MRI white matter lesion segmentation using an ensemble of ...
P
Tgdtisaot
A9
bActa
Int. J. Radiation Oncology Biol. Phys., Vol. 59, No. 1, pp. 300–312, 2004Copyright © 2004 Elsevier Inc.
Printed in the USA. All rights reserved0360-3016/04/$–see front matter
doi:10.1016/j.ijrobp.2004.01.026
HYSICS CONTRIBUTION
BRAIN TUMOR TARGET VOLUME DETERMINATION FOR RADIATIONTREATMENT PLANNING THROUGH AUTOMATED MRI SEGMENTATION
GLORIA P. MAZZARA, PH.D.,* ROBERT P. VELTHUIZEN, PH.D.,†
JAMES L. PEARLMAN, M.D.,‡ HARVEY M. GREENBERG, M.D.,‡ AND HENRY WAGNER, M.D.‡
*Department of Radiology and‡Division of Radiation Oncology, Moffitt Cancer Center, Tampa, FL;†Unilever Research andDevelopment, Edgewater, NJ
Purpose: To assess the effectiveness of two automated magnetic resonance imaging (MRI) segmentation methodsin determining the gross tumor volume (GTV) of brain tumors for use in radiation therapy treatment planning.Methods and Materials: Two automated MRI tumor segmentation methods (supervised k-nearest neighbors[kNN] and automatic knowledge-guided [KG]) were evaluated for their potential as “cyber colleagues.” Thisrequired an initial determination of the accuracy and variability of radiation oncologists engaged in the manualdefinition of the GTV in MRI registered with computed tomography images for 11 glioma patients. Three setsof contours were defined for each of these patients by three radiation oncologists. These outlines were compareddirectly to establish inter- and intraoperator variability among the radiation oncologists. A novel, probabilisticmeasurement of accuracy was introduced to compare the level of agreement among the automated MRIsegmentations. The accuracy was determined by comparing the volumes obtained by the automated segmentationmethods with the weighted average volumes prepared by the radiation oncologists.Results: Intra- and inter-operator variability in outlining was found to be an average of 20% � 15% and 28%� 12%, respectively. Lowest intraoperator variability was found for the physician who spent the most timeproducing the contours. The average accuracy of the kNN segmentation method was 56%� 6% for all 11 cases,whereas that of the KG method was 52%� 7% for 7 of the 11 cases when compared with the physician contours.For the areas of the contours where the oncologists were in substantial agreement (i.e., the center of the tumorvolume), the accuracy of kNN and KG was 75% and 72%, respectively. The automated segmentation methodswere found to be least accurate in outlining at the edges of the tumor volume.Conclusions: The kNN method was able to segment all cases, whereas the KG method was limited to enhancingtumors and gliomas with clear enhancing edges and no cystic formation. Both methods undersegment the tumorvolume when compared with the radiation oncologists and performed within the variability of the contouringperformed by experienced radiation oncologists based on the same data. © 2004 Elsevier Inc.
Glioma, Tumor volume, Magnetic resonance imaging, Image segmentation, Brain radiation therapy.
asce-l of
totheires
ationrgetthe
o ust tedt RI)( umed im-a RIi themr thea on-s
kell05)
atic
i-idinghanksnter
i nt ofR t ofR ssis-t uterS MattC ansC
003.A
INTRODUCTION
reatment protocols for malignant brain tumors knownliomas generally call for removal through surgical proures followed by irradiation of the tumor bed. The goa
hree-dimensional (3D) conformal radiation therapy isrradiate the tumor volume while limiting damage tourrounding normal tissues. Achieving this goal requccurate determination of 3D treatment volumes. Radincologists traditionally model the brain treatment ta
hrough a time-intensive manual procedure involving
Reprint requests to: Gloria P. Mazzara, Ph.D., 2475 Bricvenue #2607, Miami, FL 33129. Tel: (305) 858-0266; Fax: (329-1971; E-mail: [email protected] by 1999 RSNA (1) seed grant, entitled “Autom
rain tumor target volume for radiation treatment planning.”cknowledgments—We would like to thank Computerized Medal Systems and Colin Sims, M.S., product manager, for provhe software and support that made this research possible. Tre also due to all the personnel from Moffitt Cancer Ce
300
utlining of the gross tumor volume (GTV) on numerowo-dimensional imaging “slices” using either compuomography (CT) or magnetic resonance imaging (M1). Recently, the search for improvements in target volefinition methodology has concentrated on improvedging modalities(2, 3). It has been demonstrated that M
s more sensitive than CT in both lesion detection and inargin delineation of gliomas(4–7). However, limitations
emain in the delineation of tumor volumes and inbility of different radiation oncologists to reproduce cistent results(4, 8–10).
nvolved in this research, technologists from the Departmeadiology, physicists and dosimetrists from the Departmenadiation Oncology, and specially to Carol Johnson for her a
ance in collecting the data. Also, the Department of Compcience for providing access to their computer workstations;lark, Ph.D., for helping with the KG data processing; and Hhristian Beyer for editing the manuscript.Received Jul 22, 2003, and in revised form Dec 19, 2
ccepted for publication Jan 19, 2004.
mdhocceamr
otantmUqaGtsmtpKma
cswoanptm
mcm
S
bTFpucgapmtstMtthw3
C
smftuOcn
�
301Automated brain tumor volume determination ● G. P. MAZZARA et al.
Although the technology for conformal radiation treat-ent planning has developed to a high level of accuracy, the
efinition of the tumor GTV is still based on time-intensive,ighly subjective manual outlining (8, 11, 12). Manualutlining is the type of process that should be an excellentandidate for automation through the development of aomputerized segmentation system. At our institution, sev-ral techniques of MRI segmentation have been developednd evaluated specifically for use with brain tumors. Theseethods use the information derived from several magnetic
esonance contrasts (i.e., multispectral data).A supervised automated segmentation method requires an
perator to select regions of interest on each slice of mul-ispectral MRI data, which, in turn, are used to train theutomated classifier. One of these methods, the “k-nearesteighbor” (kNN) system, has been shown to perform betterhan other tested supervised methods and has been used byany researchers for automated brain segmentation (13).nsupervised techniques of MR segmentation do not re-uire operator input for the processing of each data set. Toutomate the tumor volume determination, Clark, Hall, andoldgof encoded knowledge of the pixel intensity and spa-
ial relationships in the images to create a fully automatedegmentation system known as the knowledge-guided (KG)ethod (16, 17). The KG expert system was initially trained
o identify slices of MR images of the brain that containathology from slices that do not contain pathology. TheG system’s current incarnation is able to identify andeasure tumor tissue from glioblastoma multiforme lesions
fter gadolinium enhancement in the brain (17).Both the kNN and KG segmentation methods have been
linically applied as a technique for more accurately mea-uring tumor volume variation in the brain (15, 18). Thisork evaluates the performance of kNN as a representativef operator-assisted semiautomated segmentation and KGs a promising candidate for fully automated GTV determi-ation. Automatic segmentation of MR images offers theotential to accurately define complex treatment volumes,o speed the contouring process in radiation therapy treat-ent planning, and to provide a standardized reproducible
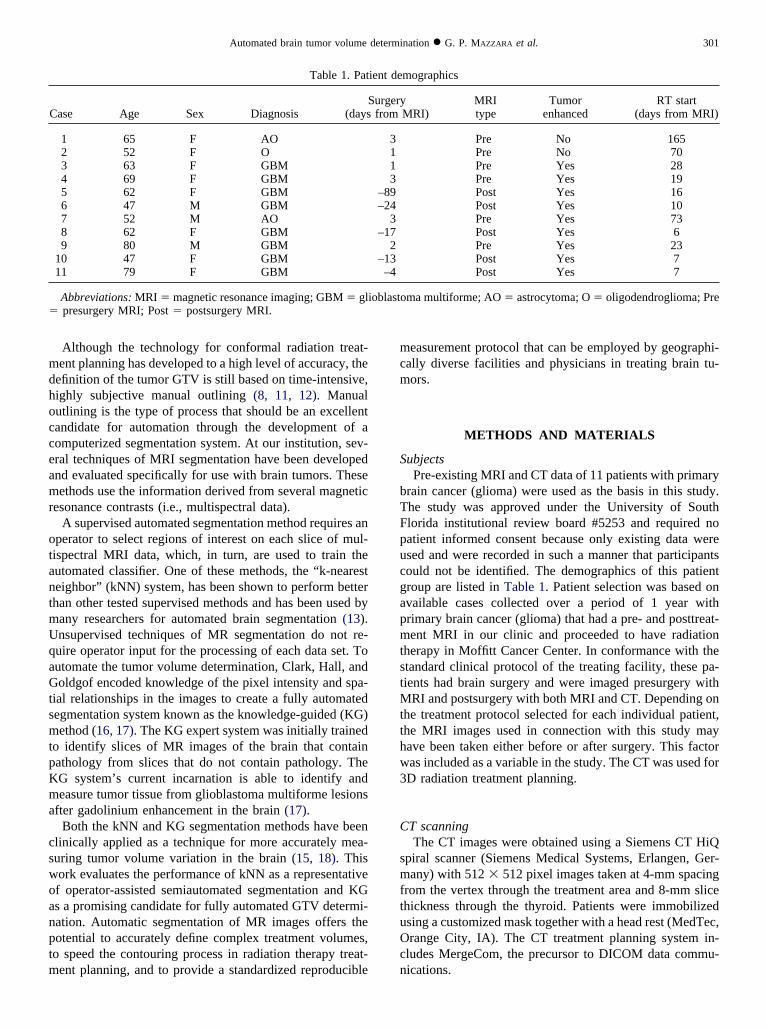
Table 1. Pat
Case Age Sex DiagnosisS
(days
1 65 F AO2 52 F O3 63 F GBM4 69 F GBM5 62 F GBM6 47 M GBM7 52 M AO8 62 F GBM9 80 M GBM
10 47 F GBM11 79 F GBM
Abbreviations: MRI � magnetic resonance imaging; GBM � glipresurgery MRI; Post � postsurgery MRI.
easurement protocol that can be employed by geographi-ally diverse facilities and physicians in treating brain tu-ors.
METHODS AND MATERIALS
ubjectsPre-existing MRI and CT data of 11 patients with primary
rain cancer (glioma) were used as the basis in this study.he study was approved under the University of Southlorida institutional review board #5253 and required noatient informed consent because only existing data weresed and were recorded in such a manner that participantsould not be identified. The demographics of this patientroup are listed in Table 1. Patient selection was based onvailable cases collected over a period of 1 year withrimary brain cancer (glioma) that had a pre- and posttreat-ent MRI in our clinic and proceeded to have radiation
herapy in Moffitt Cancer Center. In conformance with thetandard clinical protocol of the treating facility, these pa-ients had brain surgery and were imaged presurgery with
RI and postsurgery with both MRI and CT. Depending onhe treatment protocol selected for each individual patient,he MRI images used in connection with this study mayave been taken either before or after surgery. This factoras included as a variable in the study. The CT was used forD radiation treatment planning.
T scanningThe CT images were obtained using a Siemens CT HiQ
piral scanner (Siemens Medical Systems, Erlangen, Ger-any) with 512 � 512 pixel images taken at 4-mm spacing
rom the vertex through the treatment area and 8-mm slicehickness through the thyroid. Patients were immobilizedsing a customized mask together with a head rest (MedTec,range City, IA). The CT treatment planning system in-
ludes MergeCom, the precursor to DICOM data commu-ications.
mographics
MRI)MRItype
Tumorenhanced
RT start(days from MRI)
Pre No 165Pre No 70Pre Yes 28Pre Yes 19Post Yes 16Post Yes 10Pre Yes 73Post Yes 6Pre Yes 23Post Yes 7Post Yes 7
ma multiforme; AO � astrocytoma; O � oligodendroglioma; Pre
ient de
urgeryfrom
3113
–89–24
3–17
2–13–4
oblasto
M
Hmicsawvia(dtdvouRdi
I
PtsIwssr
FuFffipmac
tfiprtcc
T
tg(
(dciGroactttfpp
Prot2y
rVwlaofngtsoart
tpowtFtfar
A
fLI
e
302 I. J. Radiation Oncology ● Biology ● Physics Volume 59, Number 1, 2004
RI scanningThe patients were imaged in either a 1.5 Tesla GE Signa
orizon (General Electric Co., Milwaukee, WI) or a Sie-ens Magnetom Symphony with fast gradient systems us-
ng the standard multielement head coil. The systems in-lude DICOM data communications. The multispectral dataet used for MRI segmentation consisted of 5-mm thickxial anatomic slices T1-weighted, proton-density–eighted, and T2-weighted images obtained with a field ofiew of 220 mm and reconstructed to a 512 � 512 pixelmage. The T1 scans used for this study were obtained afterdministration of 0.1 mmol/kg body weight of gadoliniumGd) MRI contrast material (Gd-DTPA) and using a stan-ard spin-echo sequence with a repetition time (TR)/echoime (TE) � 400/8 or TR/TE � 525/17 ms. The proton-ensity images were acquired using a fluid-attenuated in-ersion recovery sequence with a TR/TE � 10002/147 msr TR/TE � 9000/110 ms. The T2 images were acquiredsing a TR/TE � 3000/104 ms or TR/TE � 4000/96 ms.adiation oncologists used axial postcontrast T1 images toefine GTV for cases of enhancing tumor or precontrast T2
mages for cases involving no tumor enhancement.
mage registrationBoth CT and MRI image sets were transferred to Hewlett
ackard workstations running Computerized Medical Sys-ems (CMS) 3-D treatment planning FOCUS software ver-ion 2.4.0. Each image set was then transferred to a Dellnspiron 7000 laptop computer equipped with CMS soft-are for image fusion (Focal Fusion, software release ver-
ion 1.3) and contouring (Focal Ease, software release ver-ion 1.3.0). The laptop computer was dedicated to thisesearch.
The CT and MRI data were registered using the Focalusion software. Registration was required to permit man-al physician contouring on the MRI images. The Focalusion software uses maximization of mutual informationor fully automatic registration without the need to defineducial or anatomic points (19). The software also incor-orates a manual method for pre- or postinteractive adjust-ent of the registration. The program writes out a file withtransformation matrix to convert MRI data to the CT
oordinates.Quantitative accuracy of the mutual information registra-
ion algorithm has previously been validated (19, 20). Thenal MRI image transformation was evaluated and ap-roved by a radiation oncologist who specializes in neu-ooncology. The transformation matrix that resulted fromhe image registration was also used for transforming theontours generated by the segmentation methods to the CToordinate system.
umor volume definitionThe reconstructed and registered MR images were used
o define the GTV using the CMS Focal Ease software. Theuidelines for contouring required the definition of the GTVenhancing tumor) from which the clinical and planning
PTV) target volumes would be expanded. The GTV wasefined by the Gd contrast enhancement in T1 images orhanges in the white matter (edema as defined by T2 MRImages). Each radiation oncologist performed 3 differentTV outlines on each image set for each of the 11 patients,
esulting in a total of 33 contours. The three differentutlining sessions for each physician were separated bypproximately 1 month to prevent memory bias. The laptopomputer was brought to each radiation oncologist’s loca-ion of choice. The time the radiation oncologists took forhe outlining process was measured and recorded as part ofhis study. All contours, including CT data and MRI trans-ormation files, were copied to a UNIX research network torovide the basis for comparison with the segmentationsrepared by the automated expert systems.The expertise of each radiation oncologist is as follows:
hysician 1 is a radiation oncologist specializing in neu-ooncology with 9 years of clinical practice in radiationncology and involvement with more than 200 glioma brainumor cases, including brain study trials (21, 22). Physicians
and 3 are radiation oncologists, each with more than 20ears of experience in radiation oncology.MRI segmentation. The MRI segmentation methods were
un on UNIX workstations (Sun Microsystems, Mountainiew, CA) using a network and software environment inhich MRI, CT, focus treatment planning systems, the
aptop computer, and the image processing laboratory werell integrated to allow for convenient flow of images andther data between platforms. MRI segmentation was per-ormed on the tumor volume data by two different tech-iques: kNN (13, 14, 23) and the fully automatic knowledgeuided system (17, 24). The kNN method requires the usero select training data from each MRI slice. In the presenttudy, a medical physicist selected the training data. Previ-us research estimated the intra- and interoperator variationrising from training data selection for kNN at 9% and 5%,espectively (14). The KG system requires no user input;herefore, there is no variability in output.
The results from the kNN segmentation included scat-ered tumor-labeled pixels in addition to the main body ofixels identified as “ the” tumor. Consistent with the previ-usly reported studies, pixels from the kNN results thatere clustered together were selected for tumor classifica-
ion and the scattered individual pixels were discarded.inal results from both MRI segmentation methods were
ransformed to the CT coordinate system using the trans-ormation matrix produced by the registration software tollow comparison with the GTV outlines prepared by theadiation oncologists.
nalysis strategyAll analysis and image data transformation was per-
ormed using programs developed with Interactive Dataanguage software version 5.4 (IDL, Research Systems
nc., Boulder, CO).Intraoperator and interoperator variability. The intraop-
rator variability was calculated by overlapping the three
votitv
nalvfpapp(
dbchetpseeapsnoitcattwpdbraita
I
moca
cpa
O
papp3a
mosrpseshtiq
M
sa1�rg1Ttr2wc
Ptacttd
C
nntmp
303Automated brain tumor volume determination ● G. P. MAZZARA et al.
olumes defined on the same patient by the same radiationncologist at roughly 1-month intervals. The variability washen calculated as the ratio of the average disagreement; thats, the size of each volume minus the intersection of thehree volumes, divided by the average size of the threeolumes (see Appendix A).The interoperator variability was calculated using the
ine sets of 3D resulting outlines for each of the 11 patientsnd then calculating the disagreement of each volume out-ine prepared by each physician for each patient with eacholume outline prepared by each of the other two physiciansor that same patient. This process was repeated for eachatient to provide a data set comprising the average dis-greement between the three contours for each patient pre-ared by one physician with the other six sets of contoursrepared by the other two physicians for that same patientsee Appendix A).
Accuracy. It is customary for radiation oncologists toelineate the GTV used in radiation therapy. The differenceetween brain GTV delineation for different physician spe-ialties (radiation oncology, radiologists, neurosurgeons)as been reported by Weltens et al. (10). This researchvaluates the automated segmentation methods as possibleools for delineating GTV in connection with treatmentlanning of brain tumor volumes. For purposes of thistudy, a probabilistic interpretation of the volumes delin-ated by the radiation oncologists provided the basis forvaluating the accuracy of both the individual physiciansnd the automated segmentation systems. Specifically, therobability that a given pixel in an image is properly clas-ified as part of the tumor volume is determined by theumber of times that this pixel was included in the nineutlines prepared by the three physicians. Every pixel in themage is labeled with an integer value (0–9) correspondingo the number of physician contours in which it was in-luded. This pixel label provided the weight for measuringccuracy. Final accuracy for the computer segmentation ishen defined as the ratio of the total sum of weights con-ained within the computer segmentation volume to the totaleights generated from the nine volumes produced by thehysicians (Appendix B). The same protocol was used toetermine the accuracy of each contoured volume producedy each physician. This approach measures the true-positiveate. To estimate the false-positive rate (i.e., the level ofgreement between physicians on healthy tissue that wasncorrectly characterized as constituting part of the GTV),he study calculated the excluded volume accuracy in annalogous manner (see Appendix B).
RESULTS
mage registrationThe CT and MR images were registered using the auto-atic registration function of the software. The radiation
ncologist specializing in neuro-oncology reviewed eachase and, if necessary, performed an additional manualdjustment. The same transformation matrix was used for
omparing contours generated by the physicians with thoseroduced by the segmentation methods, thereby eliminatingny errors arising from the image registration.
perator timeThe time each radiation oncologist took to outline all 11
atients was recorded. It ranged from 4.0 to 6.5 hours in theggregate (i.e., an average of approximately 30 min peratient). Physician 1 spent the most time outlining theatient contours, resulting in an average of approximately0 min, whereas Physician 2 spent the least time, averagingpproximately 20 min per patient.
The time to perform a kNN segmentation averaged 20in per patient, with some variation based upon the number
f slices evidencing enhanced tumor and the difficulty ofelecting the training data for the kNN segmentation algo-ithm. For the KG system, the only time required was in thereparation of the MRI scans for segmentation, which re-ulted in approximately 1.5 h of operator time. It is inter-sting to note that this data preparation task could be sub-tantially automated in the future, further reducing theuman operator time required by the KG system. The au-omatic segmentation using the KG system required approx-mately 30 min of computer time for all patients and re-uired no user input.
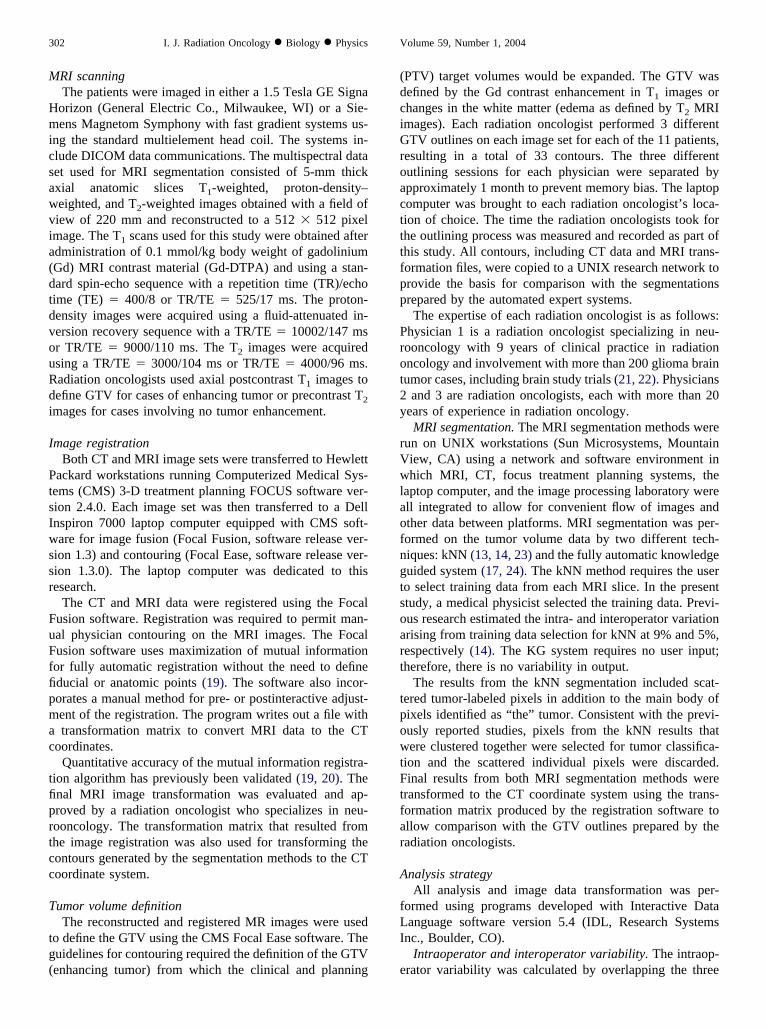
anual outline variabilityReproducibility of the delineation of the GTV on the MRI
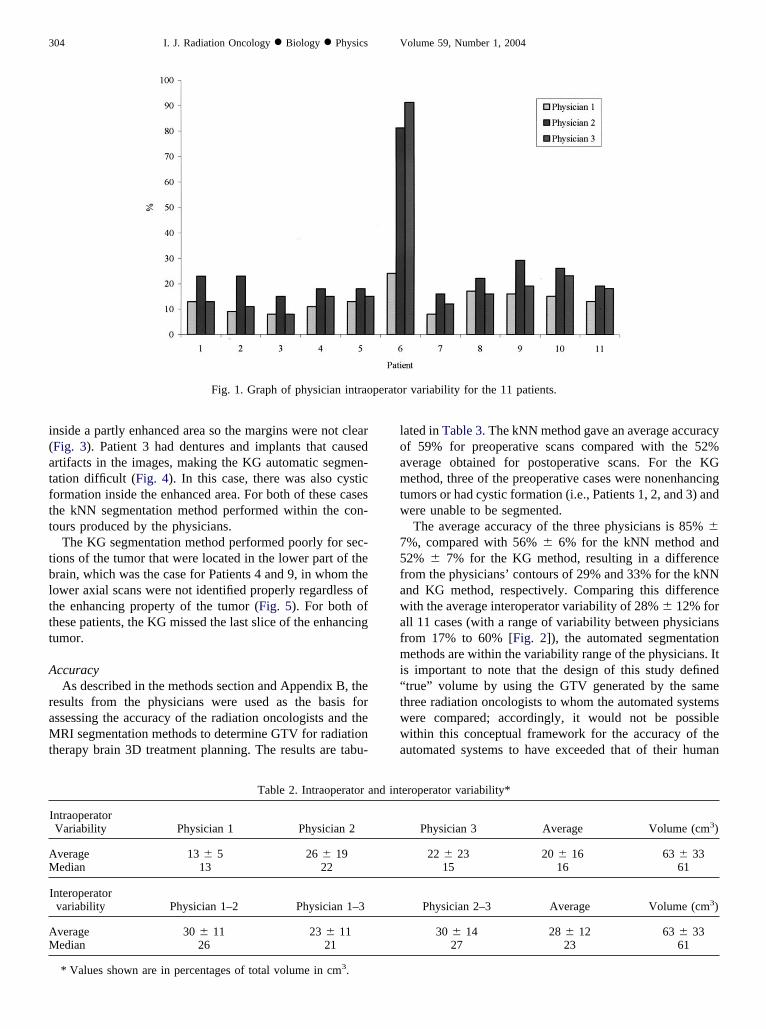
cans by the same radiation oncologist (intraoperator vari-bility) was assessed producing the results set forth in Fig.and Table 2. The intraoperator variability averaged 20%16% over all 33 contour sets of the 11 patients. The
eproducibility of the delineation of target volume wasenerally better in preoperative cases (18 sets of contours:5%) than in postoperative cases (15 sets of contours: 27%).he difference among GTVs identified by the three radia-
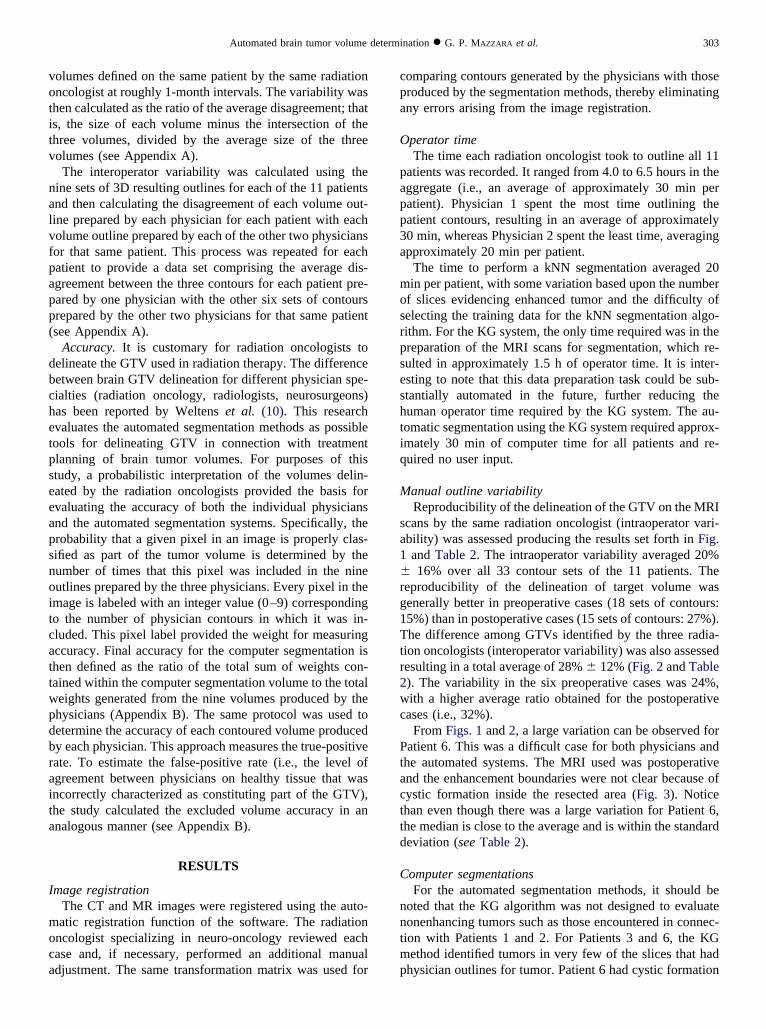
ion oncologists (interoperator variability) was also assessedesulting in a total average of 28% � 12% (Fig. 2 and Table). The variability in the six preoperative cases was 24%,ith a higher average ratio obtained for the postoperative
ases (i.e., 32%).From Figs. 1 and 2, a large variation can be observed for
atient 6. This was a difficult case for both physicians andhe automated systems. The MRI used was postoperativend the enhancement boundaries were not clear because ofystic formation inside the resected area (Fig. 3). Noticehan even though there was a large variation for Patient 6,he median is close to the average and is within the standardeviation (see Table 2).
omputer segmentationsFor the automated segmentation methods, it should be
oted that the KG algorithm was not designed to evaluateonenhancing tumors such as those encountered in connec-ion with Patients 1 and 2. For Patients 3 and 6, the KGethod identified tumors in very few of the slices that had
hysician outlines for tumor. Patient 6 had cystic formation
i(atftt
tblttt
A
raMt
loamtw
75fawafmi“twwa
perato
AM
AM
304 I. J. Radiation Oncology ● Biology ● Physics Volume 59, Number 1, 2004
nside a partly enhanced area so the margins were not clearFig. 3). Patient 3 had dentures and implants that causedrtifacts in the images, making the KG automatic segmen-ation difficult (Fig. 4). In this case, there was also cysticormation inside the enhanced area. For both of these caseshe kNN segmentation method performed within the con-ours produced by the physicians.
The KG segmentation method performed poorly for sec-ions of the tumor that were located in the lower part of therain, which was the case for Patients 4 and 9, in whom theower axial scans were not identified properly regardless ofhe enhancing property of the tumor (Fig. 5). For both ofhese patients, the KG missed the last slice of the enhancingumor.
ccuracyAs described in the methods section and Appendix B, the
esults from the physicians were used as the basis forssessing the accuracy of the radiation oncologists and theRI segmentation methods to determine GTV for radiation
herapy brain 3D treatment planning. The results are tabu-
Fig. 1. Graph of physician intrao
Table 2. Intraoperator a
IntraoperatorVariability Physician 1 Physician 2
verage 13 � 5 26 � 19edian 13 22
Interoperatorvariability Physician 1–2 Physician 1–3
verage 30 � 11 23 � 11edian 26 21
* Values shown are in percentages of total volume in cm3.
ated in Table 3. The kNN method gave an average accuracyf 59% for preoperative scans compared with the 52%verage obtained for postoperative scans. For the KGethod, three of the preoperative cases were nonenhancing
umors or had cystic formation (i.e., Patients 1, 2, and 3) andere unable to be segmented.The average accuracy of the three physicians is 85% �
%, compared with 56% � 6% for the kNN method and2% � 7% for the KG method, resulting in a differencerom the physicians’ contours of 29% and 33% for the kNNnd KG method, respectively. Comparing this differenceith the average interoperator variability of 28% � 12% for
ll 11 cases (with a range of variability between physiciansrom 17% to 60% [Fig. 2]), the automated segmentationethods are within the variability range of the physicians. It
s important to note that the design of this study definedtrue” volume by using the GTV generated by the samehree radiation oncologists to whom the automated systemsere compared; accordingly, it would not be possibleithin this conceptual framework for the accuracy of the
utomated systems to have exceeded that of their human
r variability for the 11 patients.
eroperator variability*
Physician 3 Average Volume (cm3)
22 � 23 20 � 16 63 � 3315 16 61
Physician 2–3 Average Volume (cm3)
30 � 14 28 � 12 63 � 3327 23 61
nd int
ci
v“ftc4ww1su
adppsagpsTeimsce
w
dIicttpwtaooacmw
descamt
ibasatoo
perato
305Automated brain tumor volume determination ● G. P. MAZZARA et al.
ounterparts. This limitation of the study is explored furthern the Future Work section.
The accuracy measure used for this study favors largerolumes because there is no penalty in the measure forfalse-positive” pixels. The effect of this false-positive ef-ect is expressed as a ratio based on the volume included byhe computer segmentations and excluded by the physi-ians’ modeling volume; these results are set forth in Table. Interestingly, the false-positive rate of the kNN methodas 8% � 11% and of the KG method was 8 � 8%,hereas the false positive rate of the physicians was 17% �1%. Thus the automated segmentation methods have beenhown to err on the side of underestimation of tumor vol-me when compared with the physicians.The two segmentation methods were assessed visually
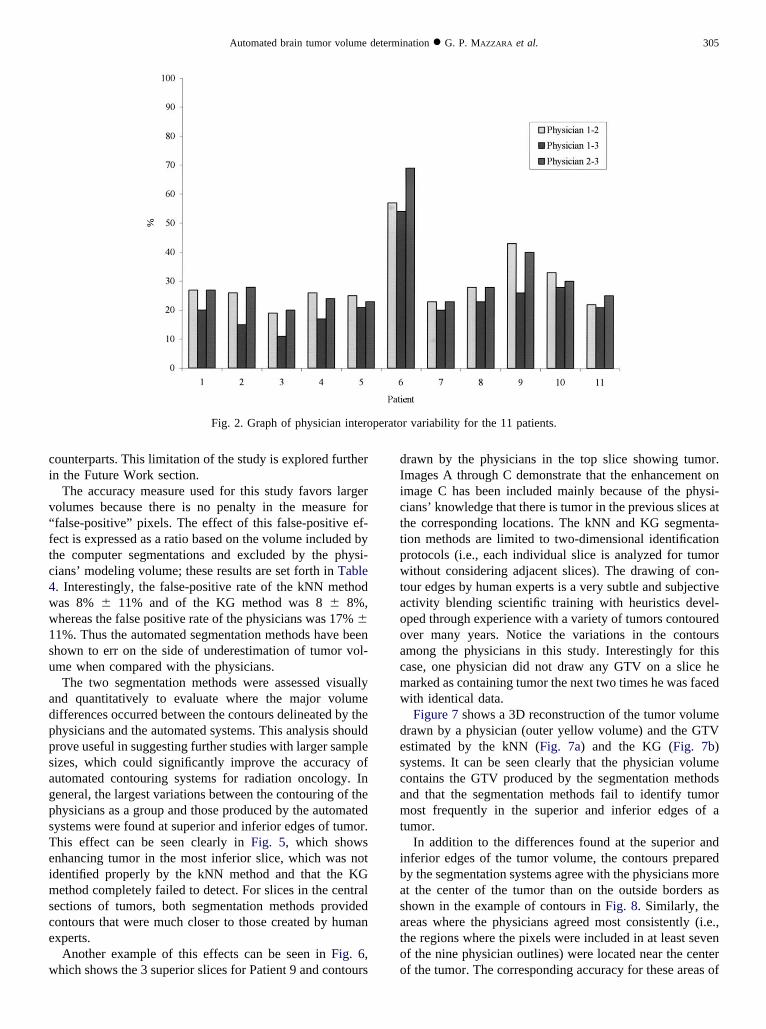
nd quantitatively to evaluate where the major volumeifferences occurred between the contours delineated by thehysicians and the automated systems. This analysis shouldrove useful in suggesting further studies with larger sampleizes, which could significantly improve the accuracy ofutomated contouring systems for radiation oncology. Ineneral, the largest variations between the contouring of thehysicians as a group and those produced by the automatedystems were found at superior and inferior edges of tumor.his effect can be seen clearly in Fig. 5, which showsnhancing tumor in the most inferior slice, which was notdentified properly by the kNN method and that the KG
ethod completely failed to detect. For slices in the centralections of tumors, both segmentation methods providedontours that were much closer to those created by humanxperts.
Another example of this effects can be seen in Fig. 6,hich shows the 3 superior slices for Patient 9 and contours
Fig. 2. Graph of physician intero
rawn by the physicians in the top slice showing tumor.mages A through C demonstrate that the enhancement onmage C has been included mainly because of the physi-ians’ knowledge that there is tumor in the previous slices athe corresponding locations. The kNN and KG segmenta-ion methods are limited to two-dimensional identificationrotocols (i.e., each individual slice is analyzed for tumorithout considering adjacent slices). The drawing of con-
our edges by human experts is a very subtle and subjectivectivity blending scientific training with heuristics devel-ped through experience with a variety of tumors contouredver many years. Notice the variations in the contoursmong the physicians in this study. Interestingly for thisase, one physician did not draw any GTV on a slice hearked as containing tumor the next two times he was facedith identical data.Figure 7 shows a 3D reconstruction of the tumor volume
rawn by a physician (outer yellow volume) and the GTVstimated by the kNN (Fig. 7a) and the KG (Fig. 7b)ystems. It can be seen clearly that the physician volumeontains the GTV produced by the segmentation methodsnd that the segmentation methods fail to identify tumorost frequently in the superior and inferior edges of a
umor.In addition to the differences found at the superior and
nferior edges of the tumor volume, the contours preparedy the segmentation systems agree with the physicians moret the center of the tumor than on the outside borders ashown in the example of contours in Fig. 8. Similarly, thereas where the physicians agreed most consistently (i.e.,he regions where the pixels were included in at least sevenf the nine physician outlines) were located near the centerf the tumor. The corresponding accuracy for these areas of
r variability for the 11 patients.
h7
awaronpfssomscf
eF
aHmttfin7citvtfT
Ft2sGPatakupsfi
FtntPmcma2
306 I. J. Radiation Oncology ● Biology ● Physics Volume 59, Number 1, 2004
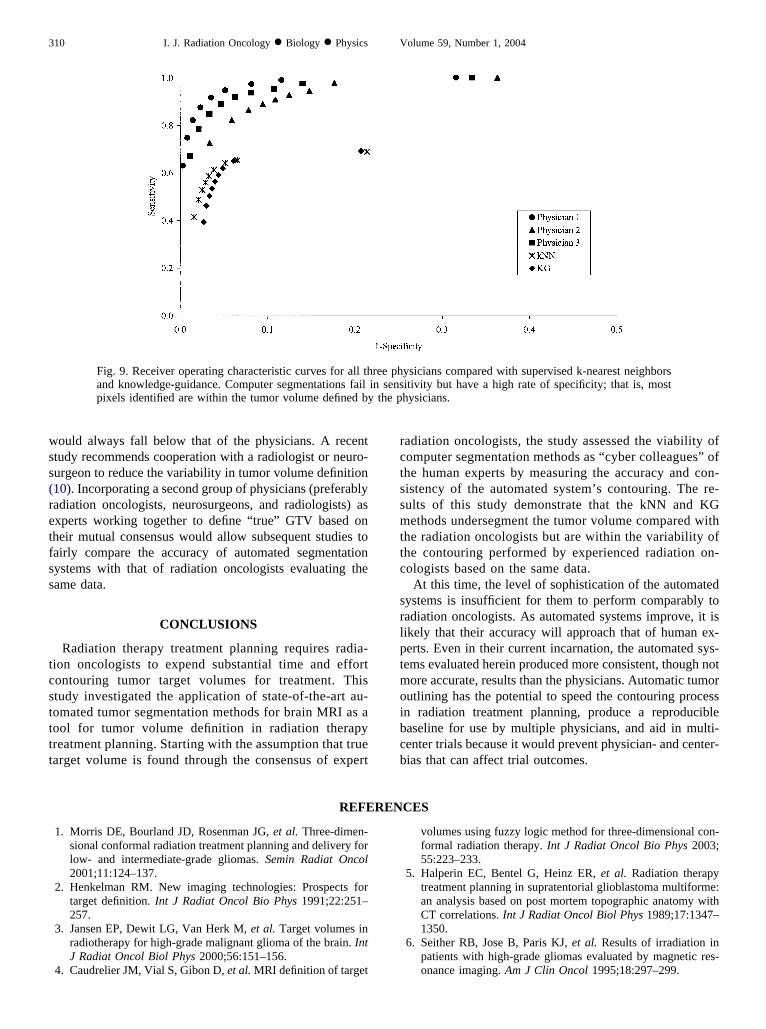
igh physician agreement for kNN and KG was 75% and2%, respectively.Figure 9 shows a section of the receiver operating char-
cteristic (ROC) curves for all three physicians comparedith those for the kNN and KG systems. The ROC curve isplot of the true-positive rate (TP) against the false-positive
ate (FP). It shows the tradeoff between sensitivity (portionf accurate TP) and specificity (portion of accurate true-egative) because any increase in sensitivity will be accom-anied by a decrease in specificity. The closer a curveollows the left-hand border and top border of the ROCpace, the more accurate the test. True tumor (TP) for thistudy is based on the times a pixel was included in anutline by the physicians. The curves for the segmentationethods must necessarily be below those of the physicians
ince the latter defined “ truth” for purposes of this study. Itan be seen that automated segmentation systems tend toail in sensitivity but have a high degree of specificity as
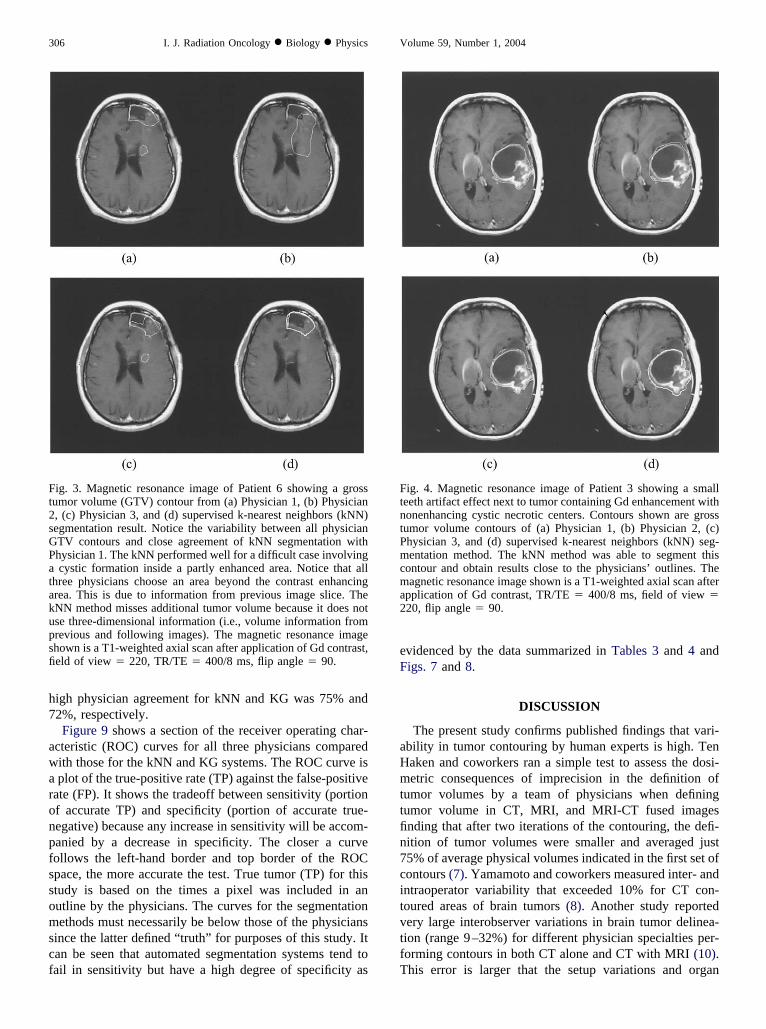
ig. 3. Magnetic resonance image of Patient 6 showing a grossumor volume (GTV) contour from (a) Physician 1, (b) Physician, (c) Physician 3, and (d) supervised k-nearest neighbors (kNN)egmentation result. Notice the variability between all physicianTV contours and close agreement of kNN segmentation withhysician 1. The kNN performed well for a difficult case involvingcystic formation inside a partly enhanced area. Notice that all
hree physicians choose an area beyond the contrast enhancingrea. This is due to information from previous image slice. TheNN method misses additional tumor volume because it does notse three-dimensional information (i.e., volume information fromrevious and following images). The magnetic resonance imagehown is a T1-weighted axial scan after application of Gd contrast,eld of view � 220, TR/TE � 400/8 ms, flip angle � 90.
videnced by the data summarized in Tables 3 and 4 andigs. 7 and 8.
DISCUSSION
The present study confirms published findings that vari-bility in tumor contouring by human experts is high. Tenaken and coworkers ran a simple test to assess the dosi-etric consequences of imprecision in the definition of
umor volumes by a team of physicians when definingumor volume in CT, MRI, and MRI-CT fused imagesnding that after two iterations of the contouring, the defi-ition of tumor volumes were smaller and averaged just5% of average physical volumes indicated in the first set ofontours (7). Yamamoto and coworkers measured inter- andntraoperator variability that exceeded 10% for CT con-oured areas of brain tumors (8). Another study reportedery large interobserver variations in brain tumor delinea-ion (range 9–32%) for different physician specialties per-orming contours in both CT alone and CT with MRI (10).his error is larger that the setup variations and organ
ig. 4. Magnetic resonance image of Patient 3 showing a smalleeth artifact effect next to tumor containing Gd enhancement withonenhancing cystic necrotic centers. Contours shown are grossumor volume contours of (a) Physician 1, (b) Physician 2, (c)hysician 3, and (d) supervised k-nearest neighbors (kNN) seg-entation method. The kNN method was able to segment this
ontour and obtain results close to the physicians’ outlines. Theagnetic resonance image shown is a T1-weighted axial scan after
pplication of Gd contrast, TR/TE � 400/8 ms, field of view �20, flip angle � 90.
mtfd
wio
i2
tapswoc1capcfP
pmpttgqtr
tppptow
FPntsinisa
A
M
307Automated brain tumor volume determination ● G. P. MAZZARA et al.
otions that are traditionally taken into account in radiationherapy planning. All of these results demonstrate the needor a method of contouring that is more consistently repro-ucible.In this study, it was found that the radiation oncologist
ho took the most time for outlining achieved the smallestntraoperator variability (i.e., 13% [the average for all of thencologists was 20%]) and the one who took the least time
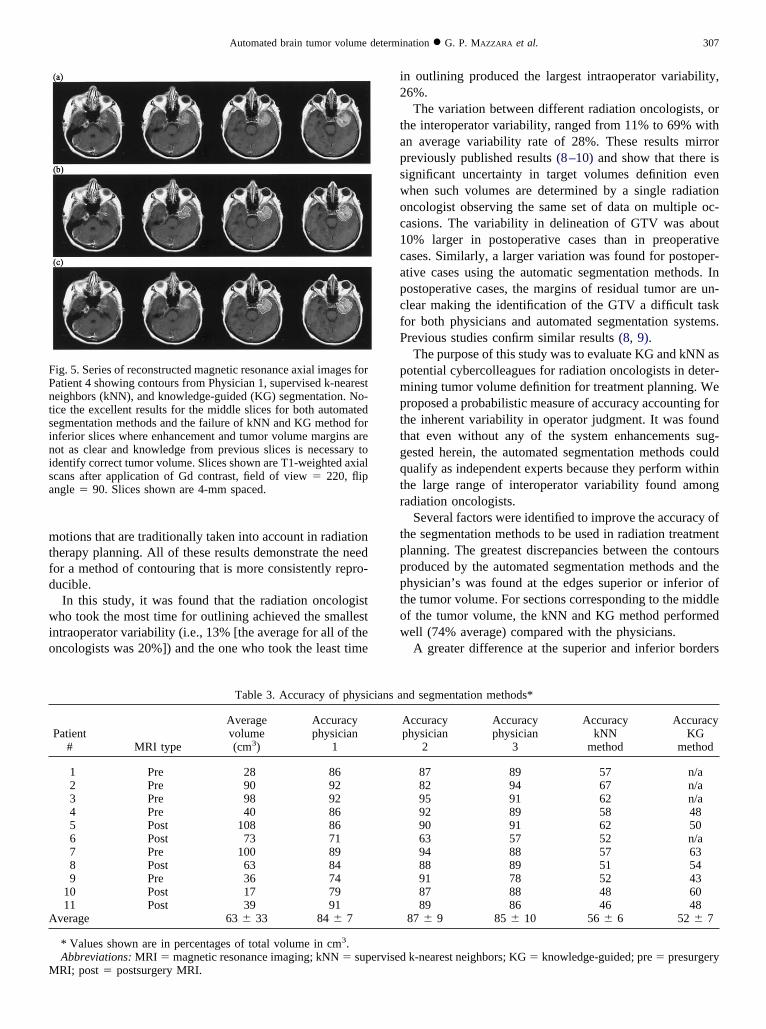
ig. 5. Series of reconstructed magnetic resonance axial images foratient 4 showing contours from Physician 1, supervised k-nearesteighbors (kNN), and knowledge-guided (KG) segmentation. No-ice the excellent results for the middle slices for both automatedegmentation methods and the failure of kNN and KG method fornferior slices where enhancement and tumor volume margins areot as clear and knowledge from previous slices is necessary todentify correct tumor volume. Slices shown are T1-weighted axialcans after application of Gd contrast, field of view � 220, flipngle � 90. Slices shown are 4-mm spaced.
Table 3. Accuracy of physi
Patient# MRI type
Averagevolume(cm3)
Accuracyphysician
1
1 Pre 28 862 Pre 90 923 Pre 98 924 Pre 40 865 Post 108 866 Post 73 717 Pre 100 898 Post 63 849 Pre 36 74
10 Post 17 7911 Post 39 91
verage 63 � 33 84 � 7
* Values shown are in percentages of total volume in cm3.Abbreviations: MRI � magnetic resonance imaging; kNN � supRI; post � postsurgery MRI.
n outlining produced the largest intraoperator variability,6%.The variation between different radiation oncologists, or
he interoperator variability, ranged from 11% to 69% withn average variability rate of 28%. These results mirrorreviously published results (8–10) and show that there isignificant uncertainty in target volumes definition evenhen such volumes are determined by a single radiationncologist observing the same set of data on multiple oc-asions. The variability in delineation of GTV was about0% larger in postoperative cases than in preoperativeases. Similarly, a larger variation was found for postoper-tive cases using the automatic segmentation methods. Inostoperative cases, the margins of residual tumor are un-lear making the identification of the GTV a difficult taskor both physicians and automated segmentation systems.revious studies confirm similar results (8, 9).The purpose of this study was to evaluate KG and kNN as
otential cybercolleagues for radiation oncologists in deter-ining tumor volume definition for treatment planning. We
roposed a probabilistic measure of accuracy accounting forhe inherent variability in operator judgment. It was foundhat even without any of the system enhancements sug-ested herein, the automated segmentation methods couldualify as independent experts because they perform withinhe large range of interoperator variability found amongadiation oncologists.
Several factors were identified to improve the accuracy ofhe segmentation methods to be used in radiation treatmentlanning. The greatest discrepancies between the contoursroduced by the automated segmentation methods and thehysician’s was found at the edges superior or inferior ofhe tumor volume. For sections corresponding to the middlef the tumor volume, the kNN and KG method performedell (74% average) compared with the physicians.A greater difference at the superior and inferior borders
nd segmentation methods*
Accuracyphysician
2
Accuracyphysician
3
AccuracykNN
method
AccuracyKG
method
87 89 57 n/a82 94 67 n/a95 91 62 n/a92 89 58 4890 91 62 5063 57 52 n/a94 88 57 6388 89 51 5491 78 52 4387 88 48 6089 86 46 48
87 � 9 85 � 10 56 � 6 52 � 7
k-nearest neighbors; KG � knowledge-guided; pre � presurgery
cians a
ervised
omcowas
tsps
fwtcataftaosimtat
witwmt
mtcafid
k
F(NcTMPcis�
308 I. J. Radiation Oncology ● Biology ● Physics Volume 59, Number 1, 2004
f the tumor results, at least in part, from the small enhance-ent found at the edges of the tumor. The drawing of
ontour edges is very subtle and subjective. The radiationncologists use a 3D method of contouring; that is, one inhich the previous and subsequent two-dimensional slices
re used to predict the presence of tumor volume on thelide in question. This knowledge needs to be included in
Table 4. Excluded accuracy for p
PatientNo. MRI type
Averagevolume(cm3)
Exc accphysician
1
1 Pre 28 82 Pre 90 133 Pre 98 54 Pre 40 55 Post 108 76 Post 73 347 Pre 100 68 Post 63 89 Pre 36 5
10 Post 17 611 Post 39 14
Average 63 � 33 10 � 9
* Values shown are in percentages of total volume in cm3.Abbreviations: MRI � magnetic resonance imaging; exc acc
nowledge-guided; pre � presurgery MRI; post � postsurgery M
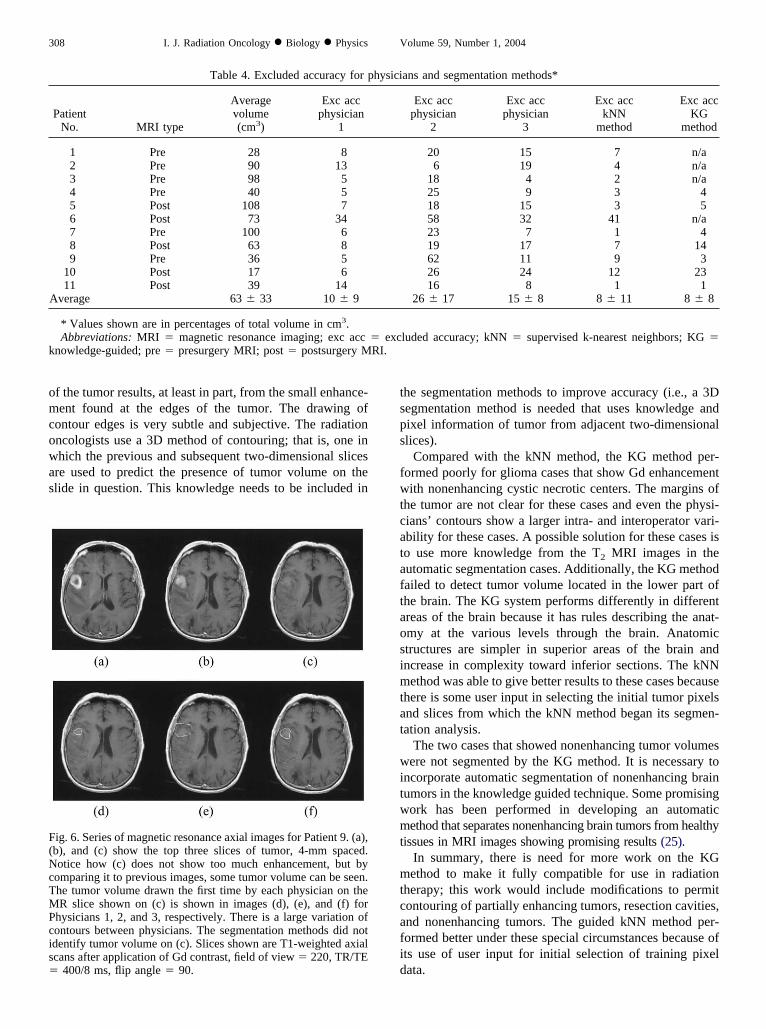
ig. 6. Series of magnetic resonance axial images for Patient 9. (a),b), and (c) show the top three slices of tumor, 4-mm spaced.otice how (c) does not show too much enhancement, but by
omparing it to previous images, some tumor volume can be seen.he tumor volume drawn the first time by each physician on theR slice shown on (c) is shown in images (d), (e), and (f) for
hysicians 1, 2, and 3, respectively. There is a large variation ofontours between physicians. The segmentation methods did notdentify tumor volume on (c). Slices shown are T1-weighted axialcans after application of Gd contrast, field of view � 220, TR/TE
400/8 ms, flip angle � 90.
he segmentation methods to improve accuracy (i.e., a 3Degmentation method is needed that uses knowledge andixel information of tumor from adjacent two-dimensionallices).
Compared with the kNN method, the KG method per-ormed poorly for glioma cases that show Gd enhancementith nonenhancing cystic necrotic centers. The margins of
he tumor are not clear for these cases and even the physi-ians’ contours show a larger intra- and interoperator vari-bility for these cases. A possible solution for these cases iso use more knowledge from the T2 MRI images in theutomatic segmentation cases. Additionally, the KG methodailed to detect tumor volume located in the lower part ofhe brain. The KG system performs differently in differentreas of the brain because it has rules describing the anat-my at the various levels through the brain. Anatomictructures are simpler in superior areas of the brain andncrease in complexity toward inferior sections. The kNNethod was able to give better results to these cases because
here is some user input in selecting the initial tumor pixelsnd slices from which the kNN method began its segmen-ation analysis.
The two cases that showed nonenhancing tumor volumesere not segmented by the KG method. It is necessary to
ncorporate automatic segmentation of nonenhancing brainumors in the knowledge guided technique. Some promisingork has been performed in developing an automaticethod that separates nonenhancing brain tumors from healthy
issues in MRI images showing promising results (25).In summary, there is need for more work on the KGethod to make it fully compatible for use in radiation
herapy; this work would include modifications to permitontouring of partially enhancing tumors, resection cavities,nd nonenhancing tumors. The guided kNN method per-ormed better under these special circumstances because ofts use of user input for initial selection of training pixelata.
ans and segmentation methods*
Exc accphysician
2
Exc accphysician
3
Exc acckNN
method
Exc accKG
method
20 15 7 n/a6 19 4 n/a
18 4 2 n/a25 9 3 418 15 3 558 32 41 n/a23 7 1 419 17 7 1462 11 9 326 24 12 2316 8 1 1
26 � 17 15 � 8 8 � 11 8 � 8
luded accuracy; kNN � supervised k-nearest neighbors; KG �
hysici
� excRI.
msaett
ibtgt
asttvcppm
lactut
FssaatsIG
F1ablcmtdco
309Automated brain tumor volume determination ● G. P. MAZZARA et al.
Future work should concentrate on optimizing the seg-entation techniques to improve the accuracy of their re-
ults, especially with respect to the definition of the inferiornd superior borders of the tumor volume. Note that differ-nt glioma types were included in this research to generatehe basis of possible future applications of brain segmenta-ion methods. It would be of interest to perform more
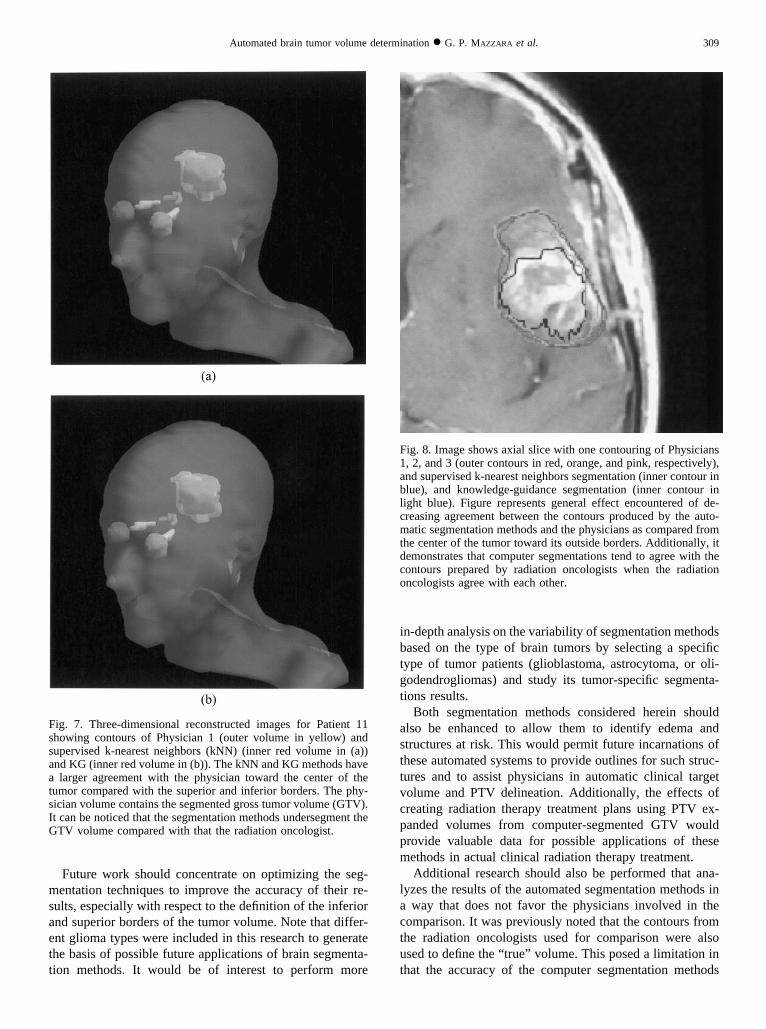
ig. 7. Three-dimensional reconstructed images for Patient 11howing contours of Physician 1 (outer volume in yellow) andupervised k-nearest neighbors (kNN) (inner red volume in (a))nd KG (inner red volume in (b)). The kNN and KG methods havelarger agreement with the physician toward the center of the
umor compared with the superior and inferior borders. The phy-ician volume contains the segmented gross tumor volume (GTV).t can be noticed that the segmentation methods undersegment theTV volume compared with that the radiation oncologist.
n-depth analysis on the variability of segmentation methodsased on the type of brain tumors by selecting a specificype of tumor patients (glioblastoma, astrocytoma, or oli-odendrogliomas) and study its tumor-specific segmenta-ions results.
Both segmentation methods considered herein shouldlso be enhanced to allow them to identify edema andtructures at risk. This would permit future incarnations ofhese automated systems to provide outlines for such struc-ures and to assist physicians in automatic clinical targetolume and PTV delineation. Additionally, the effects ofreating radiation therapy treatment plans using PTV ex-anded volumes from computer-segmented GTV wouldrovide valuable data for possible applications of theseethods in actual clinical radiation therapy treatment.Additional research should also be performed that ana-
yzes the results of the automated segmentation methods inway that does not favor the physicians involved in the
omparison. It was previously noted that the contours fromhe radiation oncologists used for comparison were alsosed to define the “ true” volume. This posed a limitation inhat the accuracy of the computer segmentation methods
ig. 8. Image shows axial slice with one contouring of Physicians, 2, and 3 (outer contours in red, orange, and pink, respectively),nd supervised k-nearest neighbors segmentation (inner contour inlue), and knowledge-guidance segmentation (inner contour inight blue). Figure represents general effect encountered of de-reasing agreement between the contours produced by the auto-atic segmentation methods and the physicians as compared from
he center of the tumor toward its outside borders. Additionally, itemonstrates that computer segmentations tend to agree with theontours prepared by radiation oncologists when the radiationncologists agree with each other.
wss(retfss
tcstttt
rctssmttc
srlptmoibcb
the p
310 I. J. Radiation Oncology ● Biology ● Physics Volume 59, Number 1, 2004
ould always fall below that of the physicians. A recenttudy recommends cooperation with a radiologist or neuro-urgeon to reduce the variability in tumor volume definition10). Incorporating a second group of physicians (preferablyadiation oncologists, neurosurgeons, and radiologists) asxperts working together to define “ true” GTV based onheir mutual consensus would allow subsequent studies toairly compare the accuracy of automated segmentationystems with that of radiation oncologists evaluating theame data.
CONCLUSIONS
Radiation therapy treatment planning requires radia-ion oncologists to expend substantial time and effortontouring tumor target volumes for treatment. Thistudy investigated the application of state-of-the-art au-omated tumor segmentation methods for brain MRI as aool for tumor volume definition in radiation therapyreatment planning. Starting with the assumption that truearget volume is found through the consensus of expert
Fig. 9. Receiver operating characteristic curves for all thand knowledge-guidance. Computer segmentations failpixels identified are within the tumor volume defined by
REFEREN
adiation oncologists, the study assessed the viability ofomputer segmentation methods as “cyber colleagues” ofhe human experts by measuring the accuracy and con-istency of the automated system’ s contouring. The re-ults of this study demonstrate that the kNN and KGethods undersegment the tumor volume compared with
he radiation oncologists but are within the variability ofhe contouring performed by experienced radiation on-ologists based on the same data.
At this time, the level of sophistication of the automatedystems is insufficient for them to perform comparably toadiation oncologists. As automated systems improve, it isikely that their accuracy will approach that of human ex-erts. Even in their current incarnation, the automated sys-ems evaluated herein produced more consistent, though notore accurate, results than the physicians. Automatic tumor
utlining has the potential to speed the contouring processn radiation treatment planning, produce a reproducibleaseline for use by multiple physicians, and aid in multi-enter trials because it would prevent physician- and center-ias that can affect trial outcomes.
ysicians compared with supervised k-nearest neighborsitivity but have a high rate of specificity; that is, mosthysicians.
CES
1. Morris DE, Bourland JD, Rosenman JG, et al. Three-dimen-sional conformal radiation treatment planning and delivery forlow- and intermediate-grade gliomas. Semin Radiat Oncol2001;11:124–137.
2. Henkelman RM. New imaging technologies: Prospects fortarget definition. Int J Radiat Oncol Bio Phys 1991;22:251–257.
3. Jansen EP, Dewit LG, Van Herk M, et al. Target volumes inradiotherapy for high-grade malignant glioma of the brain. IntJ Radiat Oncol Biol Phys 2000;56:151–156.
4. Caudrelier JM, Vial S, Gibon D, et al. MRI definition of target
volumes using fuzzy logic method for three-dimensional con-formal radiation therapy. Int J Radiat Oncol Bio Phys 2003;55:223–233.
5. Halperin EC, Bentel G, Heinz ER, et al. Radiation therapytreatment planning in supratentorial glioblastoma multiforme:an analysis based on post mortem topographic anatomy withCT correlations. Int J Radiat Oncol Biol Phys 1989;17:1347–1350.
6. Seither RB, Jose B, Paris KJ, et al. Results of irradiation inpatients with high-grade gliomas evaluated by magnetic res-onance imaging. Am J Clin Oncol 1995;18:297–299.
ree phin sens
1
1
1
1
1
1
1
1
1
1
2
2
2
2
2
2
ovdetahr
311Automated brain tumor volume determination ● G. P. MAZZARA et al.
7. TenHaken RK, Thornton AF, Sandler HM, et al. A quantita-tive assessment of the addition of MRI to CT-based, 3-Dtreatment planning of brain tumors. Radiother Oncol 1992;25:121–133.
8. Yamamoto M, Nagata Y, Okajima K. Differences in targetoutline from CT scans of brain tumours using different meth-ods and different observers. Radiother Oncol 1999;50:151–156.
9. Khoo VS, Adams EJ, Saran F, et al. A comparison of clinicaltarget volumes determined by CT and MRI for the radiother-apy planning of base of skull meningiomas. Int J Radiat OncolBiol Phys 2000;46:1309–1317.
0. Weltens C, Menten J, Feron M, et al. Interobserver variationsin gross tumor volume delineation of brain tumors on com-puted tomography and impact of magnetic resonance imaging.Radiother Oncol 2001;60:49–59.
1. Pitkanen MA, Holli KA, Ojala AT, et al. Quality assurance inradiotherapy of breast cancer—variability in planning targetvolume delineation. Acta Oncol 2001;40:50–55.
2. Van den Berge DL, De Ridder M, Storme G. Imaging inradiotherapy. Eur J Radiol 2000;34:41–48.
3. Clarke LP, Velthuizen RP, Camacho MA, et al. MRI segmen-tation: Methods and applications. Magn Reson Imaging 1995;13:343–368.
4. Vaidyanathan M, Clarke LP, Velthuizen RP, et al. Compari-son of supervised MRI segmentation methods for tumor vol-ume determination during therapy. Magn Reson Imaging1995;13:719–728.
5. Vaidyanathan M, Clarke LP, Hall LO, et al. Monitoring braintumor response to therapy using MRI segmentation. MagnReson Imaging 1997;15:323–334.
6. Li C, Goldgof DB, Hall LO. Automatic segmentation andtissue labeling of MR images. IEEE Trans Med Imaging1993;12:740–750.
rria
nceosvp
7. Clark MC, Hall LO, Goldgof DB, et al. Automatic tumorsegmentation using knowledge-based techniques. IEEE TransMed Imaging 1998;17:187–201.
8. Velthuizen RP, Clarke LP, Phuphanich S, et al. Unsupervisedmeasurement of brain tumor volume on MR images. J MagnReson Imaging 1995;5:594–605.
9. Meyer CR, Boes JL, Kim B, et al. Demonstration of accuracyand clinical versatility of mutual information for automaticmultimodality image fusion using affine and thin-plate splinewarped geometric deformations. Med Image Anal 1997;1:195–206.
0. Maes F, Vandermeulen D, Suetens P. Comparative evaluationof multiresolution optimization strategies for multimodalityimage registration by maximixation of mutual information.Med Image Anal 1999;3:373–386.
1. Grossman SA, O’Neill A, Grunnet M, et al. Phase III studycomparing three cycles of infusional carmustine and cisplatinfollowed by radiation therapy with radiation therapy and con-current carmustine in patients with newly diagnosed supraten-torial glioblastoma multiforme: Eastern Cooperative Oncol-ogy Group Trial 2394. J Clin Oncol 2003;21:1485–1491.
2. Kleinberg L, Grossman SA, Carson K, et al. Survival ofpatients with newly diagnosed glioblastoma multiformetreated with RSR13 and radiotherapy: Results of a phase IInew approaches to brain tumor therapy CNS consortiumsafety and efficacy study. J Clin Oncol 2002;20:3149–3155.
3. Clarke LP, Velthuizen RP, Phuphanich S, et al. MRI: Stabilityof three supervised segmentation techniques. Magn ResonImaging 1993;11:95–106.
4. Clarke LP, Velthuizen RP, Clark MC, et al. MRI measurementof brain tumor response: Comparison of visual metric andautomatic segmentation. Magn Reson Imaging 1998;16:271–279.
5. Fletcher-Heath LM, Hall LO, Goldgof DB, et al. Automaticsegmentation of non-enhancing brain tumors in magnetic res-onance image. Artif Intell Med 2001;21:43–63.
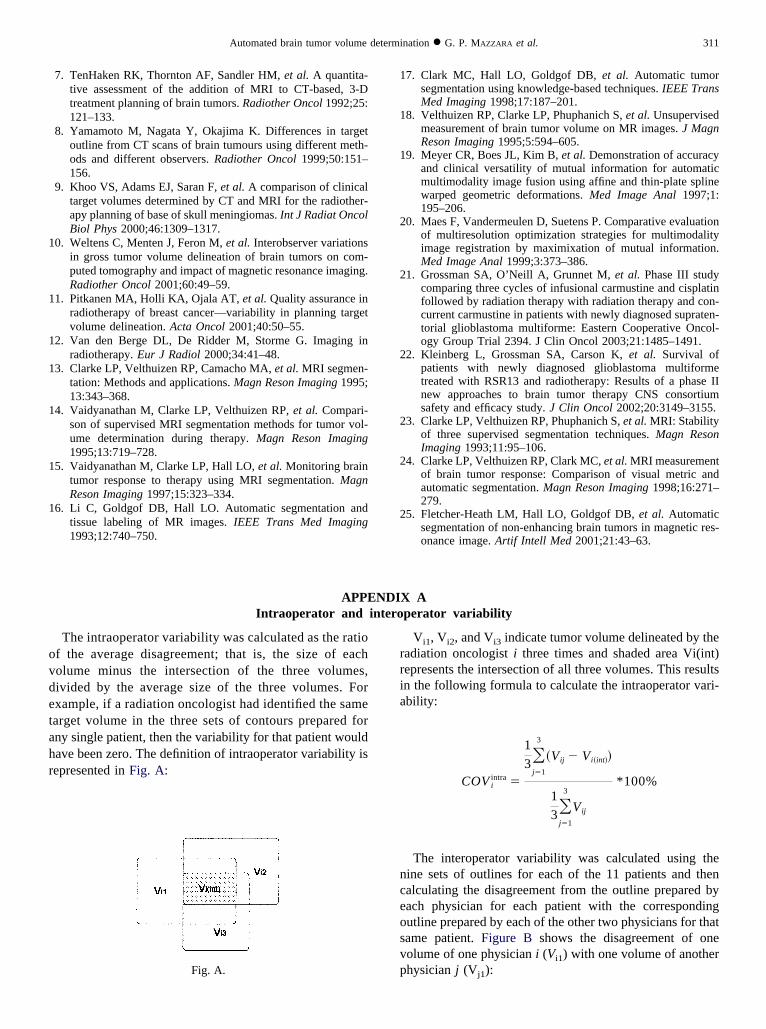
APPENDIX AIntraoperator and interoperator variability
The intraoperator variability was calculated as the ratiof the average disagreement; that is, the size of eacholume minus the intersection of the three volumes,ivided by the average size of the three volumes. Forxample, if a radiation oncologist had identified the samearget volume in the three sets of contours prepared forny single patient, then the variability for that patient wouldave been zero. The definition of intraoperator variability isepresented in Fig. A:
Fig. A.
Vi1, Vi2, and Vi3 indicate tumor volume delineated by theadiation oncologist i three times and shaded area Vi(int)epresents the intersection of all three volumes. This resultsn the following formula to calculate the intraoperator vari-bility:
COV iintra �
1
3�j�1
3
�Vij � Vi�int��
1
3�j�1
3
Vij
*100%
The interoperator variability was calculated using theine sets of outlines for each of the 11 patients and thenalculating the disagreement from the outline prepared byach physician for each patient with the correspondingutline prepared by each of the other two physicians for thatame patient. Figure B shows the disagreement of oneolume of one physician i (Vi1) with one volume of anotherhysician j (V ):
j1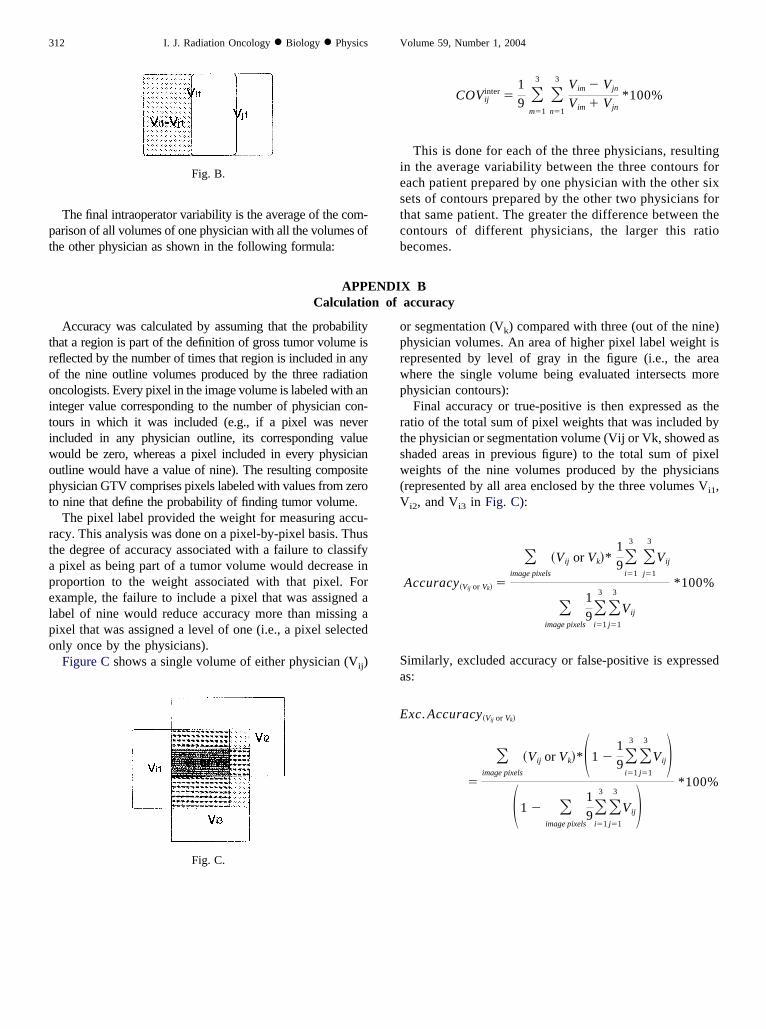
pt
iestcb
trooitiwopt
rtapelpo
312 I. J. Radiation Oncology ● Biology ● Physics Volume 59, Number 1, 2004
The final intraoperator variability is the average of the com-arison of all volumes of one physician with all the volumes ofhe other physician as shown in the following formula:
Fig. B.
oprwp
rtsw(V
Sa
E
COVijinter �
1
9 �m�1
3 �n�1
3 Vim � Vjn
Vim � Vjn*100%
This is done for each of the three physicians, resultingn the average variability between the three contours forach patient prepared by one physician with the other sixets of contours prepared by the other two physicians forhat same patient. The greater the difference between theontours of different physicians, the larger this ratioecomes.
APPENDIX BCalculation of accuracy
Accuracy was calculated by assuming that the probabilityhat a region is part of the definition of gross tumor volume iseflected by the number of times that region is included in anyf the nine outline volumes produced by the three radiationncologists. Every pixel in the image volume is labeled with annteger value corresponding to the number of physician con-ours in which it was included (e.g., if a pixel was neverncluded in any physician outline, its corresponding valueould be zero, whereas a pixel included in every physicianutline would have a value of nine). The resulting compositehysician GTV comprises pixels labeled with values from zeroo nine that define the probability of finding tumor volume.
The pixel label provided the weight for measuring accu-acy. This analysis was done on a pixel-by-pixel basis. Thushe degree of accuracy associated with a failure to classifypixel as being part of a tumor volume would decrease in
roportion to the weight associated with that pixel. Forxample, the failure to include a pixel that was assigned aabel of nine would reduce accuracy more than missing aixel that was assigned a level of one (i.e., a pixel selectednly once by the physicians).Figure C shows a single volume of either physician (Vij)
Fig. C.
r segmentation (Vk) compared with three (out of the nine)hysician volumes. An area of higher pixel label weight isepresented by level of gray in the figure (i.e., the areahere the single volume being evaluated intersects morehysician contours):Final accuracy or true-positive is then expressed as the
atio of the total sum of pixel weights that was included byhe physician or segmentation volume (Vij or Vk, showed ashaded areas in previous figure) to the total sum of pixeleights of the nine volumes produced by the physicians
represented by all area enclosed by the three volumes Vi1,
i2, and Vi3 in Fig. C):
Accuracy�Vij or Vk� �
�image pixels
�Vij or Vk�*1
9�i�1
3 �j�1
3
Vij
�image pixels
1
9�i�1
3 �j�1
3
Vij
*100%
imilarly, excluded accuracy or false-positive is expresseds:
xc. Accuracy�Vij or Vk�
�
�image pixels
�Vij or Vk�*�1 �1
9�i�1
3 �j�1
3
Vij��1 � �
image pixels
1
9�i�1
3 �j�1
3
Vij� *100%