TOURISM INVESTMENT , SUPPLY AND DEMAND IN INDONESIA ...
14
The First International Conference on Law, Business and Government 2013, UBL, Indonesia III-61 TOURISM INVESTMENT , SUPPLY AND DEMAND IN INDONESIA: IMPACT AND FACTOR ANALYSIS Faurani Santi, Rina Oktaviani, Dedi Budiman Hakim, Reni Kustiari 1 Doctorate Program in Economic Agriculture, Institut Pertanian Bogor, Bogor, Indonesia Corresponding email : [email protected] Abstract Tourism is one of the most significant contributors to the Indonesia growth of economy, based on data from the Indonesia Central Bureau of Statistics in 2012, the share of national tourism to GDP is 13.9 percent and of course the contribution of the sector to be helpful for the growth of the national economy, through foreign exchange earnings as revenue from tourist consumption. Besides that, it has provided a multiplier effect to other sectors which related to the sectors. Therefore, an improving of the contribution is a one of government’s effort to boost economic growth and increasing the welfare, thus the increasing of tourism investment and trade will be focus in the tourism development program. Meanwhile, the Indonesia Coordinating Board (BKPM) stated the average national investment for the tourism sector is Rp. 2.73 billion or 6 percent from total investment during 2006-2012, in other words an investment in tourism sector has not been able to provide optimal contribution to the national economy development considering to its potential. The purpose of this study was to analyze the determinants of investment, demand and supply of Indonesian tourism sector. Regarding to answer the problems, this research used series data from 1990 – 2012 periods, by using simultaneous model (2SLS) the model analyzed impact of investment, and international trade of Indonesia tourism sector to the national economic growth. Based on the Two Stages Least Squares method on simultaneous model, the results of the analysis gives some conclusions including: (1) tourism arrivals, tourism expenditure, investment, consumption price index, total consumption, government spending, export and import tourism affected the national tourism demand, (2) Current investment and investment on previous year, total consumption on previous year, and travel warning have positive impact to national tourism supply, (3) GDP was the most influenced variable beside Indonesia tourism price and neighbor countries’ tourism price as competitors of Indonesia tourism. Finally, the simulations showed the fiscal and monetary policy impact to the national economic tourism sector. Keyword: Impact, investment, international trade, supply and demand tourism, and economic growth 1. INTRODUCTION Tourism is one sector of the economy that great contributed to the economic development of a country, based on data from the Indonesia Central Bureau of Statistics, in 2012 the share of national tourism around 13.9 percent of the total GDP and of course the contribution of the sector to be useful for the growth of the national economy , through foreign exchange earnings received from the large consumption incurred by the traveler to national goods and services. It is also able to provide a multiplier effect of tourism to other sectors related either directly or indirectly (Reuters, 1999). Historically, the development of tourism be able to encourage and accelerate national economic growth whreas tourism activities create demand, both consumption and investment, which in turn will lead to the production of goods and services. During the activiy in tourism, tourists will be doing his shopping and spend their money to consume for travelling, thereby directly causing demand (tourism final demand) market for goods and services. Furthermore finals tourism demand indirectly raises demand for capital goods and raw materials (derived investment demand) to produce to meet tourist demand for goods and services. Indonesian tourist area of potential improvement in line with the 1 Institut Pertanian Bogor , Doctorate Program in Economic Agriculture, Jl. Kamper LV Wing 4 Darmaga, Bogor, Indonesia
Transcript of TOURISM INVESTMENT , SUPPLY AND DEMAND IN INDONESIA ...

The First International Conference on Law, Business and Government 2013, UBL, Indonesia
III-61
TOURISM INVESTMENT , SUPPLY AND DEMAND IN INDONESIA:IMPACT AND FACTOR ANALYSIS
Faurani Santi, Rina Oktaviani, Dedi Budiman Hakim, Reni Kustiari1
Doctorate Program in Economic Agriculture, Institut Pertanian Bogor, Bogor, Indonesia
Corresponding email : [email protected]
Abstract
Tourism is one of the most significant contributors to the Indonesia growth of economy, based on datafrom the Indonesia Central Bureau of Statistics in 2012, the share of national tourism to GDP is 13.9percent and of course the contribution of the sector to be helpful for the growth of the national economy,through foreign exchange earnings as revenue from tourist consumption. Besides that, it has provided amultiplier effect to other sectors which related to the sectors. Therefore, an improving of the contributionis a one of government’s effort to boost economic growth and increasing the welfare, thus the increasingof tourism investment and trade will be focus in the tourism development program. Meanwhile, theIndonesia Coordinating Board (BKPM) stated the average national investment for the tourism sector isRp. 2.73 billion or 6 percent from total investment during 2006-2012, in other words an investment intourism sector has not been able to provide optimal contribution to the national economy developmentconsidering to its potential.
The purpose of this study was to analyze the determinants of investment, demand and supply ofIndonesian tourism sector. Regarding to answer the problems, this research used series data from 1990 –2012 periods, by using simultaneous model (2SLS) the model analyzed impact of investment, andinternational trade of Indonesia tourism sector to the national economic growth. Based on the Two StagesLeast Squares method on simultaneous model, the results of the analysis gives some conclusions including: (1)tourism arrivals, tourism expenditure, investment, consumption price index, total consumption, governmentspending, export and import tourism affected the national tourism demand, (2) Current investment andinvestment on previous year, total consumption on previous year, and travel warning have positive impact tonational tourism supply, (3) GDP was the most influenced variable beside Indonesia tourism price andneighbor countries’ tourism price as competitors of Indonesia tourism. Finally, the simulations showed thefiscal and monetary policy impact to the national economic tourism sector.
Keyword: Impact, investment, international trade, supply and demand tourism, and economic growth
1. INTRODUCTION
Tourism is one sector of the economy that great contributed to the economic development of acountry, based on data from the Indonesia Central Bureau of Statistics, in 2012 the share of nationaltourism around 13.9 percent of the total GDP and of course the contribution of the sector to be useful forthe growth of the national economy , through foreign exchange earnings received from the largeconsumption incurred by the traveler to national goods and services. It is also able to provide a multipliereffect of tourism to other sectors related either directly or indirectly (Reuters, 1999).
Historically, the development of tourism be able to encourage and accelerate national economicgrowth whreas tourism activities create demand, both consumption and investment, which in turn willlead to the production of goods and services. During the activiy in tourism, tourists will be doing hisshopping and spend their money to consume for travelling, thereby directly causing demand (tourismfinal demand) market for goods and services. Furthermore finals tourism demand indirectly raisesdemand for capital goods and raw materials (derived investment demand) to produce to meet touristdemand for goods and services. Indonesian tourist area of potential improvement in line with the
1 Institut Pertanian Bogor , Doctorate Program in Economic Agriculture, Jl. Kamper LV Wing 4 Darmaga, Bogor,Indonesia
The First International Conference on Law, Business and Government 2013, UBL, Indonesia
III-62
liberalization of trade in services is seen from the increasing tourist demand internationally, it isseemingly in Table 1, where in 2012 there was an increase of 5.8 percent when compared to 2011, withthe amount of foreign exchange earned by 8 , 6 million tourists, an increase of 13.6 percent compared tothe previous period.
Table 1: Number of tourism arrival and expenditures in 2005-2012
Sources: BPS and Indonesia Ministry of Tourism & Creative Economy, 2012
From Table 1 it is clear that an increase in the number of visits is also followed by an increasing as aresult of foreign exchange receipts from tourism transactions during some periods. According to theMinistry of Tourism and Creative Economy, said that tourism is able to account for about 8.46 percent ofthe total employment provided that is equal to 192.210 million in 2012 (Kemenpraf, 2013).
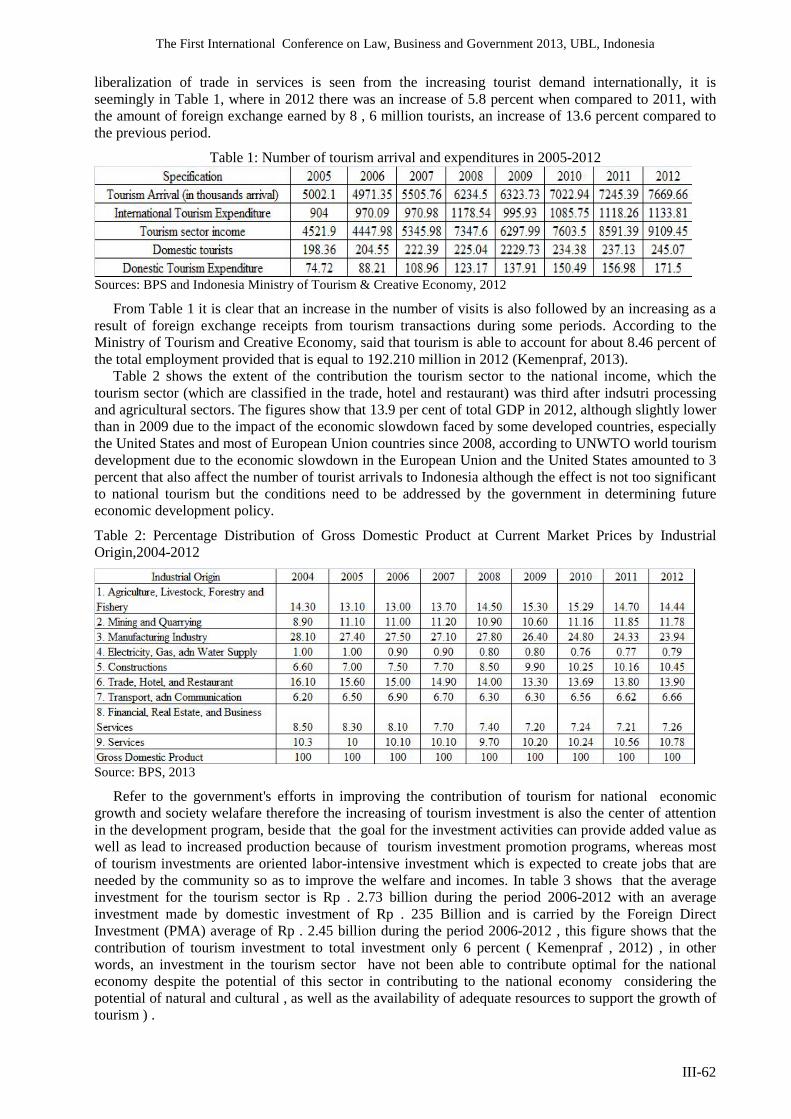
Table 2 shows the extent of the contribution the tourism sector to the national income, which thetourism sector (which are classified in the trade, hotel and restaurant) was third after indsutri processingand agricultural sectors. The figures show that 13.9 per cent of total GDP in 2012, although slightly lowerthan in 2009 due to the impact of the economic slowdown faced by some developed countries, especiallythe United States and most of European Union countries since 2008, according to UNWTO world tourismdevelopment due to the economic slowdown in the European Union and the United States amounted to 3percent that also affect the number of tourist arrivals to Indonesia although the effect is not too significantto national tourism but the conditions need to be addressed by the government in determining futureeconomic development policy.
Table 2: Percentage Distribution of Gross Domestic Product at Current Market Prices by IndustrialOrigin,2004-2012
Source: BPS, 2013
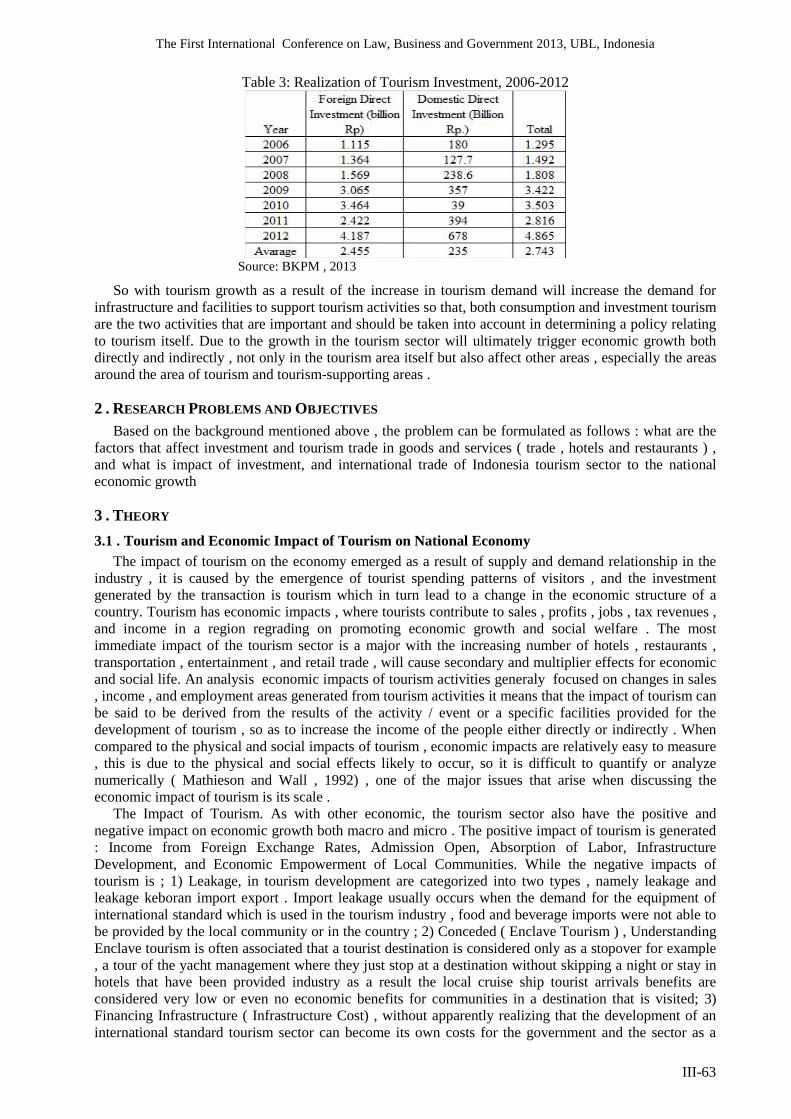
Refer to the government's efforts in improving the contribution of tourism for national economicgrowth and society welafare therefore the increasing of tourism investment is also the center of attentionin the development program, beside that the goal for the investment activities can provide added value aswell as lead to increased production because of tourism investment promotion programs, whereas mostof tourism investments are oriented labor-intensive investment which is expected to create jobs that areneeded by the community so as to improve the welfare and incomes. In table 3 shows that the averageinvestment for the tourism sector is Rp . 2.73 billion during the period 2006-2012 with an averageinvestment made by domestic investment of Rp . 235 Billion and is carried by the Foreign DirectInvestment (PMA) average of Rp . 2.45 billion during the period 2006-2012 , this figure shows that thecontribution of tourism investment to total investment only 6 percent ( Kemenpraf , 2012) , in otherwords, an investment in the tourism sector have not been able to contribute optimal for the nationaleconomy despite the potential of this sector in contributing to the national economy considering thepotential of natural and cultural , as well as the availability of adequate resources to support the growth oftourism ) .
The First International Conference on Law, Business and Government 2013, UBL, Indonesia
III-63
Table 3: Realization of Tourism Investment, 2006-2012
Source: BKPM , 2013
So with tourism growth as a result of the increase in tourism demand will increase the demand forinfrastructure and facilities to support tourism activities so that, both consumption and investment tourismare the two activities that are important and should be taken into account in determining a policy relatingto tourism itself. Due to the growth in the tourism sector will ultimately trigger economic growth bothdirectly and indirectly , not only in the tourism area itself but also affect other areas , especially the areasaround the area of tourism and tourism-supporting areas .
2 . RESEARCH PROBLEMS AND OBJECTIVES
Based on the background mentioned above , the problem can be formulated as follows : what are thefactors that affect investment and tourism trade in goods and services ( trade , hotels and restaurants ) ,and what is impact of investment, and international trade of Indonesia tourism sector to the nationaleconomic growth
3 . THEORY
3.1 . Tourism and Economic Impact of Tourism on National EconomyThe impact of tourism on the economy emerged as a result of supply and demand relationship in the
industry , it is caused by the emergence of tourist spending patterns of visitors , and the investmentgenerated by the transaction is tourism which in turn lead to a change in the economic structure of acountry. Tourism has economic impacts , where tourists contribute to sales , profits , jobs , tax revenues ,and income in a region regrading on promoting economic growth and social welfare . The mostimmediate impact of the tourism sector is a major with the increasing number of hotels , restaurants ,transportation , entertainment , and retail trade , will cause secondary and multiplier effects for economicand social life. An analysis economic impacts of tourism activities generaly focused on changes in sales, income , and employment areas generated from tourism activities it means that the impact of tourism canbe said to be derived from the results of the activity / event or a specific facilities provided for thedevelopment of tourism , so as to increase the income of the people either directly or indirectly . Whencompared to the physical and social impacts of tourism , economic impacts are relatively easy to measure, this is due to the physical and social effects likely to occur, so it is difficult to quantify or analyzenumerically ( Mathieson and Wall , 1992) , one of the major issues that arise when discussing theeconomic impact of tourism is its scale .
The Impact of Tourism. As with other economic, the tourism sector also have the positive andnegative impact on economic growth both macro and micro . The positive impact of tourism is generated: Income from Foreign Exchange Rates, Admission Open, Absorption of Labor, InfrastructureDevelopment, and Economic Empowerment of Local Communities. While the negative impacts oftourism is ; 1) Leakage, in tourism development are categorized into two types , namely leakage andleakage keboran import export . Import leakage usually occurs when the demand for the equipment ofinternational standard which is used in the tourism industry , food and beverage imports were not able tobe provided by the local community or in the country ; 2) Conceded ( Enclave Tourism ) , UnderstandingEnclave tourism is often associated that a tourist destination is considered only as a stopover for example, a tour of the yacht management where they just stop at a destination without skipping a night or stay inhotels that have been provided industry as a result the local cruise ship tourist arrivals benefits areconsidered very low or even no economic benefits for communities in a destination that is visited; 3)Financing Infrastructure ( Infrastructure Cost) , without apparently realizing that the development of aninternational standard tourism sector can become its own costs for the government and the sector as a
The First International Conference on Law, Business and Government 2013, UBL, Indonesia
III-64
result tend to be charged to tax as a means to build the infrastructure , tax revenues must be increased tothe community means tax should be raised . Other sectors such as the reduction of the budget foreducation and health; 4) Increased dramatically prices ( Increase in Prices or Inflation , increased demandfor goods and services from the tourists will lead to rising prices in a row inflation which will certainlyhave a negative impact for local communities who in reality does not increase in proportion of incomemeans income if local communities are increasing but not comparable to the increase in prices will causethe purchasing power of local communities to be low; 5) Sectoral dependence ( Economic Dependence ) ,the diversity of industries in an economy showing soundness of a country , if there is a country that isonly dependent on one sector of the economy such as tourism , for example, makes a country becomesdependent on the tourism sector as a result of economic resilience to be very high risk; 6 . Seasonalproblems ( Seasonal Characteristics , in the tourism industry , recognized the existence of certain seasons, such as the high season " which will have peak tourist arrivals , occupancy rates will be close to themaximum room occupancy rates and conditions will impact business revenue increased tourism .Meanwhile, also low season in which the condition is the average occupancy rate does not match theexpectations of the business as a revenue impact tourism industries also declined this is often called aseasonal problem .
Tourism has economic impacts , where tourists contribute to sales , profits , jobs , tax revenues , andpendapatandi a region in promoting economic growth and social welfare . The most immediate impact ofthe tourism sector is a major with the increasing number of hotels , restaurants , transportation ,entertainment , and retail trade , will cause secondary and multiplier effects for economic and social lifeof the community . An analysis / biasanyaterfokus economic impact of tourism activities on changes insales , income , and employment areas generated from tourism activities this means the impact of tourismcan be said to be derived from the results of the activity / event or a specific tour the facilities providedfor the development of tourism , so able to increase the income of the people either directly or indirectly
3.2. Concept and Scope of InvestmentTypical investment also called by investment or capital formation is a second component that
determines the level of aggregate expenditure . Concerning to investmet is an activity in the economycould push up the lower level of the country's economy , it is important to do in country because it canincrease production and employment . Investment is the government spending and the company as awhole to purchase real capital goods for setting up a new company or to expand an existing business inorder to obtain greater benefits than costs incurred capital to invest .
3.3. The Relationship between Investment on Economic GrowthInvestment is an important factor in the sustainability of economic development and long-term
economic growth . It will create jobs , increase incomes , which will further increase the market demand .The investment activities consist of direct investment ( foreign direct investment / FDI ) and portfolioinvestment . The investments are included a portfolio investment in the form of financial assets such asbonds , stocks , and so on are owned by foreign investors and invested into a country . While directinvestment is investment made in plant , capital goods , land and so on , with the exercise control over theinvestments that are known Foreign Direct Investment ( FDI ) is the foreign ownership of the assets of acountry , so that they can have direct oversight of the use of the asset . FDI recipient country not onlyreceive benefits in the form of capital , but also access to electronic technology , management , market ,international network , changes in the structure and export oriented.
3.4 . Investment and Tourism PromotionInvestment in tourism is basically the same understanding of the investment in a general sense , the
only difference lies in Fixed Capital Information that relate directly to the development of infrastructureand facilities that improve the growth of tourism . On the issue of funding devoted to tourisminfrastructure and tourism facilities such as roads , communication networks , utilities , ports , anotherdistinction is generally financed by the government through the state budget or the budget which is alsocalled the Social Investment Tourism . While the infrastructure and facilities such as hotels , theme parks, tourist transport , and others carried out by the private sector tourism - called direct invesment ( Rusman, 2004) .
While promotion is defined as an effort to expand its share of both domestic and international tourism, as well as the efforts of developing countries is generally done by the government , and, if carried out byprivate parties directly related to the interests of private parties themselves as promotional hotel ,
The First International Conference on Law, Business and Government 2013, UBL, Indonesia
III-65
restaurant , and airline . And together with the investment , financing in order to promote tourismfinanced by the state budget / budget which is government consumption and not investment .
3.5. Tourism ComponentsTourism activities include two main components of supply and demand. Components offers a product
that can travel offered , which includes tourism , tourism facilities , tourism services , environment andfacilities , which include a demand component of tourist activities and aspirations of the community andaround the area of tourism . Everything is presented for the benefit of tourists, either in the form ofobjects objects , tools ( infrastructure ) , labor ( human , technological ) , activities ( events) , as well asservices , which is summarized bundled into supply and demand of the travelers , it can be said as atourist product . One of the critical studies in tourism sector development plan is an analysis of supplyand demand .
Tourism supply can be interpreted as elements of natural attractions or man-made tourist , goods andservices ( Yoeti , 1996) , where the Component Demand is is much desired tourist opportunities totalpicture of society or community participation in tourism activities in general can be expected whenavailable adequate facilities . According Yoeti (1996 ) inquiry notice of its kind tourism is divided intotwo , namely : 1). Potential demand , the number of people who meet the minimum requirements fortravel tourism because it has a lot of money , physical state is still strong , just not have any spare timetraveling as tourists, 2) . Actual demand , that is, people who are traveling on tourism to a certain area, 3)Analysis of demand according to the analysis of meaning is the traditional view , the social characteristicsthat have been used as a variable to explain market segmentation . Conventionally , the difference in age ,affect the expectations and behavior of tourists at a young age market segment , tourists from abroad andso on .
On the other side , demand factors , among others : 1) Length Of Stay, The higher level of long-staytravelers will increase the carrying capacity of tourism . If tourist numbers slightly but high levels of longresidence will be better than the number of tourists that much with a low level of long lived; 2) TravelersActivity Type where the travelers with deeper object recognition ( convention tourism and culturaltourism ) absorbs very little travelers compared to nature, 3). Guest Satisfaction, and 4). Sights utilizationby Travelers .
According Ariyanto 2005 , the main factors and other factors affecting tourism demand can beexplained as follows : a) price , b ) income , c ) Socio-Cultural , d ) Social Politics , e ) Intensity family , f) Price of substitutes , in addition the fifth aspect of the above , the price of substitute goods are alsoincluded in the aspect of demand , which is assumed replacement goods instead of a tourist destination isused as a backup in traveled as : Bali as the main tourist destination in Indonesia , due to one reason oranother Bali can not provide the ability to fulfill the terms of a tourist destination that tourists willindirectly change the goal nearest stricken like Malaysia ( Kuala Lumpur and Singapore ) , and g )complementary goods price , is an item that mutual aid or in other words, complementary goods aregoods that are complementary , which when linked with tourism complementary goods is as a touristattraction complementary with other tourism object .
4 . RESEARCH METHODOLOGY
In general , the methodology used in this study using Simultaneous Approach . With reference to theKeynesian model of aggregate demand , is part of the tourism economy in the short term where theincome / output is determined by the Household Expenditure ( C ) , Company ( I) , government ( G ) , andForeign Affairs ( NX ) , here in after referred to as Planned Expenditure ( PE ) ( Mankiw , 2000 ) . So thatmathematically can be written :
PEC (YT)I( r*)GNX (e)where the Household Consumption ( C ) is part of the income ( Y ) net of taxes ( T ) , Investment ( I) is afunction of the level of the World Interest Rate ( r * ) and the Export and Import of Goods and Services (NX ) is a function of the exchange rate , as reflected by the Competitiveness ( e ) . Tourism in this modelto be a part of the net exports that Planned Expenditure equation can be written as follows:
where NXNP is net exports of goods and services other than tourism and NPP is the net export balance oftourism or tourism balanced .
While the data used in this study used secondary data (1990-2012) from various official sources suchas governments , international agencies , and report the results of both studies have been published or not
The First International Conference on Law, Business and Government 2013, UBL, Indonesia
III-66
. The type of secondary data time series and cross section data is merged into the panel . As for some ofthe data required in this study were : 1 ) . Data on the number of foreign tourists visiting Indonesiaaccording to country of residence , the number of Indonesian people who go overseas , the consumerprice index , and the total population , 2 ) . Countries GDP data are entered in this study include , 3 )consumption , investment , government spending , exports , imports , interest rates and currency exchangerates against the USD , 4 ) Data rate , exchange rate against foreign currencies and the current account , 5) Data value FDI ( outward ) Investor countries included in the study ( U.S. , EU , Japan , Australia ,ASEAN , and the Rest of the World ) in units of USD , 6 ) Data about average average expenditure andtypes of tourism expenditure , information and events , as well as the existing tourism policy in Indonesia, 7 ) the number of residents of countries included in this study (population series ) , and 8 ) . Datadistance between origin and Indonesian tourists.
As mentioned before, this research will use a simultaneous model, whereas Simultaneous equationmodel is a statistical model that links economic variables of an economic phenomenon that includesstochastic elements that consist of one or more random variables ( Intrilligator , 1978) . According toKoutsoyiannis ( 1978 ) , said to be a good model should be able to meet the criteria of economy (theoretically meaningfull ) , dimanastatisticcriteria seen from one degree of accuracy ( goodness of fit )usually by looking at the R ² statistically significant , and the criteria econometrics is a prediction modelthat has unbisa properties , consistency , adequacy , and efficiency . In addition, the model is asimplification and representation of the real world . Based on the relationship between the variables in theblock , then compiled equations consisting of endogenous and exogenous variables . Theoreticalframework , previous studies , in field conditions , the availability of the data will determine the decisionvariables . Models are formulated in the form of the following equation : Yt = a0 + a1Y*t + a2Xt +a3Xt-j + a4Zt + a5Zt-j + a6Yt-j + Ut
where : Yt = endogenous variables in period t (current endogenous variabels), Y * t = endogenousexplanatory variables in period t (current endogenous explanatory variabels), Xt = exogenous variables inperiod t (current exogenous variabels ), Xt - j = exogenous variables in tj lag ( lagged exogenous variabels), Policy variables zt = (policy variabels ), Zt - j = the lagged policy variables tj ( lagged policy variabels), Yt - j = tj on the lag endogenous variables ( lagged endogenous variabels ), Ut = Factor error ( errorterms), a0 = constant ( intercept ), a1 ... a6 = parameter
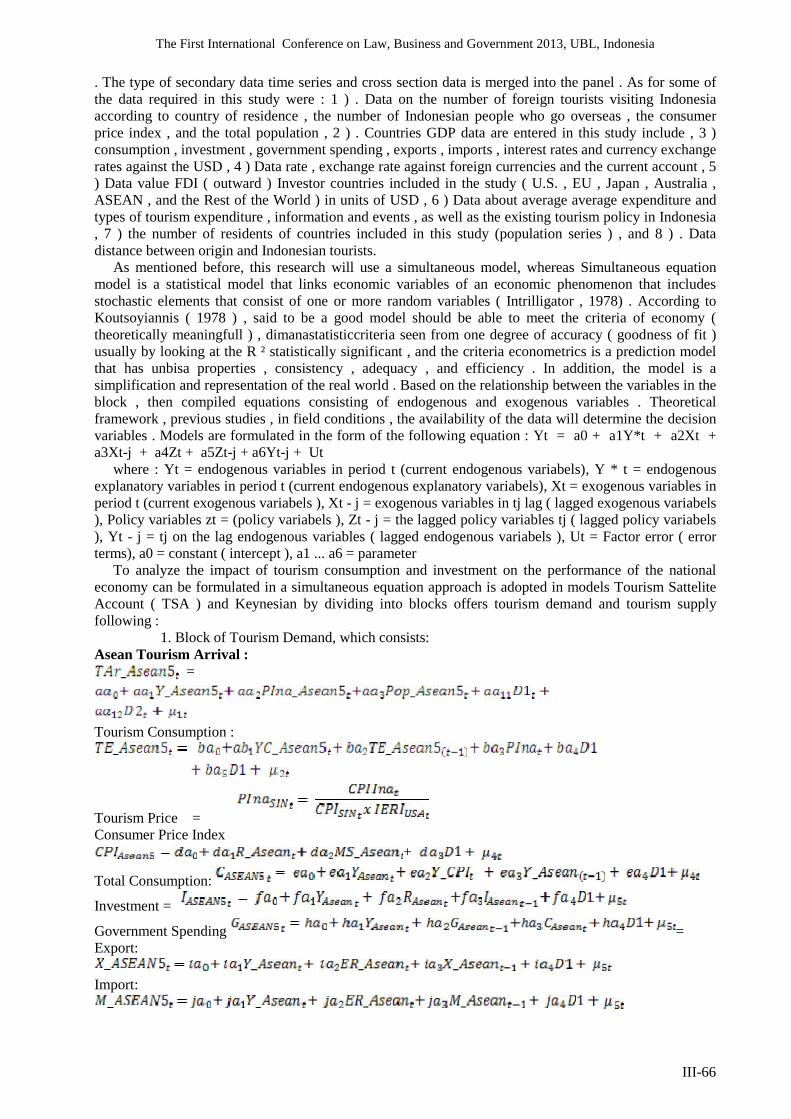
To analyze the impact of tourism consumption and investment on the performance of the nationaleconomy can be formulated in a simultaneous equation approach is adopted in models Tourism SatteliteAccount ( TSA ) and Keynesian by dividing into blocks offers tourism demand and tourism supplyfollowing :
1. Block of Tourism Demand, which consists:Asean Tourism Arrival :
=
Tourism Consumption :
Tourism Price =Consumer Price Index
+
Total Consumption:
Investment =
Government Spending =Export:
Import:
The First International Conference on Law, Business and Government 2013, UBL, Indonesia
III-67
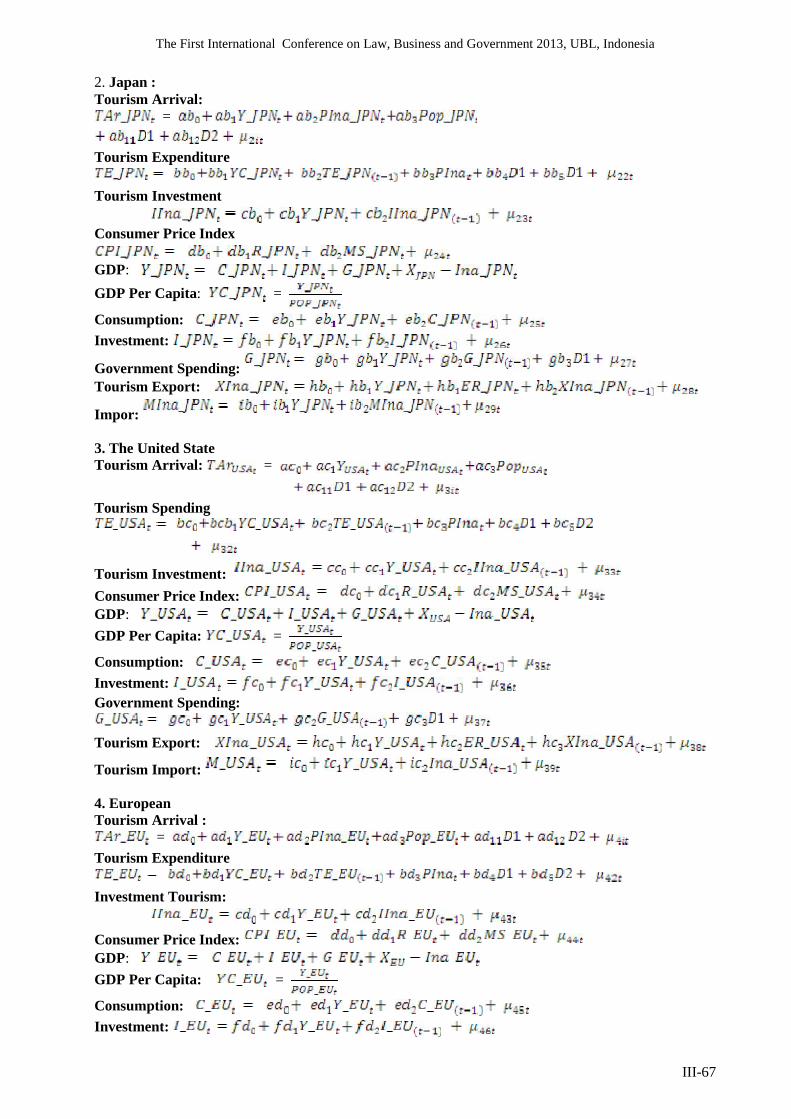
2. Japan :Tourism Arrival:
=
Tourism Expenditure
Tourism Investment
Consumer Price Index
GDP:
GDP Per Capita: =
Consumption:Investment:
Government Spending:Tourism Export:
Impor:
3. The United StateTourism Arrival: =
Tourism Spending
Tourism Investment:
Consumer Price Index:GDP:
GDP Per Capita: =
Consumption:Investment:Government Spending:
Tourism Export:
Tourism Import:
4. EuropeanTourism Arrival :
=
Tourism Expenditure
Investment Tourism:
Consumer Price Index:GDP:
GDP Per Capita: =
Consumption:Investment:
The First International Conference on Law, Business and Government 2013, UBL, Indonesia
III-68
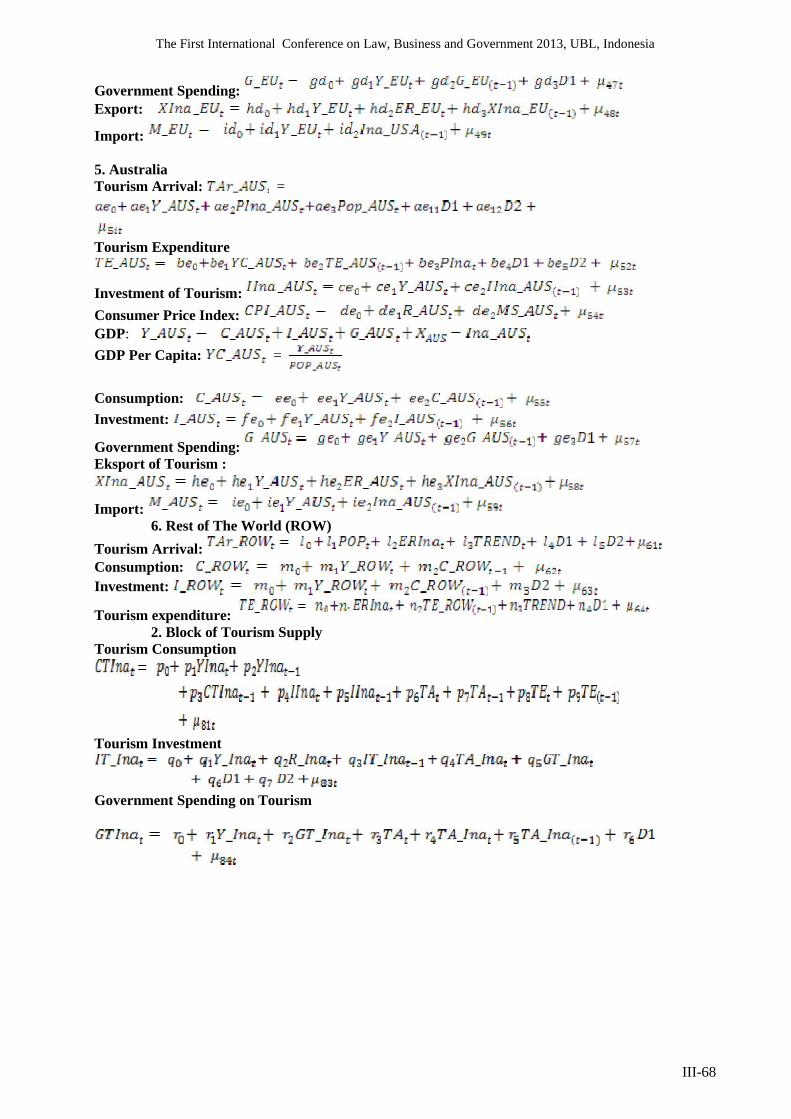
Government Spending:Export:
Import:
5. AustraliaTourism Arrival: =
Tourism Expenditure
Investment of Tourism:
Consumer Price Index:GDP:
GDP Per Capita: =
Consumption:Investment:
Government Spending:Eksport of Tourism :
Import:6. Rest of The World (ROW)
Tourism Arrival:Consumption:Investment:
Tourism expenditure:2. Block of Tourism Supply
Tourism Consumption
Tourism Investment
Government Spending on Tourism
The First International Conference on Law, Business and Government 2013, UBL, Indonesia
III-69
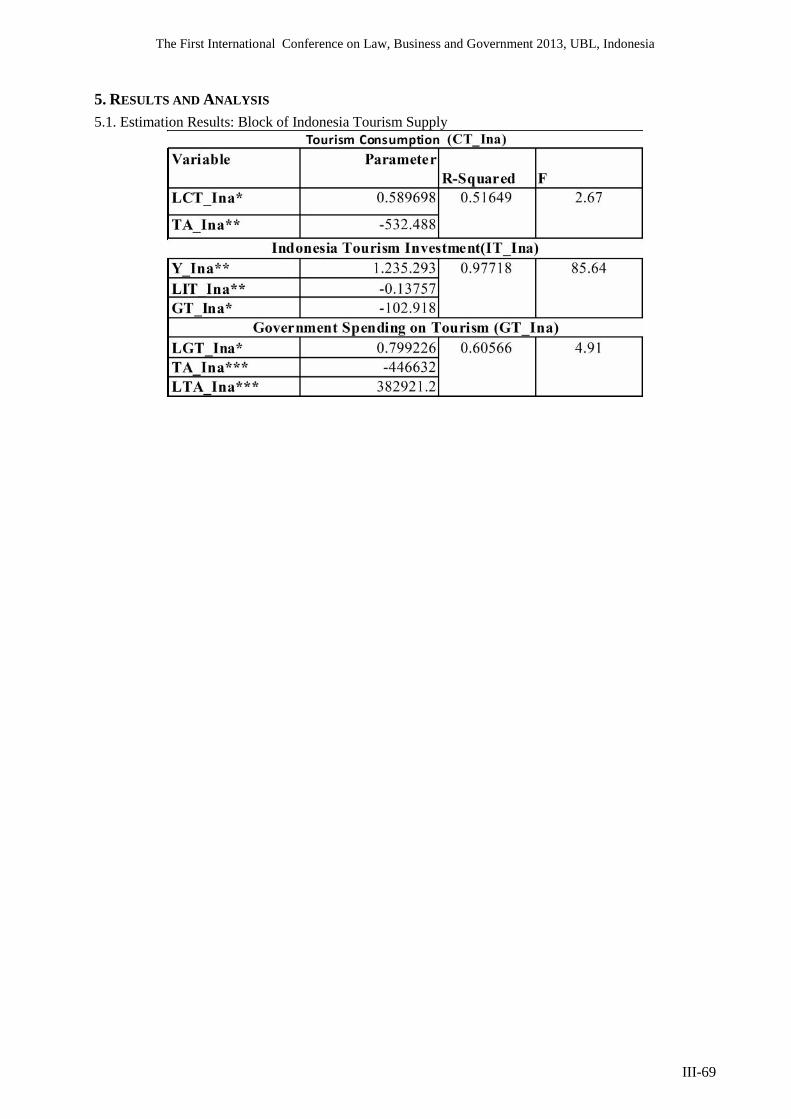
5. RESULTS AND ANALYSIS
5.1. Estimation Results: Block of Indonesia Tourism Supply
Variable ParameterR-Squared F
LCT_Ina* 0.589698
TA_Ina** -532.488
Y_Ina** 1.235.293LIT_Ina** -0.13757GT_Ina* -102.918
LGT_Ina* 0.799226TA_Ina*** -446632LTA_Ina*** 382921.2
Tourism Consumption (CT_Ina)
0.51649 2.67
Indonesia Tourism Investment(IT_Ina)0.97718 85.64
Government Spending on Tourism (GT_Ina)0.60566 4.91
The First International Conference on Law, Business and Government 2013, UBL, Indonesia
III-70
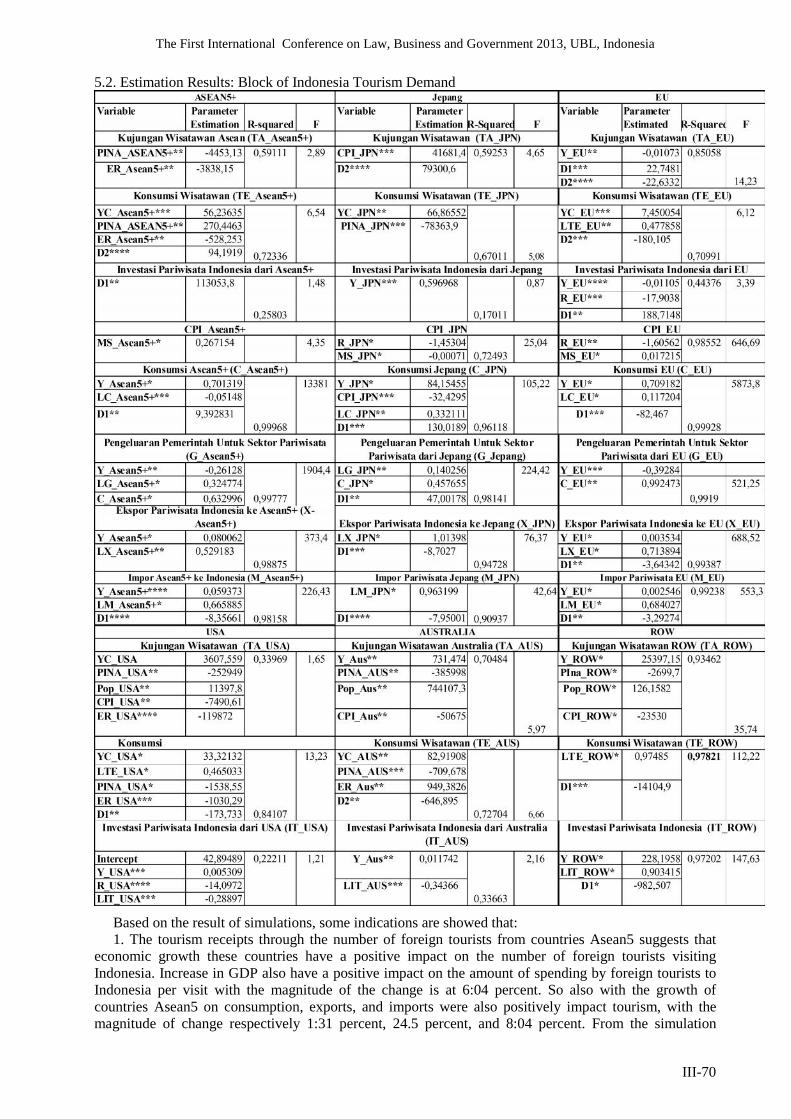
5.2. Estimation Results: Block of Indonesia Tourism Demand
Variable ParameterEstimation R-squared F
Variable ParameterEstimation R-Squared F
Variable ParameterEstimated R-Squared F
PINA_ASEAN5+***
-4453,13 CPI_JPN*** 41681,4 Y_EU** -0,01073
D1*** 22,7481D2**** -22,6332
YC_Asean5+*** 56,23635 YC_JPN** 66,86552 YC_EU*** 7,450054PINA_ASEAN5+** 270,4463 LTE_EU** 0,477858ER_Asean5+** -528,253D2**** 94,1919
Y_EU**** -0,01105
R_EU*** -17,9038
D1** 188,7148
R_JPN* -1,45304 R_EU** -1,60562MS_JPN* -0,00071 MS_EU* 0,017215
Y_Asean5+* 0,701319 Y_JPN* 84,15455 Y_EU* 0,709182LC_Asean5+*** -0,05148 CPI_JPN*** -32,4295 LC_EU* 0,117204
LC_JPN** 0,332111D1*** 130,0189
Y_Asean5+** -0,26128 LG_JPN** 0,140256 Y_EU*** -0,39284LG_Asean5+* 0,324774 C_JPN* 0,457655
C_Asean5+* 0,632996 D1** 47,00178
Y_Asean5+* 0,080062 LX_JPN* 1,01398 Y_EU* 0,003534LX_EU* 0,713894D1** -3,64342
Y_Asean5+**** 0,059373 42,64 Y_EU* 0,002546 0,99238 553,3LM_Asean5+* 0,665885 LM_EU* 0,684027D1**** -8,35661 D1**** -7,95001 D1** -3,29274
YC_USA 3607,559 Y_Aus** 731,474 Y_ROW* 25397,15PINA_USA** -252949 PINA_AUS** -385998 PIna_ROW* -2699,7
Pop_USA** 11397,8CPI_USA** -7490,61
KonsumsiWisatawanYC_USA* 33,32132 YC_AUS** 82,91908
LTE_USA* 0,465033 PINA_AUS*** -709,678
PINA_USA* -1538,55 ER_Aus** 949,3826ER_USA*** -1030,29D1** -173,733
Intercept 42,89489 Y_ROW* 228,1958Y_USA*** 0,005309 LIT_ROW* 0,903415R_USA**** -14,0972LIT_USA*** -0,28897
ER_Asean5+** -3838,15
0,59111 2,89
D2****
112,22
Investasi Pariwisata Indonesia (IT_ROW)
D1* -982,507
147,630,97202
ER_USA**** -119872
Investasi Pariwisata Indonesia dari USA (IT_USA)
0,011742
LIT_AUS*** -0,343660,33663
2,16
0,5291830,98875
373,4D1*** -8,7027
0,94728
D1*** -82,4670,99928
5873,8
Pengeluaran Pemerintah Untuk SektorPariwisata dari EU (G_EU)
C_EU** 0,992473
0,44376 3,39
D1** 9,3928310,99968
13381
0,98552 646,69MS_Asean5+* 0,267154
-180,105
0,70991
6,12
D1** 113053,8
0,25803
1,48
0,9919
521,25
0,99387
688,52Ekspor Pariwisata Indonesia ke EU (X_EU)
ROW
Investasi Pariwisata Indonesia dari EU
D2***
Kujungan Wisatawan Australia (TA_AUS)
Pop_Aus** 744107,3
0,70484
0,7249325,04
0,85058
14,23Konsumsi Wisatawan (TE_EU)
5,97Konsumsi Wisatawan (TE_AUS)
D2** -646,895
Kujungan Wisatawan ROW (TA_ROW)
79300,6
0,59253
Konsumsi Wisatawan (TE_ROW)
0,84107
13,23
0,72704 6,66
LTE_ROW* 0,97485
D1*** -14104,9
0,33969 1,65
USA
Kujungan Wisatawan (TA_USA)
CPI_Aus** -50675
Impor Pariwisata EU (M_EU)
Investasi Pariwisata Indonesia dari Australia(IT_AUS)
Pop_ROW* 126,1582
CPI_EU
Konsumsi EU (C_EU)
CPI_ROW* -23530
0,93462
35,74
AUSTRALIA
0,963199LM_JPN*
0,90937
EU
Kujungan Wisatawan (TA_EU)4,65
Ekspor Pariwisata Indonesia ke Jepang (X_JPN)
PINA_JPN*** -78363,9
0,67011 5,08
4,35
0,98141
224,42
Impor Pariwisata Jepang (M_JPN)
76,37
0,97821
Investasi Pariwisata Indonesia dari Jepang
CPI_JPN
Konsumsi Jepang (C_JPN)
0,96118
105,22
Pengeluaran Pemerintah Untuk SektorPariwisata dari Jepang (G_Jepang)
Y_JPN*** 0,596968
0,17011
0,87
Impor Asean5+ ke Indonesia (M_Asean5+)
0,98158
226,43
Jepang
Kujungan Wisatawan (TA_JPN)
Konsumsi Wisatawan (TE_JPN)
0,99777
1904,4
Ekspor Pariwisata Indonesia ke Asean5+ (X-Asean5+)
LX_Asean5+**
0,22211 1,21
Investasi Pariwisata Indonesia dari Asean5+
CPI_Asean5+
Konsumsi Asean5+ (C_Asean5+)
Pengeluaran Pemerintah Untuk Sektor Pariwisata(G_Asean5+)
Y_Aus**
ASEAN5+
Kujungan Wisatawan Asean (TA_Asean5+)
Konsumsi Wisatawan (TE_Asean5+)
0,72336
6,54
Based on the result of simulations, some indications are showed that:1. The tourism receipts through the number of foreign tourists from countries Asean5 suggests that
economic growth these countries have a positive impact on the number of foreign tourists visitingIndonesia. Increase in GDP also have a positive impact on the amount of spending by foreign tourists toIndonesia per visit with the magnitude of the change is at 6:04 percent. So also with the growth ofcountries Asean5 on consumption, exports, and imports were also positively impact tourism, with themagnitude of change respectively 1:31 percent, 24.5 percent, and 8:04 percent. From the simulation
The First International Conference on Law, Business and Government 2013, UBL, Indonesia
III-71
results, it is found if there is a Japanese economic growth of 6 percent would lower the foreign touristsvisiting Japan to Indonesia at 2:08 percent, government spending 7:08 percent, 3.76 percent tourismconsumption and tourism exports of 88.42 percent. In contrast, the Japanese economic growth of 6percent will increase spending by foreign tourists per visit sebesa 20.3 percent, 143.90 percent tourisminvestment, tourism and impor of 11:46 percent. GDP growth of 6 percent in the United States, from thesimulation results obtained negative impact on U.S. foreign tourist visits to Indonesia, the magnitude ofspending U.S. tourists in Indonesian tourism investment, government spending (in the tourism sector),and the export of tourism, with the magnitude of change in each of 0.0006 percent, 10.64 percent, 42.03percent, 00:05 percent, and 1:57 percent. While the positive impact of the increase in GDP in the UnitedStates for tourism consumption, and the changing imports of tourism respectively by 0.67 percent, and2:51 percent. The impact of the increase in GDP of European countries by 6 percent were positive forforeign tourists visiting European countries amounted to 0.03 per cent, 4.28 per cent of tourismconsumption, government spending in the tourism sector by 5.12 per cent, 11.08 per cent of exports oftourism , and imports of 14:41 percent tourism. While the impact of increase in GDP by 6 percent inEuropean countries was negative, which gained its impact on the amount of expenditures Europe touristin Indonesia 2.16 percent, 149.01 percent and tourism investment. Impact of the increase in Australia'sGDP by 6 percent, from the simulation results obtained positive for foreign tourists visiting Australia toIndonesia amounted to 13.74 percent, 243.49 percent tourism investment, consumption of 7.14 percent,7.8 planners in government spending, and exports 3.13 tourism. percent. In contrast to the amount ofexpenditures of foreign tourists to Indonesia and Australia imports negatively impact tourism GDPincreased 6 percent, with the magnitude of the change 17.94 percent, and 10.81 percent.
2. By the time the interest rate of 5.75 percent , the number of tourists from Asean countries toIndonesia increased by 20.4 per cent on the contrary impact on tourism demand and supply - Asean5Indonesia had lower inflation rate of 0.56 percent , 163.53 percent of tourism investment , consumptionby 1.70 percent and government spending in the tourism sector by 2.65 percent. From the simulationresults on block Indonesian tourism demand from Japan suggests that if the current BI rate at 5.75 thenthe impact on the number of foreign tourists visiting Japan to Indonesia is negative , with the magnitudeof the decline was 3 percent . As well as the impact on consumption , inflation , government spending ,and exports ; with the magnitude of the decline amounted to 6:39 percent , 12:08 percent , 10.74 percent ,and 88.36 percent . While the impact of the prevailing interest rate at 5.75 percent in Indonesia to theamount of spending Japanese tourists per day in Indonesia , tourism investment , tourism and importvalue is positive , which means that if there is an increase sebesr 5.75 percent interest rate would increasespending by foreign tourists , investment and imports respectively amounted to 20.3 percent , 139.52percent and 10.88 percent . Applicability of interest rate by 5.75 per cent in the country to supply anddemand of Indonesian tourism - Americans , based on the results obtained simulsi negative impact onU.S. foreign tourists to visit Indonesia , tourism spending U.S. tourists per visit in Indonesia , tourisminvestment , consumption , and export value of tourism to the magnitude decreased respectively by 2:15percent , 10.64 percent , 99.96 percent , 0.82 percent , and 2:52 percent . Instead of simulation resultsimpacts of a 10 percent increase in interest rates have a positive impact to interest rates , governmentspending , and imports to the value of each individual is 00:28 percent and 12:24 percent. From thesimulation results obtained by the impact of an interest rate of 5.75 percent is positive for foreign touristsvisiting European countries amounted to 12:03 per cent , 1.61 per cent of tourism consumption ,government spending in the tourism sector of 3:17 per cent , 9:45 percent tourism exports , and imports oftourism of 12:54 percent . While the impact of rising interest rates timgkat 10 percent in Europeancountries is negative for European tourists spending in Indonesia per visit of 2:16 percent , 149.55 percentand the investment price level of 0:33 percent, which gained its impact on the amount of European touristexpenditures in Indonesia 2:16 percent , 149.01 percent and tourism investment. The impact of interestrate 5.75 percent , from the simulation results obtained positive for foreign tourists visiting Australia toIndonesia 29.84 percent , 215.67 percent tourism investment , consumption percent 4:06 , 5:03 percent ofgovernment spending , and exports 1:43 tourism percent . In contrast to the amount of expendituresAustralian tourists to Indonesia , level of prices , and the negative impact on tourism imports increased 10percent interest rate , with the magnitude of the change 17.94 per cent , 1:01 percent and 14:08 percent .In addition, the simulation results obtained on how the impact of interest rates by 5.75 per cent against thevisit of tourists from all over the world , the amount of spending per day from tourists all over the world ,tourism investment , tourism consumption , tourism exports , and imports of tourism from all over theworld , which of the results simulations obtained with the positive impact of each individual 12:50percent , 2.65 percent , 3.19 percent , 1.4 percent , 3.67 percent , and 3.61 percent . The negative impact
The First International Conference on Law, Business and Government 2013, UBL, Indonesia
III-72
of the increase in worldwide GDP by 6 percent , from the simulation results obtained on the level ofprices , the magnitude of the effect of government spending respectively 12:38 percent and 3.65 percent.
3. the simulation results in case of tourism demand block rate hikes prices by 6.8 percent , whereas inthe simulation results Indonesian tourism demand equation block of countries Asean5 positive impactoccurred on the amount of spending by foreign tourists to Indonesia Asean5 per day at 6:04 percent , thevalue of imports of tourism Indonesia to Asean5 at 3:46 percent , and the export value of Indonesiantourism Asean5 by 6.9 percent. On tourism demand equation blocks Indonesia to Japan , the simulationresults obtained are positive impacts of foreign tourists visiting Japan , the amount of spending by foreigntourists to Indonesia Japan per visit , Japanese investment in Indonesia's tourism sector , the level ofprices , and the Japanese import of Indonesian tourism with magnitude respectively is 95.75 percent ,20:30 percent , 137.12 percent , 10 percent , and 10.88 percent . As for the consumption , governmentspending in the tourism sector , and the value of Japan's exports to Indonesia tourism negatively , withvariable coefficients respectively 17.96 percent , 21:53 percent , and 88.36 percent. The positive impactthat occurs when inflation of 6.8 percent for Indonesia tourism demand from the USA is happening at thelevel of prices of goods and imports 10.05 percent at 00:24 percent tourism USA . In contrast to foreigntourists visiting the USA , the amount of spending by foreign tourists to Indonesia, USA , USA toIndonesia tourism investment , tourism sector consumption , government spending tourism sector ,tourism and import value respectively obtained for 85.29 percent , 10.64 percent , 47.07 percent , 2:51percent , 1.87 percent , and 2:52 percent. In the Indonesian tourism demand blocks from the EuropeanUnion based on the simulation results , the positive impact due to increase by 10 percent effect on thenumber of foreign tourists visiting the European Union to Indonesia , 9.99 percent of the level of prices ofgoods , consumption of 1.80 percent against , 3:50 percent of government expenditure , the value oftourism exports for 9:45 , and 12:54 to import tourism value , whereas if the negative impact of theincrease in the prices of 10 per cent occurred in the magnitude of EU spending foreign tourists toIndonesia per day of 2:16 percent , and investment sector, tourism 146.36 percent. Positive impact if thereis an increase in prices by 10 percent pad Indonesian tourism revenue equation from Australia occurredon investment of 217.73 per cent , 9.95 per cent of the level of prices , consumption by 5.98 percent ,government spending percent of 8:02 , and 1:43 on the value of tourism exports . The negative impactcaused when there is an increase in prices by 10 percent occur in foreign tourists visiting Australia toIndonesia 170.74 percent , the amount of Australian tourists spending per visit by 17.94 percent , andimports of 14:08 percent. In Equation worldwide tourism receipts to Indonesia , from the simulationresults obtained positive impact if there is an increase in prices by 10 percent against foreign tourists visit, the magnitude of touristsm expenditure per day to Indonesia , investment , level of prices of goods ,consumption , exports , and imported by the magnitude of the effect of each 0.50 percent , 2.65 percent ,3.18 percent , 10.01 percent , 1.79 percent , 3.67 percent , and 3.61 percent , while the rate of increase inspending of tourists influence the prices of goods by 10 percent will have a negative impact ongovernment spending in the tourism sector of 1:40 percent .
6. CONSCLUSION
1 . The contribution of Indonesia Tourism sector to national economy has been third rank from nineestblishment, after the processing industry sector , fisheries and livestock farming with the contribution ofthe tourism sector by 13.90 per cent of total gross domestic product (GDP) , while the contribution oftourism investment during 2012 was only 6 percent and is still inadequate compared to the capacitytourism sector's contribution to GDP2 . The tourism supply is offered by tourism providers are included in this tour services , places / touristatrkasi , consumer goods and travel . Investment to tourism offer of a state / regional tourist destination isgenerally done in order to improve the capacity and competitiveness of tourism itself, so that the availableresources in a tourist area has added value , as well as the potential of a tourist area if it is supported bythe large quality and quantity of investment made , in this case the role of government , private , andforeign indispensable . Various efforts in exploring the potential of tourism in Indonesia such asinfrastructure development , facilities , promotion , and regulation should continue to be made . Inaddition, the constraints that often occur as extortion , bureaucratic and convoluted administrative ,regulatory overlap with each other , security and social factors should begin to be considered in order toimprove the investment climate in the country is comfortable and safe . The contribution of tourisminvestment in Indonesia is empirically known by 96 percent , which means that the influence of tourisminvestment on a very large amount of tourism offers .
The First International Conference on Law, Business and Government 2013, UBL, Indonesia
III-73
3 . Economic growth occurs when a country (country of origin of tourists) the number of foreign touristsvisiting Indonesia tends to increase , while when economic growth occurs in the number of foreigntourists visiting Indonesia tends to decrease , this is because in times of economic growth in Indonesiaincreased commodity prices , including the price - tourism commodity prices will be more expensive thanbefore . On the other hand economic growth in Indonesia Indonesia which encourage residents to goabroad , and if the country of origin of foreign tourists increased growth along with economic growth inIndonesia, the number of inbound (arrival) and outbound (departure) showed an increase , but the increasewas smaller in the inbound compared with the increase in outbound tourism surplus tends to decrease .4 . Domestic exchange rate (Rupiah) against foreign currencies also affect the tourism price changes , sodoes the Indonesian consumer price index and the consumer price index of tourists origin country alsoaffects the price of tourism in the country . Strengthening of the rupiah against foreign currencies wouldreduce spending foreign tourists while in Indonesia. At the time of monetary expansion policy which ledto a decline in the value of the rupiah against foreign currencies and caused prices to be more competitivetourism in Indonesia , while the price of holidays abroad became more expensive for the people ofIndonesia . On the other hand this policy will also trigger the consumer price index resulted in priceincreases of Indonesian tourism . Due to the pull of these two forces resulted in a decline in the number offoreign tourists visiting Indonesia , and these conditions resulted in reduced tourism surplus in otherwords the deficit budget.5 . Qualitative factors such as the economic crisis and travel warning do not always affect the intention tovisit Indonesia , as well as the intention of potential investors to invest in Indonesia in the tourism sector .Such as the Bali bombings experience I and II where the occurrence of events after the number of foreigntourist arrivals from countries like USA , Australia , and the European Union had a pretty drasticdeterioration as well as the value of investments and trade of these countries , so it meskioun this does nothappen on the number of visits , investment , trade and tourism from other countries especially fromASEAN ( Singapore , Malaysia ) , Japan , and South Korea .6 . The amount of government expenditure on tourism sector affect the activities especially tourisminvestment and tourism trade . Because government investment spending is government spending that isused to fund activities related to the dimension of time longer than one fiscal year . Investment spendingdevoted to the formation of an asset ( stocks of capital goods ) in the future is expected to cause a largemultiplier effect and more sustainable , so in this case the government expenditure related to investmentin the tourism sector spending is done in order to meet the needs of the tourism demand and supplyunytuk aims to increase economic growth and well-being of society as a result of the investment activity .The size of government spending will affect the demand and supply of tourism in the country7 . Economic growth in these countries have a positive impact on the number of foreign tourists visitingIndonesia . Increase in GDP also have a positive impact on the amount of spending by foreign tourists toIndonesia per day . The greater the growth rate , the more positive impact on the level of consumption ,the value of exports and imports of a country , this is because due to the ever increasing economic growthwill result in increased purchasing power due to higher revenue semkin society as a whole , so that theincrease in purchasing power will lead to an increase in demand and consumption of goods and services .
BIBLIOGRAPHY
[1] Anderson, James E. 1979. A Theoretical Foundation For The Gravity Equation, American Economic Review69, 106-116
[2] Antariksa B. 2010. Pengaruh Liberalisasi Perdagangan Jasa terhadap Daya Saing Kepariwisataan Indonesia.Prosiding Pertemuan Diklat Pariwisata tingkat Lanjutan Tahun 2010; Jakarta, 29 Juli 2010. Jakarta: PusdiklatKemenbudpar.
[3] Antara, Made. 1999. Dampak Pengeluaran Pemerintah dan Wisatawan terhadap Kinerja Perekonomian Bali:Pendekatan Sosial Accounting Matrix. (Disertasi). Bogor: IPB
[4] Archer, Brian & Cooper. 1994. The Positive and Negatif Impacts of Tourism. Oxford: Butterworth-Heinemann.[5] Barudin. 2011. Dampak Liberalisasi Perdagangan dan Peningkatan Permintaan Pariwisata terhadap Kinerja
Ekonomi Makro dan Sektoral di Indonesia. (Thesis). Bogor: IPB[6] Choyakh H. 2008. Modeling Tourism Demand in Tunisia Using Cointegration and Error Correction Models.
London: Physica-Verlag.[7] Dornbusch, R., S. Fischer, dan R. Startz. 2004. Macroeconomics. 9th edition. McGraw-Hill, Boston[8] Dunning, John H. 1980. Towards an Eclectic Theory of International Production: Some Empirical Tests.
Reading University. England[9] Gujarati, D. 1995. Basic Econometrics. Third Edition. McGraw-Hill, New York[10] Greene. 2000, Econometric Analysis. 4th ed., Englewood Cliffs, NJ: Prentice-Hall
The First International Conference on Law, Business and Government 2013, UBL, Indonesia
III-74
[11] Hady H. 2004. Ekonomi Internasional, Teori dan Kebijakan Perdagangan Internasional. Buku kesatu. Jakarta :Ghalia Indonesia.
[12] Hanafiah, M.H. & Harun, M.F. 2011. Trade and Tourism Demand: A case of Malaysia. InternationalConference on Business and Eonomic Research. Malaysia
[13] Heriawan R. 2004. Peranan dan Dampak Pariwisata pada Perekonomi Indonesia: Suatu Pendekatan Model I-O san SAM [Disertasi]. Bogor: IPB.
[14] Intriligator, M.R. Bodkin and C. Hsiao. 1978. Econometrics Models, Techniques and Application. Prentice-HallInc., New Jersey
[15] Koutsoyianis, A. 1977. Theory of Econometrics: An Introductory Exposition of Econometric Methods. SecondEdition. The Macmillan Publisher Ltd,. London
[16] Paul R. Krugman & Mauricen Stfeld, International Economics, Theory and Practics, London Scott, Foresman &Company, 1997
[17] Kweka J. 2004. Tourism and The Economiy of Tanzania: a CGE Analysis. Research Fellow Economic andSosial Research Foundation. Oxford, UK: P.0. BOX 31226., 21 - 22 March 2004.
[18] Lumaksono, Adi. 2011. Dampak Ekonomi Pariwisata Internasional Pada Perekonomian Indonesia: SuatuPendekatan Ekonometrika dan Analisis Input-Output (Disertasi). IPB. Bogor
[19] Mankiw, N.G., D. Romer, dan D. Weil. 2002. A Contribution to the Empirics of Economic Growth, QuarterlyJournal of Economics
[20] Marpaung, Happy. 2002. Pengantar Pariwisata. Bandung : Alfabeta[21] Mathieson, Alister dan Wall, Geofrey, 1982, Tourism: Economic, Physical, and Sosial Impacts, Longman,
London and New York[22] Mason, P. 2003, Tourism Impacts, Planning and Management . Oxford[23] Millberg, William. 1999. Foreign Direct Investment and Development: Reassessing the Costs and Benefits.
International Monetary and Financial Issues for the 1990’s, Vol. VII, UNCTAD: Geneva[24] Nicholson W. 2005. Microeconomic Theory, Basic Principles and Extensions. Ninth Edition. Canada: Thomson
South-western.[25] Oktaviani R, Novianti T. 2009. Teori Perdagangan Internasional dan Aplikasinya di Indonesia. Bagian I.
Bogor: Departemen Ilmu Ekonomi FEM, IPB.[26] Pitana, I Gde, & Gayatri, Putu G. 2005. Sosiologi Pariwisata. Yogyakarta.: Andi[27] Pyndick, R.S. and D.L. Rubinfeld. 1991. Econometric Models and Economic Forecast. Third Edition. Mc
Graw-Hill Inc, Singapore[28] Rahayu, Ani Sri, 2010, Pengantar Kebijakan Fiskal, Bumi Aksara, Jakarta[29] Raharja, Prathama, dan Manurung. 2008. Pengantar Ilmu Ekonomi. Lembaga Penerbit Fakultas Ekonomi
Universitas Indonesia. Jakarta[30] Romer, Paul, M. 1986.[31] The Journal of Political Economy, Volume 94 Vol 5. Pp 1002-1037[32] Sadoulet E, de Janvry A. 1995. Quantitative Development Policy Analysis. Baltimore: The Johns Hopkins
University Press.[33] Samuelson. P.A., and Nordhaus. 2004. Economics. 17th Edition. Irwin-Mc Graw Hill[34] Salvatore D. 1996. Ekonomi Internasional. Munandar H, penerjemah; Sumiharti Y, editor. Jakarta: Erlangga.
Terjemahan dari: International Economics.[35] Sinclair, M. T., and C. M. S. Sutcliffe. 1988. The Estimation of Keynesian Income Multipliers at The Sub-
national level. Applied Economics 20(11), 1435-1444.[36] Smith, S. L. J. 1988. Defining Tourism: A Supply-Side View. Annuals of Tourism Research 15(2):179-190.[37] Spillane & James, J. 1994. Ekonomi Pariwisata: Sejarah dan Prospeknya. Kanisius. Yogyakarta[38] Sugiyarto G, Blake A, Sinclair MT. 2003. Economic Impact of Tourism and Globalisation in Indonesia.
Annuals of Tourism Research, 30 (3). Hlm 683-701.[39] Sukirno, Sadono. 2001. Pengantar Teori Mikroekonomi. Edisis ke-2. Jakarta. Rajawali Pess[40] Suyana, Made. 2006. Pengaruh Perkembangan Pariwisata Terhadap Kinerja Perekonomian dan Perubahan
Struktur Ekonomi Serta Kesejahteraan Masyrakat di Provinsi Bali (Disertasi). Universitas Airlangga. Surabaya[41] Thapa, K. (2005). Challenges and Opprtunities of Village Tourism in Sirubari. B.Sc Thesis, School of
Environmental Management and Sustainable Development, Pokhara University, Kathmandu[42] UNWTO 2009. Tourism Highlights 2009 Edition . http://www.unwto.org [21 April 2010].[43] UNWTO. 2011. Tourism Highlights 2011 Edition. http://www.unwto.org [2 November 2011].[44] Wagner JE. 1997. Estimating the Economic Impacts of Tourism. Annuals of Tourism Research 24 . hlm 592-
608.[45] World Economic Forum. 2011. The Travel & Tourism Competitiveness Report 2011. Geneva, Switzerland.[46] Yoety, Oka. 1996. Pemasaran Pariwisata. Bandung : Angkasa.