CHARACTERISTICS OF INBOUND TOURISM DEMAND IN …ijsser.org/uploads/ijsser_01__94.pdf · Depok,...
20
International Journal of Social Science and Economic Research ISSN: 2455-8834 Volume:01, Issue:10 www.ijsser.org Copyright © IJSSER 2016, All right reserved Page 1521 CHARACTERISTICS OF INBOUND TOURISM DEMAND IN INDONESIA AND RESPONSES OF THE GOVERNMENT Raditya Graduate Program in Economics, Faculty of Economics and Business, Universitas Indonesia, Depok, 16424, Indonesia, Tel: +6221-7270164, +6221-7872588/9, +6281384660299, FAX: 021-78849155 ABSTRACT The efficient planning and management of the tourism sector requires appropriate knowledge about the characteristics of inbound tourism demand, especially in Indonesia, where most industries are highly dependent on the government. This study examined the relationship between the determinants of inbound tourism demand and international visitor arrivals in Indonesia and the responses of the government to changes in the determinants. The findings show that changes in tourists’ origin country income, real exchange rates, travel costs, and the time trend affect international tourist arrivals in Indonesia. However, the inbound tourism demand in Indonesia is sensitive only to changes in the income variable. Moreover, the relationship between changes in income and tourist arrivals in Indonesia is not linear. The government has realized the impact of the changes of the determinants and responded positively through the instrument of budgeting policy. The implication of the findings will affect the budget allocation priority for the tourism marketing program. Keywords: Tourism economics, government budget, tourism policy, inbound tourism demand INTRODUCTION The efficient planning and management of the tourism sector requires appropriate knowledge about characteristics of inbound tourism demand. In a country where most industries are highly dependent on the government, the efficient planning and management of the sector becomes more significant. The better the understanding of the characteristics of the tourism demand, the better the policy produced by the policymakers to enhance the tourism destination competitiveness and attractiveness (Prideaux, 2005, p. 781). Nevertheless, the public agencies turn out to be more critical for the success of businesses in the tourism industry, which are highly dependent on the national tourism demand (Song & Witt, 2000, p. 1). Moreover, the nature of
Transcript of CHARACTERISTICS OF INBOUND TOURISM DEMAND IN …ijsser.org/uploads/ijsser_01__94.pdf · Depok,...

International Journal of Social Science and Economic Research
ISSN: 2455-8834
Volume:01, Issue:10
www.ijsser.org Copyright © IJSSER 2016, All right reserved Page 1521
CHARACTERISTICS OF INBOUND TOURISM DEMAND IN INDONESIA AND RESPONSES OF THE GOVERNMENT
Raditya
Graduate Program in Economics, Faculty of Economics and Business, Universitas Indonesia, Depok, 16424, Indonesia, Tel: +6221-7270164, +6221-7872588/9,
+6281384660299, FAX: 021-78849155
ABSTRACT
The efficient planning and management of the tourism sector requires appropriate knowledge about the characteristics of inbound tourism demand, especially in Indonesia, where most industries are highly dependent on the government. This study examined the relationship between the determinants of inbound tourism demand and international visitor arrivals in Indonesia and the responses of the government to changes in the determinants. The findings show that changes in tourists’ origin country income, real exchange rates, travel costs, and the
time trend affect international tourist arrivals in Indonesia. However, the inbound tourism demand in Indonesia is sensitive only to changes in the income variable. Moreover, the relationship between changes in income and tourist arrivals in Indonesia is not linear. The government has realized the impact of the changes of the determinants and responded positively through the instrument of budgeting policy. The implication of the findings will affect the budget allocation priority for the tourism marketing program.
Keywords: Tourism economics, government budget, tourism policy, inbound tourism demand
INTRODUCTION
The efficient planning and management of the tourism sector requires appropriate knowledge about characteristics of inbound tourism demand. In a country where most industries are highly dependent on the government, the efficient planning and management of the sector becomes more significant. The better the understanding of the characteristics of the tourism demand, the better the policy produced by the policymakers to enhance the tourism destination competitiveness and attractiveness (Prideaux, 2005, p. 781). Nevertheless, the public agencies turn out to be more critical for the success of businesses in the tourism industry, which are highly dependent on the national tourism demand (Song & Witt, 2000, p. 1). Moreover, the nature of

International Journal of Social Science and Economic Research
ISSN: 2455-8834
Volume:01, Issue:10
www.ijsser.org Copyright © IJSSER 2016, All right reserved Page 1522
the tourism industry, which consists mostly of mixed sectors (Chui-Hua, Tzeng, & Lee, 2012, p. 413), makes inter-organizational coordination and cooperation an important factor (Wang & Ap, 2013, p. 223). This type of inter-organizational relationship in the tourism sector means that dependency on the government or public agencies as the coordinator becomes higher than for other sectors, such as agriculture and manufacturing. Thus, a failure in planning demand in the tourism sector will negatively impact the related industries.
This study examined the relationship between some factors or determinants of inbound tourism demand in Indonesia and the responses of the government due to the changes of those factors, using data of tourist arrivals from 47 countries to Indonesia from 2000 to 2014. For the analyses, this study uses panel data and time series analysis. The methodology consists of two parts. The first is significance testing for some factors that influence tourism demand in Indonesia. The second is the response of the government, using the utilization of budget allocation for international tourism marketing as the instrument, as the budget for international tourism marketing has a significant impact on optimizing the benefits of tourism, according to Agarwal and Yochum (1998).
LITERATURE REVIEW
Some studies have discussed the determinants of tourism demand in countries that include Indonesia. Using the data of tourist arrivals to Indonesia from 1980 to 1997, Tan et al. (2002) tried to model the primary factors that influence tourism flows to Indonesia. Income, prices, and time trends were found to be the significant factors. Due to limitations of the data, this study did not include the travel cost variable in the model. Additionally, this research did not discuss international tourism marketing efforts. Falk (2015) and Munoz (2007) observed the same variables with models for each country using the ordinary least square (OLS) method. In another study, Crouch (1995, p. 104) discussed the mixed results in some tourism demand studies. The mixed findings may be related to regional factors, because most empirical data used were from nationwide samples from multiple geographical regions, which share similarities with demographic and socio-economic characteristics (Wei-Ting et al., 2013). Theoretically, these kinds of samples cannot be analyzed using ordinary least square (OLS), because the error terms are correlated, which violates the regression assumption, resulting in misleading findings (Gujarati & Porter, 2009). Additionally, the relationship between income and tourism demand in Indonesia seems less simple than the linear relationship in the model by Tan et al. (2002). Song and Witt (2000) propose that when the consumer’s disposable income is low, the increase in
income tends to have a larger impact on traveling expenditures. By filling the knowledge gap from previous studies, the inbound tourism demand model for Indonesia becomes more realistic while minimizing the errors as a tool of policy analysis.

International Journal of Social Science and Economic Research
ISSN: 2455-8834
Volume:01, Issue:10
www.ijsser.org Copyright © IJSSER 2016, All right reserved Page 1523
To define the characteristics of inbound tourism demand, we should be able to determine the factors that affect it. Song and Witt (2000, pp. 4-7) have listed eight explanatory variables to model the demand. The variables are population, income, own price, substitute price, tastes, marketing, tourists’ habits, and special events. Exchange rates are also sometimes used to
represent the cost of living for tourists. Among those factors, income, relative prices, and transport costs are mostly used in the research about tourism demand factors (Prideaux, 2005, p. 782). In the micro or household level, a previous study by Wei-Ting et al.(2013, pp. 613-614) indicated that age, income, car ownership, and Internet usage have a positive impact on tourism spending decisions, while home loan and health insurance expenditures negatively influence tourism expenditures. In addition to those variables, the study noted that regional factors, such as average household income and industry structure, also affected tourism expenditures. On a macroeconomic level, regionalization significantly impacts tourism investments and visitor arrivals (Henderson, 2001, p. 78). The definition of regionalization is the increase of cross-border flows of capital, goods, and people within specific geographic areas that are regionally close (Hoshiro, 2013, p. 2). Thus, there is a possibility that tourism demand in Indonesia is affected by neighboring countries such as Malaysia, Singapore, and Thailand.
The responsiveness of tourism demand to changes in the independent variables can explain tourism demand relationships to some variables. To calculate the responsiveness of tourism demand to changes in the independent variables, Song and Witt (2000) proposed using demand elasticity as the measure. Demand elasticity shows the relationship between demand and its determinant as the change in percentage caused by a 1% change in the determinant. For example, an income elasticity of 1.8 shows that the demand increases by 1.8% when the income increases by 1%. However, there is no standard value for the tourism demand elasticity of a country. The variations in tourism demand elasticity depend on the nationality or originality of the tourist and the specification of the destination of the observed country (Crouch, 1995, p. 111). For example, negative growth in Indonesia’s tourism industry in 1997 was attributed to the Asian currency
crisis and the outbreaks of forest fires in Indonesia (Tan et al., 2002, p. 64). The negative growth in Indonesia’s tourism industry is evidence for categorizing Indonesia’s tourism demand as
sensitive to changes in exchange rates and qualitative events. In addition to the demand theory, analysis in tourism research may also use the trade and investment perspective, as done bySingagerda, Oktaviani, Hakim, and Kustiari (2013).
Government efforts play a major role in managing tourist flow. In general, the effort to influence tourist flow is conducted by increasing attractiveness and competitiveness of a destination (Prideaux, 2005, p. 781). More specifically, Prideaux (2005, p. 783) has listed some responsibilities of governments regarding tourism activities. First, diplomatic relations play a significant role, as they facilitate or discourage people from travel. Visa and passport regulations

International Journal of Social Science and Economic Research
ISSN: 2455-8834
Volume:01, Issue:10
www.ijsser.org Copyright © IJSSER 2016, All right reserved Page 1524
have a relationship to this issue. Second, transportation policy—for example, an agreement on bilateral aviation—will give access for travel. Third, and most important, is whether or not regulations are designed to assist tourism development. The last item is an economic policy that stimulates tourism. At the government level, categories of factors include diplomatic, policy, marketing, political regimes, and the supply of goods and services. However, previous studies on tourism policy planning often neglect to consider the priority levels of the policies (Chui-Hua, Tzeng, & Lee, 2012, p. 414). Government effort is needed primarily to deal with international issues, because tourism is perceived as a sector that is vulnerable to international events (Hitchkock, 2001, p. 101). Although not as directly involved as income from the tourism sector, budget spending for international tourism marketing is important for the tourism industry in Indonesia. A reduction in tourism marketing in fiscal plans would reduce visitor spending, jobs, and revenue from taxes (Landis, 2016). Therefore, if the objective of the tourism policy is to maximize benefits from tourism, then the government should expand the marketing budget (Agarwal & Yochum, 1998).
Some studies documented the experiences of Indonesia’s government in dealing with stressful
situations in tourism. The government took several actions to maintain the tourism industry in Indonesia prior to the financial crisis in 1997. According to Henderson (1999), most government activities took the form of promotional campaigns. The activities relied on private sector funds to regain tourist markets through overseas promotions. The promotions focused on countries that were not directly affected by the financial crisis, such as Australia, New Zealand, Japan, Europe, and the United States. From the supply side, the government announced a shorter procedure of only 30 days to start tourism businesses. However, those attempts were considered a failure, as hotel occupancy levels failed to rise and airlines were unable to fulfill leasing agreements. Some of the tourism businesses closed their operations (Henderson, 1999). On the other hand, while Indonesia was trying to increase its budget on promotional campaigns for overseas tourist markets, Thailand was cutting its budget on foreign offices Thailand focused its efforts on the most productive markets, such as Scandinavia and China, with an emphasis on Internet marketing and on empowering Thai embassies. The Thai government also relaxed visa rules for elder and retired Japanese and adopted a visa on arrival regulation, resulting in better prospects compared to Indonesia. Nevertheless, when confronted with terrorism issues, such as the Bali bombing in 2002, Indonesia was successfully managed the issues (Henderson, 1999).
METHODOLOGY
Most studies examine different types of tourism demand and use the number of visitor arrivals from an origin country to a destination country, recorded by frontier counts or immigration counters, to calculate the international inbound tourism demand (Song & Witt, 2000, p. 3). Thus,
International Journal of Social Science and Economic Research
ISSN: 2455-8834
Volume:01, Issue:10
www.ijsser.org Copyright © IJSSER 2016, All right reserved Page 1525
this paper utilizes the data on visitor arrivals to Indonesia by nationality and country of origin from 2000 to 2014 (Center of Data and Information, 2012, pp. 24-25; Central Board of Statistics for Indonesia,2016; Statistical report on visitor arrivals to Indonesia, 2014). To remove the impact of increasing tourists’ arrivals caused by population growth, the variable of tourist arrival
uses the per capita term (ARRPERCAP), which is the number of visitor arrivals to Indonesia divided by the population of the origin country. The use of the per capita term differs significantly from the composition of dominant countries of tourist arrival compared to the nominal term.
This study uses the gross domestic product (GDP) of the tourist’s origin country to represent the
income variable. In this case, the GDP is defined in real GDP per capita (GDPPERCAP) in US Dollars with the year 2005 constant term to avoid the effect of population growth and inflation bias. The data source comes from International Financial Statistics published by the IMF (International Monetary Fund, 2016) combined with World Development Indicators by the World Bank (World Bank, 2016).
The real exchange rate (RER) variable represents the effect of price to exchange rate. This variable accounts for the interaction of those factors. Using this variable seems to give a better measurement of the joint effect of the changes in exchange rates and relative prices, rather than as a separate variable (Tan et al., 2002, p. 61). The calculation of the RER refers to the methodology from Falk (2015, p. 467) as shown in equation (1). The 𝑒𝑖𝑡 as the nominal exchange rate between Indonesia and the observed country is expressed as the number of Indonesia Rupiah per unit of the observed country’s currency with US Dollars as the intermediary currency. The
𝑃𝑡∗ is the corresponding price level in the counterpart foreign country, measured in consumer
price index (CPI) (2010=100). The𝑃𝑖𝑡 is the price level in theobserved country, measured in CPI (2010=100). For some countries, the RER is calculated as the real effective exchange rate (REER), which consists of the exchange rate of a country compared to some major trade partner countries, not only the United States. The calculation of the REER refers to the methodology by the International Monetary Fund (IMF) (Govil, 2014, p. 25). The International Financial Statistics published by the IMF (International Monetary Fund, 2016) provide data of the real exchange rate (RER) variable. The utilization of the real effective exchange rate as the variable is different from the previous study (Tan et al., 2002, p. 69).
𝑅𝐸𝑅𝑖𝑡 = 𝑒𝑖𝑡 .𝑃𝑖𝑡
𝑃𝑡∗ (1)
The cost of airline tickets represents the travel costs in the model. The calculation of the travel cost (COST) uses the total price of a ticket from Jakarta, Indonesia, to main cities of tourists’
origin countries. The data consists of the cheapest fare across months of the year, taken from
International Journal of Social Science and Economic Research
ISSN: 2455-8834
Volume:01, Issue:10
www.ijsser.org Copyright © IJSSER 2016, All right reserved Page 1526
Skyscanner.com and assumed to be fixed across the period of observation. The cheapest fare represents the demand theory that the lower the price, the higher the demand, in addition to the issue of the existence of low-cost airlines (Rey, Myro, & Galera, 2011).
Time trend variable (TREN) represents the consumer preferences for a destination. In the equation, it is defined as the numerical variable that constantly grows as 2000=1, 2001=2, 2002=3, and so on. This variable is used to capture the effect of changing consumer tastes about tourist destinations, while more than one destination may exist in a country.
The government budget allocation for international tourism marketing represents the marketing efforts to influence inbound tourism demand. In this paper, the model uses the data of the total budget allocation (BUDGET_TOTAL) from the unit responsible for conducting the international tourism marketing program in the Ministry of Tourism for the Republic of Indonesia, from 2010 to 2014. The data comes from the budget and work plan documents from the Bureau of Planning and Finance of the Ministry of Tourism for Indonesia (2010-2014). The analysis uses only the budget allocation that directly targeted a specific country. Therefore, the budget for general uses that has no direct relationship with the origin country of a tourist is omitted. The total budget allocation for each country is displayed in million Rupiah, as the currency unit.
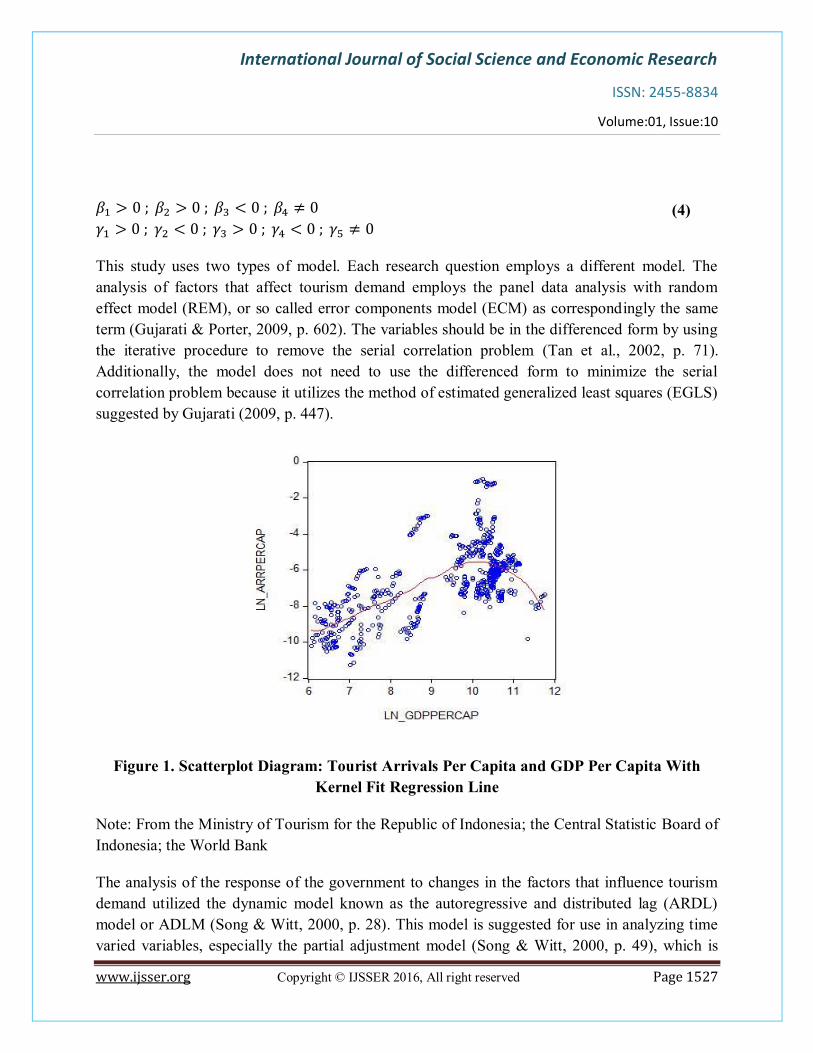
The econometric model is used to explain the impact of some factors on inbound tourism demand in Indonesia. The demand model is the base of analysis, which suggests that changes in consumers’ income, the price of goods or services, and consumer preferences affect demand (Tan et al., 2002, p. 68). In addition, some related literature and the availability of data were also of concern in the model formulation. Therefore, the major determinants of inbound tourism demand for Indonesia include income, relative price and exchange rates, travel costs, and trend term as shown in equation (2). By looking at the scatterplot diagram in the Figure 1, there is a possibility that the relationship between tourist arrivals and income is not linear but quadratic. Accordingly, we use the model in equation (3) to accommodate the marginal changes of income in the relationship, while the hypothesis of the estimated coefficients is in equation (4).
𝑙𝑛𝐴𝑅𝑅𝑃𝐸𝑅𝐶𝐴𝑃𝑖𝑡
= 𝛽0 + 𝛽1𝑙𝑛𝐺𝐷𝑃𝑃𝐸𝑅𝐶𝐴𝑃𝑖𝑡 + 𝛽2𝑙𝑛𝑅𝐸𝑅𝑖𝑡 + 𝛽3𝑙𝑛𝐶𝑂𝑆𝑇𝑖 + 𝛽4𝑇𝑅𝐸𝑁𝑡
+ 𝜀𝑖𝑡
(2)
𝑙𝑛𝐴𝑅𝑅𝑃𝐸𝑅𝐶𝐴𝑃𝑖𝑡
= 𝛾0 + 𝛾1𝑙𝑛𝐺𝐷𝑃𝑃𝐸𝑅𝐶𝐴𝑃𝑖𝑡 + 𝛾2𝑙𝑛𝐺𝐷𝑃𝑃𝐸𝑅𝐶𝐴𝑃𝑖𝑡2 + 𝛾3𝑙𝑛𝑅𝐸𝑅𝑖𝑡
+ 𝛾4𝑙𝑛𝐶𝑂𝑆𝑇𝑖 + 𝛾5𝑇𝑅𝐸𝑁𝑡 + 𝜀𝑖𝑡
(3)
International Journal of Social Science and Economic Research
ISSN: 2455-8834
Volume:01, Issue:10
www.ijsser.org Copyright © IJSSER 2016, All right reserved Page 1527
𝛽1 > 0 ; 𝛽2 > 0 ; 𝛽3 < 0 ; 𝛽4 ≠ 0 𝛾1 > 0 ; 𝛾2 < 0 ; 𝛾3 > 0 ; 𝛾4 < 0 ; 𝛾5 ≠ 0
(4)
This study uses two types of model. Each research question employs a different model. The analysis of factors that affect tourism demand employs the panel data analysis with random effect model (REM), or so called error components model (ECM) as correspondingly the same term (Gujarati & Porter, 2009, p. 602). The variables should be in the differenced form by using the iterative procedure to remove the serial correlation problem (Tan et al., 2002, p. 71). Additionally, the model does not need to use the differenced form to minimize the serial correlation problem because it utilizes the method of estimated generalized least squares (EGLS) suggested by Gujarati (2009, p. 447).
Figure 1. Scatterplot Diagram: Tourist Arrivals Per Capita and GDP Per Capita With Kernel Fit Regression Line
Note: From the Ministry of Tourism for the Republic of Indonesia; the Central Statistic Board of Indonesia; the World Bank
The analysis of the response of the government to changes in the factors that influence tourism demand utilized the dynamic model known as the autoregressive and distributed lag (ARDL) model or ADLM (Song & Witt, 2000, p. 28). This model is suggested for use in analyzing time varied variables, especially the partial adjustment model (Song & Witt, 2000, p. 49), which is

International Journal of Social Science and Economic Research
ISSN: 2455-8834
Volume:01, Issue:10
www.ijsser.org Copyright © IJSSER 2016, All right reserved Page 1528
specialized to model macroeconomic activities that involve habitual persistence and adaptive expectations processes such as consumption and permanent income hypothesis. Janjua, Samad, and Khan (2014) also stated that this method is suitable for small data samples, while the short run and long run coefficient could be estimated simultaneously using the OLS procedure. Past values are used to anticipate the effect of changes in a variable that are rarely instantaneous in economics (Gujarati & Porter, 2009, p. 618). The unidirectional causality from the budget to the determinants of tourism demand represents the response of the government. The equation that utilizes the method is as shown in equation (5), where X is factors that influence tourism demand in Indonesia, j is the lagged period, and 𝜀𝑖𝑡 is the error term that is assumed to be normally distributed with zero mean and constant variance. When the time varied variable that is assumed to significantly affect inbound tourism demand has been decided, for example the GDP and real exchange rate, the equation will become equation(6).
𝐵𝑈𝐷𝐺𝐸𝑇𝑖𝑡 = 𝛼0 + ∑ ∑ 𝛼𝑗𝐵𝑈𝐷𝐺𝐸𝑇𝑖𝑡−𝑗
𝑛
𝑗=1
𝑘
𝑖=1
+ ∑ ∑ 𝛽𝑖𝑗𝑋𝑖,𝑡−𝑗
𝑚
𝑗=0
𝑘
𝑖=1
+ 𝜀𝑖𝑡 (5)
𝐵𝑈𝐷𝐺𝐸𝑇𝑖𝑡 = 𝛼0 + ∑ ∑ 𝛼𝑗𝐵𝑈𝐷𝐺𝐸𝑇𝑖𝑡−𝑗
𝑛
𝑗=1
𝑘
𝑖=1
+ ∑ 𝛽1𝑗𝐺𝐷𝑃𝑃𝐸𝑅𝐶𝐴𝑃𝑖,𝑡−𝑗
𝑚
𝑗=0
+ ∑ 𝛽2𝑗𝑅𝐸𝑅𝑖,𝑡−𝑗
𝑚
𝑗=0
+ 𝜀𝑖𝑡
(6)
RESULTS
Table 1 shows the estimation results of the impact of the changes in determinants of inbound tourism demand to international tourist arrivals in Indonesia using equation (2) and (3). The estimation uses the double log equations for the dependent and independent variables. Therefore, the estimated coefficients represent the elasticity of international tourism arrival to some factors used in the model. Table 1shows the estimated coefficients, t statistics, and the level of significance of the independent variables, such as the GDP per capita, real exchange rates, travel costs, and time trend. In this model, the tourist arrival per capita is the independent variable.
The first model is the linear income growth model, while the second one is the nonlinear income growth model. The study performs a panel data method analysis with random effects to investigate the impact of each independent variable to the changes in international tourist arrivals

International Journal of Social Science and Economic Research
ISSN: 2455-8834
Volume:01, Issue:10
www.ijsser.org Copyright © IJSSER 2016, All right reserved Page 1529
in Indonesia. The second model produce more significant variables and larger adjusted R-squared of 0.3254 compared to the first model with adjusted R-squared of 0.2888. The result means that about 32.54% of the variability can be explained by the second model, which shows that the second model could explain more about the relationship among variables compared to the first model, with only 28.88%. However, the significance levels of those variables are different. Using the second model, all variables are significant at the 5% level or above.
Table 1. Panel Data Estimation of the Impact of Changes in Some Factors to International Tourist Arrivals in Indonesia
Dependent variable: Tourist arrivals per capita (1) (2)
Independent variables Coeff. t-stat Coeff. t-stat Constant -11.987 *** -5.179 -28.533 *** -7.3507
(2.2898) (3.8816) GDP per capita 1.191 *** 5.482 5.157 *** 5.7211
(0.2173) (0.9014) GDP per capita2 - -0.233 *** -4.8686
(0.0479) Real exchange rates 0.102 * 1.771 0.115 ** 2.1083
(0.0577) (0.0546) Travel costs -1.065 *** -2.607 -0.998 ** -2.5054
(0.4085) (0.3982) Time trend 0.017 * 1.720 0.017 ** 2.0723
(0.0097) (0.0080) R-squared 0.2888 0.3254 Adjusted R-squared 0.2842 0.3200
Note: Numbers in parenthesis are the White cross section standard errors.***, **, and * indicate the statistical significance of the estimated coefficients at the 1%, 5%, and 10% significance level, respectively.
The coefficient of parameters shows the elasticity of tourism demand to the independent variables. It represents the sensitiveness of international tourist arrivals in Indonesia as the impact of the changes in those variables. Only the coefficient of GDP per capita is more than unity (more than 1). The other variables are all below unity (less than 1). The coefficient of GDP per capita shows a positive value at 5.157, while the impact of the GDP growth is negative at -0.233. In addition to the GDP, the coefficient of the travel cost is also negative, at -0.998, while the rest of coefficients are positive.

International Journal of Social Science and Economic Research
ISSN: 2455-8834
Volume:01, Issue:10
www.ijsser.org Copyright © IJSSER 2016, All right reserved Page 1530
The Augmented Dickey-Fuller (ADF) test was conducted to verify the presence of a unit root for variables that varied across time, such as the GDP per capita, real exchange rate, and budget. The result of the ADF test is shown in Table 2. The stationarity condition is needed for the variable to avoid the spurious regression problem. The absence of the unit root indicates that the variable is stationary.
Table 2. ADF unit root test results for time varied variables
Level
1st difference
Variables Stat Stat Budget 94.381 ** 155.244 *** GDP per capita 87.933 279.820 *** Real exchange rates 111.259 227.084 ***
Note: Null Hypothesis: There is unit root (individual unit root process). ***, **, and * indicate the statistical significance of the estimated coefficients at the 1%, 5%, and 10% significance level, respectively.
The ADF test results imply that in the level form, most variables are not stationary, as shown by the failure to reject the null hypothesis of the unit root existence, especially for the GDP per capita and exchange rate. However, in the first difference form, the variables no longer hold a unit root. The test rejected the null hypothesis that has unit root at a 1% significance level. For that reason, all of the variables used in the time-varied model are in the first difference form.
After establishing the first differencing procedure, the next step is to examine the relationship between the government tourism marketing budget and the change in GDP per capita and real exchange rate using the ARDL model. The next two proposed models, which are the ARDL and the panel data with random effects (RE), produced the results shown in Table 3.

International Journal of Social Science and Economic Research
ISSN: 2455-8834
Volume:01, Issue:10
www.ijsser.org Copyright © IJSSER 2016, All right reserved Page 1531
Table 3. Result of the Government Budget Response on the Changes in Determinants of Inbound Tourism Demand in Indonesia
Dependent variable: Government tourism budget Estimation method: ARDL RE
Independent variables Coeff.
t-stat Coeff.
t-stat Constant 230.9331 0.5522 20.2947 *** 18.4677
(418.1613) (1.0989) Budget (-1) -0.7189 *** -8.0813 -
(0.0889) GDP per capita -20,186.57
-1.2010 0.4682 *** 20.2056
(16,807.23) (0.0232) GDP per capita (-1) 31,699.91 ** 2.294064 -
(13,818.23) Real exchange rate 12.9271 0.015887 0.1050 1.4949
(813.6915) (0.0702) Real exchange rate (-1) -99.16947 -0.121892 - (813.5870) Travel cost -
-0.6291 *** -2.9825
(0.2109) R-squared 0.3599 0.0733 Adjusted R-squared 0.3359 0.0501 F-stat 14.9612 3.1628 Prob (F-stat) 0.0000
0.0271
Note: ARDL: Autoregressive Distributed Lag; RE: Panel data with Random Effects. Numbers in parenthesis are the standard errors.***, **, and * indicate the statistical significance of the estimated coefficients at the 1%, 5%, and 10% significance level, respectively.
The ARDL model constitutes a lagged variable, which represents the intra-period effects or the long-run relationship between the variables. Regarding the limitation of data, the model uses only one lagged period to be tested. The lagged period variable of budget (BUDGET-1) and GDP per capita (GDP per capita -1) are both significant at 1% and 5% confidence levels. The significant parameter of the lag variables represents the impact of the changes in the previous period to the current value. The negative value of the budget parameter, which is -0.7189, shows that the increase of budget allocation in the previous period will mostly result in the reduction in the current period budget allocation. On the other hand, the positive value of the parameter of the GDP per capita, which is 31,699.91, represents the positive response of the government to the increase of the income of the tourist’s origin country. However, the current changes in the GDP
per capita in the ARDL model are not significant.

International Journal of Social Science and Economic Research
ISSN: 2455-8834
Volume:01, Issue:10
www.ijsser.org Copyright © IJSSER 2016, All right reserved Page 1532
This result implies that there is no short-term effect of the changes in GDP per capita to the budget allocation. The coefficient for the lagged budget variable is negative. However, the coefficient of lagged GDP per capita shows a positive sign. Both variables for real exchange rate are not significant using the ARDL model. Despite the fact that both models fit with the data regarding the F-statistic and its P-value, the adjusted R-squared value for the ARDL model is 0.3359, which is larger than the adjusted R-squared for the random effects model at only 0.0501. Nevertheless, using the RE model, the relationship of a time constant variable such as travel cost can be observed. Using the RE model, the current GDP per capita and travel cost become the significant factors for budget allocation, at 1% confidence level.
DISCUSSION
Based on the result shown in, the relationship between tourist arrivals and income in Indonesia is not linear. The result differs from the previous study by Tan et al. (2002). Figure 2represents the assumption of a linear relationship of the tourist arrivals and income, adopted by previous research.
Figure 2. Scatterplot Diagram: Tourist Arrivals Per Capita and GDP Per Capita With Linear Regression Line

International Journal of Social Science and Economic Research
ISSN: 2455-8834
Volume:01, Issue:10
www.ijsser.org Copyright © IJSSER 2016, All right reserved Page 1533
Note: From the Ministry of Tourism for the Republic of Indonesia; the Central Statistic Board of Indonesia; the World Bank
The figure uses the natural logarithm form of the arrival per capita variable in the vertical axis and the GDP per capita in the horizontal axis, while the linear regression line acts as the relationship between the variables. Using this assumption, the relationship implies that whenever income increases, tourist arrivals will also increase without any limitation. In this case, the countries with higher income tend to contribute more visitors to Indonesia. On the other hand, the nonlinear relationship between the tourist arrivals and income as the result of this study has a different implication.
Figure 1shows the nonlinear relationship between tourist arrivals and income in Indonesia. The variables used in the figure are the same as Figure 2, but the regression line shows a different pattern. The regression line in the figure seems to be a quadratic function rather than a linear one. The curve illustrates the diminishing growth or diminishing marginal changes (Jacques, 2006, p. 271) of tourist arrivals to income changes. It states that the growth of tourist arrivals due to a 1% increase in GDP per capita will eventually decline. In other words, once the income has reached a certain threshold level, the growth of the tourist arrivals will get smaller. Therefore, we can illustrate the Figure 3, which shows the relationship of the tourist arrivals and income in Indonesia in a two- dimensional graph.
Figure 3. The Relationship of Tourist Arrivals and Income in Indonesia
Note: Calculated from the results

International Journal of Social Science and Economic Research
ISSN: 2455-8834
Volume:01, Issue:10
www.ijsser.org Copyright © IJSSER 2016, All right reserved Page 1534
From the Figure 3, there is a point when the increase of income will produce decreasing tourist arrivals. The downward slope of the graph represents the declining number of arrivals as income increases. Song and Witt (2000, p. 11) explain this condition based on the consumer behavior theory. Consumer behavior theory assumes that the increase of income at a certain point will shift consumer demand to a higher order. In this case, rather than spending the excess income on tourism, the consumer prefers to buy an investment or a new property. Another option for spending the additional income is to change the destination of the holiday to a location more suitable to the consumer’s current income. For Indonesia, the positive parameter coefficient of
the time trend shows that shifting consumer demand to a higher order assumes that the supply side could accompany to follow the shifting demand. The positive sign of the trend variable shows that Indonesia successfully fulfills most visitors’ expectations. Therefore, when the
expectations of tourists change, Indonesia has an option to keep them coming. The behavior of the tourist arrivals regarding the changes in income in Figure 3will divide the tourists’ origin
country into two groups. The first group contains the countries with potential growth of arrivals as income increases, while the second group contains the countries that have declining arrivals as income increases.
There is a possibility that price gaps between countries become the reason, because Singapore tends to be more sensitive in price compared to Japan, Australia, the United States, and Germany in the study. The reason behind the sensitiveness of Singaporeans to relative price is that their proximity causes them to be better informed about prices in Indonesia (Tan et al., 2002, p. 77).
A different interpretation arises from the significance of the travel cost variable. The negative coefficient indeed shows that international tourists in Indonesia consider travel costs in planning trips. Because the travel cost variable used in the model is assumed to be constant across the period, the negative sign shows that there is a higher possibility that international tourists in Indonesia come from countries with lower travel costs, such as Singapore, Malaysia, and Australia, rather than higher costs, like the United States or European countries. There is a possibility that the existence of low-cost airlines in tourists’ origin countries plays a significant
role, as suggested by Rey, Myro, and Galera (2011). Therefore, further study is needed to find empirical evidence on the issue of low-cost airlines in Indonesia.
The coefficient of time trend was found to be significant, although not sensitive or below one. The sign is positive, which indicates that tourist destinations in Indonesia have fulfilled the expectation of tourists in general, as visitor arrivals increased while the consumer trend was rising. Therefore, a positive sign can be interpreted as the increase in consumer preference or tastes about destinations has been positively responded to by the Indonesian government in its tourism destination policy.

International Journal of Social Science and Economic Research
ISSN: 2455-8834
Volume:01, Issue:10
www.ijsser.org Copyright © IJSSER 2016, All right reserved Page 1535
Figure 4. Total Number of International Tourist Arrivals and the Time Trend in Years 2000-2014
Note: From the Ministry of Tourism for the Republic of Indonesia; the Central Statistic Board of Indonesia
The government considers marketing expenditure as an investment rather than expenses to seek a positive financial return indirectly through increased tax revenue in the medium- or long-term future. In addition to the long-term return, the budgeting process itself is not instantaneous. In Indonesia, the process of budget allocation takes at least one year before execution. This is why the parameter of budget responses to the changes in determinants of tourism demand is significant at one lagged period and not at the current period. This situation also explains the significant positive coefficient for GDP per capita as the proxy for income at one lagged period.
When defining the macroeconomic variables for the budgeting process, the government uses some basic assumptions, specified a year before. The estimation of the macroeconomic variables consist of three periods, known as the medium term budget framework (Ministry of Finance for the Republic of Indonesia, 2015, p. 13). Therefore, the impact of changes in assumptions will remain for the next two years. The government’s budget process also uses the concept of
baseline, which consists of the five-year budget plan (Ministry of Finance for the Republic of Indonesia, 2015, p. 15).
In defining the assumption for allocating budget, the government usually uses the optimistic assumption rather than the realistic assumption. The optimistic budget assumption is the result of
0
2
4
6
8
10
12
14
16
0
1,000,000
2,000,000
3,000,000
4,000,000
5,000,000
6,000,000
7,000,000
8,000,000
9,000,000
10,000,000
YEAR
NU
MB
ER O
F A
RR
IVA
LSTotal arrivals Tren

International Journal of Social Science and Economic Research
ISSN: 2455-8834
Volume:01, Issue:10
www.ijsser.org Copyright © IJSSER 2016, All right reserved Page 1536
the agreement between the government and the legislature (Ministry of Finance for the Republic of Indonesia, 2015, p. 96). This optimistic budget assumption results in higher amounts than the proposed budget. In most situations, the optimistic budget is not realized as planned. The government cannot reallocate the unrealized budget directly at the current fiscal period. To use the unrealized budget, the government has to make a new budget proposal to utilize the budget. Thus, the government cannot spend the allocated budget efficiently. This situation can be analogous to the situation in wheat production in Pakistan (Janjua, et al., 2014). When production in the previous period is higher than the consumption rate, the accumulated stock increases (caused by a reduction of current production to avoid inconsumable stock) then it becomes degraded in quality. In this case, the over allocated budget becomes unproductive when the government cannot spend it completely. Therefore, when there is no significant change in the factors that affect international tourist arrivals, the budget allocation for the next period will decrease. After all, it seems that the government has realized the advantage of using GDP indicators for improving potential tourist arrivals and positively responds to the observation on its budget for international tourism marketing.
CONCLUSION
This study examined the relationship between some factors or determinants of inbound tourism demand and international tourist arrivals in Indonesia and the response of the government to the changes in those factors. This research uses data from 2000-2014. The key finding is that changes in a tourist’s origin country income, using the GDP per capita as the proxy, real
exchange rates, travel costs, and the time trend, affect international tourist arrivals in Indonesia. However, the inbound tourism demand in Indonesia is sensitive only to changes in the income variable. Moreover, the relationship between the changes in income and tourist arrivals in Indonesia is not linear. The nonlinear relationship implies that the growth of tourist arrivals due to the increase in GDP per capita will eventually decline. In other words, once the income has reached a certain threshold level, the growth of tourist arrivals will get smaller. Based the observation results on the budget allocation for tourism marketing, it looks like the government has realized the impact of the changes of the determinants of tourism demand to international tourist arrivals in Indonesia and positively responded through the instrument of budgeting policy.
RECOMMENDATION
There are some policy implications and recommendations regarding the results and findings of this research. The segmentation of the international tourism market based on the income of visitors is a proper policy. However, the implication of the assumption of the nonlinear relationship between tourist arrivals and income will affect the budget allocation priority for

International Journal of Social Science and Economic Research
ISSN: 2455-8834
Volume:01, Issue:10
www.ijsser.org Copyright © IJSSER 2016, All right reserved Page 1537
tourism marketing. We can see that the growth of tourist arrivals is not the same on each level of income. The countries with lower income tend to grow higher in arrivals compared to countries with higher income. Thus, if the target of the policy is to increase tourist arrivals, the government may prioritize those countries with lower income. However, policymakers should be aware of the cost of traveling from the tourists’ origin countries to Indonesia, because potential tourists
will not be able to travel to Indonesia if their low disposable income is not sufficient to cover the travel costs. Thus, if we use income and cost as the criteria to arrange a priority list of countries to approach, we may sort countries by income first as the most sensitive variable, followed by travel cost. The adjustment of the formulation of the marketing program may also become an option as the implication of the segmented income of tourists’ origin countries. The government
may try to reduce the cost of travel to Indonesia as a strategy for countries with income below the threshold. The cost reduction will make Indonesia a tourist destination suitable for income level of potential tourists.
The implication of using the baseline concept in the government budgeting process is that when there is a change in a macroeconomic assumption that has not been included in the baseline, the proposed budget will become a new initiative, which will be covered after the baseline has been fulfilled. Usually, the amount of the new initiative budget is much lower than the baseline. That is why the new initiative budget mostly has no significant impact to the targeted policy. For the tourism budget case in this study, this budgeting system may explain the slow response of the government to changes in tourism demand. Using econometric terms, changes in the independent variables have no short-term effect on the response of the government. To increase the responsiveness of the policy to changes in the determinants of tourism demand, the government may consider creating a new mechanism of budget reallocation based on the current assumptions. Additionally, the realistic budget assumption is preferable to the optimistic assumption. The realistic assumption may reduce the unallocated budget to increase the effectiveness of the budgeting process.
REFERENCES
Agarwal, V., & Yochum, G. (1998). Tourism and advertising: Evidence from Virginia Beach. IAER 4 (4), 384-397.
ASEAN Secretariat. (2009). Roadmap for an ASEAN Community 2009-2015. Jakarta: ASEAN Secretariat.
Bureau of Planning and Finance for Ministry of Tourism. (2010-2014). "Rencana kerja dan anggaran kementerian / lembaga 2010-2014" [Workplan and Budget of Ministry and Institution]. Jakarta: Ministry of Tourism for the Republic of Indonesia.
International Journal of Social Science and Economic Research
ISSN: 2455-8834
Volume:01, Issue:10
www.ijsser.org Copyright © IJSSER 2016, All right reserved Page 1538
Chui-Hua, L., Tzeng, G.-H., & Lee, M.-H. (2012). Improving tourism policy implementation - The use of hybrid MCDM models. Tourism Management, 413-426.
Crouch, G. (1995). A meta analysis of tourism demand. Annals of Tourism Research 22 (1), 103-118.
Falk, M. (2015). The sensitivity of tourism demand to exchange rate changes: an application to Swiss overnight stays in Austrian mountain villages during the winter season. Current Issues in Tourism 18 (5), 465-476.
Govil, R. (2014). Exchange rates: concepts, measurements and assessment of competitiveness. IMF-Singapore Regional Training Institute. Bangkok: International Monetary Fund.
Griffiths, W., Hill, R., & Lim, G. (2012). Using EViews for principles of econometrics (4th ed.). NY: John Wiley & Sons.
Gujarati, D., & Porter, D. (2009). Basic econometrics (5th ed.). NY: McGraw Hill.
Henderson. (1999). Asian tourism and the financial crisis: Indonesia and Thailand compared. Current Issues in Tourism, 2:4, 294-303.
Henderson. (2001). Regionalisation and tourism: The Indonesia Malaysia Singapore growth triangle. Current Issues in Tourism 4:2-4, 78-93.
Hitchkock, M. (2001). Tourism and total crisis in Indonesia: The case of Bali. Asia Pacific Business Review, 8:2, 101-120.
Hoshiro, H. (2013). Regionalization and regionalism in East Asia. ISS Discussion Paper Series F-162, 1-20.
International Monetary Fund. (2016, May 13). International Financial Statitics. Retrieved from data.imf.org: http://data.imf.org/regular.aspx?key=60998108
Jacques, I. (2006). Mathematics for economics and business (5th ed.). Essex, England: Pearson Education Limited.
Janjua, et al. (2014). Climate change and wheat production in Pakistan: An autoregressive distributed lag approach. NJAS Wageningen Journal of Life Sciences 68, 13-19.
Landis, T. (2016). Budget deadlock study: State cuts threaten $36.3 B tourism industry toursim conference at PCCC. Springfield, IL: Lexis Nexis Academic.
International Journal of Social Science and Economic Research
ISSN: 2455-8834
Volume:01, Issue:10
www.ijsser.org Copyright © IJSSER 2016, All right reserved Page 1539
Ministry of Finance for the Republic of Indonesia. (2015). "Pokok-pokok proses penyusunan anggaran belanja" [Principals of the State Budgeting Process]. Jakarta: Directorate of State Budget Preparation.
Ministry of Tourism and Creative Economy. (2012). "Rencana strategis 2012-2014" [Strategic Plan 2012-2014]. Jakarta: Ministry of Tourism and Creative Economy for the Republic of Indonesia.
Ministry of Tourism for the Republic of Indonesia. (2015). "Rencana strategis 2015-2019" [Strategic Planning 2015-2019]. Jakarta: Bureau of Planning and Finance MOT.
Munoz, T. (2007). German demand for tourism in Spain. Tourism Management 28, 12-22.
Panjaitan, et al. (2016). The tourism competitiveness index of Indonesia in the effort to improve the workforce absorption in tourism sector. Economic and Finance Review 4 (08), 01-07.
Prideaux, B. (2005). Factors affecting bilateral tourism flows. Annals of Tourism Research, 780-801.
Rey, B., Myro, R., & Galera, A. (2011). Effect of low cost airlines on tourism in Spain: A dynamic panel data model. Journal of Air Transport Management 17 (3), 163-167.
Schiff, A., & Becken, S. (2011). Demand elasticity estimates for New Zealand tourism. Tourism Management 32, 564-575.
Singagerda, F., Oktaviani, R., Hakim, D., & Kustiari, R. (2013). "Analisis aliran investasi dan perdagangan pariwisata Indonesia" [Analysis of investment and trade flows of tourism in Indonesia]. Bina Ekonomi, Fakultas Ekonomi Unpar 17 (2), 57-85.
Song, H., & Witt, S. (2000). Tourism demand modelling and forecasting: Modern econometric approach. Kidlington, Oxford, UK: Elsevier Science Ltd.
Tan et al. (2002). Modeling tourist flow to Indonesia and Malaysia. Journal of Travel & Tourism Marketing 13:1-2, 61-82.
Wang, D., & Ap, J. (2013). Factors affecting tourism policy implementation: A conceptual framework and a case study in China. Tourism Management 36, 221-233.
Wei-Ting et al. (2013). A multilevel analysis on the determinants of household tourism expenditure. Current Issues in Tourism 16 (6), 612-617.

International Journal of Social Science and Economic Research
ISSN: 2455-8834
Volume:01, Issue:10
www.ijsser.org Copyright © IJSSER 2016, All right reserved Page 1540
Wooldridge, J. (2006). Introductory econometrics: A modern approach (3rd ed.). Mason, OH: Thomson Higher Education.
World Bank. (2016, May 13). World Development Indicators. Retrieved from data.worldbank.org: http://databank.worldbank.org/data/reports.aspx?source=2&country=&series=PA.NUS.FCRF&period=
World Tourism Organization. (2014, February). Glossary of tourism terms. Retrieved from unwto.org: http://cf.cdn.unwto.org/sites/all/files/Glossary-of-terms.pdf