The World Bank Group Twin Goals & The Millennium ... World Bank Group Twin Goals & The Millennium...
22
The World Bank Group Twin Goals & The Millennium Development Goals Report Card 2014/2015
Transcript of The World Bank Group Twin Goals & The Millennium ... World Bank Group Twin Goals & The Millennium...
The World Bank Group Twin Goals & The Millennium Development Goals
Report Card
2014/2015
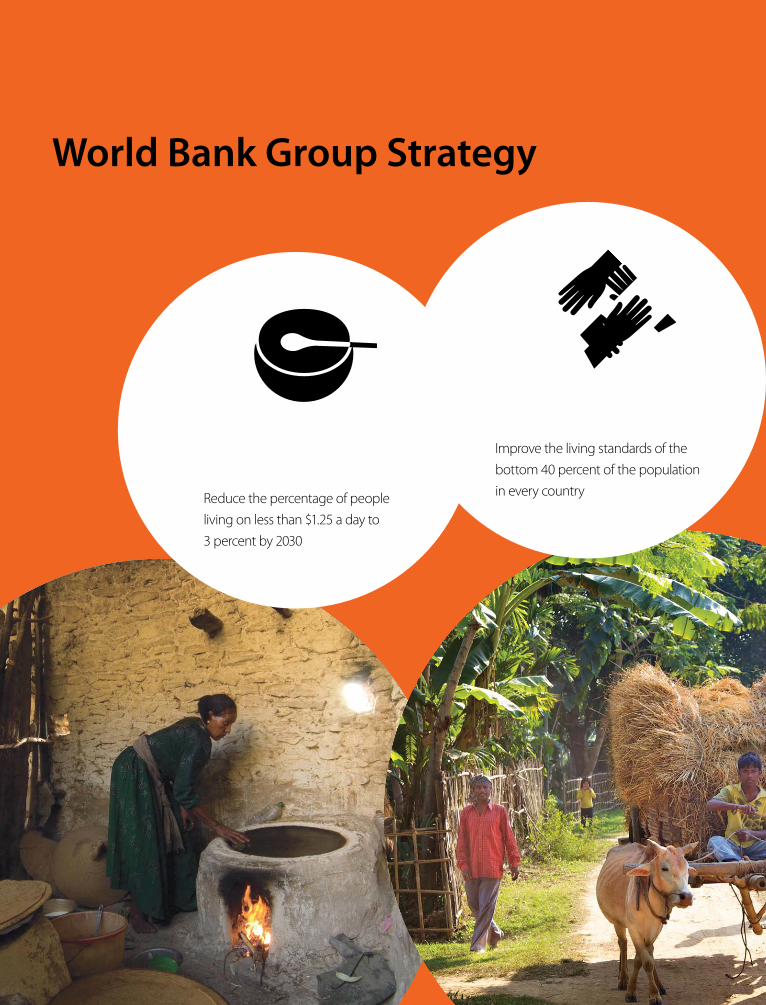
World Bank Group Strategy
Reduce the percentage of people living on less than $1.25 a day to 3 percent by 2030
End extreme poverty
1Improve the living standards of the bottom 40 percent of the population in every country
Promote shared prosperity
2
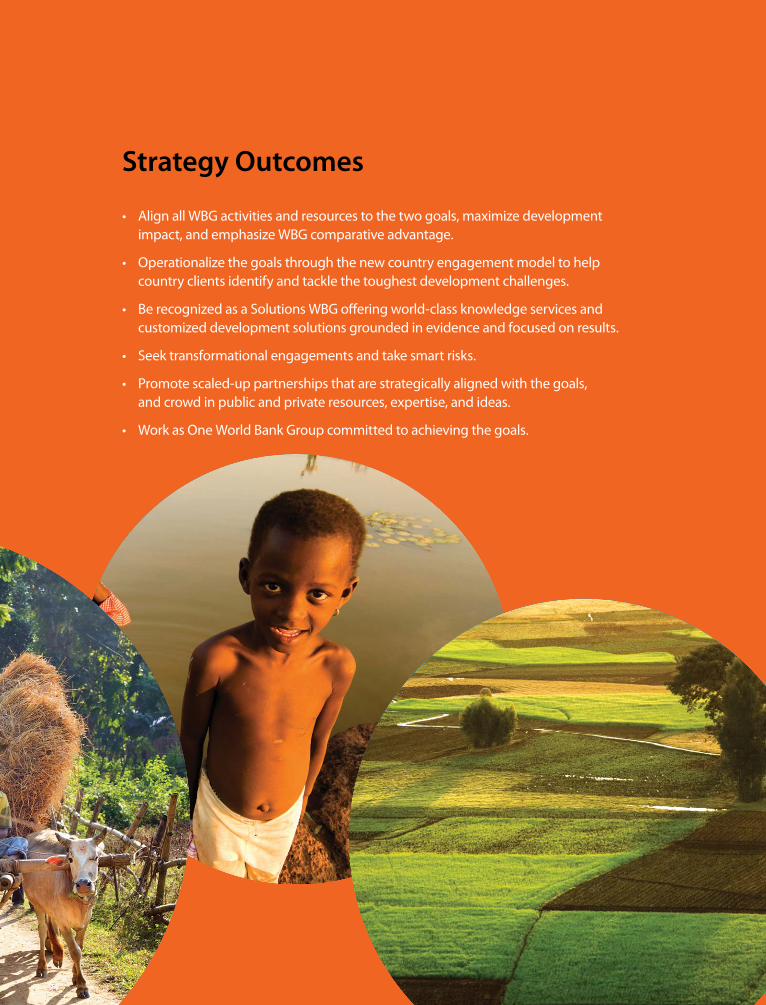
Strategy Outcomes
• Align all WBG activities and resources to the two goals, maximize development impact, and emphasize WBG comparative advantage.
• Operationalize the goals through the new country engagement model to help country clients identify and tackle the toughest development challenges.
• Be recognized as a Solutions WBG offering world-class knowledge services and customized development solutions grounded in evidence and focused on results.
• Seek transformational engagements and take smart risks.
• Promote scaled-up partnerships that are strategically aligned with the goals, and crowd in public and private resources, expertise, and ideas.
• Work as One World Bank Group committed to achieving the goals.

Monitoring the Road to Ending Poverty and Sharing Prosperity
MONITORING OF GOALSGlobal, regional, country level poverty• Household income• Consumption per capita
Monitoring of bottom 40%• Prevalence of underweight
(% of children under age 5) • Primary completion rate (% of
relevant age group)• Under-five mortality rate (per 1,000
live births)• Infant mortality rate (per 1,000
live births)• Assistance during birth delivery
(any skilled personnel) (% of births)• HIV prevalence rate among adults
(15 to 49 years) • Access to improved water (% of the
population)• Access to improved sanitation facilities
(% of the population)
THE WORLD BANK CORPORATE SCORE CARD—Areas for WBG Strategy Results Framework
The Scorecard is structured in three tiers:
Goals and Development Context tierProvides an overview of progress on key development challenges faced by World Bank Group client countries
Results tier Reports on the key sectoral and multi-sectoral results achieved by World Bank Group clients with support of World Bank Group operations in pursuit of the goals
Performance tier Captures World Bank Group performance in implementation of the World Bank Group Strategy and includes measures of both operational and organizational effectiveness
EXTERNAL INTERNAL
The Report Card
The Report Card presents a global assessment of progress to date, including data on the World Bank Group’s twin goals and the Millennium Develop-
ment Goals at the global, regional, and country levels. The Report Card identifies the outstanding performers that have made considerable progress, discusses expected and unexpected outcomes gleaned from monitoring progress toward the twin goals and the MDG targets, and shows where progress has slowed or indicators have dete-riorated. The key messages are:
• The Global Monitoring Report includes for the first time the WBG’s twin goals of ending extreme poverty by 2030 and boosting the incomes of the bottom 40 percent (including in high-income economies), referred to as shared prosperity. Focusing on the bot-tom 40 percent will assist in the eventual attainment of the MDGs, as the delivery of MDG-related services to the bottom 40 percent is clearly lagging.
• The interim goal of reducing extreme poverty to below 9 percent of the global population by 2020 is likely to be reached, while the goal of ending poverty by 2030 remains highly ambitious. Shared prosperity: growth has improved the incomes/consumption of the bottom 40 percent (with some regional variation), but it has not been sufficient to reach the health, edu-cation, and other non-income development goals. Greater efforts will be needed to improve shared prosperity.
• MDGs: Only a few MDG targets (poverty, gender equality in primary and secondary education, water, and slums) have been met at the global level. The gen-der equality on secondary enrollment target is likely to be met by 2015, while the remaining MDGs (primary education completion, access to basic sanitation, and infant, child and maternal mortality) are lagging and will not be achieved without rapid acceleration toward the finish line. Being able to report regularly on the WBG twin goals and current MDGs and their succes-sors will require a major effort, and will also need to recognize the importance of the unfinished data agenda.
Twin goals
One year ago, the WBG proposed two goals to measure success in promoting sustainable economic develop-ment, and set a strategy for monitoring its own effective-ness in delivering results. The first goal is to essentially end extreme poverty by reducing the share of people living on less than $1.25 a day to less than 3 percent of the global population by 2030. The second goal is to promote shared prosperity by improving the living standards of the bot-tom 40 percent of the population in every country. The WBG further urged that the two goals be pursued in ways that sustainably secure the future of the planet and its resources, promote social inclusion, and limit the eco-nomic burdens that future generations inherit (World Bank 2014b).
The first goal of ending poverty can be seen as a con-tinuation of part of MDG 1, which aims to eradicate extreme poverty and hunger and has as its main target to halve the share of people who live in extreme poverty by 2015 (from the 1990 level). The success in reaching MDG 1.a—halving extreme poverty—in 2010, five years ahead of schedule, has emboldened the WBG to set a more ambitious goal. The second WBG goal of boosting shared prosperity is new and opportune. It shifts the focus in evaluating economic development from average income growth to income growth of the bottom 40 percent. Indi-cators proxying the socioeconomic status of the bottom 40 percent of the population, have shown little improve-ment, even though the growth of incomes of the bottom 40 percent of the population has not been slower than that of the general population in many countries. This growing inequality in basic living standards is worrisome. These developments have inspired the WBG’s goal of shared prosperity. Thus the two WBG goals retain an emphasis on growth and economic dynamism, while emphasizing that the world should pay particularly atten-tion to those who are less fortunate.
Ending extreme poverty
Global poverty has declined significantly over the last few decades. The number of people living on less than $1.25 a
18 R E P O R T C A R D G L O B A L M O N I T O R I N G R E P O R T 2 0 1 4 / 2 0 1 5
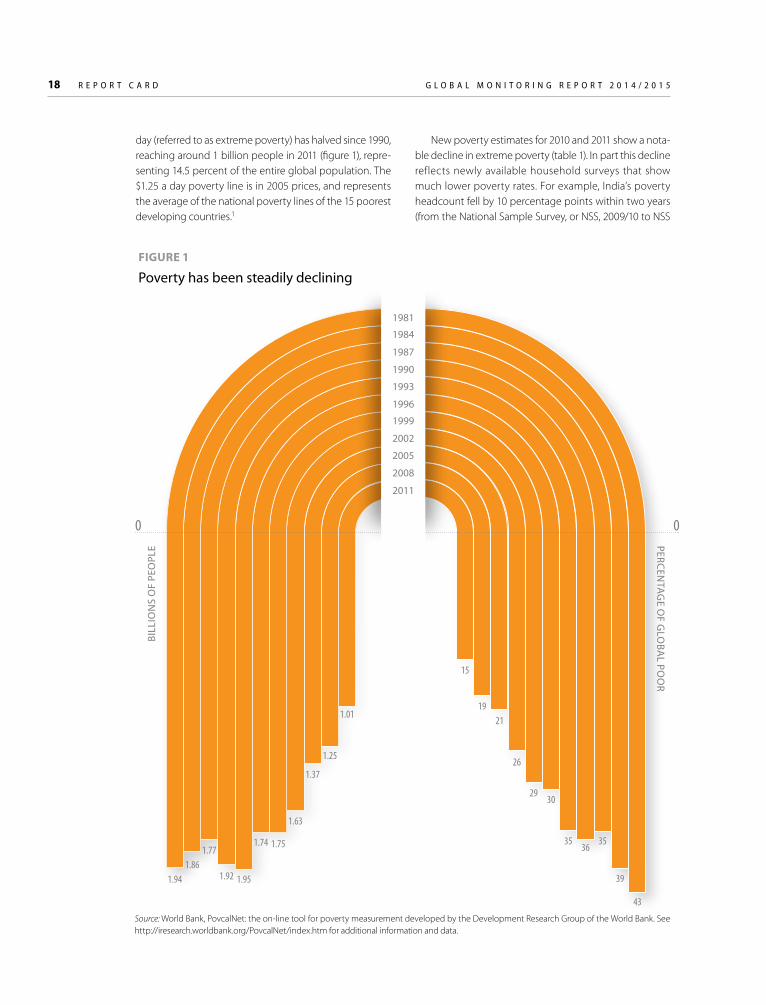
day (referred to as extreme poverty) has halved since 1990, reaching around 1 billion people in 2011 (figure 1), repre-senting 14.5 percent of the entire global population. The $1.25 a day poverty line is in 2005 prices, and represents the average of the national poverty lines of the 15 poorest developing countries.1
New poverty estimates for 2010 and 2011 show a nota-ble decline in extreme poverty (table 1). In part this decline reflects newly available household surveys that show much lower poverty rates. For example, India’s poverty headcount fell by 10 percentage points within two years (from the National Sample Survey, or NSS, 2009/10 to NSS
1.941.86
1.77
1.92 1.95
1.74 1.75
1.63
1.37
1.25
1.01
43
39
3536
35
3029
26
2119
15
PERCENTA
GE O
F GLO
BAL PO
OR
BILL
ION
S O
F PE
OPL
E
00
1981
1984
1987
1990
1993
1996
1999
2002
2005
2008
2011
FIGURE 1
Poverty has been steadily declining
Source: World Bank, PovcalNet: the on-line tool for poverty measurement developed by the Development Research Group of the World Bank. See http://iresearch.worldbank.org/PovcalNet/index.htm for additional information and data.

G L O B A L M O N I T O R I N G R E P O R T 2 0 1 4 / 2 0 1 5 R E P O R T C A R D 19
2011/12). Lower poverty rates also reflect revisions to data on population, which can affect headcount poverty esti-mates at the country and regional levels. For example, China’s urban population count was revised upward, which reduces China’s national headcount poverty esti-mate by 1 to 2 percentage points (since China’s poor are concentrated in rural areas, a higher urban population estimate raises the total population estimate with little impact on the total number of poor). In addition, the lower poverty estimates reflect revisions to consumer price (CPI) data and national accounts data.2
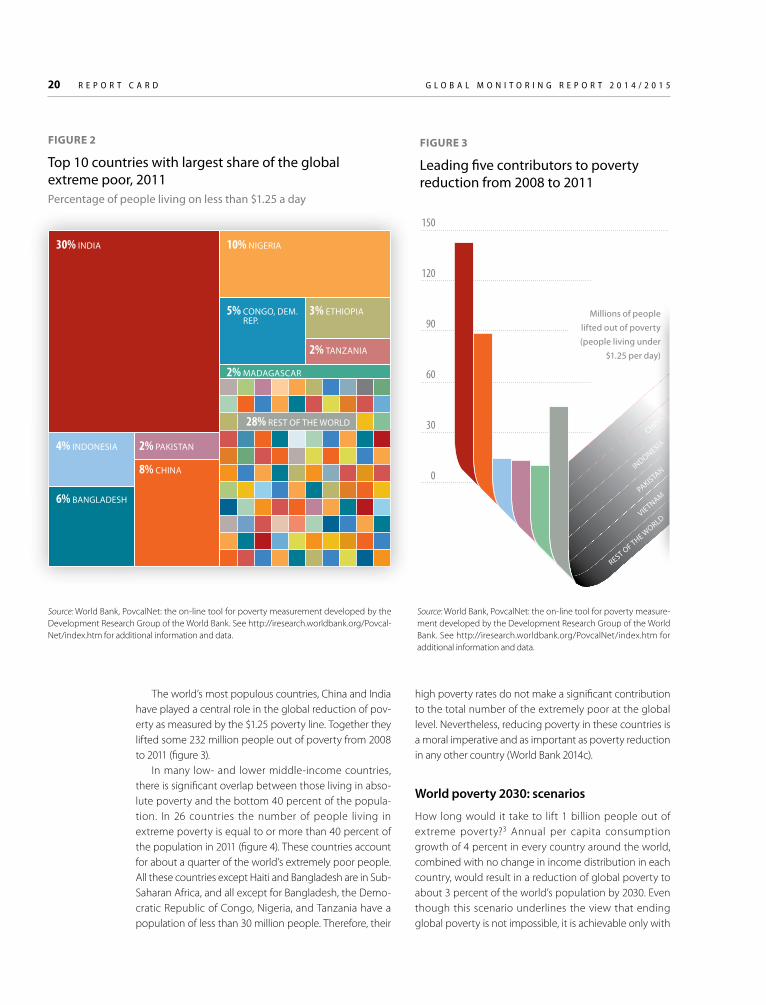
Poverty has been more prevalent in Sub-Saharan Africa and South Asia than in other developing regions, accounting for about 80 percent of the global poor. According to the 2011 estimates, almost three-fifths of the world’s extreme poor are concentrated in just five coun-tries: Bangladesh, China, the Democratic Republic of Congo, India, and Nigeria (figure 2). Adding another five countries (Ethiopia, Indonesia, Pakistan, Madagascar, and Tanzania) would encompass just over 70 percent of the extreme poor.
TABLE 1
Extreme poverty by region
Share of population below US$1.25 a day (2005 ppp) Projections
Region 1990 2005 2008 2010 2011 2015 2020 2030
East Asia and Pacific 58.2 16.7 13.7 10.3 7.9 4.1 1.5 0.1a
Eastern Europe and Central Asia 1.5 1.3 0.4 0.6 0.5 0.3 0.2 0.1b
Latin America and the Caribbean 12.0 7.4 5.4 4.8 4.6 4.3 3.8 3.1
Middle East and North Africa 5.8 3.0 2.1 1.7 1.7 2.0 1.8 2.4
South Asia 53.2 39.3 34.1 29.0 24.5 18.1 13.8 2.1
Sub-Saharan Africa 56.6 52.8 49.7 48.2 46.8 40.9 34.2 23.6
Total (developing world) 43.5 24.8 21.8 19.1 17.0 13.4 10.5 5.7
Total 36.4 21.1 18.6 16.3 14.5 11.5 9.1 4.9
Millions of people below US$1.25 a day (2005 ppp) Projections
Region 1990 2005 2008 2010 2011 2015 2020 2030
East Asia and Pacific 957.1 324.1 272.3 207.1 160.8 86.4 31.3 2.5
Eastern Europe and Central Asia 7.1 6.0 2.0 2.9 2.3 1.3 0.8 0.3
Latin America and the Caribbean 52.7 41.0 31.0 28.3 27.6 26.8 24.8 21.7
Middle East and North Africa 13.1 9.0 6.5c 5.5c 5.6c 7.3 7.0 10.3
South Asia 603.2 589.0 532.7 465.3 399.0 310.6 249.6 42.5
Sub-Saharan Africa 287.1c 399.1 406.8 416.4 415.4 403.2 382.9 334.6
Total 1,920.2 1,368.1 1,251.4 1,125.5 1,010.7 835.5 696.4 411.8
Source: World Bank calculations on poverty and poverty projections from PovcalNet database, the on-line tool for poverty measurement developed by the Development Research Group of the World Bank. See http://iresearch.worldbank.org/PovcalNet/index.htm for additional information and data. The source of growth projections used to generate the poverty projections for 2015, 2020, and 2030, is World Bank calculations (World Bank 2014a). a. The statistic for 2030 is 0.11 for East Asia and Pacific. It has been rounded to 0.1 in the table.b. The statistic for 2030 is 0.06 for Europe and Central Asia. It has been rounded to 0.1 in the table.c. Refers to the numbers that are provisional because survey coverage is less than 50 percent of population in the region.
20 R E P O R T C A R D G L O B A L M O N I T O R I N G R E P O R T 2 0 1 4 / 2 0 1 5
The world’s most populous countries, China and India have played a central role in the global reduction of pov-erty as measured by the $1.25 poverty line. Together they lifted some 232 million people out of poverty from 2008 to 2011 (figure 3).
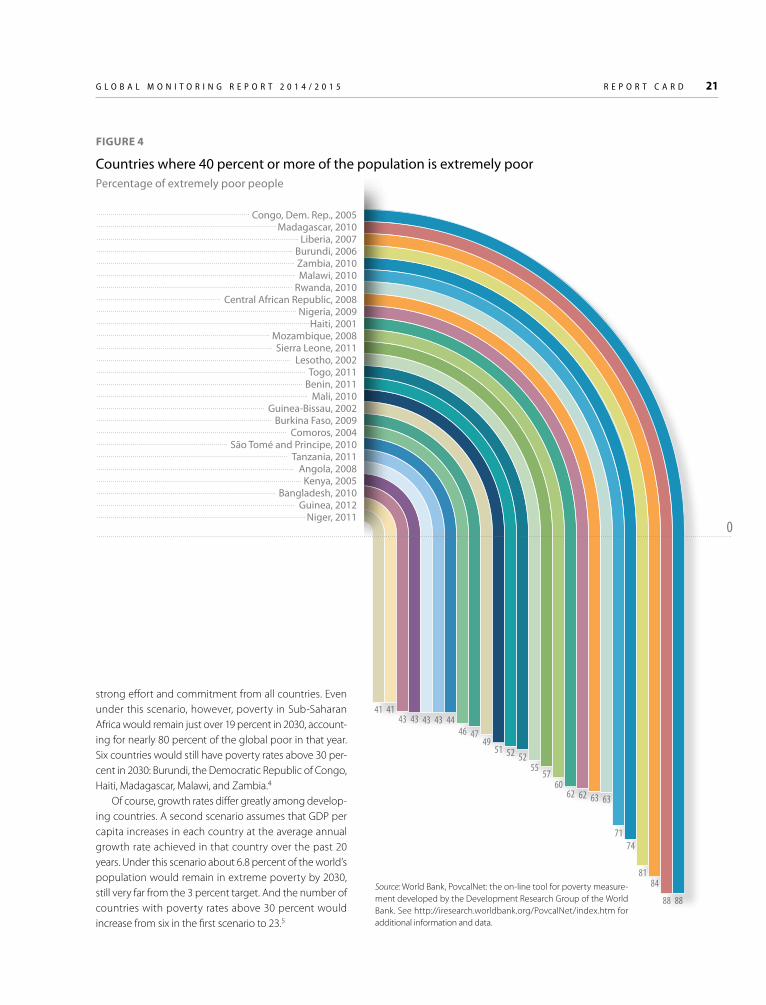
In many low- and lower middle-income countries, there is significant overlap between those living in abso-lute poverty and the bottom 40 percent of the popula-tion. In 26 countries the number of people living in extreme poverty is equal to or more than 40 percent of the population in 2011 (figure 4). These countries account for about a quarter of the world’s extremely poor people. All these countries except Haiti and Bangladesh are in Sub-Saharan Africa, and all except for Bangladesh, the Demo-cratic Republic of Congo, Nigeria, and Tanzania have a population of less than 30 million people. Therefore, their
FIGURE 2
Top 10 countries with largest share of the global extreme poor, 2011Percentage of people living on less than $1.25 a day
high poverty rates do not make a significant contribution to the total number of the extremely poor at the global level. Nevertheless, reducing poverty in these countries is a moral imperative and as important as poverty reduction in any other country (World Bank 2014c).
World poverty 2030: scenarios
How long would it take to lift 1 billion people out of extreme poverty?3 Annual per capita consumption growth of 4 percent in every country around the world, combined with no change in income distribution in each country, would result in a reduction of global poverty to about 3 percent of the world’s population by 2030. Even though this scenario underlines the view that ending global poverty is not impossible, it is achievable only with
Source: World Bank, PovcalNet: the on-line tool for poverty measurement developed by the Development Research Group of the World Bank. See http://iresearch.worldbank.org/Povcal-Net/index.htm for additional information and data.
Source: World Bank, PovcalNet: the on-line tool for poverty measure-ment developed by the Development Research Group of the World Bank. See http://iresearch.worldbank.org/PovcalNet/index.htm for additional information and data.
FIGURE 3
Leading five contributors to poverty reduction from 2008 to 2011
150
120
90
60
30
0
REST OF THE W
ORLDVIETNAMPAKISTAN
INDONESIA
CHINA
INDIA
Millions of people
lifted out of poverty
(people living under
$1.25 per day)
5% CONGO, DEM. REP.
10% NIGERIA30% INDIA
4% INDONESIA 2% PAKISTAN
6% BANGLADESH
8% CHINA
3% ETHIOPIA
2% TANZANIA
2% MADAGASCAR
28% REST OF THE WORLD
G L O B A L M O N I T O R I N G R E P O R T 2 0 1 4 / 2 0 1 5 R E P O R T C A R D 21
Source: World Bank, PovcalNet: the on-line tool for poverty measure-ment developed by the Development Research Group of the World Bank. See http://iresearch.worldbank.org/PovcalNet/index.htm for additional information and data.
strong effort and commitment from all countries. Even under this scenario, however, poverty in Sub-Saharan Africa would remain just over 19 percent in 2030, account-ing for nearly 80 percent of the global poor in that year. Six countries would still have poverty rates above 30 per-cent in 2030: Burundi, the Democratic Republic of Congo, Haiti, Madagascar, Malawi, and Zambia.4
Of course, growth rates differ greatly among develop-ing countries. A second scenario assumes that GDP per capita increases in each country at the average annual growth rate achieved in that country over the past 20 years. Under this scenario about 6.8 percent of the world’s population would remain in extreme poverty by 2030, still very far from the 3 percent target. And the number of countries with poverty rates above 30 percent would increase from six in the first scenario to 23.5
88 88
4143
4143 43 43 44
4649
51 52 5255
5760
62 62 63 63
7174
8184
47
0
Congo, Dem. Rep., 2005Madagascar, 2010
Liberia, 2007Burundi, 2006Zambia, 2010Malawi, 2010
Rwanda, 2010Central African Republic, 2008
Nigeria, 2009Haiti, 2001
Mozambique, 2008Sierra Leone, 2011
Lesotho, 2002Togo, 2011
Benin, 2011Mali, 2010
Guinea-Bissau, 2002Burkina Faso, 2009
Comoros, 2004São Tomé and Principe, 2010
Tanzania, 2011Angola, 2008
Kenya, 2005Bangladesh, 2010
Guinea, 2012Niger, 2011
FIGURE 4
Countries where 40 percent or more of the population is extremely poorPercentage of extremely poor people
22 R E P O R T C A R D G L O B A L M O N I T O R I N G R E P O R T 2 0 1 4 / 2 0 1 5
A third scenario maintains the assumption of country-specific growth rates, but now applies the average annual rate achieved during the past 10 years, instead of the past 20 years. Poverty would fall to about 4.8 percent of the world’s population by 2030, which is lower than the previ-ous scenario, but still well above the global target of 3 per-cent. The number of countries with poverty rates above 30 percent would still be 17 in 2030.6
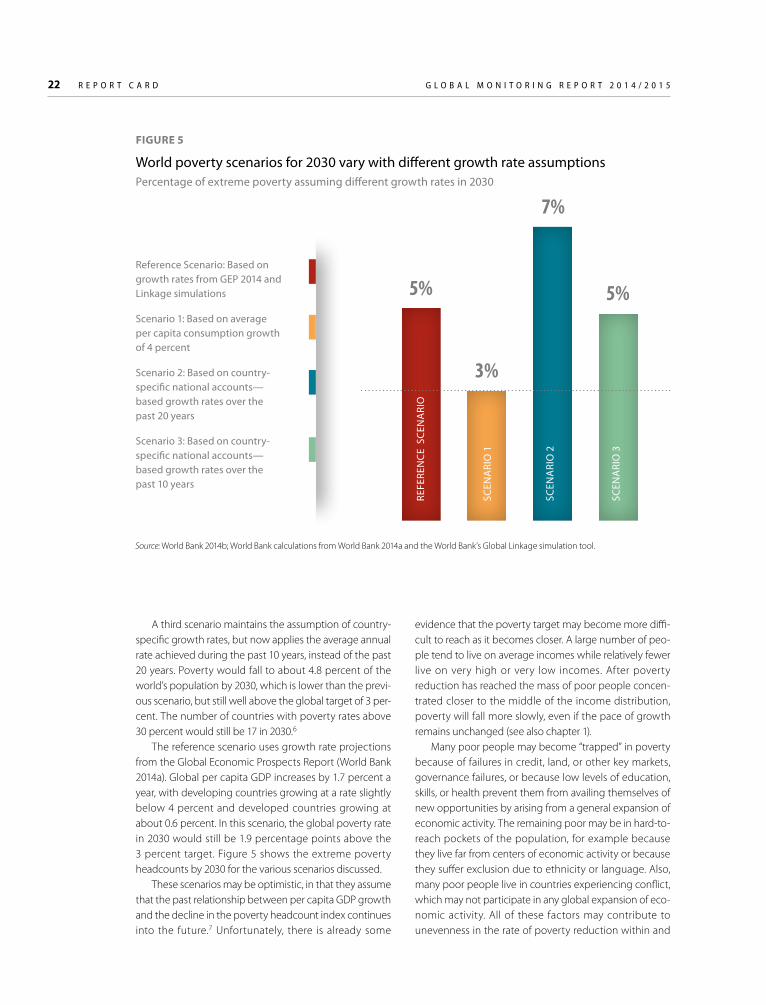
The reference scenario uses growth rate projections from the Global Economic Prospects Report (World Bank 2014a). Global per capita GDP increases by 1.7 percent a year, with developing countries growing at a rate slightly below 4 percent and developed countries growing at about 0.6 percent. In this scenario, the global poverty rate in 2030 would still be 1.9 percentage points above the 3 percent target. Figure 5 shows the extreme poverty headcounts by 2030 for the various scenarios discussed.
These scenarios may be optimistic, in that they assume that the past relationship between per capita GDP growth and the decline in the poverty headcount index continues into the future.7 Unfortunately, there is already some
evidence that the poverty target may become more diffi-cult to reach as it becomes closer. A large number of peo-ple tend to live on average incomes while relatively fewer live on very high or very low incomes. After poverty reduction has reached the mass of poor people concen-trated closer to the middle of the income distribution, poverty will fall more slowly, even if the pace of growth remains unchanged (see also chapter 1).
Many poor people may become “trapped” in poverty because of failures in credit, land, or other key markets, governance failures, or because low levels of education, skills, or health prevent them from availing themselves of new opportunities by arising from a general expansion of economic activity. The remaining poor may be in hard-to-reach pockets of the population, for example because they live far from centers of economic activity or because they suffer exclusion due to ethnicity or language. Also, many poor people live in countries experiencing conflict, which may not participate in any global expansion of eco-nomic activity. All of these factors may contribute to unevenness in the rate of poverty reduction within and
FIGURE 5
World poverty scenarios for 2030 vary with different growth rate assumptionsPercentage of extreme poverty assuming different growth rates in 2030
5%
3%
7%
5%
REFE
REN
CE S
CEN
ARI
O
SCEN
ARI
O 1
SCEN
ARI
O 2
SCEN
ARI
O 3
Reference Scenario: Based on growth rates from GEP 2014 and Linkage simulations
Scenario 1: Based on average per capita consumption growth of 4 percent
Scenario 2: Based on country- specific national accounts— based growth rates over the past 20 years
Scenario 3: Based on country- specific national accounts— based growth rates over the past 10 years
Source: World Bank 2014b; World Bank calculations from World Bank 2014a and the World Bank’s Global Linkage simulation tool.

G L O B A L M O N I T O R I N G R E P O R T 2 0 1 4 / 2 0 1 5 R E P O R T C A R D 23
1980 1990 2000 2010 1980 1990 2000 2010
Source: World Bank 2014b.Note: Index of household consumption expenditure or income per capita in constant 2005 ppp dollar (earliest year=100)
between countries and can result in a declining respon-siveness of poverty reduction to a given rate of aggregate growth over time.
Promoting shared prosperity
The WBG shared prosperity goal is to increase per capita real household income or consumption of the bottom 40 percent of each country’s population. Since the goal is
country specific, there is no explicit target set at the global level. The tracking of shared prosperity can reinforce pov-erty reduction efforts in the low- and lower-middle-income countries by bringing attention to those people not covered by social inclusion policies but who might otherwise be left behind.8 Calculating progress in shared prosperity requires comparable income surveys for multi-ple years. Figure 6 shows examples from four countries where multiple surveys have existed since the 1980s and
BRAZIL
AN
NU
AL
GRO
WTH
(199
2 =
100)
190
170
150
130
110
90
SOUTH AFRICA
AN
NU
AL
GRO
WTH
(199
3 =
100)
190
170
150
130
110
90
SRI LANKA
AN
NU
AL
GRO
WTH
(198
5 =
100)
190
170
150
130
110
901980 1990 2000 2010 1980 1990 2000 2010
UGANDA
AN
NU
AL
GRO
WTH
(198
9 =
100)
190
170
150
130
110
90
FIGURE 6
Evolution of mean income or consumption of the bottom 40 percent and the overall population in four countriesMean income/consumption of the total population and bottom 40 percent
Mean income/consumption of the total population Mean income/consumption of the bottom 40 percent
24 R E P O R T C A R D G L O B A L M O N I T O R I N G R E P O R T 2 0 1 4 / 2 0 1 5
1990s. In Uganda, for example, shared prosperity varied significantly in the late 1990s but subsequently started increasing, reaching a peak in the latest survey years. Simi-larly, in Brazil, shared prosperity varied significantly in the 1990s before beginning an increasing trend in the early 2000s. In this sense, performance has been better in both countries in more recent years. This is also the case in South Africa and Sri Lanka.
Another way to view the data on shared prosperity is to compare the performance of the bottom 40 percent with that of other parts of the income distribution (for example the top 60 percent of the population) or overall national performance. Alongside trends in average income of the bottom 40 percent, figure 6 also shows income growth rates for the total population. In addition to providing a means to compare performance of shared prosperity across countries, this comparison also allows an assessment of the evolution of income inequality. For example, the bottom 40 percent in South Africa did better
than average during the mid-1990s (suggesting not only that incomes at the bottom 40 grew but also that there was some catching up). By contrast, by the 2000s, income growth for the bottom 40 percent increased, compared with the mid-1990s, but was significantly slower than aver-age income growth, implying increased inequality. In Uganda, on the other hand, the average income of the bottom 40 percent has increased over time, and at rates that were equal or higher than the national average.
Tracking shared prosperity in practice
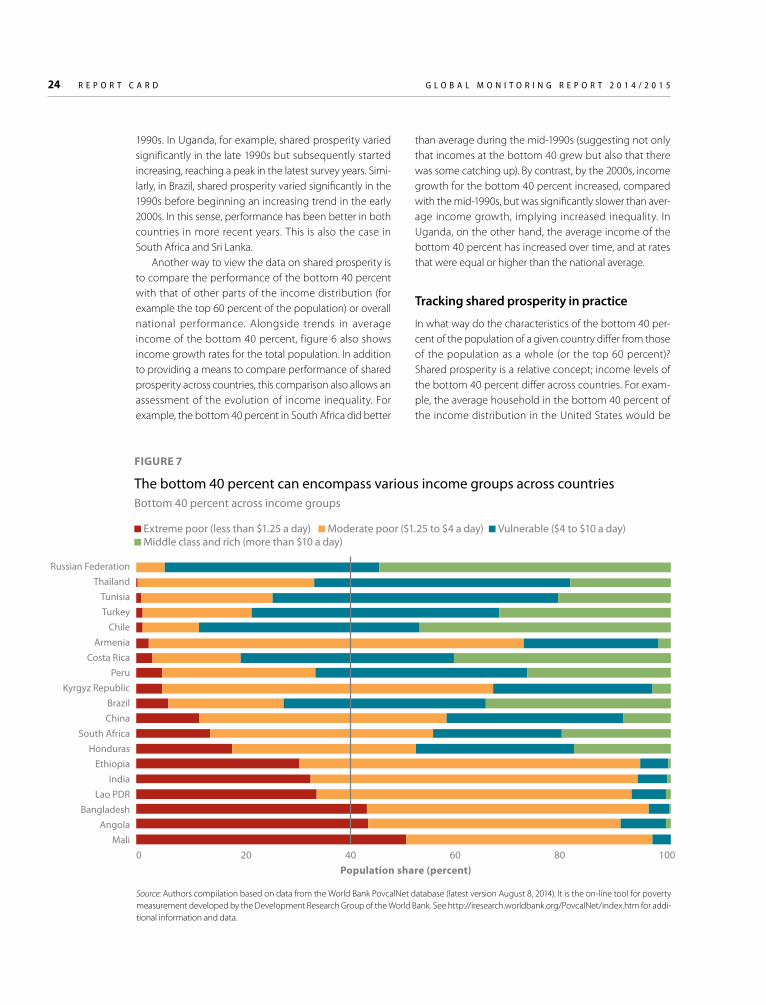
In what way do the characteristics of the bottom 40 per-cent of the population of a given country differ from those of the population as a whole (or the top 60 percent)? Shared prosperity is a relative concept; income levels of the bottom 40 percent differ across countries. For exam-ple, the average household in the bottom 40 percent of the income distribution in the United States would be
FIGURE 7
The bottom 40 percent can encompass various income groups across countriesBottom 40 percent across income groups
Extreme poor (less than $1.25 a day) Moderate poor ($1.25 to $4 a day) Vulnerable ($4 to $10 a day) Middle class and rich (more than $10 a day)
Russian Federation Thailand
Tunisia Turkey
Chile Armenia
Costa Rica Peru
Kyrgyz Republic Brazil China
South Africa Honduras
Ethiopia India
Lao PDR Bangladesh
Angola Mali
0 20 40 60 80 100Population share (percent)
Source: Authors compilation based on data from the World Bank PovcalNet database (latest version August 8, 2014). It is the on-line tool for poverty measurement developed by the Development Research Group of the World Bank. See http://iresearch.worldbank.org/PovcalNet/index.htm for addi-tional information and data.

G L O B A L M O N I T O R I N G R E P O R T 2 0 1 4 / 2 0 1 5 R E P O R T C A R D 25
among the richest 10 percent in Brazil. Similarly, the aver-age household in the bottom 40 percent of Brazil’s income distribution would be at approximately the 90th percentile of the income distribution in India.
Both the average income and the distribution of income within the bottom 40 percent vary greatly across countries. Figure 7 illustrates this point with the size of various income-based groups across a set of developing countries.9 In some countries, like Angola, Bangladesh, and Mali, all households in the bottom 40 percent are among the extreme poor (using the international poverty line), whereas in other countries, like Ethiopia and India, 80 per-cent of those at the bottom 40 percent are extremely poor and the rest are moderately poor. In China, the bot-tom 40 percent are mostly among the moderately poor (with the rest falling within the extreme poor). By contrast, in some of the upper middle-income countries in Latin America and the Caribbean and in Europe and Central Asia, for example Chile and the Russian Federation, the large majority of individuals in the bottom 40 percent are in the group of the vulnerable: these are nonpoor individ-uals with a high risk of falling back into poverty. These observations highlight the great range of incomes and the different meaning that the bottom 40 percent constitutes across the world.
Recent trends in shared prosperity have been broadly positive. The incomes of the bottom 40 percent increased in all but 18 countries of a sample of 86 countries (figure 8). Where possible an annual growth rate was calculated for the latest 5-year period within a 10-year time span, 2002 to 2012. There is considerable variation across countries. In 13 countries10 the bottom 40 percent experienced annual growth rates of more than 7 percent, while in 18 coun-tries11 the income or consumption of the bottom 40 per-cent declined over the period.12
Cross-country comparisons should be made with cau-tion. Take, for example, country A, where the growth rate of the bottom 40 percent was 4 percent a year, and coun-try B, where it was 8 percent for the same period. Did country B outperform country A during this period for the bottom 40 percent? At first look, that would seem to be the case. However, it is not obvious whose performance was better. Overall growth in country B for the total popu-lation was 9 percent, while in country A it was only 1 per-cent. A literal interpretation of the shared prosperity goal would suggest that country B did a better job of boosting shared prosperity, since income growth of the bottom 40 percent was higher. However income growth for the bot-tom 40 percent of country A was four times higher that of its national average, while in country B, despite the gains
of the bottom 40 percent and a remarkable overall growth rate, growth of the bottom 40 percent lagged behind the national average (figure 9). Hence, the need to make cross-country comparisons with care.
MDG outcomes for the bottom 40 percent
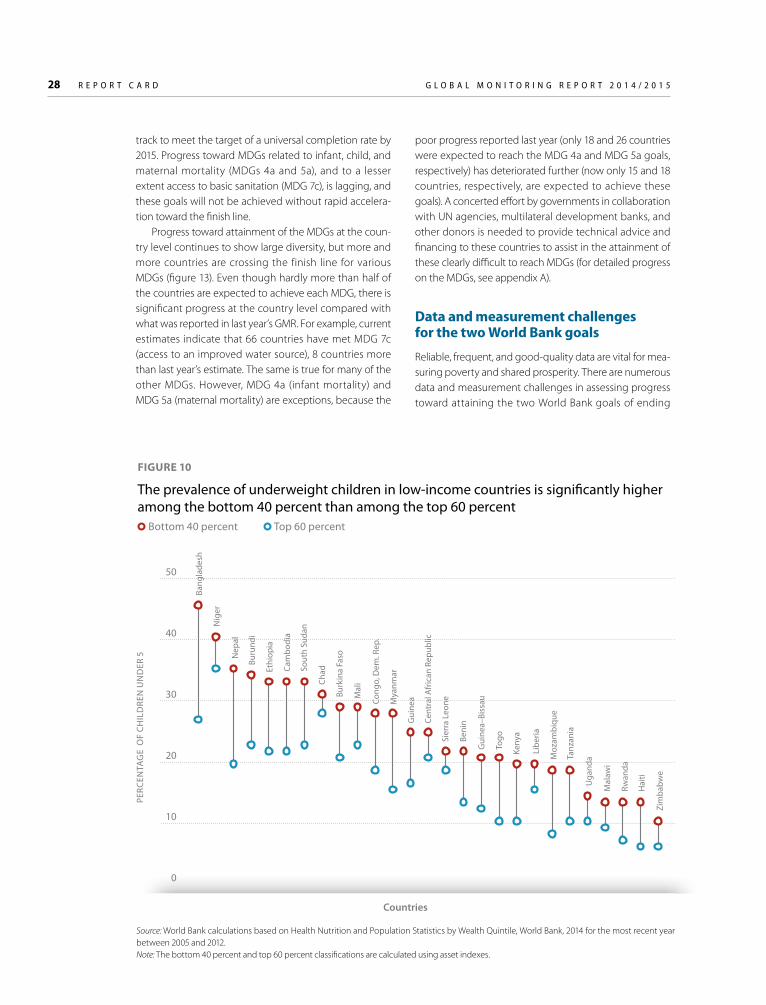
Monitoring progress on the income growth of the bottom 40 percent can usefully be complemented with monitor-ing progress in non-income related indicators such as the MDGs.13 While incomes of the bottom 40 percent have increased as much as (or more than) the average for many countries, education and health indicators are lagging. Households in the bottom 40 percent tend to have much lower levels of welfare, as measured by the MDG indica-tors, than are enjoyed by households in the top 60 per-cent. For example, young children in the poorest house-holds are two to three times more likely to be malnourished as those in the highest wealth quintile. Fig-ure 10 shows the difference between the share of under-weight children in the bottom 40 percent and the top 60 percent of wealth quintile.14 The situation is better in edu-cation, in that groups such as the poor and girls have tended to benefit more than the better off from gains in educational attainment. For example, increases in primary enrollment benefited mostly the poor, because the bet-ter-off children were already enrolled. But enrollment beyond primary school remains an issue, especially for the most disadvantaged groups. Another example is access to sanitation; Figure 11 shows the difference between access to an improved sanitation source in the bottom 40 per-cent and top 60 percent of wealth quintile.
Based on over 160 Demographic Health Surveys (DHS) and Multiple Indicator Cluster Surveys (MICS) cov-ering 65 countries, the poorest 40 percent are worse off than the richest 60 percent for many of the MDGs. For access to an improved sanitation source, the outcome for the bottom 40 percent is well behind that of the top 60 percent in a majority of countries. The poor are also less well served regarding access to, and usage of, many health services and interventions. In some countries access to care and health outcomes for the poor have even deteriorated in absolute terms. This is the case for stunting in a third of countries, underweight status in a fourth of countries, and access to maternal and child health services in a fifth of countries. Infant and child mortality have not improved for the poor in a tenth of countries (Wagstaff, Bredenkamp, and Buisman 2014; see also chapter 4).

26 R E P O R T C A R D G L O B A L M O N I T O R I N G R E P O R T 2 0 1 4 / 2 0 1 5
FIGURE 8
Shared prosperity by countryAnnualized growth in mean income/consumption per capita a five year period between 2002–12
Bottom 40 percent Total population (percent)
Source: World Bank calculations based on PovcalNet.Note: Growth rates in GDSP are computed as annualized average growth rate in per capita real income (or consumption) over a five-year period roughly circa 2006–11, where only those countries with surveys that meet the following criteria are included: the latest household survey year for a country (year T1) is no older than 2009; the initial year (year T0) is selected as close to T1-5 as possible, with a bandwidth of +/- 2 years; thus the gap between the initial and final survey years would range from 3 to 7 years. The comparability of numbers on shared prosperity across countries is strictly around time periods; comparability is limited because household surveys are infrequent in most countries and are not aligned across countries in terms of timing. Consequently, comparisons across countries or over time should be made with a high degree of caution.
Progress toward the MDGs
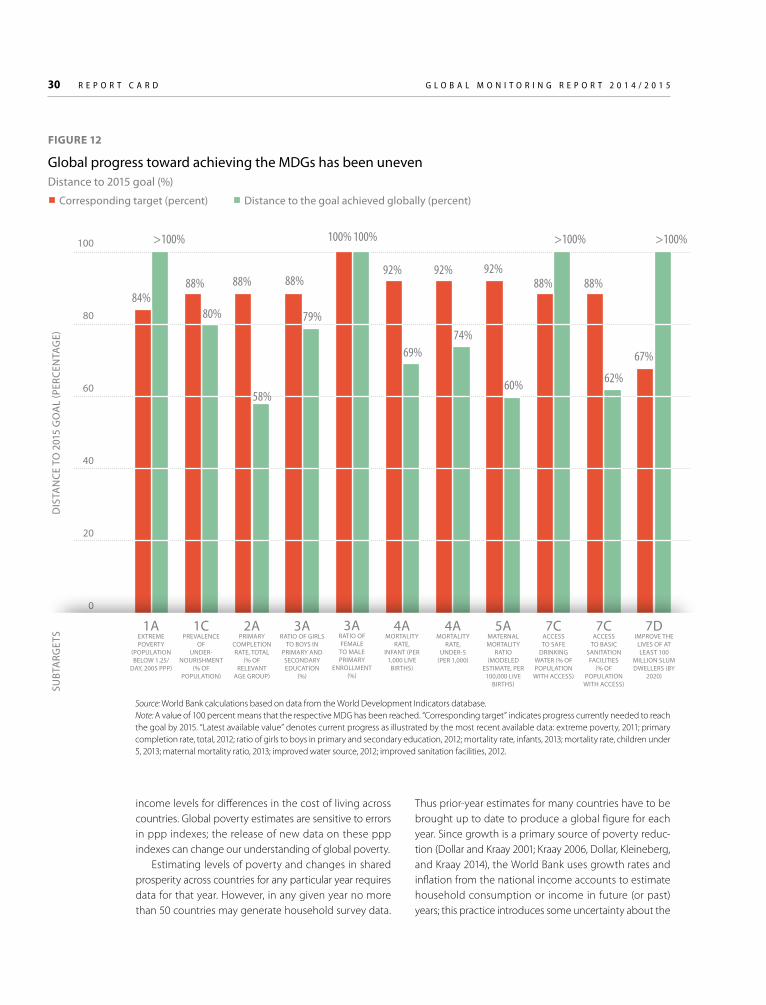
The target year of 2015 for the Millennium Development Goals is fast approaching. One important aspect of the MDGs has been their focus on measuring and monitoring progress. In the past quarter century, progress toward the MDGs has been varied across targets and regions. Esti-mates for the developing world indicate that the targets for extreme poverty reduction (MDG 1.a), access to safe drinking water (MDG 7.c) and improving the lives of at
least 100 million slum dwellers (MDG 7.d) have been reached ahead of the 2015 deadline (figure 12). The targets on gender equality in primary and secondary education and the incidence of malaria are projected to be met by 2015, although gender disparity remains prevalent in higher levels of education (United Nations 2014).
On the other hand, progress on the remaining MDGs has been lagging, especially for education and health-related MDGs. Specifically, the primary school completion rate reached 90 percent by 2011, but progress is slightly off
–6.00
–4.00
–2.00
0.00
2.00
4.00
6.00
8.00
10.00
12.00
14.00
Boliv
ia
Colo
mbi
a U
rugu
ay
Peru
Pa
ragu
ay
Arg
entin
a Br
azil
Cost
a Ri
ca
Pana
ma
Nic
arag
ua
Ecua
dor
Hon
dura
s Ch
ile
Dom
inic
an R
epub
lic
Cana
da
El S
alva
dor
Mex
ico
Uni
ted
Stat
es
Gua
tem
ala
Cam
bodi
a Ch
ina
Viet
nam
Th
aila
nd
Lao
PDR
Phili
ppin
es
Russ
ian
Fede
ratio
n Be
laru
s Sl
ovak
Rep
ublic
Ka
zakh
stan
Ta
jikis
tan
Rom
ania
Ky
rgyz
Rep
ublic
M
oldo
va
Turk
ey
Ukr
aine
Es
toni
a Po
land
N
orw
ay
Mon
tene
gro
Net
herla
nds
Finl
and
Czec
h Re
publ
ic
Slov
enia
Bu
lgar
ia
Lith
uani
a G
eorg
ia
Den
mar
k A
rmen
ia
Latv
ia
Ger
man
y Ire
land
Ita
ly
Icel
and
Hun
gary
U
nite
d Ki
ngdo
m
Gre
ece
Spai
n A
lban
ia
Serb
ia
Tuni
sia
Jord
an
Wes
t Ban
k an
d G
aza
Isra
el
Iraq
Nep
al
Bhut
an
Indi
a Pa
kist
an
Sri L
anka
Ba
ngla
desh
Ta
nzan
ia
Cong
o, R
ep.
Bots
wan
a Rw
anda
So
uth
Afr
ica
Moz
ambi
que
Uga
nda
Nam
ibia
M
ali
Mau
ritiu
s Se
nega
l N
iger
ia
Ethi
opia
M
alaw
i To
go
Mad
agas
car
AN
NU
ALI
ZED
GRO
WTH
IN M
EAN
INCO
ME
PER
CAPI
TA
EAST ASIAAND PACIFIC EUROPE AND CENTRAL ASIA THE AMERICAS
MIDDLE EASTAND
NORTH AFRICA SOUTH ASIA SUB-SAHARAN AFRICA

G L O B A L M O N I T O R I N G R E P O R T 2 0 1 4 / 2 0 1 5 R E P O R T C A R D 27
FIGURE 9
Shared prosperity example
–6.00
–4.00
–2.00
0.00
2.00
4.00
6.00
8.00
10.00
12.00
14.00
Boliv
ia
Colo
mbi
a U
rugu
ay
Peru
Pa
ragu
ay
Arg
entin
a Br
azil
Cost
a Ri
ca
Pana
ma
Nic
arag
ua
Ecua
dor
Hon
dura
s Ch
ile
Dom
inic
an R
epub
lic
Cana
da
El S
alva
dor
Mex
ico
Uni
ted
Stat
es
Gua
tem
ala
Cam
bodi
a Ch
ina
Viet
nam
Th
aila
nd
Lao
PDR
Phili
ppin
es
Russ
ian
Fede
ratio
n Be
laru
s Sl
ovak
Rep
ublic
Ka
zakh
stan
Ta
jikis
tan
Rom
ania
Ky
rgyz
Rep
ublic
M
oldo
va
Turk
ey
Ukr
aine
Es
toni
a Po
land
N
orw
ay
Mon
tene
gro
Net
herla
nds
Finl
and
Czec
h Re
publ
ic
Slov
enia
Bu
lgar
ia
Lith
uani
a G
eorg
ia
Den
mar
k A
rmen
ia
Latv
ia
Ger
man
y Ire
land
Ita
ly
Icel
and
Hun
gary
U
nite
d Ki
ngdo
m
Gre
ece
Spai
n A
lban
ia
Serb
ia
Tuni
sia
Jord
an
Wes
t Ban
k an
d G
aza
Isra
el
Iraq
Nep
al
Bhut
an
Indi
a Pa
kist
an
Sri L
anka
Ba
ngla
desh
Ta
nzan
ia
Cong
o, R
ep.
Bots
wan
a Rw
anda
So
uth
Afr
ica
Moz
ambi
que
Uga
nda
Nam
ibia
M
ali
Mau
ritiu
s Se
nega
l N
iger
ia
Ethi
opia
M
alaw
i To
go
Mad
agas
car
AN
NU
ALI
ZED
GRO
WTH
IN M
EAN
INCO
ME
PER
CAPI
TA
EAST ASIAAND PACIFIC EUROPE AND CENTRAL ASIA THE AMERICAS
MIDDLE EASTAND
NORTH AFRICA SOUTH ASIA SUB-SAHARAN AFRICA
10
8
6
4
2
0
AN
NU
ALI
ZED
GRO
WTH
IN
MEA
N IN
COM
E PE
R C
API
TA (%
)
COUNTRY B
COUNTRY A
28 R E P O R T C A R D G L O B A L M O N I T O R I N G R E P O R T 2 0 1 4 / 2 0 1 5
track to meet the target of a universal completion rate by 2015. Progress toward MDGs related to infant, child, and maternal mortality (MDGs 4a and 5a), and to a lesser extent access to basic sanitation (MDG 7c), is lagging, and these goals will not be achieved without rapid accelera-tion toward the finish line.
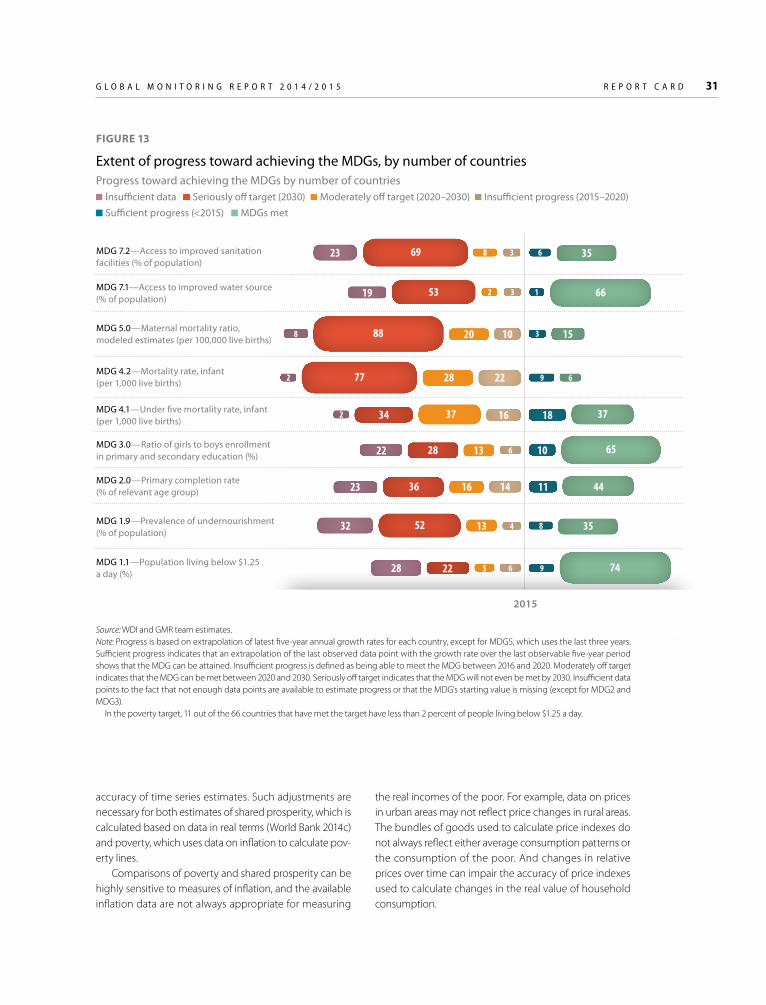
Progress toward attainment of the MDGs at the coun-try level continues to show large diversity, but more and more countries are crossing the finish line for various MDGs (figure 13). Even though hardly more than half of the countries are expected to achieve each MDG, there is significant progress at the country level compared with what was reported in last year’s GMR. For example, current estimates indicate that 66 countries have met MDG 7c (access to an improved water source), 8 countries more than last year’s estimate. The same is true for many of the other MDGs. However, MDG 4a (infant mortality) and MDG 5a (maternal mortality) are exceptions, because the
poor progress reported last year (only 18 and 26 countries were expected to reach the MDG 4a and MDG 5a goals, respectively) has deteriorated further (now only 15 and 18 countries, respectively, are expected to achieve these goals). A concerted effort by governments in collaboration with UN agencies, multilateral development banks, and other donors is needed to provide technical advice and financing to these countries to assist in the attainment of these clearly difficult to reach MDGs (for detailed progress on the MDGs, see appendix A).
Data and measurement challenges for the two World Bank goals
Reliable, frequent, and good-quality data are vital for mea-suring poverty and shared prosperity. There are numerous data and measurement challenges in assessing progress toward attaining the two World Bank goals of ending
FIGURE 10
The prevalence of underweight children in low-income countries is significantly higher among the bottom 40 percent than among the top 60 percent
Bottom 40 percent Top 60 percent
50
40
30
20
10
0
Bang
lade
sh
Nig
er
Nep
al
Buru
ndi
Ethi
opia
Cam
bodi
a
Sout
h Su
dan
Chad
Burk
ina
Faso
Mal
i
Cong
o, D
em. R
ep.
Mya
nmar
Gui
nea
Cent
ral A
fric
an R
epub
lic
Sier
ra L
eone
Beni
n
Gui
nea–
Biss
au
Togo
Keny
a
PERC
ENTA
GE
OF
CH
ILD
REN
UN
DER
5
Countries
Source: World Bank calculations based on Health Nutrition and Population Statistics by Wealth Quintile, World Bank, 2014 for the most recent year between 2005 and 2012. Note: The bottom 40 percent and top 60 percent classifications are calculated using asset indexes.
Libe
ria
Moz
ambi
que
Tanz
ania
Uga
nda
Mal
awi
Rwan
da
Hai
ti
Zim
babw
e

G L O B A L M O N I T O R I N G R E P O R T 2 0 1 4 / 2 0 1 5 R E P O R T C A R D 29
extreme poverty and promoting shared prosperity. The challenges arise from the characteristics and scope of the indicators chosen to measure progress toward these goals. The poverty indicator is global, derived by estimat-ing the number of poor people in every country, and it requires several different and complementary data sources. The shared prosperity indicator, on the other hand, is country specific, is not aggregated globally, and requires additional data. And, importantly, the quality of these indicators is directly related to the capacity of the statistical systems in the poorest countries.
Population data from censuses are essential to esti-mate the poverty rate (box 1). It would be difficult to mea-sure the population of a country by relying on sample-based household surveys. The quality of census data is critical. Census data that are not of good quality or obso-lete are likely to produce poor-quality survey weights or
an outdated sampling frame, thereby failing to represent important groups or areas and giving rise to errors.
Considerable work is required to ensure that cross-country comparisons are valid. Countries differ in mini-mum needs, context, data collection and estimation approaches; thus arriving at consistent data on poverty counts is challenging. One issue is the need for data on inflation to adjust for the difference in the cost of living across countries, for which national income accounts esti-mates of real growth and consumer price index (CPI) esti-mates of the change in price levels are used.
Another issue is determining the local currency level of consumption or income that is consistent with the inter-national poverty line in US dollars. The purchasing power parity (ppp) index numbers from the International Com-parison Program are used to convert between local cur-rencies and dollars, since they adjust consumption and
FIGURE 11
Access to improved sanitation for people in the bottom 40 percent is significantly worse than the rates in the top 60 percent.Access to improved sanitation for low- income countries (most recent year between 2005 and 2012)
Bottom 40 percent Top 60 percent
Mya
nmar
Tajik
ista
n
Buru
ndi
Gam
bia,
The
Mal
i
Afg
hani
stan
Nep
al
Zim
babw
e
Bang
lade
sh
Hai
ti
Keny
a
Uga
nda
Mal
awi G
uine
a
Ethi
opia
Moz
ambi
que
Cam
bodi
a
Sier
ra L
eone
Tanz
ania
Libe
ria
Beni
n
Cent
ral A
fric
an R
epub
lic
Cong
o, D
em. R
ep.
Chad
Mad
agas
car To
go
Gui
nea-
Biss
au
Som
alia
Burk
ina
Faso
Nig
er
Countries
100
90
80
70
60
50
40
30
20
10
0
PERC
ENTA
GE
OF
POPU
LATI
ON
WIT
H A
CCES
S TO
BA
SIC
SAN
ITAT
ION
Source: World Bank calculations based on WHO/UNICEF Joint Monitoring Program (JMP) for Water Supply and Sanitation 2014 for most recent year between 2005 and 2012. Data in the figure for the bottom 40 and top 60 percent should not be directly compared with those published in the JMP 2014 report for which rural and urban but not national wealth quintiles were reported.
30 R E P O R T C A R D G L O B A L M O N I T O R I N G R E P O R T 2 0 1 4 / 2 0 1 5
income levels for differences in the cost of living across countries. Global poverty estimates are sensitive to errors in ppp indexes; the release of new data on these ppp indexes can change our understanding of global poverty.
Estimating levels of poverty and changes in shared prosperity across countries for any particular year requires data for that year. However, in any given year no more than 50 countries may generate household survey data.
Thus prior-year estimates for many countries have to be brought up to date to produce a global figure for each year. Since growth is a primary source of poverty reduc-tion (Dollar and Kraay 2001; Kraay 2006, Dollar, Kleineberg, and Kraay 2014), the World Bank uses growth rates and inflation from the national income accounts to estimate household consumption or income in future (or past) years; this practice introduces some uncertainty about the
FIGURE 12
Global progress toward achieving the MDGs has been unevenDistance to 2015 goal (%)
Corresponding target (percent) Distance to the goal achieved globally (percent)
Source: World Bank calculations based on data from the World Development Indicators database. Note: A value of 100 percent means that the respective MDG has been reached. “Corresponding target” indicates progress currently needed to reach the goal by 2015. “Latest available value” denotes current progress as illustrated by the most recent available data: extreme poverty, 2011; primary completion rate, total, 2012; ratio of girls to boys in primary and secondary education, 2012; mortality rate, infants, 2013; mortality rate, children under 5, 2013; maternal mortality ratio, 2013; improved water source, 2012; improved sanitation facilities, 2012.
100
80
60
40
20
0
84%
>100% >100% >100%
88%
100%
92% 92% 92%88% 88%
67%
88%
58%
100%
69%74%
60% 62%
88%
79%80%
DIS
TAN
CE T
O 2
015
GO
AL
(PER
CEN
TAG
E)
1A EXTREME POVERTY
(POPULATION BELOW 1.25/
DAY, 2005 PPP)
3A RATIO OF FEMALE TO MALE PRIMARY
ENROLLMENT (%)
5A MATERNAL MORTALITY
RATIO (MODELED
ESTIMATE, PER 100,000 LIVE
BIRTHS)
1C PREVALENCE
OF UNDER-
NOURISHMENT (% OF
POPULATION)
7C ACCESS TO SAFE
DRINKING WATER (% OF POPULATION
WITH ACCESS)
2A PRIMARY
COMPLETION RATE, TOTAL
(% OF RELEVANT
AGE GROUP)
4A MORTALITY
RATE, INFANT (PER
1,000 LIVE BIRTHS)
7C ACCESS
TO BASIC SANITATION FACILITIES
(% OF POPULATION
WITH ACCESS)
3A RATIO OF GIRLS
TO BOYS IN PRIMARY AND SECONDARY EDUCATION
(%)
4A MORTALITY
RATE, UNDER-5
(PER 1,000)
7D IMPROVE THE LIVES OF AT LEAST 100
MILLION SLUM DWELLERS (BY
2020)
SUBT
ARG
ETS
G L O B A L M O N I T O R I N G R E P O R T 2 0 1 4 / 2 0 1 5 R E P O R T C A R D 31
accuracy of time series estimates. Such adjustments are necessary for both estimates of shared prosperity, which is calculated based on data in real terms (World Bank 2014c) and poverty, which uses data on inflation to calculate pov-erty lines.
Comparisons of poverty and shared prosperity can be highly sensitive to measures of inflation, and the available inflation data are not always appropriate for measuring
FIGURE 13
Extent of progress toward achieving the MDGs, by number of countriesProgress toward achieving the MDGs by number of countries
Insufficient data Seriously off target (2030) Moderately off target (2020–2030) Insufficient progress (2015–2020) Sufficient progress (<2015) MDGs met
the real incomes of the poor. For example, data on prices in urban areas may not reflect price changes in rural areas. The bundles of goods used to calculate price indexes do not always reflect either average consumption patterns or the consumption of the poor. And changes in relative prices over time can impair the accuracy of price indexes used to calculate changes in the real value of household consumption.
MDG 7.2—Access to improved sanitation facilities (% of population)
MDG 7.1—Access to improved water source (% of population)
MDG 5.0—Maternal mortality ratio, modeled estimates (per 100,000 live births)
MDG 4.2—Mortality rate, infant (per 1,000 live births)
MDG 4.1—Under five mortality rate, infant (per 1,000 live births)
MDG 3.0—Ratio of girls to boys enrollment in primary and secondary education (%)
MDG 2.0—Primary completion rate (% of relevant age group)
MDG 1.9—Prevalence of undernourishment (% of population)
MDG 1.1—Population living below $1.25 a day (%)
2015
35
53
88
69
77
34
2822
23
19
37
28
20
22
8 10 3
6
16
13
16 14 11
9
8
9
10
18
15
13
23
32
28
36
52
22
66
37
65
44
35
74
6
1
3
3
8
2
2
2
5 6
4
6
Source: WDI and GMR team estimates.Note: Progress is based on extrapolation of latest five-year annual growth rates for each country, except for MDG5, which uses the last three years. Sufficient progress indicates that an extrapolation of the last observed data point with the growth rate over the last observable five-year period shows that the MDG can be attained. Insufficient progress is defined as being able to meet the MDG between 2016 and 2020. Moderately off target indicates that the MDG can be met between 2020 and 2030. Seriously off target indicates that the MDG will not even be met by 2030. Insufficient data points to the fact that not enough data points are available to estimate progress or that the MDG’s starting value is missing (except for MDG2 and MDG3). In the poverty target, 11 out of the 66 countries that have met the target have less than 2 percent of people living below $1.25 a day.
32 R E P O R T C A R D G L O B A L M O N I T O R I N G R E P O R T 2 0 1 4 / 2 0 1 5
Notes
1. World Bank 2014b, chapter 2, sets out the World Bank approach to measuring global poverty in more detail. See Ravallion, Chen, and Sangraula (2009) for a fuller description of how the $1.25-a-day international poverty line was derived.
2. Data on income and consumption are collected in nominal terms, in local currency. CPI data (along with ppp exchange rates) are then used to calculate income and consumption levels in ppp dollars of 2005, which are the basis of poverty estimates. If inflation for a given year is revised downward, then household income for that year in 2005 ppp dollars will be revised upward, and the esti-mated poverty rate will fall. Such revisions can be substan-tial. For example, the 2010 CPI of the Democratic Republic of the Congo was revised downward from 240 (2005=100) to 170, resulting in a substantial increase in estimated real household incomes and thus a decline in poverty rates.
3. See World Bank 2014b for a detailed description.4. Note that in these countries, the underlying data are
less than perfectly reliable and may be shown, with future work, to have inaccuracies that merit correction and revision.
5. These countries are Benin, Burundi, the Central Afri-can Republic, Comoros, the Democratic Republic of Congo, Republic of Congo, Côte d’Ivoire, Gambia, Guinea-Bissau, Haiti, Kenya, Madagascar, Malawi, Mali, Niger, Nige-ria, Rwanda, Sierra Leone, Swaziland, São Tomé and Prin-cipe, Togo, and Zambia.
6. These are Benin, Burundi, the Central African Repub-lic, Comoros, the Democratic Republic of Congo, Côte d’Ivoire, Gambia, Guinea-Bissau, Guinea, Haiti, Liberia, Madagascar, Malawi, Mali, Swaziland, Togo, and Zambia.
7. For more alternative scenarios, see World Bank 2014b.
8. See World Bank 2014b for a detailed description.9. These groups are the extreme poor as defined by
the World Bank’s international poverty line; the “moderate poor,” who live on between $1.25 and $4.00 a day; the “vulnerable” who live on between $4.00 and $10.00 a day; and the middle class and rich who live on more than $10.00 a day—all measured at 2005 constant ppp. The concept that people living on $4.00 to $10.00 a day are vulnerable is based on evidence that a considerable share of households above a given poverty line are usually vul-nerable to falling below that line over time. See Ferreira and others (2012) and Birdsall and Lustig, and Meyer (2014).
10. These countries are Fiji, Slovak Republic, the Russian Federation, Belarus, Panama, Uruguay, and Malaysia.
11. These countries are Côte d’Ivoire, Georgia, Albania, Macedonia, Serbia, Croatia, Guatemala, Central African Republic, and Zambia.
12. Given the sensitivity of the shared prosperity indi-cator and extreme poverty estimates to differences in the source and time interval of data used, some caution in making cross-country comparisons is needed. Another concern is that some countries use income data to mea-sure shared prosperity and extreme poverty, while others use consumption data. This creates another complication in interpretation of results when comparing countries. See World Bank 2014b for a detailed description.
13. A note of caution about the data for the bottom 40 percent using surveys: national level data for the MDG indicators do not always come straight from surveys (for example Primary Completion Rate, Child Mortality, HIV, Water and Sanitation). Therefore, data for the bottom 40 percent and national data are not comparable.
BOX 1 Census Data
Census data are the primary source of sampling frames and benchmark statistics for household surveys (United Nations Statistics Division 1984 and 2008). At the World Bank, population statistics are based on the biennial World Population Prospects (WPP) issued by UN Population Division, and other information including latest census reports from national statistical offices, feed into the World Development Indicators (WDI), and act as the baseline for official regional and global poverty estimates.
In developing countries, where census data are often not available, obsolete or outdated, or unreliable, demographic models and complementary data such as surveys, population registrars, or administrative records, combined with indirect estimation techniques (Moultrie and others 2013) are often the only option to provide consistent population counts by country and region (United Nations 2014). Maintaining reliable, frequent, and well-functioning census systems is important to reduce reliance on modeling and estimation approaches to determining population levels.
Source: World Bank 2014b.
G L O B A L M O N I T O R I N G R E P O R T 2 0 1 4 / 2 0 1 5 R E P O R T C A R D 33
14. The bottom 40 percent and top 60 percent classifi-cations are calculated using asset indexes (the base for Demographic and Health Surveys). Estimating the same bottom 40 percent and top 60 percent using consump-tion estimates from household budget surveys can give dif ferent results (though similar trends would be expected). The bottom 40 percent is an average of the first and second quintiles, and it would be different from the average of the bottom 40 percent from the micro datasets (due to use of weights).
References
Birdsall, Nancy, Nora Lustig, and Christian J. Meyer. 2014. “The Strugglers: The New Poor in Latin America?” World Development 60 (August): 132–46. doi:10.1016 /j.worlddev.2014.03.019.
Dollar, David, and Aart Kraay. 2001. “Growth Is Good for the Poor.” World Bank, Development Research Group, Macroeconomics and Growth, Washington, DC.
Dollar, D., T. Kleineberg, and A. Kraay. 2014. Growth, Inequality, and Social Welfare: Cross-country Evidence. Washington, DC: World Bank.
Ferreira, Francisco H. G., Julian Messina, Jamele Rigolini, Luis-Felipe López-Calva, Maria Ana Lugo, and Renos Vakis. 2012. Economic Mobility and the Rise of the Latin American Middle Class. Washington, DC: World Bank.
Kraay, A., 2006. “When Is Growth Pro-poor? Evidence from a Panel of Countries.” Journal of Development Economics 80 (1): 198–227.
Moultrie, Tom, Rob Dorrington, Allan Hill, Kenneth Hill, Ian Timaeus, and Basia Zaba, eds. 2013. Tools for Demographic Estimation. Paris: International Union for the Scientific Study of Population.
Ravallion, Martin, Shaohua Chen, and Prem Sangraula. 2009. “Dollar a Day Revisited.” World Bank Economic Review 23 (2): 163–84. doi:10.1093/wber/lhp007.
United Nations. 2008. Report of the Secretary-General on the Indicators for Monitoring the Millennium Development Goals. E/CN.3/2008/29. New York.
———. 2014. The Millennium Development Goals Report. New York.
Wagstaff, Adam, Caryn Brendenkamp, and Leander R. Buisman. 2014. “Progress toward the Health MDGs: Are the Poor Being Left Behind?” Policy Research Working paper 6894. World Bank, Washington, DC (May).
WHO (World Health Organization) and UNICEF (United Nations Children’s Fund). 2013. “Progress on Sanitation and Drinking Water: 2014 Update.” Geneva.
World Bank. 2014a. “Global Economic Prospects.” World Bank, Washington, DC (June).
———. 2014b. “Ending Poverty and Boosting Shared Prosperity, Development Goals and Measurement Challenges.” Policy Research Report, World Bank, Washington, DC.
———. 2014c. “Prosperity for All: Ending Extreme Poverty.” A Note for the World Bank Group for the Spring 2014 Meetings. World Bank, Washington, DC (April).
![[Millennium Development Goals 1 and 3] By [Author Name ... · MILLENNIUM DEVELOPMENT GOALS 1 & 3 4 were termedas “Millennium Development Goals” and United Nations Millennium Declaration](https://static.fdocuments.us/doc/165x107/5edb6813ad6a402d66659cfd/millennium-development-goals-1-and-3-by-author-name-millennium-development.jpg)