The Transformation of New Orleans Public Schools ... · Many urban districts across the nation have...
16
DATACENTERRESEARCH.ORG Introduction O f the various systemic reforms in New Orleans, public education can claim the most dramatic before-and-after Katrina picture. The traditional public school district, managed by the Orleans Parish School Board, not only got a makeover (New Orleans received a $1.8 billion FEMA grant to build or renovate schools); these reforms also dramatically changed who teaches, how students enroll, who’s accountable, and the funding schools received. Many urban districts across the nation have expanded the proportion of charter schools; increased the percentage of teachers trained in alternate certification programs; widened attendance zones; adopted voucher programs; constructed new facilities; and changed their relationships with teachers unions. But no city can claim to have done so with as much depth and breadth as New Orleans. New Orleans’ post-Katrina public school reform efforts and outcomes have been the focus of intense national scrutiny as other districts consider undertaking what they consider to be similar reforms. With this in mind, it’s important to recognize the vast scope and breadth of the New Orleans reforms, and it’s equally important to understand the actual state of the pre-reform New Orleans school system as well as the circumstances under which these reforms were implemented. New Orleans public education before Katrina In the 1950s and 60s, as integration began, whites fled New Orleans public schools. In the 1970s, many middle-class blacks also began abandoning the city’s public schools, leaving behind a predominantly high-needs population of students. By 2004-05, just before Hurri- cane Katrina struck, the New Orleans public school population was 94 percent African American with 73 percent qualifying for the free and reduced lunch program, while the overall population of New Orleans was only 66 percent African American, and the citywide child poverty rate was 41 percent. 1 In addition to serving an overwhelming high-needs population, the Orleans Parish School Board (OPSB) and the district administration engaged in ineffective, and sometimes illegal, practices. In 2003, a private investigator found that the school system inappropriately provided checks to nearly 4,000 people and health insurance to 2,000 people. The New Orleans Index at Ten The Transformation of New Orleans Public Schools: Addressing System-Level Problems without a System Andre Perry, Columnist, The Hechinger Report Douglas N Harris, Education Research Alliance, Tulane University Christian Buerger, Education Research Alliance, Tulane University Vicki Mack, The Data Center WHAT IS ORLEANS PARISH? Orleans Parish is the city of New Orleans. New Orleans and Orleans Parish are interchangable. Their boundaries are the same and they contain the same population.
Transcript of The Transformation of New Orleans Public Schools ... · Many urban districts across the nation have...

D A T A C E N T E R R E S E A R C H . O R G
Introduction
O f the various systemic reforms in New Orleans, public education can claim the most dramatic before-and-after Katrina picture. The traditional public school district, managed by the Orleans Parish School Board, not only got a makeover (New Orleans received a $1.8 billion FEMA grant to build or renovate schools); these reforms also dramatically changed who teaches, how
students enroll, who’s accountable, and the funding schools received. Many urban districts across the nation have expanded the proportion of charter schools; increased the percentage of teachers trained in alternate certification programs; widened attendance zones; adopted voucher programs; constructed new facilities; and changed their relationships with teachers unions. But no city can claim to have done so with as much depth and breadth as New Orleans.
New Orleans’ post-Katrina public school reform efforts and outcomes have been the focus of intense national scrutiny as other districts consider undertaking what they consider to be similar reforms. With this in mind, it’s important to recognize the vast scope and breadth of the New Orleans reforms, and it’s equally important to understand the actual state of the pre-reform New Orleans school system as well as the circumstances under which these reforms were implemented.
New Orleans public education before KatrinaIn the 1950s and 60s, as integration began, whites fled New Orleans public schools. In the 1970s, many middle-class blacks also began abandoning the city’s public schools, leaving behind a predominantly high-needs population of students. By 2004-05, just before Hurri-cane Katrina struck, the New Orleans public school population was 94 percent African American with 73 percent qualifying for the free and reduced lunch program, while the overall population of New Orleans was only 66 percent African American, and the citywide child poverty rate was 41 percent.1
In addition to serving an overwhelming high-needs population, the Orleans Parish School Board (OPSB) and the district administration engaged in ineffective, and sometimes illegal, practices. In 2003, a private investigator found that the school system inappropriately provided checks to nearly 4,000 people and health insurance to 2,000 people.
The New Orleans Index at Ten
The Transformation of New Orleans Public Schools: Addressing System-Level Problems
without a SystemAndre Perry, Columnist, The Hechinger Report
Douglas N Harris, Education Research Alliance, Tulane University
Christian Buerger, Education Research Alliance, Tulane University
Vicki Mack, The Data Center
WHAT IS ORLEANS PARISH?
Orleans Parish is the city of New Orleans. New Orleans and Orleans Parish are interchangable. Their boundaries are the same and they contain the same population.

D A T A C E N T E R R E S E A R C H . O R G2 | August 2015
Some of those who collected checks were retired, fired, or even dead according to the district records. In a 4-year period, the school district allocated more than 15,000 erroneous checks costing the district $11 million.2 Common control practices, such as audits, were not done on a regular basis.3 In 2004, the Federal Bureau of Investigation issued indictments against 11 people for criminal offenses against the district related to financial mismanagement. Among them was a former school board president who accepted $140,000 in bribes in exchange for supporting the district’s purchase from a particular vendor.4
The school board was frequently criticized for awarding contracts in ways that hurt the district financially while providing low-quality ser-vices.5 Frequent leadership changes added to the general disorder in the school district. Eight superintendents served between 1998 and 2005.6 Further, between 1999 and 2003 the payroll department had seven managers and the finance department had three head adminis-trators.7 Under any set of conditions, effectively addressing the educational requirements of an overwhelmingly high-needs population of students is a challenge. These leadership problems only compounded that challenge.
In the 2004-05 school year, Orleans Parish public schools ranked 67th out of 68 districts in mathematics and reading test scores in the Louisiana accountability system. Fully 63 percent of public schools in New Orleans were deemed “academically unacceptable” by Louisi-ana accountability standards, compared to just eight percent of public schools across Louisiana. The graduation rate was 54 percent, 10 percentage points below the state average. And Louisiana consistently ranked 49th out of 50 states on national tests.8 The next-to-lowest ranked district, in the next-to-lowest ranked state, had nowhere to go but up.
Still these figures obscure the fact that pre-Katrina some of the most successful public schools in the state resided in New Orleans and produced high achieving graduates who are thriving. For decades, selective admissions, public high schools in New Orleans like Eleanor McMain, Ben Franklin, McDonogh 35, and Edna Karr produced highly successful collegians who would become the gentry of New Orleans. But in 2003, only selective admissions public, private or parochial institutions in New Orleans schools combined could say that more than one-third of their students were eligible for the Taylor Opportunity Scholarship (TOPS), the state’s merit scholarship.9 In comparison, only 5 percent of the students in the non-selective high schools qualified for any level of TOPS. Sadly, thousands of students who could not enroll in selective admissions or private institutions were enrolled in schools that were among the worst in the nation.
The need for dramatic improvements in open enrollment schools made New Orleans a target for some form of state intervention. Hurri-cane Katrina and its aftermath led to a particularly aggressive method and scope of that intervention.
Summary of the post-Katrina major reformsThere is no doubt that the aftermath of Katrina expedited education reform in New Orleans. Many of the enacted reforms existed in some form prior to the storm, and the absence of evacuated stakeholders changed the political dynamics that held the prior system together. The destruction of the majority of 127 schools forced at least the temporary removal of attendance zones. Moreover, the race to open schools for students who returned to the city was as big an impetus for New Orleans’ noted restructuring as any intentional reform strategy. It is difficult to imagine other districts executing so many reforms simultaneously under non-extraordinary circum-stances.
1. STATE TAKEOVER
In other cities, financial duress has been the primary impetus for state takeovers (e.g. Philadelphia, Detroit). By assuming responsi-bility for the budget and central office, states became public school district operators. The state of Louisiana, in contrast, took over individual schools based on their school performance—leaving the local school board and its central office intact, and not inheriting the central administration financial and operational problems. Indeed, contrary to popular belief, the Recovery School District existed before the storm and oversaw five schools in New Orleans. After Katrina, the state legislature voted to change the academic criteria that made a school eligible for takeover, thus the state took over the vast majority of New Orleans public schools, leaving just a few high-performing schools to be run by the Orleans Parish School Board.10
2. CHARTER SCHOOLS
The Recovery School District (RSD), which took over all “failing schools”, and the Orleans Parish School Board (OPSB), which kept just a small number of high-performing schools, both began converting traditionally run schools to charters. Today, open-access charter schools educate the majority of students in the state-run RSD. In addition, the majority of the higher-performing schools still governed by the Orleans Parish School Board (some of which have selective admissions criteria), also became charter schools after the storm.
As of the fall of 2014, 92 percent of the public schools in New Orleans are charter schools—the largest share of any school district in the nation.11 Charter schools are publically funded, independently managed public schools that are authorized in Louisiana by the local district or the State Board of Elementary and Secondary Education. In exchange for autonomy, charters agree to meet assigned academic benchmarks.

D A T A C E N T E R R E S E A R C H . O R G3 | August 2015
3. SCHOOL CHOICE AND COMPETITION
School choice refers to the range of policies that allow parents to select the school they want their children to attend. Prior to Katrina, as in the vast majority of the nation’s school districts, schools were arranged in neighborhood zones. Schools chiefly enrolled students from their respective zone, but schools would accept students from outside their zone if seats were available. However, the flooding that inundated over 80 percent of the city after Katrina significantly reduced the number of available schools, which necessitated at least the temporary removal of attendance zones. In addition, the state prohibited the use of attendance zones by charter operators who applied for their school through the RSD. Some Orleans Parish authorized charters have attendance zones. However, all parents have to apply to the school where they wish to send their children. The RSD continued to prohibit the use of attendance zones as schools reopened. To promote fairness, equity, and transparency in the school application process, RSD officials created a centralized enrollment system called OneApp.12
4. EDUCATORS
Most urban school districts around the country have collective bargaining agreements with a local teachers union that set guidelines for hiring, promotion, dismissal, compensation, work hours, and more. In addition, state laws often codify tenure and seniority protections. Following the state takeover of most public schools in New Orleans, the Orleans Parish School Board terminated nearly all of its teachers and school staff. The legality of the firing was disputed in court on the grounds that teachers’ due process were violated. In 2012, a state district judge ruled in favor of employees, and an appellate court mainly upheld that ruling. However, the state Supreme Court dismissed the suit in October of 2014 and found that employees’ due process rights were not violated.13 Currently, only two charter schools have collective bargaining agreements, one of which is still in the process of being developed.14 The RSD-run schools and all of the charter schools have significant flexibility under state law to set hiring, promotion, salary, and work rules. Due to increased flexibility in the educator labor market, combined with support for alternative teacher and principal pipelines among charter operators and philanthropists, schools recruited heav-ily from organizations like Teach for America and The New Teacher Project, over the years to staff their buildings. In addition, local universi-ty-based teacher training programs as well as Relay Graduate School of Education supply and train the workforce.
5. FUNDING
In addition to regular state, local, and federal dollars that comprise the annual per pupil expenditure, New Orleans reform efforts have been financially supported through a wider portfolio of sources including governmental agencies and philanthropic foundations. Immediately after the reforms, spending roughly doubled from just under $10,000 per pupil to over $17,000 in 2008, which included one-time money all hurricane impacted districts in the state received. Over the last ten years, sporadic infusions to schools, nonprof-its, and districts have included $28 million from the federal Investing in Innovation Grant to replicate effective schools and strategies as well as millions in charter start up grants. New Orleans’ education recovery efforts received large infusions from philanthropic foundations including but not limited to the Laura and John Arnold Foundation, Max M. & Marjorie S. Fisher Foundation, the Bill & Me-linda Gates Foundation, the Eli and Edythe Broad Foundation, the W.K. Kellogg Foundation, and the Walton Family Foundation. More recently, expenditures have returned closer to pre-Katrina levels, though they have increased $1,000 per student more in New Orleans compared with demographically similar districts.15 And these increases are on top of the massive $1.8 billion FEMA grant to construct and refurbish school buildings.
WHAT HASN’T CHANGED
Public education delivery systems have changed radically, but the people who use them have remained similar. New Orleans public schools are only slightly more diverse than before the storm. White enrollment has nudged upward from 3 percent in 2004–05 to 6 per-cent at the start of the 2014–15 school year. (But whites are concentrated in selective admission, test-in schools authorized by the Orle-ans Parish School Board.) The influx of Hispanics to the region spurred growth in the proportion of Hispanic youth in schools. The per-centage grew from 1 percent in 2004–05 to 5 percent in 2013–14. But low-income, black families still have the most at stake in regards to the effectiveness of public schools. Eighty-seven percent of the children in New Orleans public schools are still African American. In 2004–05, 77 percent of New Orleans students were part of the free and reduced price lunch program, which was how schools primarily measured poverty. At the start of the 2014 academic year, 84 percent of students were “economically disadvantaged,” a term that also refers to those who qualify for SNAP, TANF, or Medicaid.16 The similarity in the student population is reinforced by other evidence of Census data and the test scores of students who returned to New Orleans.17
The overrepresentation of poor, black students in public schools is largely due to the fact that white and middle-class families opt out of the public sector and choose private and parochial schools at significantly higher rates in New Orleans. Only 10 percent of students nationwide attend private schools. In New Orleans, a quarter of students attend private/parochial schools.18 High concentrations of poverty in open enrollment public schools reflect an immeasurable but still durable problem that reform should aspire to solve – the chronic social divestment in public education.

D A T A C E N T E R R E S E A R C H . O R G4 | August 2015
Summary of the latest impactAmong other things, the reforms have had an impact on civic engagement, but it’s unclear whether that engagement has been en-hanced or stymied. Because the board of each nonprofit charter is typically comprised of local residents, the opportunities for direct civic engagement have in some ways increased. However, the elected local school board oversees a much smaller share of schools than before the storm. Some charge that the removal of schools from the elected board removes basic political rights. “New Orleans is the only place in the state where the majority of taxpayers and voters have no participation in public education,” said education advocate Raynard Sanders in the context of a millage vote.19 Opportunities for involvement in charter school boards need more study to determine overall impact on civic engagement.
Similarly, it’s unclear whether the reforms have rectified financial mismanagement of the schools, or simply decentralized it. In 2015, a prominent New Orleans based lawyer and board chair of a charter school used a school credit card to charge up to $13,000 worth of expenses.20 Earlier that year, an Orleans Parish School Board Member pleaded guilty to accepting $5,000 in bribes.21 A business manag-er of a charter school pilfered almost $660,000 in 2010.22 Another charter school employee embezzled $25,000 in 2011–12.23 A former employee of one charter school was charged with theft by fraudulent checks in the amount of $31,000 in 2013.24
But the most important question in everyone’s minds should be: How are the children doing now? After all of the aforementioned changes, are students more prepared for college? There are several ways to answer these questions.
TEST SCORES
Louisiana used the LEAP tests (4th and 8th grade) and iLEAP tests (3rd grade and 5th–7th grade) beginning in 2006–07 through 2013–14 to assess student performance and school performance.25 The state required high school students in 2004–05 to take the Graduate Exit Exam (GEE). The GEE measured student’s cumulative progress in English/Language Arts, Mathematics, Science, and Social Studies. Students took the Language Arts and Mathematics portion in the 10th grade year. Science and Social Studies was taken in the 11th grade. Students were given three opportunities to pass. By 2013–14, Louisiana had transitioned to End-of-Course (EOC) tests and added the ACT to its high school assessments.
According to the state, “The percentage of students who were proficient on all state tests for all grades increased from 35 percent in 2004–05, to 62 percent in 2013–14. The percentage of African American students in New Orleans proficient on state tests increased 27 percentage points between 2004–05 and 2013–14, from 32 percent to 59 percent. African American students in New Orleans closed the gap with the state average in 2010–11 and have outperformed the state ever since.”26
FIGURE 1: PERCENT PROFICIENT ON STATE TESTS
ALL STUDENTS, ALL GRADES, ALL TESTS
Source: Louisiana Department of Education Academic Outcomes.
58%60%
65%
68% 68%
35%
40%
52%
58%
62%
30%
40%
50%
60%
70%
2004-05 2005-06 2006-07 2007-08 2009-10 2011-12 2013-14
Louisiana
New Orleans

D A T A C E N T E R R E S E A R C H . O R G5 | August 2015
Students need to build upon solid academic foundations to best receive college ready curriculums. Encouragingly, elementary and middle school students test scores also increased in the past 10 years. The percentage of elementary and middle school students who scored basic or above on the LEAP and iLEAP tests increased from 33 percent in 2004–05 to 63 percent in 2013–14.27
Prior to their being phased out by a revised End of Course Exam, the state required all 10th and 11th grade students to pass the Grad-uation Exit Examination. After Katrina, high school student test scores on the GEE increased steadily from 39 percent in 2004–05 to 57 percent in 2010–11. Since 2010–11, the percentage of students who were proficient on the EOC has increased from 39 percent to 59 percent.
FIGURE 2: PERCENT OF STUDENTS PROFICIENT ON LEAP AND ILEAP
Source: Louisiana Department of Education Academic Outcomes.
FIGURE 3: PERCENT OF STUDENTS PROFICIENT ON GEE AND EOC TESTS
57%
60%
65%
68% 69%
33%
39%
52%
58%
63%
30%
40%
50%
60%
70%
2005 2006 2007 2008 2010 2012 2014
Louisiana
New Orleans
60%61%
62%
65%66%
64%
43% 43%
49%
55%
59%
62%
39%40%
38%
49%
55%57%
33%
30%
39%
45%
52%
59%
25%
35%
45%
55%
65%
75%
2004-05 2005-06 2006-07 2007-08 2008-09 2010-11 2013-14 2007-08 2008-09 2010-11 2011-12 2013-13 2013-14
GEE EOC
Louisiana
New Orleans
Source: Louisiana Department of Education High School Performance.

D A T A C E N T E R R E S E A R C H . O R G6 | August 2015
COHORT GRADUATION RATES
Graduation rates are an important indicator of school performance for parents, policymakers, and other concerned community mem-bers. However, graduation rates are not the most reliable indicator of success because of variations in school quality and frequent changes in how students are classified as eligible for different diplomas. Still, a high school diploma is requisite for college enrollment. Consequently, graduation rates are a cornerstone of high school accountability and used in decisionmaking about the targeting of resources and interventions to low-performing schools.28 In Louisiana, high school cohort graduation rates are used in the calculation of School Performance Scores.29
The Louisiana Department of Education did not calculate the cohort graduation rate for 2004–05 and the 2003–04 cohort graduation rate was calculated after the fact. As such, 2003–04 graduation rate data was not certified at the district level at the end of that year. The available data suggests that the cohort graduation rates increased from 54 percent in 2003–04 to 73 percent by 2013–14.30
New Orleans high schools are graduating historically underserved students at a higher clip than the state. African American students, African American male students, economically disadvantaged students, and students with disabilities in New Orleans schools are graduating at a higher rate than their respective state cohort. For instance, in 2014, African American males in New Orleans graduated at five percentage points higher than the state average. Students with disabilities graduated at 17 percentage points higher than the state average.31
COLLEGE ENROLLMENT
While graduation rates are a good indicator of growth, college enrollment is almost universally seen as the more important marker of student success. A high school diploma is simply not enough. The Pew Research Center found that the value of a college degree is increasing with time while high school diplomas are depreciating. Today, 22 percent of young adults ages 25 to 32 who have only a high school diploma live in poverty. Back in 1979, when the Baby Boomers were young adults, those with just a high school diploma had only a 7 percent likelihood of living in poverty.32
FIGURE 4: HIGH SCHOOL 4-YEAR COHORT GRADUATION RATES
AS OF SPRING OF YEAR FOUR
Source: Louisiana Department of Education, National Center for Education Statistics.
54%
90%
94%
89% 89% 89%
79%80%
81%
65%66% 66%
67%67%
71% 72%74%
77%78%
73% 73%
50%
59%
68%
60%61%
40%
50%
60%
70%
80%
90%
100%
2003-04 2004-05 2005-06 2006-07 2007-08 2008-09 2009-10 2010-11 2011-12 2012-13 2013-14
OPSB
U.S.
Louisiana
Orleans combined
RSD - New Orleans
D A T A C E N T E R R E S E A R C H . O R G7 | August 2015
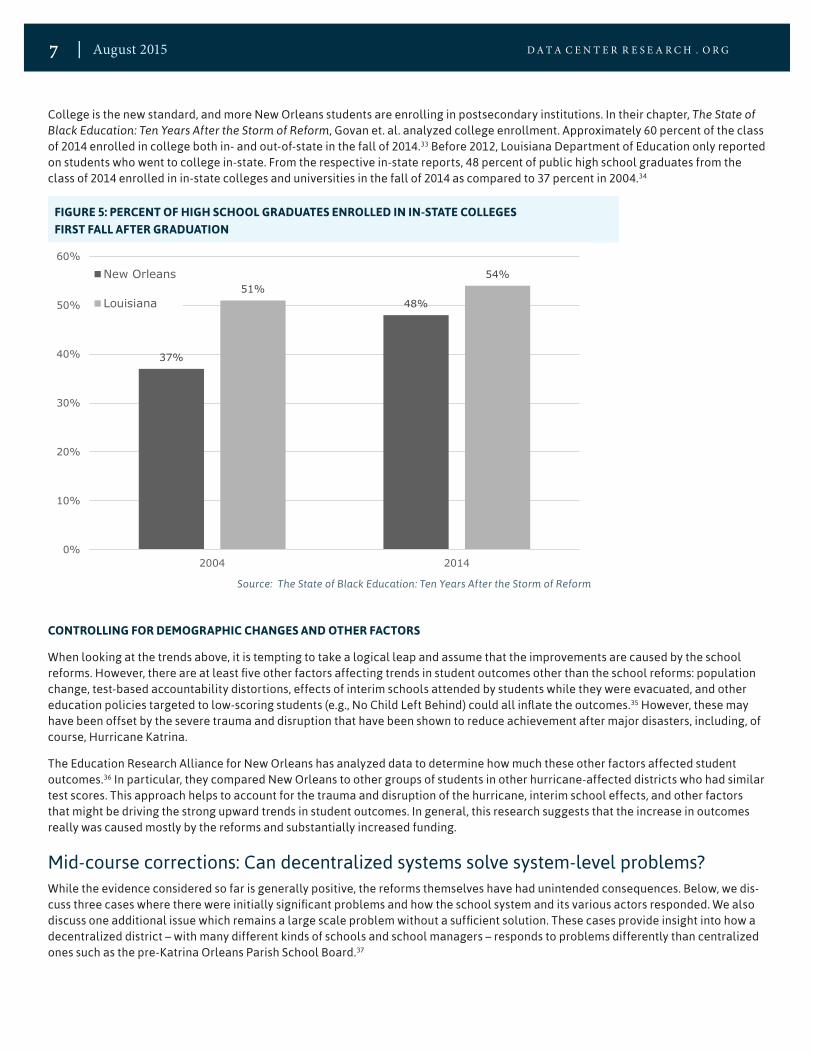
College is the new standard, and more New Orleans students are enrolling in postsecondary institutions. In their chapter, The State of Black Education: Ten Years After the Storm of Reform, Govan et. al. analyzed college enrollment. Approximately 60 percent of the class of 2014 enrolled in college both in- and out-of-state in the fall of 2014.33 Before 2012, Louisiana Department of Education only reported on students who went to college in-state. From the respective in-state reports, 48 percent of public high school graduates from the class of 2014 enrolled in in-state colleges and universities in the fall of 2014 as compared to 37 percent in 2004.34
CONTROLLING FOR DEMOGRAPHIC CHANGES AND OTHER FACTORS
When looking at the trends above, it is tempting to take a logical leap and assume that the improvements are caused by the school reforms. However, there are at least five other factors affecting trends in student outcomes other than the school reforms: population change, test-based accountability distortions, effects of interim schools attended by students while they were evacuated, and other education policies targeted to low-scoring students (e.g., No Child Left Behind) could all inflate the outcomes.35 However, these may have been offset by the severe trauma and disruption that have been shown to reduce achievement after major disasters, including, of course, Hurricane Katrina.
The Education Research Alliance for New Orleans has analyzed data to determine how much these other factors affected student outcomes.36 In particular, they compared New Orleans to other groups of students in other hurricane-affected districts who had similar test scores. This approach helps to account for the trauma and disruption of the hurricane, interim school effects, and other factors that might be driving the strong upward trends in student outcomes. In general, this research suggests that the increase in outcomes really was caused mostly by the reforms and substantially increased funding.
Mid-course corrections: Can decentralized systems solve system-level problems?While the evidence considered so far is generally positive, the reforms themselves have had unintended consequences. Below, we dis-cuss three cases where there were initially significant problems and how the school system and its various actors responded. We also discuss one additional issue which remains a large scale problem without a sufficient solution. These cases provide insight into how a decentralized district – with many different kinds of schools and school managers – responds to problems differently than centralized ones such as the pre-Katrina Orleans Parish School Board.37
FIGURE 5: PERCENT OF HIGH SCHOOL GRADUATES ENROLLED IN IN-STATE COLLEGES
FIRST FALL AFTER GRADUATION
Source: The State of Black Education: Ten Years After the Storm of Reform
37%
48%51%
54%
0%
10%
20%
30%
40%
50%
60%
2004 2014
New Orleans
Louisiana

D A T A C E N T E R R E S E A R C H . O R G8 | August 2015
EXPULSIONS AND SUSPENSIONS
In New Orleans, where the local incarceration rate is more than twice the national rate,38 a focus of a public educational system must be to keep students in school and out of prison. The phrase “school-to-prison pipeline” describes how schools convey students directly into the criminal justice system through “zero-tolerance” policies that criminalize mundane school infractions. School leaders often “sweat the little things,” like uniform infractions, walking out of line, and unsanctioned verbal communication. Multiple violations culminate into out-of-school suspensions.
Evidence suggests that there was a substantial spike in expulsions in the years just after the reforms, but this number too has declined substantially.39 Figure 6 below shows the number of suspensions and expulsions have declined since the pre-Katrina period. Black students, while still having much higher suspension and expulsion rates, saw the steepest declines in the post-Katrina period.
When students remain in school, they are more likely to continue receiving instruction, and to avoid trouble that often occurs when they are sent home. Therefore, another key decision educators make is whether to make suspensions in-school versus out-of-school. Figure 7 shows the percent of suspensions that are out-of-school.
A hike in expulsions in the years after reform solidified a general perception of unreasonably harsh discipline, and led to considerable pushback on the RSD and OPSB from the media and advocacy groups. In the face of mounting pressure from organizations like Fami-lies and Friends of Louisiana’s Incarcerated Children, the Juvenile Justice Project, Southern Poverty Law Center, and individual families and other advocacy groups, the RSD, OPSB, and a large number of school management organizations came together and agreed on a set of policies aimed at combating school discipline problems. As a result, the RSD and OPSB created a centralized expulsion process for the 2012–2013 school year to ensure all students received fair and consistent treatment.40 The RSD and OPSB 2014–2015 Manuals for Disciplinary Decisions explain that a student can be expelled for incidents that severely interfere with safety and learning. How-ever, they also state that students cannot, under any circumstances, be recommended for expulsion for disrespect or willful disobedi-ence, uniform violations, or repeated suspensions for violations not listed in expellable offenses.41
FIGURE 6: PERCENT OF STUDENTS SUSPENDED OR EXPELLED IN NEW ORLEANS
BY RACE
20% 21%
14%
6%
7%
4%
6%
9%
4%
0%
5%
10%
15%
20%
25%
2001 2002 2003 2004 2005 2006 2007 2008 2009 2010 2011 2012 2013
Black Students
Other Students
White Students
Source: Education Research Alliance for New Orleans.

D A T A C E N T E R R E S E A R C H . O R G9 | August 2015
FIGURE 7: PERCENT OF SUSPENSIONS OUT-OF-SCHOOL
97%
83%
87%
49%47%
39%
20%
40%
60%
80%
100%
2001 2002 2003 2004 2005 2006 2007 2008 2009 2010 2011 2012 2013
New Orleans
All Other Parishes
Source: Education Research Alliance for New Orleans.
SPECIAL EDUCATION
Test scores for students with disabilities have also risen. The percentage of New Orleans students with disabilities achieving proficien-cy on state tests has increased by 38 percentage points since 2004–05 and is now two points below the state average.42 The journey to this growth was extremely difficult for students with special needs.
Almost immediately after Katrina, parents of special needs students (and their lawyers) officially filed complaints on behalf of children who were not being served according to the law. Moreover, because schools are held accountable for test scores, schools have incen-tives to attract and keep high-scoring students, perhaps to the exclusion of others. Special education students are especially vulnera-ble to these negative aspects of decentralization and competition. It is also more difficult for schools to serve these students. Anything that requires specialized services will be harder for individual schools to address because they can’t leverage economies of scale.
Eventually, the Southern Poverty Law Center (SPLC) filed a lawsuit against the Louisiana Department of Education in 2010. The SPLC found that students were denied services because of their disability; that students were denied protections and services because state agencies did not apply consistent, uniform policies that identify, locate, and evaluate students’ needs; and that New Orleans schools did not develop or review individual education plans in a timely fashion.
The Louisiana Department of Education reached a settlement agreement in 2015 by consent decree to make necessary improvements, but prior to the settlement, schools responded to the harmful practices described in the lawsuit by changing their suspension and expulsion policies; developing a common suspension/expulsion policy; and creating a centralized enrollment system (see below). Officials also implemented a school monitoring process to improve identification, location, and evaluation of students who may have special needs.
ENROLLMENT POLICIES
As the New Orleans decentralized system of schools evolved, selecting a school became increasingly onerous. To provide parents with sufficient information to choose among many school options, a 175-page New Orleans Parents Guide was developed by an indepen-dent nonprofit.43 Even with this comprehensive information, simply applying to one’s preferred schools was exceedingly difficult. With multiple applications for different schools, and in the absence of attendance zones, harried parents needed a simpler way to enroll children in school.
Subsequently, the Recovery School District developed a centralized enrollment system called the OneApp program, which creates a one-stop shop for parents. Families list their school preferences, and a computer algorithm uses that information to assign students

D A T A C E N T E R R E S E A R C H . O R G1 0 | August 2015
to schools. For those schools with more applicants than open seats, the computer assigns essentially by lottery, while also taking into account factors like home neighborhood.44
Currently, 89 percent of schools participate in OneApp. In 2014, RSD and OPSB signed a cooperative endeavor agreement (CEA) that clarified and defined the relationship between the school districts in three key areas: educational programs and services intended to meet the needs of the city’s most vulnerable students; facility improvement; and the efficient and equitable use of funding and shared financial resources. In regards to OneApp, the CEA states that all RSD and OPSB direct run schools will participate in OneApp, but OPSB fell short of 100 percent participation. Other OPSB charters will participate upon extension or renewal of their charters. OPSB has agreed to the following:
* All OPSB direct-run schools will participate in OneApp (This step has already been taken);
* All charter schools commencing operations in Fall 2013 or after will participate in OneApp; and
* Charter schools commencing operation prior to Fall 2013, upon extension or renewal will participate in OneApp.
In short, eight of the most sought after New Orleans schools do not participate in OneApp. The fact that all schools are not currently participating in OneApp is concerning as this hinders fair access to all schools for all students.45
And while there are far fewer schools that are deemed failing than in the past, there are not enough quality seats to authoritatively claim New Orleans is a choice system. The Cowen Institute for Public Education Initiatives and Education Research Alliance for New Orleans have examined the enrollment and capacity of schools according to their school performance score or grade. There is some evidence that high performing schools simply do not have room for more students. In short, there are not enough high quality options among New Orleans’ public schools.
FIGURE 8: SCHOOL CAPACITY BY LETTER GRADE, 2013–14
Source: Sims, P. The State of public education in New Orleans. Cowen Institute.

D A T A C E N T E R R E S E A R C H . O R G1 1 | August 2015
It is important to note, however, that the highest performing schools also typically have selective admissions so most students would not be able to attend even if there were open slots. Also, a study by the Education Research Alliance for New Orleans found that some of what appears to be preference for academic quality actually reflects the fact that high-performing schools also tend to have other characteristics that families prefer.46 So, the above figure probably exaggerates how much families focus on academics.
Going forward, the question is whether RSD and OPSB can follow through on universal school participation in OneApp and reduce confusion among families about how the OneApp, and its complicated computer algorithm, really works. Perceptions of fairness are just as important as the reality.47
TEACHER PIPELINE
There is widespread agreement among scholars that teacher quality is the most important schooling factor influencing student achievement.48 However, it’s extremely difficult to untangle how many effective teachers exist in any low or high performing system. What is certain is that in December 2005, the OPSB officially terminated most of their 8,500 employees.
Very shortly after the storm, many former OPSB teachers were rehired, for example, in the quickly installed Algiers Charter Schools Association. “Founded in 2005 by a nonprofit board comprised of members from the Orleans Parish School Board and neighborhood representatives, ACSA provided the first ed-ucational options for families returning to Algiers and the wider New Orleans community after Hurricane Katrina.”49 Algiers, on the West bank of New Orleans, did not flood. Teachers who lived in this less impacted area had the capacity to return. In contrast, schools on the largely flooded East bank struggled to find teachers as they were dispersed across the country.
In December 2007, the Bill & Melinda Gates Foundation, the Doris and Donald Fisher Fund, and the Eli and Edythe Broad Foundation announced their plans to provide several grants for three years to New Schools for New Orleans, New Leaders for New Schools, and Teach for America-Greater New Orleans. In addition, the Walton Family Foundation awarded significant grant support for charter schools and the Recovery School District. All these philanthropic organizations place emphases on quality teaching and leadership, and encouraging new ways to get quality personnel into schools.
Today, the post-Katrina teacher pipeline in New Orleans relies disproportionately on alternative pathway programs such as Teach for America and TeachNOLA. These teachers receive relatively little formal training and often commit to teaching for no more than two years, which has resulted in sharp drops in the percentages of teachers who are certified and have more than a few years of experi-ence.51 There is widespread concern even within the pro-reform community that this model may be difficult to sustain and insufficient to take the system to the next level of performance. New Orleans arguably had a teacher pipeline problem before the storm, and it has another teacher pipeline problem now. New Orleans still needs effective teachers who stay in the city and better ways to recruit talent within the region.
Cautions and implications for future policy and actionThe responses by the New Orleans decentralized school systems to problems in special education, enrollment, and discipline are interesting in part because opponents of decentralization have argued that such a system will be either unwilling or unable to solve such problems. The evidence from New Orleans, however, suggests that entities in a decentralized system can, at least under certain circumstances, coordinate and try to correct problems as they arise. This seems especially true when advocates play an important role in pushing for change.
One way to solve problems of coordination and harmful competition is by having the government step in as happened when the RSD and OPSB played critical roles in correcting problems in special education, discipline, and enrollment. Another way to solve such problems is for many small organizations involved in running schools to band together and pool resources. An example is the Eastbank Collaborative of Charter Schools, in which 15 schools across OPSB and RSD are members. The group facilitates bulk/group purchasing to save money.52 Another example is the NOLA Human Capital Collaborative, which consists of some of the largest charter manage-ment organizations in New Orleans. The goal of the network is to coordinate human resource and personnel management activities, including marketing strategies to attract personnel to the city’s public schools.
The human capital problem, however, is also an example of a problem where such informal collaborations may come up short. We ar-gue that problems, such as the teacher pipeline, will be easier to solve in a decentralized system like New Orleans under the following conditions:53
The dismissal of 8,500 OPSB employees had a
large impact on the city’s black middle class.
In 2004–05, 71 percent of teachers in New
Orleans were African American. By 2014, this
figured had dropped to 49 percent. This drop
is equivalent to about 4 percent of the entire
African American working age population.50

D A T A C E N T E R R E S E A R C H . O R G1 2 | August 2015
* Limited need for coordination. When individual organizations can solve problems largely on their own, there is little benefit to having a centralized government intervene. This is not the case with the teacher pipeline, which is driven by universities and larger labor market forces.
* Limited resource demands. The more resources are required to solve a problem, the more that scale considerations come into play. With the teacher pipeline issue, the problem is not only that preparing, recruiting, and developing teachers is expensive, but that the organizations perhaps best positioned to help—universities—have had their own crises. From 2008 to 2014, Louisi-ana cut funding for higher education (per full-time enrollment) by 48 percent.54
* Common goals and values. The decentralized system can solve problems when charter schools and other school organizations share common goals and define problems in similar ways. But charter schools vary in the types of teachers they are looking for, and often in ways that differ from traditional university-based schools of education.
* Trust. It may be difficult to coordinate without trust. Philosophical differences and lingering racial tensions may make this more difficult.
RecommendationsOur recommendations for the future are based on the successes and failures we see in the data and our analysis of the types of prob-lems decentralization can readily solve.
* Continue to strengthen an accountability system that emphasizes college readiness. The majority of New Orleans schools calibrate their pedagogies, curriculums, and overall educational plans towards college readiness. The overwhelming evidence shows the most abundant job opportunities are those that call for college and advanced degrees. In addition, at the entry level many trades require the same basic math skills as first-year college. Whether professional or vocational, careers in the 21st cen-tury require the type of curriculum that is presented in the Louisiana Core 4, which is the college preparatory track. An account-ability system that expects college entrance should be employed.55
* Following the lead of special education, enrollment, and discipline, develop a new task force to address the teacher prepara-tion problem. There is widespread agreement that teachers are the most important resource in New Orleans schools and it is not clear the current model is sustainable. It is also a problem that will be very difficult for any individual organization to solve. University partners should be able to help produce teachers who have acculturated to the community and are more likely to make a career out of teaching in New Orleans. In addition, the three historically black universities in the area should also be able to assist in the development of teachers who are underrepresented in the schools.
* Monitor and report on the progress of New Orleans’ most vulnerable populations. State and local officials are mandated through a consent decree to monitor the progress of special needs students. While improvements have been made, a focus must be placed on students who fall through the cracks of a decentralized system.
* Create a centralized data collection mechanism and improve data sharing. Community groups and the media ask legitimate questions that cannot be easily answered within the current decentralized system. Data should also be more widely shared for objective, third party evaluation.
* System leaders should conduct and report results from more regular audits of data collection regarding high-stakes outcomes. Schools are under intense pressure to raise test scores and graduation rates. Regular audits and spot checks, and public report-ing of the findings, would help ensure the integrity of the results.
* Require schools and charter management organizations to improve openness to participation in school board meetings. One of the greatest threats to the long-term success of the school system is the perception that there is little opportunity for the family and community to express their concerns and have a say in decision-making. RSD and OPSB should encourage family participa-tion in board meetings and school planning.
* Work to build relationships and trust by holding regular meetings between system leaders, institutions of higher education, and community groups. We believe there is more room for agreement than the current debates suggest and that more regular meetings would help identify problems, potential solutions, and collaborations. These meetings should be organized by a third party to help mediate disputes and guide conversations.

D A T A C E N T E R R E S E A R C H . O R G1 3 | August 2015
Endnotes 1. US Census, 2000; LDE, 2004-05 Orleans Parish District Accountability Report Card.
2. Thevenot, B. (2004, April 20). New Probe of N.O. Schools is Launched, The Times-Picayune.
3. Burns, P. & Matthews. T. (2009). Teaching in the storm’s wake: Post-Katrina public education reform in New Orleans. Retrieved from http://www.researchgate.net/publication/228124440_Teaching_in_the_Storm%27s_Wake_Post-Katrina_Public_Education_Reform_in_New_Orleans.
4. Chang, C. (2010). Ellenese Brooks-Simms gets sentence reduced as reward for helping prosecutors. The Times-Picayune. Retrieved from http://www.nola.com/crime/index.ssf/2010/03/ellenese_brooks-simms_got_sent.html.
5. Nabonne, R. (1997, September 10). Firm Faces Scrutiny as Board Members Fume, The Times-Picayune; Vishnav, A. (1999, May 18). School Board Feels Somewhat Moved Over, The Times-Picayune; Thevenot, B. (2009, August 23). Final Antics of School Board Laid Bare, The Times-Picayune.
6. Boston Consulting Group. (2007). The state of public education in New Orleans. Retrieved from https://www.bcg.com/documents/file15048.pdf.
7. Office of Legislative Auditor. (2004). Legislative auditor state of Louisiana: Orleans parish school board. Retrieved from http://www.lla.state.la.us/PublicReports.nsf/86256EA9004C005986256F4A0054AB01/$FILE/03101962.PDF.
8. Boston Consulting Group. (2007). The state of public education in New Orleans. Retrieved from https://www.bcg.com/documents/file15048.pdf.
9. Louisiana Board of Regents.
10. Louisiana Department of Education. (2015). Student Enrollment and Demographics. Retrieved from http://www.louisianabelieves.com/docs/default-source/katrina/final-louisana-believes-v5-enrollment-demographics22f9e85b8c9b66d6b292ff0000215f92.pdf?sfvrsn=2.
11. Ibid.
12. Harris, D.N., Valant, J. & Gross, B. (2015). The New Orleans OneApp. Education Next.
13. Associated Press (2015). Fired New Orleans school workers go to U.S. Supreme Court. Retrieved from http://www.nola.com/education/index.ssf/2015/03/fired_new_orleans_school_worke.html.
14. Jewson, M. (2015, April 15). Two city charter schools engaging with teachers unions for bargaining, The Lens. Retrieved from http://thelensnola.org/2015/04/13/some-city-charter-schools-engaging-with-teachers-unions/.
15. Sims, P. & Rossmeier, V. (2015). The State of Public Education in New Orleans. 10 Years After Hurricane Katrina. Tulane University Cowen Institute. Retrieved from http://www.speno2015.com/images/SPENO.2015.small.pdf.
16. Louisiana Department of Education. (2015). Student Enrollment and Demographics. Retrieved from http://www.louisianabelieves.com/docs/default-source/katrina/final-louisana-believes-v5-enrollment-demographics22f9e85b8c9b66d6b292ff0000215f92.pdf?sfvrsn=2.
17. Harris, D. & Larsen, M. (forthcoming). The Effects of the New Orleans School Reforms on Student Achievement. New Orleans, LA: Tulane University, Education Research Alliance for New Orleans.
18. Davidson, J. (2014). You’ll Never Guess the City Where Private School Is Most Common. Money. Retrieved from http://time.com/money/3105112/private-school-enroll-ment-cities-highest/.
19. New Orleans Tribune (2015). Why we must say “No!” to renewing the school millage. Retrieved from http://www.theneworleanstribune.com/main/why-we-must-say-no-to-renewing-the-school-millage/.
20. Felton, E. (2015). Louisiana charter school CEO racks up thousands in questionable charges to school’s credit card. Hechinger Report. Retrieved from http://hechinger-report.org/louisiana-charter-school-ceo-racks-up-thousands-in-questionable-charges-to-schools-credit-card/.
21. Grimm, A. (2015). Ira Thomas pleads guilty to taking bribe from Orleans school board contractor, The Times-Picayune. Retrieved from http://www.nola.com/crime/index.ssf/2015/05/ira_thomas_pleads_guilty_to_ta.html.
22. Vargas, R.A. (2010). Langston Hughes Academy’s former business manager admits to stealing $660,000. The Times-Picayune. Retrieved from http://www.nola.com/crime/index.ssf/2010/02/langston_hughes_academys_forme.html
23. Williams, J. (2012). Audit: Lusher employee embezzled $25,000 from school. The Lens. Retrieved from http://thelensnola.org/2012/12/19/audit-lusher-employee-em-bezzled-25000-from-school/
24. Williams, J. (2013). Former employee charged with stealing $31,000 from military academy, The Lens. Retrieved from http://thelensnola.org/2013/12/03/former-em-ployee-charged-with-stealing-31000-from-new-orleans-military-and-maritime-academy/.
25. Louisiana Department of Education. (2015). Academic outcomes. Retrieved from http://www.louisianabelieves.com/docs/default-source/katrina/final-louisana-be-lieves-v5-academic-outcomes.pdf?sfvrsn=2.
26. Ibid.
27. Ibid.
28. Alliance for Excellent Education. (2009). Understanding high school graduation rates in the United States. Retrieved from http://www.getreallearning.com/Under-standing_Drop_out_rate.pdf.
29. Louisiana Department of Education. (2014). School performance score. Retrieved from http://www.louisianabelieves.com/accountability/school-performance-scores.
30. Louisiana Department of Education. (2015). High school performance. Retrieved from http://www.louisianabelieves.com/docs/default-source/katrina/final-louisa-na-believes-v5-high-school-performance.pdf?sfvrsn=2.
31. Ibid.

D A T A C E N T E R R E S E A R C H . O R G1 4 | August 2015
32. Pew Research Center. (2014, February 11). The Rising Cost of Not Going to College. Retrieved from http://www.pewsocialtrends.org/2014/02/11/the-rising-cost-of-not-going-to-college/.
33. Govan, R. H., Perry, A.M., & Vaughan, D. (in print). The State of Black education: Ten years after the storm of reform. In E. McConduit-Diggs (Ed.), The State of Black New Orleans: 10 years post-Katrina. New Orleans: Urban League of Greater New Orleans.
34. Ibid.
35. Harris, D.N. (2015). Good News for New Orleans, Education Next.
36. Harris, D. & Larsen, M. (forthcoming). The Effects of the New Orleans School Reforms on Student Achievement. New Orleans, LA: Tulane University, Education Research Alliance for New Orleans.
37. This discussion is based on: Buerger, C. & Harris, D. (2015). How Can Decentralized Systems Solve System-Level Problems? An Analysis of Market-Driven New Orleans School Reforms. American Behavioral Scientist 59(10) 1246–1262.
38. Plyer, A., Shrinath, N. & Mack, V. (2014, July 31). The New Orleans Index at Ten: Measuring Greater New Orleans’ Progress toward Prosperity. Retrieved from http://www.datacenterresearch.org/reports_analysis/new-orleans-index-at-ten/.
39. Barrett, N. & Santillano, R. (2015). Student Discipline: Outcomes, Policies, and Practices. Presentation at The Urban Education Future? Lessons from New Orleans 10 Years After Hurricane Katrina. June 18-20, 2015, New Orleans, LA.
40. Louisiana Department of Education Recovery School District. (2015). Release: RSD sees 39 percent decrease in expulsions for 2014-15. Retrieved from http://rsdla.net/apps/news/show_news.jsp?REC_ID=342306&id=0.
41. Louisiana Department of Education. (2015). Manual for Disciplinary Procedures. Retrieved from http://www.louisianabelieves.com/docs/default-source/ka-trina/2014-0807-sho-manual.pdf?sfvrsn=2. Orleans Parish School Board, School Code of Conduct. Retrieved from http://opsb.us/wp-content/uploads/2012/10/2014-2015-OPSB-Student-Code-of-Conduct.pdf.
42. Ibid.
43. New Orleans Parents’ Guide. http://neworleansparentsguide.org/.
44. For a more detailed discussion, see: Harris, D. Valant, J., & Gross, B. (2015). The New Orleans OneApp, Education Next.
45. Louisiana Department of Education Recovery School District. (2015). EnrollNola:Annual Report: February 2015. Retrieved from http://lrsd.entest.org/EnrollNOLA%20Annual%20Report%20_2%2011%2015_.pdf.
46. Harris, D.N. & Larsen, M. (2015). What Schools Do Families Want? Tulane University, Education Research Alliance for New Orleans.
47. Harris, D. Valant, J., & Gross, B. (2015). The New Orleans OneApp, Education Next.
48. Aaronson, D., Barrow, L., & Sander, W. (2007). Teachers and student achievement in the Chicago public high schools. Journal of Labor Economics, 25 (1). Retrieved from http://faculty.smu.edu/millimet/classes/eco7321/papers/aaronson%20et%20al.pdf; Goldhaber, D., Brewer, D. & Anderson, D. (1999) A three-way error components analysis of educational productivity. Education Economics, 7(3), 199-208.; Rivkin, S., Hanushek, E., & Kain, J. (2005). Teachers, schools, and academic achievement. Econometrica, 73, (2). 417–58: Chetty, R., Friedman, J. N., & Rockoff, J. E. (2011). The long-term impacts of teachers: Teacher value-added and student outcomes in adulthood (No. w17699). National Bureau of Economic Research; Chetty, R., Friedman, J. N., & Rockoff, J. E. (2013). Measuring the impacts of teachers I: Evaluating bias in teacher value-added estimates (No. w19423). National Bureau of Economic Research.
49. Algiers Charter School Association. History. Retrieved from http://www.algierscharterschools.org/apps/pages/index.jsp?uREC_ID=227671&type=d&pREC_ID=442392 on August 3, 2015.
50. Buerger, C. & Harris, D. (2015). How Can Decentralized Systems Solve System-Level Problems? An Analysis of Market-Driven New Orleans School Reforms. American Behavioral Scientist 59(10) 1246–1262.
51. Barrett, N. & Harris, D. (forthcoming). Significant Changes in the New Orleans Teacher Workforce. New Orleans, LA; Tulane University, Education Research Alliance for New Orleans.
52. Eastbank Collaborative. (2015). About us: Member schools. Eastbank Collaborative of Charter Schools. Retrieved from http://www.eastbankcollaborative.com/abou-tus.html.
53. Barrett, N. & Harris, D. (forthcoming). Significant Changes in the New Orleans Teacher Workforce. New Orleans, LA; Tulane University, Education Research Alliance for New Orleans.
54. Plyer, A., Shrinath, N. & Mack, V. (2014, July 31). The New Orleans Index at Ten: Measuring Greater New Orleans’ Progress toward Prosperity. Retrieved from http://www.datacenterresearch.org/reports_analysis/new-orleans-index-at-ten/.
55. Harris, D.N. (2014). Recommendations to Improve the Louisiana System of Accountability for Teachers, Leaders, Schools, and Districts: Second Report. Retrieved from: https://deutsch29.files.wordpress.com/2015/01/harris_report.pdf.

D A T A C E N T E R R E S E A R C H . O R G1 5 | August 2015
Acknowledgments from the Authors
The authors would like to acknowledge Ann Carpenter, Leslie Jacobs, Kent McGuire, Jeannie Oakes, Sanjiv Rao, Michael Ripski, Jen Roberts, and William Wainwright for their valuable comments on an earlier draft of this essay. Finally, this publication would not have been possible without the contributions of many individuals who have provided us with the most up-to-date information available. For their tireless efforts to collect and make available data we would like to thank the Louisiana Department of Education, as well as Nathan Barrett, Patrick Sims, and Vincent Rossmeir at the Cowen Institute for Public Education Initiatives, and Rashida Govan of the Urban League of Greater New Orleans.
For more InformationAndre Perry
Columnist, The Hechinger Report
Douglas N Harris
Education Research Alliance, Tulane University
Christian Buerger
Education Research Alliance, Tulane University
Vicki Mack
The Data Center

D A T A C E N T E R R E S E A R C H . O R G1 6 | August 2015
About The Data CenterThe Data Center is the most trusted resource for data about greater New Orleans and Southeast Louisiana. Since 1997, The Data Center has been an objective partner in bringing reliable, thoroughly researched data to conversations about building a prosperous, inclusive, and sustainable region.
About The New Orleans Index at Ten CollectionThe New Orleans Index at Ten collection includes contributions from The Data Center, the Brookings Institution, and more than a doz-en local scholars. The aim of this collection is to advance discussion and action among residents and leaders in greater New Orleans and maximize opportunities provided by the 10-year anniversary of Katrina.
The New Orleans Index at Ten: Measuring Greater New Orleans’ Progress toward Prosperity analyzes more than 30 indicators to track the region’s progress on economic, inclusive, and sustainable growth. Essays contributed by leading local scholars and the Brookings Institution systematically document major post-Katrina reforms, and hold up new policy opportunities. Together these reports provide New Orleanians with facts to form a common understanding of our progress and possible future.
The New Orleans Index series, developed in collaboration with the Brookings Institution, and published since shortly after Katrina, has proven to be a widely used and cited publication. The Index’s value as a regularly updated, one-stop shop of metrics made it the go-to resource for national and local media, decisionmakers across all levels of government, and leaders in the private and nonprofit sectors.
Acknowledgments from The Data CenterMany thanks go to Elaine Ortiz for editorial assistance, and Southpaw Creative for design.
The Data Center wishes to thank blue moon fund, Foundation for Louisiana, Greater New Orleans Foundation, JPMorgan Chase Foun-dation, Walton Family Foundation, and Zemurray Foundation for their generous support of The New Orleans Index at Ten. Additional gratitude goes to Baptist Community Ministries, GPOA Foundation, Entergy Corp., Institute for Mental Hygiene, Methodist Health Systems Foundation, RosaMary Foundation, Patrick F. Taylor Foundation, United Way of Southeast Louisiana for their support of the ongoing work of The Data Center.
For More Information
Allison Plyer
Executive Director and Chief Demographer
The Data Center
Nihal Shrinath
Data Manager and Research Associate
The Data Center
DisclaimerThe New Orleans Index at Ten collection represents studies and reports on timely topics worthy of public consideration. The views expressed are those of the authors and should not be attributed to The Data Center, its trustees, or its funders.