
The role of financial factors in the · The role of financial factors in the ... and according to...
21
192 BIS Papers No 19 The role of financial factors in the transmission of monetary policy 1 Laurent Clerc and Christian Pfister, Bank of France 1. Introduction The last two decades have been marked by far-reaching changes in financial markets. The combined effects of financial deregulation and innovation against the backdrop of globalisation and the development of new information and communication technologies may have contributed to strengthening the role of financial factors in the economic cycle and, hence, to an alteration of the channels used for transmitting monetary policy. In addition, the implementation of the single European monetary policy has accelerated the financial integration process in the euro area, in particular on the bond market. Finally, the privatisations, the increasing share of equities in households’ assets and the rise in asset prices in the late 1990s should have contributed to strengthening the role of the wealth effect in the transmission mechanism. The purpose of this paper is to identify the ways in which financial factors may alter the transmission mechanism. In the first part, an example drawn from the “US miracle” in the 1990s highlights these financial factors and the way in which they were able to operate in the United States and contributed to amplifying the business cycle and also, possibly, macro-financial imbalances. In the second part, we focus on the euro area. On the one hand, during the last 20 years, this area has undergone changes in its financial structures that have made it more similar to English-speaking countries. However, wealth effects remain difficult to spot in the euro area. On the other hand, and again in contrast with English-speaking countries, financial intermediation is stronger there. Credit market flaws are also probably more important, enabling a priori the broad credit channel to play a more prominent role in the euro area to the detriment of typical bank lending or interest rate channels. In this case, however, empirical results are mixed. Overall, financial factors thus seem to have more affected the monetary policy transmission mechanism in the United States or even more generally in English-speaking countries than in the euro area. The conclusion of this paper focuses on the role of financial factors, in particular asset prices in the conduct of monetary policy. 2. Transmission channels - role of financial factors 2.1 Identification of the main financial factors We may group the main financial factors at play in the transmission mechanism of monetary policy into two categories: • the first includes asset prices (shares, property); 2 • the second is derived from the existence of an external funding premium and credit constraints; this category is at the origin of the credit cycle. 3 1 The views expressed in this paper are those of the authors and do not necessarily reflect the opinion of the Bank of France. 2 Mishkin (2001). 3 Clerc (2001). It is worth noting that this restrictive definition is used in the ECB’s works on the transmission mechanism in the euro area in order to interpret the expression “financial factors” (see, for example, Angeloni et al (2002)).
Transcript of The role of financial factors in the · The role of financial factors in the ... and according to...
192 BIS Papers No 19
The role of financial factors in the transmission of monetary policy1
Laurent Clerc and Christian Pfister, Bank of France
1. Introduction
The last two decades have been marked by far-reaching changes in financial markets. The combined effects of financial deregulation and innovation against the backdrop of globalisation and the development of new information and communication technologies may have contributed to strengthening the role of financial factors in the economic cycle and, hence, to an alteration of the channels used for transmitting monetary policy. In addition, the implementation of the single European monetary policy has accelerated the financial integration process in the euro area, in particular on the bond market. Finally, the privatisations, the increasing share of equities in households’ assets and the rise in asset prices in the late 1990s should have contributed to strengthening the role of the wealth effect in the transmission mechanism.
The purpose of this paper is to identify the ways in which financial factors may alter the transmission mechanism. In the first part, an example drawn from the “US miracle” in the 1990s highlights these financial factors and the way in which they were able to operate in the United States and contributed to amplifying the business cycle and also, possibly, macro-financial imbalances. In the second part, we focus on the euro area. On the one hand, during the last 20 years, this area has undergone changes in its financial structures that have made it more similar to English-speaking countries. However, wealth effects remain difficult to spot in the euro area. On the other hand, and again in contrast with English-speaking countries, financial intermediation is stronger there. Credit market flaws are also probably more important, enabling a priori the broad credit channel to play a more prominent role in the euro area to the detriment of typical bank lending or interest rate channels. In this case, however, empirical results are mixed. Overall, financial factors thus seem to have more affected the monetary policy transmission mechanism in the United States or even more generally in English-speaking countries than in the euro area. The conclusion of this paper focuses on the role of financial factors, in particular asset prices in the conduct of monetary policy.
2. Transmission channels - role of financial factors
2.1 Identification of the main financial factors
We may group the main financial factors at play in the transmission mechanism of monetary policy into two categories:
• the first includes asset prices (shares, property);2
• the second is derived from the existence of an external funding premium and credit constraints; this category is at the origin of the credit cycle.3
1 The views expressed in this paper are those of the authors and do not necessarily reflect the opinion of the Bank of France. 2 Mishkin (2001). 3 Clerc (2001). It is worth noting that this restrictive definition is used in the ECB’s works on the transmission mechanism in
the euro area in order to interpret the expression “financial factors” (see, for example, Angeloni et al (2002)).
BIS Papers No 19
193
There is furthermore a tight link between these two categories, because of the guarantees required prior to the granting of loans. This issue is dealt with below in the second category.
2.1.1 Asset prices
In the long term, monetary policy is capable of influencing asset prices. More specifically, a credible monetary policy contributes to reducing uncertainty and therefore risk premiums and eventually increases the growth potential and therefore asset prices.4 Nevertheless, when studying transmission mechanisms, it is necessary to focus on the short-term effects of monetary policy on changes in asset prices. These effects are two-pronged: any change in interest rates, especially if it is unanticipated, influences growth expectations and the rates used to discount future income derived from the holding of assets (shares and property). The resulting change in asset prices influences corporates’ and households’ spending behaviour.
Any change in share prices may have an impact on enterprises’ capital through the “Tobin q” factor and on household consumption through the wealth effect. As far as “Tobin’s q”5 is concerned, any increase in share prices following a decrease in interest rates leads to an increase in the value of capital installed compared to new capital (thus increasing the “Tobin q” factor) and stimulates capital expenditure by enterprises. Turning to the wealth effect, and according to the life cycle theory,6 households smooth out their consumption level according to their current income, but also according to their wealth level. An increase in share prices increases households’ wealth and thus prompts them to spend more.7
Just as an increase in share prices stimulates corporate capital investment, an increase in property prices supports construction expenditures, because it becomes more profitable to build a new housing unit than to buy an existing one. In addition, rising property prices boost households’ net assets and therefore also trigger a wealth effect.
2.1.2 External financing premium and credit constraints
Despite the considerable advances made during the last two decades, in particular concerning the availability of accounting and financial information, financial markets still suffer from information imperfections and asymmetries. The recent and growing concern about corporate earnings disclosure and accounting standards is a striking case in point. It illustrates how difficult it is for creditors to assess not only businesses’ financial statements but also the real value of their assets as well as the nature and degree of the risk associated with their capital projects.
The existence of such imperfections accounts for certain patterns documented in a very large number of empirical works, in particular: (i) external funding is more expensive than self-financing, especially when it is not secured; (ii) the gap between the cost of external and internal financing (defined as the external financing premium) decreases with the borrower’s net wealth and increases with the amount of funds borrowed; (iii) an adverse shock impacting the borrower’s net wealth increases the cost of external financing, restricts the borrower’s access to finance, and may lead the borrower to reduce his capital expenditure and payroll expenses as well as the level of his output. When businesses face an overall shock affecting their net wealth or balance sheet (in which case, reference is made to the balance sheet channel), then the financial accelerator mechanism is triggered and amplifies the initial shock.8
4 ECB (2002). 5 Tobin (1969). 6 Modigliani (1971). 7 It should, however, be noted that according to Lettau and Ludvigson (2001), despite the importance and persistence of
shocks to households’ net wealth (such shocks being incidentally attributable to share price fluctuations), the consumption of households only depends on the components of their wealth and income. Under these conditions, there would be no room for a wealth effect in the monetary policy transmission mechanism.
8 Hubbard (1994).
194 BIS Papers No 19
2.1.2.1 External financing premium
The external financing premium stems from several factors. First, a company that seeks external funding instead of relying on self-financing incurs not only transaction costs but also the implicit cost of finding and drafting a loan agreement. Second, debt agreements permit creditors to exert control over the borrowing company. The problem of verification costs addressed by Townsend (1979), where the lender has to pay a fixed audit fee to assess the rate of return generated by the borrower, is one of the reasons why unsecured external financing can prove more expensive than internal financing.
The cost of external financing depends, inter alia, on monetary policy. The impacts of monetary policy are both direct - the financing premium is the sum of a riskless interest rate, ie the policy rate, and a company-specific risk factor - and indirect, insofar as a rate hike reduces the value of a company’s collateral or its net wealth. In particular, an unexpected tightening of policy lowers the company’s future revenue flows and raises the discount rate used to compute the present value of those flows. Further, higher interest rates exacerbate the financial constraints on the weakest companies, and hence their likelihood of default, which pushes up the financing premium.
The financing premium can be gauged by observing the difference between the high-yield bond rate - ie corporate bonds with below investment grade rating (BBB-rated) - and the corresponding rate for the highest-quality firms (AAA-rated). That difference is referred to here as the “credit spread”.
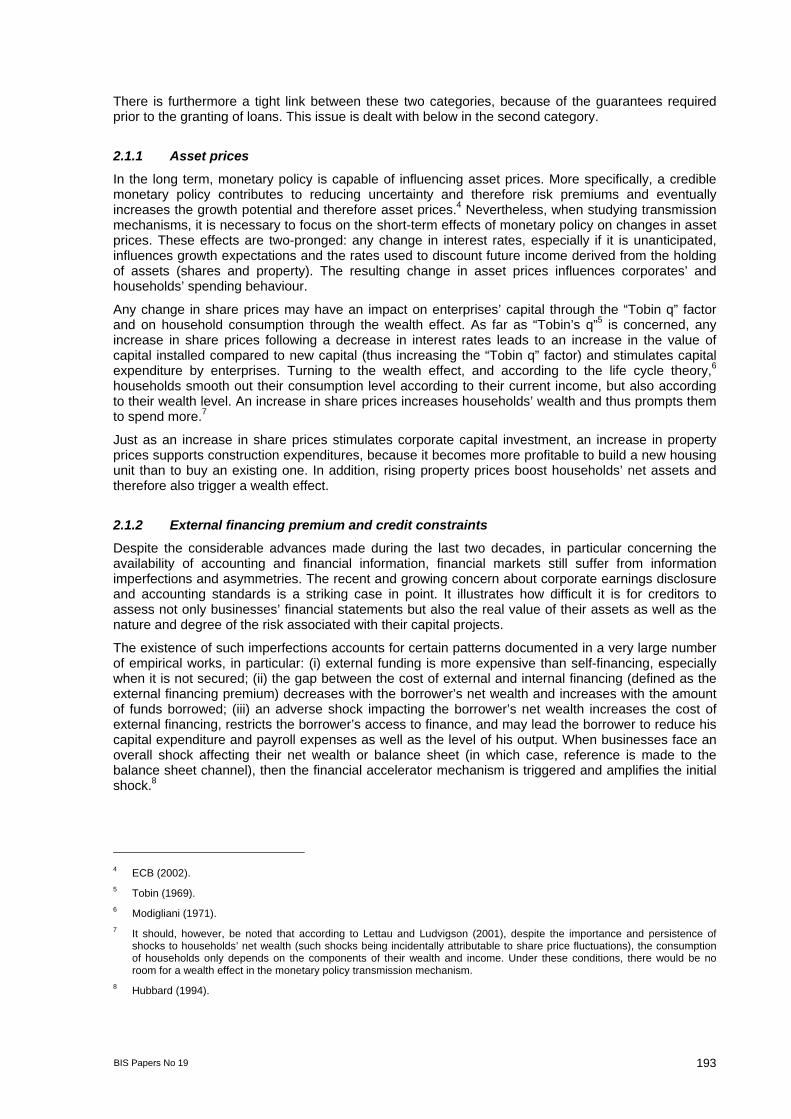
Graph 1 shows the relationship between the interest rate and the external financing premium, as proxied by credit spreads, in the euro area. The interest rate used here is the three-month interbank rate (the German rate as representative of the euro area until 1999 and Euribor thereafter).
Graph 1
Credit spreads and the interest rate In basis points and percentages
0
50
100
150
200
250
1994:01 1995:01 1996:01 1997:01 1998:01 1999:01 2000:01 2001:01 2002:012.53.03.54.04.55.05.56.06.5
Morgan Stanley (lhs) Merrill Lynch (lhs) Three-month interest rate (rhs)
During the period under review, interest rates seem to be closely correlated with credit spreads. However, that correlation weakens towards the end of the period, because the trend towards tighter spreads, which seems to coincide with monetary easing in early 2001, went into reverse in the aftermath of 11 September 2001. Financing conditions then improved before deteriorating once again on the uncertainties caused by stock market turmoil in early 2002.
2.1.2.2 Financing constraints
Financing constraints arise because lenders cannot force borrowers to repay their debt since such debt is not secured. Lenders reduce accordingly the amount of the funds they intend to provide, thus creating a form of credit squeeze.

BIS Papers No 19
195
In addition, if an enterprise’s human capital cannot be separated from the physical capital,9 then the value of a capital expenditure project may exceed its recovery value in the event of default. In such an event, management may threaten to terminate the agreement by withdrawing the human capital. The lenders, who are thus aware that contracts may be renegotiated ex post, will limit their loans to the discounted values of collateral. This mechanism is central to the recent models of the credit cycle’s general balance.10 This mechanism also introduces a specific interaction between asset prices and credit constraints, because the borrower’s credit caps are determined by the price of the assets used as collateral and more generally by the borrower’s general wealth. However, at the same time, as shown by Kiyotaki and Moore (1997), asset prices are also influenced by the level of credit constraints. This interaction constitutes a powerful transmission mechanism through which shock effects persist and are amplified and propagated.
2.2 Illustration based on an interpretation of the “US miracle”
The phase of strong and protracted growth observed in the United States during the second half of the 1990s may provide a particularly impressive example of the main theoretical mechanisms introduced above. While this episode stems from technological advances and the resulting productivity gains, it is likely that financial factors have largely contributed to the unusual scope and duration of this activity cycle.
2.2.1 Financial factors have probably contributed to amplifying the productivity shock and making it more persistent
Progress made in the new ITC sector and its swift spread to most industries led to a sharp acceleration in the US economy’s productivity gains from the mid-1990s (Table 1).
The subsequent improvement in the US economic outlook and the possible increase of its growth potential then contributed to a sharp rise in the price of financial assets, first in the new technology sectors and thereafter in nearly all industries.
Table 1
US real wages, productivity and wage costs Annual averages, in percentages
Hourly wages Productivity Unit wage costs
1983-92 4.1 3.0 1.0 1993-2002 3.7 3.7 0.1 1993 2.8 1.9 0.8 1994 2.8 3.0 −0.2 1995 2.1 3.9 −1.7 1996 1.3 3.5 −2.1 1997 1.9 4.2 −2.2 1998 5.4 5.4 0.0 1999 4.0 4.6 −0.5 2000 6.5 6.7 −0.2 2001 6.9 1.6 5.3 20021 3.6 2.0 1.6 1 Forecasts. Source: IMF.
9 Hart and Moore (1994). 10 Kiyotaki and Moore (1997); Bernanke et al (1999).
196 BIS Papers No 19
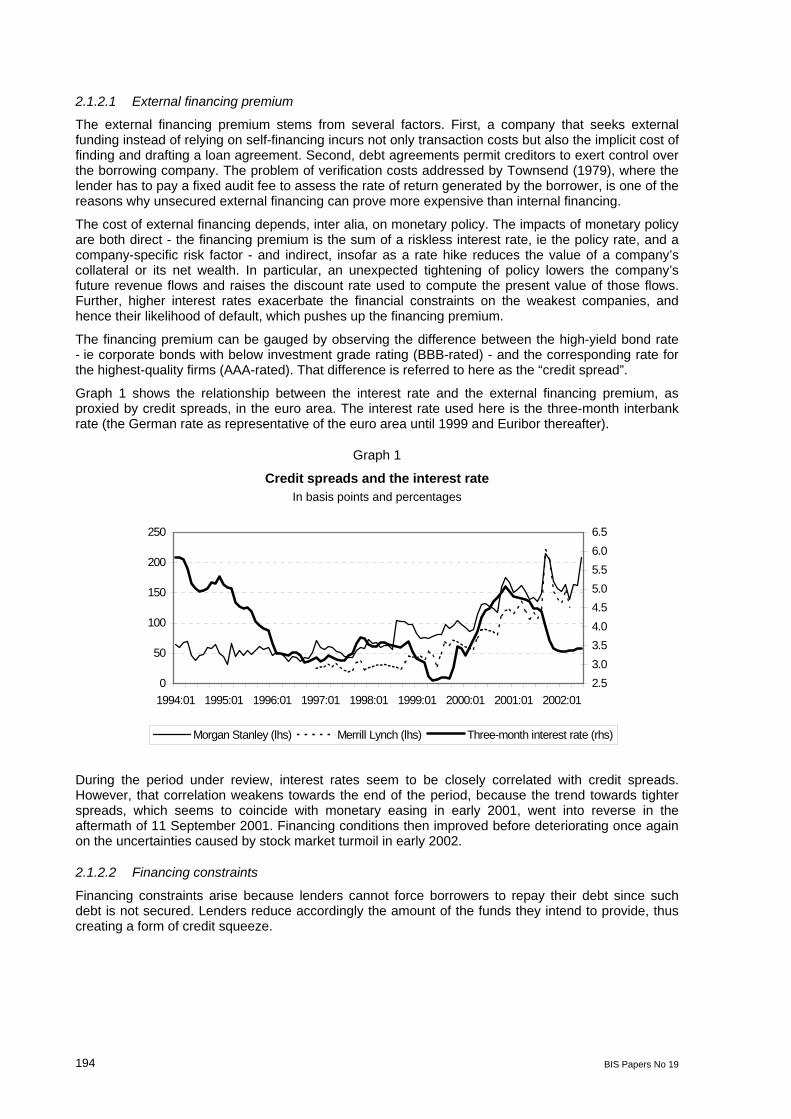
Graph 2 Graph 3
US stock market indices S&P 500’s p/e ratio
0
1,000
2,000
3,000
4,000
Jan
85
Jan
87
Jan
89
Jan
91
Jan
93
Jan
95
Jan
97
Jan
99
Jan
01
S&P 500 Nasdaq 100
0
10
20
30
40
Jan
85
Jan
87
Jan
89
Jan
91
Jan
93
Jan
95
Jan
97
Jan
99
Jan
01
Source: Datastream.
As a case in point, the Nasdaq index rose sharply from the beginning of 1995. The value of this index has increased almost tenfold within five years. Other industries benefited from this rally, in particular with an annual increase of nearly 25% for the S&P 500 index between 1995 and 2000. The S&P 500’s p/e ratio also gained from the euphoria prevailing on financial markets and more than doubled over the same period (Graphs 2 and 3).
This increase in the price of financial assets went along with spontaneous and self-sustained growth in household expenditure and corporate capital expenditure, as well as an increase in household housing investment, contributing to a rise in property prices (Graph 4).
Graph 4
US residential property prices Changes over four quarters, in percentages
0
2
4
6
8
10
12
Feb
85
Feb
86
Feb
87
Feb
88
Feb
89
Feb
90
Feb
91
Feb
92
Feb
93
Feb
94
Feb
95
Feb
96
Feb
97
Feb
98
Feb
99
Feb
00
Feb
01
Source: Datastream.
These rising asset prices may have activated the balance sheet channel through a rise in the value of collateral. Economic agents were thus able to increase their indebtedness, in particular with banks, and accordingly to increase their spending or buy new assets if they expected a sufficiently high return in view of the risk incurred and the financing cost.
From this point of view, the extraordinary resilience shown in 2001 by US household expenditure may be reconciled with the surge in activity on the mortgage refinancing market and the strong increase in residential property prices. Indeed, the leverage resulting from the increase in the value of the
BIS Papers No 19
197
mortgaged collateral and property prices is deemed to have contributed significantly to the rise in household consumption expenditures (ranging from 10 to 25%11).
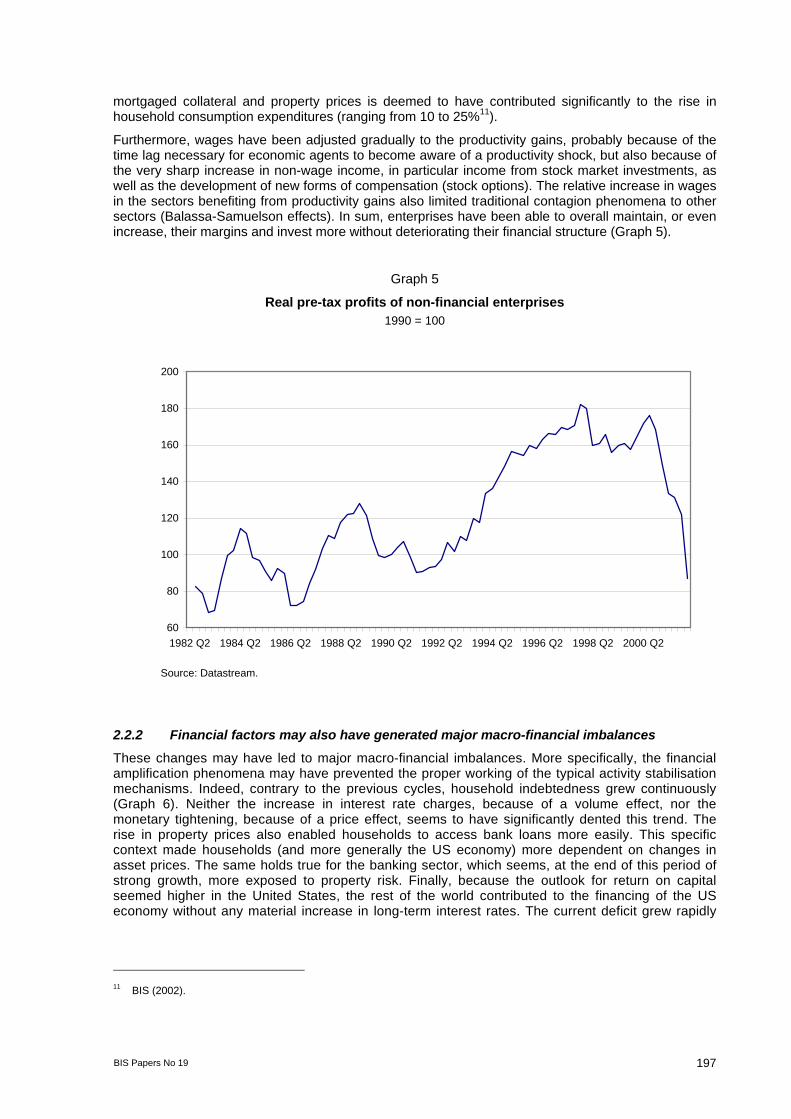
Furthermore, wages have been adjusted gradually to the productivity gains, probably because of the time lag necessary for economic agents to become aware of a productivity shock, but also because of the very sharp increase in non-wage income, in particular income from stock market investments, as well as the development of new forms of compensation (stock options). The relative increase in wages in the sectors benefiting from productivity gains also limited traditional contagion phenomena to other sectors (Balassa-Samuelson effects). In sum, enterprises have been able to overall maintain, or even increase, their margins and invest more without deteriorating their financial structure (Graph 5).
Graph 5
Real pre-tax profits of non-financial enterprises 1990 = 100
60
80
100
120
140
160
180
200
1982 Q2 1984 Q2 1986 Q2 1988 Q2 1990 Q2 1992 Q2 1994 Q2 1996 Q2 1998 Q2 2000 Q2
Source: Datastream.
2.2.2 Financial factors may also have generated major macro-financial imbalances
These changes may have led to major macro-financial imbalances. More specifically, the financial amplification phenomena may have prevented the proper working of the typical activity stabilisation mechanisms. Indeed, contrary to the previous cycles, household indebtedness grew continuously (Graph 6). Neither the increase in interest rate charges, because of a volume effect, nor the monetary tightening, because of a price effect, seems to have significantly dented this trend. The rise in property prices also enabled households to access bank loans more easily. This specific context made households (and more generally the US economy) more dependent on changes in asset prices. The same holds true for the banking sector, which seems, at the end of this period of strong growth, more exposed to property risk. Finally, because the outlook for return on capital seemed higher in the United States, the rest of the world contributed to the financing of the US economy without any material increase in long-term interest rates. The current deficit grew rapidly
11 BIS (2002).

198 BIS Papers No 19
and even reached 5% of gross domestic product (GDP), ie a level that seems hard to sustain in the medium term (Graph 7).
Graph 6 Graph 7
Household debt As a percentage of gross disposable income
Current transactions balance and long-term interest rates
80
85
90
95
100
105
110
Mar
90
Mar
91
Mar
92
Mar
93
Mar
94
Mar
95
Mar
96
Mar
97
Mar
98
Mar
99
Mar
00
Mar
01 -5
-4
-3
-2
-1
0
1993 1994 1995 1996 1997 1998 1999 20003
4
5
6
7
8
Current transactions balance (as a percentage of GDP; lhs)Ten-year interest rate (in %; rhs)
Source: Datastream. Source: OECD.
In terms of monetary policy, such changes raise the issue of the factoring-in of asset prices. On the one hand, the role played by financial factors in the US economy’s recent dynamics seems to show that the main expenditure items (consumption and investment) largely depend on wealth effects. In 2002, an increase in the saving rate following a reduction in the household debt level or a decrease in asset prices would most certainly weigh on the recovery process. On the other hand, households’ high indebtedness does not seem to be lastingly sustainable, except if the outlook for return on capital remains favourable, which is not likely.
In terms of financial stability, the major role played by property loans has probably heightened the banking sector’s vulnerability to property risk. The same holds true for the large refinancing agencies such as Fannie Mae and Freddie Mac, which are major players on the US secondary mortgage market. While there are multiple risk-hedging opportunities, the information provided by these two agencies in March 2002 concerning their counterparties on the derivatives market has shown that the risk diversification level is finally small: only eight counterparties represent nearly 80% of their transactions on the derivatives market.12 Following the phase of strong growth at the end of the 1990s, the macroeconomic and financial balance therefore seems to be highly dependent on changes in property prices.
Furthermore, the increase in US current imbalances creates a risk for the global economy. While we have noted in the past that such imbalances may be brought down nearly spontaneously, most past corrections involved a very substantial depreciation of foreign exchange rates.
12 BIS (2002).
BIS Papers No 19
199
3. What about the euro area?
3.1 Asset prices and wealth effects
Several factors have made the financial structures of the euro area more similar to those of the United States, or more generally those of the G7 English-speaking countries (United States, Canada, United Kingdom): financial liberalisation, households’ share ownership, the new economy and changes specific to the financial sector. However, empirical studies do not always clearly show wealth effects in the euro area, for reasons that shall be discussed when reviewing each of these factors.
3.1.1 Financial liberalisation
One of the expected effects of the financial liberalisation implemented in OECD countries since the end of the 1970s has been to facilitate access to home ownership and credit by facilitating use of assets held, such assets being themselves valued at a higher price. Wealth effects may thus spread easily. However, a recent OECD study13 covering the G7 countries other than Germany did not show that financial liberalisation in continental Europe (France, Italy) had any effect before the beginning of the 1990s. In addition, the strongest impact on the relationship between consumption and households’ wealth (taken as a whole or by component: financial, property or otherwise) relates to the long term, while no marked effect is observed on dynamic relationships.
Accordingly, this impact would have consisted in a weakening of the liquidity constraints, leading to an increase in the consumption level, but not in an effect on consumers’ short-term behaviour reflecting a wealth effect. As shown by the authors, such results may, however, stem from the fact that, in France and in Italy, financial liberalisation occurred later and more gradually than in English-speaking countries.
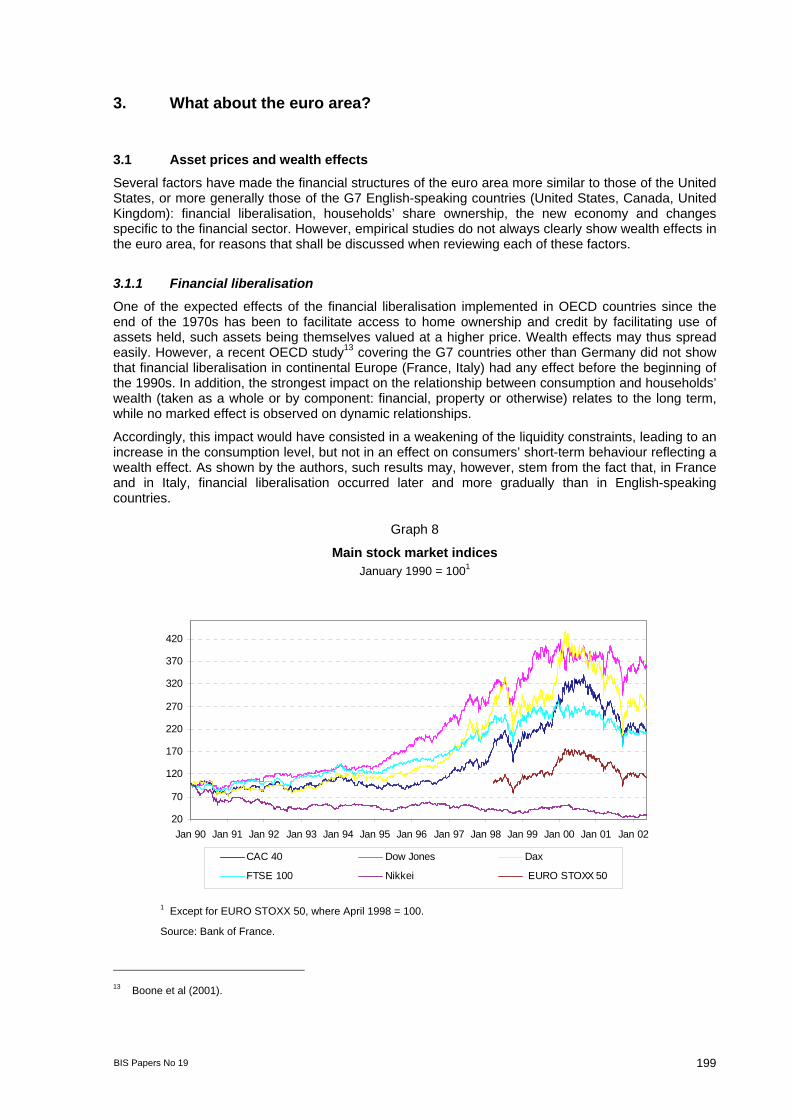
Graph 8
Main stock market indices January 1990 = 1001
20
70
120
170
220
270
320
370
420
Jan 90 Jan 91 Jan 92 Jan 93 Jan 94 Jan 95 Jan 96 Jan 97 Jan 98 Jan 99 Jan 00 Jan 01 Jan 02
CAC 40 Dow Jones Dax
FTSE 100 Nikkei EURO STOXX 50
1 Except for EURO STOXX 50, where April 1998 = 100.
Source: Bank of France.
13 Boone et al (2001).
200 BIS Papers No 19
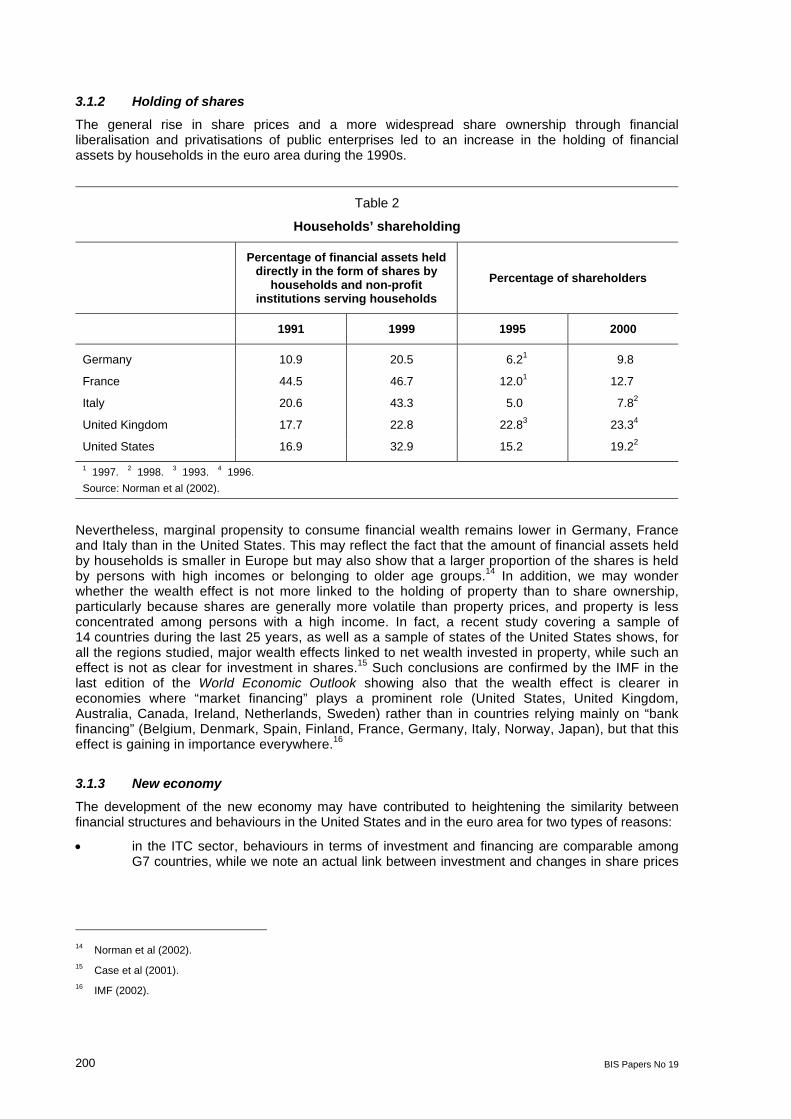
3.1.2 Holding of shares
The general rise in share prices and a more widespread share ownership through financial liberalisation and privatisations of public enterprises led to an increase in the holding of financial assets by households in the euro area during the 1990s.
Table 2
Households’ shareholding
Percentage of financial assets held
directly in the form of shares by households and non-profit
institutions serving households Percentage of shareholders
1991 1999 1995 2000
Germany 10.9 20.5 6.21 9.8
France 44.5 46.7 12.01 12.7
Italy 20.6 43.3 5.0 7.82
United Kingdom 17.7 22.8 22.83 23.34
United States 16.9 32.9 15.2 19.22
1 1997. 2 1998. 3 1993. 4 1996. Source: Norman et al (2002).
Nevertheless, marginal propensity to consume financial wealth remains lower in Germany, France and Italy than in the United States. This may reflect the fact that the amount of financial assets held by households is smaller in Europe but may also show that a larger proportion of the shares is held by persons with high incomes or belonging to older age groups.14 In addition, we may wonder whether the wealth effect is not more linked to the holding of property than to share ownership, particularly because shares are generally more volatile than property prices, and property is less concentrated among persons with a high income. In fact, a recent study covering a sample of 14 countries during the last 25 years, as well as a sample of states of the United States shows, for all the regions studied, major wealth effects linked to net wealth invested in property, while such an effect is not as clear for investment in shares.15 Such conclusions are confirmed by the IMF in the last edition of the World Economic Outlook showing also that the wealth effect is clearer in economies where “market financing” plays a prominent role (United States, United Kingdom, Australia, Canada, Ireland, Netherlands, Sweden) rather than in countries relying mainly on “bank financing” (Belgium, Denmark, Spain, Finland, France, Germany, Italy, Norway, Japan), but that this effect is gaining in importance everywhere.16
3.1.3 New economy
The development of the new economy may have contributed to heightening the similarity between financial structures and behaviours in the United States and in the euro area for two types of reasons:
• in the ITC sector, behaviours in terms of investment and financing are comparable among G7 countries, while we note an actual link between investment and changes in share prices
14 Norman et al (2002). 15 Case et al (2001). 16 IMF (2002).
BIS Papers No 19
201
in the other sectors (showing a “Tobin q” factor is at work) existing in English-speaking countries but not in continental European countries;17
• the impact of changes in the prices of the ITC shares in terms of wealth effect is comparable in continental Europe and in English-speaking countries, while, for securities from other sectors, this impact is weaker in continental Europe.18
However, it seems difficult to draw conclusions from these observations because of the features of “new economy” firms, in particular the fact that return on investment is highly unpredictable, inducing specific financial behaviour,19 and because the stock market capitalisations of ITC securities are highly different from across countries (in March 2001, 8% of GDP in Germany, 18% in the Netherlands and 24% in France, versus 33% in the United States and 35% in the United Kingdom, according to Edison and Sløk (2001a)).
3.1.4 Financial sector
Finally, the euro area’s financial sector has in recent years undergone a number of structural changes that have brought it closer to its US counterpart. The most obvious of these changes is the introduction of the single currency, which blurred the distinctions between national markets and even unified the money market altogether. Other material changes are related to the development of competition, linked to the changeover to the single currency but also to the creation of the single market, and to the use of securitisation, which is increasing albeit at a slow pace. Finally, through information and communication technologies, which are broadly used by the financial sector, the new economy also impacted the operation of the financial sector in the euro area as well as in other major industrial countries. However, it is likely that most of these changes tended to strengthen the interest rate channel through swifter and broader propagation of changes in interest rates, rather than increase the role of financial factors in the mechanism serving to transmit monetary policy.
3.2 Information asymmetries, liquidity constraints and external financing premium
The need to assess the transmission mechanism of the single monetary policy according to a harmonised methodology led to a major research project steered by the Eurosystem as part of a network (called Eurosystem Monetary Transmission Network or MTN). The first results were published in the form of ECB papers. These results are used as a benchmark in order to characterise the role of financial factors in Europe. Before analysing this project, we would like to show how the recent changes and facts summarised in the first part may in theory modify the way in which major macroeconomic data react to a monetary policy shock.
3.2.1 A theoretical illustration based on a financial accelerator model
Two of the main features of the last economic cycle observed in most developed countries are: first, its degree of persistence, because the sole growth phase, which started in the middle of the 1990s, has been generally close to that of a “normal” activity cycle; and second, the amplitude of this cycle, with recorded growth rates that lastingly exceeded these economies’ potential growth rates. While an explanation based on technological factors has been submitted in the case of the United States, it is difficult to document a material impact of new technologies on economic activity in other economies, in particular the euro area, which suggests that other factors are at play.
At the same time, it is interesting to note that most of the work focusing on the monetary policy transmission mechanism runs into two major difficulties: first, the weak elasticity of productive investment and household consumption in response to interest rate changes, as shown by econometric estimates; and second, the relative inability of theoretical approaches to take into account the degree of shock amplification and persistence, in particular monetary policy. In fact, a recent trend
17 Edison and Sløk (2001b). 18 Edison and Sløk (2001a). 19 Direction Générale des Études et des Relations Internationales (2002).
202 BIS Papers No 19
in economic literature consists in integrating the credit market flaws into “real cycle” models and manages to a certain extent to overcome these difficulties. We are therefore tempted to regard financial factors as the possible sources of amplification and persistence phenomena relating to the multiple shocks that may have affected the recent dynamics of developed economies.
Bernanke, Gertler and Gilchrist’s work (1999) is in line with this school of thought. The main assumption used by the authors is that imperfections do exist on credit markets, in the form of information asymmetries and problems linked to contract performance. Such imperfections may lead to agency costs that are liable to create a gap between the cost of self-financing and that of external financing (external financing premium).
From a theoretical point of view, this model integrates certain features that are essential to the way in which a monetary policy stimulus is transmitted to the economy. This model includes a reference to monopolistic competition, in which prices are determined in accordance with the terms first suggested by Calvo (1983) and serving to integrate nominal rigidities. In addition, we are using this model in a version including real rigidities in the form of an adjustment cost to the capital stock and a lag between the decision to invest and the actual commissioning of productive investment.
Within this model, it is possible to distinguish two channels for the transmission of monetary policy:
• The interest rate channel. This channel affects those components of demand that are sensitive to the real interest rate: the first includes household consumption through substitution effects between different time periods; then productive investment, because a change in central banks’ interest rates affects the cost of capital. In addition, a change in interest rates also generates wealth effects, in particular by changing the discount rate used by economic agents in order to assess their current wealth. A cut in official interest rates increases for instance the discounted value of collateral, thus reducing the external financing premium and enabling economic agents to fund additional consumption or investment. Finally, official interest rates directly affect the cost of capital, thus weighing on enterprises’ investment decisions.
• The broad credit channel relies on the existence of an external financing premium in response to present flaws on the credit market. This channel also includes elements linked to the wealth effect. Any factor contributing to a change in economic agents’ net wealth alters this external financing premium and leads to a change in the spending level. In the absence of aggregated data on the euro area, the leverage effect is calibrated on the basis of French data (see Chatelain and Teurlai (2000)). Taking into account the model’s structure, this effect only influences corporate capital expenditure and entrepreneurs’ consumption. As regards entrepreneurs’ consumption, the model is calibrated so that one additional euro in economic agents’ net wealth only increases consumption up to €0.024.20
It is, however, necessary to mention that the model used is subject to two significant limitations:
• The interest rate channel does not trigger any income effect for households. Taking into effect the fact that this effect has a perverse impact in the euro area, because households are net creditors, the interest rate channel is probably overvalued in the model.
• In addition, the model relates to a closed economy. This assumption is not negligible, because, despite a low degree of openness comparable to that of the United States, the euro area has nevertheless seemed to be sensitive to outside changes. Therefore, the transmission mechanism as modelled here does not include the potentially powerful foreign exchange channel.
Such a model provides the following responses to an unanticipated monetary policy shock.21
The existence of real and nominal rigidities leads to a one- or two-period lag between the occurrence of the monetary policy shock and the time when production and prices are affected respectively. However, for these two variables, the maximum impact is reached as early as the second period,
20 Such an effect is significantly lower than that shown in econometric estimates made in the United States, where the wealth
effect generally ranges between 3 and 5½%. 21 This shock is equal to one standard deviation, which corresponds to an interest rate shock equal to 20 basis points.

BIS Papers No 19
203
which seems very fast, especially as concerns prices. This effect then dwindles while variables return to their long-term equilibrium level, thus reflecting monetary policy’s neutral nature.
The financial accelerator mechanism has two essential implications. The first implication is the amplification of monetary policy’s impact on production and prices, if we compare these two variables’ response in an environment where only the interest rate channel is effective (Graph 9). Also, if we use solely the interest rate channel, the second implication is that this shock is made more persistent, especially as regards production.
Graph 9
Production and price effects of a non-anticipated monetary policy shock Production
-0.25
-0.2
-0.15
-0.1
-0.05
0
0.05
1 2 3 4 5 6 7 8 9 10 11 12 13 14 15
Quarters
Interest rate channel Financial acceleratorPrices
-0.08
-0.07
-0.06
-0.05
-0.04
-0.03
-0.02
-0.01
0
0.01
1 2 3 4 5 6 7 8 9 10 11 12 13 14 15Quarters
3.2.2 While there is a role for financial factors, it is more difficult to quantify
We are seeking to assess the role of financial factors by comparing three approaches: the use of vector autoregression (VAR) models, the relationship between credit spreads and economic activity, and lessons drawn from the MTN project.
3.2.2.1 What VAR models teach us
Since the seminal works conducted by Sims,22 most of the research focusing on monetary policy transmission mechanisms has relied on a VAR methodology. We use the same type of approach here by considering the responses obtained on the basis of two VAR representations of the euro area.
The first representation relies on the contribution of Garcia and Verdelhan (2001). This is a structural VAR model based on abridged quarterly data relating to the euro area. The endogenous variable vector (Y) includes the annual growth of GDP in the euro area and the series showing primary differences in terms of annual inflation, three-month interest rates and budget balance. In this model, structural shocks are identified by using the methodology developed by Galí (1992) making it possible to distinguish between short- and long-term constraints. The assumptions used are as follows: only the supply side shock has a long-term impact on the GDP level; a monetary shock has no instantaneous effect on GDP; and the budgetary shock does not instantaneously affect inflation or interest rates. Despite the limitations inherent in such an exercise, such as the presence of structural disruptions, this model is estimated over the 1970-2000 period. Confidence intervals are built by bootstrapping. The results are shown in the left-hand panels of Graph 10.
The second VAR presentation makes use of the results obtained by Peersman and Smets (2001), on which the MTN project incidentally relies. The endogenous variable vector is significantly different,
22 Sims (1972, 1980).

204 BIS Papers No 19
because it includes, in addition to real GDP, the consumer price index, the standard short-term interest rate and the real effective foreign exchange rate.
Graph 10
Responses to a one-off unanticipated monetary policy shock in the euro area’s VAR models
Production
-0.25-0.20-0.15-0.10-0.050.000.050.100.150.20
0 3 6 9 12 15 18 21 24 27 30 33 36 39
Quarters
Production
-0.25-0.20-0.15-0.10-0.050.000.050.100.15
0 1 2 3 4 5 6 7 8 9 10 11 12 13 14 15
Quarters
Prices
-0.35
-0.30
-0.25
-0.20
-0.15
-0.10
-0.05
0.00
0.05
0 3 6 9 12 15 18 21 24 27 30 33 36 39
Quarters
Prices
-0.20
-0.15
-0.10
-0.05
0.00
0.05
0 1 2 3 4 5 6 7 8 9 10 11 12 13 14 15
Quarters
Interest rates
-0.20
-0.10
0.00
0.10
0.20
0.30
0.40
0.50
0.60
0.70
1 4 7 10 13 16 19 22 25 28 31 34 37 40
Quarters
Interest rates
-0.30
-0.20
-0.10
0.00
0.10
0.20
0.30
0.40
0 1 2 3 4 5 6 7 8 9 10 11 12 13 14 15
Quarters
Sources: Left-hand panels, Bank of France, based on Garcia and Verdelhan (2001); right-hand panels, Peersman and Smets (2001).
BIS Papers No 19
205
Structural shocks are analysed through a Choleski decomposition, the variables being ordered as specified above. As an implied identification constraint, this leads to the conclusion that a monetary policy shock does not have any instantaneous impact on activity or on prices, but may affect the real effective foreign exchange rate. This model is estimated on the basis of quarterly data for the 1980-98 period. Here also, the only supply side shock is supposed to have a real impact on the GDP level, reflecting the assumption that monetary policy is neutral. The results of the simulations are shown in the right-hand panels of Graph 10.
Differences in specifications, samples and specification constraints prevent a direct comparison of simulations. It is, however, possible to analyse the way in which production and prices respond to an unanticipated monetary policy shock and to compare such a response to that provided by the theoretical model (see Graph 9).
We first note that, in the two simulations, production responds in the same way to an unanticipated monetary policy shock. The shock’s impact seems to be greatest after two quarters, the GDP returning thereafter to its equilibrium level. Subsequently, the response of the first VAR induces a specific GDP adjustment based on the constraint of monetary policy vis-à-vis long-term activity. In terms of profile, this response recalls that of the sole interest rate channel identified by the theoretical model. Moreover, the second VAR shows the monetary shock’s long-term impact on activity and, in fact, the profile of the activity response is totally comparable to the pattern suggesting the presence of financial effects within the euro area.
In terms of prices, the response provided by these alternative approaches is very different: while the theoretical model, with or without financial accelerator, suggests, like the first VAR, that prices return to their equilibrium level, the second VAR shows a remnant effect of monetary policy on prices. It is difficult to come to a final conclusion concerning the information provided by these various results as to the monetary policy transmission mechanisms at work in the euro area. Indeed, responses given by the theoretical model, as well as by the first VAR, suggest that prices respond very quickly. However, we would a priori expect a more gradual impact of the monetary policy impulse, the maximum impact being generally reached after four to five years in macroeconomic models.23 In addition, most of research work shows that prices gradually return to their equilibrium level. Because simulations are shown for 15 quarters only, the results shown by Peersman and Smets do not make it possible to judge whether the situation subsequently returns to normal.
In sum, the forecasts made in respect of the theoretical model do not seem atypical, in particular because such a model includes the financial factors. We may therefore not totally dismiss the presence of financial effects in the euro area, however, without proving it finally.
3.2.2.2 Analysis of the relationship between credit spreads and economic activity
Credit spreads provide an approximate measure of the external financing premia paid by corporates. Experience has shown that when monetary policy is tightened, the cost of external financing increases more than proportionally to the rise in interest rates. This reflects, inter alia, the greater likelihood of default. Accordingly, there may be a mechanism - materialised by a chain of causation between wider credit spreads and future levels of activity and inflation - that amplifies the business cycle. To verify this assumption, we adopted two approaches in succession: computing cross correlations and performing Granger causality tests. We then observed the results obtained with small VAR models.
Cross-correlation calculations
We computed cross correlations between credit spreads, lagged by several periods, and economic growth indicators. For the indicators, we used the year-on-year change in industrial production (based on monthly data) and aggregate GDP growth in the euro area (quarterly data). The results are shown in Graphs 11 and 12.
23 Van Els et al (2001).
206 BIS Papers No 19
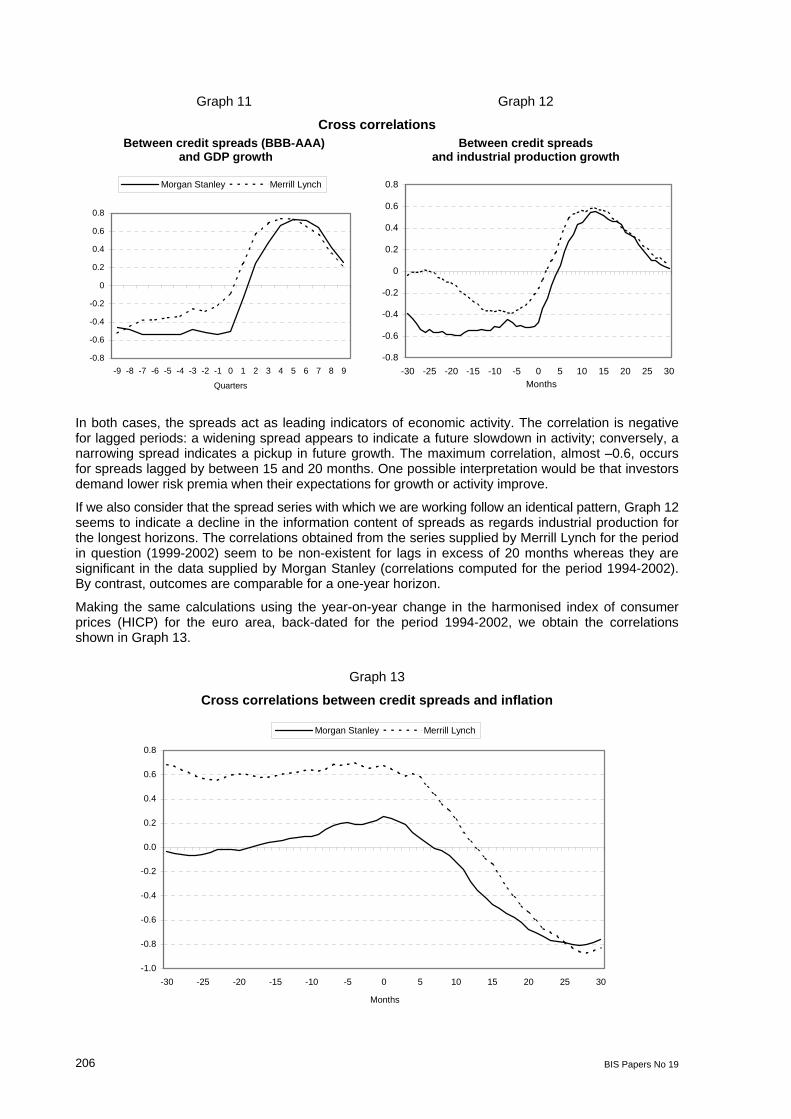
Graph 11 Graph 12
Cross correlations Between credit spreads (BBB-AAA)
and GDP growth Between credit spreads
and industrial production growth
-0.8
-0.6
-0.4
-0.2
0
0.2
0.4
0.6
0.8
-9 -8 -7 -6 -5 -4 -3 -2 -1 0 1 2 3 4 5 6 7 8 9
Quarters
Morgan Stanley Merrill Lynch
-0.8
-0.6
-0.4
-0.2
0
0.2
0.4
0.6
0.8
-30 -25 -20 -15 -10 -5 0 5 10 15 20 25 30Months
In both cases, the spreads act as leading indicators of economic activity. The correlation is negative for lagged periods: a widening spread appears to indicate a future slowdown in activity; conversely, a narrowing spread indicates a pickup in future growth. The maximum correlation, almost –0.6, occurs for spreads lagged by between 15 and 20 months. One possible interpretation would be that investors demand lower risk premia when their expectations for growth or activity improve.
If we also consider that the spread series with which we are working follow an identical pattern, Graph 12 seems to indicate a decline in the information content of spreads as regards industrial production for the longest horizons. The correlations obtained from the series supplied by Merrill Lynch for the period in question (1999-2002) seem to be non-existent for lags in excess of 20 months whereas they are significant in the data supplied by Morgan Stanley (correlations computed for the period 1994-2002). By contrast, outcomes are comparable for a one-year horizon.
Making the same calculations using the year-on-year change in the harmonised index of consumer prices (HICP) for the euro area, back-dated for the period 1994-2002, we obtain the correlations shown in Graph 13.
Graph 13
Cross correlations between credit spreads and inflation
-1.0
-0.8
-0.6
-0.4
-0.2
0.0
0.2
0.4
0.6
0.8
-30 -25 -20 -15 -10 -5 0 5 10 15 20 25 30
Months
Morgan Stanley Merrill Lynch

BIS Papers No 19
207
Here, the correlations are positive for lagged periods (Merrill Lynch spreads) and negative for leading periods beyond a horizon of approximately one year (Morgan Stanley and Merrill Lynch). In addition, the correlations seem to strengthen over the recent period. The correlation coefficient is near zero if we look at the spread derived from Morgan Stanley data but is significantly positive (0.6) for correlations computed over a more recent period (Merrill Lynch spread). This means that credit spreads are also leading indicators of inflation. One explanation for these correlations is as follows: in periods of accelerating inflation, or when an inflationary surge is expected, economic agents demand higher risk premia for investing in corporate bonds.
Granger causality tests
Tables 3 and 4 show the results of Granger causality tests24 between credit spreads and several indicative variables of economic activity (year-on-year changes and output gaps for industrial production (IPI) and euro area GDP), as well as inflation. The number of lags has been chosen on the basis of different information criteria (AIC, Schwartz and Hannan-Quinn) or likelihood ratio tests. Where the results of these tests differ, we generally choose the most parsimonious model because of the small number of data.
We have also presented the results obtained for very small lags (two and four quarters for GDP, two and four months for the IPI and the HICP). A low probability, ie less than 1%, 5% or 10%, indicates that we reject the assumption that variable x does not cause variable y at thresholds of 1%, 5% or 10%. In other words, we accept the causality of x for y.
Table 3
Granger causality tests on credit spreads (Morgan Stanley)
Lags x does not cause the credit spread Prob Lags The credit spread
does not cause x Prob
2 quarters YoY GDP growth 0.01*** 2 quarters YoY GDP growth 0.73
2 quarters Output gap (GDP) 0.02** 2 quarters Output gap (GDP) 0.52
4 quarters Output gap (GDP) 0.02** 4 quarters Output gap (GDP) 0.83
10 months Output gap (IPI) 0.07* 10 months Output gap (IPI) 0.99
10 months YoY change in IPI 0.01*** 10 months YoY change in IPI 0.51
2 months YoY change in HICP 0.01*** 2 months YoY change in HICP 0.56
4 months YoY change in HICP 0.03** 4 months YoY change in HICP 0.22
10 months YoY change in HICP 0.01*** 10 months YoY change in HICP 0.02**
Note: *** Causality of x for y is accepted at the threshold of 99%; ** 95%; * 90%. YoY = Year-on-year.
These tests confirm our earlier results, although the picture is less clear-cut. First, we note substantial differences depending on which spread is used. This is mainly due to the fact that the tests were conducted over a different period, owing to the availability of data (1994-2002 for the Morgan Stanley series, 1999-2002 for Merrill Lynch).
Second, we observe that the results are highly sensitive to the number of lags, which reflects the weakness of the causality, in the sense of Granger, highlighted by the tests. In particular, Table 3 seems to establish that a spread is primarily a reflection of current or past economic conditions rather than a leading indicator of activity. However, since the two series of spreads follow comparable patterns from 1999 onwards, Table 4 shows that the causal direction tends to reverse sharply over the recent period and that the information content of the spreads has tended to increase since that date as
24 A variable x Granger-causes a variable y if, when used to explain the dynamic of y, it makes y easier to forecast or, in other
words, if the coefficients of the past values of x are statistically significant in explaining y.
208 BIS Papers No 19
regards both inflation and, to a lesser degree, activity. Although these results are not robust, they are nonetheless consistent with the financial accelerator hypothesis and seem to confirm that a broad credit channel does exist in the euro area.
Table 4
Granger causality tests on credit spreads (Merrill Lynch)
Lags x does not cause the credit spread Prob Lags The credit spread
does not cause x Prob
2 quarters YoY GDP growth 0.45 2 quarters YoY GDP growth 0.93
2 quarters Output gap (GDP) 0.11 2 quarters Output gap (GDP) 0.24
4 quarters Output gap (GDP) 0.34 4 quarters Output gap (GDP) 0.42
4 quarters YoY GDP growth 0.96 4 quarters YoY GDP growth 0.54
10 months Output gap (IPI) 0.09* 10 months Output gap (IPI) 0.77
12 months YoY change in IPI 0.62 12 months YoY change in IPI 0.04**
4 months YoY change in HICP 0.84 4 months YoY change in HICP 0.09*
10 months YoY change in HICP 0.05** 10 months YoY change in HICP 0.06*
Note: *** Causality of x for y is accepted at the threshold of 99%; ** 95%; * 90%. YoY = Year-on-year.
Significance of a financial accelerator effect - results of a VAR model
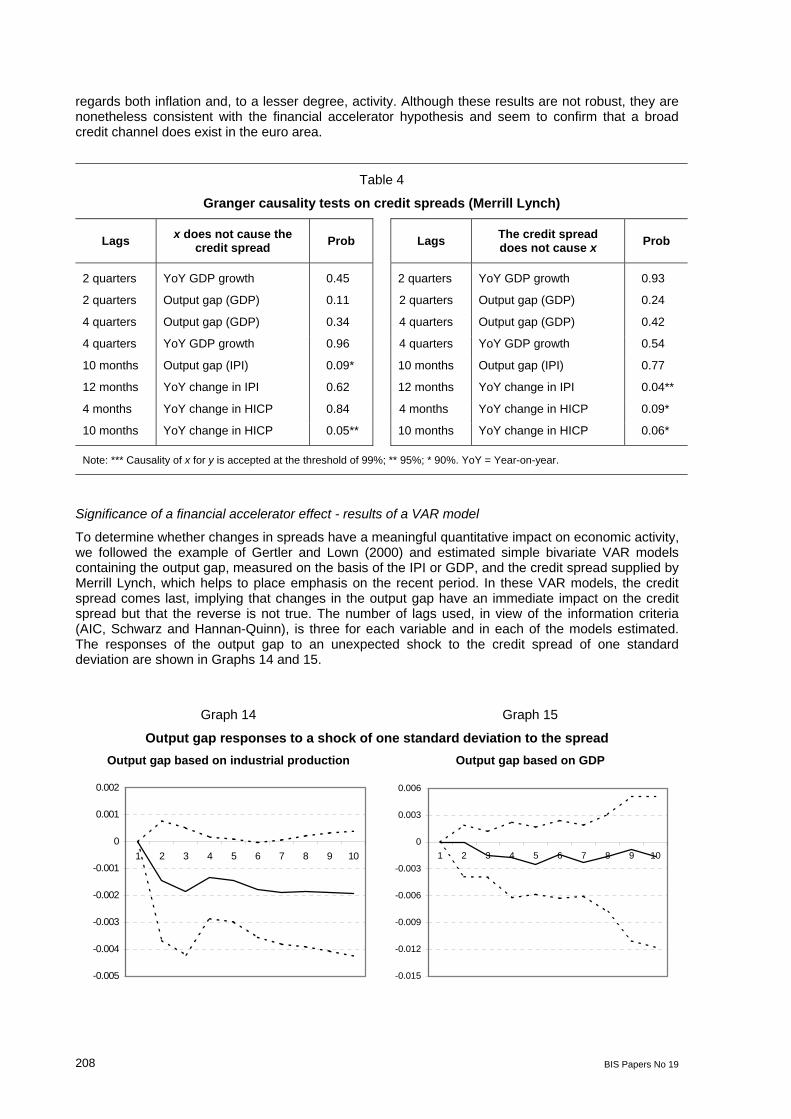
To determine whether changes in spreads have a meaningful quantitative impact on economic activity, we followed the example of Gertler and Lown (2000) and estimated simple bivariate VAR models containing the output gap, measured on the basis of the IPI or GDP, and the credit spread supplied by Merrill Lynch, which helps to place emphasis on the recent period. In these VAR models, the credit spread comes last, implying that changes in the output gap have an immediate impact on the credit spread but that the reverse is not true. The number of lags used, in view of the information criteria (AIC, Schwarz and Hannan-Quinn), is three for each variable and in each of the models estimated. The responses of the output gap to an unexpected shock to the credit spread of one standard deviation are shown in Graphs 14 and 15.
Graph 14 Graph 15
Output gap responses to a shock of one standard deviation to the spread Output gap based on industrial production Output gap based on GDP
-0.005
-0.004
-0.003
-0.002
-0.001
0
0.001
0.002
1 2 3 4 5 6 7 8 9 10
-0.015
-0.012
-0.009
-0.006
-0.003
0
0.003
0.006
1 2 3 4 5 6 7 8 9 10

BIS Papers No 19
209
A financial shock, reflected by a widening of credit spreads, would indeed have a recessionary impact on activity, consistent with occurrences of financial acceleration. In the case of the euro area, the impact would be long-lasting but only very weakly significant (Graph 14) or insignificant (Graph 15).
In sum, it would seem that credit spreads provide a good approximation of external financing premia in the euro area. They can also act as leading indicators of activity, consistent with the presence of a broad credit channel. However, the results are precarious, because only a small number of observations is available and because the data do not cover a full business cycle. Further, the period under review is characterised by bouts of financial instability, which lead to a rise in market risk premia and a greater likelihood of business failures. This may explain why spreads have tended to widen continually in the EMU area since the late 1990s.
3.2.2.3 Other empirical results on the transmission mechanism in the euro area
The results of the major research work conducted under the aegis of the Eurosystem as part of the MTN project lead to a similar conclusion after relying on a very broad range of alternative approaches: simulations of macroeconomic models, VAR models, work on individual data relating to enterprises and credit institutions.
This work shows that the interest rate channel is important in most countries of the euro area and that it practically represents the sole monetary transmission mechanism in many countries of the euro area. However, financial factors, even though they are difficult to characterise, seem to play a non-negligible role in most economies of the area, such as Germany, Italy or even France.
Table 5
Monetary policy transmission channels in the euro area
Dismissal of the assumption that the interest rate channel is predominant
Non-dismissal of the assumption that the interest rate channel is predominant Results obtained
on individual data concerning banks
Data insufficient to conclude that financial factors play a role
Financial factors’ role in consumption and investment
Financial factors’ role in consumption but not in investment
Financial factors’ role in investment but not in consumption
No role for financial factors
Supply of credit sensitive to official interest rates
Netherlands Portugal
Greece France? Germany Italy
France?
Inelastic credit supply Austria Finland
Spain
Non-conclusive results Ireland Belgium Luxembourg
Source: Angeloni et al (2002).
It is of course too early to know specifically the monetary transmission mechanism in the euro area. The results shown above also seem to prove that banks play a smaller than expected role in the transmission mechanism.
4. Conclusion
The fact that financial factors tend to play a growing role in the configuration and amplitude of economic cycles has many implications for central banks.
In terms of monetary policy, this first raises the issue of the possible factoring-in of asset prices in the definition and conduct of monetary policy. However, such factoring-in must be made bearing in mind the primary objective of central banks, which is to ensure the stability of the price of flows. Insofar as
210 BIS Papers No 19
financial factors influence activity cycles, and therefore the prices of flows, their trends must be carefully analysed, and full use must be made of leading inflation indicators. This does not require a change in central bank behaviour.
The same is probably not true as far as financial stability is concerned. Indeed, recent macroeconomic changes show that the growing weight of financial factors in the economy’s dynamics may also have a destabilising effect. If final demand overly depends on changes in asset prices or the granting of financings, the central bank may be tempted to focus excessively on financial factors when conducting its monetary policy. However, this type of behaviour would lead to a possibly dangerous asymmetrical reaction from the central bank, because it would create a moral hazard for economic agents.25 In addition, the use of a single instrument - the interest rate - in order to pursue two objectives might lead to a conflict between these objectives. The current situation (contained inflation) shows how difficult it would be for central banks to justify, for instance, a significant interest rate increase in order to ensure financial stability in the absence of price pressures. In addition, a second difficulty may arise from the fact that financial stability considerations may be rooted in the very near term, while price stability is defined as a medium-term objective. Accordingly, we may envisage resorting to a second instrument specifically focused on the financial stability objective.
Many avenues may be explored in this respect. If we restrict ourselves to the changes in monetary policy transmission channels highlighted in this article, a particularly significant amplification factor seems to be linked to the highly procyclical nature of bank credit. This element is in particular due to cyclical changes in the value of collateralised assets, which are, where applicable, strengthened by the procyclical nature of certain prudential ratios. Accordingly, we might envisage creating instruments more specifically intended to correct this bias. One of the approaches currently explored and already applied in certain European countries, such as Spain, consists in setting up proactive provisions, where banks set aside during a growth phase the provisions that are to be used during a downturn. By evening out bank earnings throughout the cycle, this mechanism reduces cyclical fluctuations associated with changes in the balance sheet of financial intermediaries and the sometimes destabilising effects due to too sharp an increase in loans granted to the economy.26
More generally, some issues are still pending concerning the adequate measurement of risk and the way to hedge against such risk and prevent information imperfections and asymmetries on financial markets. These reflections therefore clearly depend on those studies conducted on economic information and market transparency.
References
Angeloni, I, A Kashyap, B Mojon and D Terlizzese (2002): “Monetary transmission in the euro area: where do we stand?”, ECB Working Paper, no 114, January.
Bank for International Settlements (2002): Fannie, Freddie, and the economic cycle, mimeo, May.
Bernanke, B S, M Gertler and S Gilchrist (1999): “The financial accelerator in a quantitative business cycle framework”, in J B Taylor and M Woodford (eds), The handbook of macroeconomics, vol 1, Chapter 21, Elsevier, Amsterdam, pp 1341-93.
Boone, L, N Girouard and I Wanner (2001): “Financial market liberalisation, wealth and consumption”, mimeo, Economics Department Working Papers, no 308, Organisation for Economic Co-operation and Development, 20 September.
Calvo, G A (1983): “Staggered prices in a utility maximizing framework”, Journal of Monetary Economics, vol 12, September, pp 383-98.
25 Trichet (2002). 26 Caruana (2002).
BIS Papers No 19
211
Caruana, J (2002): “Banking provisions and asset price bubbles”, mimeo, presented at the conference “Asset price bubbles - implications for monetary, regulatory and international policies”, organised by the Reserve Federal Bank of Chicago on 22-24 April, Chicago, Illinois, United States.
Case, K E, J M Quigley and R J Shiller (2001): “Comparing wealth effects: the stock market versus the housing market”, NBER Working Paper, no 8606, November.
Chatelain, J B and J C Teurlai (2000): “Investment and the cost of external finance: an empirical investigation according to the size of firms and their use of leasing”, mimeo, Banque de France, November.
Clerc, L (2001): “Le cycle du crédit, une revue de la littérature: intermédiation, prime de financement externe et politique monétaire” (The credit cycle, a literature review: intermediation, financing premiums and monetary policy), Bulletin de la Banque de France, no 94, October, pp 43-61.
Direction Générale des Études et des Relations Internationales (2002): “Le financement des entreprises de la nouvelle économie” (The financing of new economy businesses), Bulletin de la Banque de France, no 97, January, pp 43-61.
Edison, H and T Sløk (2001a): “Wealth effects and the new economy”, IMF Working Paper, no 77, June.
——— (2001b): “New economy stock valuations and investment in the 1990s”, IMF Working Paper, no 78, June.
European Central Bank (2002): “Le marché des actions et la politique monétaire” (The share market and monetary policy), Bulletin mensuel de la BCE, February, pp 39-54.
Galí, J (1992): “How well does the IS-LM model fit postwar US data?”, Quarterly Journal of Economics, vol 57, no 2, May, pp 709-38.
Garcia, S and A Verdelhan (2001): “Le policy-mix de la zone euro - une évaluation de l’impact des chocs monétaires et budgétaires” (Policy mix in the euro area - an evaluation of the impact of monetary and budgetary shocks), Économie et prévision, no 2, June, pp 23-40.
Gertler, M and C S Lown (2000): “The information in the high yield bond spread for the business cycle: evidence and some implications”, NBER Working Paper, no 7549, February.
Hart, O and J Moore (1994): “Default and renegotiation: a dynamic model of debt”, mimeo, Harvard University.
Hubbard, G (1994): “Is there a credit channel for monetary policy”, NBER Working Paper, no 4977, December.
International Monetary Fund (2002): World Economic Outlook, May.
Kiyotaki, N and J Moore (1997): “Credit cycle”, Journal of Political Economy, vol 105, no 2, April, pp 211-48.
Lettau, M and S Ludvigson (2001): “Understanding trend and cycle in asset values: bulls, bears and the wealth effect on consumption”, CEPR Discussion Paper, no 3104, December.
Mishkin, F S (2001): “The transmission mechanism and the role of asset prices in monetary policy”, NBER Working Paper, no 8617, December.
Modigliani, F (1971): “Monetary policy and consumption”, in Consumer spending and monetary policy: the linkages, Federal Reserve Bank of Boston.
Norman, B, M Sebastia-Barriel and O Weeken (2002): “Equity wealth and consumption - the experience of Germany, France and Italy in an international context”, Bank of England Quarterly Bulletin, spring, pp 78-85.
Peersman, G and F Smets (2001): “The monetary transmission mechanism in the euro area: more evidence from VAR analysis”, ECB Working Paper, no 114, December.
Sims, C (1972): “Money, income and causality”, American Economic Review, vol 62, no 4, September, pp 540-2.
——— (1980): “Comparison of interwar and postwar business cycles”, American Economic Review, vol 70, no 2, May, pp 250-7.

212 BIS Papers No 19
Tobin, J (1969): “A general equilibrium approach to monetary theory”, Journal of Money, Credit, and Banking, no 1, February, pp 15-29.
Townsend, R (1979): “Optimal contracts and competitive markets with costly state verification”, Journal of Economic Theory, vol 21, no 2, October, pp 265-93.
Trichet, J-C (2002): “Asset price bubbles and their implications for monetary policy”, mimeo, presented at the conference “Asset price bubbles - implications for monetary, regulatory and international policies”, organised by the Reserve Federal Bank of Chicago on 22-24 April, Chicago, Illinois, United States.
van Els, P, A Locarno, J Morgan and J P Villetelle (2001): “Monetary policy transmission in the euro area: what do aggregate and national structural models tell us?”, ECB Working Paper, no 94, December.


![[Q] the Role Moderating Factors in Mobile Coupon Adoption](https://static.fdocuments.us/doc/165x107/577cc67c1a28aba7119e5bf8/q-the-role-moderating-factors-in-mobile-coupon-adoption.jpg)