Project title: The role of environmental factors in the ...
53
Project title: The role of environmental factors in the incidence of Pansy mottle syndrome (PaMS) Project number: PO 016 Project leader: Dr Jill England, ADAS Boxworth Report: Final report, April 2015 Key staff: Dr Jill England, Project Leader Dr Dave Skirvin (ADAS), Senior Research Consultant Chloe Whiteside (ADAS), Horticulture Consultant Location of project: Commercial growers Industry Representative: Chris Need, Roundstone Nurseries, Pagham Rd, Lagness, Chichester, W. Sussex PO20 1LL. Fay Richardson, Coletta & Tyson, 324 Hull Rd, Woodmansey, Beverley, E. Yorks HU17 0RU Mike Smith, W.D. Smith & Son, Grange Nurseries, Woodham Rd, Battlesbridge, Essex SS11 7QU Date project commenced: 1 May 2013 Date project completed (or expected completion date): 30 April 2015
Transcript of Project title: The role of environmental factors in the ...

Project title: The role of environmental factors in the
incidence of Pansy mottle syndrome
(PaMS)
Project number: PO 016
Project leader: Dr Jill England, ADAS Boxworth
Report: Final report, April 2015
Key staff: Dr Jill England, Project Leader
Dr Dave Skirvin (ADAS), Senior Research
Consultant
Chloe Whiteside (ADAS), Horticulture
Consultant
Location of project: Commercial growers
Industry Representative: Chris Need, Roundstone Nurseries,
Pagham Rd, Lagness, Chichester, W.
Sussex PO20 1LL.
Fay Richardson, Coletta & Tyson, 324 Hull
Rd, Woodmansey, Beverley, E. Yorks
HU17 0RU
Mike Smith, W.D. Smith & Son, Grange
Nurseries, Woodham Rd, Battlesbridge,
Essex SS11 7QU
Date project commenced: 1 May 2013
Date project completed
(or expected completion date):
30 April 2015
Agriculture and Horticulture Development Board 2015. All rights reserved
AHDB, operating through its HDC division seeks to ensure that the information contained
within this document is accurate at the time of printing. No warranty is given in respect
thereof and, to the maximum extent permitted by law the Agriculture and Horticulture
Development Board accepts no liability for loss, damage or injury howsoever caused
(including that caused by negligence) or suffered directly or indirectly in relation to
information and opinions contained in or omitted from this document.
Copyright, Agriculture and Horticulture Development Board 2015. All rights reserved.
No part of this publication may be reproduced in any material form (including by photocopy
or storage in any medium by electronic means) or any copy or adaptation stored, published
or distributed (by physical, electronic or other means) without the prior permission in writing
of the Agriculture and Horticulture Development Board, other than by reproduction in an
unmodified form for the sole purpose of use as an information resource when the
Agriculture and Horticulture Development Board or HDC is clearly acknowledged as the
source, or in accordance with the provisions of the Copyright, Designs and Patents Act
1988. All rights reserved.
AHDB (logo) is a registered trademark of the Agriculture and Horticulture Development
Board.
HDC is a registered trademark of the Agriculture and Horticulture Development Board, for
use by its HDC division.
All other trademarks, logos and brand names contained in this publication are the
trademarks of their respective holders. No rights are granted without the prior written
permission of the relevant owners.
[The results and conclusions in this report are based on an investigation conducted over a
one-year period. The conditions under which the experiments were carried out and the
results have been reported in detail and with accuracy. However, because of the biological
nature of the work it must be borne in mind that different circumstances and conditions
could produce different results. Therefore, care must be taken with interpretation of the
results, especially if they are used as the basis for commercial product recommendations.]

Agriculture and Horticulture Development Board 2015. All rights reserved
AUTHENTICATION
We declare that this work was done under our supervision according to the procedures
described herein and that the report represents a true and accurate record of the results
obtained.
Dr Jill England
Horticulture Consultant
ADAS
Signature Date 28 April 2015
Dr Dave Skirvin
Senior Environmental Modeller
ADAS
Signature Date 28 April 2015
Chloe Whiteside
Horticulture Consultant
ADAS
Signature Date 28 April 2015
Report authorised by:
Dr Barry Mulholland
Head of Horticulture
ADAS
Signature Date 28 April 2015.

Agriculture and Horticulture Development Board 2015. All rights reserved
CONTENTS
GROWER SUMMARY ............................................................................................... 1
Headline.................................................................................................................. 1
Background ............................................................................................................. 1
Expected deliverables ............................................................................................. 2
Summary of the project and main conclusions ....................................................... 2
Nursery monitoring ................................................................................................. 2
Financial Benefits ................................................................................................... 6
Action Points ........................................................................................................... 6
SCIENCE SECTION .................................................................................................. 8
Introduction ............................................................................................................. 8
Project objectives .................................................................................................. 10
Materials and methods ......................................................................................... 11
Results .................................................................................................................. 19
Discussion ............................................................................................................ 30
Conclusions .......................................................................................................... 31
Knowledge and Technology Transfer ................................................................... 32
References ........................................................................................................... 32
Appendix 1. Controlled environment cabinet trial plan* .................................... 34
Appendix 2. Glasshouse trial plan* ...................................................................... 35
Appendix 3. Grower monitoring template* .......................................................... 36
Appendix 4. Site environmental data* .................................................................. 44
*Available upon request – please email Hort.Funding.ac.uk

1
Agriculture and Horticulture Development Board 2015. All rights reserved
GROWER SUMMARY
Headline
High light levels, vapour pressure deficit (VPD) and temperatures are potentially linked to
expression of pansy mottle syndrome (PaMS) symptoms.
Background
Pansy mottle syndrome (PaMS) has been reported (though not understood) since the 1960s,
and is recognised as a measureable or visible change in plant growth and function
(physiological response). Typical symptoms include leaf distortion, mottling, leaf bleaching,
stunting and apical blindness (Figure 1). The extent of PaMS may vary from year to year on
nurseries; bedding plant species including Antirrhinum, Gerbera, marigold, Petunia, Primula,
stocks, sweet pea and Verbena can display similar symptoms. Determination of the cause is
complicated by the transient and intermittent nature of plant response, difficulty in replicating
the symptoms and linking the cause with effect (McPherson, 2010). The condition has
become more common in recent years, and this has renewed interest in identifying the
causal factors.
Figure 1. PaMS symptoms recorded site A, batch 1, 2013.
Grower observation suggests that PaMS may be varietal, with incidence occurring in specific
seed batches and colours. Outbreaks have also been linked to environmental factors,
occurring under humid conditions including warm, wet and windy weather when glasshouse
vents are shut, causing humidity to increase within the glasshouse. Plug size (greater risk of
PaMS in the larger module tested), growing media, and the plant hormone methyl-salicylate
(associated with plant stress) also appear to promote the incidence of PaMS. Symptoms do
not appear to be directly increased by fungicide, adjuvant or plant growth regulator
application, the light or irrigation regimes tested, virus (tests proved negative), low irrigation

2
Agriculture and Horticulture Development Board 2015. All rights reserved
or boron/calcium (levels confirmed adequate by plant tissue analysis) (McPherson, 2010).
Although not a direct cause, pesticides, plant growth regulators or adjuvants may be
involved in the development of PaMS by contributing to plant stress. PaMS does not
generally appear to spread between plants (McPherson, 2010). Other research has linked
growth distortion with boron deficiency under high relative humidity conditions (100%); these
conditions decrease water loss via transpiration, resulting in reduced boron uptake and
movement from the roots to the shoot (Krug et al, 2013). The precise trigger however for the
expression of PaMS symptoms remains unknown. As symptoms have proven difficult to
replicate both on grower holdings and in research facilities, the approach taken for this study
was to collect production and environmental data from nurseries during commercial pansy
production for modelling together with symptom expression to identify trigger point(s) of
PaMS.
Expected deliverables
To investigate the role of selected environmental factors on the incidence of PaMS, and
identify any causal relationships between the incidence of PaMS and environment through,
a) monitoring the nursery environment (humidity, temperature, light) and root development
within commercial bedding plant production systems and b) controlled environment cabinet
experiments.
Summary of the project and main conclusions
Nursery monitoring
Data was collected from four commercial nurseries (sites A-D) located in Hertfordshire, East
Yorkshire, West Sussex and Essex respectively between June and September 2014. The
sites were selected to include sites with a sustained record of PaMS, and one site where
PaMS does not generally occur. These sites were also selected because they grow pansies
from seed, so the production process from sowing to marketing could be monitored.
Four batches of pansy were monitored at sites A, three at site B, and two batches at sites C
and D. Each batch was monitored using a Tinytag Plus 2 data logger (temperature and
humidity), a Watchdog 1000 series microstation data logger with an external LightScout
Quantum Light 3 Sensor PAR probe (temperature, humidity and light) and a WaterScout
SM100 soil moisture sensor (connected to the Watchdog 1000 data logger). Data loggers
were set to record data every 15 minutes. Data loggers were pole mounted within the crop
at canopy height so they recorded the environmental conditions the plants experienced. The

3
Agriculture and Horticulture Development Board 2015. All rights reserved
light sensor was positioned above the crop (Figure 2). Two different production systems
were in use on the nurseries taking part in the monitoring: coir ‘teabags’ in clear green
plastic trays and peat based growing medium in packs. Due to the shape of the coir
‘teabags’, sensors were placed horizontally through the coir, whilst in the peat based system
the sensors were place vertically into the growing media (Figure 3).
Figure 2. Positioning of data loggers and light sensor within a batch of pansies: a) LightScout Quantum Light 3 Sensor PAR probe; b) Tinytag Plus 2 data logger (temperature and humidity); c) Watchdog 1000 series data logger housed within a radiation shield for protection against solar radiation and water damage
Soil moisture sensors
Figure 3. Positioning of SM100 Soil Moisture Sensor within a coir system, inserted horizontally (image left); and in a peat based system inserted vertically (image right) production systems
In 2013, although there was low occurrence of PaMS symptoms in the monitored batches
across the four sites, a potential association was tentatively muted between environmental
factors and the occurrence of PaMS symptoms. This association was derived from the
observation that the VPD, temperature and PAR received by the plants in site A, batch 1
were higher than for the other batches at the same site and also for batches at other sites. It
a c b

4
Agriculture and Horticulture Development Board 2015. All rights reserved
was suggested that light levels could be a factor, in combination with high VPD and
temperature that may lead to symptom development. However the sample size of one
precluded any robust statistical analysis of the environmental data.
There were no significant occurrences of PaMS in the monitored batches in 2014, and
consultation with the wider bedding plant sector similarly indicated few cases of PaMS within
the industry. Data analysis showed that high VPD did occur in all batches on a number of
occasions however, daily light integral (DLI) was generally lower across all batches,
including when VPD was higher than 4 kPa. DLI was generally lower in 2014 (Figure 12)
than 2013 (Figure 13). At site A in 2013, there was a sustained period (~20–50 days from
sowing) when DLI was between 100-150 mol/m2/day. In 2014, DLI generally peaked below
100 mol/m2/day, but with a number of peaks above 150 mol/m2/day) and sparser peaks
above 150 mol/m2/day, across the four batches. DLI was calculated per sampling period,
based on a 24 hr day.
Nursery experience suggests that the absence or reduction of root hairs (water roots), as
occurs when plants are grown under continually wet growing media conditions, may
contribute to triggering PaMS. Root zone issues may impose additional stress on plants
either because water is present within the root zone but plants are unable to take up water or
nutrients because of the lack of root hairs, or there is no water present.
Recording of growing media moisture data was improved in 2014 through the use of soil
moisture sensors, which provided more consistency in the data collected and indicated that
none of the batches became critically dry during the monitoring period. Linking this
information with the root assessments, where root hair development was good in all of the
assessed batches provides an indication that roots were not critically under- nor over-
watered during production.
If PaMS symptoms are associated with stress due to high water requirements under high
light and temperature conditions, including for photosynthesis, then we would expect the
stress to have been lower in 2014 due to the lower light levels. Lower light levels – along
with less extreme temperatures and high VPD events – recorded in the nursery monitoring in
2014 would also help to explain the reduced incidence of PaMS across the industry.

5
Agriculture and Horticulture Development Board 2015. All rights reserved
Vapour pressure deficit describes the drying effect of air; high VPD occurs under high
temperature, low humidity conditions, where high VPD is greater than 2.0 kPa (dry air) and
low VPD is less than 0.2 kPa (humid air). Most plants grow well in the middle of this range
(0.5 kPa to 0.95 kPa), with pansies performing well around 0.6-0.7 kPa. To put high VPD
into context, VPD greater than >5.3 kPa is reported in the Sonoran Desert of Southern
California. The data suggested a potential link between high VPD, high temperature and the
development of PaMS symptoms.
Controlled environment work
Seeds of Pansy Matrix Autumn Select were sown (31 March 2014) into 288 trays (24 trays),
using Bulrush growing media, at Bryants Nursery, Hertfordshire. The environment
(temperature, humidity, and light) was monitored using two Tinytag data loggers and two
Watchdog 1000 series data loggers with light sensors. The pansy plugs were transported to
ADAS Boxworth on 14 April (cotyledon stage) where they were grown on in a glasshouse
compartment, maintained between 15 and 25°C. Of the trays of plugs, six from each
irrigation treatment remained in the glasshouse throughout the trial, where the environment
continued to be monitored.
Irrigation treatments
Plants were grown under two irrigation regimes, wet and dry. The intention had been to
provide these two different irrigation treatments (wet and dry) from sowing to encourage
greater root hair development under the dry treatment, and water roots (no root hairs) under
the wet treatment, but this had not been achieved. The pansies were uniform, with a similar
number of root hairs visible on all plants on arrival at ADAS Boxworth, when the two
irrigation regimes were applied, but although the two irrigation treatments at Boxworth did
achieve greater root hair development under the dry regime, water roots were not present on
the plants grown under the wet treatment (Figure 21). Reassessment of the roots following
the cabinet treatments indicated no change in root hair development.
Two controlled environment cabinets (Sanyo Fitotron SGC097.CPX.F) were set to 35°C and
30% relative humidity and, with the addition of silica gel / cobalt chloride crystals, VPD >3
was achieved on each cabinet treatment day. The cabinet treatments ran for five
consecutive days (5 – 9 May 2014) once the plants had reached 3 – 4 true leaves (Table 1).
Plants were assessed daily for PaMS symptoms for two weeks post treatment, but no
symptoms were expressed in either wet or dry treatments.

6
Agriculture and Horticulture Development Board 2015. All rights reserved
Table 1.Controlled environment treatments
Treatment no. Location Treatment
1a Glasshouse
Wet 15-25°C
1b Dry
2* Cabinet Wet Temperature (>35ºC), VPD
(>3), 6 hrs on 5 consecutive
days
3* Cabinet
Dry
*Plants were returned to the glasshouse between treatments
PaMS symptoms did not occur in any of the plants subjected to the controlled environment
work. A maximum instantaneous light level of 1021 μmol/m2/s was achieved. During the
2013 monitoring, light levels reached ~1300-1400 μmol/m2/s when high VPD conditions
were experienced, and this correlated with nursery experience where more PaMS developed
in glasshouses without screens, and with higher light levels. The lack of symptom
development under high VPD and temperature conditions in the controlled environment work
may also support the theory that high light levels in association with high VPD and
temperature are required for PaMS symptoms to develop – and root development or root
zone water balance may also prove to play an important role.
Financial Benefits
Published statistics (Defra, 2014) estimate pansy production in England and Wales at 9.4
million plants with a farm gate value of £2.1 million in 2004 (21p/plant); these values are
likely to have increased in subsequent years. It is difficult to quantify plant losses due to
PaMS for several reasons (the intermittent and variable nature of PaMS, growers rogueing
distorted plants, unreported incidence, incidence identified as PaMS), however, reports have
been received of 5-20% of batches on individual nurseries being affected. Based on Defra
data, this would to equate to losses of £21,000 (1% of crop affected), £105,000 (5% of crop
affected) or £420,000 (20% of crop affected). Additional costs are also incurred by nurseries
in refilling plug trays or packs once affected plants have been discarded.
Action Points
The results of this study suggest a causal link between environmental conditions (high VPD,
temperature and light) and the expression of PaMS symptoms, however, this is based on the
results from a single site in year 1. The precise triggers and sequence of events that lead to
7
Agriculture and Horticulture Development Board 2015. All rights reserved
PaMS still remain to be elucidated within the current project but growers should take
measures to monitor environmental conditions, and reduce plant stress:
1) Monitor VPD and temperature.
2) Ensure that during periods where extreme high temperatures are predicted measures
are taken to reduce plant stress by providing shade, maximum ventilation appropriate to
prevailing weather conditions and adequate irrigation. High VPD may be reduced by
increasing relative humidity by, for example, path damping and use of mist irrigation
where available.
3) Ensure healthy plant root development through careful application of water; over-
application of water will limit root development, particularly in tray module production
units.

8
Agriculture and Horticulture Development Board 2015. All rights reserved
SCIENCE SECTION
Introduction
Symptoms of pansy mottle syndrome (PaMS) have been reported since the 1960s, and have
generally been considered to be a physiological response to stress. Symptoms include leaf
distortion, mottling, leaf bleaching, stunting and apical blindness (Figure 4). Symptom
expression may vary from year to year on nurseries; bedding plant species including
Antirrhinum, marigold, Petunia, stocks, sweet pea, Verbena, Gerbera and Primula can
display similar symptoms. Determination of the cause is complicated by the transient and
intermittent nature of the symptoms, difficulty in replicating the symptoms and linking the
cause with effect (McPherson, 2010). The condition has become more common in recent
years, particularly under the relatively cool, wet conditions of 2012, and this has renewed
interest in identifying the cause.
a) mottling and leaf bleaching b) leaf distortion
Figure 4. Pansy mottle symptoms: a) mottling and leaf bleaching and b) leaf distortion
Grower observation suggests that PaMS may be varietal, with incidence occurring in specific
seed batches and colours. Outbreaks have, however, been linked to environmental factors,
as symptoms have often been observed under humid conditions. These include warm, wet
and windy weather when glasshouse vents are shut, causing humidity to increase within the
glasshouse. Symptoms also tend to appear after transplant, although they may have been
triggered earlier and have also been linked to high root-zone moisture levels. A previous
HDC funded study (PC 286) included a survey of growers, 68% of whom had seen the
problem on their nursery, and similar symptoms on other crops. Treatments that had some
impact on symptoms included plug size, with increased risk of PaMS in the larger module
tested. Growing media also had some influence, and the plant hormone methyl-salicylate
appeared to be associated with symptoms, suggesting that plants were under stress. In this
study, symptoms were not directly caused by fungicide, adjuvant or plant growth regulator
application, the light or irrigation regimes tested, virus (tests proved negative), low irrigation
9
Agriculture and Horticulture Development Board 2015. All rights reserved
or boron/calcium (levels confirmed adequate by plant tissue analysis). Observations made
at the time indicated that symptoms first appeared on the first and second true leaves, and
were potentially related to initial root development; susceptibility may also be linked to
cultivar. PaMS does not generally appear to spread between plants (unless by a volatile or
water soluble agent). Although not a direct cause, pesticides, plant growth regulators or
adjuvants may be implicated through their contribution to plant stress (McPherson, 2010).
Whipker et al (2000) suggest that high temperatures (29°C) and high light levels increase
susceptibility to PaMS, and provide production recommendations: day temperature 13-18°C,
night temperature 10-13°C, light 47.28 - 78.79 watts/m2. Symptoms are attributed to a
genetic defect rather than nutritional deficiencies, with symptoms disappearing under cool
night and daytime temperatures (below 27°C), but reappearing when plants are again
stressed as application of boron, iron and magnesium mask the underlying genetic problem.
Hammond (2013) found no biotic cause of PaMS, and although an ilarvirus was found to be
common to pansies from many sources, there was no correlation with PaMS. 1,3
dichlorobenzene (1,3-DCB), proposed as a potential contaminant of peat causing herbicide-
like symptoms, was also discounted as symptoms could not be replicated.
Other research correlates with the use of controlled release fertilisers and high temperatures
which, in well watered plants, appears to trigger the production of hormones to accelerate
growth. Genetic variation within pansies is large, and off-types (<1%) are known to occur;
those plants with mottling exhibit membrane proliferation (over-expression of Golgi bodies
and endoplasmic reticulum), but without cell divisions. The stress is induced in young
plants, before flower bud initiation (de Rooij-van der Goes, 2013).
Krug (2007) has shown that PaMS symptoms could be linked to specific environmental and
production conditions. Boron deficiency symptoms are often caused by an inability to uptake
boron, rather than a lack of boron in the growing media; high growing media pH reduces the
availability of boron to plants. Krug et al (2013) linked growth distortion and boron deficiency
to high relative humidity conditions (100%). Under these conditions the decrease in water
loss via transpiration results in lower boron uptake, and consequently reduced boron levels
in shoot tissue. Distorted growth symptoms were replicated in pansy, Petunia and Gerbera
plugs grown under high relative humidity conditions. Boron deficiency symptoms include the
inhibition of apical growth, terminal bud necrosis, reduced leaf expansion, upward cupping of
leaves, chlorosis of upper leaves, clubbing of roots, inhibition of pollen development and
10
Agriculture and Horticulture Development Board 2015. All rights reserved
germination, brittle and fragile tissue, aborted flower initials and shedding of fruit. Although
the roles of boron are not fully understood, it is a component of cell walls and is involved in
membrane integrity.
While environmental conditions, plant genetics and nutrition are all implicated, the precise
trigger or triggers for expression of PaMS symptoms remains unknown. Mottling symptoms
have proven difficult to replicate both on grower holdings and in research facilities. For this
project, data collected from nurseries during commercial pansy production and
environmental data was modelled together with symptom expression to identify trigger
point(s) for PaMS.
In year 1 the environmental conditions (temperature, humidity and light) and nursery
production practices under which 10 batches of pansies were produced were monitored on
four commercial nurseries. Symptoms developed in two of these batches from one site, one
of which expressed symptoms including mottling and leaf bleaching, and the other distortion
only. Analysis of the data collected suggested that high VPD (>3) and temperature (>35ºC)
may be implicated in development of symptoms. Root status was suggested as another
factor that could be involved, with plants grown under a wet regime developing water roots
(no root hairs) preventing adequate water and nutrient uptake during stress conditions such
as high VPD.
The nursery monitoring continued at the same sites in year 2, with the addition of growing
media moisture monitoring using a soil moisture sensor and investigation of root
development (under wet and dry growing media conditions) to help with understanding their
contribution to symptom development. Further work was also carried out under controlled
environment conditions to investigate symptom development under specific environmental
(temperature >35ºC and VPD >3) and growing media (wet and dry) conditions.
Project objectives
Objective 1 - nursery monitoring: To monitor nursery environment (humidity, temperature,
light and growing media moisture) within commercial bedding plant production systems and,
using regression analysis approaches, elucidate any statistically robust causal relationships
between the incidence of PaMS and environment.

11
Agriculture and Horticulture Development Board 2015. All rights reserved
Objective 2 - controlled environment cabinet trial: To carry out controlled environment
cabinet experiments to determine the influence of temperature (>35ºC), VPD (>3) and root
status on the development of Pansy Mottle Syndrome.
Materials and methods
Objective 1 - nursery monitoring
Data was collected from four commercial nurseries (sites A-D) located in Hertfordshire, East
Yorkshire, West Sussex and Essex respectively between June and September 2014. The
sites were selected to include holdings with a sustained record of PaMS, and one holding
where PaMS does not generally occur. These sites were also selected as they grow
pansies from seed, so the production process from sowing to marketing could be monitored.
Four pansy batches were monitored at sites A, three at site B, and two batches at sites C
and D. Each batch was monitored using a Tinytag Plus 2 data logger (temperature and
humidity), a Watchdog 1000 series microstation data logger with an external LightScout
Quantum Light 3 Sensor PAR probe (temperature, humidity and light) and WaterScout
SM100 soil moisture sensor.
Data loggers were pole mounted within the crop at canopy height so they recorded the
environmental conditions the plants experienced. The light sensor was positioned above the
crop (Figure 5). Data loggers were set to record data every 15 minutes. During the
propagation stage, as the plugs cells were too small to accommodate the soil moisture
sensor, an unplanted pot of growing media was placed alongside batches of plug trays to
hold the moisture sensor, as a proxy. These pots were irrigated the same as the plug trays,
and a correlation made between the pots of growing media and the plug trays to calculate
the volume of water applied. Post-transplant, the sensors were placed into the packs,
however, two different production systems were in use on the nurseries taking part in the
monitoring: coir ‘teabags’ in clear green plastic trays and peat based growing medium in
packs. Due to the shape of the coir ‘teabags’ sensors were placed horizontally through the
coir, whilst in the peat based system the sensors were placed vertically into the growing
media (Figure 6). Sowing, transplant and dispatch dates for the batches monitored were
recorded (

12
Agriculture and Horticulture Development Board 2015. All rights reserved
Table 2).

13
Agriculture and Horticulture Development Board 2015. All rights reserved
Soil moisture sensor calibration
The SM100 Soil Moisture Sensor was calibrated for each unique growing media used in the
trial. Soilless media tend to be hydrophobic, and shrink when dry, therefore the moisture
content of each growing media was established by adding water to a known quantity of
growing media. This was done on a mass wetness (MW) basis where mass wetness is
defined as:
𝑀𝑊 = 100 ×𝑀𝑤𝑎𝑡𝑒𝑟
2 × 𝑀𝑚𝑎𝑡𝑒𝑟𝑖𝑎𝑙
MW = target mass wetness (%) Mwater = mass of water needed Mmaterial = total air-dry mass of sample
Samples of propagation and transplant growing media were collected from sites A, C and D
in 2014 (a sample wasn’t provided by site B). For each growing media sample, 18
containers (1L) were used, providing three replicates at six different water contents. Each
empty pot weighed 21 g.
Approximately 3.5 L of growing media was placed into a polythene bag and weighed, six
bags per growing media, one for each mass wetness. Target mass wetnesses of 0, 40, 80,
120, 160 and 200% were used. Water was added to each bag to bring the material to the
desired mass wetness using the following equation:
M water = 2 * MW * Mmaterial 100
Once the water had been incorporated, the sealed bags were left for 24 hours to allow the
water and material to come to equilibrium. The material was added to the 1 L container and
weighed. For each container, three readings were taken using the SM100. Readings were
taken perpendicular to the sides of the container. The growing media in the containers was
then completely air-dried and re-weighed. The volumetric water content (VMC) for each
container was calculated using the following equation:
𝑉𝑊𝐶 =𝑀𝑤𝑒𝑡 − (𝑀𝑑𝑟𝑦−𝑜𝑛𝑙𝑦 + 𝑀𝑐𝑜𝑛𝑡)
𝑃𝑤 × 𝑉𝑐𝑜𝑛𝑡
VWC = Mwet-total – (Mdry-only + Mcont) Ρw * Vcont
VWC = Volumetric water content (%) Mwet-total = Total mass of container and wet material Mdry-only = Mass of air-dry material

14
Agriculture and Horticulture Development Board 2015. All rights reserved
Mcont = Mass of container Ρw = Density of water (1 g/ml) Vcont = Volume of container
Figure 5. Positioning of data loggers and light sensor within a batch of pansies: a) LightScout Quantum Light 3 Sensor PAR probe; b) Tinytag Plus 2 data logger (temperature and humidity); c) Watchdog 1000 series data logger housed within a radiation shield for protection against solar radiation and water damage
Soil moisture sensors
Figure 6. Positioning of SM100 Soil Moisture Sensor within a coir system, inserted horizontally (image left); and in a peat based system inserted vertically (image right) production systems
a c b

15
Agriculture and Horticulture Development Board 2015. All rights reserved
Table 2. Dates of sowing, transplanting and dispatch for each monitored batch at each site
Site Batch no. Sowing date Transplant date First symptom expression
Dispatch date
Site A 1 24.06.14 22.07.14 - 12.08.14
Site A 2 31.07.14 28.08.14 - 18.09.14
Site A 3 04.07.14 30.07.14 18.08.14
Site A 4 07.08.14 02.09.14 - 07.10.14
Site B 1 27.06.14 30.07.14 - *
Site B 2 27.06.14 30.07.14 - *
Site B 3 03.07.14 05.08.14 *
Site C 1 26.06.14 25.07.14 - 18.08.14
Site C 2 04.07.14 31.07.14 –
01.08.14
- 08.12.14
Site D 1 24.06.14 22.07.14 - 08.08.14
Site D 2 07.07.14 04.08.14 –
05.08.14
- 01.09.14
*These batches were produced specifically for this trial and were not dispatched for sale
Objective 2 - controlled environment cabinet trial
Site and crop details
Work was carried out between March and June 2014 at ADAS Boxworth. Seeds of Pansy
Matrix Autumn Select were sown on 31 March 2014 into 288 cell trays (24 trays), using
Bulrush growing media, at Bryants Nursery, Hertfordshire. Two Tinytag data loggers and two
Watchdog 1000 series data loggers, with light sensors, were placed with the batch, to record
temperature, humidity and light every 30 minutes from the point of sowing. All trays received
the same amount of irrigation whilst at Bryants Nursery. The plants were transported to
ADAS Boxworth on 14 April (cotyledon stage) where they were grown on in a glasshouse
compartment, maintained between 15 and 25°C.
The trays were cut in half to allow for greater replication, and two irrigation regimes (wet and
dry) applied, each to 50% of the plants (18 half-trays per treatment) (Figure 7). Of the trays,
six from each irrigation treatment remained in the glasshouse throughout the trial (untreated
control, treatments 1a and 1b, Table 3). The two sets of loggers (Tinytag and Watchdog
1000) monitored the glasshouse environment, one per watering regime, for the duration of
the trial.

16
Agriculture and Horticulture Development Board 2015. All rights reserved
Figure 7. Layout of trays in the glasshouse, separated into two irrigation regimes (wet and dry) ADAS Boxworth
Irrigation treatment
On arrival at ADAS Boxworth, the trays of plants were weighed, watered to the point of
saturation, and then re-weighed. Plants destined for the dry treatments (50% of the total)
were allowed to dry down for two days, with no further water applications. Plants destined
for the wet treatment were then watered daily to the point of saturation (treatment 2); and for
the dry treatment, plants received between 50 ml and 100 ml (treatment 3) depending on
temperature conditions (Table 3). All trays were weighed daily prior to watering throughout
the trial. As the plug cells were too small to accommodate the soil moisture sensors, 9 cm
pots were used as a proxy to estimate moisture levels. WaterScout SM100 soil moisture
sensors were placed in 9 cm pots of Bulrush growing media (one per treatment) which
received the same volume of water as the plants.
On the five consecutive cabinet treatment days, the wet treatment trays were watered to the
point of saturation as normal, and the dry treatment were given 100 ml. The trays were
watered in the afternoon, once they had been removed from the cabinets. Once the cabinet
treatments had finished, the two separate watering treatments continued until the end of the
trial.
Table 3.Controlled environment treatments
Location Treatment
1a Glasshouse
Wet 15-25°C
1b Dry
2* Cabinet Wet Temperature (>35ºC), VPD (>3),
6 hrs on 5 consecutive days 3* Cabinet Dry
*Plants were returned to the glasshouse between treatments

17
Agriculture and Horticulture Development Board 2015. All rights reserved
Controlled environment (CE) cabinet treatments
Two CE cabinets (Sanyo Fitotron SGC097.CPX.F) were set to 35°C and 30% humidity to
achieve a VPD of >3, whilst maintaining the temperature above 35°C (Table 3). As the
introduction of plants into the cabinets increased humidity and reduced VPD trays of silica
gel crystals were placed on the bottom of each cabinet. The silica gel crystals were also
removed each day and placed in an oven overnight set to 80°C, so that they could dry out
and be placed back in the cabinets each day. The cabinet treatments ran for five
consecutive days, (5 – 9 May 2014) once the plants had reached 3 – 4 true leaves.
The plants were moved from the glasshouse to the CE cabinets on a trolley and placed in
the cabinets according to the trial plan, 12 half trays per cabinet (one half tray per plot). The
trays were randomised within the cabinets (Appendix 1), but kept separate in the two
watering regimes within the glasshouse, for ease of watering (Appendix 2).
Environmental conditions were monitored using a Tinytag and Watchdog data logger with
light sensor in each cabinet; these data loggers remained with the plants, moving in and out
of the cabinets each day, and the trays were placed in the same area of the cabinet (Figure
8) each day. The plants were placed in the cabinets at 9 am each day, removed at 3 pm,
reweighed and watered.
Figure 8. Layout of trays in the CE cabinets
Assessments
Objective 1 - nursery monitoring
Nursery staff provided production data for routine inputs: irrigation (method, volume, and
source), fertiliser, crop protection and plant growth regulator application, and growing media
as detailed within a monitoring template (Appendix 3). Plants were monitored daily for
PaMS symptoms by nursery staff and the location of symptomatic plants recorded, along

18
Agriculture and Horticulture Development Board 2015. All rights reserved
with the date and time of inspection. Any symptomatic plants were to be further inspected
by ADAS, to quantify the number of infected plants and their position both within the module
tray and the glasshouse.
At site B, batches 1 and 2 were sown on the same day (same cultivar), and transferred to
different areas within the same glasshouse post transplant to provide contrasting
environmental conditions: unshaded (stressed) vs shaded (not stressed).
A root hair assessment of 20 plants per batch was carried out by nursery staff at transplant,
scoring on a scale of 0-3, where 0 = no root hairs and 3 = many root hairs (Figure 9), using
the guide provided.
Root score 0
Either no roots present, or there are water roots with no
root hairs
Root score 1
Very few hairs present
Root score 2
Root hairs present
Root score 3
Roots are extremely hairy
Figure 9. Root assessment scores. Scale = 0-3; 0 = no root hairs and 3 = many root hairs
Objective 2 - controlled environment cabinet trial
The following assessments were carried out according to the timetable below (Table 4):
Root hair assessment, five plants per tray scored on a scale of 0-3, where 0 = no root
hairs and 3 = many root hairs (Figure 9).
Assessment of PaMS symptoms.

19
Agriculture and Horticulture Development Board 2015. All rights reserved
Table 4. Timetable of actions and assessments
Date Action
31.03.14 Seeds of Pansy Matrix Autumn Select sown into 288 celltrays at Bryants Nursery. Data loggers monitoring from sowing
Early April Irrigation regime for the wet and dry treatments determined at ADAS Boxworth
14.04.14 Plants arrive at ADAS
Initial root assessment
Irrigation treatments commence
Mid-April CE cabinets tested with plants to ensure VPD >3 achievable
02.05.14 Root hair assessment (pre-cabinet treatments)
05.05.14 Day 1 of cabinet treatments. Plants at 3-4 true leaf stage
09.05.14 Day 5 of cabinet treatments. Root assessment (post cabinet treatment)
Mid May – 11.06.14 Daily weighing, watering and monitoring for symptoms of PaMS
Results
Objective 1 - nursery monitoring
No PaMS symptoms occurred in any of the monitored batches in 2014 other than one or two
plants at site A, batch 1. Stunting and distortion, but no mottling or variegation, was reported
in an unmonitored batch of Pansy Frizzle-Sizzle at site C (August) that was located in an
area of the glasshouse that was monitored later in the season. The possibility of using the
nursery environmental monitoring system data for analysis was investigated but it did not
prove possible to access the full range of data required.
Data capture
Production information provided by the nurseries (available as a separate appendix: PaMS
nursery data appendix 2014) was reviewed and considered in association with
environmental data.
Environmental data was recorded by both the Tinytag (temperature, humidity) and Watchdog
(temperature, humidity, light and growing media moisture) data loggers for all sites and
batches. The only issue arose in site B, batch 2 where there appears to have been an issue
where the sensor recording zero initially, and then around 1000 micromols/m2/s for every
20
Agriculture and Horticulture Development Board 2015. All rights reserved
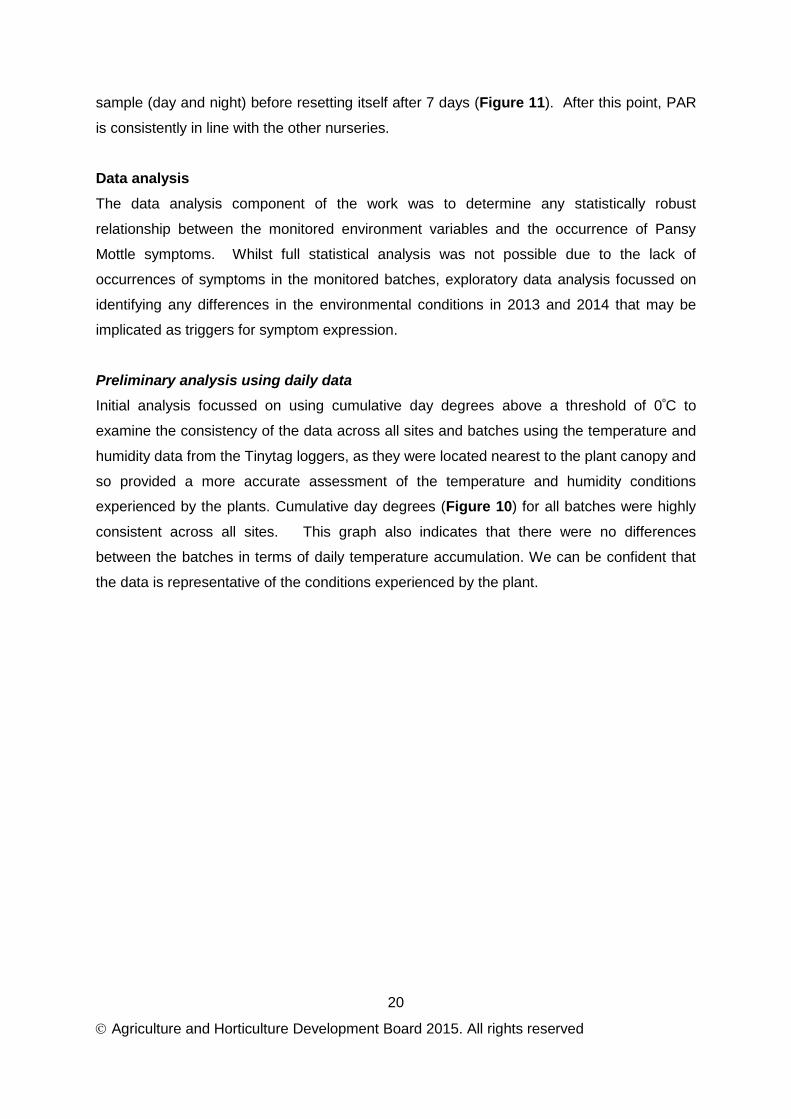
sample (day and night) before resetting itself after 7 days (Figure 11). After this point, PAR
is consistently in line with the other nurseries.
Data analysis
The data analysis component of the work was to determine any statistically robust
relationship between the monitored environment variables and the occurrence of Pansy
Mottle symptoms. Whilst full statistical analysis was not possible due to the lack of
occurrences of symptoms in the monitored batches, exploratory data analysis focussed on
identifying any differences in the environmental conditions in 2013 and 2014 that may be
implicated as triggers for symptom expression.
Preliminary analysis using daily data
Initial analysis focussed on using cumulative day degrees above a threshold of 0ºC to
examine the consistency of the data across all sites and batches using the temperature and
humidity data from the Tinytag loggers, as they were located nearest to the plant canopy and
so provided a more accurate assessment of the temperature and humidity conditions
experienced by the plants. Cumulative day degrees (Figure 10) for all batches were highly
consistent across all sites. This graph also indicates that there were no differences
between the batches in terms of daily temperature accumulation. We can be confident that
the data is representative of the conditions experienced by the plant.

21
Agriculture and Horticulture Development Board 2015. All rights reserved
Figure 10. Cumulative Day Degrees (ºC) 2014, all batches
The cumulative photosynthetically active radiation (PAR) chart (Figure 11) shows a high
level of consistency in the PAR received by the plants in different batches at sites A, C and
D, and within batches 1 and 3 at site C. The PAR received by site B, batch 2 was noticeably
higher that the other batches; there had been data logger issues up to day 7 (see comments
above under ‘Data capture’).

22
Agriculture and Horticulture Development Board 2015. All rights reserved
Figure 11. Cumulative daily PAR (mols/m2/day) 2014, all batches
As PaMS symptoms only occurred on site A in 2013, light, temperature and VPD data for
that site for 2013 and 2014 is discussed below (Figure 12 to Figure 17). Environmental
data (temperature, daily light integral (DLI) and VPD; 2014) for sites B, C and D may be
found in Appendix 4.
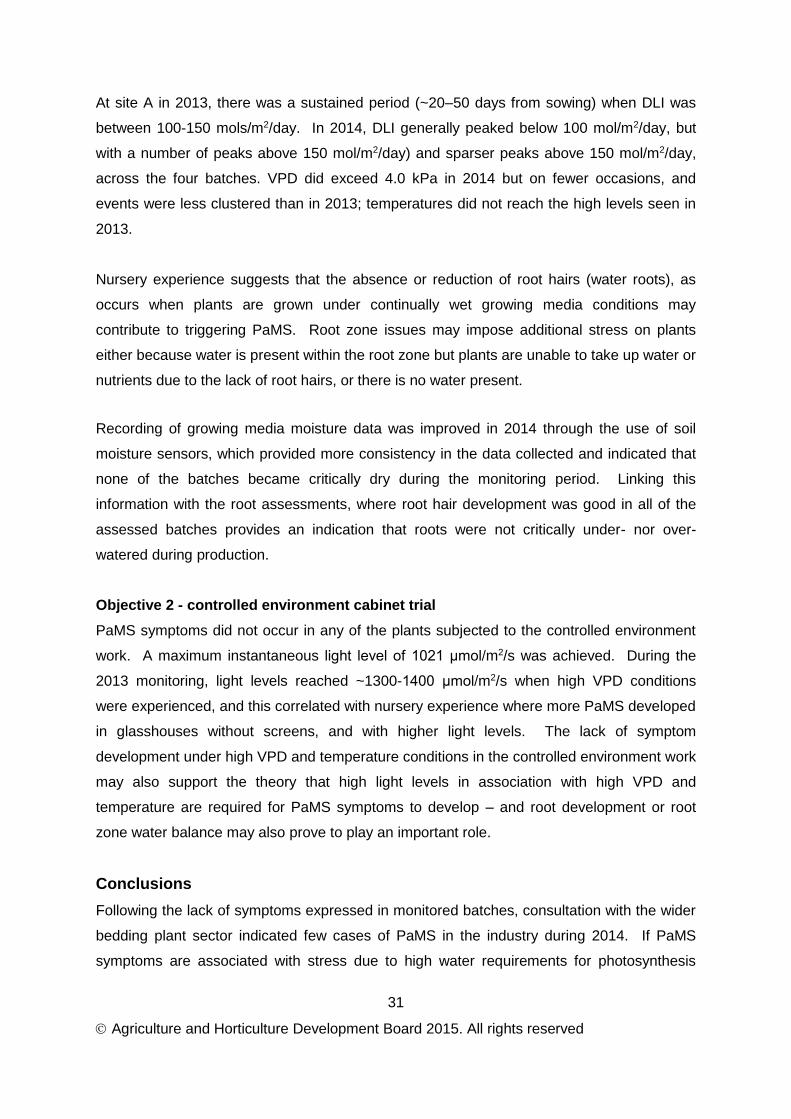
DLI was generally lower in 2014 (Figure 12) than 2013 (Figure 13). At site A in 2013, there
was a sustained period (~20–50 days from sowing) when DLI was between 100-150
mols/m2/day. In 2014, site A, DLI generally peaked below 100 mol/m2/day, but with a
number of peaks above 150 mol/m2/day and sparser peaks above 150 mol/m2/day, across
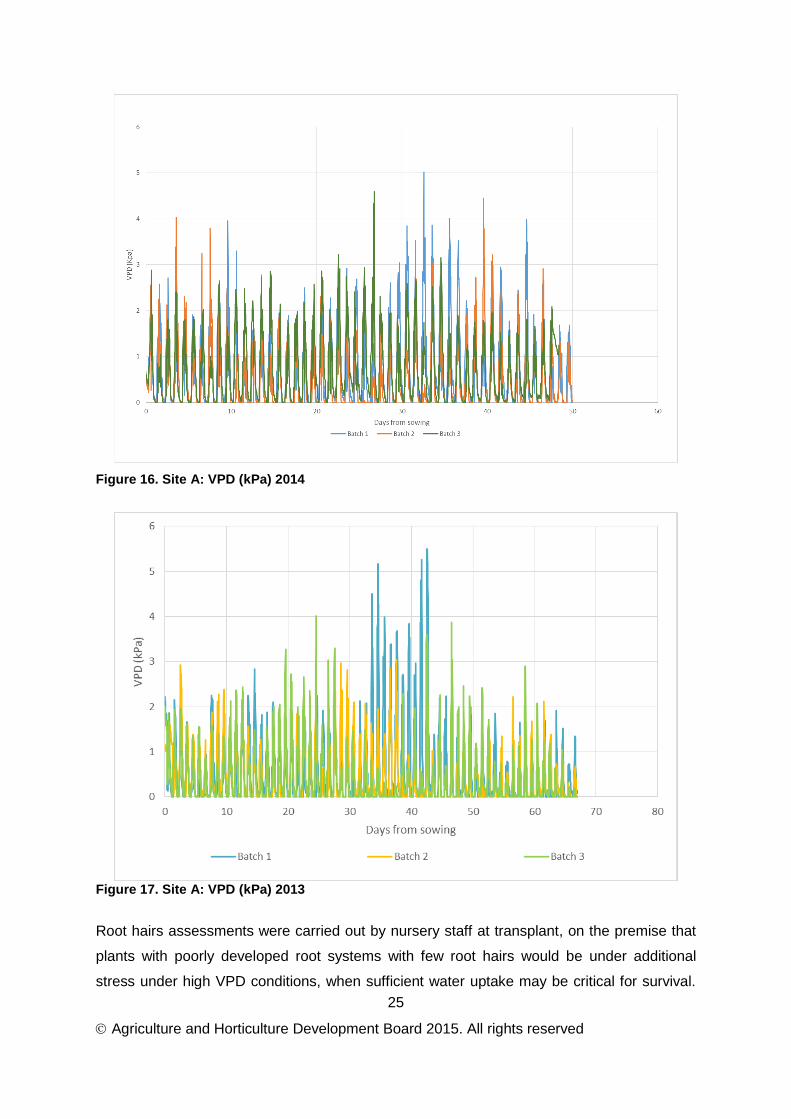
the four batches. DLI was calculated per sampling period, based on a 24 hr day. VPD did
exceed 4.0 kPa in 2014 (Figure 16) but on fewer occasions, and events were less clustered
than in 2013 (Figure 17) when VPD exceeded 5.0 kPa. Similarly in 2014 (Figure 14),
temperatures did not reach the high levels seen in 2013 (Figure 15).

23
Agriculture and Horticulture Development Board 2015. All rights reserved
Figure 12. Daily Light Integral per sampling period (mols/m2/day), site A all batches, 2014 (calculation based on a 24 hr day)
Figure 13. Daily Light Integral per sampling period (mols/m2/day), site A all batches, 2013 (calculation based on a 24 hr day)

24
Agriculture and Horticulture Development Board 2015. All rights reserved
Figure 14. Site A: Temperature (°C) 2014
Figure 15. Site A: Temperature (°C) 2013
25
Agriculture and Horticulture Development Board 2015. All rights reserved
Figure 16. Site A: VPD (kPa) 2014
Figure 17. Site A: VPD (kPa) 2013
Root hairs assessments were carried out by nursery staff at transplant, on the premise that
plants with poorly developed root systems with few root hairs would be under additional
stress under high VPD conditions, when sufficient water uptake may be critical for survival.

26
Agriculture and Horticulture Development Board 2015. All rights reserved
Plants were scored on a scale of 0-3, where 0 = no root hairs and 3 = many root hairs. For
all batches where an assessment was completed, the sample was assessed to have good
root hair development (Table 5).
Table 5. Average root hair score per batch at transplant. Plants were scored on a scale of 0-3, where 0 = no root hairs and 3 = many root hairs (Figure 9)
Site Batch Average root score
A 1 2.00
A 2 not completed*
A 3 2.00
A 4 3.00
B 1 not completed*
B 2 not completed*
B 3 not completed*
C 1 2.65
C 2 2.25
D 1 2.75
D 2 2.65 *assessment not completed for this batch
Growing media moisture is presented as the volumetric water content (VMC); the ratio of
water to substrate expressed as a percentage. As moisture levels in the plug trays were
recorded using a proxy (9 cm pot of growing media, irrigated with the same volume of water
as the trays of plugs), a correlation was made between the pots of growing media and the
trays of plugs to calculate the volume of water applied (Figure 18 to Figure 20); data was
not collected at site B. The data cannot be compared between nurseries, as differences
may be due to the different substrates used which require different irrigation regimes. There
were no occasions when moisture levels were low for long periods.

27
Agriculture and Horticulture Development Board 2015. All rights reserved
Figure 18. Volumetric water content (VWC, %): Site A
Figure 19. Volumetric water content (VWC, %): Site C

28
Agriculture and Horticulture Development Board 2015. All rights reserved
Figure 20. Volumetric water content (VWC, %): Site D
Objective 2 - controlled environment cabinet trial
Root hair assessment
On arrival at ADAS Boxworth the pansies were uniform, with a similar number of root hairs
visible on all plants. The intention had been to provide two different irrigation treatments
(wet and dry) from sowing to encourage greater root hair development under the dry
treatment, and water roots (no root hairs) under the wet treatment. Although the two
irrigation treatments at Boxworth did achieve greater root hair development under the dry
regime, water roots were not present on the plants grown under the wet treatment (Figure
21). Reassessment of the roots following the cabinet treatments indicated no change in root
hair development.

29
Agriculture and Horticulture Development Board 2015. All rights reserved
Figure 21: Average root hair assessment following water treatments, prior to cabinet treatments, on a scale of 0-3, where 0 = no root hairs and 3 = many root hairs
CE cabinet treatment
The cabinets were set to 35°C and 30% relative humidity and, with the addition of silica gel /
cobalt chloride crystals, VPD >3 was achieved on each cabinet treatment day (Figure 22).
The five vertical bars on the graph indicate when VPDs of 3 to 4.5 were achieved whilst the
trays were in the cabinets. Instantaneous PAR light levels between 852 - 1021 μmol/m2/s
were achieved within the cabinets.
Plant assessment
Plants were assessed daily for PaMS symptoms for two weeks post treatment, but no
symptoms were expressed in either wet or dry treatments.

30
Agriculture and Horticulture Development Board 2015. All rights reserved
Figure 22. Calculated VPD for CE cabinet experiments
Discussion
Objective 1 - nursery monitoring
In 2013, although there was low occurrence of PaMS symptoms in the monitored batches
across the four sites, a potential association was tentatively muted between environmental
factors and the occurrence of PaMS symptoms. This association was derived from the
observation that the VPD, temperature and PAR received by the plants in site A, batch 1
were higher than for the other batches at the same site and also for batches at other sites. It
was suggested that light levels could be a factor, in combination with high VPD and
temperature that may lead to symptom development. However the sample size of one
precluded any robust statistical analysis of the environmental data.
In 2014, significant PaMS symptoms did not occur in any of the monitored batches across
the four sites. Data analysis showed that high VPD occurred in all batches on a number of
occasions in 2014. DLI was generally lower in 2014 (Figure 12) than 2013 (Figure 13),
and at site A, DLI generally peaked below 100 mol/m2/day, but with a number of peaks
above 150 mol/m2/day) across the four batches (DLI was calculated per sampling period,
based on a 24 hr day).
31
Agriculture and Horticulture Development Board 2015. All rights reserved
At site A in 2013, there was a sustained period (~20–50 days from sowing) when DLI was
between 100-150 mols/m2/day. In 2014, DLI generally peaked below 100 mol/m2/day, but
with a number of peaks above 150 mol/m2/day) and sparser peaks above 150 mol/m2/day,
across the four batches. VPD did exceed 4.0 kPa in 2014 but on fewer occasions, and
events were less clustered than in 2013; temperatures did not reach the high levels seen in
2013.
Nursery experience suggests that the absence or reduction of root hairs (water roots), as
occurs when plants are grown under continually wet growing media conditions may
contribute to triggering PaMS. Root zone issues may impose additional stress on plants
either because water is present within the root zone but plants are unable to take up water or
nutrients due to the lack of root hairs, or there is no water present.
Recording of growing media moisture data was improved in 2014 through the use of soil
moisture sensors, which provided more consistency in the data collected and indicated that
none of the batches became critically dry during the monitoring period. Linking this
information with the root assessments, where root hair development was good in all of the
assessed batches provides an indication that roots were not critically under- nor over-
watered during production.
Objective 2 - controlled environment cabinet trial
PaMS symptoms did not occur in any of the plants subjected to the controlled environment
work. A maximum instantaneous light level of 1021 μmol/m2/s was achieved. During the
2013 monitoring, light levels reached ~1300-1400 μmol/m2/s when high VPD conditions
were experienced, and this correlated with nursery experience where more PaMS developed
in glasshouses without screens, and with higher light levels. The lack of symptom
development under high VPD and temperature conditions in the controlled environment work
may also support the theory that high light levels in association with high VPD and
temperature are required for PaMS symptoms to develop – and root development or root
zone water balance may also prove to play an important role.
Conclusions
Following the lack of symptoms expressed in monitored batches, consultation with the wider
bedding plant sector indicated few cases of PaMS in the industry during 2014. If PaMS
symptoms are associated with stress due to high water requirements for photosynthesis

32
Agriculture and Horticulture Development Board 2015. All rights reserved
(under high light and temperature conditions), then we would expect the stress to have been
lower in 2014 due to the lower light levels. Lower light levels – along with less extreme
temperatures and high VPD events – recorded in the nursery monitoring in 2014 would also
help to explain the reduced incidence of PaMS across the industry.
Further nursery monitoring will be carried out during 2015, to further examine the
relationship between VPD, temperature, light levels and root status, and their effect on the
development of PaMS.
Knowledge and Technology Transfer
An informal briefing has been presented to the industry representatives to provide updates
on the controlled environment work and the second year of nursery monitoring. An HDC
News article was published in October 2014.
Acknowledgements
We would like to acknowledge the work of Chris Need, Fay Richardson, Mike Smith,
Caroline Shove, Russ Woodcock and the staff of Roundstone Nurseries, Coletta & Tyson,
W.D. Smith & Son and Bryants Nurseries in developing this project and providing the data
used in this study.
References
Defra (2014) Basic horticultural statistics – datasets. [Online] Available from:
https://www.gov.uk/government/statistics/basic-horticultural-statistics-2014. [Accessed 4
March 2015].
de Rooij-van der Goes, I. J. (2013) Technical Manager, Syngenta Flowers. Personal
communication.
Hammond, J. (2013) Research Plant Pathologist, Floral and Nursery Plants Research Unit,
USDA-ARS, United States National Arboretum. Personal communication.
Krug, B. (2007) Physiological and environmental factors affecting shoot tissue boron
concentration of pansy, petunia and gerbera plugs. PhD Thesis, North Caroline Institute,
USA.

33
Agriculture and Horticulture Development Board 2015. All rights reserved
Krug, B., Whipker, B. E., McCall, I., Frantz, J. (2013) Elevated relative humidity increases
the incidence of distorted growth and boron deficiency in bedding plant plugs. HortScience
48(3):311-313.
Murray FW (1967) On the computation of saturation vapor pressure. J. Appl. Meteorol. 6:
203-204.
McPherson, G. M. (2010) PS 286. Bedding plants: investigating the cause and prevention of
pansy mottle syndrome. Horticultural Development Company.
Monteith JL, Unsworth MH (1990) Principles of environmental physics. Arnold
Nilson, E. T., Rundel, P. W., and Sharifi, M. R. (1081) Summer water relations of the desert
phreatophyte Prosopis glandulosa in the Sonoran Desert of Southern California. Oecologia,
Vol. 50, No. 2 (1981), pp. 271-276
Whipker, B. E., Gibson, J. L., Pitchay, D. S., Nelson, P. V., Baker, J. R., Faust, J. E.,
Thomas, P. A., Benson, M., Cavins, T. J., Williams-Woodward, J. L. (2000) Diagnosing
Common Pansy Problems. Greenhouse Product News. Available at:
http://www.gpnmag.com/diagnosing-common-pansy-problems.

34
Agriculture and Horticulture Development Board 2015. All rights reserved
Appendix 1. Controlled environment cabinet trial plan
Cabinet 1
Back of cabinet
Block
Plot
Treatment
1
1
2
2
5
3
1
2
2
2
6
3
4
10
3
3
8
2
Shelf 1 Block
Plot
Treatment
4
12
3
3
9
2
5
13
2
6
16
3
6
17
3
5
15
2
Front of cabinet
Cabinet 2
Back of cabinet
Block
Plot
Treatment
7
20
2
8
22
3
8
24
3
7
21
2
10
29
3
9
25
2
Shelf 1 Block
Plot
Treatment
9
26
2
10
30
3
11
31
2
12
34
3
12
35
3
11
33
2
Front of cabinet
Location of loggers which move from the glasshouse to the cabinets during cabinet
treatment
1
2

35
Agriculture and Horticulture Development Board 2015. All rights reserved
Appendix 2. Glasshouse trial plan
Block
Plot
Treatment
1
1
2
1
2
2
1
3
1a
2
4
1b
2
5
3
2
6
3
Block
Plot
Treatment
3
7
1a
3
8
2
3
9
2
4
10
3
4
11
1b
4
12
3
Block
Plot
Treatment
5
13
2
5
14
1a
5
15
2
6
16
3
6
17
3
6
18
1b
Block
Plot
Treatment
7
19
1a
7
20
2
7
21
2
8
22
3
8
23
1b
8
24
3
Block
Plot
Treatment
9
25
2
9
26
2
9
27
1a
10
28
1b
10
29
3
10
30
3
Block
Plot
Treatment
11
31
2
11
32
1a
11
33
2
12
34
3
12
35
3
12
36
1b
Treatment no. Watering
1a Wet control
1b Dry control
2 Wet cabinet
3 Dry cabinet
Location of loggers that follow the batch from sowing and remain in the glasshouse at
Boxworth
Location of loggers which move from the glasshouse to the cabinets during cabinet
treatment
1
2
Only treatment 2 and 3
move into the CE cabinets

36
Agriculture and Horticulture Development Board 2015. All rights reserved
Appendix 3. Grower monitoring template
Project title: The role of environmental factors in the incidence of Pansy mottle
syndrome (PaMS) 2014
ADAS: HDC: PO 016
Date Comment Initials

37
Agriculture and Horticulture Development Board 2015. All rights reserved
Production information
Seed details
Breeder/ supplier:
Cultivar, genetics (F1):
Seed treatment:
Storage Location (cold room, fridge):
Storage Temperature:
Germination/propagation information
Date of sowing/batch number:
Sowing method:
Location within Nursery:
Floor, bench, stillage? (Include construction details (open mesh, polystyrene, concrete floor):
Position within location (e.g. any doors/vents nearby):
Date covered (note if not milky plastic):
Date cover removed:
Module (cell number):
Module (cell volume):
Growing media (product, specification, additives e.g. wetters). Obtain sample.
Movement information:
Transport method:
Route (outdoors, indoors etc):
Duration:

38
Agriculture and Horticulture Development Board 2015. All rights reserved
Covered?
Growing on information:
Date of transplanting:
Growth stage at transplanting (no. of leaves)
Location within Nursery:
Floor, bench, stillage? (Include construction details (open mesh, polystyrene, concrete floor):
Position of monitors within location (within 5 m of a doorway/vent/fans):
Module (cell number):
Module (cell volume):
Growing media (product, specification, additives e.g. wetters). Obtain sample.

39
Agriculture and Horticulture Development Board 2015. All rights reserved
Irrigation application:
Date Stage of production Volume Method of application Source (mains/reservoir/borehole)

40
Agriculture and Horticulture Development Board 2015. All rights reserved
Fertiliser application:
Date Stage of production Product NPK content Method of application Concentration (g/l)
41
Agriculture and Horticulture Development Board 2015. All rights reserved
Crop protection and PGR application:
Date Input type Dose rate/water volume Product name Active ingredient Application Method

42
Agriculture and Horticulture Development Board 2015. All rights reserved
Root hair assessment at transplant Date:
Pansy batch / sowing date: Growth stage (no of leaves):
Plant no. Root hair score (0-3 scale) Comments Plant no. Root hair score (0-3 scale) Comments
1 11
2 12
3 13
4 14
5 15
6 16
7 17
8 18
9 19
10 20

43
Agriculture and Horticulture Development Board 2015. All rights reserved
Pansy Mottle Syndrome incidence
Date Time Sowing batch Tray number in batch Number of plants affected Growth Stage

44
Agriculture and Horticulture Development Board 2015. All rights reserved
Appendix 4. Site environmental data
Temperature (°C): site A, all batches, 2014
VPD (kPa): site A, all batches, 2014

45
Agriculture and Horticulture Development Board 2015. All rights reserved
Daily Light Integral per sampling period (mols/m2/day), site A all batches, 2014 (calculation based on a 24 hr day)
Temperature (°C): site B, all batches, 2014

46
Agriculture and Horticulture Development Board 2015. All rights reserved
VPD (kPa): site B, all batches, 2014
Daily Light Integral per sampling period (mols/m2/day), site B all batches, 2014 (calculation based on a 24 hr day)

47
Agriculture and Horticulture Development Board 2015. All rights reserved
Temperature (°C): site C, all batches, 2014
VPD (kPa): site C, all batches, 2014

48
Agriculture and Horticulture Development Board 2015. All rights reserved
Daily Light Integral per sampling period (mols/m2/day), site C all batches, 2014 (calculation based on a 24 hr day)
Temperature (°C): site D, all batches, 2014
49
Agriculture and Horticulture Development Board 2015. All rights reserved
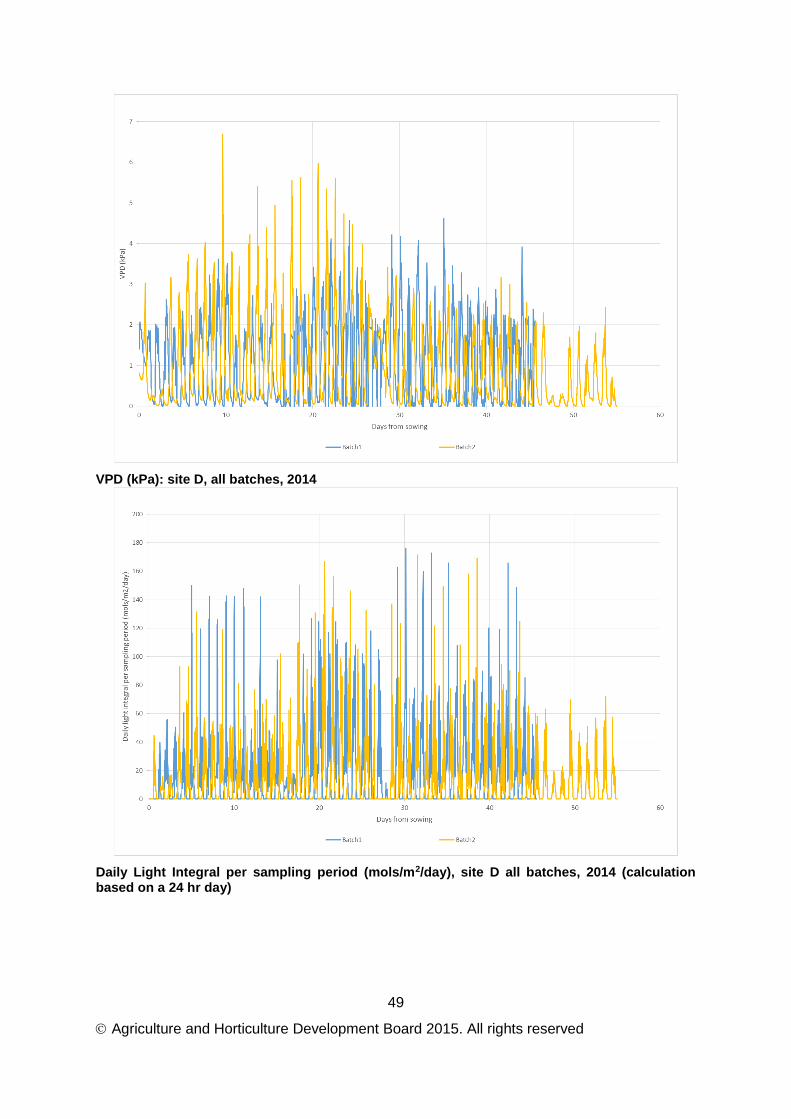
VPD (kPa): site D, all batches, 2014
Daily Light Integral per sampling period (mols/m2/day), site D all batches, 2014 (calculation based on a 24 hr day)