THE GAP BETWEEN PRODUCER PRICES AND THE PRICES PAID BY THE
62
Directorate General for Internal Policies of the Union Policy Department B: Structural and Cohesion Policies AGRICULTURE AND RURAL DEVELOPMENT THE GAP BETWEEN PRODUCER PRICES AND THE PRICES PAID BY THE CONSUMER STUDY IP/B/AGRI/IC/2007_001 October 2007 PE 397.240 EN
Transcript of THE GAP BETWEEN PRODUCER PRICES AND THE PRICES PAID BY THE

STUDY
Policy Department Structural and Cohesion Policies
THE GAP BETWEEN PRODUCER PRICES
AND THE PRICES PAID BY THE CONSUMER
AGRICULTURE
October 2007 EN


Directorate General for Internal Policies of the Union
Policy Department B: Structural and Cohesion Policies
AGRICULTURE AND RURAL DEVELOPMENT
THE GAP BETWEEN PRODUCER PRICES AND
THE PRICES PAID BY THE CONSUMER
STUDY IP/B/AGRI/IC/2007_001 October 2007 PE 397.240 EN

This study was requested by the European Parliament's committee on Agriculture and Rural Development. This paper is published in the following language: - Original: EN. Auuthors: Agra CEAS Consulting Responsible Official: M. Albert Massot Marti Policy Department B: Structural and Cohesion Policies European Parliament B-1047 Brussels E-mail: [email protected] Manuscript completed in October 2007.
This study is available on the Internet at: http://www.europarl.europa.eu/activities/committees/studies.do?language=en Brussels, European Parliament, 2008.
The opinions expressed in this document are the sole responsibility of the author and do not necessarily represent the official position of the European Parliament.
Reproduction and translation for non-commercial purposes are authorised, provided the source is acknowledged and the publisher is given prior notice and sent a copy.

Directorate General for Internal Policies of the Union
Policy Department B: Structural and Cohesion Policies
REGIONAL DEVELOPMENT
THE GAP BETWEEN PRODUCER PRICES AND
THE PRICES PAID BY THE CONSUMER
STUDY
Content:
This study aims to understand the gap between agricultural producer prices in the EU and the prices paid by the consumer between 2003 and 2005, with a view to explaining the decisive factors in this area for key agricultural sectors and, on the basis of this analysis, to formulate economic and commercial propositions aimed at improving the situation of producer income and/or the prices charged to consumers.
IP/B/AGRI/IC/2007_001 PE 397.240 EN


The Gap between Producer Prices and the Prices paid by the Consumer
PE 397.240 iii
Executive summary
Background and objectives In recent years some EU farm prices have experienced a significant decline, resulting in considerable financial stress to producers. However, in some cases, casual observation suggests that price movements of a similar magnitude, or even in the same direction, were not experienced at the wholesale and/or the food retail levels.
The aim of this study is to understand the gap between agricultural producer prices in the EU and the prices paid by the consumer between 2003 and 2005, with a view to explaining the decisive factors in this area for key agricultural sectors and, on the basis of this analysis, to formulate economic and commercial propositions aimed at improving the situation of producer income and/or the prices charged to consumers.
Methodology Monthly producer and consumer prices were collected for the period 2003-2005 from a variety of data sources, including: the European Commission (Eurostat and DG Agri), national statistical offices and private statistical bodies. In total, producer and consumer prices were collected for 233 country and product combinations. Due to incomplete price data for a number of product price series, analysis was not carried out on the entire dataset. However, this study presents price data and analysis on 202 country and product producer-consumer price combinations, making this to the authors' knowledge the largest set of price data analysed in any single EU agri-food sector study on producer-consumer price margins.
Study findings In summary, producer-consumer price margins were found to vary significantly by both Member State and product supply chain:
• In the milk and dairy products supply chains, producer-consumer price margins were generally higher for cheese and milk and lower for butter, with milk producers' share of the consumer price ranging from 28% to 62% for liquid milk, 25% to 60% for cheese and 42% to 82% for butter.
• In the meat and meat products supply chains, producer-consumer price margins were generally wider due to the number of different cuts and joints which have different consumer values. Price margins were widest for pigmeat, ranging from 12% to 92%, followed by 7% to 74% for beef and 29% to 86% for lamb.
• In the fruit and vegetables supply chains, there was a wide variation in price margins by both product and Member State. Price margins for fruit (apples and pears) ranged from 26% to 74% and for all vegetables from 14% to 82%.
Similarly, the extent to which the producer-consumer price margins have evolved over the period were found to vary significantly by both Member State and product supply chain:
• In the milk and dairy products supply chains, there were significant differences in the development of producer-consumer price margins over the period. In general, price margins widened in more Member States than not, although the converse was true when looking specifically at the price margins for cheese, with price margins narrowing in the majority of Member States. That said, in all milk and dairy product supply chains analysed, the extent to which price margins widened was greater than the extent to which price margins narrowed over the period.

The Gap between Producer Prices and the Prices paid by the Consumer
PE 397.240 iv
• In the meat and meat products supply chains, there were significant differences in the development of producer-consumer price margins over the period. In general, price margins widened in more Member States than not, in the case of sheepmeat. However, the converse was true when looking at the price margins for beef and pigmeat, with price margins narrowing in the majority of Member States. That said, in both the beef and sheepmeat supply chains analysed, the extent to which price margins widened was greater than the extent to which price margins narrowed over the period.
• In the fruit and vegetables supply chains, there were significant differences in the development of producer-consumer price margins over the period. In general, price margins widened in more Member States than not, in the case of vegetables. However, in the case of fruit the converse was true with price margins narrowing in the majority of Member States.
Although the results suggest that accession of the 10 central and eastern European Member States to the EU in May 2004 had a significant impact on the producer-consumer price margin, further possible explanatory factors which may explain both the extent of the price divergence between producer and consumer prices and its recent development were found to include:
• retail concentration and pricing policies; • the extent of co-operative marketing; • the perishable nature of the product; • the degree of product handling, storage and processing; • the degree of product differentiation and branding; • share of raw material in end product value; • consumer purchasing preferences; • legislative and regulatory frameworks; • market shocks; and, • the degree of self sufficiency and cross border trade.
Overall, the very high degree of variation in explanatory structural, market and product characteristics between EU Member States makes it extremely difficult to draw generalisable conclusions for the EU as a whole, or indeed individual supply chains. Although it is difficult to draw simplistic conclusions, on balance from the evidence reviewed there would appear to have been a general further widening of producer-consumer price margins over the period analysed (albeit limited to a relatively short time period) in a number of the supply chains and Member States covered. While this would be consistent with the view of higher retailer concentration and consequent increased bargaining power, the picture provided by this partial analysis is by no means uniform and may be somewhat misleading given that some factors may indeed work to negate the impact on the price margin of other factors.
Agro-economic proposals In conclusion, there is scope to ensure that producers’ relative position within the price determination process is improved by increasing their relative market or ‘countervailing’ power within the supply chain and/or finding new niche or differentiated markets. Recommendations would therefore include that further consideration be given to strengthening Producer Groups beyond those sectors already receiving support and encouraging the formation of producer and agri-food co-operatives in order to enable the evolution of greater bargaining power for generally fragmented producers.

The Gap between Producer Prices and the Prices paid by the Consumer
PE 397.240 v
Acknowledgements This report was prepared by Dr Edward Oliver and Conrad Caspari of Agra CEAS Consulting, with assistance from Agnieszka Ciska, Anna Holl, Clifford Biggs and Dr Dylan Bradley. We would particularly like to thank the national statistical offices and price collection and sectoral organisations for their assistance in providing price data for this study.

The Gap between Producer Prices and the Prices paid by the Consumer
PE 397.240 vi

The Gap between Producer Prices and the Prices paid by the Consumer
PE 397.240 vii
Contents Page Executive Summary iii Acknowledgments v 1. Introduction and Objectives 1
1.1. Background 1 1.2. Objectives of the study 1 2. The Nature of Competition, Marketing Margins and Price Transmission 3
2.1. Introduction 3 2.2. Marketing Margins and Price Transmission 3 2.3. Nature and Intensity of Competition in the EUAgri-Food Sector 5 3. Methodology for measuring Marketing Margins 9
3.1. Introduction 9 3.2. Marketing Margin Methodologies 9 3.3. Data Collection Procedure 10 3.4. Standardisation of the Producer-Consumer Price Data 11 4. Marketing Margins in the EU Agri-Food Sector 15
4.1. Introduction 15 4.2. EU Milk and Dairy Product Price Margins 15 4.3. Meat and Meat Products 21 4.4. Fruit and Vegetables 26 4.5. Summary and Conclusions 31 5. Agro-Economic Policy Proposals 35 Bibliography 39 Annex: Detailed Results on the Marketing Margins in the EU Agri-Food Sector 41

The Gap between Producer Prices and the Prices paid by the Consumer
PE 397.240 viii

The Gap between Producer Prices and the Prices paid by the Consumer
PE 397.240 1
1. Introduction and objectives
1.1. Background In recent years some EU farm prices have experienced a significant decline that has resulted in considerable financial stress to producers. However, in some cases, casual observation suggests that price movements of a similar magnitude, or even in the same direction, were not experienced at the wholesale and/or the food retail levels. For example, a study undertaken by London Economics (2003) found that while producer prices (in nominal terms) remained broadly stable in the EU over the period 1990-2002, aggregate consumer prices and consumer retail food prices increased.
Such evidence, in conjunction with reports on the growing financial hardship in the agricultural sector, cause concern to producers and consumers about the apparently growing gap between producer prices and the prices paid by the consumer (i.e. the marketing margin) and the (lack of) transmission of price changes through the supply chain. These concerns extend to the market structure of the supply chain beyond the farm-gate and the behaviour of the economic agents at the wholesale and the retail levels.
1.2. Objectives of the study This study aims to understand the gap between agricultural producer prices in the EU and the prices paid by the consumer, with a view to explaining the decisive factors in this area for key agricultural sectors and, on the basis of this analysis, to formulate economic and commercial propositions aimed at improving the situation of producer income and/or the prices charged to consumers.
The specific objectives of the study are:
• to make a comparison between producer prices and the prices of food products paid by the consumer between 2003 to 2005, with a view to measuring the extent of the price divergence and its recent development;
• to explain the main factors contributing to the divergence between producer prices and the prices of food products paid by the consumer; and,
to formulate economic and commercial propositions aimed at improving the situation of producer income and/or the prices charged to consumers.

The Gap between Producer Prices and the Prices paid by the Consumer
PE 397.240 2

The Gap between Producer Prices and the Prices paid by the Consumer
PE 397.240 3
2. The nature of competition, marketing margins and price transmission
2.1. Introduction Market structure and the intensity of competition in the EU agri-food supply chain is intrinsically related to the concept of the marketing margin, i.e. the difference between the producer and the consumer price (the marketing margin can be further broken down to the producer-wholesale margin and the wholesale-retail margin) and the concept of price transmission. While this research is concerned with marketing margins and not price transmission per se, the two are fundamentally linked and so the discussion that follows also focuses on the concept of price transmission. Price is the central mechanism by which the various levels (both vertical and horizontal) of a market are linked. The degree and dynamics of price adjustment which determine the marketing margin and the speed by which price changes are transmitted along the producer, wholesale and retail market levels is an important factor reflecting the nature and the organisation of the supply chain, its structure, as well as the actions of participants at the various levels. Section 2.2 provides a theoretical overview of the concept of marketing margins and price transmission and the nature of competition within a supply chain. In Section 2.3, the structure and nature and intensity of competition within the EU agri-food sector is described, with a view to providing the basis on which the results of the assessment and analysis of the marketing margins presented in Section 4 can be explained.
2.2. Marketing margins and price transmission Perfect transmission between prices at different levels of the marketing chain, for example the producer and retail price, is defined as a situation where changes in the producer (retail) price are completely and instantaneously transmitted to the retail (producer) price, prices thereby maintaining the gap (margin) between producer and retail prices. This definition implies that if price changes are not passed-through instantaneously, but after some time, price transmission will be incomplete, and therefore imperfect in the short run (leading to a short term divergence in the gap between producer and retail prices), but perfect in the long run (thereby in the long term maintaining the gap (margin) between producer and retail prices).
The concept of the marketing margin was developed to measure the gap between producer prices and the prices paid by the consumer. The marketing margin represents the costs for all assembling, processing, transporting, marketing and retailing added to the farm products, i.e. the cost of providing a bundle of marketing services (Elitzak 1997), as well valuations for risk and expectations on how markets will evolve. These margins have been examined on many occasions, often in response to concern at a time of sharp movements in farm-gate or retail prices (see for example, London Economics, 2004; Niemi. and Jansik, 2006).
In general, marketing margins tend to vary because of several factors such as changing costs of providing services, the introduction of new technologies and changes in the quantity of the produce marketed. Changes in the marketing margins originating from such shifts in the supply of processing and marketing services do not necessarily indicate deviations from a competitive supply chain and perfect price transmission1.
1 The analysis of price transmission can be thought of as being based on three notions. These are:

The Gap between Producer Prices and the Prices paid by the Consumer
PE 397.240 4
In the event that the market structure of the supply chain beyond the farm-gate is not perfectly competitive, the absolute level and any divergence between producer and retail prices over time will also reflect market power over the consumer and/or producer levels with oligopoly and/or oligopsony price distortions. The oligopoly distortion widens the margin by increasing the consumer price, whilst the oligopsony distortion widens the margin by decreasing the producer price. While the former could imply a degree of adding value at the processing and/or retail stage in the supply chain, the latter most definitively would imply a weakening of the agricultural sector's position and ability to add value in the supply chain.
Consequently, the exercise of market power at any level of the supply chain renders the transmission of price changes imperfect and hence leads to divergence between producer and retail prices. In theory, imperfect price transmission and the divergence between producer and retail prices may occur in both the short and long run due to market imperfections and power over price that implies oligopolistic or oligopsonistic pricing strategies (Wohlgenant, 1985; Schroeter and Azzam, 1991; Goodwin and Holt, 1999). Specifically looking at the issue in the EU agri-food sector, McCorriston et al (1998) showed, by means of comparative statistics, that price transmission and divergence between producer and retail prices depends on the degree of market power and the nature of the processing technology (see also Brorsen et al, 1985; Kinnucan and Forker, 1987; and more recently Prakash, 1998; von Cramon-Taubadel, 1999).
However, even if economic agents at all levels of the marketing chain behave in a perfectly competitive manner, and follow the principles of marginal cost pricing, deviations from perfect price transmission and divergence between producer and retail prices may occur in the short run, although in the long run price transmission is expected to be perfect, thereby restoring the original margin between the producer and retail price.
For example, if the direction of causality runs from producer (consumer) to consumer (producer) prices, price transmission may not be complete in the short run, leading to a divergence between producer and retail prices due to lagged responses of consumer (producer) prices to changes in the producer (consumer) prices and the corresponding slow speed of adjustment of prices along the marketing chain. This may occur as a consequence of many factors such as storage and inventory holding, delays caused in transportation or processing due to a large number of vertical stages in the supply chain, ‘price-levelling’ practices (when retailers, or wholesalers, absorb some of the upstream change in the short run in order to minimise re-pricing costs and consumer disruption), the nature of price reporting and collection methods (Kinnucan and Forker, 1987), as well as agricultural policies and production controls (Gardner, 1975).
In addition to the above reasons for deviations from perfect price transmission and the divergence between producer and retail prices along the marketing chain in the short run, prices may also respond in an asymmetric manner. In this context, asymmetry occurs when the response of the price at one level of the marketing chain, say the consumer price, depends on whether the change in prices in other levels of the chain, such as producer prices, is positive or negative.
Many researchers have worked on asymmetric price responses, but have been unable to formally detect its causes. However, there is a degree of consistency and unanimity in that the majority of authors believe that asymmetric price responses occur due to non perfectly competitive markets (for example, Kinnucan and Forker, 1987; Powers, 1995; Ward, 1982; Pick et al, 1990).
• completeness of adjustment which implies that changes in prices at one level of the supply chain are fully transmitted to the
other levels of the marketing chain; • dynamics and speed of adjustment which implies the process by, and rate at which, changes in prices at one level of the
supply chain are filtered to the other levels of the marketing chain; • asymmetry of response which implies that the changes in prices at one level of the supply chain depend on whether the
change in prices in other levels of the chain is positive or negative. Both the extent of completeness and the speed of the adjustment can be asymmetric.

The Gap between Producer Prices and the Prices paid by the Consumer
PE 397.240 5
Industry concentration and non perfectly competitive behaviour beyond the farm-gate, implies that wholesalers, processors or retailers who have power over price, may exercise pricing strategies that result in a complete and immediate transmission of increases in the producer price to prices upstream as their margins are ‘squeezed’ (thereby maintaining the gap between producer and retail prices) but slow and incomplete pass-through of decreases in the producer price, as their margins are stretched (thereby increasing the gap between producer and retail prices in the short term).
However, asymmetric price transmission and the asymmetric divergence between producer and retail prices may occur due to other reasons than market power. These are as follows:
• Producer prices may respond asymmetrically to changes in wholesale or retail prices due to different adjustment costs faced by processors depending on whether prices are rising or falling. For example, competition between processors with high fixed costs and excess capacity may result in producer prices that increase rapidly when demand for processed product is high, but decrease at a slower rate when demand is low (Bailey and Brorsen, 1989).
• Retail prices may respond asymmetrically to changes in wholesale or producer prices due to the perishable nature of the product, such as milk or fresh fruit. For example, retailers may resist to increase the retail prices following an increase in producer or wholesale prices (thereby decreasing the gap between producer and retail prices in the short term), as rising prices may reduce retail sales and increase the incidence of spoilage (Ward, 1982; Pick et al, 1990).
• Retail prices may respond asymmetrically to changes in producer prices in the presence of intervention mechanisms and supply controls. Processors and retailers when observing a decrease in the producer price may not adjust retail prices rapidly (thereby increasing the gap between producer and retail prices in the short term), as they expect that decreases in producer prices are temporary due to market support. However, processors and retailers will adjust retail prices rapidly in response to increases in producer prices (thereby maintaining the gap between producer and retail prices in the short term).
Therefore, it is important to note that although most researchers agree that asymmetric price response and asymmetric divergence between producer and retail prices is due to market imperfections, concentration and oligopolistic or oligopsonistic pricing behaviour, the theoretical underpinnings of this hypothesis (see for example Wohlgenant, 1999), as well as the related empirical evidence are inconclusive. For example, Griffith and Piggot (1994) detected asymmetries in the Australian lamb and beef markets, but not so in the pork market in spite of the fact than the Australian pork market is concentrated to a higher degree that the other meat markets.
2.3. Nature and intensity of competition in the EU agri-food sector This Section provides a descriptive assessment of the nature and intensity of competition in the EU agri-food sector, focusing in particular on the milk and dairy products, meat and meat products and fruit and vegetables supply chains for the period 2003-2005. This descriptive assessment provides an understanding of the nature and the organisation of the supply chain, its structure, as well as the actions of participants at the various levels, which in turn determine the nature and extent of price transmission and the size of the marketing margin. Porter’s five forces model (Porter, 1980) provides a convenient framework for a temporal investigation of the nature and intensity of competition by examining the main drivers of competition that may have an impact on marketing margins and the nature and extent of price transmission within the EU agri-food sector during the period 2003 to 2005 (Figure 2.1). Within

The Gap between Producer Prices and the Prices paid by the Consumer
PE 397.240 6
Porter’s five-force framework, the nature and intensity of competition in an industry, which may impact on the nature and extent of price transmission, depends on the bargaining power of suppliers and buyers, the barriers to entry, the threat of substitution and the degree of internal rivalry.
INDUSTRYCOMPETITORS
Rivalry among existing firms
POTENTIALENTRANTS
SUBSTITUTES
SUPPLIERS BUYERS
Threat of new entrants
Bargaining powerof buyers
Bargaining powerof suppliers
Threat of substitutes
Figure 2.1: Porter’s five-force framework Source: AGRA CEAS Consulting
2.3.1. Bargaining power of suppliers (producers)
Suppliers have the ability to exert bargaining power on other economic agents within a supply chain by raising prices and/or lowering the quality of purchased products. A supply group can be thought of as having increased bargaining power if it is dominated by few companies and is more concentrated than the industry it sells to.
According to London Economics (2003), by abstracting from many of the characteristics specific to individual supply chains, one can classify marketing relationships into three broad categories:
• Red meats and milk and dairy products: the production sector is still relatively fragmented and a large number of independent producers bring their product to market through largely independent intermediaries (abattoirs and dairies) who compete for sales to retailers.
• Pigmeat, fresh fruits and fresh vegetables: the supply chain is dominated by a relatively small number of vertically integrated businesses whose operations range from the production stage to the sale to retailers. Production is partially contracted out to independent operators under strict terms and conditions.
Moreover the countries covered in the study differ markedly with respect to the importance of farmers’ cooperatives in the supply chain (Table 1).

The Gap between Producer Prices and the Prices paid by the Consumer
PE 397.240 7
Table 1: Extent of producer co-operative marketing (market share), 2003
Milk and dairy
%
Beef and cattle
%
Pigmeat
%
Fruit and vegetables
%
Belgium 50 25 80
Denmark 97 30
Finland 97 74
Germany 68 35 45
Ireland 97
Latvia 25 1
Netherlands 85 60
Austria 94 20
Portugal 65
Slovenia 80 76 76
Spain 40 35 25 15-45
Sweden 99 30
Source: Copa-Cogeca
2.3.2. Bargaining power of buyers (processors and retailers) Buyers have the ability to exert bargaining power on other economic agents within a supply chain by forcing down prices and demanding higher quality products with strict specifications. A buying group can be thought of as having increased bargaining power if it is dominated by few companies and is more concentrated than the industry it buys from. Table 2 presents five firm concentration ratios and retailers' own label share of retail products.
Table 2: Concentration and nature of food retailing, 2002
5-firm concentration ratio Retailers' own brand share
Czech Republic 40% 4%
Denmark 69% 10%
Finland 7%
France 66% 20%
Germany 65% 35%
Hungary 54% 8%
Ireland 52% 7%
Poland 19% 2%
Slovakia 34%
United Kingdom 65% 40%
Source: IGD

The Gap between Producer Prices and the Prices paid by the Consumer
PE 397.240 8
2.3.3. Barriers to entry: New entrants to an industry introduce additional capacity, decrease the sector’s concentration and may erode super-normal profits of established firms by increasing competition. Barriers to entry consist of economies of scale, high capital requirements, patent or brand protection and favourable access to essential resources and inputs.
2.3.4. Product substitution: The extent to which inputs can be substituted in the process of their transformation to a food product, or the extent to which food products can be substituted in consumption (e.g. butter for margarine and beef for pigmeat) also determines the intensity of competition within a sector. The presence of many substitutes for a certain product increases competition in the sector, as the ability of firms to raise prices above the marginal cost of production is hindered.
2.3.5. Internal rivalry: The intensity of rivalry or competition within as sector is determined by the above four forces. In addition, rivalry is also determined by the level of market growth in the sector. In sectors where market growth is slow, competition between established firms focuses on capturing market share, and thus internal rivalry can be thought of as being more intense than that encountered in sectors having faster growing markets.

The Gap between Producer Prices and the Prices paid by the Consumer
PE 397.240 9
3. Methodology for measuring marketing margins
3.1. Introduction This Section reviews a number of methodologies that have been adopted in previous research to assess the gap between producer prices and the prices paid by the consumer (Section 3.2.1.). Based on a brief critique of these methodologies, the approach used in this research is presented (Section 3.2.2.). The data collection procedure, including the geographical and product scope and timeframe of this research is presented in Section 3.3. The process of standardising the price data series to allow for comparisons between prices at the producer and consumer levels is discussed in Section 3.4.
3.2. Marketing margin methodologies
3.2.1. Review of previous methodologies Various approaches to the measurement of the gap between producer prices and the prices of food products paid by the consumer (i.e. marketing margins) have been adopted in previous research. A review of the relevant literature suggests that there are three main approaches:
• National accounting records have been employed to estimate, by deduction, the proportion of consumers' expenditure which is used in the processing and distribution of food (see for example: O’Connell and Connolly 1975). Unfortunately the aggregate nature of the calculation limits the detailed examination of margins.
• The second approach, the use of comparative pricing, has been widely adopted in a number of examinations of prices and margins in the food sector (see for example: Wollen and Turner 1970; Houston, 1979; Digby 1989). The United States Department of Agriculture (Elitzak 1997, Reed and Clark. 1998, Reed et al. 2002) has also employed the technique for many years in the calculation of price margins for a variety of agricultural products.
• The third method identified is the use of individual accounting records. This approach would offer much greater detail although the reluctance of firms to release such data has limited its application.
3.2.2. Methodology used in this research Given the limitations and problems of the first and third approaches presented in Section 3.2.1, this research has used the second approach, the comparative pricing approach, that is commonly used to measure producer-consumer price margins. Using this approach the producer-consumer price margin has been calculated using the following measures:
• the absolute price margin, which is simply the difference between retail price and the farm gate price expressed in Euros across all countries; and,
• the relative price margin, which is simply the producer price expressed as percentage of the consumer price (i.e. the producer's margin of the consumer price).
The use of these measures allows a cross-country and cross-product comparison of the producer-consumer price margin for the selected countries and products over time with a view to measuring the extent of price divergence and its development over the period 2003-2005.

The Gap between Producer Prices and the Prices paid by the Consumer
PE 397.240 10
3.3. Data collection procedure
3.3.1. Geographical and product scope Monthly producer and consumer prices were collected for the period 2003-2005 from a variety of data sources, including: the European Commission (Eurostat and DG Agri), national statistical offices and private statistical bodies.
In total, producer and consumer prices were collected for 233 country and product combinations (Table 3.1.). Due to incomplete price data for a number of product price series, analysis was not carried out on the entire dataset. However, this study presents price data and analysis on 202 country and product producer-consumer price combinations, making this to the authors' knowledge the largest set of price data analysed in any single EU agri-food sector study on producer-consumer price margins:
• Country coverage. National statistical offices in all EU-25 Member States were contacted for price data. Although all EU-25 statistical offices were contacted, price data for only 16 Member States were readily available and provided for this study2. However, the 16 Member States for which price data were available provided a representative country coverage of EU-25 Member States. This was deemed necessary to allow generalised conclusions to be made between country specific factors3 which may be responsible for inter-country variations in marketing margins. Table 3.1 details the 16 (representative) EU Member States covered in this research. The EU Member States for which price data was available for analysis included a sample of northern, western, central and eastern European countries.
• Supply chain and product coverage. The choice of supply chain and agricultural product coverage concentrated on fruit and vegetables, milk and dairy products, and meat and meat products. National statistical offices in all EU-25 Member States were contacted and price data for all possible supply chains and products was requested. Table 3.1 details the number of supply chains and products covered in this research. The number of supply chains and products was limited to the extent that complete and useable price data series were available and were provided.
Table 3: Number of country and product producer-consumer price combinations
Milk and dairy products
Meat and meat products
Fruit and vegetables Total
Country coverage Czech Republic, Denmark, Germany,
Estonia, France, Ireland, Cyprus,
Latvia, Lithuania, Hungary, Malta, Poland, Slovenia, Slovakia, Finland, United Kingdom
Czech Republic, Denmark, Finland, France, Germany,
Ireland, Latvia, Lithuania, Malta, Poland, Slovakia, Slovenia, United
Kingdom
Czech Republic, Denmark, Finland, Germany, Ireland, Latvia, Lithuania,
Malta, Poland, Slovenia, Slovenia,
United Kingdom
Czech Republic, Denmark, Germany,
Estonia, France, Ireland, Cyprus,
Latvia, Lithuania, Hungary, Malta, Poland, Slovenia, Slovakia, Finland, United Kingdom
Total number of supply chain products
47 107 48 202
Source: AGRA CEAS Consulting
2 Of those National Statistical Offices that were unable to supply price data, the majority were only able to supply
price indices which could not be used for this study. 3 Country specific factors responsible for variations in marketing margins might include: different operating costs
(e.g. labour costs), transport costs, waste-management costs, size of store and volume of turnover, local taxes and the level of price competition both on the buying side and the selling side. Different preferences and tastes amongst consumers, which are largely determined by cultural habits, can also play an important role. In addition local market conditions, such as population density, the climate and the state of the supply chain, must also be taken into account (European Commission 2005).

The Gap between Producer Prices and the Prices paid by the Consumer
PE 397.240 11
3.4. Standardisation of the producer-consumer price data As discussed in Section 3.3.1, producer prices for a range of agricultural products and consumer prices for a range of food products were collected to assess the gap between producer prices and the prices paid by the consumer. All producer and consumer prices were converted into Euros to allow comparisons to be undertaken between Member States. In addition, these prices were expressed in the same units of measurement (i.e. volumes or weights) to allow comparisons to be made between producer and consumer prices along the supply chain. In the case of the milk and dairy products supply chains analysed, all prices were expressed in Euros per litre and for the meat and meat products and fruit and vegetable supply chains analysed, all prices were expressed in Euros per kg.
Assessing the gap between producer prices and the prices paid by the consumer requires that like-for-like products are being compared. This is not a problem in the case of fruit, vegetables and liquid milk where the price paid by the consumer for a kg or litre of a particular food product can be directly compared to the price received by the producer for a kg or litre of the same agricultural product. However, this is not the case for all products, particularly those that undergo significant transformation along the supply chain. For example, methodologically it becomes difficult to compare directly the price paid by the consumer for a kg of cheese or butter with the price received by the producer for a litre of raw milk. Similarly, it is difficult to compare directly the price paid by the consumer for a kg of meat with the price received by the producer for a livestock carcass.
When comparing the gap between producer prices and the prices paid by the consumer, it is therefore necessary to standardise the data to allow for such a comparison. The process undertaken in this research to standardise the price data for the dairy products (i.e. butter and cheese) supply chains and meat and meat products (i.e. beef, pigmeat and sheepmeat) supply chains is described in Sections 3.4.1 and 3.4.2.
3.4.1. Standardisation of the retail price for butter and cheese This analysis assumes that a litre of raw milk at farm level can be directly compared to a litre of processed milk at the consumer level. This assumption is commonly made by other researchers (see for example: Collins et al, 2006; MDC, 2006). However, it should be noted that when assessing the gap between producer-consumer prices over time, any divergence between the price series may be due to price movements in value of by-products (i.e. cream) as cream may be removed from the raw milk during processing (i.e. in a perfectly competitive market there may be some divergence in the producer-consumer price margin over time because the producer raw milk price may rise/fall in line with (i.e. respond to) changes in the value of cream).
While it has been assumed in this and other research that producer-consumer prices for liquid milk can be directly compared, the consumer price for butter and cheese cannot be directly compared to the producer price for raw milk. This is because, even if the producer-consumer price series are standardised into the same unit of measurement (e.g. kg), 1 kg of milk does not produce 1 kg of cheese or butter. Furthermore, the manufacture of butter and cheese produces significant by-products which have a commercial value.
Using a similar method to that used by Collins et al (2006), a producer raw milk price equivalent consumer value (in Euros per litre) was calculated from the consumer price series for both butter and cheese. The calculation of the producer raw milk price equivalent consumer value involved adjusting the consumer price of butter and cheese to take into account the following:
• Correction for milk utilisation. A greater volume/weight of raw milk is required for the production of a kg of butter and cheese. In general, 1 kg of butter requires approximately 22.5 kgs of raw milk, although this will vary by Member State and season due to variations in the composition of raw milk. For cheese, 1 kg of product requires approximately 9.4 kgs

The Gap between Producer Prices and the Prices paid by the Consumer
PE 397.240 12
of raw milk, although this will also vary by Member State and season as well as the type of cheese being produced (e.g. mature cheese may require more raw milk per kg of product than soft or processed cheese).
• Correction for by-product values. The manufacture of butter utilises only the fat content of the milk, and thus the remaining non-fat content is used in the production of other dairy products which also have a commercial value. Therefore, this should be deducted to derive the raw milk price equivalent consumer value for butter. This value proportion is governed by the butter/skimmed milk powder value ratio. Based on Collins et al (2006), it is estimated that butter accounted for approximately 42% of the value of raw milk for the period under review.
Similarly only the curd is used in the manufacture of cheese, and thus by-products of the cheese manufacturing process can be used to manufacture whey products (e.g. lactose and whey protein concentrate) which also have a commercial value. Therefore, this should be deducted to derive the raw milk price equivalent consumer value for cheese. This value proportion is governed by the cheese/whey product value ratio. Based on Collins et al (2006), it is estimated that cheese accounted for approximately 89% of the value of raw milk for the period under review.
Given these assumptions, the conversion factor used to derive the producer raw milk price equivalent consumer value for butter was 9.432 (i.e. 22.5*0.4192) and for cheese was 8.33 (i.e. 9.4*0.8862). Consumer prices for butter and cheese were thus divided by this conversion factor to derive the producer raw milk price equivalent consumer value, to allow for a meaningful comparison between raw milk producer prices and the prices paid by the consumer for butter and cheese.
3.4.2. Standardisation of the retail price for meat and meat products As in the case of butter and cheese, the consumer price for meat and meat products cannot be directly compared to the producer deadweight carcass price. This is because the producer deadweight carcass price does not take into account the fact that not all the carcass is useable for meat production and processing into meat products and there is also some drip loss at the abattoir. Using a similar method to that used by MAFF (1999) and London Economics (2004), a producer deadweight carcass price equivalent consumer value (in Euros per kg) was calculated from the consumer price series for meat and meat products. The calculation of this producer deadweight carcass price equivalent consumer value involved adjusting the consumer price of meat and meat products to take into account the following:
• Correction for the useable proportion of the carcass. The consumer meat and meat product price series were adjusted to account only for useable proportion of the carcass (i.e. excluding the bones, fat and trimmings). The correction factors for each meat are provided in Table 4.
• Correction for drip loss. A further adjustment to the consumer meat and meat product price series was necessary to account for the reduction in carcass weight due to drip loss at the abattoir. The correction factors for each meat are provided in Table 4.

The Gap between Producer Prices and the Prices paid by the Consumer
PE 397.240 13
Table 4: Correction coefficients for the useable proportion of the carcass and drip loss
Beef Pork Lamb Proportion of meat (excluding bones, fat and trimmings) coefficient 0.700 0.717 0.757 Drip loss correction coefficient 0.950 0.970 0.980 Source: MLC
Consumer prices for meat and meat products were thus multiplied by each correction coefficient to derive the producer deadweight carcass price equivalent consumer value, to allow for a meaningful comparison between producer carcass deadweight prices and the prices paid by the consumer for meat and meat products.
Due to the lack of availability of consumer price data for all possible joints and cuts, the producer deadweight carcass price equivalent consumer value could not be averaged to represent a value for an entire carcass. The producer-consumer price margins calculated thus represent the margins for individual cuts and joints.
The Gap between Producer Prices and the Prices paid by the Consumer
PE 397.240 14

The Gap between Producer Prices and the Prices paid by the Consumer
PE 397.240 15
4. Marketing margins in the EU agri-food sector
4.1. Introduction Using the methodology presented in Section 3, this Section addresses the first two study objectives, namely:
• to make a comparison between producer prices and the prices of food products paid by the consumer between 2003 and 2005, with a view to measuring the extent of the price divergence and its recent development; and,
• to explain the main factors contributing to the divergence between producer prices and the prices of food products paid by the consumer.
The following sub-Sections provide a comparison between producer and consumer prices and marketing margins for the period 2003 to 2005, by product supply chain. Detailed results (i.e. average of, and trend in, the producer price, consumer price, producer-consumer price margin and price margin ratio over the period) for each product supply chain are presented in Appendix 1. For each product supply chain, possible explanations are presented to explain observed differences between Member States in producer-consumer price margins, as well as their development over the period.
The extent to which structural factors and the nature of competition are directly responsible for observed differences in the absolute level of, and development in, marketing margins between Member States and supply chains is also presented based on quantitative analysis.
4.2. EU milk and dairy product price margins
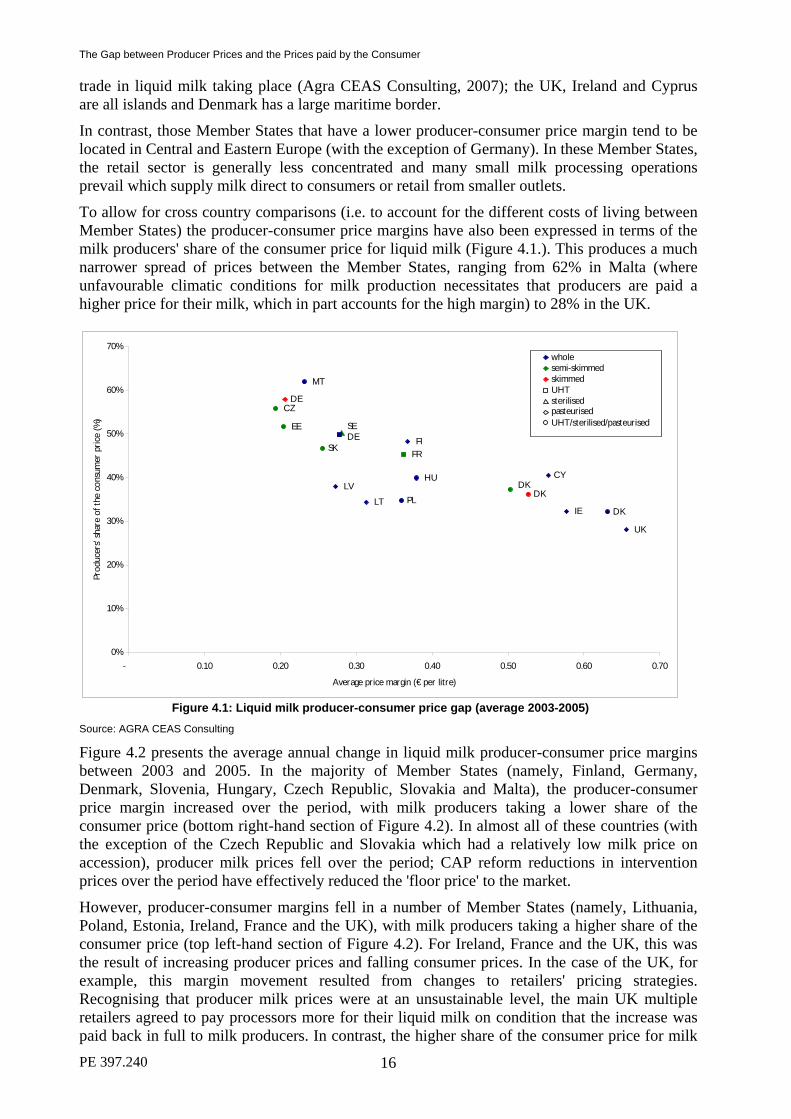
4.2.1. Liquid milk Figure 4.1 presents the average producer-consumer price gap for liquid milk for a range of Member States between 2003 and 2005. Liquid milk price margins have been categorised according to whether they refer to whole, semi-skimmed or skimmed milk as well as whether they refer to pasteurised, UHT or sterilised milk (where known). Overall, the producer-consumer price margins presented range from €0.18 per litre in the Czech Republic to €0.64 per litre in the UK.
In general, price margins are at their highest in the UK, Ireland, Denmark and Cyprus. With the exception of Cyprus, these Member States tend to be located in Northern Europe where the retail sector is generally more concentrated. That said, while a relatively concentrated retail sector does exist in Denmark, virtually all milk produced (97%) at farm level in Denmark is sold through a single farmer co-operative, Arla Foods. Thus, this would suggest that Danish milk producers should have significant bargaining power vis-à-vis the retail sector to exert downward pressure on the marketing margin. It should be noted in this respect that Danish milk producers, in addition to their milk price, receive a dividend from the profits made by the milk processing co-operative, which effectively means that if this was added back to the milk price then the observed producer-consumer price margin would be lower.
Common to all four Member States is that the consumer price series relate to fresh pasteurised milk, which commands a premium price to the consumer. The existence of significant impediments to trade in the liquid milk market limits the extent to which fresh milk can be traded across national borders to equalise consumer prices in different Member States (Agra CEAS Consulting, 2007) should the consumer price be artificially high. Such trade impediments include the fact that fresh pasteurised milk is typically a bulky, perishable and low value product, relative to the cost of transport and the fact that maritime borders inhibit significant

The Gap between Producer Prices and the Prices paid by the Consumer
PE 397.240 16
trade in liquid milk taking place (Agra CEAS Consulting, 2007); the UK, Ireland and Cyprus are all islands and Denmark has a large maritime border.
In contrast, those Member States that have a lower producer-consumer price margin tend to be located in Central and Eastern Europe (with the exception of Germany). In these Member States, the retail sector is generally less concentrated and many small milk processing operations prevail which supply milk direct to consumers or retail from smaller outlets.
To allow for cross country comparisons (i.e. to account for the different costs of living between Member States) the producer-consumer price margins have also been expressed in terms of the milk producers' share of the consumer price for liquid milk (Figure 4.1.). This produces a much narrower spread of prices between the Member States, ranging from 62% in Malta (where unfavourable climatic conditions for milk production necessitates that producers are paid a higher price for their milk, which in part accounts for the high margin) to 28% in the UK.
pasteurisedsterilised
skimmedsemi-skimmedwhole
UK
FISK
SE
PL
MT
HU
LT
LVCY
IE
FR
EE
DE
DE
DK DK
DK
CZ
UHT
UHT/sterilised/pasteurised
0%
10%
20%
30%
40%
50%
60%
70%
- 0.10 0.20 0.30 0.40 0.50 0.60 0.70
Average price margin (€ per litre)
Prod
ucer
s' sh
are
of th
e co
nsum
er p
rice
(%)
Figure 4.1: Liquid milk producer-consumer price gap (average 2003-2005)
Source: AGRA CEAS Consulting
Figure 4.2 presents the average annual change in liquid milk producer-consumer price margins between 2003 and 2005. In the majority of Member States (namely, Finland, Germany, Denmark, Slovenia, Hungary, Czech Republic, Slovakia and Malta), the producer-consumer price margin increased over the period, with milk producers taking a lower share of the consumer price (bottom right-hand section of Figure 4.2). In almost all of these countries (with the exception of the Czech Republic and Slovakia which had a relatively low milk price on accession), producer milk prices fell over the period; CAP reform reductions in intervention prices over the period have effectively reduced the 'floor price' to the market.
However, producer-consumer margins fell in a number of Member States (namely, Lithuania, Poland, Estonia, Ireland, France and the UK), with milk producers taking a higher share of the consumer price (top left-hand section of Figure 4.2). For Ireland, France and the UK, this was the result of increasing producer prices and falling consumer prices. In the case of the UK, for example, this margin movement resulted from changes to retailers' pricing strategies. Recognising that producer milk prices were at an unsustainable level, the main UK multiple retailers agreed to pay processors more for their liquid milk on condition that the increase was paid back in full to milk producers. In contrast, the higher share of the consumer price for milk

The Gap between Producer Prices and the Prices paid by the Consumer
PE 397.240 17
producers in Lithuania, Poland and Estonia was the result of increases in both producer and consumer prices following accession to the EU.
UHT/sterilised/pasteurised
UHT
CZ
DK
DKDK
DE
DE
EE
FR IE
CY
LV
LT
HU
MT
PL
SE SK FI
UK
wholesemi-skimmedskimmed
sterilised pasteurised
-0.06
-0.04
-0.02
0.00
0.02
0.04
0.06
0.08
-3.0 -2.0 -1.0 0.0 1.0 2.0 3.0 4.0
Average annual change in price margin (€ per litre)
Aver
age
annu
al ch
ange
in p
rodu
cers
' sha
re o
f the
con
sum
er p
rice
(%)
Decreasing price margin,higher producer share
Increasing price margin,lower producer share
Figure 4.2: Average annual change in liquid milk producer-consumer price gap (2003-2005)
Source: AGRA CEAS Consulting
4.2.2. Cheese Figure 4.3 presents the average producer-consumer price gap for cheese for a range of Member States between 2003 and 2005. Cheese price margins have been categorised according to whether they refer to hard, hard/semi-hard, semi-hard, semi-soft and soft cheese. Based on this classification, no apparent trend can be observed between cheese type and the extent of the producer-consumer price margin. However, no detailed information was available from the national statistical offices on the level of branding and product differentiation to which the consumer price series collected referred. It is thus possible that some of the variation in cheese price margins between Member States could be product specific, relating to differing national consumer tastes and brand preference.
Overall, the producer-consumer price margins presented range from €0.16 per litre in the Czech Republic to €0.81 per litre in Ireland. In general, price margins are at their highest for a range of different cheeses in Ireland, Denmark, UK, Germany and Slovenia. With the exception of Slovenia, these Member States are typically EU-15 countries, where retail concentration is relatively high. That said, the fact that Denmark (as discussed in Section 4.2.1.) and Slovenia (as discussed in Section 4.2.3.) have large producer co-operative structures is counter-intuitive with a high price margin.
In contrast, those Member States that have a lower producer-consumer price margin tend to be located in Central and Eastern Europe (with the exception of Gouda cheese in Germany). As discussed in Section 4.2.1., the retail sector in these Member States is generally less concentrated and many small cheese manufacturing operations prevail, which may provide milk producers with relatively more bargaining power.
Again, to allow for cross country comparisons the producer-consumer price margins were expressed in terms of the milk producers' share of the consumer price for cheese (Figure 4.3.). This produces a much narrower spread of prices between the Member States, ranging from 25%

The Gap between Producer Prices and the Prices paid by the Consumer
PE 397.240 18
in Ireland (where consumer cheese prices were at their highest) to 60% in the Czech Republic (where consumer cheese prices were at their lowest).
SoftSemi-soft
CZ
DK
DE
DE
UK
FR
IE
CY
LVLT
HU PL
SE
SK
FI
DE
HardHard/semi-hardSemi-hard
0%
10%
20%
30%
40%
50%
60%
70%
- 0.10 0.20 0.30 0.40 0.50 0.60 0.70 0.80 0.90
Average price margin (€ per litre)
Prod
ucer
s' sh
are
of th
e co
nsum
er p
rice
(%)
Figure 4.3: Cheese producer-consumer price gap (average 2003-2005)
Source: AGRA CEAS Consulting Figure 4.4 presents the average annual change in cheese producer-consumer price margins between 2003 and 2005. In general, price margins remained relatively constant in the UK and Germany. However, for the other countries covered there were some significant developments in price margins.
The producer-consumer price margin increased over the period in a number of Member States, with milk producers taking a lower share of the consumer price (bottom right-hand section of Figure 4.4.). In all of these Member States, the consumer cheese price series relate to semi-hard varieties, the price of which increased in all these countries.
In contrast, the producer-consumer price margin decreased over the period with milk producers generally taking a higher share of the consumer price (top left-hand section of Figure 4.4.) in a range of western and central and eastern European Member States. The consumer cheese price series in these Member States relate to a variety of cheese types, including soft, semi-soft, hard and semi-hard differentiated cheese varieties (e.g. farmhouse cheese in Lithuania and Dzintars processed cheese in Latvia).

The Gap between Producer Prices and the Prices paid by the Consumer
PE 397.240 19
SoftSemi-soft
CZ
DK
DEDE
UKFR
IE
CY
LV
LT
HU
PL
SE SK
FI
DE
HardHard/semi-hardSemi-hard
-4.0%
-2.0%
0.0%
2.0%
4.0%
6.0%
8.0%
-6.0 -4.0 -2.0 0.0 2.0 4.0 6.0 8.0
Average annual change in price margin (€ cents per litre)
Aver
age
annu
al ch
ange
in p
rodu
cers
' sha
re o
f the
con
sum
er p
rice
(%)
Decreasing price margin,higher producer share
Increasing price margin,lower producer share
Figure 4.4: Average annual change in cheese producer-consumer price gap (2003-2005)
Source: AGRA CEAS Consulting
4.2.3. Butter
Figure 4.5 presents the average producer-consumer price gap for butter for a range of Member States between 2003 and 2005. Overall, the producer-consumer price margins presented a range from €0.06 per litre in Germany to €0.35 per litre in Denmark. In general, price margins are at their highest in Denmark, France and Slovenia, despite a high proportion of domestic milk production being sold through producer co-operatives in these countries (97% in the case of Denmark, 80% in the case of Slovenia). In contrast, producer-consumer butter price margins are at their lowest in Germany, Poland and Czech Republic.
The main reason for this variation in butter price margins between Member States is likely to be product specific; no detailed information was available from the national statistical offices on the type of butter or level of branding to which the consumer price series collected referred. Correlation analysis revealed that 83% of the variation in producer-consumer margins was due to variations in the consumer price level for butter. In this respect, in the three Member States having the widest price margins, consumer butter prices were significantly higher than in the other Member States considered. Similarly, in the Member States which had the narrowest price margins, the consumer butter price was at its lowest.
To allow for cross country comparisons the producer-consumer price margins were expressed in terms of the milk producers' share of the consumer price for butter (Figure 4.5). This produces a much narrower spread of prices between the Member States, ranging from 42% in Lithuania (where producer milk prices were at their lowest) to 82% in Germany (where, second to Poland, consumer butter prices were at their lowest).

The Gap between Producer Prices and the Prices paid by the Consumer
PE 397.240 20
FR
UK
FI
SK
SE
PL
LT
IEET
DE
DK
CZ
0%
10%
20%
30%
40%
50%
60%
70%
80%
90%
- 0.05 0.10 0.15 0.20 0.25 0.30 0.35 0.40
Average price margin (€ per litre)
Prod
ucer
s' sh
are
of th
e co
nsum
er p
rice
(%)
Figure 4.5: Butter producer-consumer price gap (average 2003-2005)
Source: AGRA CEAS Consulting
Figure 4.6 presents the average annual change in butter producer-consumer price margins between 2003 and 2005. In general, both producer and consumer prices increased over the period in all new Member States, primarily as a result of accession. The only exception was Slovenia, where producer prices generally fell given their relatively high pre-accession level. With the exception of Poland and Lithuania, consumer prices increased by a greater amount than producer prices over the period resulting in a widening of the producer-consumer price margin with milk producers taking a lower share of the consumer price (bottom right-hand section of Figure 4.6). Poland and Lithuania were general exceptions given that their producer milk prices on accession were the lowest of the Member States analysed; thus, producer milk prices in these Member States experienced one of the greatest increases over the period. However, producer-consumer margins fell in a number of Member States (namely, Germany, Ireland, the UK, France as well as Poland), with milk producers taking a higher share of the consumer price (top left-hand section of Figure 4.6). For Ireland, France and the UK, this was the result of increasing producer prices and falling consumer prices (although in the UK consumer prices for butter remained more or less unchanged). In the case of Germany, consumer prices for butter fell while milk prices remained relatively unchanged.

The Gap between Producer Prices and the Prices paid by the Consumer
PE 397.240 21
CZDK
DE
ET
IE
LT
PL
SE
SK
FI
UKFR
-10.0%
-8.0%
-6.0%
-4.0%
-2.0%
0.0%
2.0%
4.0%
6.0%
8.0%
10.0%
12.0%
-3.0 -2.0 -1.0 0.0 1.0 2.0 3.0 4.0 5.0 6.0 7.0
Average annual change in price margin (€ cents per litre)
Aver
age
annu
al ch
ange
in p
rodu
cers
' sha
re o
f the
con
sum
er p
rice
(%)
Decreasing price margin,higher producer share
Increasing price margin,lower producer share
Figure 4.6: Average annual change in butter producer-consumer price gap (2003-2005)
Source: AGRA CEAS Consulting
4.3. Meat and meat products
4.3.1. Beef
Figure 4.7 presents the average producer-consumer price gap for beef for a range of Member States between 2003 and 2005. Based on the extensive price margin data series collected, producer-consumer price margins ranged from €0.69 per kg for boneless fore off beef in the Czech Republic to €27.03 per kg for sirloin in Denmark. With the exception of the producer-consumer price margin for sirloin in Denmark, all other Member States' producer-consumer price margins were distributed relatively evenly across the price margin range.
Unlike pigmeat and lamb (Appendix 1), beef producer prices varied by a greater amount between Member States. This would suggest, given that price transparency exists within the beef sector and beef is a tradable and storable product, that beef may be a more differentiated product by breed and production system than is the case for pigmeat (Section 4.3.2) and lamb (Section 4.3.3).
To allow for cross country comparisons the producer-consumer price margins were expressed in terms of the beef producers' share of the consumer price for beef (Figure 4.7). The spread of price margins ranged from 7% for sirloin in Denmark to 74% for boiling meat and mince in Germany.

The Gap between Producer Prices and the Prices paid by the Consumer
PE 397.240 22
UK-top side
UK-minced
UK-rump
CZ-sirloin
CZ-boneless fore-off
CZ-quality
DK-minced
DK-shoulder
DK-squaresDK-grill steak
DK-sirloin
FR-sirloin
DE-goulash & roast
DE-roulades & sirloin
DE-minced & boiling
IE-striploinIE-sirloin
IE-roundsteakIE-topside
IE-diced pieces
0%
10%
20%
30%
40%
50%
60%
70%
80%
90%
100%
- 5.00 10.00 15.00 20.00 25.00 30.00
Average price margin (€ cents per kg)
Prod
ucer
s' sh
are
of th
e co
nsum
er p
rice
(%)
Figure 4.7: Beef producer-consumer price gap (average 2003-2005)
Source: AGRA CEAS Consulting
Figure 4.8 presents the average annual change in beef producer-consumer price margins between 2003 and 2005. For virtually all Member States, price margins decreased over the period with beef producers taking a higher share of the consumer price (top left-hand section of Figure 4.8). In the main, producer prices for beef increased during the period as domestic supplies were tight and intervention stocks were run down, thereby helping to lift producer prices. Price margins only increased for sirloin beef in the Czech Republic, following a substantial increase in consumer price.

The Gap between Producer Prices and the Prices paid by the Consumer
PE 397.240 23
UK-top sideUK-minced
UK-rump
CZ-sirloin
CZ-fore on bone
CZ-fore on bone
CZ-boneless fore-off
CZ-qualityDK-minced
DK-shoulderDK-squares
DK-grill steak
DK-sirloin
FR-sirloin
IE-round & topside
IE-sirloin
IE-striploin
IE-diced pieces
DE-goulashDE-roast
DE-boiling
DE-rouladesDE-sirloin
DE-minced
-2.0%
-1.0%
0.0%
1.0%
2.0%
3.0%
4.0%
5.0%
6.0%
7.0%
-50.000 -30.000 -10.000 10.000 30.000 50.000 70.000 90.000 110.000 130.000 150.000
Average annual change in price margin (€ cents per kg)
Aver
age
annu
al ch
ange
in p
rodu
cers
' sha
re o
f the
con
sum
er p
rice
(%)
Figure 4.8: Average annual change in beef producer-consumer price gap (2003-2005)
Source: AGRA CEAS Consulting
4.3.2. Pigmeat
Figure 4.9 presents the average producer-consumer price gap for pigmeat for a range of Member States between 2003 and 2005. Based on the extensive price margin data series collected, producer-consumer price margins ranged from €0.91 per kg for pork neck in the Czech Republic to €9.48 per kg for ham in Ireland.
Price margins were generally at their highest in those EU-15 Member States where retail concentration is relatively high (namely the UK, Denmark, Germany, Finland, France and Ireland). In contrast, price margins were at their lowest in the new Member States where retail concentration is relatively low (namely, the Czech Republic, Latvia, Lithuania, Malta, Poland, Slovakia and Slovenia).
Interestingly, pigmeat producer prices were similar between all Member States suggesting that significant price transparency exists within the pigmeat sector, with the tradeability, storability and general standardised nature of pigmeat facilitating producer price equalisation between Member States.
To allow for cross country comparisons the producer-consumer price margins were expressed in terms of the pig producers' share of the consumer price for pigmeat (Figure 4.9). The spread of price margins ranged from 12% for ham in Ireland to 92% in the Czech Republic for pork belly.

The Gap between Producer Prices and the Prices paid by the Consumer
PE 397.240 24
0%
10%
20%
30%
40%
50%
60%
70%
80%
90%
100%
- 1.00 2.00 3.00 4.00 5.00 6.00 7.00 8.00 9.00 10.00
Average price margin (€ per kg)
Prod
ucer
s' sh
are
of th
e co
nsum
er p
rice
(%)
UKCZDKFIFRDEIELVLTMTPLSKSE
Figure 4.9: Pigmeat producer-consumer price gap (average 2003-2005)
Source: AGRA CEAS Consulting
Figure 4.10 presents the average annual change in pigmeat producer-consumer price margins between 2003 and 2005. For the majority of Member States, price margins decreased over the period with pig producers taking a higher share of the consumer price (top left-hand section of Figure 4.10). In the main, producer prices for pigmeat increased during the period as buoyant export demand helped to lift producer prices. In general, consumer prices increased by a lesser amount, and fell in some countries, particularly certain new Member States, following accession to the EU in 2004.
-5.0%
-4.0%
-3.0%
-2.0%
-1.0%
0.0%
1.0%
2.0%
3.0%
4.0%
5.0%
-10.00 -8.00 -6.00 -4.00 -2.00 0.00 2.00 4.00 6.00 8.00 10.00
Average annual change in price margin (€ cents per kg)
Ave
rage
ann
ual c
hang
e in
pro
duce
rs' s
hare
of t
he c
onsu
mer
pric
e (%
)
UKCZDKFIFRDEIELVLTMTPLSKSE
Increasing price margin,lower producer share
Decreasing price margin,higher producer share
Figure 4.10: Average annual change in pigmeat producer-consumer price gap (2003-2005)
Source: AGRA CEAS Consulting

The Gap between Producer Prices and the Prices paid by the Consumer
PE 397.240 25
4.3.3. Sheepmeat Figure 4.11 presents the average producer-consumer price gap for lamb for a range of Member States between 2003 and 2005. Overall, the producer-consumer price margins presented a range from €0.58 per kg for lamb's liver in Ireland to €8.21 per kg for loin chops in Ireland. A similar price margin spread was evident for the various lamb cuts and joints in Ireland, the UK and France, although the price margin for a leg of lamb tended to be considerably lower in Poland. In general, price margins were at their highest in those Member States where retail concentration is relatively high. Interestingly, lamb producer prices were similar between all Member States suggesting that significant price transparency exists within the sheepmeat market, with the tradeability, storability and general standardised nature of lamb facilitating price equalisation between Member States.
To allow for cross country comparisons the producer-consumer price margins were expressed in terms of the sheep producers' share of the consumer price for lamb (Figure 4.11). The spread of price margins ranged from 29% to 86% in Ireland.
IE - whole leg
IE - loin chops
IE - gigot chops
IE - liver
FR - gigot chops FR - chops
FR - roast PL - leg UK - shoulder
UK - loin
IE - pieces inc. neck
0%
10%
20%
30%
40%
50%
60%
70%
80%
90%
100%
- 1.00 2.00 3.00 4.00 5.00 6.00 7.00 8.00 9.00
Average price margin (€ per kg)
Prod
ucer
s' sh
are
of th
e co
nsum
er p
rice
(%)
Figure 4.11: Lamb producer-consumer price gap (average 2003-2005)
Source: AGRA CEAS Consulting
Figure 4.12 presents the average annual change in lamb producer-consumer price margins between 2003 and 2005. With the exception of the price margin for loin chops in Ireland, producer-consumer price margins decreased in all Member States over the period for all cuts and joints. In the main, producer prices for lamb fell slightly during the period (as the EU sheep flock recovered from the outbreak of foot-and-mouth disease in 2001) while at the same time consumer prices for most joints and cuts increased slightly.

The Gap between Producer Prices and the Prices paid by the Consumer
PE 397.240 26
IE - whole leg
IE - loin chops
IE - gigot chops
IE - liver
FR - gigot chops FR - chops
FR - roast
PL - leg
UK - shoulder UK - loin
IE - pieces inc. neck
-16.0%
-14.0%
-12.0%
-10.0%
-8.0%
-6.0%
-4.0%
-2.0%
0.0%
-15.0 0.0 15.0 30.0 45.0 60.0 75.0 90.0
Average annual change in price margin (€ cents per kg)
Aver
age
annu
al ch
ange
in p
rodu
cers
' sha
re o
f the
con
sum
er p
rice
(%)
Increasing price margin,lower producer share
Figure 4.12: Average annual change in lamb producer-consumer price gap (2003-2005)
Source: AGRA CEAS Consulting
4.4. Fruit and vegetables
4.4.1. Fruit Figure 4.13 presents the average producer-consumer price gap for apples and pears for a range of Member States between 2003 and 2005. Overall, pears tend to have a higher producer-consumer price margin than apples. The price margin for pears ranged from €0.44 per kg in Poland to €1.31 per kg in the UK. This compared to a price margin for apples which ranged from €0.12 per kg in Lithuania to €1.12 per kg in the UK.
In general, price margins were at their highest in the UK and Germany where retail concentration and consumer preference for quality products are relatively high. In contrast, price margins were at their lowest in a number of new Member States, namely Lithuania, Poland, Latvia and the Czech Republic.
When expressing the price margins in terms of the producers' share of the consumer price for fruit (Figure 4.13), price margins in Latvia and the Czech Republic become comparable with those in Germany and the UK at between 26% and 43%. However, in Lithuania and Poland average consumer prices for fruit were significantly lower than those in the other Member States during the period, and as a result the producers' share of the consumer price for fruit was much higher.

The Gap between Producer Prices and the Prices paid by the Consumer
PE 397.240 27
UK
LT
LV
DE
CZ UK
PL
DE
0%
10%
20%
30%
40%
50%
60%
70%
80%
90%
100%
- 0.20 0.40 0.60 0.80 1.00 1.20 1.40
Average price margin (€ per kg)
Prod
ucer
s' sh
are
of th
e co
nsum
er p
rice
(%)
ApplesPears
Figure 4.13: Fruit producer-consumer price gap (average 2003-2005)
Source: AGRA CEAS Consulting
Figure 4.14 presents the average annual change in fruit producer-consumer price margins between 2003 and 2005. With the exception of the apple price margin in the UK, producer-consumer price margins generally decreased in all Member States over the period, with fruit producers taking a higher share of the consumer price (top left-hand section of Figure 4.14) in the majority of Member States. This situation was mainly due to falling consumer prices for apples and pears over the period, due to higher domestic supplies in some Member States as a result of good harvests.
UK
LT
LV
DE
CZUK
PL
DE
-10.0%
-5.0%
0.0%
5.0%
10.0%
15.0%
20.0%
25.0%
30.0%
35.0%
40.0%
-25.00 -20.00 -15.00 -10.00 -5.00 0.00 5.00 10.00
Average annual change in price margin (€ cents per kg)
Ave
rage
ann
ual c
hang
e in
pro
duce
rs' s
hare
of t
he c
onsu
mer
pric
e (%
)
ApplesPears
Decreasing price margin,higher producer share
Increasing price margin,lower producer share
Figure 4.14: Average annual change in fruit producer-consumer price gap (2003-2005)
Source: AGRA CEAS Consulting

The Gap between Producer Prices and the Prices paid by the Consumer
PE 397.240 28
4.4.2. Vegetables Figure 4.15 and Figure 4.16 present the average producer-consumer price gap for a range of vegetables in a number of Member States between 2003 and 2005. As would be expected a priori, price margins differ significantly by the type of vegetable and Member State.
Mushrooms tend to have the highest producer-consumer price margin, ranging from €1.26 per kg in Malta to €1.88 per kg in the UK, followed by Brussel sprouts at €1.17 per kg in the UK. For these vegetables, harvesting and handling is a relatively costly process. For potatoes, carrots and onions, producer-consumer price margins are similar ranging from approximately €0.10 per kg to €0.90 per kg. For cabbages, the price margin range was slightly wider, at €0.10 per kg to €1.20 per kg. Price-margins for a number of other vegetables (beetroot, tomatoes and cucumbers) are presented in Figure 4.15 and Figure 4.16, but limited country coverage prevents a meaningful comparison.
In general, price margins were at their highest in the EU-15 Member States represented in the study, and to a lesser extent Slovenia. With the exception of Slovenia, these Member States typically have a relatively concentrated retail sector and consumer preference in these countries is generally for quality vegetables that have often been graded, washed and sorted (necessitating additional marketing costs). Although producer marketing cooperatives exist within the supply chain, a significant proportion of total vegetable production is marketed outside these cooperatives thereby reducing producers' overall bargaining power vis-à-vis other supply chain agents.
In contrast, those Member States that have a lower producer-consumer price margin tend to be located in central and eastern Europe. Generally, the retail sector in these Member States is less concentrated and vegetables are sold direct to relatively local smaller retail outlets, providing some bargaining power in price negotiations.
When expressing the price margins in terms of the producers' share of the consumer price for vegetables, price margins in central and eastern European countries become more comparable with those in EU-15 countries. This is particularly so for the selection of vegetables presented in Figure 4.16 (i.e. non-root crop vegetables).

The Gap between Producer Prices and the Prices paid by the Consumer
PE 397.240 29
CZ
DK
LV
LT
SE
FI
UK
UK
FISE
LT
LV
DE
DK
CZ
LTUK
SE
DE IE
LV
LV
LT
0%
10%
20%
30%
40%
50%
60%
70%
- 0.10 0.20 0.30 0.40 0.50 0.60 0.70 0.80 0.90 1.00
Average price margin (€ per kg)
Prod
ucer
s' sh
are
of th
e co
nsum
er p
rice
(%)
PotatoesOnionsCarrotsBeetroot
Figure 4.15: Root vegetable producer-consumer price gap (average 2003-2005)
Source: AGRA CEAS Consulting
SE MTDE
CZ
DE
LV
LT
MT
PL
LT
UK
PL
PL MT
CZ
IEUK
0%
10%
20%
30%
40%
50%
60%
70%
80%
90%
100%
- 0.20 0.40 0.60 0.80 1.00 1.20 1.40 1.60 1.80 2.00
Average price margin (€ per kg)
Prod
ucer
s' sh
are
of th
e co
nsum
er p
rice
(%)
TomatoesCabbageW.CabbageBrussels SproutsCucumberCucumber (indoor)Mushrooms
Figure 4.16: Other vegetable producer-consumer price gap (average 2003-2005)
Source: AGRA CEAS Consulting
Figure 4.17 and Figure 4.18 present the average annual change in vegetable producer-consumer price margins between 2003 and 2005. In general, although there has been a high degree of change in the absolute value of the price margin for the range of vegetables presented for the EU-15 Member States analysed (namely, the UK, Germany, Denmark, Finland and Ireland), the producers' share of the consumer price has tended to remain relatively constant in these EU-15 Member States (with the possible exception of mushrooms in the UK which experienced a slight

The Gap between Producer Prices and the Prices paid by the Consumer
PE 397.240 30
fall and potatoes in Finland which experienced a slight increase). This would be suggestive of relatively good price transmission and consistent with the findings of London Economics (2003), which found evidence of symmetric price transmission in a number of fruit and vegetable supply chains in selected EU-15 Member States.
In contrast, there was a greater degree of change in the absolute level, and/or ratio, of the producer-consumer price margin for the vegetables examined in the new Member States. Over the period, the majority of producers received a decreasing share of the consumer price. However, based on the available selection of vegetables and new Member States, no apparent trend can be observed to explain the extent of developments in the producer-consumer price margin.
CZ DK
LV
LTSE
FI UK UK
FI
SE
LT
LV
DEDK
CZ
LT UK
SE
DE
IE
LV
LV
LT
-30.0%
-25.0%
-20.0%
-15.0%
-10.0%
-5.0%
0.0%
5.0%
10.0%
15.0%
-15.00 -10.00 -5.00 0.00 5.00 10.00 15.00
Average annual change in price margin (€ cents per kg)
Aver
age
annu
al ch
ange
in p
rodu
cers
' sha
re o
f the
con
sum
er p
rice
(%)
PotatoesOnionsCarrotsBeetroot
Increasing price margin,lower producer share
Decreasing price margin,higher producer share
Figure 4.17: Average annual change in root vegetable producer-consumer price gap (2003-2005)
Source: AGRA CEAS Consulting

The Gap between Producer Prices and the Prices paid by the Consumer
PE 397.240 31
SE
MT
DE
CZ
DE
LVLT
MT
PL
LT
UK
PL
PL
MT
CZ
IE
UK
-25.0%
-20.0%
-15.0%
-10.0%
-5.0%
0.0%
5.0%
10.0%
-10.00 -5.00 0.00 5.00 10.00 15.00 20.00 25.00
Average annual change in price margin (€ cents per kg)
Ave
rage
ann
ual c
hang
e in
pro
duce
rs' s
hare
of t
he c
onsu
mer
pric
e (%
)
TomatoesCabbageW.CabbageBrussels SproutsCucumberCucumber (indoor)Mushrooms
Increasing price margin,lower producer share
Decreasing price margin,higher producer share
Figure 4.18: Average annual change in other vegetables producer-consumer price gap (2003-2005)
Source: AGRA CEAS Consulting
4.5. Summary and conclusions The producer-consumer price margin analysis undertaken for this study has extensively analysed producer-consumer price data from 16 EU Member States and covering three different broad product sectors (milk and dairy products, meat and meat products and fruit and vegetables). Analysis was carried out to measure producer-consumer price margins between 2003 and 2005, with a view to measuring the extent of the price divergence and its recent development as well as seeking to explain the main factors contributing to this divergence. In summary, producer-consumer price margins were found to vary significantly by both Member State and product supply chain:
• In the milk and dairy products supply chains, producer-consumer price margins were generally higher for cheese and milk and lower for butter, with milk producers' share of the consumer price ranging from 28% to 62% for liquid milk, 25% to 60% for cheese and 42% to 82% for butter.
• In the meat and meat products supply chains, producer-consumer price margins were generally wider due to the number of different cuts and joints which have different consumer values. Price margins were widest for pigmeat ranging from 12% to 92%, followed by 7% to 74% for beef and 29% to 86% for lamb.
• In the fruit and vegetables supply chains, there was a wide variation in price margins by both product and Member State. Price margins for fruit (apples and pears) ranged from 26% to 74% and for all vegetables from 14% to 82%.
Similarly, the extent to which the producer-consumer price margins have evolved over the period were found to vary significantly by both Member State and product supply chain:
• In the milk and dairy products supply chains, there were significant differences in the development of producer-consumer price margins over the period. In general, price margins widened in more Member States than not, although the converse was true when looking specifically at the price margins for cheese, with price margins narrowing in the majority of Member States. That said, in all milk and dairy product supply chains analysed, the extent to

The Gap between Producer Prices and the Prices paid by the Consumer
PE 397.240 32
which price margins widened was greater than the extent to which price margins narrowed over the period (which can be clearly seen in Figure 4.2, Figure 4.4, and Figure 4.6 which indicate that the positive x-axis, i.e. reflecting a widening price gap, is longer than the negative x-axis).
• In the meat and meat products supply chains, there were significant differences in the development of producer-consumer price margins over the period. In general, price margins widened in more Member States than not, in the case of sheepmeat. However, the converse was true when looking at the price margins for beef and pigmeat, with price margins narrowing in the majority of Member States. That said, in both the beef and sheepmeat supply chains analysed, the extent to which price margins widened was greater than the extent to which price margins narrowed over the period (which can be clearly seen in Figure 4.8 and Figure 4.12 which indicate that the positive x-axis, i.e. reflecting a widening price gap, is longer than the negative x-axis).
• In the fruit and vegetables supply chains, there were significant differences in the development of producer-consumer price margins over the period. In general, price margins widened in more Member States than not, in the case of vegetables. However, in the case of fruit the converse was true with price margins narrowing in the majority of Member States.
Although the results suggest that accession of the 10 central and eastern European Member States to the EU in May 2004 had a significant impact on the producer-consumer price margin, the very high degree of variation in explanatory structural, market and product characteristics between EU Member States makes it extremely difficult to draw generalisable conclusions for the EU as a whole, or indeed individual supply chains. The analysis presented in Section 4 has provided a number of possible explanatory factors which may explain both the extent of the price divergence between producer and consumer prices and its recent development. These include:
• retail concentration and pricing policies; • the extent of co-operative marketing; • the perishable nature of the product; • the degree of product handling, storage and processing; • the degree of product differentiation and branding; • share of raw material in end product value; • consumer purchasing preferences; • legislative and regulatory frameworks; • market shocks; and, • the degree of self sufficiency and cross border trade.
Given this, the extent to which any single factor can be isolated and used to explain the extent of, and change in, the producer-consumer price margin is limited. Such factors combine synergistically to affect the extent of the producer-consumer price margin and in this respect some factors may indeed work to negate the impact on the price margin of other factors.
Looking specifically at the issue of bargaining power within the supply chain, which is often cited as a central factor explaining divergence in producer-consumer price margins, correlation analysis was undertaken to measure the relationship between the extent of the price margin and concentration in the retail sector (Table 5) and the extent of producer co-operative marketing (Table 6).
In general, the results suggest that over the short time period analysed (i.e. 2003-2005), the extent to which retail concentration directly affects the producer-consumer price margin varies by product supply chain. These results suggest that retail concentration has the greatest impact

The Gap between Producer Prices and the Prices paid by the Consumer
PE 397.240 33
on the fruit and vegetable producer-consumer price margin (particularly the producer's share of the consumer price), followed by the meat and meat products producer-consumer price margin. In contrast, retail concentration was found to have a relatively insignificant impact on producer-consumer price margins in the milk and dairy products supply chain (indicating that retail concentration is not the only factor responsible for the divergence in the producer-consumer price margin). In all cases, as would be expected a priori, an increase in retail concentration has a positive association on the absolute producer-consumer price margin and a negative association on the producer's share of the consumer price (Table 5).
Table 5: Correlation between the producer-consumer price margin and retail concentration (C5 concentration ratio), 2003-2005
Average price margin Relative price margin
Correlation coefficient
R-square Correlation coefficient
R-square
Milk and dairy products 0.12 0.01 -0.08 0.01
Meat and meat products 0.46 0.21 -0.46 0.21
Fruit and vegetables 0.49 0.24 -0.73 0.53
Source: AGRA CEAS Consulting
Results presented in Table 6 suggest that, over the short period analysed, producer co-operative marketing has a counterintuitive effect on the producer-consumer price margin. Although the results suggest that the extent of producer co-operative marketing has a relatively low impact on both the fruit and vegetable and milk and dairy products producer-consumer price margins (indicating that degree of co-operative marketing is not the only factor responsible for the divergence in the producer-consumer price margin), the results suggest that in both cases, an increase in co-operative marketing has a positive association on the absolute producer-consumer price margin and a negative association on the producer's share of the consumer price. The reason for this spurious result probably lies in the fact that producer members of co-operatives often receive, in addition to their agricultural product price, a dividend from the profits made by the co-operative, which effectively means that if this was added back to the producer price then the results of the correlation would be different.
Table 6: Correlation between the producer-consumer price margin and extent of producer co-operative marketing (market share), 2003-2005
Average price margin Relative price margin
Correlation coefficient
R-square Correlation coefficient
R-square
Milk and dairy products 0.26 0.07 -0.27 0.07
Meat and meat products n.a. n.a. n.a. n.a.
Fruit and vegetables 0.45 0.20 -0.14 0.02
n.a. = not available
Source: AGRA CEAS Consulting
Overall, the aforementioned very high degree of variation in explanatory structural, market and product characteristics between EU Member States makes it extremely difficult to draw general conclusions for the EU as a whole, or indeed individual supply chains. Although it is difficult to draw simplistic conclusions, on balance from the evidence reviewed there would appear to have been a general further widening of producer-consumer price margins over the period analysed in a number of the supply chains and Member States covered. While this would be consistent with the view of higher retailer concentration and consequent increased bargaining power, the picture provided by this partial analysis is by no means uniform and may be somewhat misleading

The Gap between Producer Prices and the Prices paid by the Consumer
PE 397.240 34
given that some factors may indeed work to negate the impact on the price margin of other factors.
Furthermore, it should be emphasised that the results and conclusions drawn are based on a relatively short timeframe (a three year period from 2003 to 2005). Therefore, when measuring how producer-consumer price margins have evolved over time, the results do not consider the trend over the longer term. For example, it is possible that the observed narrowing (widening) of some of the producer-consumer price margins during the 2003-2005 period may be a correction to a widening (narrowing) of the price margins pre-2003, with the long-term trend being one of a relatively constant price margin, suggesting perfect price transmission but with a time lag.
Similarly, contrasting trends may have been observed in the period post-2005. While commodity prices have been increasing in recent months with subsequent increases in producer prices, such increases have not necessarily been enjoyed by all producers. As shown in Table 7, between quarter 1 of 2006 and quarter 2 of 2007, producer prices for milk, livestock and fresh fruit have declined slightly. That said, in the milk and dairy products supply chain, for example, significant increases have occurred in more recent months for which price data is currently not available.
Table 7: Change in producer prices between Jan-Mar 2006 and Apr-Jun 2007
EU-15 EU-25
Fruit and vegetables
Fresh vegetables -15% -13%
Potatoes 79% 87%
Fresh fruit 5% 6%
• Dessert apples 38% 43%
• Dessert pears 48% 47%
Livestock (meat and meat products)
Cattle -5% -5%
Pigs -5% -5%
Sheep and goats -6% -6%
Milk (and dairy products)
Cows milk -1% -1%
Source: European Commission (Eurostat)

The Gap between Producer Prices and the Prices paid by the Consumer
PE 397.240 35
5. Agro-economic policy proposals Based on the analysis and findings of the study, this Section addresses the third objective of the study, namely "to formulate economic and commercial propositions aimed at improving the situation of producer income and/or the prices charged to consumers". A number of implementable agro-economic policy recommendations are presented, designed to improve the situation in producer income and/or prices charged to consumers on an individual supply chain basis and where appropriate a pan-EU-27 basis.
As discussed in Section 4.5, these recommendations do not draw directly on the conclusions of the study since as might be expected in a study covering a relatively short time-frame, there appears to be only limited direct evidence of an impact of particular structural, market and product characteristics within the food chain on the extent and evolution of the producer-consumer price margin which can be generalised across the EU, or individual supply chains, as a whole. Nevertheless a number of pertinent observations can be made.
Setting a 'floor' to prices within the EU, as occurs under the CAP, will tend to reinforce the market power of producers in that it reduces the downward pressure which supply chain participants (who may or may not have greater market power) downstream from agriculture can exert. However, successive reforms to the CAP have resulted in reductions in intervention prices, thereby reducing the 'floor' price to the market. The extent to which benefits accruing from agricultural support price cuts will be distributed to consumers will vary from product to product and market to market in accordance with the relative bargaining power of the actors involved in each chain.
Economic theory, however, suggests that there is scope to ensure that producers’ relative position within the price determination process is improved by increasing their relative market or ‘countervailing’ power within the supply chain. Recommendations would therefore include strengthening co-operative structures and Producer Groups amongst producers and/or finding new niche or differentiated markets (e.g. investing in more high-quality products, entirely new products, new forms of distribution and co-operation). Looking at these points in more detail:
• Funding available under Pillar I of the Common Agricultural Policy. With the possible exception of the milk and milk products supply chain in some countries, the market shares in most other supply chains of relevance to this study (for which data were available) tend to be relatively low (Section Table 2.1, Section 2.3.1). Separately, it is estimated that in the fruit and vegetable sector there were some 1,478 producer organisations in 2004 with an average EU market share of some 34% but with a range in this regard running from under 10% in Cyprus, Hungary, Poland and Portugal to over 80% in Belgium (Duponcel, 2006).
This suggests there is scope for increasing EU support to the formation and development of producer co-operative organisations to other supply chains. To date, at EU level at least, this primarily occurs in the fruit and vegetable sector where under the fruit and vegetable Common Market Organisation4 adopted in 1996, it was considered necessary, given the increasing concentration of the retail sector, to reinforce the position of producers on the market by encouraging the grouping of supply. The funding for Producer Groups in this sector takes place under the Common Agricultural Policy's Pillar 1 provisions for agricultural market support (EC Reg. 2200/96 Article 15) in Budget Line 05020803. It
4 Council Regulation (EC) No 2200/96 of 28 October 1996 on the common organisation of the market in fruit and
vegetables(OJ L 297, 21.11.1996, p. 1), as last amended by Regulation (EC) No 47/2003 (OJ L 7, 11.1.2003, p. 64). Council Regulation (EC) No 2201/96 of 28 October 1996 on the common organisation of the market in processed fruit and vegetable products (OJ L 297, 21.11.1996, p. 29), as last amended by the Protocol concerning the conditions and arrangements for admission of the Republic of Bulgaria and Romania to the European Union — Annex III: List referred to in Article 16 of the Protocol: adaptations to acts adopted by the institutions — 2. Agriculture (OJ L 157, 21.6.2005, p. 58).

The Gap between Producer Prices and the Prices paid by the Consumer
PE 397.240 36
provided operational funds and payments amounting to €558 million in 2005, €646 million (appropriations) in 2006 and €644 million (appropriations) in 2007.
• Funding available under Pillar II of the Common Agricultural Policy. In addition, EU funding for most types of producers has been and is available under Pillar II of the Common Agricultural Policy. In the 2000-06 programming period funding was available under the following measures:
o improving processing and marketing of agricultural products: €3,309 million;
o marketing of quality agricultural products: €236 million;
o quality food schemes (2004): €8 million; and,
o producer groups (IFDR5): €12 million.
Total EU funding therefore amounted to some €3,565 million, or €509 million annually over the period. Funding for Producer Groups within the EU-15 was not available under the Rural Development Regulation in this period because it was considered that funding under the Common Market Organisations was sufficient. The aid scheme existing under Council Regulation (EC) No 952/97 was therefore discontinued6.
• EU funding to improve marketing and processing in the 2007-13 programming period is available under the following measures:
o adding value to agricultural and forestry products: €5,080 million;
o producer groups: €375 million;
o participation of farmers in food quality schemes: €278 million; and,
o LEADER 441: Implementing local development strategies: competitiveness: €449 million.
Total funding in this period will therefore amount to €6,182 million or €883 million annually. This represents an increase of 73%, although the EU comprises 27 full members in the current programming period.
Whilst direct funding for Producer Groups now takes place under Pillar II, other changes in funding emphasis should be noted. Between 2000 and 2006, the vast majority of funding (93%) was for simply improving the processing and marketing of agricultural products. In the second programming period the bulk of the funding is for adding value to agricultural and forestry products (82%). This is:
more explicit in terms of how the funds can be used; and,
includes forestry products as well as agricultural ones.
Thus, the extent to which the increased funds can actually be used to support improved marketing and processing of agricultural products is therefore unclear and will depend on implementation at the regional/national level.
Generally it should be noted that the Community Strategic Guidelines for rural development7 explicitly prioritise spending on human capital measures (rather than physical capital and market-orientation measures) and this focus is likely to reduce support for Producer Groups under the Rural Development Regulation.
5 Funds available for rural development in the 10 Member States who joined the EU in 2004. 6 Council Regulation (EC) No 1257/1999 of 17 May 1999 on support for rural development from the European
Agricultural Guidance and Guarantee Fund (EAGGF) and amending and repealing certain Regulations. 7 CEC (2005) Proposal for a Council Decision on Community Strategic Guidelines for Rural Development
(Programming period 2007–13), COM(2005) 304 final, Brussels, 5.7.2005, {SEC(2005) 914}.

The Gap between Producer Prices and the Prices paid by the Consumer
PE 397.240 37
While the levels of funding for Producer Groups could be improved and targeted to sectors in addition to fruit and vegetables, it should be noted that in the fruit and vegetable sector, where the funding has been most focused, the macroeconomic impact of the funding appears not to have been very substantial to date, although clearly this is hard to measure. In this respect, the market share held by producer organisations has remained under 40%, compared to a Common Market Organisation target of 60% and there remains a very large number (1,478) of relatively small producer organisations in the sector, thus reducing negotiating power vis-à-vis larger retail groups (Duponcel, 2006).
On the other hand, support via the Common Market Organisation had facilitated the creation of very large Producer Groups (in particular in Belgium, the Netherlands and Italy) but even so, elements of the asymmetry of power which makes producers price takers could not be removed (e.g. the perishability of produce and the scope for price arbitrage at EU or international level) (Duponcel, 2006). However, in this context Duponcel (2006) noted that the higher the degree of quality/speciality/innovation, the more readily the Producer Group would be able to improve price margins (e.g. the evolution of Dutch tomato production in the last ten years – segmentation) and as consumption patterns evolve this is increasingly occurring/likely to occur.
Support for marketing initiatives available for individual producers under certain measures of the Rural Development Regulation will undoubtedly provide an advantage to beneficiaries. However, following the same principle as that behind Producer Groups, producers coming together to form co-operatives are likely to receive benefits in excess of those available acting alone. This call for producer co-operation, for example, is a core element of the vision set out by the Sustainable Farming and Environment: Action Towards 2020 group8 which was established by the Welsh Assembly Government to provide recommendations on a longer term strategy for supporting the (financial and environmental) sustainability of Welsh farming and the countryside. Elements of this vision have relevance throughout the EU.
In conclusion, therefore, we would recommend that further consideration be given to strengthening Producer Groups beyond those sectors already receiving support and encouraging the formation of producer and agri-food co-operatives in order to enable the evolution of greater bargaining power for generally fragmented producers.
8 Sustainable Farming and Environment: Action Towards 2020 group (2007), Sustainable Farming and
Environment: Action Towards 2020, report to the Welsh Assembly Government.

The Gap between Producer Prices and the Prices paid by the Consumer
PE 397.240 38

The Gap between Producer Prices and the Prices paid by the Consumer
PE 397.240 39
Bibliography Agra CEAS Consulting, The potential for GB-European trade in liquid milk, Report for the UK Department for the Environment, Food and Rural Affairs, 2007.
Bailey, D. V. and Brorsen B.W., "Price Asymmetry in Spatial Fed Cattle Markets", Western Journal of Agricultural Economics, 14, pp. 246-252, 1989.
Brorsen, B.W., Chavas, J.P., Grant, W.R., et al., "Marketing Margins and Price Uncertainty: The Case of the US Wheat Market", American Journal of Agricultural Economics, 67, pp. 521-528, 1985.
Collins, A., Enright, P., Keane, M., et al., Food prices in Ireland - Report for the Consumer Liason Panel, Department of Food Business and Development, University College Cork, 2006.
von Cramon-Taubadel, S., "Estimating Asymmetric Price Response with the Error Correction Representation: An Application to the German Pork Market", European Review of Agricultural Economics, 25, pp. 1-18, 1999.
Digby, M., "Marketing Margins in the Meat Sector, England and Wales 1978-198", Journal of Agricultural Economics, 40, pp. 129-142, 1989.
Duponcel, M., Role and importance of producer organisations in the fruit and vegetable sector of the EU, Presentation to the CAL-MED second workshop, Washington 7-8 December 2006.
Elitzak, H., Food Cost Review, 1996, U.S. Department of Agriculture, Economic Research Service, AER-761, 1997.
Gardner, B.L., "The Farm-Retail Price Spread in a Competitive Food Industry", American Journal of Agricultural Economics, 59, pp. 399-409, 1975.
Goodwin, B.K. and Holt, M.T., "Price Transmission and Assymetric Adjustment 81 the US Beef Sector", American Journal of Agricultural Economics, 73, pp. 630-637, 1999.
Griffith, G. and Piggot, N. "Assymetry in the Beef, Lamb and Pork Farm-Retail Transmission in Australia", Agricultural Economics, 10, pp. 107-316, 1994.
Houston, G., The Behaviour of Prices and Margins of Selected Food Products in the United Kingdom, Seminar Paper OECD, Paris, 1979.
Kinnucan, H.W., and Forker, O.D., "Asymmetry in Farm-Retail Price Transmission for Major Dairy Products", American Journal of Agricultural Economics, 69, pp. 285-292, 1987.
London Economics, Investigation of the determinants of farm-retail price spreads, Report for Defra, 2003.
MDC, Dairy supply chain margins 2005-2006, UK Milk Development Council, 2006.
Niemi, J. and Jansik, C., Price formation and margin behaviour in the Finnish food markets, in: the 16th Annual World Food & Agribusiness Symposium, June 10-13, 2006, Buenos Aires, Argentina, 2006.

The Gap between Producer Prices and the Prices paid by the Consumer
PE 397.240 40
Pick, D.H., Karrenbrock, J. and Carman. H.F., "Price Asymmetry and Marketing Margin Behaviour: An Example for California-Arizona Citrus", Agribusiness, 6, pp. 75-84, 1990.
Porter, M. E., Competitive Strategy, Macmillan Free Press, New York, 1980.
Powers, N.J., "Sticky Short Run Prices and Vertical Pricing: Evidence from the Market for Iceberg Lettuce", Agribusiness, 11, pp. 57-75, 1995.
Prakash, A., The Transmission of Signals in a Decentralised Commodity Marketing System: the Case of the UK Pork Market, unpublished Ph.D. Thesis, University of London, 1998.
Reed, A.J. and J.S. Clark., "Nonfarm Input Prices, Price Margins, and Consumer Food Prices", U.S. Department of Agriculture, Economic Research Service, Technical Bulletin N° 1867, 1998.
Reed, A., Elitzak, H. and Wohlgenant, M., "Retail-Farm Price Margins and Consumer Product Diversity", U.S. Department of Agriculture, Economic Research Service, Technical Bulletin No. 1899, 29, 2002.
Schroeter, J.R., and Azzam, A., "Marketing Margins, Market Power, and Price Uncertainty", American Journal of Agricultural Economics, 73, pp. 990-999, 1991.
Ward, R.W., "Asymmetry in Retail, Wholesale and Shipping Point Prices for Fresh Fruits and Vegetables", American Journal of Agricultural Economics, 62, pp. 205-212, 1982.
Wohlgenant, M.K., "Product Heterogeneity and the Relationship between Retail and Farm Prices", European Review of Agricultural Economics, 26, pp. 219-227, 1999.
Wohlgenant, M.K., "Competitive Storage. Rational Expectations and Short Run Food Price Determination", American Journal of Agricultural Economics, 67, pp. 739-748, 1985.
Wollen, G.H. and Turner, G., "The Cost of Food Marketing", Journal of Agricultural Economics, 21, pp. 63-83, 1970.

The Gap between Producer Prices and the Prices paid by the Consumer
PE 397.240 41
Annex: Detailed results on the marketing margins in the EU agri-food sector
This annex presents the detailed results on producer and consumer prices and marketing margins in the EU agri-food sector over the period 2003-2005. Specifically, for each product supply chain covered the following results are presented:
• average and trend in the producer price over the period;
• average and trend in the consumer price over the period;
• average and trend in the producer-consumer price margin over the period; and,
• average and trend in the price margin ratio (average producer price as a % of the average consumer price) over the period.
1. EU milk and dairy product price margins Data on the absolute value of, and developments in, the producer-consumer price margin for liquid milk, cheese, butter and yoghurt are presented in the following tables.
Table 8: Liquid milk producer-consumer price margins in selected EU Member States, 2003-2005
Average producer
price (€ per litre)
Average consumer
price (€ per litre)
Average price margin
(€ per litre)
Producer price as a % of consumer
price Czech Republic Half-cream milk 0.24 0.44 0.19 56.0% Denmark Whole milk 0.30 0.93 0.63 32.0% Denmark Semi-skimmed milk 0.30 0.80 0.50 37.0% Denmark Skimmed milk 0.30 0.83 0.53 36.0% Germany Fresh milk (fat 3.5%, carton) 0.28 0.56 0.28 50.0% Germany UHT milk (fat 1.5%) 0.28 0.49 0.21 58.0% Estonia Milk (fat 2.5%) 0.22 0.42 0.20 52.0% France UHT milk semi-skimmed 0.30 0.66 0.36 45.0% Ireland Fresh milk, pasteurised full fat 0.27 0.85 0.58 32.0% Cyprus Fresh whole milk 0.38 0.93 0.55 41.0% Latvia Fresh whole milk 0.17 0.44 0.27 38.0% Lithuania Pasteurised milk 0.16 0.48 0.31 34.0% Hungary Whole milk 0.25 0.63 0.38 40.0% Malta Whole milk 0.38 0.61 0.23 62.0% Poland Whole milk 0.19 0.55 0.36 35.0% Slovenia Sterilised milk (fat 1.4-1.6%) 0.27 0.55 0.28 50.0% Slovakia Semi-skimmed milk 0.22 0.48 0.26 47.0% Finland Whole milk 0.34 0.71 0.37 48.0% United Kingdom Whole milk 0.26 0.91 0.66 28.0% Source: Agra CEAS analysis

The Gap between Producer Prices and the Prices paid by the Consumer
PE 397.240 42
Table 9: Linear regression analysis on the liquid milk producer-consumer price margins in selected EU Member States, 2003-2005
Change in average
producer price
(€/c per yr) (ß-value)
Change in average
consumer price
(€/c per yr) (ß-value)
Change in average price
margin (€/c per yr) (ß-value)
Change in producer
price margin (€/c per yr) (ß-value)
Czech Republic Half-cream milk 1.46 2.84 1.38 -0.3% Denmark Whole milk -1.62 -1.07 0.54 -1.4% Denmark Semi-skimmed milk -1.62 -2.20 -0.58 -1.0% Denmark Skimmed milk -1.62 -1.93 -0.31 -1.1% Germany Fresh milk (fat 3.5%, carton) -0.31 0.39 0.70 -0.9% Germany UHT milk (fat 1.5%) -0.31 0.10 0.41 -0.7% Estonia Milk (fat 2.5%) 3.17 3.05 -0.12 3.9% France UHT milk semi-skimmed 0.43 -0.48 -0.91 1.0% Ireland Fresh milk, pasteurised full fat 0.77 -0.31 -1.08 1.0% Cyprus Fresh whole milk 1.73 4.25 2.52 0.0% Latvia Fresh whole milk 3.61 5.96 2.35 3.0% Lithuania Pasteurised milk 2.78 0.93 -1.84 5.2% Hungary Whole milk -0.86 -0.16 0.71 -1.3% Malta Whole milk -3.16 -0.30 2.86 -4.9% Poland Whole milk 4.24 4.22 -0.02 4.9% Slovenia Sterilised milk (fat 1.4-1.6%) -1.16 -0.42 0.74 -1.7% Slovakia Semi-skimmed milk 1.33 3.50 2.18 -0.7% Finland Whole milk -0.12 0.14 0.27 -0.3% United Kingdom Whole milk 0.79 -1.57 -2.36 1.4% Source: Agra CEAS analysis
Table 10: Cheese producer-consumer price margins in selected EU Member States, 2003-2005
Average producer
price (€ per litre)
Average consumer
price (€ per litre)
Average price margin
(€ per litre)
Producer price as a % of consumer
price Czech Republic Edam 0.24 0.41 0.16 60.1% Denmark Cheese 45% 0.30 1.03 0.73 29.0% Germany Emmental 0.28 0.68 0.40 41.5% Germany Gouda 0.28 0.53 0.25 53.1% Germany Butter cheese 0.28 0.96 0.68 29.5% France Camembert (45% fat) 0.30 0.78 0.48 38.3% Ireland Cheddar 0.27 1.09 0.81 25.3% Cyprus Edam type 0.38 0.88 0.50 43.2% Latvia Dzintars processed 0.17 0.53 0.36 31.9% Lithuania Ferme 0.16 0.48 0.32 34.0% Hungary Trappist-style 0.25 0.58 0.33 43.4% Poland Yellow 0.19 0.42 0.23 45.6% Slovenia Emmental 0.27 0.97 0.70 28.2% Slovakia Edam 0.22 0.49 0.26 46.0% Finland Edam 0.34 0.90 0.56 38.2% United Kingdom Cheddar 0.26 0.95 0.69 27.0% Source: Agra CEAS analysis

The Gap between Producer Prices and the Prices paid by the Consumer
PE 397.240 43
Table 11: Linear regression analysis on the cheese producer-consumer price margins in selected EU Member States, 2003-2005
Change in average
producer price (€/c per yr) (ß-value)
Change in average
consumer price
(€/c per yr) (ß-value)
Change in average price
margin (€/c per yr) (ß-value)
Change in producer price
margin (€/c per yr) (ß-value)
Czech Republic Edam 1.46 3.05 1.58 -0.9% Denmark Cheese 45% -1.62 0.68 2.29 -1.7% Germany Emmental -0.31 -0.57 -0.26 -0.1% Germany Gouda -0.31 -0.42 -0.11 -0.2% Germany Butter cheese -0.31 -0.50 -0.19 -0.2% France Camembert (45% fat) 0.43 -0.57 -0.99 0.8% Ireland Cheddar 0.77 2.25 1.48 0.2% Cyprus Edam type 1.73 9.01 7.28 -2.5% Latvia Dzintars processed 3.61 -0.26 -3.86 6.9% Lithuania Ferme 2.78 1.53 -1.25 4.6% Hungary Trappist-style -0.86 -2.50 -1.64 0.4% Poland Yellow 4.24 4.19 -0.05 5.3% Slovenia Emmental -1.16 -4.27 -3.11 0.0% Slovakia Edam 1.33 2.80 1.47 0.0% Finland Edam -0.12 2.65 2.78 -1.3% United Kingdom Cheddar 0.79 0.64 -0.15 0.7% Source: Agra CEAS analysis
Table 12: Butter producer-consumer price margins in selected EU Member States, 2003-2005
Average producer
price (€ per litre)
Average consumer
price (€ per litre)
Average price margin
(€ per litre)
Producer price as a % of consumer
price Czech Republic Butter 0.24 0.35 0.11 69.2% Denmark Butter 0.30 0.65 0.35 46.0% Germany Butter 0.28 0.34 0.06 82.4% Estonia Butter 0.22 0.35 0.13 62.8% France Butter 0.30 0.63 0.33 47.7% Ireland Butter 0.27 0.42 0.15 64.9% Lithuania Butter 0.16 0.39 0.22 42.2% Poland Butter 0.19 0.30 0.10 65.2% Slovenia Butter 0.27 0.57 0.29 48.4% Slovakia Butter 0.22 0.42 0.20 54.5% Finland Butter 0.34 0.51 0.16 67.8% United Kingdom Butter 0.26 0.47 0.21 54.9% Source: Agra CEAS analysis Table 13: Linear regression analysis on the butter producer-consumer price margins in selected EU Member
States, 2003-2005
Change in average
producer price (€/c per yr) (ß-value)
Change in average
consumer price
(€/c per yr) (ß-value)
Change in average price
margin (€/c per yr) (ß-value)
Change in producer price
margin (€/c per yr) (ß-value)
Czech Republic Butter 1.46 3.14 1.68 -2.3% Denmark Butter -1.62 -0.86 0.76 -1.9% Germany Butter -0.08 -2.48 -2.40 5.9% Estonia Butter 3.17 5.96 2.79 -1.4% France Butter 0.43 -0.18 -0.61 0.8% Ireland Butter 0.77 -1.40 -2.17 3.9% Lithuania Butter 2.78 5.69 2.92 1.2% Poland Butter 4.24 1.85 -2.39 9.9% Slovenia Butter -1.16 0.93 2.09 -2.9% Slovakia Butter 1.33 7.78 6.45 -7.5% Finland Butter -0.12 0.35 0.47 -0.7% United Kingdom Butter 0.79 0.07 -0.73 1.7% Source: Agra CEAS analysis

The Gap between Producer Prices and the Prices paid by the Consumer
PE 397.240 44
2. EU meat and meat product price margins Data on the absolute value of, and developments in, the producer-consumer price margin for beef, pigmeat and sheepmeat, as well as for various meat products, are presented in the following tables.
Table 14: Beef producer-consumer price margins in selected EU Member States, 2003-2005
Average producer price
(€ per kg)
Average consumer
price (€ per kg)
Average price margin
(€ per kg)
Producer price as a % of consumer
price
United Kingdom Top side 2.68 6.51 3.83 41.2% United Kingdom Minced 2.68 4.04 1.36 66.5% United Kingdom Rump steak 2.68 8.66 5.97 31.0% Czech Republic Quality 1.96 3.23 1.28 60.4% Czech Republic Boneless fore-off 1.96 2.65 0.69 73.7% Czech Republic Sirloin 1.96 9.31 7.35 21.2% Denmark Shoulder 2.20 5.81 2.95 38.2% Denmark Squares 2.20 9.38 6.49 23.6% Denmark Grill steak 2.20 14.07 11.28 15.6% Denmark Sirloin 2.20 30.20 27.03 7.4% Denmark Minced 2.20 5.27 3.07 41.8% France Sirloin 2.96 11.87 8.91 24.9% Germany Boiling meat 2.52 3.43 0.91 73.6% Germany Roast 2.52 4.56 2.04 55.3% Germany Roulades 2.52 5.23 2.71 48.2% Germany Goulash 2.52 4.53 2.01 55.7% Germany Sirloin 2.52 5.24 2.72 48.1% Germany Minced 2.52 3.40 0.88 74.1% Ireland Round Steak 2.49 5.87 3.38 42.4% Ireland Striploin Steak 2.49 12.02 9.53 20.7% Ireland Sliced/diced pieces 2.49 5.01 2.52 49.7% Ireland Top side 2.49 5.71 3.22 43.6% Ireland Sirloin 2.49 8.30 5.81 30.1% Source: Agra CEAS analysis

The Gap between Producer Prices and the Prices paid by the Consumer
PE 397.240 45
Table 15: Linear regression analysis on the beef producer-consumer price margins in selected EU Member States, 2003-2005
Change in average
producer price (€/c per yr) (ß-value)
Change in average
consumer price
(€/c per yr) (ß-value)
Change in average price
margin (€/c per yr) (ß-value)
Change in producer price
margin (€/c per yr) (ß-value)
United Kingdom Top side 8.58 2.37 -6.20 1.2% United Kingdom Minced 8.58 6.55 -2.03 1.1% United Kingdom Rump steak 8.58 -1.88 -10.46 1.1% Czech Republic Quality 21.98 23.79 1.82 2.4% Czech Republic Boneless fore-off 21.98 17.72 -4.26 3.4% Czech Republic Sirloin 21.98 161.00 139.02 -1.4% Denmark Shoulder -55.37 22.65 4.79 -11.1% Denmark Squares -55.37 29.67 12.97 -6.7% Denmark Grill steak -55.37 -13.30 -32.37 -3.8% Denmark Sirloin -55.37 126.58 101.95 -2.1% Denmark Minced -55.37 8.80 64.17 -11.3% France Sirloin 22.25 48.39 26.15 0.9% Germany Boiling meat 17.49 8.57 -8.92 3.2% Germany Roast 17.49 5.69 -11.80 3.1% Germany Roulades 17.49 3.01 -14.48 3.1% Germany Goulash 17.49 5.54 -11.95 3.2% Germany Sirloin 17.49 1.93 -15.56 3.1% Germany Minced 17.49 4.22 -13.27 4.1% Ireland Round Steak 11.87 -4.19 -16.06 2.4% Ireland Striploin Steak 11.87 -7.43 -19.30 1.1% Ireland Sliced/diced pieces 11.87 8.00 -3.86 1.6% Ireland Top side 11.87 -4.54 -16.40 2.4% Ireland Sirloin 11.87 -31.82 -43.68 2.7% Source: Agra CEAS analysis

The Gap between Producer Prices and the Prices paid by the Consumer
PE 397.240 46
Table 16: Pigmeat producer-consumer price margins in selected EU Member States, 2003-2005
Average producer
price (€ per kg)
Average consumer
price (€ per kg)
Average price margin
(€ per kg)
Producer price as a % of consumer
price United Kingdom Pork loin 1.28 5.09 3.81 25.2% United Kingdom Sausage 1.28 3.35 2.06 38.3% United Kingdom Bacon Gammon 1.28 5.97 4.69 21.5% United Kingdom Back bacon 1.28 7.27 5.99 17.7% United Kingdom Boneless shoulder 1.28 3.43 2.14 37.6% Czech Republic Ham 1.32 3.49 2.17 37.7% Czech Republic Loin 1.32 2.39 1.07 54.9% Czech Republic Joint, boneless 1.32 2.52 1.20 52.2% Czech Republic Neck 1.32 2.22 0.91 59.0% Czech Republic Shoulder 1.32 2.30 0.98 57.1% Czech Republic Belly 1.32 1.42 0.11 92.3% Czech Republic Bacon 1.32 2.74 1.42 48.1% Denmark Ham 1.08 7.85 6.77 13.8% Denmark Loin 1.08 5.51 4.43 19.8% Denmark Chops 1.08 5.05 3.97 21.4% Denmark Chops, organic 1.08 7.64 6.56 14.2% Denmark Liver 1.08 2.78 1.70 38.8% Denmark Smoked saddle 1.08 5.57 4.49 19.5% Finland Loin 1.29 6.30 5.01 20.5% Finland Ham, cooked & prepacked 1.29 7.63 6.33 17.0% Finland Chops 1.29 5.47 4.17 23.7% Finland Ham, smoked & prepacked 1.29 7.04 5.74 18.4% Finland Ham sausage 1.29 4.97 3.67 26.1% Finland Bacon 1.29 7.74 6.45 16.7% France Ham 1.30 9.01 7.72 14.4% France Roast 1.30 4.85 3.55 26.7% Germany Ham 1.35 9.09 7.73 14.9% Germany Loin 1.35 6.78 5.43 20.0% Germany Chops 1.35 3.27 1.91 41.4% Germany Roast 1.35 3.32 1.97 40.8% Germany Belly 1.35 4.07 2.71 33.3% Germany Cutlet 1.35 4.25 2.90 31.8% Germany Cured chops 1.35 2.94 1.58 46.1% Germany Ground 1.35 2.87 1.51 47.3% Germany Smoked chops 1.35 3.89 2.54 34.9% Germany Tenderloin 1.35 6.78 5.43 20.0% Ireland Ham 1.29 10.77 9.48 12.0% Ireland Loin 1.29 6.41 5.12 20.1% Ireland Fillet/Half Leg 1.29 4.76 3.47 27.1% Ireland Loin chops 1.29 6.35 5.06 20.3% Ireland Steak 1.29 8.18 6.89 15.8% Ireland Best back rashers 1.29 7.75 6.46 16.7% Ireland Ham fillet bacon 1.29 6.05 4.76 21.4% Ireland Collar 1.29 4.20 2.91 30.7% Ireland Sausages 1.29 3.51 2.22 36.9% Latvia Cut with bone 1.46 1.82 0.36 80.0% Latvia Steak 1.46 2.68 1.22 54.4% Latvia Smoked 1.46 2.61 1.15 55.8% Lithuania With bone 1.44 1.77 0.34 81.0% Lithuania Without bone 1.44 2.37 0.93 60.7% Lithuania Loin 1.44 4.37 2.93 32.9% Malta Roast 1.58 2.47 0.89 64.1% Malta Cutlet, fresh 1.58 2.14 0.56 74.0% Malta Minced, fresh 1.58 2.72 1.14 58.1% Poland Loin 1.37 2.37 1.00 57.9% Poland Minced 1.37 1.80 0.43 76.7% Poland Boned chuck, not prepacked 1.37 2.23 0.86 61.7% Poland Belly, not prepacked 1.37 1.83 0.46 75.3% Poland Rib, not prepacked 1.37 1.84 0.46 75.0% Poland Liver, raw not prepacked 1.37 0.92 -0.46 150.1% Poland Tongues 1.37 1.47 0.10 94.0% Poland Smoked bacon, not prepacked 1.37 2.55 1.17 54.2% Slovakia Ham 1.34 3.44 2.10 38.8% Slovakia Loin 1.34 2.58 1.24 51.7% Slovakia Neck, with bone 1.34 2.18 0.84 61.3%

The Gap between Producer Prices and the Prices paid by the Consumer
PE 397.240 47
Slovakia Bacon 1.34 1.59 0.26 83.9% Slovakia Rump, boned 1.34 2.78 1.44 48.0% Slovakia Shoulder, boned 1.34 2.45 1.12 54.4% Slovakia Smoked neck, no bone 1.34 2.79 1.45 47.9% Slovakia Smoked bacon with skin 1.34 1.65 0.32 81.2% Slovakia Cooked ham 1.34 3.44 2.10 38.8% Slovenia Ham 1.46 3.08 1.61 47.7% Slovenia Unboned joint [kg] 1.46 3.68 2.21 39.9% Source: Agra CEAS analysis

The Gap between Producer Prices and the Prices paid by the Consumer
PE 397.240 48
Table17: Linear regression analysis on the pigmeat producer-consumer price margins in selected EU Member States, 2003-2005
Change in average
producer price
(€/c per yr) (ß-value)
Change in average
consumer price
(€/c per yr) (ß-value)
Change in average price
margin (€/c per yr) (ß-value)
Change in producer
price margin (€/c per yr) (ß-value)
United Kingdom Pork loin 12.51 11.98 -0.53 1.8% United Kingdom Sausage 12.51 14.17 1.66 2.0% United Kingdom Bacon Gammon 12.51 7.67 -4.84 1.8% United Kingdom Back bacon 12.51 2.92 -9.59 1.6% United Kingdom Boneless shoulder 12.51 -1.61 -14.13 3.9% Czech Republic Ham 15.01 15.62 0.60 2.6% Czech Republic Loin 15.01 16.33 1.32 2.6% Czech Republic Joint, boneless 15.01 14.80 -0.21 2.9% Czech Republic Neck 15.01 15.60 0.59 2.7% Czech Republic Shoulder 15.01 11.12 -3.89 3.8% Czech Republic Belly 15.01 11.47 -3.54 3.2% Czech Republic Bacon 15.01 14.51 -0.51 2.9% Denmark Ham 12.81 9.29 -3.52 1.5% Denmark Loin 12.81 -16.19 -29.01 3.0% Denmark Chops 12.81 -1.27 -14.08 2.6% Denmark Chops, organic 12.81 -30.27 -43.09 2.2% Denmark Liver 12.81 4.35 -8.46 4.0% Denmark Smoked saddle 12.81 -18.21 -31.02 3.0% Finland Loin 6.85 1.87 -4.97 1.0% Finland Ham, cooked & prepacked 6.85 -18.92 -25.77 1.3% Finland Chops 6.85 9.27 2.42 0.9% Finland Ham, smoked & prepacked 6.85 -20.78 -27.63 1.5% Finland Ham sausage 6.85 -20.10 -26.95 2.5% Finland Bacon 6.85 10.20 3.35 0.7% France Ham 6.71 -2.31 -9.02 0.8% France Roast 6.71 8.49 1.79 0.9% Germany Ham 16.24 5.42 -10.81 1.7% Germany Loin 16.24 7.01 -9.23 2.2% Germany Chops 16.24 0.02 -16.22 5.0% Germany Roast 16.24 5.60 -10.64 4.2% Germany Belly 16.24 2.35 -13.89 3.8% Germany Cutlet 16.24 -0.54 -16.78 3.9% Germany Cured chops 16.24 7.49 -8.75 4.4% Germany Ground 16.24 0.44 -15.80 5.6% Germany Smoked chops 16.24 1.14 -15.10 4.1% Germany Tenderloin 16.24 7.01 -9.23 2.2% Ireland Ham 4.19 45.25 41.06 -0.1% Ireland Loin 4.19 1.96 -2.24 0.6% Ireland Fillet/Half Leg 4.19 1.92 -2.28 0.8% Ireland Loin chops 4.19 -1.92 -6.12 0.7% Ireland Steak 4.19 -6.60 -10.80 0.6% Ireland Best back rashers 4.19 10.11 5.92 0.3% Ireland Ham fillet bacon 4.19 -29.06 -33.25 1.7% Ireland Collar 4.19 0.12 -4.07 1.0% Ireland Sausages 4.19 21.05 16.85 -1.0% Latvia Cut with bone 4.24 2.17 -2.06 1.3% Latvia Steak 4.24 -0.34 -4.58 1.6% Latvia Smoked 4.24 5.64 1.40 0.5% Lithuania With bone 4.81 1.06 -3.75 2.3% Lithuania Without bone 4.81 3.60 -1.21 1.2% Lithuania Loin 4.81 -11.62 -16.44 2.0% Malta Roast -4.32 -1.07 3.25 -1.5% Malta Cutlet, fresh -4.32 2.30 6.62 -2.8% Malta Minced, fresh -4.32 2.60 6.92 -2.1% Poland Loin -5.96 2.24 8.20 -3.1% Poland Minced -5.96 22.17 28.13 -13.3% Poland Boned chuck, not prepacked -5.96 6.78 12.74 -4.7% Poland Belly, not prepacked -5.96 15.06 21.02 -9.9% Poland Rib, not prepacked -5.96 16.92 22.88 -10.5% Poland Liver, raw not prepacked -5.96 8.75 14.71 -21.7% Poland Tongues -5.96 20.03 25.99 -17.5% Poland Smoked bacon, not prepacked -5.96 26.27 32.23 -8.2%

The Gap between Producer Prices and the Prices paid by the Consumer
PE 397.240 49
Slovakia Ham 12.02 10.23 -1.80 2.4% Slovakia Loin 12.02 14.60 2.57 1.8% Slovakia Neck, with bone 12.02 8.57 -3.45 3.1% Slovakia Bacon 12.02 13.42 1.39 0.5% Slovakia Rump, boned 12.02 10.98 -1.05 2.5% Slovakia Shoulder, boned 12.02 2.01 -10.01 4.5% Slovakia Smoked neck, no bone 12.02 10.06 -1.97 2.6% Slovakia Smoked bacon with skin 12.02 18.72 6.69 -1.8% Slovakia Cooked ham 12.02 10.23 -1.80 2.4% Slovenia Ham 9.38 -28.82 -38.20 7.5% Slovenia Unboned joint [kg] 9.38 -23.39 -32.77 4.9% Source: Agra CEAS analysis
Table 18: Sheepmeat producer-consumer price margins in selected EU Member States, 2003-2005
Average producer price
(€ per kg)
Average consumer
price (€ per kg)
Average price margin
(€ per kg)
Producer price as a % of consumer
price
Ireland Whole leg 3.43 7.45 4.02 46.0% Ireland Loin chops 3.43 11.64 8.21 29.4% Ireland Gigot chops 3.43 7.33 3.91 46.7% Ireland Lamb Pieces incl. Neck 3.43 6.11 2.68 57.1% Ireland Liver 3.43 4.01 0.58 85.5% France Gigot racourci 4.84 10.74 5.90 45.1% France Lamb Chop 4.84 11.35 6.52 42.6% France Lamb roast 4.84 6.30 1.47 76.8% Poland Lamb, leg, not prepacked 3.33 4.08 0.74 82.7% United Kingdom Lamb shoulder 3.77 4.48 0.70 84.3% United Kingdom Lamb loin 3.77 10.80 7.03 34.9% Source: Agra CEAS analysis
Table 19: Linear regression analysis on the Sheepmeat producer-consumer price margins in selected EU Member States, 2003-2005
Change in average
producer price (€/c per yr) (ß-value)
Change in average
consumer price
(€/c per yr) (ß-value)
Change in average price
margin (€/c per yr) (ß-value)
Change in producer price
margin (€/c per yr) (ß-value)
Ireland Whole leg -13.73 0.89 14.62 -2.0% Ireland Loin chops -13.73 -24.85 -11.12 -0.6% Ireland Gigot chops -13.73 5.54 19.28 -2.3% Ireland Lamb Pieces incl. Neck -13.73 72.47 86.21 -9.7% Ireland Liver -13.73 1.28 15.01 -3.7% France Gigot racourci -7.14 34.96 42.09 -2.2% France Lamb Chop -7.14 28.82 35.96 -1.7% France Lamb roast -7.14 12.35 19.48 -2.7% Poland Lamb, leg, not prepacked 10.16 76.36 66.20 -15.1% United Kingdom Lamb shoulder -16.54 -10.83 5.70 -1.7% United Kingdom Lamb loin -16.54 -6.23 10.31 -1.3% Source: Agra CEAS analysis

The Gap between Producer Prices and the Prices paid by the Consumer
PE 397.240 50
3. EU fruit and vegetable price margins Data on the absolute value of, and developments in, the producer-consumer price margin for fruit and vegetables are presented in the following tables.
Table 20: Fruit producer-consumer price margins in selected EU Member States, 2003-2005
Average producer price
(€ per kg)
Average consumer
price (€ per kg)
Average price margin
(€ per kg)
Producer price as a % of consumer
price
Czech Republic Apples 0.27 0.78 0.50 35.2% Germany Apples 0.33 1.27 0.94 25.7% Latvia Apples 0.18 0.65 0.46 32.9% Lithuania Apples 0.21 0.45 0.12 73.6% United Kingdom Apples 0.68 1.80 1.12 42.5% Germany Pears 0.38 1.49 1.11 25.8% Poland Pears 0.63 1.06 0.44 59.5% United Kingdom Pears 0.65 1.96 1.31 33.3% Source: Agra CEAS analysis
Table 21: Linear regression analysis on the fruit producer-consumer price margins in selected EU Member States, 2003-2005
Change in average
producer price (€/c per yr) (ß-value)
Change in average
consumer price
(€/c per yr) (ß-value)
Change in average price
margin (€/c per yr) (ß-value)
Change in producer price
margin (€/c per yr) (ß-value)
Czech Republic Apples 0.49 -0.55 -1.04 0.9% Germany Apples -6.64 -7.09 -0.45 -3.8% Latvia Apples 1.41 -11.71 -20.72 22.1% Lithuania Apples 13.37 -3.91 -15.07 36.0% United Kingdom Apples -15.15 -5.52 9.63 -1.1% Germany Pears -1.93 -8.46 -6.52 0.4% Poland Pears 6.49 -3.67 -10.16 6.9% United Kingdom Pears 1.65 -7.37 -9.02 2.2% Source: Agra CEAS analysis
Table 22: Vegetable producer-consumer price margins in selected EU Member States, 2003-2005
Average producer price
(€ per kg)
Average consumer price
(€ per kg)
Average price margin
(€ per kg)
Producer price as a % of
consumer price Czech Republic Potatoes 0.14 0.32 0.18 44.0% Denmark Potatoes 0.15 1.04 0.89 14.1% Latvia Potatoes 0.12 0.25 0.13 45.7% Lithuania Potatoes 0.11 0.20 0.10 52.2% Slovenia Potatoes 0.16 0.43 0.28 34.8% Finland Potatoes 0.18 0.62 0.44 28.7% United Kingdom Potatoes 0.15 0.76 0.61 19.5% Czech Republic Onions 0.19 0.37 0.17 54.1% Denmark Onions 0.27 1.12 0.85 23.7% Germany Onions 0.18 0.94 0.76 18.2% Latvia Onions 0.25 0.40 0.15 60.0% Lithuania Onions 0.18 0.35 0.17 49.4% Slovenia Onions 0.29 0.62 0.33 45.1% Finland Onions 0.46 0.98 0.53 46.1% United Kingdom Onions 0.23 0.92 0.70 25.1% Germany Carrots 0.21 0.74 0.53 27.3% Ireland Carrots 0.33 1.19 0.86 27.5% Latvia Carrots 0.20 0.33 0.13 59.0% Lithuania Carrots 0.12 0.26 0.14 46.1% Slovenia Carrots 0.35 1.07 0.72 32.6% United Kingdom Carrots 0.36 0.86 0.49 42.3% Czech Republic Tomatoes 0.57 1.16 0.49 53.7%

The Gap between Producer Prices and the Prices paid by the Consumer
PE 397.240 51
Germany Tomatoes 1.19 2.03 0.84 57.3% Malta Tomatoes 0.72 1.30 0.58 52.5% Slovenia Tomatoes 0.85 1.63 0.77 51.1% Germany Cabbage 0.17 0.70 0.53 23.1% Latvia Cabbage 0.09 0.50 0.41 17.7% Lithuania Cabbage 0.10 0.21 0.11 47.6% Malta Cabbage 0.21 1.42 1.21 14.4% Czech Republic Mushroom 1.38 2.81 1.43 49.3% Ireland Mushroom 2.31 4.17 1.86 55.5% Malta Mushroom 3.09 4.35 1.26 71.0% United Kingdom Mushroom 1.96 3.84 1.88 50.9% United Kingdom Brussels sprouts 0.64 1.05 1.17 35.2% Poland White Cabbage 0.11 0.19 0.07 56.4% Lithuania White Cabbage 0.10 0.21 0.11 47.6% Poland Cucumber 0.36 0.25 0.03 82.5% Poland Cucumber (Indoor) 0.93 1.30 0.37 70.3% Latvia Beetroot 0.12 0.25 0.13 49.9% Lithuania Beetroot 0.07 0.14 0.09 44.4% Source: Agra CEAS analysis
Table 23: Linear regression analysis on the vegetable producer-consumer price margins in selected EU Member States, 2003-2005
Change in average
producer price (€/c per yr) (ß-value)
Change in average
consumer price (€/c per yr) (ß-value)
Change in average price
margin (€/c per yr) (ß-value)
Change in producer price
margin (€/c per yr) (ß-value)
Czech Republic Potatoes -1.91 -6.06 -4.15 2.1% Denmark Potatoes 2.50 0.05 -2.45 2.2% Latvia Potatoes -0.68 -0.78 -0.09 -0.3% Lithuania Potatoes -0.21 2.47 2.68 -8.3% Slovenia Potatoes -4.84 -7.00 -2.16 -6.5% Finland Potatoes 6.73 16.04 9.30 3.7% United Kingdom Potatoes 0.16 -4.77 -4.93 1.7% Czech Republic Onions 0.21 -7.61 -7.82 11.9% Denmark Onions -2.08 -4.93 -3.35 -0.7% Germany Onions -2.99 -8.23 -5.24 -2.1% Latvia Onions -19.00 -20.21 -1.21 -17.3% Lithuania Onions -19.90 -22.48 -2.58 -27.1% Slovenia Onions -10.27 -10.02 0.25 -9.0% Finland Onions -7.97 -16.53 -8.56 -0.3% United Kingdom Onions 1.11 3.95 2.84 0.7% Germany Carrots -0.84 -2.29 -1.45 -0.8% Ireland Carrots -2.04 -13.93 -11.88 1.5% Latvia Carrots -8.20 -0.17 8.04 -24.3% Lithuania Carrots 2.30 4.82 2.52 0.1% Slovenia Carrots -7.71 -10.38 -2.67 -3.8% United Kingdom Carrots 1.71 6.87 5.16 -1.5% Czech Republic Tomatoes 3.13 8.09 -1.75 2.5% Germany Tomatoes -3.11 -0.04 3.07 -2.1% Malta Tomatoes -80.00 -81.24 -1.24 -21.4% Slovenia Tomatoes -2.77 0.83 3.60 -2.3% Germany Cabbage -0.58 -1.92 -1.34 -0.4% Latvia Cabbage 5.20 7.64 2.44 8.6% Lithuania Cabbage 5.20 4.32 -0.88 8.7% Malta Cabbage -10.92 -9.46 1.47 -6.8% Czech Republic Mushroom -0.83 14.61 15.44 -2.9% Ireland Mushroom 2.72 6.06 3.34 -0.2% Malta Mushroom 10.62 17.94 7.32 -0.6% United Kingdom Mushroom -28.42 -7.41 21.01 -6.4% United Kingdom Brussels sprouts -10.44 2.82 -4.06 1.8% Poland White Cabbage -3.45 -4.57 -1.11 -4.9% Lithuania White Cabbage 5.20 4.32 -0.88 8.7% Poland Cucumber 2.03 -5.97 12.63 -3.0% Poland Cucumber (Indoor) 13.35 5.58 -7.78 5.7% Latvia Beetroot 0.62 2.68 2.06 -4.2% Lithuania Beetroot 2.80 5.80 1.62 6.0% Source: Agra CEAS analysis

The Gap between Producer Prices and the Prices paid by the Consumer
PE 397.240 52


![RETAC Producer Update 10-19-17.pptx [Read-Only] · 2017. 10. 17. · Coal Producer Update Barb Porter, VP Logistics & Market Optimization ... Thermal U.S. and International Coal Prices](https://static.fdocuments.us/doc/165x107/60c01a5c04f80c48e648a364/retac-producer-update-10-19-17pptx-read-only-2017-10-17-coal-producer-update.jpg)