WCRI Medical Price Index for Workers’ CompensationTable B.2 Trends in Prices Paid for Professional...
184
WCRI Medical Price Index for Workers’ Compensation 12th Edition Rui Yang Olesya Fomenko WCRI BENCHMARKS
Transcript of WCRI Medical Price Index for Workers’ CompensationTable B.2 Trends in Prices Paid for Professional...

WCRI Medical Price Index for Workers’
Compensation
12th Edition
Rui Yang
Olesya Fomenko
WCRI BENCHMARKS

ABOUT THE INSTITUTE
OUR MISSION:
To be a catalyst for significant improvements in workers’
compensation systems, providing the public with
objective, credible, high-quality research on important public
policy issues.
THE INSTITUTE: Founded in 1983, the Workers Compensation Research Institute (WCRI) is an independent, not-for-profit research organization which strives to help those interested in making improvements to the workers’ compensation system by providing highly regarded, objective data and analysis.
The Institute does not take positions on the issues it researches; rather, it provides information obtained through studies and data collection efforts, which conform to recognized scientific methods. Objectivity is further ensured through rigorous, unbiased peer review procedures.
The Institute’s work includes the following:
Original research studies of major issues confronting workers’ compensation systems (for example, worker outcomes)
Studies of individual state systems where policymakers have shown an interest in change and where there is an unmet need for objective information
Studies of states that have undergone major legislative changes to measure the impact of those reforms and draw possible lessons for other states
Presentations on research findings to legislators, workers’ compensation administrators, industry groups, and other stakeholders
With WCRI’s research, policymakers and other system stakeholders —employers, insurers, and labor unions —can monitor state systems on a regular basis and identify incremental changes to improve system performance. This results in a more enduring, efficient, and equitable system that better serves the needs of workers and employers.
For more information and to view other WCRI studies, please visit our website: www.wcrinet.org

WCRI MEDICAL PRICE INDEX FOR WORKERS’
COMPENSATION, 12TH EDITION (MPI-WC)
Rui Yang
Olesya Fomenko
WC-20-24
May 2020
TABLE OF CONTENTS
List of Figures and Tables 4
Introduction and How to Use This Report 7
Discussion of Key Lessons 13
Discussion of Substantial Price Changes 16
Data and Methods 54
Limitations and Caveats 56
Finding the Data You Want: Quick Reference Guide to Figures and Tables 57
Statistical Appendix 146
Technical Appendix 158
References 179
copyright © 2020 workers compensation research institute1

copyright © 2020 by the workers compensation research institute all rights reserved. no part of this book may be copied or
reproduced in any form or by any means without written permission of the workers compensation research institute.
ISBN 978-1-61471-562-7
publications of the workers compensation research institute do not necessarily reflect the opinions or policies
of the institute’s research sponsors.
copyright © 2020 workers compensation research institute2
_____________________________________________________________________________________________W C R I M E D I C A L P R I C E I N D E X F O R W O R K E R S ' C O M P E N S A T I O N , 1 2 T H E D I T I O N ( M P I - W C )

ACKNOWLEDGMENTS
We are indebted to many people both within and outside the Institute. We want to recognize the contribution
of Ramona Tanabe, executive vice president and in-house counsel of the Institute, to this study. Her insight
and guidance were invaluable to the success of the publication.
We thank our data sources for their ongoing support of the database that is the foundation for this and
other WCRI studies. The development of the database would not have been possible without the help of Dr.
Philip Borba and his staff at Milliman, Inc.; their commitment to quality helps ensure the accuracy of the
information.
We appreciate the excellent cooperation we received during our inquiry on workers’ compensation fee
schedule information from the state agencies.
We received support from many of our colleagues at the Institute. Eric Harrison, Beth Heffner, Thomas
Landry, Stacey O’Brien, Karen Rothkin, and Roman Dolinschi helped make sure that the data were of the
highest quality. Beth Heffner helped in fee schedule information collection and the presentation of the report.
Julie Zhang and Te-Chun Liu provided professional programming assistance for this project. Sarah Solorzano
and Eric LaRocca provided expert administrative assistance in formatting and editing the report. We thank
Andrew Kenneally, the communications director at WCRI, for his diligent efforts in disseminating the research
findings. We also thank Dr. John Ruser, president and chief executive officer of the Institute, for his support of
this study.
Of course, any errors or omissions that remain are the responsibility of the authors.
Rui Yang
Olesya Fomenko
Cambridge, Massachusetts May 2020
copyright © 2020 workers compensation research institute3
_____________________________________________________________________________________________W C R I M E D I C A L P R I C E I N D E X F O R W O R K E R S ' C O M P E N S A T I O N , 1 2 T H E D I T I O N ( M P I - W C )

LIST OF FIGURES AND TABLES
Introduction and Discussions of Key Lessons and Substantial Price Changes:
Figure 1 Interstate Comparison of Prices Paid for Professional Services, WCRI MPI-WC in 36 States,
2018 / 27
Figure 2 Interstate Comparison of Prices Paid for Professional Services, WCRI MPI-WC in 36 States,
2019 / 27
Table 1 Summary of Fee Regulation Types and Medical Price Index for Professional Services across 36
Study States, 2018 / 28
Table 2 Summary of Fee Regulation Types and Medical Price Index for Professional Services across 36
Study States, 2019 / 29
Table 3a Workers’ Compensation Premium over Medicare, February 2019 / 30
Table 3b Workers’ Compensation Premium over Medicare, March 2016 / 31
Table 4 Percentage Change in Aggregate Workers’ Compensation Fee Schedule Rates from March 2016 to
February 2019 / 32
Figure 3 Comparison of Cumulative Growth Rate in Prices Paid for Professional Services across 31 Study
States, 2008 to 2019 / 33
Figure 4 Comparison of Cumulative Growth Rate in Prices Paid for Professional Services across 22 Study
States, 2008 to 2019 / 34
Table 5 Summary of Cumulative Growth Rate in Prices Paid and Network Use for Professional Services
across 22 Study States, by Fee Regulation Type, 2008 to 2019 / 35
Table 6 Comparison of Network Participation Rates across States, 2008 to 2019 / 36
Table 7 Characteristics of Workers’ Compensation Fee Schedules for Nonfacility Providers, February
2019 / 37
Table 8 Characteristics of Workers’ Compensation Fee Schedules for Professional Medical Services,
March 2016 / 38
Table 9 Interstate Ranking for Virginia on Medical Price Index for Professional Services in 2017 and 2018
/ 39
Figure 5 Changes in Interstate Ranking for North Carolina on Medical Price Index for Overall Professional
Services, 2014 and 2016 / 40
Table 10 Interstate Ranking for North Carolina on Medical Price Index for Professional Services in 2014
and 2016 / 41
Table 11 Interstate Ranking for Kentucky on Medical Price Index for Professional Services in 2013 and
2015 / 42
Table 12 Interstate Ranking for Arizona on Medical Price Index for Professional Services in 2013 and
2014 / 43
copyright © 2020 workers compensation research institute4
_____________________________________________________________________________________________W C R I M E D I C A L P R I C E I N D E X F O R W O R K E R S ' C O M P E N S A T I O N , 1 2 T H E D I T I O N ( M P I - W C )

Table 13 Interstate Ranking for Illinois on Medical Price Index for Professional Services in 2010 and
2012 / 44
Table 14 Interstate Ranking for Texas on Medical Price Index for Professional Services in 2010 and 2011
/ 45
Table 15 Interstate Ranking for Massachusetts on Medical Price Index for Professional Services in 2008
and 2010 / 46
Table 16 Interstate Ranking for Arizona on Medical Price Index for Professional Services in 2017 and
2018 / 47
Table 17 Interstate Ranking for Colorado on Medical Price Index for Professional Services in 2015 and
2016 / 48
Table 18 Interstate Ranking for California on Medical Price Index for Professional Services in 2013, 2014,
2015, 2016, and 2017 / 49
Table 19 States with Significant Annual Changes in Prices Paid by Service Group from 2008 to 2019 / 50
Interstate Comparisons:
Table A.1 WCRI MPI-WC—2018 Interstate Comparisons / 59
Table A.2 WCRI MPI-WC—2019 Interstate Comparisons / 60
Figures A.1–A.2 Interstate Comparison of Prices Paid for Professional Services / 61
Figures A.3–A.4 Interstate Comparison of Prices Paid for Professional Evaluation and Management
Services / 62
Figures A.5–A.6 Interstate Comparison of Prices Paid for Professional Physical Medicine Services / 63
Figures A.7–A.8 Interstate Comparison of Prices Paid for Professional Major Surgery Services / 64
Figures A.9–A.10 Interstate Comparison of Prices Paid for Professional Pain Management Injection
Services / 65
Figures A.11–A.12 Interstate Comparison of Prices Paid for Professional Major Radiology Services / 66
Figures A.13–A.14 Interstate Comparison of Prices Paid for Professional Minor Radiology Services / 67
Figures A.15–A.16 Interstate Comparison of Prices Paid for Professional Neurological/Neuromuscular
Testing Services / 68
Figures A.17–A.18 Interstate Comparison of Prices Paid for Professional Emergency Services / 69
Trends:
Figure B.1 Trends in Prices Paid for Professional Services, WCRI MPI-WC, 2008 to 2019 / 70
Figures B.2–B.32 Trends in Prices Paid for Professional Services, WCRI MPI-WC, 2008 to 2019, by State /
72
Table B.1 Trends in Prices Paid for Professional Evaluation and Management Services,
2008 to 2019 / 103
copyright © 2020 workers compensation research institute5
_____________________________________________________________________________________________W C R I M E D I C A L P R I C E I N D E X F O R W O R K E R S ' C O M P E N S A T I O N , 1 2 T H E D I T I O N ( M P I - W C )

Table B.2 Trends in Prices Paid for Professional Physical Medicine Services, 2008 to 2019 / 104
Table B.3 Trends in Prices Paid for Professional Major Surgery Services, 2008 to 2019 / 105
Table B.4 Trends in Prices Paid for Professional Pain Management Injection Services, 2008 to
2019 / 106
Table B.5 Trends in Prices Paid for Professional Major Radiology Services, 2008 to 2019 / 107
Table B.6 Trends in Prices Paid for Professional Minor Radiology Services, 2008 to 2019 / 108
Table B.7 Trends in Prices Paid for Professional Neurological/Neuromuscular Testing Services,
2008 to 2019 / 109
Table B.8 Trends in Prices Paid for Professional Emergency Services, 2008 to 2019 / 110
Figures C.1–C.31 Trends in Professional Prices Paid by Service Group, 2008 to 2019, by State / 111
External Information:
Table D.1 Trends of Consumer Price Index for Medical Care (CPI-M, Professional Services) and
Producer Price Index for Health Care Services (PPI, Physician Care) / 142
Table D.2 Medicare Physician Fee Schedule Geographic Practice Cost Indices (GPCIs), April 2019
/ 143
Statistical Appendix:
Table SA.1 Trends in Professional Prices Paid by Service Group across 25 Study States, 2002 to 2019 /
147
Table SA.2 Trends in Professional Prices Paid by Service Group for the Additional Five Study States
Included in MPI-WC, 12th Edition, 2013 to 2019 / 156
Technical Appendix:
Table TA.1 Brief Marketbasket Service Group Definitions / 169
Table TA.2 Marketbasket Services / 170
Table TA.3 Procedures for Arthroscopic Shoulder Surgery / 173
Table TA.4 Description of Marketbasket Contents / 174
Table TA.5a Percentage of Expenditures Represented by the Marketbasket by State and Service Group,
January 2013 to December 2014 / 175
Table TA.5b Percentage of Expenditures Represented by the Marketbasket by State and Service Group,
January 2018 to June 2019 / 176
Table TA.6 New CPT Codes for Nerve Conduction Studies Implemented in 2013 / 177
Figure TA.1 Interstate Comparison of Evaluation and Management Prices Paid, Full-Year versus Half-
Year Data in 2018, from Different Editions of the MPI-WC / 178
copyright © 2020 workers compensation research institute6
_____________________________________________________________________________________________W C R I M E D I C A L P R I C E I N D E X F O R W O R K E R S ' C O M P E N S A T I O N , 1 2 T H E D I T I O N ( M P I - W C )

INTRODUCTION AND HOW TO USE THIS REPORT
This is the 12th edition of the Workers Compensation Research Institute (WCRI) annual series that
benchmarks the actual prices paid for medical professional services delivered to workers with injuries across
states. Increasing medical costs have been a focus of public policymakers and system stakeholders in public
policy debates in many states. This study focuses on medical professional prices, a key component of medical
costs. To help policymakers and stakeholders conduct meaningful comparisons of prices paid across states, and
to monitor the price trends in relation to changes in fee schedules, this annual study creates an index for the
actual prices paid for professional services based on a marketbasket of the most commonly used services for
treating workers with injuries. Other WCRI studies examine the quantity and mix of medical care;1 facility
payments to ambulatory surgery centers (ASCs);2 hospital outpatient payments related to surgeries;3 hospital
payments for outpatient services unrelated to surgeries and for inpatient services;1 the prevalence of and
payments for physician-dispensed drugs;4 use of opioids;5 and the differences in prices paid for professional
services and hospital outpatient services between workers’ compensation and group health.6 Together with this
annual study, WCRI research helps policymakers and stakeholders understand the overall costs associated with
medical care for treating workers with injuries.
This report is an update to the 11th edition of this annual study.7 The 36 states included in this study
represent 88 percent of the workers’ compensation benefits paid in the United States.8 In this 12th edition, we
focus on the interstate index comparisons for 2018 and 2019, and expand the growth rate analysis to a 12-year
span from 2008 to 2019. The key lessons in this edition are consistent with what was previously reported.
This report also monitors substantial changes in the overall and service-type level prices following major
fee schedule changes during the study period, including the recent policy changes in Virginia and Arizona.
Effective January 2018, Virginia introduced a workers’ compensation fee schedule; overall prices paid for
professional services in the state decreased 13 percent from 2017 to 2018, and then remained stable in 2019 (see
the discussion of substantial changes in overall prices following major fee schedule changes). In October 2017,
Arizona transitioned to a fee schedule that uses Medicare’s resource-based relative value scale (RBRVS) as its
basis, and this policy change led to large price increases for some types of services and decreases for others in
1 See CompScope™ Medical Benchmarks, 20th Edition (Belton et al., 2019). 2 See Comparing Payments to Ambulatory Surgery Centers and Hospital Outpatient Departments, 2nd Edition (Savych, 2016), Payments to Ambulatory Surgery Centers, 2nd Edition (Savych, 2016), and WCRI FlashReport: Comparing Payments to Ambulatory Surgery Centers and Hospital Outpatient Departments (Savych and Yang, 2018). 3 See Hospital Outpatient Payment Index: Interstate Variations and Policy Analysis, 9th Edition (Fomenko and Yang, 2020). 4 See A Multistate Perspective on Physician Dispensing, 2011–2014 (Wang, Thumula, and Liu, 2017) and Physician Dispensing of Higher-Priced New Drug Strengths and Formulation (Wang, Thumula, and Liu, 2016). 5 See Interstate Variations in Dispensing of Opioids, 5th edition (Thumula, Wang, and Liu, 2019) and Longer-Term Dispensing of Opioids, 4th Edition (Wang, 2017). 6 See Comparing Workers’ Compensation and Group Health Hospital Outpatient Payments (Fomenko, 2013) and A New Benchmark for Workers’ Compensation Fee Schedules: Prices Paid by Commercial Insurers? (Fomenko and Victor, 2013). 7 WCRI Medical Price Index for Workers’ Compensation, 11th Edition (MPI-WC) (Yang and Fomenko, 2019). 8 The states included in this study are Alabama, Arizona, Arkansas, California, Colorado, Connecticut, Delaware, Florida, Georgia, Illinois, Indiana, Iowa, Kansas, Kentucky, Louisiana, Maryland, Massachusetts, Michigan, Minnesota, Mississippi, Missouri, Nebraska, Nevada, New Hampshire, New Jersey, New Mexico, New York, North Carolina, Oklahoma, Oregon, Pennsylvania, South Carolina, Tennessee, Texas, Virginia, and Wisconsin. However, Alabama, Delaware, Nevada, New Hampshire, and New Mexico were excluded from the trend analysis because of insufficient sample sizes in earlier years.
copyright © 2020 workers compensation research institute7
_____________________________________________________________________________________________W C R I M E D I C A L P R I C E I N D E X F O R W O R K E R S ' C O M P E N S A T I O N , 1 2 T H E D I T I O N ( M P I - W C )

2018. The overall prices paid for professional services in Arizona grew moderately in 2018, and remained stable
in 2019 (see the discussion of substantial changes in prices at the service-type level). We also retain the
discussion of substantial price changes following major fee schedule changes in study states with such changes
from 2008 through 2016 for the readers’ convenience.
OBJECTIVES OF THE STUDY
This study focuses on the interstate comparisons of levels and trends in prices paid for medical professional
services. The objectives of this study are twofold. The first is to help policymakers and stakeholders conduct
meaningful comparisons of prices across states and track the price changes in their states. Specifically, the study
informs readers on the following topics: how prices paid for medical professional services provided to workers
injured in their state compare with other states, how prices in their state are changing, and whether price growth
in their state is part of a national phenomenon or unique to their state. The tables and figures in this report
meet this objective. The second objective is to discuss the price comparison results and price trends in relation
to the principal policy tool for regulating prices—fee schedules.9 The discussion also takes into consideration
differences in network participation, another important mechanism that can affect prices paid. The two
discussion sections (pages 13–26) accomplish this objective. The conceptual framework underlying this
discussion is as follows.
Workers’ compensation prices are regulated by statutory regulations (i.e., fee schedules) in most states. In
states with specified workers’ compensation fee schedule rates, workers’ compensation prices are either paid at
the statutory fee schedule rate or a negotiated rate where the fee schedule is often used as a benchmark.10 In
states with no specified fee schedule rates, workers’ compensation prices for out-of-network services are often
paid at what the provider charges or some notion of usual and customary charges in the area, while in-network
providers are paid at a negotiated rate. Therefore, fee schedule regulations (i.e., the policy choice) and network
contracts are the main factors shaping workers’ compensation prices and hence the main focus of the discussion
of price results in this study.
Medical costs can be seen as a function of price and utilization. While fee schedules and network contracts
can affect prices, other policy initiatives can affect utilization of medical services. For example, changes in
treatment guidelines, utilization review, and provider choice policies can have direct and indirect effects on
utilization and treatment patterns. Some fee schedule initiatives that change the price differentials between
different types of services can also affect the mix of services provided and billed. Furthermore, some policy
changes in the structure of income benefits may affect the duration of disability benefits and the duration of
medical care, which may have an indirect effect on utilization patterns and the mix of services. All these factors
can affect medical costs at the aggregate level, and often these different types of policy initiatives can be
implemented simultaneously. To isolate the price effect from the utilization effect of the policy initiatives, we
used a marketbasket approach to control for the mix of services across states and years in this study. In other
words, when reporting prices, we do not allow utilization to vary. Therefore, the price comparison results and
9 A fee schedule sets payment rates for medical services provided in workers’ compensation, usually with a list of procedure codes and the associated payment amounts. A fee schedule has many design elements (for further explanation, see the discussion in a later section, “Discussion of Substantial Price Changes,” on page 16). In this study we use the term fee schedule changes to mean changes in any of the design elements as well as any changes in the coding list or billing rules. We use the term fee regulation type to identify a state with or without a fee schedule. 10 The negotiated rates are often discounted prices below the fee schedule rates; sometimes they can be above the fee schedule rates (if the regulation allows), especially when the workers’ compensation fee schedule rates in a state are substantially lower than the prices paid by other large payors (such as group health and Medicare).
copyright © 2020 workers compensation research institute8
_____________________________________________________________________________________________W C R I M E D I C A L P R I C E I N D E X F O R W O R K E R S ' C O M P E N S A T I O N , 1 2 T H E D I T I O N ( M P I - W C )

price trends reported in this study mainly measure the effects of fee schedule and network differences on prices.
Other WCRI studies examine the effects of policy initiatives on utilization of medical services.11
SCOPE OF THE STUDY
WCRI developed the Medical Price Index for Workers’ Compensation (MPI-WC) for common professional
services to aid policymakers and stakeholders in identifying states where medical prices are unusually high or
low or are rising more or less rapidly. This study focuses on prices paid for professional services that are billed
by physicians, physical therapists/occupational therapists, and chiropractors.12 Therefore, the medical price
indices exclude services billed by hospitals or ambulatory surgery centers and services billed for durable medical
equipment as well as pharmaceuticals.13 Professional services typically make up 44 percent of total workers’
compensation medical expenditures in workers’ compensation in a given state (Belton et al., 2019).
The medical price indices compare prices paid across study states and show the trends within each state.
The indices measure prices actually paid and take into account any network or other discounts. Indices are
reported for each state on a statewide basis and for major groups of medical services, including evaluation and
management, physical medicine, major surgery, pain management injections, major radiology, minor
radiology, neurological and neuromuscular testing, and emergency care. Together, these eight groups typically
comprise 84 percent of total medical payments for professional services across states (Belton et al., 2019).14
This 12th edition covers 36 states that represent 88 percent of the workers’ compensation benefits paid in
the United States. These 36 study states are Alabama, Arizona, Arkansas, California, Colorado, Connecticut,
Delaware, Florida, Georgia, Illinois, Indiana, Iowa, Kansas, Kentucky, Louisiana, Maryland, Massachusetts,
Michigan, Minnesota, Mississippi, Missouri, Nebraska, Nevada, New Hampshire, New Jersey, New Mexico,
New York, North Carolina, Oklahoma, Oregon, Pennsylvania, South Carolina, Tennessee, Texas, Virginia, and
Wisconsin. The study states are geographically diverse and represent nearly all industries and a variety of
regulation choices for professional service payment under workers’ compensation. Other states are not
included because the data do not consistently have sufficient cell sizes for those states for all service groups
analyzed in this study. For each study state, the indices track medical prices from calendar year 2008 through
2019.15 Also, this study provides snapshots of interstate comparisons on medical price indices for the two most
recent study years, 2018 and 2019.
11 These studies include (but are not limited to) the annual CompScope™ and CompScope™ Medical Benchmarks study series (e.g., Belton et al., 2019, and Dolinschi et al., 2020), Impact of Treatment Guidelines in Texas (Borba and Yee, 2012), The Impact of Provider Choice on Workers’ Compensation Costs and Outcomes (Victor, Barth, and Neumark, 2005), The Effects of Provider Choice Policies on Workers’ Compensation Costs (Neumark and Savych, 2017), and Why Surgery Rates Vary (Yee, Pizer, and Fomenko, 2015). 12 Medical professional services include both professional and technical components of diagnostic tests for applicable services among the eight service types covered in this study. 13 Medical professional services provided in a hospital setting but billed by physicians, physical therapists/occupational therapists, and chiropractors are included in this study. Medical professional services billed by hospitals are excluded. 14 For a brief description of these service groups, refer to Table TA.1. 15 2019 numbers are preliminary results based on half-year price data through June 30, 2019. Five study states (Alabama, Delaware, Nevada, New Hampshire, and New Mexico) were excluded from the trend analysis because of insufficient sample sizes in earlier years. The “Statistical Appendix” Table SA.2 shows price changes in these five states for a shorter period from 2013 to 2019, when sufficient data were available.
copyright © 2020 workers compensation research institute9
_____________________________________________________________________________________________W C R I M E D I C A L P R I C E I N D E X F O R W O R K E R S ' C O M P E N S A T I O N , 1 2 T H E D I T I O N ( M P I - W C )

OUTLINE OF KEY LESSONS
This outline summarizes the key lessons from interstate index comparisons and growth rate comparisons across
states. A more extensive discussion can be found in the section “Discussion of Key Lessons,” beginning on page 13.
LESSONS FROM INTERSTATE INDEX COMPARISONS
Prices paid for a similar set of professional services varied significantly across states, ranging from 28
percent below the 36-state median in Florida to 165 percent above the 36-state median in Wisconsin in
2019 (see Figure 2). The price index in 2018 shows similar results (see Figure 1).
States with no fee schedules for professional services had higher prices paid compared with states with fee
schedules—42 to 174 percent higher than the median of the study states with fee schedules in 2019 (see
Figure 2 and Table 2). Similar results were observed in 2018 (see Figure 1 and Table 1).
LESSONS FROM GROWTH RATE COMPARISONS ACROSS STATES
Growth in prices paid for professional services exhibited tremendous variation across states, spanning
between negative 12 percent in Illinois16 and positive 48 percent in Wisconsin over the time period from
2008 to 2019 (see Figure 3).17
Most states with no fee schedules experienced faster growth in prices paid for professional services
compared with states with fee schedules—the median growth rate among the non-fee schedule states was
34 percent from 2008 to 2019, compared with the median growth rate of 7 percent among the fee
schedule states (see Figure 4 and Table 5).18,19
OUTLINE OF SUBSTANTIAL PRICE CHANGES
This outline summarizes the substantial changes in prices paid for professional medical services in the study
states. A more extensive discussion can be found in the section “Discussion of Substantial Price Changes,”
beginning on page 16.
Seven study states (Arizona, Illinois, Kentucky, Massachusetts, North Carolina, Texas, and Virginia) had
substantial changes (i.e., an increase or a decrease of 10 percent or more) in overall prices paid following
major fee schedule changes during the study period (see page 17).20
16 The price trend in Illinois is discussed in a later section, “Discussion of Substantial Price Changes,” beginning on page 16. 17 Five study states (Alabama, Delaware, Nevada, New Hampshire, and New Mexico) were excluded from the trend analysis because of insufficient sample sizes in earlier years. The “Statistical Appendix” Table SA.2 shows price changes in these five states for a shorter period from 2013 to 2019, when sufficient data were available. 18 Two non-fee schedule states, Iowa and New Jersey, had slower growth in prices paid than the other study states without fee schedules. The results in these two states are discussed in the section “Lessons from Growth Rate Comparisons across States,” beginning on page 14. 19 To compare the price growth between states with fee schedules and states without fee schedules, we restricted our attention to the 22 study states with no major fee schedule changes from 2008 to 2019 because including states with major fee schedule changes in this analysis would likely distort the results. The price trends in the states with major fee schedule changes are discussed in a later section, “Discussion of Substantial Price Changes,” beginning on page 16. 20 Note that New York implemented increases in medical fee schedule rates effective April 1, 2019; previously, the fee schedule in the state had remained relatively unchanged since 1996. The half-year price data through June 2019 in this edition reflect only two months of experience under the new fee schedule. The next edition will examine the price trends with 14 months of experience after this policy change.
copyright © 2020 workers compensation research institute10
_____________________________________________________________________________________________W C R I M E D I C A L P R I C E I N D E X F O R W O R K E R S ' C O M P E N S A T I O N , 1 2 T H E D I T I O N ( M P I - W C )

Many study states had substantial price changes at the service-type level that did not manifest in material
changes in the overall prices. Among these states, Arizona, California, and Colorado had major changes
in the basis of their fee schedules that resulted in substantial changes in prices paid for different types of
services (see page 22). All other states’ substantial price changes in each service type from 2008 to 2019
are summarized in Table 19.
HOW TO USE THIS BENCHMARKING REPORT
The MPI-WC study offers a rich and detailed set of benchmarks, which are organized in an easily accessible
format.
The short narrative scope of the study explains what is covered in this report, including the types of
providers and services, the study states and time span, and the focus of the report.
The section “Discussion of Key Lessons” provides a detailed discussion of comparisons of prices paid for
professional services across states and over time.
The section “Discussion of Substantial Price Changes” provides a detailed discussion of substantial
changes in prices paid for professional medical services following major fee schedule changes.
For those who want to see the medical price index at a glance, Tables A.1 and A.2 show the index values
overall as well as for each service group across the 36 study states in 2018 and 2019.
For those who want to view the graphic presentations of interstate comparisons, there are bar charts for
the overall medical price index as well as a price index for each type of service in Figures A.1–A.18.
For those seeking to understand the overall price growth across study states, Figure B.1 shows the trends
in the overall price index across 31 study states for which we could do a trend analysis from 2008 to 2019.
For those who want to focus on the price growth in a specific state, Figures B.2–B.32 highlight the price
trends in each of the 31 study states for which we could do a trend analysis from 2008 to 2019. In the
state-specific notes to these figures, readers can also find summaries of major fee schedule changes. For
the five additional states introduced in the latest two editions, we show price changes in the “Statistical
Appendix” Table SA.2 for a shorter period from 2013 to 2019, when sufficient data were available in
these states.
For those who want to compare the price growth by service group in different states, Tables B.1–B.8
summarize the trends of prices paid for each of the eight types of services across study states. Table 19
provides a summary of substantial price changes in each service type across study states.
For those who want to drill down on the price trend in a specific state, the charts and tables in Figures
C.1–C.31 provide the changes in prices paid by service group in each of the 31 study states for which we
could do a trend analysis from 2008 to 2019, along with state-specific summaries of major fee schedule
changes in the notes to these graphs. We also provide longer-term price trends from 2002 to 2019 for the
25 states covered in the earlier editions of this study series in the “Statistical Appendix” Table SA.1.
All tables and graphs may be accessed via links in the “List of Figures and Tables” and the “Quick
Reference Guide to Figures and Tables.”
The data and methods are fully described in the “Technical Appendix.” This report also contains a short
summary of the “Technical Appendix” entitled “Data and Methods.”
Note: Each page of this report contains a “Back to Previous View” button that allows the reader to click on
a link to another section and then return to the original page.
copyright © 2020 workers compensation research institute11
_____________________________________________________________________________________________W C R I M E D I C A L P R I C E I N D E X F O R W O R K E R S ' C O M P E N S A T I O N , 1 2 T H E D I T I O N ( M P I - W C )

WCRI MPI-WC: STATE-LEVEL MEASURE OF WORKERS’ COMPENSATION PRICE INFLATION
The method for developing this Medical Price Index for Workers’ Compensation is similar to that of the
Consumer Price Index for medical care services (CPI-M) and Producer Price Index for Health Care Services
(PPI), published by the U.S. Department of Labor’s Bureau of Labor Statistics (BLS).21 All of these price indices
measure changes in price while holding utilization constant over the period studied.
However, the WCRI MPI-WC is an in-depth, independent measure that provides a more relevant
benchmark of medical inflation in workers’ compensation. Compared with the general inflation measures, the
WCRI MPI-WC has the following advantages:
The WCRI MPI-WC focuses only on those medical professional services that are most commonly
provided to workers with injuries—largely related to the diagnosis and treatment of trauma and
orthopedic conditions. The BLS CPI-M and PPI include the prices of all medical professional services
provided to the U.S. population. Many types of services have little or no relevance for tracking medical
prices for the care provided to workers with injuries.
The WCRI MPI-WC is a state-level price index, including all metropolitan areas and rural areas. This
study shows that prices paid and price growth in workers’ compensation exhibit tremendous variation
across states, which is likely related to differences in state workers’ compensation fee regulations—the
principal policy tool for regulating prices—and network participation. The BLS CPI-M and PPI do not
report at the state level; they are only available for the national level and the regional level based on
selected metropolitan areas.
Since workers’ compensation prices paid in the fee schedule states are shaped by the fee schedule
regulations and, in the states without fee schedules, arise out of the negotiations between workers’
compensation insurers and providers, there is no reason to expect workers’ compensation prices to be
similar to prices paid by other types of payors in the local markets. In particular, previous WCRI studies
showed that workers’ compensation typically paid higher prices than group health.22 Hence, the WCRI
MPI-WC better captures the inflation rates in medical professional services specific to workers’
compensation as compared with more general measures of medical price inflation.
21 Table D.1 shows the trends of the Consumer Price Index for medical professional services (CPI-M) and Producer Price Index for Physician Care (PPI) to provide a context of general medical inflation during the analysis period. 22 A New Benchmark for Workers’ Compensation Fee Schedules: Prices Paid by Commercial Insurers? (Fomenko and Victor, 2013) and Comparing Workers’ Compensation and Group Health Hospital Outpatient Payments (Fomenko, 2013).
copyright © 2020 workers compensation research institute12
_____________________________________________________________________________________________W C R I M E D I C A L P R I C E I N D E X F O R W O R K E R S ' C O M P E N S A T I O N , 1 2 T H E D I T I O N ( M P I - W C )

DISCUSSION OF KEY LESSONS
This section provides a detailed discussion of comparisons of prices paid for professional medical services across
states and over time. An outline summarizing the main points of this discussion can be found in the earlier
section “Introduction and How to Use This Report.” The following two major topics are addressed here:
Lessons from interstate index comparisons
Lessons from growth rate comparisons across states
The discussion of these topics focuses on the experience of states with different fee regulation types (i.e.,
states with fee schedules versus states without fee schedules) and the comparative results observed across states
and over time.1 The conceptual framework underlying the focus of the discussion is explained in the earlier
section “Introduction and How to Use This Report.” Note that in the second topic, we focus on states without
major fee schedule changes only, since including states with major fee schedule changes would distort the results
characterizing the relationship between the fee regulation type and price growth rates.2
This report is an update to the 11th edition of this annual study with an additional year of data in 2019. In
this 12th edition, the interstate index comparisons focus on 2018 and 2019, and the growth rate analysis is
expanded to a 12-year span from 2008 to 2019. The key lessons in this 12th edition are consistent with what
was previously reported.
LESSONS FROM INTERSTATE INDEX COMPARISONS
Prices paid for a similar set of professional services for treating workers with injuries varied
significantly across states (see Figure 2 and Table 2). In 2019,3 the overall level of prices paid ranged
from 28 percent below the 36-state median in Florida to 165 percent above the 36-state median in
Wisconsin. In other words, the overall level of prices paid in the highest-price study state, Wisconsin, was
more than three times the level in Florida, the lowest-price study state. The price index in 2018 based on
full-year data shows similar results (see Figure 1 and Table 1).4
1 Earlier editions of this WCRI Medical Price Index study examined the significance of the observed patterns using a linear regression model of an association between the levels of prices paid for professional services and the fee regulation type, adjusted for network participation rates. The findings from this statistical method were supportive of the descriptive analysis of variation in medical prices across states and over time in relation to fee schedules. For more details, refer to WCRI Medical Price Index for Workers’ Compensation, Ninth Edition (MPI-WC) (Yang and Fomenko, 2017). 2 Nine study states with major fee schedule changes are discussed separately in the next section, “Discussion of Substantial Price Changes.” These states are Arizona, California, Colorado, Illinois, Kentucky, Massachusetts, North Carolina, Texas, and Virginia. 3 Results in 2019 are based on half-year price data from January through June 30, 2019. Note that the half-year data likely provide a reasonable approximation for interstate ranking across states in 2019 (see the “Technical Appendix”). 4 Note that the interstate variation in prices paid for medical professional services in workers’ compensation had little correlation with the geographic differences in the costs of maintaining a physician’s office, which can be measured by the Medicare physician fee schedule geographic practice cost indices (GPCIs). Table D.2 shows the GPCIs for practice expense (PE), physician work (Work), and malpractice insurance (MP) as of April 2019. An earlier WCRI study, A New Benchmark for Workers’ Compensation Fee Schedules: Prices Paid by Commercial Insurers? (Fomenko and Victor, 2013), also found that workers’ compensation prices were not well-related to the interstate differences in provider expenses. Analysis in the study shows that fee schedule regulations and network contracts are the main factors shaping workers’ compensation prices.
copyright © 2020 workers compensation research institute13
_____________________________________________________________________________________________W C R I M E D I C A L P R I C E I N D E X F O R W O R K E R S ' C O M P E N S A T I O N , 1 2 T H E D I T I O N ( M P I - W C )

States with no fee schedules for professional services had higher prices paid than states with fee
schedules (see Figure 2 and Table 2). Six study states had no fee schedules as of 2019: Indiana, Iowa,
Missouri, New Hampshire, New Jersey, and Wisconsin.5 In 2019, the overall levels of prices paid in these
six states were 42 to 174 percent higher than the median of the study states with fee schedules. Among the
six study states without fee schedules, the prices paid in Wisconsin were the highest—more than twice
the median of the study states with fee schedules and 67 percent higher than the median of the study
states without fee schedules. Moreover, the median non-fee schedule study state had an overall level of
prices paid for common professional services that was 64 percent higher than that in the typical (i.e.,
median) fee schedule study state for similar services.6 The results for 2018 were similar to those for 2019.7
States with fee schedules for professional services (except for Illinois, Nevada, and Oregon) had
relatively lower prices paid compared with states without fee schedules (see Figure 2). Thirty of the 36
study states had workers’ compensation fee schedules for professional services in 2019.8 Except for
Illinois, Nevada, and Oregon, the overall level of prices paid in these states in 2019 ranged from 25
percent below to 23 percent above the median of the fee schedule study states. These numbers were lower
than the price levels in the non-fee schedule study states. Illinois, Nevada, and Oregon had higher prices
than the other fee schedule states, mainly due to higher fee schedule rates. The overall level of prices paid
in these three states was 34 to 38 percent higher than the median of the fee schedule study states in 2019,
and close to the price level in Iowa, the non-fee schedule state with the lowest prices. Note that these
three states had higher fee schedule rates compared with most other study states with fee schedules (see
Table 3a). The results for 2018 were similar (see Figure 1 and Table 1).
LESSONS FROM GROWTH RATE COMPARISONS ACROSS STATES
Growth in prices paid for common professional services exhibited tremendous variation across states.
In the 31 study states for which we could do a trend analysis from 2008 to 2019, growth rates in the
overall prices paid varied from negative 12 percent in Illinois to positive 48 percent in Wisconsin (see
Figure 3).9
Most states with no fee schedules experienced faster growth in prices paid compared with states with
fee schedules (see Figure 4 and Table 5). Here we focus on the 22 study states with no major fee schedule
5 Virginia adopted its first workers’ compensation fee schedule for medical professional services effective January 1, 2018. The impact of this policy change is discussed in the “Discussion of Substantial Price Changes” section. 6 In this report, we use the terms median and typical interchangeably. 7 Earlier editions of this WCRI Medical Price Index study found statistical evidence supporting the observations of the higher prices paid for professional services in non-fee schedule states than in fee schedule states. The same statistical method also showed that higher network participation rates were associated with lower price levels. Both results were statistically significant. For more details, refer to the discussion of Table 3 and the “Technical Appendix” in WCRI Medical Price Index for Workers’ Compensation, Ninth Edition (MPI-WC) (Yang and Fomenko, 2017). 8 These states are Alabama, Arizona, Arkansas, California, Colorado, Connecticut, Delaware, Florida, Georgia, Illinois, Kansas, Kentucky, Louisiana, Maryland, Massachusetts, Michigan, Minnesota, Mississippi, Nebraska, Nevada, New Mexico, New York, North Carolina, Oklahoma, Oregon, Pennsylvania, South Carolina, Tennessee, Texas, and Virginia (workers’ compensation fee schedule effective January 1, 2018). 9 Five study states (Alabama, Delaware, Nevada, New Hampshire, and New Mexico) were excluded from the trend analysis because of insufficient sample sizes in earlier years. The “Statistical Appendix” Table SA.2 shows price changes in these five states for a shorter period from 2013 to 2019, when sufficient data were available.
copyright © 2020 workers compensation research institute14
_____________________________________________________________________________________________W C R I M E D I C A L P R I C E I N D E X F O R W O R K E R S ' C O M P E N S A T I O N , 1 2 T H E D I T I O N ( M P I - W C )

changes from 2008 to 2019, and 5 of them are states without fee schedules.10 In three out of the five non-
fee schedule study states—Indiana, Missouri, and Wisconsin—the overall increase in prices paid from
2008 to 2019 was 34 percent, 44 percent, and 48 percent, respectively. In contrast, price changes among
the fee schedule states ranged from negative 2 percent (in South Carolina) to 25 percent (in Maryland),
with the typical growth rate at 7 percent over the 12-year study span. In terms of the average annual
growth rate, the increase in prices paid among these three non-fee schedule states was 3–4 percent per
year from 2008 to 2019, while the annual growth rate in prices paid among the fee schedule states ranged
from minimal to 2 percent per year.11
Two non-fee schedule states, Iowa and New Jersey, experienced slower growth in prices paid than
the other study states without fee schedules. From 2008 to 2019, the cumulative growth in prices paid
was 20 percent in Iowa and 19 percent New Jersey (see Figure 4). In Iowa, the overall prices paid grew 11
percent from 2008 to 2011, similar to the experience in other non-fee schedule states during this period
(see Figure B.1). However, prices paid in Iowa remained fairly stable from 2011 to 2015. During the same
period, we observed that the share of payments made to in-network providers for common professional
services in Iowa continued to increase—from 2011 to 2015, this measure increased 8 percentage points
(or 11 percent) in the state, from 73 percent in 2011 to 81 percent in 2015 (see Table 6). The payment
data in Iowa indicated the cost-saving nature of networks, as the prices paid to in-network providers
were lower than to out-of-network providers for similar professional services. The slower growth in
prices paid in New Jersey over the study period was mainly due to a 13 percent decrease in 2013, which
was an atypical change among the non-fee schedule states in that year (see Figure B.1). At the same time,
the share of payments made to in-network providers for common professional services in New Jersey
increased nearly 9 percentage points (or 11 percent) over one year, from 79 percent in 2012 to 88 percent
in 2013 (see Table 6). Moreover, according to the payment data, in New Jersey, the prices paid to in-
network providers were lower than to out-of-network providers for similar professional services,
indicating the cost-saving nature of networks in the state. Note that the trends in prices paid in New
Jersey before and after 2013 were fairly similar to the experience among the other non-fee schedule states
during the same periods—the overall prices paid in New Jersey increased 15 percent from 2008 to 2012;
after the decrease in 2013, this measure grew 18 percent from 2013 to 2019.
10 As we mentioned earlier, since some study states had major changes in their professional fee schedules, the inclusion of those states would likely distort the results characterizing the relationship between the fee regulation type and price growth rates; therefore, we restricted our attention to the 22 study states with no major fee schedule changes from 2008 to June 2019 in this bullet point. The trends of prices paid in states with major changes in their professional fee schedules are discussed in the next section, “Discussion of Substantial Price Changes.” 11 Earlier editions of this WCRI Medical Price Index study found statistical support for the observations of the faster growth in professional prices in the non-fee schedule states compared with the fee schedule states. The same statistical method also showed a strong inverse association between growth in network participation rates and changes in professional prices. Both results were statistically significant. For more details, refer to the discussion of Table 6 in WCRI Medical Price Index for Workers’ Compensation, Ninth Edition (MPI-WC) (Yang and Fomenko, 2017).
copyright © 2020 workers compensation research institute15
_____________________________________________________________________________________________W C R I M E D I C A L P R I C E I N D E X F O R W O R K E R S ' C O M P E N S A T I O N , 1 2 T H E D I T I O N ( M P I - W C )

DISCUSSION OF SUBSTANTIAL PRICE CHANGES
This section provides a detailed discussion of substantial changes in prices paid for professional medical
services. An outline summarizing the main points of this discussion can be found in the earlier section
“Introduction and How to Use This Report.” The following two major topics are addressed here:
A discussion of substantial changes in overall prices following major fee schedule changes
A discussion of substantial changes in prices at the service-type level (without material changes in overall
prices) following major changes in the fee schedule basis
This report offers an abundant body of metrics that track price changes at the overall level as well as in each
of eight service types in the study states over a long period of time. To provide a more targeted discussion here,
we consider a price increase or a price decrease of 10 percent or more to be a substantial price change and focus
on these changes only.
In the first topic, we discuss the results in seven study states that experienced substantial price changes at
the overall level following major changes in fee schedules during the study period. We describe all the
substantial changes in overall prices observed in the data following the major changes in fee schedules—the
principal policy tool for regulating prices—and note the changes in network participation, another important
mechanism that can affect prices paid. The conceptual framework underlying the focus of the discussion is
explained in the earlier section “Introduction and How to Use This Report.”
Many study states had substantial price changes at the service-type level without materially impacting the
overall price levels for professional services. In the second topic, we focus the detailed discussion on three study
states that had major changes to the basis of their fee schedules (i.e., the most fundamental design element of a
fee schedule) that resulted in a substantial shift in relative prices paid for different types of services. We also
provide a brief summary of all the substantial price changes in each service type across all study states during
the study period.
A fee schedule sets payment rates for medical services provided in workers’ compensation, usually with a
list of procedure codes and the associated payment amounts. As another WCRI study1 explained, a workers’
compensation fee schedule has many design elements, including the basis of the fee schedule (RBRVS-based or
not), conversion factor (single or multiple conversion factors), regional variation (single statewide or multiple
regional fee schedules), and level of the fee schedule (how high or low to set the maximum payment rates).2 In
this study we use the term fee schedule changes to mean changes in any of the design elements as well as any
changes in the coding list or billing rules (for example, the coding change discussed in the second topic).
1 Designing Workers’ Compensation Medical Fee Schedules, 2019 (Fomenko and Liu, 2019). 2 See Table 7 for the characteristics of workers’ compensation fee schedules for professional medical services as of 2019, according to the WCRI study Designing Workers’ Compensation Medical Fee Schedules, 2019 (Fomenko and Liu, 2019).
copyright © 2020 workers compensation research institute16
_____________________________________________________________________________________________W C R I M E D I C A L P R I C E I N D E X F O R W O R K E R S ' C O M P E N S A T I O N , 1 2 T H E D I T I O N ( M P I - W C )
DISCUSSION OF SUBSTANTIAL CHANGES IN OVERALL PRICES FOLLOWING MAJOR FEE SCHEDULE
CHANGES
Seven study states—Arizona, Illinois, Kentucky, Massachusetts, North Carolina, Texas, and Virginia—had
substantial changes in overall prices paid following major fee schedule changes during the study period.3
In this section, we describe the fee schedule changes and the changes in prices paid in each of these states,
organized in reverse chronological order, starting with the policy change in January 2018 in Virginia.
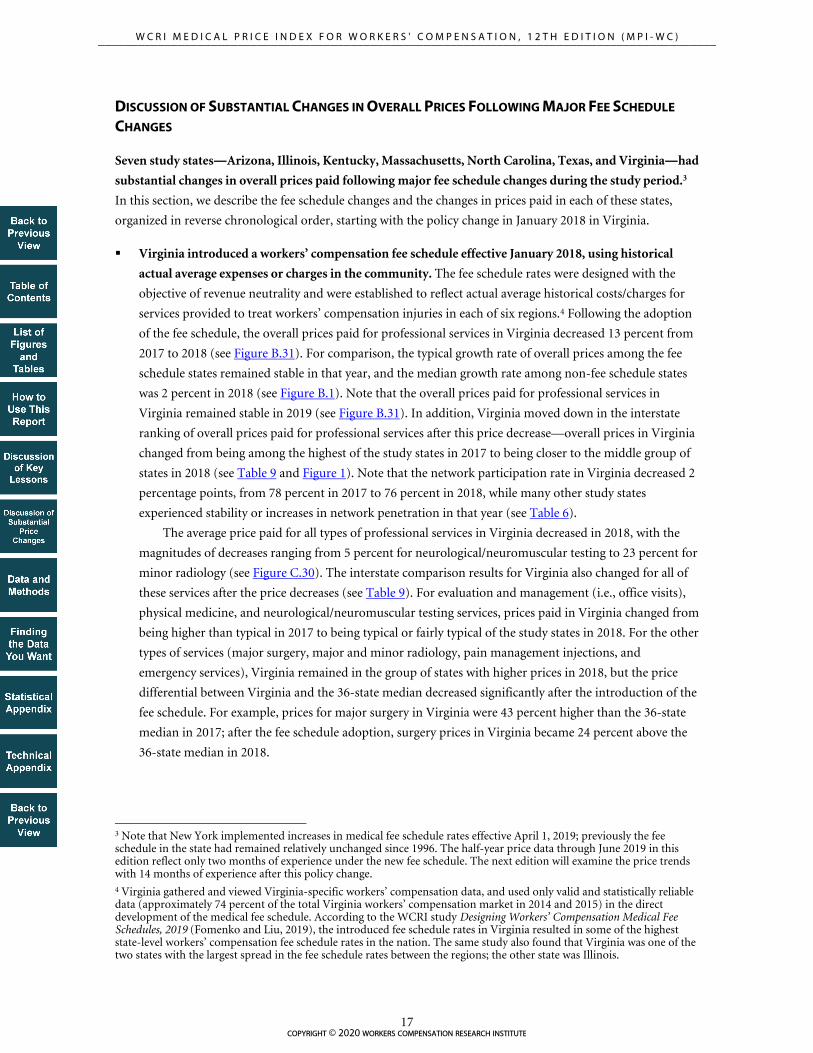
Virginia introduced a workers’ compensation fee schedule effective January 2018, using historical
actual average expenses or charges in the community. The fee schedule rates were designed with the
objective of revenue neutrality and were established to reflect actual average historical costs/charges for
services provided to treat workers’ compensation injuries in each of six regions.4 Following the adoption
of the fee schedule, the overall prices paid for professional services in Virginia decreased 13 percent from
2017 to 2018 (see Figure B.31). For comparison, the typical growth rate of overall prices among the fee
schedule states remained stable in that year, and the median growth rate among non-fee schedule states
was 2 percent in 2018 (see Figure B.1). Note that the overall prices paid for professional services in
Virginia remained stable in 2019 (see Figure B.31). In addition, Virginia moved down in the interstate
ranking of overall prices paid for professional services after this price decrease—overall prices in Virginia
changed from being among the highest of the study states in 2017 to being closer to the middle group of
states in 2018 (see Table 9 and Figure 1). Note that the network participation rate in Virginia decreased 2
percentage points, from 78 percent in 2017 to 76 percent in 2018, while many other study states
experienced stability or increases in network penetration in that year (see Table 6).
The average price paid for all types of professional services in Virginia decreased in 2018, with the
magnitudes of decreases ranging from 5 percent for neurological/neuromuscular testing to 23 percent for
minor radiology (see Figure C.30). The interstate comparison results for Virginia also changed for all of
these services after the price decreases (see Table 9). For evaluation and management (i.e., office visits),
physical medicine, and neurological/neuromuscular testing services, prices paid in Virginia changed from
being higher than typical in 2017 to being typical or fairly typical of the study states in 2018. For the other
types of services (major surgery, major and minor radiology, pain management injections, and
emergency services), Virginia remained in the group of states with higher prices in 2018, but the price
differential between Virginia and the 36-state median decreased significantly after the introduction of the
fee schedule. For example, prices for major surgery in Virginia were 43 percent higher than the 36-state
median in 2017; after the fee schedule adoption, surgery prices in Virginia became 24 percent above the
36-state median in 2018.
3 Note that New York implemented increases in medical fee schedule rates effective April 1, 2019; previously the fee schedule in the state had remained relatively unchanged since 1996. The half-year price data through June 2019 in this edition reflect only two months of experience under the new fee schedule. The next edition will examine the price trends with 14 months of experience after this policy change. 4 Virginia gathered and viewed Virginia-specific workers’ compensation data, and used only valid and statistically reliable data (approximately 74 percent of the total Virginia workers’ compensation market in 2014 and 2015) in the direct development of the medical fee schedule. According to the WCRI study Designing Workers’ Compensation Medical Fee Schedules, 2019 (Fomenko and Liu, 2019), the introduced fee schedule rates in Virginia resulted in some of the highest state-level workers’ compensation fee schedule rates in the nation. The same study also found that Virginia was one of the two states with the largest spread in the fee schedule rates between the regions; the other state was Illinois.
copyright © 2020 workers compensation research institute17
_____________________________________________________________________________________________W C R I M E D I C A L P R I C E I N D E X F O R W O R K E R S ' C O M P E N S A T I O N , 1 2 T H E D I T I O N ( M P I - W C )

North Carolina implemented new fee schedule rates for professional services effective July 2015.5 The
new fee schedule rates incorporate the 2015 Medicare rates with the revised service-type specific
multipliers, ranging between 140 and 195 percent of Medicare. Before this change, the fee schedule rates
for most types of professional services in North Carolina were set at 158 percent of the 1995 Medicare
values. The overall prices paid for professional services in North Carolina increased 17 percent from 2014
to 2016 following this fee schedule change (see Figure B.21). For comparison, the median growth rate of
overall prices among the fee schedule states remained stable during this period (see Figure B.1). Note that
the network participation rate in North Carolina was fairly stable between 2014 and 2016, while many
other fee schedule states experienced increases in network participation (see Table 6). As to the interstate
ranking results, the overall prices paid in North Carolina moved from being among the lowest of the
study states in 2014 to being fairly typical of the study states in 2016 (see Figure 5).6
At the service-type level, prices paid increased for some services and decreased for others after the
new fee schedule rates were implemented. On one hand, the average price paid for evaluation and
management (i.e., office visits), physical medicine, and emergency visits in North Carolina increased
substantially, with growth ranging from 30 to 46 percent from 2014 to 2016 (see Figure C.20). Note that
the median growth rate of prices paid among fee schedule states for these types of services was within
2 percent during this period (see Tables B.1, B.2, and B.8). North Carolina moved up in the interstate
ranking of prices paid for these types of services after the price increases (see Table 10). In addition, for
minor radiology services, the average price paid in North Carolina had a small increase of 4 percent from
2014 to 2016 (see Figure C.20). On the other hand, the average price paid for several other types of
services decreased—7 to 10 percent decreases from 2014 to 2016 for major surgery, pain management
injections, and neurological/neuromuscular testing services, and a 38 percent decrease for major
radiology. In contrast, during this period, the typical trends of prices paid among fee schedule states
showed little change for major surgery and neurological/neuromuscular testing, a small increase of
2 percent for pain management injections, and a small decrease of 3 percent for major radiology (see
Tables B.3, B.4, B.5, and B.7). North Carolina moved down in the interstate ranking of prices paid for
major radiology after the substantial price decrease (see Table 10). For major surgery, pain management
injections, and neurological/neuromuscular testing services, the interstate ranking for North Carolina did
not change much between 2014 and 2016. Note that prices paid for all types of services in North Carolina
changed little in 2017, and the overall prices paid for professional services remained stable in the most
recent study year in this report (see Figure C.20 and Figure B.21).
5 House Bill 92, passed in the 2013 legislative session, required that physician reimbursement be based on “applicable Medicare payment methodologies” and charged the North Carolina Industrial Commission with developing and updating the reimbursement methodology. Proposed fee schedule rule changes were published in November 2014 and approved in February 2015; the new professional fee schedule rates went into effect July 1, 2015. Under the new fee schedule, reimbursement rates vary by service with multipliers set at 140–195 percent of the 2015 Medicare levels across different types of services. Before this change, the fee schedule rates for most types of professional services in North Carolina had remained at 158 percent of the 1995 Medicare values, since 1996. In 2013, the fee schedule rates for office visits in North Carolina increased significantly as the multiplier for this type of service increased from 158 to 205 percent of Medicare. Note that, as of 2016, North Carolina publishes fee schedule rates effective January 1 in each year. 6 This comparison for North Carolina in 2014 is based on the 31 states published in the ninth edition of this annual study; the comparison in 2016 is based on the same set of states for consistency. For the other states discussed in this section, excluding Virginia, the interstate ranking changes are also based on these 31 study states.
copyright © 2020 workers compensation research institute18
_____________________________________________________________________________________________W C R I M E D I C A L P R I C E I N D E X F O R W O R K E R S ' C O M P E N S A T I O N , 1 2 T H E D I T I O N ( M P I - W C )

Kentucky discontinued the use of relative values from Medicare’s RBRVS for its professional fee
schedule in June 2014.7 Instead, it transitioned to state-specific relative values based on historic data
from FAIR Health commercial database values. Following this policy change, the overall prices paid for
professional services in Kentucky increased 19 percent from 2013 to 2015 (see Figure B.13). For
comparison, the median growth rate of overall prices among the fee schedule states changed little during
this period (see Figure B.1). Kentucky moved up in the interstate ranking of overall prices paid for
professional services after this price increase (see Table 11). Note that the network participation rate in
Kentucky increased from 82 percent in 2013 to 85 percent in 2015, and this increase was similar to the
experience in many study states with fee schedules during this period (see Table 6).
The average price paid for many types of services in Kentucky increased from 2013 to 2015, with the
magnitudes of increases ranging from 4 percent for major surgery to 33 percent for physical medicine
services (see Figure C.12). In particular, prices paid increased substantially for evaluation and
management (i.e., office visits), emergency services, and physical medicine from 2013 to 2015—a 21
percent increase for office visits, 31 percent increase for emergency services, and 33 percent increase for
physical medicine. The interstate ranking for Kentucky changed significantly for these services. For
physical medicine, Kentucky changed from 10 percent lower than the median of the study states in 2013
to 15 percent higher than the median state in 2015 (see Table 11). For office visits and emergency
services, Kentucky moved from well below the median state in 2013 to around the median state in 2015.
On the other hand, prices paid for radiology services remained stable in Kentucky (see Figure C.12). In
addition, prices paid for neurological/neuromuscular testing services in Kentucky decreased 23 percent
from 2013 to 2015. This price decrease was mainly related to the fundamental change in the coding for
nerve conduction studies that was implemented by the Centers for Medicare & Medicaid Services
(CMS).8
Arizona implemented increases in fee schedule rates for evaluation and management, physical
medicine, and certain surgeries in October 2013.9 The overall prices paid for professional services in
Arizona increased 10 percent from 2013 to 2014 following this fee schedule change (see Figure B.3). For
comparison, the median growth rate of overall prices among the fee schedule states changed little in 2014
(see Figure B.1). Note that the network participation rate in Arizona increased from 80 percent in 2013
to 85 percent in 2014, and this increase was similar to the experience in many study states in that year
7 According to the WCRI study Designing Workers’ Compensation Medical Fee Schedules, 2016 (Fomenko and Liu, 2016), the overall fee schedule rate in Kentucky in 2016 was 29 percent higher compared with that in 2011. Before the 2014 policy change, the professional fee schedule in Kentucky was based on Medicare’s RBRVS, with multiple conversion factors for different types of services, and was updated periodically. 8 For more discussion on this coding change, see the following subsection titled “Discussion of Substantial Changes in Prices at Service-Type Level.” 9 Arizona publishes its fee schedule annually with effective dates of October 1 through September 30 of the following year. The Industrial Commission of Arizona reviews the fee schedule rates annually with a focus each year on one of four specific groups of codes and rotates through these specific groups of codes every four years. To calculate the fee schedule rates for the codes under review, the Commission surveys the workers’ compensation fee schedules from the states of Colorado, Nevada, New Mexico, North Carolina, Oregon, Utah, and Washington and uses the following methodology: (a) current Arizona values between the 75th and 100th percentile of the states surveyed will not be adjusted; (b) current Arizona values over the 100th percentile of the states surveyed will be reduced to the 100th percentile; and (c) current Arizona values below the 75th percentile will be increased to the 75th percentile subject to the following: Increases shall be capped at 25 percent, unless and except as necessary to bring a current value up to the 50th percentile. For the fee schedule effective October 2013, the groups of codes that were reviewed and adjusted were evaluation and management, physical medicine, surgery codes from 25000 to 39599, and anesthesiology relative values. Note that the fee schedule rates for many common surgeries remained unchanged or had only small increases. Effective October 1, 2017, Arizona transitioned to an RBRVS-based fee schedule. The impact of this fee schedule transition is examined in the following subsection, “Discussion of Substantial Changes in Prices at Service-Type Level.”
copyright © 2020 workers compensation research institute19
_____________________________________________________________________________________________W C R I M E D I C A L P R I C E I N D E X F O R W O R K E R S ' C O M P E N S A T I O N , 1 2 T H E D I T I O N ( M P I - W C )

(see Table 6). As for the interstate ranking results, the overall prices paid in Arizona changed from being
typical of the study states in 2013 to 10 percent higher than the median state in 2014 (see Table 12).
At the service-type level, the average price paid for evaluation and management (i.e., office visits)
and physical medicine services in Arizona increased 18 percent and 15 percent, respectively, in 2014 (see
Figure C.2). Note that the median growth rate of prices paid among fee schedule states for both types of
services was about 1 percent in that year (see Tables B.1 and B.2). Arizona moved up in the interstate
ranking of prices paid for office visits and physical medicine after the price increase for these services (see
Table 12). For major surgery, Arizona had a slight increase of 2 percent in the average price in 2014 (see
Figure C.2), and the interstate ranking of Arizona remained in the group of states with higher prices for
major surgery in 2014 (see Table 12).
In September 2011, the Illinois workers’ compensation fee schedule rates for all types of medical
services underwent an across-the-board decrease of 30 percent.10 Following this policy change, the
overall prices paid for professional services in Illinois decreased 27 percent from 2010 to 2012 (see Figure
B.10). In contrast, the median growth rate of overall prices among the fee schedule states had a small
increase of 2 percent during this period (see Figure B.1). After this price decrease, the overall prices paid
in Illinois still ranked among the highest of the study states (see Table 13). Note that during this period,
the network participation rate in Illinois increased 6 percentage points, from 50 percent in 2010 to 56
percent in 2012, while most other study states experienced smaller changes on this measure (see Table 6).
Another WCRI study pointed out that part of this increase in network participation in Illinois may be
related to stronger incentives of providers to participate in networks in order to increase the volume of
workers’ compensation patients they treat.11 Note that even after the fee schedule decrease, the prices
paid for workers’ compensation patients in Illinois for most types of services (with the exception of
evaluation and management) were still much higher than those for other patients (such as group health
and Medicare patients), as an earlier WCRI study found.12
The average price paid for all types of services in Illinois decreased from 2010 to 2012, with the
magnitudes of decreases ranging from 18 percent for emergency services to 31 percent for
neurological/neuromuscular testing services (see Figure C.9). After this fee schedule reduction, the
interstate ranking for Illinois changed significantly for prices paid for evaluation and management (i.e.,
office visits), from 14 percent higher than the median of the study states in 2010 to 20 percent below the
median state in 2012 (see Table 13). Effective July 2014, Illinois increased the fee schedule rates for
certain evaluation and management procedures to a level more comparable to Medicare rates, and we
observed the prices paid for evaluation and management services in Illinois increase 10 percent from
2013 to 2015 (see Figure C.9). After this price increase for office visits, the interstate ranking for Illinois
10 Illinois introduced workers’ compensation medical fee schedules for the first time in 2006. The maximum allowable payments for medical procedures, treatments, or services were set at 90 percent of the 80th percentile of charges and fees in 2002–2004 within each of the 29 geozip areas of the state. A WCRI study found that the fee schedule rates for professional services showed large variations across the 29 geozip areas, and the variations were particularly significant for specialty care (Fomenko and Liu, 2012). For example, for major surgeries, the fee schedule rates ranged from a low of 277 percent above Medicare to a high of 498 percent above Medicare, a difference of 221 percentage points. In contrast, the fee schedule rates for office visits ranged from a low of 11 percent to a high of 50 percent over Medicare. Starting in January 2012, Illinois discontinued its use of the 29 geozip areas for physicians and other nonhospital providers in favor of four county-based regions, and the intrastate differences in fee schedule rates among regions in Illinois decreased noticeably. Over time, the fee schedule rates have been adjusted on an annual basis to reflect changes in the U.S. Consumer Price Index for All Urban Consumers (CPI-U). 11 CompScope™ Medical Benchmarks for Illinois, 15th Edition (Radeva, 2014). 12 The Effect of Reducing the Illinois Fee Schedule (Yang and Fomenko, 2014).
copyright © 2020 workers compensation research institute20
_____________________________________________________________________________________________W C R I M E D I C A L P R I C E I N D E X F O R W O R K E R S ' C O M P E N S A T I O N , 1 2 T H E D I T I O N ( M P I - W C )

became 16 percent below the median state in 2015, still in the group of states with lower prices paid for
evaluation and management services. Similar results were observed in 2018 (see Figure A.3).
For prices for other service groups, Illinois moved down in the interstate ranking slightly after the
2011 fee schedule decrease but remained in the higher group of states. For example, for major surgery,
the average price paid in Illinois was the highest of the study states in 2010, 163 percent above the median
state. After the price decrease following the 2011 fee schedule change, the average price paid for major
surgery in Illinois became 82 percent above the median state in 2012, still among the highest of the study
states. For the changes in Illinois’ ranking for other service groups, please refer to Table 13.
In 2011, the fee schedule rates in Texas increased for most professional services.13 Following this fee
schedule increase, the overall prices paid for professional services in Texas increased 16 percent from
2010 to 2011 (see Figure B.30). By contrast, the median growth rate of overall prices among the fee
schedule states was less than 1 percent in that year (see Figure B.1). As to the interstate ranking results,
the overall price in Texas changed from being slightly below the median state in 2010 to being near the
median of the study states in 2011 (see Table 14). Note that the network participation rate in Texas had a
significant decrease from 74 percent in 2010 to 23 percent in 2011, following the elimination of voluntary
(informal) networks in the state effective January 1, 2011. Another WCRI study pointed out that in
addition to the fee schedule increases, the elimination of voluntary networks was likely a factor in the
observed price increase in Texas because discount fee contracts between health care providers and payors
were no longer available except through certified networks.14
Double-digit increases in prices were observed across almost all types of services except for major
and minor radiology (see Figure C.29). For example, Texas had a 17 percent increase in evaluation and
management (i.e., office visit) prices in 2011, compared with a more moderate 5 percent increase in the
median growth rate among the fee schedule states (see Table B.1). The major surgery prices in Texas
increased 21 percent in 2011, while the fee schedule state median growth rate changed little in that year
(see Table B.3). The magnitudes of price increases among the other service groups with double-digit
growth from 2010 to 2011 ranged from 10 percent for emergency services to 20 percent for
neurological/neuromuscular testing. The interstate comparison results varied for different types of
services in Texas. Table 14 summarizes the changes in Texas’ interstate ranking by service group. For
instance, in 2010, the office visit price in Texas was slightly above the median of the study states (6
percent higher than the median state). After the price increase, this measure in Texas moved up into the
higher group of states (19 percent above the median state) in 2011. For major surgery, however, Texas
ranked in the lower group of states before and after the fee schedule increase.
Massachusetts increased the fee schedule rates for most professional services effective April 2009.
Notably, the fee schedule rates for many major surgeries were increased by factors of 2 or 3 to be more
13 The workers’ compensation fee schedule for professional services in Texas is RBRVS-based. Texas publishes state conversion factors for service groups annually based on changes in the Medicare Economic Index; since 2009, these published conversion factors have been effective January 1 through December 31 of the stated year. The fee schedule regulation in Texas requires that the fee schedule rates reflect the most current reimbursement methodologies, models, and values or weights used by the federal Centers for Medicare & Medicaid Services. Previously in March 2008, Texas increased fee schedule rates for professional services, especially for surgeries. In August 2003, Texas implemented a significant decrease in fee schedule rates for surgery and radiology, and a substantial increase in rates for evaluation and management services. 14 CompScope™ Medical Benchmarks for Texas, 15th Edition (Telles, 2014).
copyright © 2020 workers compensation research institute21
_____________________________________________________________________________________________W C R I M E D I C A L P R I C E I N D E X F O R W O R K E R S ' C O M P E N S A T I O N , 1 2 T H E D I T I O N ( M P I - W C )

in line with the median prices paid, due to negotiations between payors and providers.15 The overall
prices paid for professional services in Massachusetts increased 15 percent from 2008 to 2010 following
this fee schedule change (see Figure B.15). For comparison, the median growth rate of overall prices
among the fee schedule states increased 4 percent during this period (see Figure B.1). Note that the
network participation rate in Massachusetts decreased 6 percentage points, from 37 percent in 2008 to
31 percent in 2010, while most other study states had smaller changes during this period.16 The interstate
ranking of overall prices paid for professional services in Massachusetts changed from being among the
lowest of the study states in 2008 (15 percent below the median state) to being similar to the median state
in 2010 (see Table 15).
Price increases in Massachusetts were observed in all types of services except for
neurological/neuromuscular testing services (see Figure C.14). The average price paid for major surgery
experienced a particularly large increase of 27 percent from 2008 to 2010.17 By contrast, the median
growth rate in major surgery prices among the fee schedule states was 3 percent over the two years (see
Table B.3). As to the interstate ranking results, the average price paid for major surgery in Massachusetts
was 16 percent higher than the median state in 2008. After the large price increase following the fee
schedule change, this measure in Massachusetts became 44 percent above the median study state in 2010,
among the highest of the study states. The magnitudes of price increases for the other service groups
ranged from 7 percent for minor radiology to 12 percent for physical medicine and emergency services.
Table 15 summarizes the changes in Massachusetts’ interstate rankings for these service groups.
DISCUSSION OF SUBSTANTIAL CHANGES IN PRICES AT SERVICE-TYPE LEVEL
During the study period, we observed substantial price changes at the service-type level in many study states
that were not accompanied by material changes in the overall prices. Among these states, Arizona, California,
and Colorado are the three states that had major changes in the basis of their fee schedules; we discuss the
results in these three states in detail, leading with the more recent policy changes in October 2017 in Arizona.
Then, we provide a brief summary of all the substantial price changes during the study period in each service
type across all study states.
15 Prior to the 2009 change, the Massachusetts fee schedule for professional services had not been updated since September 2004. A WCRI study showed that major surgeries were often paid above the fee schedule rates (Eccleston, 2006). This study found that for many of these surgeries, it was not uncommon for the median prices paid to be two or three times the fee schedule amount. Typically, 50–60 percent of these surgical procedures were paid above the fee schedule rate. System participants indicated that payors in the state were willing to negotiate with surgeons because workers had better outcomes and return to work was faster (Radeva, 2014b). The 2009 change increased the fee schedule rates for surgeries substantially to be in line with the median prices paid; the fee schedule rates for some surgeries increased to 2–3 times the previous rates. 16 The substantial price increase for major surgeries in Massachusetts was unlikely to be affected by the decrease in network participation rate, as the negotiated prices for these services were substantially higher than the fee schedule rates (Radeva, 2014b). For other services, since the network participation rate in Massachusetts was among the lowest of the study states, only a small portion of the services was affected by the potential discounted prices through networks; thus, the potential effect of this decrease in network participation rate on the price increases was likely to be limited. 17 Part of this increase in the average price paid for major surgery reflects the fee schedule increase for the surgeries that had been paid at or below fee schedule levels before the 2009 fee schedule change. According to another WCRI study, for many common surgeries in Massachusetts, typically 50–60 percent of these surgical procedures were paid above the fee schedule rates, and the rest of them were paid at or below the fee schedule rates before the 2009 change (Eccleston, 2006). System participants indicated that continued negotiation between the medical providers and payors during the period of the 2009 fee schedule change was likely to be another factor underlying the increase in the average price paid for major surgery (Radeva, 2015).
copyright © 2020 workers compensation research institute22
_____________________________________________________________________________________________W C R I M E D I C A L P R I C E I N D E X F O R W O R K E R S ' C O M P E N S A T I O N , 1 2 T H E D I T I O N ( M P I - W C )

Arizona transitioned to a Medicare RBRVS-based fee schedule for professional services effective
October 2017. Before this change, the fee schedule rates in Arizona were established annually between
the 75th and 100th percentile of the surveyed values from the states of Colorado, Nevada, New Mexico,
North Carolina, Oregon, Utah, and Washington. This fee schedule transition in Arizona changed the
prices paid for different types of services significantly in 2018, while the average overall price had a
moderate growth of 3 percent in that year.
Following this fee schedule change, the prices paid for primary care services (for example, office
visits) increased, while prices paid for specialty care (for example, surgeries) decreased in Arizona (see
Figure C.2). In particular, prices paid for evaluation and management (i.e., office visits) increased 11
percent, while prices paid for major surgery decreased 11 percent in 2018. In contrast, the median growth
rate of prices paid for both types of services among the fee schedule states was less than 1 percent in that
year (see Tables B.1 and B.3). Another service type in Arizona that experienced a price increase in 2018
was physical medicine, and the increase was 7 percent (see Figure C.2). In comparison, this measure in
many fee schedule states remained fairly stable in that year (see Table B.2). Prices paid decreased in 2018
for major radiology (4 percent decrease), pain management injections (15 percent decrease), and
emergency services (13 percent decrease) in Arizona (see Figure C.2). Note that among the fee schedule
states, the typical price trend for emergency services was stable, and the median change rates of prices for
major radiology and pain management injections were nearly negative 1 percent in 2018 (see Tables B.4,
B.5, and B.8). Prices paid for minor radiology and neurological/neuromuscular testing remained stable in
Arizona in 2018 (see Figure C.2).
After this fee schedule transition, the interstate comparison results also varied for different types of
services in Arizona (see Table 16). For office visits and physical medicine, prices paid in Arizona moved
up in the interstate ranking after the price increases in 2018. For major and minor radiology, and
neurological/neuromuscular testing, prices paid in Arizona remained typical or fairly typical of the study
states in 2018 after the fee schedule change. Prices paid for pain management injections in Arizona
changed from being typical of the study states in 2017 to being slightly lower than typical in 2018. Prices
paid for major surgery and emergency services in Arizona changed from being slightly higher than typical
in 2017 to typical of the study states in 2018.
Without substantial change in the overall prices paid for professional services, Arizona’s interstate
ranking on this measure remained similar after the fee schedule transition—the average overall price in
Arizona was 15 percent higher than the 36-state median in 2017, and it was 18 percent above the 36-state
median in 2018 (see Table 16). The network participation rate in Arizona increased from 84 percent in
2017 to 87 percent in 2018 (see Table 6). Note that the overall prices paid for professional services in
Arizona remained stable in 2019 (see Figure B.3).
Effective January 2016, Colorado revised its fee schedule for professional services and incorporated
the use of relative values from Medicare’s RBRVS. Previously, Colorado based its fee schedule on the
Relative Values for Physicians published by OPTUM360°.18 Prices paid for different types of services in
Colorado were affected differently by this fee schedule change, while the average overall price did not
change materially during the same period.
For many types of services, the average price increased in 2016, with the magnitudes of increases
ranging from 5–6 percent for office visits and physical medicine to 50 percent for
18 The RBRVS-based workers’ compensation medical fee schedule for professional services in Colorado (effective January 1, 2016) reflected the National Physician Fee Schedule Relative Value Scale file published by Medicare in January 2015.
copyright © 2020 workers compensation research institute23
_____________________________________________________________________________________________W C R I M E D I C A L P R I C E I N D E X F O R W O R K E R S ' C O M P E N S A T I O N , 1 2 T H E D I T I O N ( M P I - W C )

neurological/neuromuscular testing services (see Figure C.4). In particular, the price increases in 2016
were substantial for pain management injections (21 percent increase), minor radiology (47 percent
increase), and neurological/neuromuscular testing (50 percent increase). In contrast, the median rates of
change in prices paid for these five types of services among the fee schedule states were all within 1
percent in 2016 (see Tables B.1, B.2, B.4, B.6, and B.7). Meanwhile, prices paid decreased in 2016 for
major radiology (13 percent decrease), major surgery (26 percent decrease), and emergency services (42
percent decrease) in Colorado (see Figure C.4). Note that the typical price trends for these services
among the fee schedule states changed little in 2016 (see Tables B.3, B.5, and B.8).
Following this fee schedule change, the interstate comparison results for Colorado also varied for
different types of services.19 For minor radiology, pain management injections, and
neurological/neuromuscular testing services, Colorado moved up in the interstate ranking after the large
price increases in 2016 (see Table 17). For major surgery, major radiology, and emergency services,
Colorado moved down in the interstate ranking after the price decreases in 2016. For evaluation and
management services (i.e., office visits) and physical medicine, the interstate comparison grouping for
Colorado did not change much between 2015 and 2016—Colorado ranked among the lower group of
states for the prices paid for physical medicine and in the middle group for prices paid for office visits,
before and after the fee schedule change.
The overall prices paid for professional services in Colorado remained fairly stable in 2016 (see
Figure B.5), and Colorado remained in the middle group of the study states on overall prices paid after
the fee schedule change (see Table 17). The network participation rate in Colorado increased moderately
from 89 percent in 2015 to 91 percent in 2016 (see Table 6). Note that the overall prices paid for
professional services in Colorado remained stable in 2017, and increased 6 percent in 2018 following the
fee schedule update in that year (see Figure B.5 and Figure C.4).
California began a four-year transition to an RBRVS-based fee schedule for professional services
starting in January 2014.20 Before this policy change, California used the Official Medical Fee Schedule
(OMFS) to regulate the payment of professional services, and the fee schedule rates in the OMFS had
remained unchanged since 2007. This major change in the basis of the fee schedule in California shifted
the relative prices paid for different types of services substantially, while the overall price only
experienced moderate increases of 3 percent per year from 2013 to 2017.
Following this fee schedule change, the prices paid for primary care services (for example, office
visits) increased, while prices paid for specialty care (for example, surgeries) decreased in California (see
Figure C.3). In particular, from 2013 to 2014, prices paid for evaluation and management (i.e., office
visits) and physical medicine services increased 30 and 27 percent, respectively. In contrast, the median
growth rate of prices paid for both types of services among the fee schedule states was about 1 percent in
that year (see Tables B.1 and B.2). In 2015, 2016, and 2017, the prices paid for office visits and physical
medicine in California continued to increase, but with more moderate magnitudes as compared with
19 The interstate comparisons for Colorado in 2015 are based on the 31 states published in the ninth edition of this annual study; the comparisons in 2016 are based on the same set of states for consistency. For the other states discussed in this section, excluding Arizona, the interstate ranking changes are also based on these 31 study states. 20 This fee schedule change is a part of the comprehensive workers’ compensation reform legislation in California, Senate Bill (SB) 863. This legislation requires the adoption of Medicare’s RBRVS schedule for professional services to be phased in over four years, beginning in 2014, and to remain in effect until the Division of Workers’ Compensation adopts an RBRVS schedule that allows no more than 120 percent of the aggregate fees allowed by Medicare. During the four-year transition period, the conversion factors for primary care services increased and the conversion factors for specialty services (such as surgery and radiology) decreased.
copyright © 2020 workers compensation research institute24
_____________________________________________________________________________________________W C R I M E D I C A L P R I C E I N D E X F O R W O R K E R S ' C O M P E N S A T I O N , 1 2 T H E D I T I O N ( M P I - W C )

those in 2014—18 percent for office visits and 13 percent for physical medicine from 2014 to 2017 (see
Figure C.3). On the other hand, prices paid for major surgery, major radiology, pain management
injections, and emergency services in California had decreases in 2014, ranging from 4 to 21 percent. For
comparison, the fee schedule state median growth rate of prices paid for all these types of services ranged
from positive 1 percent to negative 2 percent in that year (see Tables B.3, B.4, B.5, and B.8). In the
following three years during the transition period, the prices paid for most of these service types
continued to decrease, but with more moderate magnitudes than in 2014 (see Figure C.3). In addition,
prices paid for minor radiology services in California increased 14 percent in 2014 after the beginning of
the fee schedule transition. From 2014 to 2017, minor radiology prices decreased 18 percent in the state,
mainly reflecting the decreases in Medicare’s RBRVS fee schedule rates for many minor radiology
procedures. The prices paid for neurological/neuromuscular testing services in California decreased 43
percent in 2014, mainly related to the fundamental change in the coding for nerve conduction studies
that was implemented by CMS.21
After this fee schedule transition, the interstate comparison results varied for different types of
services in California. For example, for office visits, California moved up in the interstate ranking after
the increases in office visit prices (see Table 18). For major surgery, in contrast, California moved down
in the interstate ranking following the price decreases. Table 18 also summarizes the changes in
California’s interstate ranking for other types of services.
The overall prices paid for professional services in California increased 14 percent from 2013 to 2017
(see Figure B.4). However, after this increase, California remained among the lowest of the study states
on overall prices paid in 2017 (see Table 18). Note that the network participation rate in California
increased from 85 percent in 2013 to 93 percent in 2017 (see Table 6).
Besides Arizona, California, and Colorado, many other study states experienced substantial price changes
at the service-type level. Table 19 summarizes all the annual substantial price changes of 10 percent or more
in each service type across all study states. In states with fee schedules, these changes are often related to changes
in the fee schedule rates. In states with no fee schedules, some price changes are likely influenced by changes in
network participation. In addition, some of the price changes shown in Table 19 reflect the changes in the
Medicare fee schedule implemented by CMS. For example, we observed substantial decreases in prices paid for
neurological/neuromuscular testing services in most study states starting in 2013. This general trend is related
to a fundamental change implemented by CMS in the coding system (i.e., the coding list and billing rules) for
nerve conduction studies, the most commonly billed procedures in the neurological/neuromuscular testing
service group. During this 2013 change, the previous procedure codes for nerve conduction studies were
deleted. The new coding list no longer differentiates between the types of nerve conduction studies; instead, an
individual CPT code captures the number of nerve conduction studies. The new billing rules require that each
type of nerve conduction study be counted only once when multiple sites on the same nerve are stimulated or
recorded, and the numbers of these separate tests should be added to determine which code to use.22 Note that
this change was made in an effort to address the duplication of time (and therefore payments) when billing for
multiple units under the retired codes.23 We observed double-digit decreases in prices paid for major radiology
21 For more details on this coding change, see the description later in this subsection. 22 For more details on this coding change and the computation method, please refer to the “Technical Appendix.” 23 This change was part of the “Misguided Code Initiative” by CMS. Under this initiative, the American Medical Association (AMA) and the Relative Value Scale Update Committee (RUC) were given the task of bundling the codes that
copyright © 2020 workers compensation research institute25
_____________________________________________________________________________________________W C R I M E D I C A L P R I C E I N D E X F O R W O R K E R S ' C O M P E N S A T I O N , 1 2 T H E D I T I O N ( M P I - W C )

services in many study states after 2013. This trend in some states reflected the decreases in Medicare fee
schedule rates for some common major radiology procedures, with the rate decreases being more substantial
for the technical component of the procedures (i.e., using the radiology machine/devices). Since 2014, CMS
has implemented several changes in the Medicare fee schedule rates for certain common pain management
injection procedures. For example, the Medicare fee schedule rates for lumber and cervical epidural injections
(CPT codes 62310 and 62311) experienced double-digit decreases in 2014 and substantial increases in 2015.
We observed large changes in prices paid for pain management injections in many study states following these
fee schedule changes.
CMS identified as being performed together more than 75 percent of the time. The new codes for nerve conduction studies were added in the 2013 CPT code list published by the AMA, and the previous codes were retired.
copyright © 2020 workers compensation research institute26
_____________________________________________________________________________________________W C R I M E D I C A L P R I C E I N D E X F O R W O R K E R S ' C O M P E N S A T I O N , 1 2 T H E D I T I O N ( M P I - W C )

Figure 1 Interstate Comparison of Prices Paid for Professional Services, WCRI MPI-WC in 36 States, 2018
Figure 2 Interstate Comparison of Prices Paid for Professional Services, WCRI MPI-WC in 36 States, 2019p
Special notation: p We use the notation p to indicate that the 2019 numbers are preliminary results based on half-year price data through June 30, 2019. Note that the half-year data likely provide a reasonable approximation for interstate ranking across states in 2019, based on results for earlier years from the prior editions of this study (see Figure TA.1).
Notes:
This study focuses on prices paid for professional services that are billed by physicians, physical therapists/occupational therapists, and chiropractors. Services billed by hospitals or ambulatory surgery centers and services billed for durable medical equipment as well as pharmaceuticals are excluded.
AZ, CO, MD, MO, NY, OK, OR: The data for each of these states are not necessarily representative because each state is missing data from a larger data source that is significant in that state. The results in AZ, CO, MD, NY, OK, and OR are unlikely to be significantly under- or overestimated, given that these states use fee schedules to regulate the payment for professional services, and it is unlikely that the prices paid for the missing data source in each state were materially different from other data sources included in this study from the same state. For MO, to the extent that prices paid may differ for the missing data source compared with other data sources in the state, this may lead to possible under- or overestimations in the results.
IA, IN, MO, NH, NJ, WI: These states had no workers' compensation fee schedule in 2018 or 2019.
AZ, CT, MN, TN: These states had fee schedule changes or updates within 2019 but after June 30, 2019, that are not reflected in the results.
0
50
100
150
200
250
300
FL SC CA
OK
NY MI
AR
MA
TN MD
NC
PA KS LA CO DE
NE
AL
TX MS
KY GA
MN
NM AZ CT
VA
OR IL NV IA NJ
MO IN NH WI
36-S
tate
Med
ian
= 1
00
States with Fee Schedules States without Fee Schedules
0
50
100
150
200
250
300
FL SC NY
CA
OK MI
AR
MA
TN MD
NC
PA KS DE
LA CO NE
AL
TX MS
KY GA
NM
MN CT
AZ
VA IL NV
OR IA NJ
MO IN NH WI
36-S
tate
Med
ian
= 1
00
States with Fee Schedules States without Fee Schedules
copyright © 2020 workers compensation research institute27
_____________________________________________________________________________________________W C R I M E D I C A L P R I C E I N D E X F O R W O R K E R S ' C O M P E N S A T I O N , 1 2 T H E D I T I O N ( M P I - W C )

Fee Regulation Type StateMedical Price
Index36-State Ranking
(1 = highest)
FL 73 36
SC 78 35
NY 79 34
CA 81 33
OK 84 32
MI 86 31
AR 87 30
MA 89 29
TN 92 28
MD 92 27
NC 92 26
PA 93 25
KS 95 24
DE 97 23
LA 97 22
CO 97 21
NE 99 20
AL 100 19
TX 100 18
MS 105 17
KY 106 16
GA 109 15
NM 112 14
MN 113 13
CT 117 12
AZ 118 11
VA 120 10
IL 132 9
NV 133 8
OR 133 7
IA 139 6
NJ 144 5
MO 149 4
IN 170 3
NH 191 2
WI 267 1
Table 1 Summary of Fee Regulation Types and Medical Price Index for Professional Services across 36 Study States, 2018
Notes: AZ, CO, MD, MO, NY, OK, OR: The data for each of these states are not necessarily representative because each state is missing data from a larger data source that is significant in that state. The results in AZ, CO, MD, NY, OK, and OR are unlikely to be significantly under- or overestimated, given that these states use fee schedules to regulate the payment for professional services, and it is unlikely that the prices paid for the missing data source in each state were materially different from other data sources included in this study from the same state. For MO, to the extent that prices paid may differ for the missing data source compared with other data sources in the state, this may lead to possible under- or overestimations in the results.
Fee schedule states
Non-fee schedule states
copyright © 2020 workers compensation research institute28
_____________________________________________________________________________________________W C R I M E D I C A L P R I C E I N D E X F O R W O R K E R S ' C O M P E N S A T I O N , 1 2 T H E D I T I O N ( M P I - W C )

Fee Regulation Type StateMedical Price
Index36-State Ranking
(1 = highest)
FL 72 36
SC 76 35
CA 80 34
OK 81 33
NY 82 32
MI 85 31
AR 87 30
MA 88 29
TN 90 28
MD 91 27
NC 92 26
PA 92 25
KS 95 24
LA 96 23
CO 96 22
DE 97 21
NE 98 20
AL 99 19
TX 101 18
MS 104 17
KY 106 16
GA 107 15
MN 111 14
NM 112 13
AZ 114 12
CT 115 11
VA 119 10
OR 130 9
IL 132 8
NV 134 7
IA 137 6
NJ 146 5
MO 153 4
IN 165 3
NH 187 2
WI 265 1
Special notation: p We use the notation p to indicate that the 2019 numbers are preliminary results based on half-year price data through June 30, 2019. Note that the half-year data likely provide a reasonable approximation for interstate ranking across states in 2019, based on results for earlier years from the prior editions of this study (see Figure TA.1).
Table 2 Summary of Fee Regulation Types and Medical Price Index for
Professional Services across 36 Study States, 2019p
Notes: AZ, CO, MD, MO, NY, OK, OR: The data for each of these states are not necessarily representative because each state is missing data from a larger data source that is significant in that state. The results in AZ, CO, MD, NY, OK, and OR are unlikely to be significantly under- or overestimated, given that these states use fee schedules to regulate the payment for professional services, and it is unlikely that the prices paid for the missing data source in each state were materially different from other data sources included in this study from the same state. For MO, to the extent that prices paid may differ for the missing data source compared with other data sources in the state, this may lead to possible under- or overestimations in the results.
Non-fee schedule states
Fee schedule states
copyright © 2020 workers compensation research institute29
_____________________________________________________________________________________________W C R I M E D I C A L P R I C E I N D E X F O R W O R K E R S ' C O M P E N S A T I O N , 1 2 T H E D I T I O N ( M P I - W C )

Professional Component
Technical Component
Professional Component
Technical Component
Alabama 80 29 1 312 249 323 151 0 62 32 250
Alaska 179 122 122 444 432 444 444 122 122 358 358
Arizona 101 84 82 132 256 132 137 83 84 132 150
Arkansas 51 29 33 105 123 105 124 35 32 114 121
Californiaa 27 27 27 27 27 27 27 27 27 27 27
Colorado 50 51 50 157 103 99 87 97 22 95 98
Connecticut 71 55 54 101 108 110 96 90 25 161 247
Delawarea 41 80 -4 25 172 57 58 69 23 145 153
District of Columb 13 13 13 13 11 13 13 13 13 13 13
Floridaa 19 9 8 10 143 10 3 7 11 37 41
Georgia 83 50 52 149 168 149 146 71 52 68 224
Hawaii 30 95 37 72 23 54 16 22 22 19 33
Idaho 108 104 108 157 173 157 174 110 44 174 302
Illinoisa 98 145 8 251 513 277 179 124 45 212 303
Kansas 60 61 62 62 77 63 59 72 36 116 129
Kentucky 98 128 62 102 435 142 127 79 74 143 154
Louisianab 50 60 4 83 285 109 91 12 43 40 105
Maine 73 72 72 71 74 71 75 73 71 73 80
Maryland 33 28 28 28 29 28 29 28 28 49 68
Massachusetts 1 -9 -17 -4 185 -8 18 -36 -31 11 109
Michigan 34 34 33 33 39 33 28 34 34 32 34
Minnesota 78 94 92 94 102 95 82 90 59 93 94
Mississippi 79 36 37 88 109 88 131 77 65 197 217
Montana 73 69 71 72 82 72 66 74 75 71 66
Nebraska 72 84 45 150 152 155 150 57 39 109 204
Nevada 159 158 40 492 936 358 224 62 86 152 414
New Mexico 87 91 56 399 243 176 85 75 66 110 139
New Yorka 16 71 -24 109 226 181 70 -10 -12 -4 107
North Carolina 54 69 40 95 95 95 95 53 43 62 95
North Dakota 108 112 108 109 99 109 106 106 107 108 115
Ohio 51 41 40 41 46 41 34 41 42 62 118
Oklahoma 41 43 40 103 305 74 46 -1 3 51 90
Oregon 95 98 95 110 258 110 98 87 67 160 135
Pennsylvaniaa 58 44 10 142 416 137 90 16 39 39 119
Rhode Islandd 96 27 29 192 179 177 123 34 n/c 204 215
South Carolina 38 39 38 39 44 39 44 39 39 37 35
South Dakota 42 88 1 163 357 103 44 7 14 7 126
Tennesseec 47 89 51 89 89 89 89 51 23 89 89
Texasa 69 64 64 64 61 64 64 64 64 64 106
Utah 56 44 58 63 80 63 65 51 44 86 82
Vermontb 41 39 -1 164 n/a 146 n/a 7 33 109 91
Virginiaa 104 336 59 185 386 234 223 160 60 210 195
Washington 78 79 78 79 85 78 70 79 78 76 79
West Virginia 35 35 35 35 32 34 34 35 35 35 35
Wyoming 49 89 3 197 425 130 64 13 9 22 157
Table 3a Workers' Compensation Premium over Medicare, February 2019
d Rhode Island has different billing codes for physical medicine and does not establish rates for the majority of the codes. An overall rate is not established for Rhode Island as physical medicine is the largest component of the marketbasket and excluding it significantly biases the results. For more details, see the technical appendix in Fomenko and Liu (2019).
State OverallEmergency
Services
Evaluation and
Management
Major Radiology
Key: n/c: not comparable; RVU: relative value unit.
Source: Fomenko and Liu. 2019. Designing Workers’ Compensation Medical Fee Schedules, 2019.
Pain Management
Injections
Major Surgery
Note: Positive numbers in this table, from Fomenko and Liu (2019), reflect a percentage above the Medicare fee schedule levels for a state and negative numbers in this table reflect a percentage below the Medicare fee schedule levels for a state. The 30 fee schedule states that are included in this MPI-WC report are in bold typeface.
a California, Delaware, Florida, Illinois, New York, Pennsylvania, Texas, and Virginia have distinct fee schedules for different parts of the state. For each, a single statewide rate was created by averaging the different sub-state fee schedules using the percentage of employed persons in each sub-state region as weights. Medicare establishes distinct sub-state fee schedules in 14 states. For each, a single statewide rate was created using the same procedure.
b In Louisiana and Vermont, 87 and 86 percent of payments for pain management injections, respectively, were paid for services without established workers’ compensation fee schedule rates, allowing by report reimbursement. Hence, these services were excluded from the computation of the workers' compensation premiums over Medicare for these two states. Refer to Table 9 and Table 10 in Fomenko and Liu (2019) for the full list of by report codes that were excluded for Louisiana and Vermont, respectively.
c The workers' compensation premium over Medicare in Tennessee was computed using the general surgery multiplier of 200 percent for all surgical codes in the marketbasket. Tennessee mandates additional reimbursement for orthopedic and neurosurgeons, which is reflected in a larger multiplier of 275 percent. Refer to the technical appendix in Fomenko and Liu (2019) for the sensitivity of the Tennessee findings to the choice of multiplier for surgery.
Minor Radiology Neurological/ Neuromuscular
Testing
Physical Medicine
copyright © 2020 workers compensation research institute30
_____________________________________________________________________________________________W C R I M E D I C A L P R I C E I N D E X F O R W O R K E R S ' C O M P E N S A T I O N , 1 2 T H E D I T I O N ( M P I - W C )

Alabama 71 28 0 302 310 2 59 43 256
Alaska 189 123 123 618 618 123 124 473 473
Arizona 79 122 54 148 115 63 62 95 186
Arkansas 49 31 35 107 107 37 34 117 121
California 21 19 19 33 33 18 19 35 35
Colorado 38 35 34 157 163 86 16 87 88
Connecticut 73 57 56 101 118 92 26 164 261
Delawarea 47 123 6 35 59 102 32 107 181
District of Columbia 13 13 13 13 13 13 14 14 14
Floridaa -2 2 -10 5 1 -30 -8 50 37
Georgia 76 50 51 145 152 69 50 68 220
Hawaii 23 50 21 31 57 23 21 19 30
Idaho 108 106 110 159 160 111 46 178 310
Illinoisa 74 134 3 232 256 118 39 177 296
Kansas 58 56 60 64 67 69 37 95 127
Kentucky 64 60 49 40 55 43 63 81 112
Louisianab 42 62 5 90 111 13 44 44 110
Maine 75 73 74 72 72 74 73 77 81
Maryland 29 23 24 23 23 24 24 35 63
Massachusetts -2 -4 -13 -1 -5 -34 -30 17 133
Michigan 34 33 34 35 39 32 34 18 36
Minnesota 67 84 89 83 84 83 43 92 89
Mississippi 83 32 20 89 93 173 86 192 209
Montana 71 69 70 69 74 72 72 70 68
Nebraska 62 78 40 142 145 51 36 104 190
Nevada 112 139 29 441 320 50 77 122 385
New Mexico 73 95 44 407 161 61 57 85 143
New Yorka 8 73 -23 109 176 -7 -11 2 115
North Carolina 52 69 40 95 95 53 44 62 95
North Dakota 91 93 91 91 91 89 90 90 96
Ohio 53 42 42 41 49 42 42 46 120
Oklahoma 35 45 45 106 74 4 6 58 103
Oregon 88 97 94 108 114 81 67 158 133
Pennsylvaniaa 37 37 5 128 124 13 31 43 117
Rhode Islandc n/c 21 24 89 93 30 n/c 199 200
South Carolina 40 40 40 39 42 40 41 42 39
South Dakota 27 86 0 158 100 -5 12 2 131
Tennessee 46 90 52 90 90 52 25 90 90
Texasa 65 59 59 59 59 60 60 60 100
Utah 50 40 44 64 68 47 45 80 76
Vermontb 38 41 1 165 148 11 37 111 103
Washington 67 67 67 67 69 68 68 49 67
West Virginia 35 35 35 35 35 35 36 35 35
Wyoming 34 88 4 195 129 16 10 22 160
a Delaware, Florida, Illinois, New York, Pennsylvania, and Texas have distinct fee schedules for different parts of the state. For each of these states, a single statewide rate was created by averaging the different sub-state fee schedules using the percentage of employed persons in each sub-state region as weights. Medicare establishes distinct sub-state fee schedules in 14 states. For each, a single statewide rate was created using the same procedure.
c Rhode Island has different billing codes for physical medicine and does not establish rates for the majority of the codes. An overall rate is not established for
Rhode Island as physical medicine is the largest component of the marketbasket and excluding it significantly biases the results. For more details, see the technical appendix in Fomenko and Liu (2016).
b In Louisiana and Vermont, 86 and 82 percent of payments for pain management injections, respectively, were paid for services without established workers’ compensation fee schedule rates, allowing by report reimbursement. Hence, these services were excluded from the computation of the workers' compensation premiums over Medicare for these two states.
Key: n/c: not comparable.
Source: Fomenko and Liu. 2016. Designing Workers’ Compensation Medical Fee Schedules, 2016.
Notes: Positive numbers in this table, from Fomenko and Liu (2016), reflect a percentage above the Medicare fee schedule levels for a state, and negative numbers in this table reflect a percentage below the Medicare fee schedule levels for a state. The 29 fee schedule states that are included in this MPI-WC report are in bold typeface.
Table 3b Workers' Compensation Premium over Medicare, March 2016
State OverallEmergency
ServicesEvaluation and Management
Major Radiology
Minor Radiology
Neurological/ Neuromuscular
Testing
Physical Medicine
Pain Management
Injections
Major Surgery
copyright © 2020 workers compensation research institute31
_____________________________________________________________________________________________W C R I M E D I C A L P R I C E I N D E X F O R W O R K E R S ' C O M P E N S A T I O N , 1 2 T H E D I T I O N ( M P I - W C )

Alabama 1 5 4 1 0 6 4 -6 -2
Alaska -7 4 2 -25 -26 8 1 -18 -19
Arizona 7 -14 20 -8 4 19 13 19 -13
Arkansas 0 4 2 -2 -3 8 0 1 2
Californiaa 6 12 10 -5 -7 17 9 -4 -6
Colorado 8 17 15 -1 -26 15 7 6 6
Connecticut -2 4 1 -1 -7 7 0 0 -3
Delawareb -8 -16 -8 -9 -4 -8 -6 20 -10
District of Columbia 0 4 3 -1 -3 9 1 0 0
Floridab 17 13 23 3 6 64 22 -8 4
Georgia 2 6 4 1 -3 10 3 3 3
Hawaii 7 36 16 29 -5 7 2 1 3
Idaho 0 4 2 -2 -3 8 1 1 -1
Illinoisb 4 9 7 4 3 11 6 13 1
Kansas 2 8 5 -2 -5 11 2 13 2
Kentucky 13 50 12 44 52 37 9 38 21
Louisianac -1 3 1 -5 -4 8 1 -3 -2
Maine 0 4 2 -2 -3 8 1 0 1
Maryland 5 9 7 3 1 12 5 12 5
Massachusetts -2 4 1 -1 -3 6 1 -1 -5
Michigan 1 6 2 -1 -6 10 2 15 1
Minnesota 5 11 4 5 3 12 7 -8 4
Mississippi -3 6 17 -3 -6 -30 -10 3 1
Montana 4 7 5 2 -2 11 4 4 3
Nebraska 4 8 6 2 1 13 4 4 6
Nevada 5 12 10 7 5 14 4 13 4
New Mexico 6 4 12 -2 3 18 8 16 0
New Yorkb -2 3 1 -1 -1 5 1 -4 -4
North Carolina 1 4 3 -1 -3 8 1 2 0
North Dakota 10 15 12 8 6 19 11 11 10
Ohio 0 4 2 -1 -8 7 1 13 0
Oklahoma -1 4 1 -1 -2 5 1 -1 -4
Oregon 2 6 4 1 -4 12 2 3 3
Pennsylvaniab 6 10 8 5 3 12 7 -1 2
Rhode Islandd n/c 12 8 55 41 n/c 0 4 8
South Carolina -1 3 1 -2 -5 7 0 -2 -4
South Dakota 2 6 4 1 -1 22 3 7 -1
Tennessee 0 4 2 -1 -3 8 1 1 0
Texasb 4 8 6 2 1 12 5 5 4
Utah 4 8 13 -1 -5 9 1 5 5
Vermontc -2 3 1 -1 -1 3 0 -1 -6
Virginiae n/a n/a n/a n/a n/a n/a n/a n/a n/a
Washington 9 15 11 8 4 16 8 22 12
West Virginia 2 6 4 0 -2 10 2 3 2
Wyoming -2 3 1 -2 -4 5 0 1 -4
Table 4 Percentage Change in Aggregate Workers' Compensation Fee Schedule Rates from March 2016 to February 2019
State OverallEmergency
ServicesEvaluation and Management
Major Radiology,
Professional Component
Minor Radiology,
Professional Component
Neurological/Neuromuscular
Testing
Physical Medicine
Pain Management
Injections
d Rhode Island has different billing codes for physical medicine and does not establish rates for the majority of the codes. An overall rate is not established for Rhode Island as physical medicine is the largest component of the marketbasket and excluding it significantly biases the results. For more details, see the technical appendix in the source study.
Source: Fomenko and Liu. 2019. Designing Workers’ Compensation Medical Fee Schedules, 2019.
Major Surgery
Key: n/a: not available; n/c: not comparable.
Notes: Positive numbers in this table, from Fomenko and Liu (2019), reflect a percentage above the aggregate workers' compensation fee schedule levels in 2019 as compared with 2016 for each state and service group, while negative numbers in this table reflect a percentage below the state workers' compensation fee schedule levels in 2019 versus 2016. The 29 fee schedule states that are included in this MPI-WC report are in bold typeface.
a California has distinct fee schedules for 32 parts of the state as of February 2019, but only one fee schedule as of March 2016. For California as of February 2019, a single statewide rate was created by averaging the different sub-state fee schedules using the percentage of employed persons in each sub-state region as weights.
b Delaware, Florida, Illinois, New York, Pennsylvania, and Texas have distinct fee schedules for different parts of the state for both March 2016 and February 2019. For each, a single statewide rate was created by averaging the different sub-state fee schedules using the percentage of employed persons in each sub-state region as weights.
c In Louisiana and Vermont, 87 and 86 percent of payments for pain management injections, respectively, were paid for services without established workers’ compensation fee schedule rates, allowing by report reimbursement. Hence, these services were excluded from computation of the workers' compensation premiums over Medicare for these two states.
e Virginia did not have a workers' compensation fee schedule until January 1, 2018. Therefore, the comparison of fee schedule rates between March 2016 and February 2019 is not available.
copyright © 2020 workers compensation research institute32
_____________________________________________________________________________________________W C R I M E D I C A L P R I C E I N D E X F O R W O R K E R S ' C O M P E N S A T I O N , 1 2 T H E D I T I O N ( M P I - W C )

IL SC NE MI TN MS CT AR OK NY LA MN FL PA VA KS CO CA MA NJ OR IA GA MD TX NC AZ KY IN MO WI
Growth rate in prices paid for professional services -12 -2 -1 1 2 4 4 4 6 7 8 10 11 14 17 17 18 18 18 19 20 20 24 25 27 29 31 32 34 44 48
Figure 3 Comparison of Cumulative Growth Rate in Prices Paid for Professional Services across 31 Study States, 2008 to 2019p
Special notation: p We use the notation p to indicate that the 2019 numbers are preliminary results based on half-year price data through June 30, 2019.
Notes:
AL, DE, NV, NH, and NM are excluded from the trend analysis because of insufficient sample sizes in earlier years.
AZ, CO, MD, MO, NY, OK, OR: The data for each of these states are not necessarily representative because each state is missing data from a larger data source that is significant in that state. The results in AZ, CO, MD, NY, OK, and OR are unlikely to be significantly under- or overestimated, given that these states use fee schedules to regulate the payment for professional services, and it is unlikely that the prices paid for the missing data source in each state were materially different from other data sources included in this study from the same state. For MO, to the extent that prices paid may differ for the missing data source compared with other data sources in the state, this may lead to possible under- or overestimations in the results.
-20%
-10%
0%
10%
20%
30%
40%
50%
IL SC NE MI TN MS CT AR OK NY LA MN FL PA VA KS CO CA MA NJ OR IA GA MD TX NC AZ KY IN MO WI
Cu
mu
lati
ve G
row
th R
ate,
20
08
to 2
01
9
copyright © 2020 workers compensation research institute33
_____________________________________________________________________________________________W C R I M E D I C A L P R I C E I N D E X F O R W O R K E R S ' C O M P E N S A T I O N , 1 2 T H E D I T I O N ( M P I - W C )

SC NE MI TN MS CT AR OK NY LA MN FL PA KS NJ OR IA GA MD IN MO WI
-2 -1 1 2 4 4 4 6 7 8 10 11 14 17 19 20 20 24 25 34 44 48
MD, MO, NY, OK, OR: The data for each of these states are not necessarily representative because each state is missing data from a larger data source that is significant in that state. The results in MD, NY, OK, and OR are unlikely to be significantly under- or overestimated, given that these states use fee schedules to regulate the payment for professional services, and it is unlikely that the prices paid for the missing data source in each state were materially different from other data sources included in this study from the same state. For MO, to the extent that prices paid may differ for the missing data source compared with other data sources in the state, this may lead to possible under- or overestimations in the results.
Figure 4 Comparison of Cumulative Growth Rate in Prices Paid for Professional Services across 22 Study States, 2008 to 2019p
Growth rate in prices paid for professional services
Special notation: p We use the notation p to indicate that the 2019 numbers are preliminary results based on half-year price data through June 30, 2019.
Notes:
This comparison reflects the cumulative growth rate in prices paid across 22 study states with no substantial changes in their professional fee schedules from 2008 through 2019. The nine states with substantial fee schedule changes are AZ, CA, CO, IL, KY, MA, NC, TX, and VA. Please see the discussion in the section "Discussion of Substantial Price Changes" for each of these states. AL, DE, NH, NM, and NV are excluded from the trend analysis because of insufficient sample sizes in earlier years.
-5%
0%
5%
10%
15%
20%
25%
30%
35%
40%
45%
50%
SC NE MI TN MS CT AR OK NY LA MN FL PA KS NJ OR IA GA MD IN MO WI
Cu
mu
lati
ve G
row
th R
ate,
20
08
to
20
19
States with Fee Schedules States without Fee Schedules
copyright © 2020 workers compensation research institute34
_____________________________________________________________________________________________W C R I M E D I C A L P R I C E I N D E X F O R W O R K E R S ' C O M P E N S A T I O N , 1 2 T H E D I T I O N ( M P I - W C )

Fee Regulation Type StateCumulative
Growth Rate
Growth in Network Participation Rate (% of payments)
Growth in Network Participation Rate (% point change)
SC -2% 2% 2
NE -1% 46% 25
MI 1% 5% 4
TN 2% 7% 6
MS 4% 68% 27
CT 4% 0% 0
AR 4% 16% 12
OK 6% 7% 6
NY 7% 30% 10
LA 8% -7% -4
MN 10% 27% 13
FL 11% 5% 4
PA 14% 29% 17
KS 17% 18% 13
OR 20% n/a n/a
GA 24% 2% 2
MD 25% -7% -5
NJ 19% 22% 16
IA 20% 19% 13
IN 34% 25% 18
MO 44% 15% 12
WI 48% 15% 10
This comparison reflects the cumulative growth rate in prices paid across 22 study states with no substantial changes in their professional fee schedules from 2008 through 2019. The nine states with substantial fee schedule changes are AZ, CA, CO, IL, KY, MA, NC, TX, and VA. Please see the discussion in the section "Discussion of Substantial Price Changes" for each of these states. AL, DE, NH, NM, and NV are excluded from the trend analysis because of insufficient sample sizes in earlier years.
MD, MO, NY, OK, OR: The data for each of these states are not necessarily representative because each state is missing data from a larger data source that is significant in that state. The results in MD, NY, OK, and OR are unlikely to be significantly under- or overestimated, given that these states use fee schedules to regulate the payment for professional services, and it is unlikely that the prices paid for the missing data source in each state were materially different from other data sources included in this study from the same state. For MO, to the extent that prices paid may differ for the missing data source compared with other data sources in the state, this may lead to possible under- or overestimations in the results.
The network participation rate is measured as the percentage of payments for professional services rendered within networks; identification of network care is based on information provided by the data sources.
Key: n/a: not applicable.
Table 5 Summary of Cumulative Growth Rate in Prices Paid and Network Use for
Professional Services across 22 Study States, by Fee Regulation Type, 2008 to 2019p
Fee schedule states
Non-fee schedule states
Special notation: p We use the notation p to indicate that the 2019 numbers are preliminary results based on half-year price data through June 30, 2019.
Notes:
copyright © 2020 workers compensation research institute35
_____________________________________________________________________________________________W C R I M E D I C A L P R I C E I N D E X F O R W O R K E R S ' C O M P E N S A T I O N , 1 2 T H E D I T I O N ( M P I - W C )

State 2008 2009 2010 2011 2012 2013 2014 2015 2016 2017 2018 2019p
Alabama n/a n/a n/a n/a n/a 85% 86% 85% 87% 87% 88% 87%
Arizona 81% 84% 86% 85% 78% 80% 85% 83% 84% 84% 87% 88%
Arkansas 78% 75% 76% 75% 78% 81% 81% 85% 85% 87% 88% 90%
California 81% 80% 81% 81% 81% 85% 89% 90% 92% 93% 94% 94%
Colorado 80% 85% 85% 84% 80% 81% 87% 89% 91% 88% 90% 92%
Connecticut 85% 85% 84% 85% 84% 84% 89% 90% 94% 95% 93% 84%
Delaware n/a n/a n/a n/a n/a 24% 27% 32% 30% 34% 34% 37%
Florida 83% 82% 84% 83% 82% 84% 85% 88% 89% 90% 90% 87%
Georgia 87% 90% 90% 87% 86% 88% 89% 90% 89% 89% 90% 89%
Illinois 46% 49% 50% 52% 56% 62% 70% 71% 74% 76% 76% 76%
Indiana 70% 70% 69% 73% 73% 77% 78% 81% 84% 85% 86% 88%
Iowa 69% 69% 70% 73% 74% 75% 78% 81% 83% 84% 81% 83%
Kansas 74% 79% 74% 80% 82% 81% 81% 80% 84% 80% 85% 88%
Kentucky 67% 77% 82% 82% 81% 82% 83% 85% 89% 88% 86% 89%
Louisiana 50% 47% 44% 42% 36% 42% 51% 52% 52% 48% 47% 47%
Maryland 65% 61% 59% 60% 63% 62% 59% 60% 62% 63% 62% 60%
Massachusetts 37% 32% 31% 35% 41% 39% 41% 43% 48% 47% 43% 43%
Michigan 71% 70% 67% 68% 70% 70% 68% 73% 75% 73% 76% 74%
Minnesota 46% 44% 43% 43% 46% 53% 63% 54% 55% 55% 61% 59%
Mississippi 40% 40% 38% 47% 46% 48% 55% 61% 66% 64% 64% 67%
Missouri 80% 81% 78% 82% 81% 86% 87% 87% 87% 88% 89% 92%
Nebraska 55% 62% 69% 67% 68% 71% 76% 76% 82% 82% 78% 80%
Nevada n/a n/a n/a n/a n/a 95% 96% 97% 97% 95% 96% 95%
New Hampshire n/a n/a n/a n/a n/a 73% 73% 79% 69% 64% 68% 68%
New Jersey 73% 72% 76% 78% 79% 88% 89% 92% 92% 92% 90% 88%
New Mexico n/a n/a n/a n/a n/a 75% 75% 73% 72% 77% 76% 77%
New York 35% 35% 36% 41% 41% 40% 41% 41% 43% 43% 46% 45%
North Carolina 76% 75% 75% 75% 71% 74% 78% 80% 79% 80% 80% 82%
Oklahoma 88% 92% 92% 91% 91% 91% 93% 94% 94% 94% 94% 94%
Oregon n/a n/a n/a n/a n/a n/a n/a n/a n/a n/a n/a n/a
Pennsylvania 59% 63% 62% 62% 60% 60% 66% 70% 74% 75% 75% 76%
South Carolina 84% 86% 84% 82% 82% 83% 83% 85% 85% 83% 85% 85%
Tennessee 83% 86% 81% 82% 83% 82% 82% 84% 87% 88% 87% 89%
Texas 69% 71% 74% 23% 28% 31% 36% 37% 37% 35% 35% 33%
Virginia 58% 62% 62% 61% 65% 69% 70% 71% 77% 78% 76% 71%
Wisconsin 68% 70% 73% 75% 73% 74% 74% 75% 79% 79% 78% 78%
AL, DE, NH, NM, NV: These states are excluded from earlier years in this table because of insufficient sample sizes.
Key: n/a: not applicable.
Table 6 Comparison of Network Participation Rates across States, 2008 to 2019 p
Special notation: p We use the notation p to indicate that the 2019 numbers are preliminary results based on half-year price data through June 30, 2019.
Notes:
The network participation rate is measured as the percentage of payments for professional services rendered within networks; identification of network care is based on information provided by the data sources.
AZ, CO, MD, MO, NY, OK: The data for each of these states are not necessarily representative because each state is missing data from a larger data source that is significant in that state. The results in AZ, CO, MD, NY, and OK are unlikely to be significantly under- or overestimated, given that these states use fee schedules to regulate the payment for professional services, and it is unlikely that the prices paid for the missing data source in each state were materially different from other data sources included in this study from the same state. For MO, to the extent that prices paid may differ for the missing data source compared with other data sources in the state, this may lead to possible under- or overestimations in the results.
OR: The state is excluded from this table because missing data from a larger data source that is significant in the state may potentially lead to underestimation in this measure.
copyright © 2020 workers compensation research institute36
_____________________________________________________________________________________________W C R I M E D I C A L P R I C E I N D E X F O R W O R K E R S ' C O M P E N S A T I O N , 1 2 T H E D I T I O N ( M P I - W C )

StateRelative Value
Scale UsedConversion Factors
(single or multiple)aMost Recent Update of
Fee SchedulesRelative Value Scale
EditionCPT Edition
Alabama n/a n/a May 4, 2018 n/a n/a
Alaska RBRVS Multiple January 1, 2019 2019 RBRVS 2019
Arizona RBRVS Multiple October 1, 2018 2018 RBRVS 2018
Arkansas RBRVS Multiple January 1, 2019 2019 RBRVS 2019
California RBRVS Single January 1, 2019 2019 RBRVS 2019
Colorado RBRVS Multiple January 1, 2019 2018 RBRVS 2018
Connecticut RBRVS Multiple July 15, 2018 2018 RBRVS 2018
Delaware RBRVS Multiple January 31, 2019 2019 RBRVS 2019
District of Columbia RBRVS Single January 1, 2019 2019 RBRVS 2019
Floridab RBRVS Multiple July 1, 2017 2016 RBRVS 2016
Georgia RBRVS Multiple April 1, 2018 2018 RBRVS 2018
Hawaii RBRVS/HI RVU Multiple January 1, 2019 2019 RBRVS/2018 HI RVU 2019
Idaho RBRVS Multiple January 1, 2019 2019 RBRVS 2019
Illinois n/a n/a January 1, 2019 n/a 2019
Kansasc RBRVS Multiple January 1, 2017 2016 RBRVS 2016
Kentuckyd KY RVU Single July 1, 2018 2018 KY RVU 2018
Louisiana n/a n/a June 20, 2016 n/a 2012
Maine RBRVS Single January 1, 2019 2019 RBRVS 2019
Maryland RBRVS Multiple January 1, 2019 2019 RBRVS 2019
Massachusetts n/a n/a April 1, 2009 n/a 2008 and any update
Michigan RBRVS Single January 8, 2019 2018 RBRVS 2018
Minnesota RBRVS Multiple October 1, 2018 2016 RBRVS 2018
Mississippic RBRVS Multiple January 1, 2018 2018 RBRVS 2013–2018
Montana RBRVS Single July 1, 2018 2018 RBRVS 2018
Nebraska RBRVS Multiple January 1, 2019 2019 RBRVS 2019
Nevada RVP Multiple February 1, 2019 2019 RVP 2019
New Mexico n/a n/a January 1, 2019 n/a 2018
New York NY RVU Multiple June 1, 2012 2012 NY RVU 2012
North Carolina RBRVS Multiple January 1, 2019 2019 RBRVS 2019
North Dakota RBRVS Single January 1, 2019 2019 RBRVS 2019
Ohio RBRVS Multiple January 1, 2019 2019 RBRVS 2019
Oklahoma RBRVS Multiple January 1, 2012 2011 RBRVS 2011
Oregon RBRVS Multiple January 1, 2019 2019 RBRVS 2018 and 2019
Pennsylvaniae RBRVS n/a January 1, 2019 1994 & 2018 RBRVS 2019
Rhode Island n/a n/a October 1, 2018 n/a 2018
South Carolinac RBRVS Single April 1, 2018 2018 RBRVS 2018
South Dakotaf RVP Multiple January 1, 2019 2018 RVP 2018
Tennessee RBRVS Multiple January 1, 2019 2019 RBRVS 2019
Texas RBRVS Multiple January 1, 2019 2019 RBRVS 2019
Utahc RBRVS Multiple January 1, 2019 2018 RBRVS 2018
Vermont n/a n/a January 1, 2008 n/a 2006 and any update
Virginia n/a n/a January 1, 2018 n/a 2017
Washington RBRVS Single January 1, 2019 2019 RBRVS 2019
West Virginia RBRVS Single January 1, 2019 2019 RBRVS 2019
Wyoming RVP Multiple May 23, 2018 2018 RVP 2018
Key: CPT: Current Procedural Terminology; n/a: not applicable; RBRVS: resource-based relative value scale (Medicare); RVP: Relative values for physicians; RVU: relative value unit.
Source: Fomenko and Liu. 2019. Designing Workers’ Compensation Medical Fee Schedules, 2019.
f South Dakota allows all current codes, even if they are not listed in the RVP version referenced or if no conversion factor is provided for the given code.
Table 7 Characteristics of Workers' Compensation Fee Schedules for Nonfacility Providers, February 2019
b The Florida Workers' Compensation Health Care Provider Reimbursement Manual, 2016 Edition, became effective on July 1, 2017. This 2016 edition incorporates the 2016 Medicare conversion factor and RVUs.
c Kansas, Mississippi, South Carolina, and Utah adopted the Essential RBRVS to establish their workers' compensation fee schedules. The Essential RBRVS provides relative values for all the codes valued by the Centers for Medicare & Medicaid Services, as well relative values for many gap codes without assigned values by Medicare. d Kentucky relative values are based on historic data from FAIR Health commercial database values.
e In Pennsylvania, prior to January 1, 1995, the medical fees were capped at 113 percent of Medicare. Medical fee updates on and after January 1, 1995, are calculated based on the percentage changes in the statewide average weekly wage annually. These updates are effective on January 1 of each year, and they are cumulative. For any new CPT codes representing an entirely new service, the fee schedule rate is established based upon the Medicare fee with the 113 percent adjustment.
a The column for single or multiple conversion factors does not refer to anesthesia, laboratory, or pathology services.
Notes: This table is from Fomenko and Liu (2019). The 29 fee schedule states that are included in this MPI-WC report are in bold typeface. The fee schedule database used in Fomenko and Liu (2019) was acquired from OptumInsight™
copyright © 2020 workers compensation research institute37
_____________________________________________________________________________________________W C R I M E D I C A L P R I C E I N D E X F O R W O R K E R S ' C O M P E N S A T I O N , 1 2 T H E D I T I O N ( M P I - W C )
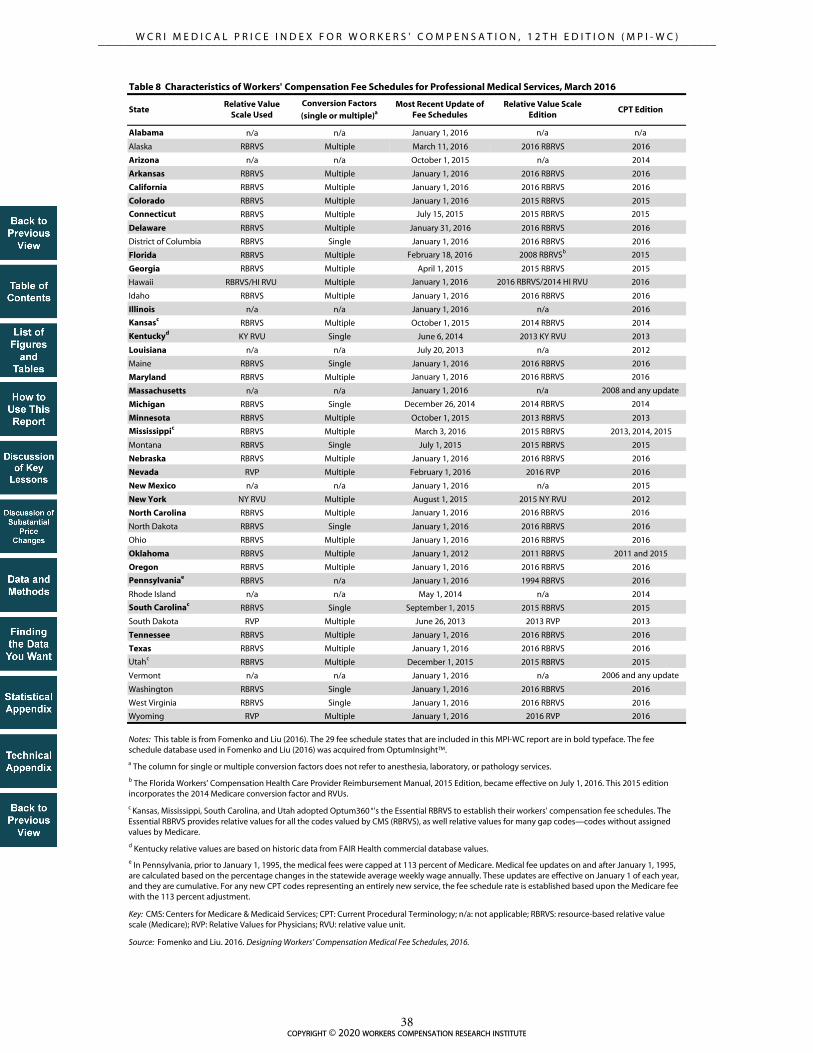
StateRelative Value
Scale UsedConversion Factors
(single or multiple)aMost Recent Update of
Fee SchedulesRelative Value Scale
EditionCPT Edition
Alabama n/a n/a January 1, 2016 n/a n/a
Alaska RBRVS Multiple March 11, 2016 2016 RBRVS 2016
Arizona n/a n/a October 1, 2015 n/a 2014
Arkansas RBRVS Multiple January 1, 2016 2016 RBRVS 2016
California RBRVS Multiple January 1, 2016 2016 RBRVS 2016
Colorado RBRVS Multiple January 1, 2016 2015 RBRVS 2015
Connecticut RBRVS Multiple July 15, 2015 2015 RBRVS 2015
Delaware RBRVS Multiple January 31, 2016 2016 RBRVS 2016
District of Columbia RBRVS Single January 1, 2016 2016 RBRVS 2016
Florida RBRVS Multiple February 18, 2016 2008 RBRVSb 2015
Georgia RBRVS Multiple April 1, 2015 2015 RBRVS 2015
Hawaii RBRVS/HI RVU Multiple January 1, 2016 2016 RBRVS/2014 HI RVU 2016
Idaho RBRVS Multiple January 1, 2016 2016 RBRVS 2016
Illinois n/a n/a January 1, 2016 n/a 2016
Kansasc RBRVS Multiple October 1, 2015 2014 RBRVS 2014
Kentuckyd KY RVU Single June 6, 2014 2013 KY RVU 2013
Louisiana n/a n/a July 20, 2013 n/a 2012
Maine RBRVS Single January 1, 2016 2016 RBRVS 2016
Maryland RBRVS Multiple January 1, 2016 2016 RBRVS 2016
Massachusetts n/a n/a January 1, 2016 n/a 2008 and any update
Michigan RBRVS Single December 26, 2014 2014 RBRVS 2014
Minnesota RBRVS Multiple October 1, 2015 2013 RBRVS 2013
Mississippic RBRVS Multiple March 3, 2016 2015 RBRVS 2013, 2014, 2015
Montana RBRVS Single July 1, 2015 2015 RBRVS 2015
Nebraska RBRVS Multiple January 1, 2016 2016 RBRVS 2016
Nevada RVP Multiple February 1, 2016 2016 RVP 2016
New Mexico n/a n/a January 1, 2016 n/a 2015
New York NY RVU Multiple August 1, 2015 2015 NY RVU 2012
North Carolina RBRVS Multiple January 1, 2016 2016 RBRVS 2016
North Dakota RBRVS Single January 1, 2016 2016 RBRVS 2016
Ohio RBRVS Multiple January 1, 2016 2016 RBRVS 2016
Oklahoma RBRVS Multiple January 1, 2012 2011 RBRVS 2011 and 2015
Oregon RBRVS Multiple January 1, 2016 2016 RBRVS 2016
Pennsylvaniae RBRVS n/a January 1, 2016 1994 RBRVS 2016
Rhode Island n/a n/a May 1, 2014 n/a 2014
South Carolinac RBRVS Single September 1, 2015 2015 RBRVS 2015
South Dakota RVP Multiple June 26, 2013 2013 RVP 2013
Tennessee RBRVS Multiple January 1, 2016 2016 RBRVS 2016
Texas RBRVS Multiple January 1, 2016 2016 RBRVS 2016
Utahc RBRVS Multiple December 1, 2015 2015 RBRVS 2015
Vermont n/a n/a January 1, 2016 n/a 2006 and any update
Washington RBRVS Single January 1, 2016 2016 RBRVS 2016
West Virginia RBRVS Single January 1, 2016 2016 RBRVS 2016
Wyoming RVP Multiple January 1, 2016 2016 RVP 2016
Source: Fomenko and Liu. 2016. Designing Workers’ Compensation Medical Fee Schedules, 2016.
Notes: This table is from Fomenko and Liu (2016). The 29 fee schedule states that are included in this MPI-WC report are in bold typeface. The fee schedule database used in Fomenko and Liu (2016) was acquired from OptumInsight™.
Key: CMS: Centers for Medicare & Medicaid Services; CPT: Current Procedural Terminology; n/a: not applicable; RBRVS: resource-based relative value scale (Medicare); RVP: Relative Values for Physicians; RVU: relative value unit.
Table 8 Characteristics of Workers' Compensation Fee Schedules for Professional Medical Services, March 2016
a The column for single or multiple conversion factors does not refer to anesthesia, laboratory, or pathology services.
b The Florida Workers’ Compensation Health Care Provider Reimbursement Manual, 2015 Edition, became effective on July 1, 2016. This 2015 edition incorporates the 2014 Medicare conversion factor and RVUs.
c Kansas, Mississippi, South Carolina, and Utah adopted Optum360 °'s the Essential RBRVS to establish their workers' compensation fee schedules. The Essential RBRVS provides relative values for all the codes valued by CMS (RBRVS), as well relative values for many gap codes—codes without assigned values by Medicare.
d Kentucky relative values are based on historic data from FAIR Health commercial database values.
e In Pennsylvania, prior to January 1, 1995, the medical fees were capped at 113 percent of Medicare. Medical fee updates on and after January 1, 1995, are calculated based on the percentage changes in the statewide average weekly wage annually. These updates are effective on January 1 of each year, and they are cumulative. For any new CPT codes representing an entirely new service, the fee schedule rate is established based upon the Medicare fee with the 113 percent adjustment.
copyright © 2020 workers compensation research institute38
_____________________________________________________________________________________________W C R I M E D I C A L P R I C E I N D E X F O R W O R K E R S ' C O M P E N S A T I O N , 1 2 T H E D I T I O N ( M P I - W C )

Professional Service Group
Year Medical Price Index% Difference
Compared with 36-State Median
36-State Ranking (1 = highest)
30-Fee-Schedule-State Ranking
(1 = highest)
2017 137 37% 6 n/a
2018 120 20% 10 4
2017 130 30% 5 n/a
2018 115 15% 11 6
2017 124 24% 7 n/a
2018 108 8% 14 8
2017 143 43% 10 n/a
2018 124 24% 12 7
2017 156 56% 7 n/a
2018 129 29% 12 6
2017 136 36% 10 n/a
2018 124 24% 11 6
2017 163 63% 6 n/a
2018 125 25% 10 4
2017 118 18% 10 n/a
2018 108 8% 11 5
2017 238 138% 4 n/a
2018 206 106% 5 1
Key: n/a: not applicable.
Pain management injections
Table 9 Interstate Ranking for Virginia on Medical Price Index for Professional Services in 2017 and 2018
Overall
Evaluation and management
Physical medicine
Major surgery
Major radiology
Minor radiology
Neurological/ neuromuscular testing
Emergency
Notes:
This ranking comparison for Virginia in 2017 and 2018 is based on 36 study states. Virginia adopted its first workers’ compensation fee schedule for medical professional services effective January 1, 2018. The interstate ranking among fee schedule states in this table is based on 30 states with fee schedules in 2018, including Virginia. In 2017, Virginia was a state with no fee schedule and therefore was not ranked among fee schedule states.
copyright © 2020 workers compensation research institute39
_____________________________________________________________________________________________W C R I M E D I C A L P R I C E I N D E X F O R W O R K E R S ' C O M P E N S A T I O N , 1 2 T H E D I T I O N ( M P I - W C )

IA, IN, MO, NJ, VA, WI: These states did not have a workers' compensation fee schedule in 2014 or 2016.
Notes:
Figure 5 Changes in Interstate Ranking for North Carolina on Medical Price Index for Overall Professional Services, 2014 and 2016
North Carolina implemented new fee schedule rates for professional services effective July 2015. The new fee schedule rates incorporate the 2015 Medicare rates with the revised service-type specific multipliers, ranging between 140 and 195 percent of Medicare. Before this change, the fee schedule rates for most types of professional services in North Carolina remained at 158 percent of the 1995 Medicare values since 1996.
This comparison for North Carolina in 2014 is based on the 31 states published in the ninth edition of this annual study; the comparison in 2016 is based on the same set of states for consistency.
AZ, CO, MD, MO, NY, OK, OR: The data for each of these states are not necessarily representative because each state is missing data from a larger data source that is significant in that state. The results in AZ, CO, MD, NY, OK, and OR are unlikely to be significantly under- or overestimated, given that these states use fee schedules to regulate the payment for professional services, and it is unlikely that the prices paid for the missing data source in each state were materially different from other data sources included in this study from the same state. For MO, to the extent that prices paid may differ for the missing data source compared with other data sources in the state, this may lead to possible under- or overestimations in the results.
80
0
50
100
150
200
250
300
FL CA NC NY SC OK MD MA PA AR MI TN KY CO KS LA NE TX GA AZ MS MN CT IL VA IA NJ MO OR IN WI
31
-Sta
te M
edia
n =
10
0
94
0
50
100
150
200
250
300
FL CA NY SC OK MI MA AR MD TN PA CO NC KS LA NE TX KY GA MS MN AZ CT IL IA VA OR NJ MO IN WI
31
-Sta
te M
edia
n =
10
0
2014
2016
copyright © 2020 workers compensation research institute40
_____________________________________________________________________________________________W C R I M E D I C A L P R I C E I N D E X F O R W O R K E R S ' C O M P E N S A T I O N , 1 2 T H E D I T I O N ( M P I - W C )

Professional Service Group
Year Medical Price Index% Difference
Compared with 31-State Median
31-State Ranking (1 = highest)
25-Fee-Schedule-State Ranking
(1 = highest)
2014 80 -20% 29 23
2016 68 -32% 19 13
2014 79 -21% 28 22
2016 101 1% 15 10
2014 71 -29% 28 22
2016 100 0% 16 10
2014 86 -14% 22 16
2016 78 -22% 24 18
2014 94 -6% 20 14
2016 78 -22% 20 14
2014 122 22% 9 4
2016 80 -20% 23 17
2014 87 -13% 21 15
2016 87 -13% 20 14
2014 84 -16% 22 16
2016 79 -21% 22 16
2014 78 -22% 28 22
2016 100 0% 15 9
Pain management injections
Table 10 Interstate Ranking for North Carolina on Medical Price Index for Professional Services in 2014 and 2016
Overall
Evaluation and management
Physical medicine
Major surgery
North Carolina implemented new fee schedule rates for professional services effective in July 2015. The new fee schedule rates incorporate the 2015 Medicare rates with the revised service-type specific multipliers, ranging between 140 and 195 percent of Medicare. Before this change, the fee schedule rates for most types of professional services in North Carolina remained at 158 percent of the 1995 Medicare values since 1996.
Major radiology
Minor radiology
Neurological/ neuromuscular testing
Emergency
This ranking comparison for North Carolina in 2014 is based on the 31 states published in the ninth edition of this annual study; the comparison in 2016 is based on the same set of states for consistency. These states comprise the 25 states that use fee schedules to regulate the payment for professional services and the 6 states with no fee schedules for the years shown.
Notes:
copyright © 2020 workers compensation research institute41
_____________________________________________________________________________________________W C R I M E D I C A L P R I C E I N D E X F O R W O R K E R S ' C O M P E N S A T I O N , 1 2 T H E D I T I O N ( M P I - W C )

Professional Service Group
Year Medical Price Index% Difference
Compared with 31-State Median
31-State Ranking (1 = highest)
25-Fee-Schedule-State Ranking
(1 = highest)
2013 87 -13% 25 19
2015 102 2% 15 9
2013 83 -17% 24 18
2015 99 -1% 17 12
2013 90 -10% 24 18
2015 115 15% 8 3
2013 83 -17% 23 17
2015 88 -12% 21 15
2013 93 -7% 19 13
2015 104 4% 15 9
2013 92 -8% 19 14
2015 103 3% 13 8
2013 77 -23% 26 20
2015 78 -22% 24 18
2013 84 -16% 24 18
2015 73 -27% 27 21
2013 76 -24% 29 23
2015 99 -1% 18 12
Effective June 6, 2014, Kentucky discontinued the use of relative values from Medicare's resource-based relative value scale (RBRVS) for its professional fee schedule and transitioned to using state-specific relative values based on historic data from FAIR Health commercial database values.
Major radiology
Minor radiology
Neurological/ neuromuscular testing
Emergency
Notes:
This ranking comparison for Kentucky in 2013 and 2015 is based on the 31 states published in the ninth edition of this annual study. These states comprise 25 states that use fee schedules to regulate the payment for professional services and 6 states with no fee schedules for the years shown.
Pain management injections
Table 11 Interstate Ranking for Kentucky on Medical Price Index for Professional Services in 2013 and 2015
Overall
Evaluation and management
Physical medicine
Major surgery
copyright © 2020 workers compensation research institute42
_____________________________________________________________________________________________W C R I M E D I C A L P R I C E I N D E X F O R W O R K E R S ' C O M P E N S A T I O N , 1 2 T H E D I T I O N ( M P I - W C )
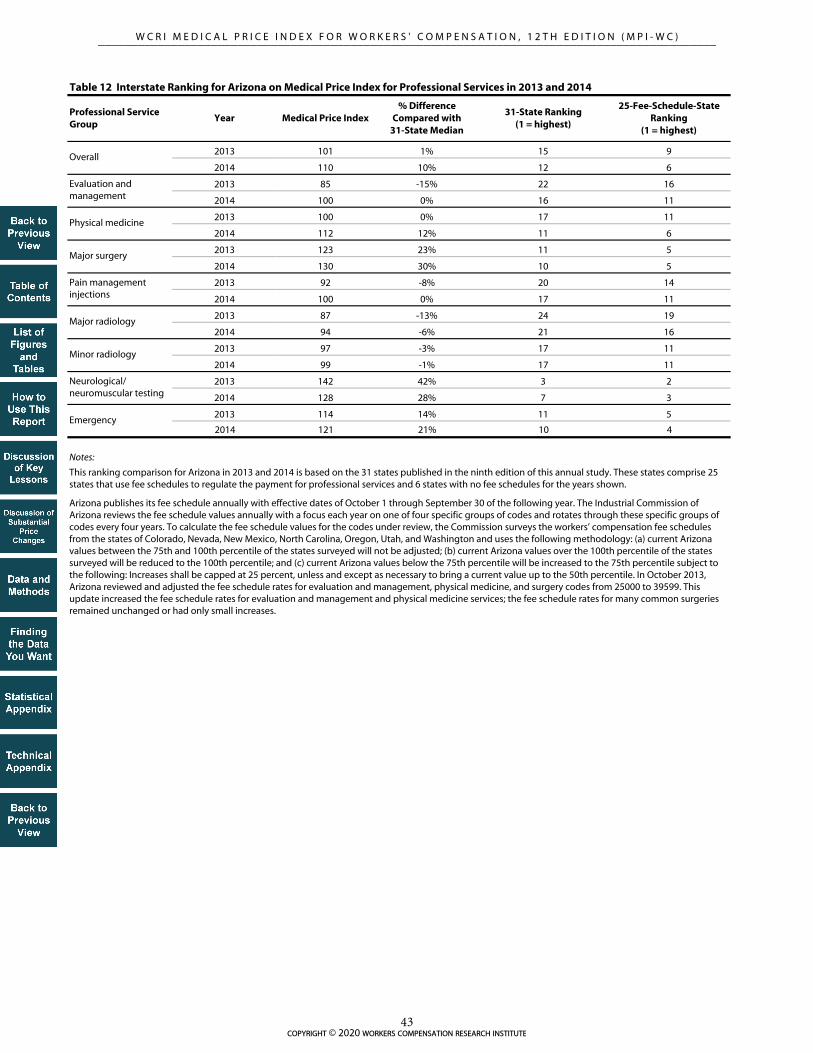
Professional Service Group
Year Medical Price Index% Difference
Compared with 31-State Median
31-State Ranking (1 = highest)
25-Fee-Schedule-State Ranking
(1 = highest)
2013 101 1% 15 9
2014 110 10% 12 6
2013 85 -15% 22 16
2014 100 0% 16 11
2013 100 0% 17 11
2014 112 12% 11 6
2013 123 23% 11 5
2014 130 30% 10 5
2013 92 -8% 20 14
2014 100 0% 17 11
2013 87 -13% 24 19
2014 94 -6% 21 16
2013 97 -3% 17 11
2014 99 -1% 17 11
2013 142 42% 3 2
2014 128 28% 7 3
2013 114 14% 11 5
2014 121 21% 10 4
Table 12 Interstate Ranking for Arizona on Medical Price Index for Professional Services in 2013 and 2014
Major radiology
Minor radiology
Neurological/ neuromuscular testing
Emergency
Arizona publishes its fee schedule annually with effective dates of October 1 through September 30 of the following year. The Industrial Commission of Arizona reviews the fee schedule values annually with a focus each year on one of four specific groups of codes and rotates through these specific groups of codes every four years. To calculate the fee schedule values for the codes under review, the Commission surveys the workers’ compensation fee schedules from the states of Colorado, Nevada, New Mexico, North Carolina, Oregon, Utah, and Washington and uses the following methodology: (a) current Arizona values between the 75th and 100th percentile of the states surveyed will not be adjusted; (b) current Arizona values over the 100th percentile of the states surveyed will be reduced to the 100th percentile; and (c) current Arizona values below the 75th percentile will be increased to the 75th percentile subject to the following: Increases shall be capped at 25 percent, unless and except as necessary to bring a current value up to the 50th percentile. In October 2013, Arizona reviewed and adjusted the fee schedule rates for evaluation and management, physical medicine, and surgery codes from 25000 to 39599. This update increased the fee schedule rates for evaluation and management and physical medicine services; the fee schedule rates for many common surgeries remained unchanged or had only small increases.
Overall
Evaluation and management
Physical medicine
Major surgery
Pain management injections
Notes:
This ranking comparison for Arizona in 2013 and 2014 is based on the 31 states published in the ninth edition of this annual study. These states comprise 25 states that use fee schedules to regulate the payment for professional services and 6 states with no fee schedules for the years shown.
copyright © 2020 workers compensation research institute43
_____________________________________________________________________________________________W C R I M E D I C A L P R I C E I N D E X F O R W O R K E R S ' C O M P E N S A T I O N , 1 2 T H E D I T I O N ( M P I - W C )

Professional Service Group
Year Medical Price Index% Difference
Compared with 31-State Median
31-State Ranking (1 = highest)
25-Fee-Schedule-State Ranking
(1 = highest)
2010 189 89% 2 1
2012 128 28% 6 2
2010 114 14% 6 4
2012 80 -20% 25 19
2010 167 67% 3 2
2012 118 18% 6 3
2010 263 163% 1 1
2012 182 82% 4 1
2010 222 122% 3 1
2012 163 63% 5 1
2010 166 66% 2 1
2012 128 28% 5 2
2010 214 114% 2 1
2012 151 51% 5 1
2010 200 100% 2 1
2012 118 18% 8 3
2010 190 90% 4 1
2012 145 45% 7 1
Illinois passed legislation introducing a 30 percent reduction in the fee schedule rates effective in September 2011. On January 1, 2012, Illinois discontinued its use of 29 geozip areas for physicians and other providers in favor of four county-based regions.
Table 13 Interstate Ranking for Illinois on Medical Price Index for Professional Services in 2010 and 2012
Major radiology
Minor radiology
Neurological/ neuromuscular testing
Emergency
Notes:
This ranking comparison for Illinois in 2010 and 2012 is based on the 31 states published in the ninth edition of this annual study. These states comprise 25 states that use fee schedules to regulate the payment for professional services and 6 states with no fee schedules for the years shown.
Overall
Evaluation and management
Physical medicine
Major surgery
Pain management injections
copyright © 2020 workers compensation research institute44
_____________________________________________________________________________________________W C R I M E D I C A L P R I C E I N D E X F O R W O R K E R S ' C O M P E N S A T I O N , 1 2 T H E D I T I O N ( M P I - W C )

Professional Service Group
Year Medical Price Index% Difference
Compared with 31-State Median
31-State Ranking (1 = highest)
25-Fee-Schedule-State Ranking
(1 = highest)
2010 93 -7% 19 13
2011 100 0% 15 9
2010 106 6% 11 6
2011 119 19% 5 4
2010 107 7% 12 7
2011 122 22% 6 3
2010 67 -33% 27 21
2011 81 -19% 24 18
2010 71 -29% 27 21
2011 83 -17% 24 18
2010 80 -20% 28 22
2011 78 -22% 29 23
2010 75 -25% 26 20
2011 78 -22% 24 18
2010 93 -7% 21 15
2011 101 1% 15 9
2010 98 -2% 17 11
2011 100 0% 17 11
In March 2008, Texas increased fee schedule rates for professional services, especially for surgeries, and allowed annual increases based on changes in the Medicare Economic Index. In 2011, the fee schedule rates in Texas increased for most professional services following the Medicare updates.
Table 14 Interstate Ranking for Texas on Medical Price Index for Professional Services in 2010 and 2011
Major radiology
Minor radiology
Neurological/ neuromuscular testing
Emergency
Notes:
This ranking comparison for Texas in 2010 and 2011 is based on the 31 states published in the ninth edition of this annual study. These states comprise 25 states that use fee schedules to regulate the payment for professional services and 6 states with no fee schedules for the years shown.
Overall
Evaluation and management
Physical medicine
Major surgery
Pain management injections
copyright © 2020 workers compensation research institute45
_____________________________________________________________________________________________W C R I M E D I C A L P R I C E I N D E X F O R W O R K E R S ' C O M P E N S A T I O N , 1 2 T H E D I T I O N ( M P I - W C )
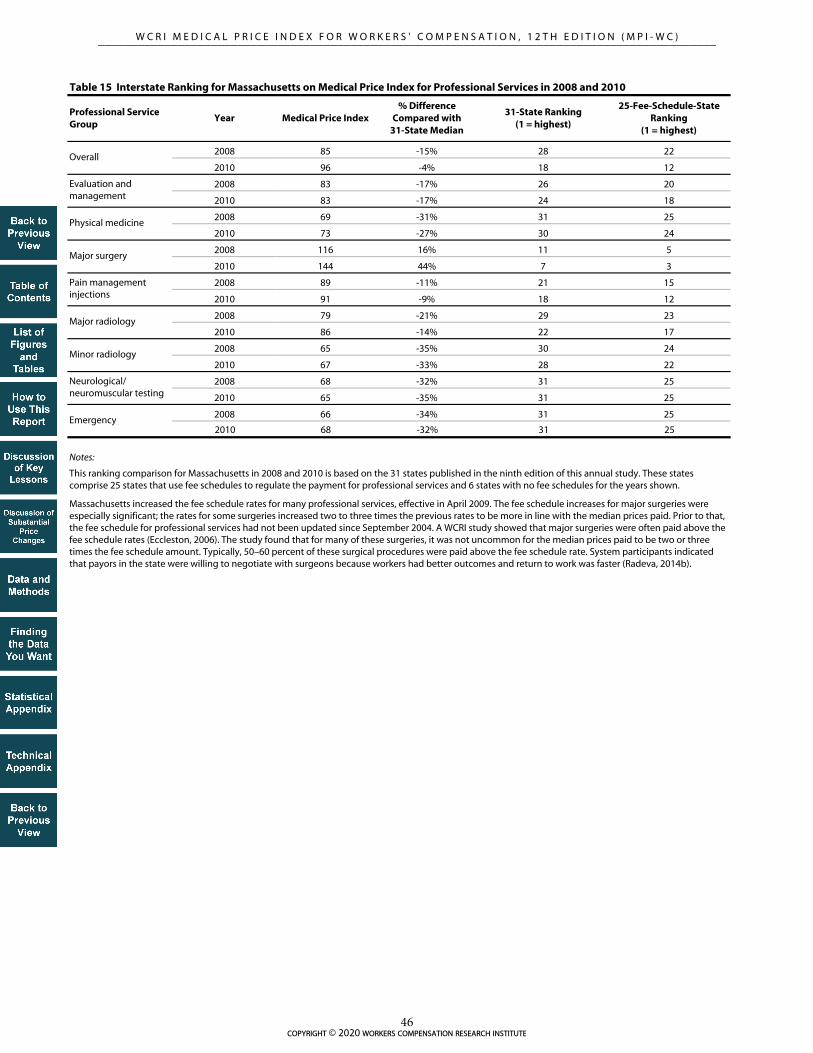
Professional Service Group
Year Medical Price Index% Difference
Compared with 31-State Median
31-State Ranking (1 = highest)
25-Fee-Schedule-State Ranking
(1 = highest)
2008 85 -15% 28 22
2010 96 -4% 18 12
2008 83 -17% 26 20
2010 83 -17% 24 18
2008 69 -31% 31 25
2010 73 -27% 30 24
2008 116 16% 11 5
2010 144 44% 7 3
2008 89 -11% 21 15
2010 91 -9% 18 12
2008 79 -21% 29 23
2010 86 -14% 22 17
2008 65 -35% 30 24
2010 67 -33% 28 22
2008 68 -32% 31 25
2010 65 -35% 31 25
2008 66 -34% 31 25
2010 68 -32% 31 25
Massachusetts increased the fee schedule rates for many professional services, effective in April 2009. The fee schedule increases for major surgeries were especially significant; the rates for some surgeries increased two to three times the previous rates to be more in line with the median prices paid. Prior to that, the fee schedule for professional services had not been updated since September 2004. A WCRI study showed that major surgeries were often paid above the fee schedule rates (Eccleston, 2006). The study found that for many of these surgeries, it was not uncommon for the median prices paid to be two or three times the fee schedule amount. Typically, 50–60 percent of these surgical procedures were paid above the fee schedule rate. System participants indicated that payors in the state were willing to negotiate with surgeons because workers had better outcomes and return to work was faster (Radeva, 2014b).
Table 15 Interstate Ranking for Massachusetts on Medical Price Index for Professional Services in 2008 and 2010
Major radiology
Minor radiology
Neurological/ neuromuscular testing
Emergency
Notes:
This ranking comparison for Massachusetts in 2008 and 2010 is based on the 31 states published in the ninth edition of this annual study. These states comprise 25 states that use fee schedules to regulate the payment for professional services and 6 states with no fee schedules for the years shown.
Overall
Evaluation and management
Physical medicine
Major surgery
Pain management injections
copyright © 2020 workers compensation research institute46
_____________________________________________________________________________________________W C R I M E D I C A L P R I C E I N D E X F O R W O R K E R S ' C O M P E N S A T I O N , 1 2 T H E D I T I O N ( M P I - W C )

Professional Service Group
Year Medical Price Index% Difference
Compared with 36-State Median
36-State Ranking (1 = highest)
30-Fee-Schedule-State Ranking
(1 = highest)
2017 115 15% 12 5
2018 118 18% 11 5
2017 113 13% 11 5
2018 124 24% 8 3
2017 114 14% 9 2
2018 122 22% 7 2
2017 115 15% 14 7
2018 102 2% 17 11
2017 99 -1% 20 13
2018 87 -13% 23 17
2017 102 2% 16 10
2018 99 -1% 20 15
2017 109 9% 15 8
2018 110 10% 13 7
2017 98 -2% 20 13
2018 97 -3% 20 14
2017 119 19% 12 5
2018 105 5% 15 9
Effective October 1, 2017, Arizona transitioned to a resource-based relative value scale (RBRVS) based fee schedule for professional services. Before this change, the fee schedule rates in Arizona were established annually between the 75th and 100th percentile of the surveyed values from the states of Colorado, Nevada, New Mexico, North Carolina, Oregon, Utah, and Washington.
Major radiology
Minor radiology
Neurological/ neuromuscular testing
Emergency
Notes:
This ranking comparison for Arizona in 2017 and 2018 is based on 36 study states. The interstate ranking among fee schedule states in this table is based on 30 states with fee schedules in 2018, including Virginia, a state that adopted its first medical fee schedule in that year. In 2017, the interstate ranking among fee schedule states is based on 29 states with fee schedules, as Virginia was a state with no fee schedule then.
Pain management injections
Table 16 Interstate Ranking for Arizona on Medical Price Index for Professional Services in 2017 and 2018
Overall
Evaluation and management
Physical medicine
Major surgery
copyright © 2020 workers compensation research institute47
_____________________________________________________________________________________________W C R I M E D I C A L P R I C E I N D E X F O R W O R K E R S ' C O M P E N S A T I O N , 1 2 T H E D I T I O N ( M P I - W C )

Professional Service Group
Year Medical Price Index% Difference
Compared with 31-State Median
31-State Ranking (1 = highest)
25-Fee-Schedule-State Ranking
(1 = highest)
2015 94 -6% 19 13
2016 93 -7% 20 14
2015 100 0% 13 8
2016 106 6% 13 8
2015 86 -14% 24 18
2016 90 -10% 25 19
2015 96 -4% 17 11
2016 71 -29% 27 21
2015 63 -37% 29 23
2016 72 -28% 23 17
2015 117 17% 9 4
2016 104 4% 11 6
2015 81 -19% 22 16
2016 116 16% 9 3
2015 71 -29% 30 24
2016 100 0% 16 9
2015 145 45% 8 2
2016 82 -18% 23 17
This ranking comparison for Colorado in 2015 is based on the 31 states published in the ninth edition of this annual study; the comparison in 2016 is based on the same set of states for consistency. These states comprise the 25 states that use fee schedules to regulate the payment for professional services and the 6 states with no fee schedules for the years shown.
Colorado usually updates its fee schedule for professional services annually in January. The most recent update covered in the study period in this report was effective January 1, 2016. In January 2016, Colorado revised its fee schedule for professional services and incorporated the use of relative values from the National Physician Fee Schedule Relative Value Scale file (RBRVS) published by Medicare in January 2015. Previously, Colorado based its fee schedule levels on relative value units (RVUs) from the Relative Values for Physicians, currently published by OPTUM360˚.
Key: RBRVS: resource-based relative value scale (Medicare).
Notes:
Table 17 Interstate Ranking for Colorado on Medical Price Index for Professional Services in 2015 and 2016
Overall
Evaluation and management
Physical medicine
Major surgery
Pain management injections
Major radiology
Minor radiology
Neurological/ neuromuscular testing
Emergency
copyright © 2020 workers compensation research institute48
_____________________________________________________________________________________________W C R I M E D I C A L P R I C E I N D E X F O R W O R K E R S ' C O M P E N S A T I O N , 1 2 T H E D I T I O N ( M P I - W C )

Professional Service Group
Year Medical Price Index% Difference
Compared with 31-State Median
31-State Ranking (1 = highest)
25-Fee-Schedule-State Ranking
(1 = highest)
2013 72 -28% 30 24
2014 77 -23% 30 24
2015 78 -22% 30 24
2016 80 -20% 30 24
2017 81 -19% 28 22
2013 67 -33% 30 24
2014 88 -12% 24 18
2015 91 -9% 22 17
2016 97 -3% 20 15
2017 99 -1% 17 12
2013 62 -38% 31 25
2014 77 -23% 26 20
2015 78 -22% 27 21
2016 81 -19% 27 21
2017 84 -16% 25 19
2013 85 -15% 21 15
2014 69 -31% 29 23
2015 65 -35% 29 23
2016 61 -39% 29 23
2017 57 -43% 31 25
2013 58 -42% 31 25
2014 60 -40% 31 25
2015 59 -41% 31 25
2016 53 -47% 31 25
2017 46 -54% 31 25
2013 82 -18% 27 21
2014 71 -29% 29 23
2015 68 -32% 28 22
2016 65 -35% 29 23
2017 63 -37% 29 23
2013 75 -25% 27 21
2014 87 -13% 22 16
2015 77 -23% 25 19
2016 72 -28% 25 19
2017 72 -28% 25 19
2013 121 21% 8 7
2014 72 -28% 27 21
2015 84 -16% 23 17
2016 86 -14% 21 15
2017 87 -13% 21 15
2013 79 -21% 27 21
2014 71 -29% 29 23
2015 73 -27% 29 23
2016 76 -24% 28 22
2017 79 -21% 26 20
Table 18 Interstate Ranking for California on Medical Price Index for Professional Services in 2013, 2014, 2015, 2016, and 2017
Notes:
Effective January 2014, California transitioned to an RBRVS-based fee schedule. This fee schedule change is a part of the workers’ compensation reform legislation outlined in Senate Bill 863. This legislation requires the adoption of Medicare’s RBRVS schedule for professional services to be phased in over four years, beginning in 2014, and to remain in effect until the Division of Workers’ Compensation adopts an RBRVS schedule that allows no more than 120 percent of the aggregate fees allowed by Medicare. During the four-year transition period, the conversion factors for primary care services increased and the conversion factors for specialty services decreased. Before the change to an RBRVS-based fee schedule, California used the Official Medical Fee Schedule (OMFS) to regulate the payment of professional services, and the maximum reimbursement rates in the OMFS remained unchanged since 2007.
Key: RBRVS: resource-based relative value scale (Medicare).
This ranking comparison for California is based on the 31 states published in the ninth edition of this annual study for the years 2013 through 2015; the comparisons in 2016 and 2017 are based on the same set of states for consistency. These states comprise 25 states that use fee schedules to regulate the payment for professional services and 6 states with no fee schedules for the years shown.
Overall
Minor radiology
Neurological/ neuromuscular testing
Emergency
Evaluation and management
Physical medicine
Major surgery
Pain management injections
Major radiology
copyright © 2020 workers compensation research institute49
_____________________________________________________________________________________________W C R I M E D I C A L P R I C E I N D E X F O R W O R K E R S ' C O M P E N S A T I O N , 1 2 T H E D I T I O N ( M P I - W C )
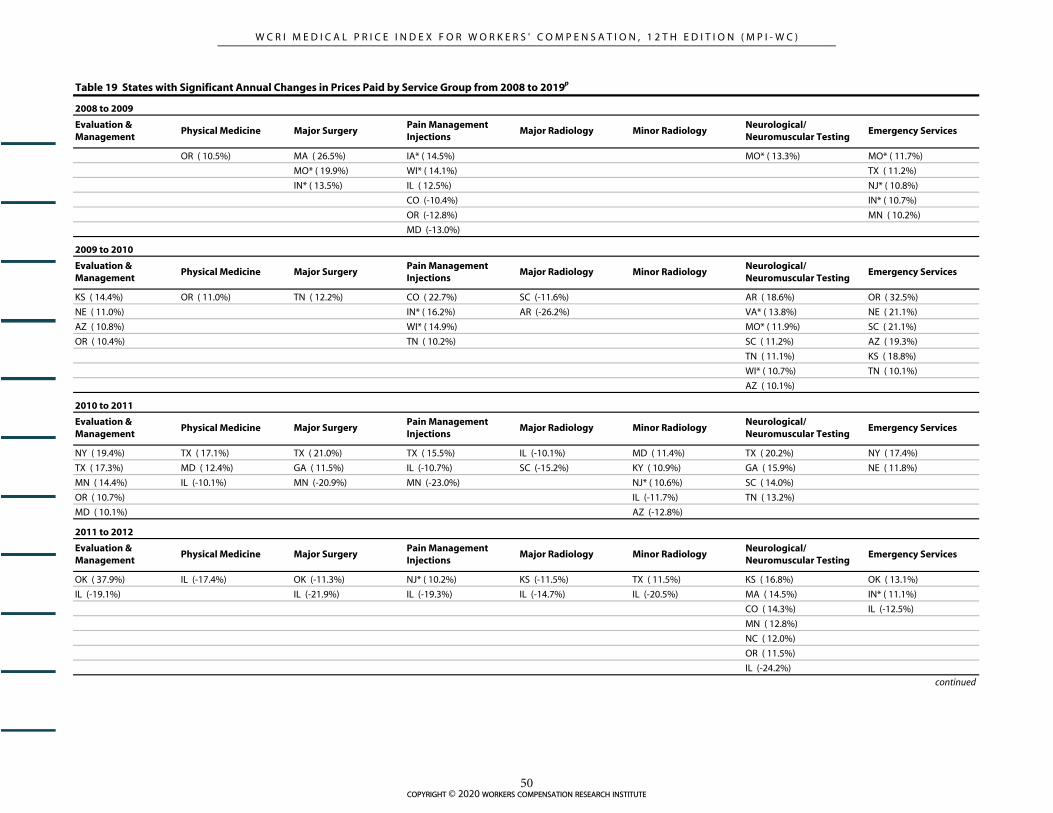
OR ( 10.5%) MA ( 26.5%) IA* ( 14.5%) MO* ( 13.3%) MO* ( 11.7%)
MO* ( 19.9%) WI* ( 14.1%) TX ( 11.2%)
IN* ( 13.5%) IL ( 12.5%) NJ* ( 10.8%)
CO (-10.4%) IN* ( 10.7%)
OR (-12.8%) MN ( 10.2%)
MD (-13.0%)
KS ( 14.4%) OR ( 11.0%) TN ( 12.2%) CO ( 22.7%) SC (-11.6%) AR ( 18.6%) OR ( 32.5%)
NE ( 11.0%) IN* ( 16.2%) AR (-26.2%) VA* ( 13.8%) NE ( 21.1%)
AZ ( 10.8%) WI* ( 14.9%) MO* ( 11.9%) SC ( 21.1%)
OR ( 10.4%) TN ( 10.2%) SC ( 11.2%) AZ ( 19.3%)
TN ( 11.1%) KS ( 18.8%)
WI* ( 10.7%) TN ( 10.1%)
AZ ( 10.1%)
NY ( 19.4%) TX ( 17.1%) TX ( 21.0%) TX ( 15.5%) IL (-10.1%) MD ( 11.4%) TX ( 20.2%) NY ( 17.4%)
TX ( 17.3%) MD ( 12.4%) GA ( 11.5%) IL (-10.7%) SC (-15.2%) KY ( 10.9%) GA ( 15.9%) NE ( 11.8%)
MN ( 14.4%) IL (-10.1%) MN (-20.9%) MN (-23.0%) NJ* ( 10.6%) SC ( 14.0%)
OR ( 10.7%) IL (-11.7%) TN ( 13.2%)
MD ( 10.1%) AZ (-12.8%)
OK ( 37.9%) IL (-17.4%) OK (-11.3%) NJ* ( 10.2%) KS (-11.5%) TX ( 11.5%) KS ( 16.8%) OK ( 13.1%)
IL (-19.1%) IL (-21.9%) IL (-19.3%) IL (-14.7%) IL (-20.5%) MA ( 14.5%) IN* ( 11.1%)
CO ( 14.3%) IL (-12.5%)
MN ( 12.8%)
NC ( 12.0%)
OR ( 11.5%)
IL (-24.2%)
2009 to 2010
Evaluation & Management
Physical Medicine
Evaluation & Management
Minor RadiologyNeurological/Neuromuscular Testing
Emergency Services
2011 to 2012
Evaluation & Management
Physical Medicine Major Surgery
Major SurgeryPain Management Injections
Major Radiology
Pain Management Injections
Major Radiology Minor Radiology
Emergency Services
2010 to 2011
Major SurgeryPain Management Injections
Major Radiology
Table 19 States with Significant Annual Changes in Prices Paid by Service Group from 2008 to 2019p
Evaluation & Management
Physical Medicine Major SurgeryPain Management Injections
Major Radiology Minor RadiologyNeurological/Neuromuscular Testing
Emergency Services
2008 to 2009
Minor RadiologyNeurological/Neuromuscular Testing
Physical Medicine
Neurological/Neuromuscular Testing
Emergency Services
continued
copyright © 2020 workers compensation research institute50
_____________________________________________________________________________________________W C R I M E D I C A L P R I C E I N D E X F O R W O R K E R S ' C O M P E N S A T I O N , 1 2 T H E D I T I O N ( M P I - W C )

NC ( 22.2%) TN (-11.1%) TN (-12.4%) TN (-10.8%) NJ* (-16.1%) MA ( 14.5%)
NJ* (-18.3%) NJ* (-15.7%) KS (-10.1%)
NE (-11.5%)
CT (-17.7%)
MS (-17.7%)
MD (-20.4%)
MO* (-28.2%)
WI* (-28.7%)
TX (-29.7%)
VA* (-31.2%)
GA (-32.5%)
OR (-34.3%)
PA (-34.8%)
AR (-38.0%)
IA* (-38.4%)
TN (-38.9%)
IN* (-40.6%)
NJ* (-41.8%)
CA ( 30.5%) CA ( 27.4%) CA (-21.2%) MO* ( 11.4%) CT (-12.3%) MS ( 14.9%) MS ( 30.4%) KY ( 16.8%)
AZ ( 17.7%) KY ( 16.8%) NE (-10.5%) AR (-17.4%) CA ( 13.8%) MO* ( 22.4%) MO* ( 16.0%)
KY ( 10.7%) MS ( 16.5%) MD (-11.1%) TN (-18.3%) TX (-10.1%) IN* ( 21.4%) VA* ( 12.1%)
AZ ( 15.5%) GA (-12.4%) MS (-19.1%) NJ* ( 21.2%) IN* ( 10.1%)
KS ( 12.3%) NJ* (-12.9%) NE (-19.6%) IA* ( 18.7%) CA (-11.4%)
IN* ( 11.8%) TN (-13.6%) TX (-19.7%) VA* ( 12.7%) NJ* (-12.5%)
NJ* ( 11.0%) TX (-14.5%) MD (-19.9%) NE (-10.1%)
AR (-19.1%) CA (-20.1%) OR (-10.8%)
CO (-38.2%) KS (-23.2%) AZ (-13.8%)
MN (-24.5%) CT (-15.6%)
KY (-16.4%)
MN (-22.8%)
KS (-27.7%)
IL (-31.3%)
CA (-42.6%)
CO (-51.7%)
Neurological/Neuromuscular Testing
Emergency ServicesPain Management Injections
Major Radiology Minor Radiology
continued
2012 to 2013
Evaluation & Management
Physical Medicine Major Surgery
Table 19 States with Significant Annual Changes in Prices Paid by Service Group from 2008 to 2019p (continued)
2013 to 2014
Evaluation & Management
Physical Medicine Major SurgeryPain Management Injections
Major Radiology Minor RadiologyNeurological/Neuromuscular Testing
Emergency Services
copyright © 2020 workers compensation research institute51
_____________________________________________________________________________________________W C R I M E D I C A L P R I C E I N D E X F O R W O R K E R S ' C O M P E N S A T I O N , 1 2 T H E D I T I O N ( M P I - W C )

NC ( 12.4%) NC ( 16.4%) TN ( 19.8%) AR (-10.3%) SC (-10.9%) MO* ( 19.5%)
KY ( 14.3%) TX ( 13.9%) CT (-12.1%) NE (-17.7%) IN* ( 16.8%)
LA ( 11.0%) KS (-14.2%) MI (-25.2%) NC ( 15.9%)
IA* (-10.1%) NC (-19.2%) AZ (-32.5%) KY ( 12.0%)
MI (-11.6%) NE (-19.8%) IA* ( 10.4%)
KS (-17.8%) MI (-39.3%)
NC ( 16.0%) NC ( 25.5%) CO (-25.7%) CO ( 21.1%) CO (-12.5%) CO ( 47.0%) CO ( 49.9%) IA* ( 17.0%)
AZ ( 10.6%) NE ( 18.3%) NC (-23.0%) IN* ( 11.2%) NC ( 14.2%)
FL (-17.7%) CO (-41.8%)
SC (-24.6%)
MO* ( 22.1%) MI ( 39.1%) CO (-14.4%) KY ( 12.8%) MO* ( 19.4%) KY ( 15.3%)
MN ( 29.6%) MN (-15.7%) CO (-19.4%) OK ( 11.0%)
NJ* ( 28.0%) MS (-23.3%) MS (-30.1%)
MA ( 26.8%)
KS ( 20.6%)
IA* ( 13.0%)
MO* ( 12.1%)
IN* ( 11.3%)
KY ( 10.1%)
OR (-13.9%)
AZ ( 10.9%) IA* ( 13.5%) CO ( 14.8%) CO ( 18.4%) NJ* ( 10.9%) OK (-20.3%) MS ( 13.5%)
VA (-10.9%) VA (-12.8%) AZ (-11.2%) OK ( 11.0%) VA (-23.4%) MO* (-27.6%) AZ (-12.5%)
VA (-12.6%) MI (-13.7%) VA (-14.2%)
AZ (-15.3%)
VA (-20.2%)
Table 19 States with Significant Annual Changes in Prices Paid by Service Group from 2008 to 2019p (continued)
Neurological/Neuromuscular Testing
Minor Radiology
Neurological/Neuromuscular Testing
Emergency Services
2014 to 2015
Evaluation & Management
Physical Medicine Major SurgeryPain Management Injections
Emergency Services
Evaluation & Management
Physical Medicine Major SurgeryPain Management Injections
Major Radiology Minor Radiology
Evaluation & Management
Physical Medicine Major SurgeryPain Management Injections
2016 to 2017
Neurological/Neuromuscular Testing
Emergency Services
Minor RadiologyNeurological/Neuromuscular Testing
Emergency Services
continued
Major Radiology
Major Radiology
Minor Radiology
2015 to 2016
2017 to 2018
Evaluation & Management
Physical Medicine Major SurgeryPain Management Injections
Major Radiology
copyright © 2020 workers compensation research institute52
_____________________________________________________________________________________________W C R I M E D I C A L P R I C E I N D E X F O R W O R K E R S ' C O M P E N S A T I O N , 1 2 T H E D I T I O N ( M P I - W C )

NY ( 13.6%) KS ( 17.2%) OK (-11.3%) NJ* ( 12.7%) MO* ( 42.4%) MS (-11.8%)
OR ( 12.5%) NY (-10.8%)
CO (-13.7%)
AZ, CO, MD, MO, NY, OK, OR: The data for each of these states are not necessarily representative because each state is missing data from a larger data source that is significant in that state. The results in AZ, CO, MD, NY, OK, and OR are unlikely to be significantly under- or overestimated, given that these states use fee schedules to regulate the reimbursement for professional services, and it is unlikely that the prices paid for the missing data source in each state were materially different from other data sources included in this study from the same state. For MO, to the extent that prices paid may differ for the missing data source compared with other data sources in the state, this may lead to possible under- or overestimations in the results.
Special notation: p We use the notation p to indicate that the 2019 numbers are preliminary results based on half-year price data through June 30, 2019.
Notes:
Prices paid for neurological/neuromuscular testing services in most study states decreased starting in 2013. This general trend is related to a fundamental change implemented by the Centers for Medicare & Medicaid Services in the coding system for nerve conduction studies, which are the most commonly billed procedures in the neurological/neuromuscular testing service group. For more details, see "Discussion of Substantial Changes in Prices at Service-Type Level" and "Technical Appendix."
2018 to 2019p
Evaluation & Management
Physical Medicine Major SurgeryPain Management Injections
Major Radiology Minor RadiologyNeurological/Neuromuscular Testing
Emergency Services
Table 19 States with Significant Annual Changes in Prices Paid by Service Group from 2008 to 2019p (continued)
* These states did not have a workers' compensation fee schedule at the specific time point shown in this table.
AL, DE, NH, NM, and NV are excluded from the trend analysis because of insufficient sample sizes in earlier years.
VA: This state adopted its first workers’ compensation fee schedule for medical professional services effective January 1, 2018.
copyright © 2020 workers compensation research institute53
_____________________________________________________________________________________________W C R I M E D I C A L P R I C E I N D E X F O R W O R K E R S ' C O M P E N S A T I O N , 1 2 T H E D I T I O N ( M P I - W C )

DATA AND METHODS
The price index measures prices for professional services, holding the utilization of those services constant
across study states and over time. It is based on a collection of the most common medical services provided to
workers with injuries; this collection is called a marketbasket. To isolate the effect of price changes and interstate
differences in prices, we held the marketbasket of services constant and used fixed weights to compute the
average prices. The following sections describe the data used, the construction of the marketbasket, and the
computation of the price index. The “Technical Appendix” provides further details on methods.
THE DATA
The WCRI MPI-WC is based on the detailed medical bill data in the WCRI Detailed Benchmark/Evaluation
(DBE) database, which comprises approximately 37 to 76 percent of the claims across most of the 36 study
states.1 The data in most of the study states are reasonably representative of the state systems, with the caveats
described in the “Limitations and Caveats” section and the “Technical Appendix.” The information to
construct the marketbasket and compute the price index comes from the medical bills associated with the
claims in the DBE database. The basic unit of measurement is the price—the amount paid for each medical
service.
THE MARKETBASKET
To represent the utilization of medical services, we selected a set of medical services most commonly used to
treat workers with injuries—a marketbasket. The marketbasket of services was held constant across states and
over time. Holding utilization constant allows us to isolate the effect of price changes and interstate differences
in prices from the changes and interstate differences in patterns of medical care delivered. The professional
services provided to workers with injuries generally fall into eight major service groups. Each of these groups
represents a price index component. We reviewed the top procedure codes ranked by frequency for each of
these groups. In general, we selected the most frequent codes so that the majority of expenditures in each service
group was represented by selected codes. Codes in the marketbasket captured at least 90 percent of total
expenditures for emergency services, evaluation and management, major radiology, and physical medicine (see
Table TA.4). For minor radiology, neurological/neuromuscular testing, and pain management injections, codes
in the marketbasket represented 76 to 79 percent of total expenditures. The only exception is major surgery,
where the codes in the marketbasket captured 44 percent of total expenditures. Service groups with lower
representation in the marketbasket have a broader list of codes in each group, and adding additional codes
added only a small percentage of payments each time. Also, the analysis of additional procedures would not be
supported by the observed number of services in smaller states. We also tested the marketbasket to ensure that
it was robust and represented the majority of workers’ compensation expenditures on professional services in
each of the study states (see Tables TA.5a and TA.5b).
1 In Colorado, New York, and Oregon, the data represented a lower percentage of the population of claims in each state because our sample is missing data from a larger data source that is significant in each state.
copyright © 2020 workers compensation research institute54
_____________________________________________________________________________________________W C R I M E D I C A L P R I C E I N D E X F O R W O R K E R S ' C O M P E N S A T I O N , 1 2 T H E D I T I O N ( M P I - W C )

CREATING THE INDICES
We computed an average price paid for each of the individual service codes in the marketbasket for each state
and for each year.2 We computed the average price level of each service group as the weighted average of the
individual service prices for the services in each group, relying on procedure-level frequency weights. The
procedure-level weights are the relative frequency of each procedure in the marketbasket—that is, the total
number of services for each procedure provided as a share of the total number of all services provided within
the respective service group. The service group price levels were aggregated to a state-level price for overall
professional services using the service group frequency weights. Here the service group frequency weights are
the share of the number of services within each service group as a percentage of the total number of all
professional services in the eight service groups, not limited to services captured by the marketbasket. Hence,
the computed state-level indices reflect the relative importance of each service group as observed in the data
and not distorted by differences in the proportion of services captured in the marketbasket for each service
group. In particular, the marketbasket services for major surgery represented a substantially smaller fraction of
all major surgery services than the marketbasket services for other service groups. If price growth for surgical
services was higher than for other services in a state, the state-level price index would have underestimated the
actual price growth if the frequency of the surgical services was based on services selected in the marketbasket.3
The index for the interstate comparisons uses the median state as a base, so an index of 120 simply means
that the prices paid in that state were, on average, 20 percent higher than those in the median state.
The intrastate trend indices use calendar year 2008 as the base, so an index of 120 for calendar year 2019
means that the average price paid in 2019 was 20 percent higher than in 2008.
2 Several data cleaning steps were necessary prior to creating the average unit price, including checking for outlier values, multiple units of services (or bundled services), and missing procedure code modifiers, and applying a visit-level approach to nerve conduction studies. The methods for cleaning the data are described in more detail in the “Technical Appendix.” 3 This approach implicitly relies on an assumption that the price trends of services captured in the marketbasket for each service group are representative of all services observed in the data for a respective service group.
copyright © 2020 workers compensation research institute55
_____________________________________________________________________________________________W C R I M E D I C A L P R I C E I N D E X F O R W O R K E R S ' C O M P E N S A T I O N , 1 2 T H E D I T I O N ( M P I - W C )

LIMITATIONS AND CAVEATS
Here, we remind readers of several caveats for interpreting the price index.
First, to provide more recent information, we report prices in 2019 based on data from January 1, 2019,
through June 30, 2019. The interstate rankings based on data from the first half of 2019 should provide a
reasonable approximation for a state’s ranking relative to other states based on a full year of 2019 data—
especially for states that adjusted their fee schedules early in 2019 (see Figure TA.1). For states that adjusted
their fee schedules after June 30, the index may understate or overstate their comparable price index for 2019.
Several study states had fee schedule changes or updates within 2019 but after June 30, 2019, namely Arizona,
Connecticut, Minnesota, and Tennessee. States that follow the latest Medicare updates may also be affected by
this issue to a certain extent. For states without fee schedules, it would not be surprising if the price index based
on six months of data understates the value of the price index based on a full year of data. In states with fee
schedules, if some common medical services are reimbursed as by report,1 the price index based on half-year
data may also understate the full-year value due to potential lagged payments with bigger amounts for these
services. Given all the reasons discussed above, the price changes from 2018 to 2019 in the report (based on
half-year 2019 data) may understate or overstate the trends based on a full year of 2019 data in the study states.
For example, New York implemented increases in medical fee schedule rates effective April 1, 2019. The half-
year price data through June 2019 in this edition reflect only two months of experience under the new fee
schedule; the next edition of this report will examine the price trends with 14 months of experience after this
policy change.
Second, this study is based on data from a group of large insurers, self-insurers, state funds, and third-
party administrators in 36 states. The data for most study states are reasonably representative of the state
systems; however, in a few states our data are not necessarily representative because they are missing data from
a larger data source that is significant in the state. To the extent that prices paid may differ for the missing
payors compared with those for other payors in the state, this may lead to under- or overestimations in the
results. These states are Arizona, Colorado, Maryland, Missouri, New York, Oklahoma, and Oregon, as noted
throughout the tables and figures in this report. However, the results for Arizona, Colorado, Maryland, New
York, Oklahoma, and Oregon are unlikely to be significantly under- or overestimated, given that these states
use fee schedules to regulate the payment for professional services; therefore, it is unlikely that the prices for
the missing data source were materially different from other data sources included in this study from the same
state.
Third, we use a single marketbasket of procedure codes across all states to hold utilization constant in order
to isolate the effects of prices. In a few states, there are a limited number of unique state-specific procedure
codes. Often these codes are mapped to the standard codes in the marketbasket. In a few states, such a mapping
was not possible. In these cases, we omitted the state-specific codes (for a more detailed discussion, please refer
to the section entitled “Selecting the Marketbasket” in the “Technical Appendix”). This omission might
produce minor distortions in the interstate comparability but should not affect the individual state trends.
1 By report procedures refer to medical services that do not have assigned fee schedule rates and instead are subject to a special report to determine reimbursement rates. Such by report services are commonly not reimbursed by Medicare.
copyright © 2020 workers compensation research institute56
_____________________________________________________________________________________________W C R I M E D I C A L P R I C E I N D E X F O R W O R K E R S ' C O M P E N S A T I O N , 1 2 T H E D I T I O N ( M P I - W C )

QUICK REFERENCE GUIDE TO FIGURES AND TABLES
Part 1: Interstate Comparisons and Trends Figures and Tables Part 2: State Trend Figures
Part 1: Interstate Comparisons and Trends Figures and Tables
Service Group
Interstate Comparisons of Price Index Price Trends from 2008 to 2019
2018 2019 In All States In Each State
Overall Table A.1Figure A.1
Table A.2Figure A.2
Figure B.1
Figures B.2–B.32
Evaluation and management
Table A.1Figure A.3
Table A.2Figure A.4
Table B.1
Figures C.1–C.31
Physical medicine Table A.1Figure A.5
Table A.2Figure A.6
Table B.2
Figures C.1–C.31
Major surgery Table A.1Figure A.7
Table A.2Figure A.8
Table B.3
Figures C.1–C.31
Pain management injections
Table A.1Figure A.9
Table A.2Figure A.10
Table B.4
Figures C.1–C.31
Major radiology Table A.1Figure A.11
Table A.2Figure A.12
Table B.5
Figures C.1–C.31
Minor radiology Table A.1Figure A.13
Table A.2 Figure A.14
Table B.6
Figures C.1–C.31
Neurological/ neuromuscular testing
Table A.1Figure A.15
Table A.2Figure A.16
Table B.7
Figures C.1–C.31
Emergency Table A.1Figure A.17
Table A.2Figure A.18
Table B.8
Figures C.1–C.31
continued
copyright © 2020 workers compensation research institute57
_____________________________________________________________________________________________W C R I M E D I C A L P R I C E I N D E X F O R W O R K E R S ' C O M P E N S A T I O N , 1 2 T H E D I T I O N ( M P I - W C )

Part 2: State Trend Figures
Statea Trends in Medical Prices for Professional Services
Arizona Overall By Service Group
Arkansas Overall By Service Group
California Overall By Service Group
Colorado Overall By Service Group
Connecticut Overall By Service Group
Florida Overall By Service Group
Georgia Overall By Service Group
Illinois Overall By Service Group
Indiana Overall By Service Group
Iowa Overall By Service Group
Kansas Overall By Service Group
Kentucky Overall By Service Group
Louisiana Overall By Service Group
Maryland Overall By Service Group
Massachusetts Overall By Service Group
Michigan Overall By Service Group
Minnesota Overall By Service Group
Mississippi Overall By Service Group
Missouri Overall By Service Group
Nebraska Overall By Service Group
New Jersey Overall By Service Group
New York Overall By Service Group
North Carolina Overall By Service Group
Oklahoma Overall By Service Group
Oregon Overall By Service Group
Pennsylvania Overall By Service Group
South Carolina Overall By Service Group
Tennessee Overall By Service Group
Texas Overall By Service Group
Virginia Overall By Service Group
Wisconsin Overall By Service Group
a This table includes 31 states. Alabama, Delaware, Nevada, New Hampshire, and New Mexico were excluded from the trend analysis because of insufficient sample sizes in earlier years. We provide price changes in these five states in the “Statistical Appendix” Table SA.2 for a shorter period from 2013 to 2019, when sufficient data were available.
copyright © 2020 workers compensation research institute58
_____________________________________________________________________________________________W C R I M E D I C A L P R I C E I N D E X F O R W O R K E R S ' C O M P E N S A T I O N , 1 2 T H E D I T I O N ( M P I - W C )

Professional Services
Overall EmergencyEvaluation & Management
Major Radiology
Minor Radiology
Neurological/Neuromuscular
Testing
Physical Medicine
Major Surgery
Pain Management
Injections
AL 100 73 71 110 148 52 99 126 80
AR 87 73 92 86 90 68 88 73 100
AZa 118 105 124 99 110 97 122 102 87
CA 81 78 101 63 70 91 82 53 47
COa 97 87 114 96 95 102 92 77 74
CT 117 93 117 102 107 107 94 157 130
DE 97 132 76 97 81 105 99 109 100
FL 73 67 82 74 55 62 72 62 67
GA 109 88 111 99 121 89 95 125 95
IAb 139 194 126 170 160 130 141 118 181
IL 132 149 86 158 160 133 113 193 184
INb 170 278 126 162 206 148 177 179 227
KS 95 89 111 71 77 86 93 82 105
KY 106 121 98 116 96 75 112 93 102
LA 97 99 81 113 97 111 102 87 160
MA 89 59 71 101 65 107 61 149 129
MDa 92 78 101 63 69 80 101 72 56
MI 86 79 97 59 66 69 98 56 64
MN 113 115 146 87 98 105 107 78 107
MOa,b 149 285 128 136 200 127 129 181 153
MS 105 85 91 80 91 101 109 115 155
NC 92 96 99 83 89 79 95 72 76
NE 99 101 100 101 109 82 89 102 100
NHb 191 204 169 300 251 220 167 189 232
NJb 144 234 100 95 130 148 119 234 204
NM 112 115 112 144 104 86 113 93 104
NV 133 151 96 158 172 86 113 193 119
NYa 79 103 63 98 117 152 62 100 69
OKa 84 82 92 125 69 102 73 74 75
ORa 133 120 153 148 110 109 132 100 99
PA 93 82 81 113 102 63 96 92 60
SC 78 82 92 61 64 69 82 52 59
TN 92 104 98 79 86 79 85 93 71
TX 100 99 119 70 82 99 101 79 77
VA 120 206 115 124 125 108 108 124 129
WIb267 304 206 382 360 277 221 337 395
Table A.1 WCRI MPI-WC—2018 Interstate Comparisons
Note: For definitions of the service groups, please see Table TA.1.
a The data for each of these states are not necessarily representative because each state is missing data from a larger data source that is significant in that state. The results in AZ, CO, MD, NY, OK, and OR are unlikely to be significantly under- or overestimated, given that these states use fee schedules to regulate the payment for professional services, and it is unlikely that the prices paid for the missing data source in each state were materially different from other data sources included in this study from the same state. For MO, to the extent that prices paid may differ for the missing data source compared with other data sources in the state, this may lead to possible under- or overestimations in the results.
b This state had no workers' compensation fee schedule in 2018.
copyright © 2020 workers compensation research institute59
_____________________________________________________________________________________________W C R I M E D I C A L P R I C E I N D E X F O R W O R K E R S ' C O M P E N S A T I O N , 1 2 T H E D I T I O N ( M P I - W C )

Professional Services
Overall EmergencyEvaluation & Management
Major Radiology
Minor Radiology
Neurological/Neuromuscular
Testing
Physical Medicine
Major Surgery
Pain Management
Injections
AL 99 76 70 112 146 54 100 130 80
AR 87 72 90 84 89 69 89 75 95
AZa,b 114 99 121 99 108 99 117 102 81
CA 80 78 99 63 70 94 81 55 48
COa 96 88 112 98 93 109 92 79 61
CTb 115 89 114 98 103 112 92 161 134
DE 97 128 76 99 79 105 99 114 93
FL 72 70 79 75 55 63 72 61 67
GA 107 87 109 100 119 92 94 124 94
IAc 137 178 124 168 154 138 142 119 170
IL 132 148 85 163 158 135 113 205 184
INc 165 271 124 165 195 158 173 175 233
KS 95 89 108 70 75 90 92 84 119
KY 106 131 101 121 101 79 111 93 105
LA 96 99 78 114 94 116 100 90 167
MA 88 58 68 103 61 114 62 155 114
MDa 91 72 100 62 69 79 100 74 55
MI 85 78 94 61 65 70 97 59 62
MNb 111 114 142 87 95 109 106 80 106
MOa,c 153 277 128 135 193 185 134 194 161
MS 104 74 88 81 87 102 108 120 154
NC 92 98 98 83 89 82 96 75 79
NE 98 103 100 101 110 86 90 105 90
NHc 187 196 168 305 243 228 170 177 218
NJc 146 225 102 100 141 150 123 244 186
NM 112 115 111 147 100 91 114 97 113
NV 134 152 93 164 171 96 115 202 119
NYa 82 104 67 98 116 139 69 105 69
OKa 81 82 90 112 66 100 72 71 71
ORa 130 120 149 148 105 114 130 98 107
PA 92 81 81 114 100 66 94 96 61
SC 76 81 92 61 64 72 77 54 57
TNb 90 103 95 78 85 81 85 94 70
TX 101 101 117 70 82 100 102 82 76
VA 119 213 112 126 124 117 109 126 127
WIc265 309 208 383 358 283 223 336 400
Table A.2 WCRI MPI-WC—2019 p Interstate Comparisons
Special notation: p We use the notation p to indicate that the 2019 numbers are preliminary results based on half-year price data through June 30, 2019. Note that the half-year data likely provide a reasonable approximation for interstate ranking across states in 2019, based on results for earlier years from the prior editions of this study (see Figure TA.1).
Notes:
For definitions of the service groups, please see Table TA.1.
a The data for each of these states are not necessarily representative because each state is missing data from a larger data source that is significant in that state. The results in AZ, CO, MD, NY, OK, and OR are unlikely to be significantly under- or overestimated, given that these states use fee schedules to regulate the payment for professional services, and it is unlikely that the prices paid for the missing data source in each state were materially different from other data sources included in this study from the same state. For MO, to the extent that prices paid may differ for the missing data source compared with other data sources in the state, this may lead to possible under- or overestimations in the results.
b This state had fee schedule changes or updates within 2019 but after June 30, 2019, that are not reflected in the results.
c This state had no workers' compensation fee schedule in 2019.
copyright © 2020 workers compensation research institute60
_____________________________________________________________________________________________W C R I M E D I C A L P R I C E I N D E X F O R W O R K E R S ' C O M P E N S A T I O N , 1 2 T H E D I T I O N ( M P I - W C )

AZ, CT, MN, TN: These states had fee schedule changes or updates within 2019 but after June 30, 2019, that are not reflected in the results.
Figure A.1 Interstate Comparison of Prices Paid for Professional Services, WCRI MPI-WC in 36 States, 2018
Figure A.2 Interstate Comparison of Prices Paid for Professional Services, WCRI MPI-WC in 36 States, 2019p
Special notation: p We use the notation p to indicate that the 2019 numbers are preliminary results based on half-year price data through June 30, 2019. Note that the half-year data likely provide a reasonable approximation for interstate ranking across states in 2019, based on results for earlier years from the prior editions of this study (see Figure TA.1).
Notes:
This study focuses on prices paid for professional services that are billed by physicians, physical therapists/occupational therapists, and chiropractors. Services billed by hospitals or ambulatory surgery centers and services billed for durable medical equipment as well as pharmaceuticals are excluded.
AZ, CO, MD, MO, NY, OK, OR: The data for each of these states are not necessarily representative because each state is missing data from a larger data source that is significant in that state. The results in AZ, CO, MD, NY, OK, and OR are unlikely to be significantly under- or overestimated, given that these states use fee schedules to regulate the payment for professional services, and it is unlikely that the prices paid for the missing data source in each state were materially different from other data sources included in this study from the same state. For MO, to the extent that prices paid may differ for the missing data source compared with other data sources in the state, this may lead to possible under- or overestimations in the results.
IA, IN, MO, NH, NJ, WI: These states had no workers' compensation fee schedule in 2018 or 2019.
VA: This state adopted a fee schedule that became effective January 1, 2018.
0
50
100
150
200
250
300
FL SC CA
OK
NY MI
AR
MA TN MD
NC
PA KS LA CO DE
NE
AL
TX MS
KY GA
MN
NM AZ CT
VA
OR IL NV IA NJ
MO IN NH WI
36
-Sta
te M
edia
n =
10
0
0
50
100
150
200
250
300
FL SC NY
CA
OK MI
AR
MA TN MD
NC
PA KS DE
LA CO NE
AL
TX MS
KY GA
NM
MN CT
AZ
VA IL NV
OR IA NJ
MO IN NH WI
36
-Sta
te M
edia
n =
10
0
States without Fee Schedules States with Fee Schedules
States without Fee Schedules States with Fee Schedules
copyright © 2020 workers compensation research institute61
_____________________________________________________________________________________________W C R I M E D I C A L P R I C E I N D E X F O R W O R K E R S ' C O M P E N S A T I O N , 1 2 T H E D I T I O N ( M P I - W C )

AZ, CO, MD, MO, NY, OK, OR: The data for each of these states are not necessarily representative because each state is missing data from a larger data source that is significant in that state. The results in AZ, CO, MD, NY, OK, and OR are unlikely to be significantly under- or overestimated, given that these states use fee schedules to regulate the payment for professional services, and it is unlikely that the prices paid for the missing data source in each state were materially different from other data sources included in this study from the same state. For MO, to the extent that prices paid may differ for the missing data source compared with other data sources in the state, this may lead to possible under- or overestimations in the results.
IA, IN, MO, NH, NJ, WI: These states had no workers' compensation fee schedule in 2018 or 2019.
AZ, CT, MN, TN: These states had fee schedule changes or updates within 2019 but after June 30, 2019, that are not reflected in the results.
Figure A.3 Interstate Comparison of Prices Paid for Professional Evaluation and Management Services, WCRI MPI-WC in 36 States, 2018
Figure A.4 Interstate Comparison of Prices Paid for Professional Evaluation and Management Services, WCRI MPI-WC in 36 States, 2019p
Special notation: p We use the notation p to indicate that the 2019 numbers are preliminary results based on half-year price data through June 30, 2019. Note that the half-year data likely provide a reasonable approximation for interstate ranking across states in 2019, based on results for earlier years from the prior editions of this study (see Figure TA.1).
Notes:
Evaluation and management: The services in this group are new and established patient office visits. These consist of office visits that require at least two of three parts: a problem focused history, a problem focused examination, and/or straightforward medical decision making of various complexities. See Table TA.2 for a detailed description of all service codes included in this group.
VA: This state adopted a fee schedule that became effective January 1, 2018.
0
50
100
150
200
250
NY
MA AL
DE
LA FL PA IL
MS
OK
AR SC NV MI
TN NC
CA NE
MD KY NJ
KS GA
NM CO VA CT
TX AZ IN IA
MO
MN
OR
NH WI
36
-Sta
te M
edia
n =
10
0
0
50
100
150
200
250
NY
MA AL
DE
LA PA FL IL
MS
AR SC OK
NV MI
TN KY NC NJ
NE
CA
MD KS GA
NM CO VA CT
TX AZ IN IA
MO
MN
OR
NH WI
36
-Sta
te M
edia
n =
10
0
States without Fee Schedules States with Fee Schedules
States without Fee Schedules States with Fee Schedules
copyright © 2020 workers compensation research institute62
_____________________________________________________________________________________________W C R I M E D I C A L P R I C E I N D E X F O R W O R K E R S ' C O M P E N S A T I O N , 1 2 T H E D I T I O N ( M P I - W C )

AZ, CO, MD, MO, NY, OK, OR: The data for each of these states are not necessarily representative because each state is missing data from a larger data source that is significant in that state. The results in AZ, CO, MD, NY, OK, and OR are unlikely to be significantly under- or overestimated, given that these states use fee schedules to regulate the payment for professional services, and it is unlikely that the prices paid for the missing data source in each state were materially different from other data sources included in this study from the same state. For MO, to the extent that prices paid may differ for the missing data source compared with other data sources in the state, this may lead to possible under- or overestimations in the results.
IA, IN, MO, NH, NJ, WI: These states had no workers' compensation fee schedule in 2018 or 2019.
AZ, CT, MN, TN: These states had fee schedule changes or updates within 2019 but after June 30, 2019, that are not reflected in the results.
Figure A.5 Interstate Comparison of Prices Paid for Professional Physical Medicine Services, WCRI MPI-WC in 36 States, 2018
Figure A.6 Interstate Comparison of Prices Paid for Professional Physical Medicine Services, WCRI MPI-WC in 36 States, 2019p
Special notation: p We use the notation p to indicate that the 2019 numbers are preliminary results based on half-year price data through June 30, 2019. Note that the half-year data likely provide a reasonable approximation for interstate ranking across states in 2019, based on results for earlier years from the prior editions of this study (see Figure TA.1).
Notes:
Physical medicine: The services in this group include physical medicine procedures, modalities, therapeutic activities and manual therapy techniques involving one or more areas, electric stimulation, and work hardening/conditioning, as well as chiropractic care and manipulations. These services may be provided by physical therapists and occupational therapists as well as chiropractors. Physical medicine codes may be billed by physicians, chiropractors, or physical therapists and occupational therapists. See Table TA.2 for a detailed description of all service codes included in this group.
VA: This state adopted a fee schedule that became effective January 1, 2018.
0
50
100
150
200
250
MA
NY
OK FL SC CA TN AR
NE
CO KS CT
PA GA
NC MI
DE
AL
MD LA TX MN
MS
VA KY IL
NM NV
AZ NJ
OR
MO IA NH IN WI
36
-Sta
te M
edia
n =
10
0
0
50
100
150
200
250
MA
NY FL OK SC CA TN AR
NE
CO KS CT
NC
GA PA MI
AL
DE
MD TX LA MN VA
MS
KY NV IL
NM N
J
AZ
MO OR IA NH IN W
I
36
-Sta
te M
edia
n =
10
0
States without Fee Schedules States with Fee Schedules
States without Fee Schedules States with Fee Schedules
copyright © 2020 workers compensation research institute63
_____________________________________________________________________________________________W C R I M E D I C A L P R I C E I N D E X F O R W O R K E R S ' C O M P E N S A T I O N , 1 2 T H E D I T I O N ( M P I - W C )

AZ, CO, MD, MO, NY, OK, OR: The data for each of these states are not necessarily representative because each state is missing data from a larger data source that is significant in that state. The results in AZ, CO, MD, NY, OK, and OR are unlikely to be significantly under- or overestimated, given that these states use fee schedules to regulate the payment for professional services, and it is unlikely that the prices paid for the missing data source in each state were materially different from other data sources included in this study from the same state. For MO, to the extent that prices paid may differ for the missing data source compared with other data sources in the state, this may lead to possible under- or overestimations in the results.
IA, IN, MO, NH, NJ, WI: These states had no workers' compensation fee schedule in 2018 or 2019.
AZ, CT, MN, TN: These states had fee schedule changes or updates within 2019 but after June 30, 2019, that are not reflected in the results.
Figure A.7 Interstate Comparison of Prices Paid for Professional Major Surgery Services, WCRI MPI-WC in 36 States, 2018
Figure A.8 Interstate Comparison of Prices Paid for Professional Major Surgery Services, WCRI MPI-WC in 36 States, 2019p
Special notation: p We use the notation p to indicate that the 2019 numbers are preliminary results based on half-year price data through June 30, 2019. Note that the half-year data likely provide a reasonable approximation for interstate ranking across states in 2019, based on results for earlier years from the prior editions of this study (see Figure TA.1).
Notes:
Major surgery: The majority of the services in this group include orthopedic surgeries, such as arthroscopy of the shoulder or knee and lumbar laminotomies, neuroplasty and/or transposition of the median nerve at the carpal tunnel, and hernia repair. See Table TA.2 for a detailed description of all service codes included in this group.
VA: This state adopted a fee schedule that became effective January 1, 2018.
0
50
100
150
200
250
300
350
SC CA MI
FL OK
MD
NC
AR
CO
MN TX KS LA KY TN PA NM OR
AZ
NY
NE
DE IA MS
GA
VA AL
MA CT IN NH
MO NV IL NJ
WI
36
-Sta
te M
edia
n =
10
0
0
50
100
150
200
250
300
350
SC CA MI
FL MD
NC
AR
OK
CO
MN TX KS LA PA TN NM KY NY
OR
AZ
NE
DE
MS IA VA
GA AL
MA CT IN
MO
NH IL NV NJ
WI
36
-Sta
te M
edia
n =
10
0
States without Fee Schedules States with Fee Schedules
States without Fee Schedules States with Fee Schedules
copyright © 2020 workers compensation research institute64
_____________________________________________________________________________________________W C R I M E D I C A L P R I C E I N D E X F O R W O R K E R S ' C O M P E N S A T I O N , 1 2 T H E D I T I O N ( M P I - W C )
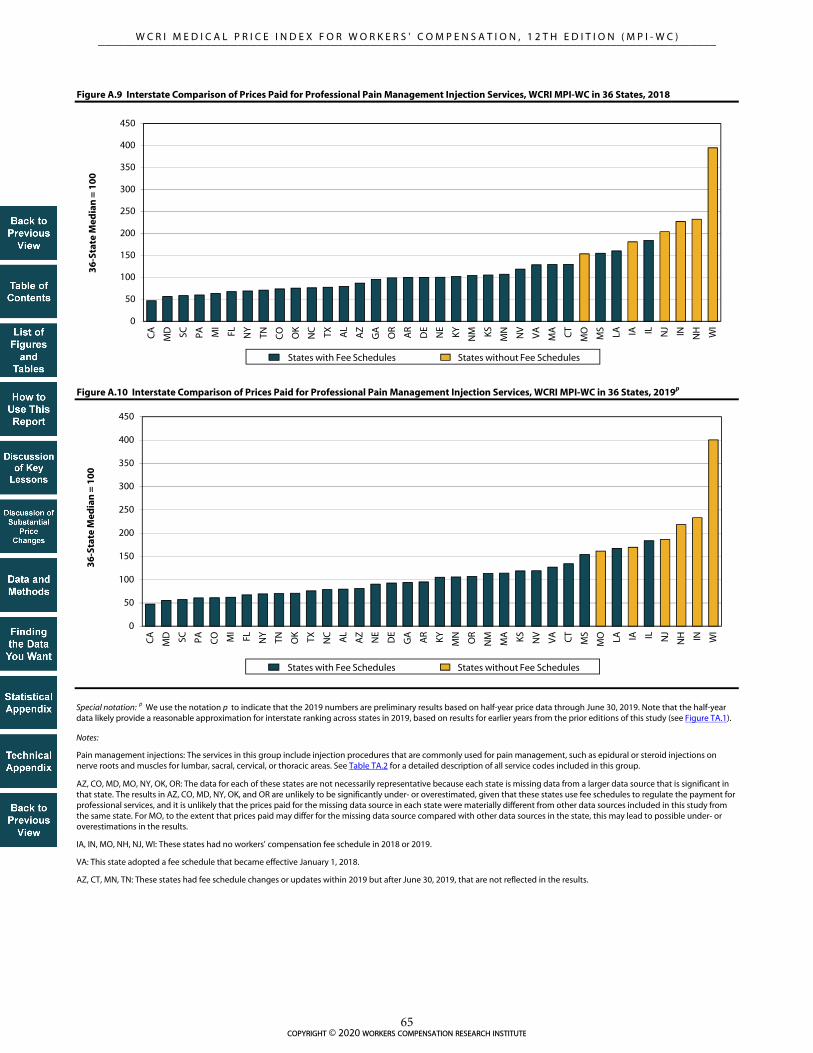
AZ, CO, MD, MO, NY, OK, OR: The data for each of these states are not necessarily representative because each state is missing data from a larger data source that is significant in that state. The results in AZ, CO, MD, NY, OK, and OR are unlikely to be significantly under- or overestimated, given that these states use fee schedules to regulate the payment for professional services, and it is unlikely that the prices paid for the missing data source in each state were materially different from other data sources included in this study from the same state. For MO, to the extent that prices paid may differ for the missing data source compared with other data sources in the state, this may lead to possible under- or overestimations in the results.
IA, IN, MO, NH, NJ, WI: These states had no workers' compensation fee schedule in 2018 or 2019.
AZ, CT, MN, TN: These states had fee schedule changes or updates within 2019 but after June 30, 2019, that are not reflected in the results.
Figure A.9 Interstate Comparison of Prices Paid for Professional Pain Management Injection Services, WCRI MPI-WC in 36 States, 2018
Figure A.10 Interstate Comparison of Prices Paid for Professional Pain Management Injection Services, WCRI MPI-WC in 36 States, 2019p
Special notation: p We use the notation p to indicate that the 2019 numbers are preliminary results based on half-year price data through June 30, 2019. Note that the half-year data likely provide a reasonable approximation for interstate ranking across states in 2019, based on results for earlier years from the prior editions of this study (see Figure TA.1).
Notes:
Pain management injections: The services in this group include injection procedures that are commonly used for pain management, such as epidural or steroid injections on nerve roots and muscles for lumbar, sacral, cervical, or thoracic areas. See Table TA.2 for a detailed description of all service codes included in this group.
VA: This state adopted a fee schedule that became effective January 1, 2018.
0
50
100
150
200
250
300
350
400
450
CA
MD SC PA CO M
I
FL NY
TN OK TX NC AL
AZ
NE
DE
GA AR KY MN
OR
NM
MA KS NV
VA CT
MS
MO LA IA IL NJ
NH IN WI
36
-Sta
te M
edia
n =
10
0
0
50
100
150
200
250
300
350
400
450
CA
MD SC PA MI
FL NY
TN CO OK
NC TX AL
AZ
GA
OR
AR
DE
NE
KY NM KS MN NV
VA
MA CT
MO
MS
LA IA IL NJ IN N
H WI
36
-Sta
te M
edia
n =
10
0
States without Fee Schedules States with Fee Schedules
States without Fee Schedules States with Fee Schedules
copyright © 2020 workers compensation research institute65
_____________________________________________________________________________________________W C R I M E D I C A L P R I C E I N D E X F O R W O R K E R S ' C O M P E N S A T I O N , 1 2 T H E D I T I O N ( M P I - W C )

AZ, CO, MD, MO, NY, OK, OR: The data for each of these states are not necessarily representative because each state is missing data from a larger data source that is significant in that state. The results in AZ, CO, MD, NY, OK, and OR are unlikely to be significantly under- or overestimated, given that these states use fee schedules to regulate the payment for professional services, and it is unlikely that the prices paid for the missing data source in each state were materially different from other data sources included in this study from the same state. For MO, to the extent that prices paid may differ for the missing data source compared with other data sources in the state, this may lead to possible under- or overestimations in the results.
IA, IN, MO, NH, NJ, WI: These states had no workers' compensation fee schedule in 2018 or 2019.
AZ, CT, MN, TN: These states had fee schedule changes or updates within 2019 but after June 30, 2019, that are not reflected in the results.
Figure A.11 Interstate Comparison of Prices Paid for Professional Major Radiology Services, WCRI MPI-WC in 36 States, 2018
Figure A.12 Interstate Comparison of Prices Paid for Professional Major Radiology Services, WCRI MPI-WC in 36 States, 2019p
Special notation: p We use the notation p to indicate that the 2019 numbers are preliminary results based on half-year price data through June 30, 2019. Note that the half-year data likely provide a reasonable approximation for interstate ranking across states in 2019, based on results for earlier years from the prior editions of this study (see Figure TA.1).
Notes:
Major radiology: The services in this group mostly include magnetic resonance imaging of various areas, including, but not limited to, spinal canal and contents, cervical, lumbar, and any joint of the upper or lower extremity. See Table TA.2 for a detailed description of all service codes included in this group.
VA: This state adopted a fee schedule that became effective January 1, 2018.
0
50
100
150
200
250
300
350
400
450
MI
SC MD CA TX KS FL TN MS
NC
AR
MN CT
CO NY
DE
AZ
GA NJ
NE
MA AL
OK LA PA KY VA
MO
NM OR IL NV IN IA NH WI
36
-Sta
te M
edia
n =
10
0
0
50
100
150
200
250
300
350
400
450
MI
SC MD CA TX KS FL TN MS
NC
AR
MN NJ
CO DE
NY
AZ
GA
MA NE
CT
AL
LA PA KY VA
OK
MO
NM OR IL NV IN IA NH WI
36
-Sta
te M
edia
n =
10
0
States without Fee Schedules States with Fee Schedules
States without Fee Schedules States with Fee Schedules
copyright © 2020 workers compensation research institute66
_____________________________________________________________________________________________W C R I M E D I C A L P R I C E I N D E X F O R W O R K E R S ' C O M P E N S A T I O N , 1 2 T H E D I T I O N ( M P I - W C )

AZ, CO, MD, MO, NY, OK, OR: The data for each of these states are not necessarily representative because each state is missing data from a larger data source that is significant in that state. The results in AZ, CO, MD, NY, OK, and OR are unlikely to be significantly under- or overestimated, given that these states use fee schedules to regulate the payment for professional services, and it is unlikely that the prices paid for the missing data source in each state were materially different from other data sources included in this study from the same state. For MO, to the extent that prices paid may differ for the missing data source compared with other data sources in the state, this may lead to possible under- or overestimations in the results.
IA, IN, MO, NH, NJ, WI: These states had no workers' compensation fee schedule in 2018 or 2019.
AZ, CT, MN, TN: These states had fee schedule changes or updates within 2019 but after June 30, 2019, that are not reflected in the results.
Figure A.13 Interstate Comparison of Prices Paid for Professional Minor Radiology Services, WCRI MPI-WC in 36 States, 2018
Figure A.14 Interstate Comparison of Prices Paid for Professional Minor Radiology Services, WCRI MPI-WC in 36 States, 2019p
Special notation: p We use the notation p to indicate that the 2019 numbers are preliminary results based on half-year price data through June 30, 2019. Note that the half-year data likely provide a reasonable approximation for interstate ranking across states in 2019, based on results for earlier years from the prior editions of this study (see Figure TA.1).
Notes:
Minor radiology: The services in this group mostly include radiologic exams (X rays or ultrasounds) involving at least two views of various areas of the body, including, but not limited to, the spine, lumbosacral, shoulder, and wrist. See Table TA.2 for a detailed description of all service codes included in this group.
VA: This state adopted a fee schedule that became effective January 1, 2018.
0
50
100
150
200
250
300
350
400
FL MA SC MI
OK
MD CA KS DE
TX TN MS
AR
NC
CO LA MN
NM PA KY CT
OR
AZ
NE
NY
GA
VA NJ
AL IA IL NV
MO IN NH W
I
36
-Sta
te M
edia
n =
10
0
0
50
100
150
200
250
300
350
400
FL SC MA MI
OK
MD CA KS DE
TX TN NC
AR
MS
CO KY LA MN PA NM CT
NE
OR
AZ
NY
GA VA NJ
AL IA IL NV
MO IN NH WI
36
-Sta
te M
edia
n =
10
0
States without Fee Schedules States with Fee Schedules
States without Fee Schedules States with Fee Schedules
copyright © 2020 workers compensation research institute67
_____________________________________________________________________________________________W C R I M E D I C A L P R I C E I N D E X F O R W O R K E R S ' C O M P E N S A T I O N , 1 2 T H E D I T I O N ( M P I - W C )

AZ, CO, MD, MO, NY, OK, OR: The data for each of these states are not necessarily representative because each state is missing data from a larger data source that is significant in that state. The results in AZ, CO, MD, NY, OK, and OR are unlikely to be significantly under- or overestimated, given that these states use fee schedules to regulate the payment for professional services, and it is unlikely that the prices paid for the missing data source in each state were materially different from other data sources included in this study from the same state. For MO, to the extent that prices paid may differ for the missing data source compared with other data sources in the state, this may lead to possible under- or overestimations in the results.
IA, IN, MO, NH, NJ, WI: These states had no workers' compensation fee schedule in 2018 or 2019.
AZ, CT, MN, TN: These states had fee schedule changes or updates within 2019 but after June 30, 2019, that are not reflected in the results.
Figure A.15 Interstate Comparison of Prices Paid for Professional Neurological/Neuromuscular Testing Services, WCRI MPI-WC in 36 States, 2018
Figure A.16 Interstate Comparison of Prices Paid for Professional Neurological/Neuromuscular Testing Services, WCRI MPI-WC in 36 States, 2019p
Special notation: p We use the notation p to indicate that the 2019 numbers are preliminary results based on half-year price data through June 30, 2019. Note that the half-year data likely provide a reasonable approximation for interstate ranking across states in 2019, based on results for earlier years from the prior editions of this study (see Figure TA.1).
Notes:
Neurological/neuromuscular testing: The services in this group are largely made up of sensory and motor nerve conduction tests but also include range of motion tests and application of neurostimulators; these services may be billed by physicians as well as by chiropractors and physical therapists. See Table TA.2 for a detailed description of all service codes included in this group.
VA: This state adopted a fee schedule that became effective January 1, 2018.
0
50
100
150
200
250
300
AL FL PA AR MI
SC MD KY TN NC
NE KS N
M GA
CA
NV
AZ TX OK
MS
DE
MN
CO CT
OR
MA LA VA IL IA NY NJ IN
MO
NH WI
36
-Sta
te M
edia
n =
10
0
0
50
100
150
200
250
300
AL FL PA AR MI
SC KY NC
TN MD NE
NM KS NV
GA
CA AZ TX MS
OK
CO DE
MN
MA CT
VA
OR LA MO IA IL IN NJ
NY
NH WI
36
-Sta
te M
edia
n =
10
0
States without Fee Schedules States with Fee Schedules
States without Fee Schedules States with Fee Schedules
copyright © 2020 workers compensation research institute68
_____________________________________________________________________________________________W C R I M E D I C A L P R I C E I N D E X F O R W O R K E R S ' C O M P E N S A T I O N , 1 2 T H E D I T I O N ( M P I - W C )

AZ, CO, MD, MO, NY, OK, OR: The data for each of these states are not necessarily representative because each state is missing data from a larger data source that is significant in that state. The results in AZ, CO, MD, NY, OK, and OR are unlikely to be significantly under- or overestimated, given that these states use fee schedules to regulate the payment for professional services, and it is unlikely that the prices paid for the missing data source in each state were materially different from other data sources included in this study from the same state. For MO, to the extent that prices paid may differ for the missing data source compared with other data sources in the state, this may lead to possible under- or overestimations in the results.
IA, IN, MO, NH, NJ, WI: These states had no workers' compensation fee schedule in 2018 or 2019.
AZ, CT, MN, TN: These states had fee schedule changes or updates within 2019 but after June 30, 2019, that are not reflected in the results.
Figure A.17 Interstate Comparison of Prices Paid for Professional Emergency Services, WCRI MPI-WC in 36 States, 2018
Figure A.18 Interstate Comparison of Prices Paid for Professional Emergency Services, WCRI MPI-WC in 36 States, 2019p
Special notation: p We use the notation p to indicate that the 2019 numbers are preliminary results based on half-year price data through June 30, 2019. Note that the half-year data likely provide a reasonable approximation for interstate ranking across states in 2019, based on results for earlier years from the prior editions of this study (see Figure TA.1).
Notes:
Emergency: The services in this group include emergency department visits for patients with various levels of severity and office services provided on an emergency basis. See Table TA.2 for a detailed description of all service codes included in this group.
VA: This state adopted a fee schedule that became effective January 1, 2018.
0
50
100
150
200
250
300
350
MA FL MD AR
MS
AL
CA MI
SC PA OK
GA
CO CT KS NC LA AZ TX NE
TN NY
MN
NM OR
DE
KY IL NV IA NH VA NJ IN
MO W
I
36
-Sta
te M
edia
n =
10
0
0
50
100
150
200
250
300
350
MA FL AL
AR
CA
MD M
I
SC OK
PA MS
CO
GA KS CT
NC TX LA NE
NY
TN AZ
MN
NM OR KY DE IL NV IA NH VA NJ IN
MO W
I
36
-Sta
te M
edia
n =
10
0
States without Fee Schedules States with Fee Schedules
States without Fee Schedules States with Fee Schedules
copyright © 2020 workers compensation research institute69
_____________________________________________________________________________________________W C R I M E D I C A L P R I C E I N D E X F O R W O R K E R S ' C O M P E N S A T I O N , 1 2 T H E D I T I O N ( M P I - W C )

Figure B.1 Trends in Prices Paid for Professional Services, WCRI MPI-WC, 2008 to 2019
continued
70
80
90
100
110
120
130
140
150
2008 2009 2010 2011 2012 2013 2014 2015 2016 2017 2018 2019
Ind
ex o
f Pri
ces
Pai
d
(bas
e ye
ar is
200
8=10
0)
p
70
80
90
100
110
120
130
140
150
2008 2009 2010 2011 2012 2013 2014 2015 2016 2017 2018 2019
Ind
ex o
f Pri
ces
Pai
d
(bas
e ye
ar is
200
8=10
0)
p
States with Fee Schedules (2019) States without Fee Schedules (2019)
Median of States with Fee Schedules Median of States without Fee Schedules
WIMO
IN
IANJ
copyright © 2020 workers compensation research institute70
_____________________________________________________________________________________________W C R I M E D I C A L P R I C E I N D E X F O R W O R K E R S ' C O M P E N S A T I O N , 1 2 T H E D I T I O N ( M P I - W C )

StateFee Regulation
Type2008 2009 2010 2011 2012 2013 2014 2015 2016 2017 2018 2019
AR FS 100 102 105 111 111 109 104 102 103 104 103 104
AZa,b FS 100 103 109 109 109 111 122 122 127 129 133 131
CA FS 100 102 103 103 102 102 110 111 114 116 117 118
COa FS 100 102 105 109 111 113 112 111 110 110 116 118
CTb FS 100 103 105 108 107 104 104 104 104 104 104 104
FL FS 100 104 104 102 101 101 102 102 106 111 110 111
GA FS 100 103 107 116 122 122 122 122 123 124 124 124
IA Non-FS 100 105 108 111 110 107 109 108 112 113 119 120
IL FS 100 106 109 99 79 81 81 82 82 84 86 88
IN Non-FS 100 107 114 113 119 115 122 128 131 134 135 134
KS FS 100 102 106 107 112 113 118 114 114 115 115 117
KY FS 100 102 102 104 104 103 113 123 123 125 129 132
LA FS 100 104 105 105 106 107 109 108 108 107 107 108
MA FS 100 112 115 115 114 114 114 116 115 116 116 118
MDa FS 100 102 105 115 119 119 116 116 119 122 123 125
MI FS 100 101 102 102 102 103 104 99 98 97 99 101
MNb FS 100 105 106 103 106 108 109 109 107 109 110 110
MOa Non-FS 100 109 113 112 114 115 121 123 126 135 138 144
MS FS 100 101 102 101 100 100 108 108 107 102 103 104
NC FS 100 103 104 102 103 108 108 115 127 127 126 129
NE FS 100 101 102 104 103 103 100 97 97 98 97 99
NJ Non-FS 100 105 108 112 115 100 103 106 108 111 114 119
NYa FS 100 100 101 101 102 101 102 102 103 102 101 107
OKa FS 100 100 103 103 108 109 109 107 108 109 109 106
ORa FS 100 107 115 122 120 119 119 119 120 121 120 120
PA FS 100 100 100 101 103 104 106 107 109 110 112 114
SC FS 100 100 103 105 106 106 105 104 103 100 99 98
TNb FS 100 102 111 116 115 106 101 99 99 100 101 102
TX FS 100 107 112 130 132 132 127 125 124 123 124 127
VAc Non-FS/FS 100 104 109 110 114 114 121 121 126 131 115 117
WI Non-FS 100 106 113 116 121 122 128 130 133 140 145 148
100 102 104 105 105 105 106 105 105 106 107 108
100 106 110 112 116 114 120 122 126 131 134 136
Median growth rate in FS states
Median growth rate in non-FS states
Figure B.1 Trends in Prices Paid for Professional Services, WCRI MPI-WC, 2008 to 2019 (continued)
c Virginia adopted its first workers’ compensation fee schedule for medical professional services effective January 1, 2018. Previously this state had no fee schedule.
Key: FS: fee schedule.
Special notation: p We use the notation p to indicate that the 2019 numbers are preliminary results based on half-year price data through June 30, 2019.
Notes:
Calendar year 2008 is the base year, which is equal to 100 in the index. For definitions of the service groups, please see Table TA.1.
a The data for each of these states are not necessarily representative because each state is missing data from a larger data source that is significant in that state. The results in AZ, CO, MD, NY, OK, and OR are unlikely to be significantly under- or overestimated, given that these states use fee schedules to regulate the payment for professional services, and it is unlikely that the prices paid for the missing data source in each state were materially different from other data sources included in this study from the same state. For MO, to the extent that prices paid may differ for the missing data source compared with other data sources in the state, this may lead to possible under- or overestimations in the results.
b This state had fee schedule changes or updates within 2019 but after June 30, 2019, that are not reflected in the results.
p
copyright © 2020 workers compensation research institute71
_____________________________________________________________________________________________W C R I M E D I C A L P R I C E I N D E X F O R W O R K E R S ' C O M P E N S A T I O N , 1 2 T H E D I T I O N ( M P I - W C )

2008 to 2009
2009 to 2010
2010 to 2011
2011 to 2012
2012 to 2013
2013 to 2014
2014 to 2015
2015 to 2016
2016 to 2017
2017 to 2018
2018 to 2019
2% 2% 6% 0% -2% -5% -2% 1% 0% -1% 2%
2% 2% 1% 0% 0% 0% 0% 0% 1% 0% 1%
6% 4% 2% 3% -1% 5% 2% 3% 4% 2% 2%
Figure B.2 Arkansas Trends in Prices Paid for Professional Services, WCRI MPI-WC, 2008 to 2019
Special notation: p We use the notation p to indicate that the 2019 numbers are preliminary results based on half-year price data through June 30, 2019. Note that the trend lines for the median of states with fee schedules and the median of states without fee schedules represent the median rates of growth of prices paid among states with and without fee schedules from year to year.
Notes: Arkansas' fee schedule for professional services has regular updates on the relative value units tied to the most recent Medicare resource-based relative value scale (RBRVS), with applied state conversion factors adopted in May 2000 for the services included in this study. The most recent update covered in the study period in this report was effective January 1, 2019.
Median annual change for fee schedule states
Median annual change for non-fee schedule states
Arkansas
State average annual change in prices paid for professional services
p
AR
70
80
90
100
110
120
130
140
150
2008 2009 2010 2011 2012 2013 2014 2015 2016 2017 2018 2019
Ind
ex o
f P
rice
s P
aid
(b
ase
year
is 2
00
8=
10
0)
Calendar Year 2008 Is the Base Year for Index
Arkansas (fee schedule state) Median of States with Fee Schedules Median of States without Fee Schedules
p
AR
70
80
90
100
110
120
130
140
150
2008 2009 2010 2011 2012 2013 2014 2015 2016 2017 2018 2019
Ind
ex o
f P
rice
s P
aid
(b
ase
year
is 2
00
8=
10
0)
Calendar Year 2008 Is the Base Year for Index
Arkansas Other Study States
p
p
copyright © 2020 workers compensation research institute72
_____________________________________________________________________________________________W C R I M E D I C A L P R I C E I N D E X F O R W O R K E R S ' C O M P E N S A T I O N , 1 2 T H E D I T I O N ( M P I - W C )

2008 to 2009
2009 to 2010
2010 to 2011
2011 to 2012
2012 to 2013
2013 to 2014
2014 to 2015
2015 to 2016
2016 to 2017
2017 to 2018
2018 to 2019
3% 6% 0% 0% 2% 10% 0% 4% 2% 3% -1%
2% 2% 1% 0% 0% 0% 0% 0% 1% 0% 1%
6% 4% 2% 3% -1% 5% 2% 3% 4% 2% 2%
Figure B.3 Arizona Trends in Prices Paid for Professional Services, WCRI MPI-WC, 2008 to 2019
Special notation: p We use the notation p to indicate that the 2019 numbers are preliminary results based on half-year price data through June 30, 2019. Note that the trend lines for the median of states with fee schedules and the median of states without fee schedules represent the median rates of growth of prices paid among states with and without fee schedules from year to year.
Notes:
The data for Arizona are not necessarily representative because they are missing data from a larger data source that is significant in this state. The results in Arizona are unlikely to be significantly under- or overestimated, given that the state uses a fee schedule to regulate the payment for professional services, and it is unlikely that the prices paid for the missing data source in Arizona were materially different from other data sources included in this study from the same state.
Arizona publishes its fee schedule annually with effective dates of October 1 through September 30 of the following year. The Industrial Commission of Arizona reviews the fee schedule values annually with a focus each year on one of four specific groups of codes and rotates through these specific groups of codes every four years. To calculate the fee schedule values for the codes under review, the Commission surveys the workers’ compensation fee schedules from the states of Colorado, Nevada, New Mexico, North Carolina, Oregon, Utah, and Washington and uses the following methodology: (a) current Arizona values between the 75th and 100th percentile of the states surveyed will not be adjusted; (b) current Arizona values over the 100th percentile of the states surveyed will be reduced to the 100th percentile; and (c) current Arizona values below the 75th percentile will be increased to the 75th percentile subject to the following: Increases shall be capped at 25 percent, unless and except as necessary to bring a current value up to the 50th percentile. In October 2013, Arizona reviewed and adjusted the fee schedule rates for evaluation and management, physical medicine, and surgery codes from 25000 to 39599. This update increased the fee schedule rates for evaluation and management and physical medicine services; the fee schedule rates for many common surgeries remained unchanged or had only small increases. The fee schedule effective October 2016 reflected a review of all codes. Effective October 1, 2017, Arizona transitioned to a resource-based relative value scale (RBRVS) based fee schedule. The impact of this fee schedule transition is examined in the section “Discussion of Substantial Changes in Prices at Service-Type Level.”
Arizona
State average annual change in prices paid for professional services
Median annual change for fee schedule states
Median annual change for non-fee schedule states
p
p
pp
AZ
70
80
90
100
110
120
130
140
150
2008 2009 2010 2011 2012 2013 2014 2015 2016 2017 2018 2019
Ind
ex o
f P
rice
s P
aid
(b
ase
year
is 2
00
8=
10
0)
Calendar Year 2008 Is the Base Year for Index
Arizona (fee schedule state) Median of States with Fee Schedules Median of States without Fee Schedules
AZ
70
80
90
100
110
120
130
140
150
2008 2009 2010 2011 2012 2013 2014 2015 2016 2017 2018 2019
Ind
ex o
f P
rice
s P
aid
(b
ase
year
is 2
00
8=
10
0)
Calendar Year 2008 Is the Base Year for Index
Arizona Other Study States
p
p
p
copyright © 2020 workers compensation research institute73
_____________________________________________________________________________________________W C R I M E D I C A L P R I C E I N D E X F O R W O R K E R S ' C O M P E N S A T I O N , 1 2 T H E D I T I O N ( M P I - W C )

2008 to 2009
2009 to 2010
2010 to 2011
2011 to 2012
2012 to 2013
2013 to 2014
2014 to 2015
2015 to 2016
2016 to 2017
2017 to 2018
2018 to 2019
2% 1% 0% -1% 0% 8% 1% 3% 2% 1% 1%
2% 2% 1% 0% 0% 0% 0% 0% 1% 0% 1%
6% 4% 2% 3% -1% 5% 2% 3% 4% 2% 2%
Figure B.4 California Trends in Prices Paid for Professional Services, WCRI MPI-WC, 2008 to 2019
Special notation: p We use the notation p to indicate that the 2019 numbers are preliminary results based on half-year price data through June 30, 2019. Note that the trend lines for the median of states with fee schedules and the median of states without fee schedules represent the median rates of growth of prices paid among states with and without fee schedules from year to year.
Notes: Effective January 2014, California transitioned to an RBRVS-based fee schedule. This fee schedule change is a part of the workers’ compensation reform legislation outlined in Senate Bill 863. This legislation requires the adoption of Medicare’s RBRVS schedule for professional services to be phased in over four years, beginning in 2014, and to remain in effect until the Division of Workers’ Compensation adopts an RBRVS schedule that allows no more than 120 percent of the aggregate fees allowed by Medicare. During the four-year transition period, the conversion factors for primary care services increased and the conversion factors for specialty services decreased. The latest fee schedule update covered in the study period in this report was in April 2019. Before the change to an RBRVS-based fee schedule, California used the Official Medical Fee Schedule (OMFS) to regulate the payment of professional services, and the maximum reimbursement rates in the OMFS remained unchanged since 2007.
Key: RBRVS: resource-based relative value scale (Medicare).
California
State average annual change in prices paid for professional services
Median annual change for fee schedule states
Median annual change for non-fee schedule states
p
p
pp
p
pp
p
pp
CA
70
80
90
100
110
120
130
140
150
2008 2009 2010 2011 2012 2013 2014 2015 2016 2017 2018 2019
Ind
ex o
f P
rice
s P
aid
(b
ase
year
is 2
00
8=
10
0)
Calendar Year 2008 Is the Base Year for Index
California (fee schedule state) Median of States with Fee Schedules Median of States without Fee Schedules
p
CA
70
80
90
100
110
120
130
140
150
2008 2009 2010 2011 2012 2013 2014 2015 2016 2017 2018 2019
Ind
ex o
f P
rice
s P
aid
(b
ase
year
is 2
00
8=
10
0)
Calendar Year 2008 Is the Base Year for Index
California Other Study States
p
p
copyright © 2020 workers compensation research institute74
_____________________________________________________________________________________________W C R I M E D I C A L P R I C E I N D E X F O R W O R K E R S ' C O M P E N S A T I O N , 1 2 T H E D I T I O N ( M P I - W C )

2008 to 2009
2009 to 2010
2010 to 2011
2011 to 2012
2012 to 2013
2013 to 2014
2014 to 2015
2015 to 2016
2016 to 2017
2017 to 2018
2018 to 2019
2% 3% 4% 2% 2% -1% 0% -2% 0% 6% 1%
2% 2% 1% 0% 0% 0% 0% 0% 1% 0% 1%
6% 4% 2% 3% -1% 5% 2% 3% 4% 2% 2%
Special notation: p We use the notation p to indicate that the 2019 numbers are preliminary results based on half-year price data through June 30, 2019. Note that the trend lines for the median of states with fee schedules and the median of states without fee schedules represent the median rates of growth of prices paid among states with and without fee schedules from year to year.
Notes:
The data for Colorado are not necessarily representative because they are missing data from a larger data source that is significant in this state. The results in Colorado are unlikely to be significantly under- or overestimated, given that the state uses a fee schedule to regulate the payment for professional services, and it is unlikely that the prices paid for the missing data source in Colorado were materially different from other data sources included in this study from the same state.
Colorado usually updates its fee schedule for professional services annually in January. The most recent update covered in the study period in this report was effective January 1, 2019. In January 2016, Colorado revised its fee schedule for professional services and incorporated the use of relative values from the National Physician Fee Schedule Relative Value Scale file (RBRVS) published by Medicare in January 2015. Previously, Colorado based its fee schedule levels on relative value units (RVUs) from the Relative Values for Physicians, currently published by OPTUM360°.
Key: RBRVS: resource-based relative value scale (Medicare).
Colorado
State average annual change in prices paid for professional services
Median annual change for fee schedule states
Median annual change for non-fee schedule states
Figure B.5 Colorado Trends in Prices Paid for Professional Services, WCRI MPI-WC, 2008 to 2019
pppppppppppppppp
p
CO
70
80
90
100
110
120
130
140
150
2008 2009 2010 2011 2012 2013 2014 2015 2016 2017 2018 2019
Ind
ex o
f P
rice
s P
aid
(b
ase
year
is 2
00
8=
10
0)
Calendar Year 2008 Is the Base Year for Index
Colorado (fee schedule state) Median of States with Fee Schedules Median of States without Fee Schedules
p
CO
70
80
90
100
110
120
130
140
150
2008 2009 2010 2011 2012 2013 2014 2015 2016 2017 2018 2019
Ind
ex o
f P
rice
s P
aid
(b
ase
year
is 2
00
8=
10
0)
Calendar Year 2008 Is the Base Year for Index
Colorado Other Study States
p
p
copyright © 2020 workers compensation research institute75
_____________________________________________________________________________________________W C R I M E D I C A L P R I C E I N D E X F O R W O R K E R S ' C O M P E N S A T I O N , 1 2 T H E D I T I O N ( M P I - W C )

2008 to 2009
2009 to 2010
2010 to 2011
2011 to 2012
2012 to 2013
2013 to 2014
2014 to 2015
2015 to 2016
2016 to 2017
2017 to 2018
2018 to 2019
3% 2% 3% -1% -2% 0% 0% 0% 0% 0% 0%
2% 2% 1% 0% 0% 0% 0% 0% 1% 0% 1%
6% 4% 2% 3% -1% 5% 2% 3% 4% 2% 2%
Figure B.6 Connecticut Trends in Prices Paid for Professional Services, WCRI MPI-WC, 2008 to 2019
Special notation: p We use the notation p to indicate that the 2019 numbers are preliminary results based on half-year price data through June 30, 2019. Note that the trend lines for the median of states with fee schedules and the median of states without fee schedules represent the median rates of growth of prices paid among states with and without fee schedules from year to year.
Notes: Connecticut has updated its fee schedule for professional services annually in July since 2008. The most recent update covered during the study period in this report was the 2018 Official Connecticut Practitioner Fee Schedule effective July 15, 2018.
Connecticut
State average annual change in prices paid for professional services
Median annual change for fee schedule states
Median annual change for non-fee schedule states
p
p
pp
p
pp
p
pp
p
pp
p
pp
p
pp
p
pp
CT
70
80
90
100
110
120
130
140
150
2008 2009 2010 2011 2012 2013 2014 2015 2016 2017 2018 2019
Ind
ex o
f P
rice
s P
aid
(b
ase
year
is 2
00
8=
10
0)
Calendar Year 2008 Is the Base Year for Index
Connecticut (fee schedule state) Median of States with Fee Schedules Median of States without Fee Schedules
p
CT
70
80
90
100
110
120
130
140
150
2008 2009 2010 2011 2012 2013 2014 2015 2016 2017 2018 2019
Ind
ex o
f P
rice
s P
aid
(b
ase
year
is 2
00
8=
10
0)
Calendar Year 2008 Is the Base Year for Index
Connecticut Other Study States
p
p
copyright © 2020 workers compensation research institute76
_____________________________________________________________________________________________W C R I M E D I C A L P R I C E I N D E X F O R W O R K E R S ' C O M P E N S A T I O N , 1 2 T H E D I T I O N ( M P I - W C )

2008 to 2009
2009 to 2010
2010 to 2011
2011 to 2012
2012 to 2013
2013 to 2014
2014 to 2015
2015 to 2016
2016 to 2017
2017 to 2018
2018 to 2019
4% 0% -2% 0% -1% 1% -1% 4% 5% -1% 1%
2% 2% 1% 0% 0% 0% 0% 0% 1% 0% 1%
6% 4% 2% 3% -1% 5% 2% 3% 4% 2% 2%
Figure B.7 Florida Trends in Prices Paid for Professional Services, WCRI MPI-WC, 2008 to 2019
Special notation: p We use the notation p to indicate that the 2019 numbers are preliminary results based on half-year price data through June 30, 2019. Note that the trend lines for the median of states with fee schedules and the median of states without fee schedules represent the median rates of growth of prices paid among states with and without fee schedules from year to year.
Notes: Florida implemented a fee schedule update effective July 1, 2016 (i.e., the 2015 edition of the Florida workers’ compensation health care provider reimbursement manual). The updated fee schedule rates reflected the 2014 Medicare rates in the maximum allowable reimbursement (MAR) computation. Before this change, the fee schedule rates in Florida were set at 140 percent of the 2008 Medicare rates for surgeries and 110 percent of the 2008 Medicare rates for other professional services. Effective July 1, 2017, Florida implemented another update to its medical fee schedule for professional services (i.e., the 2016 edition of the Florida workers' compensation health care provider reimbursement manual); this most recent update covered in the study period was not expected to have a material impact on the system costs. As shown in this figure, the overall prices paid for professional services in Florida increased 8 percent from 2015 to 2018 following these two fee schedule updates. For different types of services, prices paid in Florida increased for some service groups and decreased or remained stable for others following this fee schedule change (see Figure C.6).
Florida
State average annual change in prices paid for professional services
Median annual change for fee schedule states
Median annual change for non-fee schedule states
p
p
pp
p
pp
p
pp
p
pp
p
pp
p
pp
p
pp
FL
70
80
90
100
110
120
130
140
150
2008 2009 2010 2011 2012 2013 2014 2015 2016 2017 2018 2019
Ind
ex o
f P
rice
s P
aid
(b
ase
year
is 2
00
8=
10
0)
Calendar Year 2008 Is the Base Year for Index
Florida (fee schedule state) Median of States with Fee Schedules Median of States without Fee Schedules
p
FL
70
80
90
100
110
120
130
140
150
2008 2009 2010 2011 2012 2013 2014 2015 2016 2017 2018 2019
Ind
ex o
f P
rice
s P
aid
(b
ase
year
is 2
00
8=
10
0)
Calendar Year 2008 Is the Base Year for Index
Florida Other Study States
p
p
copyright © 2020 workers compensation research institute77
_____________________________________________________________________________________________W C R I M E D I C A L P R I C E I N D E X F O R W O R K E R S ' C O M P E N S A T I O N , 1 2 T H E D I T I O N ( M P I - W C )

2008 to 2009
2009 to 2010
2010 to 2011
2011 to 2012
2012 to 2013
2013 to 2014
2014 to 2015
2015 to 2016
2016 to 2017
2017 to 2018
2018 to 2019
3% 4% 9% 5% 0% 0% 0% 1% 1% 0% 0%
2% 2% 1% 0% 0% 0% 0% 0% 1% 0% 1%
6% 4% 2% 3% -1% 5% 2% 3% 4% 2% 2%
Figure B.8 Georgia Trends in Prices Paid for Professional Services, WCRI MPI-WC, 2008 to 2019
Special notation: p We use the notation p to indicate that the 2019 numbers are preliminary results based on half-year price data through June 30, 2019. Note that the trend lines for the median of states with fee schedules and the median of states without fee schedules represent the median rates of growth of prices paid among states with and without fee schedules from year to year.
Notes: Georgia typically updates its fee schedule for professional services annually in April. The most recent update within the study period in this report was effective April 1, 2019; the half-year price data through June 2019 in this edition reflect only two months of experience after this fee schedule update.
Georgia
State average annual change in prices paid for professional services
Median annual change for fee schedule states
Median annual change for non-fee schedule states
p
p
pp
p
pp
p
pp
p
pp
p
pp
p
pp
p
pp
p
pp
p
pp
p
pp
p
pp
p
pp
p
pp
p
pp
p
pp
GA
70
80
90
100
110
120
130
140
150
2008 2009 2010 2011 2012 2013 2014 2015 2016 2017 2018 2019
Ind
ex o
f P
rice
s P
aid
(b
ase
year
is 2
00
8=
10
0)
Calendar Year 2008 Is the Base Year for Index
Georgia (fee schedule state) Median of States with Fee Schedules Median of States without Fee Schedules
p
GA
70
80
90
100
110
120
130
140
150
2008 2009 2010 2011 2012 2013 2014 2015 2016 2017 2018 2019
Ind
ex o
f P
rice
s P
aid
(b
ase
year
is 2
00
8=
10
0)
Calendar Year 2008 Is the Base Year for Index
Georgia Other Study States
p
p
copyright © 2020 workers compensation research institute78
_____________________________________________________________________________________________W C R I M E D I C A L P R I C E I N D E X F O R W O R K E R S ' C O M P E N S A T I O N , 1 2 T H E D I T I O N ( M P I - W C )

2008 to 2009
2009 to 2010
2010 to 2011
2011 to 2012
2012 to 2013
2013 to 2014
2014 to 2015
2015 to 2016
2016 to 2017
2017 to 2018
2018 to 2019
5% 2% 3% -1% -2% 1% 0% 3% 1% 5% 1%
2% 2% 1% 0% 0% 0% 0% 0% 1% 0% 1%
6% 4% 2% 3% -1% 5% 2% 3% 4% 2% 2%
Figure B.9 Iowa Trends in Prices Paid for Professional Services, WCRI MPI-WC, 2008 to 2019
Special notation: p We use the notation p to indicate that the 2019 numbers are preliminary results based on half-year price data through June 30, 2019. Note that the trend lines for the median of states with fee schedules and the median of states without fee schedules represent the median rates of growth of prices paid among states with and without fee schedules from year to year.
Note: Iowa did not have a workers' compensation fee schedule as of 2019.
Iowa
State average annual change in prices paid for professional services
Median annual change for fee schedule states
Median annual change for non-fee schedule states
pppppppppppppppp
p
IA
70
80
90
100
110
120
130
140
150
2008 2009 2010 2011 2012 2013 2014 2015 2016 2017 2018 2019
Ind
ex o
f P
rice
s P
aid
(b
ase
year
is 2
00
8=
10
0)
Calendar Year 2008 Is the Base Year for Index
Iowa (non-fee schedule state) Median of States with Fee Schedules Median of States without Fee Schedules
p
IA
70
80
90
100
110
120
130
140
150
2008 2009 2010 2011 2012 2013 2014 2015 2016 2017 2018 2019
Ind
ex o
f P
rice
s P
aid
(b
ase
year
is 2
00
8=
10
0)
Calendar Year 2008 Is the Base Year for Index
Iowa Other Study States
p
p
copyright © 2020 workers compensation research institute79
_____________________________________________________________________________________________W C R I M E D I C A L P R I C E I N D E X F O R W O R K E R S ' C O M P E N S A T I O N , 1 2 T H E D I T I O N ( M P I - W C )
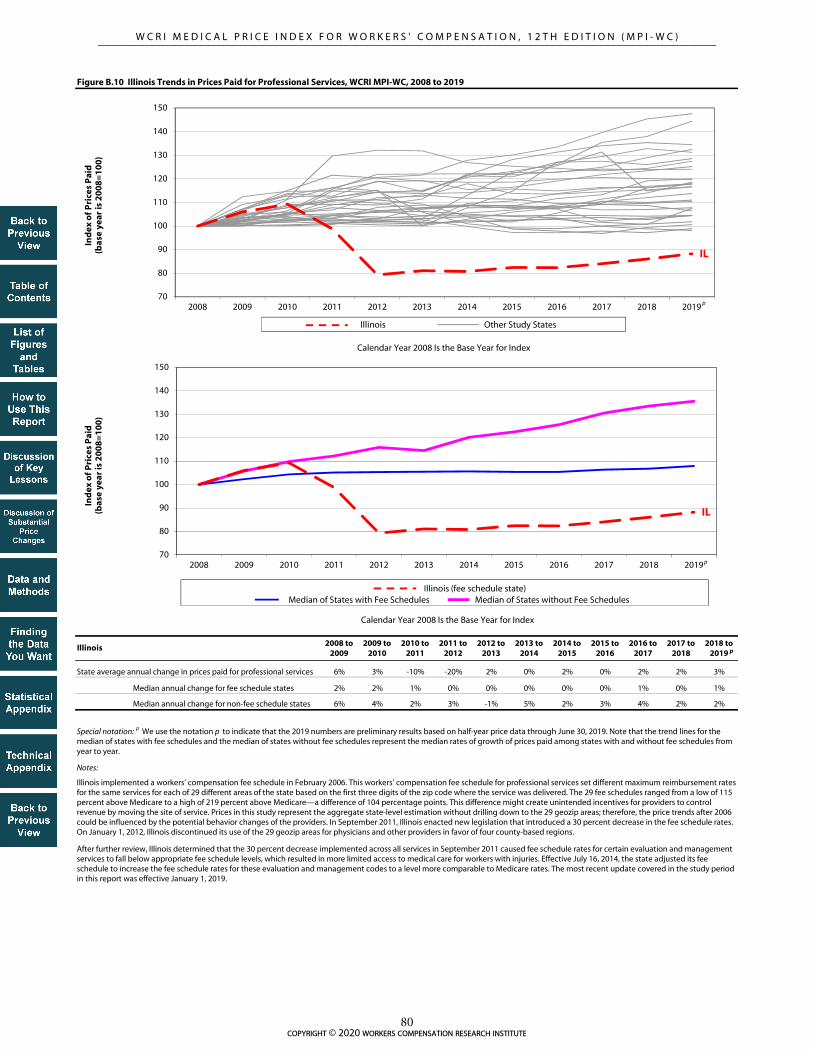
2008 to 2009
2009 to 2010
2010 to 2011
2011 to 2012
2012 to 2013
2013 to 2014
2014 to 2015
2015 to 2016
2016 to 2017
2017 to 2018
2018 to 2019
6% 3% -10% -20% 2% 0% 2% 0% 2% 2% 3%
2% 2% 1% 0% 0% 0% 0% 0% 1% 0% 1%
6% 4% 2% 3% -1% 5% 2% 3% 4% 2% 2%
Figure B.10 Illinois Trends in Prices Paid for Professional Services, WCRI MPI-WC, 2008 to 2019
Special notation: p We use the notation p to indicate that the 2019 numbers are preliminary results based on half-year price data through June 30, 2019. Note that the trend lines for the median of states with fee schedules and the median of states without fee schedules represent the median rates of growth of prices paid among states with and without fee schedules from year to year.
Notes:
Illinois implemented a workers’ compensation fee schedule in February 2006. This workers' compensation fee schedule for professional services set different maximum reimbursement rates for the same services for each of 29 different areas of the state based on the first three digits of the zip code where the service was delivered. The 29 fee schedules ranged from a low of 115 percent above Medicare to a high of 219 percent above Medicare—a difference of 104 percentage points. This difference might create unintended incentives for providers to control revenue by moving the site of service. Prices in this study represent the aggregate state-level estimation without drilling down to the 29 geozip areas; therefore, the price trends after 2006 could be influenced by the potential behavior changes of the providers. In September 2011, Illinois enacted new legislation that introduced a 30 percent decrease in the fee schedule rates. On January 1, 2012, Illinois discontinued its use of the 29 geozip areas for physicians and other providers in favor of four county-based regions.
After further review, Illinois determined that the 30 percent decrease implemented across all services in September 2011 caused fee schedule rates for certain evaluation and management services to fall below appropriate fee schedule levels, which resulted in more limited access to medical care for workers with injuries. Effective July 16, 2014, the state adjusted its fee schedule to increase the fee schedule rates for these evaluation and management codes to a level more comparable to Medicare rates. The most recent update covered in the study period in this report was effective January 1, 2019.
Illinois
State average annual change in prices paid for professional services
Median annual change for fee schedule states
Median annual change for non-fee schedule states
pppppppppppppppp
p
IL
70
80
90
100
110
120
130
140
150
2008 2009 2010 2011 2012 2013 2014 2015 2016 2017 2018 2019
Ind
ex o
f P
rice
s P
aid
(b
ase
year
is 2
00
8=
10
0)
Calendar Year 2008 Is the Base Year for Index
Illinois (fee schedule state) Median of States with Fee Schedules Median of States without Fee Schedules
IL
70
80
90
100
110
120
130
140
150
2008 2009 2010 2011 2012 2013 2014 2015 2016 2017 2018 2019
Ind
ex o
f P
rice
s P
aid
(b
ase
year
is 2
00
8=
10
0)
Calendar Year 2008 Is the Base Year for Index
Illinois Other Study States
p
p
p
copyright © 2020 workers compensation research institute80
_____________________________________________________________________________________________W C R I M E D I C A L P R I C E I N D E X F O R W O R K E R S ' C O M P E N S A T I O N , 1 2 T H E D I T I O N ( M P I - W C )

2008 to 2009
2009 to 2010
2010 to 2011
2011 to 2012
2012 to 2013
2013 to 2014
2014 to 2015
2015 to 2016
2016 to 2017
2017 to 2018
2018 to 2019
7% 6% -1% 6% -4% 6% 5% 2% 2% 1% -1%
2% 2% 1% 0% 0% 0% 0% 0% 1% 0% 1%
6% 4% 2% 3% -1% 5% 2% 3% 4% 2% 2%
Figure B.11 Indiana Trends in Prices Paid for Professional Services, WCRI MPI-WC, 2008 to 2019
Special notation: p We use the notation p to indicate that the 2019 numbers are preliminary results based on half-year price data through June 30, 2019. Note that the trend lines for the median of states with fee schedules and the median of states without fee schedules represent the median rates of growth of prices paid among states with and without fee schedules from year to year.
Note: Indiana did not have a workers' compensation fee schedule as of 2019.
Indiana
State average annual change in prices paid for professional services
Median annual change for fee schedule states
Median annual change for non-fee schedule states
pppppppppppppppp
p
IN
70
80
90
100
110
120
130
140
150
2008 2009 2010 2011 2012 2013 2014 2015 2016 2017 2018 2019
Ind
ex o
f P
rice
s P
aid
(b
ase
year
is 2
00
8=
10
0)
Calendar Year 2008 Is the Base Year for Index
Indiana (non-fee schedule state) Median of States with Fee Schedules Median of States without Fee Schedules
IN
70
80
90
100
110
120
130
140
150
2008 2009 2010 2011 2012 2013 2014 2015 2016 2017 2018 2019
Ind
ex o
f P
rice
s P
aid
(b
ase
year
is 2
00
8=
10
0)
Calendar Year 2008 Is the Base Year for Index
Indiana Other Study States
p
p
p
copyright © 2020 workers compensation research institute81
_____________________________________________________________________________________________W C R I M E D I C A L P R I C E I N D E X F O R W O R K E R S ' C O M P E N S A T I O N , 1 2 T H E D I T I O N ( M P I - W C )

2008 to 2009
2009 to 2010
2010 to 2011
2011 to 2012
2012 to 2013
2013 to 2014
2014 to 2015
2015 to 2016
2016 to 2017
2017 to 2018
2018 to 2019
2% 3% 1% 5% 0% 5% -3% 0% 1% 1% 1%
2% 2% 1% 0% 0% 0% 0% 0% 1% 0% 1%
6% 4% 2% 3% -1% 5% 2% 3% 4% 2% 2%
Figure B.12 Kansas Trends in Prices Paid for Professional Services, WCRI MPI-WC, 2008 to 2019
Special notation: p We use the notation p to indicate that the 2019 numbers are preliminary results based on half-year price data through June 30, 2019. Note that the trend lines for the median of states with fee schedules and the median of states without fee schedules represent the median rates of growth of prices paid among states with and without fee schedules from year to year.
Notes: Kansas typically updates its fee schedule for professional services either annually or biennially in January. The most recent update covered in the study period in this report was effective March 29, 2019.
Kansas
State average annual change in prices paid for professional services
Median annual change for fee schedule states
Median annual change for non-fee schedule states
pppppppppppppppp
p
KS
70
80
90
100
110
120
130
140
150
2008 2009 2010 2011 2012 2013 2014 2015 2016 2017 2018 2019
Ind
ex o
f P
rice
s P
aid
(b
ase
year
is 2
00
8=
10
0)
Calendar Year 2008 Is the Base Year for Index
Kansas (fee schedule state) Median of States with Fee Schedules Median of States without Fee Schedules
KS
70
80
90
100
110
120
130
140
150
2008 2009 2010 2011 2012 2013 2014 2015 2016 2017 2018 2019
Ind
ex o
f P
rice
s P
aid
(b
ase
year
is 2
00
8=
10
0)
Calendar Year 2008 Is the Base Year for Index
Kansas Other Study States
p
p
p
copyright © 2020 workers compensation research institute82
_____________________________________________________________________________________________W C R I M E D I C A L P R I C E I N D E X F O R W O R K E R S ' C O M P E N S A T I O N , 1 2 T H E D I T I O N ( M P I - W C )

2008 to 2009
2009 to 2010
2010 to 2011
2011 to 2012
2012 to 2013
2013 to 2014
2014 to 2015
2015 to 2016
2016 to 2017
2017 to 2018
2018 to 2019
2% 0% 3% -1% -1% 10% 9% 0% 2% 3% 3%
2% 2% 1% 0% 0% 0% 0% 0% 1% 0% 1%
6% 4% 2% 3% -1% 5% 2% 3% 4% 2% 2%
Figure B.13 Kentucky Trends in Prices Paid for Professional Services, WCRI MPI-WC, 2008 to 2019
Special notation: p We use the notation p to indicate that the 2019 numbers are preliminary results based on half-year price data through June 30, 2019. Note that the trend lines for the median of states with fee schedules and the median of states without fee schedules represent the median rates of growth of prices paid among states with and without fee schedules from year to year.
Notes: Kentucky periodically updates its fee schedule for professional services, typically every two to three years. Effective June 6, 2014, Kentucky discontinued the use of relative values from Medicare's resource-based relative value scale (RBRVS) for its professional fee schedule and transitioned to using state-specific relative values based on historic data from FAIR Health commercial database values. The most recent fee schedule update covered in the study period in this report was effective July 1, 2018. As this figure shows, the average overall price for professional services increased 6 percent between 2017 and 2019, following this fee schedule update. Price growth was observed for most types of professional services in Kentucky (see Figure C.12). With data through June 2019, results shown in this edition reflect a full year of experience after the July 2018 fee schedule update in this state.
Kentucky
State average annual change in prices paid for professional services
Median annual change for fee schedule states
Median annual change for non-fee schedule states
pppppppppppppppp
p
KY
70
80
90
100
110
120
130
140
150
2008 2009 2010 2011 2012 2013 2014 2015 2016 2017 2018 2019
Ind
ex o
f P
rice
s P
aid
(b
ase
year
is 2
00
8=
10
0)
Calendar Year 2008 Is the Base Year for Index
Kentucky (fee schedule state) Median of States with Fee Schedules Median of States without Fee Schedules
KY
70
80
90
100
110
120
130
140
150
2008 2009 2010 2011 2012 2013 2014 2015 2016 2017 2018 2019
Ind
ex o
f P
rice
s P
aid
(b
ase
year
is 2
00
8=
10
0)
Calendar Year 2008 Is the Base Year for Index
Kentucky Other Study States
p
p
p
copyright © 2020 workers compensation research institute83
_____________________________________________________________________________________________W C R I M E D I C A L P R I C E I N D E X F O R W O R K E R S ' C O M P E N S A T I O N , 1 2 T H E D I T I O N ( M P I - W C )

2008 to 2009
2009 to 2010
2010 to 2011
2011 to 2012
2012 to 2013
2013 to 2014
2014 to 2015
2015 to 2016
2016 to 2017
2017 to 2018
2018 to 2019
4% 1% 0% 1% 1% 1% 0% 0% -1% 0% 1%
2% 2% 1% 0% 0% 0% 0% 0% 1% 0% 1%
6% 4% 2% 3% -1% 5% 2% 3% 4% 2% 2%
Figure B.14 Louisiana Trends in Prices Paid for Professional Services, WCRI MPI-WC, 2008 to 2019
Special notation: p We use the notation p to indicate that the 2019 numbers are preliminary results based on half-year price data through June 30, 2019. Note that the trend lines for the median of states with fee schedules and the median of states without fee schedules represent the median rates of growth of prices paid among states with and without fee schedules from year to year.
Notes: Louisiana's fee schedule for professional services uses the 1999 CPT list published by the American Medical Association and the maximum allowable reimbursement rates effective as of March 2001. Effective July 20, 2013, Louisiana updated its fee schedule using the 2012 CPT list. Maximum allowable reimbursement rates were added for new or revised codes; however, the fee schedule rates for the existing codes appeared to remain at the March 2001 rates. The state-specific codes relating to physical and occupational therapies were discontinued in favor of national CPT codes. Effective June 20, 2016, Louisiana made further updates to its fee schedule to account for some CPT codes that were inadvertently omitted in a February 2014 update.
Key: CPT: Current Procedural Terminology.
Louisiana
State average annual change in prices paid for professional services
Median annual change for fee schedule states
Median annual change for non-fee schedule states
pppppppppppppppp
p
LA
70
80
90
100
110
120
130
140
150
2008 2009 2010 2011 2012 2013 2014 2015 2016 2017 2018 2019
Ind
ex o
f P
rice
s P
aid
(b
ase
year
is 2
00
8=
10
0)
Calendar Year 2008 Is the Base Year for Index
Louisiana (fee schedule state) Median of States with Fee Schedules Median of States without Fee Schedules
LA
70
80
90
100
110
120
130
140
150
2008 2009 2010 2011 2012 2013 2014 2015 2016 2017 2018 2019
Ind
ex o
f P
rice
s P
aid
(b
ase
year
is 2
00
8=
10
0)
Calendar Year 2008 Is the Base Year for Index
Louisiana Other Study States
p
p
p
copyright © 2020 workers compensation research institute84
_____________________________________________________________________________________________W C R I M E D I C A L P R I C E I N D E X F O R W O R K E R S ' C O M P E N S A T I O N , 1 2 T H E D I T I O N ( M P I - W C )
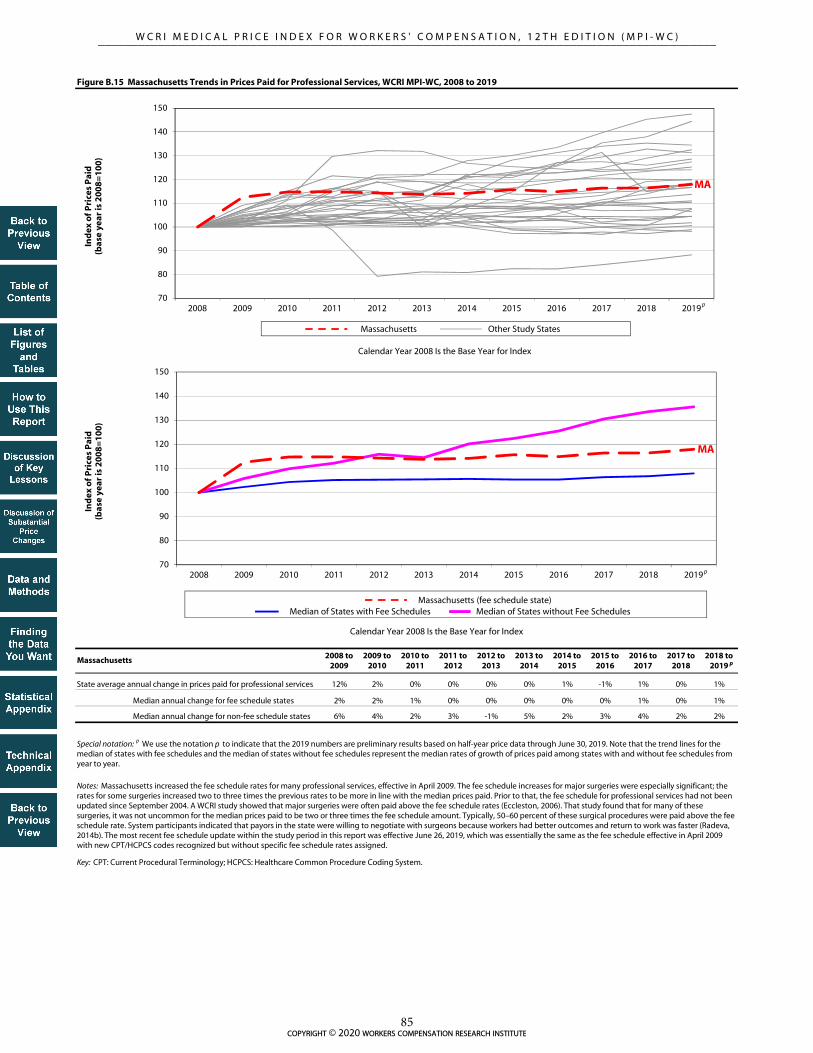
2008 to 2009
2009 to 2010
2010 to 2011
2011 to 2012
2012 to 2013
2013 to 2014
2014 to 2015
2015 to 2016
2016 to 2017
2017 to 2018
2018 to 2019
12% 2% 0% 0% 0% 0% 1% -1% 1% 0% 1%
2% 2% 1% 0% 0% 0% 0% 0% 1% 0% 1%
6% 4% 2% 3% -1% 5% 2% 3% 4% 2% 2%
Key: CPT: Current Procedural Terminology; HCPCS: Healthcare Common Procedure Coding System.
Figure B.15 Massachusetts Trends in Prices Paid for Professional Services, WCRI MPI-WC, 2008 to 2019
Special notation: p We use the notation p to indicate that the 2019 numbers are preliminary results based on half-year price data through June 30, 2019. Note that the trend lines for the median of states with fee schedules and the median of states without fee schedules represent the median rates of growth of prices paid among states with and without fee schedules from year to year.
Notes: Massachusetts increased the fee schedule rates for many professional services, effective in April 2009. The fee schedule increases for major surgeries were especially significant; the rates for some surgeries increased two to three times the previous rates to be more in line with the median prices paid. Prior to that, the fee schedule for professional services had not been updated since September 2004. A WCRI study showed that major surgeries were often paid above the fee schedule rates (Eccleston, 2006). That study found that for many of these surgeries, it was not uncommon for the median prices paid to be two or three times the fee schedule amount. Typically, 50–60 percent of these surgical procedures were paid above the fee schedule rate. System participants indicated that payors in the state were willing to negotiate with surgeons because workers had better outcomes and return to work was faster (Radeva, 2014b). The most recent fee schedule update within the study period in this report was effective June 26, 2019, which was essentially the same as the fee schedule effective in April 2009 with new CPT/HCPCS codes recognized but without specific fee schedule rates assigned.
Massachusetts
State average annual change in prices paid for professional services
Median annual change for fee schedule states
Median annual change for non-fee schedule states
pppppppppppppppp
p
MA
70
80
90
100
110
120
130
140
150
2008 2009 2010 2011 2012 2013 2014 2015 2016 2017 2018 2019
Ind
ex o
f P
rice
s P
aid
(b
ase
year
is 2
00
8=
10
0)
Calendar Year 2008 Is the Base Year for Index
Massachusetts (fee schedule state) Median of States with Fee Schedules Median of States without Fee Schedules
MA
70
80
90
100
110
120
130
140
150
2008 2009 2010 2011 2012 2013 2014 2015 2016 2017 2018 2019
Ind
ex o
f P
rice
s P
aid
(b
ase
year
is 2
00
8=
10
0)
Calendar Year 2008 Is the Base Year for Index
Massachusetts Other Study States
p
p
p
copyright © 2020 workers compensation research institute85
_____________________________________________________________________________________________W C R I M E D I C A L P R I C E I N D E X F O R W O R K E R S ' C O M P E N S A T I O N , 1 2 T H E D I T I O N ( M P I - W C )

2008 to 2009
2009 to 2010
2010 to 2011
2011 to 2012
2012 to 2013
2013 to 2014
2014 to 2015
2015 to 2016
2016 to 2017
2017 to 2018
2018 to 2019
2% 3% 9% 3% 0% -3% 1% 2% 2% 1% 1%
2% 2% 1% 0% 0% 0% 0% 0% 1% 0% 1%
6% 4% 2% 3% -1% 5% 2% 3% 4% 2% 2%
Figure B.16 Maryland Trends in Prices Paid for Professional Services, WCRI MPI-WC, 2008 to 2019
Special notation: p We use the notation p to indicate that the 2019 numbers are preliminary results based on half-year price data through June 30, 2019. Note that the trend lines for the median of states with fee schedules and the median of states without fee schedules represent the median rates of growth of prices paid among states with and without fee schedules from year to year.
Notes:
The data for Maryland are not necessarily representative because they are missing data from a larger data source that is significant in this state. The results in Maryland are unlikely to be significantly under- or overestimated, given that the state uses a fee schedule to regulate the payment for professional services, and it is unlikely that the prices paid for the missing data source in Maryland were materially different from other data sources included in this study from the same state.
Starting in March 2008, Maryland implemented annual increases to its fee schedule rates for professional services based on changes in the Medicare Economic Index. The most recent update covered during the study period in this report became effective January 1, 2019.
Maryland
State average annual change in prices paid for professional services
Median annual change for fee schedule states
Median annual change for non-fee schedule states
pppppppppppppppp
p
MD
70
80
90
100
110
120
130
140
150
2008 2009 2010 2011 2012 2013 2014 2015 2016 2017 2018 2019
Ind
ex o
f P
rice
s P
aid
(b
ase
year
is 2
00
8=
10
0)
Calendar Year 2008 Is the Base Year for Index
Maryland (fee schedule state) Median of States with Fee Schedules Median of States without Fee Schedules
MD
70
80
90
100
110
120
130
140
150
2008 2009 2010 2011 2012 2013 2014 2015 2016 2017 2018 2019
Ind
ex o
f P
rice
s P
aid
(b
ase
year
is 2
00
8=
10
0)
Calendar Year 2008 Is the Base Year for Index
Maryland Other Study States
p
p
p
copyright © 2020 workers compensation research institute86
_____________________________________________________________________________________________W C R I M E D I C A L P R I C E I N D E X F O R W O R K E R S ' C O M P E N S A T I O N , 1 2 T H E D I T I O N ( M P I - W C )

2008 to 2009
2009 to 2010
2010 to 2011
2011 to 2012
2012 to 2013
2013 to 2014
2014 to 2015
2015 to 2016
2016 to 2017
2017 to 2018
2018 to 2019
1% 1% 0% 0% 1% 1% -5% -1% -1% 3% 1%
2% 2% 1% 0% 0% 0% 0% 0% 1% 0% 1%
6% 4% 2% 3% -1% 5% 2% 3% 4% 2% 2%
Figure B.17 Michigan Trends in Prices Paid for Professional Services, WCRI MPI-WC, 2008 to 2019
Special notation: p We use the notation p to indicate that the 2019 numbers are preliminary results based on half-year price data through June 30, 2019. Note that the trend lines for the median of states with fee schedules and the median of states without fee schedules represent the median rates of growth of prices paid among states with and without fee schedules from year to year.
Notes: Michigan typically updates its fee schedule for professional services annually. The most recent update covered in the study period in this report was effective January 1, 2019.
Michigan
State average annual change in prices paid for professional services
Median annual change for fee schedule states
Median annual change for non-fee schedule states
pppppppppppppppp
p
100 MI
70
80
90
100
110
120
130
140
150
2008 2009 2010 2011 2012 2013 2014 2015 2016 2017 2018 2019
Ind
ex o
f P
rice
s P
aid
(b
ase
year
is 2
00
8=
10
0)
Calendar Year 2008 Is the Base Year for Index
Michigan (fee schedule state) Median of States with Fee Schedules Median of States without Fee Schedules
MI
70
80
90
100
110
120
130
140
150
2008 2009 2010 2011 2012 2013 2014 2015 2016 2017 2018 2019
Ind
ex o
f P
rice
s P
aid
(b
ase
year
is 2
00
8=
10
0)
Calendar Year 2008 Is the Base Year for Index
Michigan Other Study States
p
p
p
copyright © 2020 workers compensation research institute87
_____________________________________________________________________________________________W C R I M E D I C A L P R I C E I N D E X F O R W O R K E R S ' C O M P E N S A T I O N , 1 2 T H E D I T I O N ( M P I - W C )

2008 to 2009
2009 to 2010
2010 to 2011
2011 to 2012
2012 to 2013
2013 to 2014
2014 to 2015
2015 to 2016
2016 to 2017
2017 to 2018
2018 to 2019
5% 1% -3% 3% 1% 1% 0% -1% 2% 0% 1%
2% 2% 1% 0% 0% 0% 0% 0% 1% 0% 1%
6% 4% 2% 3% -1% 5% 2% 3% 4% 2% 2%
Figure B.18 Minnesota Trends in Prices Paid for Professional Services, WCRI MPI-WC, 2008 to 2019
Special notation: p We use the notation p to indicate that the 2019 numbers are preliminary results based on half-year price data through June 30, 2019. Note that the trend lines for the median of states with fee schedules and the median of states without fee schedules represent the median rates of growth of prices paid among states with and without fee schedules from year to year.
Notes: Minnesota's fee schedule for professional services from 2002 to September 2010 was based on 1998 Medicare relative value units (RVUs), with annual updates to the conversion factor. Effective October 1, 2010, Minnesota updated its fee schedule by using 2009 Medicare RVUs and decreasing the state conversion factor. The most recent update covered in the study period in this report was effective October 1, 2018, and is based on 2018 Medicare RVUs.
Minnesota
State average annual change in prices paid for professional services
Median annual change for fee schedule states
Median annual change for non-fee schedule states
pppppppppppppppp
p
MN
70
80
90
100
110
120
130
140
150
2008 2009 2010 2011 2012 2013 2014 2015 2016 2017 2018 2019
Ind
ex o
f P
rice
s P
aid
(b
ase
year
is 2
00
8=
10
0)
Calendar Year 2008 Is the Base Year for Index
Minnesota (fee schedule state) Median of States with Fee Schedules Median of States without Fee Schedules
MN
70
80
90
100
110
120
130
140
150
2008 2009 2010 2011 2012 2013 2014 2015 2016 2017 2018 2019
Ind
ex o
f P
rice
s P
aid
(b
ase
year
is 2
00
8=
10
0)
Calendar Year 2008 Is the Base Year for Index
Minnesota Other Study States
p
p
p
copyright © 2020 workers compensation research institute88
_____________________________________________________________________________________________W C R I M E D I C A L P R I C E I N D E X F O R W O R K E R S ' C O M P E N S A T I O N , 1 2 T H E D I T I O N ( M P I - W C )

2008 to 2009
2009 to 2010
2010 to 2011
2011 to 2012
2012 to 2013
2013 to 2014
2014 to 2015
2015 to 2016
2016 to 2017
2017 to 2018
2018 to 2019
9% 3% 0% 2% 1% 5% 2% 2% 7% 2% 5%
2% 2% 1% 0% 0% 0% 0% 0% 1% 0% 1%
6% 4% 2% 3% -1% 5% 2% 3% 4% 2% 2%
Figure B.19 Missouri Trends in Prices Paid for Professional Services, WCRI MPI-WC, 2008 to 2019
Special notation: p We use the notation p to indicate that the 2019 numbers are preliminary results based on half-year price data through June 30, 2019. Note that the trend lines for the median of states with fee schedules and the median of states without fee schedules represent the median rates of growth of prices paid among states with and without fee schedules from year to year.
Notes:
The data for Missouri are not necessarily representative because the state is missing data from a larger data source that is significant in the state. To the extent that prices paid may differ for the missing data source compared with other data sources in the state, this may lead to under- or overestimations in the results.
Missouri did not have a workers' compensation fee schedule as of 2019.
Missouri
State average annual change in prices paid for professional services
Median annual change for fee schedule states
Median annual change for non-fee schedule states
pppppppppppppppp
p
MO
70
80
90
100
110
120
130
140
150
2008 2009 2010 2011 2012 2013 2014 2015 2016 2017 2018 2019
Ind
ex o
f P
rice
s P
aid
(b
ase
year
is 2
00
8=
10
0)
Calendar Year 2008 Is the Base Year for Index
Missouri (non-fee schedule state) Median of States with Fee Schedules Median of States without Fee Schedules
MO
70
80
90
100
110
120
130
140
150
2008 2009 2010 2011 2012 2013 2014 2015 2016 2017 2018 2019
Ind
ex o
f P
rice
s P
aid
(b
ase
year
is 2
00
8=
10
0)
Calendar Year 2008 Is the Base Year for Index
Missouri Other Study States
p
p
p
copyright © 2020 workers compensation research institute89
_____________________________________________________________________________________________W C R I M E D I C A L P R I C E I N D E X F O R W O R K E R S ' C O M P E N S A T I O N , 1 2 T H E D I T I O N ( M P I - W C )

2008 to 2009
2009 to 2010
2010 to 2011
2011 to 2012
2012 to 2013
2013 to 2014
2014 to 2015
2015 to 2016
2016 to 2017
2017 to 2018
2018 to 2019
1% 1% -1% -1% 0% 8% 0% -1% -5% 1% 1%
2% 2% 1% 0% 0% 0% 0% 0% 1% 0% 1%
6% 4% 2% 3% -1% 5% 2% 3% 4% 2% 2%
Figure B.20 Mississippi Trends in Prices Paid for Professional Services, WCRI MPI-WC, 2008 to 2019
Special notation: p We use the notation p to indicate that the 2019 numbers are preliminary results based on half-year price data through June 30, 2019. Note that the trend lines for the median of states with fee schedules and the median of states without fee schedules represent the median rates of growth of prices paid among states with and without fee schedules from year to year.
Notes: Mississippi updates its fee schedule for professional services periodically every few years. The most recent fee schedule update within the study period in this report occurred on June 15, 2019. Data in this report include prices through June 30, 2019, primarily reflecting experience before the fee schedule update effective June 15, 2019.
Mississippi
State average annual change in prices paid for professional services
Median annual change for fee schedule states
Median annual change for non-fee schedule states
pppppppppppppppp
p
MS
70
80
90
100
110
120
130
140
150
2008 2009 2010 2011 2012 2013 2014 2015 2016 2017 2018 2019
Ind
ex o
f P
rice
s P
aid
(b
ase
year
is 2
00
8=
10
0)
Calendar Year 2008 Is the Base Year for Index
Mississippi (fee schedule state) Median of States with Fee Schedules Median of States without Fee Schedules
MS
70
80
90
100
110
120
130
140
150
2008 2009 2010 2011 2012 2013 2014 2015 2016 2017 2018 2019
Ind
ex o
f P
rice
s P
aid
(b
ase
year
is 2
00
8=
10
0)
Calendar Year 2008 Is the Base Year for Index
Mississippi Other Study States
p
p
p
copyright © 2020 workers compensation research institute90
_____________________________________________________________________________________________W C R I M E D I C A L P R I C E I N D E X F O R W O R K E R S ' C O M P E N S A T I O N , 1 2 T H E D I T I O N ( M P I - W C )

2008 to 2009
2009 to 2010
2010 to 2011
2011 to 2012
2012 to 2013
2013 to 2014
2014 to 2015
2015 to 2016
2016 to 2017
2017 to 2018
2018 to 2019
3% 1% -2% 1% 5% 0% 6% 11% 0% -1% 2%
2% 2% 1% 0% 0% 0% 0% 0% 1% 0% 1%
6% 4% 2% 3% -1% 5% 2% 3% 4% 2% 2%
Figure B.21 North Carolina Trends in Prices Paid for Professional Services, WCRI MPI-WC, 2008 to 2019
Special notation: p We use the notation p to indicate that the 2019 numbers are preliminary results based on half-year price data through June 30, 2019. Note that the trend lines for the median of states with fee schedules and the median of states without fee schedules represent the median rates of growth of prices paid among states with and without fee schedules from year to year.
Notes: Maximum reimbursement amounts in the North Carolina fee schedule for professional services are based on those adopted by the North Carolina Industrial Commission effective January 1996, which was based on the 1995 Medicare values. North Carolina updates its fee schedule annually in January to account for new and discontinued Current Procedural Terminology (CPT) codes published by the American Medical Association. In 2013, the fee schedule rates for office visits increased in North Carolina. Effective July 1, 2015, North Carolina implemented new fee schedule rates, which incorporate the 2015 Medicare rates with the revised service-type specific multipliers, ranging between 140 and 195 percent of Medicare. Before this change, the fee schedule rates for most types of professional services in North Carolina were set at 158 percent of the 1995 Medicare values. Starting in 2016, and each year thereafter, North Carolina publishes a fee schedule table that is effective January 1. The most recent update covered during the study period in this report became effective January 1, 2019.
North Carolina
State average annual change in prices paid for professional services
Median annual change for fee schedule states
Median annual change for non-fee schedule states
pppppppppppppppp
p
NC
70
80
90
100
110
120
130
140
150
2008 2009 2010 2011 2012 2013 2014 2015 2016 2017 2018 2019
Ind
ex o
f P
rice
s P
aid
(b
ase
year
is 2
00
8=
10
0)
Calendar Year 2008 Is the Base Year for Index
North Carolina (fee schedule state) Median of States with Fee Schedules Median of States without Fee Schedules
NC
70
80
90
100
110
120
130
140
150
2008 2009 2010 2011 2012 2013 2014 2015 2016 2017 2018 2019
Ind
ex o
f P
rice
s P
aid
(b
ase
year
is 2
00
8=
10
0)
Calendar Year 2008 Is the Base Year for Index
North Carolina Other Study States
p
p
p
copyright © 2020 workers compensation research institute91
_____________________________________________________________________________________________W C R I M E D I C A L P R I C E I N D E X F O R W O R K E R S ' C O M P E N S A T I O N , 1 2 T H E D I T I O N ( M P I - W C )

2008 to 2009
2009 to 2010
2010 to 2011
2011 to 2012
2012 to 2013
2013 to 2014
2014 to 2015
2015 to 2016
2016 to 2017
2017 to 2018
2018 to 2019
1% 1% 2% -1% 0% -3% -3% 0% 1% -1% 2%
2% 2% 1% 0% 0% 0% 0% 0% 1% 0% 1%
6% 4% 2% 3% -1% 5% 2% 3% 4% 2% 2%
Figure B.22 Nebraska Trends in Prices Paid for Professional Services, WCRI MPI-WC, 2008 to 2019
Special notation: p We use the notation p to indicate that the 2019 numbers are preliminary results based on half-year price data through June 30, 2019. Note that the trend lines for the median of states with fee schedules and the median of states without fee schedules represent the median rates of growth of prices paid among states with and without fee schedules from year to year.
Notes: Nebraska has historically updated its fee schedule for professional services annually or biennially in June since 2008. The most recent update covered in the study period in this report was effective January 1, 2019.
Nebraska
State average annual change in prices paid for professional services
Median annual change for fee schedule states
Median annual change for non-fee schedule states
pppppppppppppppp
p
NE
70
80
90
100
110
120
130
140
150
2008 2009 2010 2011 2012 2013 2014 2015 2016 2017 2018 2019
Ind
ex o
f P
rice
s P
aid
(b
ase
year
is 2
00
8=
10
0)
Calendar Year 2008 Is the Base Year for Index
Nebraska (fee schedule state) Median of States with Fee Schedules Median of States without Fee Schedules
NE
70
80
90
100
110
120
130
140
150
2008 2009 2010 2011 2012 2013 2014 2015 2016 2017 2018 2019
Ind
ex o
f P
rice
s P
aid
(b
ase
year
is 2
00
8=
10
0)
Calendar Year 2008 Is the Base Year for Index
Nebraska Other Study States
p
p
p
copyright © 2020 workers compensation research institute92
_____________________________________________________________________________________________W C R I M E D I C A L P R I C E I N D E X F O R W O R K E R S ' C O M P E N S A T I O N , 1 2 T H E D I T I O N ( M P I - W C )
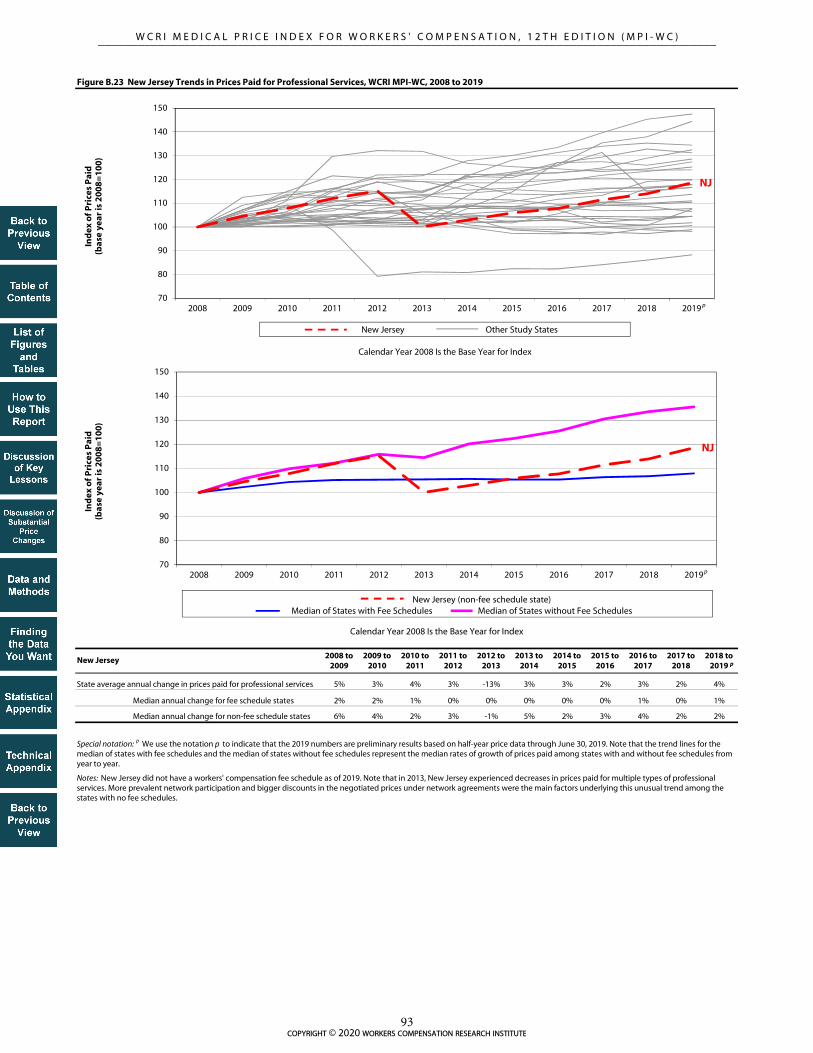
2008 to 2009
2009 to 2010
2010 to 2011
2011 to 2012
2012 to 2013
2013 to 2014
2014 to 2015
2015 to 2016
2016 to 2017
2017 to 2018
2018 to 2019
5% 3% 4% 3% -13% 3% 3% 2% 3% 2% 4%
2% 2% 1% 0% 0% 0% 0% 0% 1% 0% 1%
6% 4% 2% 3% -1% 5% 2% 3% 4% 2% 2%
Figure B.23 New Jersey Trends in Prices Paid for Professional Services, WCRI MPI-WC, 2008 to 2019
Special notation: p We use the notation p to indicate that the 2019 numbers are preliminary results based on half-year price data through June 30, 2019. Note that the trend lines for the median of states with fee schedules and the median of states without fee schedules represent the median rates of growth of prices paid among states with and without fee schedules from year to year.
Notes: New Jersey did not have a workers' compensation fee schedule as of 2019. Note that in 2013, New Jersey experienced decreases in prices paid for multiple types of professional services. More prevalent network participation and bigger discounts in the negotiated prices under network agreements were the main factors underlying this unusual trend among the states with no fee schedules.
New Jersey
State average annual change in prices paid for professional services
Median annual change for fee schedule states
Median annual change for non-fee schedule states
pppppppppppppppp
p
NJ
70
80
90
100
110
120
130
140
150
2008 2009 2010 2011 2012 2013 2014 2015 2016 2017 2018 2019
Ind
ex o
f P
rice
s P
aid
(b
ase
year
is 2
00
8=
10
0)
Calendar Year 2008 Is the Base Year for Index
New Jersey (non-fee schedule state) Median of States with Fee Schedules Median of States without Fee Schedules
NJ
70
80
90
100
110
120
130
140
150
2008 2009 2010 2011 2012 2013 2014 2015 2016 2017 2018 2019
Ind
ex o
f P
rice
s P
aid
(b
ase
year
is 2
00
8=
10
0)
Calendar Year 2008 Is the Base Year for Index
New Jersey Other Study States
p
p
p
copyright © 2020 workers compensation research institute93
_____________________________________________________________________________________________W C R I M E D I C A L P R I C E I N D E X F O R W O R K E R S ' C O M P E N S A T I O N , 1 2 T H E D I T I O N ( M P I - W C )

2008 to 2009
2009 to 2010
2010 to 2011
2011 to 2012
2012 to 2013
2013 to 2014
2014 to 2015
2015 to 2016
2016 to 2017
2017 to 2018
2018 to 2019
0% 0% 1% 1% -1% 0% 1% 0% -1% -1% 7%
2% 2% 1% 0% 0% 0% 0% 0% 1% 0% 1%
6% 4% 2% 3% -1% 5% 2% 3% 4% 2% 2%
Figure B.24 New York Trends in Prices Paid for Professional Services, WCRI MPI-WC, 2008 to 2019
Special notation: p We use the notation p to indicate that the 2019 numbers are preliminary results based on half-year price data through June 30, 2019. Note that the trend lines for the median of states with fee schedules and the median of states without fee schedules represent the median rates of growth of prices paid among states with and without fee schedules from year to year.
Notes:
The data for New York are not necessarily representative because they are missing data from a larger data source that is significant in this state. The results in New York are unlikely to be significantly under- or overestimated, given that the state uses a fee schedule to regulate the payment for professional services, and it is unlikely that the prices paid for the missing data source in New York were materially different from other data sources included in this study from the same state.
New York periodically updates its fee schedule for professional services; however, the maximum allowable reimbursement rates for most services covered in this report did not change from 2002 to November 2010. Effective December 1, 2010, the fee schedule rates in New York increased for evaluation and management services and emergency services. Effective April 1, 2019, New York implemented a fee schedule change, aiming to raise medical fee schedule rates, increase medical provider participation in the workers’ compensation system, and improve workers’ access to timely, quality medical care. The half-year price data through June 2019 in this report reflect only two months of experience under the new fee schedule. As this figure shows, the average overall price for professional services increased 7 percent from 2018 to June 2019. Price growth in half-year 2019 was observed for many types of professional services in New York (see Figure C.23). The next edition of this report will examine the price trends with 14 months of experience after the April 2019 fee schedule change.
New York
State average annual change in prices paid for professional services
Median annual change for fee schedule states
Median annual change for non-fee schedule states
pppppppppppppppp
p
NY
70
80
90
100
110
120
130
140
150
2008 2009 2010 2011 2012 2013 2014 2015 2016 2017 2018 2019
Ind
ex o
f P
rice
s P
aid
(b
ase
year
is 2
00
8=
10
0)
Calendar Year 2008 Is the Base Year for Index
New York (fee schedule state) Median of States with Fee Schedules Median of States without Fee Schedules
NY
70
80
90
100
110
120
130
140
150
2008 2009 2010 2011 2012 2013 2014 2015 2016 2017 2018 2019
Ind
ex o
f P
rice
s P
aid
(b
ase
year
is 2
00
8=
10
0)
Calendar Year 2008 Is the Base Year for Index
New York Other Study States
p
p
p
copyright © 2020 workers compensation research institute94
_____________________________________________________________________________________________W C R I M E D I C A L P R I C E I N D E X F O R W O R K E R S ' C O M P E N S A T I O N , 1 2 T H E D I T I O N ( M P I - W C )

2008 to 2009
2009 to 2010
2010 to 2011
2011 to 2012
2012 to 2013
2013 to 2014
2014 to 2015
2015 to 2016
2016 to 2017
2017 to 2018
2018 to 2019
0% 2% 1% 4% 1% 0% -1% 0% 1% 0% -2%
2% 2% 1% 0% 0% 0% 0% 0% 1% 0% 1%
6% 4% 2% 3% -1% 5% 2% 3% 4% 2% 2%
Figure B.25 Oklahoma Trends in Prices Paid for Professional Services, WCRI MPI-WC, 2008 to 2019
Special notation: p We use the notation p to indicate that the 2019 numbers are preliminary results based on half-year price data through June 30, 2019. Note that the trend lines for the median of states with fee schedules and the median of states without fee schedules represent the median rates of growth of prices paid among states with and without fee schedules from year to year.
Notes:
The data for Oklahoma are not necessarily representative because they are missing data from a larger data source that is significant in this state. The results in Oklahoma are unlikely to be significantly under- or overestimated, given that the state uses a fee schedule to regulate the payment for professional services, and it is unlikely that the prices paid for the missing data source in Oklahoma were materially different from other data sources included in this study from the same state.
Oklahoma regularly updated its fee schedule for professional services over the study period. The most recent version of the fee schedule within the study period in this report was effective June 1, 2018, which was essentially the same as the fee schedule effective in January 2012. Note that the fee schedule rates for office visits increased materially in 2012. For the most frequently billed office visits for low to moderate severity for established patients (Current Procedural Terminology [CPT] 99213), the fee schedule rate increased 51 percent in that year.
Oklahoma
State average annual change in prices paid for professional services
Median annual change for fee schedule states
Median annual change for non-fee schedule states
pppppppppppppppp
p
OK
70
80
90
100
110
120
130
140
150
2008 2009 2010 2011 2012 2013 2014 2015 2016 2017 2018 2019
Ind
ex o
f P
rice
s P
aid
(b
ase
year
is 2
00
8=
10
0)
Calendar Year 2008 Is the Base Year for Index
Oklahoma (fee schedule state) Median of States with Fee Schedules Median of States without Fee Schedules
OK
70
80
90
100
110
120
130
140
150
2008 2009 2010 2011 2012 2013 2014 2015 2016 2017 2018 2019
Ind
ex o
f P
rice
s P
aid
(b
ase
year
is 2
00
8=
10
0)
Calendar Year 2008 Is the Base Year for Index
Oklahoma Other Study States
p
p
p
copyright © 2020 workers compensation research institute95
_____________________________________________________________________________________________W C R I M E D I C A L P R I C E I N D E X F O R W O R K E R S ' C O M P E N S A T I O N , 1 2 T H E D I T I O N ( M P I - W C )

2008 to 2009
2009 to 2010
2010 to 2011
2011 to 2012
2012 to 2013
2013 to 2014
2014 to 2015
2015 to 2016
2016 to 2017
2017 to 2018
2018 to 2019
7% 7% 6% -1% -1% 0% 0% 1% 1% 0% 0%
2% 2% 1% 0% 0% 0% 0% 0% 1% 0% 1%
6% 4% 2% 3% -1% 5% 2% 3% 4% 2% 2%
Figure B.26 Oregon Trends in Prices Paid for Professional Services, WCRI MPI-WC, 2008 to 2019
Special notation: p We use the notation p to indicate that the 2019 numbers are preliminary results based on half-year price data through June 30, 2019. Note that the trend lines for the median of states with fee schedules and the median of states without fee schedules represent the median rates of growth of prices paid among states with and without fee schedules from year to year.
Notes:
The data for Oregon are not necessarily representative because they are missing data from a larger data source that is significant in this state. The results in Oregon are unlikely to be significantly under- or overestimated, given that the state uses a fee schedule to regulate the payment for professional services, and it is unlikely that the prices paid for the missing data source in Oregon were materially different from other data sources included in this study from the same state.
In July 2010, Oregon moved away from referencing the federal resource-based relative value scale (RBRVS) values in its fee schedule regulation. Instead, the state established the maximum allowable payment (MAP) amounts published by the Oregon Workers’ Compensation Division to make it easier for payors and providers to find the correct fee schedule MAP. The underlying values of the Oregon MAP amounts reported in Appendix B of the Oregon Medical Fee and Payment Rules (Oregon Administrative Rules, Chapter 436, Division 009) are based on Medicare relative value unit (RVU) values. Oregon typically updates its fee schedule annually. The most recent update covered in the study period in this report was effective April 1, 2019.
Oregon
State average annual change in prices paid for professional services
Median annual change for fee schedule states
Median annual change for non-fee schedule states
pppppppppppppppp
p
OR
70
80
90
100
110
120
130
140
150
2008 2009 2010 2011 2012 2013 2014 2015 2016 2017 2018 2019
Ind
ex o
f P
rice
s P
aid
(b
ase
year
is 2
00
8=
10
0)
Calendar Year 2008 Is the Base Year for Index
Oregon (fee schedule state) Median of States with Fee Schedules Median of States without Fee Schedules
OR
70
80
90
100
110
120
130
140
150
2008 2009 2010 2011 2012 2013 2014 2015 2016 2017 2018 2019
Ind
ex o
f P
rice
s P
aid
(b
ase
year
is 2
00
8=
10
0)
Calendar Year 2008 Is the Base Year for Index
Oregon Other Study States
p
p
p
copyright © 2020 workers compensation research institute96
_____________________________________________________________________________________________W C R I M E D I C A L P R I C E I N D E X F O R W O R K E R S ' C O M P E N S A T I O N , 1 2 T H E D I T I O N ( M P I - W C )

2008 to 2009
2009 to 2010
2010 to 2011
2011 to 2012
2012 to 2013
2013 to 2014
2014 to 2015
2015 to 2016
2016 to 2017
2017 to 2018
2018 to 2019
0% 0% 1% 3% 1% 1% 1% 2% 1% 2% 1%
2% 2% 1% 0% 0% 0% 0% 0% 1% 0% 1%
6% 4% 2% 3% -1% 5% 2% 3% 4% 2% 2%
Figure B.27 Pennsylvania Trends in Prices Paid for Professional Services, WCRI MPI-WC, 2008 to 2019
Special notation: p We use the notation p to indicate that the 2019 numbers are preliminary results based on half-year price data through June 30, 2019. Note that the trend lines for the median of states with fee schedules and the median of states without fee schedules represent the median rates of growth of prices paid among states with and without fee schedules from year to year.
Notes: Pennsylvania updates its fee schedule for professional services annually, based on the percentage change in the statewide average weekly wage. For 2019, this percentage change was 2.3 percent and applies to all services rendered on or after January 1, 2019.
Pennsylvania
State average annual change in prices paid for professional services
Median annual change for fee schedule states
Median annual change for non-fee schedule states
pppppppppppppppp
p
PA
70
80
90
100
110
120
130
140
150
2008 2009 2010 2011 2012 2013 2014 2015 2016 2017 2018 2019
Ind
ex o
f P
rice
s P
aid
(b
ase
year
is 2
00
8=
10
0)
Calendar Year 2008 Is the Base Year for Index
Pennsylvania (fee schedule state) Median of States with Fee Schedules Median of States without Fee Schedules
PA
70
80
90
100
110
120
130
140
150
2008 2009 2010 2011 2012 2013 2014 2015 2016 2017 2018 2019
Ind
ex o
f P
rice
s P
aid
(b
ase
year
is 2
00
8=
10
0)
Calendar Year 2008 Is the Base Year for Index
Pennsylvania Other Study States
p
p
p
copyright © 2020 workers compensation research institute97
_____________________________________________________________________________________________W C R I M E D I C A L P R I C E I N D E X F O R W O R K E R S ' C O M P E N S A T I O N , 1 2 T H E D I T I O N ( M P I - W C )

2008 to 2009
2009 to 2010
2010 to 2011
2011 to 2012
2012 to 2013
2013 to 2014
2014 to 2015
2015 to 2016
2016 to 2017
2017 to 2018
2018 to 2019
0% 3% 1% 1% 0% -1% -1% -1% -3% -1% -1%
2% 2% 1% 0% 0% 0% 0% 0% 1% 0% 1%
6% 4% 2% 3% -1% 5% 2% 3% 4% 2% 2%
Figure B.28 South Carolina Trends in Prices Paid for Professional Services, WCRI MPI-WC, 2008 to 2019
Special notation: p We use the notation p to indicate that the 2019 numbers are preliminary results based on half-year price data through June 30, 2019. Note that the trend lines for the median of states with fee schedules and the median of states without fee schedules represent the median rates of growth of prices paid among states with and without fee schedules from year to year.
Notes: South Carolina's fee schedule for professional services remained unchanged (after an update in January 2003) until 2009. Effective July 1, 2010, South Carolina had another update to its fee schedule, which increased the fee schedule rates for many professional services (evaluation and management, emergency, etc.) and decreased the rates for others (pain management injections, radiology services, etc.). The most recent update within the study period in this report was effective April 1, 2019; the half-year price data through June 2019 in this edition reflect only two months of experience after this fee schedule update.
South Carolina
State average annual change in prices paid for professional services
Median annual change for fee schedule states
Median annual change for non-fee schedule states
pppppppppppppppp
p
SC
70
80
90
100
110
120
130
140
150
2008 2009 2010 2011 2012 2013 2014 2015 2016 2017 2018 2019
Ind
ex o
f P
rice
s P
aid
(b
ase
year
is 2
00
8=
10
0)
Calendar Year 2008 Is the Base Year for Index
South Carolina (fee schedule state) Median of States with Fee Schedules Median of States without Fee Schedules
SC
70
80
90
100
110
120
130
140
150
2008 2009 2010 2011 2012 2013 2014 2015 2016 2017 2018 2019
Ind
ex o
f P
rice
s P
aid
(b
ase
year
is 2
00
8=
10
0)
Calendar Year 2008 Is the Base Year for Index
South Carolina Other Study States
p
p
p
copyright © 2020 workers compensation research institute98
_____________________________________________________________________________________________W C R I M E D I C A L P R I C E I N D E X F O R W O R K E R S ' C O M P E N S A T I O N , 1 2 T H E D I T I O N ( M P I - W C )

2008 to 2009
2009 to 2010
2010 to 2011
2011 to 2012
2012 to 2013
2013 to 2014
2014 to 2015
2015 to 2016
2016 to 2017
2017 to 2018
2018 to 2019
2% 9% 4% -1% -8% -5% -2% 0% 1% 1% 1%
2% 2% 1% 0% 0% 0% 0% 0% 1% 0% 1%
6% 4% 2% 3% -1% 5% 2% 3% 4% 2% 2%
Figure B.29 Tennessee Trends in Prices Paid for Professional Services, WCRI MPI-WC, 2008 to 2019
Special notation: p We use the notation p to indicate that the 2019 numbers are preliminary results based on half-year price data through June 30, 2019. Note that the trend lines for the median of states with fee schedules and the median of states without fee schedules represent the median rates of growth of prices paid among states with and without fee schedules from year to year.
Note: Tennessee implemented an RBRVS-based fee schedule in July 2005 and had regular updates in the following years. For instance, the fee schedule rates decreased across service groups in 2013. The most recent update covered in the study period in this report was effective April 1, 2019.
Key: RBRVS: resource-based relative value scale (Medicare).
Tennessee
State average annual change in prices paid for professional services
Median annual change for fee schedule states
Median annual change for non-fee schedule states
pppppppppppppppp
p
TN
70
80
90
100
110
120
130
140
150
2008 2009 2010 2011 2012 2013 2014 2015 2016 2017 2018 2019
Ind
ex o
f P
rice
s P
aid
(b
ase
year
is 2
00
8=
10
0)
Calendar Year 2008 Is the Base Year for Index
Tennessee (fee schedule state) Median of States with Fee Schedules Median of States without Fee Schedules
TN
70
80
90
100
110
120
130
140
150
2008 2009 2010 2011 2012 2013 2014 2015 2016 2017 2018 2019
Ind
ex o
f P
rice
s P
aid
(b
ase
year
is 2
00
8=
10
0)
Calendar Year 2008 Is the Base Year for Index
Tennessee Other Study States
p
p
p
copyright © 2020 workers compensation research institute99
_____________________________________________________________________________________________W C R I M E D I C A L P R I C E I N D E X F O R W O R K E R S ' C O M P E N S A T I O N , 1 2 T H E D I T I O N ( M P I - W C )

2008 to 2009
2009 to 2010
2010 to 2011
2011 to 2012
2012 to 2013
2013 to 2014
2014 to 2015
2015 to 2016
2016 to 2017
2017 to 2018
2018 to 2019
7% 4% 16% 2% 0% -4% -1% -1% -1% 1% 2%
2% 2% 1% 0% 0% 0% 0% 0% 1% 0% 1%
6% 4% 2% 3% -1% 5% 2% 3% 4% 2% 2%
Figure B.30 Texas Trends in Prices Paid for Professional Services, WCRI MPI-WC, 2008 to 2019
Special notation: p We use the notation p to indicate that the 2019 numbers are preliminary results based on half-year price data through June 30, 2019. Note that the trend lines for the median of states with fee schedules and the median of states without fee schedules represent the median rates of growth of prices paid among states with and without fee schedules from year to year.
Notes: In March 2008, Texas increased fee schedule rates for professional services, especially for surgeries, and allowed annual increases based on changes in the Medicare Economic Index. In 2011, the fee schedule rates in Texas increased for most professional services following the Medicare updates. The most recent update covered in the study period in this report was effective April 1, 2019.
Texas
State average annual change in prices paid for professional services
Median annual change for fee schedule states
Median annual change for non-fee schedule states
pppppppppppppppp
p
TX
70
80
90
100
110
120
130
140
150
2008 2009 2010 2011 2012 2013 2014 2015 2016 2017 2018 2019
Ind
ex o
f P
rice
s P
aid
(b
ase
year
is 2
00
8=
10
0)
Calendar Year 2008 Is the Base Year for Index
Texas (fee schedule state) Median of States with Fee Schedules Median of States without Fee Schedules
TX
70
80
90
100
110
120
130
140
150
2008 2009 2010 2011 2012 2013 2014 2015 2016 2017 2018 2019
Ind
ex o
f P
rice
s P
aid
(b
ase
year
is 2
00
8=
10
0)
Calendar Year 2008 Is the Base Year for Index
Texas Other Study States
p
p
p
copyright © 2020 workers compensation research institute100
_____________________________________________________________________________________________W C R I M E D I C A L P R I C E I N D E X F O R W O R K E R S ' C O M P E N S A T I O N , 1 2 T H E D I T I O N ( M P I - W C )
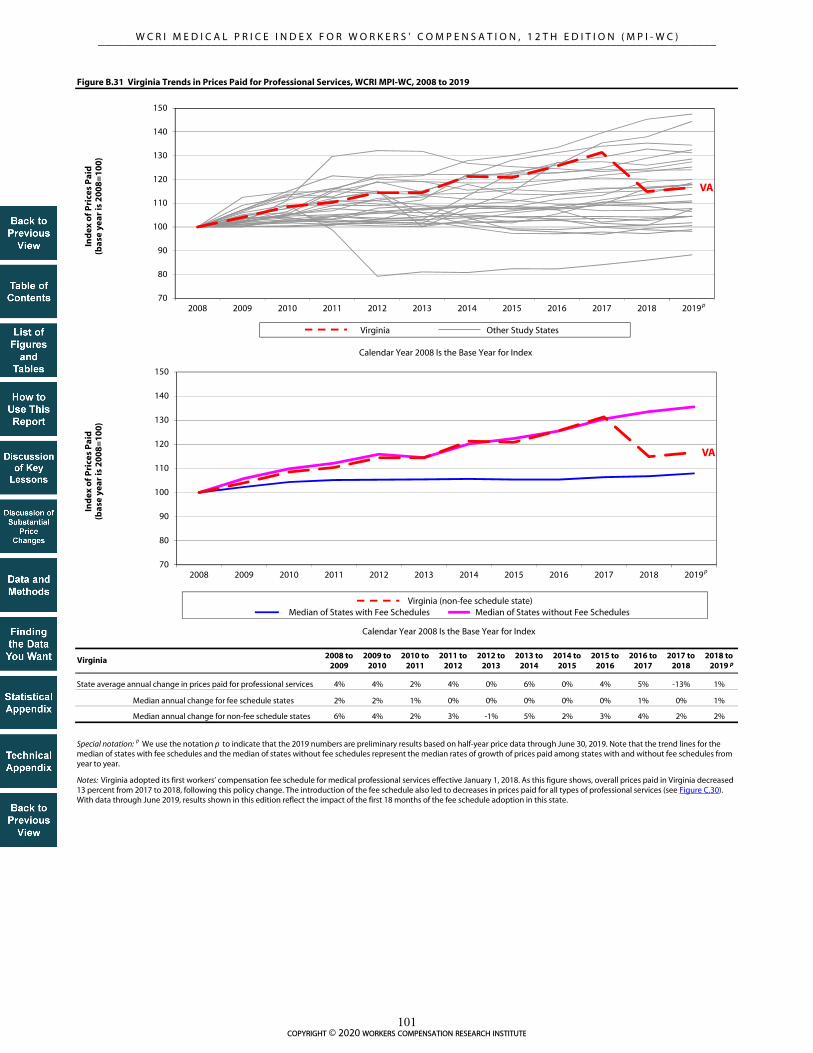
2008 to 2009
2009 to 2010
2010 to 2011
2011 to 2012
2012 to 2013
2013 to 2014
2014 to 2015
2015 to 2016
2016 to 2017
2017 to 2018
2018 to 2019
4% 4% 2% 4% 0% 6% 0% 4% 5% -13% 1%
2% 2% 1% 0% 0% 0% 0% 0% 1% 0% 1%
6% 4% 2% 3% -1% 5% 2% 3% 4% 2% 2%
Figure B.31 Virginia Trends in Prices Paid for Professional Services, WCRI MPI-WC, 2008 to 2019
Special notation: p We use the notation p to indicate that the 2019 numbers are preliminary results based on half-year price data through June 30, 2019. Note that the trend lines for the median of states with fee schedules and the median of states without fee schedules represent the median rates of growth of prices paid among states with and without fee schedules from year to year.
Notes: Virginia adopted its first workers’ compensation fee schedule for medical professional services effective January 1, 2018. As this figure shows, overall prices paid in Virginia decreased 13 percent from 2017 to 2018, following this policy change. The introduction of the fee schedule also led to decreases in prices paid for all types of professional services (see Figure C.30). With data through June 2019, results shown in this edition reflect the impact of the first 18 months of the fee schedule adoption in this state.
Virginia
State average annual change in prices paid for professional services
Median annual change for fee schedule states
Median annual change for non-fee schedule states
pppppppppppppppp
p
VA
70
80
90
100
110
120
130
140
150
2008 2009 2010 2011 2012 2013 2014 2015 2016 2017 2018 2019
Ind
ex o
f P
rice
s P
aid
(b
ase
year
is 2
00
8=
10
0)
Calendar Year 2008 Is the Base Year for Index
Virginia (non-fee schedule state) Median of States with Fee Schedules Median of States without Fee Schedules
VA
70
80
90
100
110
120
130
140
150
2008 2009 2010 2011 2012 2013 2014 2015 2016 2017 2018 2019
Ind
ex o
f P
rice
s P
aid
(b
ase
year
is 2
00
8=
10
0)
Calendar Year 2008 Is the Base Year for Index
Virginia Other Study States
p
p
p
copyright © 2020 workers compensation research institute101
_____________________________________________________________________________________________W C R I M E D I C A L P R I C E I N D E X F O R W O R K E R S ' C O M P E N S A T I O N , 1 2 T H E D I T I O N ( M P I - W C )

2008 to 2009
2009 to 2010
2010 to 2011
2011 to 2012
2012 to 2013
2013 to 2014
2014 to 2015
2015 to 2016
2016 to 2017
2017 to 2018
2018 to 2019
6% 6% 3% 4% 1% 5% 2% 3% 5% 4% 2%
2% 2% 1% 0% 0% 0% 0% 0% 1% 0% 1%
6% 4% 2% 3% -1% 5% 2% 3% 4% 2% 2%
Figure B.32 Wisconsin Trends in Prices Paid for Professional Services, WCRI MPI-WC, 2008 to 2019
Special notation: p We use the notation p to indicate that the 2019 numbers are preliminary results based on half-year price data through June 30, 2019. Note that the trend lines for the median of states with fee schedules and the median of states without fee schedules represent the median rates of growth of prices paid among states with and without fee schedules from year to year.
Note: Wisconsin did not have a conventional workers' compensation fee schedule as of 2019.
Wisconsin
State average annual change in prices paid for professional services
Median annual change for fee schedule states
Median annual change for non-fee schedule states
pppppppppppppppp
p
WI
70
80
90
100
110
120
130
140
150
2008 2009 2010 2011 2012 2013 2014 2015 2016 2017 2018 2019
Ind
ex o
f P
rice
s P
aid
(b
ase
year
is 2
00
8=
10
0)
Calendar Year 2008 Is the Base Year for Index
Wisconsin (non-fee schedule state) Median of States with Fee Schedules Median of States without Fee Schedules
WI
70
80
90
100
110
120
130
140
150
2008 2009 2010 2011 2012 2013 2014 2015 2016 2017 2018 2019
Ind
ex o
f P
rice
s P
aid
(b
ase
year
is 2
00
8=
10
0)
Calendar Year 2008 Is the Base Year for Index
Wisconsin Other Study States
p
p
p
copyright © 2020 workers compensation research institute102
_____________________________________________________________________________________________W C R I M E D I C A L P R I C E I N D E X F O R W O R K E R S ' C O M P E N S A T I O N , 1 2 T H E D I T I O N ( M P I - W C )

StateFee Regulation
Type2008 2009 2010 2011 2012 2013 2014 2015 2016 2017 2018 2019
AR FS 100 101 109 115 117 117 114 115 115 116 115 116
AZa,b FS 100 103 114 115 116 118 139 141 156 162 179 180
CA FS 100 100 101 101 100 100 131 138 147 154 157 159
COa FS 100 104 108 113 115 116 118 119 125 130 138 139
CTb FS 100 106 116 127 131 131 133 135 133 133 132 132
FL FS 100 102 104 104 104 103 104 103 113 124 124 125
GA FS 100 102 108 118 124 129 130 130 131 134 136 138
IA Non-FS 100 107 111 114 116 120 124 124 127 132 134 136
IL FS 100 104 105 97 78 79 83 87 88 89 91 94
IN Non-FS 100 104 111 115 117 118 125 134 136 141 143 145
KS FS 100 100 115 120 128 130 140 139 140 145 146 147
KY FS 100 102 102 108 109 109 121 132 132 131 135 143
LA FS 100 102 102 104 105 106 108 108 109 108 108 108
MA FS 100 107 110 109 108 108 107 106 106 107 107 106
MDa FS 100 104 109 120 127 131 127 129 133 135 138 142
MI FS 100 103 104 106 105 110 112 110 110 108 109 109
MNb FS 100 103 109 125 129 133 145 145 146 151 153 154
MOa Non-FS 100 106 110 111 115 118 122 127 132 139 142 147
MS FS 100 101 101 102 101 99 100 99 99 108 107 107
NC FS 100 101 101 100 101 123 125 140 163 164 164 167
NE FS 100 100 111 121 120 121 121 120 120 122 121 124
NJ Non-FS 100 103 109 112 114 105 108 111 115 120 125 133
NYa FS 100 104 105 125 127 128 129 129 129 129 129 141
OKa FS 100 101 103 103 142 143 143 141 140 138 138 138
ORa FS 100 110 121 134 135 135 135 135 138 138 138 139
PA FS 100 99 98 100 103 105 108 109 111 112 115 119
SC FS 100 99 107 115 115 115 114 114 115 116 115 118
TNb FS 100 101 110 117 115 114 110 108 108 110 108 109
TX FS 100 108 114 134 138 142 139 140 141 143 145 148
VAc Non-FS/FS 100 106 111 115 117 121 126 131 137 144 129 130
WI Non-FS 100 106 112 118 124 132 140 145 151 158 165 172
100 102 106 111 112 112 114 114 114 116 116 117
100 106 111 114 117 121 125 130 134 141 143 148
Table B.1 Trends in Prices Paid for Professional Evaluation and Management Services, WCRI MPI-WC, 2008 to 2019
b This state had fee schedule changes or updates within 2019 but after June 30, 2019, that are not reflected in the results.
c Virginia adopted its first workers’ compensation fee schedule for medical professional services effective January 1, 2018. Previously this state had no fee schedule.
Key: FS: fee schedule.
Median growth rate in FS states
Median growth rate in non-FS states
Special notation: p We use the notation p to indicate that the 2019 numbers are preliminary results based on half-year price data through June 30, 2019.
Notes:
Calendar year 2008 is the base year, which is equal to 100 in the index.
Evaluation and management: The services in this group are new and established patient office visits. These consist of office visits that require at least two of three parts: a problem focused history, a problem focused examination, and/or straightforward medical decision making of various complexities. See Table TA.2 for a detailed description of all service codes included in this group.
a The data for each of these states are not necessarily representative because each state is missing data from a larger data source that is significant in that state. The results in AZ, CO, MD, NY, OK, and OR are unlikely to be significantly under- or overestimated, given that these states use fee schedules to regulate the payment for professional services, and it is unlikely that the prices paid for the missing data source in each state were materially different from other data sources included in this study from the same state. For MO, to the extent that prices paid may differ for the missing data source compared with other data sources in the state, this may lead to possible under- or overestimations in the results.
p
copyright © 2020 workers compensation research institute103
_____________________________________________________________________________________________W C R I M E D I C A L P R I C E I N D E X F O R W O R K E R S ' C O M P E N S A T I O N , 1 2 T H E D I T I O N ( M P I - W C )

StateFee Regulation
Type2008 2009 2010 2011 2012 2013 2014 2015 2016 2017 2018 2019
AR FS 100 106 110 116 117 122 117 114 117 116 116 120
AZa,b FS 100 107 115 114 115 117 135 136 140 145 155 151
CA FS 100 105 104 104 103 99 126 129 136 142 142 143
COa FS 100 102 109 112 114 116 119 117 123 126 129 133
CTb FS 100 104 108 113 113 114 118 119 120 121 122 122
FL FS 100 107 108 103 104 102 104 104 112 118 118 121
GA FS 100 102 106 113 120 124 125 127 128 129 126 127
IA Non-FS 100 106 112 115 112 111 115 118 124 125 142 146
IL FS 100 109 113 102 84 85 86 87 87 89 91 92
IN Non-FS 100 107 113 107 117 119 133 142 150 156 160 160
KS FS 100 101 102 103 113 113 127 123 121 121 124 126
KY FS 100 102 103 103 102 101 118 135 134 131 136 138
LA FS 100 106 106 107 109 111 115 113 115 114 114 114
MA FS 100 106 112 110 111 109 109 111 112 114 111 115
MDa FS 100 104 106 119 126 131 130 132 134 138 138 140
MI FS 100 102 106 104 104 108 108 108 107 106 112 114
MNb FS 100 106 106 106 108 112 115 113 113 114 115 116
MOa Non-FS 100 103 108 102 109 115 120 123 128 130 134 141
MS FS 100 102 103 101 99 103 120 120 119 109 110 112
NC FS 100 103 105 103 102 106 107 125 156 157 153 157
NE FS 100 100 102 106 102 102 103 104 103 104 102 105
NJ Non-FS 100 108 112 111 119 120 133 142 145 153 154 162
NYa FS 100 100 100 96 96 95 94 96 97 94 92 104
OKa FS 100 101 105 105 104 106 106 104 105 108 107 108
ORa FS 100 111 123 132 128 133 133 132 133 134 133 133
PA FS 100 101 101 102 107 110 112 113 116 118 119 119
SC FS 100 104 107 108 109 111 111 114 116 107 107 102
TNb FS 100 105 114 118 117 117 113 109 108 110 116 118
TX FS 100 109 111 130 134 140 137 133 129 123 123 127
VAc Non-FS/FS 100 110 114 111 116 127 136 136 142 147 128 132
WI Non-FS 100 105 112 115 120 126 134 140 145 149 160 165
100 104 106 107 108 110 112 113 113 114 114 116
100 106 112 110 116 120 128 133 139 143 148 152
a The data for each of these states are not necessarily representative because each state is missing data from a larger data source that is significant in that state. The results in AZ, CO, MD, NY, OK, and OR are unlikely to be significantly under- or overestimated, given that these states use fee schedules to regulate the payment for professional services, and it is unlikely that the prices paid for the missing data source in each state were materially different from other data sources included in this study from the same state. For MO, to the extent that prices paid may differ for the missing data source compared with other data sources in the state, this may lead to possible under- or overestimations in the results.
c Virginia adopted its first workers’ compensation fee schedule for medical professional services effective January 1, 2018. Previously this state had no fee schedule.
Key: FS: fee schedule.
b This state had fee schedule changes or updates within 2019 but after June 30, 2019, that are not reflected in the results.
Median growth rate in FS states
Median growth rate in non-FS states
Table B.2 Trends in Prices Paid for Professional Physical Medicine Services, WCRI MPI-WC, 2008 to 2019
Special notation: p We use the notation p to indicate that the 2019 numbers are preliminary results based on half-year price data through June 30, 2019.
Notes:
Calendar year 2008 is the base year, which is equal to 100 in the index.
Physical medicine: The services in this group include physical medicine procedures, modalities, therapeutic activities and manual therapy techniques involving one or more areas, electronic stimulation, and work hardening/conditioning, as well as chiropractic care and manipulations. These services may be provided by physical therapists and occupational therapists as well as chiropractors. Physical medicine codes may be billed by physicians, chiropractors, or physical therapists and occupational therapists. See Table TA.2 for a detailed description of all service codes included in this group.
p
copyright © 2020 workers compensation research institute104
_____________________________________________________________________________________________W C R I M E D I C A L P R I C E I N D E X F O R W O R K E R S ' C O M P E N S A T I O N , 1 2 T H E D I T I O N ( M P I - W C )

StateFee Regulation
Type2008 2009 2010 2011 2012 2013 2014 2015 2016 2017 2018 2019
AR FS 100 99 104 112 108 109 106 105 105 106 103 106
AZa,b FS 100 102 104 105 103 105 107 107 107 103 92 90
CA FS 100 103 106 107 106 109 86 82 76 71 71 72
COa FS 100 100 99 105 105 107 106 106 78 79 91 91
CTb FS 100 101 99 99 96 94 94 94 96 95 94 95
FL FS 100 102 99 97 96 97 99 97 93 93 94 91
GA FS 100 104 106 118 124 127 127 124 126 126 127 124
IA Non-FS 100 105 105 109 105 102 96 94 96 97 99 98
IL FS 100 106 110 99 77 78 78 79 78 80 82 85
IN Non-FS 100 114 122 120 128 122 122 128 127 122 121 116
KS FS 100 106 109 110 109 113 116 111 111 111 111 111
KY FS 100 100 99 100 98 98 101 102 104 114 115 113
LA FS 100 103 106 104 104 105 105 105 105 106 105 107
MA FS 100 127 127 129 125 122 123 127 124 125 127 129
MDa FS 100 104 108 115 111 113 111 110 114 116 119 121
MI FS 100 97 95 94 94 93 93 90 89 88 89 91
MNb FS 100 106 102 80 83 86 85 87 83 86 86 86
MOa Non-FS 100 120 121 127 125 127 133 133 130 159 165 174
MS FS 100 100 101 102 103 102 110 112 112 108 112 115
NC FS 100 103 105 103 104 102 101 98 93 92 92 93
NE FS 100 100 97 93 93 94 91 90 91 91 91 91
NJ Non-FS 100 104 105 111 112 92 91 93 94 93 96 98
NYa FS 100 101 101 98 100 99 99 100 101 100 101 104
OKa FS 100 100 100 105 93 92 92 93 92 94 95 89
ORa FS 100 100 104 106 103 104 101 102 101 103 103 99
PA FS 100 101 101 101 104 109 110 111 114 115 119 122
SC FS 100 96 97 94 96 94 90 83 79 81 79 81
TNb FS 100 102 114 116 114 101 98 100 99 99 98 98
TX FS 100 108 116 140 133 136 131 131 133 134 136 139
VAc Non-FS/FS 100 93 97 103 108 104 110 103 108 119 104 103
WI Non-FS 100 107 113 118 123 127 135 134 136 145 151 148
100 102 103 103 102 103 103 103 103 103 103 104
100 106 109 114 117 114 116 116 117 121 125 124
b This state had fee schedule changes or updates within 2019 but after June 30, 2019, that are not reflected in the results.
c Virginia adopted its first workers’ compensation fee schedule for medical professional services effective January 1, 2018. Previously this state had no fee schedule.
Key: FS: fee schedule.
Table B.3 Trends in Prices Paid for Professional Major Surgery Services, WCRI MPI-WC, 2008 to 2019
Median growth rate in FS states
Median growth rate in non-FS states
Special notation: p We use the notation p to indicate that the 2019 numbers are preliminary results based on half-year price data through June 30, 2019.
Notes:
Calendar year 2008 is the base year, which is equal to 100 in the index.
Major surgery: The majority of the services in this group include orthopedic surgeries, such as arthroscopy of the shoulder or knee and lumbar laminotomies, neuroplasty and/or transposition of the median nerve at the carpal tunnel, and hernia repair. See Table TA.2 for a detailed description of all service codes included in this group.
a The data for each of these states are not necessarily representative because each state is missing data from a larger data source that is significant in that state. The results in AZ, CO, MD, NY, OK, and OR are unlikely to be significantly under- or overestimated, given that these states use fee schedules to regulate the payment for professional services, and it is unlikely that the prices paid for the missing data source in each state were materially different from other data sources included in this study from the same state. For MO, to the extent that prices paid may differ for the missing data source compared with other data sources in the state, this may lead to possible under- or overestimations in the results.
p
copyright © 2020 workers compensation research institute105
_____________________________________________________________________________________________W C R I M E D I C A L P R I C E I N D E X F O R W O R K E R S ' C O M P E N S A T I O N , 1 2 T H E D I T I O N ( M P I - W C )

StateFee Regulation
Type2008 2009 2010 2011 2012 2013 2014 2015 2016 2017 2018 2019
AR FS 100 108 118 128 128 125 102 111 115 120 116 115
AZa,b FS 100 105 106 111 110 118 119 123 132 140 119 115
CA FS 100 100 98 98 97 97 94 94 89 84 83 88
COa FS 100 90 110 107 112 116 72 71 86 79 93 80
CTb FS 100 100 105 102 99 98 93 97 103 112 110 118
FL FS 100 100 102 98 97 101 102 101 96 105 101 105
GA FS 100 101 104 112 118 123 108 112 120 130 123 125
IA Non-FS 100 114 119 123 120 118 125 113 105 119 126 123
IL FS 100 112 123 110 89 92 92 94 95 104 111 115
IN Non-FS 100 103 119 119 120 124 128 135 142 158 150 160
KS FS 100 106 95 92 95 96 98 81 79 95 91 107
KY FS 100 102 101 100 95 91 95 97 99 109 107 114
LA FS 100 108 107 105 115 118 112 125 124 130 130 141
MA FS 100 106 111 108 109 112 114 113 115 146 155 142
MDa FS 100 87 95 87 93 89 79 86 88 82 82 84
MI FS 100 94 94 91 94 100 98 87 83 115 99 101
MNb FS 100 99 94 72 74 72 67 65 65 84 85 87
MOa Non-FS 100 108 114 109 112 107 119 111 108 121 120 131
MS FS 100 107 107 108 108 104 106 106 110 113 109 113
NC FS 100 101 103 100 96 98 96 88 86 89 89 95
NE FS 100 101 92 88 84 90 81 73 86 84 83 78
NJ Non-FS 100 110 121 132 146 123 107 99 99 126 123 117
NYa FS 100 101 102 101 101 99 98 98 98 100 101 106
OKa FS 100 104 95 93 92 91 94 96 93 94 104 102
ORa FS 100 87 83 80 83 83 87 82 88 76 72 81
PA FS 100 103 99 103 106 108 109 109 109 107 110 116
SC FS 100 99 95 88 88 86 84 88 87 81 77 78
TNb FS 100 93 103 110 114 100 86 103 95 93 95 98
TX FS 100 105 108 125 127 124 106 121 123 126 130 132
VAc Non-FS/FS 100 98 105 108 112 117 122 119 123 128 102 105
WI Non-FS 100 114 131 136 147 146 157 161 161 176 173 182
100 101 101 99 99 100 98 98 100 103 102 105
100 109 118 122 125 124 131 125 125 139 137 144
a The data for each of these states are not necessarily representative because each state is missing data from a larger data source that is significant in that state. The results in AZ, CO, MD, NY, OK, and OR are unlikely to be significantly under- or overestimated, given that these states use fee schedules to regulate the payment for professional services, and it is unlikely that the prices paid for the missing data source in each state were materially different from other data sources included in this study from the same state. For MO, to the extent that prices paid may differ for the missing data source compared with other data sources in the state, this may lead to possible under- or overestimations in the results.
b This state had fee schedule changes or updates within 2019 but after June 30, 2019, that are not reflected in the results.
c Virginia adopted its first workers’ compensation fee schedule for medical professional services effective January 1, 2018. Previously this state had no fee schedule.
Key: FS: fee schedule.
Table B.4 Trends in Prices Paid for Professional Pain Management Injection Services, WCRI MPI-WC, 2008 to 2019
Special notation: p We use the notation p to indicate that the 2019 numbers are preliminary results based on half-year price data through June 30, 2019.
Notes:
Calendar year 2008 is the base year, which is equal to 100 in the index.
Pain management injections: The services in this group include injection procedures that are commonly used for pain management, such as epidural or steroid injections on nerve roots and muscles for lumbar, sacral, cervical, or thoracic areas. See Table TA.2 for a detailed description of all service codes included in this group.
Median growth rate in FS states
Median growth rate in non-FS states
p
copyright © 2020 workers compensation research institute106
_____________________________________________________________________________________________W C R I M E D I C A L P R I C E I N D E X F O R W O R K E R S ' C O M P E N S A T I O N , 1 2 T H E D I T I O N ( M P I - W C )

StateFee Regulation
Type2008 2009 2010 2011 2012 2013 2014 2015 2016 2017 2018 2019
AR FS 100 103 76 76 79 74 61 55 56 55 54 52
AZa,b FS 100 98 97 98 97 99 99 101 99 99 95 95
CA FS 100 100 100 100 99 95 76 70 66 62 62 61
COa FS 100 104 104 105 102 104 103 103 90 77 81 81
CTb FS 100 109 108 112 107 103 91 80 77 77 78 74
FL FS 100 104 105 99 99 97 96 96 94 94 90 90
GA FS 100 104 103 101 104 103 100 100 100 101 99 99
IA Non-FS 100 103 103 105 105 112 114 108 105 98 91 89
IL FS 100 102 105 94 80 85 83 83 82 83 85 87
IN Non-FS 100 101 103 100 101 105 105 103 97 102 99 100
KS FS 100 105 98 93 82 84 64 55 57 53 52 51
KY FS 100 105 101 110 109 111 110 110 108 113 118 122
LA FS 100 105 106 107 106 105 102 102 93 85 85 85
MA FS 100 109 109 111 109 109 107 106 106 105 105 106
MDa FS 100 100 97 102 101 93 75 70 72 73 73 72
MI FS 100 103 106 105 108 98 96 59 59 54 54 54
MNb FS 100 106 108 98 100 95 72 71 68 57 56 56
MOa Non-FS 100 107 105 106 104 105 109 104 108 105 103 100
MS FS 100 101 102 101 99 101 82 81 79 60 61 61
NC FS 100 105 104 104 105 104 103 83 64 64 65 64
NE FS 100 105 102 100 94 95 76 61 58 59 60 59
NJ Non-FS 100 100 100 101 102 102 102 98 98 99 97 100
NYa FS 100 95 96 94 92 91 91 91 90 87 85 84
OKa FS 100 98 100 101 97 101 101 98 100 101 102 91
ORa FS 100 106 102 96 95 93 95 95 97 98 98 96
PA FS 100 97 99 98 98 100 98 97 97 97 96 96
SC FS 100 100 88 75 75 75 74 72 67 62 58 57
TNb FS 100 99 101 106 101 90 74 69 70 70 69 67
TX FS 100 103 101 98 107 96 77 73 74 75 76 76
VAc Non-FS/FS 100 110 107 109 108 110 115 112 110 106 95 96
WI Non-FS 100 106 107 102 103 101 101 97 96 101 96 95
100 103 103 102 101 100 98 97 96 95 95 94
100 104 104 106 106 107 108 104 102 101 99 98
b This state had fee schedule changes or updates within 2019 but after June 30, 2019, that are not reflected in the results.
c Virginia adopted its first workers’ compensation fee schedule for medical professional services effective January 1, 2018. Previously this state had no fee schedule.
Key: FS: fee schedule.
Table B.5 Trends in Prices Paid for Professional Major Radiology Services, WCRI MPI-WC, 2008 to 2019
Median growth rate in FS states
Median growth rate in non-FS states
Special notation: p We use the notation p to indicate that the 2019 numbers are preliminary results based on half-year price data through June 30, 2019.
Notes:
Calendar year 2008 is the base year, which is equal to 100 in the index.
Major radiology: The services in this group mostly include magnetic resonance imaging of various areas, including, but not limited to, spinal canal and contents, cervical, lumbar, and any joint of the upper or lower extremity. See Table TA.2 for a detailed description of all service codes included in this group.
a The data for each of these states are not necessarily representative because each state is missing data from a larger data source that is significant in that state. The results in AZ, CO, MD, NY, OK, and OR are unlikely to be significantly under- or overestimated, given that these states use fee schedules to regulate the payment for professional services, and it is unlikely that the prices paid for the missing data source in each state were materially different from other data sources included in this study from the same state. For MO, to the extent that prices paid may differ for the missing data source compared with other data sources in the state, this may lead to possible under- or overestimations in the results.
p
copyright © 2020 workers compensation research institute107
_____________________________________________________________________________________________W C R I M E D I C A L P R I C E I N D E X F O R W O R K E R S ' C O M P E N S A T I O N , 1 2 T H E D I T I O N ( M P I - W C )

StateFee Regulation
Type2008 2009 2010 2011 2012 2013 2014 2015 2016 2017 2018 2019
AR FS 100 103 105 105 104 106 98 92 91 91 91 93
AZa,b FS 100 99 100 87 86 88 89 92 95 99 101 103
CA FS 100 100 100 100 100 100 114 103 98 93 94 98
COa FS 100 101 101 103 105 105 106 106 156 126 127 129
CTb FS 100 105 103 103 99 102 98 91 87 87 87 86
FL FS 100 103 109 103 103 103 103 102 103 101 97 102
GA FS 100 104 107 117 123 126 120 112 110 111 113 115
IA Non-FS 100 103 105 102 101 102 101 100 104 105 106 106
IL FS 100 104 107 94 75 77 78 80 80 81 82 84
IN Non-FS 100 104 107 105 106 106 106 108 108 109 109 106
KS FS 100 101 99 96 101 99 105 96 95 90 90 91
KY FS 100 101 100 111 113 115 116 116 117 132 144 158
LA FS 100 102 104 105 106 105 105 105 104 103 103 104
MA FS 100 104 107 108 104 104 103 103 102 104 106 105
MDa FS 100 99 99 111 116 118 107 100 102 104 105 110
MI FS 100 101 104 104 103 102 102 93 93 87 87 88
MNb FS 100 103 103 95 96 99 106 104 102 97 96 97
MOa Non-FS 100 105 104 104 103 104 104 105 110 115 119 119
MS FS 100 100 101 101 97 101 117 116 113 102 102 101
NC FS 100 102 101 99 99 97 97 98 101 101 101 106
NE FS 100 108 107 109 108 108 102 98 93 94 93 97
NJ Non-FS 100 105 109 121 122 102 99 100 102 102 113 127
NYa FS 100 99 98 93 94 93 93 93 92 92 92 95
OKa FS 100 101 101 100 99 100 99 98 98 97 97 97
ORa FS 100 104 106 110 113 115 113 108 109 110 110 109
PA FS 100 104 104 106 108 111 113 115 118 119 121 123
SC FS 100 99 103 99 99 99 98 95 92 92 90 93
TNb FS 100 99 108 112 114 106 95 89 89 90 91 93
TX FS 100 106 109 112 125 130 117 109 111 113 116 121
VAc Non-FS/FS 100 102 104 103 103 105 110 108 108 107 82 84
WI Non-FS 100 106 114 112 115 118 123 123 128 130 136 140
100 102 102 103 103 104 104 102 102 103 103 106
100 105 107 106 106 107 107 108 111 112 116 116
b This state had fee schedule changes or updates within 2019 but after June 30, 2019, that are not reflected in the results.
c Virginia adopted its first workers’ compensation fee schedule for medical professional services effective January 1, 2018. Previously this state had no fee schedule.
Key: FS: fee schedule.
Table B.6 Trends in Prices Paid for Professional Minor Radiology Services, WCRI MPI-WC, 2008 to 2019
Median growth rate in FS states
Median growth rate in non-FS states
Special notation: p We use the notation p to indicate that the 2019 numbers are preliminary results based on half-year price data through June 30, 2019.
Notes:
Calendar year 2008 is the base year, which is equal to 100 in the index.
Minor radiology: The services in this group mostly include radiologic exams (X rays or ultrasounds) involving at least two views of various areas of the body, including, but not limited to, the spine, lumbosacral, shoulder, and wrist. See Table TA.2 for a detailed description of all service codes included in this group.
a The data for each of these states are not necessarily representative because each state is missing data from a larger data source that is significant in that state. The results in AZ, CO, MD, NY, OK, and OR are unlikely to be significantly under- or overestimated, given that these states use fee schedules to regulate the payment for professional services, and it is unlikely that the prices paid for the missing data source in each state were materially different from other data sources included in this study from the same state. For MO, to the extent that prices paid may differ for the missing data source compared with other data sources in the state, this may lead to possible under- or overestimations in the results.
p
copyright © 2020 workers compensation research institute108
_____________________________________________________________________________________________W C R I M E D I C A L P R I C E I N D E X F O R W O R K E R S ' C O M P E N S A T I O N , 1 2 T H E D I T I O N ( M P I - W C )

StateFee Regulation
Type2008 2009 2010 2011 2012 2013 2014 2015 2016 2017 2018 2019
AR FS 100 97 115 124 127 78 75 81 81 83 84 83
AZa,b FS 100 102 112 112 114 119 103 69 70 76 78 77
CA FS 100 101 102 100 97 100 58 62 67 68 72 73
COa
FS 100 98 98 102 116 119 58 61 91 91 95 99
CTb FS 100 100 96 90 88 73 61 60 59 59 61 62
FL FS 100 101 102 103 103 104 105 105 86 79 80 79
GA FS 100 102 110 127 139 94 88 90 91 91 91 93
IA Non-FS 100 98 99 107 112 69 82 86 88 93 94 97
IL FS 100 104 107 98 74 80 55 58 58 61 64 64
IN Non-FS 100 103 108 116 123 73 89 87 96 98 97 101
KS FS 100 98 98 101 117 106 76 79 82 83 81 84
KY FS 100 101 104 105 108 104 87 80 81 87 88 91
LA FS 100 99 100 101 103 102 109 106 103 100 103 105
MA FS 100 98 94 100 115 131 137 140 145 138 140 147
MDa FS 100 92 96 101 107 86 83 86 86 88 93 90
MI FS 100 97 93 92 97 88 96 72 71 72 73 72
MNb FS 100 104 107 110 124 113 87 86 86 90 91 92
MOa Non-FS 100 113 127 117 118 85 104 106 110 131 95 135
MS FS 100 99 101 98 102 84 109 106 106 74 75 74
NC FS 100 99 98 99 111 110 110 106 101 105 102 104
NE FS 100 102 99 102 110 97 88 72 74 75 80 81
NJ Non-FS 100 99 106 114 114 66 80 84 85 88 91 90
NYa FS 100 98 99 97 97 98 100 100 99 100 100 90
OKa FS 100 101 104 102 100 97 101 103 113 125 100 95
ORa FS 100 104 104 109 122 80 72 73 75 77 80 82
PA FS 100 102 102 103 97 64 62 63 64 66 68 69
SC FS 100 98 109 124 129 128 127 113 85 84 84 85
TNb
FS 100 97 107 122 125 76 76 76 75 77 78 79
TX FS 100 100 106 127 133 93 91 93 95 96 99 98
VAc Non-FS/FS 100 107 121 121 127 87 99 102 100 101 97 102
WI Non-FS 100 110 121 121 124 88 91 90 94 98 99 99
100 100 101 103 107 97 95 95 95 96 97 98
100 105 114 118 122 80 95 98 101 105 107 110
c Virginia adopted its first workers’ compensation fee schedule for medical professional services effective January 1, 2018. Previously this state had no fee schedule.
Key: FS: fee schedule.
a The data for each of these states are not necessarily representative because each state is missing data from a larger data source that is significant in that state. The results in AZ, CO, MD, NY, OK, and OR are unlikely to be significantly under- or overestimated, given that these states use fee schedules to regulate the payment for professional services, and it is unlikely that the prices paid for the missing data source in each state were materially different from other data sources included in this study from the same state. For MO, to the extent that prices paid may differ for the missing data source compared with other data sources in the state, this may lead to possible under- or overestimations in the results.
b This state had fee schedule changes or updates within 2019 but after June 30, 2019, that are not reflected in the results.
Table B.7 Trends in Prices Paid for Professional Neurological/Neuromuscular Testing Services, WCRI MPI-WC, 2008 to 2019
Median growth rate in FS states
Median growth rate in non-FS states
Special notation: p We use the notation p to indicate that the 2019 numbers are preliminary results based on half-year price data through June 30, 2019.
Notes:
Calendar year 2008 is the base year, which is equal to 100 in the index.
Neurological/neuromuscular testing: The services in this group are largely made up of sensory and motor nerve conduction tests but also include range of motion tests and application of neurostimulators; these services may be billed by physicians as well as by chiropractors and physical therapists. See Table TA.2 for a detailed description of all service codes included in this group.
Prices paid for neurological/neuromuscular testing services in most study states decreased starting in 2013. This general trend is related to a fundamental change implemented by the Centers for Medicare & Medicaid Services in the coding system for nerve conduction studies, which are the most commonly billed procedures in the neurological/neuromuscular testing service group. For more details, see "Discussion of Substantial Changes in Prices at Service-Type Level" and "Technical Appendix."
p
copyright © 2020 workers compensation research institute109
_____________________________________________________________________________________________W C R I M E D I C A L P R I C E I N D E X F O R W O R K E R S ' C O M P E N S A T I O N , 1 2 T H E D I T I O N ( M P I - W C )

StateFee Regulation
Type2008 2009 2010 2011 2012 2013 2014 2015 2016 2017 2018 2019
AR FS 100 98 103 106 103 103 101 101 100 100 100 100
AZa,b FS 100 105 125 130 126 127 133 137 145 140 122 118
CA FS 100 101 102 98 98 99 87 92 97 101 102 103
COa FS 100 104 108 115 116 117 118 119 70 71 75 77
CTb FS 100 99 101 98 96 96 95 98 98 95 95 93
FL FS 100 101 100 101 101 101 100 100 103 106 106 112
GA FS 100 105 105 109 112 113 113 113 112 114 113 113
IA Non-FS 100 107 109 108 105 107 109 120 141 148 146 137
IL FS 100 106 106 99 86 89 89 90 90 92 96 97
IN Non-FS 100 111 121 121 135 139 153 179 193 194 197 195
KS FS 100 100 119 121 128 129 134 135 133 135 134 137
KY FS 100 103 104 108 108 108 126 141 145 167 179 197
LA FS 100 101 101 103 104 104 104 105 105 105 105 106
MA FS 100 106 112 109 110 109 108 107 107 108 108 107
MDa FS 100 101 102 109 113 114 112 113 113 112 116 107
MI FS 100 103 102 104 101 97 97 94 95 95 96 96
MNb FS 100 110 109 100 103 105 102 105 105 110 106 107
MOa Non-FS 100 112 121 119 123 134 155 185 198 209 212 208
MS FS 100 102 100 100 100 101 101 100 98 98 112 98
NC FS 100 104 108 105 104 104 104 120 137 137 135 139
NE FS 100 99 120 134 133 134 133 132 133 136 133 137
NJ Non-FS 100 111 115 120 127 127 111 109 115 120 126 123
NYa FS 100 104 104 122 123 128 128 128 127 126 127 129
OKa FS 100 101 101 104 118 124 114 114 112 111 110 111
ORa FS 100 104 137 124 115 113 112 114 117 118 117 118
PA FS 100 94 93 95 99 102 103 105 107 107 109 109
SC FS 100 101 122 129 130 129 130 131 130 128 129 129
TNb FS 100 106 117 120 112 106 105 106 105 105 102 102
TX FS 100 111 113 123 121 122 121 123 124 125 127 131
VAc Non-FS/FS 100 108 114 118 125 123 138 151 163 170 146 153
WI Non-FS 100 107 112 120 125 132 139 143 152 157 165 170
100 103 104 106 107 107 107 108 108 108 108 109
100 110 115 117 123 126 136 150 161 167 170 167
Key: FS: fee schedule.
Median growth rate in FS states
Median growth rate in non-FS states
Special notation: p We use the notation p to indicate that the 2019 numbers are preliminary results based on half-year price data through June 30, 2019.
Notes:
Calendar year 2008 is the base year, which is equal to 100 in the index.
Table B.8 Trends in Prices Paid for Professional Emergency Services, WCRI MPI-WC, 2008 to 2019
Emergency services: The services in this group include emergency department visits for patients with various levels of severity and office services provided on an emergency basis. See Table TA.2 for a detailed description of all service codes included in this group.
a The data for each of these states are not necessarily representative because each state is missing data from a larger data source that is significant in that state. The results in AZ, CO, MD, NY, OK, and OR are unlikely to be significantly under- or overestimated, given that these states use fee schedules to regulate the payment for professional services, and it is unlikely that the prices paid for the missing data source in each state were materially different from other data sources included in this study from the same state. For MO, to the extent that prices paid may differ for the missing data source compared with other data sources in the state, this may lead to possible under- or overestimations in the results.
b This state had fee schedule changes or updates within 2019 but after June 30, 2019, that are not reflected in the results.
c Virginia adopted its first workers’ compensation fee schedule for medical professional services effective January 1, 2018. Previously this state had no fee schedule.
p
copyright © 2020 workers compensation research institute110
_____________________________________________________________________________________________W C R I M E D I C A L P R I C E I N D E X F O R W O R K E R S ' C O M P E N S A T I O N , 1 2 T H E D I T I O N ( M P I - W C )

2008 2009 2010 2011 2012 2013 2014 2015 2016 2017 2018 2019
100 98 103 106 103 103 101 101 100 100 100 100
100 101 109 115 117 117 114 115 115 116 115 116
100 103 76 76 79 74 61 55 56 55 54 52
100 103 105 105 104 106 98 92 91 91 91 93
100 97 115 124 127 78 75 81 81 83 84 83
100 106 110 116 117 122 117 114 117 116 116 120
100 99 104 112 108 109 106 105 105 106 103 106
100 108 118 128 128 125 102 111 115 120 116 115
2008 to 2009
2009 to 2010
2010 to 2011
2011 to 2012
2012 to 2013
2013 to 2014
2014 to 2015
2015 to 2016
2016 to 2017
2017 to 2018
2018 to 2019
-2% 4% 3% -2% -1% -2% 0% -1% 0% 0% 0%
1% 8% 6% 2% 0% -2% 0% 0% 1% 0% 1%
3% -26% 1% 4% -7% -17% -10% 2% -2% -1% -4%
3% 2% 1% -1% 2% -8% -6% -1% 1% -1% 3%
-3% 19% 8% 2% -38% -4% 8% 0% 3% 1% -1%
6% 3% 6% 1% 4% -4% -3% 2% 0% 0% 4%
-1% 5% 8% -4% 2% -3% 0% 0% 1% -3% 2%
8% 10% 8% 0% -2% -19% 9% 4% 4% -3% -1%
a Prices paid for neurological/neuromuscular testing services in most study states decreased starting in 2013. This general trend is related to a fundamental change implemented by the Centers for Medicare & Medicaid Services in the coding system for nerve conduction studies, which are the most commonly billed procedures in the neurological/neuromuscular testing service group. For more details, see "Discussion of Substantial Changes in Prices at Service-Type Level" and "Technical Appendix."
Neurological/neuromuscular testinga
Figure C.1 Arkansas Trend in Professional Prices Paid by Service Group, 2008 to 2019
Arkansas Trend in Professional Prices Paid by Service Group, 2008 to 2019
Arkansas Annual Change in Professional Prices Paid by Service Group (%)
Professional Services
Emergency
Evaluation and management
Major radiology
Minor radiology
Physical medicine
Physical medicine
Major surgery
Pain management injections
Neurological/neuromuscular testinga
Evaluation and management
Special notation: p We use the notation p to indicate that the 2019 numbers are preliminary results based on half-year price data through June 30, 2019.
Notes: Arkansas' fee schedule for professional services has regular updates on the relative value units tied to the most recent Medicare resource-based relative value scale (RBRVS), with applied state conversion factors adopted in May 2000 for the services included in this study. The most recent update covered in the study period in this report was effective January 1, 2019.
Major surgery
Professional Services
Pain management injections
Major radiology
Minor radiology
Emergency
40
60
80
100
120
140
160
180
200
220
2008 2009 2010 2011 2012 2013 2014 2015 2016 2017 2018 2019
Ind
ex o
f P
rice
s P
aid
(bas
e ye
ar is
20
08
=1
00
)
Emergency
Evaluation andmanagement
Major radiology
Minor radiology
Neurological/neuromusculartesting
Physicalmedicine
Major surgery
Painmanagementinjections
p
p
p
copyright © 2020 workers compensation research institute111
_____________________________________________________________________________________________W C R I M E D I C A L P R I C E I N D E X F O R W O R K E R S ' C O M P E N S A T I O N , 1 2 T H E D I T I O N ( M P I - W C )

2008 2009 2010 2011 2012 2013 2014 2015 2016 2017 2018 2019
100 105 125 130 126 127 133 137 145 140 122 118
100 103 114 115 116 118 139 141 156 162 179 180
100 98 97 98 97 99 99 101 99 99 95 95
100 99 100 87 86 88 89 92 95 99 101 103
100 102 112 112 114 119 103 69 70 76 78 77
100 107 115 114 115 117 135 136 140 145 155 151
100 102 104 105 103 105 107 107 107 103 92 90
100 105 106 111 110 118 119 123 132 140 119 115
2008 to 2009
2009 to 2010
2010 to 2011
2011 to 2012
2012 to 2013
2013 to 2014
2014 to 2015
2015 to 2016
2016 to 2017
2017 to 2018
2018 to 2019
5% 19% 4% -3% 0% 5% 3% 6% -4% -13% -4%
3% 11% 1% 0% 2% 18% 2% 11% 4% 11% 0%
-2% -1% 1% -1% 2% 0% 3% -2% 0% -4% -1%
-1% 0% -13% -1% 2% 1% 4% 3% 5% 1% 2%
2% 10% 0% 2% 4% -14% -33% 1% 8% 2% -1%
7% 8% -1% 1% 2% 15% 1% 3% 4% 7% -3%
2% 2% 0% -2% 3% 2% 0% 0% -4% -11% -1%
5% 1% 4% -1% 7% 1% 3% 8% 6% -15% -3%
Major surgery
Arizona Trend in Professional Prices Paid by Service Group, 2008 to 2019
Arizona Annual Change in Professional Prices Paid by Service Group (%)
Figure C.2 Arizona Trend in Professional Prices Paid by Service Group, 2008 to 2019
Professional Services
Major radiology
Minor radiology
Physical medicine
Neurological/neuromuscular testinga
Emergency
Evaluation and management
Major radiology
Minor radiology
Neurological/neuromuscular testinga
Physical medicine
Major surgery
Pain management injections
Pain management injections
Professional Services
Special notation: p We use the notation p to indicate that the 2019 numbers are preliminary results based on half-year price data through June 30, 2019.
Notes:
The data for Arizona are not necessarily representative because they are missing data from a larger data source that is significant in this state. The results in Arizona are unlikely to be significantly under- or overestimated, given that the state uses a fee schedule to regulate the payment for professional services, and it is unlikely that the prices paid for the missing data source in Arizona were materially different from other data sources included in this study from the same state.
Arizona publishes its fee schedule annually with effective dates of October 1 through September 30 of the following year. The Industrial Commission of Arizona reviews the fee schedule values annually with a focus each year on one of four specific groups of codes and rotates through these specific groups of codes every four years. To calculate the fee schedule values for the codes under review, the Commission surveys the workers’ compensation fee schedules from the states of Colorado, Nevada, New Mexico, North Carolina, Oregon, Utah, and Washington and uses the following methodology: (a) current Arizona values between the 75th and 100th percentile of the states surveyed will not be adjusted; (b) current Arizona values over the 100th percentile of the states surveyed will be reduced to the 100th percentile; and (c) current Arizona values below the 75th percentile will be increased to the 75th percentile subject to the following: Increases shall be capped at 25 percent, unless and except as necessary to bring a current value up to the 50th percentile. In October 2013, Arizona reviewed and adjusted the fee schedule rates for evaluation and management, physical medicine, and surgery codes from 25000 to 39599. This update increased the fee schedule rates for evaluation and management and physical medicine services; the fee schedule rates for many common surgeries remained unchanged or had only small increases. The fee schedule effective October 2016 reflected a review of all codes. Effective October 1, 2017, Arizona transitioned to a resource-based relative value scale (RBRVS) based fee schedule. The impact of this fee schedule transition is examined in the section “Discussion of Substantial Changes in Prices at Service-Type Level.”
a Prices paid for neurological/neuromuscular testing services in most study states decreased starting in 2013. This general trend is related to a fundamental change implemented by the Centers for Medicare & Medicaid Services in the coding system for nerve conduction studies, which are the most commonly billed procedures in the neurological/neuromuscular testing service group. For more details, see "Discussion of Substantial Changes in Prices at Service-Type Level" and "Technical Appendix."
Evaluation and management
Emergency
40
60
80
100
120
140
160
180
200
220
2008 2009 2010 2011 2012 2013 2014 2015 2016 2017 2018 2019
Ind
ex o
f P
rice
s P
aid
(bas
e ye
ar is
20
08
=1
00
)
Emergency
Evaluation andmanagement
Major radiology
Minor radiology
Neurological/neuromusculartesting
Physicalmedicine
Major surgery
Painmanagementinjections
p
p
p
copyright © 2020 workers compensation research institute112
_____________________________________________________________________________________________W C R I M E D I C A L P R I C E I N D E X F O R W O R K E R S ' C O M P E N S A T I O N , 1 2 T H E D I T I O N ( M P I - W C )

2008 2009 2010 2011 2012 2013 2014 2015 2016 2017 2018 2019
100 101 102 98 98 99 87 92 97 101 102 103
100 100 101 101 100 100 131 138 147 154 157 159
100 100 100 100 99 95 76 70 66 62 62 61
100 100 100 100 100 100 114 103 98 93 94 98
100 101 102 100 97 100 58 62 67 68 72 73
100 105 104 104 103 99 126 129 136 142 142 143
100 103 106 107 106 109 86 82 76 71 71 72
100 100 98 98 97 97 94 94 89 84 83 88
2008 to 2009
2009 to 2010
2010 to 2011
2011 to 2012
2012 to 2013
2013 to 2014
2014 to 2015
2015 to 2016
2016 to 2017
2017 to 2018
2018 to 2019
1% 1% -4% 0% 0% -11% 5% 6% 4% 1% 1%
0% 0% 0% 0% 0% 30% 5% 7% 5% 2% 1%
0% 0% 0% -1% -4% -20% -8% -5% -6% -1% -1%
0% 0% 1% 0% 0% 14% -10% -5% -4% 1% 4%
1% 1% -1% -3% 4% -43% 8% 7% 1% 7% 1%
5% -1% 0% -1% -4% 27% 2% 6% 5% 0% 1%
3% 3% 1% -1% 2% -21% -5% -7% -6% 0% 1%
0% -1% -1% -1% 0% -4% 0% -5% -6% -1% 6%
California Trend in Professional Prices Paid by Service Group, 2008 to 2019
Figure C.3 California Trend in Professional Prices Paid by Service Group, 2008 to 2019
Professional Services
Neurological/neuromuscular testinga
Minor radiology
Physical medicine
Special notation: p We use the notation p to indicate that the 2019 numbers are preliminary results based on half-year price data through June 30, 2019.
Notes: Effective January 2014, California transitioned to an RBRVS-based fee schedule. This fee schedule change is a part of the workers’ compensation reform legislation outlined in Senate Bill 863. This legislation requires the adoption of Medicare’s RBRVS schedule for professional services to be phased in over four years, beginning in 2014, and to remain in effect until the Division of Workers’ Compensation adopts an RBRVS schedule that allows no more than 120 percent of the aggregate fees allowed by Medicare. During the four-year transition period, the conversion factors for primary care services increased and the conversion factors for specialty services decreased. The latest fee schedule update covered in the study period in this report was in April 2019. Before the change to an RBRVS-based fee schedule, California used the Official Medical Fee Schedule (OMFS) to regulate the payment of professional services, and the maximum reimbursement rates in the OMFS remained unchanged since 2007.
a Prices paid for neurological/neuromuscular testing services in most study states decreased starting in 2013. This general trend is related to a fundamental change implemented by the Centers for Medicare & Medicaid Services in the coding system for nerve conduction studies, which are the most commonly billed procedures in the neurological/neuromuscular testing service group. For more details, see "Discussion of Substantial Changes in Prices at Service-Type Level" and "Technical Appendix."
Key: RBRVS: resource-based relative value scale (Medicare).
Neurological/neuromuscular testinga
Pain management injections
California Annual Change in Professional Prices Paid by Service Group (%)
Emergency
Major surgery
Physical medicine
Evaluation and management
Major radiology
Minor radiology
Pain management injections
Professional Services
Emergency
Evaluation and management
Major radiology
Major surgery
40
60
80
100
120
140
160
180
200
220
2008 2009 2010 2011 2012 2013 2014 2015 2016 2017 2018 2019
Ind
ex o
f P
rice
s P
aid
(bas
e ye
ar is
20
08
=1
00
)
Emergency
Evaluation andmanagement
Major radiology
Minor radiology
Neurological/neuromusculartesting
Physicalmedicine
Major surgery
Painmanagementinjections
p
p
p
copyright © 2020 workers compensation research institute113
_____________________________________________________________________________________________W C R I M E D I C A L P R I C E I N D E X F O R W O R K E R S ' C O M P E N S A T I O N , 1 2 T H E D I T I O N ( M P I - W C )

2008 2009 2010 2011 2012 2013 2014 2015 2016 2017 2018 2019
100 104 108 115 116 117 118 119 70 71 75 77
100 104 108 113 115 116 118 119 125 130 138 139
100 104 104 105 102 104 103 103 90 77 81 81
100 101 101 103 105 105 106 106 156 126 127 129
100 98 98 102 116 119 58 61 91 91 95 99
100 102 109 112 114 116 119 117 123 126 129 133
100 100 99 105 105 107 106 106 78 79 91 91
100 90 110 107 112 116 72 71 86 79 93 80
2008 to 2009
2009 to 2010
2010 to 2011
2011 to 2012
2012 to 2013
2013 to 2014
2014 to 2015
2015 to 2016
2016 to 2017
2017 to 2018
2018 to 2019
4% 4% 6% 1% 1% 1% 1% -42% 2% 6% 2%
4% 4% 5% 2% 1% 1% 1% 6% 4% 6% 1%
4% 0% 1% -2% 2% -1% 0% -13% -14% 5% 1%
1% 0% 1% 2% 0% 1% 0% 47% -19% 1% 2%
-2% 0% 4% 14% 3% -52% 6% 50% 0% 4% 5%
2% 7% 3% 2% 2% 2% -2% 5% 2% 3% 3%
0% -1% 5% 0% 2% 0% -1% -26% 1% 15% 0%
-10% 23% -2% 4% 4% -38% -1% 21% -9% 18% -14%Pain management injections
Major radiology
Minor radiology
Neurological/neuromuscular testinga
Physical medicine
Major surgery
Minor radiology
Neurological/neuromuscular testinga
Physical medicine
Major surgery
Pain management injections
Professional Services
Figure C.4 Colorado Trend in Professional Prices Paid by Service Group, 2008 to 2019
Colorado Trend in Professional Prices Paid by Service Group, 2008 to 2019
Colorado Annual Change in Professional Prices Paid by Service Group (%)
Special notation: p We use the notation p to indicate that the 2019 numbers are preliminary results based on half-year price data through June 30, 2019.
Notes:
The data for Colorado are not necessarily representative because they are missing data from a larger data source that is significant in this state. The results in Colorado are unlikely to be significantly under- or overestimated, given that the state uses a fee schedule to regulate the payment for professional services, and it is unlikely that the prices paid for the missing data source in Colorado were materially different from other data sources included in this study from the same state.
Colorado usually updates its fee schedule for professional services annually in January. The most recent update covered in the study period in this report was effective January 1, 2019. In January 2016, Colorado revised its fee schedule for professional services and incorporated the use of relative values from the National Physician Fee Schedule Relative Value Scale file (RBRVS) published by Medicare in January 2015. Previously, Colorado based its fee schedule levels on relative value units (RVUs) from the Relative Values for Physicians, currently
published by OPTUM360°.
a Prices paid for neurological/neuromuscular testing services in most study states decreased starting in 2013. This general trend is related to a fundamental change implemented by the Centers for Medicare & Medicaid Services in the coding system for nerve conduction studies, which are the most commonly billed procedures in the neurological/neuromuscular testing service group. For more details, see "Discussion of Substantial Changes in Prices at Service-Type Level" and "Technical Appendix."
Key: RBRVS: resource-based relative value scale (Medicare).
Emergency
Evaluation and management
Professional Services
Emergency
Evaluation and management
Major radiology
40
60
80
100
120
140
160
180
200
220
2008 2009 2010 2011 2012 2013 2014 2015 2016 2017 2018 2019
Ind
ex o
f P
rice
s P
aid
(bas
e ye
ar is
20
08
=1
00
)
Emergency
Evaluation andmanagement
Major radiology
Minor radiology
Neurological/neuromusculartesting
Physicalmedicine
Major surgery
Painmanagementinjections
p
p
p
copyright © 2020 workers compensation research institute114
_____________________________________________________________________________________________W C R I M E D I C A L P R I C E I N D E X F O R W O R K E R S ' C O M P E N S A T I O N , 1 2 T H E D I T I O N ( M P I - W C )

2008 2009 2010 2011 2012 2013 2014 2015 2016 2017 2018 2019
100 99 101 98 96 96 95 98 98 95 95 93
100 106 116 127 131 131 133 135 133 133 132 132
100 109 108 112 107 103 91 80 77 77 78 74
100 105 103 103 99 102 98 91 87 87 87 86
100 100 96 90 88 73 61 60 59 59 61 62
100 104 108 113 113 114 118 119 120 121 122 122
100 101 99 99 96 94 94 94 96 95 94 95
100 100 105 102 99 98 93 97 103 112 110 118
2008 to 2009
2009 to 2010
2010 to 2011
2011 to 2012
2012 to 2013
2013 to 2014
2014 to 2015
2015 to 2016
2016 to 2017
2017 to 2018
2018 to 2019
-1% 1% -3% -2% 0% -1% 3% 0% -2% 0% -3%
6% 9% 9% 4% 0% 1% 2% -1% 0% 0% 0%
9% -2% 4% -5% -3% -12% -12% -3% 0% 1% -5%
5% -3% 1% -5% 3% -4% -7% -5% 0% 0% 0%
0% -4% -6% -2% -18% -16% -2% -1% 0% 2% 2%
4% 4% 5% 0% 1% 4% 1% 1% 1% 0% 0%
1% -2% 0% -3% -2% 0% 1% 2% -1% -1% 1%
0% 5% -3% -2% -2% -4% 4% 5% 9% -1% 8%
Major surgery
Major surgery
Physical medicine
Neurological/neuromuscular testinga
Physical medicine
Professional Services
Evaluation and management
Minor radiology
Pain management injections
Major radiology
Professional Services
Emergency
Evaluation and management
Pain management injections
Major radiology
Minor radiology
Emergency
a Prices paid for neurological/neuromuscular testing services in most study states decreased starting in 2013. This general trend is related to a fundamental change implemented by the Centers for Medicare & Medicaid Services in the coding system for nerve conduction studies, which are the most commonly billed procedures in the neurological/neuromuscular testing service group. For more details, see "Discussion of Substantial Changes in Prices at Service-Type Level" and "Technical Appendix."
Neurological/neuromuscular testinga
Figure C.5 Connecticut Trend in Professional Prices Paid by Service Group, 2008 to 2019
Connecticut Trend in Professional Prices Paid by Service Group, 2008 to 2019
Connecticut Annual Change in Professional Prices Paid by Service Group (%)
Special notation: p We use the notation p to indicate that the 2019 numbers are preliminary results based on half-year price data through June 30, 2019.
Notes: Connecticut has updated its fee schedule for professional services annually in July since 2008. The most recent update covered during the study period in this report was the 2018 Official Connecticut Practitioner Fee Schedule effective July 15, 2018.
40
60
80
100
120
140
160
180
200
220
2008 2009 2010 2011 2012 2013 2014 2015 2016 2017 2018 2019
Ind
ex o
f P
rice
s P
aid
(bas
e ye
ar is
20
08
=1
00
)
Emergency
Evaluation andmanagement
Major radiology
Minor radiology
Neurological/neuromusculartesting
Physicalmedicine
Major surgery
Painmanagementinjections
p
p
p
copyright © 2020 workers compensation research institute115
_____________________________________________________________________________________________W C R I M E D I C A L P R I C E I N D E X F O R W O R K E R S ' C O M P E N S A T I O N , 1 2 T H E D I T I O N ( M P I - W C )

2008 2009 2010 2011 2012 2013 2014 2015 2016 2017 2018 2019
100 101 100 101 101 101 100 100 103 106 106 112
100 102 104 104 104 103 104 103 113 124 124 125
100 104 105 99 99 97 96 96 94 94 90 90
100 103 109 103 103 103 103 102 103 101 97 102
100 101 102 103 103 104 105 105 86 79 80 79
100 107 108 103 104 102 104 104 112 118 118 121
100 102 99 97 96 97 99 97 93 93 94 91
100 100 102 98 97 101 102 101 96 105 101 105
2008 to 2009
2009 to 2010
2010 to 2011
2011 to 2012
2012 to 2013
2013 to 2014
2014 to 2015
2015 to 2016
2016 to 2017
2017 to 2018
2018 to 2019
1% 0% 1% 0% 0% 0% 0% 3% 3% 0% 5%
2% 1% 0% 0% -1% 1% -1% 10% 9% 0% 1%
4% 1% -5% -1% -1% -1% -1% -2% 0% -4% 0%
3% 5% -5% 0% 0% 0% -1% 1% -3% -4% 5%
1% 2% 0% 0% 1% 1% 0% -18% -9% 1% -1%
7% 1% -5% 1% -2% 2% 1% 7% 6% 0% 3%
2% -3% -2% -1% 1% 3% -2% -4% 0% 0% -3%
0% 2% -4% -1% 4% 1% -1% -5% 9% -3% 4%
Major surgery
Pain management injections
Professional Services
Emergency
Evaluation and management
Major radiology
Minor radiology
Neurological/neuromuscular testinga
Physical medicine
Major surgery
Pain management injections
Figure C.6 Florida Trend in Professional Prices Paid by Service Group, 2008 to 2019
Florida Trend in Professional Prices Paid by Service Group, 2008 to 2019
Florida Annual Change in Professional Prices Paid by Service Group (%)
Special notation: p We use the notation p to indicate that the 2019 numbers are preliminary results based on half-year price data through June 30, 2019.
Notes: Florida implemented a fee schedule update effective July 1, 2016 (i.e., the 2015 edition of the Florida workers’ compensation health care provider reimbursement manual). The updated fee schedule rates reflected the 2014 Medicare rates in the maximum allowable reimbursement (MAR) computation. Before this change, the fee schedule rates in Florida were set at 140 percent of the 2008 Medicare rates for surgeries and 110 percent of the 2008 Medicare rates for other professional services. Effective July 1, 2017, Florida implemented another update to its medical fee schedule for professional services (i.e., the 2016 edition of the Florida workers' compensation health care provider reimbursement manual); this most recent update covered in the study period was not expected to have a material impact on the system costs.
As shown in this figure, prices paid in Florida increased for some types of services and decreased or remained stable for others following these fee schedule updates. From 2015 to 2018, prices paid increased 20 percent for evaluation and management (primarily office visits), 13 percent for physical medicine, and 6 percent for emergency services. During the same period, prices paid decreased for major surgery (4 percent), minor radiology (5 percent), major radiology (6 percent), and neurological/neuromuscular testing services (24 percent). Prices paid for pain management injections remained fairly stable between 2015 and 2018. Some of these price changes may reflect the changes in Medicare fee schedule rates and/or coding, and others may be related to the reimbursement rules in the Florida workers’ compensation fee schedule. Some results at the service group level masked offsetting trends in the prices paid for individual medical procedures.
a Prices paid for neurological/neuromuscular testing services in most study states decreased starting in 2013. This general trend is related to a fundamental change implemented by the Centers for Medicare & Medicaid Services in the coding system for nerve conduction studies, which are the most commonly billed procedures in the neurological/neuromuscular testing service group. For more details, see "Discussion of Substantial Changes in Prices at Service-Type Level" and "Technical Appendix."
Professional Services
Evaluation and management
Physical medicine
Neurological/neuromuscular testinga
Minor radiology
Major radiology
Emergency
40
60
80
100
120
140
160
180
200
220
2008 2009 2010 2011 2012 2013 2014 2015 2016 2017 2018 2019
Ind
ex o
f P
rice
s P
aid
(bas
e ye
ar is
20
08
=1
00
)
Emergency
Evaluation andmanagement
Major radiology
Minor radiology
Neurological/neuromusculartesting
Physicalmedicine
Major surgery
Painmanagementinjections
p
p
p
copyright © 2020 workers compensation research institute116
_____________________________________________________________________________________________W C R I M E D I C A L P R I C E I N D E X F O R W O R K E R S ' C O M P E N S A T I O N , 1 2 T H E D I T I O N ( M P I - W C )
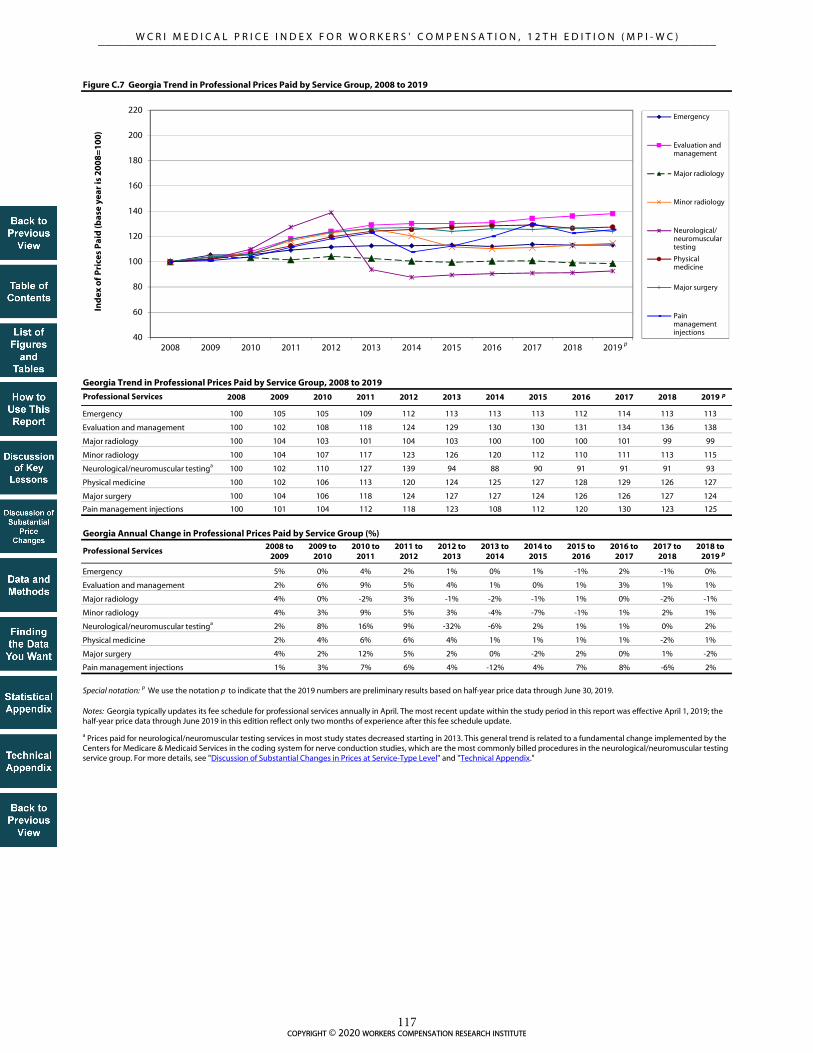
2008 2009 2010 2011 2012 2013 2014 2015 2016 2017 2018 2019
100 105 105 109 112 113 113 113 112 114 113 113
100 102 108 118 124 129 130 130 131 134 136 138
100 104 103 101 104 103 100 100 100 101 99 99
100 104 107 117 123 126 120 112 110 111 113 115
100 102 110 127 139 94 88 90 91 91 91 93
100 102 106 113 120 124 125 127 128 129 126 127
100 104 106 118 124 127 127 124 126 126 127 124
100 101 104 112 118 123 108 112 120 130 123 125
2008 to 2009
2009 to 2010
2010 to 2011
2011 to 2012
2012 to 2013
2013 to 2014
2014 to 2015
2015 to 2016
2016 to 2017
2017 to 2018
2018 to 2019
5% 0% 4% 2% 1% 0% 1% -1% 2% -1% 0%
2% 6% 9% 5% 4% 1% 0% 1% 3% 1% 1%
4% 0% -2% 3% -1% -2% -1% 1% 0% -2% -1%
4% 3% 9% 5% 3% -4% -7% -1% 1% 2% 1%
2% 8% 16% 9% -32% -6% 2% 1% 1% 0% 2%
2% 4% 6% 6% 4% 1% 1% 1% 1% -2% 1%
4% 2% 12% 5% 2% 0% -2% 2% 0% 1% -2%
1% 3% 7% 6% 4% -12% 4% 7% 8% -6% 2%
Physical medicine
Physical medicine
Major surgery
Pain management injections
Emergency
Evaluation and management
Major radiology
Minor radiology
Neurological/neuromuscular testinga
Major radiology
Neurological/neuromuscular testinga
Emergency
a Prices paid for neurological/neuromuscular testing services in most study states decreased starting in 2013. This general trend is related to a fundamental change implemented by the Centers for Medicare & Medicaid Services in the coding system for nerve conduction studies, which are the most commonly billed procedures in the neurological/neuromuscular testing service group. For more details, see "Discussion of Substantial Changes in Prices at Service-Type Level" and "Technical Appendix."
Figure C.7 Georgia Trend in Professional Prices Paid by Service Group, 2008 to 2019
Georgia Trend in Professional Prices Paid by Service Group, 2008 to 2019
Georgia Annual Change in Professional Prices Paid by Service Group (%)
Special notation: p We use the notation p to indicate that the 2019 numbers are preliminary results based on half-year price data through June 30, 2019.
Notes: Georgia typically updates its fee schedule for professional services annually in April. The most recent update within the study period in this report was effective April 1, 2019; the half-year price data through June 2019 in this edition reflect only two months of experience after this fee schedule update.
Pain management injections
Major surgery
Professional Services
Professional Services
Evaluation and management
Minor radiology
40
60
80
100
120
140
160
180
200
220
2008 2009 2010 2011 2012 2013 2014 2015 2016 2017 2018 2019
Ind
ex o
f P
rice
s P
aid
(bas
e ye
ar is
20
08
=1
00
)
Emergency
Evaluation andmanagement
Major radiology
Minor radiology
Neurological/neuromusculartesting
Physicalmedicine
Major surgery
Painmanagementinjections
p
p
p
copyright © 2020 workers compensation research institute117
_____________________________________________________________________________________________W C R I M E D I C A L P R I C E I N D E X F O R W O R K E R S ' C O M P E N S A T I O N , 1 2 T H E D I T I O N ( M P I - W C )

2008 2009 2010 2011 2012 2013 2014 2015 2016 2017 2018 2019
100 107 109 108 105 107 109 120 141 148 146 137
100 107 111 114 116 120 124 124 127 132 134 136
100 103 103 105 105 112 114 108 105 98 91 89
100 103 105 102 101 102 101 100 104 105 106 106
100 98 99 107 112 69 82 86 88 93 94 97
100 106 112 115 112 111 115 118 124 125 142 146
100 105 105 109 105 102 96 94 96 97 99 98
100 114 119 123 120 118 125 113 105 119 126 123
2008 to 2009
2009 to 2010
2010 to 2011
2011 to 2012
2012 to 2013
2013 to 2014
2014 to 2015
2015 to 2016
2016 to 2017
2017 to 2018
2018 to 2019
7% 2% -1% -2% 2% 2% 10% 17% 5% -1% -7%
7% 4% 2% 2% 3% 3% 0% 2% 4% 1% 1%
3% 1% 2% 0% 7% 2% -6% -3% -7% -7% -2%
3% 2% -3% 0% 1% -1% -1% 3% 1% 1% 0%
-2% 1% 8% 4% -38% 19% 5% 3% 5% 1% 3%
6% 5% 3% -3% 0% 4% 2% 5% 1% 14% 2%
5% -1% 4% -4% -2% -6% -2% 2% 0% 3% -1%
14% 4% 3% -2% -2% 6% -10% -7% 13% 7% -3%Pain management injections
Emergency
Evaluation and management
Minor radiology
Professional Services
Emergency
Evaluation and management
Major radiology
Minor radiology
Neurological/neuromuscular testinga
Physical medicine
Major surgery
Major radiology
Neurological/neuromuscular testinga
Figure C.8 Iowa Trend in Professional Prices Paid by Service Group, 2008 to 2019
Special notation: p We use the notation p to indicate that the 2019 numbers are preliminary results based on half-year price data through June 30, 2019.
Note: Iowa did not have a workers' compensation fee schedule as of 2019.
a Prices paid for neurological/neuromuscular testing services in most study states decreased starting in 2013. This general trend is related to a fundamental change implemented by the Centers for Medicare & Medicaid Services in the coding system for nerve conduction studies, which are the most commonly billed procedures in the neurological/neuromuscular testing service group. For more details, see "Discussion of Substantial Changes in Prices at Service-Type Level" and "Technical Appendix."
Iowa Trend in Professional Prices Paid by Service Group, 2008 to 2019
Iowa Annual Change in Professional Prices Paid by Service Group (%)
Professional Services
Pain management injections
Major surgery
Physical medicine
40
60
80
100
120
140
160
180
200
220
2008 2009 2010 2011 2012 2013 2014 2015 2016 2017 2018 2019
Ind
ex o
f P
rice
s P
aid
(bas
e ye
ar is
20
08
=1
00
)
Emergency
Evaluation andmanagement
Major radiology
Minor radiology
Neurological/neuromusculartesting
Physicalmedicine
Major surgery
Painmanagementinjections
p
p
p
copyright © 2020 workers compensation research institute118
_____________________________________________________________________________________________W C R I M E D I C A L P R I C E I N D E X F O R W O R K E R S ' C O M P E N S A T I O N , 1 2 T H E D I T I O N ( M P I - W C )

2008 2009 2010 2011 2012 2013 2014 2015 2016 2017 2018 2019
100 106 106 99 86 89 89 90 90 92 96 97
100 104 105 97 78 79 83 87 88 89 91 94
100 102 105 94 80 85 83 83 82 83 85 87
100 104 107 94 75 77 78 80 80 81 82 84
100 104 107 98 74 80 55 58 58 61 64 64
100 109 113 102 84 85 86 87 87 89 91 92
100 106 110 99 77 78 78 79 78 80 82 85
100 112 123 110 89 92 92 94 95 104 111 115
2008 to 2009
2009 to 2010
2010 to 2011
2011 to 2012
2012 to 2013
2013 to 2014
2014 to 2015
2015 to 2016
2016 to 2017
2017 to 2018
2018 to 2019
6% 0% -7% -12% 3% 0% 1% 1% 2% 5% 1%
4% 1% -7% -19% 1% 4% 5% 1% 1% 2% 3%
2% 3% -10% -15% 5% -2% 0% -1% 1% 2% 2%
4% 3% -12% -20% 3% 1% 2% 1% 1% 1% 2%
4% 3% -9% -24% 8% -31% 6% -1% 5% 6% -1%
9% 3% -10% -17% 1% 1% 1% 0% 2% 2% 1%
6% 4% -10% -22% 1% -1% 1% -1% 3% 2% 4%
12% 9% -11% -19% 4% 0% 2% 2% 10% 7% 4%
Special notation: p We use the notation p to indicate that the 2019 numbers are preliminary results based on half-year price data through June 30, 2019.
Notes:
Illinois implemented a workers’ compensation fee schedule in February 2006. This workers' compensation fee schedule for professional services set different maximum reimbursement rates for the same services for each of 29 different areas of the state based on the first three digits of the zip code where the service was delivered. The 29 fee schedules ranged from a low of 115 percent above Medicare to a high of 219 percent above Medicare—a difference of 104 percentage points. This difference might create unintended incentives for providers to control revenue by moving the site of service. Prices in this study represent the aggregate state-level estimation without drilling down to the 29 geozip areas; therefore, the price trends after 2006 could be influenced by the potential behavior changes of the providers. In September 2011, Illinois enacted new legislation that introduced a 30 percent decrease in the fee schedule rates. On January 1, 2012, Illinois discontinued its use of the 29 geozip areas for physicians and other providers in favor of four county-based regions.
After further review, Illinois determined that the 30 percent decrease implemented across all services in September 2011 caused fee schedule rates for certain evaluation and management services to fall below appropriate fee schedule levels, which resulted in more limited access to medical care for workers. Effective July 16, 2014, the state adjusted its fee schedule to increase the fee schedule rates for these evaluation and management codes to a level more comparable to Medicare rates. The most recent update covered in the study period in this report was effective January 1, 2019.
a Prices paid for neurological/neuromuscular testing services in most study states decreased starting in 2013. This general trend is related to a fundamental change implemented by the Centers for Medicare & Medicaid Services in the coding system for nerve conduction studies, which are the most commonly billed procedures in the neurological/neuromuscular testing service group. For more details, see "Discussion of Substantial Changes in Prices at Service-Type Level" and "Technical Appendix."
Pain management injections
Neurological/neuromuscular testinga
Physical medicine
Illinois Annual Change in Professional Prices Paid by Service Group (%)
Major surgery
Professional Services
Emergency
Physical medicine
Illinois Trend in Professional Prices Paid by Service Group, 2008 to 2019
Figure C.9 Illinois Trend in Professional Prices Paid by Service Group, 2008 to 2019
Neurological/neuromuscular testinga
Minor radiology
Major surgery
Pain management injections
Evaluation and management
Major radiology
Minor radiology
Evaluation and management
Professional Services
Emergency
Major radiology
40
60
80
100
120
140
160
180
200
220
2008 2009 2010 2011 2012 2013 2014 2015 2016 2017 2018 2019
Ind
ex o
f P
rice
s P
aid
(bas
e ye
ar is
20
08
=1
00
)
Emergency
Evaluation andmanagement
Major radiology
Minor radiology
Neurological/neuromusculartesting
Physicalmedicine
Major surgery
Painmanagementinjections
p
p
p
copyright © 2020 workers compensation research institute119
_____________________________________________________________________________________________W C R I M E D I C A L P R I C E I N D E X F O R W O R K E R S ' C O M P E N S A T I O N , 1 2 T H E D I T I O N ( M P I - W C )

2008 2009 2010 2011 2012 2013 2014 2015 2016 2017 2018 2019
100 111 121 121 135 139 153 179 193 194 197 195
100 104 111 115 117 118 125 134 136 141 143 145
100 101 103 100 101 105 105 103 97 102 99 100
100 104 107 105 106 106 106 108 108 109 109 106
100 103 108 116 123 73 89 87 96 98 97 101
100 107 113 107 117 119 133 142 150 156 160 160
100 114 122 120 128 122 122 128 127 122 121 116
100 103 119 119 120 124 128 135 142 158 150 160
2008 to 2009
2009 to 2010
2010 to 2011
2011 to 2012
2012 to 2013
2013 to 2014
2014 to 2015
2015 to 2016
2016 to 2017
2017 to 2018
2018 to 2019
11% 9% 1% 11% 3% 10% 17% 8% 0% 2% -1%
4% 6% 4% 2% 1% 6% 7% 1% 4% 1% 1%
1% 2% -2% 0% 5% 0% -3% -6% 5% -2% 1%
4% 3% -2% 0% 0% 1% 2% 0% 1% -1% -2%
3% 5% 7% 6% -41% 21% -2% 11% 2% -1% 4%
7% 6% -5% 9% 1% 12% 7% 6% 4% 3% 0%
14% 7% -1% 7% -5% 0% 5% -1% -4% 0% -4%
3% 16% 0% 1% 3% 3% 5% 5% 11% -5% 7%
Special notation: p We use the notation p to indicate that the 2019 numbers are preliminary results based on half-year price data through June 30, 2019.
Note: Indiana did not have a workers' compensation fee schedule as of 2019.
a Prices paid for neurological/neuromuscular testing services in most study states decreased starting in 2013. This general trend is related to a fundamental change implemented by the Centers for Medicare & Medicaid Services in the coding system for nerve conduction studies, which are the most commonly billed procedures in the neurological/neuromuscular testing service group. For more details, see "Discussion of Substantial Changes in Prices at Service-Type Level" and "Technical Appendix."
Minor radiology
Neurological/neuromuscular testinga
Physical medicine
Major surgery
Indiana Trend in Professional Prices Paid by Service Group, 2008 to 2019
Indiana Annual Change in Professional Prices Paid by Service Group (%)
Figure C.10 Indiana Trend in Professional Prices Paid by Service Group, 2008 to 2019
Physical medicine
Neurological/neuromuscular testinga
Major surgery
Pain management injections
Professional Services
Emergency
Evaluation and management
Pain management injections
Major radiology
Professional Services
Minor radiology
Emergency
Evaluation and management
Major radiology
40
60
80
100
120
140
160
180
200
220
2008 2009 2010 2011 2012 2013 2014 2015 2016 2017 2018 2019
Ind
ex o
f P
rice
s P
aid
(bas
e ye
ar is
20
08
=1
00
)
Emergency
Evaluation andmanagement
Major radiology
Minor radiology
Neurological/neuromusculartesting
Physicalmedicine
Major surgery
Painmanagementinjections
p
p
p
copyright © 2020 workers compensation research institute120
_____________________________________________________________________________________________W C R I M E D I C A L P R I C E I N D E X F O R W O R K E R S ' C O M P E N S A T I O N , 1 2 T H E D I T I O N ( M P I - W C )

2008 2009 2010 2011 2012 2013 2014 2015 2016 2017 2018 2019
100 100 119 121 128 129 134 135 133 135 134 137
100 100 115 120 128 130 140 139 140 145 146 147
100 105 98 93 82 84 64 55 57 53 52 51
100 101 99 96 101 99 105 96 95 90 90 91
100 98 98 101 117 106 76 79 82 83 81 84
100 101 102 103 113 113 127 123 121 121 124 126
100 106 109 110 109 113 116 111 111 111 111 111
100 106 95 92 95 96 98 81 79 95 91 107
2008 to 2009
2009 to 2010
2010 to 2011
2011 to 2012
2012 to 2013
2013 to 2014
2014 to 2015
2015 to 2016
2016 to 2017
2017 to 2018
2018 to 2019
0% 19% 2% 6% 1% 3% 1% -1% 1% -1% 2%
0% 14% 5% 7% 1% 8% -1% 1% 3% 1% 1%
5% -7% -5% -12% 2% -23% -14% 3% -6% -2% -2%
1% -2% -3% 6% -2% 5% -8% -1% -5% 0% 2%
-2% 0% 2% 17% -10% -28% 3% 4% 1% -2% 3%
1% 1% 1% 10% 0% 12% -3% -1% 0% 2% 1%
6% 3% 0% -1% 4% 3% -4% 0% 0% -1% 1%
6% -10% -4% 3% 1% 3% -18% -2% 21% -4% 17%Pain management injections
Major radiology
Minor radiology
Neurological/neuromuscular testinga
Physical medicine
Major surgery
a Prices paid for neurological/neuromuscular testing services in most study states decreased starting in 2013. This general trend is related to a fundamental change implemented by the Centers for Medicare & Medicaid Services in the coding system for nerve conduction studies, which are the most commonly billed procedures in the neurological/neuromuscular testing service group. For more details, see "Discussion of Substantial Changes in Prices at Service-Type Level" and "Technical Appendix."
Pain management injections
Professional Services
Emergency
Figure C.11 Kansas Trend in Professional Prices Paid by Service Group, 2008 to 2019
Kansas Trend in Professional Prices Paid by Service Group, 2008 to 2019
Kansas Annual Change in Professional Prices Paid by Service Group (%)
Special notation: p We use the notation p to indicate that the 2019 numbers are preliminary results based on half-year price data through June 30, 2019.
Notes: Kansas typically updates its fee schedule for professional services either annually or biennially in January. The most recent update covered in the study period in this report was effective March 29, 2019.
Evaluation and management
Professional Services
Emergency
Evaluation and management
Major radiology
Minor radiology
Neurological/neuromuscular testinga
Physical medicine
Major surgery
40
60
80
100
120
140
160
180
200
220
2008 2009 2010 2011 2012 2013 2014 2015 2016 2017 2018 2019
Ind
ex o
f P
rice
s P
aid
(bas
e ye
ar is
20
08
=1
00
)
Emergency
Evaluation andmanagement
Major radiology
Minor radiology
Neurological/neuromusculartesting
Physicalmedicine
Major surgery
Painmanagementinjections
p
p
p
copyright © 2020 workers compensation research institute121
_____________________________________________________________________________________________W C R I M E D I C A L P R I C E I N D E X F O R W O R K E R S ' C O M P E N S A T I O N , 1 2 T H E D I T I O N ( M P I - W C )
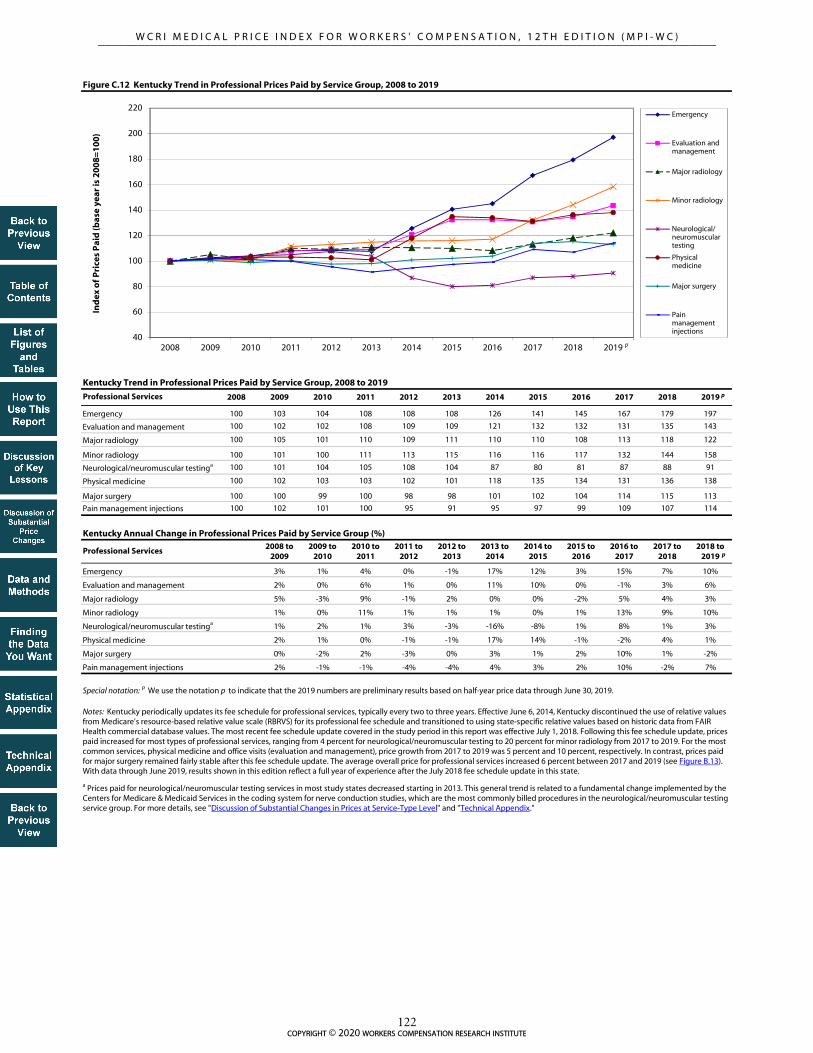
2008 2009 2010 2011 2012 2013 2014 2015 2016 2017 2018 2019
100 103 104 108 108 108 126 141 145 167 179 197
100 102 102 108 109 109 121 132 132 131 135 143
100 105 101 110 109 111 110 110 108 113 118 122
100 101 100 111 113 115 116 116 117 132 144 158
100 101 104 105 108 104 87 80 81 87 88 91
100 102 103 103 102 101 118 135 134 131 136 138
100 100 99 100 98 98 101 102 104 114 115 113
100 102 101 100 95 91 95 97 99 109 107 114
2008 to 2009
2009 to 2010
2010 to 2011
2011 to 2012
2012 to 2013
2013 to 2014
2014 to 2015
2015 to 2016
2016 to 2017
2017 to 2018
2018 to 2019
3% 1% 4% 0% -1% 17% 12% 3% 15% 7% 10%
2% 0% 6% 1% 0% 11% 10% 0% -1% 3% 6%
5% -3% 9% -1% 2% 0% 0% -2% 5% 4% 3%
1% 0% 11% 1% 1% 1% 0% 1% 13% 9% 10%
1% 2% 1% 3% -3% -16% -8% 1% 8% 1% 3%
2% 1% 0% -1% -1% 17% 14% -1% -2% 4% 1%
0% -2% 2% -3% 0% 3% 1% 2% 10% 1% -2%
2% -1% -1% -4% -4% 4% 3% 2% 10% -2% 7%Pain management injections
Major radiology
Minor radiology
Neurological/neuromuscular testinga
Physical medicine
Major surgery
a Prices paid for neurological/neuromuscular testing services in most study states decreased starting in 2013. This general trend is related to a fundamental change implemented by the Centers for Medicare & Medicaid Services in the coding system for nerve conduction studies, which are the most commonly billed procedures in the neurological/neuromuscular testing service group. For more details, see "Discussion of Substantial Changes in Prices at Service-Type Level" and "Technical Appendix."
Pain management injections
Professional Services
Emergency
Figure C.12 Kentucky Trend in Professional Prices Paid by Service Group, 2008 to 2019
Kentucky Trend in Professional Prices Paid by Service Group, 2008 to 2019
Kentucky Annual Change in Professional Prices Paid by Service Group (%)
Special notation: p We use the notation p to indicate that the 2019 numbers are preliminary results based on half-year price data through June 30, 2019.
Notes: Kentucky periodically updates its fee schedule for professional services, typically every two to three years. Effective June 6, 2014, Kentucky discontinued the use of relative values from Medicare's resource-based relative value scale (RBRVS) for its professional fee schedule and transitioned to using state-specific relative values based on historic data from FAIR Health commercial database values. The most recent fee schedule update covered in the study period in this report was effective July 1, 2018. Following this fee schedule update, prices paid increased for most types of professional services, ranging from 4 percent for neurological/neuromuscular testing to 20 percent for minor radiology from 2017 to 2019. For the most common services, physical medicine and office visits (evaluation and management), price growth from 2017 to 2019 was 5 percent and 10 percent, respectively. In contrast, prices paid for major surgery remained fairly stable after this fee schedule update. The average overall price for professional services increased 6 percent between 2017 and 2019 (see Figure B.13). With data through June 2019, results shown in this edition reflect a full year of experience after the July 2018 fee schedule update in this state.
Evaluation and management
Professional Services
Emergency
Evaluation and management
Major radiology
Minor radiology
Neurological/neuromuscular testinga
Physical medicine
Major surgery
40
60
80
100
120
140
160
180
200
220
2008 2009 2010 2011 2012 2013 2014 2015 2016 2017 2018 2019
Ind
ex o
f P
rice
s P
aid
(bas
e ye
ar is
20
08
=1
00
)
Emergency
Evaluation andmanagement
Major radiology
Minor radiology
Neurological/neuromusculartesting
Physicalmedicine
Major surgery
Painmanagementinjections
p
p
p
copyright © 2020 workers compensation research institute122
_____________________________________________________________________________________________W C R I M E D I C A L P R I C E I N D E X F O R W O R K E R S ' C O M P E N S A T I O N , 1 2 T H E D I T I O N ( M P I - W C )

2008 2009 2010 2011 2012 2013 2014 2015 2016 2017 2018 2019
100 101 101 103 104 104 104 105 105 105 105 106
100 102 102 104 105 106 108 108 109 108 108 108
100 105 106 107 106 105 102 102 93 85 85 85
100 102 104 105 106 105 105 105 104 103 103 104
100 99 100 101 103 102 109 106 103 100 103 105
100 106 106 107 109 111 115 113 115 114 114 114
100 103 106 104 104 105 105 105 105 106 105 107
100 108 107 105 115 118 112 125 124 130 130 141
2008 to 2009
2009 to 2010
2010 to 2011
2011 to 2012
2012 to 2013
2013 to 2014
2014 to 2015
2015 to 2016
2016 to 2017
2017 to 2018
2018 to 2019
1% 0% 2% 1% 0% 0% 1% 0% 0% 0% 1%
2% 1% 2% 1% 1% 2% 0% 0% 0% 0% 0%
5% 1% 1% -1% 0% -3% 0% -9% -9% 0% 0%
2% 2% 1% 1% -1% 0% 0% -1% -2% 1% 1%
-1% 1% 1% 1% -1% 7% -2% -3% -3% 3% 2%
6% 0% 1% 2% 2% 3% -1% 1% -1% 1% 0%
3% 3% -2% 0% 1% -1% 0% 0% 0% -1% 2%
8% -1% -2% 10% 2% -5% 11% -1% 5% 0% 8%
Professional Services
Emergency
Evaluation and management
Major radiology
Pain management injections
a Prices paid for neurological/neuromuscular testing services in most study states decreased starting in 2013. This general trend is related to a fundamental change implemented by the Centers for Medicare & Medicaid Services in the coding system for nerve conduction studies, which are the most commonly billed procedures in the neurological/neuromuscular testing service group. For more details, see "Discussion of Substantial Changes in Prices at Service-Type Level" and "Technical Appendix."
Physical medicine
Major surgery
Key: CPT: Current Procedural Terminology.
Figure C.13 Louisiana Trend in Professional Prices Paid by Service Group, 2008 to 2019
Louisiana Trend in Professional Prices Paid by Service Group, 2008 to 2019
Louisiana Annual Change in Professional Prices Paid by Service Group (%)
Special notation: p We use the notation p to indicate that the 2019 numbers are preliminary results based on half-year price data through June 30, 2019.
Notes: Louisiana's fee schedule for professional services uses the 1999 CPT list published by the American Medical Association and the maximum allowable reimbursement rates effective as of March 2001. Effective July 20, 2013, Louisiana updated its fee schedule using the 2012 CPT list. Maximum allowable reimbursement rates were added for new or revised codes; however, the fee schedule rates for the existing codes appeared to remain at the March 2001 rates. The state-specific codes relating to physical and occupational therapies were discontinued in favor of national CPT codes. Effective June 20, 2016, Louisiana made further updates to its fee schedule to account for some CPT codes that were inadvertently omitted in a February 2014 update.
Minor radiology
Neurological/neuromuscular testinga
Professional Services
Emergency
Evaluation and management
Pain management injections
Major surgery
Physical medicine
Major radiology
Neurological/neuromuscular testinga
Minor radiology
40
60
80
100
120
140
160
180
200
220
2008 2009 2010 2011 2012 2013 2014 2015 2016 2017 2018 2019
Ind
ex o
f P
rice
s P
aid
(bas
e ye
ar is
20
08
=1
00
)
Emergency
Evaluation andmanagement
Major radiology
Minor radiology
Neurological/neuromusculartesting
Physicalmedicine
Major surgery
Painmanagementinjections
p
p
p
copyright © 2020 workers compensation research institute123
_____________________________________________________________________________________________W C R I M E D I C A L P R I C E I N D E X F O R W O R K E R S ' C O M P E N S A T I O N , 1 2 T H E D I T I O N ( M P I - W C )

2008 2009 2010 2011 2012 2013 2014 2015 2016 2017 2018 2019
100 106 112 109 110 109 108 107 107 108 108 107
100 107 110 109 108 108 107 106 106 107 107 106
100 109 109 111 109 109 107 106 106 105 105 106
100 104 107 108 104 104 103 103 102 104 106 105
100 98 94 100 115 131 137 140 145 138 140 147
100 106 112 110 111 109 109 111 112 114 111 115
100 127 127 129 125 122 123 127 124 125 127 129
100 106 111 108 109 112 114 113 115 146 155 142
2008 to 2009
2009 to 2010
2010 to 2011
2011 to 2012
2012 to 2013
2013 to 2014
2014 to 2015
2015 to 2016
2016 to 2017
2017 to 2018
2018 to 2019
6% 6% -2% 1% -1% -1% -1% 0% 0% 0% 0%
7% 3% -2% -1% 0% -1% -1% 0% 1% 0% -1%
9% 0% 2% -2% 0% -1% -1% 0% -1% 0% 1%
4% 3% 1% -3% 0% -1% 0% 0% 1% 3% -2%
-2% -5% 7% 14% 15% 5% 2% 3% -5% 1% 5%
6% 6% -2% 1% -2% 0% 2% 0% 2% -3% 4%
27% 1% 1% -3% -2% 1% 3% -3% 1% 2% 2%
6% 5% -3% 1% 3% 2% -1% 2% 27% 6% -8%
Emergency
Pain management injections
Evaluation and management
Major radiology
Minor radiology
Neurological/neuromuscular testinga
Physical medicine
Major surgery
Special notation: p We use the notation p to indicate that the 2019 numbers are preliminary results based on half-year price data through June 30, 2019.
Figure C.14 Massachusetts Trend in Professional Prices Paid by Service Group, 2008 to 2019
Notes: Massachusetts increased the fee schedule rates for many professional services, effective in April 2009. The fee schedule increases for major surgeries were especially significant; the rates for some surgeries increased to two to three times the previous rates to be more in line with the median prices paid. Prior to that, the fee schedule for professional services had not been updated since September 2004. A WCRI study showed that major surgeries were often paid above the fee schedule rates (Eccleston, 2006). That study found that for many of these surgeries, it was not uncommon for the median prices paid to be two or three times the fee schedule amount. Typically, 50–60 percent of these surgical procedures were paid above the fee schedule rate. System participants indicated that payors in the state were willing to negotiate with surgeons because workers had better outcomes and return to work was faster (Radeva, 2014b). The most recent fee schedule update within the study period in this report was effective June 26, 2019, which was essentially the same as the fee schedule effective in April 2009 with new CPT/HCPCS codes recognized but without specific fee schedule rates assigned.
a Prices paid for neurological/neuromuscular testing services in most study states decreased starting in 2013. This general trend is related to a fundamental change implemented by the Centers for Medicare & Medicaid Services in the coding system for nerve conduction studies, which are the most commonly billed procedures in the neurological/neuromuscular testing service group. For more details, see "Discussion of Substantial Changes in Prices at Service-Type Level" and "Technical Appendix."
Key: CPT: Current Procedural Terminology; HCPCS: Healthcare Common Procedure Coding System.
Massachusetts Annual Change in Professional Prices Paid by Service Group (%)
Massachusetts Trend in Professional Prices Paid by Service Group, 2008 to 2019
Professional Services
Major surgery
Physical medicine
Emergency
Major radiology
Neurological/neuromuscular testinga
Pain management injections
Evaluation and management
Minor radiology
Professional Services
40
60
80
100
120
140
160
180
200
220
2008 2009 2010 2011 2012 2013 2014 2015 2016 2017 2018 2019
Ind
ex o
f P
rice
s P
aid
(bas
e ye
ar is
20
08
=1
00
)
Emergency
Evaluation andmanagement
Major radiology
Minor radiology
Neurological/neuromusculartesting
Physicalmedicine
Major surgery
Painmanagementinjections
p
p
p
copyright © 2020 workers compensation research institute124
_____________________________________________________________________________________________W C R I M E D I C A L P R I C E I N D E X F O R W O R K E R S ' C O M P E N S A T I O N , 1 2 T H E D I T I O N ( M P I - W C )

2008 2009 2010 2011 2012 2013 2014 2015 2016 2017 2018 2019
100 101 102 109 113 114 112 113 113 112 116 107
100 104 109 120 127 131 127 129 133 135 138 142
100 100 97 102 101 93 75 70 72 73 73 72
100 99 99 111 116 118 107 100 102 104 105 110
100 92 96 101 107 86 83 86 86 88 93 90
100 104 106 119 126 131 130 132 134 138 138 140
100 104 108 115 111 113 111 110 114 116 119 121
100 87 95 87 93 89 79 86 88 82 82 84
2008 to 2009
2009 to 2010
2010 to 2011
2011 to 2012
2012 to 2013
2013 to 2014
2014 to 2015
2015 to 2016
2016 to 2017
2017 to 2018
2018 to 2019
1% 1% 7% 4% 1% -2% 1% 0% -1% 3% -7%
4% 5% 10% 6% 3% -3% 1% 3% 2% 2% 2%
0% -4% 5% -1% -7% -20% -6% 3% 1% 1% -2%
-1% 0% 11% 5% 2% -10% -6% 1% 2% 2% 5%
-8% 4% 5% 6% -20% -3% 4% 0% 2% 6% -3%
4% 2% 12% 6% 4% -1% 2% 1% 3% 0% 1%
4% 4% 6% -3% 1% -2% -1% 4% 2% 3% 2%
-13% 9% -9% 7% -4% -11% 8% 2% -7% 0% 2%
Professional Services
Figure C.15 Maryland Trend in Professional Prices Paid by Service Group, 2008 to 2019
Maryland Trend in Professional Prices Paid by Service Group, 2008 to 2019
Maryland Annual Change in Professional Prices Paid by Service Group (%)
Major radiology
Physical medicine
Pain management injections
Minor radiology
Major surgery
Professional Services
Neurological/neuromuscular testinga
Evaluation and management
Emergency
Emergency
Evaluation and management
Major radiology
Minor radiology
Physical medicine
Major surgery
Neurological/neuromuscular testinga
Pain management injections
Starting in March 2008, Maryland implemented annual increases to its fee schedule rates for professional services based on changes in the Medicare Economic Index. The most recent update covered during the study period in this report became effective January 1, 2019.
a Prices paid for neurological/neuromuscular testing services in most study states decreased starting in 2013. This general trend is related to a fundamental change implemented by the Centers for Medicare & Medicaid Services in the coding system for nerve conduction studies, which are the most commonly billed procedures in the neurological/neuromuscular testing service group. For more details, see "Discussion of Substantial Changes in Prices at Service-Type Level" and "Technical Appendix."
The data for Maryland are not necessarily representative because they are missing data from a larger data source that is significant in this state. The results in Maryland are unlikely to be significantly under- or overestimated, given that the state uses a fee schedule to regulate the payment for professional services, and it is unlikely that the prices paid for the missing data source in Maryland were materially different from other data sources included in this study from the same state.
Special notation: p We use the notation p to indicate that the 2019 numbers are preliminary results based on half-year price data through June 30, 2019.
Notes:
40
60
80
100
120
140
160
180
200
220
2008 2009 2010 2011 2012 2013 2014 2015 2016 2017 2018 2019
Ind
ex o
f P
rice
s P
aid
(bas
e ye
ar is
20
08
=1
00
)
Emergency
Evaluation andmanagement
Major radiology
Minor radiology
Neurological/neuromusculartesting
Physicalmedicine
Major surgery
Painmanagementinjections
p
p
p
copyright © 2020 workers compensation research institute125
_____________________________________________________________________________________________W C R I M E D I C A L P R I C E I N D E X F O R W O R K E R S ' C O M P E N S A T I O N , 1 2 T H E D I T I O N ( M P I - W C )

2008 2009 2010 2011 2012 2013 2014 2015 2016 2017 2018 2019
100 103 102 104 101 97 97 94 95 95 96 96
100 103 104 106 105 110 112 110 110 108 109 109
100 103 106 105 108 98 96 59 59 54 54 54
100 101 104 104 103 102 102 93 93 87 87 88
100 97 93 92 97 88 96 72 71 72 73 72
100 102 106 104 104 108 108 108 107 106 112 114
100 97 95 94 94 93 93 90 89 88 89 91
100 94 94 91 94 100 98 87 83 115 99 101
2008 to 2009
2009 to 2010
2010 to 2011
2011 to 2012
2012 to 2013
2013 to 2014
2014 to 2015
2015 to 2016
2016 to 2017
2017 to 2018
2018 to 2019
3% -1% 2% -3% -4% 0% -3% 1% 0% 0% 0%
3% 1% 2% -1% 4% 2% -2% 0% -1% 1% 0%
3% 3% -1% 3% -10% -1% -39% 0% -7% -1% 1%
1% 3% -1% -1% -1% 0% -8% 0% -7% 1% 1%
-3% -4% -1% 5% -9% 8% -25% -1% 1% 1% -1%
2% 3% -2% 0% 3% 1% 0% -1% -1% 6% 2%
-3% -2% 0% -1% 0% -1% -3% -2% -1% 2% 2%
-6% 0% -3% 4% 6% -2% -12% -5% 39% -14% 2%
Michigan Trend in Professional Prices Paid by Service Group, 2008 to 2019
Michigan Annual Change in Professional Prices Paid by Service Group (%)
Special notation: p We use the notation p to indicate that the 2019 numbers are preliminary results based on half-year price data through June 30, 2019.
Notes: Michigan typically updates its fee schedule for professional services annually. The most recent update covered in the study period in this report was effective January 1, 2019.
a Prices paid for neurological/neuromuscular testing services in most study states decreased starting in 2013. This general trend is related to a fundamental change implemented by the Centers for Medicare & Medicaid Services in the coding system for nerve conduction studies, which are the most commonly billed procedures in the neurological/neuromuscular testing service group. For more details, see "Discussion of Substantial Changes in Prices at Service-Type Level" and "Technical Appendix."
Neurological/neuromuscular testinga
Professional Services
Emergency
Physical medicine
Major surgery
Figure C.16 Michigan Trend in Professional Prices Paid by Service Group, 2008 to 2019
Major surgery
Pain management injections
Evaluation and management
Minor radiology
Major radiology
Professional Services
Emergency
Evaluation and management
Pain management injections
Major radiology
Minor radiology
Neurological/neuromuscular testinga
Physical medicine
40
60
80
100
120
140
160
180
200
220
2008 2009 2010 2011 2012 2013 2014 2015 2016 2017 2018 2019
Ind
ex o
f P
rice
s P
aid
(bas
e ye
ar is
20
08
=1
00
)
Emergency
Evaluation andmanagement
Major radiology
Minor radiology
Neurological/neuromusculartesting
Physicalmedicine
Major surgery
Painmanagementinjections
p
p
p
copyright © 2020 workers compensation research institute126
_____________________________________________________________________________________________W C R I M E D I C A L P R I C E I N D E X F O R W O R K E R S ' C O M P E N S A T I O N , 1 2 T H E D I T I O N ( M P I - W C )

2008 2009 2010 2011 2012 2013 2014 2015 2016 2017 2018 2019
100 110 109 100 103 105 102 105 105 110 106 107
100 103 109 125 129 133 145 145 146 151 153 154
100 106 108 98 100 95 72 71 68 57 56 56
100 103 103 95 96 99 106 104 102 97 96 97
100 104 107 110 124 113 87 86 86 90 91 92
100 106 106 106 108 112 115 113 113 114 115 116
100 106 102 80 83 86 85 87 83 86 86 86
100 99 94 72 74 72 67 65 65 84 85 87
2008 to 2009
2009 to 2010
2010 to 2011
2011 to 2012
2012 to 2013
2013 to 2014
2014 to 2015
2015 to 2016
2016 to 2017
2017 to 2018
2018 to 2019
10% -1% -8% 2% 2% -3% 3% 0% 5% -3% 0%
3% 6% 14% 3% 3% 9% 0% 0% 4% 1% 1%
6% 2% -9% 1% -5% -24% -1% -5% -16% -1% -1%
3% 0% -8% 1% 3% 6% -1% -2% -5% 0% 1%
4% 3% 3% 13% -9% -23% -1% -1% 5% 1% 1%
6% 1% 0% 2% 3% 3% -1% 0% 1% 1% 1%
6% -4% -21% 4% 3% -1% 2% -5% 5% -1% 0%
-1% -6% -23% 2% -2% -7% -3% -1% 30% 1% 3%
Figure C.17 Minnesota Trend in Professional Prices Paid by Service Group, 2008 to 2019
Minnesota Trend in Professional Prices Paid by Service Group, 2008 to 2019
Minnesota Annual Change in Professional Prices Paid by Service Group (%)
Special notation: p We use the notation p to indicate that the 2019 numbers are preliminary results based on half-year price data through June 30, 2019.
Notes: Minnesota's fee schedule for professional services from 2002 to September 2010 was based on 1998 Medicare relative value units (RVUs), with annual updates to the conversion factor. Effective October 1, 2010, Minnesota updated its fee schedule by using 2009 Medicare RVUs and decreasing the state conversion factor. The most recent update covered in the study period in this report was effective October 1, 2018, and is based on 2018 Medicare RVUs.
Emergency
Minor radiology
Evaluation and management
Professional Services
Major radiology
Neurological/neuromuscular testinga
Major radiology
Physical medicine
Major surgery
Minor radiology
Neurological/neuromuscular testinga
Physical medicine
Pain management injections
Professional Services
Major surgery
Emergency
Evaluation and management
Pain management injections
a Prices paid for neurological/neuromuscular testing services in most study states decreased starting in 2013. This general trend is related to a fundamental change implemented by the Centers for Medicare & Medicaid Services in the coding system for nerve conduction studies, which are the most commonly billed procedures in the neurological/neuromuscular testing service group. For more details, see "Discussion of Substantial Changes in Prices at Service-Type Level" and "Technical Appendix."
40
60
80
100
120
140
160
180
200
220
2008 2009 2010 2011 2012 2013 2014 2015 2016 2017 2018 2019
Ind
ex o
f P
rice
s P
aid
(bas
e ye
ar is
20
08
=1
00
)
Emergency
Evaluation andmanagement
Major radiology
Minor radiology
Neurological/neuromusculartesting
Physicalmedicine
Major surgery
Painmanagementinjections
p
p
p
copyright © 2020 workers compensation research institute127
_____________________________________________________________________________________________W C R I M E D I C A L P R I C E I N D E X F O R W O R K E R S ' C O M P E N S A T I O N , 1 2 T H E D I T I O N ( M P I - W C )

2008 2009 2010 2011 2012 2013 2014 2015 2016 2017 2018 2019
100 112 121 119 123 134 155 185 198 209 212 208
100 106 110 111 115 118 122 127 132 139 142 147
100 107 105 106 104 105 109 104 108 105 103 100
100 105 104 104 103 104 104 105 110 115 119 119
100 113 127 117 118 85 104 106 110 131 95 135
100 103 108 102 109 115 120 123 128 130 134 141
100 120 121 127 125 127 133 133 130 159 165 174
100 108 114 109 112 107 119 111 108 121 120 131
2008 to 2009
2009 to 2010
2010 to 2011
2011 to 2012
2012 to 2013
2013 to 2014
2014 to 2015
2015 to 2016
2016 to 2017
2017 to 2018
2018 to 2019
12% 8% -2% 4% 8% 16% 20% 7% 5% 1% -2%
6% 4% 2% 3% 3% 3% 4% 4% 6% 2% 3%
7% -2% 1% -1% 1% 4% -5% 4% -3% -2% -2%
5% -1% 0% -1% 1% 0% 1% 4% 5% 4% 0%
13% 12% -8% 1% -28% 22% 3% 3% 19% -28% 42%
3% 5% -6% 7% 6% 4% 3% 4% 1% 3% 5%
20% 1% 5% -2% 2% 5% 0% -3% 22% 4% 5%
8% 5% -4% 2% -4% 11% -6% -3% 12% -1% 9%
Figure C.18 Missouri Trend in Professional Prices Paid by Service Group, 2008 to 2019
Missouri Trend in Professional Prices Paid by Service Group, 2008 to 2019
Missouri Annual Change in Professional Prices Paid by Service Group (%)
Special notation: p We use the notation p to indicate that the 2019 numbers are preliminary results based on half-year price data through June 30, 2019.
Notes:
The data for Missouri are not necessarily representative because the state is missing data from a larger data source that is significant in the state. To the extent that prices paid may differ for the missing data source compared with other data sources in the state, this may lead to under- or overestimations in the results.
Missouri did not have a workers' compensation fee schedule as of 2019.
a Prices paid for neurological/neuromuscular testing services in most study states decreased starting in 2013. This general trend is related to a fundamental change implemented by the Centers for Medicare & Medicaid Services in the coding system for nerve conduction studies, which are the most commonly billed procedures in the neurological/neuromuscular testing service group. For more details, see "Discussion of Substantial Changes in Prices at Service-Type Level" and "Technical Appendix."
Pain management injections
Major surgery
Physical medicine
Pain management injections
Professional Services
Emergency
Evaluation and management
Major radiology
Minor radiology
Neurological/neuromuscular testinga
Physical medicine
Major surgery
Emergency
Professional Services
Neurological/neuromuscular testinga
Evaluation and management
Major radiology
Minor radiology
40
60
80
100
120
140
160
180
200
220
2008 2009 2010 2011 2012 2013 2014 2015 2016 2017 2018 2019
Ind
ex o
f P
rice
s P
aid
(bas
e ye
ar is
20
08
=1
00
)
Emergency
Evaluation andmanagement
Major radiology
Minor radiology
Neurological/neuromusculartesting
Physicalmedicine
Major surgery
Painmanagementinjections
p
p
p
copyright © 2020 workers compensation research institute128
_____________________________________________________________________________________________W C R I M E D I C A L P R I C E I N D E X F O R W O R K E R S ' C O M P E N S A T I O N , 1 2 T H E D I T I O N ( M P I - W C )

2008 2009 2010 2011 2012 2013 2014 2015 2016 2017 2018 2019
100 102 100 100 100 101 101 100 98 98 112 98
100 101 101 102 101 99 100 99 99 108 107 107
100 101 102 101 99 101 82 81 79 60 61 61
100 100 101 101 97 101 117 116 113 102 102 101
100 99 101 98 102 84 109 106 106 74 75 74
100 102 103 101 99 103 120 120 119 109 110 112
100 100 101 102 103 102 110 112 112 108 112 115
100 107 107 108 108 104 106 106 110 113 109 113
2008 to 2009
2009 to 2010
2010 to 2011
2011 to 2012
2012 to 2013
2013 to 2014
2014 to 2015
2015 to 2016
2016 to 2017
2017 to 2018
2018 to 2019
2% -2% -1% 1% 0% 0% -1% -2% 0% 13% -12%
1% 1% 1% -1% -1% 0% -1% 0% 9% -1% 0%
1% 1% -1% -2% 2% -19% -1% -3% -23% 1% 0%
0% 1% 0% -4% 5% 15% -1% -2% -9% -1% 0%
-1% 2% -3% 4% -18% 30% -3% 0% -30% 1% -2%
2% 1% -2% -2% 4% 16% 1% -1% -8% 1% 1%
0% 1% 1% 1% 0% 8% 1% 0% -4% 4% 3%
7% -1% 1% 1% -4% 2% 0% 3% 3% -3% 4%
Neurological/neuromuscular testinga
Physical medicine
Major surgery
Pain management injections
Professional Services
Pain management injections
Major radiology
Minor radiology
Neurological/neuromuscular testinga
Physical medicine
Major surgery
Professional Services
Emergency
Evaluation and management
Major radiology
a Prices paid for neurological/neuromuscular testing services in most study states decreased starting in 2013. This general trend is related to a fundamental change implemented by the Centers for Medicare & Medicaid Services in the coding system for nerve conduction studies, which are the most commonly billed procedures in the neurological/neuromuscular testing service group. For more details, see "Discussion of Substantial Changes in Prices at Service-Type Level" and "Technical Appendix."
Minor radiology
Emergency
Evaluation and management
Figure C.19 Mississippi Trend in Professional Prices Paid by Service Group, 2008 to 2019
Mississippi Trend in Professional Prices Paid by Service Group, 2002 to 2019
Mississippi Annual Change in Professional Prices Paid by Service Group (%)
Special notation: p We use the notation p to indicate that the 2019 numbers are preliminary results based on half-year price data through June 30, 2019.
Notes: Mississippi updates its fee schedule for professional services periodically every few years. The most recent fee schedule update within the study period in this report occurred on June 15, 2019. Data in this report include prices through June 30, 2019, primarily reflecting experience before the fee schedule update effective June 15, 2019.
40
60
80
100
120
140
160
180
200
220
2008 2009 2010 2011 2012 2013 2014 2015 2016 2017 2018 2019
Ind
ex o
f P
rice
s P
aid
(bas
e ye
ar is
20
08
=1
00
)
Emergency
Evaluation andmanagement
Major radiology
Minor radiology
Neurological/neuromusculartesting
Physicalmedicine
Major surgery
Painmanagementinjections
p
p
p
copyright © 2020 workers compensation research institute129
_____________________________________________________________________________________________W C R I M E D I C A L P R I C E I N D E X F O R W O R K E R S ' C O M P E N S A T I O N , 1 2 T H E D I T I O N ( M P I - W C )

2008 2009 2010 2011 2012 2013 2014 2015 2016 2017 2018 2019
100 104 108 105 104 104 104 120 137 137 135 139
100 101 101 100 101 123 125 140 163 164 164 167
100 105 104 104 105 104 103 83 64 64 65 64
100 102 101 99 99 97 97 98 101 101 101 106
100 99 98 99 111 110 110 106 101 105 102 104
100 103 105 103 102 106 107 125 156 157 153 157
100 103 105 103 104 102 101 98 93 92 92 93
100 101 103 100 96 98 96 88 86 89 89 95
2008 to 2009
2009 to 2010
2010 to 2011
2011 to 2012
2012 to 2013
2013 to 2014
2014 to 2015
2015 to 2016
2016 to 2017
2017 to 2018
2018 to 2019
4% 4% -3% 0% 0% 0% 16% 14% 0% -2% 3%
1% 0% -1% 0% 22% 1% 12% 16% 1% 0% 2%
5% 0% 0% 0% -1% -1% -19% -23% 0% 1% -1%
2% -1% -2% -1% -1% -1% 1% 3% 1% 0% 4%
-1% -1% 1% 12% -1% -1% -3% -4% 3% -2% 1%
3% 2% -3% -1% 4% 1% 16% 25% 0% -3% 3%
3% 2% -2% 1% -2% -1% -2% -5% -1% 0% 1%
1% 2% -3% -4% 1% -2% -8% -3% 3% 0% 7%
Professional Services
Emergency
Evaluation and management
a Prices paid for neurological/neuromuscular testing services in most study states decreased starting in 2013. This general trend is related to a fundamental change implemented by the Centers for Medicare & Medicaid Services in the coding system for nerve conduction studies, which are the most commonly billed procedures in the neurological/neuromuscular testing service group. For more details, see "Discussion of Substantial Changes in Prices at Service-Type Level" and "Technical Appendix."
Pain management injections
Major radiology
Minor radiology
Neurological/neuromuscular testinga
Neurological/neuromuscular testinga
Major radiology
Pain management injections
Major surgery
Physical medicine
Professional Services
Emergency
Evaluation and management
Physical medicine
Major surgery
Minor radiology
Figure C.20 North Carolina Trend in Professional Prices Paid by Service Group, 2008 to 2019
North Carolina Trend in Professional Prices Paid by Service Group, 2008 to 2019
North Carolina Annual Change in Professional Prices Paid by Service Group (%)
Special notation: p We use the notation p to indicate that the 2019 numbers are preliminary results based on half-year price data through June 30, 2019.
Notes: Maximum reimbursement amounts in the North Carolina fee schedule for professional services are based on those adopted by the North Carolina Industrial Commission effective January 1996, which was based on the 1995 Medicare values. North Carolina updates its fee schedule annually in January to account for new and discontinued Current Procedural Terminology (CPT) codes published by the American Medical Association. In 2013, the fee schedule rates for office visits increased in North Carolina. Effective July 1, 2015, North Carolina implemented new fee schedule rates, which incorporate the 2015 Medicare rates with the revised service-type specific multipliers, ranging between 140 and 195 percent of Medicare. Before this change, the fee schedule rates for most types of professional services in North Carolina were set at 158 percent of the 1995 Medicare values. Starting in 2016, and each year thereafter, North Carolina publishes a fee schedule table that is effective January 1. The most recent update covered during the study period in this report became effective January 1, 2019.
40
60
80
100
120
140
160
180
200
220
2008 2009 2010 2011 2012 2013 2014 2015 2016 2017 2018 2019
Ind
ex o
f P
rice
s P
aid
(bas
e ye
ar is
20
08
=1
00
)
Emergency
Evaluation andmanagement
Major radiology
Minor radiology
Neurological/neuromusculartesting
Physicalmedicine
Major surgery
Painmanagementinjections
p
p
p
copyright © 2020 workers compensation research institute130
_____________________________________________________________________________________________W C R I M E D I C A L P R I C E I N D E X F O R W O R K E R S ' C O M P E N S A T I O N , 1 2 T H E D I T I O N ( M P I - W C )
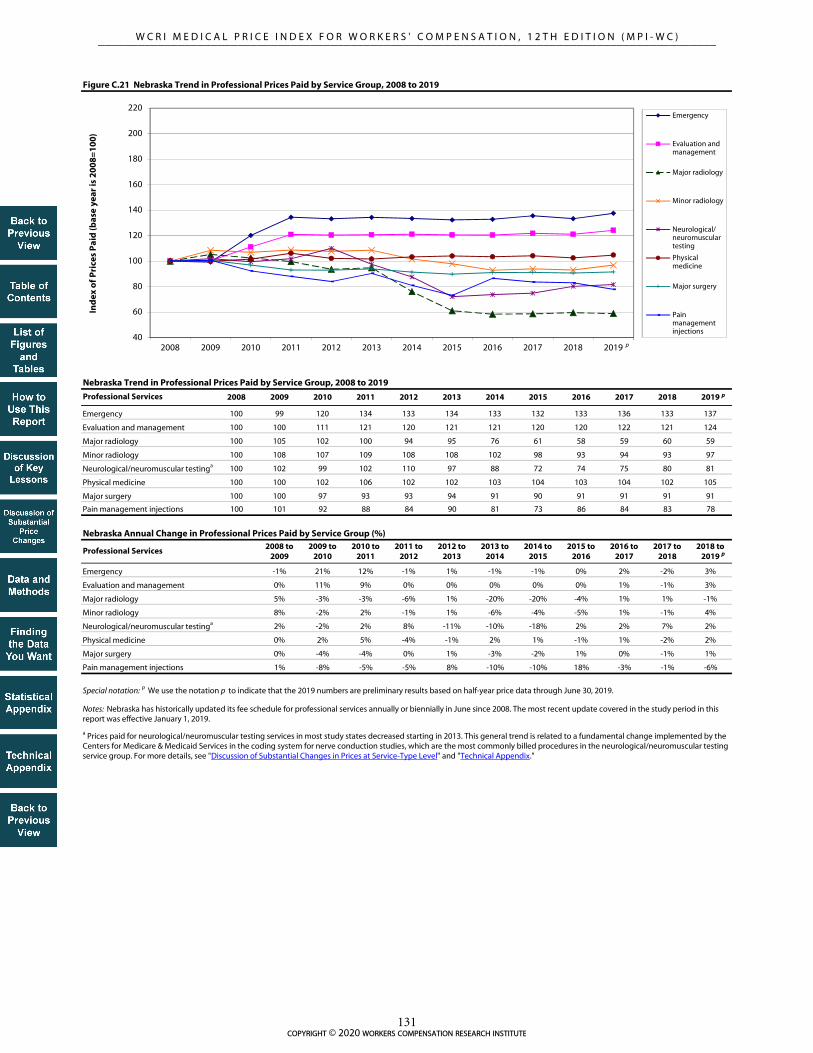
2008 2009 2010 2011 2012 2013 2014 2015 2016 2017 2018 2019
100 99 120 134 133 134 133 132 133 136 133 137
100 100 111 121 120 121 121 120 120 122 121 124
100 105 102 100 94 95 76 61 58 59 60 59
100 108 107 109 108 108 102 98 93 94 93 97
100 102 99 102 110 97 88 72 74 75 80 81
100 100 102 106 102 102 103 104 103 104 102 105
100 100 97 93 93 94 91 90 91 91 91 91
100 101 92 88 84 90 81 73 86 84 83 78
2008 to 2009
2009 to 2010
2010 to 2011
2011 to 2012
2012 to 2013
2013 to 2014
2014 to 2015
2015 to 2016
2016 to 2017
2017 to 2018
2018 to 2019
-1% 21% 12% -1% 1% -1% -1% 0% 2% -2% 3%
0% 11% 9% 0% 0% 0% 0% 0% 1% -1% 3%
5% -3% -3% -6% 1% -20% -20% -4% 1% 1% -1%
8% -2% 2% -1% 1% -6% -4% -5% 1% -1% 4%
2% -2% 2% 8% -11% -10% -18% 2% 2% 7% 2%
0% 2% 5% -4% -1% 2% 1% -1% 1% -2% 2%
0% -4% -4% 0% 1% -3% -2% 1% 0% -1% 1%
1% -8% -5% -5% 8% -10% -10% 18% -3% -1% -6%
Neurological/neuromuscular testinga
Physical medicine
Major surgery
Pain management injections
Professional Services
Pain management injections
Major radiology
Minor radiology
Neurological/neuromuscular testinga
Physical medicine
Major surgery
Professional Services
Emergency
Evaluation and management
Major radiology
Emergency
Evaluation and management
Special notation: p We use the notation p to indicate that the 2019 numbers are preliminary results based on half-year price data through June 30, 2019.
Notes: Nebraska has historically updated its fee schedule for professional services annually or biennially in June since 2008. The most recent update covered in the study period in this report was effective January 1, 2019.
a Prices paid for neurological/neuromuscular testing services in most study states decreased starting in 2013. This general trend is related to a fundamental change implemented by the Centers for Medicare & Medicaid Services in the coding system for nerve conduction studies, which are the most commonly billed procedures in the neurological/neuromuscular testing service group. For more details, see "Discussion of Substantial Changes in Prices at Service-Type Level" and "Technical Appendix."
Figure C.21 Nebraska Trend in Professional Prices Paid by Service Group, 2008 to 2019
Minor radiology
Nebraska Trend in Professional Prices Paid by Service Group, 2008 to 2019
Nebraska Annual Change in Professional Prices Paid by Service Group (%)
40
60
80
100
120
140
160
180
200
220
2008 2009 2010 2011 2012 2013 2014 2015 2016 2017 2018 2019
Ind
ex o
f P
rice
s P
aid
(bas
e ye
ar is
20
08
=1
00
)
Emergency
Evaluation andmanagement
Major radiology
Minor radiology
Neurological/neuromusculartesting
Physicalmedicine
Major surgery
Painmanagementinjections
p
p
p
copyright © 2020 workers compensation research institute131
_____________________________________________________________________________________________W C R I M E D I C A L P R I C E I N D E X F O R W O R K E R S ' C O M P E N S A T I O N , 1 2 T H E D I T I O N ( M P I - W C )

2008 2009 2010 2011 2012 2013 2014 2015 2016 2017 2018 2019
100 111 115 120 127 127 111 109 115 120 126 123
100 103 109 112 114 105 108 111 115 120 125 133
100 100 100 101 102 102 102 98 98 99 97 100
100 105 109 121 122 102 99 100 102 102 113 127
100 99 106 114 114 66 80 84 85 88 91 90
100 108 112 111 119 120 133 142 145 153 154 162
100 104 105 111 112 92 91 93 94 93 96 98
100 110 121 132 146 123 107 99 99 126 123 117
2008 to 2009
2009 to 2010
2010 to 2011
2011 to 2012
2012 to 2013
2013 to 2014
2014 to 2015
2015 to 2016
2016 to 2017
2017 to 2018
2018 to 2019
11% 3% 5% 6% 0% -12% -2% 6% 4% 5% -2%
3% 5% 3% 2% -7% 2% 3% 3% 5% 4% 6%
0% 0% 1% 1% -1% 1% -5% 0% 1% -2% 4%
5% 4% 11% 1% -16% -3% 0% 3% -1% 11% 13%
-1% 7% 8% 0% -42% 21% 4% 2% 3% 3% -1%
8% 4% -1% 7% 1% 11% 6% 2% 6% 0% 5%
4% 1% 5% 1% -18% -1% 2% 1% 0% 3% 2%
10% 10% 10% 10% -16% -13% -7% -1% 28% -2% -5%
New Jersey Annual Change in Professional Prices Paid by Service Group (%)
Notes: New Jersey did not have a workers' compensation fee schedule as of 2019. Note that in 2013, New Jersey experienced decreases in prices paid for multiple types of professional services. More prevalent network participation and bigger discounts in the negotiated prices under network agreements were the main factors underlying this unusual trend among the states with no fee schedules.
Evaluation and management
Major radiology
Neurological/neuromuscular testinga
Minor radiology
Pain management injections
Major radiology
Minor radiology
Neurological/neuromuscular testinga
Special notation: p We use the notation p to indicate that the 2019 numbers are preliminary results based on half-year price data through June 30, 2019.
Major surgery
Physical medicine
Pain management injections
Professional Services
Emergency
Evaluation and management
Physical medicine
Major surgery
a Prices paid for neurological/neuromuscular testing services in most study states decreased starting in 2013. This general trend is related to a fundamental change implemented by the Centers for Medicare & Medicaid Services in the coding system for nerve conduction studies, which are the most commonly billed procedures in the neurological/neuromuscular testing service group. For more details, see "Discussion of Substantial Changes in Prices at Service-Type Level" and "Technical Appendix."
Figure C.22 New Jersey Trend in Professional Prices Paid by Service Group, 2008 to 2019
New Jersey Trend in Professional Prices Paid by Service Group, 2008 to 2019
Professional Services
Emergency
40
60
80
100
120
140
160
180
200
220
2008 2009 2010 2011 2012 2013 2014 2015 2016 2017 2018 2019
Ind
ex o
f P
rice
s P
aid
(bas
e ye
ar is
20
08
=1
00
)
Emergency
Evaluation andmanagement
Major radiology
Minor radiology
Neurological/neuromusculartesting
Physicalmedicine
Major surgery
Painmanagementinjections
p
p
p
copyright © 2020 workers compensation research institute132
_____________________________________________________________________________________________W C R I M E D I C A L P R I C E I N D E X F O R W O R K E R S ' C O M P E N S A T I O N , 1 2 T H E D I T I O N ( M P I - W C )

2008 2009 2010 2011 2012 2013 2014 2015 2016 2017 2018 2019
100 104 104 122 123 128 128 128 127 126 127 129
100 104 105 125 127 128 129 129 129 129 129 141
100 95 96 94 92 91 91 91 90 87 85 84
100 99 98 93 94 93 93 93 92 92 92 95
100 98 99 97 97 98 100 100 99 100 100 90
100 100 100 96 96 95 94 96 97 94 92 104
100 101 101 98 100 99 99 100 101 100 101 104
100 101 102 101 101 99 98 98 98 100 101 106
2008 to 2009
2009 to 2010
2010 to 2011
2011 to 2012
2012 to 2013
2013 to 2014
2014 to 2015
2015 to 2016
2016 to 2017
2017 to 2018
2018 to 2019
4% 0% 17% 1% 4% -1% 0% -1% -1% 0% 2%
4% 1% 19% 2% 1% 1% 0% 0% 0% 0% 9%
-5% 0% -2% -2% -1% 0% -1% -1% -3% -3% 0%
-1% -1% -4% 1% -1% 0% 0% -1% 0% 0% 3%
-2% 1% -3% 1% 0% 2% 0% -1% 1% 1% -11%
0% 0% -4% 0% -1% -1% 2% 1% -3% -3% 14%
1% 1% -3% 2% -1% 0% 0% 2% -1% 1% 3%
1% 0% 0% 0% -2% -1% 0% 0% 1% 2% 5%
Pain management injections
Professional Services
Emergency
Evaluation and management
Major radiology
Minor radiology
Neurological/neuromuscular testinga
Physical medicine
Major surgery
Pain management injections
Figure C.23 New York Trend in Professional Prices Paid by Service Group, 2008 to 2019
New York Trend in Professional Prices Paid by Service Group, 2008 to 2019
New York Annual Change in Professional Prices Paid by Service Group (%)
Special notation: p We use the notation p to indicate that the 2019 numbers are preliminary results based on half-year price data through June 30, 2019.
Notes:
The data for New York are not necessarily representative because they are missing data from a larger data source that is significant in this state. The results in New York are unlikely to be significantly under- or overestimated, given that the state uses a fee schedule to regulate the payment for professional services, and it is unlikely that the prices paid for the missing data source in New York were materially different from other data sources included in this study from the same state.
New York periodically updates its fee schedule for professional services; however, the maximum allowable reimbursement rates for most services covered in this report did not change from 2002 to November 2010. Effective December 1, 2010, the fee schedule rates in New York increased for evaluation and management services and emergency services. Effective April 1, 2019, New York implemented a fee schedule change, aiming to raise medical fee schedule rates, increase medical provider participation in the workers’ compensation system, and improve workers’ access to timely, quality medical care. The half-year price data through June 2019 in this report reflect only two months of experience under the new fee schedule. From 2018 to June 2019, prices increased 9 percent for evaluation and management (primarily office visits) and 14 percent for physical medicine. Price growth in half-year 2019 were also seen in minor radiology, major surgery, and pain management injections, with smaller magnitudes ranging between 3 to 5 percent. Prices paid for major radiology and emergency services changed little, and prices paid for neurological/neuromuscular testing decreased between 2018 and 2019 (as of June). The average overall price for professional services increased 7 percent from 2018 to June 2019 (see Figure B.24). The next edition of this report will examine the price trends with 14 months of experience after the April 2019 fee schedule change.
a Prices paid for neurological/neuromuscular testing services in most study states decreased starting in 2013. This general trend is related to a fundamental change implemented by the Centers for Medicare & Medicaid Services in the coding system for nerve conduction studies, which are the most commonly billed procedures in the neurological/neuromuscular testing service group. For more details, see "Discussion of Substantial Changes in Prices at Service-Type Level" and "Technical Appendix."
Professional Services
Emergency
Evaluation and management
Major surgery
Major radiology
Neurological/neuromuscular testinga
Minor radiology
Physical medicine
40
60
80
100
120
140
160
180
200
220
2008 2009 2010 2011 2012 2013 2014 2015 2016 2017 2018 2019
Ind
ex o
f P
rice
s P
aid
(bas
e ye
ar is
20
08
=1
00
)
Emergency
Evaluation andmanagement
Major radiology
Minor radiology
Neurological/neuromusculartesting
Physicalmedicine
Major surgery
Painmanagementinjections
p
p
p
copyright © 2020 workers compensation research institute133
_____________________________________________________________________________________________W C R I M E D I C A L P R I C E I N D E X F O R W O R K E R S ' C O M P E N S A T I O N , 1 2 T H E D I T I O N ( M P I - W C )

2008 2009 2010 2011 2012 2013 2014 2015 2016 2017 2018 2019
100 101 101 104 118 124 114 114 112 111 110 111
100 101 103 103 142 143 143 141 140 138 138 138
100 98 100 101 97 101 101 98 100 101 102 91
100 101 101 100 99 100 99 98 98 97 97 97
100 101 104 102 100 97 101 103 113 125 100 95
100 101 105 105 104 106 106 104 105 108 107 108
100 100 100 105 93 92 92 93 92 94 95 89
100 104 95 93 92 91 94 96 93 94 104 102
2008 to 2009
2009 to 2010
2010 to 2011
2011 to 2012
2012 to 2013
2013 to 2014
2014 to 2015
2015 to 2016
2016 to 2017
2017 to 2018
2018 to 2019
1% 0% 3% 13% 6% -8% 0% -2% -1% -1% 1%
1% 3% 0% 38% 0% 0% -1% -1% -2% 0% 0%
-2% 2% 2% -4% 5% 0% -3% 3% 1% 1% -11%
1% 0% -1% -1% 1% -1% -1% 0% -1% 0% -1%
1% 3% -2% -2% -3% 4% 2% 9% 11% -20% -4%
1% 4% -1% -1% 2% 0% -2% 1% 3% 0% 1%
0% 1% 4% -11% -1% 0% 1% 0% 2% 1% -6%
4% -8% -2% -2% 0% 3% 2% -3% 0% 11% -2%
Professional Services
Emergency
Minor radiology
Major radiology
Evaluation and management
Neurological/neuromuscular testinga
Oklahoma regularly updated its fee schedule for professional services over the study period. The most recent version of fee schedule within the study period in this report was effective June 1, 2018, which was essentially the same as the fee schedule effective in January 2012. Note that the fee schedule rates for office visits increased materially in 2012. For the most frequently billed office visits for low to moderate severity for established patients (Current Procedural Terminology [CPT] 99213), the fee schedule rate increased 51 percent in that year.
a Prices paid for neurological/neuromuscular testing services in most study states decreased starting in 2013. This general trend is related to a fundamental change implemented by the Centers for Medicare & Medicaid Services in the coding system for nerve conduction studies, which are the most commonly billed procedures in the neurological/neuromuscular testing service group. For more details, see "Discussion of Substantial Changes in Prices at Service-Type Level" and "Technical Appendix."
The data for Oklahoma are not necessarily representative because they are missing data from a larger data source that is significant in this state. The results in Oklahoma are unlikely to be significantly under- or overestimated, given that the state uses a fee schedule to regulate the payment for professional services, and it is unlikely that the prices paid for the missing data source in Oklahoma were materially different from other data sources included in this study from the same state.
Physical medicine
Pain management injections
Major surgery
Professional Services
Emergency
Evaluation and management
Major radiology
Minor radiology
Neurological/neuromuscular testinga
Physical medicine
Major surgery
Pain management injections
Figure C.24 Oklahoma Trend in Professional Prices Paid by Service Group, 2008 to 2019
Oklahoma Trend in Professional Prices Paid by Service Group, 2008 to 2019
Oklahoma Annual Change in Professional Prices Paid by Service Group (%)
Special notation: p We use the notation p to indicate that the 2019 numbers are preliminary results based on half-year price data through June 30, 2019.
Notes:
40
60
80
100
120
140
160
180
200
220
2008 2009 2010 2011 2012 2013 2014 2015 2016 2017 2018 2019
Ind
ex o
f P
rice
s P
aid
(bas
e ye
ar is
20
08
=1
00
)
Emergency
Evaluation andmanagement
Major radiology
Minor radiology
Neurological/neuromusculartesting
Physicalmedicine
Major surgery
Painmanagementinjections
p
p
p
copyright © 2020 workers compensation research institute134
_____________________________________________________________________________________________W C R I M E D I C A L P R I C E I N D E X F O R W O R K E R S ' C O M P E N S A T I O N , 1 2 T H E D I T I O N ( M P I - W C )

2008 2009 2010 2011 2012 2013 2014 2015 2016 2017 2018 2019
100 104 137 124 115 113 112 114 117 118 117 118
100 110 121 134 135 135 135 135 138 138 138 139
100 106 102 96 95 93 95 95 97 98 98 96
100 104 106 110 113 115 113 108 109 110 110 109
100 104 104 109 122 80 72 73 75 77 80 82
100 111 123 132 128 133 133 132 133 134 133 133
100 100 104 106 103 104 101 102 101 103 103 99
100 87 83 80 83 83 87 82 88 76 72 81
2008 to 2009
2009 to 2010
2010 to 2011
2011 to 2012
2012 to 2013
2013 to 2014
2014 to 2015
2015 to 2016
2016 to 2017
2017 to 2018
2018 to 2019
4% 32% -10% -8% -2% 0% 2% 3% 0% -1% 1%
10% 10% 11% 1% 0% 0% 0% 2% 0% -1% 1%
6% -3% -6% -1% -3% 2% 0% 2% 1% -1% -1%
4% 2% 4% 3% 2% -2% -4% 1% 1% 0% -1%
4% 0% 6% 12% -34% -11% 3% 3% 3% 4% 2%
11% 11% 8% -3% 4% 0% 0% 1% 1% -1% 0%
0% 4% 2% -3% 1% -3% 1% -1% 1% 1% -4%
-13% -5% -4% 3% 1% 5% -5% 7% -14% -5% 13%
Neurological/neuromuscular testinga
Physical medicine
Major surgery
Pain management injections
Pain management injections
Professional Services
Emergency
Major surgery
Evaluation and management
Major radiology
Minor radiology
Neurological/neuromuscular testinga
Physical medicine
In July 2010, Oregon moved away from referencing the federal resource-based relative value scale (RBRVS) values in its fee schedule regulation. Instead, the state established the maximum allowable payment (MAP) amounts published by the Oregon Workers’ Compensation Division to make it easier for payors and providers to find the correct fee schedule MAP. The underlying values of the Oregon MAP amounts reported in Appendix B of the Oregon Medical Fee and Payment Rules (Oregon Administrative Rules, Chapter 436, Division 009) are based on Medicare relative value unit (RVU) values. Oregon typically updates its fee schedule annually. The most recent update covered in the study period in this report was effective April 1, 2019.
a Prices paid for neurological/neuromuscular testing services in most study states decreased starting in 2013. This general trend is related to a fundamental change implemented by the Centers for Medicare & Medicaid Services in the coding system for nerve conduction studies, which are the most commonly billed procedures in the neurological/neuromuscular testing service group. For more details, see "Discussion of Substantial Changes in Prices at Service-Type Level" and "Technical Appendix."
The data for Oregon are not necessarily representative because they are missing data from a larger data source that is significant in this state. The results in Oregon are unlikely to be significantly under- or overestimated, given that the state uses a fee schedule to regulate the payment for professional services, and it is unlikely that the prices paid for the missing data source in Oregon were materially different from other data sources included in this study from the same state.
Figure C.25 Oregon Trend in Professional Prices Paid by Service Group, 2008 to 2019
Oregon Trend in Professional Prices Paid by Service Group, 2008 to 2019
Oregon Annual Change in Professional Prices Paid by Service Group (%)
Special notation: p We use the notation p to indicate that the 2019 numbers are preliminary results based on half-year price data through June 30, 2019.
Notes:
Professional Services
Emergency
Evaluation and management
Major radiology
Minor radiology
40
60
80
100
120
140
160
180
200
220
2008 2009 2010 2011 2012 2013 2014 2015 2016 2017 2018 2019
Ind
ex o
f P
rice
s P
aid
(bas
e ye
ar is
20
08
=1
00
)
Emergency
Evaluation andmanagement
Major radiology
Minor radiology
Neurological/neuromusculartesting
Physicalmedicine
Major surgery
Painmanagementinjections
p
p
p
copyright © 2020 workers compensation research institute135
_____________________________________________________________________________________________W C R I M E D I C A L P R I C E I N D E X F O R W O R K E R S ' C O M P E N S A T I O N , 1 2 T H E D I T I O N ( M P I - W C )

2008 2009 2010 2011 2012 2013 2014 2015 2016 2017 2018 2019
100 94 93 95 99 102 103 105 107 107 109 109
100 99 98 100 103 105 108 109 111 112 115 119
100 97 99 98 98 100 98 97 97 97 96 96
100 104 104 106 108 111 113 115 118 119 121 123
100 102 102 103 97 64 62 63 64 66 68 69
100 101 101 102 107 110 112 113 116 118 119 119
100 101 101 101 104 109 110 111 114 115 119 122
100 103 99 103 106 108 109 109 109 107 110 116
2008 to 2009
2009 to 2010
2010 to 2011
2011 to 2012
2012 to 2013
2013 to 2014
2014 to 2015
2015 to 2016
2016 to 2017
2017 to 2018
2018 to 2019
-6% -1% 3% 4% 2% 2% 1% 2% 0% 2% 0%
-1% -1% 1% 3% 3% 2% 1% 2% 1% 3% 3%
-3% 2% -1% 0% 2% -1% -1% 0% 0% -1% 0%
4% 0% 2% 2% 3% 2% 2% 2% 1% 1% 2%
2% 0% 1% -5% -35% -2% 1% 2% 2% 3% 2%
1% -1% 1% 5% 3% 2% 1% 3% 2% 1% 0%
1% 0% 0% 3% 5% 1% 1% 2% 1% 4% 3%
3% -4% 4% 2% 2% 1% 0% 1% -2% 3% 6%
Figure C.26 Pennsylvania Trend in Professional Prices Paid by Service Group, 2008 to 2019
Pennsylvania Trend in Professional Prices Paid by Service Group, 2008 to 2019
Pennsylvania Annual Change in Professional Prices Paid by Service Group (%)
Special notation: p We use the notation p to indicate that the 2019 numbers are preliminary results based on half-year price data through June 30, 2019.
Notes: Pennsylvania updates its fee schedule for professional services annually, based on the percentage change in the statewide average weekly wage. For 2019, this percentage change was 2.3 percent and applies to all services rendered on or after January 1, 2019.
Evaluation and management
Physical medicine
Major radiology
Professional Services
Neurological/neuromuscular testinga
Emergency
Minor radiology
Pain management injections
Major radiology
Minor radiology
Neurological/neuromuscular testinga
Pain management injections
Major surgery
Professional Services
Emergency
Evaluation and management
Physical medicine
Major surgery
a Prices paid for neurological/neuromuscular testing services in most study states decreased starting in 2013. This general trend is related to a fundamental change implemented by the Centers for Medicare & Medicaid Services in the coding system for nerve conduction studies, which are the most commonly billed procedures in the neurological/neuromuscular testing service group. For more details, see "Discussion of Substantial Changes in Prices at Service-Type Level" and "Technical Appendix."
40
60
80
100
120
140
160
180
200
220
2008 2009 2010 2011 2012 2013 2014 2015 2016 2017 2018 2019
Ind
ex o
f P
rice
s P
aid
(bas
e ye
ar is
20
08
=1
00
)
Emergency
Evaluation andmanagement
Major radiology
Minor radiology
Neurological/neuromusculartesting
Physicalmedicine
Major surgery
Painmanagementinjections
p
p
p
copyright © 2020 workers compensation research institute136
_____________________________________________________________________________________________W C R I M E D I C A L P R I C E I N D E X F O R W O R K E R S ' C O M P E N S A T I O N , 1 2 T H E D I T I O N ( M P I - W C )

2008 2009 2010 2011 2012 2013 2014 2015 2016 2017 2018 2019
100 101 122 129 130 129 130 131 130 128 129 129
100 99 107 115 115 115 114 114 115 116 115 118
100 100 88 75 75 75 74 72 67 62 58 57
100 99 103 99 99 99 98 95 92 92 90 93
100 98 109 124 129 128 127 113 85 84 84 85
100 104 107 108 109 111 111 114 116 107 107 102
100 96 97 94 96 94 90 83 79 81 79 81
100 99 95 88 88 86 84 88 87 81 77 78
2008 to 2009
2009 to 2010
2010 to 2011
2011 to 2012
2012 to 2013
2013 to 2014
2014 to 2015
2015 to 2016
2016 to 2017
2017 to 2018
2018 to 2019
1% 21% 6% 1% -1% 1% 1% -1% -2% 0% 0%
-1% 8% 7% 0% 0% -1% 0% 1% 1% -1% 2%
0% -12% -15% 0% 0% -1% -4% -6% -8% -7% -1%
-1% 4% -4% 0% 0% -1% -3% -3% 0% -2% 3%
-2% 11% 14% 4% -1% 0% -11% -25% -2% 1% 0%
4% 3% 1% 1% 3% 0% 2% 2% -8% 1% -5%
-4% 1% -3% 2% -2% -5% -8% -5% 3% -3% 2%
-1% -3% -7% 0% -3% -2% 5% -2% -6% -5% 2%
South Carolina Annual Change in Professional Prices Paid by Service Group (%)
Special notation: p We use the notation p to indicate that the 2019 numbers are preliminary results based on half-year price data through June 30, 2019.
Notes: South Carolina's fee schedule for professional services remained unchanged (after an update in January 2003) until 2009. Effective July 1, 2010, South Carolina had another update to its fee schedule, which increased the fee schedule rates for many professional services (evaluation and management, emergency, etc.) and decreased the rates for others (pain management injections, radiology services, etc.). The most recent update within the study period in this report was effective April 1, 2019; the half-year price data through June 2019 in this edition reflect only two months of experience after this fee schedule update.
Figure C.27 South Carolina Trend in Professional Prices Paid by Service Group, 2008 to 2019
Professional Services
Emergency
Physical medicine
Evaluation and management
Minor radiology
Major radiology
Neurological/neuromuscular testinga
South Carolina Trend in Professional Prices Paid by Service Group, 2008 to 2019
Physical medicine
Major surgery
Pain management injections
Major surgery
Pain management injections
Professional Services
Emergency
Evaluation and management
Major radiology
Minor radiology
Neurological/neuromuscular testinga
a Prices paid for neurological/neuromuscular testing services in most study states decreased starting in 2013. This general trend is related to a fundamental change implemented by the Centers for Medicare & Medicaid Services in the coding system for nerve conduction studies, which are the most commonly billed procedures in the neurological/neuromuscular testing service group. For more details, see "Discussion of Substantial Changes in Prices at Service-Type Level" and "Technical Appendix."
40
60
80
100
120
140
160
180
200
220
2008 2009 2010 2011 2012 2013 2014 2015 2016 2017 2018 2019
Ind
ex o
f P
rice
s P
aid
(bas
e ye
ar is
20
08
=1
00
)
Emergency
Evaluation andmanagement
Major radiology
Minor radiology
Neurological/neuromusculartesting
Physicalmedicine
Major surgery
Painmanagementinjections
p
p
p
copyright © 2020 workers compensation research institute137
_____________________________________________________________________________________________W C R I M E D I C A L P R I C E I N D E X F O R W O R K E R S ' C O M P E N S A T I O N , 1 2 T H E D I T I O N ( M P I - W C )

2008 2009 2010 2011 2012 2013 2014 2015 2016 2017 2018 2019
100 106 117 120 112 106 105 106 105 105 102 102
100 101 110 117 115 114 110 108 108 110 108 109
100 99 101 106 101 90 74 69 70 70 69 67
100 99 108 112 114 106 95 89 89 90 91 93
100 97 107 122 125 76 76 76 75 77 78 79
100 105 114 118 117 117 113 109 108 110 116 118
100 102 114 116 114 101 98 100 99 99 98 98
100 93 103 110 114 100 86 103 95 93 95 98
2008 to 2009
2009 to 2010
2010 to 2011
2011 to 2012
2012 to 2013
2013 to 2014
2014 to 2015
2015 to 2016
2016 to 2017
2017 to 2018
2018 to 2019
6% 10% 3% -7% -6% 0% 0% -1% 0% -3% 0%
1% 9% 7% -1% -1% -3% -2% 0% 2% -2% 1%
-1% 2% 4% -4% -11% -18% -6% 1% 0% -1% -2%
-1% 9% 4% 2% -7% -10% -7% 0% 1% 0% 3%
-3% 11% 13% 3% -39% 0% 0% -1% 2% 2% 1%
5% 8% 3% 0% -1% -3% -4% -1% 2% 5% 2%
2% 12% 2% -2% -11% -4% 2% 0% 0% -1% 0%
-7% 10% 7% 4% -12% -14% 20% -8% -3% 3% 3%
Physical medicine
Major surgery
Special notation: p We use the notation p to indicate that the 2019 numbers are preliminary results based on half-year price data through June 30, 2019.
Note: Tennessee implemented an RBRVS-based fee schedule in July 2005 and had regular updates in the following years. For instance, the fee schedule rates decreased across service groups in 2013. The most recent update covered in the study period in this report was effective April 1, 2019.
a Prices paid for neurological/neuromuscular testing services in most study states decreased starting in 2013. This general trend is related to a fundamental change implemented by the Centers for Medicare & Medicaid Services in the coding system for nerve conduction studies, which are the most commonly billed procedures in the neurological/neuromuscular testing service group. For more details, see "Discussion of Substantial Changes in Prices at Service-Type Level" and "Technical Appendix."
Key: RBRVS: resource-based relative value scale (Medicare).
Neurological/neuromuscular testinga
Minor radiology
Physical medicine
Professional Services
Emergency
Evaluation and management
Pain management injections
Pain management injections
Major radiology
Major surgery
Minor radiology
Neurological/neuromuscular testinga
Tennessee Annual Change in Professional Prices Paid by Service Group (%)
Figure C.28 Tennessee Trend in Professional Prices Paid by Service Group, 2008 to 2019
Evaluation and management
Major radiology
Emergency
Professional Services
Tennessee Trend in Professional Prices Paid by Service Group, 2008 to 2019
40
60
80
100
120
140
160
180
200
220
2008 2009 2010 2011 2012 2013 2014 2015 2016 2017 2018 2019
Ind
ex o
f P
rice
s P
aid
(bas
e ye
ar is
20
08
=1
00
)
Emergency
Evaluation andmanagement
Major radiology
Minor radiology
Neurological/neuromusculartesting
Physicalmedicine
Major surgery
Painmanagementinjections
p
p
p
copyright © 2020 workers compensation research institute138
_____________________________________________________________________________________________W C R I M E D I C A L P R I C E I N D E X F O R W O R K E R S ' C O M P E N S A T I O N , 1 2 T H E D I T I O N ( M P I - W C )

2008 2009 2010 2011 2012 2013 2014 2015 2016 2017 2018 2019
100 111 113 123 121 122 121 123 124 125 127 131
100 108 114 134 138 142 139 140 141 143 145 148
100 103 101 98 107 96 77 73 74 75 76 76
100 106 109 112 125 130 117 109 111 113 116 121
100 100 106 127 133 93 91 93 95 96 99 98
100 109 111 130 134 140 137 133 129 123 123 127
100 108 116 140 133 136 131 131 133 134 136 139
100 105 108 125 127 124 106 121 123 126 130 132
2008 to 2009
2009 to 2010
2010 to 2011
2011 to 2012
2012 to 2013
2013 to 2014
2014 to 2015
2015 to 2016
2016 to 2017
2017 to 2018
2018 to 2019
11% 1% 10% -2% 0% -1% 2% 1% 1% 1% 3%
8% 6% 17% 3% 3% -2% 1% 1% 1% 1% 2%
3% -2% -3% 9% -10% -20% -6% 2% 1% 2% 0%
6% 2% 3% 12% 4% -10% -7% 2% 2% 2% 4%
0% 6% 20% 5% -30% -3% 2% 2% 1% 4% -1%
9% 2% 17% 3% 4% -2% -3% -3% -4% 0% 3%
8% 7% 21% -5% 2% -3% 0% 1% 1% 1% 2%
5% 3% 15% 1% -2% -14% 14% 1% 3% 3% 2%
Figure C.29 Texas Trend in Professional Prices Paid by Service Group, 2008 to 2019
Professional Services
Pain management injections
Major surgery
Evaluation and management
Minor radiology
Major radiology
Emergency
Texas Trend in Professional Prices Paid by Service Group, 2008 to 2019
Special notation: p We use the notation p to indicate that the 2019 numbers are preliminary results based on half-year price data through June 30, 2019.
Notes: In March 2008, Texas increased fee schedule rates for professional services, especially for surgeries, and allowed annual increases based on changes in the Medicare Economic Index. In 2011, the fee schedule rates in Texas increased for most professional services following the Medicare updates. The most recent update covered in the study period in this report was effective April 1, 2019.
Pain management injections
Major radiology
Minor radiology
Neurological/neuromuscular testinga
Neurological/neuromuscular testinga
Physical medicine
Professional Services
Emergency
Evaluation and management
Physical medicine
Major surgery
a Prices paid for neurological/neuromuscular testing services in most study states decreased starting in 2013. This general trend is related to a fundamental change implemented by the Centers for Medicare & Medicaid Services in the coding system for nerve conduction studies, which are the most commonly billed procedures in the neurological/neuromuscular testing service group. For more details, see "Discussion of Substantial Changes in Prices at Service-Type Level" and "Technical Appendix."
Texas Annual Change in Professional Prices Paid by Service Group (%)
40
60
80
100
120
140
160
180
200
220
2008 2009 2010 2011 2012 2013 2014 2015 2016 2017 2018 2019
Ind
ex o
f P
rice
s P
aid
(bas
e ye
ar is
20
08
=1
00
)
Emergency
Evaluation andmanagement
Major radiology
Minor radiology
Neurological/neuromusculartesting
Physicalmedicine
Major surgery
Painmanagementinjections
p
p
p
copyright © 2020 workers compensation research institute139
_____________________________________________________________________________________________W C R I M E D I C A L P R I C E I N D E X F O R W O R K E R S ' C O M P E N S A T I O N , 1 2 T H E D I T I O N ( M P I - W C )

2008 2009 2010 2011 2012 2013 2014 2015 2016 2017 2018 2019
100 108 114 118 125 123 138 151 163 170 146 153
100 106 111 115 117 121 126 131 137 144 129 130
100 110 107 109 108 110 115 112 110 106 95 96
100 102 104 103 103 105 110 108 108 107 82 84
100 107 121 121 127 87 99 102 100 101 97 102
100 110 114 111 116 127 136 136 142 147 128 132
100 93 97 103 108 104 110 103 108 119 104 103
100 98 105 108 112 117 122 119 123 128 102 105
2008 to 2009
2009 to 2010
2010 to 2011
2011 to 2012
2012 to 2013
2013 to 2014
2014 to 2015
2015 to 2016
2016 to 2017
2017 to 2018
2018 to 2019
8% 5% 3% 6% -1% 12% 10% 8% 4% -14% 5%
6% 5% 3% 2% 3% 5% 4% 5% 5% -11% 1%
10% -2% 2% -1% 2% 5% -3% -2% -4% -10% 0%
2% 1% -1% 0% 2% 4% -1% -1% -1% -23% 3%
7% 14% 0% 5% -31% 13% 3% -2% 1% -5% 5%
10% 4% -3% 5% 9% 7% 0% 5% 4% -13% 3%
-7% 4% 6% 5% -4% 6% -7% 5% 10% -13% 0%
-2% 7% 3% 4% 4% 5% -2% 3% 5% -20% 3%
Figure C.30 Virginia Trend in Professional Prices Paid by Service Group, 2008 to 2019
Physical medicine
Major radiology
Minor radiology
Professional Services
Emergency
Evaluation and management
Neurological/neuromuscular testinga
Virginia Trend in Professional Prices Paid by Service Group, 2008 to 2019
Special notation: p We use the notation p to indicate that the 2019 numbers are preliminary results based on half-year price data through June 30, 2019.
Notes: Virginia adopted its first workers’ compensation fee schedule for medical professional services effective January 1, 2018. As this figure shows, prices paid for all types of professional services in Virginia decreased from 2017 to 2018, following this policy change. The average overall price for professional services decreased 13 percent in 2018 (see Figure B.31). With data through June 2019, results shown in this edition reflect the impact of the first 18 months of the fee schedule adoption in this state.
Neurological/neuromuscular testinga
Physical medicine
Major surgery
Pain management injections
Pain management injections
Major surgery
Professional Services
Emergency
Evaluation and management
Major radiology
Minor radiology
a Prices paid for neurological/neuromuscular testing services in most study states decreased starting in 2013. This general trend is related to a fundamental change implemented by the Centers for Medicare & Medicaid Services in the coding system for nerve conduction studies, which are the most commonly billed procedures in the neurological/neuromuscular testing service group. For more details, see "Discussion of Substantial Changes in Prices at Service-Type Level" and "Technical Appendix."
Virginia Annual Change in Professional Prices Paid by Service Group (%)
40
60
80
100
120
140
160
180
200
220
2008 2009 2010 2011 2012 2013 2014 2015 2016 2017 2018 2019
Ind
ex o
f P
rice
s P
aid
(bas
e ye
ar is
20
08
=1
00
)
Emergency
Evaluation andmanagement
Major radiology
Minor radiology
Neurological/neuromusculartesting
Physicalmedicine
Major surgery
Painmanagementinjections
p
p
p
copyright © 2020 workers compensation research institute140
_____________________________________________________________________________________________W C R I M E D I C A L P R I C E I N D E X F O R W O R K E R S ' C O M P E N S A T I O N , 1 2 T H E D I T I O N ( M P I - W C )

2008 2009 2010 2011 2012 2013 2014 2015 2016 2017 2018 2019
100 107 112 120 125 132 139 143 152 157 165 170
100 106 112 118 124 132 140 145 151 158 165 172
100 106 107 102 103 101 101 97 96 101 96 95
100 106 114 112 115 118 123 123 128 130 136 140
100 110 121 121 124 88 91 90 94 98 99 99
100 105 112 115 120 126 134 140 145 149 160 165
100 107 113 118 123 127 135 134 136 145 151 148
100 114 131 136 147 146 157 161 161 176 173 182
2008 to 2009
2009 to 2010
2010 to 2011
2011 to 2012
2012 to 2013
2013 to 2014
2014 to 2015
2015 to 2016
2016 to 2017
2017 to 2018
2018 to 2019
7% 5% 7% 4% 5% 5% 3% 6% 4% 5% 3%
6% 6% 5% 5% 6% 6% 3% 4% 5% 5% 4%
6% 1% -5% 1% -2% 0% -4% -1% 6% -5% -1%
6% 8% -2% 3% 3% 4% 0% 4% 2% 4% 3%
10% 11% 0% 2% -29% 3% -1% 4% 5% 1% 0%
5% 6% 3% 4% 5% 6% 5% 3% 3% 7% 3%
7% 6% 4% 4% 4% 6% 0% 2% 6% 4% -2%
14% 15% 3% 8% 0% 7% 3% 0% 9% -2% 5%
Figure C.31 Wisconsin Trend in Professional Prices Paid by Service Group, 2008 to 2019
Wisconsin Trend in Professional Prices Paid by Service Group, 2008 to 2019
Wisconsin Annual Change in Professional Prices Paid by Service Group (%)
Special notation: p We use the notation p to indicate that the 2019 numbers are preliminary results based on half-year price data through June 30, 2019.
Note: Wisconsin did not have a conventional workers' compensation fee schedule as of 2019.
Neurological/neuromuscular testinga
Physical medicine
Major radiology
Professional Services
Neurological/neuromuscular testinga
Emergency
Minor radiology
Evaluation and management
Pain management injections
Major surgery
Professional Services
Emergency
Evaluation and management
Major radiology
Minor radiology
Physical medicine
Major surgery
Pain management injections
a Prices paid for neurological/neuromuscular testing services in most study states decreased starting in 2013. This general trend is related to a fundamental change implemented by the Centers for Medicare & Medicaid Services in the coding system for nerve conduction studies, which are the most commonly billed procedures in the neurological/neuromuscular testing service group. For more details, see "Discussion of Substantial Changes in Prices at Service-Type Level" and "Technical Appendix."
40
60
80
100
120
140
160
180
200
220
2008 2009 2010 2011 2012 2013 2014 2015 2016 2017 2018 2019
Ind
ex o
f P
rice
s P
aid
(bas
e ye
ar is
20
08
=1
00
)
Emergency
Evaluation andmanagement
Major radiology
Minor radiology
Neurological/neuromusculartesting
Physicalmedicine
Major surgery
Painmanagementinjections
p
p
p
copyright © 2020 workers compensation research institute141
_____________________________________________________________________________________________W C R I M E D I C A L P R I C E I N D E X F O R W O R K E R S ' C O M P E N S A T I O N , 1 2 T H E D I T I O N ( M P I - W C )

2008 to 2009 2009 to 2010 2010 to 2011 2011 to 2012 2012 to 2013 2013 to 2014 2014 to 2015 2015 to 2016 2016 to 2017 2017 to 2018 2018 to 2019
CPI-M for professional services, nationwide 3% 3% 2% 2% 2% 1% 2% 3% 1% 1% 1% 1.9%
CPI-M, Northeast 2% 2% 2% 1% 2% 1% 3% 3% 2% 1% 3% 2.0%
CPI-M, Midwest 4% 3% 2% 2% 2% 2% 1% 4% 2% 0% 1% 2.3%
CPI-M, South 3% 4% 3% 2% 2% 1% 1% 2% 0% 1% 1% 1.6%
CPI-M, West 3% 2% 2% 2% 2% 2% 2% 4% 1% 1% 0% 1.9%
2009 to 2010 2010 to 2011 2011 to 2012 2012 to 2013 2013 to 2014 2014 to 2015 2015 to 2016 2016 to 2017 2017 to 2018 2018 to 2019
3% 2% 1% 0% 1% -1% 0% 1% 1% 1% 0.9%
Table D.1 Trends of Consumer Price Index for Medical Care (CPI-M, Professional Services) and Producer Price Index for Health Care Services (PPI, Physician Care)
CPI-M, Professional Services, 2008 to 2019, for Urban Wage Earners and Clerical Workers, Not Seasonally Adjusted
Annual Growth Rate (percentage change)
PPI - commodity for physician care, nationwide
Source: U.S. Bureau of Labor Statistics, not seasonally adjusted. Producer Price Index - commodity for physician care, Series ID WPU511101 located at http://www.bls.gov/ppi.
Average Annual Percentage
Change
Source: U.S. Bureau of Labor Statistics, not seasonally adjusted. Consumer Price Index - Urban Wage Earners and Clerical Workers, Series ID CWUR0000SEMC located at http://www.bls.gov/cpi.
PPI, Commodity for Health Care Services, Physician Care, 2009 to 2019, Not Seasonally Adjusted
Annual Growth Rate (percentage change)
Average Annual Percentage
Change
By region
copyright © 2020 workers compensation research institute142
_____________________________________________________________________________________________W C R I M E D I C A L P R I C E I N D E X F O R W O R K E R S ' C O M P E N S A T I O N , 1 2 T H E D I T I O N ( M P I - W C )
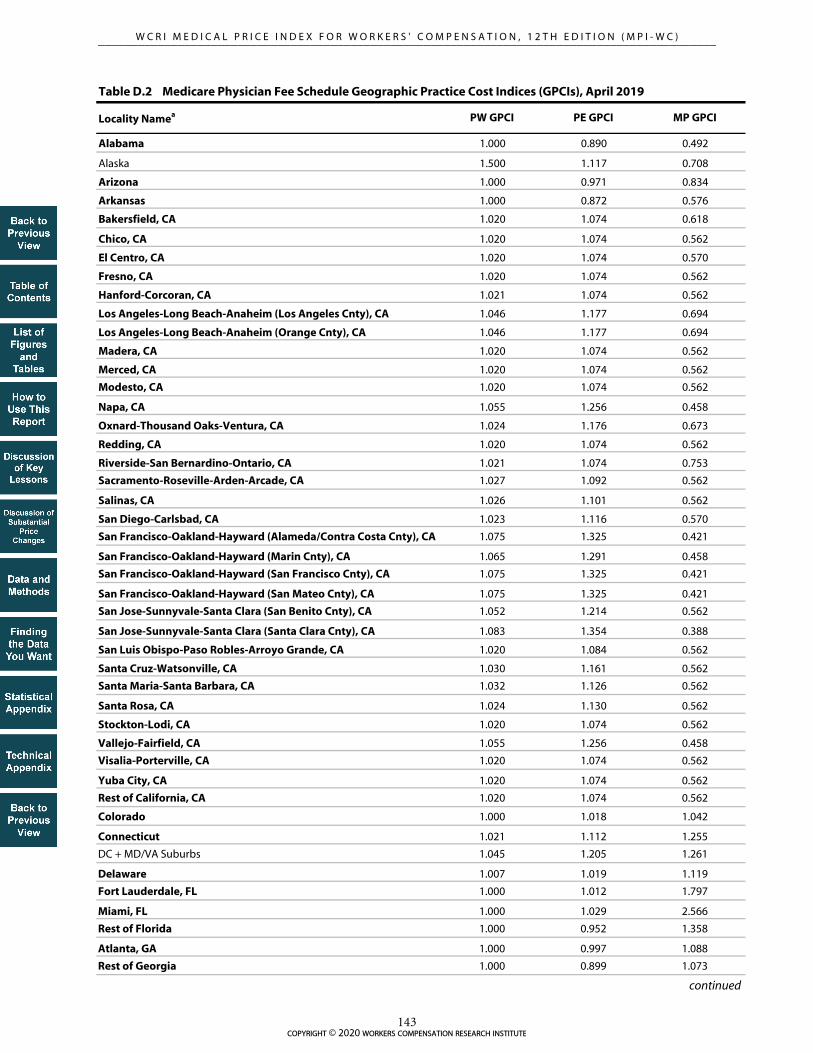
Locality Namea PW GPCI PE GPCI MP GPCI
Alabama 1.000 0.890 0.492
Alaska 1.500 1.117 0.708
Arizona 1.000 0.971 0.834
Arkansas 1.000 0.872 0.576
Bakersfield, CA 1.020 1.074 0.618
Chico, CA 1.020 1.074 0.562
El Centro, CA 1.020 1.074 0.570
Fresno, CA 1.020 1.074 0.562
Hanford-Corcoran, CA 1.021 1.074 0.562
Los Angeles-Long Beach-Anaheim (Los Angeles Cnty), CA 1.046 1.177 0.694
Los Angeles-Long Beach-Anaheim (Orange Cnty), CA 1.046 1.177 0.694
Madera, CA 1.020 1.074 0.562
Merced, CA 1.020 1.074 0.562
Modesto, CA 1.020 1.074 0.562
Napa, CA 1.055 1.256 0.458
Oxnard-Thousand Oaks-Ventura, CA 1.024 1.176 0.673
Redding, CA 1.020 1.074 0.562
Riverside-San Bernardino-Ontario, CA 1.021 1.074 0.753
Sacramento-Roseville-Arden-Arcade, CA 1.027 1.092 0.562
Salinas, CA 1.026 1.101 0.562
San Diego-Carlsbad, CA 1.023 1.116 0.570
San Francisco-Oakland-Hayward (Alameda/Contra Costa Cnty), CA 1.075 1.325 0.421
San Francisco-Oakland-Hayward (Marin Cnty), CA 1.065 1.291 0.458
San Francisco-Oakland-Hayward (San Francisco Cnty), CA 1.075 1.325 0.421
San Francisco-Oakland-Hayward (San Mateo Cnty), CA 1.075 1.325 0.421
San Jose-Sunnyvale-Santa Clara (San Benito Cnty), CA 1.052 1.214 0.562
San Jose-Sunnyvale-Santa Clara (Santa Clara Cnty), CA 1.083 1.354 0.388
San Luis Obispo-Paso Robles-Arroyo Grande, CA 1.020 1.084 0.562
Santa Cruz-Watsonville, CA 1.030 1.161 0.562
Santa Maria-Santa Barbara, CA 1.032 1.126 0.562
Santa Rosa, CA 1.024 1.130 0.562
Stockton-Lodi, CA 1.020 1.074 0.562
Vallejo-Fairfield, CA 1.055 1.256 0.458
Visalia-Porterville, CA 1.020 1.074 0.562
Yuba City, CA 1.020 1.074 0.562
Rest of California, CA 1.020 1.074 0.562
Colorado 1.000 1.018 1.042
Connecticut 1.021 1.112 1.255
DC + MD/VA Suburbs 1.045 1.205 1.261
Delaware 1.007 1.019 1.119
Fort Lauderdale, FL 1.000 1.012 1.797
Miami, FL 1.000 1.029 2.566
Rest of Florida 1.000 0.952 1.358
Atlanta, GA 1.000 0.997 1.088
Rest of Georgia 1.000 0.899 1.073
Table D.2 Medicare Physician Fee Schedule Geographic Practice Cost Indices (GPCIs), April 2019
continued
copyright © 2020 workers compensation research institute143
_____________________________________________________________________________________________W C R I M E D I C A L P R I C E I N D E X F O R W O R K E R S ' C O M P E N S A T I O N , 1 2 T H E D I T I O N ( M P I - W C )

Locality Namea PW GPCI PE GPCI MP GPCI
Hawaii/Guam 1.001 1.146 0.614
Idaho 1.000 0.902 0.512
Chicago, IL 1.008 1.034 1.925
East St. Louis, IL 1.000 0.936 1.785
Suburban Chicago, IL 1.009 1.053 1.565
Rest of Illinois 1.000 0.919 1.208
Indiana 1.000 0.919 0.379
Iowa 1.000 0.907 0.423
Kansas 1.000 0.911 0.615
Kentucky 1.000 0.880 0.819
New Orleans, LA 1.000 0.966 1.273
Rest of Louisiana 1.000 0.887 1.199
Southern Maine 1.000 1.007 0.670
Rest of Maine 1.000 0.922 0.670
Baltimore/Surr. Cntys, MD 1.023 1.095 1.295
Rest of Maryland 1.009 1.033 1.082
Metropolitan Boston 1.033 1.179 1.061
Rest of Massachusetts 1.020 1.067 1.061
Detroit, MI 1.000 0.989 1.691
Rest of Michigan 1.000 0.919 1.018
Minnesota 1.000 1.011 0.362
Mississippi 1.000 0.870 0.370
Metropolitan Kansas City, MO 1.000 0.963 1.073
Metropolitan St Louis, MO 1.000 0.959 1.053
Rest of Missouri 1.000 0.863 0.993
Montana 1.000 1.000 1.631
Nebraska 1.000 0.910 0.318
Nevada 1.002 1.017 0.909
New Hampshire 1.000 1.045 1.050
Northern NJ 1.041 1.180 0.938
Rest of New Jersey 1.024 1.123 0.938
New Mexico 1.000 0.921 1.247
Manhattan, NY 1.052 1.180 1.615
NYC Suburbs/Long Island, NY 1.041 1.205 2.149
Poughkpsie/N NYC Suburbs, NY 1.016 1.070 1.313
Queens, NY 1.052 1.200 2.121
Rest of New York 1.000 0.950 0.595
North Carolina 1.000 0.931 0.695
North Dakota 1.000 1.000 0.540
Ohio 1.000 0.917 1.005
Oklahoma 1.000 0.891 0.954
Portland, OR 1.010 1.054 0.783
Rest of Oregon 1.000 0.967 0.783
Metropolitan Philadelphia, PA 1.022 1.074 1.379
Rest of Pennsylvania 1.000 0.936 1.033
continued
Table D.2 Medicare Physician Fee Schedule Geographic Practice Cost Indices (GPCIs), April 2019 (continued)
copyright © 2020 workers compensation research institute144
_____________________________________________________________________________________________W C R I M E D I C A L P R I C E I N D E X F O R W O R K E R S ' C O M P E N S A T I O N , 1 2 T H E D I T I O N ( M P I - W C )

Locality Namea PW GPCI PE GPCI MP GPCI
Puerto Rico 1.000 1.007 0.990
Rhode Island 1.027 1.050 0.999
South Carolina 1.000 0.912 0.553
South Dakota 1.000 1.000 0.389
Tennessee 1.000 0.901 0.526
Austin, TX 1.000 1.021 0.747
Beaumont, TX 1.000 0.924 0.839
Brazoria, TX 1.020 0.997 0.839
Dallas, TX 1.012 1.014 0.768
Fort Worth, TX 1.007 0.986 0.747
Galveston, TX 1.020 1.011 0.839
Houston, TX 1.020 1.012 0.936
Rest of Texas 1.000 0.938 0.796
Utah 1.000 0.927 1.165
Vermont 1.000 1.015 0.595
Virginia 1.000 0.986 0.908
Virgin Islands 1.000 1.007 0.990
Seattle (King Cnty), WA 1.027 1.146 0.931
Rest of Washington 1.000 1.011 0.902
West Virginia 1.000 0.857 1.296
Wisconsin 1.000 0.957 0.347
Wyoming 1.000 1.000 0.880
Medicare fee schedule payment amounts for services are monetized by multiplying the RVU for each component by the GPCI for that component and then applying a conversion factor.
Key: CMS: Centers for Medicare & Medicaid Services; GPCI: geographic practice cost index; MP: malpractice insurance; PE: practice expense; PFS: physician fee schedule; PW: physician wages; RVU: relative value unit.
Source: Centers for Medicare & Medicaid Services. April 2019. Physician Fee Schedule - PFS Relative Value Files, RVU19B.zip, CY2019 GPCIs located at https://www.cms.gov/Medicare/Medicare-Fee-for-Service-Payment/PhysicianFeeSched/PFS-Relative-Value-Files-Items/RVU19B.html.
Notes:
a Developed and implemented in 1997, the Centers for Medicare & Medicaid Services currently calculates GPCIs for 112 separate geographic areas, referred to as Medicare payment localities, for use with the physician fee schedule. Localities in the states covered in this study are indicated above in bold typeface.
The national physician fee schedule (PFS) specifies a set of allowable procedures and is used to determine the Medicare payment to the medical professional for each service. Each procedure is assessed to be composed of a combination of three components or inputs: (1) physician work (wages), (2) practice-related expenses (including staff wages; office rent; cost of contracted services, such as accounting, legal, and advertising; and expenses relating to equipment and supplies), and (3) costs related to malpractice insurance coverage. The blend of these underlying components is evaluated and relative value units (RVUs) are assigned to each component for each service at the national level.
The Medicare PFS payment amounts are further adjusted to account for the variation in practice costs from area to area using geographic practice cost indices (GPCIs). Paralleling the RVU structure, GPCIs are split into three parts: physician work (PW), practice expense (PE), and malpractice insurance (MP). The GPCI values reflect the estimated component cost in a specified locality divided by the national average component cost. GPCIs greater than 1.000 indicate that a locality has costs estimated to be above the national average, while GPCIs of less than 1.000 point toward practice costs that fall below the national average.
Table D.2 Medicare Physician Fee Schedule Geographic Practice Cost Indices (GPCIs), April 2019 (continued)
copyright © 2020 workers compensation research institute145
_____________________________________________________________________________________________W C R I M E D I C A L P R I C E I N D E X F O R W O R K E R S ' C O M P E N S A T I O N , 1 2 T H E D I T I O N ( M P I - W C )

STATISTICAL APPENDIX
This statistical appendix for the 12th edition of the MPI-WC provides the following supplemental figures and
tables:
Table SA.1 provides longer-term trends of prices paid for overall professional services as well as by each
service group from 2002 to 2019 for the 25 states covered in the earlier editions of this study series.
Table SA.2 shows changes in prices paid for overall professional services as well as by each service group
in the five additional states introduced since the 10th edition—Alabama, Delaware, Nevada, New
Hampshire, and New Mexico—for a shorter period from 2013 to 2019, when sufficient data were
available in these states.
copyright © 2020 workers compensation research institute146
_____________________________________________________________________________________________W C R I M E D I C A L P R I C E I N D E X F O R W O R K E R S ' C O M P E N S A T I O N , 1 2 T H E D I T I O N ( M P I - W C )

2002 2003 2004 2005 2006 2007 2008 2009 2010 2011 2012 2013 2014 2015 2016 2017 2018 2019
100 104 104 105 106 108 107 110 112 119 119 117 111 109 110 111 110 112
100 103 105 104 103 113 119 117 122 125 123 122 120 120 119 119 118 118
100 101 103 103 104 113 115 116 125 132 134 135 132 132 132 133 133 134
100 104 105 104 110 108 106 109 81 81 84 79 65 58 59 58 58 56
100 102 102 101 103 103 104 107 109 110 109 111 102 96 95 95 95 97
100 112 126 131 134 119 120 116 138 149 152 94 90 97 98 100 101 100
100 110 109 112 111 113 109 116 120 127 128 133 129 125 128 127 127 131
100 97 95 94 96 93 93 92 96 104 100 101 98 97 97 98 96 98
100 98 100 109 114 82 83 89 97 106 105 104 84 91 95 99 96 95
2002 2003 2004 2005 2006 2007 2008 2009 2010 2011 2012 2013 2014 2015 2016 2017 2018 2019
100 101 103 105 108 111 109 112 119 119 119 122 133 133 139 141 145 143
100 101 103 115 117 121 119 125 149 155 151 151 159 164 173 167 146 140
100 100 102 110 115 121 121 124 138 140 140 142 168 171 189 196 217 218
100 102 117 121 115 117 101 99 98 99 98 100 99 102 100 100 96 95
100 100 105 105 102 101 96 96 96 84 83 84 85 89 92 96 97 99
100 91 93 87 87 90 104 106 117 117 119 125 107 72 73 79 81 81
100 107 109 113 127 124 122 130 140 139 141 143 165 166 171 177 190 185
100 99 97 95 93 98 97 99 101 101 100 102 104 103 104 100 89 88
100 112 106 101 105 104 102 107 108 113 112 120 121 125 135 143 121 118
2002 2003 2004 2005 2006 2007 2008 2009 2010 2011 2012 2013 2014 2015 2016 2017 2018 2019
100 100 97 99 97 100 102 104 105 105 104 104 112 113 116 118 119 120
100 100 95 95 94 94 98 99 101 96 97 97 86 91 96 99 101 101
100 101 100 100 99 112 115 116 116 116 116 115 151 159 169 177 181 183
100 101 97 97 96 96 95 95 95 95 95 90 72 67 63 59 59 58
100 100 94 94 93 93 91 91 90 91 91 91 103 93 89 85 86 89
100 88 83 79 76 74 84 84 85 84 81 84 48 52 56 57 61 61
100 103 96 103 102 102 104 109 108 108 107 103 131 134 141 148 148 148
100 99 104 106 102 103 103 105 109 110 109 112 88 84 78 73 73 74
100 102 100 100 101 102 102 102 101 100 99 99 96 96 91 86 85 90
Table SA.1 Trends in Professional Prices Paid by Service Group across 25 Study States, 2002 to 2019
Arkansas
Price indices by service group
Arizona
Price indices by service group
California
Price indices by service group
continued
Evaluation and management
Overall price index
Physical medicine
Neurological/neuromuscular testing
Physical medicine
Major surgery
Pain management injections
Overall price index
Emergency
Evaluation and management
Major radiology
Minor radiology
Emergency
Physical medicine
Evaluation and management
Major radiology
Minor radiology
Major radiology
Major surgery
Minor radiology
Neurological/neuromuscular testing
Major surgery
Pain management injections
Overall price index
Emergency
Pain management injections
Neurological/neuromuscular testing
p
p
p
copyright © 2020 workers compensation research institute147
_____________________________________________________________________________________________W C R I M E D I C A L P R I C E I N D E X F O R W O R K E R S ' C O M P E N S A T I O N , 1 2 T H E D I T I O N ( M P I - W C )
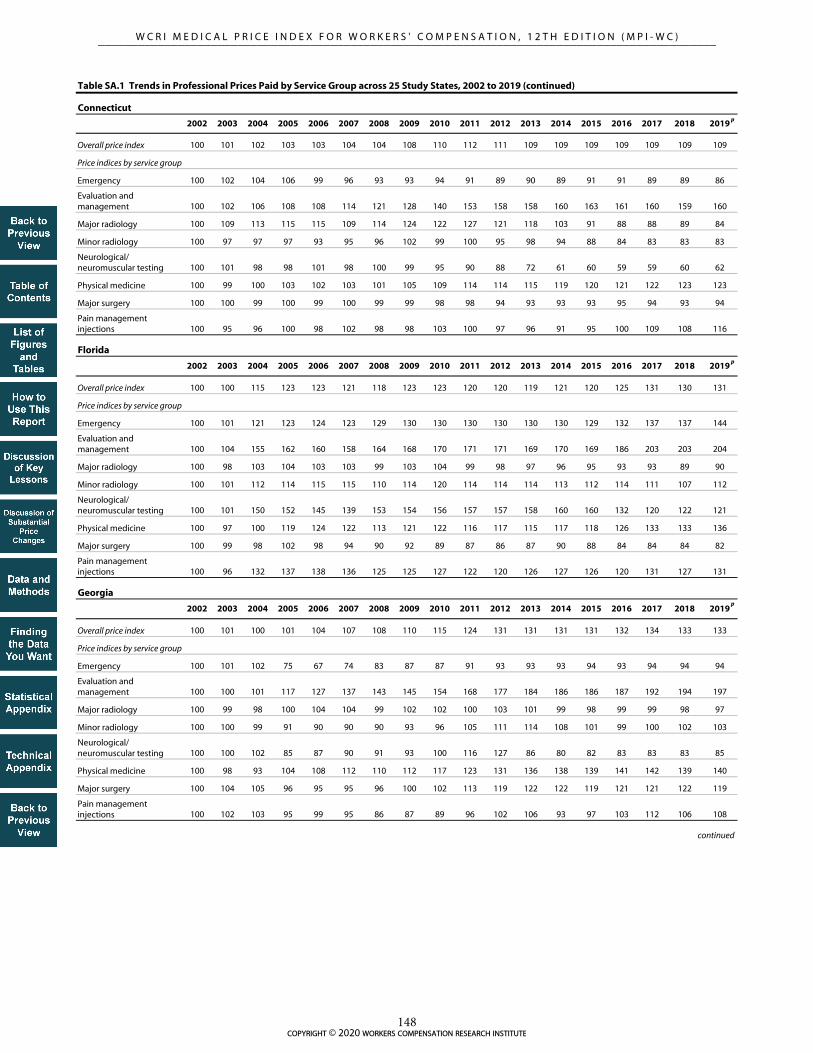
2002 2003 2004 2005 2006 2007 2008 2009 2010 2011 2012 2013 2014 2015 2016 2017 2018 2019
100 101 102 103 103 104 104 108 110 112 111 109 109 109 109 109 109 109
100 102 104 106 99 96 93 93 94 91 89 90 89 91 91 89 89 86
100 102 106 108 108 114 121 128 140 153 158 158 160 163 161 160 159 160
100 109 113 115 115 109 114 124 122 127 121 118 103 91 88 88 89 84
100 97 97 97 93 95 96 102 99 100 95 98 94 88 84 83 83 83
100 101 98 98 101 98 100 99 95 90 88 72 61 60 59 59 60 62
100 99 100 103 102 103 101 105 109 114 114 115 119 120 121 122 123 123
100 100 99 100 99 100 99 99 98 98 94 93 93 93 95 94 93 94
100 95 96 100 98 102 98 98 103 100 97 96 91 95 100 109 108 116
2002 2003 2004 2005 2006 2007 2008 2009 2010 2011 2012 2013 2014 2015 2016 2017 2018 2019
100 100 115 123 123 121 118 123 123 120 120 119 121 120 125 131 130 131
100 101 121 123 124 123 129 130 130 130 130 130 130 129 132 137 137 144
100 104 155 162 160 158 164 168 170 171 171 169 170 169 186 203 203 204
100 98 103 104 103 103 99 103 104 99 98 97 96 95 93 93 89 90
100 101 112 114 115 115 110 114 120 114 114 114 113 112 114 111 107 112
100 101 150 152 145 139 153 154 156 157 157 158 160 160 132 120 122 121
100 97 100 119 124 122 113 121 122 116 117 115 117 118 126 133 133 136
100 99 98 102 98 94 90 92 89 87 86 87 90 88 84 84 84 82
100 96 132 137 138 136 125 125 127 122 120 126 127 126 120 131 127 131
2002 2003 2004 2005 2006 2007 2008 2009 2010 2011 2012 2013 2014 2015 2016 2017 2018 2019
100 101 100 101 104 107 108 110 115 124 131 131 131 131 132 134 133 133
100 101 102 75 67 74 83 87 87 91 93 93 93 94 93 94 94 94
100 100 101 117 127 137 143 145 154 168 177 184 186 186 187 192 194 197
100 99 98 100 104 104 99 102 102 100 103 101 99 98 99 99 98 97
100 100 99 91 90 90 90 93 96 105 111 114 108 101 99 100 102 103
100 100 102 85 87 90 91 93 100 116 127 86 80 82 83 83 83 85
100 98 93 104 108 112 110 112 117 123 131 136 138 139 141 142 139 140
100 104 105 96 95 95 96 100 102 113 119 122 122 119 121 121 122 119
100 102 103 95 99 95 86 87 89 96 102 106 93 97 103 112 106 108
Physical medicine
Major surgery
Table SA.1 Trends in Professional Prices Paid by Service Group across 25 Study States, 2002 to 2019 (continued)
Overall price index
Pain management injections
Overall price index
Emergency
Evaluation and management
Neurological/neuromuscular testing
Major radiology
Minor radiology
Neurological/neuromuscular testing
Physical medicine
Major surgery
Price indices by service group
Georgia
Price indices by service group
continued
Pain management injections
Emergency
Evaluation and management
Major radiology
Minor radiology
Neurological/neuromuscular testing
Overall price index
Emergency
Evaluation and management
Major radiology
Minor radiology
Physical medicine
Major surgery
Pain management injections
Connecticut
Price indices by service group
Florida
p
p
p
copyright © 2020 workers compensation research institute148
_____________________________________________________________________________________________W C R I M E D I C A L P R I C E I N D E X F O R W O R K E R S ' C O M P E N S A T I O N , 1 2 T H E D I T I O N ( M P I - W C )

2002 2003 2004 2005 2006 2007 2008 2009 2010 2011 2012 2013 2014 2015 2016 2017 2018 2019
100 105 111 120 118 123 126 134 138 125 100 102 102 104 104 106 108 111
100 108 109 111 108 111 110 117 117 109 96 99 99 99 100 102 106 107
100 107 113 120 118 124 126 131 132 122 99 100 104 110 111 112 115 118
100 103 108 113 109 107 109 111 115 103 88 93 91 91 90 91 93 95
100 103 106 109 93 97 99 103 106 93 74 76 77 79 79 80 81 83
100 96 105 111 106 114 122 126 130 119 90 97 67 71 70 74 78 77
100 105 109 117 116 121 119 130 134 121 100 101 102 103 103 105 108 109
100 107 115 130 132 141 148 157 163 147 115 116 115 117 116 119 121 126
100 101 110 120 115 120 122 137 150 134 108 112 112 114 116 127 136 141
2002 2003 2004 2005 2006 2007 2008 2009 2010 2011 2012 2013 2014 2015 2016 2017 2018 2019
100 103 105 106 109 113 116 124 132 131 138 133 141 149 152 155 157 156
100 103 109 112 115 119 115 127 139 140 155 160 176 206 222 223 226 224
100 103 109 116 124 129 131 137 146 151 154 156 164 177 179 186 189 191
100 102 100 97 93 97 93 94 96 94 94 98 98 96 90 95 92 93
100 102 104 108 110 115 117 122 125 123 123 123 124 126 126 128 127 124
100 105 105 107 118 123 125 129 136 145 154 91 111 109 121 123 121 126
100 99 103 103 105 109 113 121 128 121 132 134 150 160 169 176 181 180
100 107 106 105 108 112 117 133 142 140 150 143 143 149 148 142 142 136
100 106 110 116 124 123 131 135 156 156 158 163 168 177 186 207 197 210
2002 2003 2004 2005 2006 2007 2008 2009 2010 2011 2012 2013 2014 2015 2016 2017 2018 2019
100 105 107 108 110 114 115 121 124 128 126 123 125 125 128 130 137 138
100 109 114 117 125 126 142 152 155 153 150 153 155 171 200 211 208 194
100 107 111 113 117 123 135 145 150 153 157 162 167 167 171 178 181 183
100 103 104 103 103 106 101 104 105 107 107 114 116 109 106 99 92 90
100 102 106 107 106 109 110 112 115 111 111 112 111 110 113 115 116 116
100 101 104 111 110 127 126 124 124 135 141 87 103 108 111 117 118 122
100 109 108 111 113 114 117 124 131 135 130 130 135 138 145 147 167 170
100 101 103 104 105 106 100 105 104 109 105 102 96 94 96 96 99 98
100 102 108 112 111 117 115 132 138 142 139 136 145 130 121 137 146 142
Minor radiology
Neurological/neuromuscular testing
Physical medicine
Major surgery
Pain management injections
Overall price index
Price indices by service group
Major surgery
Pain management injections
Neurological/neuromuscular testing
Physical medicine
Minor radiology
continued
Minor radiology
Emergency
Evaluation and management
Major radiology
Evaluation and management
Major radiology
Emergency
Iowa
Price indices by service group
Major surgery
Pain management injections
Overall price index
Evaluation and management
Major radiology
Indiana
Neurological/neuromuscular testing
Physical medicine
Overall price index
Emergency
Table SA.1 Trends in Professional Prices Paid by Service Group across 25 Study States, 2002 to 2019 (continued)
Illinois
Price indices by service group
p
p
p
copyright © 2020 workers compensation research institute149
_____________________________________________________________________________________________W C R I M E D I C A L P R I C E I N D E X F O R W O R K E R S ' C O M P E N S A T I O N , 1 2 T H E D I T I O N ( M P I - W C )

2002 2003 2004 2005 2006 2007 2008 2009 2010 2011 2012 2013 2014 2015 2016 2017 2018 2019
100 101 100 100 101 101 102 106 107 107 108 109 111 111 110 109 109 110
100 102 102 102 101 102 102 103 103 105 106 106 106 107 107 107 107 108
100 101 100 102 103 105 106 108 109 111 112 113 115 115 115 115 114 115
100 100 102 100 98 97 96 101 102 103 102 101 98 98 89 82 82 82
100 100 98 98 97 97 97 99 101 102 103 102 102 102 101 100 100 101
100 97 97 99 98 96 103 102 102 104 105 105 112 109 106 103 106 108
100 101 99 100 100 101 101 107 107 108 110 112 116 114 116 115 115 115
100 101 98 98 104 102 102 105 108 106 106 108 107 107 108 108 107 109
100 106 110 112 114 117 125 136 134 132 145 149 141 156 155 164 163 177
2002 2003 2004 2005 2006 2007 2008 2009 2010 2011 2012 2013 2014 2015 2016 2017 2018 2019
100 100 98 102 106 106 109 112 115 125 130 130 126 127 130 133 135 137
100 98 92 74 72 72 82 83 84 90 93 94 92 93 93 92 95 88
100 99 107 126 126 126 133 138 145 160 170 175 170 172 178 181 185 189
100 99 96 92 91 92 88 88 85 89 89 82 66 62 63 64 64 63
100 98 96 95 94 94 98 97 97 108 113 116 104 98 99 101 103 108
100 92 99 103 103 106 113 105 109 115 122 97 94 98 98 100 105 102
100 105 112 136 140 139 137 143 146 164 173 180 178 181 184 190 190 193
100 100 79 59 70 71 76 79 82 87 85 86 84 84 87 88 91 92
100 97 94 93 91 94 78 68 75 68 73 70 62 67 69 64 64 65
2002 2003 2004 2005 2006 2007 2008 2009 2010 2011 2012 2013 2014 2015 2016 2017 2018 2019
100 112 113 121 118 123 123 139 141 141 141 140 141 142 141 143 143 145
100 134 138 138 139 141 140 149 158 154 155 153 152 151 151 152 151 151
100 130 133 141 143 144 144 154 158 156 155 154 154 153 152 154 153 152
100 107 112 115 114 116 114 124 124 127 123 124 122 121 120 120 119 121
100 105 108 109 109 114 111 116 119 120 116 116 115 114 114 115 118 117
100 99 112 128 131 129 134 132 126 134 154 176 184 188 194 185 188 197
100 100 108 113 112 113 112 119 126 123 125 122 122 125 125 128 124 129
100 115 106 117 106 119 122 154 155 156 152 148 150 155 151 152 155 157
100 80 83 90 86 91 89 94 99 96 97 100 101 100 102 130 138 126
Neurological/neuromuscular testing
Physical medicine
Major surgery
Pain management injections
continued
Emergency
Evaluation and management
Major radiology
Minor radiology
Physical medicine
Major surgery
Pain management injections
Maryland
Physical medicine
Emergency
Evaluation and management
Major radiology
Minor radiology
Neurological/neuromuscular testing
Overall price index
Overall price index
Major surgery
Price indices by service group
Massachusetts
Price indices by service group
Pain management injections
Major radiology
Minor radiology
Neurological/neuromuscular testing
Overall price index
Emergency
Evaluation and management
Table SA.1 Trends in Professional Prices Paid by Service Group across 25 Study States, 2002 to 2019 (continued)
Louisiana
Price indices by service group
p
p
p
copyright © 2020 workers compensation research institute150
_____________________________________________________________________________________________W C R I M E D I C A L P R I C E I N D E X F O R W O R K E R S ' C O M P E N S A T I O N , 1 2 T H E D I T I O N ( M P I - W C )

2002 2003 2004 2005 2006 2007 2008 2009 2010 2011 2012 2013 2014 2015 2016 2017 2018 2019
100 104 108 112 113 114 120 121 123 122 123 124 125 118 117 116 119 121
100 99 99 102 102 104 114 117 116 118 115 111 111 107 108 108 109 109
100 109 114 119 121 123 133 137 139 141 140 146 149 146 146 144 145 145
100 95 98 100 102 104 104 107 110 109 112 101 100 61 61 56 56 56
100 97 99 100 102 103 105 106 109 109 108 106 106 97 97 91 91 92
100 94 110 113 117 113 128 124 119 118 124 113 122 91 91 92 93 92
100 106 112 118 117 118 124 127 131 129 129 133 135 135 133 132 139 141
100 104 100 100 102 104 106 103 101 100 100 99 99 96 94 93 95 97
100 105 112 115 101 98 92 87 86 84 87 92 90 80 76 106 92 93
2002 2003 2004 2005 2006 2007 2008 2009 2010 2011 2012 2013 2014 2015 2016 2017 2018 2019
100 104 106 107 108 110 111 117 118 115 118 120 121 121 119 121 122 123
100 103 105 106 107 108 112 124 122 112 115 117 114 117 117 123 119 120
100 104 107 110 110 112 115 118 125 143 148 153 166 166 167 173 175 176
100 103 103 105 105 103 103 109 111 101 102 98 74 73 69 58 58 58
100 103 104 106 108 111 113 117 116 107 109 112 119 118 115 109 109 109
100 100 100 99 97 99 105 109 112 116 130 118 91 91 90 94 96 96
100 103 105 106 109 112 113 119 120 120 122 126 129 128 127 128 129 131
100 109 108 109 110 109 111 117 112 89 92 95 94 96 91 96 95 95
100 110 122 131 130 135 140 139 131 101 103 101 94 91 91 117 118 121
2002 2003 2004 2005 2006 2007 2008 2009 2010 2011 2012 2013 2014 2015 2016 2017 2018 2019
100 101 104 107 107 111 114 125 129 128 130 131 138 140 144 155 157 165
100 105 110 114 116 121 124 138 149 147 153 165 192 229 245 259 262 257
100 104 110 118 126 133 139 147 152 154 159 164 170 176 183 193 197 204
100 98 100 101 97 98 92 98 96 97 96 97 101 95 100 96 94 92
100 103 105 107 109 112 117 123 122 122 121 121 122 123 128 135 139 139
100 98 110 108 109 113 120 136 152 140 142 102 125 128 132 157 114 162
100 98 99 104 105 108 113 116 122 115 123 130 136 140 145 147 151 160
100 103 106 103 98 103 104 125 126 132 130 133 139 139 135 165 172 181
100 94 97 104 111 118 122 132 139 134 137 131 145 136 132 148 146 160
Michigan
Price indices by service group
Minnesota
Price indices by service group
Major surgery
Pain management injections
Neurological/neuromuscular testing
Physical medicine
Overall price index
Emergency
Major radiology
Minor radiology
Evaluation and management
Table SA.1 Trends in Professional Prices Paid by Service Group across 25 Study States, 2002 to 2019 (continued)
Physical medicine
Major surgery
Emergency
Evaluation and management
Neurological/neuromuscular testing
Missouri
Price indices by service group
continued
Overall price index
Pain management injections
Major radiology
Minor radiology
Neurological/neuromuscular testing
Physical medicine
Major surgery
Pain management injections
Emergency
Evaluation and management
Overall price index
Major radiology
Minor radiology
p
p
p
copyright © 2020 workers compensation research institute151
_____________________________________________________________________________________________W C R I M E D I C A L P R I C E I N D E X F O R W O R K E R S ' C O M P E N S A T I O N , 1 2 T H E D I T I O N ( M P I - W C )

2002 2003 2004 2005 2006 2007 2008 2009 2010 2011 2012 2013 2014 2015 2016 2017 2018 2019
100 107 109 115 114 116 117 123 127 132 135 118 121 124 127 131 134 139
100 109 118 125 126 128 139 154 159 167 177 176 154 152 160 167 175 171
100 104 107 112 115 120 123 127 134 138 140 130 133 137 141 148 154 164
100 100 103 103 96 95 94 94 93 95 96 95 96 91 91 93 90 94
100 99 99 100 96 99 105 110 115 127 128 107 104 105 108 107 119 134
100 105 108 108 107 99 109 109 116 125 125 73 88 92 93 97 100 99
100 102 100 103 103 109 103 111 116 115 123 124 138 147 150 158 159 167
100 116 117 129 128 128 130 135 137 144 146 119 119 121 122 122 125 128
100 114 127 132 131 135 130 143 157 173 190 160 140 129 128 164 160 152
2002 2003 2004 2005 2006 2007 2008 2009 2010 2011 2012 2013 2014 2015 2016 2017 2018 2019
100 101 101 102 101 102 102 102 102 103 104 103 103 104 105 103 102 109
100 101 104 105 104 103 100 104 104 122 123 128 127 128 127 126 126 129
100 101 101 102 103 103 99 103 103 123 125 126 127 128 127 128 128 139
100 100 100 99 101 102 104 100 100 98 96 95 95 95 94 91 88 88
100 100 100 101 101 101 102 100 99 95 95 95 94 94 93 94 94 97
100 100 103 100 99 100 108 107 108 105 105 106 108 108 107 108 109 97
100 101 102 102 102 103 102 102 102 98 98 97 96 99 99 96 94 106
100 100 100 102 101 101 100 100 101 98 100 99 99 99 101 100 101 104
100 100 103 104 108 109 108 110 110 110 109 107 106 106 107 108 110 115
2002 2003 2004 2005 2006 2007 2008 2009 2010 2011 2012 2013 2014 2015 2016 2017 2018 2019
100 102 101 101 100 99 99 101 103 101 102 107 107 113 126 126 125 127
100 101 101 98 99 98 96 100 104 101 101 100 100 116 132 132 130 134
100 101 101 101 101 102 101 102 102 102 102 125 126 142 165 167 166 169
100 101 100 102 102 103 100 105 104 104 105 104 103 83 64 64 65 64
100 101 100 100 99 99 98 101 100 98 97 96 95 96 99 100 100 104
100 101 102 100 100 100 105 104 103 104 117 115 115 111 106 110 107 109
100 100 99 100 99 99 100 103 105 102 101 106 107 124 156 157 153 156
100 105 104 104 98 95 94 97 99 97 98 96 95 93 88 87 87 88
100 100 95 98 94 92 90 91 92 90 87 87 86 79 77 80 80 86
Major surgery
Pain management injections
Table SA.1 Trends in Professional Prices Paid by Service Group across 25 Study States, 2002 to 2019 (continued)
New Jersey
Price indices by service group
New York
Price indices by service group
Overall price index
Minor radiology
Physical medicine
Major surgery
Pain management injections
Emergency
Evaluation and management
Major radiology
Neurological/neuromuscular testing
Physical medicine
Major surgery
Pain management injections
continued
Emergency
Evaluation and management
Major radiology
Minor radiology
Neurological/neuromuscular testing
Overall price index
Physical medicine
Overall price index
Emergency
North Carolina
Price indices by service group
Major radiology
Minor radiology
Neurological/neuromuscular testing
Evaluation and management
p
p
p
copyright © 2020 workers compensation research institute152
_____________________________________________________________________________________________W C R I M E D I C A L P R I C E I N D E X F O R W O R K E R S ' C O M P E N S A T I O N , 1 2 T H E D I T I O N ( M P I - W C )

2002 2003 2004 2005 2006 2007 2008 2009 2010 2011 2012 2013 2014 2015 2016 2017 2018 2019
100 103 105 104 100 98 96 97 99 100 104 105 105 104 104 105 105 103
100 101 100 107 97 99 97 98 98 101 114 121 111 111 108 108 107 108
100 108 110 114 112 111 118 119 122 122 168 169 169 167 166 163 163 164
100 103 103 102 90 89 80 78 80 81 77 81 81 78 80 81 82 72
100 100 100 100 91 90 89 90 90 89 88 89 88 87 87 86 86 86
100 94 97 84 78 81 85 85 88 87 85 83 86 87 95 106 84 81
100 100 104 105 113 107 105 106 111 110 109 112 111 109 110 113 112 113
100 106 107 105 92 88 84 83 84 87 77 77 77 77 77 78 79 74
100 97 96 97 159 159 162 168 155 151 149 148 152 155 151 152 169 165
2002 2003 2004 2005 2006 2007 2008 2009 2010 2011 2012 2013 2014 2015 2016 2017 2018 2019
100 104 106 109 112 115 118 118 118 118 122 122 124 125 128 130 132 134
100 101 103 109 111 125 131 123 122 125 130 133 135 137 140 140 143 143
100 103 105 109 112 116 121 119 119 120 124 128 130 132 134 136 139 143
100 103 105 104 103 105 105 102 104 103 102 104 103 102 101 101 100 100
100 103 106 109 110 113 114 118 119 121 123 126 129 131 134 136 137 140
100 101 107 104 106 110 118 120 120 121 115 75 74 75 76 77 80 82
100 104 108 113 117 116 116 118 117 118 124 127 130 131 135 137 138 138
100 107 104 107 111 119 123 124 124 124 127 134 135 137 140 142 147 150
100 99 102 106 106 100 101 104 100 104 107 109 110 110 110 108 111 117
2002 2003 2004 2005 2006 2007 2008 2009 2010 2011 2012 2013 2014 2015 2016 2017 2018 2019
100 104 103 104 104 104 101 101 105 106 107 108 107 106 105 101 100 100
100 89 90 89 86 88 85 86 104 110 111 110 111 112 111 110 110 110
100 112 114 116 116 117 116 114 124 133 133 134 133 132 134 135 133 136
100 95 96 96 95 96 94 94 83 71 71 71 70 67 63 58 54 53
100 93 93 93 93 94 91 90 94 90 91 90 89 87 84 84 82 85
100 98 95 97 95 97 100 98 109 125 130 128 128 114 86 84 85 85
100 104 102 104 103 101 96 100 103 104 104 107 107 110 112 102 103 98
100 104 100 98 100 101 100 96 97 94 96 94 90 83 79 81 79 81
100 122 120 122 115 117 114 113 109 101 101 98 96 101 99 93 88 90
Pennsylvania
Price indices by service group
South Carolina
Price indices by service group
Pain management injections
Overall price index
Major radiology
Minor radiology
Neurological/neuromuscular testing
Physical medicine
Major surgery
Overall price index
Emergency
Evaluation and management
Emergency
Evaluation and management
Major radiology
Minor radiology
Neurological/neuromuscular testing
Major surgery
Pain management injections
Physical medicine
continued
Pain management injections
Emergency
Evaluation and management
Major radiology
Minor radiology
Overall price index
Table SA.1 Trends in Professional Prices Paid by Service Group across 25 Study States, 2002 to 2019 (continued)
Oklahoma
Price indices by service group
Neurological/neuromuscular testing
Physical medicine
Major surgery
p
p
p
copyright © 2020 workers compensation research institute153
_____________________________________________________________________________________________W C R I M E D I C A L P R I C E I N D E X F O R W O R K E R S ' C O M P E N S A T I O N , 1 2 T H E D I T I O N ( M P I - W C )

2002 2003 2004 2005 2006 2007 2008 2009 2010 2011 2012 2013 2014 2015 2016 2017 2018 2019
100 102 104 101 97 98 92 94 103 107 106 98 93 91 91 92 93 94
100 105 108 101 87 95 90 96 106 109 101 96 95 96 95 95 92 93
100 106 110 122 134 142 137 139 150 161 158 156 151 148 148 151 148 149
100 98 99 104 105 110 100 100 102 106 102 91 74 70 70 70 69 67
100 101 103 93 71 71 65 64 70 73 74 69 62 58 58 59 59 61
100 102 106 99 89 86 80 78 86 98 100 61 61 61 61 62 63 63
100 101 101 98 89 87 83 87 95 98 97 97 94 90 90 91 96 98
100 102 104 90 86 87 78 80 90 91 89 79 76 78 78 78 77 77
100 103 114 108 96 84 71 66 72 77 81 71 61 73 67 65 67 69
2002 2003 2004 2005 2006 2007 2008 2009 2010 2011 2012 2013 2014 2015 2016 2017 2018 2019
100 94 93 95 93 91 96 103 107 125 127 127 122 121 120 119 120 123
100 100 105 106 107 115 123 137 138 152 149 150 149 151 152 153 156 161
100 113 139 142 142 149 154 167 177 207 213 220 214 216 218 221 224 228
100 91 78 78 77 66 72 74 73 71 77 70 56 53 54 54 55 55
100 87 68 69 68 69 73 78 79 82 92 95 85 80 81 83 85 88
100 92 102 98 98 93 102 102 108 130 136 95 93 95 97 97 101 100
100 98 100 100 96 91 94 102 105 123 126 132 129 125 121 116 116 120
100 76 58 62 60 59 67 73 78 94 89 91 88 88 89 90 91 93
100 109 123 106 98 91 97 101 105 121 123 120 103 117 119 122 126 128
2002 2003 2004 2005 2006 2007 2008 2009 2010 2011 2012 2013 2014 2015 2016 2017 2018 2019
100 103 105 107 110 114 115 120 125 127 132 132 139 139 144 151 132 134
100 103 103 111 118 120 127 137 145 149 158 156 175 191 207 215 185 194
100 104 107 113 122 132 140 148 155 161 164 169 177 183 193 203 181 182
100 98 100 100 101 103 103 113 111 113 112 114 119 116 114 109 99 99
100 100 99 99 100 106 109 112 113 112 113 115 120 118 118 117 89 92
100 102 102 105 108 101 98 104 118 118 124 85 96 100 98 99 94 99
100 106 107 112 115 115 114 125 130 127 133 145 155 155 162 168 146 150
100 104 107 100 101 107 107 99 103 109 115 111 117 110 115 127 111 110
100 104 102 104 106 110 102 100 107 111 115 119 125 122 126 131 105 107
Major surgery
Pain management injections
Overall price index
Emergency
Evaluation and management
Major radiology
Major radiology
Minor radiology
Neurological/neuromuscular testing
Emergency
Physical medicine
Texas
Price indices by service group
Virginia
Major surgery
Pain management injections
Major surgery
Pain management injections
Overall price index
Price indices by service group
continued
Neurological/neuromuscular testing
Physical medicine
Evaluation and management
Major radiology
Minor radiology
Emergency
Overall price index
Evaluation and management
Minor radiology
Neurological/neuromuscular testing
Physical medicine
Table SA.1 Trends in Professional Prices Paid by Service Group across 25 Study States, 2002 to 2019 (continued)
Tennessee
Price indices by service group
p
p
p
copyright © 2020 workers compensation research institute154
_____________________________________________________________________________________________W C R I M E D I C A L P R I C E I N D E X F O R W O R K E R S ' C O M P E N S A T I O N , 1 2 T H E D I T I O N ( M P I - W C )

2002 2003 2004 2005 2006 2007 2008 2009 2010 2011 2012 2013 2014 2015 2016 2017 2018 2019
100 106 111 114 119 125 130 138 147 151 156 158 166 169 173 181 188 191
100 108 114 117 122 129 137 147 154 165 172 181 190 196 208 216 226 233
100 106 110 115 122 129 136 143 152 160 168 178 190 196 205 215 224 234
100 105 107 109 106 106 106 112 114 109 109 107 107 103 102 107 102 101
100 103 106 108 114 118 121 128 138 136 139 143 149 149 155 158 165 170
100 105 109 116 121 138 149 163 181 181 185 132 135 134 140 146 148 148
100 106 111 112 115 120 125 131 140 144 149 157 167 175 181 186 200 205
100 107 115 118 125 131 136 146 154 160 166 173 183 182 185 197 205 201
100 101 104 110 123 130 141 161 185 192 207 207 222 228 228 249 244 258
Overall price index
Notes:
Table SA.1 Trends in Professional Prices Paid by Service Group across 25 Study States, 2002 to 2019 (continued)
Wisconsin
Price indices by service group
Special notation: p We use the notation p to indicate that the 2019 numbers are preliminary results based on half-year price data through June 30, 2019.
Emergency
Evaluation and management
Pain management injections
Major radiology
Minor radiology
Neurological/neuromuscular testing
Physical medicine
Major surgery
Prices paid for neurological/neuromuscular testing services in most study states decreased starting in 2013. This general trend is related to a fundamental change implemented by the Centers for Medicare & Medicaid Services in the coding system for nerve conduction studies, which are the most commonly billed procedures in the neurological/neuromuscular testing service group. For more details, see "Discussion of Substantial Changes in Prices at Service-Type Level" and "Technical Appendix."
This table provides longer-term trends of prices paid for overall professional services as well as by each service group from 2002 to 2019 for the 25 states covered in the earlier editions of this study series.
AZ, MD, MO, NY, OK: The data for each of these states are not necessarily representative because each state is missing data from a larger data source that is significant in that state. The results in AZ, MD, NY, and OK are unlikely to be significantly under- or overestimated, given that these states use fee schedules to regulate the payment for professional services, and it is unlikely that the prices paid for the missing data source in each state were materially different from other data sources included in this study from the same state. For MO, to the extent that prices paid may differ for the missing data source compared with other data sources in the state, this may lead to possible under- or overestimations in the results.
p
copyright © 2020 workers compensation research institute155
_____________________________________________________________________________________________W C R I M E D I C A L P R I C E I N D E X F O R W O R K E R S ' C O M P E N S A T I O N , 1 2 T H E D I T I O N ( M P I - W C )
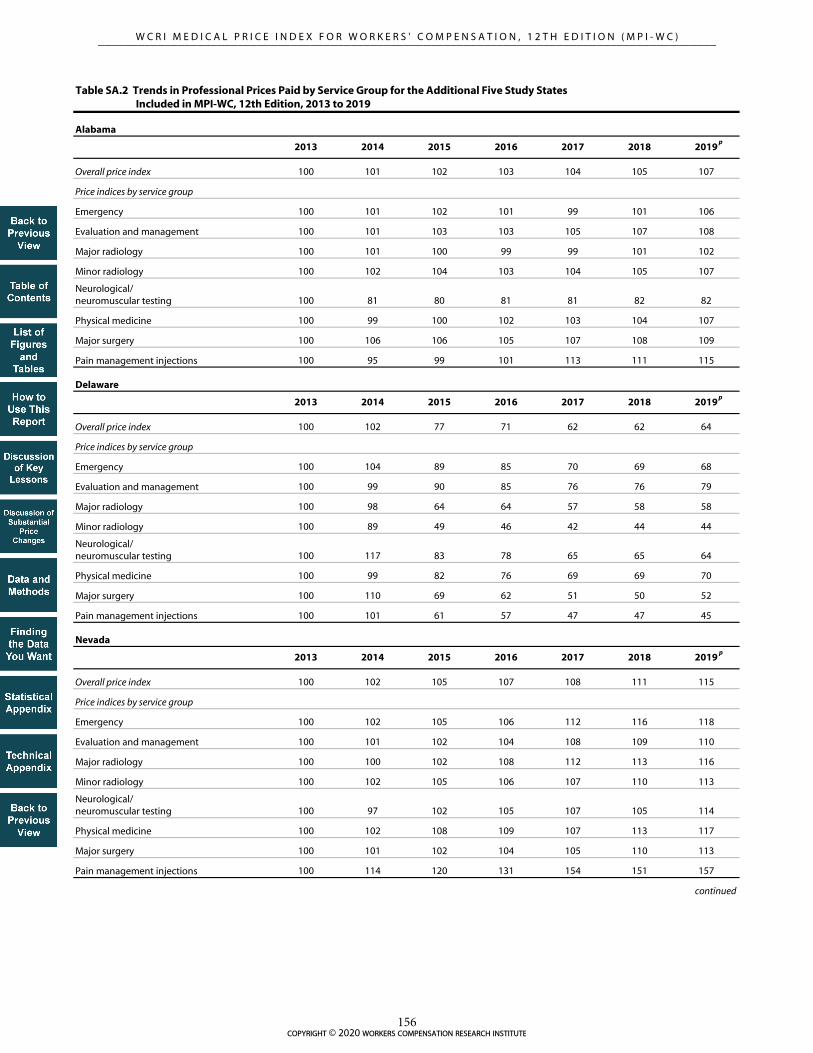
2013 2014 2015 2016 2017 2018 2019
100 101 102 103 104 105 107
100 101 102 101 99 101 106
100 101 103 103 105 107 108
100 101 100 99 99 101 102
100 102 104 103 104 105 107
100 81 80 81 81 82 82
100 99 100 102 103 104 107
100 106 106 105 107 108 109
100 95 99 101 113 111 115
2013 2014 2015 2016 2017 2018 2019
100 102 77 71 62 62 64
100 104 89 85 70 69 68
100 99 90 85 76 76 79
100 98 64 64 57 58 58
100 89 49 46 42 44 44
100 117 83 78 65 65 64
100 99 82 76 69 69 70
100 110 69 62 51 50 52
100 101 61 57 47 47 45
2013 2014 2015 2016 2017 2018 2019
100 102 105 107 108 111 115
100 102 105 106 112 116 118
100 101 102 104 108 109 110
100 100 102 108 112 113 116
100 102 105 106 107 110 113
100 97 102 105 107 105 114
100 102 108 109 107 113 117
100 101 102 104 105 110 113
100 114 120 131 154 151 157
continued
Table SA.2 Trends in Professional Prices Paid by Service Group for the Additional Five Study States Included in MPI-WC, 12th Edition, 2013 to 2019
Alabama
Price indices by service group
Delaware
Price indices by service group
Overall price index
Emergency
Evaluation and management
Nevada
Price indices by service group
Major surgery
Pain management injections
Overall price index
Emergency
Evaluation and management
Major radiology
Minor radiology
Neurological/neuromuscular testing
Physical medicine
Pain management injections
Evaluation and management
Major radiology
Minor radiology
Neurological/neuromuscular testing
Physical medicine
Major surgery
Major radiology
Minor radiology
Neurological/neuromuscular testing
Physical medicine
Major surgery
Pain management injections
Overall price index
Emergency
p
p
p
copyright © 2020 workers compensation research institute156
_____________________________________________________________________________________________W C R I M E D I C A L P R I C E I N D E X F O R W O R K E R S ' C O M P E N S A T I O N , 1 2 T H E D I T I O N ( M P I - W C )

2013 2014 2015 2016 2017 2018 2019
100 102 105 104 104 100 100
100 110 125 128 129 129 125
100 104 105 108 111 113 116
100 100 102 100 100 93 93
100 103 99 98 98 104 104
100 136 129 130 133 147 148
100 103 103 108 111 115 119
100 98 106 95 94 ― ―
100 101 89 91 90 95 93
2013 2014 2015 2016 2017 2018 2019
100 100 103 105 108 109 111
100 106 113 115 116 113 114
100 103 106 109 116 117 120
100 102 99 97 97 97 98
100 102 103 101 105 105 105
100 54 59 63 67 68 70
100 100 104 108 109 111 113
100 102 105 105 104 104 107
100 99 100 122 135 112 126
Table SA.2 Trends in Professional Prices Paid by Service Group for the Additional Five Study States Included in MPI-WC, 12th Edition, 2013 to 2019 (continued)
New Hampshire
Price indices by service group
New Mexico
Overall price index
Emergency
Physical medicine
Major surgery
Pain management injections
Overall price index
Emergency
Evaluation and management
Major radiology
Minor radiology
Neurological/neuromuscular testing
Physical medicine
Pain management injections
Price indices by service group
Evaluation and management
Major radiology
Minor radiology
Neurological/neuromuscular testing
Major surgery
Special notation: p We use the notation p to indicate that the 2019 numbers are preliminary results based on half-year price data through June 30, 2019.
Notes:
In the latest three editions we introduced five additional states: Alabama, Delaware, Nevada, New Hampshire, and New Mexico. These states were excluded from the trend analysis from 2008 to 2019 in this report because of insufficient sample sizes in earlier years. This table provides changes in prices paid for overall professional services as well as by each service group in these five states for a shorter period from 2013 to 2019, when sufficient data were available. The price series in each state was indexed to calendar year 2013 as the base and reflects the marketbasket based on the 2013–2014 medical transaction data without using the chained-index method. Note that the trend numbers for surgery in New Hampshire in 2018 and 2019 were not shown because the cell sizes were too small to support a meaningful trend analysis; this issue did not affect the interstate comparison results in any material way.
Delaware transitioned to Medicare-based fee schedules for professional services effective January 31, 2015. According to House Bill 373, the objective of the fee schedule design and subsequent annual updates was to reduce medical expenses by 33 percent by January 31, 2017, over three consecutive annual reductions. For the analysis of the impact of this policy change on prices paid, refer to the WCRI studies Evaluation of the 2015 and 2016 Fee Schedule Changes in Delaware (Fomenko, Yang, and Liu, 2017) and Evaluation of the 2015, 2016, and 2017 Fee Schedule Changes in Delaware (Fomenko and Liu, 2017).
p
p
copyright © 2020 workers compensation research institute157
_____________________________________________________________________________________________W C R I M E D I C A L P R I C E I N D E X F O R W O R K E R S ' C O M P E N S A T I O N , 1 2 T H E D I T I O N ( M P I - W C )

TECHNICAL APPENDIX
This “Technical Appendix” for the MPI-WC contains two major sections: the first section, “Study Scope,” lays
out the conceptual structure of the WCRI medical price index and describes the covered providers and services.
The second section, “Data and Methods,” discusses the representativeness of the data, creation of the price
indices, data cleaning methods, and regression analysis of aggregate price levels and growth rates.
STUDY SCOPE
The WCRI MPI-WC focuses on professional services provided by physicians, chiropractors, and physical or
occupational therapists to workers with workers’ compensation claims. Professional services typically make up
44 percent of total workers’ compensation medical expenditures in workers’ compensation in a given state
(Belton et al., 2019). The rest include payments for hospital inpatient and outpatient services, ambulatory
surgery centers, and pharmaceuticals and supplies. The price indices are computed for the most common
groups of medical professional services: emergency, evaluation and management, physical medicine, both
major and minor radiology, neurological and neuromuscular testing, major surgery, and pain management
injections. Together, these eight groups typically comprise 84 percent of total medical payments for professional
services across states (Belton et al., 2019). Table TA.1 provides a brief description of these service groups.
Detailed definitions of the specific CPT codes included under each group can be found in Table TA.2.
This study reports prices paid for each of the eight types of services provided by any nonhospital provider;
it does not break out specific provider types (such as physicians, chiropractors, and physical/occupational
therapists). Thirty-six states are included in this study: Alabama, Arizona, Arkansas, California, Colorado,
Connecticut, Delaware, Florida, Georgia, Illinois, Indiana, Iowa, Kansas, Kentucky, Louisiana, Maryland,
Massachusetts, Michigan, Minnesota, Mississippi, Missouri, Nebraska, Nevada, New Hampshire, New Jersey,
New Mexico, New York, North Carolina, Oklahoma, Oregon, Pennsylvania, South Carolina, Tennessee, Texas,
Virginia, and Wisconsin. We provide snapshots of interstate comparisons on prices paid for professional
services in the two most recent study years, 2018 and 2019.1 Also, we monitor price trends from calendar year
2008 through June 2019.2
DATA AND METHODS
THE DATA
The data in this MPI-WC study are from the medical transaction information in WCRI’s DBE database. In this
study, we pooled the medical transaction data from the study states together to establish the marketbasket and
the frequency weights on services in the marketbasket. After that, for each individual study state, we obtained
prices for each marketbasket service and constructed price indices using the marketbasket weights.
In this study, prices were collected for services rendered from 2008 through June 2019 in the study states.
We obtained the actual amount paid for each medical bill line item for each of the services included in the 1 2019 numbers are preliminary results based on half-year price data through June 30, 2019. 2 Five study states (Alabama, Delaware, Nevada, New Hampshire, and New Mexico) were excluded from the trend analysis because of insufficient sample sizes in earlier years. The “Statistical Appendix” Table SA.2 shows price changes in these five states for a shorter period from 2013 to 2019, when sufficient data were available.
copyright © 2020 workers compensation research institute158
_____________________________________________________________________________________________W C R I M E D I C A L P R I C E I N D E X F O R W O R K E R S ' C O M P E N S A T I O N , 1 2 T H E D I T I O N ( M P I - W C )

marketbasket. The DBE database included approximately 37 to 76 percent of the workers’ compensation claims
across most of the study states.3 The data are from several large insurers, self-insurers, state funds, and third-
party administrators in the 36 states. In most study states, our data are reasonably representative of the state
systems; however, in a few states the data may not be necessarily representative because they are missing data
from a larger data source that is significant in the state. These states include Arizona, Colorado, Maryland,
Missouri, New York, Oklahoma, and Oregon, as noted throughout the figures and tables. The results for
Arizona, Colorado, Maryland, New York, Oklahoma, and Oregon are unlikely to be significantly under- or
overestimated, given that these states use fee schedules to regulate the payment for professional services;
therefore, it is unlikely that the prices for the missing data source were materially different from other data
sources included in this study from the same state. For Missouri, to the extent that prices paid may differ for
the missing data source compared with other data sources in the state, this may lead to possible under- or
overestimations in the results.
CREATING THE PRICE INDICES
selecting the marketbasket
The price index is the weighted average of prices paid for a collection of the most common medical services
provided to workers with injuries. This collection is called a marketbasket. See Table TA.2 for a list of CPT
codes in the marketbasket. In selecting the marketbasket services, we used eight service groups to characterize
the professional services. Each of these groups represents a price index component. We reviewed the top
procedure codes ranked by frequency for each of these groups. We then sequentially chose codes within each
service group until the majority of expenditures in each service group were represented by the selected codes.
Table TA.4 shows that the marketbasket codes captured at least 90 percent of total expenditures for emergency
services, evaluation and management, major radiology, and physical medicine. For minor radiology,
neurological/neuromuscular testing, and pain management injections, codes in the marketbasket represented
76 to 79 percent of total expenditures. The only exception is major surgery, where the codes in the marketbasket
captured 44 percent of total expenditures. Service groups with lower representation by the marketbasket have
a broader list of codes in each of them, and adding additional codes added only a small percentage of payments
each time. Also, the analysis of additional procedures would not be supported by the observed number of
services in smaller states.
In the major surgery service group, we used two sets of codes to represent arthroscopic shoulder surgeries,
depending on the billing rules followed in the state. One set included CPT code 29826, while the other did not.
CPT 29826 is used for reporting shoulder arthroscopy; decompression of subacromial space with partial
acromioplasty, with or without coracoacromial release. The CPT 2012 book changed it from a standalone code
to an add-on code. However, not every state followed this change. About half of the study states followed this
coding change and reimbursed CPT 29826 only as a non-primary or add-on procedure. For these states, the
marketbasket consisting of primary surgical procedures did not include CPT 29826. For the remaining study
states that still reimbursed CPT 29826 as a primary surgical procedure, CPT 29826 was included in the
marketbasket. See Table TA.3 for the list of arthroscopic shoulder surgery codes with and without 29826.
We used a single marketbasket of procedure codes across all states to hold utilization constant so that we
are able to report pure price changes across states and provide more meaningful interstate comparisons.
However, the marketbasket may represent a smaller percentage of the total expenditures in some states when
3 In Colorado, New York, and Oregon, the data represented a lower percentage of the population of claims in each state because our sample is missing data from a larger data source that is significant in each state.
copyright © 2020 workers compensation research institute159
_____________________________________________________________________________________________W C R I M E D I C A L P R I C E I N D E X F O R W O R K E R S ' C O M P E N S A T I O N , 1 2 T H E D I T I O N ( M P I - W C )

state-specific codes are used. In most cases, we have been able to map these unique codes to the standard codes
in the marketbasket, though some state-specific codes do not have a standard alternative. In states where this was
common, the marketbasket may represent a smaller percentage of the total dollars spent. Also, if a state had
very different utilization patterns from what is seen overall in the marketbasket states, the results for that state
could be less representative. In this edition, we continued to use the marketbasket established in the ninth
edition of this annual study, which was based on the 2013–2014 medical transaction data from 31 study states.
We examined the representativeness of the marketbasket across the 31 study states for the 2013–2014 time
period (Table TA.5a), and across all the 36 study states for the two most recent years covered in this report
(Table TA.5b). Table TA.5a illustrates that the procedures in the marketbasket represent the majority of the
total expenditures for the 31 study states for most service groups. For emergency procedures, the marketbasket
captures 87 percent or more of total expenditures in all states except Florida.4 For evaluation and management
procedures, the marketbasket represents 91 percent or more of total expenditures in all states. For major
radiology services, the marketbasket represents 86 percent or more of total expenditures in all states. For
physical medicine services, the analyzed procedures capture 79 percent or more of total expenditures in all
states. The selected procedures account for 67 to 83 percent of total expenditures for minor radiology services
and 69 to 86 percent of total expenditures for pain management injection services across study states. The
analysis covers at least 51 percent of total expenditures for neurological/neuromuscular testing services in all
states. The only exception is major surgery—the procedures in the marketbasket represent 33 to 51 percent of
total expenditures in all study states. Lower representation by the marketbasket in this service group was mainly
due to a broader list of surgical procedures, and adding additional codes added only a small percentage of
payments each time. Table TA.5b shows that the 2013–2014 marketbasket is still representative of the utilization
patterns for the 36 study states in the 2018–2019 time period.
The data underlying this entire study series cover a long time span from 2002 to 2019. To account for
potential changes in the utilization patterns over this long period, three marketbaskets were established. Each
marketbasket is based on the medical transaction data covering a 24-month period. The most recent
marketbasket is based on data in 2013 and 2014, and is used to compute the price indices from 2014 to 2019
(see the beginning of this section for a detailed description of this marketbasket). The other two marketbaskets
were employed for the earlier years: the 2008–2009 based marketbasket was used for computing the price
indices from 2009 to 2013, and the 2005–2006 based marketbasket was used for calculating the price indices
from 2002 to 2008. Then, we used a standard chained-index method to chain the price indices across all years
based on the three marketbaskets together. In this way, we maintained continuity of the price index across
different editions of this study series and, meanwhile, adjusted for potential changes in utilization patterns over
a long period. The chained-index method we employed in this report is commonly used in creating price index
trends. For example, the trends in the CPI-M, published by the BLS, rely on essentially the same chained-index
approach.5 In this study, we used calendar years 2009 and 2013 as the two transitioning years between the three
series of price indices. The price indices in the latest series from 2014 to 2019 were chained back to the base
year 2002 of the earliest series via the transitioning years 2009 and 2013 (see the following formula):
4 For emergency services, the marketbasket captures 70 percent of total expenditures in Florida. CPT code S9088 captures nearly 30 percent of total expenditures. CPT S9088 is an add-on code to report services provided in an urgent care center (listed in addition to the code for service). The Florida workers’ compensation fee schedule rate for this code is by report. 5 For more information on concepts, statistical procedures, and estimation methods used by the BLS to compile the Chained CPI-U, refer to Introducing the Chained Consumer Price Index (Cage, Greenlees, and Jackman, 2003).
copyright © 2020 workers compensation research institute160
_____________________________________________________________________________________________W C R I M E D I C A L P R I C E I N D E X F O R W O R K E R S ' C O M P E N S A T I O N , 1 2 T H E D I T I O N ( M P I - W C )

where yrsI is the price-trend index for a year in the latest series for a state s (2014 to 2019),
yr
sP is the price in a year in the latest series based on the 2013–2014 marketbasket for a state s,
13sP is the price in 2013 based on the 2013–2014 marketbasket for a state s,
13sP is the price in 2013 based on the 2008–2009 marketbasket for a state s,
09sP is the price in 2009 based on the 2008–2009 marketbasket for a state s,
09sP is the price in 2009 based on the 2005–2006 marketbasket for a state s, and
02sP is the price in 2002 based on the 2005–2006 marketbasket for a state s.
The price indices in the later series from 2009 to 2013 were chained back to the base year 2002 of the earliest
series via the transitioning year 2009 (see the following formula):
where yrsI is the price-trend index for a year in the later series for a state s (2009 to 2013),
yr
sP is the price in a year in the later series based on the 2008–2009 marketbasket for a state s,
09sP is the price in 2009 based on the 2008–2009 marketbasket for a state s,
09sP is the price in 2009 based on the 2005–2006 marketbasket for a state s, and
02sP is the price in 2002 based on the 2005–2006 marketbasket for a state s.
In this 12th edition of this annual study series, we focus the analysis and presentations of medical price
indices on a 12-year time span from 2008 to 2019. In the “Statistical Appendix,” we also provide supplemental
information on price trends during a longer-term period from 2002 to 2019 for the 25 states covered in the
earlier editions of this study series (see Table SA.1).
computing the price index
A key feature of the price index is to isolate the changes in price from the changes in utilization, which requires
holding utilization constant across the states. To accomplish this, we created two sets of weights. The
procedure-level frequency weight for a marketbasket code was used to average procedure-level prices to the
service group level. It was calculated as the total number of services with the code divided by the total number
of services across all marketbasket codes within the service group. The frequency weight for a service group,
which was used to further aggregate service group prices to the overall state level, was computed as the
percentage of the total number of services associated with this service group divided by the total number of all
professional services.6 The frequency weights at the service group level were not restricted to services captured
6 Note that in this study we compute the price index (MPI-WC) based on frequency weights. This approach is mathematically equivalent to the one used by the BLS in the computation of the CPI. The BLS measures the CPI as the weighted average of changes in prices for goods between two time periods, where the weight for a good is an expenditure share. This is equivalent to a calculation of the expenditure on a fixed marketbasket of goods in any given time period relative to a “base” period, where the same basket of goods (defined by physical quantities or frequency weights) is
02
09
09
13
13s
s
s
s
s
yrsyr
sP
P
P
P
P
PI
02
09
09s
s
s
yrsyr
s P
P
P
PI
copyright © 2020 workers compensation research institute161
_____________________________________________________________________________________________W C R I M E D I C A L P R I C E I N D E X F O R W O R K E R S ' C O M P E N S A T I O N , 1 2 T H E D I T I O N ( M P I - W C )

by the marketbasket. Even though the marketbasket captures the majority of services for most service groups,
the major surgery marketbasket codes represent a smaller fraction of all professional services within the group.
Therefore, by computing service group weights for all professional services within each service group, the
service group weights reflect the relative frequency of services associated with each service group as it was
observed in the data.
The procedure-level frequency weight can be expressed as the following:
where vij is the procedure-level frequency weight for procedure j in service group i,
NSij is the number of services for procedure j in the marketbasket for service group i, and
Mi is the total number of procedures in the marketbasket for service group i.
The frequency weight for a service group can be expressed as the following:
where wi is the frequency weight for service group i,
ijNS ' is the number of services for procedure j observed in the data for service group i,
iM ' is the total number of procedures observed in the data for service group i, and
i = 1…8 and 8 is the total number of service groups.
Because we selected the marketbasket from the pooled dataset of 31 states, one may be concerned that the
distribution of service frequencies in relatively larger states (such as California and Texas) might dominate the
whole distribution in the pooled data, and as a result, the marketbasket may be less representative of other
states. To prevent this, we adjusted for the differences in claim shares across the states in the pooled data. To
make sure that each state has essentially the same influence, the adjustment factor was applied when selecting
the marketbasket and computing the frequency weights based on the mix of services in the state-pooled data.
Based on the established marketbasket, we computed unit prices and price indices using the following
steps:
1. Compute the price for each procedure code in the marketbasket by averaging amounts paid for
individual procedures using all occurrences with an identical procedure code.
purchased in both time periods, but where prices reflect actual prices in the two time periods. We follow the latter approach in this study.
iM
jij
ijij
NS
NSv
1
i
i
M
jij
i
M
jij
i
NS
NS
w'
1
8
1
'
1
'
'
copyright © 2020 workers compensation research institute162
_____________________________________________________________________________________________W C R I M E D I C A L P R I C E I N D E X F O R W O R K E R S ' C O M P E N S A T I O N , 1 2 T H E D I T I O N ( M P I - W C )

2. Aggregate prices across marketbasket codes to the service group level using the procedure-level frequency
weights.
3. Aggregate prices across service groups to the overall level using the service group level frequency weights.
4. For interstate comparisons, calculate price indices against the prices in the median study state at both
service group and overall state levels for each state.
5. For trends, calculate price indices in the later years against the prices in calendar year 2008.
Step 2 can be expressed as the following:
where Pis is the aggregated price for service group i in a state s,
Pijs is the estimated price for procedure j in service group i in a state s,
vij is the procedure-level frequency weight for procedure j in service group i, and
j = 1…Ai and Ai is the total number of procedures in service group i.
Step 3 can be expressed as the following:
where Ps is the aggregate price for overall professional services in a state s,
Pis is the aggregate price for service group i in a state s,
wi is the service group level frequency weight for service group i, and
i = 1…8 and 8 is the total number of service groups.
Steps 4 and 5 can be expressed as the following:
where Is is the price index for a state s,
yrsI is the price-trend index for a year yr from 2008 to 2019 and a state s,
Ps is the price (either for a service group or overall) in a state s,
P mdn is the price (either for a service group or overall) in the median study state,
yrsP is the price (either for a service group or overall) in a year yr from 2008 to 2019 in a state s,
08sP is the price (either for a service group or overall) in 2008 in a state s.
iA
jijsijis PvP
1
*
8
1
*i
isis PwP
mdns
s P
PI
08s
yrsyr
s P
PI
copyright © 2020 workers compensation research institute163
_____________________________________________________________________________________________W C R I M E D I C A L P R I C E I N D E X F O R W O R K E R S ' C O M P E N S A T I O N , 1 2 T H E D I T I O N ( M P I - W C )

DATA CLEANING
Over the years, WCRI has developed algorithms to adjust for known limitations in the data. Some of these
limitations include outlier payments for individual services, lines representing multiple services, and missing
procedure modifier information. To maintain continuity for capturing prices paid for nerve conduction studies
facing the fundamental coding change in 2013, we also implemented a visit-level approach that combines all
payments associated with nerve conduction studies under a single visit-level measure.
trimming outlier values
A small proportion of the lines in the data had unusually large or small values in medical payments. Also due
to a skewed distribution of medical payments, these extreme values contributed disproportionately to the
average. In particular, since distribution of payments is bounded at zero, the distribution is skewed to the right,
and large positive values are not offset by large negative values. To mitigate the influence of the extreme values
on the average medical payments and ensure meaningful results, we applied a price data cleaning technique to
trim the outlier values at both extremes of the distribution of the paid amounts across all services with the same
procedure code.
To remove outliers for marketbasket services associated with all service groups, except major surgery, pain
management injections, and minor and major radiology, we excluded 5 percent of the services at the lower and
upper end of the price distribution for each procedure, year, and state. The data cleaning methods for minor
and major radiology, major surgery, and pain management injections are described in the subsections
“Identifying Modified Services for Radiology,” “Identifying Modified Services for Surgery,” and “Identifying
Modified Services for Pain Management Injections.”
multiple units of service
Some physical medicine modalities and procedures may be billed in multiple units. For example, therapeutic
exercise (CPT 97110) is normally billed for every 15 minutes of treatment. Sometimes there were no accurate
indications of how many units of service were provided. Hence, it was necessary to adjust the data for these
multiple unit billings.
To identify the multiple units of service, we first looked at the units of service field provided in each data
source file. If the units of service field was populated with a value greater than one (default value), we treated
that number as the number of services for which the payments were paid in a given line. The number of services
provided by data sources, however, is not always accurate and is sometimes missing. For physical medicine
procedures (which are commonly billed in multiple units) where the units of service field was missing or equal
to one, we did a further check on multiple units of service using prevailing prices. The prevailing price, by
definition, is one or more of the most frequently paid prices for each procedure code picked from a data source
within a calendar year. Once prevailing prices for each procedure code were picked, we then checked line items
with that procedure against the respective prevailing prices. If the paid amount in a line item was a whole
multiple of any of the prevailing prices for this procedure, we assumed that line indicated that multiple of
services at that prevailing price, and the number of services was reset to the whole multiple. We performed the
units of service adjustment for each procedure code in each year for each data source.
identifying modified services for radiology
Major and minor radiology procedure codes often have modifiers to distinguish the technical component (e.g.,
using the radiology machine/devices) from the professional component (e.g., reviewing the results) of the whole
copyright © 2020 workers compensation research institute164
_____________________________________________________________________________________________W C R I M E D I C A L P R I C E I N D E X F O R W O R K E R S ' C O M P E N S A T I O N , 1 2 T H E D I T I O N ( M P I - W C )

procedure. The professional component is typically identified with the modifier code 26, and the technical
component is usually identified with the modifier code 27. For the same procedure, these components are paid
at different levelsusually 20 to 30 percent of the price for the whole procedure is paid for the professional
component, and 70 to 80 percent of the price for the whole procedure is paid for the technical component.
However, the modifier codes are missing for many services in the data. Without a modifier, a paid amount can
be for one of the following three things: the professional component, the technical component, or the whole
procedure.
In this study, we developed an algorithm to identify radiology services that are billed and paid as the
professional component separately from those billed and paid as the whole procedure. First, for each radiology
procedure in the marketbasket, we captured the services that had only a single service billed in a day. These
services accounted for more than 95 percent of all the services for each procedure, indicating that the vast
majority of the radiology services in the data are likely one of the following two types of services: (1) professional
components that were billed by nonhospital providers, or (2) whole procedures that were billed by nonhospital
providers. In the first case, the radiology services were likely done in a hospital setting and the technical
components paired with the professional components of these services were billed by hospitals. Note that
hospital-billed services are beyond the scope of this study and they are subject to different fee schedule
regulations than the services billed by nonhospital providers. In the second case, both the professional and the
technical components of the radiology services were provided and billed by nonhospital providers.
Second, we estimated a threshold of the maximum price for the professional component for each radiology
procedure code in a state and identified all the payments below this threshold as prices paid for the professional
component. Since the professional component of radiology services is commonly reimbursed at 20 to 30
percent of the fee schedule rate for the whole procedure, and to accommodate the potential deviation of the
actual prices paid from the fee schedule rates, the threshold of the maximum price for the professional
component was computed as 1.4 times the professional-component fee schedule rate for a particular procedure
in a fee schedule state.7 For non-fee schedule states, since a fee schedule rate was not available, we relied on the
price distribution observed in the services with modifier code 26 specified, and captured the amount paid at
the 90th percentile of this distribution for each procedure code. We then multiplied this amount paid by 1.4 to
arrive at the threshold of the maximum price for the professional component for a particular procedure in a
non-fee schedule state.8 Payments below the threshold of the maximum price for the professional component
were identified as prices paid for the professional component, and payments above this threshold were classified
as prices paid for the whole procedure.
To trim outliers, we excluded 5 percent of the services at the lower and upper ends of the price distribution
of the professional component for each procedure, state, and year; we applied the same data trimming method
to the price distributions for the whole procedures as well. The average price paid for the professional
component and the average price paid for the whole procedure for each marketbasket radiology procedure in
7 This method takes into consideration potential negotiated prices for the professional component above the fee schedule rate and the potential negotiated prices for the whole procedure below the fee schedule rate. Using the multiplier of 1.4 allows an up to 40 percent mark-up above the fee schedule rate to be paid for the professional component, and will not result in the whole-procedure prices being misidentified as the professional-component prices, even if the actual prices paid for the whole procedure reflected a 50 percent discount of the fee schedule rate. 8 We also applied the multiplier of 1.4 to compute the threshold of the maximum price for the professional component in non-fee schedule study states, as prices paid in non-fee schedule states often exhibit large variation. This multiplier allows the actual prices paid for the professional component to be up to 40 percent higher than the 90th percentile of the price distribution for services with the professional-component modifier specified. We also did a sensitivity analysis using an alternative multiplier of 1.2 to make sure that the classification of the whole-procedure prices is not sensitive to the choice of multiplier value. The results proved to be not sensitive to the choice between 1.2 and 1.4 for a multiplier value. We chose the multiplier of 1.4 to have consistency between the methods used for fee schedule and non-fee schedule states.
copyright © 2020 workers compensation research institute165
_____________________________________________________________________________________________W C R I M E D I C A L P R I C E I N D E X F O R W O R K E R S ' C O M P E N S A T I O N , 1 2 T H E D I T I O N ( M P I - W C )

a state was computed based on the final trimmed distributions. Note that the relative frequency of the
professional component and the whole procedure for each marketbasket code was held constant across states
and years when computing the average price at the service group level for radiology services.
identifying modified services for surgery
Surgical procedures also have a set of commonly used modifiers to identify modified or reduced payments. In
particular, in the case of multiple surgical procedures performed at the same operative session, modifiers
indicate which surgical procedure was primary. Additional or non-primary surgical procedures are commonly
reimbursed at about 50 percent of the full rate—the rate at which the same procedure is reimbursed when
performed as primary by a primary surgeon.9 Also, modifiers are used to identify payments for services of a
primary surgeon versus an assistant surgeon. Services of an assistant surgeon are typically reimbursed at about
15–25 percent of the full rate. Unfortunately, the modifiers are not always consistently and accurately reported
in the data, and they are often missing. Because of the incompleteness of the modifiers, we focus on the prices
paid for services of a primary surgeon performing the primary surgery procedure only.
In this study, we used an algorithm to isolate the payments to the primary surgeon for the primary
procedure. This algorithm has two steps: (1) capture the most expensive surgical service (i.e., primary surgery)
on a surgery day, and (2) further remove remaining reduced payments and unusually high values. The following
are more detailed discussions of each step.
First, following payment rules establishing discounted rates for secondary procedures and services of
assistant surgeons, we considered all surgical services provided on a surgery day and kept the one with the
highest payment. This approach removed reduced payments for non-primary surgical services and payments
for assistant surgeon services. After restricting distribution of actual payments to include only the highest
payment on the surgery day, some number of misclassified facility payments (or unusually high values) and
modified payments (or values around 15–25 percent or 50 percent of the full rate) still appeared in the price
distribution, motivating additional trimming. Incomplete billing information, especially missing payments for
the primary surgery for the primary surgeon services, was likely to result in discounted payments to remain in
the price distribution prior to the second step.
Second, we removed the remaining reduced payments as well as the unusually high values. The developed
trimming method relied on the estimated threshold of the maximum price for modified services for each
surgical procedure code in a state and eliminated all payments below this threshold as modified payments. Since
non-primary surgical procedures are commonly reimbursed at about 50 percent of the full rate, and services of
an assistant surgeon are typically reimbursed at about 15–25 percent of the full rate, the threshold of the
maximum price for modified services was computed as 50 percent of the full fee schedule rate for a particular
procedure in a fee schedule state. For non-fee schedule states, since a fee schedule rate was not available, we
relied on a typical price observed for the primary procedure performed by a primary surgeon, which was
computed in the earlier step, by keeping the most expensive procedure for each operative session. Hence, in
order to compute the maximum price for modified services for each surgical procedure in a state without a fee
schedule, the threshold was defined as 50 percent of the median of the paid price for primary procedures as
identified after the first step.
To address the issue of misclassified facility payments, the trimming technique restricted the final price
distribution by eliminating surgical procedures with payments above 2.5 times the full fee schedule rate for a
9 The discount rates for reduced payments are based on state fee schedule regulations.
copyright © 2020 workers compensation research institute166
_____________________________________________________________________________________________W C R I M E D I C A L P R I C E I N D E X F O R W O R K E R S ' C O M P E N S A T I O N , 1 2 T H E D I T I O N ( M P I - W C )
particular procedure for a fee schedule state.10 In non-fee schedule states, we relied on the typical price observed
for the primary procedure performed by a primary surgeon as identified in the first step. Hence, to exclude
misclassified facility payments for each surgical procedure in a state without a fee schedule, prices above 2.5
times the median price for primary procedures were dropped from the analysis. The average price paid for each
marketbasket surgical procedure in a state was computed based on the final trimmed distribution of prices paid
to the primary surgeon performing the primary procedure.
identifying modified services for pain management injections
It is also common to have multiple pain management injection procedures during a single visit, and some of
the multiple procedures can be subject to a reduced payment rule. In some cases, the multiple procedure codes
(CPT codes) billed during a visit are multiple levels of the same procedure where the single level and each
additional level are recorded under different CPT codes. Typically, billing multiple units is not allowed under
single-level procedure codes. However, billing for multiple services associated with procedure codes identified
as “each additional level” is common and requires the modifier code 59. In this case, a reduced payment rule
for multiple procedures will apply. It is also possible to have different multiple pain management injection
procedures during a single visit, which are also likely to be subject to a reduced payment rule for secondary
procedures. Similar to the methods applied to surgical procedures, to isolate full prices paid for the pain
management injection procedures in the marketbasket, we focused on the prices paid for a primary pain
management injection procedure during a visit, since it is not subject to a reduced payment rule. To isolate the
payments for the primary procedure, we considered all pain management injections administered during a
single visit and kept the one with the highest payment. To remove outliers for pain management injection
procedures, we excluded 5 percent of the primary services at the lower end of the price distribution and 10
percent at the upper end of the price distribution for each procedure, year, and state.11
applying a visit-level approach to nerve conduction studies
In 2013, CMS implemented a fundamental change in the coding for nerve conduction studies. Previous
procedure codes for sensory conduction studies, motor conduction studies with or without an F-wave test, or
H-reflex tests were deleted (i.e., CPT codes 95900, 95903, 95904, 95934, and 95936). These were replaced with
the code couplets in Table TA.6. This code change affected the most commonly billed procedures in the
neurological/neuromuscular testing service group. Under the new coding system, a single nerve conduction
study includes a sensory nerve conduction test, a motor nerve conduction test with or without an F-wave test,
or an H-reflex test. Essentially, the new coding system combines various types of nerve conduction studies (i.e.,
a sensory nerve conduction test, a motor nerve conduction test with or without an F-wave test, or an H-reflex
test) and assigns a specific code depending on the number of multiple separate nerve conduction tests
performed during a visit. To determine which code to use, only the number of the separate tests should be
added, and, when multiple sites on the same nerve are stimulated or recorded, each type of nerve conduction
study is counted only once. The old approach did not have this clear rule limiting the number of multiple nerve
10 Fee schedule rates for facility services associated with common surgeries are substantially greater than the fee schedule amounts for the relevant professional services of surgeons. In particular, in 2009, the Texas fee schedule rate for facility services related to common shoulder arthroscopy (ambulatory payment classification [APC] 42 or CPT 29826) was $6,472, while the fee schedule rate for surgeon’s services was $1,143 (see Coomer and Liu, 2010, and Coomer, 2010). In Tennessee, the facility rate associated with common shoulder arthroscopy was $4,679 versus $1,668 for the relevant professional services. 11 A larger percentage of services were removed from the upper end of the price distribution to exclude misclassified facility payments.
copyright © 2020 workers compensation research institute167
_____________________________________________________________________________________________W C R I M E D I C A L P R I C E I N D E X F O R W O R K E R S ' C O M P E N S A T I O N , 1 2 T H E D I T I O N ( M P I - W C )

conduction studies, making interpretation of the number of multiple services ambiguous. Since under the old
rule the number of multiple services included both testing multiple sites on a single nerve and multiple separate
studies, a direct crosswalk at the CPT level to the new coding system is impossible. To maintain continuity, for
nerve conduction studies, we implemented a visit-level approach that combines all payments associated with
nerve conduction studies under a single visit-level measure. The other four procedures included in the
marketbasket for neurological/neuromuscular testing services follow the standard procedure-level method for
price computation (see Table TA.2). Note that because of this visit-level approach, some of the observed
changes in the prices paid for neurological/neuromuscular testing services may also reflect changes in
utilization and/or billing patterns of nerve conduction studies.
copyright © 2020 workers compensation research institute168
_____________________________________________________________________________________________W C R I M E D I C A L P R I C E I N D E X F O R W O R K E R S ' C O M P E N S A T I O N , 1 2 T H E D I T I O N ( M P I - W C )

Service Group Definition
Professional services Professional services in this study refer to medical professional services that are billed by physicians, physical therapists/occupational therapists, and chiropractors. Medical professional services in this study include eight types of services: evaluation and management, physical medicine, minor radiology, major radiology, major surgery, pain management injections, neurological/neuromuscular testing, and emergency services. Note that medical professional services include both professional and technical components of diagnostic tests for applicable services among the eight service types. Medical professional services provided in a hospital setting but billed by physicians, physical therapists/occupational therapists, and chiropractors are included in this study. Medical professional services billed by hospitals are excluded.
Emergency The services in this group include emergency department visits for patients with various levels of severity and office services provided on an emergency basis. See Table TA.2 for a detailed description of all service codes included in this group.
Evaluation and management The services in this group are primarily new and established patient office visits. These consist of office visits that require at least two of three parts: a problem focused history, a problem focused examination, and straightforward medical decision making of various complexities. See Table TA.2 for a detailed description of all service codes included in this group.
Major radiology The services in this group mostly include magnetic resonance imaging (MRI) and computed tomography (CT) scans of various areas, including, but not limited to, spinal canal and contents, cervical, lumbar, and any joint of the upper or lower extremity. See Table TA.2 for a detailed description of all service codes included in this group.
Minor radiology The services in this group mostly include radiologic exams (X rays or ultrasounds) involving at least two views of various areas of the body, including, but not limited to, the spine, lumbosacral, shoulder, and wrist. See Table TA.2 for a detailed description of all service codes included in this group.
Neurological/neuromuscular testing
The services in this group include neurological and neuromuscular testing. They are largely made up of sensory and motor nerve conduction studies but also include range of motion tests and application of neurostimulators. These services may be billed by physicians as well as by chiropractors and physical therapists. See Table TA.2 for a detailed description of all service codes included in this group.
Physical medicine The services in this group include physical medicine procedures, modalities, therapeutic activities and manual therapy techniques involving one or more areas, electric stimulation, and work hardening/conditioning, as well as chiropractic care and manipulations. These services may be provided by physical therapists and occupational therapists as well as chiropractors. Physical medicine codes may be billed by physicians, chiropractors, or physical therapists and occupational therapists. See Table TA.2 for a detailed description of all service codes included in this group.
Major surgery The services in this group include invasive surgical procedures, as opposed to surgical treatments and pain management injections (which are also included in the surgery section of the Current Procedural Terminology [CPT] manual). The most frequent surgeries in this service group include, but are not limited to, arthroscopic surgeries of the shoulder or knee, laminectomies, laminotomies, discectomies, carpal tunnel surgeries, neuroplasty, and hernia repair. See Table TA.2 for a detailed description of all service codes included in this group.
Pain management injections The services in this group include injection procedures that are commonly used for pain management, such as epidural or steroid injections on nerve roots and muscles for lumbar, sacral, cervical, or thoracic areas. See Table TA.2 for a detailed description of all service codes included in this group.
Table TA.1 Brief Marketbasket Service Group Definitions
copyright © 2020 workers compensation research institute169
_____________________________________________________________________________________________W C R I M E D I C A L P R I C E I N D E X F O R W O R K E R S ' C O M P E N S A T I O N , 1 2 T H E D I T I O N ( M P I - W C )

Service Group
% of Services
CPT Code Description
1 47.8% 99283 Emergency department visit, moderate severity
2 32.2% 99284 Emergency department visit, high severity, urgent evaluation
3 10.5% 99285 Emergency department visit, high severity, immediate significant threat
4 8.0% 99282 Emergency department visit, low–moderate severity
5 1.6% 99281 Emergency department visit, self-limited/minor
6 42.3% 99213 Established patient office visit, low–moderate severity, 15 minutes
7 21.9% 99214 Established patient office visit, moderate–high severity, 25 minutes
8 10.7% 99203 New patient office visit, moderate severity, 30 minutes
9 7.4% 99204 New patient office visit, moderate–high severity, 45 minutes
10 7.4% 99212 Established patient office visit, self-limited/minor, 10 minutes
11 2.7% 99202 New patient office visit, low–moderate severity, 20 minutes
12 2.1% 99215 Established patient office visit, moderate–high severity, 40 minutes
13 1.2% 99243 Office consultation, new/established patient, moderate severity, 40 minutes
14 1.2% 99232 Subsequent hospital care, minor complication, 25 minutes
15 1.1% 99244 Office consultation, new/established patient, moderate–high severity, 60 minutes
16 0.9% 99205 New patient office visit, moderate–high severity, 60 minutes
17 0.7% 99211 Established patient office visit, no physician necessary, 5 minutes
18 0.5% 99245 Office consultation, new/established patient, moderate–high severity, 80 minutes
19 21.1% 73221 MRI, any joint of upper extremity, without contrast material
20 19.1% 73721 MRI, any joint of lower extremity, without contrast material
21 16.6% 72148 MRI, spinal canal and contents, lumbar, without contrast material
22 10.3% 70450 Computed tomography, head or brain, without contrast material
23 8.1% 72141 MRI, spinal canal and contents, cervical, without contrast material
24 5.3% 72125 Computed tomography, cervical spine, without contrast material
25 4.0% 73222 MRI, any joint of upper extremity, with contrast material
26 2.7% 72131 Computed tomography, lumbar spine, without contrast material
27 2.4% 72158 MRI, spinal canal and contents, without then with contrast material, lumbar
28 2.3% 74177 Computed tomography, abdomen and pelvis, with contrast material
29 2.2% 73700 Computed tomography, lower extremity, without contrast material
30 2.1% 73718 MRI, lower extremity, other than joint, without contrast material
31 2.1% 72146 MRI, spinal canal and contents, thoracic, without contrast material
32 1.8% 73218 MRI, upper extremity, other than joint, without contrast material
33 10.7% 73030 Radiologic exam, shoulder, complete, minimum of two views
34 7.7% 73140 Radiologic exam, finger(s), minimum of two views
35 7.6% 72100 Radiologic exam, spine, lumbosacral, two or three views
36 7.6% 73610 Radiologic exam, ankle, complete, minimum of three views
37 7.3% 73130 Radiologic exam, hand, minimum of three views
38 7.3% 73110 Radiologic exam, wrist, complete, minimum of three views
39 7.2% 73630 Radiologic exam, foot, complete, minimum of three views
40 5.0% 73562 Radiologic exam, knee, three views
41 3.9% 73560 Radiologic exam, knee, one or two views
42 3.5% 76942 Ultrasonic guidance for needle placement, imaging supervision and interpretation
43 3.4% 72040 Radiologic exam, spine, cervical, two or three views
44 3.3% 72110 Radiologic exam, spine, lumbosacral, minimum of four views
45 3.0% 73080 Radiologic exam, elbow, complete, minimum of three views
46 3.0% 73564 Radiologic exam, knee, complete, four or more views
47 2.9% 71020a Radiologic exam, chest, two views, frontal and lateral
48 2.1% 71010a Radiologic exam, chest, single view, frontal
49 2.1% 73590 Radiologic exam, tibia and fibula, two views
50 2.0% 73510a Radiologic exam, hip, unilateral, complete, minimum of two views
51 1.8% 73070 Radiologic exam, elbow, two views
52 1.8% 72170 Radiologic exam, pelvis, one or two views
53 1.7% 73100 Radiologic exam, wrist, two views
54 1.7% 72050 Radiologic exam, spine, cervical, minimum of four views
55 1.6% 73090 Radiologic exam, forearm, two views
56 1.5% 72070 Radiologic exam, spine, thoracic, two views
continued
Table TA.2 Marketbasket Services
Emergency
Major radiology
Minor radiology
Evaluation and management
copyright © 2020 workers compensation research institute170
_____________________________________________________________________________________________W C R I M E D I C A L P R I C E I N D E X F O R W O R K E R S ' C O M P E N S A T I O N , 1 2 T H E D I T I O N ( M P I - W C )

Service Group
% of Services
CPT Code Description
57 43.2% 95886Needle electromyography, each extremity, with related paraspinal areas, done with nerve conduction, amplitude and latency/velocity study
58–64 39.7% NCS Nerve conduction study (i.e., CPT codes 95907–95913)
65 7.1% 95851 ROM measurements and report, each extremity (excluding hand) or each trunk section
66 5.9% 95831 Muscle testing, manual (separate procedure) with report; extremity (excluding hand) or trunk
67 4.0% 95885Needle EMG, each extremity, with related paraspinal areas, when performed, done with nerve conduction, amplitude and latency/velocity study; limited (list separately in addition to code for primary procedure)
68 45.8% 97110 Therapeutic procedure, one or more areas, each 15 minutes, therapeutic exercises
69 15.7% 97140 Manual therapy techniques, one or more regions, each 15 minutes
70 7.9% 97530 Therapeutic activities, direct patient contact, each 15 minutes
71 6.2% 97014 Electrical stimulation (unattended), one or more areas72 5.0% 97112 Therapeutic procedure, one or more areas, each 15 minutes, neuromuscular re-education of movement
73 4.9% 97010 Hot/cold packs, one or more areas
74 3.2% 97035 Ultrasound, one or more areas, each 15 minutes
75 1.6% 97001b Physical therapy evaluation
76 1.2% 98940 Chiropractic manipulative treatment, spinal, one to two regions
77 1.1% 97032 Electric stimulation, one or more areas, each 15 minutes
78 1.0% 97124 Therapeutic procedure, one or more areas, each 15 minutes, massage
79 1.0% 98941 Chiropractic manipulative treatment, spinal, three to four regions
80 0.9% 97546 Work hardening/conditioning, each additional hour
81 0.9% 97012 Traction, mechanical, one or more areas
82 0.8% 97545 Work hardening/conditioning, initial two hours
83 0.8% 97113 Therapeutic procedure, one or more areas, each 15 minutes, aquatic therapy with therapeutic exercises
84 0.8% 97002b Physical therapy re-evaluation
85 0.7% 97033 Iontophoresis, one or more areas, each 15 minutes
86 0.6% 97750 Physical performance test or measurement, with written report, each 15 minutes
87–90 33.3%Shoulder
arthroscopies Arthroscopic shoulder surgery (i.e., CPT codes 29823, 29824, 29826, and 29827)
91 18.7% 29881 Arthroscopy, knee surgery, with meniscectomy, medial or lateral
92 15.4% 64721 Neuroplasty and/or transposition, median nerve at carpal tunnel
93 6.6% 29880 Arthroscopy, knee surgery, with meniscectomy, medial and lateral
94 5.6% 63030 Laminotomy with decompression of nerve root, one interspace, lumbar
95 5.3% 49505 Repair initial inguinal hernia, age five years or over, reducible
96 4.4% 29888 Arthroscopically aided ACL repair, augmentation, reconstruction
97 3.8% 23412 Repair of ruptured musculotendinous cuff, chronic
98 3.8% 22551Arthrodesis, anterior interbody, including disc space preparation, discectomy, osteophytectomy and decompression of spinal cord and/or nerve roots; cervical below C2
99 3.1% 63047Laminectomy, facetectomy and foraminotomy (unilateral or bilateral with decompression of spinal cord, cauda equina and/or nerve root[s] [e.g., spinal or lateral recess stenosis]), single vertebral segment, lumbar
100 22.9% 20552 Injection(s), single or multiple trigger point(s), one or two muscle(s)
101 21.3% 64415 Injection, anesthetic agent, brachial plexus, single
102 16.5% 64483Injection(s), anesthetic agent and/or steroid, transforaminal epidural, with imaging guidance (fluoroscopy or CT), lumbar or sacral, single level
103 13.4% 62311c
Injection, single (not via indwelling catheter), not including neurolytic substances, with or without contrast (for either localization or epidurography), of diagnostic or therapeutic substance(s) (including anesthetic, antispasmodic, opioid, steroid, other solution), epidural or subarachnoid, lumbar, sacral (caudal)
104 6.7% 64493Injections, diagnostic or therapeutic agent, paravertebral facet joint (or nerves innervating that joint) with image guidance, lumbar or sacral, single level
105 6.3% 62310c
Injection, single (not via indwelling catheter), not including neurolytic substances, with or without contrast (for either localization or epidurography), of diagnostic or therapeutic substance(s) (including anesthetic, antispasmodic, opioid, steroid, other solution), epidural or subarachnoid, cervical or thoracic
106 5.5% 64450 Injection, anesthetic agent, other peripheral nerve or branch
107 5.4% 20553 Injection(s), single or multiple trigger point(s), three or more muscle(s)
108 2.0% 62284Injection procedure for myelography and/or computed tomography, spinal (other than C1–C2 and posterior fossa)
continued
Physical medicine
Major surgery
Pain management injections
Neurological/neuromuscular testing
Table TA.2 Marketbasket Services (continued)
copyright © 2020 workers compensation research institute171
_____________________________________________________________________________________________W C R I M E D I C A L P R I C E I N D E X F O R W O R K E R S ' C O M P E N S A T I O N , 1 2 T H E D I T I O N ( M P I - W C )

Key: ACL: anterior cruciate ligament; CPT: Current Procedural Terminology; EMG: electromyography; MRI: magnetic resonance imaging; NCS: nerve conduction study; ROM: range of motion.
a In 2016, the use of CPT code 73510 in many states was replaced by the use of a new code, 73502, following a Medicare coding change. This new CPT code is for unilateral radiologic examination of hip, with pelvis when performed, and including 2–3 views. In the study states that followed this coding change starting in 2016, we crosswalked the new code 73502 to the CPT code 73510, as these two codes have similar definitions, prices, and utilization patterns. In 2018, the use of CPT code 71010 and 71020 in many states was replaced by the use of new codes 71045 and 71046, respectively, following a Medicare coding change. The new CPT code 71045 is for radiologic examination of chest with a single view, and the new CPT code 71046 is for radiologic examination of chest with two views. In the study states that followed this coding change in 2018, we crosswalked the new code 71045 to the CPT code 71010, and the new code 71046 to the CPT code 71020, based on the common billing pattern observed across states as of June 2018.
c In 2017, CPT code 62310 was replaced by a pair of new codes, 62321 (cervical epidural injections with imaging guidance) and 62320 (cervical epidural injections without imaging guidance). CPT 62311 was replaced by a pair of new codes, 62323 (lumbar epidural injections with imaging guidance) and 62322 (lumbar epidural injections without imaging guidance). Starting in 2017, we observed that the use of CPT code 62310 was mainly replaced by the use of the new code 62321, and the use of CPT code 62311 was mainly replaced by the use of the new code 62323 in most states; therefore, we crosswalked the new code 62321 to the CPT code 62310 and crosswalked the new code 62323 to the CPT code 62311.
b In 2017, Medicare issued several coding changes that are relevant to our marketbasket. CPT codes 97001 and 97002 were replaced by a set of four new codes: 97161 (physical therapy evaluation with low complexity for 10 minutes typically), 97162 (physical therapy evaluation with moderate complexity for 30 minutes typically), 97163 (physical therapy evaluation with high complexity for 45 minutes typically), and 97164 (physical therapy re-evaluation with high complexity for 20 minutes typically). Based on the common billing pattern observed across states starting in 2017, we crosswalked the new codes 97161, 97162, and 97163 to the CPT code 97001, and we crosswalked the new code 97164 to the CPT code 97002.
Table TA.2 Marketbasket Services (continued)
copyright © 2020 workers compensation research institute172
_____________________________________________________________________________________________W C R I M E D I C A L P R I C E I N D E X F O R W O R K E R S ' C O M P E N S A T I O N , 1 2 T H E D I T I O N ( M P I - W C )

Major Surgery Procedure CPT CodePercentage
Frequencya Description
1 29827 52.9% Arthroscopy, shoulder, surgical; rotator cuff repair
2 29826 29.4%Arthroscopy, shoulder, surgical; decompression of subacromial space with partial acromioplasty, with or without coracoacromial release
3 29823 12.7% Arthroscopy, shoulder, surgical; debridement extensive
4 29824 5.0% Arthroscopy, shoulder, surgical; distal claviculectomy including distal articular surface (Mumford procedure)
1 29827 63.3% Arthroscopy, shoulder, surgical; rotator cuff repair
2 29823 20.6% Arthroscopy, shoulder, surgical; debridement extensive
3 29824 16.1% Arthroscopy, shoulder, surgical; distal claviculectomy including distal articular surface (Mumford procedure)
Key: CPT: Current Procedural Terminology.
Table TA.3 Procedures for Arthroscopic Shoulder Surgery
CPT 29826 is a primary code
CPT 29826 is an add-on code
Notes: The CPT 2012 Professional Edition converted CPT 29826 from a primary code to an add-on code. Sixteen study states reimburse CPT 29826 as an add-on code as of 2019. The other study state workers' compensation fee schedules still establish the rate for CPT 29826 as a primary code.a Percentage frequency is the frequency share for each CPT code within the arthroscopic shoulder surgery procedures.
copyright © 2020 workers compensation research institute173
_____________________________________________________________________________________________W C R I M E D I C A L P R I C E I N D E X F O R W O R K E R S ' C O M P E N S A T I O N , 1 2 T H E D I T I O N ( M P I - W C )

Service GroupNumber of CPT Codes
% of Expenditures Captured by
Marketbasket Codes
% of Expenditures in
Marketbasket
% of Services Captured by
Marketbasket Codes
% of Services in Marketbasket
Emergency 5 95% 2% 89% 1%
Evaluation and management 13 95% 26% 96% 17%
Major radiology 14 90% 8% 86% 1%
Minor radiology 24 76% 4% 82% 5%
Neurological/neuromuscular testing 11 78% 2% 77% 1%
Physical medicine 19 94% 36% 95% 73%
Major surgery 13 44% 20% 41% 1%
Pain management injections 9 79% 2% 85% 1%
Table TA.4 Description of Marketbasket Contents
Key: CPT: Current Procedural Terminology.
copyright © 2020 workers compensation research institute174
_____________________________________________________________________________________________W C R I M E D I C A L P R I C E I N D E X F O R W O R K E R S ' C O M P E N S A T I O N , 1 2 T H E D I T I O N ( M P I - W C )

State EmergencyEvaluation & Management
Major Radiology
Minor Radiology
Neurological/ Neuromuscular
Testing
Physical Medicine
Major Surgery
Pain Management
Injections
AR 94% 95% 87% 80% 70% 96% 36% 78%
AZ 96% 95% 86% 79% 83% 94% 42% 83%
CA 91% 92% 92% 67% 76% 79% 42% 84%
CO 95% 97% 91% 72% 75% 93% 46% 73%
CT 95% 97% 91% 76% 72% 98% 49% 79%
FL 70% 96% 90% 73% 86% 94% 36% 78%
GA 90% 97% 90% 79% 72% 95% 43% 81%
IA 100% 95% 91% 77% 93% 98% 43% 84%
IL 93% 94% 90% 74% 71% 98% 46% 79%
IN 99% 96% 91% 78% 82% 97% 47% 74%
KS 99% 95% 92% 77% 87% 96% 44% 85%
KY 100% 96% 88% 78% 88% 98% 45% 82%
LA 98% 91% 89% 74% 57% 86% 38% 77%
MA 97% 95% 91% 71% 77% 94% 51% 82%
MD 87% 96% 90% 78% 72% 92% 37% 78%
MI 99% 96% 89% 81% 92% 97% 40% 76%
MN 100% 96% 90% 77% 87% 92% 47% 69%
MO 99% 96% 90% 73% 87% 97% 48% 86%
MS 100% 95% 89% 75% 87% 95% 50% 84%
NC 97% 94% 90% 77% 85% 94% 44% 79%
NE 94% 95% 92% 83% 87% 98% 43% 80%
NJ 98% 93% 89% 71% 51% 96% 45% 76%
NY 97% 96% 92% 71% 81% 91% 45% 82%
OK 95% 96% 94% 79% 54% 95% 48% 79%
OR 93% 98% 91% 73% 88% 94% 41% 76%
PA 96% 95% 91% 78% 73% 91% 46% 78%
SC 93% 94% 92% 78% 89% 97% 38% 81%
TN 99% 97% 90% 82% 75% 95% 47% 76%
TX 99% 96% 86% 79% 65% 85% 33% 76%
VA 91% 95% 89% 74% 69% 97% 39% 80%
WI 98% 95% 90% 77% 90% 95% 51% 76%
Table TA.5a Percentage of Expenditures Represented by the Marketbasket by State and Service Group, January 2013 to December 2014
Notes: For emergency services, the marketbasket captures 70 percent of total expenditures in Florida, a lower percentage than in other study states. CPT code S9088 captures nearly 30 percent of total expenditures. CPT S9088 is an add-on code to report services provided in an urgent care center (listed in addition to the code for service). The Florida workers’ compensation fee schedule rate for this code is by report.
Key: CPT: Current Procedural Terminology.
copyright © 2020 workers compensation research institute175
_____________________________________________________________________________________________W C R I M E D I C A L P R I C E I N D E X F O R W O R K E R S ' C O M P E N S A T I O N , 1 2 T H E D I T I O N ( M P I - W C )

State EmergencyEvaluation & Management
Major Radiology
Minor Radiology
Neurological/ Neuromuscular
Testing
Physical Medicine
Major Surgery
Pain Management
Injections
AL 97% 95% 89% 83% 65% 96% 46% 80%
AR 92% 97% 87% 86% 56% 97% 31% 75%
AZ 97% 97% 90% 81% 67% 95% 30% 78%
CA 85% 95% 91% 76% 81% 81% 35% 83%
CO 85% 98% 90% 78% 44% 93% 36% 64%
CT 86% 98% 90% 78% 47% 97% 44% 77%
DE 100% 97% 92% 79% 89% 96% 34% 65%
FL 51% 96% 91% 77% 72% 95% 32% 75%
GA 89% 97% 91% 82% 62% 96% 40% 78%
IA 100% 96% 90% 79% 88% 98% 42% 84%
IL 92% 96% 91% 77% 54% 98% 43% 79%
IN 99% 96% 91% 83% 71% 98% 41% 74%
KS 98% 96% 91% 80% 69% 97% 41% 75%
KY 99% 97% 90% 83% 68% 98% 40% 75%
LA 98% 92% 88% 77% 44% 96% 35% 69%
MA 90% 95% 91% 75% 67% 95% 46% 74%
MD 79% 98% 89% 82% 70% 96% 33% 77%
MI 99% 97% 87% 82% 78% 98% 33% 71%
MN 100% 97% 88% 80% 85% 92% 39% 72%
MO 99% 97% 90% 80% 73% 96% 44% 81%
MS 100% 97% 90% 82% 75% 97% 41% 81%
NC 98% 96% 88% 82% 69% 94% 35% 78%
NE 99% 96% 90% 85% 89% 98% 39% 78%
NH 100% 98% 93% 78% 80% 95% 42% 84%
NJ 91% 95% 90% 78% 42% 97% 45% 80%
NM 96% 94% 90% 79% 49% 91% 34% 65%
NV 97% 96% 89% 80% 47% 95% 47% 69%
NY 98% 96% 93% 72% 80% 91% 41% 78%
OK 98% 97% 93% 85% 36% 96% 46% 79%
OR 91% 98% 91% 73% 76% 93% 34% 74%
PA 90% 96% 91% 82% 69% 92% 41% 75%
SC 92% 95% 91% 82% 87% 96% 34% 77%
TN 93% 97% 89% 84% 74% 97% 38% 78%
TX 100% 96% 85% 83% 38% 81% 27% 77%
VA 80% 95% 90% 81% 71% 96% 34% 70%
WI 100% 96% 89% 82% 82% 96% 43% 79%
Table TA.5b Percentage of Expenditures Represented by the Marketbasket by State and Service Group, January 2018 to June 2019
Notes: For emergency services, the marketbasket captures lower percentages of total expenditures in Florida due to more frequent billing of CPT code S9088 (an add-on code to report services provided in an urgent care center, listed in addition to the code for service) in the state. For neurological/neuromuscular testing services, the marketbasket captures lower percentages of total expenditures in Oklahoma and Texas due to more frequent billing of CPT codes 95940 (a code for continuous intraoperative neurophysiological monitoring in operating room) and 95941 (a code for continuous intraoperative neurophysiology monitoring from outside the operating room either remote or nearby) in Oklahoma, and more frequent billing of CPT code 95951 (a code for monitoring for localization of cerebral seizure focus by cable or radio) in Texas.
Key: CPT: Current Procedural Terminology.
copyright © 2020 workers compensation research institute176
_____________________________________________________________________________________________W C R I M E D I C A L P R I C E I N D E X F O R W O R K E R S ' C O M P E N S A T I O N , 1 2 T H E D I T I O N ( M P I - W C )

CPT Code Definition
95907 Nerve conduction studies; 1–2 studies
95908 Nerve conduction studies; 3–4 studies
95909 Nerve conduction studies; 5–6 studies
95910 Nerve conduction studies; 7–8 studies
95911 Nerve conduction studies; 9–10 studies
95912 Nerve conduction studies; 11–12 studies
95913 Nerve conduction studies; 13 or more studies
Table TA.6 New CPT Codes for Nerve Conduction Studies Implemented in 2013
Key: CPT: Current Procedural Terminology.
copyright © 2020 workers compensation research institute177
_____________________________________________________________________________________________W C R I M E D I C A L P R I C E I N D E X F O R W O R K E R S ' C O M P E N S A T I O N , 1 2 T H E D I T I O N ( M P I - W C )
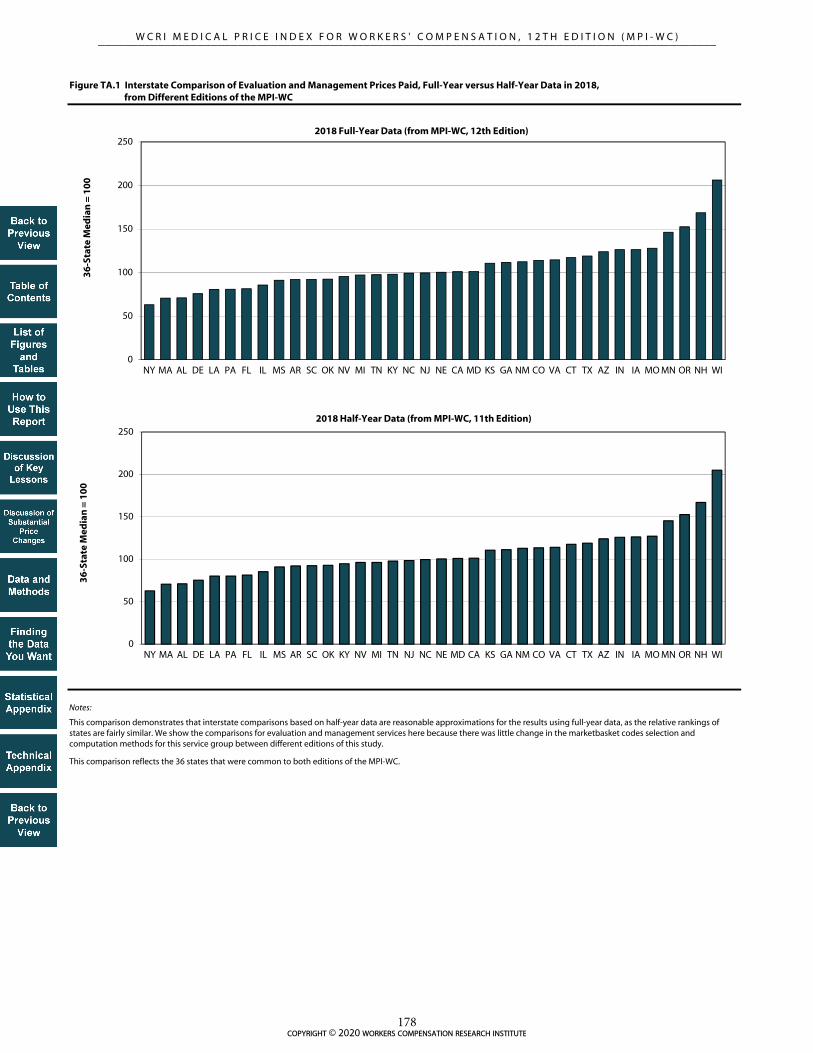
Figure TA.1 Interstate Comparison of Evaluation and Management Prices Paid, Full-Year versus Half-Year Data in 2018, from Different Editions of the MPI-WC
Notes:
This comparison demonstrates that interstate comparisons based on half-year data are reasonable approximations for the results using full-year data, as the relative rankings of states are fairly similar. We show the comparisons for evaluation and management services here because there was little change in the marketbasket codes selection and computation methods for this service group between different editions of this study.
This comparison reflects the 36 states that were common to both editions of the MPI-WC.
0
50
100
150
200
250
NY MA AL DE LA PA FL IL MS AR SC OK NV MI TN KY NC NJ NE CA MD KS GA NM CO VA CT TX AZ IN IA MO MN OR NH WI
36
-Sta
te M
edia
n =
10
0
2018 Full-Year Data (from MPI-WC, 12th Edition)
0
50
100
150
200
250
NY MA AL DE LA PA FL IL MS AR SC OK KY NV MI TN NJ NC NE MD CA KS GA NM CO VA CT TX AZ IN IA MO MN OR NH WI
36
-Sta
te M
edia
n =
10
0
2018 Half-Year Data (from MPI-WC, 11th Edition)
copyright © 2020 workers compensation research institute178
_____________________________________________________________________________________________W C R I M E D I C A L P R I C E I N D E X F O R W O R K E R S ' C O M P E N S A T I O N , 1 2 T H E D I T I O N ( M P I - W C )

REFERENCES
American Medical Association (AMA). 2012. Current procedural terminology 2012. Chicago, IL: AMA Press.
______. 2013. Current procedural terminology 2013. Chicago, IL: AMA Press.
______. 2014. Current procedural terminology 2014. Chicago, IL: AMA Press.
______. 2015. Current procedural terminology 2015. Chicago, IL: AMA Press.
______. 2016. Current procedural terminology 2016. Chicago, IL: AMA Press.
______. 2017. Current procedural terminology 2017. Chicago, IL: AMA Press.
______. 2018. Current procedural terminology 2018. Chicago, IL: AMA Press.
Belton, S., R. Dolinschi, W. Monnin-Browder, E. Radeva, K. Rothkin, B. Savych, C. Telles, H. Wellman, and
R. Yang. 2019. CompScope™ medical benchmarks, 20th edition. 16 vols. Cambridge, MA: Workers
Compensation Research Institute.
Borba, P., and C. Yee. 2012. Impact of treatment guidelines in Texas. Cambridge, MA: Workers Compensation
Research Institute.
Cage, R., J. Greenlees, and P. Jackman. 2003. Introducing the chained consumer price index. Washington, DC:
U.S. Bureau of Labor Statistics.
Centers for Medicare & Medicaid Services. 2016. Physician Fee Schedule - PFS Relative Value Files,
RVU16B.zip, CY2016 GPCIs. Retrieved from https://www.cms.gov/Medicare/Medicare-Fee-for-
Service-Payment/PhysicianFeeSched/PFS-Relative-Value-Files-Items/RVU16B.html (accessed May
2017).
______. 2017. Physician Fee Schedule - PFS Relative Value Files, RVU17B.zip, CY2017 GPCIs. Retrieved
from https://www.cms.gov/Medicare/Medicare-Fee-for-Service-Payment/PhysicianFeeSched/PFS-
Relative-Value-Files-Items/RVU17B.html (accessed January 30, 2018).
______. 2018. Physician Fee Schedule - PFS Relative Value Files, RVU18B.zip, CY2018 GPCIs. Retrieved
from https://www.cms.gov/Medicare/Medicare-Fee-for-Service-Payment/PhysicianFeeSched/PFS-
Relative-Value-Files-Items/RVU18B.html (accessed March 2019).
______. 2019. Physician Fee Schedule - PFS Relative Value Files, RVU19B.zip, CY2019 GPCIs. Retrieved
from https://www.cms.gov/Medicare/Medicare-Fee-for-Service-Payment/PhysicianFeeSched/PFS-
Relative-Value-Files-Items/RVU19B.html (accessed May 2019).
Coomer, N. 2010. Fee schedules for hospitals and ambulatory surgical centers: A guide for policymakers.
Cambridge, MA: Workers Compensation Research Institute.
Coomer, N., and T. Liu. 2010. Benchmarks for designing workers’ compensation medical fee schedules: 2009.
Cambridge, MA: Workers Compensation Research Institute.
Dolinschi, R., W. Monnin-Browder, E. Radeva, K. Rothkin, B. Savych, C. Telles, and R. Yang. 2020.
CompScope™ benchmarks, 20th edition. 15 vols. Cambridge, MA: Workers Compensation Research
Institute.
Eccleston, S. 2006. How does the Massachusetts medical fee schedule compare to prices actually paid in workers’
compensation? Cambridge, MA: Workers Compensation Research Institute.
Fomenko, O. 2013. Comparing workers’ compensation and group health hospital outpatient payments.
Cambridge, MA: Workers Compensation Research Institute.
———. 2015. WCRI FlashReport: Evaluation of the 2015 professional fee schedule update for Florida.
Cambridge, MA: Workers Compensation Research Institute.
copyright © 2020 workers compensation research institute179
_____________________________________________________________________________________________W C R I M E D I C A L P R I C E I N D E X F O R W O R K E R S ' C O M P E N S A T I O N , 1 2 T H E D I T I O N ( M P I - W C )

______. 2016. Evaluation of the 2015 fee schedule rates in Illinois. Cambridge, MA: Workers Compensation
Research Institute.
Fomenko, O., and T. Liu. 2012. Designing workers’ compensation medical fee schedules. Cambridge, MA:
Workers Compensation Research Institute.
______. 2016. Designing workers’ compensation medical fee schedules, 2016. Cambridge, MA: Workers
Compensation Research Institute.
______. 2017. Evaluation of the 2015, 2016, and 2017 fee schedule changes in Delaware. Cambridge, MA:
Workers Compensation Research Institute.
______. 2019. Designing workers’ compensation medical fee schedules, 2019. Cambridge, MA: Workers
Compensation Research Institute.
Fomenko, O., and R. Victor. 2013. A new benchmark for workers’ compensation fee schedules: Prices paid by
commercial insurers? Cambridge, MA: Workers Compensation Research Institute.
Fomenko, O., and R. Yang. 2016. Hospital outpatient payment index: Interstate variations and policy analysis,
5th edition. Cambridge, MA: Workers Compensation Research Institute.
______. 2017. Hospital outpatient payment index: Interstate variations and policy analysis, 6th edition.
Cambridge, MA: Workers Compensation Research Institute.
______. 2018. Hospital outpatient payment index: Interstate variations and policy analysis, 7th edition.
Cambridge, MA: Workers Compensation Research Institute.
______. 2019. Hospital outpatient payment index: Interstate variations and policy analysis, 8th edition.
Cambridge, MA: Workers Compensation Research Institute.
______. 2020. Hospital outpatient payment index: Interstate variations and policy analysis, 9th edition.
Cambridge, MA: Workers Compensation Research Institute.
Fomenko, O., R. Yang, and T. Liu. 2017. Evaluation of the 2015 and 2016 fee schedule changes in Delaware.
Cambridge, MA: Workers Compensation Research Institute.
National Council on Compensation Insurance, Inc. (NCCI). 2014. Annual statistical bulletin. Boca Raton, FL.
———. 2015. Annual statistical bulletin. Boca Raton, FL.
———. 2016. Annual statistical bulletin. Boca Raton, FL.
———. 2017. Annual statistical bulletin. Boca Raton, FL.
———. 2018. Annual statistical bulletin. Boca Raton, FL.
———. 2019. Annual statistical bulletin. Boca Raton, FL.
Neumark, D., and B. Savych. 2017. The effects of provider choice policies on workers’ compensation costs.
Cambridge, MA: Workers Compensation Research Institute.
Radeva, E. 2014a. CompScope™ medical benchmarks for Illinois, 15th edition. Cambridge, MA: Workers
Compensation Research Institute.
______. 2014b. CompScope™ medical benchmarks for Massachusetts, 15th edition. Cambridge, MA: Workers
Compensation Research Institute.
______. 2015. CompScope™ medical benchmarks for Massachusetts, 16th edition. Cambridge, MA: Workers
Compensation Research Institute.
Rothkin, K. and R. Tanabe. 2018. Workers’ compensation medical cost containment: A national inventory, 2018.
Cambridge, MA: Workers Compensation Research Institute.
Savych, B. 2016a. Comparing payments to ambulatory surgery centers and hospital outpatient departments, 2nd
edition. Cambridge, MA: Workers Compensation Research Institute.
———. 2016b. Payments to ambulatory surgery centers, 2nd edition. Cambridge, MA: Workers Compensation
Research Institute.
copyright © 2020 workers compensation research institute180
_____________________________________________________________________________________________W C R I M E D I C A L P R I C E I N D E X F O R W O R K E R S ' C O M P E N S A T I O N , 1 2 T H E D I T I O N ( M P I - W C )

Savych, B., and O. Fomenko. 2019. Workers’ compensation medical prices and outcomes of injured workers.
Cambridge, MA: Workers Compensation Research Institute.
Savych, B., and R. Yang. 2018. WCRI FlashReport: Comparing payments to ambulatory surgery centers and
hospital outpatient departments. Cambridge, MA: Workers Compensation Research Institute.
Tanabe, R. 2015. Workers’ compensation medical cost containment: A national inventory, 2015. Cambridge,
MA: Workers Compensation Research Institute.
Telles, C. 2014. CompScope™ medical benchmarks for Texas, 15th edition. Cambridge, MA: Workers
Compensation Research Institute.
Thumula, V., D. Wang, and T. Liu. 2019. Interstate variations in dispensing of opioids, 5th edition. Cambridge,
MA: Workers Compensation Research Institute.
U.S. Bureau of Labor Statistics. 2019. U.S. Bureau of Labor Statistics, not seasonally adjusted. Consumer Price
Index - Urban Wage Earners and Clerical Workers, Series ID CWUR0000SEMC. Producer Price
Index - Commodity for Physician Care, Series ID WPU511101. Retrieved from
http://www.bls.gov/cpi and http://www.bls.gov/ppi (accessed April 2020).
Victor, R., P. Barth, and D. Neumark. 2005. The impact of provider choice on workers’ compensation costs and
outcomes. Cambridge, MA: Workers Compensation Research Institute.
Wang, D. 2017. Longer-term dispensing of opioids, 4th edition. Cambridge, MA: Workers Compensation
Research Institute.
Wang, D., V. Thumula, and T. Liu. 2016. Physician dispensing of higher-priced new drug strengths and
formulation. Cambridge, MA: Workers Compensation Research Institute.
______. 2017. A multistate perspective on physician dispensing, 2011–2014. Cambridge, MA: Workers
Compensation Research Institute.
Wang, D., and X. Zhao. 2003. WCRI medical price index for workers’ compensation. Cambridge, MA: Workers
Compensation Research Institute.
Yang, R. 2011. WCRI medical price index for workers’ compensation, third edition (MPI-WC). Cambridge, MA:
Workers Compensation Research Institute.
Yang, R., and O. Fomenko. 2012. WCRI medical price index for workers’ compensation, fourth edition (MPI-
WC). Cambridge, MA: Workers Compensation Research Institute.
______. 2013. WCRI medical price index for workers’ compensation, fifth edition (MPI-WC). Cambridge, MA:
Workers Compensation Research Institute.
______. 2014a. The effect of reducing the Illinois fee schedule. Cambridge, MA: Workers Compensation
Research Institute.
______. 2014b. WCRI medical price index for workers’ compensation, sixth edition (MPI-WC). Cambridge, MA:
Workers Compensation Research Institute.
______. 2015. WCRI medical price index for workers’ compensation, seventh edition (MPI-WC). Cambridge,
MA: Workers Compensation Research Institute.
______. 2016. WCRI medical price index for workers’ compensation, eighth edition (MPI-WC). Cambridge,
MA: Workers Compensation Research Institute.
______. 2017. WCRI medical price index for workers’ compensation, ninth edition (MPI-WC). Cambridge, MA:
Workers Compensation Research Institute.
______. 2018. WCRI medical price index for workers’ compensation, 10th edition (MPI-WC). Cambridge, MA:
Workers Compensation Research Institute.
______. 2019. WCRI medical price index for workers’ compensation, 11th edition (MPI-WC). Cambridge, MA:
Workers Compensation Research Institute.
copyright © 2020 workers compensation research institute181
_____________________________________________________________________________________________W C R I M E D I C A L P R I C E I N D E X F O R W O R K E R S ' C O M P E N S A T I O N , 1 2 T H E D I T I O N ( M P I - W C )

Yee, C., S. Pizer, and O. Fomenko. 2015. Why surgery rates vary. Cambridge, MA: Workers Compensation
Research Institute.
OTHER WCRI PUBLICATIONS
For a list of WCRI’s other publications, please click here.
copyright © 2020 workers compensation research institute182
_____________________________________________________________________________________________W C R I M E D I C A L P R I C E I N D E X F O R W O R K E R S ' C O M P E N S A T I O N , 1 2 T H E D I T I O N ( M P I - W C )