Changes in prices paid for telecommunications services …€“ACCC, changes in prices paid...
48
ACCC telecommunications reports 2004–05 | REPORT 2 67 Changes in prices paid for telecommunications services in Australia, 2004–05 Report to the Minister for Communications, Information Technology and the Arts April 2006
-
Upload
nguyendiep -
Category
Documents
-
view
216 -
download
2
Transcript of Changes in prices paid for telecommunications services …€“ACCC, changes in prices paid...

ACCC telecommunications reports 2004–05 | REPORT 2 67
Changes in prices paid for telecommunications services in Australia, 2004–05
Report to the Minister for Communications, Information Technology and the Arts
April 2006
Telco reports 1&2 2004-05_2006.iPart2:67 Part2:67Telco reports 1&2 2004-05_2006.iPart2:67 Part2:67 26/04/2006 4:19:19 PM26/04/2006 4:19:19 PM

Telco reports 1&2 2004-05_2006.iPart2:68 Part2:68Telco reports 1&2 2004-05_2006.iPart2:68 Part2:68 26/04/2006 3:12:07 PM26/04/2006 3:12:07 PM

ACCC telecommunications reports 2004–05 | REPORT 2 69
Contents
1 Summary .......................................................................................................71
1.1 Main price changes ........................................................................................... 711.1.1 PSTN services prices .......................................................................................................................71
1.1.2 Mobile services prices.....................................................................................................................72
1.2 Structure of the report ...................................................................................... 73
2 Methodology for determining price change ...................................................75
2.1 The index model ............................................................................................... 752.1.1 The PSTN services index..................................................................................................................75
2.1.2 The mobile telephony services index ...............................................................................................76
2.1.3 The internet services index .............................................................................................................77
2.2 Other methodology issues ................................................................................. 772.2.1 Real prices .....................................................................................................................................77
2.2.2 The goods and services tax (GST)....................................................................................................78
2.2.3 Quality of service ...........................................................................................................................78
2.2.4 Percentage changes and points contribution ..................................................................................78
2.2.5 Record keeping rules for the Division 12 report ..............................................................................79
3 Telecommunications services index .................................................................80
3.1 Main changes ................................................................................................... 80
4 PSTN services index ........................................................................................82
4.1 Main changes ................................................................................................... 82
4.2 PSTN residential index ....................................................................................... 854.2.1 Main changes ................................................................................................................................85
4.2.2 Description and analysis of price changes by PSTN service for residential consumers........................86
4.3 PSTN business index .......................................................................................... 894.3.1 Defi nition of business type .............................................................................................................89
4.3.2 Main changes ................................................................................................................................90
4.4 Small business index ......................................................................................... 934.4.1 Main changes ................................................................................................................................93
4.4.2 Description and analysis of price changes by PSTN service for small business consumers .................94
4.5 Other business index ......................................................................................... 974.5.1 Main changes ................................................................................................................................97
4.5.2 Description and analysis of price changes by PSTN service for other business consumers .................97
5 Mobile telephony services index ...................................................................100
5.1 Main changes ................................................................................................. 100
Telco reports 1&2 2004-05_2006.iPart2:69 Part2:69Telco reports 1&2 2004-05_2006.iPart2:69 Part2:69 26/04/2006 3:12:07 PM26/04/2006 3:12:07 PM
ACCC telecommunications reports 2004–05 | REPORT 270
5.2 GSM services ................................................................................................... 1025.2.1 Post-paid prices ...........................................................................................................................102
5.2.2 Prepaid prices ..............................................................................................................................103
5.3 CDMA services ................................................................................................ 1045.3.1 Post-paid prices ...........................................................................................................................105
5.3.2 Prepaid prices ..............................................................................................................................105
5.4 Points contribution.......................................................................................... 106
5.5 Analysis of price changes for mobile services in 2004–05 ...................................107
6 Tables ..........................................................................................................109
Telco reports 1&2 2004-05_2006.iPart2:70 Part2:70Telco reports 1&2 2004-05_2006.iPart2:70 Part2:70 26/04/2006 3:12:07 PM26/04/2006 3:12:07 PM

ACCC telecommunications reports 2004–05 | REPORT 2 71
1 Summary
Division 12 of Part XIB of the Trade Practices Act 1974 (the Act) requires that the Australian Competition and Consumer Commission (ACCC) report each year to the Minister for Communications, Information Technology and the Arts on prices paid by Australian consumers for telecommunications services. This report (also known as the Division 12 report) meets this obligation for the 2004–05 fi nancial year.
The Division 12 report monitors prices consumers pay for PSTN (public switched telephone network) services and mobile telephony services. For PSTN services, it analyses prices paid by residential and business consumers for basic access service (or line rental) and for local, national long-distance, international and fi xed-to-mobile calls. For mobile telephony services, this report covers prices paid by consumers for services on the global system for mobiles (GSM) and code division multiple access (CDMA) networks.
To determine price changes, the ACCC uses a price index methodology and data and other information provided by Telstra, SingTel Optus (Optus), AAPT, Primus, Vodafone, Hutchison Telecommunications (Orange) and Virgin Mobile. The methodology used to determine price changes can be found in section 2.
The ACCC has also begun collecting information from selected internet service providers1 to construct price indexes for dial-up and broadband internet services to include in future Division 12 reports.
1.1 Main price changes
In 2004–05 prices paid by consumers for telecommunications services fell by 6.6 per cent.
This decline was almost entirely due to a decrease in the prices paid by consumers for mobile telephony services which fell by 13 per cent. Prices for PSTN (fi xed line) services fell by 1.2 per cent in 2004–05.
1.1.1 PSTN services prices
Table 1.1 below summarises the price changes for each PSTN service monitored in the report by residential and business consumer groups for 2004–05 and since 1997–98.
On average, the price of PSTN services fell by 1.2 per cent in 2004–05. Prices for residential consumers fell by 0.3 per cent, while prices paid by business consumers fell by 2.9 per cent.
1 Telstra, SingTel Optus, AAPT, Primus, MCI Worldcom, iiNet.
Telco reports 1&2 2004-05_2006.iPart2:71 Part2:71Telco reports 1&2 2004-05_2006.iPart2:71 Part2:71 26/04/2006 3:12:07 PM26/04/2006 3:12:07 PM

ACCC telecommunications reports 2004–05 | REPORT 272
Results outlined in table 1.1 show that price declines for call services for business consumers continue to outstrip price falls for residential consumers while price increases for basic access services for business consumers have been about half of those experienced by residential consumers since 1997–98. The process which carriers use to change the price structure of PSTN services (increasing the fi xed price of basic access while decreasing the price of per-call services) is called ‘rebalancing’. This process has been evident in the results of the Division 12 report since 1999–2000.
Table 1.1 Percentage changes in the PSTN price indexes by service and consumer group
Residential Business Overall
2004
–05
sinc
e 19
97–9
8
2004
–05
sinc
e 19
97–9
8
2004
–05
sin
ce
1997
–98
basic access 7.5 98.3 1.0 48.0 5.2 79.4
local calls –11.1 –44.3 –0.7 –43.2 –7.7 –43.9
national long-distance –1.7 –27.1 –5.7 –45.5 –3.1 –34.3
international –3.6 –62.7 –7.6 –73.2 –4.4 –65.5
fi xed-to-mobile –1.8 –14.8 –6.5 –38.1 –3.8 –27.3
Overall –0.3 –11.6 –2.9 –30.1 –1.2 –18.9
Source: data supplied by Telstra, AAPT, Primus, SingTel Optus (except 2001–02 data, which was excluded from the index) and (until 2000–01) One.Tel.
The ACCC notes that not all business consumers have benefi ted equally from price declines in 2004–05 or since 1997–98. Small business consumers have, on average, fared much worse than large business consumers with price change patterns more closely mirroring those of residential consumers with smaller call volumes and fewer lines. In fact, the price index for small business consumers in 2004–05 has increased by 15.8 per cent. Reasons for this increase are discussed in section 4.3.1 of this report.
1.1.2 Mobile services prices
Table 1.2 sets out the changes in the prices paid for mobile services by consumers in 2004–05.
The average price paid by consumers for mobile telephony services fell by 13 per cent in 2004–05. Prices for GSM services fell by 12.9 per cent and prices for CDMA services declined by 13.8 per cent.
The fall in prices was mainly due to the introduction of capped or ‘bucket’2 plans by carriers which resulted in large decreases in prices paid by consumers for post-paid services. Specifi cally, prices for GSM post-paid services fell by 15.3 per cent and prices for post-paid CDMA services fell by 14.2 per cent.
2 ‘Bucket’ plans in mobile services refer to deeply discounted packages of services for a fi xed price or a maximum price. For example, a bucket plan may involve a carrier offering $500 worth of standard calls charged at rates of 60 cents per minute, plus text, picture messaging and data browsing, all for a fi xed price of $79 per month.
Telco reports 1&2 2004-05_2006.iPart2:72 Part2:72Telco reports 1&2 2004-05_2006.iPart2:72 Part2:72 26/04/2006 3:12:07 PM26/04/2006 3:12:07 PM

ACCC telecommunications reports 2004–05 | REPORT 2 73
Prices for consumers of prepaid GSM services declined by 5.6 per cent and prepaid CDMA prices fell by 12.4 per cent. The larger fall for CDMA consumers was due in part to Orange signifi cantly cutting the price of its short messaging service (SMS) and per minute call charges for prepaid services customers.
Table 1.2 Percentage change in the mobile services index by user group, 2004–05
Very low Low Average High Very high All
GSM –12.9
post-paid –1.3 –3.2 –3.2 –17.8 –21.3 –15.3
prepaid –3.2 –6.0 –8.0 –9.4 –0.3 –5.6
CDMA –13.8
post-paid –2.2 –9.2 –7.3 –10.8 –23.5 –14.2
prepaid –14.9 –14.4 –12.3 –9.3 –11.0 –12.4
All mobiles –13.0
Source: data obtained from Telstra, SingTel Optus, Vodafone, Hutchison Telecommunications, AAPT, Virgin Mobile, published plan and service information.
In 2004–05, 51 per cent of the 16.2 million mobile services in operation were prepaid services. While this segment of the market grew signifi cantly in previous years (with the ACCC noting larger price falls for prepaid services in those years refl ecting intense competition for consumers in that market), in 2004–05 growth slowed to 7.7 per cent (compared to 28 per cent in 2003–04 and 256 per cent in 1999–2000). As the GSM and CDMA markets approach saturation, carriers appear again to be shifting focus to increasing usage among existing consumers. This has been particularly noticeable in the past reporting period with the introduction of so-called ‘bucket’ or capped plans which are predominantly offered on a post-paid or subscriber basis to consumers. Consequently there were larger price falls in this market in 2004–05.
1.2 Structure of the report
This report describes changes in prices paid by consumers for telecommunications services in Australia for the twelve months to 30 June 2005.
It also provides information on price changes in previous years and includes a complete series of price index numbers and points contributions for the telecommunications services in statistical tables at the end of the report.
Figure 1.1 below shows the structure of the report and telecommunications index used to derive the price change estimates. Aggregated results for the telecommunications market as a whole are presented fi rst in section 3 while section 4 describes changes in PSTN prices and section 5 presents changes in mobile services in more detail.
Telco reports 1&2 2004-05_2006.iPart2:73 Part2:73Telco reports 1&2 2004-05_2006.iPart2:73 Part2:73 26/04/2006 3:12:07 PM26/04/2006 3:12:07 PM

ACCC telecommunications reports 2004–05 | REPORT 274
As noted earlier, the ACCC has started to collect revenue, usage and pricing information from selected carriers for internet services and proposes to introduce these services into the telecommunications index in the near future.
Figure 1.1 Structure of the report and telecommunications index
Section 3 Telecommunications services index
Section 4 PSTN services index
Section 4.2 PSTN
residential
Section 4.3 PSTN
business
Section 5Mobile services index
PROPOSED Internet services index
Section 5.2 GSM
mobile
Section 5.3 CDMA mobile
Dial-up services
Broadband
services
Section 4.3.1 small
business
Section 4.3.2 other
business
Telco reports 1&2 2004-05_2006.iPart2:74 Part2:74Telco reports 1&2 2004-05_2006.iPart2:74 Part2:74 26/04/2006 3:12:07 PM26/04/2006 3:12:07 PM

ACCC telecommunications reports 2004–05 | REPORT 2 75
2 Methodology for determining price change
2.1 The index model
Since 1999–2000 the Division 12 report has used a basket approach to measure the prices consumers pay for telecommunications services. Under this approach, developed by the Communications Research Unit (CRU) of the Department of Communications, Information Technology and the Arts, index numbers are used to analyse movements in prices paid for a ‘basket’ of telecommunications services. An index number measures the price of the services in one period relative to another. They refl ect price changes over time, but not price levels. The advantages and disadvantages of the index approach and the method of constructing indexes are detailed in the Division 12 report for 1999–2000.3
The price indexes are constructed using revenue, quantity and pricing plan data collected by the ACCC from several telecommunications service providers. They are then aggregated to derive a series of overall indexes.
The ACCC uses a different method to derive the PSTN services index than for the mobile telephony services index. Both methods are outlined below.
2.1.1 The PSTN services index
As the Act requires that the ACCC report on prices paid for telecommunications services, the ACCC monitors retail prices, after deducting discounts and concessions to refl ect prices actually paid by consumers.
Data on actual prices paid by consumers is not readily available and would require regular and expensive sampling. Tariff documents also may not include information on discounts and short-term specials, which carriers increasingly offer, and many discount plans become effective only after a threshold value or number of calls has been made. It is therefore extremely diffi cult to establish retrospectively the actual prices paid by consumers for particular services and the degree to which customers may have taken advantage of discounts.4
To try to capture the effects of discounts and specials on prices paid, carrier revenue and usage data have been used to derive a yield. The yield provides a proxy for price in the form of an estimate of the average price paid for a unit of a telecommunications service.
3 A full description of the construction of the index and the underlying theory is contained in appendix 1 of Changes in the prices paid for telecommunications services in Australia 1999–2000, ACCC, April 2001.
4 The diffi culty in obtaining data on prices paid meant that the standard or list prices were used to construct the weighted averages for each service reported in the fi rst two Division 12 reports, but at a cost. Standard prices are the maximum consumers pay—they exclude all discounts and short-term specials.
Telco reports 1&2 2004-05_2006.iPart2:75 Part2:75Telco reports 1&2 2004-05_2006.iPart2:75 Part2:75 26/04/2006 3:12:08 PM26/04/2006 3:12:08 PM

ACCC telecommunications reports 2004–05 | REPORT 276
Participating carriers provided separate revenue and usage estimates for fi ve basic PSTN services—basic access, local calls, national long-distance, international long-distance and fi xed-to-mobile services. For each of these, carriers were asked to further disaggregate the data into usage by residential, small business and other business consumers.
Using this data, a yield has been estimated for every PSTN service by consumer group for each year of the study (1997–98 to 2004–05). These yields were then converted into real terms5 and, as indicated above, used to construct a series of price indexes—using a chained-Laspeyres index methodology6—that show how prices paid for individual PSTN services by different consumer groups changed over time.
Individual carrier indexes for each PSTN service and consumer group category were then combined to derive indexes for PSTN services consumed by the three consumer groups for which data was collected—residential, small business and other business. These three indexes were then aggregated into an overall index for all PSTN services for all consumers. As with all aggregated indexes, the expenditure share of a service determines its importance in the overall index. For a given change in price, the index is infl uenced most by those services on which consumers as a group spend the most money.
The different levels of aggregation of the PSTN indexes are particularly useful for the ACCC. They allow it to monitor the changes in PSTN prices for all consumers through the ‘overall’ index as well as analyse how average prices change for individual services across particular consumer groups.
2.1.2 The mobile telephony services index
The Division 12 report monitors prices consumers pay for mobile telephony services provided on the GSM and CDMA networks, including both prepaid and post-paid (billed) mobile services.
In contrast to the PSTN index, yield data has not been used to construct indexes for mobile telephony services because of the marketing methods and pricing structures used to sell these services. To make a call on a mobile network, consumers require a mobile handset, connection and ongoing access to the network. Carriers and carriage service providers typically offer these services as part of a bundled package or plan. These plans include ongoing access to a carrier’s network, charges for calls and other services and if required, connection and a handset.
Mobile plans can contain a high degree of cross-subsidisation. Historically, when carriers have offered low upfront charges for handsets, they have recovered these costs through higher charges for monthly access or outgoing calls. When choosing which plan to use, consumers can further trade off higher access charges for lower call charges and increasingly choose an array of discount options to suit their calling preferences.
5 All the revenue and price data are expressed in 1999–2000 dollars in the index model. The nominal values were converted to 1999–2000 values using the consumer price index.
6 Full details of this methodology can be found in appendix 1 of Changes in the prices paid for telecommunications services 1999–2000, ACCC, April 2001.
Telco reports 1&2 2004-05_2006.iPart2:76 Part2:76Telco reports 1&2 2004-05_2006.iPart2:76 Part2:76 26/04/2006 3:12:08 PM26/04/2006 3:12:08 PM

ACCC telecommunications reports 2004–05 | REPORT 2 77
The CRU’s approach to the problem of estimating prices for mobile services has been to treat mobile telephony as a bundle of services and then to measure the prices paid by consumers for these bundles. The bundles7, updated by the ACCC in 2003, are based on the number and pattern of calls made by consumers and include voice calls and short messaging service (SMS) messages to all mobile networks, and voice calls to the fi xed network. The bundles are derived from sample bill data provided by carriers in the study and so refl ect the actual consumption patterns of Australian consumers. The price of each bundle is determined by adding the cost of the handset, connection, monthly access and call charges, net of any discounts and free calls.
The bundles used in this approach include all components necessary for the consumer to use a mobile telephone service including connection and access fees, handset costs, fl agfall8 and call charges. They also take into account any discounts or free calls offered by carriers.
Separate indexes are then constructed to compare the cost of each bundle over time. These indexes—GSM and CDMA, post-paid and prepaid—are then aggregated using a revenue-weighting process to form an overall mobile telephony index.
2.1.3 The internet services index
As part of the ACCC’s Division 12 record keeping rules introduced in December 2004, particular carriers and carriage service providers9 are required to provide information on dial-up and broadband internet services. This information will be used by the ACCC to estimate price changes for these services.
The ACCC is currently examining appropriate methodology for estimating price change for internet services. Because of the characteristics of the service and because carriers and carriage service providers typically offer these services as part of a bundled package or plan, the ACCC’s preliminary view is that a ‘bundling’ methodology (similar to that used to estimate price change for mobile telephony services) is the most appropriate approach to pricing internet services.
2.2 Other methodology issues
2.2.1 Real prices
Price changes in the report are calculated using ‘real’ prices. This is done by adjusting nominal prices for the effects of infl ation using the consumer price index (CPI).
7 The new user group bundles are set out in the appendix for chapter 5 at the end of the 2002–03 Division 12 report.
8 Flagfall is a fee applied at the start of a mobile voice call for the purpose of call connection, regardless of the length of the call.
9 Telstra, SingTel Optus, AAPT, Primus, MCI Worldcom, iiNet.
Telco reports 1&2 2004-05_2006.iPart2:77 Part2:77Telco reports 1&2 2004-05_2006.iPart2:77 Part2:77 26/04/2006 3:12:08 PM26/04/2006 3:12:08 PM

ACCC telecommunications reports 2004–05 | REPORT 278
2.2.2 The goods and services tax (GST)
The GST affects the prices paid by consumers of telephony services. This affects business and residential consumers differently. While business consumers can claim a GST input credit on telecommunications services because these are business inputs, residential consumers cannot.
As a result, the estimated prices paid by business consumers for PSTN services are GST-exclusive while those paid by residential consumers include GST.10 The prices for mobile telephony services are GST-inclusive as information was not available to estimate the proportion of mobile services used exclusively or partly for business.
2.2.3 Quality of service
Quality means all the non-price attributes of a product or service and includes performance, reliability and features of the product or service. The estimates obtained in this report do not take into account the effect of quality changes on price and consumers’ utility of the services (i.e. the enjoyment that consumers derive from consuming the services) due to the diffi culty in quantifying such changes. The recent introduction of mobile phones with cameras and multimedia messaging services (MMS) (allowing wireless messages that include images, audio and video clips in addition to text) is a good example of how quality affects price. When these handsets were fi rst introduced, they were more expensive than previous models but offered consumers more utility.
If changes in quality are ignored in the analysis of price changes for telecommunications services, those price changes will probably not refl ect pure price changes, that is, price changes where quality remains unchanged. However, an adjustment for a change in quality is diffi cult to make. The Australian Bureau of Statistics (ABS) has no satisfactory arrangement for adjusting the prices of these services in the CPI to refl ect changes in quality, however signifi cant they are.
It is therefore not possible to do anything other than acknowledge that there may be a bias.
2.2.4 Percentage changes and points contribution
The percentage changes used in this report are based on changes in the price indexes constructed for each of the PSTN and mobile services analysed. A complete set of index numbers for the telecommunications services covered is included in tables at the end of this report. Percentage changes are useful when summarising and analysing price movements over time.
The points contribution of an index component is the number of points that a component contributes to the overall index in a particular year. For example, analysis might show that, of a 10 per cent increase in the price index for a certain basket of services, 3 per cent is due to an increase in the price of a given individual service. The points contribution for a component of a given index is calculated by multiplying the revenue share of a component in a basket by the value of the index in that year.
10 As the GST was not in operation in Australia before 1 July 2000, no services included a GST component in their prices before 2000–01.
Telco reports 1&2 2004-05_2006.iPart2:78 Part2:78Telco reports 1&2 2004-05_2006.iPart2:78 Part2:78 26/04/2006 3:12:08 PM26/04/2006 3:12:08 PM

ACCC telecommunications reports 2004–05 | REPORT 2 79
Analysis of points contribution provides an insight into the underlying dynamics in the price of the basket and shows the effects of different price changes within the basket on the index.11
2.2.5 Record keeping rules for the Division 12 report
In December 2004 the ACCC implemented a record keeping rule (RKR) for the Division 12 report, after a consultation process with industry. Under s. 151BU of the Act, the ACCC has the power to make an RKR by written instrument and require that carriers and carriage service providers comply with it. The rules may specify what records are kept, how reports are prepared and when these reports are provided to the ACCC. The ACCC cannot require the keeping of records unless they contain information relevant to its responsibilities. These responsibilities include the operation of Parts XIB and XIC of the Act. Under Part XIB, division 12, paragraph 151CM(1)(a) the ACCC is required to monitor and report each fi nancial year on charges paid by consumers for telecommunications services.
This is the fi rst Division 12 report compiled using the RKR. Before the RKR was implemented, carriers and service providers provided the ACCC with the raw data for Division 12 reports on a voluntary basis. Each year, the ACCC wrote to carriers outlining the information sought. In recent years, however, the ACCC has experienced signifi cant diffi culties in acquiring reliable, up-to-date and relevant information from some carriers. While some carriers have consistently provided timely and reliable data, others have not. Also, some carriers have submitted information that is very late and does not comply in all respects with the data request. This has contributed to previous Division 12 reports being presented to the minister later than is appropriate.
The ACCC therefore decided to implement an RKR to signifi cantly enhance the quality and timeliness of information received from carriers and service providers for the Division 12 report.
Further information about the Division 12 record keeping rule is on the ACCC website at www.accc.gov.au.
11 ACCC, Changes in the prices paid for telecommunications services in Australia 1999–2000, April 2001.
Telco reports 1&2 2004-05_2006.iPart2:79 Part2:79Telco reports 1&2 2004-05_2006.iPart2:79 Part2:79 26/04/2006 3:12:08 PM26/04/2006 3:12:08 PM

ACCC telecommunications reports 2004–05 | REPORT 280
3 Telecommunications services index
The telecommunications services index shows how prices have changed, on average, for consumers of PSTN (fi xed lines) and mobile services as a whole. The index is derived using the price indexes for PSTN services for all consumers and for mobile telephony services which are weighted in the overall index using expenditure aggregates derived from carrier revenue data. The sub-index for PSTN services for all consumers is constructed with reference to baskets of services for both residential and business consumers. The sub-index for mobile services is calculated by deriving sample prices for bundles of post-paid and prepaid mobile telephony services that represent the consumption patterns of fi ve defi ned user groups. Details of the results of the sub-indexes are outlined in subsequent chapters of this report.
3.1 Main changes
Overall, the prices paid by consumers for telecommunications services in Australia fell by 6.6 per cent in 2004–05.
This fall was primarily driven by a decline of 13 per cent in prices paid for mobile telephony, while the average price paid for PSTN services fell by 1.2 per cent in 2004–05.
As fi gure 3.1 shows, since 1997–98 the telecommunications index has fallen from 100 to 73.8 or by 26.2 per cent. Over this time the PSTN services index has fallen from 100 to 81.1 or 18.9 per cent and the mobile services index has fallen by 36 per cent from 100 to 64.
Figure 3.1 Telecommunications services index by PSTN and mobile telephony services, 1997–98 to 2004–05
PSTN
mobiles
all services
1997–98 1998–99 1999–00 2000–01 2001–02 2002–03 2003–04 2004–05
financial year
ind
ex
Source: data supplied by Telstra, AAPT, Primus, Vodafone, Hutchison Telecommunications, Optus, Virgin Mobile (except 2001–02 data, which was excluded from the index) and (until 2000–01) One.Tel.
Note: base year is 1997–98.
Telco reports 1&2 2004-05_2006.iPart2:80 Part2:80Telco reports 1&2 2004-05_2006.iPart2:80 Part2:80 26/04/2006 3:12:08 PM26/04/2006 3:12:08 PM

ACCC telecommunications reports 2004–05 | REPORT 2 81
Falls in the price of mobile services have consistently exceeded falls in PSTN prices, and, as consumer expenditure on mobile services has increased, these declines have had greater effect on movements in the telecommunications index. Points contribution of the PSTN and mobile services indexes to the telecommunications services index confi rms this. Figure 3.2 shows that of the overall index decline of –6.6 per cent mobile services accounted for –5.8 points and PSTN –0.7 points.
Figure 3.2 Points contribution of the PSTN and mobile services indexes to the telecommunications index, 2004–05
-9 -7 -5 -3 -1 1 3 5
all telecommunications
PSTN services
mobile services
-6.6
-0.7
-5.8
points contribution
Telco reports 1&2 2004-05_2006.iPart2:81 Part2:81Telco reports 1&2 2004-05_2006.iPart2:81 Part2:81 26/04/2006 3:12:08 PM26/04/2006 3:12:08 PM

ACCC telecommunications reports 2004–05 | REPORT 282
4 PSTN services index
The PSTN services index summarises price movements for all consumer groups. It is derived by calculating the weighted average price change of each PSTN service in the study for business and residential consumers. The price changes for each PSTN service are then aggregated into a single PSTN index for all consumers.
4.1 Main changes
Prices for PSTN services are estimated to have fallen by 1.2 per cent in 2004–05. Since the index base year of 1997–98, the average price of a basket of PSTN services consumed by all consumers (residential and business combined) has fallen by 18.9 per cent.
Figure 4.1 below, illustrates how the PSTN residential and business indexes correlate with the overall PSTN services index. In this respect, the PSTN residential index fell from 88.7 in 2003–04 to 88.4 or by 0.3 per cent in 2004–05 while the PSTN business index decreased from 72.0 to 69.9 or by 2.9 per cent in 2004–05. These results indicate that falls for business consumers continue to diverge from and outstrip those for residential consumers.
Figure 4.1 PSTN services index by residential and business consumer group, 1997–98 to 2004–05
residential
business
all PSTN
1997–98 1998–99 1999–00 2000–01 2001–02 2002–03 2003–04 2004–05
financial year
ind
ex
Source: data supplied by Telstra, AAPT, Primus, Optus (except 2001–02 data, which was excluded from the index) and (until 2000–01) One.Tel.
Note: base year is 1997–98.
Table 4.1 below sets out the percentage changes in the PSTN services index by each service in the PSTN basket over the past fi ve years and fi gure 4.2 below shows the change in the share of total expenditure by consumers on each of the PSTN services in the index between the base year of 1997–98 and 2004–05.
Telco reports 1&2 2004-05_2006.iPart2:82 Part2:82Telco reports 1&2 2004-05_2006.iPart2:82 Part2:82 26/04/2006 3:12:08 PM26/04/2006 3:12:08 PM

ACCC telecommunications reports 2004–05 | REPORT 2 83
Prices paid by PSTN consumers, on average, for basic access increased in 2004–05 by 5.2 per cent—the smallest increase since carriers began changing the price structure of PSTN services by increasing the fi xed price of basic access while decreasing the price of per-call services or ‘rebalancing’. Basic access charges in the overall PSTN index have increased by 43 per cent since 2000–01 and 79.4 per cent since 1997–98. Figure 4.2 further shows that the process of rebalancing and restructuring PSTN charges has resulted in the share of consumers’ total expenditure on PSTN services spent on basic access doubling from 19 per cent in 1997–98 to 40 per cent in 2004–05.
Table 4.1 Percentage change in the PSTN services index by service type from 2000–01 to 2004–05
2000–01 2001–02 2002–03 2003–04 2004–05
Basic access 15.2 13.2 12.4 6.8 5.2
Local calls –17.9 –11.7 –3.8 –3.3 –7.7
National long-distance –6.3 –8.7 –4.7 –1.9 –3.1
International –17.2 –15.3 –5.8 –5.9 –4.4
Fixed-to-mobile –6.2 –3.2 –2.4 –2.2 –3.8
PSTN services index –5.8 –2.6 1.0 0.2 –1.2
Source: data supplied by Telstra, AAPT, Primus, Optus (except 2001–02 data, which was excluded from the index) and (until 2000–01) One.Tel.
The price of local calls fell by 7.7 per cent in 2004–05, 24.3 per cent since 2000–01 and 43.9 per cent since 1997–98. Figure 4.2 shows that between 1997 and 2004–05 the proportion of consumer total expenditure on local calls halved from 31 per cent to 16 per cent again due to carriers rebalancing call and access charges.
Figure 4.2 Comparison of share of total consumer PSTN expenditure by service 1997–98 and 2004–05
0% basic access
19%
local calls 31%
national long distance 25%
international 11%
fixed to mobiles 14%
2004–05
basic access40%
local calls 16%
national long distance 16%
international 4%
fixed to mobiles 24%
1997–98
Source: data supplied by Telstra, AAPT, Primus, Optus (except 2001–02 data, which was excluded from the index) and (until 2000–01) One.Tel.
Telco reports 1&2 2004-05_2006.iPart2:83 Part2:83Telco reports 1&2 2004-05_2006.iPart2:83 Part2:83 26/04/2006 3:12:09 PM26/04/2006 3:12:09 PM

ACCC telecommunications reports 2004–05 | REPORT 284
Table 4.1 shows the prices of other call services—national long-distance, international and fi xed-to-mobile calls—have all also declined in the past twelve months and since 2000–01.
While expenditure on local, national long-distance and international calls as a share of total expenditure on PSTN services has been declining, as fi gure 4.2 illustrates, the proportion spent on fi xed-to-mobile calls has increased. This is due to the growth of the mobile market from 3.5 million services in operation in 1997–98 to approximately 16.2 million services in 2004–05.
Figure 4.3 below details each service’s points contribution to the PSTN services index in 2004–05. The increase in basic access contributed +1.8 points to the PSTN services index change. Local calls contributed –1.4 points, while fi xed-to-mobile calls, national and international calls contributed –0.9 and –0.5 and –0.2 points respectively. Accordingly, there was an overall decrease in the average price of a basket of PSTN services consumed by all consumers of 1.2 per cent in 2004–05.
Figure 4.3 Points contribution of PSTN services to the PSTN index in 2004–05
-1.2
-0.9
-0.2
-0.5
-1.4
1.8
-2 -1.5 -1 -0.5 0 0.5 1 1.5 2
all PSTN
fixed-to-mobile
international
national long distance
local calls
basic access
points contribution
Percentage changes and price trends for residential and business consumers over the past fi ve years in the PSTN index are outlined in table 4.2 below. As indicated earlier in this section, results show that business consumers have experienced consistently falling prices while residential consumers have experienced either smaller price decreases compared to business consumers or price increases over the same time period. Since 1997–98 PSTN prices for business consumers have declined by a total of 30.1 per cent, while prices paid by residential consumers for the same services have fallen by 11.6 per cent.
Table 4.2 Percentage changes in the PSTN services index by consumer group 2000–01 to 2004–05
2000–01 2001–02 2002–03 2003–04 2004–05
PSTN residential –3.5 –2.2 5.0 1.4 –0.3
PSTN business –9.2 –3.2 –5.8 –1.6 –2.9
PSTN services index –5.8 –2.6 1.0 0.2 –1.2
Source: data supplied by Telstra, AAPT, Primus, Optus (except 2001–02 data, which was excluded from the index) and (until 2000–01) One.Tel.
Telco reports 1&2 2004-05_2006.iPart2:84 Part2:84Telco reports 1&2 2004-05_2006.iPart2:84 Part2:84 26/04/2006 3:12:09 PM26/04/2006 3:12:09 PM

ACCC telecommunications reports 2004–05 | REPORT 2 85
The ACCC notes, however, the decline in the PSTN business index is substantially due to falls in the prices paid by other business (i.e. larger business) consumers rather than the prices paid by small business consumers.
While prices paid for PSTN services by other businesses have decreased by 18.9 per cent in 2004–05 and by 46.5 per cent since 1997–98, prices for small business consumers have largely followed the same trends as prices for residential consumers and, in 2004–05, the small business index has increased by 15.8 per cent. Reasons for this increase are discussed in section 4.3.1
Sections 4.2 and 4.3 of this report further disaggregate these results and show how the average price of each of the PSTN services has changed for residential, small business and other business consumers.
4.2 PSTN residential index
The index for PSTN residential services is derived from fi ve individual sub-indexes for basic access (line rental), local calls, national long-distance, international and fi xed-to-mobile calls. The indexes for each service are then combined by revenue-weighting the year-on-year price change for each PSTN service. Weights are based on each service’s share of the previous year’s overall revenue for residential PSTN services in the study.
4.2.1 Main changes
In 2004–05 the average price of PSTN residential services decreased by 0.3 per cent. This follows price increases of 1.4 per cent in 2003–04 and 5 per cent in 2002–03. Since 1997–98 the PSTN residential services index has fallen from 100 to 88.4 indicating an overall decline in the prices paid by residential consumers for PSTN services of 11.6 per cent (fi gure 4.4).
Figure 4.4 Index for PSTN services for residential consumers, 1997–98 to 2004–05
1997–98 1998–99 1999–00 2000–01 2001–02 2002–03 2003–04 2004–05
financial year
ind
ex
100.0 95.388.2 85.1 83.3 87.5 88.7 88.4
Source: data supplied by Telstra, AAPT, Primus, Optus (except 2001–02 data, which was excluded from the index) and (until 2000–01) One.Tel.
Note: base year is 1997–98.
Telco reports 1&2 2004-05_2006.iPart2:85 Part2:85Telco reports 1&2 2004-05_2006.iPart2:85 Part2:85 26/04/2006 3:12:09 PM26/04/2006 3:12:09 PM

ACCC telecommunications reports 2004–05 | REPORT 286
4.2.2 Description and analysis of price changes by PSTN service for residential consumers
As noted above, overall prices for residential consumers of PSTN services fell by 0.3 per cent in 2004–05. The overall movement of the PSTN residential index is generated by changes in the average price paid for individual services comprising the residential PSTN basket. These changes are discussed in more detail below. Table 4.3 sets out the percentage changes for each service in the residential PSTN basket over the past fi ve years while fi gure 4.5 illustrates the year-on-year percentage price changes by service for residential consumers.
Basic access service
The average price paid for basic services by residential consumers increased by 7.5 per cent in 2004–05 and by 54.5 per cent in the past fi ve years. While Telstra did not increase the price of its basic access service in its HomeLine plan products between July 2004 and June 2005, the increase in the basic access prices indicated in the PSTN residential index can be accounted for by the fl ow-on effects of Telstra increasing the prices of basic access for its HomeLine Plus and HomeLine Complete products by up to 14.7 per cent (about $3.45 per month) in June 2004. Following these increases by Telstra, Optus increased its line rental charges to customers in August 2004 by between 1.3 and 8 per cent and again in May 2005 by about 6 per cent. In September 2004 Optus launched a ‘yes’ LineSaver product which offered $4 discount on line rental if customers signed up to a 12-month contract for a specifi c long-distance call plan.
Overall, from 1997–98 to 2004–05, the average price of basic access paid by residential consumers has increased by 98.3 per cent.
Table 4.3 Percentage changes in the PSTN residential index, 2000–01 to 2004–05
2000–01 2001–02 2002–03 2003–04 2004–05
Basic access 16.0 15.1 16.6 7.3 7.5
Local calls –16.5 –10.9 –1.2 –3.8 –11.1
National long-distance –3.1 –8.5 –2.4 0.8 –1.7
International –14.6 –15.6 –3.5 –5.8 –3.6
Fixed-to-mobile –1.1 –4.7 5.0 0.1 –1.8
PSTN residential –3.5 –2.2 5.0 1.4 –0.3
Source: data supplied by Telstra, AAPT, Primus, Optus (except 2001–02 data, which was excluded from the index) and (until 2000–01) One.Tel.
Local calls
The average price paid for local calls decreased by 11.1 per cent in 2004–05 and by 24.8 per cent in the last fi ve years. Since the base year of 1997–98, the average price of local calls has decreased by 44.3 per cent.
Telco reports 1&2 2004-05_2006.iPart2:86 Part2:86Telco reports 1&2 2004-05_2006.iPart2:86 Part2:86 26/04/2006 3:12:09 PM26/04/2006 3:12:09 PM

ACCC telecommunications reports 2004–05 | REPORT 2 87
Again, while Telstra has not changed the price of local calls in its HomeLine products in 2004–05, the decrease in the average price of a local call for residential consumers is in part attributable to tariff changes made late in the 2003–04 fi nancial year fl owing through to revenue and usage data used to calculate the PSTN indexes in 2004–05. Similarly, consumer take-up of bundled offerings where unlimited local calls are priced into line-rental charges or providers offering lower local call prices to customers who bundle other services, such as internet access, further contributed to the fall in the average price of a local call for residential consumers in 2004–05.
National long-distance calls
The average price paid by residential consumers for national long-distance calls decreased by 1.7 per cent in 2004–05 and by 11.5 per cent in the past fi ve years. Since the base year of 1997–98 prices for this service have decreased by 27.1 per cent for residential consumers. Telstra did not report any changes to charges for its national long-distance services as part of its HomeLine product which may have contributed to this change. In April 2005 Optus introduced a $39 HomeCap product—if consumers spend $39 on long-distance calls they can receive up to $120 worth of national, international and fi xed-to-mobile calls. However, Optus also increased its fl agfall charges from 35 to 37 cents in August 2004 and 37 to 39 cents in May 2005 which may have offset any decreases from its capped plans.
Figure 4.5 Year-on-year percentage change in the price index by PSTN service for residential consumers, 2000–01 to 2004–05
-20%
-15%
-10%
-5%
0%
5%
10%
15%
20%
basic access local calls NLD ILD F2M
1999–00 to 2000–01
2000–01 to 2001–02
2001–02 to 2002–03
2002–03 to 2003–04
2003–04 to 2004–05
Source: data supplied by Telstra, AAPT, Primus, Optus (except 2001–02 data, which was excluded from the index) and (until 2000–01) One.Tel.
International calls
The average price paid by residential consumers for international long-distance calls decreased by 3.6 per cent in 2004–05. Factors contributing to this decline include the introduction of Optus’ ‘yes’ CallSaver plan in September 2004 reducing call rates to 9 cents per minute to USA, UK, New Zealand, Canada, Ireland, Italy, Greece, Singapore, Hong Kong and China. Similarly international calls were included in Optus’ $39 HomeCap plan introduced in April 2005 although these declines may have partially been offset by Optus increases in fl agfalls noted above. Telstra’s introduction of a 20-minute call cap option for international calls made by HomeLine customers in June 2004 also may have contributed to price falls for this service in 2004–05.
Telco reports 1&2 2004-05_2006.iPart2:87 Part2:87Telco reports 1&2 2004-05_2006.iPart2:87 Part2:87 26/04/2006 3:12:09 PM26/04/2006 3:12:09 PM

ACCC telecommunications reports 2004–05 | REPORT 288
The average price paid for international long-distance calls has fallen by 62.7 per cent since the base year 1997–98 for residential PSTN consumers. While this decline is the largest of all call services in the residential PSTN index, as consumer spending on international calls accounts for about 4 per cent of total expenditure on PSTN services, price changes for this service affect the overall movement of the index less than other call services.
Fixed-to-mobile calls
In 2004–05 the average price paid by residential consumers for fi xed-to-mobile calls decreased by 1.8 per cent. Telstra did not report any changes to the price of its fi xed-to-mobile charges for residential consumers in its HomeLine products in 2004–05, although yield calculations using revenue and usage information from Telstra suggest small increases in these call prices for residential consumers which may be due to more price sensitive consumers churning out or between Telstra plans. Optus increased the price of its fi xed-to-mobile calls in December 2004 from 35 to 37 cents per minute although fi xed-to-mobile calls were also included in Optus’ $39 HomeCap product (providing $120 worth of calls) which may have offset this increase to some extent.
Because of increases of 5 per cent in 2002–03 and 0.1 per cent last year, the average price paid for fi xed-to-mobile calls for residential consumers has decreased by 1.8 per cent over the past fi ve years and by 14.8 per cent since the 1997–98 base year.
Points contribution
The points contribution of individual service components to the weighted average price change for the PSTN residential services is shown in fi gure 4.6. The points contribution analysis outlines the number of points that a component (in this case, a service) contributes to the overall index in a particular year. That is, it shows how each service in the PSTN residential basket contributes to the movement in the PSTN residential services index.
As shown in fi gure 4.6, national, fi xed-to-mobile and international calls contributed –0.3, –0.3 and –0.2 points respectively to the change in the PSTN index for residential consumers, while local calls contributed –2.1 points. Increases in the average price paid for basic access and +2.6 points nearly offsetting all the declines in call prices in 2004–05.
Telco reports 1&2 2004-05_2006.iPart2:88 Part2:88Telco reports 1&2 2004-05_2006.iPart2:88 Part2:88 26/04/2006 3:12:10 PM26/04/2006 3:12:10 PM

ACCC telecommunications reports 2004–05 | REPORT 2 89
Figure 4.6 Points contributions by individual PSTN services to the residential index in 2004–05
-0.3
-0.3
-0.2
-0.3
-2.1
2.6
-3 -2 -1 0 1 2 3
PSTN residential
fixed-to-mobile
international
national long distance
local calls
basic access
points contribution
Source: data supplied by Telstra, AAPT, Primus, Optus (except 2001–02 data, which was excluded from the index) and (until 2000–01) One.Tel.
4.3 PSTN business index
The index for PSTN business services is made up of the small business and other business sub-indexes. These sub-indexes can be disaggregated to show how prices have changed for each of the services in the business index basket.
4.3.1 Defi nition of business type
There is no single defi nition for ‘small business’ or ‘other business’ consumers across carriers. This can make price comparison between business types and carriers diffi cult as customers that may be classed as a ‘small business’ consumer by one carrier may be treated as an ‘other business’ consumer by another carrier. Carriers also regularly change their defi nitions, as noted below, shifting revenues and usage between categories and years making year-on-year comparisons within business categories problematic.
In 2004–05 Telstra, for example, defi nes a small business customer as one who spends up to $500 000 annually with no more than two lines and no complex services and includes so called SOHO (small offi ce/home offi ce) customers. In previous years Telstra defi ned small business customers as those who had a spend threshold of up to $25 000 annually. In 2003–04 Telstra also changed its defi nition of small business in its Telstra Country Wide (TCW) segment and moved all TCW customers that are account managed, irrespective of the $25 000 annual spending rule, to the ‘other business’ category of the Division 12 report. In 2004–05 Telstra defi ned its other business customers as those with annual spend greater than $500 000 which may include key and large, medium and small corporate customers.
Optus defi nes a small business customer as one with fewer than 20 phone lines, fewer than fi ve employees, and a telecommunications bill spend with Optus of less than $1500 per month. Primus does not differentiate between residential and small business customers, noting that while
Telco reports 1&2 2004-05_2006.iPart2:89 Part2:89Telco reports 1&2 2004-05_2006.iPart2:89 Part2:89 26/04/2006 3:12:10 PM26/04/2006 3:12:10 PM

ACCC telecommunications reports 2004–05 | REPORT 290
its residential customers generally have fi ve lines or less, a residential customer is simply one that acquires a residential service. If a small business chooses to acquire a residential package, Primus classifi es it as a residential customer. AAPT defi nes a small business customer as a customer that is business or commercial in nature and has a monthly-billed revenue of less than $1000 per month. In previous periods, One.Tel also defi ned small business customers as those business customers with less than fi ve lines. The ‘other business’ category generally comprises larger businesses that fall outside the respective carriers’ defi nitions of small businesses.
The ACCC therefore considers that the aggregate PSTN business index is the most reliable indicator of price change for business consumers as it includes all revenue and usage data from all business consumers each year regardless of defi nitional changes by carriers. However, the ACCC also considers that the small and other business sub-indexes still provide useful information on price trends between different sized business consumers and has continued to include information on these sub-indexes in this report.
4.3.2 Main changes
As shown in fi gure 4.7 below, in 2004–05 the average price paid by business consumers for a basket of PSTN services decreased by 2.9 per cent as the PSTN business index fell from 72 in 2003–04 to 69.9 in 2004–05. Since the base year of 1997–98, the PSTN business index has declined from 100 to 69.9, a fall of 30.1 per cent.
While the overall PSTN business index has steadily declined since 1997–98, fi gure 4.7 shows that since 2001–02 the results have diverged according to business type and the average price paid by small business consumers has been increasing while the average price paid by other businesses has been falling.
Figure 4.7 PSTN business services index for all business by small and other businesses, 1997–98 to 2004–05
small business
other business
all business
1997–98 1998–99 1999–00 2000–01 2001–02 2002–03 2003–04 2004–05
financial year
ind
ex
Source: data supplied by Telstra, AAPT, Primus, Optus (except 2001–02 data, which was excluded from the index) and (until 2000–01) One.Tel.
Note: base year is 1997–98.
Telco reports 1&2 2004-05_2006.iPart2:90 Part2:90Telco reports 1&2 2004-05_2006.iPart2:90 Part2:90 26/04/2006 3:12:10 PM26/04/2006 3:12:10 PM

ACCC telecommunications reports 2004–05 | REPORT 2 91
Table 4.4 below sets out the percentage changes in the overall PSTN business services index by each service in the PSTN basket over the past fi ve years and fi gure 4.8 shows the year-on-year rate of price decrease for business consumers by each service in the PSTN business basket.
Table 4.4 Percentage changes in the PSTN business index, 2000–01 to 2004–05
2000–01 2001–02 2002–03 2003–04 2004–05
Basic access 13.7 10.0 4.2 5.8 1.0
Local calls –20.2 –13.0 –9.2 –2.3 –0.7
National long-distance –11.7 –8.9 –8.6 –6.8 –5.7
International –25.2 –13.3 –14.3 –5.8 –7.6
Fixed-to-mobile –9.9 –1.8 –9.6 –4.7 –6.5
PSTN business –9.2 –3.2 –5.8 –1.6 –2.9
Source: data supplied by Telstra, AAPT, Primus, Optus (except 2001–02 data, which was excluded from the index) and (until 2000–01) One.Tel.
In 2004–05 basic access prices for all business consumers increased by 1.0 per cent and by 22.4 per cent in the past fi ve years. Since the base year of 1997–98 prices for this service have increased by 48 per cent.
The average price paid by business consumers for local and national long-distance calls decreased by 0.7 and 5.7 per cent in 2004–05, by 23.3 and 26.8 per cent in the last fi ve years and 43.2 and 45.5 per cent since 1997–98.
Similarly, the average price of international and fi xed-to-mobile calls in the business index fell by 7.6 and 6.5 per cent respectively in 2004–05, by 35.2 and 20.9 per cent in the past fi ve years and 73.2 and 38.1 per cent since the index base year of 1997–98.
Figure 4.8 Year-on-year percentage change in the price index by PSTN service for all business consumers, 2000–01 to 2004–05
-20%
-15%
-30%
-25%
-10%
-5%
0%
5%
10%
15%
20%
basic access local calls NLD ILD F2M
1999–00 to 2000–01
2000–01 to 2001–02
2001–02 to 2002–03
2002–03 to 2003–04
2003–04 to 2004–05
Source: data supplied by Telstra, AAPT, Primus, Optus (except 2001–02 data, which was excluded from the index) and (until 2000–01) One.Tel.
Telco reports 1&2 2004-05_2006.iPart2:91 Part2:91Telco reports 1&2 2004-05_2006.iPart2:91 Part2:91 26/04/2006 3:12:10 PM26/04/2006 3:12:10 PM

ACCC telecommunications reports 2004–05 | REPORT 292
Figure 4.9 shows the points contribution made by each service in the overall PSTN business index. It shows that the 0.3 points increase in basic access in 2004–05 for business consumers was offset by falls for all of the call services and, in particular, that fi xed-to-mobile services contributed –2.0 points to the –2.9 per cent decline in the PSTN business index refl ecting the relatively large share—about 30 per cent—of total expenditure on business services that consumers spend on fi xed-to-mobile calls.
Figure 4.9 Points contributions by individual PSTN services to the all business index in 2004–05
-2.9
-2
-0.2
-0.9
-0.1
0.3
-4 -3 -2 -1 0 1
PSTN all business
fixed-to-mobile
international
national long distance
local calls
basic access
points contribution
Source: data supplied by Telstra, AAPT, Primus, Optus (except 2001–02 data, which was excluded from the index) and (until 2000–01) One.Tel.
As noted above, while the overall PSTN business index has steadily declined since 1997–98, the results have diverged according to business type and the average price paid by small business consumers has been increasing while the average price paid by other businesses has been falling. Table 4.5 below shows that in 2004–05 the index for small business consumers for PSTN services increased by 15.8 per cent. The ACCC notes, however, that only a portion of this increase can be attributed directly to price increases in tariff and small business plan charges in 2004–05. Other factors that may have contributed to this result are discussed in the following section (4.4) detailing changes in the small business index.
The average prices paid by other (larger) business consumers on the other hand, fell by 18.1 per cent in 2004–05 (and by 46.5 per cent since 1997–98). Reasons for the large fall for other business consumers are discussed in section 4.5 below and include larger businesses’ ability to negotiate ‘off-tariff’ discounts with suppliers of PSTN services due to higher volumes and expenditure.
Table 4.5 Percentage changes in the PSTN business services index by business type, 2000–01 to 2004–05
2000–01 2001–02 2002–03 2003–04 2004–05
Small business –8.7 2.4 1.1 3.1 15.8
Other business –9.4 –4.7 –8.6 –5.6 –18.1
PSTN business index –9.2 –3.2 –5.8 –1.6 –2.9
Source: data supplied by Telstra, AAPT, Primus, Optus (except 2001–02 data, which was excluded from the index) and (until 2000–01) One.Tel.
Telco reports 1&2 2004-05_2006.iPart2:92 Part2:92Telco reports 1&2 2004-05_2006.iPart2:92 Part2:92 26/04/2006 3:12:11 PM26/04/2006 3:12:11 PM

ACCC telecommunications reports 2004–05 | REPORT 2 93
Figure 4.10 below shows the points contribution made by the small business and other business indexes to the overall price movement in the ‘all business index’. ‘Small business index’ for the basket of PSTN services contributed +7.1 points to the overall business index, while the average price paid by other business consumers for the basket of PSTN services accounted for –10.0 points and accounted for the overall 2.9 per cent decrease in the overall PSTN business index.
Figure 4.10 Points contributions by small and other business to the PSTN business index in 2004–05
-2.9
7.1
-10
-12 -10 -8 -6 -4 -2 0 2 4 6 8
all business
small business
other business
points contribution
Source: data supplied by Telstra, AAPT, Primus, Optus (except 2001–02 data, which was excluded from the index) and (until 2000–01) One.Tel.
4.4 Small business index
4.4.1 Main changes
As indicated in table 4.5 the PSTN index for small business consumers increased by 15.8 per cent in 2004–05. This is the fourth consecutive increase in the small business index and compares with an overall average increase in the basket of small business PSTN services of 3.1 per cent in 2003–04 and 1.1 per cent in 2002–03. Possible reasons for the large movement in the index for 2004–05 are discussed below and as noted earlier in the report price change estimates based on this sub-index should be quoted with caution.
Figure 4.11 shows, since 1997–98, and because of the latest increase, the PSTN index for small business consumers has increased from 100 to 102.6 or by 2.6 per cent.
Telco reports 1&2 2004-05_2006.iPart2:93 Part2:93Telco reports 1&2 2004-05_2006.iPart2:93 Part2:93 26/04/2006 3:12:11 PM26/04/2006 3:12:11 PM

ACCC telecommunications reports 2004–05 | REPORT 294
Figure 4.11 Index for PSTN services for small business consumers, 1997–98 to 2004–05
1997–98 1998–99 1999–00 2000–01 2001–02 2002–03 2003–04 2004–05
financial year
ind
ex
100.0 97.9 90.882.9 84.9 85.9 88.6
102.6
Source: data supplied by Telstra, AAPT, Primus, Optus (except 2001–02 data, which was excluded from the index) and (until 2000–01) One.Tel.
Note: base year is 1997–98.
4.4.2 Description and analysis of price changes by PSTN service for small business consumers
As noted in table 4.5 the small business index has increased by 15.8 per cent in 2004–05. ACCC analysis indicates that only part of this increase can be directly attributed to actual price changes in the carriers’ tariff and small business pricing plans in 2004–05. Revenue and traffi c (usage) information supplied by Telstra and used to calculate yields (proxy prices) for each service in the small business sub-index have been the main cause of the increase in the small business index. In particular, Telstra has reported falling revenues and traffi c across all PSTN services for small business consumers in 2004–05. However, as the rate of decline in revenue for each service has been smaller than the decline in traffi c for that service, corresponding yields have increased and led to an increase in the small business sub-index.
Factors the ACCC has identifi ed and Telstra has provided to explain this result include:
• defi nitional changes for small business consumers
• price sensitivities of small business consumers (and movement of more price sensitive consumers out of this group or to competing carriers where they are not treated as ‘small businesses’)
• prices of and conversion to competing non-PSTN services such as ISDN, fi xed-to-mobile migration and migration to other technologies such as VoDSL
• a lag in the implementation of higher tariff charges introduced in 2003–04 as consumers move to higher rates at the end of contracts
• the limitations of the methodology used to construct the PSTN price indexes for this report to take account of such factors.
Telco reports 1&2 2004-05_2006.iPart2:94 Part2:94Telco reports 1&2 2004-05_2006.iPart2:94 Part2:94 26/04/2006 3:12:11 PM26/04/2006 3:12:11 PM

ACCC telecommunications reports 2004–05 | REPORT 2 95
Data supplied by other carriers for this sub-index generally showed either small increases or decreases in yield compared to the previous year.
The overall movement of the PSTN small business index has been infl uenced by the respective price changes of the services comprising the PSTN small business basket. These are described below and set out in table 4.6 and illustrated in fi gure 4.12.
Table 4.6 Percentage changes in the PSTN small business index by service type from 2000–01 to 2004–05
2000–01 2001–02 2002–03 2003–04 2004–05
Basic access 8.5 16.2 7.5 7.7 14.5
Local calls –23.2 –3.0 –3.7 –3.0 17.8
National long-distance –3.4 –6.6 –6.8 5.3 10.3
International –33.5 –13.4 –7.3 –4.4 14.1
Fixed-to-mobile –8.6 –0.8 –4.3 1.4 19.8
PSTN small business –8.7 2.4 1.1 3.1 15.8
Source: data supplied by Telstra, AAPT, Primus, Optus (except 2001–02 data, which was excluded from the index) and (until 2000–01) One.Tel.
Basic access
In 2004–05 the average price paid by small business consumers for basic access increased by 14.5 per cent and by 54.1 per cent in the past fi ve years. While Telstra did not increase the price of its basic access service in its BusinessLine plan products between July 2004 and June 2005, a portion of the increase can be accounted for by the fl ow-on effects of Telstra increasing the prices of basic access for its BusinessLine Complete and BusinessLine Plus products by $1.00 per month in June 2004. Optus increased its line rental charges to small business customers in August 2004 by between 1.3 and 8 per cent and again in May 2005 by about 6 per cent in line with its increases for residential consumers. In September 2004 Optus launched a ‘yes’ LineSaver product which offered $4 discount on line rental if customers signed up to a 12-month contract for a specifi c long-distance call plan. In 2004–05 Optus also introduced a Business Rewards bundle plan offering $5 off monthly line rental.
Since the 1997–98 base year, the average price paid for basic access has increased by 76.6 per cent. This is less than the 98.3 per cent increase experienced by residential consumers for basic access.
Local calls
The average price paid for local calls increased by 17.8 per cent in 2004–05 and by 6.7 per cent in the last fi ve years. Since the base year of 1997–98, the average price of local calls has decreased by 19.4 per cent.
Telco reports 1&2 2004-05_2006.iPart2:95 Part2:95Telco reports 1&2 2004-05_2006.iPart2:95 Part2:95 26/04/2006 3:12:11 PM26/04/2006 3:12:11 PM

ACCC telecommunications reports 2004–05 | REPORT 296
Figure 4.12 Year-on-year percentage change in the price index by PSTN service for small business consumers, 2000–01 to 2004–05
-20%
-30%
-40%
-10%
0%
10%
20%
30%
basic access local calls NLD ILD F2M
1999–00 to 2000–01
2000–01 to 2001–02
2001–02 to 2002–03
2002–03 to 2003–04
2003–04 to 2004–05
Source: data supplied by Telstra, AAPT, Primus, Optus (except 2001–02 data, which was excluded from the index) and (until 2000–01) One.Tel.
National long-distance
The average price paid by small business consumers for national long-distance calls increased by 10.3 per cent in 2004–05 and by 1.0 per cent in the past fi ve years. Since the base year of 1997–98 prices for this service have decreased by 12.6 per cent for small business consumers.
In December 2004 Telstra increased timed STD call connection charges in its BusinessLine Plus plan from 20 to 22.7 cents. Optus also increased its fl agfall charges from 35 to 37 cents in August 2004 and 37 to 39 cents in May 2005.
International calls
The average price paid by small business consumers for international long-distance calls increased by 14.1 per cent in 2004–05. Despite this latest increase, the average price paid for international long-distance calls has fallen by 65.2 per cent since the base year 1997–98 for small business PSTN consumers.
Optus reported a 10 per cent increase in its standard international rates in August 2004. In 2004–05 it also introduced a 30 cents per minute mobile termination surcharge to 49 countries. In October 2004 Optus reduced rates to its ‘Top 5’ countries to 18 cents per minute. In January 2005 Optus again reduced call rates to 9 cents per minute to USA, UK, New Zealand, Canada, Ireland, Italy, Greece, Singapore, Hong Kong and China and reduced these yet again to 2.5 cents per minute in April 2005.
Fixed-to-mobile calls
In 2004–05 the average price paid by small business consumers for fi xed-to-mobile calls increased by 19.8 per cent. Telstra increased call connection charges in its BusinessLine Plus plan from 20 cents to 22.7 cents in December 2004. Optus increased the price of its fi xed-to-mobile calls in December
Telco reports 1&2 2004-05_2006.iPart2:96 Part2:96Telco reports 1&2 2004-05_2006.iPart2:96 Part2:96 26/04/2006 3:12:12 PM26/04/2006 3:12:12 PM

ACCC telecommunications reports 2004–05 | REPORT 2 97
2004 from 35 to 37 cents per minute although fi xed-to-mobile calls were also included in Optus’ $39 HomeCap product (providing $120 worth of calls) which was also available to small business consumers.
The average price paid for fi xed-to-mobile calls for residential consumers has increased by 15 per cent over the past fi ve years and decreased by 7.7 per cent since the 1997–98 base year.
4.5 Other business index
4.5.1 Main changes
The average prices paid by other (larger) business consumers fell by 18.1 per cent in 2004–05. As fi gure 4.13 shows, prices for other business consumers have been falling steadily and consistently and since 1997–98 base year, the PSTN other business index has declined from 100 to 53.5—a fall of 46.5 per cent.
Figure 4.13 Index of PSTN services for other business consumers, 1997–98 to 2004–05
1997–98 1998–99 1999–00 2000–01 2001–02 2002–03 2003–04 2004–05
financial year
ind
ex
100.093.7
87.879.5 75.8
69.3 65.4 53.5
Source: data supplied by Telstra, AAPT, Primus, Optus (except 2001–02 data, which was excluded from the index) and (until 2000–01) One.Tel.
Note: base year is 1997–98.
4.5.2 Description and analysis of price changes by PSTN service for other business consumers
As noted in table 4.5 the other business index has decreased by 18.1 per cent in 2004–05.
Revenue and traffi c (usage) information supplied by carriers and used to calculate yields (proxy prices) for each service in the other business sub-index show that while revenues for PSTN services for other business consumers in the index for 2004–05 have been falling, traffi c for each service has been increasing leading to falling yields (prices) and a decrease in the PSTN index for other business consumers.
Telco reports 1&2 2004-05_2006.iPart2:97 Part2:97Telco reports 1&2 2004-05_2006.iPart2:97 Part2:97 26/04/2006 3:12:12 PM26/04/2006 3:12:12 PM

ACCC telecommunications reports 2004–05 | REPORT 298
Reasons the ACCC has identifi ed and carriers have provided for the large fall in prices for the other business consumer group compared to small business consumers include the prevalence of ‘off-tariff’ or individually negotiated contracts and the signifi cant bargaining power of larger businesses to negotiate discounts with suppliers of PSTN services due to higher volumes and expenditure. Similarly, the use of tenders and consultants to select suppliers and the competition from other carriers to supply larger business consumers have also driven down prices in this market segment. The ACCC also considers downward pressure on prices may result from stronger facilities-based competition in central business district areas where the proportion of major corporate and large business consumers is greatest and the increasingly bundled services bought by large corporate consumers extend beyond the fi ve basic PSTN services currently reported on under Division 12 provisions.
The overall movement of the PSTN other business index has been infl uenced by the respective price changes of the services comprising the PSTN other business basket. These are described below and set out in table 4.6 and illustrated in fi gure 4.14 below.
Table 4.6 Percentage changes in the PSTN other business index by service type from 2000–01 to 2004–05
2000–01 2001–02 2002–03 2003–04 2004–05
Basic access 15.4 7.9 0.7 3.7 –14.8
Local calls –19.4 –15.5 –10.8 –1.6 –18.8
National long-distance –14.7 –9.4 –9.1 –14.8 –16.2
International –22.4 –13.2 –15.8 –6.8 –21.9
Fixed-to-mobile –10.3 –1.9 –11.0 –8.5 –21.2
PSTN other business –9.4 –4.7 –8.6 –5.6 –18.1
Source: data supplied by Telstra, AAPT, Primus, Optus (except 2001–02 data, which was excluded from the index) and (until 2000–01) One.Tel.
Basic access
The average price paid for basic access decreased by 14.8 per cent in 2004–05 and by 3.9 per cent in the last fi ve years. Since the base year of 1997–98, the average price of basic access has increased by 18.2 per cent. Figure 4.14 shows that the rate of increase in basic access prices has been falling over recent years (with this year’s fall offsetting increases over the past fi ve years).
Local calls
In 2004–05 the average price paid by other business consumers for local calls decreased by 18.8 per cent and by 39.7 per cent in the past fi ve years. Since the base index year of 1997–98, the average price of local calls for other business consumers has fallen by 55.6 per cent.
Telco reports 1&2 2004-05_2006.iPart2:98 Part2:98Telco reports 1&2 2004-05_2006.iPart2:98 Part2:98 26/04/2006 3:12:12 PM26/04/2006 3:12:12 PM
ACCC telecommunications reports 2004–05 | REPORT 2 99
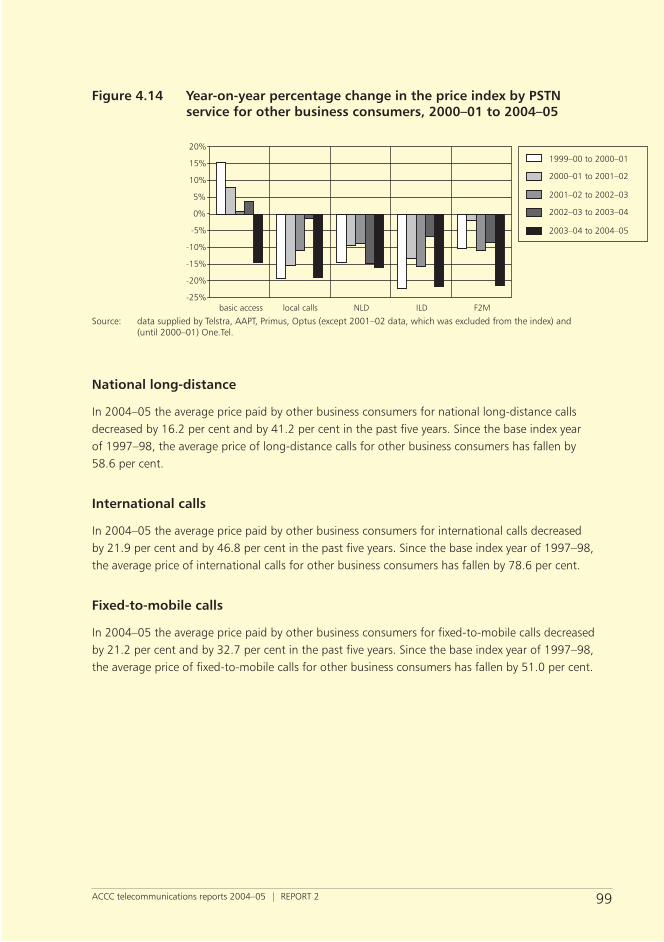
Figure 4.14 Year-on-year percentage change in the price index by PSTN service for other business consumers, 2000–01 to 2004–05
-5%
-10%
-15%
-20%
-25%
0%
5%
10%
15%
20%
basic access local calls NLD ILD F2M
1999–00 to 2000–01
2000–01 to 2001–02
2001–02 to 2002–03
2002–03 to 2003–04
2003–04 to 2004–05
Source: data supplied by Telstra, AAPT, Primus, Optus (except 2001–02 data, which was excluded from the index) and (until 2000–01) One.Tel.
National long-distance
In 2004–05 the average price paid by other business consumers for national long-distance calls decreased by 16.2 per cent and by 41.2 per cent in the past fi ve years. Since the base index year of 1997–98, the average price of long-distance calls for other business consumers has fallen by 58.6 per cent.
International calls
In 2004–05 the average price paid by other business consumers for international calls decreased by 21.9 per cent and by 46.8 per cent in the past fi ve years. Since the base index year of 1997–98, the average price of international calls for other business consumers has fallen by 78.6 per cent.
Fixed-to-mobile calls
In 2004–05 the average price paid by other business consumers for fi xed-to-mobile calls decreased by 21.2 per cent and by 32.7 per cent in the past fi ve years. Since the base index year of 1997–98, the average price of fi xed-to-mobile calls for other business consumers has fallen by 51.0 per cent.
Telco reports 1&2 2004-05_2006.iPart2:99 Part2:99Telco reports 1&2 2004-05_2006.iPart2:99 Part2:99 26/04/2006 3:12:12 PM26/04/2006 3:12:12 PM

ACCC telecommunications reports 2004–05 | REPORT 2100
5 Mobile telephony services indexThe mobile telephone services index is used to show how prices have changed, on average, for consumers of GSM and CDMA prepaid and post-paid mobile services.12 The index is calculated by estimating sample prices for bundles of mobile services that represent the usage patterns of consumers with very low, low, average, high and very high consumption of these services.13
The sub-indexes for post-paid and prepaid GSM and CDMA services are then aggregated to derive both an overall GSM and CDMA index and an overall price index for mobile services. The sub-indexes are weighted in the index according to the proportion of mobile services in operation for each service.
5.1 Main changes
Figure 5.1 shows that the overall index for mobile telephony services fell from 73.5 in 2003–04 to 64.0 in 2004–05 indicating a fall in the average price paid by consumers for mobile services of 13 per cent. Since 1997–98, the mobile services index has fallen from 100 to 64.0 a total decrease of 36 per cent.
Figure 5.1 Overall mobile telephony services index, 1997–98 to 2004–05
1997–98 1998–99 1999–00 2000–01 2001–02 2002–03 2003–04 2004–05
financial year
ind
ex
100.0 94.9
82.476.8 75.2 75.9 73.5
64.0
Source: data from Telstra, Optus, Orange, Primus, Vodafone, AAPT and Virgin Mobile; published plan and service information.
The main changes in the prices for mobile services are set out in table 5.1.
In 2004–05 prices for GSM services fell by 12.9 per cent and prices for CDMA services declined by 13.8 per cent.
12 GSM is defi ned as global system for mobile communications; CDMA is defi ned as code division multiple access services. Both are digital cellular networks.
13 Very low user group: occasional consumers making 1–2 calls a week; low user group: occasional to regular consumers making 5–7 calls a week; average user group: regular to frequent consumers making 2 calls a day; high user group: frequent consumers who make 4–5 calls a day; very high user group: very frequent consumers who make 8–10 calls a day.
Telco reports 1&2 2004-05_2006.iPart2:100 Part2:100Telco reports 1&2 2004-05_2006.iPart2:100 Part2:100 26/04/2006 3:12:12 PM26/04/2006 3:12:12 PM

ACCC telecommunications reports 2004–05 | REPORT 2 101
The decrease in mobile service prices was mainly due to the introduction of capped or ‘bucket’ plans by carriers which resulted in large falls in prices paid by consumers for post-paid services. In this regard, prices for GSM post-paid services fell by 15.3 per cent and prices for post-paid CDMA services fell by 14.2 per cent.
Prices paid by consumers for prepaid GSM services declined by 5.6 per cent and prepaid CDMA prices fell by 12.4 per cent. The larger fall for CDMA consumers was partially because Orange signifi cantly cut the price of its short messaging service (SMS) and per minute charges for prepaid customers.
Table 5.1 Percentage change in price indexes for mobile services, 2000–01 to 2004–05
2000–01 2001–02 2002–03 2003–04 2004–05
GSM
post-paid –5.4 –0.9 2.2 –1.0 –15.3
prepaid –13.7 –5.1 –0.9 –5.6 –5.6
all GSM –6.8 –2.2 1.1 –3.2 –12.9
CDMA
post-paid –2.0 –1.5 –14.2
prepaid –3.6 –4.3 –12.4
all CDMA –2.3 –2.2 –13.8
Overall mobiles –6.8 –2.0 0.9 –3.2 –13.0
Source: data from Telstra, Optus, Orange, Primus, Vodafone, AAPT and Virgin Mobile; published plan and service information.
In 2004–05, 51 per cent of the 16.2 million mobile services in operation14 were prepaid services. While this segment of the market grew signifi cantly in previous years, in 2004–05 growth slowed to 7.7 per cent (compared to 28 per cent in 2003–04 and 256 per cent in 1999–2000). Table 5.1 above shows how price falls for prepaid services on both the GSM and CDMA networks were greater than those for post-paid services up to 2003–04 refl ecting intense competition for new consumers in that market.
As the GSM and CDMA markets approach saturation, carriers appear to be again shifting focus to increase use among existing consumers. This has been particularly evident in the past reporting period with the introduction of so-called ‘bucket’ or capped plans which seem to be aimed at encouraging consumers to make more calls and text messages. These plans are predominantly, but not exclusively, offered on a post-paid or subscriber basis to consumers. This has led to larger falls in prices for post-paid consumers in 2004–05 compared to prepaid consumers.
14 GSM and CDMA services reported by carriers providing information for the purpose of this report.
Telco reports 1&2 2004-05_2006.iPart2:101 Part2:101Telco reports 1&2 2004-05_2006.iPart2:101 Part2:101 26/04/2006 3:12:13 PM26/04/2006 3:12:13 PM

ACCC telecommunications reports 2004–05 | REPORT 2102
5.2 GSM services
Figure 5.2 shows that the GSM price index fell from 73.6 in 2003–04 to 64.1 in 2004–05—a fall of 12.9 per cent—the largest decline in price in fi ve years.
The GSM post-paid services index fell from 78 to 66.1 in 2004–05—a decline of 15.3 per cent, while the index for GSM prepaid services fell from 68.6 to 64.8, a drop of 5.6 per cent over the same time.
Figure 5.2 GSM mobile services index, 1998–99 to 2004–05
post-paid
prepaid
all GSM
1998–99 1999–00 2000–01 2001–02 2002–03 2003–04 2004–05
financial year
ind
ex
Source: CRU estimates to 2000–01; data from Telstra, Optus, Vodafone, AAPT, Virgin Mobile, published plan and service information.
5.2.1 Post-paid prices
As noted in table 5.1, the GSM post-paid services index fell in 2004–05 by 15.3 per cent. As illustrated in fi gure 5.3 below, the largest price falls in 2004–05 were experienced by GSM post-paid users with the highest consumption of mobile services.
In this regard, prices for consumers in the very high user group fell by 21.3 per cent in 2004–05 and by a total 18.5 per cent over the past fi ve years. Prices for consumers in the high user group fell by 17.8 per cent in 2004–05 and by 22.2 per cent over the previous fi ve years. These GSM user groups benefi ted most from the introduction of capped plans which have resulted in lower prices for consumers with high consumption patterns.
Prices for consumers in the average and low user groups both fell by 3.2 per cent in 2004–05 and 13.2 and 11.1 per cent respectively over fi ve years while consumers in the lowest user group experienced a price fall of 1.3 per cent in 2004–05 and a price increase of 2.7 per cent over the past fi ve years. In 2004–05 there were few changes to pricing plans available to consumers with lower consumption patterns. Current capped plans offered by carriers are generally unsuitable and too costly for many consumers at this end of the market who do not make as many calls as consumers in other user groups.
Telco reports 1&2 2004-05_2006.iPart2:102 Part2:102Telco reports 1&2 2004-05_2006.iPart2:102 Part2:102 26/04/2006 3:12:13 PM26/04/2006 3:12:13 PM

ACCC telecommunications reports 2004–05 | REPORT 2 103
Figure 5.3 Year-on-year percentage change in the price index for GSM post-paid services by user group, 2000–01 to 2004–05
-5%
-10%
-15%
-20%
-25%
0%
5%
10%
very low low average high very high
1999–00 to 2000–01
2000–01 to 2001–02
2001–02 to 2002–03
2002–03 to 2003–04
2003–04 to 2004–05
Source: CRU estimates to 2000–01; data from Telstra, Optus, Vodafone, AAPT, Virgin Mobile, published plan and service information.
5.2.2 Prepaid prices
As shown in fi gure 5.2, the index for GSM prepaid services fell from 68.6 in 2003–04 to 64.8 in 2004–05 or by 5.6 per cent. Prices for GSM prepaid services have fallen by 16.1 per cent in the past fi ve years and by 35.2 per cent since the base 1997–98. In recent years the number of prepaid services in operation increased to roughly half of all SIO and prices for many prepaid users fell to levels similar to those available on post-paid plans.
Figure 5.4 below shows the year-on-year price changes for GSM prepaid services by user group for the past fi ve years. Prices for very low users of this service fell by 3.2 per cent in 2004–05 and by 38.1 per cent in the past fi ve years. Prices for this user group have fallen the most since the index base year due to large reductions in fi xed upfront costs such as handset prices and reductions in call prices over that time.
Prices for low and average users of GSM prepaid services have fallen by 6.0 and 8.0 per cent respectively in 2004–05 and by 13.7 and 14.8 per cent over the previous fi ve years. Similarly prices have fallen by 9.4 per cent in 2004–05 and by 17.8 per cent over fi ve years for consumers in the high user group. Higher falls for these groups in 2004–05 compared to the very low user group refl ect carrier competition for users with higher consumption patterns. The effect of Vodafone in particular offering the same plans (including capped plans) to its customers regardless of payment method has put downward pressure on GSM prepaid prices in 2004–05.
Telco reports 1&2 2004-05_2006.iPart2:103 Part2:103Telco reports 1&2 2004-05_2006.iPart2:103 Part2:103 26/04/2006 3:12:13 PM26/04/2006 3:12:13 PM

ACCC telecommunications reports 2004–05 | REPORT 2104
Figure 5.4 Year-on-year percentage change in the price index for GSM prepaid services by user group, 2000–01 to 2004–05
-5%
-10%
-15%
-20%
-25%
-30%
-35%
-40%
0%
5%
10%
very low low average high very high
1999–00 to 2000–01
2000–01 to 2001–02
2001–02 to 2002–03
2002–03 to 2003–04
2003–04 to 2004–05
Source: data from Telstra, Optus, Vodafone, AAPT, Virgin Mobile, published plan and service information.
5.3 CDMA services
The ACCC began reporting on prices paid by consumers for CDMA services in Australia in 2001–02. Telstra and Orange operate CDMA networks, with other carriers (including Optus) reselling this service to its customers.
Figure 5.5 below shows that the CDMA services index fell from 95.6 in 2003–04 to 82.3 in 2004–05 indicating an average fall in CDMA service prices of 13.8 per cent. Since 2001–02 prices of CDMA services have fallen by 17.7 per cent. In comparison GSM prices have fallen by 14.8 per cent over the same period.
Price falls for CDMA post-paid services exceeded those for prepaid services in 2004–05. In this regard CDMA post-paid prices fell by 14.2 per cent and CDMA prepaid prices fell by 12.4 per cent in 2004–05.
Figure 5.5 CDMA mobile services index, 2001–02 to 2004–05
post-paid
prepaid
all CDMA
financial year
ind
ex
2001–02 2002–03 2003–04 2004–05
Source: data from Telstra, Optus, Orange, Primus, published plan and service information.
Notes: base year is 2001–02.
Telco reports 1&2 2004-05_2006.iPart2:104 Part2:104Telco reports 1&2 2004-05_2006.iPart2:104 Part2:104 26/04/2006 3:12:13 PM26/04/2006 3:12:13 PM

ACCC telecommunications reports 2004–05 | REPORT 2 105
5.3.1 Post-paid prices
As noted above, the average price paid for CDMA post-paid services fell by 14.2 per cent in 2004–05. Since 2001–02 CDMA post-paid prices have fallen by 17.2 per cent.
Figure 5.6 below illustrates that, as with the price trend observed in 2004–05 for GSM post-paid services, the largest price falls in 2004–05 for CDMA post-paid services were for consumers with the highest consumption of mobile services who have benefi ted most from the introduction of capped plans.
In this regard, prices for consumers in the very high user group fell by 23.5 per cent in 2004–05 and by a total 31.3 per cent since 2001–02. Prices for consumers in the high user group fell by 10.8 per cent in 2004–05 and by 17.7 per cent over the previous four years.
Figure 5.6 Year-on-year percentage change in the price index for CDMA post-paid services by user group, 2001–02 to 2004–05
-5%
-10%
-15%
-20%
-25%
-30%
0%
5%
10%
very low low average high very high
2001–02 to 2002–03
2002–03 to 2003–04
2003–04 to 2004–05
Source: data from Telstra, Optus, Orange, Primus, published plan and service information.
Notes: base year is 2001–02.
Prices for consumers in the average and low user groups fell by 7.3 and 9.2 per cent respectively in 2004–05. These falls were higher than those for the same GSM user groups and refl ect the competitive pricing plans being offered by Orange in this part of the market. Consumers in the lowest user group experienced a price fall of 2.2 per cent in 2004–05 and a price increase of 1.7 per cent over the past four years. As with GSM consumers in this user group, current capped plans offered by carriers are generally unsuitable and too costly for many consumers at this end of the market who do not make as many calls as consumers in other user groups.
5.3.2 Prepaid prices
As shown in fi gure 5.5 above, the index for CDMA prepaid services fell from 92.1 in 2003–04 to 80.7 in 2004–05 or by 12.4 per cent. Prices for CDMA prepaid services have fallen by 19.3 per cent since the base 2001–02. In comparison GSM prepaid services have fallen by 11.6 per cent over the same time.
Figure 5.7 below shows the year-on-year price changes for CDMA prepaid services by user group since 2001–02. Prices for very low users of this service fell by 14.9 per cent in 2004–05 and by 23.2 per cent in the past four years.
Telco reports 1&2 2004-05_2006.iPart2:105 Part2:105Telco reports 1&2 2004-05_2006.iPart2:105 Part2:105 26/04/2006 3:12:14 PM26/04/2006 3:12:14 PM

ACCC telecommunications reports 2004–05 | REPORT 2106
Figure 5.7 Year-on-year percentage change in the price index for CDMA prepaid services by user group, 2001–02 to 2004–05
-5%
-10%
-15%
-20%
0%
5%
very low low average high very high
2001–02 to 2002–03
2002–03 to 2003–04
2003–04 to 2004–05
Source: data from Telstra, Optus, Orange, Primus, published plan and service information.
Notes: base year is 2001–02.
Prices for low and average users of CDMA prepaid services have fallen by 14.4 and 12.3 per cent respectively in 2004–05 and by 19.7 and 17.2 per cent since 2001–02. Similarly prices have fallen by 9.3 per cent in 2004–05 and by 15.2 per cent over four years for consumers in the high user group and by 11.0 per cent in 2004–05 and 21.3 per cent since 2001–02 for the very high user group.
These falls are greater than falls observed in the GSM prepaid index in 2004–5 and are due to the effect of falls in the pricing plans offered by Orange. In particular, between July 2004 and June 2005, Orange reduced its call prices for prepaid customers from 56 to 18 cents per minute and its SMS charges from 18 to 15 cents per message. Telstra, on the other hand, did not reduce its charges (25 cents per SMS and between 44 and 88 cents per minute for calls) for its CDMA prepaid customers in the same period.
5.4 Points contribution
The points contribution refl ects the number of points that the GSM and CDMA indexes make to the overall change in the mobile services index. Figure 5.8 illustrates that the mobile services index declined by 13.0 per cent in 2004–05, of which falls in the GSM services index contributed –11.3 points and falls in the CDMA services index accounted for –1.7 points. This refl ects that, while price falls for GSM and CDMA services were –12.9 per cent and –13.8 per cent respectively, the change in the GSM index is given more weight because more consumers use and spend money on GSM services compared to CDMA services.
Telco reports 1&2 2004-05_2006.iPart2:106 Part2:106Telco reports 1&2 2004-05_2006.iPart2:106 Part2:106 26/04/2006 3:12:14 PM26/04/2006 3:12:14 PM

ACCC telecommunications reports 2004–05 | REPORT 2 107
Figure 5.8 Points contribution by GSM and CDMA indexes to the mobile services index in 2004–05
-13.0
-11.3
-1.7
-15.0 -13.0 -11.0 -9.0 -7.0 -5.0 -3.0 -1.0 1.0
all mobiles
GSM
CDMA
points contribution
Source: data from Telstra, Optus, AAPT, Orange, Primus, Vodafone and Virgin Mobile, published plan and service information.
5.5 Analysis of price changes for mobile services in 2004–05
To make a mobile call, consumers require a handset, connection and ongoing access to a mobile network. These are typically sold through a wide range of pricing plans.15
In 2004–05 carriers continued to offer consumers a wide range of prepaid and post-paid pricing plans, from simplifi ed call plans, such as those offering fl at call rates regardless of the time of day to plans with complex discounts, handset repayment plans, credits and free call and message options.
The main reason the prices of mobile services have fallen in 2004–05 is the wide-spread introduction by carriers of capped or ‘bucket’ plans into the market. With the growth rate of new mobile phone users slowing, carriers are offering plans that seem to encourage existing customers to increase their usage. For average to high users of mobile services, these plans can have the effect of reducing the overall price paid for mobile calls, provided the cap is not exceeded. Interestingly, the per minute charges under capped plans are typically higher than had previously been offered in plans to consumers with higher calling patterns so fewer calls are needed to reach the cap.
New competitors in the mobile market have also led the way in cutting per minute call and SMS prices which have contributed to falls in prices. For example, Orange offers fl at 18 cent per minute call rates and SMS rates up to 10 cents lower than Telstra in its CDMA pricing plans.
Another new pricing trend is for a carrier to offer one set of pricing plans regardless of whether the customer buys the service on a prepaid or post-paid basis. Vodafone customers, for example, can choose a plan and then choose their preferred payment method. This is signifi cant because historically, prepaid services have been priced at high levels compared to post-paid services. The effect of this pricing policy has already been observed in lower prices for prepaid consumers.
15 While consumers are able to sign up to plans without handsets, the CRU uses pricing plans with a handset as it is a basic component for using a mobile service.
Telco reports 1&2 2004-05_2006.iPart2:107 Part2:107Telco reports 1&2 2004-05_2006.iPart2:107 Part2:107 26/04/2006 3:12:14 PM26/04/2006 3:12:14 PM

ACCC telecommunications reports 2004–05 | REPORT 2108
The ACCC also notes that other factors continue to contribute to falling mobile prices for consumers such as the continued improvements in handset technology (e.g. cameras, MMS, radios and polyphonic ring tones) and providing these new handsets at a relatively low cost to consumers. Other contributing factors to price decreases are the scrapping of network connection charges with most carriers in 2004–05 no longer charging new customers to connect to their networks and the prevalence of complex discount options within individual plans. Proper use of these options depend on consumers having a good knowledge of their calling patterns—for example, choosing between discounted calls to fi xed-line numbers, or other mobile numbers or cheaper SMS calls. Other examples of discounts include ‘loyalty bonuses’, further percentage discounts at set expenditure thresholds and discounts if consumers also bundle other products from the carrier such as internet or fi xed-line services.
Telco reports 1&2 2004-05_2006.iPart2:108 Part2:108Telco reports 1&2 2004-05_2006.iPart2:108 Part2:108 26/04/2006 3:12:14 PM26/04/2006 3:12:14 PM

ACCC telecommunications reports 2004–05 | REPORT 2 109
6 Tables
Table 6.1 Telecommunications services index, 1997–98 to 2004–05
1997–98 1998–99 1999–00 2000–01 2001–02 2002–03 2003–04 2004–05
PSTN services 100.0 95.0 88.4 83.2 81.0 81.9 82.1 81.1
mobile services 100.0 94.9 82.4 76.8 75.2 75.9 73.5 64.0
All telecommunications
services 100.0 95.0 86.4 81.1 79.1 79.9 79.0 73.8
Source: data obtained from Telstra, SingTel Optus, AAPT, Primus, Vodafone, Hutchison Telecommunications, Virgin Mobile, pricing plans and other published information.
Table 6.2 PSTN services index by service; residential and business, 1997–98 to 2004–05
1997–98 1998–99 1999–00 2000–01 2001–02 2002–03 2003–04 2004–05
All PSTN
basic access 100 99.2 108.9 125.4 142.0 159.6 170.5 179.4
local calls 100 99.5 90.3 74.1 65.4 62.9 60.8 56.1
national long-distance 100 93.6 84.7 79.4 72.5 69.1 67.8 65.7
international 100 79.3 57.9 48.0 40.7 38.3 36.1 34.5
fi xed-to-mobile 100 94.7 87.3 81.9 79.2 77.3 75.6 72.7
All PSTN 100 95.0 88.4 83.2 81.0 81.9 82.1 81.1
PSTN residential
basic access 100 99.4 110.4 128.1 147.4 171.9 184.4 198.3
local calls 100 99.0 88.7 74.1 66.0 65.2 62.7 55.7
national long-distance 100 94.8 85.0 82.4 75.4 73.6 74.2 72.9
international 100 80.2 59.1 50.5 42.6 41.1 38.7 37.3
fi xed-to-mobile 100 95.6 87.7 86.7 82.6 86.7 86.8 85.2
All residential 100 95.3 88.2 85.1 83.3 87.5 88.7 88.4
PSTN business
basic access 100 98.9 106.4 120.9 133.0 138.5 146.6 148.0
local calls 100 100.5 92.9 74.1 64.4 58.5 57.2 56.8
national long-distance 100 91.7 84.3 74.5 67.8 62.0 57.8 54.5
international 100 77.4 55.4 41.4 35.9 30.8 29.0 26.8
fi xed-to-mobile 100 94.1 86.9 78.3 76.9 69.5 66.2 61.9
All business 100 94.7 88.5 80.3 77.7 73.2 72.0 69.9
Source: data obtained from Telstra, SingTel Optus, AAPT, Primus, pricing plans and other published information.
Telco reports 1&2 2004-05_2006.iPart2:109 Part2:109Telco reports 1&2 2004-05_2006.iPart2:109 Part2:109 26/04/2006 3:12:14 PM26/04/2006 3:12:14 PM

ACCC telecommunications reports 2004–05 | REPORT 2110
Table 6.3 PSTN business services index; small and other business, 1997–98 to 2004–05
1997–98 1998–99 1999–00 2000–01 2001–02 2002–03 2003–04 2004–05
Small business
basic access 100 94.7 105.6 114.6 133.2 143.2 154.2 176.6
local calls 100 107.2 98.4 75.5 73.2 70.5 68.4 80.6
national long-distance 100 98.2 89.5 86.4 80.7 75.2 79.2 87.4
international 100 90.7 59.7 39.7 34.4 31.9 30.5 34.8
fi xed-to-mobile 100 92.4 87.4 79.9 79.3 75.9 77.0 92.3
All small business 100 97.9 90.8 82.9 84.9 85.9 88.6 102.6
Other business
basic access 100 100.5 106.7 123.1 132.8 133.7 138.7 118.2
local calls 100 98.6 91.4 73.7 62.3 55.6 54.7 44.4
national long-distance 100 89.4 82.5 70.4 63.8 58.0 49.4 41.4
international 100 69.0 51.8 40.2 34.9 29.4 27.4 21.4
fi xed-to-mobile 100 94.5 86.8 77.9 76.4 68.0 62.2 49.0
All other business 100 93.7 87.8 79.5 75.8 69.3 65.4 53.5
PSTN business 100 94.7 88.5 80.3 77.7 73.2 72.0 69.9
Source: data obtained from Telstra, SingTel Optus, AAPT, Primus, pricing plans and other published information.
Table 6.4 Mobile telephony services index, 1997–98 to 2004–05
1997–98 1998–99 1999–00 2000–01 2001–02 2002–03 2003–04 2004–05
GSM
post-paid 100 94.9 82.2 77.7 77.0 78.7 78.0 66.1
prepaid 100 89.6 77.3 73.3 72.7 68.6 64.8
All GSM 100 94.9 82.4 76.8 75.2 76.0 73.6 64.1
CDMA
post-paid 100 98.0 96.6 82.8
prepaid 100 96.4 92.3 80.7
All CDMA 100 97.7 95.6 82.3
All mobile services 100 94.9 82.4 76.8 75.2 75.9 73.5 64.0
Source: data obtained from Telstra, SingTel Optus, AAPT, Vodafone, Hutchison Telecommunications, Virgin Mobile, pricing plans and other published information.
Telco reports 1&2 2004-05_2006.iPart2:110 Part2:110Telco reports 1&2 2004-05_2006.iPart2:110 Part2:110 26/04/2006 3:12:14 PM26/04/2006 3:12:14 PM

ACCC telecommunications reports 2004–05 | REPORT 2 111
Table 6.5 Mobile telephony services index by network type and user group, 1997–98 to 2004–05
1997–98 1998–99 1999–00 2000–01 2001–02 2002–03 2003–04 2004–05
GSM post-paid
very low 100 80.5 57.2 47.6 44.0 46.0 49.6 48.9
low 100 92.4 73.9 63.6 59.6 59.5 58.4 56.5
average 100 98.3 84.0 74.4 67.7 67.0 66.7 64.6
high 100 93.3 81.5 76.5 73.6 72.7 72.4 59.5
very high 100 95.9 84.3 82.0 83.7 86.7 84.9 66.8
GSM prepaid
very low 100 92.0 62.3 41.2 41.5 39.8 38.6
low 100 87.7 78.7 78.9 76.9 72.3 67.9
average 100 88.3 79.8 76.9 78.4 73.9 68.0
high 100 90.5 85.7 86.4 83.4 77.8 70.5
very high 100 89.4 80.1 83.4 85.7 79.1 78.9
CDMA post-paid
very low 100 107.9 104.0 101.7
low 100 102.7 106.4 96.6
average 100 106.3 110.1 102.1
high 100 88.7 92.3 82.3
very high 100 97.2 89.9 68.7
CDMA prepaid
very low 100 97.6 90.3 76.8
low 100 99.3 93.9 80.3
average 100 97.6 94.5 82.8
high 100 94.3 93.4 84.8
very high 100 91.8 89.3 78.7
Source: data obtained from Telstra, SingTel Optus, AAPT, Vodafone, Hutchison Telecommunications, Virgin Mobile, pricing plans and other published information.
Telco reports 1&2 2004-05_2006.iPart2:111 Part2:111Telco reports 1&2 2004-05_2006.iPart2:111 Part2:111 26/04/2006 3:12:15 PM26/04/2006 3:12:15 PM
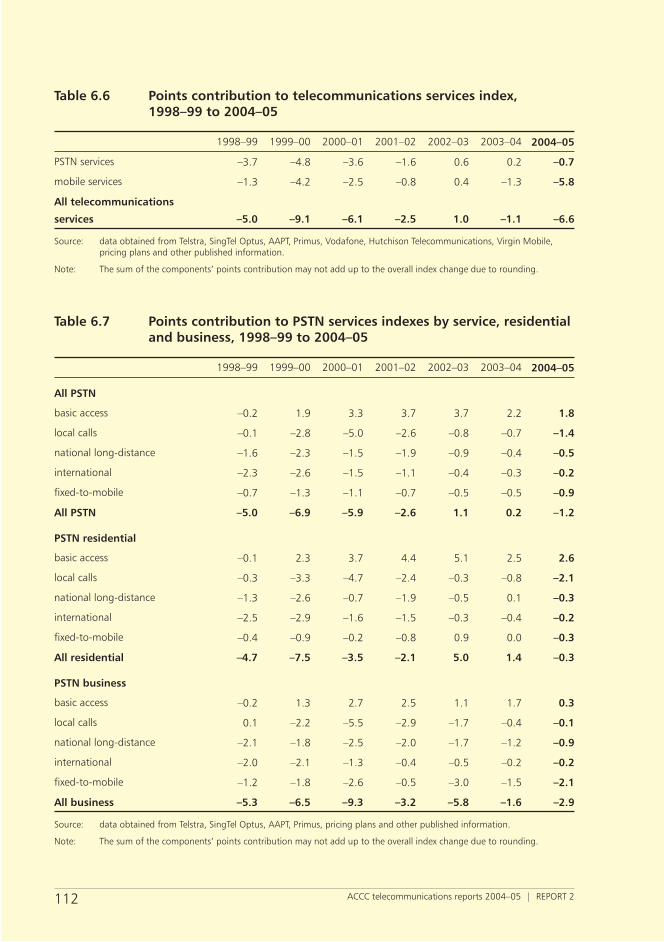
ACCC telecommunications reports 2004–05 | REPORT 2112
Table 6.6 Points contribution to telecommunications services index, 1998–99 to 2004–05
1998–99 1999–00 2000–01 2001–02 2002–03 2003–04 2004–05
PSTN services –3.7 –4.8 –3.6 –1.6 0.6 0.2 –0.7
mobile services –1.3 –4.2 –2.5 –0.8 0.4 –1.3 –5.8
All telecommunications
services –5.0 –9.1 –6.1 –2.5 1.0 –1.1 –6.6
Source: data obtained from Telstra, SingTel Optus, AAPT, Primus, Vodafone, Hutchison Telecommunications, Virgin Mobile, pricing plans and other published information.
Note: The sum of the components’ points contribution may not add up to the overall index change due to rounding.
Table 6.7 Points contribution to PSTN services indexes by service, residential and business, 1998–99 to 2004–05
1998–99 1999–00 2000–01 2001–02 2002–03 2003–04 2004–05
All PSTN
basic access –0.2 1.9 3.3 3.7 3.7 2.2 1.8
local calls –0.1 –2.8 –5.0 –2.6 –0.8 –0.7 –1.4
national long-distance –1.6 –2.3 –1.5 –1.9 –0.9 –0.4 –0.5
international –2.3 –2.6 –1.5 –1.1 –0.4 –0.3 –0.2
fi xed-to-mobile –0.7 –1.3 –1.1 –0.7 –0.5 –0.5 –0.9
All PSTN –5.0 –6.9 –5.9 –2.6 1.1 0.2 –1.2
PSTN residential
basic access –0.1 2.3 3.7 4.4 5.1 2.5 2.6
local calls –0.3 –3.3 –4.7 –2.4 –0.3 –0.8 –2.1
national long-distance –1.3 –2.6 –0.7 –1.9 –0.5 0.1 –0.3
international –2.5 –2.9 –1.6 –1.5 –0.3 –0.4 –0.2
fi xed-to-mobile –0.4 –0.9 –0.2 –0.8 0.9 0.0 –0.3
All residential –4.7 –7.5 –3.5 –2.1 5.0 1.4 –0.3
PSTN business
basic access –0.2 1.3 2.7 2.5 1.1 1.7 0.3
local calls 0.1 –2.2 –5.5 –2.9 –1.7 –0.4 –0.1
national long-distance –2.1 –1.8 –2.5 –2.0 –1.7 –1.2 –0.9
international –2.0 –2.1 –1.3 –0.4 –0.5 –0.2 –0.2
fi xed-to-mobile –1.2 –1.8 –2.6 –0.5 –3.0 –1.5 –2.1
All business –5.3 –6.5 –9.3 –3.2 –5.8 –1.6 –2.9
Source: data obtained from Telstra, SingTel Optus, AAPT, Primus, pricing plans and other published information.
Note: The sum of the components’ points contribution may not add up to the overall index change due to rounding.
Telco reports 1&2 2004-05_2006.iPart2:112 Part2:112Telco reports 1&2 2004-05_2006.iPart2:112 Part2:112 26/04/2006 3:12:15 PM26/04/2006 3:12:15 PM
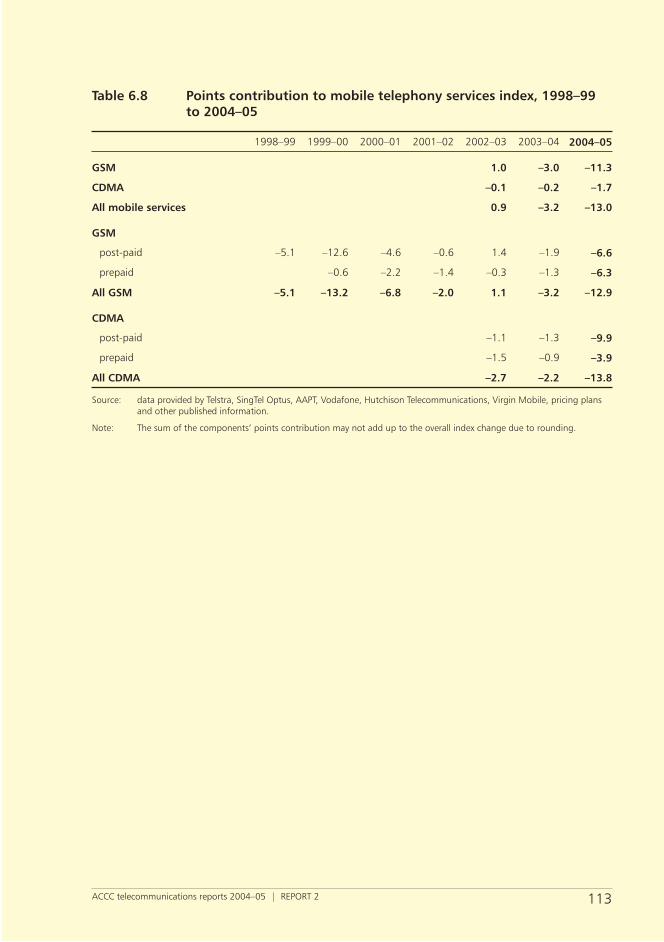
ACCC telecommunications reports 2004–05 | REPORT 2 113
Table 6.8 Points contribution to mobile telephony services index, 1998–99 to 2004–05
1998–99 1999–00 2000–01 2001–02 2002–03 2003–04 2004–05
GSM 1.0 –3.0 –11.3
CDMA –0.1 –0.2 –1.7
All mobile services 0.9 –3.2 –13.0
GSM
post-paid –5.1 –12.6 –4.6 –0.6 1.4 –1.9 –6.6
prepaid –0.6 –2.2 –1.4 –0.3 –1.3 –6.3
All GSM –5.1 –13.2 –6.8 –2.0 1.1 –3.2 –12.9
CDMA
post-paid –1.1 –1.3 –9.9
prepaid –1.5 –0.9 –3.9
All CDMA –2.7 –2.2 –13.8
Source: data provided by Telstra, SingTel Optus, AAPT, Vodafone, Hutchison Telecommunications, Virgin Mobile, pricing plans and other published information.
Note: The sum of the components’ points contribution may not add up to the overall index change due to rounding.
Telco reports 1&2 2004-05_2006.iPart2:113 Part2:113Telco reports 1&2 2004-05_2006.iPart2:113 Part2:113 26/04/2006 3:12:15 PM26/04/2006 3:12:15 PM

ACCC telecommunications reports 2004–05114
ACCC contacts
ACCC Infocentre
for all business and consumer inquiries
infoline 1300 302 502
website www.accc.gov.au
ACT (national offi ce)PO Box 1199DICKSON ACT 2602Tel: (02) 6243 1111Fax: (02) 6243 1199
New South WalesGPO Box 3648SYDNEY NSW 2001Tel: (02) 9230 9133Fax: (02) 9223 1092
VictoriaGPO Box 520JMELBOURNE VIC 3001Tel: (03) 9290 1800Fax: (03) 9663 3699
South AustraliaGPO Box 922ADELAIDE SA 5001Tel: (08) 8213 3444Fax: (08) 8410 4155
North QueenslandPO Box 2016TOWNSVILLE QLD 4810Tel: (07) 4729 2666Fax: (07) 4721 1538
QueenslandPO Box 10048Adelaide Street Post Offi ceBRISBANE QLD 4000Tel: (07) 3835 4666Fax: (07) 3832 0372
Western AustraliaPO Box 6381EAST PERTH WA 6892Tel: (08) 9325 0600Fax: (08) 9325 5976
TasmaniaGPO Box 1210HOBART TAS 7001Tel: (03) 6215 9333Fax: (03) 6234 7796
Northern TerritoryGPO Box 3056DARWIN NT 0801Tel: (08) 8946 9666Fax: (08) 8946 9600
Telco reports 1&2 2004-05_2006.iPart2:114 Part2:114Telco reports 1&2 2004-05_2006.iPart2:114 Part2:114 26/04/2006 4:18:11 PM26/04/2006 4:18:11 PM