
The development of an operational second dimensional value ... · opinions. The Kompas system works...
20
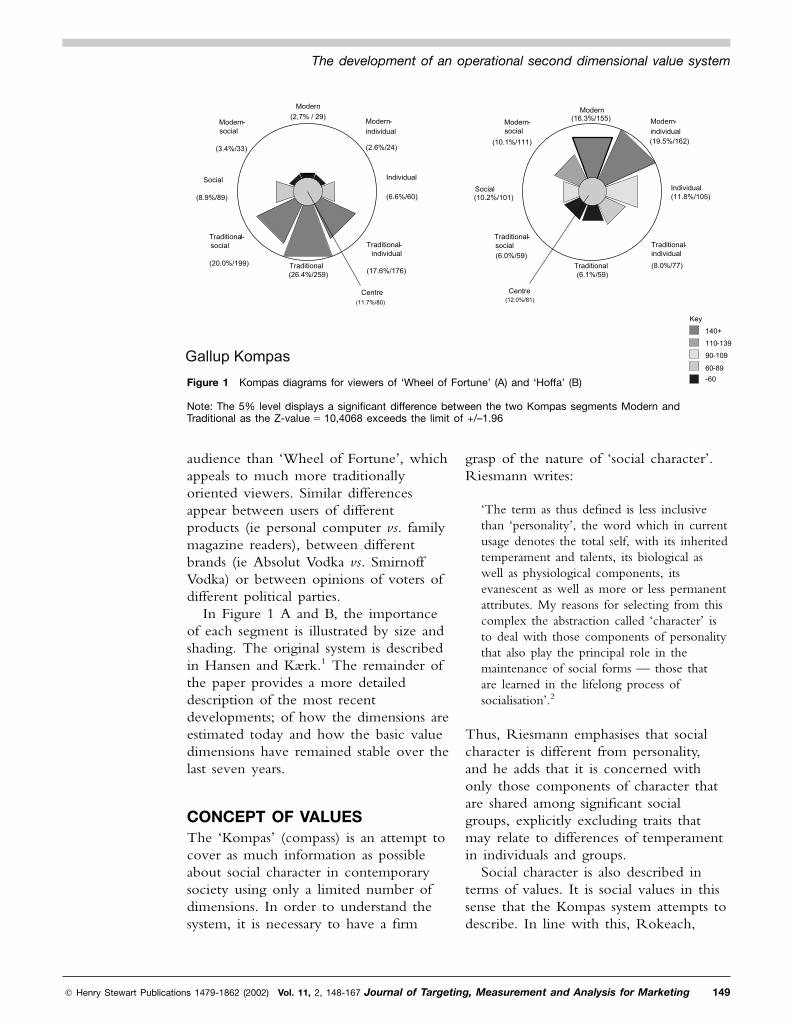
Basically, the Kompas system divides the world (described along the two previously mentioned dimensions) into nine segments, as shown in Figure 1. Gallup used Kompas for the viewers of the television programme ‘Wheel of Fortune’ (1A) (gross rating points (GRP) in segments) and the film ‘Hoffa’ (1B). The much more traditional profile describing ‘Wheel of Fortune’ viewers as compared with the viewers of the more serious movie is obvious. Looking at the total population, the nine segments are practically equal in size. The difference between the viewers of the two programmes is obvious. ‘Hoffa’ appeals to a more modern and individually oriented INTRODUCTION Since its introduction in 1994, Kompas has been a very successful value measurement system used for media planning, marketing strategy formulation and many other purposes. It has been used particularly in the Nordic countries, Poland and Israel, and is coming into use in other countries too. The Kompas system is unique in the sense that it is based upon people’s everyday opinions and interpreted in terms of underlying values. Furthermore, it is easy to use because it works with an easily interpretable two-dimensional solution — traditional vs. modern opinions, and social vs. individual values. 148 Journal of Targeting, Measurement and Analysis for Marketing Vol. 11, 2, 148–167 Henry Stewart Publications 1479-1862 (2002) The development of an operational second dimensional value system Received (in revised form): 8th July, 2002 Flemming Hansen is a professor at the Copenhagen Business School, and head of Forum for Advertising Research. From 1973 to 1989 he was part-owner and chairman of the board for AIM Research in Denmark. He was vice president for ESOMAR and EMAC. He is advisor to the Danish Circulation Board (Oplagskontrollen), the Ministry of Communication and a committee set up by the Danish Prime Minister. He is member of the board for Gallup AS — a part of Taylor Nilson/Sofres. He has written more than 100 articles in international journals and proceedings and is author of several books on consumer behaviour and communication. Rolf Randrup is responsible for the development and administration of the Danish Media Index with 24,000 interviews annually. A Bachelor in Economics from the Aarhus School of Business, he has been involved in market research at Gallup Denmark for more than 40 years. He has written a number of articles and contributed to articles and textbooks. He has given presentations at ESOMAR, the Advertising Research Foundation and Worldwide Readership Research Symposium. Regin Reinert is responsible for the technical development of Gallup Kompas. He is a Master of Science in statistics, University of Copenhagen and has published articles about Danish voters in the EU context. Abstract Sociologists, linguists and market researchers have studied values and lifestyles for decades. In the present paper, the authors look at the motivation behind their approaches and suggest the presence of a general communality for the solutions, which, in turn, made it possible to discern basic evaluation dimensions common for all of these. They further suggest a general two-dimensional solution and demonstrate how it compares with other systems and how it functions. Flemming Hansen Forum for Advertising Research, Copenhagen Business School, Solbjerg Plads 3, DK-2000 Frederiksberg, Denmark. Tel: 45 3815 2100; Fax: 45 3815 2101; e-mail: [email protected]
Transcript of The development of an operational second dimensional value ... · opinions. The Kompas system works...
Basically, the Kompas system dividesthe world (described along the twopreviously mentioned dimensions) intonine segments, as shown in Figure 1.Gallup used Kompas for the viewers ofthe television programme ‘Wheel ofFortune’ (1A) (gross rating points (GRP)in segments) and the film ‘Hoffa’ (1B).The much more traditional profiledescribing ‘Wheel of Fortune’ viewers ascompared with the viewers of the moreserious movie is obvious. Looking at thetotal population, the nine segments arepractically equal in size. The differencebetween the viewers of the twoprogrammes is obvious. ‘Hoffa’ appeals toa more modern and individually oriented
INTRODUCTIONSince its introduction in 1994, Kompashas been a very successful valuemeasurement system used for mediaplanning, marketing strategy formulationand many other purposes. It has beenused particularly in the Nordic countries,Poland and Israel, and is coming into usein other countries too. The Kompassystem is unique in the sense that it isbased upon people’s everyday opinionsand interpreted in terms of underlyingvalues. Furthermore, it is easy to usebecause it works with an easilyinterpretable two-dimensional solution —traditional vs. modern opinions, andsocial vs. individual values.
148 Journal of Targeting, Measurement and Analysis for Marketing Vol. 11, 2, 148–167 � Henry Stewart Publications 1479-1862 (2002)
The development of an operationalsecond dimensional value systemReceived (in revised form): 8th July, 2002
Flemming Hansenis a professor at the Copenhagen Business School, and head of Forum for Advertising Research. From 1973 to 1989 he waspart-owner and chairman of the board for AIM Research in Denmark. He was vice president for ESOMAR and EMAC. He isadvisor to the Danish Circulation Board (Oplagskontrollen), the Ministry of Communication and a committee set up by theDanish Prime Minister. He is member of the board for Gallup AS — a part of Taylor Nilson/Sofres. He has written more than100 articles in international journals and proceedings and is author of several books on consumer behaviour andcommunication.
Rolf Randrupis responsible for the development and administration of the Danish Media Index with 24,000 interviews annually. A Bachelorin Economics from the Aarhus School of Business, he has been involved in market research at Gallup Denmark for more than40 years. He has written a number of articles and contributed to articles and textbooks. He has given presentations atESOMAR, the Advertising Research Foundation and Worldwide Readership Research Symposium.
Regin Reinertis responsible for the technical development of Gallup Kompas. He is a Master of Science in statistics, University ofCopenhagen and has published articles about Danish voters in the EU context.
Abstract Sociologists, linguists and market researchers have studied values andlifestyles for decades. In the present paper, the authors look at the motivation behindtheir approaches and suggest the presence of a general communality for the solutions,which, in turn, made it possible to discern basic evaluation dimensions common for allof these. They further suggest a general two-dimensional solution and demonstrate howit compares with other systems and how it functions.
Flemming HansenForum for AdvertisingResearch,Copenhagen BusinessSchool, Solbjerg Plads 3,DK-2000 Frederiksberg,Denmark.
Tel: �45 3815 2100;Fax: �45 3815 2101;e-mail: [email protected]
grasp of the nature of ‘social character’.Riesmann writes:
‘The term as thus defined is less inclusivethan ‘personality’, the word which in currentusage denotes the total self, with its inheritedtemperament and talents, its biological aswell as physiological components, itsevanescent as well as more or less permanentattributes. My reasons for selecting from thiscomplex the abstraction called ‘character’ isto deal with those components of personalitythat also play the principal role in themaintenance of social forms — those thatare learned in the lifelong process ofsocialisation’.2
Thus, Riesmann emphasises that socialcharacter is different from personality,and he adds that it is concerned withonly those components of character thatare shared among significant socialgroups, explicitly excluding traits thatmay relate to differences of temperamentin individuals and groups.
Social character is also described interms of values. It is social values in thissense that the Kompas system attempts todescribe. In line with this, Rokeach,
audience than ‘Wheel of Fortune’, whichappeals to much more traditionallyoriented viewers. Similar differencesappear between users of differentproducts (ie personal computer vs. familymagazine readers), between differentbrands (ie Absolut Vodka vs. SmirnoffVodka) or between opinions of voters ofdifferent political parties.
In Figure 1 A and B, the importanceof each segment is illustrated by size andshading. The original system is describedin Hansen and Kærk.1 The remainder ofthe paper provides a more detaileddescription of the most recentdevelopments; of how the dimensions areestimated today and how the basic valuedimensions have remained stable over thelast seven years.
CONCEPT OF VALUESThe ‘Kompas’ (compass) is an attempt tocover as much information as possibleabout social character in contemporarysociety using only a limited number ofdimensions. In order to understand thesystem, it is necessary to have a firm
� Henry Stewart Publications 1479-1862 (2002) Vol. 11, 2, 148-167 Journal of Targeting, Measurement and Analysis for Marketing 149
The development of an operational second dimensional value system
Figure 1 Kompas diagrams for viewers of ‘Wheel of Fortune’ (A) and ‘Hoffa’ (B)
Note: The 5% level displays a significant difference between the two Kompas segments Modern andTraditional as the Z-value � 10,4068 exceeds the limit of +/–1.96
Modern
(2,7% / 29)Modern-
(2.6%/24)
individual
Individual
(6.6%/60)
Traditional-
(17.6%/176)
individual
Traditional
(26.4%/259)
Traditional-
(20.0%/199)
social
Social
(8.9%/89)
Modern-
(3.4%/33)
social
Centre
(11.7%/80)
Modern(16.3%/155) Modern-
(19.5%/162)
individual
Individual
(11.8%/105)
Traditional-
(8.0%/77)
individual
Traditional
(6.1%/59)
Traditional-
(6.0%/59)
social
Social
(10.2%/101)
Modern-
(10.1%/111)
social
Centre
(12.0%/81)
-60
60-89
90-109
110-139
140+
Key
Gallup Kompas
systems. One such set is described in‘The study of values’,5 which wassubsequently used in many empiricalstudies. Another instrument is ‘theRokeach Value Survey’,6 whererespondents were asked to rank 36 valuesin Rokeach terms: 18 instrumental and18 terminal.
With lifestyle research in the USA as apoint of departure,7 values and lifestyle(VALS)8 and VALS 2 have been usedfrequently. This system employsvalue-related statements to be rated onLikert Scales. European systems like Riskand other related systems have furtherbeen inspired by this system.
In addition, the list of values (LOV),which was developed at the SurveyResearch Center at the University ofMichigan,9 is in common use. The latterhas mainly been used in a consumerbehaviour context.10 The relationshipsbetween consumer values and opinions atdifferent levels have been studied withthe use of laddering.11 Here, theinterrelatedness of consumer perceptionsat different levels such as basic motives,values, intermediate goals and perceptionsis documented.
More recently, the Schwartz Value(SVI)12 has been introduced to consumerbehaviour research.13 Departing from thework by Rokeach this inventory wasdeveloped on the basis of several decadesof theoretical and empirical work inpsychology, social psychology andsociology. Its theoretical starting point isto view values as representingmotivations, because they are criteriaused by individuals to select and justifyactions, based upon which one evaluatespeople, things, oneself and events. Tenmotivational domains of values aresuggested and represented across twodimensions. The first dimension reflectsopinion to change vs. conservation andthe other is labelled self-transcendence vs.self-enhancement. The system has been
who promoted the idea of valuesinfluencing all human life domains,viewed values as ‘centrally held enduringbeliefs that guide actions and judgementsin specific situations and, beyondimmediate goals, in more ultimate statesof existence’.3
Later, Schwartz and Bilsky,4
summarised five main features of values,and outlined the common backgroundfor social science research on values.
Thus values are:
— concepts or beliefs— about desirable states or behaviour— that transcend specific situations,— guide the selection or evaluation of
persons, behaviour and events, and— ordered by their relative importance.
When describing a phenomenon likesocial values, different stylistic approachesmay be used, and different degrees ofdetail may be included. A drawing of thehuman body by Albrecht Durer isremarkably different from a late drawingof the same object by Henri Matisse. Noobserver will deny that two suchdrawings represent the samephenomenon, but they do so with aremarkable degree of difference in styleand detail with the Durer version beingmuch more naturalistic and detailed.With the Kompas system, we are lookingfor a Matisse-like representation of socialcharacter. The inclusion of the detailscontained in the minute drawing byDurer requires a much larger number ofpoints to be included in the description.This may be useful for some purposes,thus we have attached a more detailedKompas Value Map (Table 6) to theKompas value system.
EARLY VALUE SYSTEMSMany measurement systems have beendeveloped for measuring individual value
150 Journal of Targeting, Measurement and Analysis for Marketing Vol. 11, 2, 148–167 � Henry Stewart Publications 1479-1862 (2002)
Hansen, Randrup and Reinert
— social orientation, altruistic or openmindedness vs. individual, egoistic orclosed mindedness.
In the process, it was learned thatcombining attitudes, interests, behaviourand opinions (AIO) in a simultaneousfactor analysis is not recommended.Generally, some dimensions are foundreflecting activities, some reflectinginterest, some behaviour and still othersreflecting opinions. Even though thereare relationships between measurementsat the three levels in a factor analysis,they do not work well together.Consequently, to define a stable andmeaningful value representation in a fewdimensions, a choice has to be madewhether to use activities, interests oropinions. The Kompas system workswith opinions.
Thus, the Kompas system is basedupon the measurement of opinions ratherthan the basic values used in theRokeach system and interests andactivities used in the traditional lifestyleapproach.20
Moreover, the Kompas system usesonly two dimensions. It could be arguedthat a three-dimensional solution wouldbe more appropriate statistically. In manyanalyses a third significant dimensionappears. Sometimes reflecting egoism vs.altruism. Integrating the Kompas valuediagram (Figure 1) into the Kompassystem itself makes up, however, for thelack of detail due to focusing on onlythe two first major dimensions.
applied both in national andcross-cultural studies.14–16
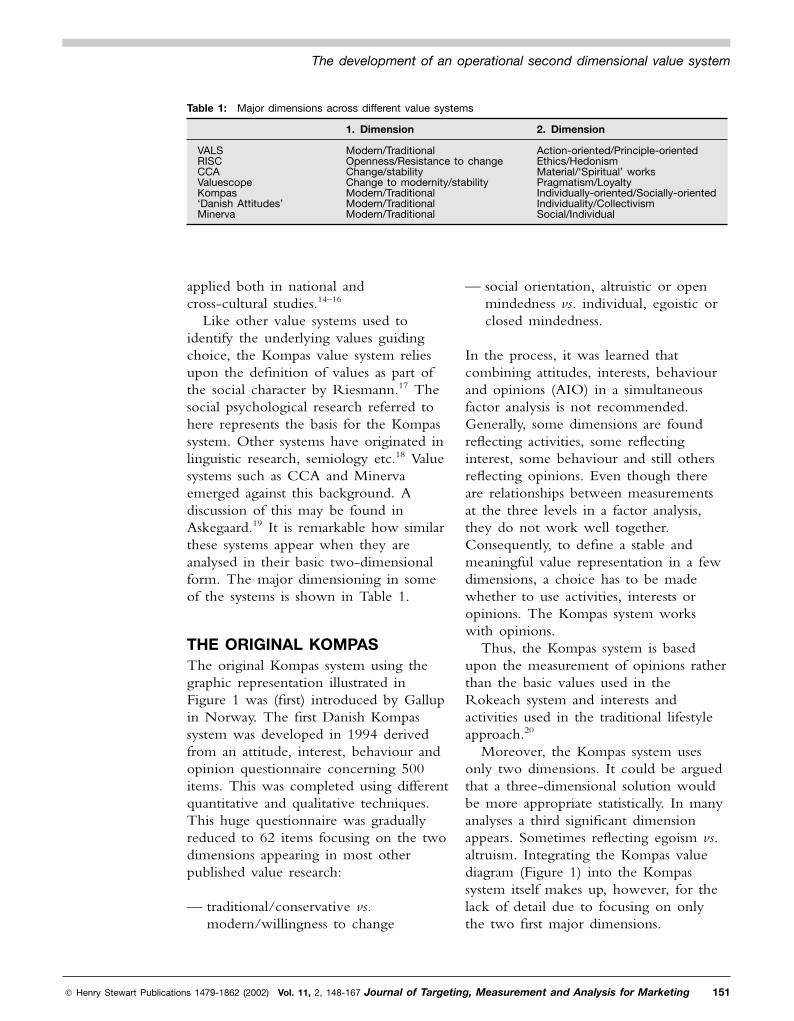
Like other value systems used toidentify the underlying values guidingchoice, the Kompas value system reliesupon the definition of values as part ofthe social character by Riesmann.17 Thesocial psychological research referred tohere represents the basis for the Kompassystem. Other systems have originated inlinguistic research, semiology etc.18 Valuesystems such as CCA and Minervaemerged against this background. Adiscussion of this may be found inAskegaard.19 It is remarkable how similarthese systems appear when they areanalysed in their basic two-dimensionalform. The major dimensioning in someof the systems is shown in Table 1.
THE ORIGINAL KOMPASThe original Kompas system using thegraphic representation illustrated inFigure 1 was (first) introduced by Gallupin Norway. The first Danish Kompassystem was developed in 1994 derivedfrom an attitude, interest, behaviour andopinion questionnaire concerning 500items. This was completed using differentquantitative and qualitative techniques.This huge questionnaire was graduallyreduced to 62 items focusing on the twodimensions appearing in most otherpublished value research:
— traditional/conservative vs.modern/willingness to change
� Henry Stewart Publications 1479-1862 (2002) Vol. 11, 2, 148-167 Journal of Targeting, Measurement and Analysis for Marketing 151
The development of an operational second dimensional value system
Table 1: Major dimensions across different value systems
1. Dimension 2. Dimension
VALSRISCCCAValuescopeKompas‘Danish Attitudes’Minerva
Modern/TraditionalOpenness/Resistance to changeChange/stabilityChange to modernity/stabilityModern/TraditionalModern/TraditionalModern/Traditional
Action-oriented/Principle-orientedEthics/HedonismMaterial/‘Spiritual’ worksPragmatism/LoyaltyIndividually-oriented/Socially-orientedIndividuality/CollectivismSocial/Individual
known that the dimensions along whichthe evaluations were made haveremained very stable,21,22 whereas theaverage scores for the respondentsfluctuate from year to year. On theindividual/social dimension, fluctuationsare minor and in the long run they tendto counteract each other. On themodern/traditional dimension, however,a systematic move in the moderndirection can be observed.
A particular reason for the usefulnessof Kompas is the sensitivity of themeasurements. Sensitivity has beenattained by deleting questions of themore obvious nature with whicheverybody tends to agree. If a person isasked if they think it is a good idea tobe ‘modern’ the majority would agree,and there is not much discriminationamong the respondents. If people areasked if IT generates a lot of trouble forthem, a much more sensitive response isobtained and, as it turns out, the answersto this question basically reflect the same
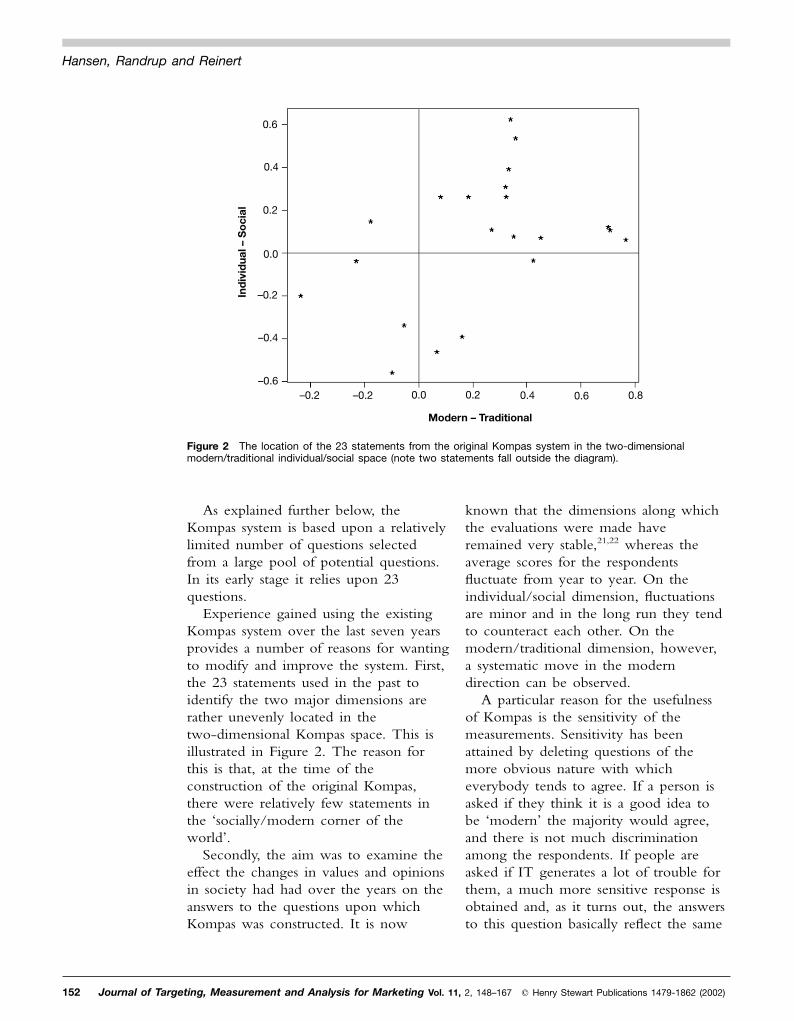
As explained further below, theKompas system is based upon a relativelylimited number of questions selectedfrom a large pool of potential questions.In its early stage it relies upon 23questions.
Experience gained using the existingKompas system over the last seven yearsprovides a number of reasons for wantingto modify and improve the system. First,the 23 statements used in the past toidentify the two major dimensions arerather unevenly located in thetwo-dimensional Kompas space. This isillustrated in Figure 2. The reason forthis is that, at the time of theconstruction of the original Kompas,there were relatively few statements inthe ‘socially/modern corner of theworld’.
Secondly, the aim was to examine theeffect the changes in values and opinionsin society had had over the years on theanswers to the questions upon whichKompas was constructed. It is now
152 Journal of Targeting, Measurement and Analysis for Marketing Vol. 11, 2, 148–167 � Henry Stewart Publications 1479-1862 (2002)
Hansen, Randrup and Reinert
Figure 2 The location of the 23 statements from the original Kompas system in the two-dimensionalmodern/traditional individual/social space (note two statements fall outside the diagram).
0.0 0.2 0.4 0.6 0.8–0.2–0.2
Modern – Traditional
Ind
ivid
ual –
So
cial
0.6
0.4
0.2
0.0
–0.2
–0.6
–0.4

marketers would have to work with avery modified selection of questions. Byconcentrating on items that arenon-specific to the Nordic countries inthe revised version, it was hoped thesystem would be easier to useinternationally.
DEVELOPING THE SECONDGENERATION KOMPASRedevelopment and refinement of thesystem is continuously taking place. Astudy comparing Schwartz Value Domainand Kompas statements as well asdimensions has been completed.24
Following this, a completely new masterlist of questions was developed, basedpartly upon focus group interviews andpartly upon analyses of sociologicaltheory, news items, existing valuemeasures, etc. In this process, 29potential topic areas such asenvironmental issues, EU, religion wereidentified. For each of these a number ofrelevant statements were extracted.
To ensure that the new Kompasquestionnaire would cover virtually allrelevant value/opinion issues incontemporary society, two approacheswere used simultaneously. Groupdiscussions were conducted with differentage groups in Copenhagen as well as inthe provinces. The discussions werestructured in such a way as to have theparticipants reflect on contemporaryimportant opinion/value issues.Subsequently, the responses were analysedfor potential meaningful items. A totallist of more than 900 items resulted fromthis analysis. By examining the initial 900statements, it was possible to deleteapproximately 560 due to a similaritywith other items, unclear andmeaningless formulations etc. All Kompasquestions used in the past were includedamong the resulting 359 items.
Simultaneously, a selection of
underlying dimension of modern vs.traditional orientation.
Over the years, however, thesensitivity of some of the items hasdecreased, thus in the process of revisingKompas, it seemed natural to look forthe effect of such changes.
Even when working with quite largesamples, as one begins to constructKompas illustrations (Figure 1) for smallbrands in product areas with fewconsumers, the shape of the Kompastends to fluctuate from year to year. Thiscan normally be explained as a statisticalphenomenon, resulting from smallsubsamples, but for many users it is stillinconvenient. To make it possible towork with Kompas even when smallersamples are involved, it was decided toestablish an additional five-segmentKompas. Furthermore, as part of therevision process, alternative Kompasmodels were identified.
Another reason for revising the itemsupon which Kompas is computed is thewish to reduce the number of questionsneeding to be asked. The idea was for itto be possible to reproduce basically thesame dimensions with fewer questions assome of the less important questionswould be deleted and substituted with afew more efficient ones.
A final reason for looking at thenumber and selection of statements usedfor constructing the Kompas was thewish to make the system more flexiblefor international applications. Inlarge-scale surveys, the system works in asimilar manner throughout the Nordiccountries.23 Ad hoc applications of thesystem in modified versions in productareas such as mobile telephone and grouptravelling suggest that it works quite wellin other ‘Western’ cultures as well.Applications of the basic system inPoland and Israel have demonstrated thatthe same dimensions can also beidentified in these countries. However,
� Henry Stewart Publications 1479-1862 (2002) Vol. 11, 2, 148-167 Journal of Targeting, Measurement and Analysis for Marketing 153
The development of an operational second dimensional value system

70 per cent of the responses fell into oneor two categories of the six-point scaleused. Other statements were deletedbecause respondents had obviously haddifficulties interpreting their meaning,indicated by 20 per cent or morerespondents not answering a question.This left a battery of 75 items: with thisbattery, a varimax rotated factor analysisusing SPSS25 was conducted in order toarrive at a meaningful solution using tendimensions. This discussion will bepicked up later.
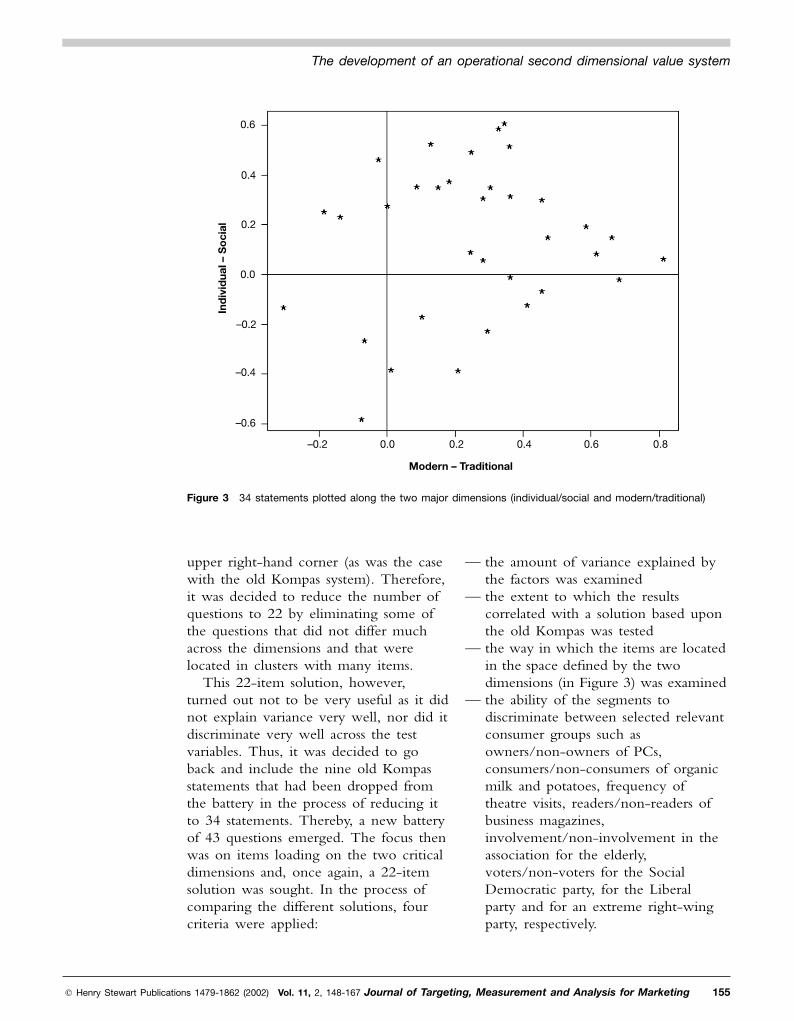
When using this solution, it wasevident that the first two factors closelyresembled the expected modern/traditionand social/individual dimensions.Consequently, it was decided to subjectthe 75 items to a forced two factorvarimax rotated solution. Again, the twosought after dimensions emerged. Next,it was decided to measure the highestquestion loading on each of the twofactors and concentrate on these. Two by17, or 34 items were selected, and again,a two-factor solution was sought. As anexample the resulting rotated first factor,in terms of the highest loadingstatements, is shown in Table 2. Thetwo-factor solution is also plotted inFigure 3.
In Figure 3 there can be seen atendency for items to cluster in the
newspapers and magazines were analysedfor important value topics and a numberof well-known lifestyle, value and similarquestionnaires were subsequentlyscreened. This was done with thepurpose of defining a list of major topicareas. This process resulted in a total of34 such topic areas. Examples are theEC, royal families, refugees.
As a result, the 359 remainingstatements were grouped into 34categories (the original 29 plus the fiveadditional topic areas emerging fromworking with those of the 359statements that did not fall in the first 29topic areas). By concentrating on threestatements relating to each of the 34topic areas and including the original 23statements, a macro battery of 125statements emerged.
PRE-TEST AND SCALECONSTRUCTIONUsing 125 statements together with anumber of questions regarding productusage, demography, political voting, etc.,a pre-test was carried out with 505computer assisted telephone interviews(Capi interviews). Based upon theresulting data, a number of statementswere deleted due to a lack ofdiscriminative power, ie when more than
154 Journal of Targeting, Measurement and Analysis for Marketing Vol. 11, 2, 148–167 � Henry Stewart Publications 1479-1862 (2002)
Hansen, Randrup and Reinert
Table 2: Factor loading for the statements with the highest loadings on factor 1 (2 factor solution with 34variables)
If we do not take care, machines will overpower the human raceChanges come about too quickly todayModern technology makes people more stressedThere is a risk that the Internet will replace social contact between peopleTechnology prevents people from being creativeI am afraid that traditional family values will totally disappearWomen are exhibited in commercials and magazines in a humiliating wayI feel that Denmark’s fundamental values are in dangerThere is a big gap between the rich and the poor in today’s societyDenmark should do more for the weak and elderly people in societyThe welfare society ‘kills’ personal initiativeThe overwhelming air pollution worries me more and moreThe Danish national church is an important factor in my daily lifeEach home should have a computerThe Christian view of life should be the foundation for Danish law
0.7870.6860.6820.6230.5980.5340.5210.5140.4880.4400.3810.3500.349
�0.3390.310
— the amount of variance explained bythe factors was examined
— the extent to which the resultscorrelated with a solution based uponthe old Kompas was tested
— the way in which the items are locatedin the space defined by the twodimensions (in Figure 3) was examined
— the ability of the segments todiscriminate between selected relevantconsumer groups such asowners/non-owners of PCs,consumers/non-consumers of organicmilk and potatoes, frequency oftheatre visits, readers/non-readers ofbusiness magazines,involvement/non-involvement in theassociation for the elderly,voters/non-voters for the SocialDemocratic party, for the Liberalparty and for an extreme right-wingparty, respectively.
upper right-hand corner (as was the casewith the old Kompas system). Therefore,it was decided to reduce the number ofquestions to 22 by eliminating some ofthe questions that did not differ muchacross the dimensions and that werelocated in clusters with many items.
This 22-item solution, however,turned out not to be very useful as it didnot explain variance very well, nor did itdiscriminate very well across the testvariables. Thus, it was decided to goback and include the nine old Kompasstatements that had been dropped fromthe battery in the process of reducing itto 34 statements. Thereby, a new batteryof 43 questions emerged. The focus thenwas on items loading on the two criticaldimensions and, once again, a 22-itemsolution was sought. In the process ofcomparing the different solutions, fourcriteria were applied:
� Henry Stewart Publications 1479-1862 (2002) Vol. 11, 2, 148-167 Journal of Targeting, Measurement and Analysis for Marketing 155
The development of an operational second dimensional value system
Figure 3 34 statements plotted along the two major dimensions (individual/social and modern/traditional)
–0.2
–0.4
–0.6
0.0
0.2
0.4
0.6
–0.2 0.0 0.80.60.40.2
Modern – Traditional
Ind
ivid
ual –
So
cial
assumes normally distributed responses.The way in which extreme items havebeen deleted means that the worst casesof abnormal distribution have beenavoided, however, the assumption ofnormality is far from fulfilled.Furthermore, a questionnaire of this kindwith many items to be rated adds quite alot of uncertainty to the data. People arejust not careful enough with theiranswers, or they do not perceive thescales identically. Finally, in theconstruction of the battery, someemphasis was placed on including many,rather than just a few, aspects of relevantopinions in society. Therefore, to be ableto account for 33 per cent of the totalvariance using two factors in the data setdescribed above must, in itself, be said tobe more than satisfactory. It is hard toaccommodate bi-variate demographicvariables such as sex or single/family
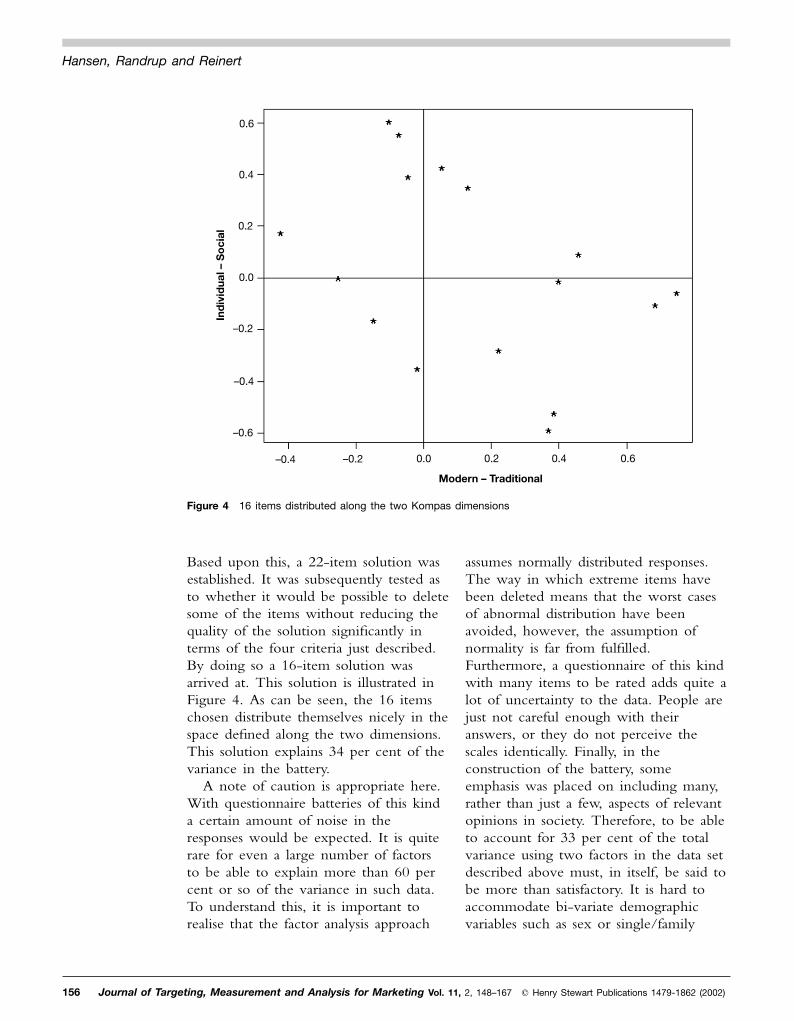
Based upon this, a 22-item solution wasestablished. It was subsequently tested asto whether it would be possible to deletesome of the items without reducing thequality of the solution significantly interms of the four criteria just described.By doing so a 16-item solution wasarrived at. This solution is illustrated inFigure 4. As can be seen, the 16 itemschosen distribute themselves nicely in thespace defined along the two dimensions.This solution explains 34 per cent of thevariance in the battery.
A note of caution is appropriate here.With questionnaire batteries of this kinda certain amount of noise in theresponses would be expected. It is quiterare for even a large number of factorsto be able to explain more than 60 percent or so of the variance in such data.To understand this, it is important torealise that the factor analysis approach
156 Journal of Targeting, Measurement and Analysis for Marketing Vol. 11, 2, 148–167 � Henry Stewart Publications 1479-1862 (2002)
Hansen, Randrup and Reinert
Figure 4 16 items distributed along the two Kompas dimensions
Modern – Traditional
Ind
ivid
ual –
So
cial
0.0 0.2 0.60.4
0.2
0.0
0.6
0.4
–0.2–0.4
–0.6
–0.4
–0.2
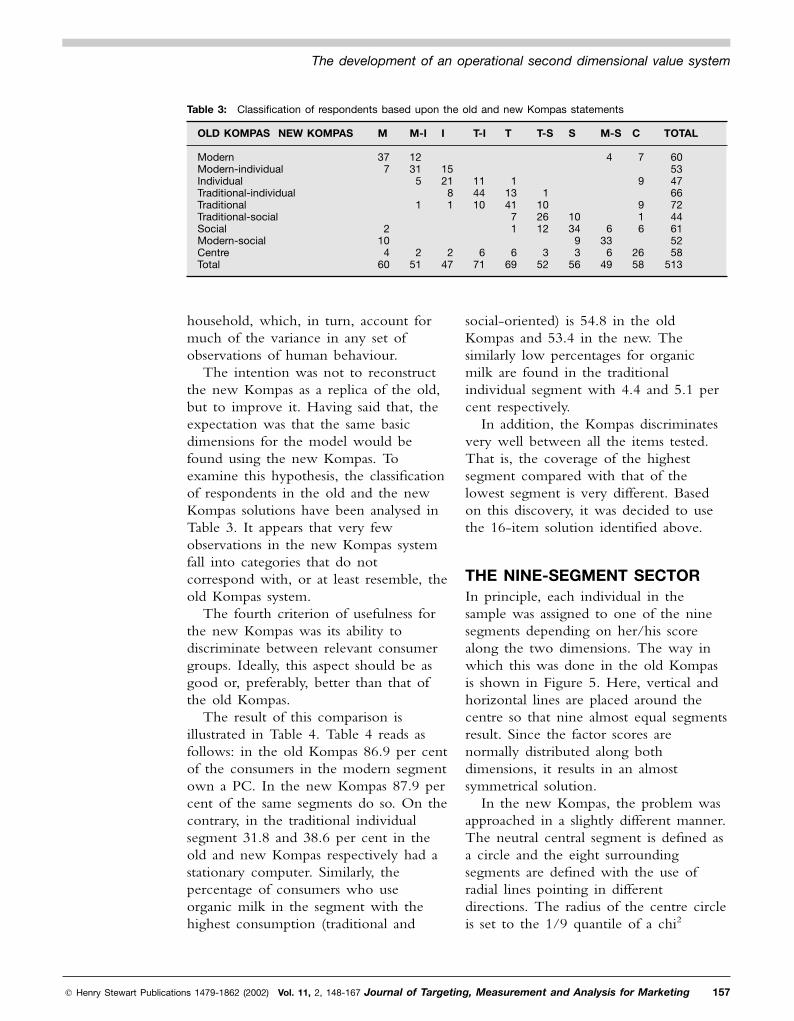
social-oriented) is 54.8 in the oldKompas and 53.4 in the new. Thesimilarly low percentages for organicmilk are found in the traditionalindividual segment with 4.4 and 5.1 percent respectively.
In addition, the Kompas discriminatesvery well between all the items tested.That is, the coverage of the highestsegment compared with that of thelowest segment is very different. Basedon this discovery, it was decided to usethe 16-item solution identified above.
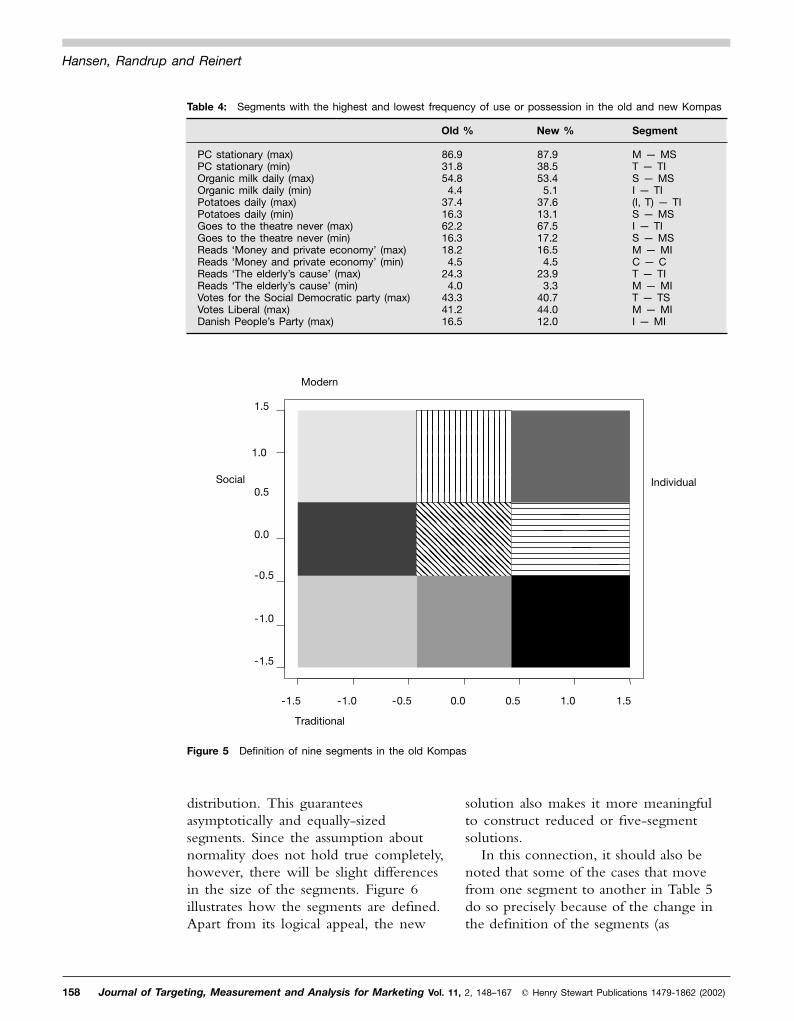
THE NINE-SEGMENT SECTORIn principle, each individual in thesample was assigned to one of the ninesegments depending on her/his scorealong the two dimensions. The way inwhich this was done in the old Kompasis shown in Figure 5. Here, vertical andhorizontal lines are placed around thecentre so that nine almost equal segmentsresult. Since the factor scores arenormally distributed along bothdimensions, it results in an almostsymmetrical solution.
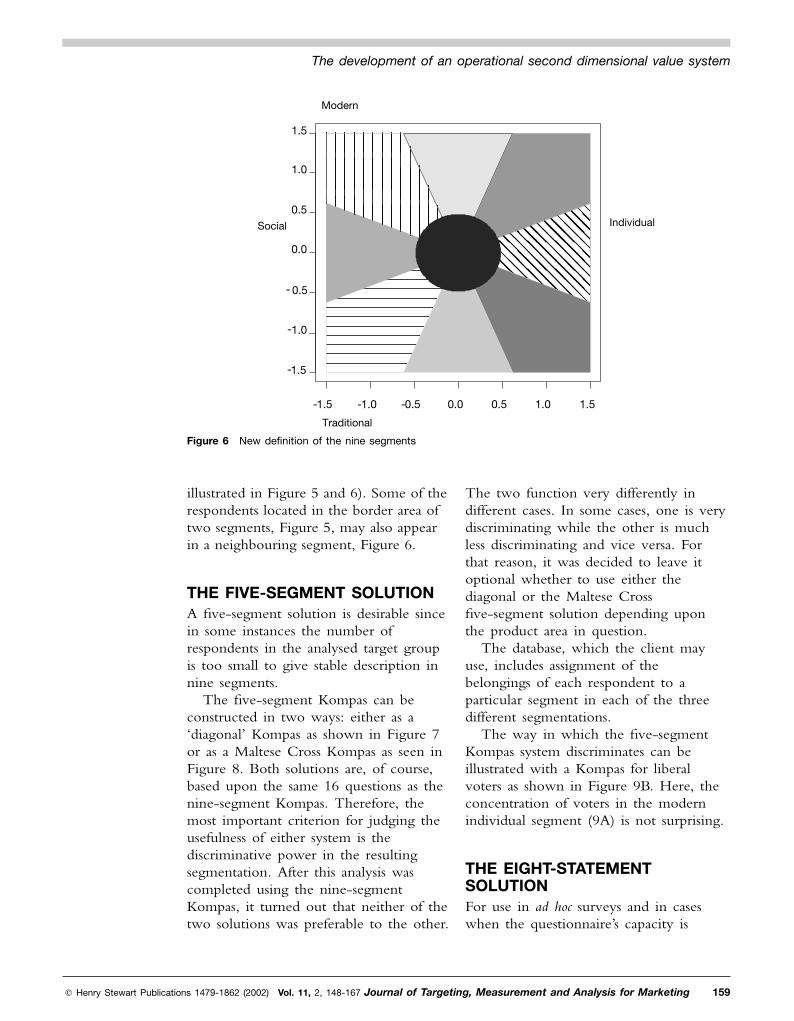
In the new Kompas, the problem wasapproached in a slightly different manner.The neutral central segment is defined asa circle and the eight surroundingsegments are defined with the use ofradial lines pointing in differentdirections. The radius of the centre circleis set to the 1/9 quantile of a chi2
household, which, in turn, account formuch of the variance in any set ofobservations of human behaviour.
The intention was not to reconstructthe new Kompas as a replica of the old,but to improve it. Having said that, theexpectation was that the same basicdimensions for the model would befound using the new Kompas. Toexamine this hypothesis, the classificationof respondents in the old and the newKompas solutions have been analysed inTable 3. It appears that very fewobservations in the new Kompas systemfall into categories that do notcorrespond with, or at least resemble, theold Kompas system.
The fourth criterion of usefulness forthe new Kompas was its ability todiscriminate between relevant consumergroups. Ideally, this aspect should be asgood or, preferably, better than that ofthe old Kompas.
The result of this comparison isillustrated in Table 4. Table 4 reads asfollows: in the old Kompas 86.9 per centof the consumers in the modern segmentown a PC. In the new Kompas 87.9 percent of the same segments do so. On thecontrary, in the traditional individualsegment 31.8 and 38.6 per cent in theold and new Kompas respectively had astationary computer. Similarly, thepercentage of consumers who useorganic milk in the segment with thehighest consumption (traditional and
� Henry Stewart Publications 1479-1862 (2002) Vol. 11, 2, 148-167 Journal of Targeting, Measurement and Analysis for Marketing 157
The development of an operational second dimensional value system
Table 3: Classification of respondents based upon the old and new Kompas statements
OLD KOMPAS NEW KOMPAS M M-I I T-I T T-S S M-S C TOTAL
ModernModern-individualIndividualTraditional-individualTraditionalTraditional-socialSocialModern-socialCentreTotal
377
210
460
1231
5
1
251
1521
81
247
114410
671
11341
71
669
1102612
352
1034
93
56
4
633
649
7
9
916
2658
605347667244615258
513
solution also makes it more meaningfulto construct reduced or five-segmentsolutions.
In this connection, it should also benoted that some of the cases that movefrom one segment to another in Table 5do so precisely because of the change inthe definition of the segments (as
distribution. This guaranteesasymptotically and equally-sizedsegments. Since the assumption aboutnormality does not hold true completely,however, there will be slight differencesin the size of the segments. Figure 6illustrates how the segments are defined.Apart from its logical appeal, the new
158 Journal of Targeting, Measurement and Analysis for Marketing Vol. 11, 2, 148–167 � Henry Stewart Publications 1479-1862 (2002)
Hansen, Randrup and Reinert
Table 4: Segments with the highest and lowest frequency of use or possession in the old and new Kompas
Old % New % Segment
PC stationary (max)PC stationary (min)Organic milk daily (max)Organic milk daily (min)Potatoes daily (max)Potatoes daily (min)Goes to the theatre never (max)Goes to the theatre never (min)Reads ‘Money and private economy’ (max)Reads ‘Money and private economy’ (min)Reads ‘The elderly’s cause’ (max)Reads ‘The elderly’s cause’ (min)Votes for the Social Democratic party (max)Votes Liberal (max)Danish People’s Party (max)
86.931.854.8
4.437.416.362.216.318.2
4.524.3
4.043.341.216.5
87.938.553.4
5.137.613.167.517.216.5
4.523.9
3.340.744.012.0
M — MST — TIS — MSI — TI(I, T) — TIS — MSI — TIS — MSM — MIC — CT — TIM — MIT — TSM — MII — MI
Figure 5 Definition of nine segments in the old Kompas
Modern
Individual
-1.5
Traditional
-1.0 -0.5 0.0 0.5 1.0 1.5
-1.5
-1.0
-0.5
0.0
0.5
1.0
Social
1.5
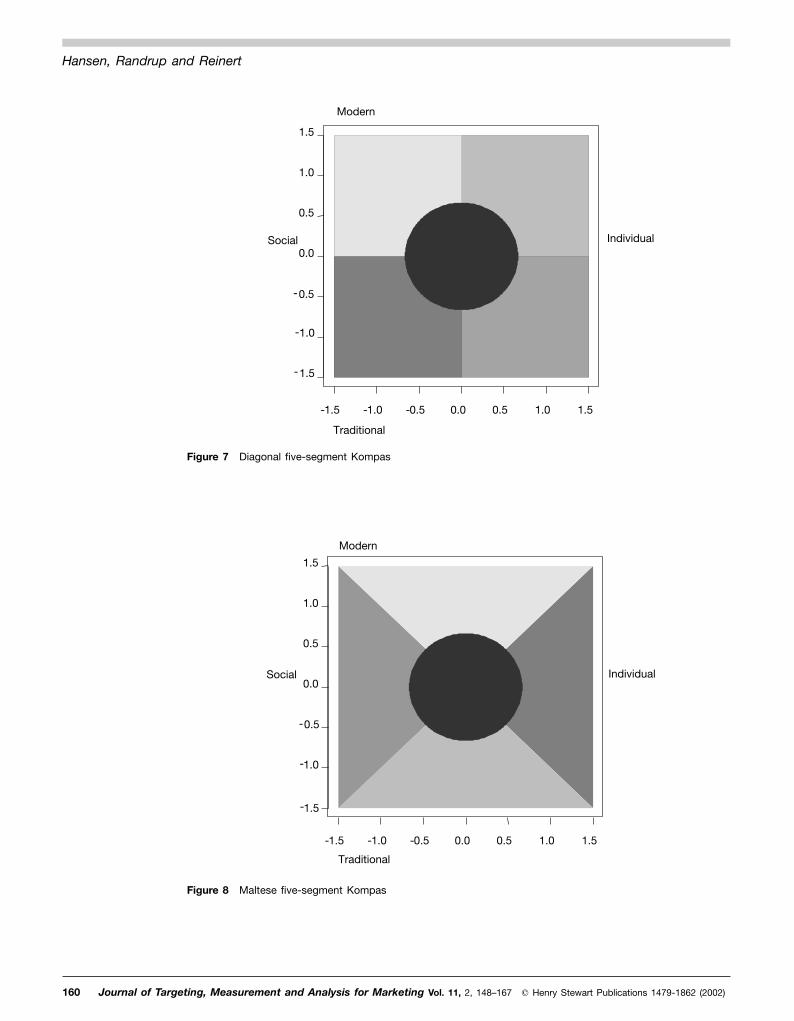
The two function very differently indifferent cases. In some cases, one is verydiscriminating while the other is muchless discriminating and vice versa. Forthat reason, it was decided to leave itoptional whether to use either thediagonal or the Maltese Crossfive-segment solution depending uponthe product area in question.
The database, which the client mayuse, includes assignment of thebelongings of each respondent to aparticular segment in each of the threedifferent segmentations.
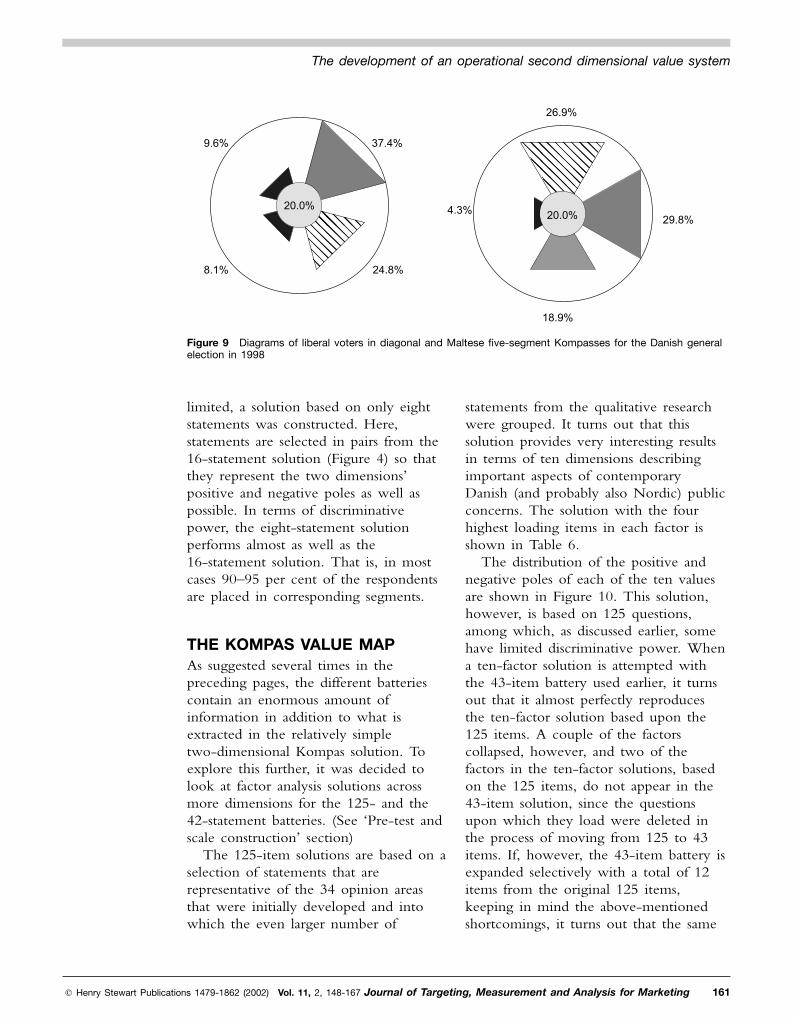
The way in which the five-segmentKompas system discriminates can beillustrated with a Kompas for liberalvoters as shown in Figure 9B. Here, theconcentration of voters in the modernindividual segment (9A) is not surprising.
THE EIGHT-STATEMENTSOLUTIONFor use in ad hoc surveys and in caseswhen the questionnaire’s capacity is
illustrated in Figure 5 and 6). Some of therespondents located in the border area oftwo segments, Figure 5, may also appearin a neighbouring segment, Figure 6.
THE FIVE-SEGMENT SOLUTIONA five-segment solution is desirable sincein some instances the number ofrespondents in the analysed target groupis too small to give stable description innine segments.
The five-segment Kompas can beconstructed in two ways: either as a‘diagonal’ Kompas as shown in Figure 7or as a Maltese Cross Kompas as seen inFigure 8. Both solutions are, of course,based upon the same 16 questions as thenine-segment Kompas. Therefore, themost important criterion for judging theusefulness of either system is thediscriminative power in the resultingsegmentation. After this analysis wascompleted using the nine-segmentKompas, it turned out that neither of thetwo solutions was preferable to the other.
� Henry Stewart Publications 1479-1862 (2002) Vol. 11, 2, 148-167 Journal of Targeting, Measurement and Analysis for Marketing 159
The development of an operational second dimensional value system
Figure 6 New definition of the nine segments
-1.5 -1.0 -0.5 0.0 0.5 1.0 1.5
-1.5
-1.0
- 0.5
0.0
0.5
1.0
1.5
Modern
Traditional
Social Individual
160 Journal of Targeting, Measurement and Analysis for Marketing Vol. 11, 2, 148–167 � Henry Stewart Publications 1479-1862 (2002)
Hansen, Randrup and Reinert
Figure 7 Diagonal five-segment Kompas
Figure 8 Maltese five-segment Kompas
-1.5 -1.0 -0.5 0.0 0.5 1.0 1.5
-1.5
-1.0
-0.5
0.0
0.5
1.0
1.5
Modern
Social
Traditional
Individual
-1.5 -1.0 -0.5 0.0 0.5 1.0 1.5
-1.5
-1.0
-0.5
0.0
0.5
1.0
1.5
Modern
Traditional
Social Individual
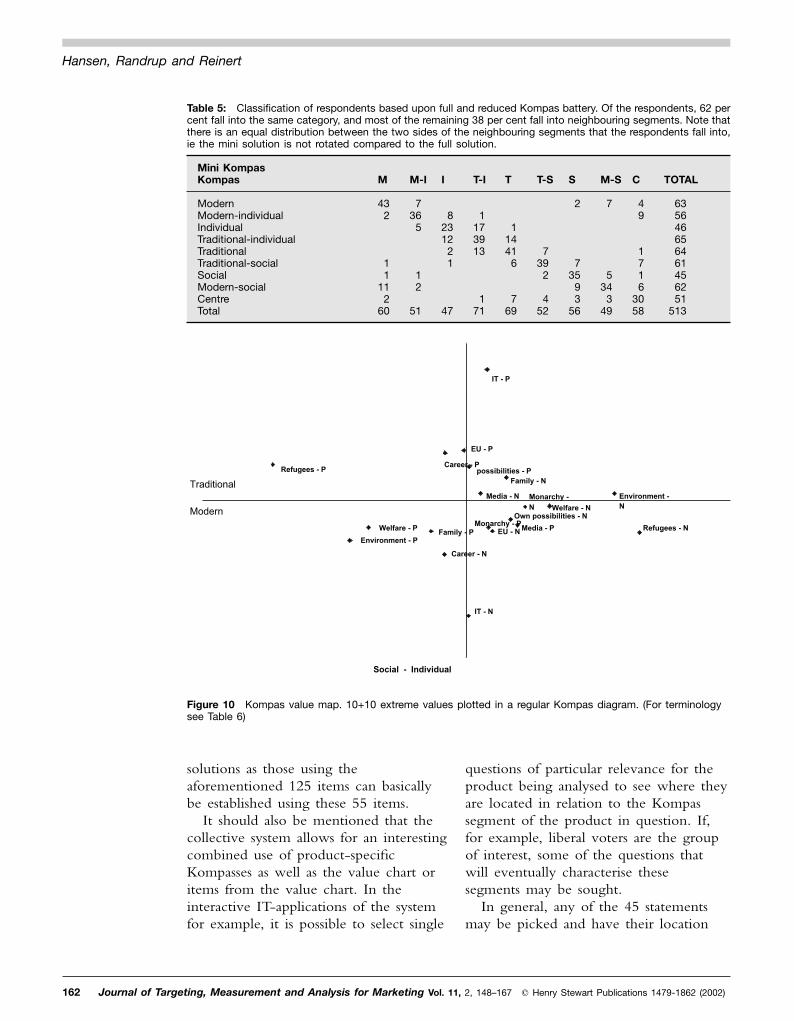
statements from the qualitative researchwere grouped. It turns out that thissolution provides very interesting resultsin terms of ten dimensions describingimportant aspects of contemporaryDanish (and probably also Nordic) publicconcerns. The solution with the fourhighest loading items in each factor isshown in Table 6.
The distribution of the positive andnegative poles of each of the ten valuesare shown in Figure 10. This solution,however, is based on 125 questions,among which, as discussed earlier, somehave limited discriminative power. Whena ten-factor solution is attempted withthe 43-item battery used earlier, it turnsout that it almost perfectly reproducesthe ten-factor solution based upon the125 items. A couple of the factorscollapsed, however, and two of thefactors in the ten-factor solutions, basedon the 125 items, do not appear in the43-item solution, since the questionsupon which they load were deleted inthe process of moving from 125 to 43items. If, however, the 43-item battery isexpanded selectively with a total of 12items from the original 125 items,keeping in mind the above-mentionedshortcomings, it turns out that the same
limited, a solution based on only eightstatements was constructed. Here,statements are selected in pairs from the16-statement solution (Figure 4) so thatthey represent the two dimensions’positive and negative poles as well aspossible. In terms of discriminativepower, the eight-statement solutionperforms almost as well as the16-statement solution. That is, in mostcases 90–95 per cent of the respondentsare placed in corresponding segments.
THE KOMPAS VALUE MAPAs suggested several times in thepreceding pages, the different batteriescontain an enormous amount ofinformation in addition to what isextracted in the relatively simpletwo-dimensional Kompas solution. Toexplore this further, it was decided tolook at factor analysis solutions acrossmore dimensions for the 125- and the42-statement batteries. (See ‘Pre-test andscale construction’ section)
The 125-item solutions are based on aselection of statements that arerepresentative of the 34 opinion areasthat were initially developed and intowhich the even larger number of
� Henry Stewart Publications 1479-1862 (2002) Vol. 11, 2, 148-167 Journal of Targeting, Measurement and Analysis for Marketing 161
The development of an operational second dimensional value system
Figure 9 Diagrams of liberal voters in diagonal and Maltese five-segment Kompasses for the Danish generalelection in 1998
37.4%
24.8%8.1%
9.6%
20.0%
26.9%
29.8%
18.9%
4.3%20.0%
questions of particular relevance for theproduct being analysed to see where theyare located in relation to the Kompassegment of the product in question. If,for example, liberal voters are the groupof interest, some of the questions thatwill eventually characterise thesesegments may be sought.
In general, any of the 45 statementsmay be picked and have their location
solutions as those using theaforementioned 125 items can basicallybe established using these 55 items.
It should also be mentioned that thecollective system allows for an interestingcombined use of product-specificKompasses as well as the value chart oritems from the value chart. In theinteractive IT-applications of the systemfor example, it is possible to select single
162 Journal of Targeting, Measurement and Analysis for Marketing Vol. 11, 2, 148–167 � Henry Stewart Publications 1479-1862 (2002)
Hansen, Randrup and Reinert
Table 5: Classification of respondents based upon full and reduced Kompas battery. Of the respondents, 62 percent fall into the same category, and most of the remaining 38 per cent fall into neighbouring segments. Note thatthere is an equal distribution between the two sides of the neighbouring segments that the respondents fall into,ie the mini solution is not rotated compared to the full solution.
Mini KompasKompas M M-I I T-I T T-S S M-S C TOTAL
ModernModern-individualIndividualTraditional-individualTraditionalTraditional-socialSocialModern-socialCentreTotal
432
11
112
60
736
5
12
51
82312
21
47
1173913
171
11441
6
769
739
2
452
2
735
93
56
7
534
349
49
1716
3058
635646656461456251
513
Figure 10 Kompas value map. 10+10 extreme values plotted in a regular Kompas diagram. (For terminologysee Table 6)
-1,5
-1
-0,5
0
0,5
1
1,5
Social - Individual
Refugees - P
Refugees - N
IT - P
IT - N
Environment - P
Environment -
N
Welfare - P
Welfare - N
EU - P
EU - NMedia - P
Media - N
possibilities - P
Own possibilities - NMonarchy - P
Monarchy -
N
Family - P
Family - N
Career - P
Career - N
Traditional
Modern
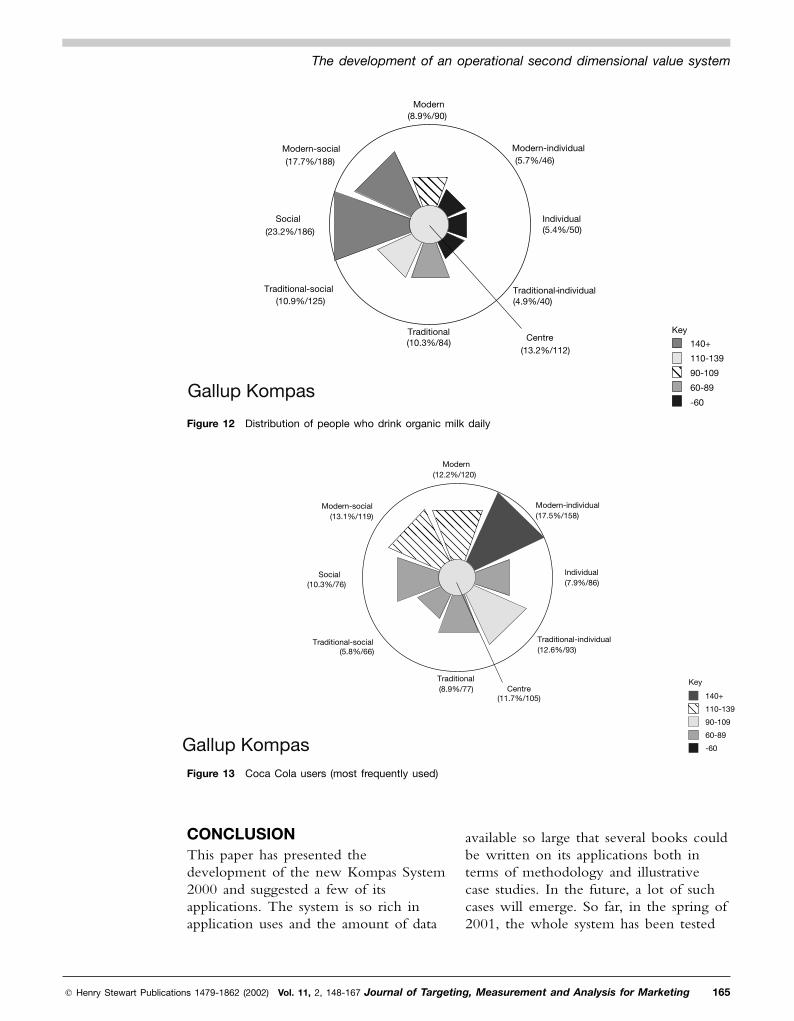
organic milk drinkers dominate. Thisprocedure also makes it possible toidentify a relatively limited number ofscreening questions to be used inqualitative research representing particularsegments and products. By picking thecentral statements in the critical segment,the chances of proper screening of the
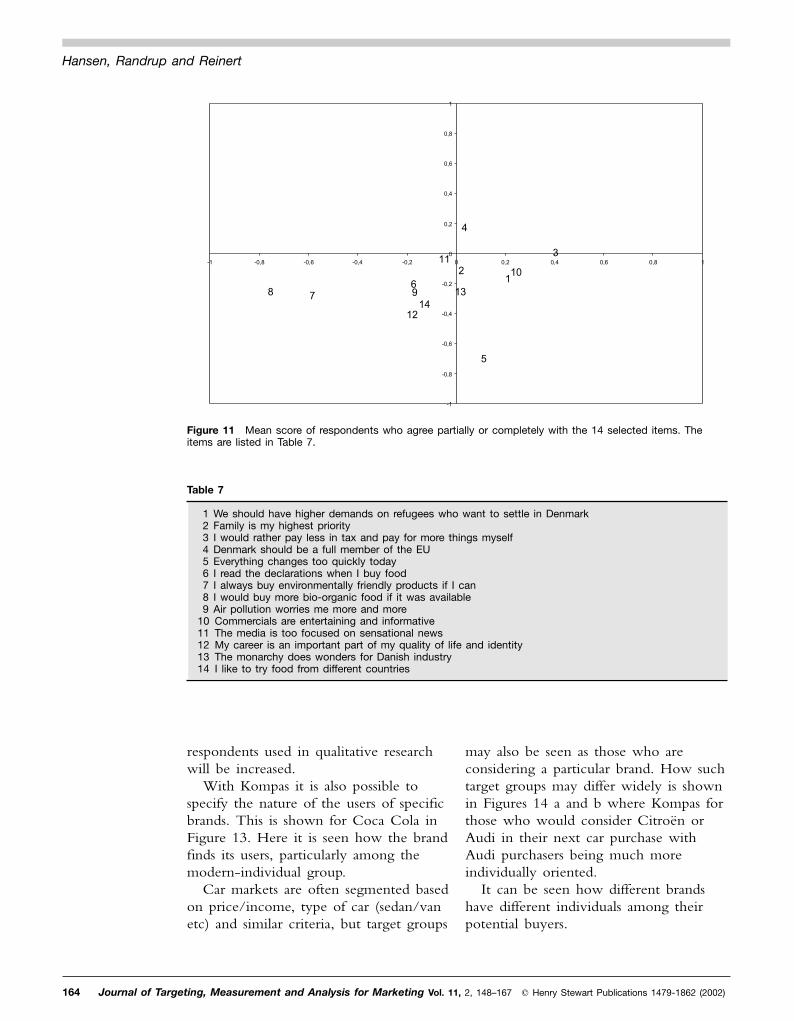
plotted. Figure 11 displays statements foreach of the ten value dimensions chosentogether with four items particularlyrelated to organic products. In Figure 12,users of organic milk are shown. Bycomparing Figure 11 and Figure 12 itwill be seen that organic statements areconcentrated in the segment where
� Henry Stewart Publications 1479-1862 (2002) Vol. 11, 2, 148-167 Journal of Targeting, Measurement and Analysis for Marketing 163
The development of an operational second dimensional value system
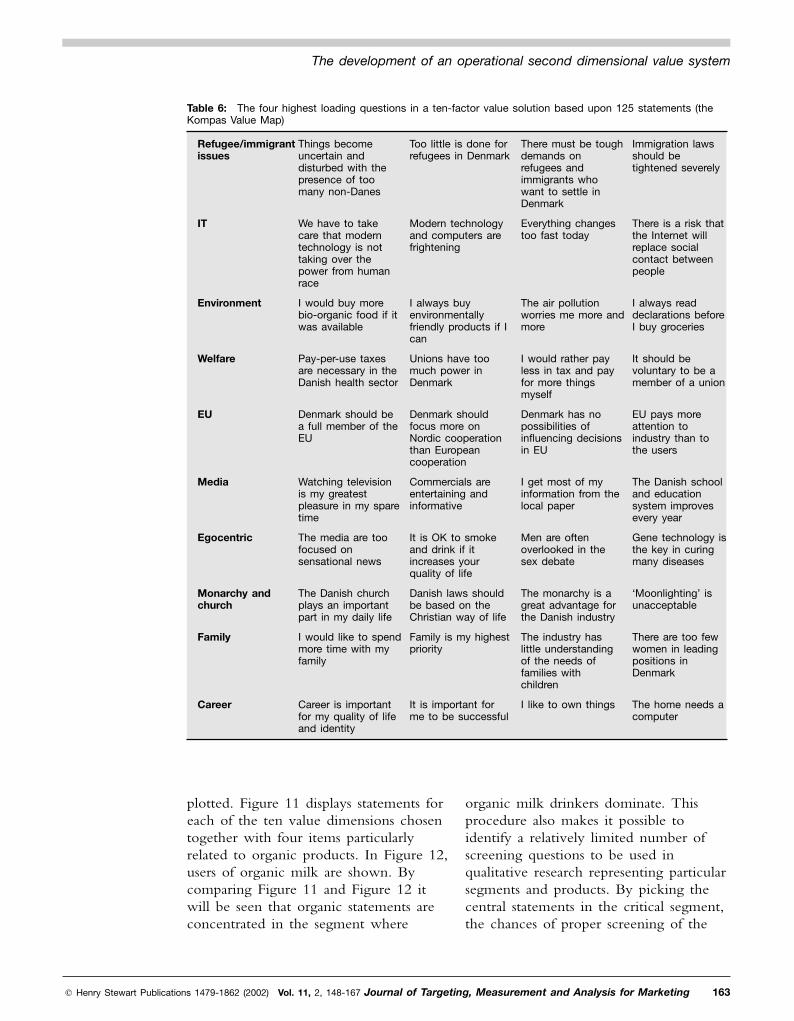
Table 6: The four highest loading questions in a ten-factor value solution based upon 125 statements (theKompas Value Map)
Refugee/immigrantissues
Things becomeuncertain anddisturbed with thepresence of toomany non-Danes
Too little is done forrefugees in Denmark
There must be toughdemands onrefugees andimmigrants whowant to settle inDenmark
Immigration lawsshould betightened severely
IT We have to takecare that moderntechnology is nottaking over thepower from humanrace
Modern technologyand computers arefrightening
Everything changestoo fast today
There is a risk thatthe Internet willreplace socialcontact betweenpeople
Environment I would buy morebio-organic food if itwas available
I always buyenvironmentallyfriendly products if Ican
The air pollutionworries me more andmore
I always readdeclarations beforeI buy groceries
Welfare Pay-per-use taxesare necessary in theDanish health sector
Unions have toomuch power inDenmark
I would rather payless in tax and payfor more thingsmyself
It should bevoluntary to be amember of a union
EU Denmark should bea full member of theEU
Denmark shouldfocus more onNordic cooperationthan Europeancooperation
Denmark has nopossibilities ofinfluencing decisionsin EU
EU pays moreattention toindustry than tothe users
Media Watching televisionis my greatestpleasure in my sparetime
Commercials areentertaining andinformative
I get most of myinformation from thelocal paper
The Danish schooland educationsystem improvesevery year
Egocentric The media are toofocused onsensational news
It is OK to smokeand drink if itincreases yourquality of life
Men are oftenoverlooked in thesex debate
Gene technology isthe key in curingmany diseases
Monarchy andchurch
The Danish churchplays an importantpart in my daily life
Danish laws shouldbe based on theChristian way of life
The monarchy is agreat advantage forthe Danish industry
‘Moonlighting’ isunacceptable
Family I would like to spendmore time with myfamily
Family is my highestpriority
The industry haslittle understandingof the needs offamilies withchildren
There are too fewwomen in leadingpositions inDenmark
Career Career is importantfor my quality of lifeand identity
It is important forme to be successful
I like to own things The home needs acomputer
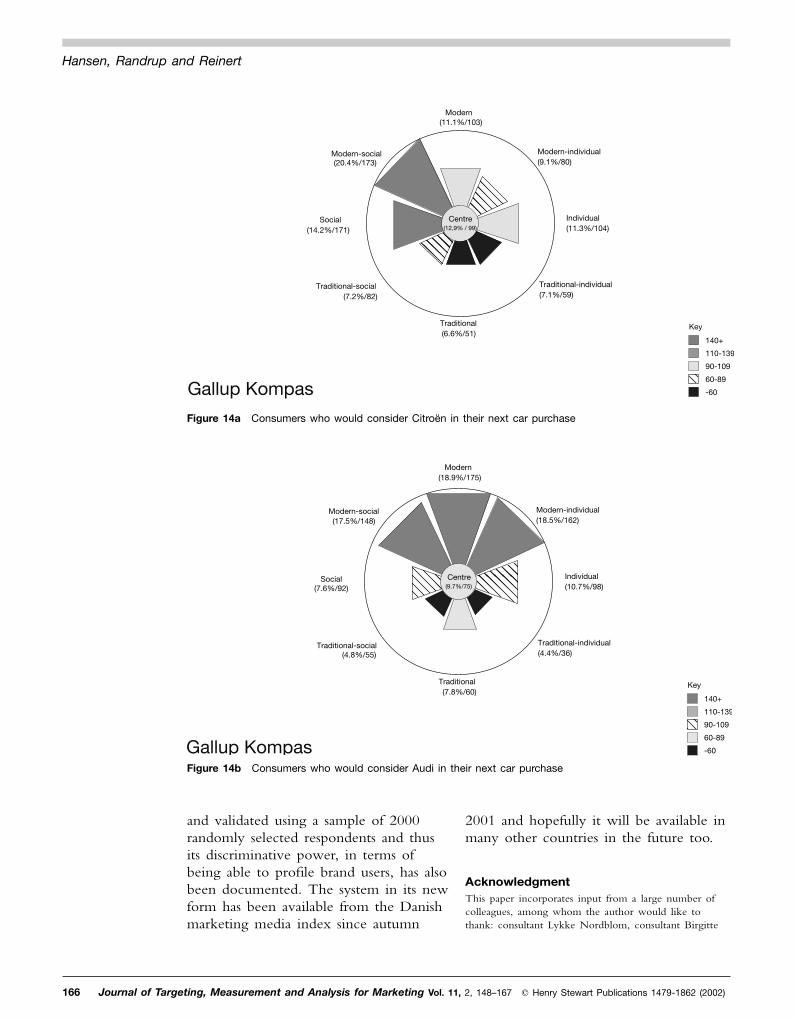
may also be seen as those who areconsidering a particular brand. How suchtarget groups may differ widely is shownin Figures 14 a and b where Kompas forthose who would consider Citroen orAudi in their next car purchase withAudi purchasers being much moreindividually oriented.
It can be seen how different brandshave different individuals among theirpotential buyers.
respondents used in qualitative researchwill be increased.
With Kompas it is also possible tospecify the nature of the users of specificbrands. This is shown for Coca Cola inFigure 13. Here it is seen how the brandfinds its users, particularly among themodern-individual group.
Car markets are often segmented basedon price/income, type of car (sedan/vanetc) and similar criteria, but target groups
164 Journal of Targeting, Measurement and Analysis for Marketing Vol. 11, 2, 148–167 � Henry Stewart Publications 1479-1862 (2002)
Hansen, Randrup and Reinert
Figure 11 Mean score of respondents who agree partially or completely with the 14 selected items. Theitems are listed in Table 7.
-1
-0,8
-0,6
-0,4
-0,2
0
0,2
0,4
0,6
0,8
1
-1 -0,8 -0,6 -0,4 -0,2 0 0,2 0,4 0,6 0,8 1
1
2
3
4
5
6
78 9
10
11
12
13
14
Table 7
1 We should have higher demands on refugees who want to settle in Denmark2 Family is my highest priority3 I would rather pay less in tax and pay for more things myself4 Denmark should be a full member of the EU5 Everything changes too quickly today6 I read the declarations when I buy food7 I always buy environmentally friendly products if I can8 I would buy more bio-organic food if it was available9 Air pollution worries me more and more
10 Commercials are entertaining and informative11 The media is too focused on sensational news12 My career is an important part of my quality of life and identity13 The monarchy does wonders for Danish industry14 I like to try food from different countries
available so large that several books couldbe written on its applications both interms of methodology and illustrativecase studies. In the future, a lot of suchcases will emerge. So far, in the spring of2001, the whole system has been tested
CONCLUSIONThis paper has presented thedevelopment of the new Kompas System2000 and suggested a few of itsapplications. The system is so rich inapplication uses and the amount of data
� Henry Stewart Publications 1479-1862 (2002) Vol. 11, 2, 148-167 Journal of Targeting, Measurement and Analysis for Marketing 165
The development of an operational second dimensional value system
Figure 12 Distribution of people who drink organic milk daily
Figure 13 Coca Cola users (most frequently used)
-60
60-89
90-109
110-139
140+
Key
Modern(12.2%/120)
Modern-individual(17.5%/158)
Individual(7.9%/86)
Traditional-individual(12.6%/93)
Traditional(8.9%/77)
Traditional-social(5.8%/66)
Social(10.3%/76)
Modern-social(13.1%/119)
Gallup Kompas
Centre(11.7%/105)
Gallup Kompas-60
60-89
90-109
110-139
140+
Key
Modern(8.9%/90)
Modern-individual(5.7%/46)
Individual(5.4%/50)
Traditional-individual(4.9%/40)
Traditional(10.3%/84)
Traditional-social(10.9%/125)
Social(23.2%/186)
Modern-social(17.7%/188)
Centre(13.2%/112)
2001 and hopefully it will be available inmany other countries in the future too.
AcknowledgmentThis paper incorporates input from a large number ofcolleagues, among whom the author would like tothank: consultant Lykke Nordblom, consultant Birgitte
and validated using a sample of 2000randomly selected respondents and thusits discriminative power, in terms ofbeing able to profile brand users, has alsobeen documented. The system in its newform has been available from the Danishmarketing media index since autumn
166 Journal of Targeting, Measurement and Analysis for Marketing Vol. 11, 2, 148–167 � Henry Stewart Publications 1479-1862 (2002)
Hansen, Randrup and Reinert
Figure 14a Consumers who would consider Citroen in their next car purchase
Figure 14b Consumers who would consider Audi in their next car purchase
-60
60-89
90-109
110-139
140+
Key
Modern(18.9%/175)
Modern-individual(18.5%/162)
Individual(10.7%/98)
Traditional-individual(4.4%/36)
Traditional(7.8%/60)
Traditional-social(4.8%/55)
Social(7.6%/92)
Modern-social(17.5%/148)
Centre(9.7%/75)
Gallup Kompas
-60
60-89
90-109
110-139
140+
Key
Modern(11.1%/103)
Modern-individual(9.1%/80)
Individual(11.3%/104)
Traditional-individual(7.1%/59)
Traditional(6.6%/51)
Traditional-social(7.2%/82)
Social(14.2%/171)
Modern-social(20.4%/173)
Centre(12,9% / 99)
Gallup Kompas

empirical tests in 20 countries. Advances inExperimental Social Psychology, Vol. 25, pp. 1–65.
13 Grunert, S. C. and Juhl, H. J. (1995) ‘Values,environmental attitudes, and buying of organicfoods’, Journal of Economic Psychology, Vol. 16, No. 1,pp. 39–62.
14 Grunert, S. C. and Muller, T. E. (1999) ‘Measuringvalues in international settings: Are respondentsthinking ‘‘real’’ life or ‘‘ideal’’ life?’, in Manrai, L. A.and Manrai, A. K. (eds) ‘Global perspectives incross-cultural and cross-national research’, pp.169–186, The Haworth Press, New York.
15 Grunert, S. C. and Scherhorn, G. (1990) ‘Consumervalues in West Germany: Underlying dimensions andcross-cultural comparison with North America’,Journal of Business Research, Vol. 20, No. 2, pp.97–107.
16 Kahle, L. R., Beatty, S. E. and Homer, P. (1989)‘Consumer values in Norway and the United States:A comparison’, Journal of International ConsumerMarketing, Vol. 1, No. 4, pp. 81–92.
17 Riesmann (1950) op. cit.18 Dahl, H. (1997) ‘Hvis din nabo var en bil — en
bog om livsstil’, Akademisk Forlag.19 Askegaard, S. (1993). ‘Livsstilsundersøgelser —
henimod et teoretisk fundament’.20 Wells, W. D. and Tigert, D. J. (1971) ‘Activities,
interests and opinions’, Journal of Advertising Research,Vol. 11, August, pp. 27–35.
21 Christiansen, C. P. and Hansen, F. (2000) ‘The useof social psychological and applied value research forthe measurement of cultural differences amongconsumers’, proceedings from the III Asian ACRConference, Surfers Paradise, Australia, March.
22 Arnaa, C. et al. (1999) ‘Profiling media users: Anoperational instrument for the measurement ofcultural values in a wide variety of cultures’,proceedings from the Esomar Conference, MexicoCity, 1998.
23 Hansen, F. (2002) ‘Survey-research: A substitute forsingle-source data’, Admap, London, January.
24 Arnaa et al. (1999) op. cit.25 SPSS� Base 7.0 for Windows� User’s Guide (1996).
Høg, Director Morten Kromann Larsen andpsychologist Anette B. Bangsgaard.
References1 Hansen, F. and Kærk, A. (1997) ‘Value dimensions
— are there really that many?’, proceedings fromthe 49th Annual Esomar Conference, Istanbul,September.
2 Riesmann, D. (1950) ‘The lonely crowd’, YaleUniversity Press, New Haven.
3 Rokeach, M. J. (1968) ‘Beliefs, attitudes, andvalues’, Jossey Bass, San Francisco, CA.
4 Schwarz, S. H. and Bilsky, W. (1987) ‘Toward auniversal psychological structure of human values’,Journal of Personality and Social Psychology, Vol. 53,No. 3, pp. 550–562.
5 Vernon, P. and Allport, G. W. (1931) ‘A test forpersonal values’ Journal of Abnormal and SocialPsychology, Vol. 26, pp. 231–248.
6 Rokeach, M. J. (1973) ‘The nature of humanvalues’, Free Press, New York, NY.
7 Plummer, J. T. (1974) ‘The concept and applicationof life style segmentation’, Journal of Marketing, Vol.38, January, pp. 33–37.
8 Mitchell, A. (1983) ‘Nine American lifestyles: Whowe are and where we are going’, MacMillan, NewYork.
9 Kahle, L. R. E. (1983) ‘Social values and socialchange: Adaptation to life in America’, Praeger,New York.
10 Homer, P. M. and Kahle, L. R. (1988) ‘A structuralequation test of the value-attitude-behaviorhierarchy’, Journal of Personality and Social Psychology,Vol. 54, No. 4, pp. 638–646.
11 Gutman, J. and Reynolds, T. J. (1986) ‘Coordinatingassessment to strategy development: An advertisingassessment paradigm based on the MECCAS model’,Olson, I. J. and Sentis, K. (eds) ‘Advertising andconsumer psychology 3’, pp. 242–258. Praeger, NewYork.
12 Schwartz, S. H. (1992) ‘Universals in the contentand structure of values. Theoretical advance and
� Henry Stewart Publications 1479-1862 (2002) Vol. 11, 2, 148-167 Journal of Targeting, Measurement and Analysis for Marketing 167
The development of an operational second dimensional value system