Technological Substitution Forecasting with a Model Based ...
18
TECHNOLOGICAL FORECASTLNG AND SOCIAL CHANGE 23.41-58 (1983) Technological Substitution Forecasting with a Model Based on Biological Analogy HALZNA KWASNICKA, ROMAN GALAR, and WITOLD KWASNICKI Although many models of technological substitution proce~ses exist. only a few deal with multilmi technological substitution and still fewer may be easily applied to forecasting of real multilevel substitution processes. We propose a stochastic model of multilevel techlogical substitution ad a forecasting method based on this model. in the authors' opinion, the developed algorithm may be easily applied to forecasting various technological substitution processes. An example of the application of this algorithm to forecasting of world energy consumption is presented. The algorithm makes possible an investigation of the impact of future innovation on the system's behavior. Introduction Some technological substitution models constructed from an economical point of view show a strong resemblance to population models known in biology dynamics (e.g., the multitype substitution model presented in [9] and Fisher's model [4], which Wbes changes of the percentage of m-alleles of the same gene in a population). The number 05 studies on technologcal substitution has grown rapidly in recent years. A simple model of technological substitution pracesses was developed by Fisher and Ry 131. More complex approaches to substitution analysis have been developed by other scientists [I, 8, 101. A model of multilevel substitution has been put forward by Stern et al. [lo], but as it was pointed out by the authors, the application of this model is considerably limited by its requirements for a good deal of technical and economic data. Most of these approaches suffer from a number of restrictions on their application. Among them arc: (1) the consideration of only mbcmiy substitution (i.e.. one ium substituting anaher). (2) the assumption that once the substitution starts, it will proceed undinctionally to the final Iml of saluration (i.e., the substitution will not reverse irself at some future time), and (3) the condition that a cenain amount of historical data be available from the early stages of subsutution (a substitution that has not yet started caa be considered only by analogy) [Ill. Taking all these opinions into account, we propose a stochastic model of multitype technological substitution based on biological ideas. It is possible to evaluate the impact of future innovation on process development. H. KWASNICKA and W. KWASNICKI are with Rtures Research Center, Technical University of Wrdaw. Wybrzeze Wyspianskiego 27. Wrockw. Poland. R. GL4R is with the Inst~rute of Technical Cyber- netics, Technical University of Wrodaw, Poland. 0 1983 by Elsev~er Sclence Publishing Co.. Inc. 0040-16251831010041-18~3.00
Transcript of Technological Substitution Forecasting with a Model Based ...

TECHNOLOGICAL FORECASTLNG AND SOCIAL CHANGE 23.41-58 (1983)
Technological Substitution Forecasting with a Model Based on Biological Analogy
HALZNA KWASNICKA, ROMAN GALAR, and WITOLD KWASNICKI
Although many models of technological substitution proce~ses exist. only a few deal with multilmi technological substitution and still fewer may be easily applied to forecasting of real multilevel substitution processes. We propose a stochastic model of multilevel techlogical substitution ad a forecasting method based on this model. in the authors' opinion, the developed algorithm may be easily applied to forecasting various technological substitution processes. An example of the application of this algorithm to forecasting of world energy consumption is presented. The algorithm makes possible an investigation of the impact of future innovation on the system's behavior.
Introduction Some technological substitution models constructed from an economical point of
view show a strong resemblance to population models known in biology dynamics (e.g., the multitype substitution model presented in [9] and Fisher's model [4], which W b e s changes of the percentage of m-alleles of the same gene in a population). The number 05 studies on technologcal substitution has grown rapidly in recent years. A simple model of technological substitution pracesses was developed by Fisher and Ry 131. More complex approaches to substitution analysis have been developed by other scientists [I, 8, 101. A model of multilevel substitution has been put forward by Stern et al. [lo], but as it was pointed out by the authors, the application of this model is considerably limited by its requirements for a good deal of technical and economic data.
Most of these approaches suffer from a number of restrictions on their application. Among them arc: (1) the consideration of only mbcmiy substitution (i.e.. one ium substituting anaher). (2) the assumption that once the substitution starts, it will proceed undinctionally to the final I m l of saluration (i.e., the substitution will not reverse irself at some future time), and (3) the condition that a cenain amount of historical data be available from the early stages of subsutution (a substitution that has not yet started caa be considered only by analogy) [Ill.
Taking all these opinions into account, we propose a stochastic model of multitype technological substitution based on biological ideas. It is possible to evaluate the impact of future innovation on process development.
H. KWASNICKA and W. KWASNICKI are with Rtures Research Center, Technical University of Wrdaw. Wybrzeze Wyspianskiego 27. Wrockw. Poland. R. G L 4 R is with the Inst~rute of Technical Cyber- netics, Technical University of Wrodaw, Poland.
0 1983 by Elsev~er Sclence Publishing Co.. Inc. 0040-16251831010041-18~3.00

42 H. KWASNICKA ET AL.
Let us consider a situation where products of several types are successively supplied to the market at a given capacity and statistically defined preferences to meet specific consumer needs. Assuming that the market demand and relative quality indexes are determined for some period of time, we are able to predict, in statistical terms, the number of products of particular types accepted by the market in successive moments of this period for a given initial state.
In terms of population dynamics we consider a population of elements (products) competing in a specific environment at limited capacity. The elements are of the same , origin but of different types with different ratios of fitness. In biology the fitness reflects the degree of adaptation of a genotype (phenotype) to ecological conditions: climate, geography, influence of other populations, and so on. In technological systems, quality , index (fitness) is a synthetic coefficient that reflects relations among costs of production. price, reliability, aesthetic advantage, and so on. Higher fitness is correlated with a higher reproduction ratio and the result of differences in fitness is that elements with fitness ratios higher than average in a population tend to supersede all other elements. We do not attempt to determine fitness value explicitly. Having constructed an adequate model of population dynamics, we are able to identify them based on population history in some period in the past. This opens the way to the forecasting of the future development of the population under the assumption that future environment capacity has been predicted and that environment preferences, reflected by fitness ratios, will be the same or will change in a given pattern. According to the existing classification, the proposed model is a probabilistic multitype substitution model [7]. It can describe the process of competition of several technologies on a uniform market that can be called a process of development of an evolutionary type [6] .
The data necessary to run the model as a prediction tool can be obtained by identi- fication on the basis of records of distribution of particular types of market supply in some period in the past. For the assumed market capacity and tendencies in market preferences (reflected by quality indexes) the model makes it possible to generate predictions in the form of expected values and variances of the distribution mentioned above. Thanks to variance evaluation it is possible to make reasonable judgments concerning the time limit prognosis. It is also possible in some respects to investigate the impact of future innovation on the behavior of the system.
The first part of this paper deals with model description, the second gives the forecasting algorithm, and the last part discusses some application problems.
The Model Let us analyze the development process illustrated in Figure 1. In each period of time
Ti there exists population &Ti) of the elements (products) consisting of those that have "survived" from a previous period and of a new generation of elements G(r) recently introduced to the population by reproduction process. Elements act in the environment performing the same task, and this performance is "evaluated" by the environment. The result of evaluation of a particular element is given by the quality index, which may be a random variable. We assume that the environment is so homogenous that the distribution of the quality index is the same for all elements of the same type. To simplify the problem we assume that the distributions for elements of different types differ in parameter values only. As is shown by Kwainicka [ 5 ] , this assumption does not influence the behavior of the system, and even probabilistic evaluation elements behave in a similar manner as with

TECHNOLOGICAL SUBSTITUTION FORECASTING
I RE PRODUCTION
Fig. I. Ekment~ floa in mccesin popuMom.
deterministic evaluation equal for all the same elements. In each time period there exists a limited capacity of an environment for the elements M(r) and the random reproduction process tends to satisfy the demand, as far as the existing limitations (e.g., maximum reproduction ratio) allow for it. At the same time the reproduction process tends to prefer elements for types with higher than average quality indexes. The number of elements in a population in each period is the sum of the number of "survivors" and the number of elements in new generations. The problem can be simplified by using the demand for new elements instead of the capicity of the environment as on input value. Then the survivors can be ignored together with all the age structure problems involved and we deal with new generations of elements only. From now on, we will use the term "population" to denote only the new elements introduced in time t .
Let us denote t t ~ (0, I,. . . ,) = discrete time P ( t ) = population at time t M ( t ) = demand of environment at time t NZ ( t ) = number of elements in P ( t ) m = number of types represented in the population Ni(r), i = 1, 2,. . . , m = number of i-type elements existing in P(r) qi( t ) = average index of i-type elements qi(t)ER+ N ( t ) = [N, ( t ) , . . . , N,(t)] = a state of P(t) .
During construction of the model, the following assumptions were made:
1. For all indexes i and j, random variables Ni(r) , Nj( t ) are stochastically indepen- dent.
2. The expected value of new elements obtained during reproduction of i-type ele- ments is proportional to the average quality of these elements:

44 H. KWASNICKA ET AL.
V,, V i = 1, ..., m; E[N, ( t + 1 ) / N ( t ) ] = c . N i ( t ) . q i ( t ) ; c > 0. ( 1 . 1 )
3. The conditional expected value of the size of population P ( t + 1 ) is the known function of the number of elements in P ( t ) , the demand of the environment and time: E [ N x ( t + 1)JMt) l = g . N x ( t ) ; g = g 0 , MI, ( 1 . 2 )
We define the average quality q,,(t) of the population by the expression
and assumption 2 has the form
It is known that
then coefficient c is equal to
The probability generating function (pgf) at time t is equal to
where
S = m-dimensional vector, S = [S ,,... , S,,]
P(N(t) ) = probability that the state of the population is N(t) .
It may be proved that the conditional pgf of new elements obtained during reproduction of population N ( t ) is equal to
where H,(S,, t + 1) = conditional pgf of new elements obtained during reproduction of iV;(t) elements at time r.
From this we can see that pgf of the state of population at time t + 1 is equal to

TECHNOLOGICAL SUBSTITUTION FORECASTING 45
The process described above is the Markov chain, in which a probability of the transition from state N(t) to state N(t + 1) is equal to the coefficient for (S)N(' + I) in eq. (1.6).
This paper assumes that N,(t + 1) has the Poisson distributio'n and g(r, M) has the form
In some development processes the size of population may not be a natural number. Examples of processes of this type are as follows: in biology, changes of biomass of phenotypes; in technology, changes of energy produced from different sources such as coal, gas, and oil. Thus at time t, N,(t),. .., N,,,(t) are random variables of a continuous type, and N,(t)&+ for all i = 1, 2 ,..., m.
Only probability distributions of the process of reproduction of types make the continuous model, as we call it, different from the discrete model described above. All assumptions are the same as before, only assumption 3 has the form of an equation (1.8). Let +,(U,, t + 1) denote a characteristic function of quantity of new elements obtained during the reproduction of k-type elements at time r, then a conditional characteristic function of the state of population at time t + 1 is equal to
where
u = (U ,,..., U,)EZm.
Further, it is assumed that the distribution of the number of new elements obtained during reproduction Nk(t) elements is the gamma distribution:
where
In this case, the characteristic function of the state of population has the form
DETERMINISTIC VERSION OF THE MODEL The probabilistic model described above suggests a deterministic model at a discrete
time. Assuming that the process of reproduction is deterministic and is described by eq. (1.8). we obtain the set of m-difference equation
If we know the initial state of the population and the qualities of the types, we may write a solution of these equations:

H. KWASNICKA ET AL.
(1.13)
where the size of the population is described by a logistic equation
Forecasting of the Evolutionary Process of Development In the authors' opinion the model presented in the previous section may be used to
forecast technological substitution (i.e.. evolutionary process of development). Some authors [lo] are of the opinion that there are difficulties in obtaining economical param- eters of processes of technological substitution, and this was taken into account in the method of forecasting presented below.
In fact, we assume that changes of size in the population are logistic and quality indexes do not change in the course of time. However, in case these assumptions turn out to be inadequate, new and more appropriate assumptions may be easily incorporated into the forecasting algorithm.
Changes in the state of the population or a random sample of the state during some period of time are the only conditions necessary to use this method. But if we know the random sample of the state of the population only, it is necessary to know the changes of size of the population (or we may estimate this size by means of double drawing [2, chapter 21).
Two versions of the forecasting algorithm were worked out. They differ themselves in application of the probabilistic model: algorithm I uses the discrete model, algorithm II, the continuous model.
Here are problems reckoned by the algorithms:
estimation of the state of the population changes during some time period on the basis of a random sample of the state of the population; identification of the model's parameters (by the method of maximum likelihood on the basis of the known history of changes of the state of the population); calculation of the expected values and variances of the size of the population and number of elements of all the existing types during a forecasting period (evaluation of the state of the population and its variance); calculation of changes of the state of the population in the deterministic model during a forecasting period; estimation of the prognosis's horizon.
The horizon of prognosis makes it possible tc evaluate the impact of innovation on the state of the population that may appear during the forecasting period. We define the horizon of prognosis as the time after which the incorporated innovation will change the prognosis above 10%. Taking some other interval of the prognosis changes for defining the horizon is

TECHNOLOGICAL SUBSTITUTION FORECASTING 47
also possible. The number of introduced elements, their quality, and the moment of introduction give the user a prognosis.
ESTIMATION OF THE STATE OF THE POPULATION ON THE BASIS OF A RANDOM SAMPLE The following are known:
N,(t) = during period of time (0. 7') R(t) = size of random sample at time t~ (0 , T ) k,(t) = number of i-type elements in the sample at t~ (0, T), i = 1,2 ,..., m.
We have to calculate
I"ji(t) = estimation of number of i-type elements at a (0, t ) , i = 1,2,. . . , m.
The probability of [k, ,. . . , k,] = distribution in R(t) sample from the population in the state [N, ,..., N,,,] is equal to
(i.e., k, ,. . . , k, has multidimensional hypergeometric distribution). Let us assume the maximum likelihood estimator; therefore estimators of a number of elements of different types at time t are equal to
IDENTIFICATION OF THE MODEL'S PARAMETERS It was assumed that quality indexes q, , . . ., q,, demand M , and parameter A in
function g are time independent. The history of changes in the state of the population during period (0 , 7') is given.
It is necessary to look for the model's parameters: A , M, q, . . . q, . The probability of the sequence of the state ( N ( T ) , N(T - l), . . . , N(0)) is equal to
We assume the maximum likelihood estimators:
max PT - A*, M*, q;,.. . . q i .4..u.qjzo

48 H. KWASNICKA ET AL.
From the computational point of view it is more convenient to maximize the P, logarithm. Where Poisson distributions are present the criterion has the form
The last component in the expression above does not depend on optimized variables and may be omitted. It may be shown that P, has the same maximum values for all vectors (A*, M*, Csq;, ..., C-q;), where C is a positive real value. It is necessary to assume the value of one of the qualities (e.g., q,), which will be a relative level for all other qualities.
The problem of max (In P,) may be solved by one of the optimization methods of multivariable function (e.g., Rosenbrock's method). A similiar approach was used for identification of parameters of a continuous model.
THE HORIZON OF THE PROGNOSIS
Let tp denote the moment of insertion of a new better type (m + 1 - in our nota- tion). From the deterministic model a number of i-type elements at tp is
Since tp (m + 1) types exist in the population, let us assume that at t = tp there are Nm+ l(tp) elements of the new type. For t 3 tp
N,(t) is the number of i-type elements for t > rp when only m-types exist in the population. N,!(t) is the number of i-type elements fort > tp when m + 1 types exist in the population.
TECHNOLOGICAL SUBSTITUTION FORECASTING 49
If q,, , , N,, , , and t, are given, the horizon of prognosis t , may be computed from the equation
The influences of the identification inaccuracy of the models' parameters, the initial state of the population, and other parameters of the course of the process are considered in detail in KwaSnicka (51.
Simulation Here we present a simulational study of the models on a digital computer and an
example of an application of the forecasting algorithm. Looking into the models' qualitative properties was the basic aim of the simulation.
The results make it possible to compare qualitatively the models' behavior with real evolutionary processes of development.
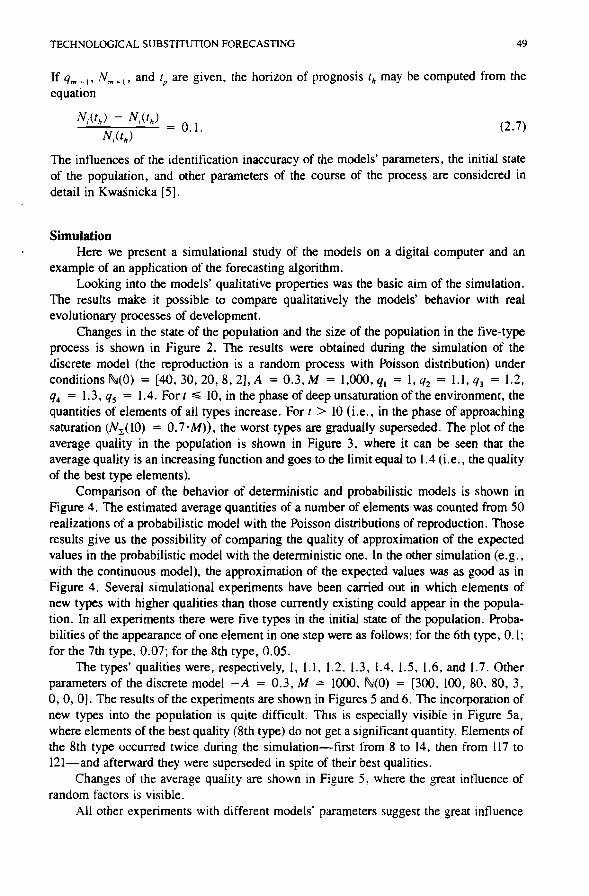
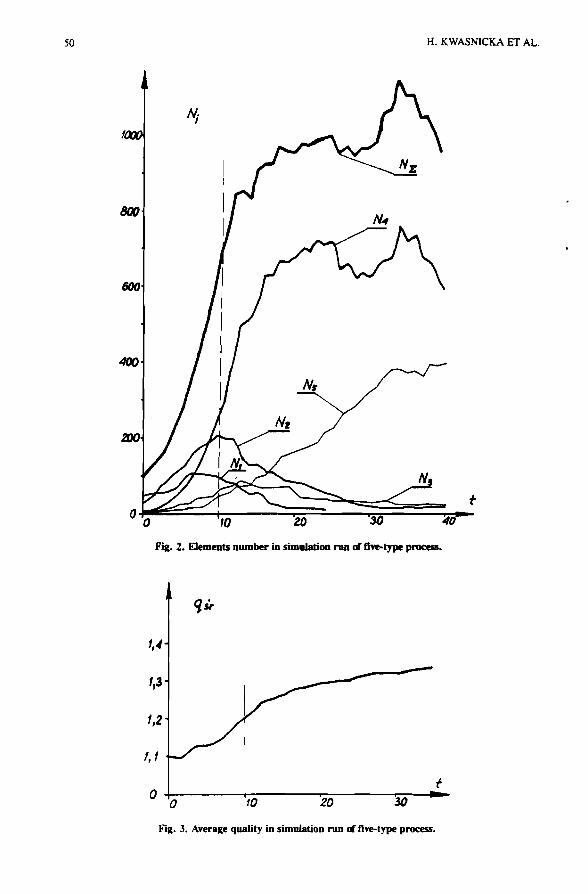
Changes in the state of the population and the size of the population in the five-type process is shown in Figure 2. The results were obtained during the simulation of the discrete model (the reproduction is a random process with Poisson distribution) under conditions N(0) = 140, 30, 20, 8, 21, A = 0.3, M = 1,000, q, = 1, q, = 1.1, q, = 1.2, q, = 1.3, q, = 1.4. For r 6 10, in the phase of deep unsaturation of the environment, the quantities of elements of all types increase. For t > 10 (i.e., in the phase of approaching saturation (N,(lO) = 0.7.M)), the worst types are gradually superseded. The plot of the average quality in the population is shown in Figure 3, where it can be seen that the average quality is an increasing function and goes to the limit equal to 1.4 (i.e., the quality of the best type elements).
Comparison of the behavior of deterministic and probabilistic models is shown in Figure 4. The estimated average quantities of a number of elements was counted from 50 realizations of a probabilistic model with the Poisson distributions of reproduction. Those results give us the possibility of comparing the quality of approximation of the expected values in the probabilistic model with the deterministic one. In the other simulation (e.g.. with the continuous model), the approximation of the expected values was as good as in Figure 4. Several simulational experiments have been carried out in which elements of new types with higher qualities than those currently existing could appear in the popula- tion. In all experiments there were five types in the initial state of the population. Proba- bilities of the appearance of one element in one step were as follows: for the 6th type, 0.1; for the 7th type, 0.07; for the 8th type, 0.05.
The types' qualities were, respectively, 1, 1.1, 1.2. 1.3, 1.4, 1.5, 1.6, and 1.7. Other parameters of the discrete model -A = 0.3, M = 1000, N(0) = 1300, 100, 80, 80, 3, 0,0,O]. The results of the experiments are shown in Figures 5 and 6. The incorporation of new types into the population is quite difficult. This is especially visible in Figure 5a, where elements of the best quality (8th type) do not get a significant quantity. Elements of the 8th type occurred twice during the simulation-first from 8 to 14, then from 117 to 121-and afterward they were superseded in spite of their best qualities.
Changes of the average quality are shown in Figure 5 . where the great influence of random factors is visible.
All other experiments with different models' parameters suggest the great intluence
H. KWASNICKA ET AL.
Fig. 2. Elements number in simulation run d 5vc-type pmcesa.
Fig. 3. Average quality in simulation run d five-type process.

TECHNOLOGICAL SUBSTITUTION FORECASTING
Fig. 4. Deterministic and probabilistic behavior of discrete (a) and continuous (b) models: --,,estimated average values, d e t e r m i n i s t i c model. ----average values t standard devia- tions. e x a m p l e s of variations.

H. KWASNICKA ET AL.
20 roo jAL 0 10 20 U ) 40 50
Fig. 5. Impact of potential innovations on process behavior.
of random factors on the behavior of new types that might possibly be incorporated, especially in the first phase, when the number of elements is low (in experiments with fewer than five elements; the random superseding of the best elements did not occur when the number of elements was greater than five).
In the authors' opinion, results obtained from experiments with variable qualities of elements are very interesting. The results were obtained for two types of variations of qualities-deterministic and random. The results are shown in Figure 7; other conditions N(0) = [40, 30,20, 8 , 2 ] , 4 = 1,q; = 1.1,q; = 1.2,qy = 1.3,q: = 1 . 4 . I t c a n b e seen that the changes of the number of elements are strongly deterministic and from the quantitative point of view do not greatly depend on the character of the quality changes. It seems that the average of quality during a long period of time is the most important factor in this situation.
Before applying the algorithm to the forecasting of the real processes, a prognosis of some "unreal" processes has been made. The results obtained during the simulation of the extended version of a discrete model in which new types of elements may appear (pre- sented in [6]) were used as the input data to the algorithm. One of those testing prognoses

TECHNOLOGICAL SUBSTITUTION FORECASTING
Fig. 6. Average qualities respecting realizations in Figure 5.
is shown in Figure 9. The changes of the state of the population are plotted in Figure 8. Only the types presented in the initial moment were involved in the process of forecasting (i.e., it was assumed that types denoted by A , B, and C in Figure 8 did not originate during the simulation). We must take into account that in t = 30 there existed three new types and the quantity of one of these types was equal to 1,000. This and other testing forecasts have suggested that this algorithm may be used in forecasting real processes. A prognosis of world energy consumption obtained from different materials was developed as an example of an application of the forecasting algorithm. The necessary statistical data were taken from Marchetti and Nakinovic [9].
The history of changes in the state of the population during the period 1951-1961 was used to identify the model's parameters. It makes it possible to compare the real history of the process in the years 1962-1974 with the prognosis. In the period 1951-1961 three types of raw materials were used as the main source of energy: natural gas, and coal. Shares of nuclear energy and wood during the period considered were very small and therefore omitted. Furthermore, three possible scenarios with nuclear energy are presented.
The second algorithm (reproduction with gamma distribution) was used to forecast. The parameters obtained during identification were as follows: M = 2.0192-lo9, A =
4.8148. b = 0.142, q, = 103.787, q, = 105.036, q, = 100. The first simulational experiment was made under the assumption that the initial moment is in 1951.
In this case an evaluation of the identification quality is possible (the dashes during the period 1951-1961 in Figure 10). Next, the year 1961 was used as the initial moment. The estimated, expected values and standard errors are shown in Figure 10. The horizon of prognosis is shown in Table 1. Even a great quality of the corporated type (e.g., by nuclear energy) cause the time after which the share of the new type is noticeable to be decades.

H. KWASNICKA ET AL.
Fig. 7. Nomber of ekmenb in renlizations Pswming different evPIOatioa-reproduction p r d n r r s : ~ d o m evaluation with uniform distributions (qf - 0, 15, qt + 0, 15)-the m s u g i ~ of distribu- tions coupk together-aad deterministic repmductioa, d e t e r m i n i s t i c evaluation and random re- production with qi = qt + 0, 15 sin (: t + ~ i ) Q, = W, Q, = 90", Q, = W, Q, = 27W, Q, = 180°, d e t e r m i n i s t i c evaluation qi = qt and detvministic reproduction, ----determinktic evaluation and random reproduction with the Poiason distribution.
Figure 11 shows the results of three simulational experiments of the 4th type. The results were obtained under the assumption that the quality of the 4th type was equal to 115 and 120, respectively. The share of the nuclear energy in the period 1961-1974 was much lower than that of other sources (in 1974 less than 1.5%), but it was possible to use these data for quality identification. The quality of nuclear energy obtained from identification was equal to 121.7.
Conclusions The proposed model of a technological substitution is heuristical and has been built
on the basis of biological intuitions, especially those adopted from the theory of popula- tion dynamics and the theory of evolution. The model described competition and substitu- tion among more than two types of objects. From the theoretical point of view there are no constraints on the number of types that may be considered by the model presented here, but from the computational point of view the number of types should be fewer than ten. For greater number of types the identification time of the model's parameters may be qu~te

TECHNOLOGICAL SUBSTITUTION FORECASTING
Fig. 8. Elements amber for some types in exemplary mdhtloo.
Fig. 9. Forecasting results: e x e m p l a r y realizations, d e t e r m i n i s t i c prognosis, ----rendom prognasis realization.

56 H. KWASNICKA ET AL.
Fig. 10. World energy consumption-comparison quality of identification and forecasting results witb real behavior: r e a l pmces, forecasts since 1951, ----forecasts since 1961, --,dvemge values t standard deviations.
TABLE 1 The Horizon of Prognosis
Quality of 4th Tyw Time of Inserting Horizon of Prognosis

TECHNOLOGICAL SUBSTITUTION FORECASTING 57
- w ~ t h w t nuclear enerqy --- quality of nucleor energy 9, = 115
qualify of nuclear energy 9, = 120
10
5
Fig. ll. Scenarios for nuclear energy involrcd.
long. The proposed forecasting algorithm does not need any economic information about the forecasted process, and it seems to be very convenient from the practical viewpoint. However, in order to use this method it is necessary to collect historical data on changes of the state of population (number of different types of elements). The similarity of the dynamic characteristics of real processes of the development [7J and the behavior of the model is prominent.
The authors would like to thank Pi-@ Zvgmunt Szparkaoskifbr his comments and suggestions on the original manuscript.

58 H. KWASNICKA ET AL.
References I . Blackman. A. W., Seligman, E. J., and Soligiem, G. C., An Innovation Index Based on Factor Analysis,
Technological Forecasting and Social Change 4: 301-3 16 (1973). 2. Feller, W., An lnrroduction to Probabiliry Theory and Its Applicationr, vol. I, Wiley. New York. 1 %I. 3. Fisher, J. C., and Ry, R. H., A Simple Substitution Model of Technological Change, Technological
Forecasting and Social Change 3: 75-88 (1971). 4. Fisher. R. A., The Genetical Theory qCNmral Selection, Dover, New York. 1958. 5. Kwainicka, H., Wykorrystanie modeli d y ~ m i k i populacji w prognoz-iu (Use q' Population Dynamic
Models into Forecasting). Doctoral thesis, repon 104, Institute of Technical Cybemetics, Wroclaw, 1979. 6. Kwainicki, W., Symulacja pewnej k l q ewolucyjnych procesdw ronvoju (Simulation 4Some Evolutionary
Processes 4 Development) Docad thesis. repon 105, Institute of Technical Cybemetics, Wroclaw 1979. 7. Linstone, H. A., and Sahal, D. (eds.), Technological Substinuion. Elsevier. New Yo*, 1976. 8. Mansfield, E.. Technological Change and Rate of Imitation, Economem'ca 29 (October 1%1). 9. Marchetti, C., and Nakicenovic. N., The Dynamics of Energy Systems and the Logistic Substitution
Model, vol. I, Administrative Report, IIASA, Laxenburg. 1978. 10. Stem, M. 0.. Ayres, R. U.. and Shapanka, A.. A Model for Forecasting Technological Substitution,
Technological Forecasting and Social Change 8: 353-364 (1975). I I . S t a r . J. G.. Use of Decision Modeling for Substitution Analysis: Application lo Acceptance of New
Electricity-generaring Technologies, Technological Forecasting and Social Change 12: 337-352 (1978).
Received 15 December 1981