Surfacescienceinvestigations oftheroleofCO2...
16
rsta.royalsocietypublishing.org Research Cite this article: Edridge JL, Freimann K, Burke DJ, Brown WA. 2013 Surface science investigations of the role of CO 2 in astrophysical ices. Phil Trans R Soc A 371: 20110578. http://dx.doi.org/10.1098/rsta.2011.0578 One contribution of 11 to a Theme Issue ‘Surface science in the interstellar medium’. Subject Areas: astrochemistry Keywords: adsorption, interstellar ices, temperature-programmed desorption, infrared spectroscopy, dust grains Author for correspondence: Wendy A. Brown e-mail: [email protected] † Present address: Division of Chemistry, School of Life Sciences, University of Sussex, Brighton BNI 9QJ, UK. Surface science investigations of the role of CO 2 in astrophysical ices John L. Edridge, Kati Freimann, Daren J. Burke and Wendy A. Brown † Department of Chemistry, University College London, 20 Gordon Street, London WC1H 0AJ, UK We have recorded reflection–absorption infrared spectroscopy (RAIRS) and temperature-programmed desorption (TPD) data for a range of CO 2 -bearing model astrophysical ices adsorbed on a graphitic dust grain analogue surface. Data have been recorded for pure CO 2 , for CO 2 adsorbed on top of amorphous solid water, for mixed CO 2 :H 2 O ices and for CO 2 adsorbed on top of a mixed CH 3 OH : H 2 O ice. For the TPD data, kinetic parameters for desorption have been determined, and the trapping behaviour of the CO 2 in the H 2 O (CH 3 OH) ice has been determined. Data of these types are important as they can be used to model desorption in a range of astrophysical environments. RAIR spectra have also shown the interaction of the CO 2 with H 2 O and CH 3 OH and can be used to compare with astronomical observations, allowing the accurate assignment of spectra. 1. Introduction Ultra-high-vacuum (UHV) surface science techniques have an important role to play in helping our understanding of surface processes that are of relevance in a range of astrophysical environments [1], such as comets, planetary atmospheres and the interstellar medium (ISM). In particular, techniques such as temperature-programmed desorption (TPD) and surface infrared spectroscopy, especially reflection–absorption infrared spectroscopy (RAIRS), give data that help us to model these environments using realistic conditions. Here, we will demonstrate the role that surface science techniques play in understanding the thermal processing of model interstellar ices, using CO 2 - and H 2 O- containing ices as an illustrative example. 2013 The Author(s) Published by the Royal Society. All rights reserved. on June 5, 2018 http://rsta.royalsocietypublishing.org/ Downloaded from
-
Upload
vuongkhanh -
Category
Documents
-
view
217 -
download
4
Transcript of Surfacescienceinvestigations oftheroleofCO2...

rsta.royalsocietypublishing.org
ResearchCite this article: Edridge JL, Freimann K,Burke DJ, BrownWA. 2013 Surface scienceinvestigations of the role of CO2 inastrophysical ices. Phil Trans R Soc A 371:20110578.http://dx.doi.org/10.1098/rsta.2011.0578
One contribution of 11 to a Theme Issue‘Surface science in the interstellar medium’.
Subject Areas:astrochemistry
Keywords:adsorption, interstellar ices,temperature-programmed desorption,infrared spectroscopy, dust grains
Author for correspondence:Wendy A. Browne-mail: [email protected]
†Present address: Division of Chemistry,School of Life Sciences, University of Sussex,Brighton BNI 9QJ, UK.
Surface science investigationsof the role of CO2 inastrophysical icesJohn L. Edridge, Kati Freimann, Daren J. Burke and
Wendy A. Brown†
Department of Chemistry, University College London,20 Gordon Street, LondonWC1H 0AJ, UK
We have recorded reflection–absorption infraredspectroscopy (RAIRS) and temperature-programmeddesorption (TPD) data for a range of CO2-bearingmodel astrophysical ices adsorbed on a graphitic dustgrain analogue surface. Data have been recorded forpure CO2, for CO2 adsorbed on top of amorphoussolid water, for mixed CO2 : H2O ices and for CO2adsorbed on top of a mixed CH3OH : H2O ice. Forthe TPD data, kinetic parameters for desorption havebeen determined, and the trapping behaviour of theCO2 in the H2O (CH3OH) ice has been determined.Data of these types are important as they can beused to model desorption in a range of astrophysicalenvironments. RAIR spectra have also shown theinteraction of the CO2 with H2O and CH3OH and canbe used to compare with astronomical observations,allowing the accurate assignment of spectra.
1. IntroductionUltra-high-vacuum (UHV) surface science techniqueshave an important role to play in helping ourunderstanding of surface processes that are of relevancein a range of astrophysical environments [1], suchas comets, planetary atmospheres and the interstellarmedium (ISM). In particular, techniques such astemperature-programmed desorption (TPD) and surfaceinfrared spectroscopy, especially reflection–absorptioninfrared spectroscopy (RAIRS), give data that help usto model these environments using realistic conditions.Here, we will demonstrate the role that surface sciencetechniques play in understanding the thermal processingof model interstellar ices, using CO2- and H2O-containing ices as an illustrative example.
2013 The Author(s) Published by the Royal Society. All rights reserved.
on June 5, 2018http://rsta.royalsocietypublishing.org/Downloaded from

2
rsta.royalsocietypublishing.orgPhilTransRSocA371:20110578
......................................................
CO2 is an important molecule in the ISM, where it is predominantly found in the solid phase,with typically less than 5% being found in the gas phase [2]. Infrared observations from theSpitzer space telescope [3–6] and the Infrared Space Observatory (ISO) [7–10] have shown thatCO2 is a major constituent of the icy mantles that accumulate on the surface of dust grains indense interstellar clouds [11]. In these dense molecular clouds, the major constituent of the icesis H2O, which typically constitutes around 60–70% of the ices [12–14]. Towards low- and high-mass stars, field stars and Galactic Centre sources, CO2 has abundances of 10–23% relative toH2O ice [15], and abundances as high as 37% have been observed in low- and intermediate-mass sources [15,16]. CO2 is also a major constituent of the atmospheres of planetary bodiessuch as Venus and Mars. CO2 condensation and sublimation is particularly relevant on Mars,since the CO2 condenses at the poles to form solid CO2, which then sublimates during thesummer [17]. Hence, understanding the cosmic evolution of CO2, including characterizing itsformation [18,19] and its role in the formation of larger carbon-bearing species, is a key problemin astrophysics. CO2 is also a powerful tracer molecule for investigations of the composition,thermal and radiation history of an icy mantle [20,21].
Surface infrared studies of pure CO2 and of CO2-bearing ices, using transmission andreflection infrared techniques, have been undertaken on a range of surfaces, including CsI[15,20–29], Si [30–36], MgO [37–39], NaCl [40–43], Ge [44], zeolitic [45], carbonaceous [44,46],Al [47] and Au [48] surfaces. The infrared spectrum of CO2 differs depending on the compositionof the ice matrix, whether apolar (CO, CO2, O2 and N2 rich [21,49]) or polar (H2O and CH3OHrich [21,49]). Studies show that the CO2 υ3 stretch, seen at 2349 cm−1 in the gas phase, shiftsfurther in polar ices (7–15 cm−1) than in apolar ices (2–8 cm−1) [23]. Owing to structural changesthat occur in the ice (for example, the formation of amorphous or crystalline phases), all ofthe infrared bands of CO2 have also been found to be dependent on the temperature of theCO2-bearing ice.
TPD experiments have been conducted on pure CO2 and CO2-bearing polar ices on a range ofsurfaces [32,34,38,50,51]. TPD spectra for CO2 desorption from an Au surface [50] and from highlyoriented pyrolytic graphite (HOPG) [51] show that multilayer CO2 desorbs at around 80 K. Tosimulate ices in the ISM, where H2O is the dominant constituent, several groups have also studiedCO2/H2O ices. As for other molecules [1], H2O plays an important role in the desorption of CO2,as CO2 is able to trap in and diffuse through the H2O ice film [32,38,50]. CO2 desorption fromCO2-bearing layered and mixed ices occurs well above the multilayer desorption temperatureof CO2, coincident with the amorphous to crystalline phase transition of H2O ice [30,43,50]. Thetrapping and diffusion of CO2 within other polar ice matrices have also been studied. TPD spectrarecorded for CO2 desorption from CO2 : CH3OH ices adsorbed on Si at 85 K [35] show that CO2also traps within the CH3OH film. As observed for H2O, the amorphous to crystalline phasetransition of CH3OH ice strongly influences the desorption of the CO2 [34].
Here, we present surface science studies of the adsorption and thermal processing of a rangeof CO2-containing ices adsorbed on a model carbonaceous dust grain analogue surface (HOPG).RAIRS and TPD have been used to characterize the adsorption and thermal processing of pureCO2, CO2 adsorbed on top of amorphous solid water (ASW), CO2 in binary ice mixtures withH2O, as well as CO2 adsorbed on top of a mixed CH3OH : H2O ice. In all cases, the relevance ofthe information obtained with respect to interstellar ices is discussed in order to illustrate the roleof surface science techniques in understanding astrophysical processes.
2. Experimental methodologyExperiments were performed in a UHV chamber with a background pressure less than or equal to2 × 10−10 mbar. The HOPG sample was purchased from Goodfellows Ltd and was cleaved priorto mounting using the ‘Scotch Tape’ method [52]. The sample was mounted on the end of a closedcycle helium refrigerator, allowing the sample to be cooled to a base temperature of around 15 K.The sample temperature in these experiments was approximately 30 K. The sample was cleanedbefore each experiment by annealing at 300 K in UHV for 3 min. Sample cleanliness was confirmed
on June 5, 2018http://rsta.royalsocietypublishing.org/Downloaded from

3
rsta.royalsocietypublishing.orgPhilTransRSocA371:20110578
......................................................
by the absence of any desorption during TPD experiments performed with no dosage. Researchgrade CO2 (BOC 99.9%), CH3OH (Fisher Scientific, 99.9%) and H2O (distilled, deionized) wereused, and the H2O and CH3OH were purified by repeated freeze–pump–thaw cycles. Ices weregrown in situ by backfilling the chamber through a high-precision leak valve. All exposures aremeasured in Langmuir (L), where 1 L = 10−6 mbar s. RAIR spectra were recorded using a MattsonInstruments RS1 Research Series Fourier transform infrared spectrometer and liquid-nitrogen-cooled mercury cadmium telluride (MCT) detector. Spectra were recorded at a resolution of2 cm−1 and are the result of the co-addition of 128 scans. For the annealed RAIRS experiments,the sample was held at the pre-determined temperature for the duration of the experiment. TPDspectra were recorded at a heating rate of 0.50 ± 0.01 K s−1 with a Hiden Analytical HAL 201quadrupole mass spectrometer.
3. Results and discussion
(a) Temperature-programmed desorption data(i) Pure CO2 ices on highly oriented pyrolytic graphite
While pure CO2 ices are not seen in the ISM, the study of pure ices is important to determinewhether any adsorbate–substrate interactions are involved in the growth and desorption ofthe ices. Kinetic data can also be derived from the TPD spectra of pure ices, which canthen be incorporated into astrophysical models simulating the desorption of molecular ices onastronomical time scales [53–55].
Figure 1 shows TPD spectra recorded for CO2 adsorbed on HOPG at 33 K. At the lowestCO2 exposure, one peak is observed at 83 K with a low-temperature shoulder at 77 K. As shownin figure 1, this peak can be assigned to the desorption of monolayer CO2, directly associatedwith the HOPG surface. This peak shows characteristics of first-order desorption, as expectedfor a monolayer, with a constant peak temperature and an asymmetric peak shape. Further CO2exposure shows a gradual increase in the size and temperature of the low-temperature shoulder,and at higher CO2 exposures the low-temperature shoulder merges into the main peak and growsto dominate the spectrum. This main peak increases in temperature with increasing CO2 doseand can be assigned to multilayer desorption of CO2. This peak does not saturate with increasingCO2 exposure and shows characteristics of zero-order desorption. Comparing with previous TPDstudies of physisorbed CO2 on Au and HOPG [50,51], good agreement is observed.
The TPD data in figure 1 can be analysed in order to determine the kinetic parameters thatgovern the desorption of CO2 from HOPG. Desorption parameters calculated from UHV TPDstudies are crucially important, as they can be incorporated into astrophysical models in orderto determine desorption temperatures on an astrophysical time scale, as well as the residencetimes of the molecules in interstellar ices [54]. Desorption temperatures obtained from laboratoryTPD data cannot be directly incorporated into astrophysical models, because desorption is a non-equilibrium process that depends on the rate at which the ice is heated. Typical heating rates of icymantles in hot cores are around 1 K century−1 [55,56], compared with 0.5 K s−1 in the laboratory.The kinetic parameters determined in the laboratory are therefore used to determine the expecteddesorption temperatures of ice components under real interstellar conditions. In order to be asrealistic as possible, models need to incorporate both an appropriate heating rate and also correctinformation about the trapping of species within interstellar ices (see later).
Kinetic analysis of the TPD spectra in figure 1 was undertaken using leading edgemethodologies described in detail previously [1]. The average monolayer desorption order wasdetermined to be 0.73 ± 0.02. The desorption order of the multilayers could not be determined,because the leading edges of the TPD spectra at higher doses (inset figure 1) are not perfectlyshared, as would normally be expected for multilayer desorption. It is not clear what causes theleading edges to not be perfectly shared, although it is likely that it could be due to the formationof crystalline CO2, which is known to have taken place by 87 K [47]. Analysis of the data to
on June 5, 2018http://rsta.royalsocietypublishing.org/Downloaded from

4
rsta.royalsocietypublishing.orgPhilTransRSocA371:20110578
......................................................
CO
2 de
sorp
tion
rate
(ar
b. u
nits
)
temperature (K)70 80 90
10L
70 75 80 85 90 95 100
multilayer monolayer
50L100L200L
10L7L5L3L2L1L
Figure 1. TPD spectra for CO2 adsorbed on HOPG at 33 K. The main figure shows lower doses of CO2, whereas the inset showsthe growth of multilayer CO2. (Online version in colour.)
determine the desorption order of the multilayer gives small negative values, which is clearlyunrealistic. The desorption order of multilayer CO2 was therefore assumed to be equal to zero,in agreement with previous studies [50]. The desorption energies of monolayer and multilayerCO2 adsorbed on HOPG were determined to be 20.2 ± 2.3 and 24.8 ± 1.6 kJ mol−1, respectively,in agreement with previous work [20,32,34,46,51]. Finally, the pre-exponential values for thedesorption of CO2 were determined to be 9.9 × 10¹⁴±0.9 s−1 and 1.1 × 1030±1.5 mol m−2 s−1 formonolayer and multilayer CO2, respectively.
Comparing the kinetic parameters for CO2 desorption determined here and those cited inthe literature [20,32,34,46,51], some striking differences are evident. Ulbricht et al. [51] assumeda desorption order of zero from qualitative inspection of their data for multilayer ices, butcalculated a first-order pre-exponential factor of 6 × 10¹⁴±1 s−1. Sandford & Allamandola [20],Gálvez et al. [32] and Maté et al. [34] also assumed a desorption order of zero, but used a first-order pre-exponential factor of 3 × 10¹² s−1, which is clearly not accurate. The determination ofaccurate kinetic parameters is of great importance in modelling desorption in molecular cloudsand star-forming regions in the ISM [54]. An example of this is illustrated in figure 2, whichshows a simulated desorption spectrum for a 0.3 µm thick interstellar ice, containing H2O andCO2 (13%). An astrophysically relevant heating rate of temperature = 1.706 × 10⁻⁴ × time1.289
was used, characteristic of a hot core surrounded by a medium-mass star, as used previously[53]. This spectrum was simulated using kinetic data derived from the TPD spectra shown infigure 1, and also using information about the trapping of CO2 in H2O ice (described here later).The simulations were based on a model originally developed by Collings et al. [50]. Clearly, thedesorption of surface CO2 at low temperatures occurs at a much lower temperature than observedin the laboratory. In addition, high-temperature features corresponding to the desorption ofCO2 along with the water ice film (see later) are also observed. These data show the power oflaboratory TPD studies, which allow us to simulate the desorption of ‘real’ interstellar ices in thisway, thus providing data that can be incorporated into astronomical models.
(ii) CO2 adsorbed on amorphous solid water
The study of layered ices is important in order to understand the effect of H2O on the adsorptionand desorption of CO2. There is evidence that H2O-rich ices undergo segregation on warming [57]
on June 5, 2018http://rsta.royalsocietypublishing.org/Downloaded from

5
rsta.royalsocietypublishing.orgPhilTransRSocA371:20110578
......................................................
temperature (K)
surface
40 60 80 100
co-desorption
volcano
deso
rptio
n ra
te (
arb.
uni
ts)
Figure 2. Simulated TPD spectra of a 0.3µm thick 13% CO2 : H2O ice using a heating rate of T = 1.706 × 10⁻⁴ × time1.289
[53], characteristic of the warming of a hot core near to a mediummass star. Solid straight line denotes CO2 and the dotted linedenotes H2O.
and so the study of layered ices is of direct relevance to astrochemistry. TPD data were recordedfor various doses of CO2 adsorbed on 100 L of pre-adsorbed water. ASW is known to be formedon a surface when it is vapour deposited on a cold substrate at temperatures below 140 K [38,58],and hence the CO2 layers are adsorbed on ASW as expected in the ISM.
Figure 3a shows TPD spectra for a range of CO2 doses adsorbed on 100 L of ASW at 33 K.Three desorption features are observed in the spectrum (figure 3a). A broad, low-temperature,peak centred at 90 K is observed in addition to two high-temperature peaks, not observed forpure CO2 ice (figure 1). Increasing the CO2 exposure leads to an increase in the size of the low-temperature peak with no shift in peak temperature. The two high-temperature peaks do notshow any significant change in peak temperature upon increasing CO2 dose, but they do appearto saturate as the CO2 dose increases. Figure 3a also shows the desorption peak recorded forH2O. The H2O TPD is unaffected by the adsorption of a layer of CO2 on top of the ASW. TheH2O TPD peak shows one main peak, with a desorption temperature of 167 K (characteristic ofthe desorption of crystalline H2O) [59], and a low-temperature shoulder at 158 K, assigned to theamorphous to crystalline phase transition of ASW [59].
Assignment of the CO2 desorption features seen in figure 3a can be made by comparison withthe TPD spectra of pure CO2 (figure 1), with previous studies of layered CO2/H2O ices [32,38,47,50] and with studies of layered ices containing other volatiles adsorbed on ASW [50,60,61]. Thebroad, low-temperature, CO2 TPD peak seen in figure 3a can be assigned to the desorption ofpure CO2 from the surface of the ASW. The peak is broadened, compared with that observed forCO2 adsorbed on HOPG, owing to the highly heterogeneous nature of the ASW surface, whichhas a wide range of adsorption sites. The two high-temperature CO2 TPD peaks in figure 3a arecoincident with the features observed in the H2O TPD spectrum and can hence be assigned to thedesorption of CO2 trapped within the porous ASW surface. These features are assigned to volcano
on June 5, 2018http://rsta.royalsocietypublishing.org/Downloaded from
6
rsta.royalsocietypublishing.orgPhilTransRSocA371:20110578
......................................................60 80
surface
CO
2 de
sorp
tion
rate
(ar
b. u
nits
)
140
2 L(a) (b)
ASW thickness
10 L50 L
100 L
3 L5 L
10 L
160 180
co-desorption
co-desorption
volcano
volcano
H2O
100 120 140 160 180 200 140 150 160 170 180
temperature (K) temperature (K)
15 L20 L
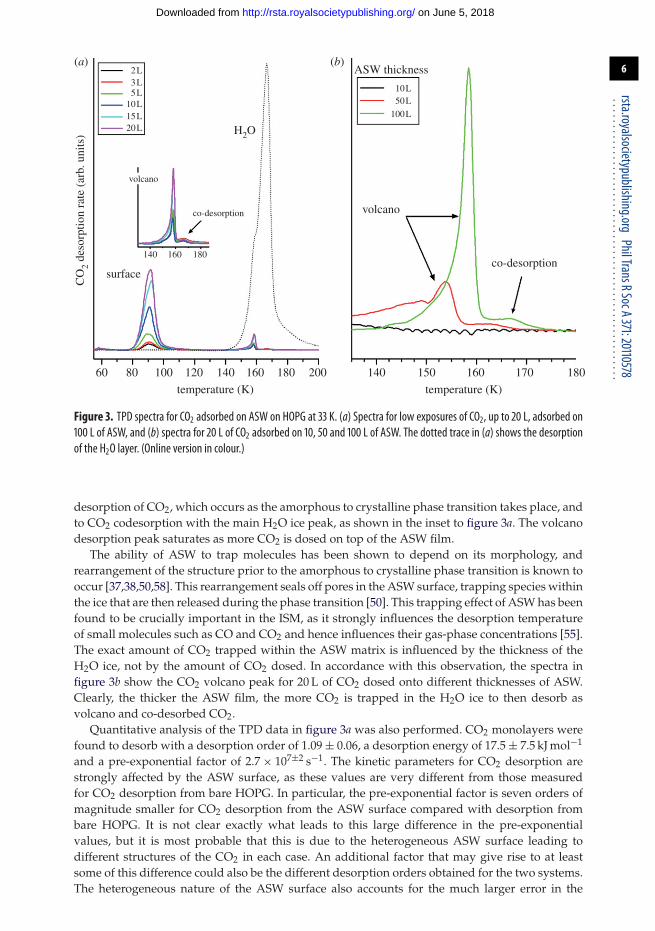
Figure 3. TPD spectra for CO2 adsorbed on ASW on HOPG at 33 K. (a) Spectra for low exposures of CO2, up to 20 L, adsorbed on100 L of ASW, and (b) spectra for 20 L of CO2 adsorbed on 10, 50 and 100 L of ASW. The dotted trace in (a) shows the desorptionof the H2O layer. (Online version in colour.)
desorption of CO2, which occurs as the amorphous to crystalline phase transition takes place, andto CO2 codesorption with the main H2O ice peak, as shown in the inset to figure 3a. The volcanodesorption peak saturates as more CO2 is dosed on top of the ASW film.
The ability of ASW to trap molecules has been shown to depend on its morphology, andrearrangement of the structure prior to the amorphous to crystalline phase transition is known tooccur [37,38,50,58]. This rearrangement seals off pores in the ASW surface, trapping species withinthe ice that are then released during the phase transition [50]. This trapping effect of ASW has beenfound to be crucially important in the ISM, as it strongly influences the desorption temperatureof small molecules such as CO and CO2 and hence influences their gas-phase concentrations [55].The exact amount of CO2 trapped within the ASW matrix is influenced by the thickness of theH2O ice, not by the amount of CO2 dosed. In accordance with this observation, the spectra infigure 3b show the CO2 volcano peak for 20 L of CO2 dosed onto different thicknesses of ASW.Clearly, the thicker the ASW film, the more CO2 is trapped in the H2O ice to then desorb asvolcano and co-desorbed CO2.
Quantitative analysis of the TPD data in figure 3a was also performed. CO2 monolayers werefound to desorb with a desorption order of 1.09 ± 0.06, a desorption energy of 17.5 ± 7.5 kJ mol−1
and a pre-exponential factor of 2.7 × 10⁷±2 s−1. The kinetic parameters for CO2 desorption arestrongly affected by the ASW surface, as these values are very different from those measuredfor CO2 desorption from bare HOPG. In particular, the pre-exponential factor is seven orders ofmagnitude smaller for CO2 desorption from the ASW surface compared with desorption frombare HOPG. It is not clear exactly what leads to this large difference in the pre-exponentialvalues, but it is most probable that this is due to the heterogeneous ASW surface leading todifferent structures of the CO2 in each case. An additional factor that may give rise to at leastsome of this difference could also be the different desorption orders obtained for the two systems.The heterogeneous nature of the ASW surface also accounts for the much larger error in the
on June 5, 2018http://rsta.royalsocietypublishing.org/Downloaded from

7
rsta.royalsocietypublishing.orgPhilTransRSocA371:20110578
......................................................
Table 1. Measured kinetic parameters for the desorption of a range of CO2-containing ices adsorbed on HOPG at around 30 K.
monolayer adsorption multilayer adsorption
desorption pre-exponential desorption pre-exponentialorder of energy factor order of energy factor
ice system desorption (kJ mol−1) (s−1) desorption (kJ mol−1) (mol m−2 s−1)
pure CO2 0.73 ± 0.20 20.2 ± 2.3 9.9 × 10¹⁴±0.9 0 24.8 ± 1.6 1.1 × 1030±1.5. . . . . . . . . . . . . . . . . . . . . . . . . . . . . . . . . . . . . . . . . . . . . . . . . . . . . . . . . . . . . . . . . . . . . . . . . . . . . . . . . . . . . . . . . . . . . . . . . . . . . . . . . . . . . . . . . . . . . . . . . . . . . . . . . . . . . . . . . . . . . . . . . . . . . . . . . . . . . . . . . . . . . . . . . . . . . . . . . . . . . . . . . . . . . . . . . . . . . . . . . .
CO2/ASW 1.09 ± 0.06 17.5 ± 7.5 2.7 × 10⁷±2 0 25.4 ± 1.4 2.1 × 1030±0.5. . . . . . . . . . . . . . . . . . . . . . . . . . . . . . . . . . . . . . . . . . . . . . . . . . . . . . . . . . . . . . . . . . . . . . . . . . . . . . . . . . . . . . . . . . . . . . . . . . . . . . . . . . . . . . . . . . . . . . . . . . . . . . . . . . . . . . . . . . . . . . . . . . . . . . . . . . . . . . . . . . . . . . . . . . . . . . . . . . . . . . . . . . . . . . . . . . . . . . . . . .
CO2/CH3OH : H2O — — — 0 24.3 ± 2.4 2.3 × 1029±0.8. . . . . . . . . . . . . . . . . . . . . . . . . . . . . . . . . . . . . . . . . . . . . . . . . . . . . . . . . . . . . . . . . . . . . . . . . . . . . . . . . . . . . . . . . . . . . . . . . . . . . . . . . . . . . . . . . . . . . . . . . . . . . . . . . . . . . . . . . . . . . . . . . . . . . . . . . . . . . . . . . . . . . . . . . . . . . . . . . . . . . . . . . . . . . . . . . . . . . . . . . .
desorption energy determined for CO2 desorption from ASW, since the value obtained is anaverage of the range of sites seen on the heterogeneous surface. The data in table 1 suggest thatCO2 does not interact as strongly with ASW as it does with HOPG, leading to a lower desorptionenergy. However, because of the large error bars for the desorption energy of CO2 desorbing fromASW, this is not conclusive. CO2 multilayers, as expected, have very similar desorption kineticparameters to those determined for pure CO2 adsorbed on HOPG. The desorption energy ofmultilayer CO2 adsorbed on ASW was found to be 25.4 ± 1.4 kJ mol−1, with a pre-exponentialfactor of 2.1 × 1030±0.5 mol m−2 s−1.
(iii) CO2 : H2O mixtures
The most astrophysically relevant ice systems are those in which volatile molecules are intimatelymixed with the ASW ice, as these ices more closely represent real astrophysical ices, which containa range of species, with H2O as the largest component.
Figure 4 shows a comparison of TPD spectra recorded for 100 L of a 15% CO2 : H2O mixed icewith spectra for pure and layered ices. The behaviour of the mixed ice is similar to that observedfor the binary layered ices, but with some important differences. In particular, the volcano peak,which occurs as the H2O amorphous to crystalline phase transition takes place, is the dominantpeak for the mixed ice. As already discussed, the volcano peak arises due to the trapping of theCO2 within the pores of the H2O ice as they close up during initial rearrangement of the H2Oice and prior to the amorphous to crystalline phase transition. In the layered ices, trapping ofthe CO2 only occurs in the top few layers of the H2O ice, whereas, in the mixed ice, trappingcan occur throughout the ice. Hence, it is unsurprising that a greater proportion of the CO2 istrapped in the mixed ice than in the layered ice. What is perhaps more surprising is that someCO2 desorption is observed at low temperatures, even for the mixed ice. This suggests that theCO2 is small enough to diffuse through the porous H2O ice structure to come off the surface atits ‘natural’ desorption temperature. This observation is confirmed by experiments when ASW isadsorbed on top of CO2, which show TPD spectra very similar to those observed in figure 3a. Alarger co-desorption peak is also observed for the mixed CO2 ice than for the layered ice, whichis again due to the fact that the CO2 is distributed throughout the ice.
(b) Reflection–absorption infrared spectroscopy dataAs well as TPD data, infrared studies can also tell us a great deal about the behaviourof astrophysically relevant ices. In particular, laboratory infrared studies are invaluable forcomparisons with astronomical observations, as they allow us to determine the phase (gas orsolid) and environment (polar or apolar) of various molecules observed in the ISM, as well as theexact composition of the interstellar ices (see §3).
on June 5, 2018http://rsta.royalsocietypublishing.org/Downloaded from

8
rsta.royalsocietypublishing.orgPhilTransRSocA371:20110578
......................................................
deso
rptio
n ra
te (
arb.
uni
ts)
pure ice
binary layer
mixed ice
H2O 100 L(a)
(b)
(c)
(d )
60 80 100 120 140 160 180
temperature (K)
Figure 4. A comparison of TPD spectra recorded for equivalent doses of pure CO2 ice on HOPG (d), CO2 adsorbed on top of 100 Lof ASW ice (c) and 100 L of a 15% CO2 : H2O ice co-deposited mixture (b). (a) The 100 L H2O TPD spectrum from the layered icefor comparison. All ices were deposited on an HOPG substrate at 33 K. (Online version in colour.)
(i) Pure CO2 ice
Figure 5a shows RAIR spectra recorded for CO2 adsorbed on HOPG at 28 K. Following a CO2exposure of 5 L, a single band is observed at 2373 cm−1. This band shifts to 2382 cm−1 withincreasing CO2 exposure up to 100 L. Two additional bands are seen in the RAIR spectra after aCO2 exposure of 30 L—a broad band centred at 2373 cm−1 and a low-intensity band at 2341 cm−1.Further increasing the CO2 exposure shows an increase in intensity of all bands, but no furtherfrequency shift.
From comparison with infrared spectra for CO2 adsorption on a range of surfaces [15,20–48,62]and with gas-phase CO2 spectra [63], assignment of the infrared bands seen in figure 5 canbe made. Gas-phase spectra show one peak at 2349 cm−1, assigned to the υ3 stretching modeof CO2. Hence the band at 2341 cm−1 can be assigned to the υ3 mode of CO2 physisorbed onHOPG at 28 K. The band seen at 2382 cm−1 is not seen in infrared studies of amorphous CO2 icesrecorded at normal incidence to the surface; however, this band is observed in infrared spectraof crystalline CO2 ices [27,64–68] and also in spectra of amorphous ices recorded at grazingincidence [23,30,31,36]. Infrared studies of crystalline CO2 ices generally show a broad, multi-peak, feature between 2340 and 2380 cm−1 [27,64–68]. In particular, Ovchinnikov & Wight [27]observed the transverse optical (TO) and orthogonal, or longitudinal optical (LO), modes of
on June 5, 2018http://rsta.royalsocietypublishing.org/Downloaded from

9
rsta.royalsocietypublishing.orgPhilTransRSocA371:20110578
......................................................
2400 2350
2382
wavenumber (cm–1) wavenumber (cm–1)
2450 2400 2350 2300
5L
2373
DR
/R
(a) (b)
2380
2378
2341
2341
4% 4%10 L
15 L20 L
30 L
40 L50 L
100 L
37 K
43 K
55 K
62 K
66 K73 K
Figure 5. (a) RAIR spectra of a range of exposures of CO2 adsorbed on HOPG at 28 K. (b) RAIR spectra of 100 L of CO2 adsorbedon HOPG at 28 K, following warming to a range of temperatures. (Online version in colour.)
the CO2 υ3 stretching mode, split as a consequence of the crystalline nature of the CO2 ice, tobe at 2344 and 2381 cm−1, respectively. However, this does not explain the observation of theband at 2382 cm−1 in amorphous ices. Instead, as discussed by Baratta & Palumbo [30,36] andBaratta et al. [31], and confirmed by studies in our laboratory [69], the observed LO–TO splittingis caused by coupling of polarized phonon vibrations within the CO2 ice with the electric fieldof the incident radiation at grazing incidence, known as the Berreman effect [70]. Hence thebands at 2382 and 2341 cm−1 are assigned to the LO and TO phonon modes of the υ3 stretchingvibration, respectively.
The LO phonon mode of the CO2 υ3 vibration increases in frequency with increasing CO2coverage and decreases in frequency with increasing surface temperature (figure 5b). Hence theposition of this band is directly related to the coverage of CO2 on the surface and this behaviouris not a consequence of the optical properties of CO2 [69]. The broad band at 2373 cm−1 hasnot previously been observed in the literature. However, since the coverage of CO2 on theHOPG surface affects the position of the LO phonon mode, this band could be caused by amodification of the polarization of the phonon vibrations within the ice. The CO2 ice is expectedto be heterogeneous and amorphous, which would cause disruptions to the phonon vibrationswithin the ice and therefore may affect the interaction of the incident light with the phonon mode.Hence this band is tentatively assigned to a weakly polarized LO phonon mode of the CO2 υ3stretching mode.
Figure 5b shows RAIRS data recorded following the warming of a 100 L CO2 ice to varioustemperatures indicated on the figure. Warming the ice to between 28 and 55 K shows no change inthe infrared bands at 2382 and 2341 cm−1, but the feature at 2373 cm−1 shifts down to 2367 cm−1.Warming the surface to 62 K leads to a broadening of the band at 2382 cm−1. Warming to 73 Kleads to the desorption of the CO2 ice, in agreement with the TPD desorption temperatureof around 84 K. No other effects are observed on warming of the pure CO2 ice adsorbed on
on June 5, 2018http://rsta.royalsocietypublishing.org/Downloaded from

10
rsta.royalsocietypublishing.orgPhilTransRSocA371:20110578
......................................................
22502300
2361
2346
2346
2376
CO2
CO2/H2O
CO2:H2O
CO2/CH3OH:H2O
2375
1%
235024002450
wavenumber (cm–1)
DR
/R
Figure 6. A comparison of RAIR spectra recorded for a range of CO2 ices adsorbed on HOPG at 30 K. The top spectrum is for pureCO2, the second from top spectrum is for CO2 adsorbed on 100 L of ASW, the third from top spectrum is for a 15% CO2 : H2O iceadsorbed on HOPG and the bottom spectrum is that recorded for CO2 adsorbed on top of 100 L of a 15% CH3OH : H2O mixed ice.In all cases, the CO2 dose is equivalent and is equal to 15 or 20 L, depending on the ice. (Online version in colour.)
HOPG. These observed frequency shifts are the opposite of those observed on adsorption, andsuggest that the exact vibrational frequency for CO2 depends on the coverage on the surface, asalready discussed.
(ii) Layered and mixed CO2 : H2O ices
Figure 6 shows a comparison of CO2 RAIR spectra for pure CO2 on HOPG (top spectrum), CO2adsorbed on ASW (second from top) and a CO2 : H2O mixture (third from top). In all cases, theamount of CO2 in the ice is roughly equivalent (15–20 L). Also included is an infrared spectrumfor CO2 adsorbed on top of a mixed CH3OH : H2O ice (bottom spectrum—see later for discussionof this spectrum).
It is clear from figure 6 that the presence of H2O in the ice makes a big difference to the infraredspectra that are observed. This shows the importance of modelling interstellar ices as realisticallyas possible, since the infrared spectra recorded are clearly very dependent on the compositionof the ice. As already discussed, pure CO2 adsorbed on HOPG at low doses gives rise to a bandat 2376 cm−1, assigned to the LO mode of the CO2 υ3 stretching mode. However, when CO2 isadsorbed either on top of H2O or in a mixture with H2O, a band at 2346 cm−1 is observed. Thisband is clearly characteristic of CO2 interacting with and/or trapped within the H2O ice matrix.This band does not occur due to LO–TO coupling and arises due to a real physical interactionbetween the CO2 and H2O ice. This is confirmed by infrared spectra that result from annealing100 L of CO2 ice adsorbed on top of ASW. The spectra that result from this experiment give a bandat 2346 cm−1—exactly as observed in figure 6—at temperatures above those at which pure CO2desorbs from the surface (figures 1 and 5). TPD spectra (figure 3) show that, at these temperatures,CO2 is trapped in the H2O ice, desorbing as volcano and co-desorbed CO2. Hence this infraredband arises due to the presence of CO2 trapped in, or interacting directly with, H2O ice. Exactlythe same effect is observed in infrared experiments resulting from the annealing of mixedCO2 : H2O ices, with a band at 2346 cm−1 finally disappearing from the infrared spectrumfollowing annealing to 160 K.
on June 5, 2018http://rsta.royalsocietypublishing.org/Downloaded from

11
rsta.royalsocietypublishing.orgPhilTransRSocA371:20110578
......................................................
(c) The effect of CH3OH on CO2-bearing icesMost laboratory surface science studies of interstellar ices study binary (two-component) ices,with H2O as the main component, as already discussed here. However, interstellar ices contain awide range of species, including H2O, CO, CO2 and CH3OH along with minority species suchas CH4 and OCS [71]. Therefore, to understand the thermal processing of real astrophysicalices, the current laboratory definition of these ices needs extending. CH3OH is typically thesecond most abundant species in interstellar ices and is the most abundant organic moleculedetected in cometary comae, interstellar ices and on a variety of bodies at the edge of ourSolar System. The abundance of CH3OH varies depending on the environment, ranging fromas low as 5% with respect to H2O in dark clouds, to around 30% near low- and high-mass protostars.
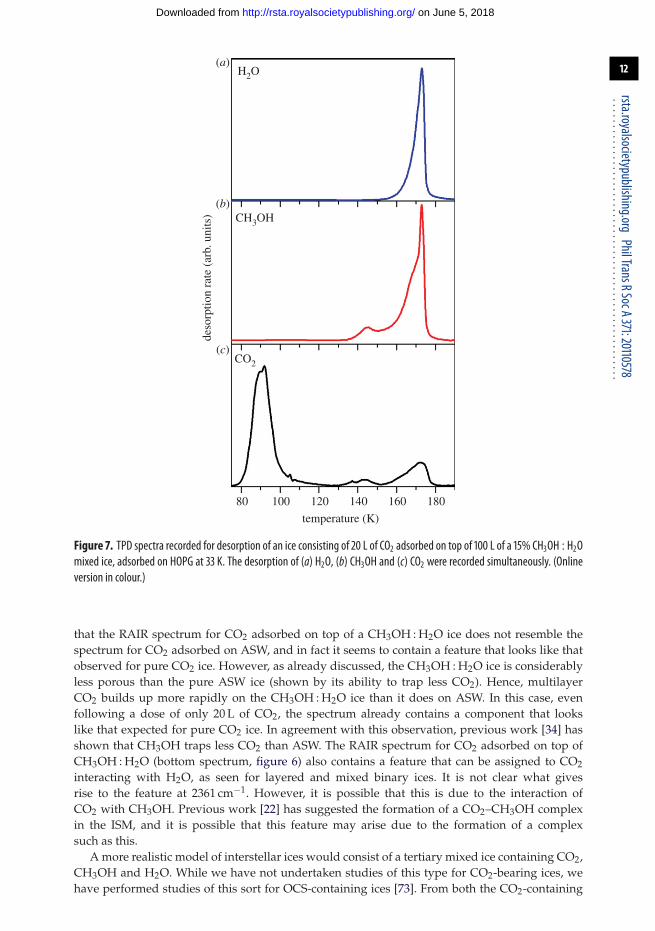
To study the effect of CH3OH on CO2-bearing ices, RAIR and TPD spectra were recorded forCO2 adsorbed on 100 L of a 15% CH3OH : H2O ice mixture adsorbed on HOPG at 33 K. TPDspectra for the adsorption of 20 L of CO2 on a mixed CH3OH : H2O ice are shown in figure 7.Several differences are observed when compared with the TPD spectra for layered and mixedices seen in figure 4. Firstly, the low-temperature shoulder on the leading edge of the H2O TPDtrace, characteristic of the H2O amorphous to crystalline phase transition, is not observed forthe CH3OH : H2O mixed ice. This is also observed for layered CH3OH/H2O ices [61] and arisesbecause CH3OH lowers the temperature of the H2O phase transition so that it occurs before theonset of H2O desorption [72].
However, the most important difference between the TPD spectra in figure 7 and those infigure 4 is the behaviour of the desorbing CO2. In particular, no volcano desorption is observedfor CO2 desorbing from the surface of a CH3OH : H2O ice. Instead, there are three main peaksfor CO2 desorption. A broad, low-temperature, peak centred at around 90 K is observed, which isassigned to CO2 desorption from the surface of the CH3OH : H2O ice. A second feature, possiblyconsisting of two peaks, is observed at around 140 K, which is coincident with a peak in theCH3OH desorption (middle spectrum, figure 7). This is assigned to the desorption of CO2 andCH3OH as the H2O amorphous to crystalline phase transition takes place at a considerably lowertemperature due to the presence of CH3OH in the ice. Finally, a third CO2 desorption peak isobserved at around 170 K, which is assigned to the co-desorption of CO2 trapped within theCH3OH : H2O ice.
Clearly, the presence of CH3OH in the ice affects the desorption behaviour of CO2considerably, demonstrating the importance of using the most realistic models possible whenperforming surface science studies of interstellar ices. This is also clearly demonstrated if theintegrated area of the CO2 TPD peaks for the trapped features desorbing from on top of ASW iscompared with the high-temperature peaks (due to trapped CO2 species) for CO2 desorbing fromon top of a CH3OH : H2O ice. In the latter case, the trapped CO2 desorption features correspond to2 L of CO2, whereas in comparison the trapped CO2 features desorbing from an ASW film equateto an 8 L exposure of CO2. Clearly, a CH3OH : H2O ice has less capacity to trap small volatilessuch as CO2 when compared with a pure H2O ice. This is most probably because some of thepores of the H2O are already filled with CH3OH. In addition, the structure of the CH3OH : H2Oice will be different when compared with pure H2O ice, owing to the presence of the CH3OH.
Quantitative analysis of TPD spectra was also conducted for CO2 adsorbed on CH3OH : H2Oice, although only for multilayers of CO2. CO2 multilayers were found to have a desorptionorder of zero, a desorption energy of 24.3 ± 2.4 kJ mol−1 and a pre-exponential factor of 2.3 ×1029±0.8 mol m−2 s−1. As expected, multilayer desorption does not depend on the nature of theunderlying substrate, as these parameters are very similar to those for pure CO2 and for CO2desorbing from on top of ASW.
RAIR spectra for CO2 adsorbed on top of CH3OH : H2O ice are also different from those forother ices, as seen in figure 6 (bottom spectrum). The spectrum for CO2 adsorbed on top of amixed CH3OH : H2O ice is a complex convolution of the spectrum for pure CO2 and that forCO2 interacting with H2O, with an additional feature at 2361 cm−1. At first glance, it is surprising
on June 5, 2018http://rsta.royalsocietypublishing.org/Downloaded from
12
rsta.royalsocietypublishing.orgPhilTransRSocA371:20110578
......................................................
H2O(a)
(b)
(c)
CH3OHde
sorp
tion
rate
(ar
b. u
nits
)
80 100 120 140 160 180
temperature (K)
CO2
Figure 7. TPD spectra recorded for desorption of an ice consisting of 20 L of CO2 adsorbed on top of 100 L of a 15% CH3OH : H2Omixed ice, adsorbed on HOPG at 33 K. The desorption of (a) H2O, (b) CH3OH and (c) CO2 were recorded simultaneously. (Onlineversion in colour.)
that the RAIR spectrum for CO2 adsorbed on top of a CH3OH : H2O ice does not resemble thespectrum for CO2 adsorbed on ASW, and in fact it seems to contain a feature that looks like thatobserved for pure CO2 ice. However, as already discussed, the CH3OH : H2O ice is considerablyless porous than the pure ASW ice (shown by its ability to trap less CO2). Hence, multilayerCO2 builds up more rapidly on the CH3OH : H2O ice than it does on ASW. In this case, evenfollowing a dose of only 20 L of CO2, the spectrum already contains a component that lookslike that expected for pure CO2 ice. In agreement with this observation, previous work [34] hasshown that CH3OH traps less CO2 than ASW. The RAIR spectrum for CO2 adsorbed on top ofCH3OH : H2O (bottom spectrum, figure 6) also contains a feature that can be assigned to CO2interacting with H2O, as seen for layered and mixed binary ices. It is not clear what givesrise to the feature at 2361 cm−1. However, it is possible that this is due to the interaction ofCO2 with CH3OH. Previous work [22] has suggested the formation of a CO2–CH3OH complexin the ISM, and it is possible that this feature may arise due to the formation of a complexsuch as this.
A more realistic model of interstellar ices would consist of a tertiary mixed ice containing CO2,CH3OH and H2O. While we have not undertaken studies of this type for CO2-bearing ices, wehave performed studies of this sort for OCS-containing ices [73]. From both the CO2-containing
on June 5, 2018http://rsta.royalsocietypublishing.org/Downloaded from

13
rsta.royalsocietypublishing.orgPhilTransRSocA371:20110578
......................................................
ices discussed here, and the OCS-bearing ices discussed in detail elsewhere, it is very clear thatCH3OH had a big effect on the desorption of small molecules from ices, and hence the importanceof modelling interstellar ices as realistically as possible is reinforced.
4. Summary and conclusionsSurface science investigations of the thermal processing of astrophysically relevant ices area powerful tool that allows crucial information to be determined about ices in a range ofastrophysical environments. We have recorded TPD data for several CO2- and H2O-containingices, and have determined the kinetic parameters for desorption in each case, as summarizedin table 1. Clearly, the multilayer desorption parameters are not dependent on the nature ofthe underlying substrate (HOPG, ASW or CH3OH : H2O). However, the monolayer desorptionparameters do depend on the substrate, as expected. As well as desorption parameters, TPD datacan also be used to give detailed information about the trapping behaviour of species within theH2O and CH3OH matrix. These data are useful, as they allow us to model desorption under realastrophysical conditions.
The UK EPSRC are acknowledged for a studentship for J.L.E., and the Leverhulme Trust are acknowledgedfor a post-doctoral fellowship for D.J.B.
References1. Burke DJ, Brown WA. 2010 Ice in space: surface science investigations of the thermal
desorption of model interstellar ices on dust grain analogue surfaces. Phys. Chem. Chem. Phys.12, 5947–5969. (doi:10.1039/b917005g)
2. de Graauw T et al. 1996 SWS observations of solid CO2 in molecular clouds. Astron. Astrophys.315, L49–L54. See http://hdl.handle.net/1887/2253.
3. Boogert ACA et al. 2004 Spitzer space telescope spectroscopy of ices toward low-massembedded protostars. Astrophys. J. Suppl. Ser. 154, 359–362. (doi:10.1086/422556)
4. Dartois E, Pontoppidan K, Thi WF, Muñoz Caro GM. 2005 Spitzer’s large CO2 icedetection toward the L723 class 0 object. Astron. Astrophys. 444, L57–L60. (doi:10.1051/0004-6361:200500211)
5. Pontoppidan KM, Dullemond CP, van Dishoeck EF, Blake GA, Boogert ACA, Evans IINJ, Kessler-Silacci JE, Lahuis F. 2005 Ices in the edge-on disk CRBR 2422.8–3423: Spitzerspectroscopy and Monte Carlo radiative transfer modeling. Astrophys. J. 622, 463–481.(doi:10.1086/427688)
6. Watson DM et al. 2004 Mid-infrared spectra of class I protostars in Taurus. Astrophys. J. Suppl.Ser. 154, 391–395. (doi:10.1086/422918)
7. d’Hendecourt L, Jourdain de Muizon M, Dartois E, Breitfellner M, Ehrenfreund P, Benit J,Boulanger F, Puget JL, Habing HJ. 1996 ISO-SWS observations of solid state features towardsRAFGL 7009S. Astron. Astrophys. 315, L365–L368. See http://adsabs.harvard.edu/full/1996A&A...315L.365D.
8. Gerakines PA et al. 1999 Observations of solid carbon dioxide in molecular clouds with theInfrared Space Observatory. Astrophys. J. 522, 357–377. (doi:10.1086/307611)
9. Gibb EL, Whittet DCB, Boogert ACA, Tielens AGGM. 2004 Interstellar ice: the Infrared SpaceObservatory legacy. Astrophys. J. Suppl. Ser. 151, 35–73. (doi:10.1086/381182)
10. Nummelin A, Whittet DCB, Gibb EL, Gerakines PA, Chiar JE. 2001 Solid carbon dioxide inregions of low-mass star formation. Astrophys. J. 558, 185–193. (doi:10.1086/322480)
11. Allamandola LJ, Bernstein MP, Sandford SA, Walker RL. 1999 Evolution of interstellar ices.Space Sci. Rev. 90, 219–232. (doi:10.1023/A:1005210417396)
12. Tielens AGGM, Hagen W. 1982 Model calculations of the molecular composition of interstellargrain mantles. Astron. Astrophys. 114, 245–260. See http://adsabs.harvard.edu/full/1982A&A...114..245T.
13. Whittet DCB. 1993 Observations of molecular ices. In Dust and chemistry in astronomy (eds TJMillar, DA Williams), pp. 9–36. Bristol, UK: IOP Publishing.
14. Whittet DCB. 2003 Dust in the galactic environment, 2nd edn. Bristol, UK: IOP Publishing.
on June 5, 2018http://rsta.royalsocietypublishing.org/Downloaded from

14
rsta.royalsocietypublishing.orgPhilTransRSocA371:20110578
......................................................
15. van Broekhuizen FA, Groot IMN, Fraser HJ, van Dishoeck EF, Schlemmer S. 2006 Infraredspectroscopy of solid CO–CO2 mixtures and layers. Astron. Astrophys. 451, 723–731.(doi:10.1051/0004-6361:20052942)
16. Whittet DCB, Shenoy SS, Bergin EA, Chiar JE, Gerakines PA, Gibb EL, Melnick GJ, NeufeldDA. 2007 The abundance of carbon dioxide ice in the quiescent intracloud medium. Astrophys.J. 655, 332–341. (doi:10.1086/509772)
17. Conway SJ, Hovius N, Barnie T, Besserer J, Le Mouelic S, Orosei R, Read NA. 2012 Climate-driven deposition of water ice and the formation of mounds in craters in Mars’ north polarregion. Icarus 220, 174–193. (doi:10.1016/j.icarus.2012.04.021)
18. Roser JE, Vidali G, Manicò G, Pirronello V. 2001 Formation of carbon dioxide by surfacereactions on ices in the interstellar medium. Astrophys. J. 555, L61–L64. (doi:10.1086/321732)
19. Watanabe N, Kouchi A. 2002 Measurements of conversion rates of CO to CO2 in ultraviolet-induced reaction of D2O(H2O)/CO amorphous ice. Astrophys. J. 567, 651–655. (doi:10.1086/338491)
20. Sandford SA, Allamandola LJ. 1990 The physical and infrared spectral properties of CO2 inastrophysical ice analogs. Astrophys. J. 355, 357–372. (doi:10.1086/168770)
21. Ehrenfreund P, Boogert ACA, Gerakines PA, Jansen DJ, Schutte WA, Tielens AGGM, vanDishoeck EF. 1996 A laboratory database of solid CO and CO2 for ISO. Astron. Astrophys.315, L341–L344. See http://hdl.handle.net/1887/2255.
22. Dartois E, Demyk K, d’Hendecourt L, Ehrenfreund P. 1999 Carbon dioxide–methanolintermolecular complexes in interstellar grain mantles. Astron. Astrophys. 351, 1066–1074.See http://hdl.handle.net/1887/6921.
23. Ehrenfreund P, Boogert ACA, Gerakines PA, Tielens AGGM, van Dishoeck EF. 1997Infrared spectroscopy of interstellar apolar ice analogs. Astron. Astrophys. 328, 649–669.See http://hdl.handle.net/1887/2259.
24. Ehrenfreund P et al. 1999 Laboratory studies of thermally processed H2O–CH3OH–CO2 ice mixtures and their astrophysical implications. Astron. Astrophys. 350, 240–253.See http://hdl.handle.net/1887/2286.
25. Hodyss R, Johnson PV, Orzechowska GE, Goguen JD, Kanik I. 2008 Carbon dioxidesegregation in 1 : 4 and 1 : 9 CO2 : H2O ices. Icarus 194, 836–842. (doi:10.1016/j.icarus.2007.10.005)
26. Öberg KI, Fraser HJ, Boogert ACA, Bisschop SE, Fuchs GW, van Dishoeck EF, Linnartz H.2007 Effects of CO2 on H2O band profiles and band strengths in mixed H2O:CO2 ices. Astron.Astrophys. 462, 1187–1198. (doi:10.1051/0004-6361:20065881)
27. Ovchinnikov MA, Wight CA. 1993 Inhomogeneous broadening of infrared and Ramanspectral bands of amorphous and polycrystalline thin films. J. Chem. Phys. 99, 3374–3379.(doi:10.1063/1.465147)
28. Bernstein MP, Cruikshank DP, Sandford SA. 2005 Near-infrared laboratory spectra ofsolid H2O/CO2 and CH3OH/CO2 ice mixtures. Icarus 179, 527–534. (doi:10.1016/j.icarus.2005.07.009)
29. Gerakines PA, Schutte WA, Greenberg JM, van Dishoeck EF. 1995 The infrared band strengthsof H2O, CO and CO2 in laboratory simulations of astrophysical ice mixtures. Astron. Astrophys.296, 810–818. See http://hdl.handle.net/1887/2230.
30. Baratta GA, Palumbo ME. 1998 Infrared optical constants of CO and CO2 thin icy films. J. Opt.Soc. Am. A 15, 3076–3085. (doi:10.1364/JOSAA.15.003076)
31. Baratta GA, Palumbo ME, Strazzulla G. 2000 Laboratory and astronomical IR spectra: anexperimental clue for their comparison. Astron. Astrophys. 357, 1045–1050. See http://adsabs.harvard.edu/full/2000A&A...357.1045B.
32. Gálvez O, Ortega IK, Maté B, Moreno MA, Martín-Llorente B, Herrero VJ, Escribano R,Gutiérrez PJ. 2007 A study of the interaction of CO2 with water ice. Astron. Astrophys. 472,691–698. (doi:10.1051/0004-6361:20077421)
33. Gálvez O, Maté B, Herrero VJ, Escribano R. 2008 Trapping and adsorption of CO2 inamorphous ice: a FTIR study. Icarus 197, 599–605. (doi:10.1016/j.icarus.2008.05.016)
34. Maté B, Gálvez O, Herrero VJ, Escribano R. 2009 Infrared spectra and thermodynamicproperties of CO2/methanol ices. Astrophys. J. 690, 486–495. (doi:10.1088/0004-637X/690/1/486)
35. Palumbo ME, Baratta GA, Brucato JR, Castorina AC, Satorre MA, Strazulla G. 1998 Profile ofthe CO2 bands produced after ion irradiation of ice mixtures. Astron. Astrophys. 334, 247–252.See http://adsabs.harvard.edu/full/1998A&A...334..247P.
on June 5, 2018http://rsta.royalsocietypublishing.org/Downloaded from

15
rsta.royalsocietypublishing.orgPhilTransRSocA371:20110578
......................................................
36. Palumbo ME, Baratta GA. 2000 Infrared spectra of CO2 in H2O:CH3OH:CO2 icy mixtures.Astron. Astrophys. 361, 298–302. See http://adsabs.harvard.edu/full/2000A&A...361..298P.
37. Kumi G, Malyk S, Hawkins S, Reisler H, Wittig C. 2006 Amorphous solid water films:transport and guest–host interactions with CO2 and N2O dopants. J. Phys. Chem. A 110,2097–2105. (doi:10.1021/jp058234y)
38. Malyk S, Kumi G, Reisler H, Wittig C. 2007 Trapping and release of CO2 guest molecules byamorphous ice. J. Phys. Chem. A 111, 13 365–13 370. (doi:10.1021/jp074083i)
39. Heidberg J, Redlich B. 1996 The adsorption of CO2 and N2O on the MgO(001) single crystalsurface: a comparative PIRSS and LEED study. Surf. Sci. 368, 140–146. (doi:10.1016/S0039-6028(96)01042-4)
40. Falk M, Seto PF. 1986 Infrared spectra of solid carbon dioxide. Can. J. Spectrosc. 31, 134–137.41. Osberg WE, Hornig DF. 1952 The vibrational spectra of molecules and complex ions in
crystals. VI. Carbon dioxide. J. Chem. Phys. 20, 1345–1347. (doi:10.1063/1.1700760)42. Heidberg J, Hoge D, Stahmer K, Stein H, Venschott M, Warskulat M, Weiss H. 1988 Vibrational
infrared spectra of adsorbates on ionic single crystal surfaces: CO2 on NaCl(100). Vacuum 38,275–277. (doi:10.1016/0042-207X(88)90060-7)
43. Berg O, Ewing GE. 1989 The determination of monolayer structure by infrared spectroscopy:CO2 on NaCl(100). Surf. Sci. 220, 207–229. (doi:10.1016/0039-6028(89)90228-8)
44. Wood BE, Roux JA. 1982 Infrared optical properties of thin H2O, NH3 and CO2 cryofilms.J. Opt. Soc. Am. 72, 720–728. (doi:10.1364/JOSA.72.000720)
45. Pokrovski K, Jung KT, Bell AT. 2001 Investigation of CO and CO2 adsorption on tetragonaland monoclinic zirconia. Langmuir 17, 4297–4303. (doi:10.1021/la001723z)
46. Andersson PU, Någård MB, Witt G, Pettersson JBC. 2004 Carbon dioxide interactions withcrystalline and amorphous ice surfaces. J. Phys. Chem. A 108, 4627–4631. (doi:10.1021/jp049346c)
47. Maté B, Gálvez O, Martín-Llorente B, Moreno MA, Herrero VJ, Escribano R, Artacho E.2008 Ices of CO2/H2O mixtures. Reflection–absorption IR spectroscopy and theoreticalcalculations. J. Phys. Chem. A 112, 457–465. (doi:10.1021/jp0769983)
48. Öberg KI, van Dishoeck EF, Linnartz H. 2009 Photodesorption of ices I: CO, N2, and CO2.Astron. Astrophys. 496, 281–293. (doi:10.1051/0004-6361/200810207)
49. Whittet DCB et al. 1996 An ISO SWS view of interstellar ices: first results. Astron. Astrophys.315, L357–L360. See http://adsabs.harvard.edu/full/1996A&A...315L.357W.
50. Collings MP, Anderson MA, Chen R, Dever JW, Viti S, Williams DA, McCoustra MRS. 2004 Alaboratory survey of the thermal desorption of astrophysically relevant molecules. Mon. Not.R. Astron. Soc. 354, 1133–1140. (doi:10.1111/j.1365-2966.2004.08272.x)
51. Ulbricht H, Zacharia R, Cindir N, Hertel T. 2006 Thermal desorption of gases and solventsfrom graphite and carbon nanotube surfaces. Carbon 44, 2931–2942. (doi:10.1016/j.carbon.2006.05.040)
52. Wiesendanger R, Eng L, Hidber HR, Oelhafen P, Rosenthaler L, Staufer U, Guntherodt HJ.1987 Local tunnelling barrier height images obtained with the scanning tunnellingmicroscope. Surf. Sci. 189, 24–28. (doi:10.1016/S0039-6028(87)80410-7)
53. Brown WA, Viti S, Wolff AJ, Bolina AS. 2006 Laboratory investigations of the role of the grainsurface in astrochemical models. Faraday Discuss. 133, 113–124. (doi:10.1039/b516770a)
54. Brown WA, Bolina AS. 2007 Fundamental data on the desorption of pure interstellar ices. Mon.Not. R. Astron. Soc. 374, 1006–1014. (doi:10.1111/j.1365-2966.2006.11216.x)
55. Viti S, Collings MP, Dever JW, McCoustra MRS, Williams DA. 2004 Evaporation of ices nearmassive stars: models based on laboratory temperature programmed desorption data. Mon.Not. R. Astron. Soc. 354, 1141–1145. (doi:10.1111/j.1365-2966.2004.08273.x)
56. Viti S, Williams DA. 1999 Time-dependent evaporation of icy mantles in hot cores. Mon. Not.R. Astron. Soc. 305, 755–762. (doi:10.1046/j.1365-8711.1999.02447.x)
57. Ehrenfreund P, Dartois E, Demyk K, d’Hendecourt L. 1998 Ice segregation toward massiveprotostars. Astron. Astrophys. 339, L17–L20. See http://hdl.handle.net/1887/6962.
58. Smith RS, Huang C, Wong EKL, Kay BD. 1997 The molecular volcano: abrupt CCl4desorption driven by the crystallization of amorphous solid water. Phys. Rev. Lett. 79, 909–912.(doi:10.1103/PhysRevLett.79.909)
59. Bolina AS, Wolff AJ, Brown WA. 2005 RAIRS and TPD studies of the adsorption anddesorption of amorphous and crystalline water on a graphite surface. J. Phys. Chem. B 109,16 836–16 845. (doi:10.1021/jp0528111)
on June 5, 2018http://rsta.royalsocietypublishing.org/Downloaded from

16
rsta.royalsocietypublishing.orgPhilTransRSocA371:20110578
......................................................
60. Burke DJ, Wolff AJ, Edridge JL, Brown WA. 2008 Thermally induced mixing of waterdominated interstellar ices. Phys. Chem. Chem. Phys. 10, 4956–4967. (doi:10.1039/b807220e)
61. Wolff AJ, Carlstedt C, Brown WA. 2007 Studies of binary layered CH3OH/H2O ices adsorbedon a graphite surface. J. Phys. Chem. C 111, 5990–5999. (doi:10.1021/jp067377x)
62. Mennella V, Baratta GA, Palumbo ME, Bergin EA. 2006 Synthesis of CO and CO2 moleculesby UV irradiation of water ice-covered hydrogenated carbon grains. Astrophys. J. 643, 923–931.(doi:10.1086/502965)
63. Herzberg G. 1945 Infrared and Raman spectra of polyatomic molecules. New York, NY: VanNostrand.
64. Yamada H, Person WB. 1964 Absolute infrared intensities of fundamental absorption bandsin solid CO2 and N2O. J. Chem. Phys. 41, 2478–2487. (doi:10.1063/1.1726291)
65. Barnes JA, Gough TE. 1987 Fourier transform infrared spectroscopy of molecular clusters—the structure and internal mobility of clustered carbon dioxide. J. Chem. Phys. 86, 6012–6017.(doi:10.1063/1.452488)
66. Disselkamp R, Ewing GE. 1990 Infrared spectroscopy of large CO2 clusters. J. Chem. Soc.Faraday Trans. 86, 2369–2373. (doi:10.1039/ft9908602369)
67. Ewing GE, Sheng DT. 1988 Infrared spectroscopy of CO2 ultrafine particles. J. Phys. Chem. 92,4063–4066. (doi:10.1021/j100325a016)
68. Fleyfel F, Devlin JP. 1989 FTIR spectra of CO2 clusters. J. Phys. Chem. 93, 7292–7294.(doi:10.1021/j100358a005)
69. Edridge JL, Brown WA. In preparation.70. Berreman DW. 1963 Infrared absorption at longitudinal optic frequency in cubic crystal films.
Phys. Rev. 130, 2193–2198. (doi:10.1103/PhysRev.130.2193)71. Gibb EL et al. 2000 An inventory of interstellar ices toward the embedded protostar W33A.
Astrophys. J. 536, 347–356. (doi:10.1086/308940)72. Souda R. 2007 Effects of methanol on crystallization of water in the deeply supercooled region.
Phys. Rev. B 75, 184116. (doi:10.1103/PhysRevB.75.184116)73. Burke DJ, Brown WA. In preparation.
on June 5, 2018http://rsta.royalsocietypublishing.org/Downloaded from