Supporting Online Material for -...
19
www.sciencemag.org/cgi/content/full/316/5824/604/DC1 Supporting Online Material for Regulation of the Germinal Center Response by MicroRNA-155 To-Ha Thai, Dinis Pedro Calado, Stefano Casola, K. Mark Ansel, Changchun Xiao, Yingzi Xue, Andrew Murphy, David Frendewey, David Valenzuela, Jeffery L. Kutok, Marc Schmidt-Supprian, Nikolaus Rajewsky, George Yancopoulos, Anjana Rao, Klaus Rajewsky * *To whom correspondence should be addressed. E-mail: [email protected] Published 27 April 2007, Science 316, 604 (2007) DOI: 10.1126/science.1141229 This PDF file includes: Materials and Methods Figs. S1 to S9 References
-
Upload
phungkhanh -
Category
Documents
-
view
222 -
download
0
Transcript of Supporting Online Material for -...
www.sciencemag.org/cgi/content/full/316/5824/604/DC1
Supporting Online Material for
Regulation of the Germinal Center Response by MicroRNA-155
To-Ha Thai, Dinis Pedro Calado, Stefano Casola, K. Mark Ansel, Changchun Xiao,
Yingzi Xue, Andrew Murphy, David Frendewey, David Valenzuela, Jeffery L. Kutok, Marc Schmidt-Supprian, Nikolaus Rajewsky, George Yancopoulos, Anjana Rao, Klaus
Rajewsky*
*To whom correspondence should be addressed. E-mail: [email protected]
Published 27 April 2007, Science 316, 604 (2007) DOI: 10.1126/science.1141229
This PDF file includes:
Materials and Methods Figs. S1 to S9 References
Thai et. al. (SOM)
1
Supporting Online Material for
Regulation of the Germinal Center Response by microRNA-155
To-Ha Thai, Dinis Pedro Calado, K. Mark Ansel, Stefano Casola, Changchun
Xiao, Yingzi Xue, Andrew Murphy, David Frendewey, David Valenzuela, Jeffery
L. Kutok, Marc Schmidt-Supprian, Nikolaus Rajewsky, George Yancopoulos,
Anjana Rao and Klaus Rajewsky*
*To whom correspondence should be addressed. E-mail:
This PDF file includes
Materials and methods Figures S1 to S9 References
Thai et. al. (SOM)
2
Supporting Online Materials
Materials and Methods
Generation of mutant mice
Knockout mice: bic/miR-155 knockout/lacZ reporter mice were generated using the BAC-based
targeting vector technology (Velocigene) (S1). Briefly, 0.97 kb of bic exon 2 was replaced by an
in frame linear reporter cassette in which the lacZ reporter gene was in tandem with the NeoR
gene flanked by loxP sites, allowing bic promoter to control lacZ gene expression (Fig. S1A).
Screening of ES cell clones was done using loss-of-native-allele assay as described (S1).
Knockout mice were on mixed 129SV X C57BL/6 genetic background.
Knock-in mice: Conditional mir-155 transgenic mice were generated by knocking the bic gene,
preceded by the CAG promoter and a transcriptional STOP cassette, into the Rosa26 locus (Fig.
S2A), as previously described (S2). An frt-flanked IRES-EGFP cassette was placed downstream
of the miR-155 gene before and upstream a polyadenylation signal (pA). Mice were generated
using the tetraploid embryo complementation technology (S3, S4). Knock-in mice were on a
mixed BALB/c X C57BL/6 genetic background.
Homozygous mutant of both strains were born at Mendelian ratios, were fertile and had no
obvious aberrant phenotype.
All mice were bred and maintained in specific pathogen-free conditions; all mouse protocols
were approved by the Harvard University Institutional Animal Care and Use Committee and by
the CBR Institute for Biomedical Research.
Thai et. al. (SOM)
3
RT-PCR
Total RNA, from FACS sorted progenitor B-cells or MACS purified mature spleen B-cells,
activated and unactivated, was prepared with Trizol (Invitrogen, Carlsbad, CA), treated with
DNaseI (New England Biolabs, Ipswich, MA) and reverse-transcribed, according to
manufacturer’s recommendations, with oligo-(dT)20 and cloned AMV Reverse Transcriptase
(Invitrogen). Transcripts were amplified from cDNA with the following primers: for bic
forward, 5′−cctcatgaaaccagctcatctg−3′, reverse 5′−ctggttgaatcattgaagatgg−3′; for β-actin
forward, 5′−cctaaggccaaccgtgaaaag−3′, reverse 5′−tcttcatggtgctaggagcca−3′. bic PCR was done
under the following conditions in 25 µl volume: 0.2 mM dNTPs, 0.1 µM primers, 1.25 U
Eppendorf taq polymerase (Eppendorf, Westbury, NY) in PCR buffer (10X 100mM Tris, pH 8.3,
35 mM MgCl2 and 750 mM KCl); 94°C for 2 min, then 30 cycles of 94°C for 1 min, 65°C for 1
min, 72°C for 30 sec, followed by 72°C extension for 10 min.
For calcineurin inactivation, cells were pre-treated with 2µM cyclosporine A (CSA, Calbiochem,
San Diego, CA) in culture medium for 15 mins before stimulation and PCR.
TNF, LT-α and LT-β messages were amplified from cDNA with the following primers: TNF-
forward 5′−aaagcatgatccgcgacgtggaac−3′, TNF-reverse 5′−ctgggagtagacaaggtacaacccatcg−3′;
LT-α-forward 5′−acactgctcggccgtctccacctct−3′, LTα-reverse 5′−gaaaagagctggacctcgtgtgcc−3′;
LT-β-forward 5′−tgcctatcactgtcctggctgtgc−3′, LTβ-reverse 5′−aacgcttcttcttggctcgcctcc−3′. PCR
conditions were 35 cycles of 94°C for 1 min, 60°C for 1 min and 72°C for 1 min.
Northern blots
Total RNA (5 to 20 µg) was loaded and separated on a denaturing 12-15% polyacrylamide gel
and transferred electrophoretically to a GeneScreen Plus or Nytran SuPerCharge membrane
(Schleicher and Schuell, Keene, NH). Membranes were UV-crosslinked. Probes were prepared

Thai et. al. (SOM)
4
by T4 polynucleotide kinase labeling of antisense oligonucleotides with γ32P dATP.
Hybridization was performed with UltraHyb Hybridization buffer (Ambion, Austin, TX) or
Denhardt's solution at 37-42°C with the following miR-155 probe: 5′−cccctatcacaattagcattaa−3′.
Blots were washed at room temperature once with 2X SSC without SDS for 30 min.
Radiolabeled Decade RNA markers (Ambion) were loaded as size markers. tRNA and 5S RNA
stained with ethidium bromide served as a sample loading control. For reuse, blots were stripped
by boiling in 0.1 × SSC/0.1% SDS twice for 10 min and reprobed.
Flow cytometry
Single-cell suspensions prepared from various lymphoid organs were stained with the following
monoclonal antibodies conjugated to phycoerythrin (PE), Peridin-Chlorophyll (PerCP),
allophycocyanin (APC), or biotin: anti-CD19 (ID3), FAS (anti-CD95), B220/CD45R (clone
RA3-6B2) (all from BD Pharmingen), and anti-CD38 (clone 90, eBioscience). All samples were
acquired on a FACSCalibur (BD Biosciences, San Jose, CA), and results were analyzed with
FlowJo (Tree Star, Ashland, OR) and CellQuest (BD Biosciences) software.
For detection of β-galactosidase activity, cells were stained with the β-galactosidase substrate
fluorescein di-β-D-galactopyranoside (FDG) using the FluoReporter® lacZ Flow Cytometry kit,
according to manufacturer’s recommendations (Molecular Probes/Invitrogen). Data were
acquired with the FACSCalibur cytometer, and analyzed using the CellQuest software.
GC (CD19+CD38loFashi) and non-GC (CD19+CD38hiFas−) B-cells were sorted on the FACSAria
BD, using the DIVA version 5.0 software.
Thai et. al. (SOM)
5
Immunization and ELISA
Mice were immunized with 100 µg of T–dependent (TD) antigen NP-CCG (4-hydroxy-3-
nitrophenylacetyl chicken γ-globulin, BiosearchTechnologies, Novato, CA) in Imject Alum
(Pierce Biotechnology, Rockford, IL) intraperitoneally. At day 7 or day 14, mice were bled or
sacrificed for analyses. Serum samples were analyzed by ELISA with coating and detection
antibodies generated previously in the laboratory (S5) or purchased from Southern Biotech
(Birmingham, AL) and Biosearch Technologies.
In vitro B-lymphocyte activation
MACS-purified CD19+ B-cells were activated in vitro at a density of 5x10⁵ cells/ml either with
20 µg/ml of LPS (Sigma), 2 µg/ml of αCD40 (1C10, eBioscience) or 10 µg/ml of goat
anti-mouse IgM, µ chain specific F(ab’)2 fragment (Jackson Immunoresearch, West Grove, PA)
in Dulbecco's modified Eagle's medium (DMEM) supplemented with 10% fetal calf serum,
L-glutamine, penicillin-streptomycin, nonessential amino acids, sodium pyruvate, HEPES and
2-mercaptoethanol (Invitrogen).
Proliferation assay
Purified CD19+ B-cells were labeled with 1nM CFSE for 10 min at 37°C in 5% CO2, followed
by 2 washes with culture medium. Labeled cells were then activated as above for 3 days.
Proliferation was monitored by FACSCalibur, and data were analyzed using FlowJo software.
Intracellular cytokine staining
Unstimulated or two- to three- day stimulated mature spleen CD19+ B-cells were treated with
PMA (10-20 nM) and ionomycin (1 µM) for 6 h (Sigma-Aldrich, St. Louis, MO). Cytokine
secretion was blocked for 4 h with 5 µg/ml brefeldin-A (Sigma). Cells were then fixed in 2%
formaldehyde and permeabilized with 0.5% of saponin (Sigma). After CD16/CD32 (FcγIII/II
Thai et. al. (SOM)
6
Receptor) blockage with 2.4G2 antibody (BD Pharmigen) cells were stained with either anti-
mouse TNF-PE (MP6-XT22) from BD Pharmigen or anti-mouse IL-10-APC (JES5-16E3)
antibody (eBioscience). Data acquisition was performed on a FACSCalibur cytometer with
CellQuest software, and analyzed using FlowJo software. Fluorescence intensities in one- and
two-dimensional histograms were presented on a log10 scale.
Cytokine detection in supernatants
Cytokine quantification in supernatants of both two to three days activated or non-activated
CD19+ B-lymphocytes cultures was determined using the Beadlyte® mouse multi-cytokine
detection system (Upstate Biotechnology, Charlottesville, VA), according to the manufacturer’s
protocols. Data acquisition was performed on a Luminex® 200™ IS analyzer (Luminex
Corporation, Austin, TX).
TH1/TH2 differentiation and FACS analyses
Purification of CD4+ T-cells from peripheral lymph nodes, induction of Th1/Th2 differentiation,
and restimulation for flow cytometric analysis of intracellular cytokine staining were performed
as described (S6). Briefly, CD4+ T-cells were purified (>95%) from peripheral lymph nodes by
magnetic bead selection (Dynal, Invitrogen). 1x10⁶ cells were stimulated in 12-well tissue
culture plates with plate-bound anti-CD3 (2C11) and anti-CD28 (37.5, both from BD
Biosciences) antibodies under Th1 (IL12, anti-IL4), Th2 (IL4, anti-IFN-γ, anti-IL-12), ThN
conditions (nonpolarizing; no addition of exogenous cytokines or antibodies), or ThN with a
limited quantity of IL-4 (12.5 U/ml) for 50 hours, then removed to uncoated flasks and cultured
in the same cytokine conditions with the addition of recombinant human IL2 (20 U/mL; NCI
Biological Resources Branch, Frederick, MD) for 3 days. For determination of cytokine
production, cells were restimulated with PMA and ionomycin (Sigma-Aldrich) for 6 hours, with
Thai et. al. (SOM)
7
the addition of brefeldin-A (5 µg/mL, Sigma-Aldrich) during the final 2 hours. Restimulated
cells were fixed in 4% paraformaldehyde (Sigma-Aldrich) for 8 minutes at room temperature,
stained in permeabilization buffer (PBS, 1% w/v bovine serum albumin, 0.1% w/v sodium azide,
0.5% w/v saponin), and analyzed by flow cytometry.
Immunohistochemistry
4µM-thick paraffin sections from lymphoid organs of wild-type and mutant mice were placed in
room temperature acetone soon after cutting and, then stored at −80°C. Before use, slides were
placed in −20°C acetone for 2 minutes and left to air dry for 20 minutes at room temperature.
Slides were blocked with Peroxidase block (part of the Dako Envision Kit cat # K4011) for 5
minutes. Slides were then incubated sequentially with primary Ab for 1 hour, secondary Ab for
30 minutes, and if necessary with tertiary Ab for 30 minutes. Slides were developed with DAB
for 5 min. All the slides were then enhanced in a DAB enhancer (Zymed Laboratories, Carlsbad,
CA.) for approximately 10 seconds and counterstained with Hemotoxylin. The following
reagents were used: PNA (Vector Laboratories, Burlingame, CA) and Hemotoxylin (Sigma). The
samples were analyzed using an Olympus BX41 microscope with the objective lens of 40X/0.75
Olympus UPlanFL and 2X/0.05 plan (Olympus, Melville, NY). Pictures were taken using
Olympus QColor3 and analyzed with acquisition software QCapture v2.60 (QImaging, Burnaby,
BC Canada) and Adobe Photoshop 6.0 (Adobe, San Jose, CA).
Somatic hypermutation analysis
The mutational status of the VH186.2 gene was analyzed as described (S7). Briefly, GC
(CD38loFAShiCD19+) and naïve (CD38+FASloCD19+) B-cells were sorted from spleen of
bic/miR-155 knock-out and wild-type littermate mice 12-14 days after immunization with 100µg

Thai et. al. (SOM)
8
NP-CGG. Genomic DNA from 104 cell equivalents was subjected to a two-round genomic PCR
amplification protocol using the Expand High Fidelity PCR system (Roche, Nutley, NJ) and
primers previously described (S7). PCR fragments corresponding to the VH186.2 gene were
cloned into the pGEM-T easy (Promega) and sequenced. Sequence analyses were performed
with the help of the DNASTAR Lasergene software.
Statistics
P values were determined by applying Student’s two-tailed t-test for independent samples,
assuming equal variances on all experimental data sets, using the online t test calculator from
GraphPad Software (http://graphpad.com/quickcalcs/ttest1.cfm). Dr. Paul Catalano provided
additional advices on statistical analyses.
Thai et. al. (SOM)
9
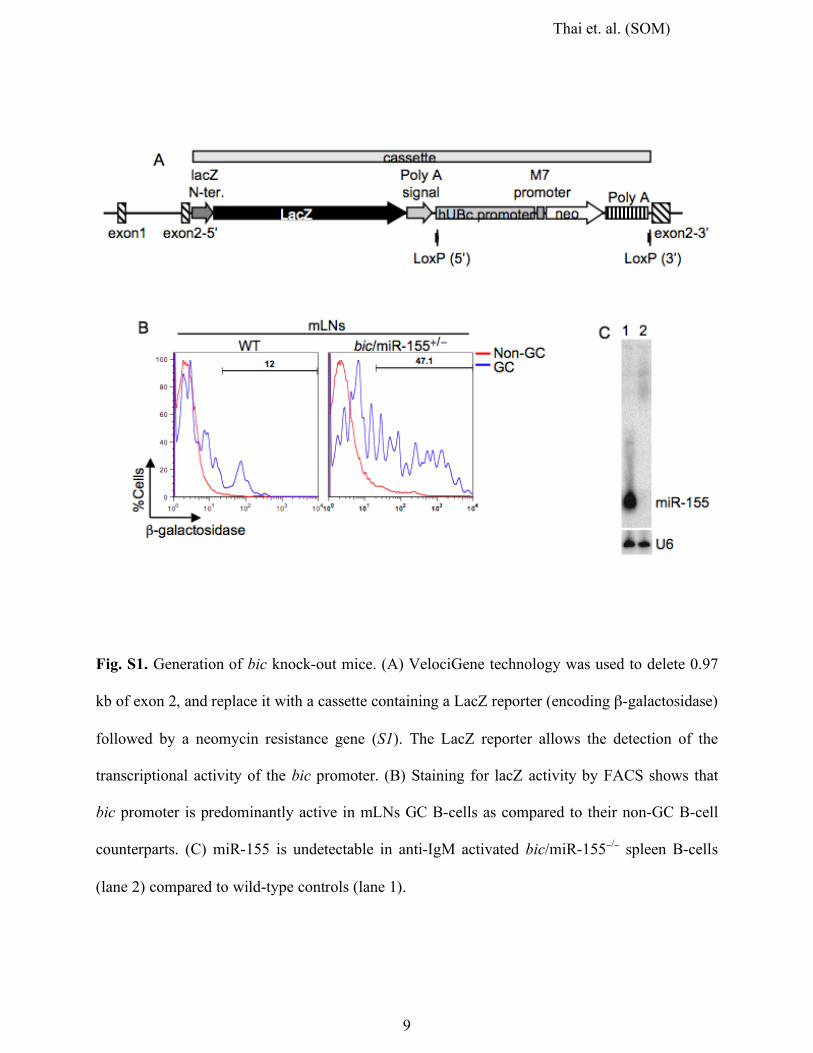
Fig. S1. Generation of bic knock-out mice. (A) VelociGene technology was used to delete 0.97
kb of exon 2, and replace it with a cassette containing a LacZ reporter (encoding β-galactosidase)
followed by a neomycin resistance gene (S1). The LacZ reporter allows the detection of the
transcriptional activity of the bic promoter. (B) Staining for lacZ activity by FACS shows that
bic promoter is predominantly active in mLNs GC B-cells as compared to their non-GC B-cell
counterparts. (C) miR-155 is undetectable in anti-IgM activated bic/miR-155−/− spleen B-cells
(lane 2) compared to wild-type controls (lane 1).
Thai et. al. (SOM)
10
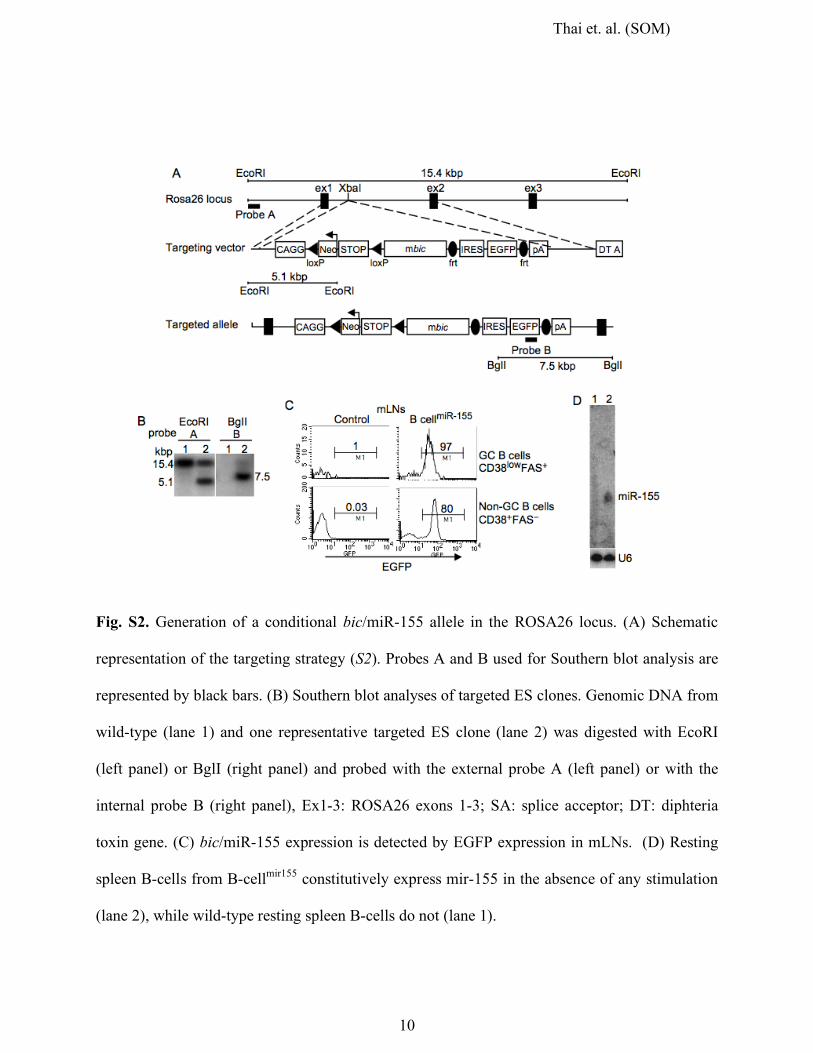
Fig. S2. Generation of a conditional bic/miR-155 allele in the ROSA26 locus. (A) Schematic
representation of the targeting strategy (S2). Probes A and B used for Southern blot analysis are
represented by black bars. (B) Southern blot analyses of targeted ES clones. Genomic DNA from
wild-type (lane 1) and one representative targeted ES clone (lane 2) was digested with EcoRI
(left panel) or BglI (right panel) and probed with the external probe A (left panel) or with the
internal probe B (right panel), Ex1-3: ROSA26 exons 1-3; SA: splice acceptor; DT: diphteria
toxin gene. (C) bic/miR-155 expression is detected by EGFP expression in mLNs. (D) Resting
spleen B-cells from B-cellmir155 constitutively express mir-155 in the absence of any stimulation
(lane 2), while wild-type resting spleen B-cells do not (lane 1).
Thai et. al. (SOM)
11
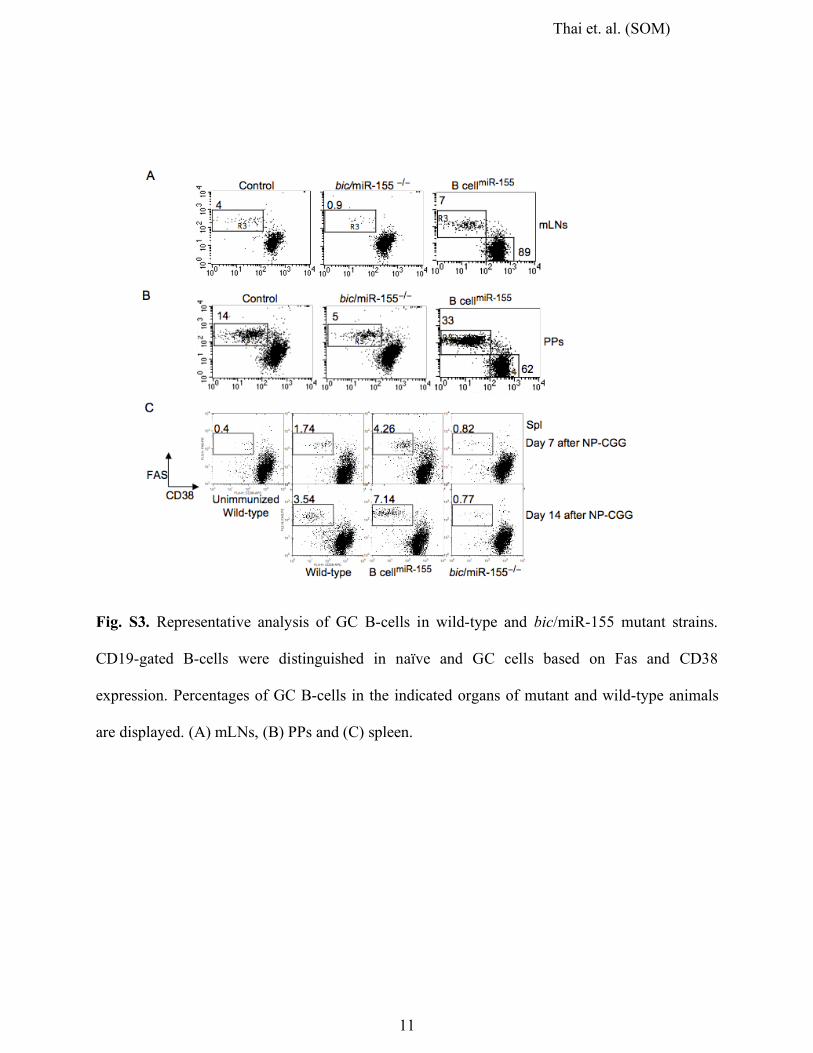
Fig. S3. Representative analysis of GC B-cells in wild-type and bic/miR-155 mutant strains.
CD19-gated B-cells were distinguished in naïve and GC cells based on Fas and CD38
expression. Percentages of GC B-cells in the indicated organs of mutant and wild-type animals
are displayed. (A) mLNs, (B) PPs and (C) spleen.
Thai et. al. (SOM)
12
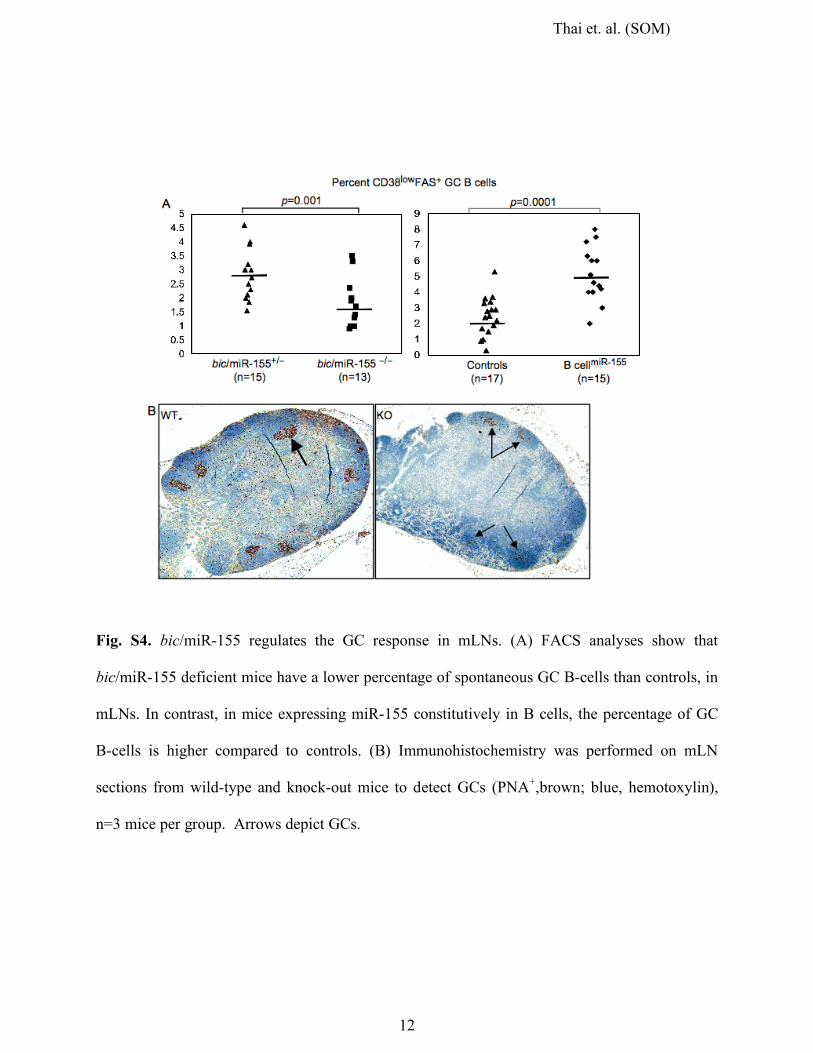
Fig. S4. bic/miR-155 regulates the GC response in mLNs. (A) FACS analyses show that
bic/miR-155 deficient mice have a lower percentage of spontaneous GC B-cells than controls, in
mLNs. In contrast, in mice expressing miR-155 constitutively in B cells, the percentage of GC
B-cells is higher compared to controls. (B) Immunohistochemistry was performed on mLN
sections from wild-type and knock-out mice to detect GCs (PNA+,brown; blue, hemotoxylin),
n=3 mice per group. Arrows depict GCs.
Thai et. al. (SOM)
13
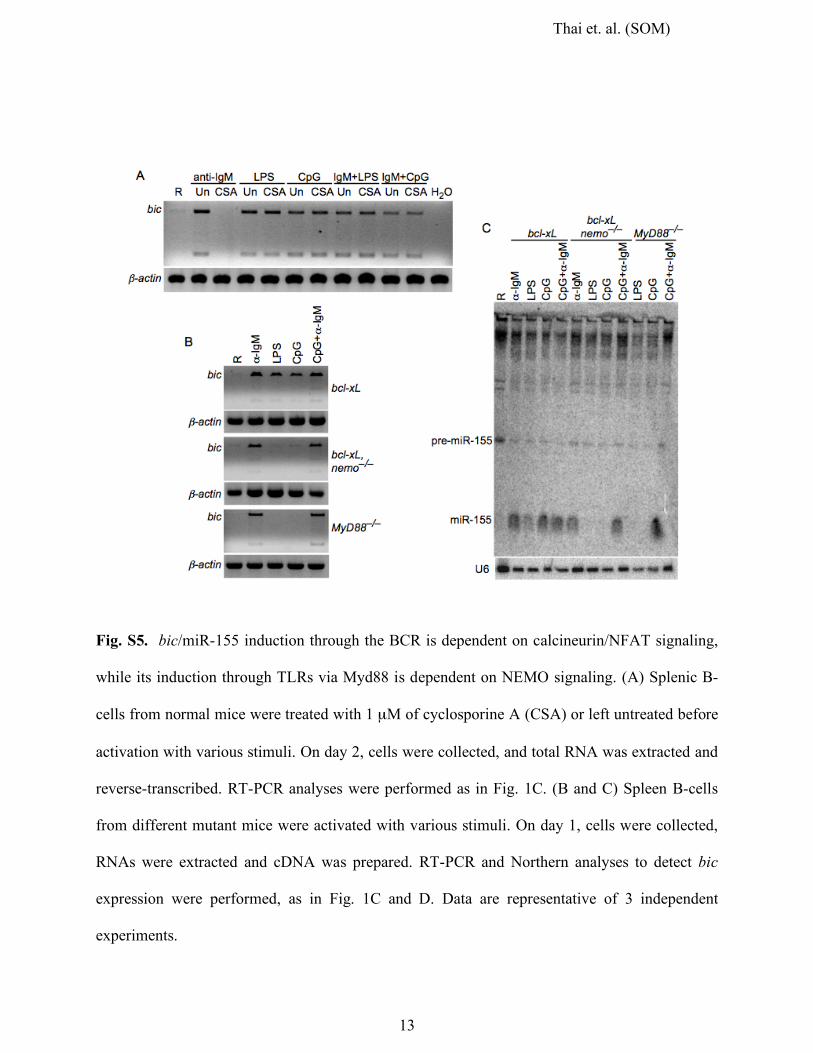
Fig. S5. bic/miR-155 induction through the BCR is dependent on calcineurin/NFAT signaling,
while its induction through TLRs via Myd88 is dependent on NEMO signaling. (A) Splenic B-
cells from normal mice were treated with 1 µM of cyclosporine A (CSA) or left untreated before
activation with various stimuli. On day 2, cells were collected, and total RNA was extracted and
reverse-transcribed. RT-PCR analyses were performed as in Fig. 1C. (B and C) Spleen B-cells
from different mutant mice were activated with various stimuli. On day 1, cells were collected,
RNAs were extracted and cDNA was prepared. RT-PCR and Northern analyses to detect bic
expression were performed, as in Fig. 1C and D. Data are representative of 3 independent
experiments.
Thai et. al. (SOM)
14
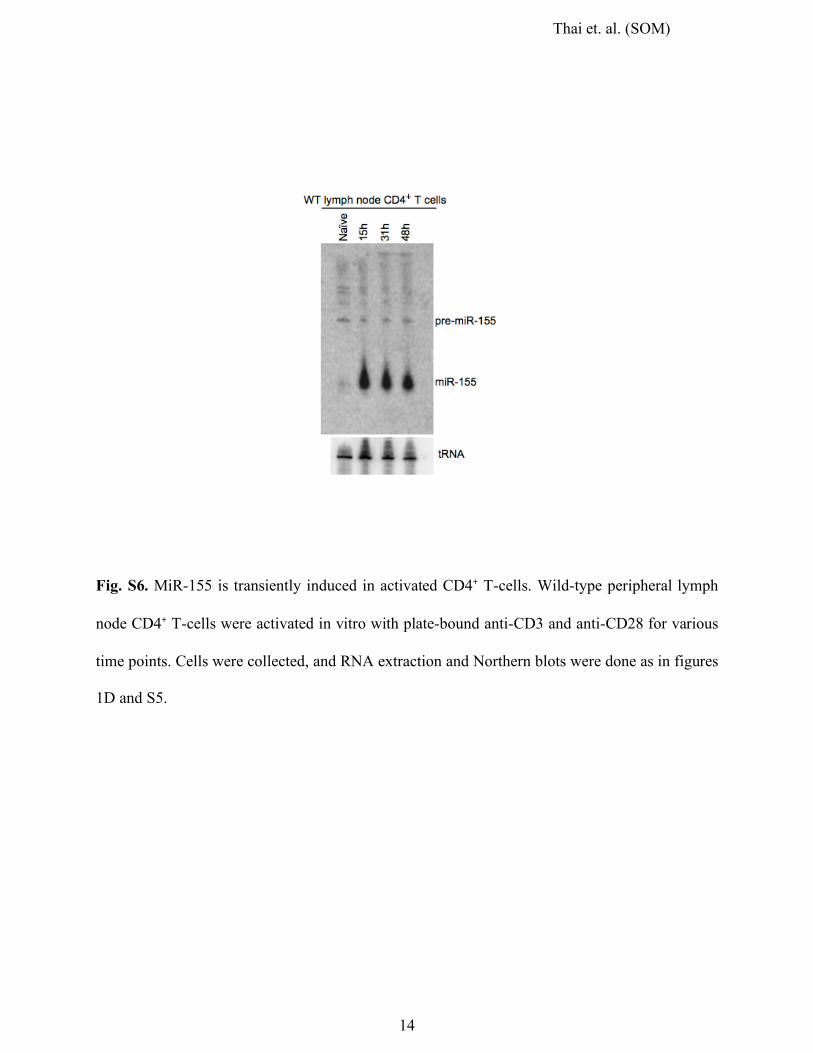
Fig. S6. MiR-155 is transiently induced in activated CD4+ T-cells. Wild-type peripheral lymph
node CD4+ T-cells were activated in vitro with plate-bound anti-CD3 and anti-CD28 for various
time points. Cells were collected, and RNA extraction and Northern blots were done as in figures
1D and S5.
Thai et. al. (SOM)
15
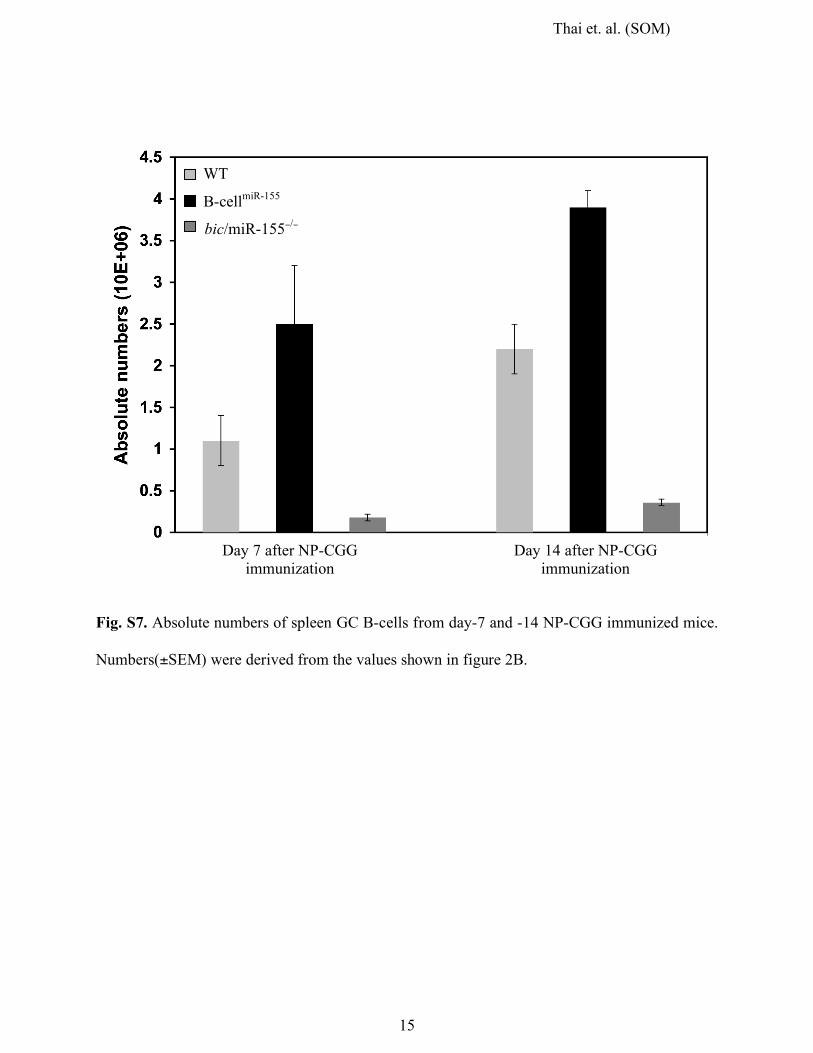
Fig. S7. Absolute numbers of spleen GC B-cells from day-7 and -14 NP-CGG immunized mice.
Numbers(±SEM) were derived from the values shown in figure 2B.
Day 7 after NP-CGG immunization
bic/miR-155−/−
B-cellmiR-155
WT
Day 14 after NP-CGG immunization
Thai et. al. (SOM)
16
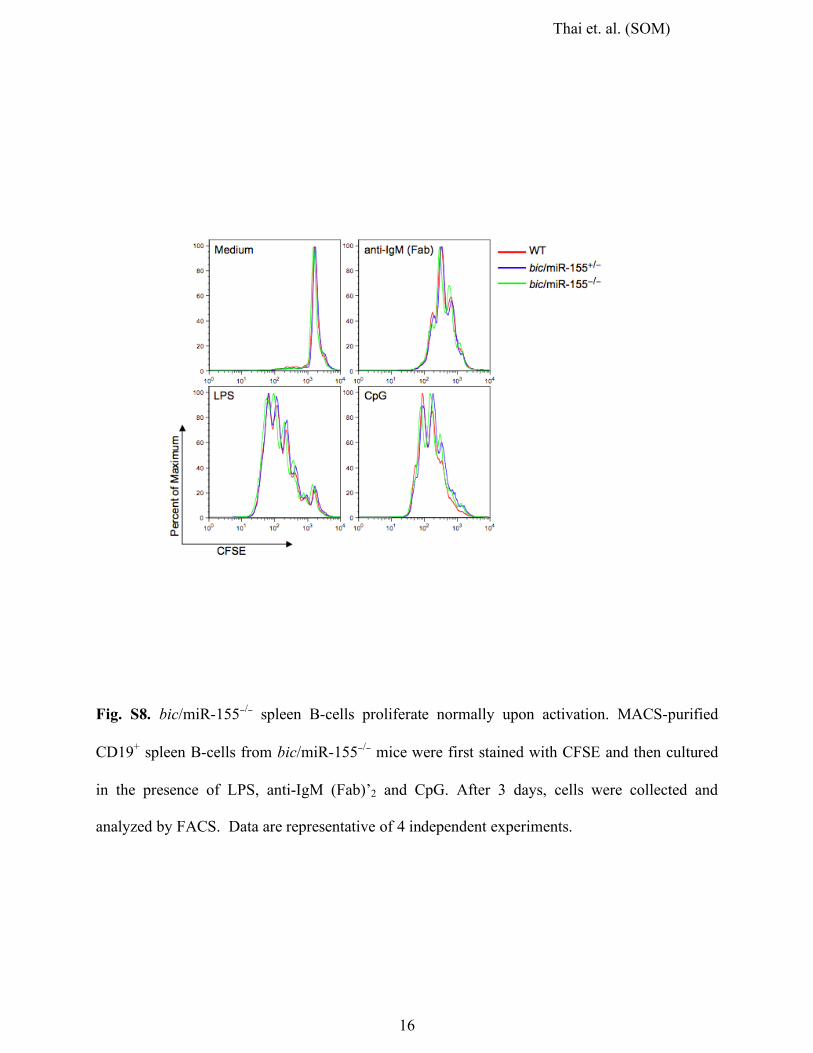
Fig. S8. bic/miR-155−/− spleen B-cells proliferate normally upon activation. MACS-purified
CD19+ spleen B-cells from bic/miR-155−/− mice were first stained with CFSE and then cultured
in the presence of LPS, anti-IgM (Fab)’2 and CpG. After 3 days, cells were collected and
analyzed by FACS. Data are representative of 4 independent experiments.
Thai et. al. (SOM)
17
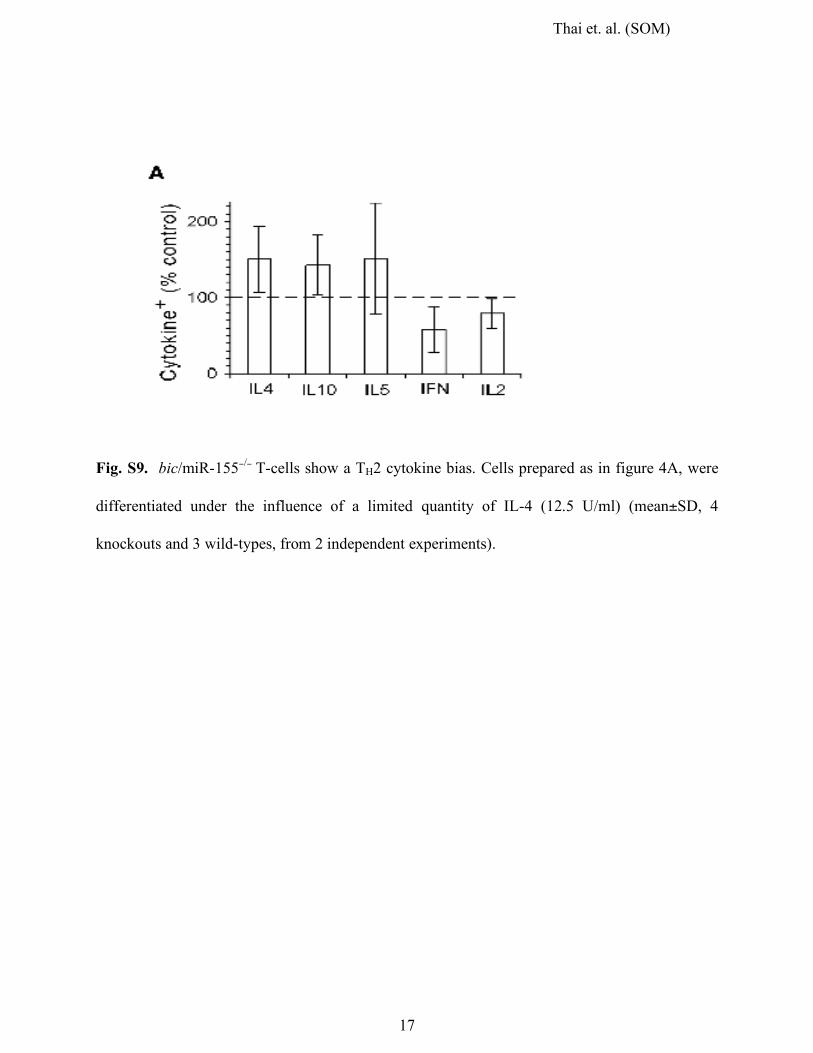
Fig. S9. bic/miR-155−/− T-cells show a TH2 cytokine bias. Cells prepared as in figure 4A, were
differentiated under the influence of a limited quantity of IL-4 (12.5 U/ml) (mean±SD, 4
knockouts and 3 wild-types, from 2 independent experiments).
Thai et. al. (SOM)
18
Supporting Online References
S1. D. M. Valenzuela et al., Nat Biotechnol 21, 652 (Jun, 2003). S2. Y. Sasaki et al., Immunity 24, 729 (Jun, 2006). S3. J. Seibler et al., Nucleic Acids Res 31, e12 (Feb 15, 2003). S4. J. Wang, J. Mager, E. Schnedier, T. Magnuson, Mamm Genome 13, 493 (Sep, 2002). S5. H. C. Patterson, M. Kraus, Y. M. Kim, H. Ploegh, K. Rajewsky, Immunity 25, 55 (Jul,
2006). S6. K. M. Ansel et al., Nat Immunol 5, 1251 (Dec, 2004). S7. G. Esposito et al., Proc Natl Acad Sci U S A 97, 1166 (Feb 1, 2000).


![Supporting Online Material forscience.sciencemag.org/highwire/filestream/590781/field_highwire...Verde [Guanacaste] Biological Stations, 2006; Corcovado National Park [Puntarenas],](https://static.fdocuments.us/doc/165x107/5e215cb3bf01800aa4125a36/supporting-online-material-guanacaste-biological-stations-2006-corcovado-national.jpg)