Summer Training Report-Tolga - courses.ie.bilkent.edu.tr · Summer Training Report Pınar Süt...
27
Summer Training Report Pınar Süt Mamülleri San. A.Ş. Tolga Dizdarer IE299 11.12.2014 Industrial Engineering Bilkent University 06800 Ankara Abstract This report contains information regarding my summer internship period in Pınar Süt A.Ş. and its organizational structure in Summer 2014. It includes general information about the company, which includes its sector, production and sales volumes and market share. The information presented in this report is analyzed with an Industrial Engineering perspective and relies heavily on our manufacturing and production courses. Company’s production and manufacturing systems are examined using materials seen in Industrial Engineering courses.
Transcript of Summer Training Report-Tolga - courses.ie.bilkent.edu.tr · Summer Training Report Pınar Süt...
Summer Training Report
Pınar Süt Mamülleri San. A.Ş.
Tolga Dizdarer IE299
11.12.2014
Industrial Engineering Bilkent University
06800 Ankara
Abstract
This report contains information regarding my summer internship period in Pınar Süt A.Ş. and its organizational structure in Summer 2014. It includes general information
about the company, which includes its sector, production and sales volumes and market share. The information presented in this report is analyzed with an Industrial
Engineering perspective and relies heavily on our manufacturing and production courses. Company’s production and manufacturing systems are examined using
materials seen in Industrial Engineering courses.
1
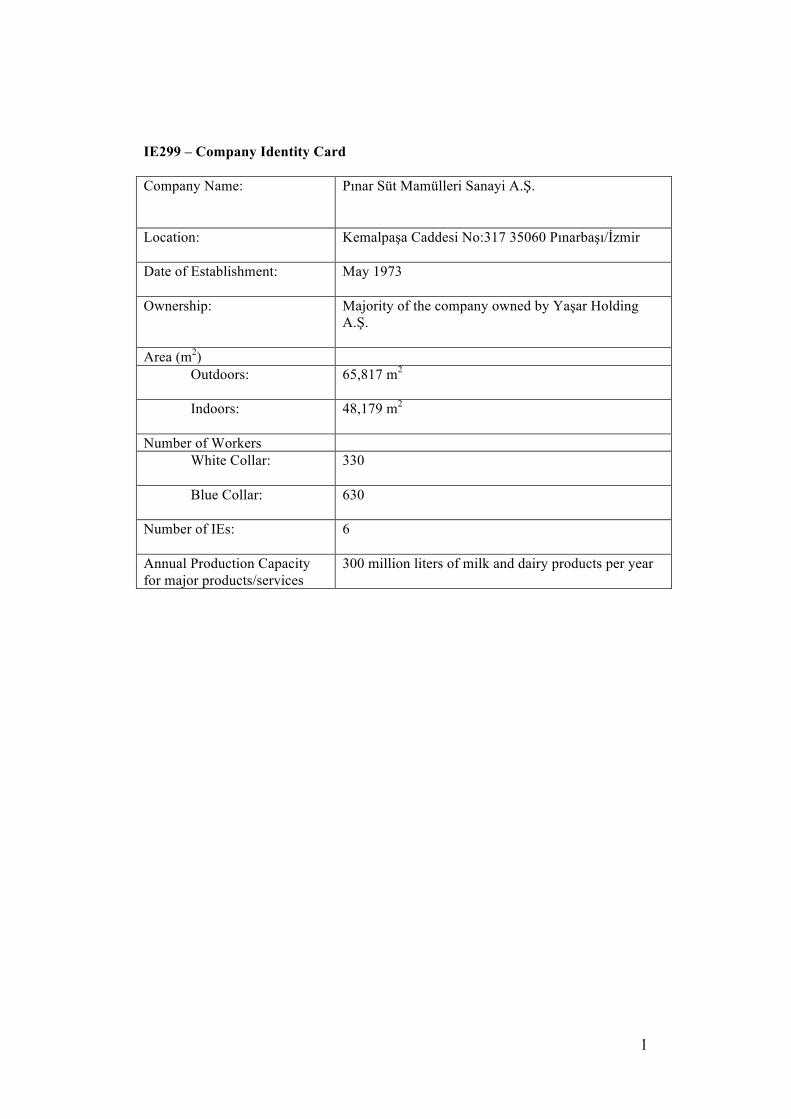
IE299 – Company Identity Card Company Name: Pınar Süt Mamülleri Sanayi A.Ş.
Location: Kemalpaşa Caddesi No:317 35060 Pınarbaşı/İzmir
Date of Establishment: May 1973
Ownership: Majority of the company owned by Yaşar Holding A.Ş.
Area (m2) Outdoors: 65,817 m2
Indoors: 48,179 m2
Number of Workers White Collar: 330
Blue Collar: 630
Number of IEs: 6
Annual Production Capacity for major products/services
300 million liters of milk and dairy products per year
2
PART 2
2.1. General Information
2.1.1. Ownership
Although one holding owns majority of the company, a big part of its shares are open
to shareholders. The Pınar Süt (2014) announces that 61.41% of the company is
owned by Yaşar Holding A.Ş. The remaining 38.59% are open to 3 different groups
of shareholders. In terms of TL, the share of Yaşar Holding refers to 27,603,901.56
TL in an aggregate of 44,951,051.25 TL. In total the company has 1600 partners.
2.1.2. Sector
Pınar Süt is in the milk and dairy products sector and it is one of the leading
companies in its sector. It is a sector that is not only very competitive, but also very
dynamic in terms of market growth. Pınar Süt (2014) reports that dairy market has
grown by 7% in the first half of 2014 compared to same period in 2013. This shows
that as big as the sector is, it is still open for more expansion.
2.1.3. Products
The company has many types of products in various product categories. They mainly
include milk (plain, light, fortified, flavored, lactose-free, organic), cheese, yoghurt &
ayran, and condiments. The company’s products revolve around the main substance
of milk. A more detailed list of product categories can be found in Appendix A.
2.1.4. Production Capacity
Pınar Süt (2010) states an increase in its milk and dairy product production capacity
to 300 million liters a year with addition of its new production plant investments in
3
Eskişehir. Pınar Süt (2011) gives production amounts for every product category in
2011. It is available in Appendix B.
2.1.5. Sales Volume
In 2014 H1, the company reported a growth in sales by 17.1% in terms of both value
and volume. In 2013, the company had net sales of 809,8 million TL. Pınar Süt
(2014) announced 612,4 million TL gross sales for the first 6 months of 2014 with a
16,24% increase over the same period in 2013. The company saw 157,08 thousand
tons in terms of sales volume, which is a 4,65% increase compared to previous 6-
month sales. Given Pınar Süt’s (2014) statistic on milk consumption in Turkey, which
states milk equivalent consumption per one person as 223 kgs, we can see how big of
a share Pınar has in the sector.
2.1.6. Market Shares and Competitors
Pınar Süt (2013) states the company has 26.3% market share of turnover in the
branded-product segment of milk category. It is in the leader position for many of the
product segments. The company occupies its superior position in various markets
with shares of 29.2% in long-life plain milk, 61.1% in light milk, 54.5% in fortified
children’s milk, 38% in spreadable cheese and 19.5% in flavored milks segment.
Sütaş, Ülker, Danone, Yörsan, SEK, Dost and Ateşoğlu make up the majority of the
company’s competitors in this highly ambitious sector. Pınar Süt (2014) reports one
of its latest major efforts as the new Şanlıurfa Investment, which is the establishment
of a new plant on a land of 100 thousand m2 that is planned to start its operations in
late 2014.
4
2.1.7. Suppliers and Customers
The company is operating its supply through 55 milk collection centers around
Turkey from 35,000 domestic suppliers twice a day. Although the company mainly
focuses on domestic supply and sales, a considerably large proportion of foreign
customers make up the net sales of the company. 13% of the export is accounted for
the company’s net sales, whereas 6% is made up by direct sales from the company,
and the majority 81% is accounted on sales under the name of YBP (Yaşar Birleşik
Pazarlama). Pınar Süt (2014) states foreign market shares as 21% Saudi Arabia, 12%
Iraq, 11% Kuwait, 9% UAE, where other smaller markets make up the rest.
Especially the company’s Pınar Labaneh Cheese product stands out in terms of its
high market share in their exported countries.
2.2. Organization
2.2.1. Organization Chart
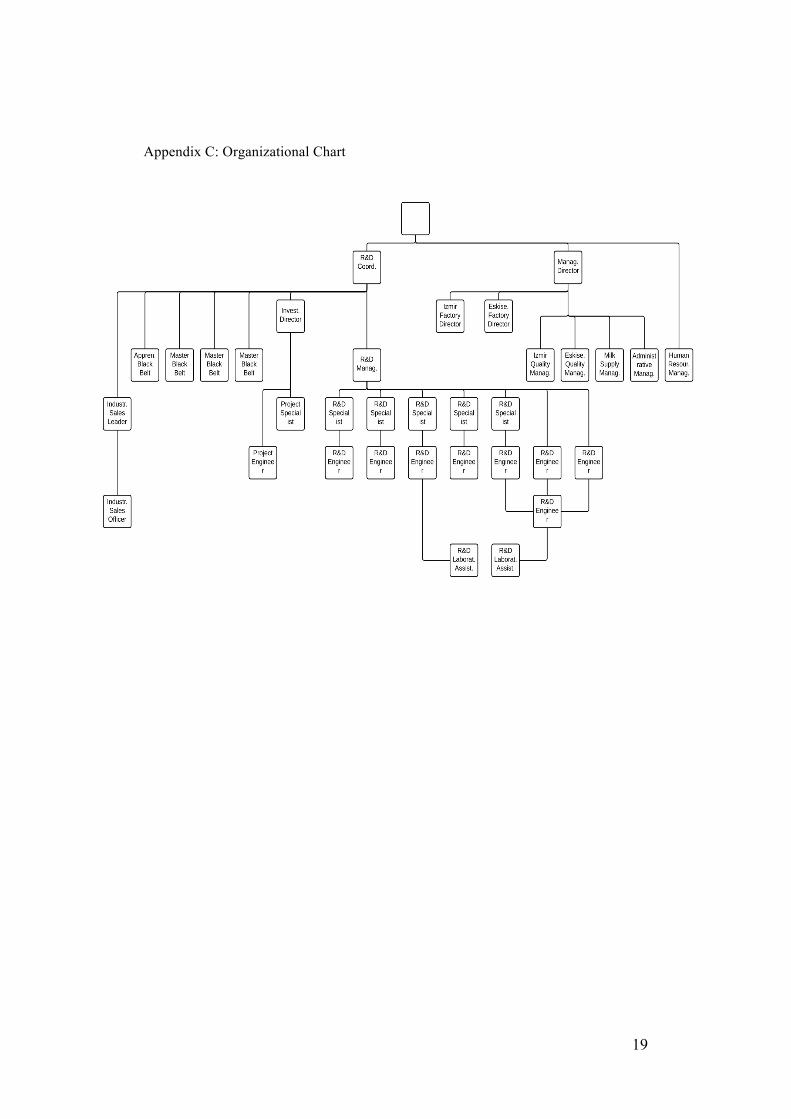
The Human Resources Department provided this organization chart and it represents
the hierarchical structure of the company. Since the document was in Turkish, I drew
the same organizational chart using English. It is available in Appendix C.
2.2.2. Organizational Analysis
We can make inferences on the hierarchical order based on this organizational chart.
On the top of this company, there is R&D coordinator, the Managing Director and
Human Resources Manager. Under Managing Director are the facility managers and
beneath them are Quality Control Managers, Supply Managers and Administrative
Managers. Under R&D coordinator we have R&D Manager, and beneath we see
5
R&D Specialists, and then the R&D Engineers and lastly R&D Laboratory Assistant.
However, just by looking at this organizational structure, we cannot see the details on
how the hierarchy in Manufacturing Departments works. There exists some division
of responsibilities, which some of the managers have explained to me during my
internship. In every division under the manufacturing department there exists a
manager. That manager is responsible for performing the sub-production in his
department using the schedules sent to him by the Planning Department. When doing
so, he is responsible for managing around 60 people in his department. He does not
only schedule their work and absence, but also is responsible for their morale in the
workplace as well. Under him, there are one or two foremen. They are more qualified
than other workers and they are expected to handle most of the daily production
problems with their talents. When their skill is not sufficient to solve the problems, or
their hierarchical order keeps them from solving them, then they reach out to the
manager. There are usually four shift chiefs in departments under them and they are
responsible for notifying the foremen about the problems in production. Beneath
them are regular workers, who are assigned to various task defined by the department
manager.
2.2.3. Roles of Industrial Engineers
The company has employees in various hierarchical orders in the organization. The
production system is made up of various white-collar and blue-collar workers in a
number of divisions. Surprisingly, Pınar doesn’t use industrial engineering in the core
manufacturing departments. The main working unit of Industrial Engineers is the
Production Planning Department. Here they get the chance to show not only their
managerial skills, but their mathematical background as well. Their job is crucial for
6
the company. Given an initial forecasted demand, production capacity values and
current storage levels, this department is responsible for determining the amount of
production for all of the products. When making decisions about the production
amount, they take a lot of things into consideration, such as budget, limited
workforce, limited resources and limited inventory. This project must be handled with
great care since both over-production of a product and running out of stocks for a
product would lead to great problems in terms of money and company reputation.
2.3. Production and Manufacturing Systems
2.3.1. The Production System
When talking about production, more than manufacturing must be taken into account
since production system is responsible from the beginning of the design of the
product until the end where it is in a feasible form to ship to the customer. So the
production system in a company is made up of many departments which all make
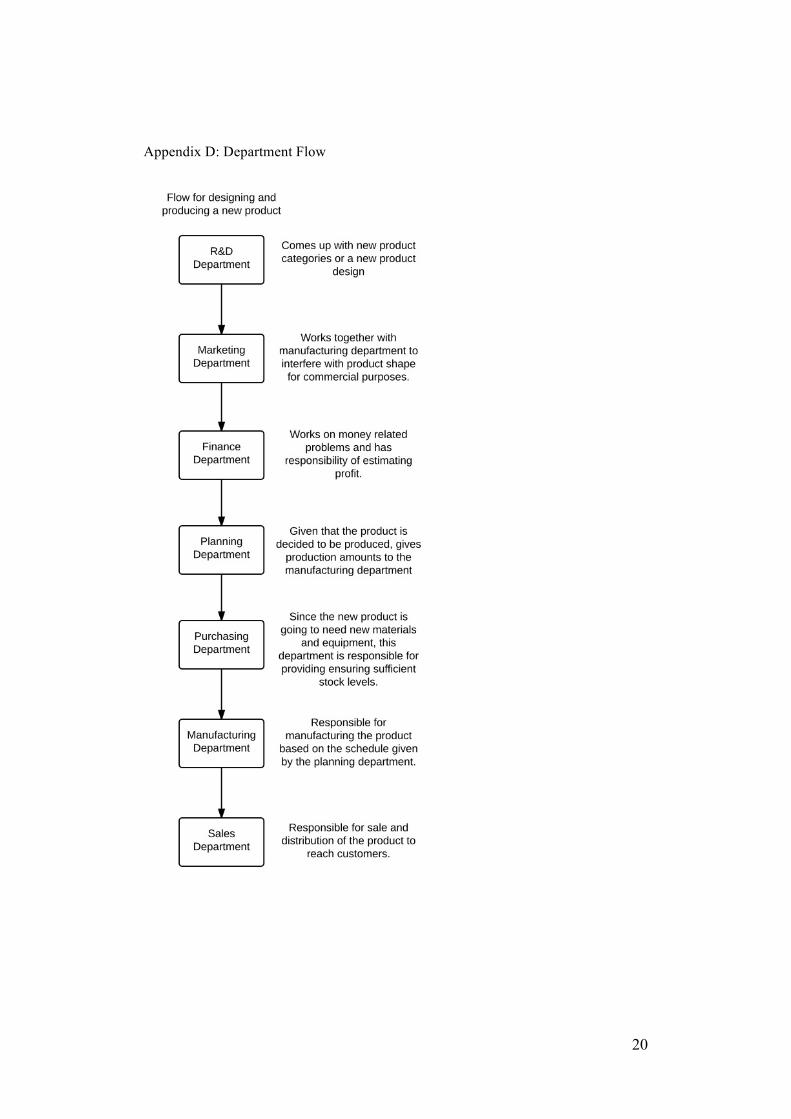
contribution to the final product. The R&D department creates the base for this
system. It is the department that initializes the production by coming up with different
products or even sometimes, different product categories. Then the Manufacturing
Department works on turning these ideas into realities. For example, if the idea is to
produce a new set of milk products, the Manufacturing Department works on how
they can produce it. When doing this, the department works very closely with the
Marketing Department. They sample the new product with Marketing Department
and come up with necessary modifications. These modifications can include anything
from commercial shape of the product to the commercial name or even logos. The
Marketing Department uses public surveys to estimate demand and sends the Finance
Department to estimate the cost, sale and profit. Given that the company decides to
7
push the product into the market, Production Planning Department sets a production
schedule and weekly production amounts for Manufacturing Department. Since the
manufacturing of this product is going to need some materials or new equipment, it is
the duty of Purchasing Department to provide them. For Pınar Süt, the first material
that comes to mind is milk, but apart from that they require many other materials that
can go from as simple as cartons to probiotic bacteria for use of making cheese and
yoghurt. Now that we have equipment and materials, the Manufacturing Department
starts the production according to production levels given to them by the Planning
Department. At this point, when there is a stock of unit available, it is the duty of the
Sales Department to distribute the finished good to the customers. We can observe
the explained departments and their duties in production by looking at the relevant
chart in Appendix D.
2.3.2. The Manufacturing System
The manufacturing and storage of any milk product is a very complex process and
requires many steps. Although the company uses raw milk to produce variety of
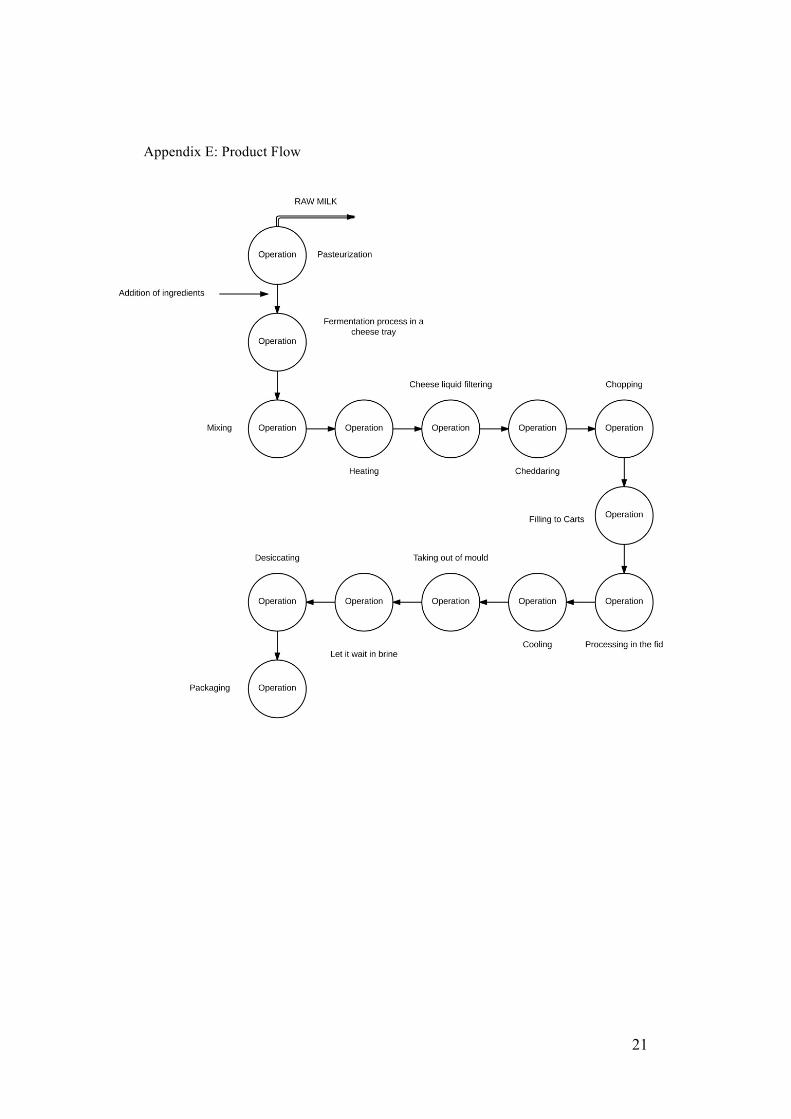
products, this part is going to focus on one product, cheese. The manufacturing of
cheese involves a few manufacturing sequences. We can find the operations chart for
the production of cheese in Appendix E.
If we look at this chart, we can see that manufacturing of cheese requires very
complex but linear steps. Cheese goes through all of these operations one by one and
as the manufacturing of cheese revolves around some traditional manufacturing steps
there is not much creativity that the company can add to these operations. It is nearly
impossible to eliminate an operation and the order of operations cannot be changed. It
8
starts with pasteurization and fermentation. Then the ingredients are treated until they
are ready to be filled to carts. Additional cooling and desiccating process makes the
product ready for the packaging. Since all of these steps require special conditions,
they take place in a particular department, the Cheese Manufacturing and Packaging
sub-department of the company. As we can see, the manufacturing system only
consists of taking the raw material, having some operations on them and turning them
into finished goods. This is where manufacturing system differs from a production
system. We can say that manufacturing system only makes up for a small portion of
the production system that deals with creating finished products from raw materials.
2.3.3. Classifications of the Manufacturing System
Pınar Süt plans and manufactures their products according to demand. Sometimes
they are forecasting, and for a number of products they are producing on demand.
However when we look at its main manufacturing product, commercial milk, we see
that its production schema fits Make-to-Stock (MTS) manufacturing the best. They
have a steady flow of demand that can be forecasted and planed for ahead of time.
They have a push-type production, where the company pushes its products to the
market without any order from the customer, and expect the product to be purchased
according to forecasts. This prevents the company from having any stock-outs,
however it puts a lot of work on supply management, since they do not want too
much excess inventory. The relatively short shelf life of milk makes this problem
more complicated. For Pınar Süt, Industrial Engineers who work in the Planning
Department handle this problem by designating weekly production schedules and
production amounts for every hour of that week.
9
Most of the production is highly mechanized. From use of high efficiency machines
to use of conveyors in most of the departments, we can see that the company focuses
heavily on high productivity and high production levels. This is in fact necessary
since the company has a MTS production model. Only some small parts of the
production requires manual handling for inspection or sometimes packaging, which I
am going to be focusing on in the third part of the training report.
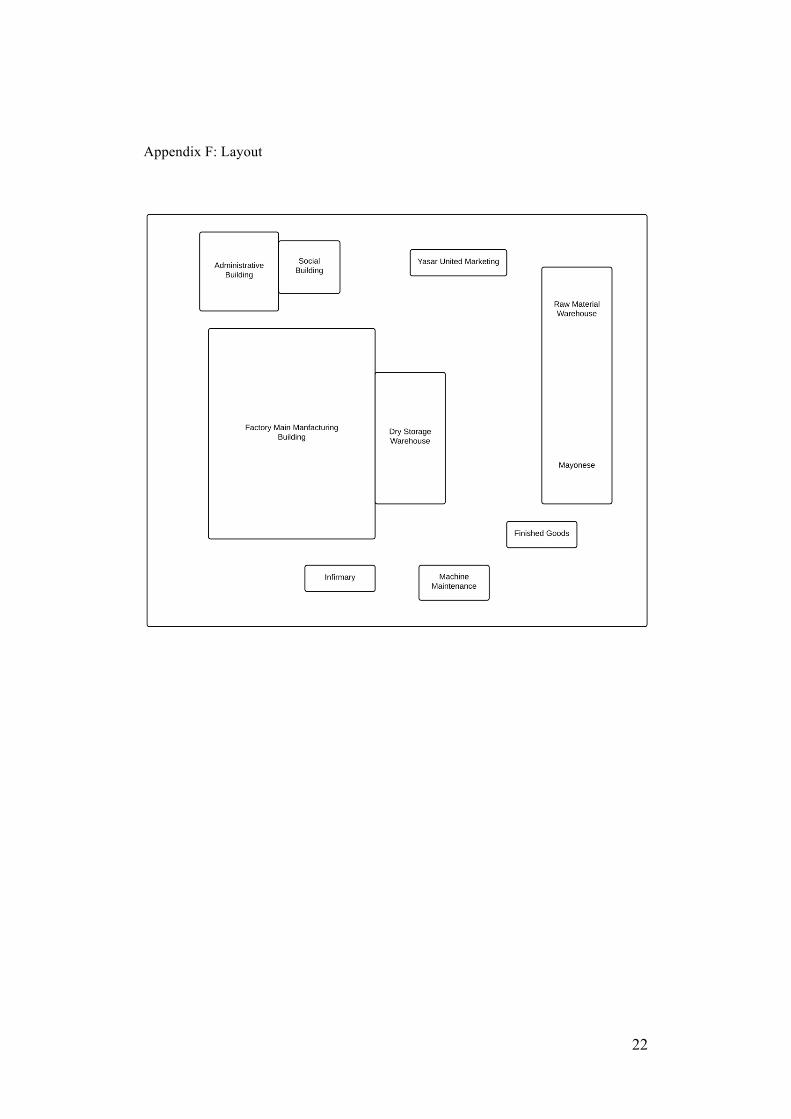
In terms of layout type, the factory uses product layout. For production of most of the
types, the equipment and operations are aligned along a line. This type of layout gives
company some advantages. Firstly, they can obtain a large amount of output in a
short period. Secondly, due to the high output, the unit cost of manufacturing is
lower. Thirdly, since the company focuses more on practicality rather than flexibility,
this type of layout allows them to produce without needing too much concentration
on details. This layout also leads to company having continuous-flow manufacturing.
This type of manufacturing is applicable when the manufacturing of products is
handled continuously, which is the opposite of the batch production.
2.3.4. Layout
I acquired a layout of the factory by using the layout schema available in the
company. Since the layout was in Turkish I drew a copy of the layout which will be
more appropriate for this course. It is available in Appendix F.
2.4. Productivity
I have spent a lot of time in the Tetra-Pak unit and have seen how it operates. It is the
unit that is responsible for taking the pasteurized milk and packing them into cartons.
Then the unit takes a batch of these cartons and packs them and then sends them to
10
the dispatch unit. Although I was not allowed to acquire the blueprints for this
subassembly location, I drew an approximation of the location below and I am going
to go through the flow presented on that drawing. The operations are mostly
mechanized, but I found a few things that make up the non-productive elements in
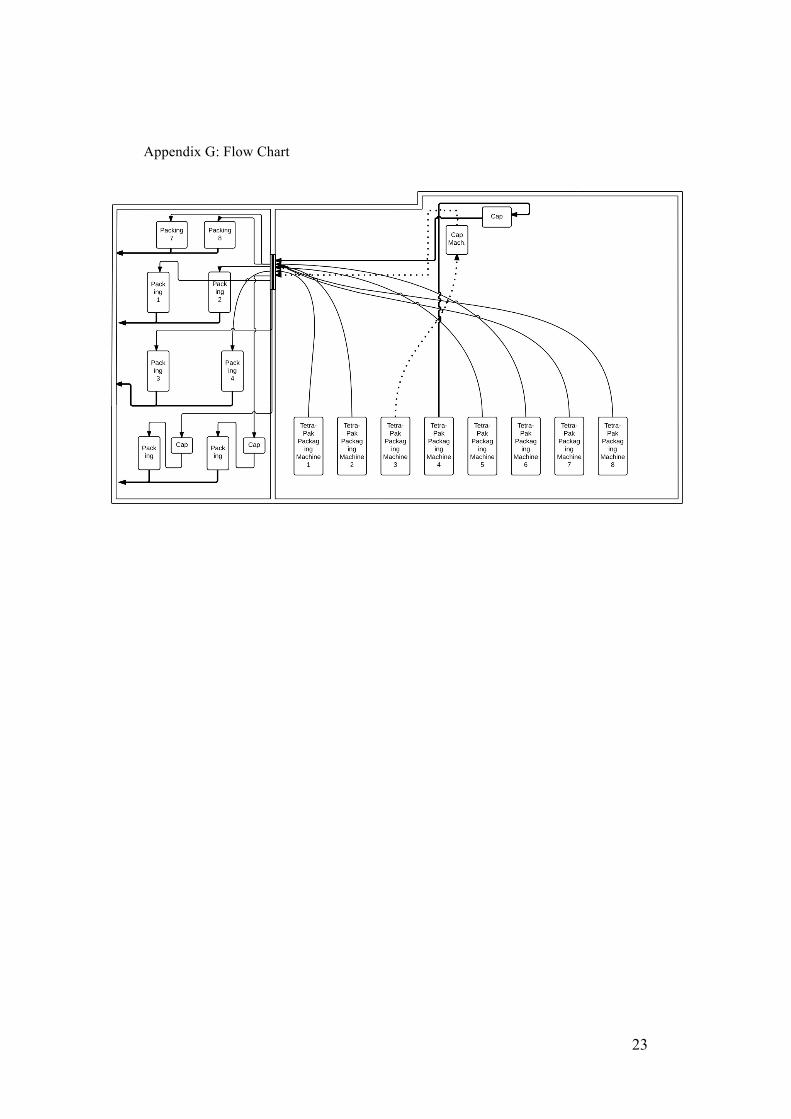
that subassembly. The flow chart is available in Appendix G.
The flow chart may need a little explaining due to its complexity. After explanation,
we can focus on its productive and non-productive elements. Tetra-Pak Packaging
Machines 1 and 2 are used for production of 500 ml milks, 3 and 4 produce 1 liter
milks, 5 and 6 produce 200 ml milks and lastly machine 7 and 8 produce 225 gr
puddings. The Tetra-Pak machine takes milk and other substances, mixes them and
then packages them. The packaged products are transferred with conveyors to batch
packing area where they are packed in batches. Only machine 3 and 4, which produce
1 liter milks, send their products to capping machine, since this is how the company
markets their product, and then send unit to packing. In packing unit, the 200 ml
milks first arrive into capping machines and then go to the packing machines. The
rest of the products also go to their corresponding packing machines, where two
machines can be found for each product type. After packing all products go to the
dispatch unit by conveyors.
As we can see, the process is very mechanized, therefore has many productive
elements. They are capable of producing different types of products and show all the
necessary operational information on them. All of the products are carried with their
own conveyors. During the travel of the products through conveyors, at some points,
there is automation where a unit in the batch is thrown into a basket. These baskets
11
are then removed and used for inspection. This automated inspection saves some time
during the production.
We should also note the non-productive elements in this process. First one that comes
to mind is about the unit’s maintenance. The Tetra-Pak units need to be cleaned
before the start of production for every product type. For example, for 500 ml milk,
Pınar produces regular milk, skim milk, organic milk and some other milk types.
Since the production schedule given by the Planning Department requires this
department to produce different products every day, the production stops a lot to give
time for cleaning. The second element is also due to production of different product
types, but this time includes human elements. Although the system is mostly
automated, the feeding of cartons into Tetra-Pak machines is still done manually.
When switching product type, the workers also need to change the cartons fed into
the machine every single time. Lastly, the packing units are a little mismatched in
timing. There are two packing units for each product and they work at the same time,
but once in a while one of them interrupts the output flow from the other one since
they are sent to dispatch unit on the same conveyor.
12
PART 3
My internship in Pınar involved working in different Manufacturing Departments
with supervision of different department managers. Although I believe that working
in each of these departments taught me something, I believe there is one that stands
out from the rest. It is also the sub-assembly that I worked on the most and enjoyed
the most. I worked there for a project we were given as a team of five industrial
engineers. First, we were taken to a sub-assembly packaging unit. The packaged
product is Pınar Labaneh, which is produced only for exporting. The unit was
responsible for taking the sub-products in pallets, inspecting them for errors, putting
plastic caps on the non-faulty sub-product, and then packing them into large packages
to be sent to storage unit. What makes this unit special is a couple of things. Firstly,
since the production amount was relatively low, all of the packing was done
manually. Secondly, the product design was new and the supplier would send a lot of
faulty containers. Therefore they needed a heavy load of inspection before they are
packed for storage. Lastly, the unit was next to the cheese production unit, which
requires hot temperatures. As a consequence, the working conditions were hard and
low worker morale was identified. Our task was to optimize this challenging process
and to try to increase the hourly output. We have spent a lot of time observing how
the process was currently done, tried to find its peak and lowest speeds and determine
the possible improvements. However, we found a lot of things which are out of our
control, such as the amount of faulty containers. In every pallet of 1344 units the
faulty ones could go up to 320, which can lead to both lower output and high
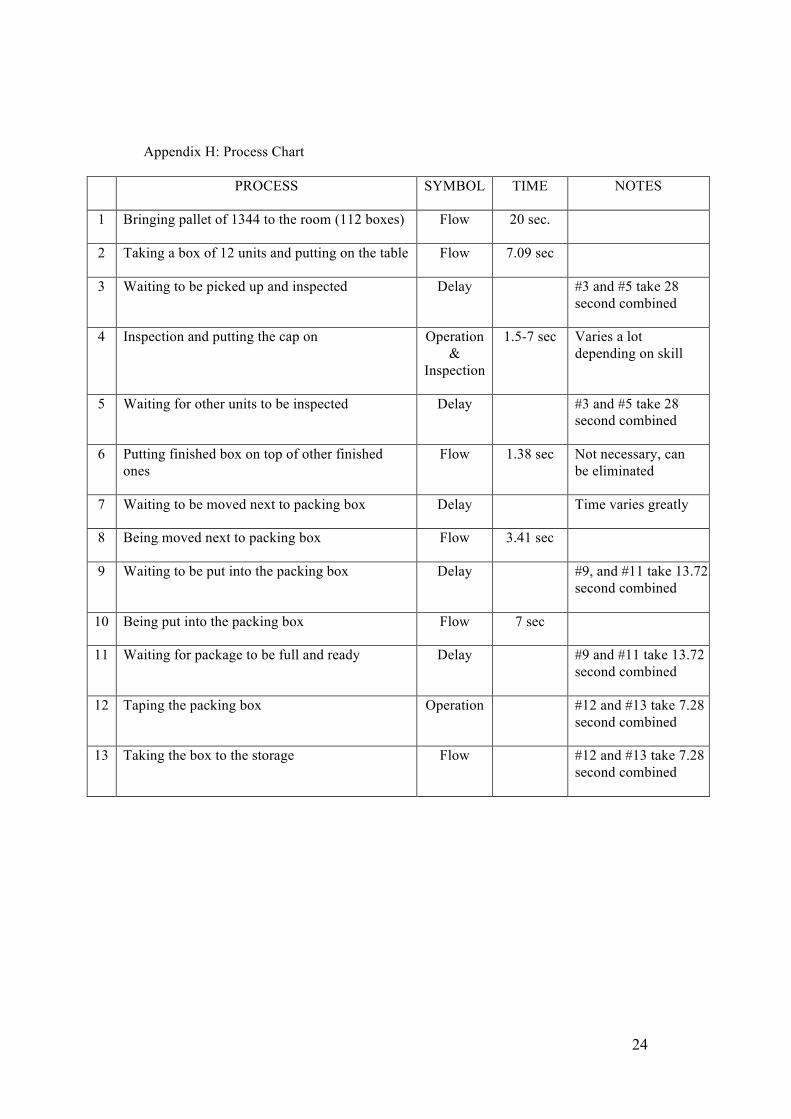
inspection times. Having observed the sub-assembly, I created an initial process chart
for current operation. It is available in Appendix H.
13
The greatest difficulty for us was that, although we could manage to create a process
chart with nearly average times, which shows that it takes 89.38 seconds to pack and
being done with one box of product, there were a few problems. Firstly, there is not
only one worker doing this job. In fact, at that time, three workers were working. The
first two of them were doing the inspection and putting caps on the product and
passing it to the third worker. The third worker was responsible for packing.
Moreover, other observations showed that the time it takes to finish packing one box
would take anywhere from 1 minute to 3 minutes and 10 seconds. That is when I
realized that there is one thing that we cannot control, but it is one of the crucial
elements in a production where you use manual labor. That is the morale of the
worker. This process gives an example for how morale can single handedly affect the
production times and output. Considering that huge impact, the biggest improvement
would be to mechanize the process. This would get rid of all the wasted time due to
workers and in the long term it would be advantageous in terms of profit. However,
we neither had the authorization nor the budget. So we went back to the manual
process and tried to identify some small parts that could make an impact. We focused
on two things; the non-productive elements and suggestions. They were as follows:
3.1. Non-Productive Elements
- Everyone was assigned to more than one task at one time. This created unnecessary
worker flow in the unit and also kept the workers from specializing in one process. It
led to longer inspection and packaging processes, and also waste of time.
- There was no specific inspection model. The manager would tell them to inspect
and separate the faulty products, however there were a lot of times where the workers
14
would not know if the product should be considered faulty and spend time arguing
with each other on that matter.
- Although two workers were instructed to look for and separate the faulty ones, we
observed that the third worker would also spend time separating unnoticed faulty
products. This led to third worker packing slowly since he would have to take notice
of the products while he packed them.
- As we can see in the process chart we have some unnecessary operations. The most
obvious one is putting finished box on top of other finished ones. This was a habit
that we came across from other workers, but couldn’t find any productivity in it.
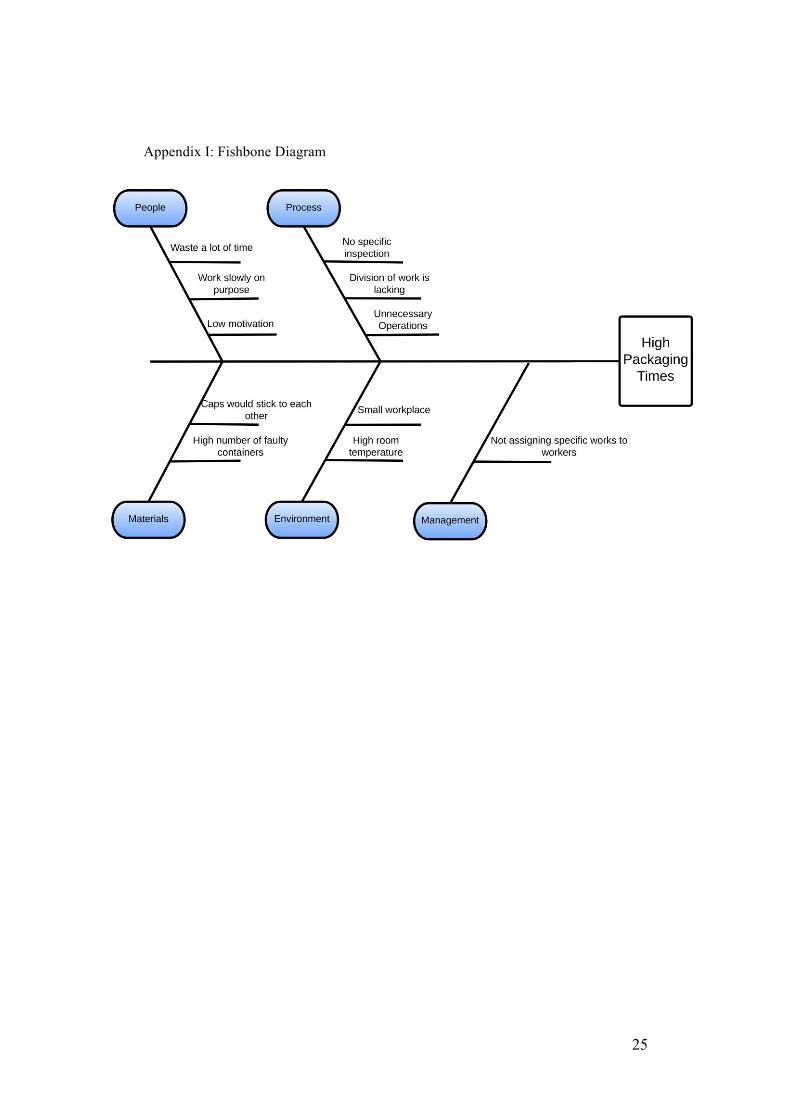
More extended causes with additional mistakes are on the fishbone diagram that is
available in Appendix I.
3.2. Suggestions
- We can create a specific inspection model. We have found that a faulty and non-
faulty product can be differentiated by their difference in volume. Using some sort of
specialized volume calculating system could lead to a specification for the inspection,
and eliminate the indecisions in the process.
- When the third worker puts the products into packaging box, we observed two
practices. Either he throws all the set of 12 units into the box and then spends time
fixing their position, or he takes 4 product at a time and places them, then repeats for
three times. In our observations, it was found that the second practice would take 2
seconds less for every box compared to first practice. So we decided that this should
be set as the recommended practice.
15
- In our process chart it is shown in notes that there is one specific unnecessary
operation, which is putting the inspected product into box of 12 again, waiting for the
box to fill with inspected products, and then putting the box on top of other finished
boxes. We identified that this habit was caused by the lack of workspace. However, if
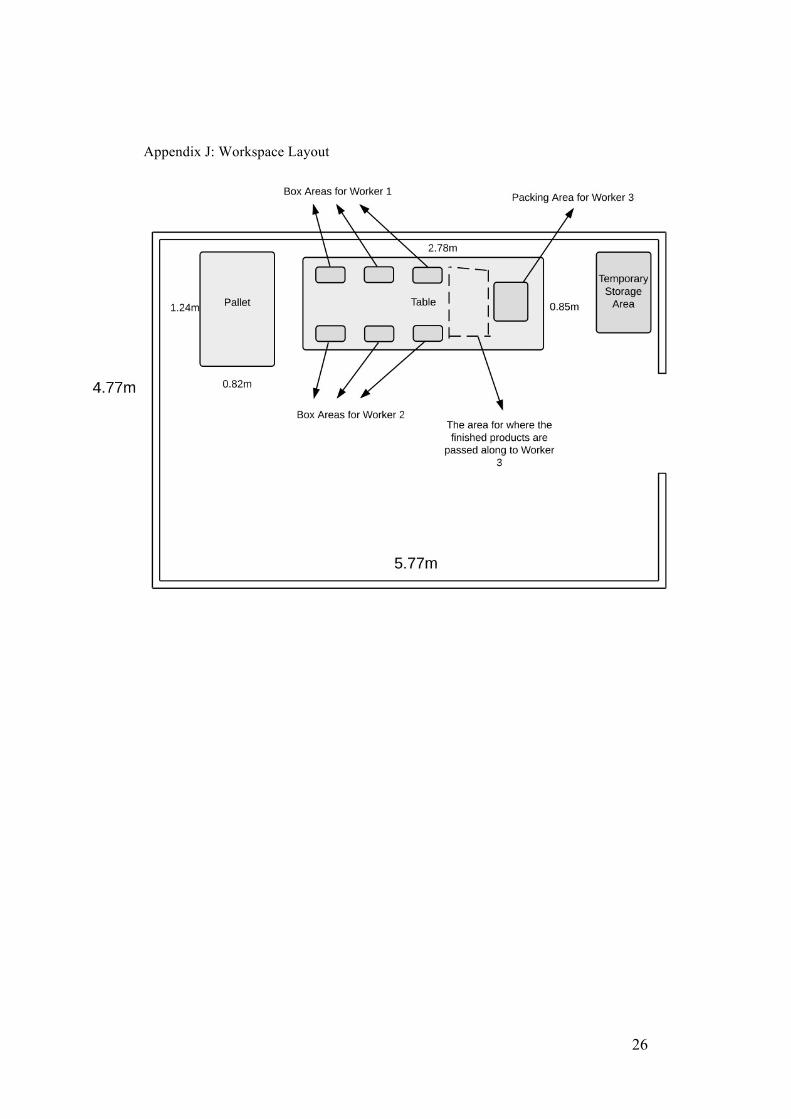
we can get a larger work table, the best practice would be to pass along the inspected
product next to the packaging box right away, that would eliminate steps #5, #6, and
#7 altogether. That could lower the process time up to 30 seconds. Even with the
current workspace, we designed a work model that could apply this practice. It is
available in Appendix J.
-In inspection we saw two methods that separate skilled workers from unskilled ones.
The skilled workers could inspect the product without the need of looking at it, just
by touching to identify the faulty ones. The unskilled worker would take its time and
looks at all angles of the product. With some practice, we came to learn that the first
method is indeed possible to learn and by taking time to teach unskilled workers, that
method could lower the production times in the long run.
3.3. Results
The extended discussion with our supervisor led us to some estimated numbers. We
estimated that under ideal conditions applying these small modifications may lead to
packing and storage of 80 boxes per hour. This number is forecasted as a raw
estimate; therefore real life application of the designed process could lead to different
production outputs. However, the fact that the current practice leads to production
amount of 60 boxes per hour led us to believe that the process can indeed be
16
improved this way. Ultimately, we did not get a chance to work further on the
subject, but it led us to get a first hand experience in a real life situation.
Having worked in this department made a great influence on me. Firstly, I got to learn
how a real workplace works, and how there may exist some factors that you cannot
have a control over and that you have to learn to manage them in some ways. I
realized that the subjects we have learned in our department courses in the university
did indeed broaden my horizon substantially. When faced with a problem, I believe I
acquired some tools in my pocket that help me identify, analyze and solve it.
17
References
Pınar Süt 2010. “Pınar Süt Annual Report 2010, Assesment of 2010 Activities” accessed at http://eng.pinar.com.tr/pdf/sut/pinarsut/pdf/en9.pdf as of October 4, 2014.
Pınar Süt 2011. “Pınar Süt in 2011” accessed at
http://www.pinar.com.tr/pdf/sut/pinarsut11/pdf/tr11.pdf as of October 9, 2014.
Pınar Süt 2013. “Pınar Süt Annual Report 2013”, accessed at
http://eng.pinar.com.tr/pdf/sut/pinarsut2013/pdf/en-8.pdf as of October 4, 2014.
Pınar Süt 2014. “Earnings Presentation, 2014 H1” accessed at
http://eng.pinar.com.tr/images/pdf/PNSUT-2014-1H.pdf as of October 9, 2014.
Pınar Süt 2014. “Legal Mid-Year 6 Months Annual Report 2014” accessed at
http://www.pinar.com.tr/images/pdf/6aylikaradonemyasalfaaliyetraporusut.pdf as of October 10, 2014.
Pınar Süt 2014. “Shareholder Structure” accessed at http://eng.pinar.com.tr/investor-
relations/milk-detail/Shareholder-Structure/2186/2296/0 as of October 3, 2014.
18
Appendix
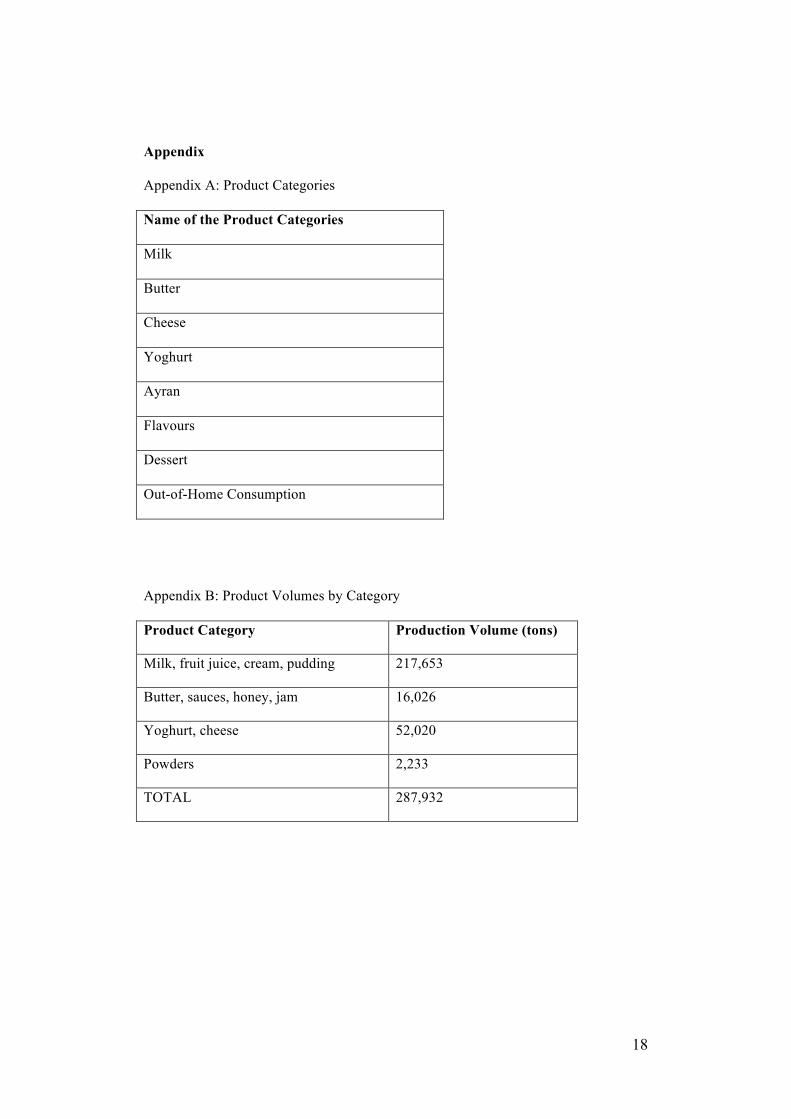
Appendix A: Product Categories
Name of the Product Categories
Milk
Butter
Cheese
Yoghurt
Ayran
Flavours
Dessert
Out-of-Home Consumption
Appendix B: Product Volumes by Category
Product Category Production Volume (tons)
Milk, fruit juice, cream, pudding 217,653
Butter, sauces, honey, jam 16,026
Yoghurt, cheese 52,020
Powders 2,233
TOTAL 287,932
19
Appendix C: Organizational Chart
20
Appendix D: Department Flow
21
Appendix E: Product Flow
22
Appendix F: Layout
23
Appendix G: Flow Chart
24
Appendix H: Process Chart
# PROCESS SYMBOL TIME NOTES
1 Bringing pallet of 1344 to the room (112 boxes) Flow 20 sec.
2 Taking a box of 12 units and putting on the table Flow 7.09 sec
3 Waiting to be picked up and inspected Delay #3 and #5 take 28 second combined
4 Inspection and putting the cap on Operation &
Inspection
1.5-7 sec Varies a lot depending on skill
5 Waiting for other units to be inspected Delay #3 and #5 take 28 second combined
6 Putting finished box on top of other finished ones
Flow 1.38 sec Not necessary, can be eliminated
7 Waiting to be moved next to packing box Delay Time varies greatly
8 Being moved next to packing box Flow 3.41 sec
9 Waiting to be put into the packing box Delay #9, and #11 take 13.72 second combined
10 Being put into the packing box Flow 7 sec
11 Waiting for package to be full and ready Delay #9 and #11 take 13.72 second combined
12 Taping the packing box Operation #12 and #13 take 7.28 second combined
13 Taking the box to the storage Flow #12 and #13 take 7.28 second combined
25
Appendix I: Fishbone Diagram
26
Appendix J: Workspace Layout


![Raymond James Conference - Esprinet S.p.A. - IT & …investor.esprinet.com/contenuti/download/[11.12.2014]Esprinet_RJ.pdf · Technology wholesale distributor in Italy, ... 13 AVNET](https://static.fdocuments.us/doc/165x107/5ac2d6487f8b9aae1b8b9eff/raymond-james-conference-esprinet-spa-it-11122014esprinetrjpdftechnology.jpg)