STOCK-AND-FLOW SIMULATION MODELING FOR ASSESSING BASIC ...
15
STOCK-AND-FLOW SIMULATION MODELING FOR ASSESSING BASIC SUPPLY CHAIN OPERATIONS Ilija Hristoski 1 ,Ramona Markoska 2 , Tome Dimovski 3 , Nikola Rendevski 4 , and Željko Stojanov 5 Abstract: The supplychain is a backbone of business operations, an indispensable part of every organization, whether small or large. Effective supplychain management (SCM) is one of the most important aspects of running a successful and profitable business, leading to maximizing customer value and achieving a sustainable competitive advantage over the competitors. In the era of omnipresent digitalization, SCM is subject to intensive ICT support that transforms supply chain operations in a profound manner. The aim of the paper is to propose a basic simulation modeling framework suitable for carrying out various analyses vis-à-vis supply chain operations, based on the utilization of continuous stock-and-flow simulations. The resulting simulation model allows one to run various scenarios, making a plethora of ‘what-if’ analyses regarding a number of adjustable input variables. As an example of how digital transformation affects traditional supply chains, it provides a solid basis for further enhancements and inclusion of additional input and output parameters for forecasting purposes. Key words: supply chain,modeling, stock-and-flow simulation, Web-based simulation, InsightMaker 1 “St. Kliment Ohridski” University – Bitola / Faculty of Economics – Prilep, North Macedonia, e-Mail: [email protected] 2 “St. Kliment Ohridski” University – Bitola / Faculty of Information and Communication Technologies – Bitola, North Macedonia, e-Mail: [email protected] 3 “St. Kliment Ohridski” University – Bitola / Faculty of Information and Communication Technologies – Bitola, North Macedonia, e-Mail: [email protected] 4 “St. Kliment Ohridski” University – Bitola / Faculty of Information and Communication Technologies – Bitola, North Macedonia, e-Mail: [email protected] 5 University of Novi Sad / Technical Faculty “Mihajlo Pupin”– Zrenjanin, Serbia, e-Mail: [email protected] Page 269
Transcript of STOCK-AND-FLOW SIMULATION MODELING FOR ASSESSING BASIC ...

STOCK-AND-FLOW SIMULATION MODELING FOR
ASSESSING BASIC SUPPLY CHAIN OPERATIONS
Ilija Hristoski1,Ramona Markoska2, Tome Dimovski3, Nikola Rendevski4, and
Željko Stojanov5
Abstract:
The supplychain is a backbone of business operations, an indispensable part of every organization,
whether small or large. Effective supplychain management (SCM) is one of the most important
aspects of running a successful and profitable business, leading to maximizing customer value and
achieving a sustainable competitive advantage over the competitors. In the era of omnipresent
digitalization, SCM is subject to intensive ICT support that transforms supply chain operations in a
profound manner. The aim of the paper is to propose a basic simulation modeling framework suitable
for carrying out various analyses vis-à-vis supply chain operations, based on the utilization of
continuous stock-and-flow simulations. The resulting simulation model allows one to run various
scenarios, making a plethora of ‘what-if’ analyses regarding a number of adjustable input variables.
As an example of how digital transformation affects traditional supply chains, it provides a solid basis
for further enhancements and inclusion of additional input and output parameters for forecasting
purposes.
Key words: supply chain,modeling, stock-and-flow simulation, Web-based simulation, InsightMaker
1“St. Kliment Ohridski” University – Bitola / Faculty of Economics – Prilep, North Macedonia,
e-Mail: [email protected] 2“St. Kliment Ohridski” University – Bitola / Faculty of Information and Communication Technologies – Bitola,
North Macedonia, e-Mail: [email protected] 3“St. Kliment Ohridski” University – Bitola / Faculty of Information and Communication Technologies – Bitola,
North Macedonia, e-Mail: [email protected] 4“St. Kliment Ohridski” University – Bitola / Faculty of Information and Communication Technologies – Bitola,
North Macedonia, e-Mail: [email protected] 5 University of Novi Sad / Technical Faculty “Mihajlo Pupin”– Zrenjanin, Serbia,
e-Mail: [email protected]
Page 269
Introduction
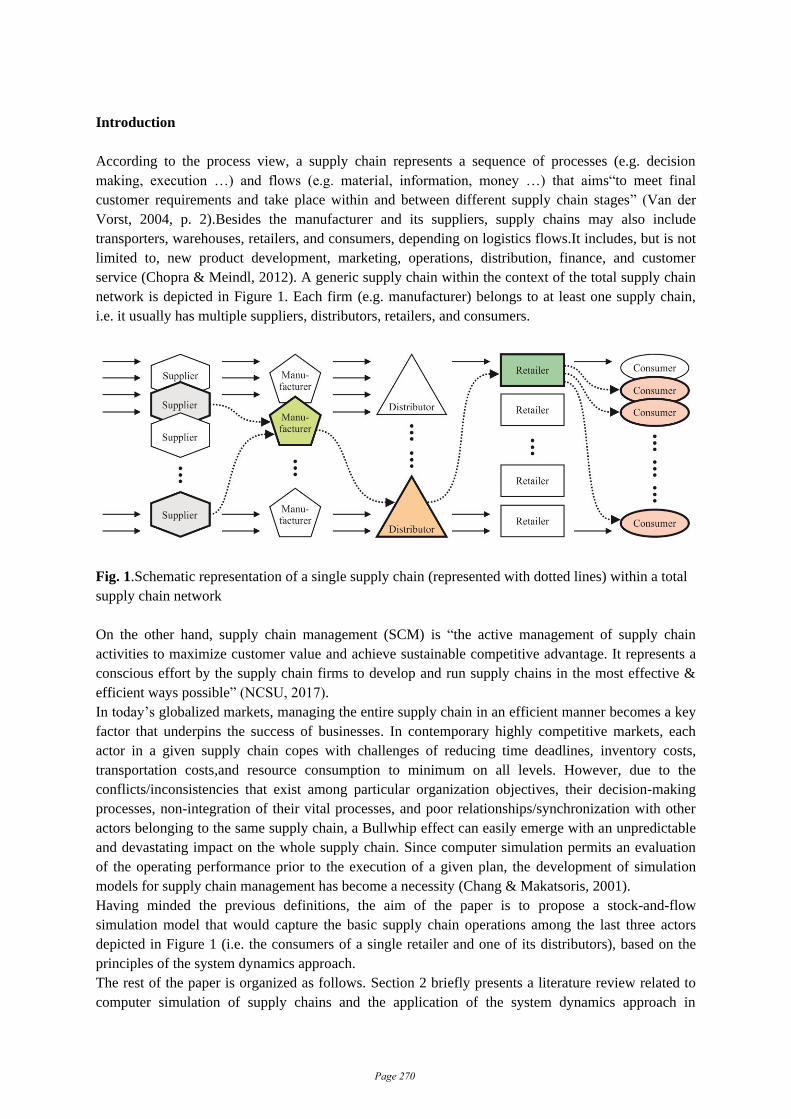
According to the process view, a supply chain represents a sequence of processes (e.g. decision
making, execution …) and flows (e.g. material, information, money …) that aims“to meet final
customer requirements and take place within and between different supply chain stages” (Van der
Vorst, 2004, p. 2).Besides the manufacturer and its suppliers, supply chains may also include
transporters, warehouses, retailers, and consumers, depending on logistics flows.It includes, but is not
limited to, new product development, marketing, operations, distribution, finance, and customer
service (Chopra & Meindl, 2012). A generic supply chain within the context of the total supply chain
network is depicted in Figure 1. Each firm (e.g. manufacturer) belongs to at least one supply chain,
i.e. it usually has multiple suppliers, distributors, retailers, and consumers.
Fig. 1.Schematic representation of a single supply chain (represented with dotted lines) within a total
supply chain network
On the other hand, supply chain management (SCM) is “the active management of supply chain
activities to maximize customer value and achieve sustainable competitive advantage. It represents a
conscious effort by the supply chain firms to develop and run supply chains in the most effective &
efficient ways possible” (NCSU, 2017).
In today’s globalized markets, managing the entire supply chain in an efficient manner becomes a key
factor that underpins the success of businesses. In contemporary highly competitive markets, each
actor in a given supply chain copes with challenges of reducing time deadlines, inventory costs,
transportation costs,and resource consumption to minimum on all levels. However, due to the
conflicts/inconsistencies that exist among particular organization objectives, their decision-making
processes, non-integration of their vital processes, and poor relationships/synchronization with other
actors belonging to the same supply chain, a Bullwhip effect can easily emerge with an unpredictable
and devastating impact on the whole supply chain. Since computer simulation permits an evaluation
of the operating performance prior to the execution of a given plan, the development of simulation
models for supply chain management has become a necessity (Chang & Makatsoris, 2001).
Having minded the previous definitions, the aim of the paper is to propose a stock-and-flow
simulation model that would capture the basic supply chain operations among the last three actors
depicted in Figure 1 (i.e. the consumers of a single retailer and one of its distributors), based on the
principles of the system dynamics approach.
The rest of the paper is organized as follows. Section 2 briefly presents a literature review related to
computer simulation of supply chains and the application of the system dynamics approach in
Page 270

building simulation models of supply chains, in the last decade.Section 3 elaborates the common
supply chain simulation approaches and focuses on the details of system dynamics. Section 4
describes the problem to be dealt with by describing the underlying causal loop diagram and
formulating the corresponding SD model implemented in InsightMaker. Section 5 evaluates the
results obtained. Finally, Section 6 provides conclusions, research limitations, and future research
lines.
Related Research
Due to its increased significance in recent years, computer simulation of supply chains has been put in
the focus of methodologies for their analysis and assessment.The research being made in this area and
being covered in this section can be roughly divided into two subcategories: (a) papers dealing with
the application of computer simulation in SCM (in general) and (b) papers focused solely on the
application of the system dynamics (SD) approach in modeling and simulation of supply chains. What
follows is a brief overview of some of the research endeavors done in this field during the last decade.
The subsequent three pieces of research belong to the first subcategory:
Hossain & Ouzrout (2012) attempted to model the trust in SCM for using Agent Modeling Language
(AML) by proposing a Multi-Agent System (MAS) SCM model of trust in supply chain management.
The proposed model is implemented using the Java Agent Development Environment (JADE) and the
simulation results demonstrated the impact of trust in the supply chain along with the evolution of
trust.
Ingalls (2014) elaborates the reasons for using simulation as an analysis methodology to evaluate
supply chains, its advantages and disadvantages compared to other analysis methodologies, and points
out some business scenarios where simulation can help in obtaining cost reductions that other
methodologies would miss.
Sánchez-Ramírezet al. (2016) develop a simulation model to improve the performance of an
automotive supply chain and using sensitivity analysis, they find the values that allow the supply
chain to improve its order fulfillment indicator by modification of specific variables in the model such
as Cycle Time, Production Adjustment Time, Delivery Time, Raw Material Inventory, and Finished
Good Inventory.
What follows are some of the most prominent researches that belong to the second subcategory:
Wai &Chooi-Leng (2011) utilize system dynamics approach and the iThink® software to better
understand the supply chain system of an actual semiconductor company and to find out better
solutions through experimentations with a few key variables. The results of their research revealed
that a company could achieve up to 25% reduction in inventory cost using computer simulations.
Feng (2012) used the method of system dynamics (SD) to model supply chain information sharing, in
order to demonstrate its importance in SCM.
Mula et al. (2013) propose a simulation approach based on system dynamics for operational
procurement and transport planning in a two-level, multi-product and multi-period automobile supply
chain. They used the Vensim® simulation tool to highlight the potential of system dynamics for
supply chain simulation. The effectiveness of the proposed model was validated through the
comparison of the results provided by spreadsheet-based simulation, fuzzy multi-objective
programming, and system dynamics-based simulation models. The simulation results indicated a
reduction in inventory cost by about 10%.
Sundarakaniet al. (2014) analyzed the environmental implications of the rapidly growing construction
industry in the UAE using the system dynamics approach. By quantitative modeling of the
construction industry supply chain, which helps to measure the dynamic interaction among various
Page 271
factors under multiple realistic scenarios, their study provides an analytical decision framework to
assess emissions of all stages applicable to the construction industry supply chain.
Hoque & Khan (2016) attempted to provide a review of the best practices and performance measuring
frameworks on supply chain performance measurement in order to control and improve operational
efficiency and effectiveness, as well as on the system dynamics modeling solely in the field of SCM.
According to their research, despite the fact that the dynamic complexity of supply chains can be
handled through SD modeling, articles that provide best practices for measuring supply chain
performance using the SD approach are quite rare.
There are also a rising number of Ph. D. theses that focus on the application of SD approach to supply
chains in different areas, like Li (2016), who focused on risk modeling and simulation of chemical
supply chains, and Botha (2017), whoused SD simulation for strategic inventory management in the
automotive industry of South Africa.
Ghadge et al. (2018) assessed the impact of additive manufacturing implementation on aircraft supply
chain networks, using a system dynamics simulation approach that revealed significant and valuable
insights into the supply chain performance.
In their research based on the use of agro-straw as a typical agro-waste, Liu et al. (2018) utilize a
hybrid approach, built on multi-objective optimization and system dynamics simulation,intended for
optimizing the structure of straw-to-electricity supply chain and designing motivational mechanisms
to enhance its sustainability.
Abidiet al. (2018) present a system dynamics simulation inventory management modeling for a multi-
echelon multi-product pharmaceutical supply chain that aims to support selecting optimal operational
service levels regarding the total inventory cost.
Supply Chain Simulation
As one of the several methodologies available for supply chain analysis, simulation has distinct
advantages and disadvantages when compared to other analysis methodologies. Since the objective of
any simulation is performance evaluation,supply chain simulation enables effective strategic planning
and decision making. Customers, products, sites, and transportation modes can be defined using
supply chain specific modeling constructs. Customized business logic, objects, and rules can be
defined to capture the dynamics and real-world supply chain behavior. Business policies for
inventory, sourcing, transportation, and production processes can be modeled, as well. Applications
include: (a) supply chain network design; (b) demand planning; (c) production capacity planning; (d)
inventory optimization; (e) transportation modeling; and (f) modeling of warehouse operations.
Some of the most prominent benefits/features of performing supply chain simulationsmay include
(PMC, −):
• Creation of realistic supply chain models capturing system
dynamics,resourceconstraints,and risk;
• Simulation of existing (as-is) and improved (to-be)supply chain network designs;
• Analysis of the performance metrics such as service level, cost, inventory level, and cycle
time;
• Visualization of the supply chain in action;
• Evaluation of routing strategies and testing new strategies to predict actual costs and service
levels;
• Optimization of supply chain performances.
Page 272

It should be notified that supply chain simulations can be carried out by using common or
dedicated/specialized commercially available software packages such as Arena, AutoMod,
ExtendSim, ProModel, Supply Chain Guru, Simul8, Solvoyo, Tecnomatix Plant Simulation,
and Witness. In general, supply chain simulations can be also carried out by developing and running
a suitable simulation model using a general-purpose programming language (e.g. Python/SimPy).
The main approaches encompass either Discrete-Event Simulation (DES) methods or continuous
simulations (e.g. stock-and-flow simulations).
A discrete-event simulation (DES) models the operation of a given system as a (discrete) sequence of
events in time. Each event occurs at a particular instant in time and marks a change of state in the
system. Between any two consecutive events, no change in the system is assumed to occur; thus the
simulation time can directly jump to the occurrence time of the next event (Robinson, 2014).Contrary
to this, with continuous simulations, the system state is changed continuously over time on the basis
of a set of differential equations defining the relationships for the rates of change of state variables. In
trivial cases, those systems of differential equations can be solved analytically, otherwise, they are
solved numerically, by using a computer and a corresponding software, either general-purpose or
dedicated one (Duivesteijn, 2006; Thierry et al., 2008, pp. 12−13).
System Dynamics (SD) is a methodology and a mathematical modeling and simulation technique for
framing, understanding, and discussing complex issues and problems. As an approach to
understanding the dynamic behavior of complex systems over time and an important aspect of the
systems thinking theory, SD uses internal feedback loops, time delays, as well as stocks and flows to
model the entire system. In fact, stocks and flows are the main building blocks of SD models (Ford,
1999, pp. 14−24). Contrary to Discrete-Event Simulation (DES), SD uses a quite different approach.
SD is essentially deterministic by nature. It models the observed system as a series of stocks and
flows, whilst state changes are continuous, resembling a motion of a fluid at a given rate, flowing
through a system of reservoirs or tanks (stocks), mutually connected by pipes (flows). Stocks are
variables presenting the level of accumulation. Flows go in and/or out of the stocks, thus increasing or
decreasing their values with a certain rate. In essence, SD deals with the interaction of different
elements of a system in time and captures the dynamic aspect by incorporating concepts such as stock,
flows, feedback and delays, and thus offers an insight into the dynamic behavior of a system over time
(Tang & Vijay, 2001).
Because of its great flexibility, along with its ability to combine together both qualitative and
quantitative aspects of the modeled system, as well as its tendency to model and simulate the
dynamics of a system at a higher, yet more strategic level in order to gain a holistic insight into the
dynamic interrelations among the different parts of a complex system, SD has been applied in many
different fields of study so far, including project management, system analysis, health care, supply
chain management, logistics, sustainability, environmental science, etc.The SD approach has become
popular in SCM during the last two decades, although it was initially introduced by Jay Forrester in
1961.
Given the accuracy of this modeling method that permits building formal computer simulations of
complex systems and their use to design more effective policies, in this paper, we revert to continuous
simulations based on the SD principles. Using general-purpose Web-based software in a SaaS
manner, we develop a simplified simulation model capturing the basic supply chain operations.
Stock-and-Flow Simulation Model
Contemporary software solutions that support integrated supply chain operations cover a number of
operations related to the cost, quality, delivery, and flexibility that arise from the very first suppliers to
Page 273
the end consumers. For instance, retailers do not make explicit purchases from distributors anymore;
instead, retailers’ information systems automatically generate and send purchases, based on the
defined minimum levels of products in their internal warehouses, and distributors automatically
initiate the transportation of ordered products to retailers, based on their available resources. This is
the essence of the proposed supply chain simulation model.
The underlying logic behind the proposed SD simulation model and its boundaries are concisely
described with the causal loop diagram, shown in Figure 2.
Causal loop diagrams are a technique to portray the information feedback at work in the observed
system. The word ‘causal’ refers to cause-and-effect relationships, whilst the word ‘loop’ refers to any
closed chain of cause and effect (Ford, 1999, pp. 69−87). Causal loop diagrams are an essential tool
used by the SD approach, allowing one to focus on the structure and the dynamic behavior of a given
system over time. It portrays the interrelations that exist among different input and output variables,
mutually connected by influence arcs that end with arrows (i.e. directed arcs), forming the causal
chains and loops. Each arc has two important features: a direction and a sign. The direction of arcs
actually shows the effect of a causal chain, whilst the sign denotes the nature of a change between two
variables: when the sign is positive (+), the variables on both sides of the influence arc change in the
same direction (e.g. an increase of the value of the variable from which the arc originates implies an
increase of the variable to which the arc sinks and vice-versa), otherwise (−) they behave in the
opposite manner.
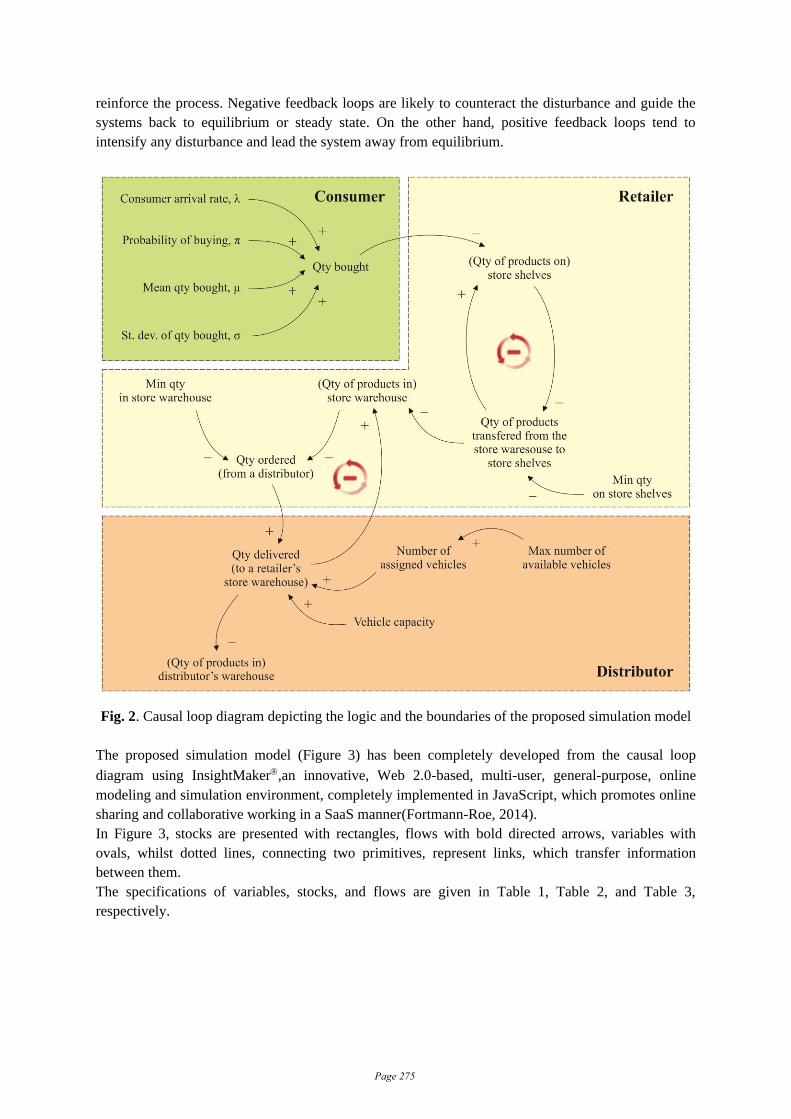
The causal loop diagram depicted in Figure 2 clearly points out the inclusion of three main actors in
the SD model, which are a constituent part of any supply chain: the consumers, a retailer, and one of
its distributors:
(a) Consumers: the consumer arrival rate (λ), the probability of buying a certain product (π),
the mean quantity bought (μ), and the standard deviation of the quantity bought (σ) have all
a positive impact on the total quantity bought in a particular retailer’s store;
(b) Retailer: the increased quantity bought leads to decreasing the quantity of a product on the
retailer’s store shelves. After reaching the defined minimum level on store shelves, an
internal transfer of a certain quantity of the same product is being initiated from the
retailer’s store warehouse to store shelves. Each internal transfer of products decreases the
number of products in the retailer’s store warehouse. After reaching the minimum level in
the store warehouse, a certain quantity of the product is being ordered automatically from
one of the retailer’s distributors;
(c) Distributor: based on the maximum number of available transportation vehicles, the
distributor assigns a certain number of these to transport (a part of) the ordered quantity of
the product, based on vehicles’ storage capacity. The more assigned vehicles and/or the
larger the vehicles’ storage capacity, the more the quantity delivered to a retailer’s store
warehouse. The increase of the quantity delivered to a retailer’s store warehouse imposes
an increase of the quantity in the retailer’s store warehouse while decreasing the quantity of
a product in a distributor’s warehouse.
Figure 2 indicates the existence of two balancing loops, which reflectcircular causality in the modeled
system: the first one encompasses the processes included in the internal transportation of a product
from retailer’s warehouse to retailer’s store shelves, whilst the second one refers to processes
encompassing the transportation of a product from distributor’s warehouse to retailer’s warehouse. In
general, a feedback loop exists when information, originating from some action, travels through a
system and eventually returns in some form to its point of origin. Feedback is said to be negative (i.e.
balancing) when the change fosters other components to respond by counteracting that modification.
Feedback is considered positive (i.e. reinforcing) when the original change leads to modifications that
Page 274
reinforce the process. Negative feedback loops are likely to counteract the disturbance and guide the
systems back to equilibrium or steady state. On the other hand, positive feedback loops tend to
intensify any disturbance and lead the system away from equilibrium.
Fig. 2. Causal loop diagram depicting the logic and the boundaries of the proposed simulation model
The proposed simulation model (Figure 3) has been completely developed from the causal loop
diagram using InsightMaker,an innovative, Web 2.0-based, multi-user, general-purpose, online
modeling and simulation environment, completely implemented in JavaScript, which promotes online
sharing and collaborative working in a SaaS manner(Fortmann-Roe, 2014).
In Figure 3, stocks are presented with rectangles, flows with bold directed arrows, variables with
ovals, whilst dotted lines, connecting two primitives, represent links, which transfer information
between them.
The specifications of variables, stocks, and flows are given in Table 1, Table 2, and Table 3,
respectively.
Page 275

Fig. 3. Stock-and-Flow simulation model of basic supply chain operations
Table 1. Specification of variables in the SD model
Object (variable) Unit Initial
value
Adjustabl
e?
Min
value
Max
value Step
Consumer arrival rate λ consumer
s per day 200 Yes 0 1,000 5
Probability of buying π /// 0.05 Yes 0.00 1.00 0.05
Mean qty bought μ pcs 1 Yes 0 50 1
StDev qty bought σ pcs 0.75 Yes 0.00 1.00 0.05
Store shelves qty pcs 50 Yes 0 100 5
Min qty on shelves pcs 5 Yes 0 25 5
Store warehouse qty pcs 5,000 Yes 0 10,000 100
Min qty in store
warehouse pcs 500 Yes 0 2,500 100
Order in progress /// Prog.
code No /// /// ///
Max number of vehicles
available pcs 5 Yes 1 10 1
Vehicle capacity pcs 25 Yes 10 100 5
Distributor warehouse
qty pcs 500,000 Yes 0
1,000,00
0 1,000
From Table 1, it is obvious that all variables in the SD model are adjustable, except the variable
[Order in progress], which is an internal control variable; it takes its value depending on the output of
the following programming code:
Page 276
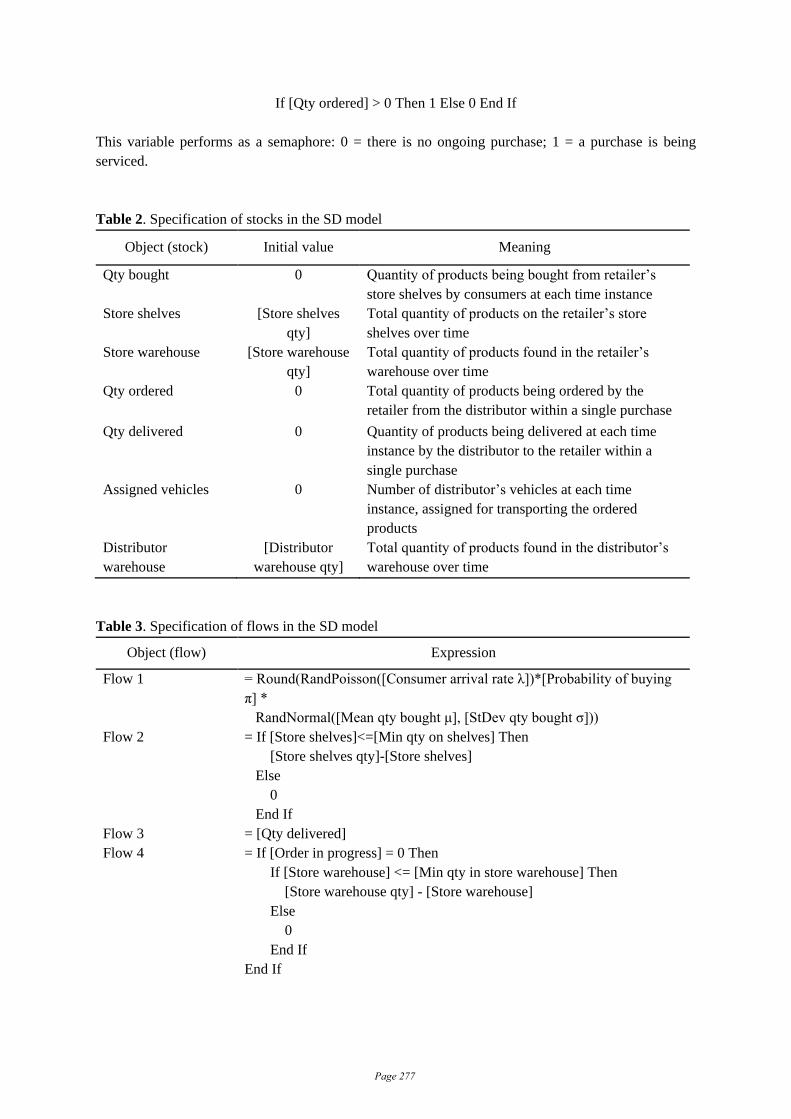
If [Qty ordered] > 0 Then 1 Else 0 End If
This variable performs as a semaphore: 0 = there is no ongoing purchase; 1 = a purchase is being
serviced.
Table 2. Specification of stocks in the SD model
Object (stock) Initial value Meaning
Qty bought 0 Quantity of products being bought from retailer’s
store shelves by consumers at each time instance
Store shelves [Store shelves
qty]
Total quantity of products on the retailer’s store
shelves over time
Store warehouse [Store warehouse
qty]
Total quantity of products found in the retailer’s
warehouse over time
Qty ordered 0 Total quantity of products being ordered by the
retailer from the distributor within a single purchase
Qty delivered 0 Quantity of products being delivered at each time
instance by the distributor to the retailer within a
single purchase
Assigned vehicles 0 Number of distributor’s vehicles at each time
instance, assigned for transporting the ordered
products
Distributor
warehouse
[Distributor
warehouse qty]
Total quantity of products found in the distributor’s
warehouse over time
Table 3. Specification of flows in the SD model
Object (flow) Expression
Flow 1 = Round(RandPoisson([Consumer arrival rate λ])*[Probability of buying
π] *
RandNormal([Mean qty bought μ], [StDev qty bought σ]))
Flow 2 = If [Store shelves]<=[Min qty on shelves] Then
[Store shelves qty]-[Store shelves]
Else
0
End If
Flow 3 = [Qty delivered]
Flow 4 = If [Order in progress] = 0 Then
If [Store warehouse] <= [Min qty in store warehouse] Then
[Store warehouse qty] - [Store warehouse]
Else
0
End If
End If
Page 277
Flow 5 = If [Qty ordered] - [Assigned vehicles] * [Vehicle capacity] > 0 Then
[Assigned vehicles]*[Vehicle capacity]
Else
If [Qty ordered] - [Assigned vehicles] * [Vehicle capacity] < 0 Then
[Qty ordered]
Else
0
End If
End If
Flow 6 = If [Order in progress] = 1 Then
Round(Rand(0, 1) * [Max number of vehicles available])
Else
0
End If
Flow 7 = [Assigned vehicles]
Flow 8 = [Qty delivered]
Simulation Results
Given that the time unit used in simulations is set to ‘day’, the maximum simulated time length was
set up to 1,500 [days].What follows is astep-by-step verification of the proposed SD model by
presenting a series of simulation outputs that portray the dynamics of certain parts of the supply chain
over time, thus proving that the modeled system complies with the general idea/specification.
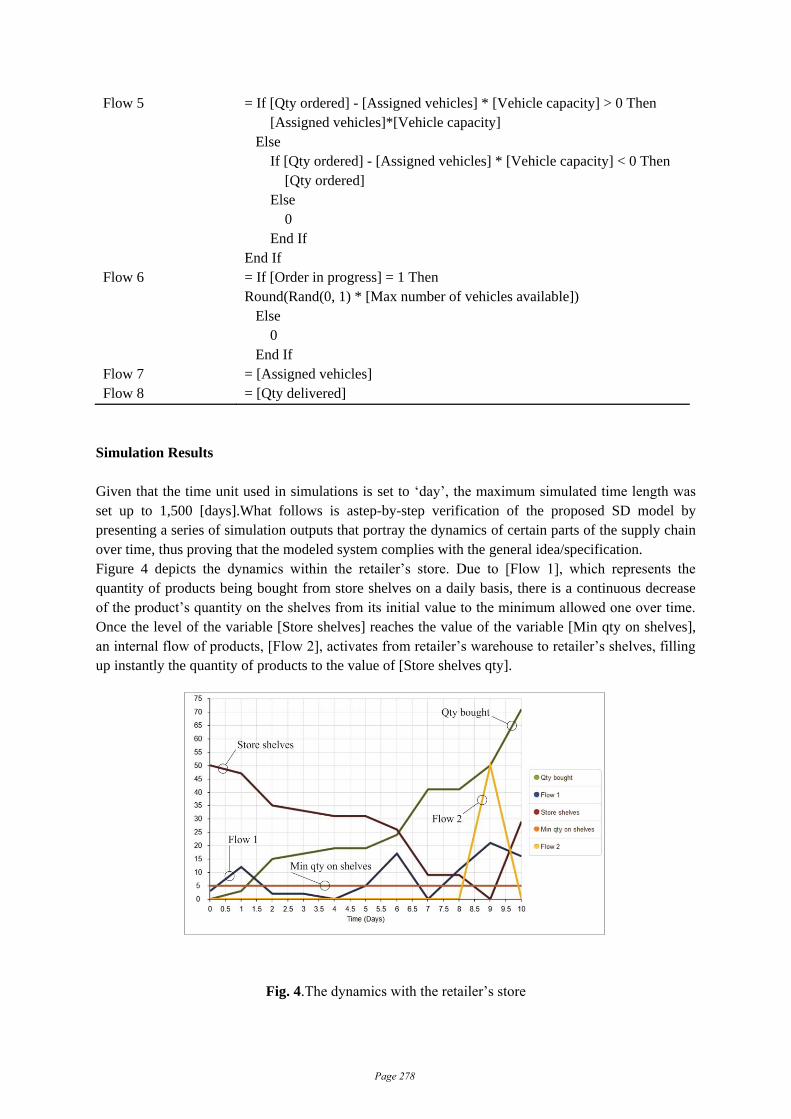
Figure 4 depicts the dynamics within the retailer’s store. Due to [Flow 1], which represents the
quantity of products being bought from store shelves on a daily basis, there is a continuous decrease
of the product’s quantity on the shelves from its initial value to the minimum allowed one over time.
Once the level of the variable [Store shelves] reaches the value of the variable [Min qty on shelves],
an internal flow of products, [Flow 2], activates from retailer’s warehouse to retailer’s shelves, filling
up instantly the quantity of products to the value of [Store shelves qty].
Fig. 4.The dynamics with the retailer’s store
Page 278
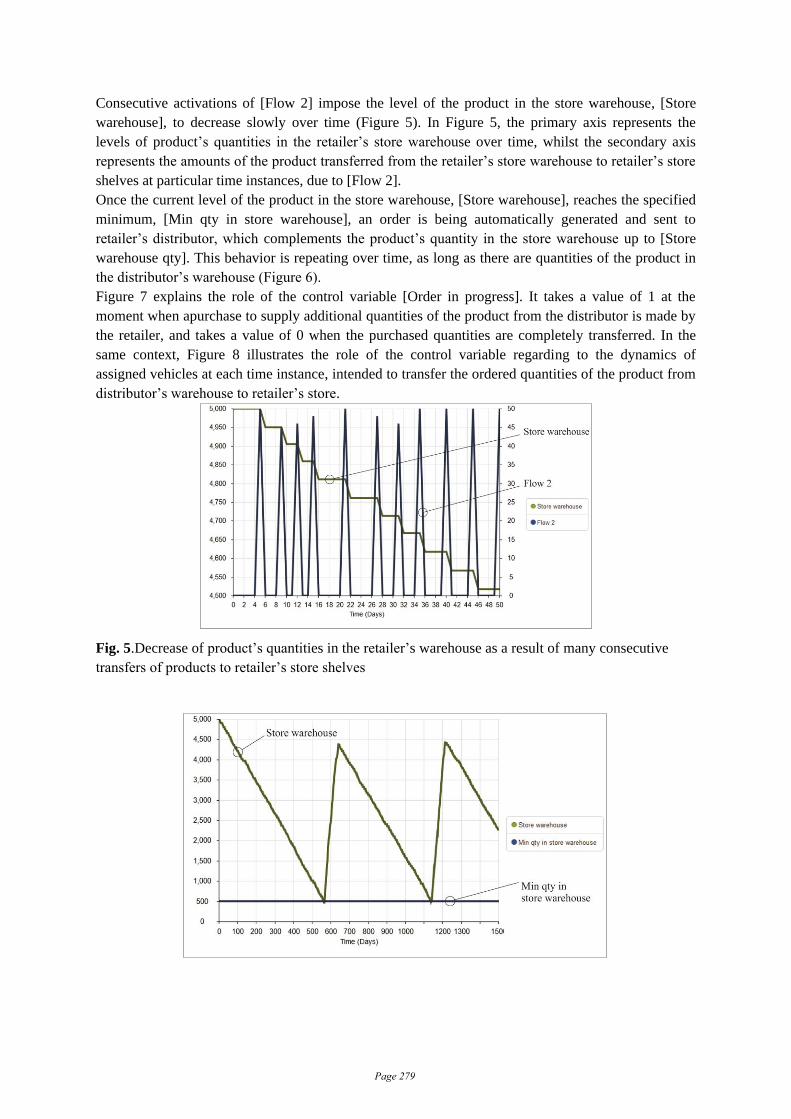
Consecutive activations of [Flow 2] impose the level of the product in the store warehouse, [Store
warehouse], to decrease slowly over time (Figure 5). In Figure 5, the primary axis represents the
levels of product’s quantities in the retailer’s store warehouse over time, whilst the secondary axis
represents the amounts of the product transferred from the retailer’s store warehouse to retailer’s store
shelves at particular time instances, due to [Flow 2].
Once the current level of the product in the store warehouse, [Store warehouse], reaches the specified
minimum, [Min qty in store warehouse], an order is being automatically generated and sent to
retailer’s distributor, which complements the product’s quantity in the store warehouse up to [Store
warehouse qty]. This behavior is repeating over time, as long as there are quantities of the product in
the distributor’s warehouse (Figure 6).
Figure 7 explains the role of the control variable [Order in progress]. It takes a value of 1 at the
moment when apurchase to supply additional quantities of the product from the distributor is made by
the retailer, and takes a value of 0 when the purchased quantities are completely transferred. In the
same context, Figure 8 illustrates the role of the control variable regarding to the dynamics of
assigned vehicles at each time instance, intended to transfer the ordered quantities of the product from
distributor’s warehouse to retailer’s store.
Fig. 5.Decrease of product’s quantities in the retailer’s warehouse as a result of many consecutive
transfers of products to retailer’s store shelves
Page 279

Fig. 6.Cycliccomplementing product’s quantities in the retailer’s store warehouse over time, as a
result of reaching the specified minimum
Fig. 7.Illustration of the variable [Order in progress] vis-à-vis the timing of placing and fulfilling
purchases.
Fig. 8. Illustration of the variable [Order in progress] vis-à-vis the number of assigned vehicles
Finally, Figure 9 shows the decrease of product quantities in the distributor’s warehouse over time
(primary axis), as a result of [Flow 8], representing the transfer of purchased quantities to retailer’s
store warehouse at particular time instances (secondary axis).
Page 280
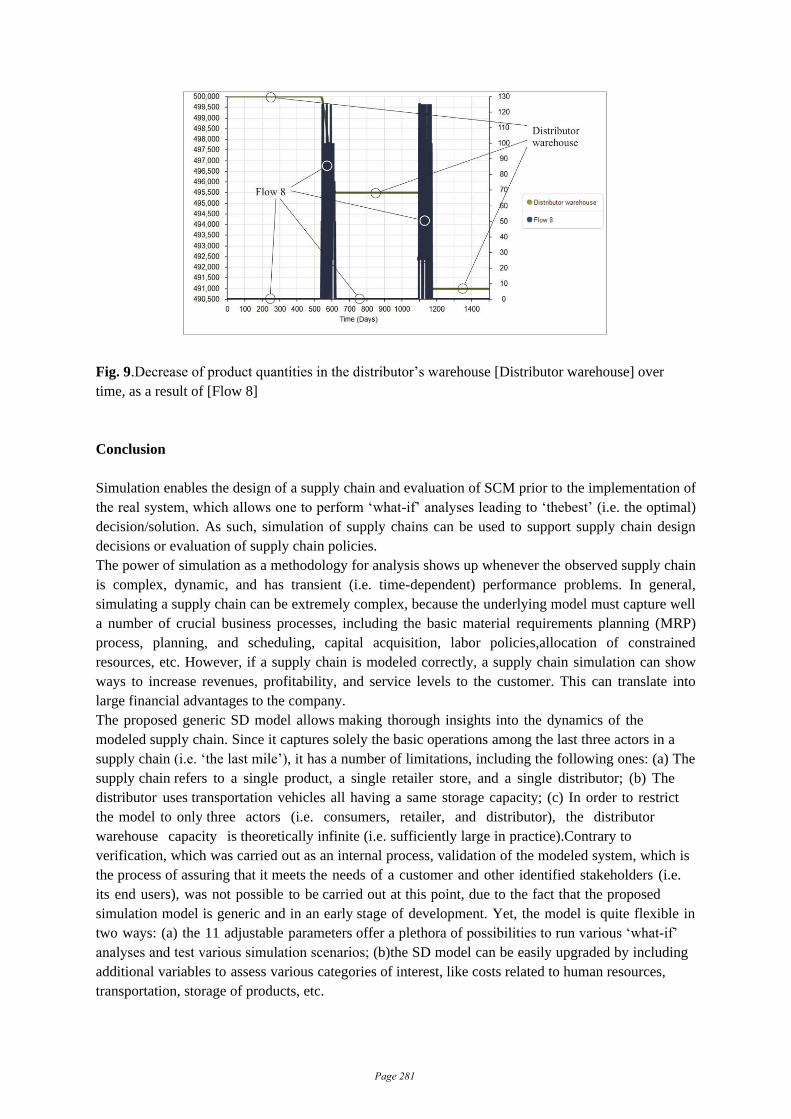
Fig. 9.Decrease of product quantities in the distributor’s warehouse [Distributor warehouse] over
time, as a result of [Flow 8]
Conclusion
Simulation enables the design of a supply chain and evaluation of SCM prior to the implementation of
the real system, which allows one to perform ‘what-if’ analyses leading to ‘thebest’ (i.e. the optimal)
decision/solution. As such, simulation of supply chains can be used to support supply chain design
decisions or evaluation of supply chain policies.
The power of simulation as a methodology for analysis shows up whenever the observed supply chain
is complex, dynamic, and has transient (i.e. time-dependent) performance problems. In general,
simulating a supply chain can be extremely complex, because the underlying model must capture well
a number of crucial business processes, including the basic material requirements planning (MRP)
process, planning, and scheduling, capital acquisition, labor policies,allocation of constrained
resources, etc. However, if a supply chain is modeled correctly, a supply chain simulation can show
ways to increase revenues, profitability, and service levels to the customer. This can translate into
large financial advantages to the company.
The proposed generic SD model allows making thorough insights into the dynamics of the
modeled supply chain. Since it captures solely the basic operations among the last three actors in a
supply chain (i.e. ‘the last mile’), it has a number of limitations, including the following ones: (a) The
supply chain refers to a single product, a single retailer store, and a single distributor; (b) The
distributor uses transportation vehicles all having a same storage capacity; (c) In order to restrict
the model to only three actors (i.e. consumers, retailer, and distributor), the distributor
warehouse capacity is theoretically infinite (i.e. sufficiently large in practice).Contrary to
verification, which was carried out as an internal process, validation of the modeled system, which is
the process of assuring that it meets the needs of a customer and other identified stakeholders (i.e.
its end users), was not possible to be carried out at this point, due to the fact that the proposed
simulation model is generic and in an early stage of development. Yet, the model is quite flexible in
two ways: (a) the 11 adjustable parameters offer a plethora of possibilities to run various ‘what-if’
analyses and test various simulation scenarios; (b)the SD model can be easily upgraded by including
additional variables to assess various categories of interest, like costs related to human resources,
transportation, storage of products, etc.
Page 281
REFERENCES
1. Abidi, M., Lattouf, A., Altarazi, S. (2018). A system dynamics simulation modeling for managing
the inventory in multi-echelon multi-product pharmaceutical supply chain.Proceedings of the Annual
Simulation Symposium (ANSS ’18), Baltimore, MD, USA.
2. Botha, A. (2017). A System Dynamics Simulation for Strategic Inventory Management in the South
African Automotive Industry.Ph. D. thesis, University of Pretoria, Pretoria, South
Africa.https://repository.up.ac.za/bitstream/handle/2263/66223/Botha_ System_2018.pdf (accessed
16.09.2019)
3. Chang, Y. & Makatsoris, H. (2001). Supply Chain Modeling Using Simulation. International
Journal of Simulation: Systems, Science and Technology, Vol. 2, No. 1, pp. 24−30.
4. Chopra, S. & Meindl, P. (2012). Supply Chain Management: Strategy, Planning, and Operation,
5th Edition. Upper Saddle River, NJ, US: Pearson/Prentice Hall
5. Duivesteijn, W. (2006). Continuous Simulation.Utrecht University, the
Netherlands.http://www.cs.uu.nl/docs/vakken/sim/continuous.pdf (accessed 06.09.2019)
6. Feng, Y. (2012). System Dynamics Modeling for Supply Chain Information Sharing.Physics
Procedia, Vol. 25 (2012), pp. 1463−1469.
7. Ford, A. (1999). Modeling the Environment:An Introduction to System Dynamics Modeling of
Environmental Systems. Washington, DC, US: Island Press.
8. Fortmann-Roe, S. (2014). Insight Maker: A General-Purpose Tool for Web-based Modeling &
Simulation. Simulation Modelling Practice and Theory, Vol. 47, pp. 28–45.
9. Ghadge, A., Karantoni, G., Chaudhuri, A., Srinivasan, A. (2018). Impact of Additive
Manufacturing on Aircraft Supply Chain Performance: A System Dynamics Approach. Journal of
Manufacturing Technology Management, Vol. 29, Issue 5, pp. 846−865.
10. Hoque, M. A. & Khan, Q. K. (2016). Supply Chain Performance and System Dynamics Modeling:
A Literature Review. British Journal of Business Design & Education, Vol. 9, No. 2.
11. Hossain, S. A. & Ouzrout, Y. (2012). Trust Model Simulation for Supply Chain Management.
Proceedings of the 15th International Conference on Computer and Information Technology (ICCIT
2012), Chittagong, Bangladesh, pp. 376−383.
12. Ingalls, R. G. (2014). Introduction to supply chain simulation. In: Tolk, A., Diallo, S. Y., Ryzhov,
I. O., Yilmaz, L., Buckley, S., and Miller, J. A. (Eds.), Proceedings of the 2014 Winter Simulation
Conference (WSC ’14), Savannah, GA, USA, pp. 36−50.
13. Li, C. (2016). Risk Modelling and Simulation of Chemical Supply Chains using a System
Dynamics Approach. Ph. D. thesis, John Moores University, Liverpool,
UK.http://researchonline.ljmu.ac.uk/id/eprint/4254/1/2016chaoyuliphd.pdf (accessed 16.09.2019)
14. Liu, Y., Zhao, R., Wu, K.-J., Huang, T., Chiu, A. S. F., Cai, C. (2018). A Hybrid of Multi-
Objective Optimization and System Dynamics Simulation for Straw-to-Electricity Supply Chain
Management under the Belt and Road Initiatives. Sustainability, Vol. 10, No. 3:868, pp. 1−17.
15. Mula, J., Campuzano-Bolarin, F., Díaz-Madroñero, M., Carpio, K. M. (2013). A System
Dynamics Model for the Supply Chain Procurement Transport Problem: Comparing Spreadsheets,
Fuzzy Programming and Simulation Approaches. International Journal of Production Research, Vol.
51, Issue 13, pp. 4087−4104.
16. NCSU (2017). What is Supply Chain Management (SCM)? North Carolina State University,
Raleigh, NC, USA.https://scm.ncsu.edu/scm-articles/article/what-is-supply-chain-management-scm
(accessed 17.09.2019)
Page 282

17. PMC (−). Supply Chain Simulation. Production Modeling Corporation (PMC), Dearborn, MI,
USA. https://www.pmcorp.com/Products/Simulation/ SupplyChainSimulation.aspx (accessed
06.09.2019)
18. Robinson, S. (2014). Simulation: The practice of model development and use. 2nd Edition.
London, UK: Red Globe Press
19. Sánchez-Ramírez, C., López, D. R. M., Hernández, G. A., Alcaraz, J. L. G., Mendoza, D. A. T.
(2016). Simulation Software as a Tool for Supply Chain Analysis and Improvement.Computer
Science and Information Systems, Vol. 13, No. 3, pp. 983–998.
20. Tang, V. & Vijay, S. (2001). System Dynamics: Origins, Development, and Future Prospects of a
Method. ESD.83, Research Seminar in Engineering Systems.Massachusetts Institute of Technology,
Cambridge, MA, US.http://web.mit.edu/esd.83/www/ notebook/System%20Dynamics%20final.doc
(accessed 24.09.2019)
21. Thierry, C., Thomas, A., Bel, G. (Eds.) (2008). Simulation for Supply Chain Management.1st
Edition. London, UK: Wiley-ISTE
22. Van der Vorst, J. (2004). Supply Chain Management: Theory and Practices. In: Camps, T.,
Diederen, P., Hofstede, G. J., Vos, B. (Eds.), The Emerging World of Chains & Networks: Bridging
Theory and Practice, Amsterdam, the Netherlands: Reed Business Information
23. Wai, C. K. &Chooi-Leng, A. (2011). Supply Chain Management: A System Dynamics Approach
to Improve Visibility and Performance. Journal of ICT, Vol. 10, pp. 117−135.
Page 283