CT2 : Assessing sources of uncertainty in ocean analysis and forecasts
1
Assessing the uncertainty in micro-simulation model outputs
S. Zhu1 and L. Ferreira2
1School of Civil Engineering, Faculty of Engineering, Architecture and Information Technology, The University of Queensland, Brisbane St Lucia, QLD 4072, Australia
2School of Civil Engineering, Faculty of Engineering, Architecture and Information Technology, The University of Queensland, Brisbane St Lucia, QLD 4072, Australia
Corresponding author E-mail: [email protected]
Corresponding author’s telephone number: +61 7 33469706
Abstract
Micro simulation traffic models continue to be widely used as tools to analyse current and future road system performance. Such models tend to operate by concentrating on the movement of individual vehicles in the traffic stream on a second by second basis. The likely errors associated the outputs of such models are usually thought to be significantly lower than the ‘coarser’ models with deal with the movement of groups of vehicles over an average time period. This paper puts forward a methodology to evaluate the uncertainty in the outputs of micro level models by comparing those outputs with field data obtained from loop detectors.
The paper concludes that model uncertainty shows very different characteristics for different traffic flow conditions. The Taguchi statistical method was applied to three traffic flow stages to establish the relationships between modelled vehicle speeds and measured speeds, on a minute-by-minute basis. The results show the close agreement between modelled and actual speeds under both congested and free flow conditions. In contrast, the transitional stage between free flow and queuing shows a higher level of discrepancy.
Keywords:
Micro simulation traffic; model uncertainty; Taguchi method.
1 Introduction
Micro simulation traffic models continue to be widely used as tools to analyse current and future road system performance. Such models tend to operate by concentrating on the movement of individual vehicles in the traffic stream on a second by second basis. The likely

2
errors associated the outputs of such models are usually thought to be significantly lower than the ‘coarser’ models with deal with the movement of groups of vehicles over an average time period. The predicted vehicle speeds and the traffic volumes are the most important traffic indicators, and primary inputs of other models such as emission estimation. This paper evaluates the uncertainty in the outputs of micro level models by comparing those outputs with field data obtained from loop detectors on disaggregated level.
2 Past work
Currently, limited research has been put forward on the validation of micro simulation outputs, in terms of the gap between prediction and measurement for vehicle speeds for each modelled time period. The performance of these types of models, with respect to their ability to predict average speeds and traffic volumes, is depended on several external and internal factors. This paper focuses on uncertainty induced by internal factors in the form of the driver behaviour model used. Theoretically, micro simulation has two core algorithms, namely: car-following and lane-changing, which are the main drivers of overall model accuracy. Panwai and Dia (2005) undertook a comparative evaluation of car-following behaviour in a number of traffic simulaton models to validate their reliability of the AIMSUN, PARAMICS, and VISSIM models). The results point to similar performance for the psychophysical spacing models used in VISSIM and PARAMICS with better performance reported for the Gipps-based models implemented. Hidas (2006) confirms the findings and points out that lane-changing behaviour is a challenge for prediction accuracy. In most models, lane-changing behaviour requires two stages, consideration of lane- changing and execution. The improvement of lane-changing may be facilitated in two major directions: an increase in the level of detail in the specification of models to better capture the complexity and sophistication of human decision-making processes; and an improvement in the quality of data used to calibrate such these models (Toledo, 2007).
3 Methodology
This paper evaluates the uncertainty in the outputs of micro simulation models by comparing predicted results with field average speed data obtained from motorway loop detectors at the 1-minute disaggregated level. Currently, the Queensland based traffic operations system records real time data by using 1-minute average speed measurements and other road section performance indicators, such as flow count and density (DTMR, 2010). For major facilities, such as the Pacific motorway, this data is collected from a network of loop detectors established by the Department of Transport and Main Roads (DTMR, 2011). A detailed Aimsun traffic micro-simulation model has recently been calibrated using data obtained from those loop detectors(Chung et al., 2011). Although loop detector data has its shortcomings, it is the only available extensive data set for model calibration purposes. This paper assumes that detector measurement error can be neglected, after the more obvious instances of missing or spurious data has been omitted. An initial primary visual check indicates that the uncertainty in the model outputs is likely to be associated with traffic flow conditions, such as the level of congestion. Particularly, the fundamental traffic theory is qualitatively different from empirical traffic flow analysis on over-saturated conditions (Chowdhury et al., 2000).
Hence, a new traffic flow theory has been proposed, in which flow is classified into three conditions, namely: free flow; ‘synchronised ’ flow and queuing (Kerner, 2004). Synchronized flow refers to non-interrupted traffic flow without a long period of queuing. There is a tendency to a synchronization of vehicle speeds across different lanes on a multi-lane road in this flow.

3
To evaluate the uncertainty on different traffic conditions, the Taguchi method, an offline quality control technique, is introduced in this paper (Logothetis and Haigh, 1988). This technique classifies the source of uncertainty into outer and inner noise. In this research, the former includes the external sources to micro simulation model outputs, such as in traffic conditions, driving behaviour variations and traffic management strategies. The current research has focussed on the inner noise induced by the simulation algorithm itself. The performance of system output is evaluated using equation (1).
NSR=
����
----------------- (1)
Where: �� : Speed output expectation �� : Absolute output error NSR: Noise-to-signal ratio, percentage of error to prediction. The model for the relationship between the output (��) and its error (��) is formulated as: NSR=∅(��)� -------------------- (2) Where: ��: Speed Output expectation NSR: Noise-to-signal ratio k and ∅: Coefficients Equation 2 may have a Box-Cox transformation to produce an improved fitting (Logothetis, 1988). log(NSR)=log(∅) + ����(��) -------------------- (3) The speed prediction uncertainty is defined here as the difference between loop detector measurement and simulation model output. To have a meaningful simulation speed prediction, it is necessary to undertaken a calibration of the model parameters to minimize the internal noise. In engineering practise, calibration uses simulated and actual measurements including traffic volumes, vehicle occupancies and speeds. The deviation between actual and measured values is minimised by adjusting the simulation parameters through trial-and-error. The simulation parameters are classified into two main categories, namely: global (those that affect the performance of the entire model) and local (those that affect only specific sections of the roadway). Hourdakis et al. (2003) suggest the global parameters are calibrated first followed by local parameter calibration. Examples of global parameters are the vehicle characteristics, such as desired speed, maximum acceleration/deceleration, simulation step; and driver reaction time). Link speed limits and capacities are local parameters. Toledo et al. (2003) point out the calibration process should begin with disaggregate data including information on detailed driver behaviour, such as vehicle trajectories of the subject and surrounding vehicles. Aggregate data (e.g. time headways, speeds, flows, etc.) are used to fine-tune parameters and estimate general parameters in the simulation. The application of the Aimsun model to a section of the Pacific Motorway studied here, follows established calibration methodology (Chung et al., 2011). To minimize the effects of external impacts on the uncertainty results, the measurement data was selected according to three main criteria, as shown below.
(1) Quality of instantaneous traffic flow simulated and measured outputs
The quality of simulated flow count was evaluated using equation (4):

4
� = �(�����)�
�� ----------------------- (4)
Where:
n : Number of observed values
o : Observed value
e : Simulated value
(2) Detector location
To avoid the merging and diverging effects on the mainstream motorway traffic flow, the selected detectors were around 460 metres away from on-ramp and off-ramp(TRB, 2010).
(3) Incidents affected data
Comparing with minute-by-minute traffic data on other days, the datasets with unusual and non-recurring traffic congested patterns were excluded to remove incident-induced results.
4 Dataset description
After detailed validation, three detector groups C/D/E satisfied all three criteria and were selected from a large set of potential locations. The location of all selected detectors are shown in Figure 1. The distance to the CBD of Brisbane is also shown in Figure 1. The selected datasets were used to investigate the relationship between the simulated speed output and its uncertainty as the flow moves from free flow to highly congested conditions. Detectors A and B were used to investigate free flow and queuing status. The analysis was undertaken for each minute of both actual measured outputs and simulation model results.
Figure 1: Pacific highway network map and selected detectors

5
5 Uncertainty analysis
Numerous datasets from different locations along the motorway indicate that the uncertainty in average speeds follows closely a normal distribution under off-peak time periods with free flow conditions, when tested using the Kolmogorov-Smirnov test. Using detector B as an example Figure 2(a) and 2(b) demonstrate the flow and speed results for both the measured values and simulation outputs during an off-peak period. As a result, the coefficient k is 0 in equation 2, showing non-correlation between speed prediction and uncertainty. The uncertainty expectation is a very low 1.9 km/h with a standard deviation of 4.7 km/h.
Figure 2(a) : Simulation and measurement speed during non-peak period
Detector B (2 km to CBD) Detector A (1.4 km to CBD)
Detector C (6 km to CBD)
Detector E (20.3 km to CBD) Detector D (20 km to CBD)
Inbound

6
Figure 2(b) : Simulation and measurement flow count during non-peak period
The vehicle speed related results obtained when measured data for one peak period is compared with simulation outputs are shown in Figure 3(a) and (b). In the latter, they present and sort the datasets in the descending order of vehicle speed. In the transitional stage between free flow and highly congested conditions at detector C, the relationship between uncertainty and average speed can be fitted using equation 3. In this case the following results were obtained:
k= -4.29 and log(∅) =7.15
-20
0
20
40
60
80
100
12
:00
:00
12
:11
:00
12
:22
:00
12
:33
:00
12
:44
:00
12
:55
:00
13
:06
:00
13
:17
:00
13
:28
:00
13
:39
:00
13
:50
:00
14
:01
:00
14
:12
:00
14
:23
:00
14
:34
:00
14
:45
:00
14
:56
:00
15
:07
:00
15
:18
:00
15
:29
:00
15
:40
:00
15
:51
:00
Sp
ee
d (
km
/h)
Time
Simulation
Measurment
Error
0
5
10
15
20
25
30
12
:10
:00
12
:21
:00
12
:32
:00
12
:43
:00
12
:54
:00
13
:05
:00
13
:16
:00
13
:27
:00
13
:38
:00
13
:49
:00
14
:00
:00
14
:11
:00
14
:22
:00
14
:33
:00
14
:44
:00
14
:55
:00
15
:06
:00
15
:17
:00
15
:28
:00
15
:39
:00
15
:50
:00
Ve
hic
le c
ou
nt/
min
Time
Measurment
Simulation

7
Due to traffic speed fluctuations, linear regression analysis shows R2 (Coefficient of determination) reaches 0.65, and the simulated speed, �� is statistical significant with NSR. Hence, minus exponential relationship between simulation speed and its NSR is established. Similarly, the negative correlations during the transitional stage have been replicated at other locations. Figure 3(b) demonstrates another example from detector E data.
Figure 3(a) : Simulation and measurement speed during transitional stage (detector C)
Figure 3(b) : Simulation and measurement speed during transitional stage (detector E)
When traffic flow reaches capacity, unstable conditions prevail and simulation results appear to be much less reliable. For over-saturated conditions, both queuing and ‘synchronized’ flow conditions were found at different locations during periods. Figure 4 shows the speed measurements at detector C during the peak-hour. The results from the three inbound lanes at this detector show highly synchronized speeds across all lanes.
0
10
20
30
40
50
60
70
80
90
5:4
0:0
0
5:4
6:0
0
5:3
7:0
0
6:0
4:0
0
6:0
3:0
0
5:5
6:0
0
5:4
9:0
0
6:1
8:0
0
5:5
2:0
0
5:5
3:0
0
5:5
5:0
0
6:0
6:0
0
6:0
7:0
0
6:1
4:0
0
6:0
9:0
0
6:1
0:0
0
6:2
2:0
0
6:2
3:0
0
Sp
ee
d (
Km
/h)
Time
Simulation
Error
-10
0
10
20
30
40
50
60
70
80
90
5:3
8:0
0
5:3
6:0
0
5:2
9:0
0
5:3
5:0
0
5:3
4:0
0
5:5
7:0
0
5:3
9:0
0
6:1
2:0
0
9:5
7:0
0
5:4
6:0
0
5:5
4:0
0
5:5
8:0
0
6:0
1:0
0
6:1
1:0
0
6:0
4:0
0
5:5
6:0
0
9:5
3:0
0
6:0
3:0
0
5:5
5:0
0
6:0
7:0
0
5:5
9:0
0
8:4
8:0
0
8:3
7:0
0
Sp
ee
d (
Km
/h)
Time
Simulation
Error

8
Figure 4 : Detector C measured speeds in the morning peak hour
Figures 5(a) and 5(b) demonstrate modelled and measured vehicle speeds and volumes, respectively. The results related to detector C and a 3-hour morning peak period. The modelled traffic volume results show good agreement with measured values. The modelled vehicle speeds, when compared with measured values, follow a normal distribution. The uncertainty expectation is estimated at 23.2 km/h with a standard deviation is 10.4 km/h.
Figure 5(a) : Simulated and measured average speeds: morning peak period (detector C)
0
10
20
30
40
50
60
70
806
:30
:00
6:3
7:0
0
6:4
4:0
0
6:5
1:0
0
6:5
8:0
0
7:0
5:0
0
7:1
2:0
0
7:1
9:0
0
7:2
6:0
0
7:3
3:0
0
7:4
0:0
0
7:4
7:0
0
7:5
4:0
0
8:0
1:0
0
8:0
8:0
0
8:1
5:0
0
8:2
2:0
0
8:2
9:0
0
8:3
6:0
0
8:4
3:0
0
8:5
0:0
0
8:5
7:0
0
Sp
ee
d (
km
/h)
Time
Detector C Lane 1
Detector C Lane 2
Detector C Lane 3
-40
-20
0
20
40
60
80
100
120
5:0
1:0
0
5:1
5:0
0
5:2
9:0
0
5:4
3:0
0
5:5
7:0
0
6:1
1:0
0
6:2
5:0
0
6:3
9:0
0
6:5
3:0
0
7:0
7:0
0
7:2
1:0
0
7:3
5:0
0
7:4
9:0
0
8:0
3:0
0
8:1
7:0
0
8:3
1:0
0
8:4
5:0
0
8:5
9:0
0
9:1
3:0
0
9:2
7:0
0
9:4
1:0
0
9:5
5:0
0
Sp
ee
d (
km
/h)
Time
Simulation
Measurement
Error

9
Figure 5(b) : Simulated and measured traffic flow: morning peak period (detector C)
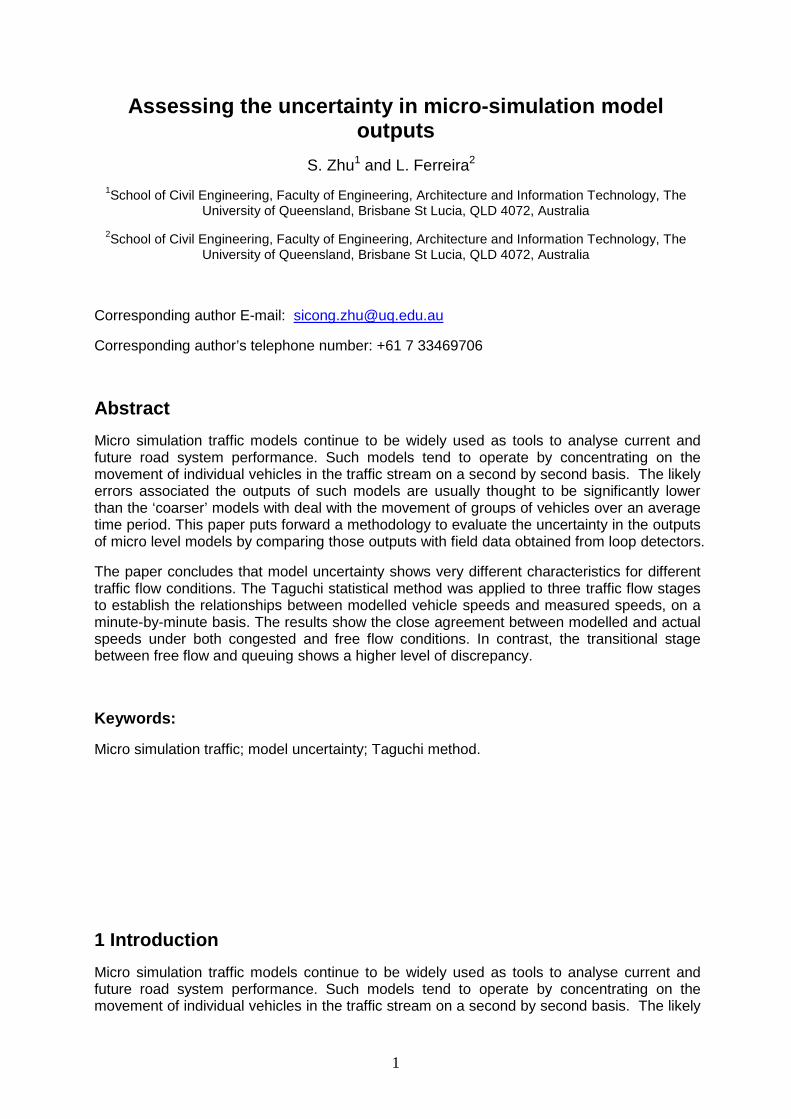
Similarly, Figures 6(a) and 6(b) demonstrate minute-by-minute traffic volumes and average speeds respectively. The data was collected at detector A in the morning peak direction. Traffic moves into queuing conditions for long periods, speed prediction uncertainty follows a normal distribution. The error expectation is 7.2 km/h with a standard deviation of 5.3 km/h, indicating the significant difference between queuing and ‘synchronized’ flow, as defined earlier.
Figure 6(a) : Simulated and measured average speed during peak hours (detector A)
0
5
10
15
20
25
30
35
40
45
5:0
1:0
0
5:1
3:0
0
5:2
5:0
0
5:3
7:0
0
5:4
9:0
0
6:0
1:0
0
6:1
3:0
0
6:2
5:0
0
6:3
7:0
0
6:4
9:0
0
7:0
1:0
0
7:1
3:0
0
7:2
5:0
0
7:3
7:0
0
7:4
9:0
0
8:0
1:0
0
8:1
3:0
0
8:2
5:0
0
8:3
7:0
0
8:4
9:0
0
9:0
1:0
0
9:1
3:0
0
9:2
5:0
0
9:3
7:0
0
9:4
9:0
0
Co
un
t V
eh
/min
Time
Simulation
Measurement
-10
0
10
20
30
40
50
60
7:2
0:0
0
7:2
5:0
0
7:3
0:0
0
7:3
5:0
0
7:4
0:0
0
7:4
5:0
0
7:5
0:0
0
7:5
5:0
0
8:0
0:0
0
8:0
5:0
0
8:1
0:0
0
8:1
5:0
0
8:2
0:0
0
8:2
5:0
0
8:3
0:0
0
8:3
5:0
0
8:4
0:0
0
8:4
5:0
0
8:5
0:0
0
8:5
5:0
0
9:0
0:0
0
Sp
ee
d (
km
/h)
Time
Simulation
Measurment
Error
10
Figure 6(b) : Simulated and measured flow count during peak hours (detector A)
6 Conclusions
Micro simulation traffic models tend to operate by concentrating on the movement of individual vehicles in the traffic stream on a second by second basis. The likely errors associated the outputs of such models are usually thought to be significantly lower than the ‘coarser’ models with deal with the movement of groups of vehicles over an average time period.
Model output uncertainty shows very different characteristics for different traffic flow conditions. The Taguchi statistical method was applied to three traffic flow stages to establish the relationships between modelled vehicle speeds and measured speeds, on a minute-by-minute basis. The results show the close agreement between modelled and actual speeds under free flow conditions, the speed prediction uncertainties can be considered to follow zero-mean normal distribution (white noise).
In contrast, the transitional stage between free flow and queuing shows a higher level of discrepancy. As traffic volumes increase, the quality of model outputs shows statistically significant negative correlation with average speeds and a negative exponential equation has been fitted. When volumes reach saturation levels, the flow break-down phenomenon leads to large model errors.
For over-saturation traffic flow, the simulation algorithm follows the fundamental theory, therefore neglects the existence ‘synchronised’ flow condition. The simulation has an acceptable solution on queue condition prediction. Figure 7 gives a big picture for the relationship between uncertainty and simulated speed prediction.
0
5
10
15
20
25
30
35
7:2
0:0
0
7:2
5:0
0
7:3
0:0
0
7:3
5:0
0
7:4
0:0
0
7:4
5:0
0
7:5
0:0
0
7:5
5:0
0
8:0
0:0
0
8:0
5:0
0
8:1
0:0
0
8:1
5:0
0
8:2
0:0
0
8:2
5:0
0
8:3
0:0
0
8:3
5:0
0
8:4
0:0
0
8:4
5:0
0
8:5
0:0
0
8:5
5:0
0
9:0
0:0
0
Flo
w c
ou
nt
(Ve
hic
le/m
in)
Time
Simulation
Measurment

11
Figure 7 : Relationship between speed prediction and uncertainty
Saturation
Free flow
Speed
Synchronized flow
Queuing
Uncertainty (absolute error term)
0

12
References
Chowdhury, D., Santen, L. & Schadschneider, A. (2000) Statistical physics of vehicular traffic and some related systems. Physics Report, 329, 199-329.
Chung, E., Rahman, M., Bevrani, K. & Jiang, R. (2011) Evaluation of Queensland Department of Transport and Main Roads Managed Motorways. Smart Transport Research Centre, Faculty of Built Environment & Engineering, Queensland University of Technology.
DTMR (2010) Guidelines for the configuration and placement of vehicle detection sensors, Traffic and Road Use Management Manual, Department of Transport and Main Roads, Queensland Government.
DTMR (2011) Pacific Motorway M1 Project location map [Online]. DTMR. Available: http://www.tmr.qld.gov.au/Projects/Name/P/Pacific-Motorway-M1.aspx [Accessed].
Hidas, P. (2006). Evaluation and further development of car following models in microscopic traffic simulation. Urban Transport XII: Urban Transport and the Environment in the 21st Century, 2006. 287-296.
Hourdakis, J., Michalopoulos, P. G. & Kottommannil, J. 2003. Practical Procedure for Calibrating Microscopic Traffic Simulation Models.
Kerner, B. S. (2004) Three-phase traffic theory and highway capacity. Physica A: Statistical Mechanics and its Applications, 333, 379-440.
Logothetis, N. (1988) Role of data transformation in taguchi analysis. Quality and Reliability Engineering International, 4, 49-61.
Logothetis, N. & HAIGH, A. (1988) Characterizing and optimizing multi-response processes by the taguchi method. Quality and Reliability Engineering International, 4, 159-169.
Panwai, S. & Dia, H. (2005) Comparative evaluation of microscopic car-following behavior. IEEE Transactions on Intelligent Transportation Systems, 6, 314-325.
Toledo, T. (2007) Driving behaviour: Models and challenges. Transport Reviews, 27, 65-84.
Toledo, T., Koutsopoulos, H. N., Davol, A., Ben-Akiva, M. E., Burghout, W., Andréasson, I., Johansson, T. & Lundin, C. (2003) Calibration and Validation of Microscopic Traffic Simulation Tools: Stockholm Case Study. 81st Transportation Research Board Meeting.
TRB. (2010) Highway Capacity Manual 2010, Transportation Research Board,Washington, D.C. 2000