Stable-isotope time series and precipitation origin from firn-core and
18
Stable-isotope time series and precipitation origin from firn-core and snow samples, Altai glaciers, Siberia Vladimir B. AIZEN, 1 Elena AIZEN, 1 Koji FUJITA, 2 Stanislav A. NIKITIN, 3 Karl J. KREUTZ, 4 L. Nozomu TAKEUCHI 5 1 College of Science, University of Idaho, PO Box 443025, Moscow, Idaho 83844, USA E-mail: [email protected] 2 Hydrospheric Atmospheric Research Center, Nagoya University, Nagoya 464-8601, Japan 3 Department of Glacio-Climatology, Tomsk State University, 634050 Tomsk, Russia 4 Stable Isotope Laboratory, University of Maine, 236 Sawyer ERC, Orono, Maine 04469, USA 5 Research Institute for Humanity and Nature, Takashima-cho 335, Kyoto 602-0878, Japan ABSTRACT. In the summers of 2001 and 2002, glacio-climatological research was performed at 4110– 4120 m a.s.l. on the Belukha snow/firn plateau, Siberian Altai. Hundreds of samples from snow pits and a 21 m snow/firn core were collected to establish the annual/seasonal/monthly depth–accumulation scale, based on stable-isotope records, stratigraphic analyses and meteorological and synoptic data. The fluctuations of water stable-isotope records show well-preserved seasonal variations. The d 18 O and dD relationships in precipitation, snow pits and the snow/firn core have the same slope to the covariance as that of the global meteoric water line. The origins of precipitation nourishing the Belukha plateau were determined based on clustering analysis of d 18 O and d-excess records and examination of synoptic atmospheric patterns. Calibration and validation of the developed clusters occurred at event and monthly timescales with about 15% uncertainty. Two distinct moisture sources were shown: oceanic sources with d-excess <12%, and the Aral–Caspian closed drainage basin sources with d-excess >12%. Two-thirds of the annual accumulation was from oceanic precipitation, of which more than half had isotopic ratios corresponding to moisture evaporated over the Atlantic Ocean. Precipitation from the Arctic/Pacific Ocean had the lowest deuterium excess, contributing one-tenth to annual accumulation. 1. INTRODUCTION The available spatial coverage of snow, firn and ice records is inadequate to document climatic and environmental change over the vast Asian continent. However, environ- mental records from the northwestern periphery of the central Asian mountain system (CAMS), obtained from Tien Shan firn/ice cores (Kreutz and others, 2001, 2003; Aizen and others, 2004) and snow/firn-core records from alpine areas in Siberia (Olivier and others, 2003; Aizen and others, in press), are extending the area of climatic and environ- mental analyses in Asia. The research reported here focuses on the Siberian Altai, the most continental northern periphery of the CAMS and the southern periphery of the Asian Arctic basin (Fig. 1). It is an ideal area for the analysis of climatic records relating to the major northern Eurasian circulation systems, i.e. the westerly jet stream and the Siberian high. Altai glaciers, located at the center of the Eurasian continent, provide records on the advection of fresh water transported from the Atlantic and Pacific Oceans to the Arctic Ocean (Fig. 1). Firn records from the Altai glaciers can also be associated directly with the large Aral–Caspian internal water system, with moisture transferred from this closed Asian drainage basin to the great Siberian river basins. The Atlantic, Arctic and Pacific Oceans are considered external moisture sources for the Siberian Altai. Internal moisture sources refer to evaporation from continental sources, such as the closed Aral and Caspian drainage basins, or convection from local basins, subjected to stronger kinetic effects and greater continental recycling. In the analyses, moisture transferred from the eastern Black Sea to the Altai mountains is also considered as evaporated from an internal moisture source. Thus, Altai glaciers store unique information on climate dynamics and on the internal and external hydrological cycles of northern Eurasia. Data on the stable-isotope content in precipitation and firn core have contributed to our understanding of environ- mental signals from different regions of the globe (Friedman and others, 1964; Johnsen, 1977; Yao and Thompson, 1992; Dansgaard and others, 1993; Thompson and others, 1995; Aizen and others, 1996, 2004; Jouzel and others, 1997; Yao and others, 1999; Welker, 2000; Froehlich and others, 2002; Naftz and others, 2002). In general, the main controls affecting the stable-isotope content in snow, firn and ice are the atmospheric deposition conditions, especially tempera- ture, and the associated air-mass trajectories and source regions. The overall levels and seasonal fluctuations of the d 18 O and dD relationship provide insight into changes in the hydrologic cycle and have been used as a climatic indicator in ice-core records (Hammer and others, 1978; Jouzel and others, 1994; Petit and others, 1999; Vimeux and others, 1999) and in isotopic modeling of atmospheric processes (Ciais and Jouzel, 1994; Hoffmann and others, 2000; Tian and others, 2001). The main objective of this research is to determine the physical processes controlling the d 18 O and dD stable- isotope content recorded in the Altai glaciers and to couple these records with the precipitation-origin time series through analysis of synoptic-scale atmospheric dynamics. Journal of Glaciology, Vol. 51, No. 175, 2005 637
Transcript of Stable-isotope time series and precipitation origin from firn-core and

Stable-isotope time series and precipitation origin from firn-coreand snow samples Altai glaciers Siberia
Vladimir B AIZEN1 Elena AIZEN1 Koji FUJITA2 Stanislav A NIKITIN3
Karl J KREUTZ4 L Nozomu TAKEUCHI5
1College of Science University of Idaho PO Box 443025 Moscow Idaho 83844 USAE-mail aizenuidahoedu
2Hydrospheric Atmospheric Research Center Nagoya University Nagoya 464-8601 Japan3Department of Glacio-Climatology Tomsk State University 634050 Tomsk Russia
4Stable Isotope Laboratory University of Maine 236 Sawyer ERC Orono Maine 04469 USA5Research Institute for Humanity and Nature Takashima-cho 335 Kyoto 602-0878 Japan
ABSTRACT In the summers of 2001 and 2002 glacio-climatological research was performed at 4110ndash4120masl on the Belukha snowfirn plateau Siberian Altai Hundreds of samples from snow pits anda 21m snowfirn core were collected to establish the annualseasonalmonthly depthndashaccumulationscale based on stable-isotope records stratigraphic analyses and meteorological and synoptic dataThe fluctuations of water stable-isotope records show well-preserved seasonal variations The d18O anddD relationships in precipitation snow pits and the snowfirn core have the same slope to thecovariance as that of the global meteoric water line The origins of precipitation nourishing theBelukha plateau were determined based on clustering analysis of d18O and d-excess records andexamination of synoptic atmospheric patterns Calibration and validation of the developed clustersoccurred at event and monthly timescales with about 15 uncertainty Two distinct moisture sourceswere shown oceanic sources with d-excess lt12 and the AralndashCaspian closed drainage basin sourceswith d-excess gt12 Two-thirds of the annual accumulation was from oceanic precipitation of whichmore than half had isotopic ratios corresponding to moisture evaporated over the Atlantic OceanPrecipitation from the ArcticPacific Ocean had the lowest deuterium excess contributing one-tenth toannual accumulation
1 INTRODUCTION
The available spatial coverage of snow firn and ice recordsis inadequate to document climatic and environmentalchange over the vast Asian continent However environ-mental records from the northwestern periphery of thecentral Asian mountain system (CAMS) obtained from TienShan firnice cores (Kreutz and others 2001 2003 Aizenand others 2004) and snowfirn-core records from alpineareas in Siberia (Olivier and others 2003 Aizen and othersin press) are extending the area of climatic and environ-mental analyses in Asia
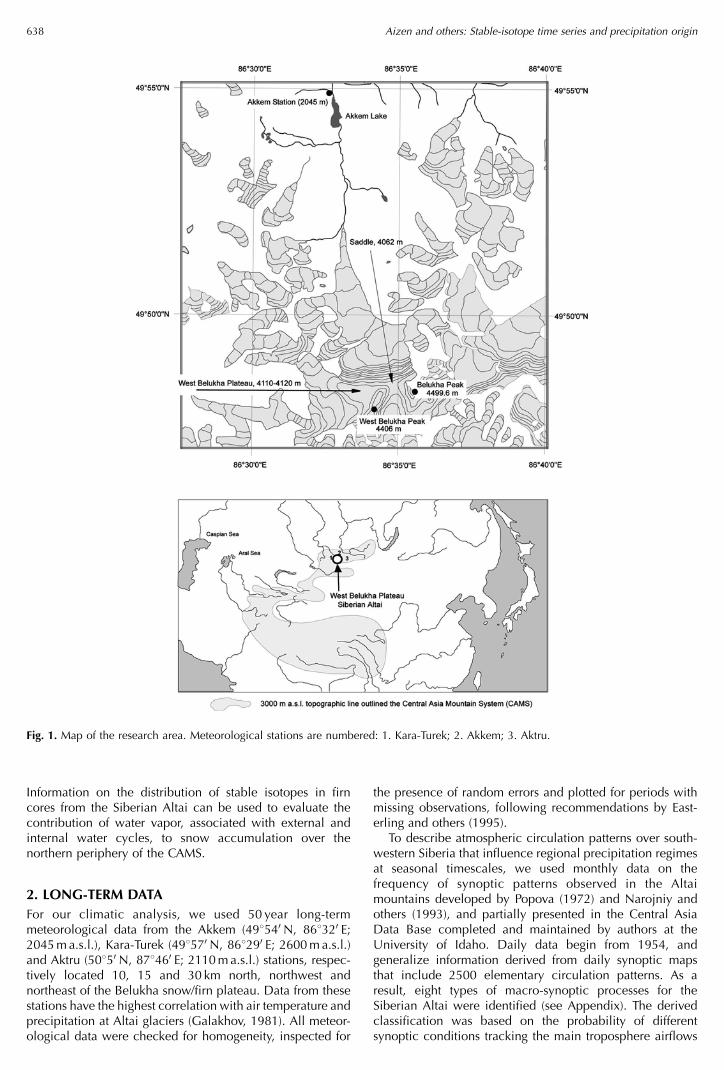
The research reported here focuses on the Siberian Altaithe most continental northern periphery of the CAMS andthe southern periphery of the Asian Arctic basin (Fig 1) It isan ideal area for the analysis of climatic records relating tothe major northern Eurasian circulation systems ie thewesterly jet stream and the Siberian high Altai glacierslocated at the center of the Eurasian continent providerecords on the advection of fresh water transported from theAtlantic and Pacific Oceans to the Arctic Ocean (Fig 1) Firnrecords from the Altai glaciers can also be associateddirectly with the large AralndashCaspian internal water systemwith moisture transferred from this closed Asian drainagebasin to the great Siberian river basins The Atlantic Arcticand Pacific Oceans are considered external moisture sourcesfor the Siberian Altai Internal moisture sources refer toevaporation from continental sources such as the closedAral and Caspian drainage basins or convection from localbasins subjected to stronger kinetic effects and greater
continental recycling In the analyses moisture transferredfrom the eastern Black Sea to the Altai mountains is alsoconsidered as evaporated from an internal moisture sourceThus Altai glaciers store unique information on climatedynamics and on the internal and external hydrologicalcycles of northern Eurasia
Data on the stable-isotope content in precipitation andfirn core have contributed to our understanding of environ-mental signals from different regions of the globe (Friedmanand others 1964 Johnsen 1977 Yao and Thompson 1992Dansgaard and others 1993 Thompson and others 1995Aizen and others 1996 2004 Jouzel and others 1997 Yaoand others 1999 Welker 2000 Froehlich and others 2002Naftz and others 2002) In general the main controlsaffecting the stable-isotope content in snow firn and ice arethe atmospheric deposition conditions especially tempera-ture and the associated air-mass trajectories and sourceregions The overall levels and seasonal fluctuations of thed18O and dD relationship provide insight into changes in thehydrologic cycle and have been used as a climatic indicatorin ice-core records (Hammer and others 1978 Jouzel andothers 1994 Petit and others 1999 Vimeux and others1999) and in isotopic modeling of atmospheric processes(Ciais and Jouzel 1994 Hoffmann and others 2000 Tianand others 2001)
The main objective of this research is to determine thephysical processes controlling the d18O and dD stable-isotope content recorded in the Altai glaciers and to couplethese records with the precipitation-origin time seriesthrough analysis of synoptic-scale atmospheric dynamics
Journal of Glaciology Vol 51 No 175 2005 637
Information on the distribution of stable isotopes in firncores from the Siberian Altai can be used to evaluate thecontribution of water vapor associated with external andinternal water cycles to snow accumulation over thenorthern periphery of the CAMS
2 LONG-TERM DATAFor our climatic analysis we used 50 year long-termmeteorological data from the Akkem (498540 N 868320 E2045masl) Kara-Turek (498570 N 868290 E 2600masl)and Aktru (50850 N 878460 E 2110masl) stations respec-tively located 10 15 and 30 km north northwest andnortheast of the Belukha snowfirn plateau Data from thesestations have the highest correlation with air temperature andprecipitation at Altai glaciers (Galakhov 1981) All meteor-ological data were checked for homogeneity inspected for
the presence of random errors and plotted for periods withmissing observations following recommendations by East-erling and others (1995)
To describe atmospheric circulation patterns over south-western Siberia that influence regional precipitation regimesat seasonal timescales we used monthly data on thefrequency of synoptic patterns observed in the Altaimountains developed by Popova (1972) and Narojniy andothers (1993) and partially presented in the Central AsiaData Base completed and maintained by authors at theUniversity of Idaho Daily data begin from 1954 andgeneralize information derived from daily synoptic mapsthat include 2500 elementary circulation patterns As aresult eight types of macro-synoptic processes for theSiberian Altai were identified (see Appendix) The derivedclassification was based on the probability of differentsynoptic conditions tracking the main troposphere airflows
Fig 1 Map of the research area Meteorological stations are numbered 1 Kara-Turek 2 Akkem 3 Aktru
Aizen and others Stable-isotope time series and precipitation origin638
(eg cyclonic and anticyclonic currents over the surface andat the 500mbar level) A similar classification developed forcentral Asia is presented in Aizen and others (2004)
3 FIELD MEASUREMENTSThe west Belukha plateau (Figs 1 and 2) is the only Siberianlocation where the Altai glaciers have sufficiently coldtemperatures and enough snow accumulation to preserveclimatic and environmental records that are unaffected bymeltwater percolation The west Belukha snowfirn plateauis in the cold recrystallization zone where positive tempera-tures were never observed at the drill site (4100masl)There is no record of positive air temperatures near the drillsite during 200001 as measured every 3 hours using a GrantInstruments automatic weather station (Fig 3)
The long-term average monthly air temperature at thedrill-site altitude was calculated from linear extrapolation ofAkkem station air temperatures with mean altitudinal gradi-ents and demonstrates the regime of negative air tempera-tures (Fig 4a) The spring summer autumn and winter mean
altitudinal gradients of air temperatures (68 72 39 and218C10ndash3mndash1) were calculated using long-term data fromAkkem Kara-Turek and Aktru stations
Snowfirnice temperatures were measured every 10m inthe 170m borehole at 4115masl (Fig 3c) and every 3 cmin the snow pit (Fig 3d) using electric sensors The lowertemperatures in ice than in air indicated the non-existence ofmelt From 08C at the snow surface temperature dropped tondash108C at 2m depth (Fig 3d) to ndash1588C at 50ndash70m depthand to ndash1428C at the bottom (Fig 3c) lower than the annualmean air temperature at this elevation (Taireth19842000THORN frac14ndash1028C see Table 1)
The melt index (Koerner and Fisher 1990) compiledfrom the measured 5 cm density data (Fig 5d) and theanalyzed stratigraphy (Fig 6) showed lt5 of melt causedby solar radiation at air temperatures close to zero (Fig 3)This minimal melt may form thin ice crusts and ice lenseson the snow surface but is insufficient to penetratedownward (Fig 6)
The drill site selected by a Swiss team (Olivier andothers 2003) on the saddle (4062masl) of a narrow field
Fig 2 (a) View from Akkem lake and meteorological station to theBelukha massif (b) The drill site west Belukha plateau (4115m)Siberian Altai Photo by V Aizen August 2003
Fig 3 (a b) Diurnal (a) and monthly (b) mean air temperatures onthe west Belukha snowfirn plateau measured by automatic weatherstation July 2002ndashApril 2003 (c) Borehole temperature profileAugust 2003 (d) Snow-pit temperatures
Aizen and others Stable-isotope time series and precipitation origin 639
between the Belukha (4499masl) and west Belukha(4406masl) peaks (Figs 1 and 2) is lower and warmerFurthermore because of very strong snow and windredistribution particularly in the winter between the twopeaks the saddle is not as suitable for snowfirn-core recordsas the west Belukha plateau where seasonal d18O and dDsignals (Fig 5a and b) are better preserved
In the summers of 2001 and 2002 snow samples werecollected every 3ndash5 cm from five 2ndash3m snow pits and one70m snow pit from the Belukha snowfirn plateau (4110ndash4120masl) A 21m snowfirn core was recovered at4115masl (498480 N 86833 0E) where radio-echo sound-ing indicated the ice was about 176m thick (Fig 7) Snow-pit precipitation and fresh snow samples were collectedinto pre-cleaned plastic bottles The density of fresh snowand snow pits was measured at 5 cm intervals using a100 cm3 stainless-steel sampler The firn core (19m long95 cm in diameter) was extracted from the bottom of the220 cm snow pit with a Polar Ice Coring Office (PICO)fiberglass auger The diameter length and weight of eachrecovered core section were measured to calculate densityFirn-core sections sealed in pre-cleaned polyethylene bagswere packed into insulated shipping containers anddelivered to the Japanese National Institute of PolarResearch (NIPR) Tokyo
Five stakes and benchmarks were installed for locationmeasurements by precise global positioning system (GPS)during summer field seasons on Belukha glacier (2001GP-SX1 TOPCON 2002 Allstar CMC Electronics) Anautomatic snow-depth gauge was installed at stake 2 on18 July 2001 (KADEC-SNOW KONA system) The sensordetected snow and open air using photo-diodes in incre-mentsdeclines of 1 cm to 26 October 2001 The surface
Table 1 Mean annual and seasonal oxygen and deuterium isotope ratios and deuterium excess in firnice-core (fiC) snow-pit (snP) andprecipitation (Pr) records from the Belukha plateau the Altai and other glaciers and sites along the northern periphery of central Asia
Stationglacier Samplefrom
Period P (share) T d18O dD d-excess DT Dd18O Dd
mm () 8C 8C
Belukha plateau Altai(4115masl)
fiC June 1984ndashJuly 2000 690 ndash102 ndash136 ndash9814 1093 310 108 279MayndashSept 590 (83) ndash174 ndash134 ndash9727 1032 89 88 239OctndashApr 100 (17) ndash148 ndash153 ndash10864 1241 230 99 258
snP July 2000ndashJuly 2001 826 ndash97 ndash138 ndash1009 100 254 166 166MayndashSept 595 ndash15 ndash122 ndash876 102 51 34 51OctndashApr 233 ndash167 ndash177 ndash987 113 141 166 166
Inylchek Tien Shan(5100 masl)
fiC 1994ndash2000 1100 ndash123 ndash1604 ndash1053 23 33 102MayndashSept 800 (72) ndash41 ndash1156 ndash801 124OctndashApr 300 (28) ndash165 ndash2178 ndash1458 284
Omsk western Siberia(94 masl)
Pr Year 401 76 ndash1346 ndash982 89
Novosibirsk western Siberia(162 masl)
Pr Year 422 09 ndash1464 ndash104 128MayndashOct 295 (70) 122 ndash1249 ndash858 141 668NovndashApr 128 (30) ndash101 ndash1917 ndash1423 111
Irkutsk eastern Siberia(485 masl)
Pr Year 445 00 ndash1212 ndash929 41MayndashOct 376 (82) 111 ndash1165 ndash903 30 448NovndashApr 84 (18) ndash109 ndash1613 ndash1229 62
Enisejsk eastern Siberia(98 masl)
Pr Year 491 ndash15 ndash1329 ndash984 79MayndashOct 312 (64) 104 ndash1186 ndash848 101 578NovndashApr 177 (36) ndash128 ndash176 ndash1383 28
Note P is amount of precipitation T is mean air temperature calculated with altitudinal gradient DT is absolute air-temperature amplitude Dd18O and Dd arerespectively oxygen isotope and d-excess range between monthly mean extremesAizen and others (in press) Araguas-Araguas and others (1998)
Fig 4 (a) Long-term monthly means of air temperature at the drillsite precipitation and sharefraction of monthly precipitation inannual total at Akkem station (b) Long-term monthly means andstandard deviations of d18O and d-excess averaged from Altaisnowfirn-core records 1984ndash2001 (cndashe) Long-term mean numberof days with different synoptic patterns southwest cyclones (c)western cyclones and western anticyclone (d) and stationarycyclonesultra-polar intrusion (e)
Aizen and others Stable-isotope time series and precipitation origin640
level was measured twice daily in the morning and evening(Fig 8) Daily snow accumulation (snow water equivalent(SWE) in mm Equation (1)) was computed based on positivechanges in the snow surface level (DH in cm) and assuminga density of new snow () of 022 g cmndash3 (Fig 6c) Negativeor zero values of Dh observed during snow sinking wereconsidered as absence of daily snow accumulation
SWEds frac14 10 hm thornheeth THORN if h gt 0 eth1THORNwhere Dhm and Dhe are positive differences of morningevening and eveningmorning changes in snow surfacelevel 10 is the unit transfer coefficient
4 LABORATORY ANALYSISThe Altai cores were processed in a dedicated cold room atNIPR using techniques established for ultra-clean samplepreparation Frozen 18mO water blanks were passedthrough the entire system to ensure there was no contamina-tion and for quality control Each 3ndash5 cm of the upper 11mof the snowfirn core as well as samples from five snow pits
and fresh snow were analyzed for d18O and dD at NIPR Thebottom 10m of the core was analyzed for dD at theUniversity of Maine and for d18O at the University of IdahoOxygen isotope ratios were measured using the standardCO2 equilibration technique (Craig 1957) Hydrogenisotope ratios were measured using Cr reduction in acontinuous flow system (Morrison and others 2001) Dataare reported in standard delta (d) notation vs Standard MeanOcean Water (SMOW) The analytical precision for mea-surements of oxygen and deuterium isotope ratio was005 and 05 respectively Analytic uncertainty ind-excess was estimated at
UethdTHORN frac14 ethudDTHORN2 thorn 8ethud2OTHORN2h i1=2
frac14 052
which is mainly dependent on the analytical precision ofdeuterium The technique of snowfirn-core stable-isotopeanalysis has been described by Kreutz and others (2001)
The concentration of sulfate was measured at NIPR by ionchromatography (Dionex 500 using AS14 separation columnand conductivity detection) To examine the temporal
Fig 5 (andashe) Isotopic composition in the snowfirn core d18O (a) dD (b) sulfate content SO42ndash (c) snowfirn density (d) and cumulative
snow water equivalent SAc (e) (f) Correlation between annual accumulation (Ac) records from firnice core and precipitation P at Akkemstation (g) Annual accumulation records from snowfirn core and precipitation at Akkem station Years (1984ndash2001) represent winterintervals
Aizen and others Stable-isotope time series and precipitation origin 641
modes of variation in the stable-isotope records obtainedfrom the snowfirn core regression spectral and K-meanclustering analyses (SYSTAT version 9 (SPSS Inc)) were used
5 RESULTS51 Establishing a depthndashage relationshipNo significant post-depositional effects were apparent in theoxygen and hydrogen records from the firn core as theamplitude of the signal near the bottom of the core wassimilar to that observed near the surface (Fig 5a and b) Todetermine annual snow accumulation layers we usedstable-isotope records with existing well-preserved seasonald18O and dD signals (Fig 5a and b) visible seasonalaccumulation evidence in snowfirn stratigraphy (Fig 6) andannual precipitation data from Akkem station (Fig 5f and g)Identification of annual accumulation layers in the snowfirncore was based on the extreme values of d18O and dD asminimum winter and maximum summer air temperaturesare a distinctive characteristic of the Altai meteorologicalregime (Fig 4a) In cases of double isotopic peaks during thewarm seasons of 1984 1985 1994 1996 and 1998 (Fig 5aand b) visible seasonal accumulation evidence in snowfirnstratigraphy (Fig 6) was used as the basis of dating withcorresponding annual accumulation compared to annualprecipitation data from Akkem station for these years
Snow and firnndashice densities (Fig 5d) were used toestablish cumulative depthwater-equivalent profiles(Fig 5e) The correlation between annual accumulationlayers in the snowfirn core and precipitation at Akkemstation reached 082 (Fig 5f and g) The mean annualaccumulation rate calculated at the drill site was690mmwe andash1 from summer 1984 to summer 2001 thisagrees with the calculated accumulation rates presented inthe World Atlas of Snow and Ice Resources (Kotlyakov1997) and with the rate of annual net accumulationobtained and validated through tritium and 210Pb recordsby Olivier and others (2003)
To verify the core chronology we used the markerhorizon of the Pinatubo (Philippines) volcanic eruption ofJune 1991 (Soden and others 2002) The ice layers ofvolcanic origin have been deduced from acidity measure-ments (mainly H2SO4) along firnice cores (Zielinski andothers 1996 Clausen and others 1997 Schwander andothers 2001 De Angelis and others 2003) The sulfateprofile of the firn core reported in Figure 5c indicated twospikes in the SO4
2ndash outside the regular seasonal variationsThe strong peak of 5088 mE Lndash1 measured at 1401mcorresponds to summer 1991 (Figs 5c and 6) documentingthe Pinatubo eruption The second sulfate peak at 58ndash60mis associated with the large forest fire that occurred in Siberiain 1998
Fig 6 Stratigraphy of 21m snowfirn core recovered in 2001 (a) and stratigraphy (b) and snowfirn density (c) of 7m snowfirn pit dug in2002 from the west Belukha plateau with seasonal and annual-layer identification 1 fine-grained snowfirn 2 medium-grained snowfirn3 coarse-grained snowfirn 4 1ndash2mm radiation of wind ice crusts 5 ice lenses or ice layers up to 5mm thick 6 regelate snowfirn 7 fine-grained snowfirn with aeolian particles 8 compact white snowfirn
Aizen and others Stable-isotope time series and precipitation origin642
In addition to validate the 17 annual accumulationlayers identified in the snowfirn core we used single seriesFourier analysis which reveals major physical processescausing periodic rhythms in the d18O and dD ratios (egregular annual cycles) (Table 2) The confidence interval forstandardized spectral density of the white noise wasdetermined according to the KolmogorovndashSmirnov criter-ion The largest values of the d18O periodogram relate tothe high-frequency part of the spectra The maximumvariance in the d18O and dD is explained by variations witha period of 308 in the 524 records (where 524 is thenumber of snowfirn-core samples from the west Belukhaplateau) The period of 308 is associated with 17 regularannual cycles (ie 524308 frac14 17) in air temperatureduring precipitation These cycles correspond to 17 annualaccumulation layers (1984ndash2001) identified both in stable-isotope ratios and in the snowfirn stratigraphy (Figs 5and 6)
52 Seasonalmonthly snow accumulationTo verify the correlation between snow accumulation on theBelukha plateau (Acds) and precipitation at Akkem station(PAkkem) obtained through ice-core annual records measure-ments of snow surface level at the drill site were used at dailyand event scale (Fig 8) The F test demonstrated astatistically significant correlation of r frac14 072 and 089
(under n ndash 2 frac14 31 and 18 at p frac14 090) between dailyeventprecipitation at Akkem station and dailyevent snow accu-mulation at the drill site (Fig 9) Two months of automaticdaily measurements of the snow surface level did not allowdevelopment of a snow accumulationprecipitation relation-ship at a monthly scale The relative value of standard error(STE in ) of regression increases with decreasing durationof averaging STE(year) frac14 104mm (ie 14 of 690mmaverage) STE(event) frac14 75mm (ie 25 of 294mm eventmean) and STE(day) frac14 45mm (ie 37 of 126mm dailymean) Therefore STE(seasonmonth) should be less than25 (STE(event)) and more than 14 (STE(year))
Significant correlation (AcdsPAkkem) validated applicationof the normalization technique (Barlow and others 1993Shuman and others 1995 Yao and others 1999 Aizen andothers 2004) to develop the seasonalmonthlyevent snowaccumulation (Ac(sme)ds) from snowice records Annualaccumulation (Ac(y)) at the drill site was normalized by thesharefraction (k) of monthlyseasonalevent precipitation inannual total (P(y)Akkem) at Akkem station (Equation (2))(Table 3)
AcethiTHORN ds frac14 kethiTHORNAcethyTHORN eth2THORNwhere i is the seasonalmonthlyevent period (eg JanuaryFebruary December) Ac(i)ds is the snow accumulationfor the lsquoi rsquo period of time and k frac14 PAkkem(i)P(y)Akkem
Fig 7 Ice-thickness profiles snow pits the weather station and snowfirn drill site on the west Belukha plateau projected onto an aerialphotograph
Aizen and others Stable-isotope time series and precipitation origin 643
Monthly snow accumulation values for 2000 calculatedby the normalization technique agreed with correspondingvalues calculated using the linear relationship of eventsnow surfaceprecipitation data (Fig 9) and verified the de-veloped evaluation of seasonalmonthlyevent accumulation(Table 3)
Furthermore calculated seasonal snow accumulationvalues were verified using the snowfirn stratigraphic profile(Fig 6) where winter layers could be differentiated fromothers by their homogeneous bright-white crystal structureIn the spring layers there are signs of 1ndash2mm slenderradiation crusts while summer layers have ice lenses up to8mm thick The autumn layers could be identified by morecompact firn and yellow-brown aeolian particles Uncer-tainty in calculating seasonal accumulation using thenormalization technique was less than 10 of theseasonal accumulation rate obtained from the snowfirn-core stratigraphic profile Snowfirn stratigraphic profiles(Fig 6) allowed partitioning of the firn-core layers with aseasonal resolution while monthly precipitation data fromthe Akkem and Kara-Turek meteorological stations enabledprofiling of the firn-core records with monthlyeventresolution for the spring summer and autumn seasons Forexample the sulfate peak measured at 1401m is related tothe firn-core layer of MayndashJune 1991 corresponding to the
Pinatubo eruption (in June) The thin winter layers wereconsidered as the sum of accumulation over 3months
The corresponding annual seasonalmonthly d18O anddD compositions were averaged as arithmetic means ofevery 3ndash5 cm of measured stable-isotope ratios in eachseasonal accumulation layer of the snowfirn core Barlowand others (1993) Shuman and others (1995) Yao andothers (1999) and Aizen and others (2004) have used thesame approaches to evaluate seasonal accumulation insnowfirnice cores
53 Stable isotopes from firn core and snow pitsThe mean d18O and dD isotope ratios from the Altai corendash136 and ndash9814 respectively are in accordance withother stable-isotope records obtained from central Asia andSiberia (Table 1) The concordance is related to the meanannual isotopic composition of precipitation from theOmsk and Eniseisk stations in southwest and southeastSiberia However seasonal means and deuterium excessfrom the station precipitation differ from the firn-corerecords
Fig 8 Twice-daily measured snow surface level (h) snow waterequivalent (SWE) and accumulated snow water equivalent (SWES)at the drill site (a) and daily precipitation (P) and accumulatedprecipitation (PS) (b) at Akkem meteorological station 2001
Table 2 Largest periodogram values of d18O and dD records in 524 snowfirn-core samples from the west Belukha plateau
d18O dD
Time series Frequency Period Periodogram Density Time series Frequency Period Periodogram Density
17 0032 308 18837 10225 17 0032 308 12313l28 6619546 0011 873 18143 9020 6 0011 873 1184230 577129
Fig 9 (a b) Relationships between precipitation at Akkem station(PAkkem) and automatically measured daily accumulation (snowwater equivalent SWEds) at the drill site and between monthlyprecipitation at Akkem station (PAkkem) and monthly snow accumu-lation (Acds) data obtained from ice-core records through normal-ization technique
Aizen and others Stable-isotope time series and precipitation origin644
The higher average annual as well as cold-season airtemperatures at the Altai drill site correspond to higher meanannual and cold-season oxygen isotope ratios showingslightly less depletion of the heavy isotopes than measuredin the Inilchek glacier core in the Tien Shan (Table 1) Thehigher minimum d18O values in the Altai snowfirn corethan from the Tien Shan winter records are caused by shortertrajectories of air masses bringing moisture to the Altaiglaciers from the same moisture source demonstrating thecontinental effect depleting the meteoric water movingfarther from the source of water vapor (Dansgaard 1964Friedman and others 1964) During the cold season the air-mass influxes move over the Eurasian continent eastwardalong the main route from the high latitudes of Iceland towestern Siberia and then to central Asia (Glukh and
Kononova 1982) Furthermore proportionally less cold-season ie OctoberndashApril precipitation amounts at theAltai drill site compared to the Tien Shan result in a highermean isotope ratio in the Belukha plateau firn-core records(Table 4) For example 17 of cold-season precipitation atthe Altai drill site with ndash153 of d18O mean during thecold season resulted in a 17 depletion of the annualmean level while 28 of cold-season precipitation at theTien Shan with ndash2178 of d18O mean resulted in a 574depletion of the annual mean level
Mean d18O isotope values of the annual records showsimilar averages throughout the period 1984ndash2001 varyingfrom ndash155 to ndash123 The distribution in d18O and dDrecords from the Altai snowfirn core shows well-preservedseasonal variations (Fig 5) and is significantly controlled bytemperature (Table 1) by share of coldwarm-season pre-cipitation amount and by precipitation origin (AppendixFig 10) The share of coldwarm season ie OctoberndashAprilprecipitationMayndashSeptember precipitation was determinedas the fraction of monthly total precipitation amount (Fig 4a)in the annual total Mean monthly oxygen isotope ratiosfrom the Altai snowfirn core reflected a typical continentalclimate with an overall range between absolute maximumand minimum values of 166 corresponding to theamplitude of maximum and minimum air temperaturesobserved from 1984 to 2001 (DT frac14 318C) (Table 1)
The highest monthly mean d18O values of ndash134 arerelated to the warm-season accumulation layers with meanair temperatures of ndash188C (Table 1) Cold season minimummean d18O values of ndash153 were associated mainly withminimum mean air temperatures of ndash1488C The highestvariability in seasonal d18O and dD was observed in thecold-season firn layers whereas the most variable season forair temperatures is from the end of autumn to the beginningof spring (Fig 4a and b)
54 Relationship between stable hydrogen- andoxygen-isotope ratiosThe slope and intercept in the covariance between the stablehydrogen and oxygen isotopic concentration found in mostmeteoric water and defined by Craig (1961) as the global
Table 3 Calculation of monthly accumulation by normalizationtechnique (Acds) from ice-core records and by developed equation(Fig 9) based on snow accumulation measurements (SWEds) at thedrill site
Month PAkkem Share inPS
Acds bynormalization
SWEds by equation12PAkkem+108
mm mm mm
Dec 172 003 232 314Nov 134 002 181 269Oct 348 006 470 526Sept 352 006 475 530Aug 969 017 1309 1271Jul 708 012 956 957Jun 1322 023 1785 1694May 948 017 1280 1246Apr 497 009 671 704Mar 116 002 157 247Feb 65 001 88 186Jan 48 001 65 16 6PS 5679 1 STE frac14 0036mm (006)
Note PAkkem is monthly precipitation at Akkem station PS is share ofmonthly precipitation in annual total
Table 4 Clustered averageextreme d18O and d-excess values from accumulation layers formed by precipitation originating from central Asian(CA) and oceanic moisture sources their share () in the total annual and seasonal accumulation layers and uncertainty () of clustering
d18O d-excess Share SeasonsUncertainty
SP Moisture source Max Min Ave Max Min Ave Year Spr Summ Aut Wint
Total accumulation (mmwe) 12 591 3037 6752 1967 834Mean accumulation rate (mmwe andash1) 690 133 376 129 52
SWC CA ndash96 ndash247 ndash141 256 120 147 33 33 32 40 24 Year8 9 6 8 21
Oceanic ndash81 ndash197 ndash133 120 11 81 67 67 68 60 76 Year7 9 5 6 19
WC Atlantic ndash97 ndash197 ndash138 120 70 96 56 57 60 36 76 Spr aut6 7 4 4 19
UP NWC Arctic ndash81 ndash167 ndash124 78 11 56 11 10 8 24 Summ8 8 7 9
StCyc Pacific 10 10 9 7 Summ7 14 7 6
Note SP is prevailing synoptic pattern SWC is southwestern cyclone WC is western cyclone UP is ultra-polar intrusion StCyc is stationary cyclone SprSumm Aut Wint are spring summer autumn winter
Aizen and others Stable-isotope time series and precipitation origin 645
meteoric water line (GMWL) are useful in understanding thesystematics of isotopic fractionation (Kendall and McDon-nell 1998) The slope of the GMWL 8 is related to the ratiosof fractionation factors when the minor dissimilarity iscaused by a kinetic fractionation effect during evaporationThe intercept of the GMWL 10 is termed the deuteriumexcess (d-excess) a concept introduced by Dansgaard(1964) ie d-excess () frac14 dDndash8d18O Deuterium excessis a parameter reflecting re-evaporation at land surfaces andor mixing along air-mass trajectories A smaller or largerintercept in the local relationship from the snowfirn corefresh snow snow pit and precipitation compared with the
GMWL (Fig 11a) reflects different kinetic evaporation effectson the transferred water vapor (eg initial water vapor wasmore quickly or slowly evaporated under non-equilibriumconditions (Kendall and McDonnell 1998)) The amount ofd-excess is dependent on sea surface temperatures duringevaporation as well as other physical conditions includingfractioning of isotopes during ice crystal formation in cloudsre-evaporationsublimation of snow below clouds in un-saturated air and post-depositional modification of theisotope signal for example by melting evaporationsublimation and wind erosion (Merlivat and Jouzel 1979Jouzel and Merlivat 1984 Ciais and Jouzel 1994)
Fig 10 (andashc) Monthly means of d18O averaged from Altai snowfirn-core records and air temperature at the drill site (a) and d-excess (b) andprecipitation amount at Akkem station (c) (d) Monthly means of d18O and d-excess records obtained from snow pit 200001 and number ofdays with synoptic patterns n that brought precipitation to the Altai (e) Mean monthly air temperature at the drill site and snowaccumulation measured from snow pit 200001
Aizen and others Stable-isotope time series and precipitation origin646
The d18OndashdD relationship in the precipitation snow pitsand snowfirn core from the Belukha plateau (Fig 11a) has asimilar slope to the covariance (ie 8) as that of the GMWLindicating the same initial relationship of fractionationfactors and points to the absence of strong melt andpercolation in the snowfirn core The slopes did notapproach typical sublimationevaporation line slopes ofabout 5 (Clark and Fritz 1997)
The spatial distribution of the long-term annual averagesof d-excess in snowfirn-core records and precipitation ischaracterized by a significant spread ranging from 23 forthe Tien Shan firn-core records to 41 from precipitationat Irkutsk station in eastern Siberia (Table 1) Anothereastern Siberian station Eniseisk also demonstrated arelatively low d-excess value of 79 At the westernSiberian stations Omsk and Novosibirsk long-term annualaverages of d-excess gradually increase to 89 and 128respectively
The average d-excess of snowfirn-core records variesaround 109 similar to the intercept of the GMWL Thereis a correlation between the two isotope parameters(r2 frac14 093) and close accordance between the Altaimeteoric water line (MWL) and GMWL (Fig 11a) Thed-excess variability is preserved throughout the core record
ranging from 18 to 297 The d-excess values vary from8 to 14 in gt50 of snowfirn-core records (Fig 12)
Along with the significant influence of snow formationtemperature on d-excess we assume that in the alpine areasof central Asia the large (up to 18 in 199495 Figs 4b and10b and d) seasonal fluctuations in Altai d-excess values(Hoffmann and others 1998 Holdsworth and Krouse 2002Kreutz and others 2003) are explained by regional-scalehydrological processes such as source transport andrecycling of atmospheric moisture Low air temperaturesduring cold dry seasons and high humidity during warmseasons when the main precipitation occurs (83 (Fig 4aTable 1)) reduces the effect of partial re-evaporation ofsnowflakes below clouds and of sublimation from snowsurfaces on the firn-core records Post-depositional effects ofmeltrefreezing and evaporationsublimation from the sur-face on the west Belukha plateau are negligible becausepositive temperatures were never observed at the drill sitewhich is located in the cold recrystallization zone (Fig 3aand b)
The long-term monthly means of d-excess show well-defined and systematic seasonal variations (Figs 4b and10d) with a mean maximum in FebruaryJanuary and aminimum in AugustJuly A firnice core drilled in the
Fig 11 (a) Annual and seasonal deuterium (dD) and oxygen (d18O) isotope relationship (Altai MWL) in snow pit fresh snow precipitationand snowfirn core on the west Belukha plateau 2001 (b) Distribution of d-excess and d18O and ten-sample averages from Altai 2001 snowfirn core
Aizen and others Stable-isotope time series and precipitation origin 647
Tien Shan (Kreutz and others 2003) exhibits seasonald-excess and d18O variability similar to that in the Altaiie lowest d-excess and highest d18O values correspond tothe summer season with maximum precipitation and airtemperatures On the other hand a firn core from TsastUla ice cap Mongolia displays inverted seasonal levels ofd-excess and d18O (Schotterer and others 1996)
From May to January the long-term monthly means ofd-excess are almost constant 95ndash112 (Fig 4b) withabout the same intercept as for the GMWL From February toApril d-excess increased and reflects the modification of airmasses during passage over relatively warm continentalwaters (Gat and Dansgaard 1972 Gat and Carmi 1987)
Compared to the Northern Hemisphere stations wherethe average d-excess values reach a maximum in DecemberJanuary and a minimum in JuneJuly (Froehlich and others2002) Altai snowfirn-core records show a delay of about1month (Fig 4b) This insignificant asymmetry probablyreflects the interior and elevated location of the Altai drillsite and complexly originated precipitation inputs to thewest Belukha accumulation areas The long-term meanextremes in the seasonal variation of d-excess values fromthe Altai snowfirn-core record range from 155 to 95(Fig 4b) insignificantly higher than corresponding valuesfrom Northern Hemisphere stations which varied from121 to 77 (Froehlich and others 2002) Low snow-formation temperatures partially caused increasing d-excessvalues in the firn-core records (Ciais and others 1995)
At the end of winterbeginning of spring warming occursfaster in the inner-continental regions than in the coastalregions increasing inland evaporation Low-humidity con-ditions in the cold-season continental air masses cause rapidevaporation and hence high d-excess values in subsequentprecipitation Long-range transport of air masses from theeastern Black Sea Caspian and Aral Seas causes conditionsfavorable to rapid evaporation and the formation of highd-excess values in the insignificant precipitation thataccumulates on the Altai glaciers during these months(Fig 4a and b)
During the warm season moisture is brought by westernand northwestern air masses formed under relatively high airtemperatures and humidity conditions that are associatedwith low d-excess values
55 Synoptic patterns and precipitation originTo identify the origin and trajectories of moisture the meanseasonal amount of precipitation d18O isotopic content and
d-excess values in the snow firn-core records werecompared with the monthly frequency of synoptic patternsusing correlation analysis
The main synoptic pattern that brings moisture to theSiberian Altai during the year is the western cyclones(WCab) and western anticyclones (WAa) (Appendix) whichhave a high correlation with monthly precipitation amount(Table 5) and a significant number of events (Fig 4cndashe) Thefrequency of WCb and WAc is positively associated withd18O isotopic content in related firn-core accumulationlayers
Air masses originating over the Arctic Ocean bringprecipitation to the Siberian Altai by northwestern cyclones(NWC) in spring by ultra-polar influxes (UP) in autumn andpartially by WAc in the summer Strong depletion in d18Oand in d-excess records associated with these synopticpatterns (Table 5) points to the rain-out effect of water vapor(Rayleigh distillation model) and is in agreement with resultspresented by Froehlich and others (2002) Mixing with watervapor evaporated from more northern oceanic areas mayaccount for the observed slight depletion of d-excess values
Summer precipitation is significantly associated with thefrequency of stationary cyclones (Table 5) which increasethe level of d18O enrichment and d-excess depletion in firn-core accumulation layers Stationary cyclones bring pre-cipitation to the Altai that originates from the Pacific OceanThis result is in agreement with estimations based onaerological observations (Kuznezova 1984) that the meansummer horizontal moisture transport over the Altai has astrong eastern component
There is a positive correlation between the frequency ofsouthwestern cyclones and springwinter amount of pre-cipitation and d-excess values These results are in agree-ment with the nature of the synoptic processes (seeAppendix) Moisture in the southwestern cyclones originatesover the eastern Black Sea the Caspian and Aral Seas and istransferred to the Altai at low altitudes and from lowlatitudes precipitating with exceptionally high d-excessvalues According to Froehlich and others (2002) excep-tionally high d-excess values were recorded at stationsreceiving precipitation from the eastern Mediterranean SeaA negative correlation coefficient between the southwes-tern-cyclone frequency pattern and d18O is a result of re-evaporating water vapor from the southern internal moisturesources in winter which moves northward over the coldAsian continent mixing with cool air masses and accountsfor strong d18O depletion
Fig 12 Probability distribution of d-excess values (F in ) in snowfirn-core records from precipitation originating over different moisturesources
Aizen and others Stable-isotope time series and precipitation origin648
6 DISCUSSION61 Clustering precipitation transferred from external(oceanic) and internal (continental) moisture sourcesStable-isotope distribution in the snowfirn core (seesection 54) and the synoptic regime (see section 55)examined from the Siberian Altai shows evidence ofmultiple moisture sources In order to distinguish the sourcesof precipitated moisture the K-means clustering andregression analyses were applied
611 K-means clustering analysisTo distinguish oceanic moisture from water vapor evapor-ated from internal drainage basins and transferred to thehighmiddle latitudes of Asia the d18O isotopic ratio andd-excess values from the Altai snowfirn core were clusteredinto two distinct datasets The clustering procedure wasbased on the K-means clustering analysis method of splittinga dataset into two groups by maximizing between-clustervariation relative to within-cluster variation The first clusteris typified by the more depleted d18O values (down tondash247) and d-excess values higher than 12 with anaverage value of 147 and maxima reaching 256(Table 4) The d-excess values in the other cluster are lowerthan 12 with an average value of 81 and an absoluteminimum of 11 The d18O mean and maximum valuesare slightly more enriched than in records related to thefirst clusters
612 Calibration of precipitation eventsTo evaluate the link between stable-isotope concentrationsin the firn-core profile and atmospheric circulationdynamics we matched the measured d18O concentrationand d-excess values in snow-pit layers to correspondingprecipitation events observed at the Akkem meteorologicalstation from July 2001 to July 2000 These snow accumu-lation event values were calculated using a normalizationtechnique (Equation (2)) which was verified through thelinear relationship obtained from snow accumulationmeasurements (Equation (1)) (see Fig 9) The d18O con-centration and d-excess mean in snow layers duringprecipitation events were related to the synoptic patterns
(see Appendix) of associated precipitation (Fig 13) Analy-sis of synoptic processes prevailing during precipitationevents over western Siberia and the Altai is in accordancewith results from the K-means clustering with 74 orabout 15 of deviation (ie amount of accumulation929mm in total accumulation 12 591mm where thestable-isotope distribution was not in accordance withdeveloped clustering) Greater uncertainty occurred duringwinter months when several insignificant precipitationevents with both internal and external moisture sourceswere associated with the same snow accumulation layer(Table 4)
The records with the highest deuterium excess (d-excess12) are associated with precipitation occurring duringsouthwestern cyclones bringing internal moisture Therecords with the lowest deuterium excess (d-excesslt12) are associated with synoptic processes bringingmoisture that originates from external (oceanic) moisturesources The snowfirn-core records with external moisturesources (d-excess lt12) were further verified by examiningthe observed synoptic processes during precipitation eventsof 200001 (Fig 13) Atlantic moisture sources are associ-ated with slightly higher d-excess ranging from 70 to12 Moisture of Arctic and Pacific origin is associated withthe lowest d-excess levels (lt78) (Table 4)
613 Verification at a monthly average scale
6131 Snow-pit recordsMonthly average d-excess and d18O values in snow-pitlayers (Fig 10d and e) together with the correspondingmonthly frequency of synoptic patterns verified the devel-oped clustering of precipitation origin (Table 4)
1 Southwestern cyclones were the prevailing synopticpattern from January to March 2001 when d-excess washigher at 12 and continental low-humidity air massesbrought insignificant amounts of recycled precipitationwith depleted d18O values to the Altai from internalmoisture sources In the cold season of 2001 south-western cyclones caused a growth of monthly d-excessmeans that reached 16 (Fig 10d)
Table 5 Correlation (at 10) between seasonal frequency of synoptic patterns (SP) observed over western Siberia and the amount ofprecipitation at Akkem station (PAkkem) based on data for 1954ndash2001 annual association (at 20) between monthly mean SP and monthlymean of d18O concentration and d-excess in snowfirn core obtained from the west Belukha plateau
NWC UP WCa WCb WAa WAc StCyc SWC
Origin of SP Arctic Arctic Atlantic Atlantic ArcticN Atlantic
ArcticN Atlantic
Pacific Central Asia
PAkkemSPSummer 034 042 034 036Spring 045 037 067 036Autumn 032 036 03 036 028Winter 085 038 042Year 031 039 034 056 033 031 044 031
d18OSPYear ndash069 064 064 031 053 062
d-excessSPYear ndash051 ndash049 ndash033 ndash05 ndash029 ndash062 ndash053 039
Note NWC is northwestern cyclone UP is ultra-polar intrusion WCa and WCb are western cyclones WAa and WAc are western anticyclones StCyc isstationary cyclone and SWC is southwestern cyclone
Aizen and others Stable-isotope time series and precipitation origin 649
2 Annual monthly frequency of ultra-polar influxesreached a maximum (up to 6 days) in October resultingin depleted d-excess monthly values (down to 5)despite an intensive development of western cyclonesUltra-polar influxes are associated with Arctic or NorthAtlantic Ocean moisture origin
3 In July 2000 intensive development of stationarycyclones (up to 5 days) brought moisture from the eastcausing depletion in d-excess values (down to 5)
4 Monthly d-excess means ranged from 7 to 12 duringthe remaining months with the main precipitationassociated with western cyclones bringing moisture fromthe Atlantic Ocean
6132 Snowfirn-core recordsThe monthly d18O and d-excess means from firn-corerecords were compared to the instrumental air-temperatureand precipitation monthly means at the drill site (Fig 10andashc)Observed interannual d18O fluctuations that cannot be
accounted for by air-temperature fluctuations were ex-plained by increased monthly frequency of synopticpatterns For example an abnormally enriched d18O meanof ndash10 from the accumulation layer of May 1998 (fallingabove the long-term May average of ndash13 Fig 4b)coincides with an abnormally depleted d-excess monthlymean of 69 (falling above the long-term average of11) and is inconsistent with the May mean airtemperature (Fig 10a) Abnormally frequent developmentof stationary-cyclone synoptic patterns which broughtmoisture from the east (eg Pacific Ocean) were observedat the end of spring reaching 6 days in May (falling abovethe long-term average of 04 days in May (Fig 4e)) andcaused a disparity between the monthly levels of d18O andair temperature The uncertainty in developed clusteringwhich was validated by analyzing deviations in monthlymeans of d18O d-excess air temperature precipitation andsynoptic pattern frequency (Fig 10andashc) was at 4(Atlantic cluster in summer and autumn) reaching 21during the winter months
Fig 13 (a) Verification of d-excess and d18O clustering at the event timescale through precipitation occurring during the observed synopticpattern at the meteorological station (b c) Corresponding snow-pit isotope records
Aizen and others Stable-isotope time series and precipitation origin650
62 Contribution of precipitation transferred fromexternal and internal moisture sources to AltaiaccumulationTotal snowfirn accumulation in the Altai core from June1984 to July 2001 amounted to 12 591mmwe Of this total67 corresponds to precipitation transferred by westernnorthwestern and stationary cyclones western anticyclonesand ultra-polar intrusions from oceanic moisture sources(Table 4) Precipitation over the Siberian Altai is mainlymarine in origin during all seasons with the oceanic sharequite steady ranging from 76 in winter to 60 in autumnaccumulation Moisture associated with synoptic patternscorresponding to water vapor evaporated over the AtlanticOcean comprises 56 of annual accumulation Precipita-tion transferred from an external moisture source with thelowest d-excess levels comprises on average 11 of annualaccumulation with an autumn maximum (up to 24) and asummer minimum (8) (Table 4)
The remaining 34 of annual precipitation is transferredby southwest cyclones from internal moisture sources withthe largest share 40 occurring in autumn (Table 4) Thesmallest share of recycled precipitation (24) transferredfrom internal moisture sources to the Altai glaciers wasobserved in winter when the Siberian high is strongest overnorthern and central Asia blocking the intrusion of airmasses and conditions for inland evaporation and localconvection are weakest because of low continental heating
Summer is the main season for accumulation from bothexternal and internal moisture sources (Fig 14) There are norecords with low d-excess values (Arctic Ocean) in accumu-lation layers related to winter months while Atlanticmoisture as well as recycled moisture over central Asiawas brought to the Siberian Altai year-round From autumnto spring d18O records associated with inter-land moisturesources are more depleted than d18O records related toAtlantic moisture sources (Fig 14) because of lower airtemperatures over the continent than over the oceanSummer mean isotope records are almost the same Themean values of d18O from summer accumulation layers
with ArcticPacific precipitation sources are the mostenriched of the three clusters considered reachingndash117 The highest d18O values may be associated withthe highest air temperature during precipitation andornearby water-vapor formation (eg ArcticPacific Ocean orlocal summer convection)
7 CONCLUSIONThe west Belukha snowfirn plateau is in the coldrecrystallization zone where positive temperatures werenever observed at the drill site The post-depositional effectof meltrefreezing and evaporationsublimation from thesurface on the west Belukha plateau is negligible and wefound no sign of water percolation
A clear seasonal signal in d18O and dD isotopes was thebasis for identification of annual accumulation layers alongwith stratigraphic analysis Validation of the dating throughthe marker horizon of the Pinatubo volcanic eruptionshowed monthly correspondence The mean accumulationrate of 690mmwe andash1 agrees with the annual accumulationrate validated through tritium and 210Pb records by Olivierand others (2003) and snow accumulation measured bysnow stakes during 3 years
The distribution of isotope records and d-excess valuesshows well-preserved seasonal variations which are sig-nificantly controlled by temperature cold- or warm-seasonprecipitation amount and precipitation origin
The d18OndashdD relationship in the Altai snowfirn-corerecords has the same slope to the covariance as that of theGMWL indicating the same initial relationship of fraction-ation factors and points to the absence of meltpercolationin the firn core The average d-excess of firn-core recordsvaries around 109 about the same as the intercept in thecovariance of the GMWL
The technique of coupling synoptic climatology andmeteorological data with d18O and d-excess firn-corerecords was developed to determine climate-related signalsand to identify the origin of moisture The firn-core records
Fig 14 Annual and seasonal contributions to accumulation of precipitation originating from external and internal moisture sourcespercentage of average oxygen deuterium and deuterium excess
Aizen and others Stable-isotope time series and precipitation origin 651
were calibrated at event-scale level and validated using themonthly meteorological data
Clustering analysis of 17 year snowfirn-core isotoperecords and examination of synoptic atmospheric patternsshow that two-thirds of the annual accumulation is formedfrom oceanic precipitation the rest of the precipitation isrecycled over AralndashCaspian sources More than half of theaccumulation has an Atlantic Ocean origin and precipita-tion from the Arctic and Pacific Oceans contributes onaverage 11 to the annual accumulation
On an annual basis the main synoptic pattern thatbrings moisture to the Siberian Altai is the westerncyclones and the western cyclone frequency is positivelyassociated with d18O isotopic content Deuterium excessvalues in related firn-core accumulation layers ranged from7 to 12 Strong depletion in d18O and in d-excessrecords is associated with synoptic patterns of north-western and ultra-polar cyclones that bring moisture fromArctic oceanic areas and contributed similar accumulationto the spring summer and autumn seasonal layersIncreased development of stationary cyclones is associatedwith d18O enrichment and d-excess depletion in firn-coreaccumulation layers Stationary cyclones bring eastern-originated precipitation from the Pacific Ocean to the Altaiglaciers
The interior moisture sources contributed the remaining33 of annual precipitation These data are in reasonableagreement with recent findings by Kurita and others (2004)that more than half of the summer moisture forming theprecipitation in Siberian plain stations originates from landsurfaces High d-excess values (up to 256) are associatedwith precipitation carried by southwestern cyclones and area result of re-evaporating water vapor from internal moisturesources (eg Caspian and Aral Seas) with observed low airhumidity Their movement northward over the cold Asiancontinent and mixing with cool air masses resulted in strongd18O depletion
The technique developed here will be used for climaticand environmental reconstruction of snow accumulationmoisture origin and atmospheric circulation in north-centralAsia over recent centuries from oxygen isotope anddeuterium records recovered from a 176m surface-to-bottom ice core obtained in 2003 from the Belukha snowfirn plateau
ACKNOWLEDGEMENTSThis research was supported by the US Department of Energy(DE-A107) and the Research Institute for Humanity andNature Kyoto Japan The authors thank T Prokopinskaya forher inestimable contribution in organizing our expeditionsWe also thank all the members of our expeditionsA Lushnikov A Chebotarev A Surazakov S PolesskiyM Yoshihiro and M Kenichiro and V Yakubovskiy andV Podoprigora the chief pilots of Russian helicopter MI-MTVfrom Altai Regional Rescue Department For valuablecomments and corrections we thank CSL OmmanneyV Masson-Delmotte D Peel BM Vinther DR Joswiak andan anonymous reviewer
REFERENCESAizen VB E Aizen J Melack and T Martma 1996 Isotopic
measurements of precipitation on central Asia glaciers
(southeastern Tibetan northern Himalayas central Tien Shan)J Geophys Res 101(D4) 9185ndash9196
Aizen VB EM Aizen JM Melack KJ Kreutz and LD Cecil2004 Association between atmospheric circulation patterns andfirnndashice core records from the Inilchek glacierized area centralTien Shan J Geophys Res 109(D8 D08304) (1010292003JD003894)
Aizen VB EM Aizen D Joswiak K Fujita LN Takeuchi andSA Nikitin In press Climatic and atmospheric circulationpattern variability from ice-core isotopegeochemistry records(Altai Tien Shan Tibet) Ann Glaciol
Araguas-Araguas L K Froehlich and K Rozanski 1998 Stableisotope composition of precipitation over southeast AsiaJ Geophys Res 103(D22) 28721ndash28742
Barlow LK JWC White RG Barry JC Rogers and P Grootes1993 The North Atlantic oscillation signature in deuterium anddeuterium excess signals in the Greenland Ice Sheet Project 2ice core 1840ndash1970 Geophys Res Lett 20(24) 2901ndash2904
Ciais P and J Jouzel 1994 Deuterium and oxygen 18 inprecipitation isotopic model including mixed cloud processesJ Geophys Res 99(D8) 16793ndash16803
Ciais P JWC White J Jouzel and JR Petit 1995 The origin ofpresent-day Antarctic precipitation from surface snow deuteriumexcess data J Geophys Res 100(D9) 18917ndash18927
Clark ID and P Fritz 1997 Environmental isotopes in hydro-geology Boca Raton FL Lewis Publishers
Clausen HB and 6 others 1997 A comparison of the volcanicrecords over the past 4000 years from the Greenland Ice CoreProject and Dye 3 Greenland ice cores J Geophys Res102(C12) 26707ndash26723
Craig H 1957 Isotopic standards for carbon and oxygen andcorrection factors for mass-spectrometric analysis of carbondioxide Geochim Cosmochim Acta 12 133ndash149
Craig H 1961 Isotopic variations in meteoric waters Science133(3465) 1702ndash1703
Dansgaard W 1964 Stable isotopes in precipitation Tellus 16(4)436ndash468
Dansgaard W and 10 others 1993 Evidence for general instabilityof past climate from a 250-kyr ice-core record Nature364(6434) 218ndash220
De Angelis M J Simoes H Bonnaveira JD Taupin andRJ Delmas 2003 Volcanic eruptions recorded in the Illimaniice core (Bolivia) 1918ndash1998 and Tambora periods AtmosChem Phys Discuss 3 2427ndash2463
Easterling DR TC Peterson and TR Karl 1995 On thedevelopment and use of homogenized climate data sets InMuircheartaigh IO ed Sixth International Meeting onStatistical Climatology 19ndash23 June 1995 Galway IrelandGalway University College 435ndash438
Friedman I AC Redfield B Shoen and J Harris 1964 Thevariations of the deuterium content of natural waters in thehydrological cycle Rev Geophys 2 177ndash224
Froehlich K JJ Gibson and PK Aggarwal 2002 Deuteriumexcess in precipitation and its climatological significance InStudy of environmental change using isotope techniquesVienna International Atomic Energy Agency 54ndash65
Galakhov VP 1981 Raschet i analys vodno-lednikovogo balanca vcentralrsquonom Altae Katun chrebet (PhD thesis Akademii NaukSSSR)
Gat JR and I Carmi 1987 Effect of climate changes on theprecipitation patterns and isotopic composition of water in aclimate transition zone case of the Eastern Mediterranean Seaarea In Solomon SI M Beran and W Hogg eds TheInfluence of Climatic Change and Climate Variability on theHydrologic Regime and Water Resources Wallingford OxonInternational Association of Hydrological Sciences 513ndash523(IAHS Publication 168)
Gat JR and W Dansgaard 1972 Stable isotope survey of thefreshwater occurrences in Israel and the Jordan Rift ValleyJ Hydrol 16 177ndash211
Aizen and others Stable-isotope time series and precipitation origin652
Glukh IS and NK Kononova 1982 Relationship of long-termprecipitation variability in western Siberia and Middle AsiaNews of Academy of Science Geogr Ser 3 23ndash29
Hammer CU HB Clausen W Dansgaard N GundestrupSJ Johnsen and N Reeh 1978 Dating of Greenland ice coresby flow models isotopes volcanic debris and continental dustJ Glaciol 20(82) 3ndash26
Hoffmann G M Werner and M Heimann 1998 Water isotopemodule of the ECHAM atmospheric general circulation model astudy on timescales from days to several years J Geophys Res103(D14) 16871ndash16896
Hoffmann G J Jouzel and V Masson 2000 Stable water isotopesin atmospheric general circulation models Hydrol Process 141385ndash1406
Holdsworth G and HR Krouse 2002 Altitudinal variation of thestable isotopes of snow in regions of high relief J Glaciol48(160) 31ndash41
Johnsen SJ 1977 Stable isotope homogenization of polar firn andice In Isotopes and Impurities in Snow and Ice WallingfordOxon International Association of Hydrological Sciences 210ndash219 (IAHS Publication 118)
Jouzel J and L Merlivat 1984 Deuterium and oxygen 18 inprecipitation modeling of the isotopic effect during snowformation J Geophys Res 89(D7) 11749ndash11757
Jouzel J RD Koster RJ Suozzo and GL Russell 1994 Stablewater isotope behavior during the last glacial maximum ageneral circulation model analysis J Geophys Res 99(D12)25791ndash25802
Jouzel J and 12 others 1997 Validity of the temperaturereconstruction from water isotopes in ice cores J GeophysRes 102(C12) 26471ndash26487
Kendall C and JJ McDonnell 1998 Isotope tracers in catchmenthydrology New York Elsevier
Koerner RM and DA Fisher 1990 A record of Holocene summerclimate from a Canadian high-Arctic ice core Nature343(6259) 630ndash631
Kotlyakov VM 1997 Atlas snezhno-ledovykh resursa miraMoscow Russian Academy of Sciences Institute of Geography
Kreutz KJ VB Aizen LD Cecil and CP Wake 2001 Oxygenisotopic and soluble ionic composition of a shallow firn coreInilchek glacier central Tien Shan J Glaciol 47(159)548ndash554
Kreutz KJ CP Wake VB Aizen LD Cecil and HA Synal2003 Seasonal deuterium excess in a Tien Shan ice coreinfluence of moisture transport and recycling in Central AsiaGeophys Res Lett 30(18) 1922 (1010292003GL017896)
Kurita N N Yoshida G Inoue and EA Chayanova 2004Modern isotope climatology of Russia a first assessmentJ Geophys Res 109(D3) D03102 (1010292003JD003404)
Kuznezova LP ed 1984 Soderjanie i perenos vlagi v atmospherenad territoriei SSSR Moscow Main Department of Geodesy andMapping Survey USSR
Merlivat L and J Jouzel 1979 Global climatic interpretation ofthe deuteriumndashoxygen 18 relationship for precipitationJ Geophys Res 84(C8) 5029ndash5033
Morrison J T Brockwell T Merren F Fourel and AM Philips2001 On-line high-precision stable hydrogen isotopic analyseson nanoliter water samples Analyt Chem 73(15) 3570ndash3575
Naftz DL and 6 others 2002 Ice core evidence of rapid airtemperature increases since 1960 in alpine areas of the WindRiver Range Wyoming United States J Geophys Res107(D13) 4171 (1010292001JD000621)
Narojniy UK OV Narojnaya and KI Popova 1993 Cyrcula-cionniy regime i gidrotermicheskie usloviya zim AltayaGlaciologiya Altaya 4(19) 183ndash188
Olivier S and 10 others 2003 Glaciochemical investigation of anice core from Belukha Glacier Siberian Altai Geophys ResLett 30(19) 2019 (1010292003GL018290)
Petit JR and 18 others 1999 Climate and atmospheric history ofthe past 420000 years from the Vostok ice core AntarcticaNature 399(6735) 429ndash436
Popova KI 1972 O tipah godovogo hoda atmosphernich osadkovv Gornom Altae Glaciologiya Altaya 7 169ndash174
Schotterer U K Frohlich HW Gaggeler S Sandjordj andW Stichler 1996 Isotope records from Mongolian and alpineice cores as climate indicators Climatic Change 36 519ndash530
Schwander J J Jouzel CU Hammer JR Petit R Udisti andE Wolff 2001 A tentative chronology for the EPICA DomeConcordia ice core Geophys Res Lett 28(22) 4243ndash4246
Shuman CA RB Alley S Anandakrishnan JWC WhitePM Grootes and CR Stearns 1995 Temperature and accumu-lation at the Greenland Summit comparison of high-resolutionisotope profiles and satellite passive microwave brightnesstemperature trends J Geophys Res 100(D5) 9165ndash9177
Soden BJ RT Wetherald GL Stenchikov and A Robock 2002Global cooling after the eruption of Mount Pinatubo a test ofclimate feedback by water vapor Science 296(5568) 727ndash730
Thompson LG and 6 others 1995 A 1000 year climatic ice-corerecord from the Guliya ice cap China its relationship to globalclimate variability Ann Glaciol 21 175ndash181
Tian L V Masson-Delmotte M Stievenard T Yao and J Jouzel2001 Tibetan Plateau summer monsoon northward extentrevealed by measurements of water stable isotopes J GeophysRes 106(D22) 28081ndash28088
Vimeux F V Masson J Jouzel M Stievenard and JR Petit 1999Glacialndashinterglacial changes in ocean surface conditions in theSouthern Hemisphere Nature 398(6726) 410ndash413
Welker JM 2000 Isotopic d18O characteristics of weekly precipi-tation collected across the USA an initial analysis with applica-tions to water source studies Hydrol Process 14 1449ndash1464
Yao T and LG Thompson 1992 Trends and features of climaticchanges in the past 5000 years recorded by the Dunde ice coreAnn Glaciol 16 21ndash24
Yao T V Masson J Jouzel M Stievenard W Sun and K Jiao1999 Relationship between d18O in precipitation and surfaceair temperature in the Urumqi river basin east Tianshanmountains China Geophys Res Lett 26(23) 3473ndash3476
Zielinski GA PA Mayewski LD Meeker SI Whitlow andMS Twickler 1996 110000-yr record of explosive volcanismfrom the GISP2 (Greenland) ice coreQuat Res 45(2) 109ndash118
Aizen and others Stable-isotope time series and precipitation origin 653
APPENDIX
Table 6 Synoptic processes observed over western Siberia (WS) (Popova 1972 Narojniy and others 1993)
Type Sub-types General description Precipitation (origin) Troposphere At surface
Westernanticyclones(WA)
WAa Cyclones transfer over WS plain Possible Westerlies developing Anticyclonic fields de-veloping over the Altaiand sub-mountain
WAb Anticyclogenesis develops over WSWAc Cyclones develop at two fronts and
moisture is intensively advected withwesterlies
Possibly intensive inthe Altai (Atlantic)
Westerncyclones (WC)
WCa WCa extend over the Altai Kazakhstanand WS plain Thunderstorms developin summer
Intensive especiallyin mountains (Atlantic)
Westerlies affected bystationary waves withlarge amplitude
WCs transferring atsouthern WS andnorthern Kazakhstan
WCb Anticyclones transfer at the north fromthe Altai
Possible
Northwesternanticyclones(NWA)
NWAa Intensificationof arctic front
Anticyclogenesis developsto north and west from theAltai dry and cold weather
No Northwesterly air masstransferring over WSand eastern Kazakhstan
Anticyclones develop-ing over the Altai
NWAb There are pressurespaces to the east andnortheast from the Altaicloudy and windy weatherover the eastern Altai
Insignificant at theeastern Altai
Northwesternanticyclones(NWC)
Arctic air masses aretransferred in rear ofcyclones intensifyingduring their passage overthe mountains duringspring and summer
Intensive especiallyin mountains (NorthAtlanticndashArctic)
Upper trough over NSand wedge overEurope
Transferring NWCs overWS
Southwesternanticyclones(SWA)
SWAa Front part ofupper troughis located overAltai andsoutheast ofWSSouthwesternheat advection
Southwesterly air masstransfers over WS andanticyclones becomestationary over the Altai
No Deep trough with axislocated from UralYamal to CaspianAral
Cyclonic fields overcentral Kazakhstansoutheast WS
SWAb No Heat advectionfrom south cloudyweather possiblemoderate droughtswith humidity lt 40
Flat pressure troughover Europe and flatwedge over WS withaxis from the Altai toLaptev Sea
Anticyclonic fields overthe Altai Kazakhstansouth WS
Southwesternanticyclones(SWC)
SWC intrusions fromCaspian Aral Black Seasto southeast of WS andthe Altai Overcastweather with possiblethunderstorms
May be intensive(Caspian AralBlack seas)
Trough with axislocated from mouthof Obrsquo river tosouthwest of WS
Ultra-polarintrusion (UP)
Arctic air from Kara Sea and Taimir istransferred in rear of NWCs as anticyclones
Intensive before coldsnap in warm season(Arctic)
Meridional isohypsewedge over northernseas high cycloneover Yakutia troughover southern WSand Kazakhstannortheasterly windsover WS
Westerly andnorthwesterly windsover the Altai
Stationarycyclone (StCyc)
Development of high thermobaric fieldcauses formation of quasi-stationarycyclone Location of Arctic front outsidecyclone causes stationary cyclone Passingof the secondary fronts cause developmentof thunderstorms (in summer) overcast andcloudy weather
Intensive summercloudburst andsnowfalls (easterneg Pacific or localconvective)
StCyc developing inthe right throughthermobaric field
Isolation of cold airmasses over southeastregions of WS
MS received 8 March 2004 and accepted in revised form 30 August 2005
Aizen and others Stable-isotope time series and precipitation origin654
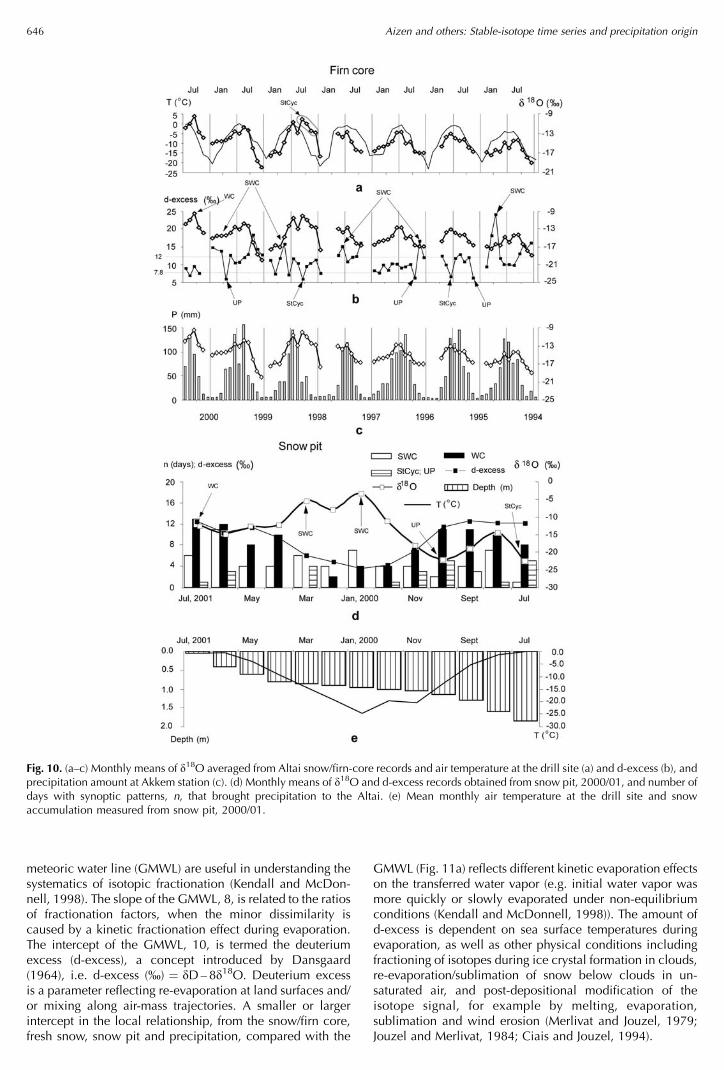
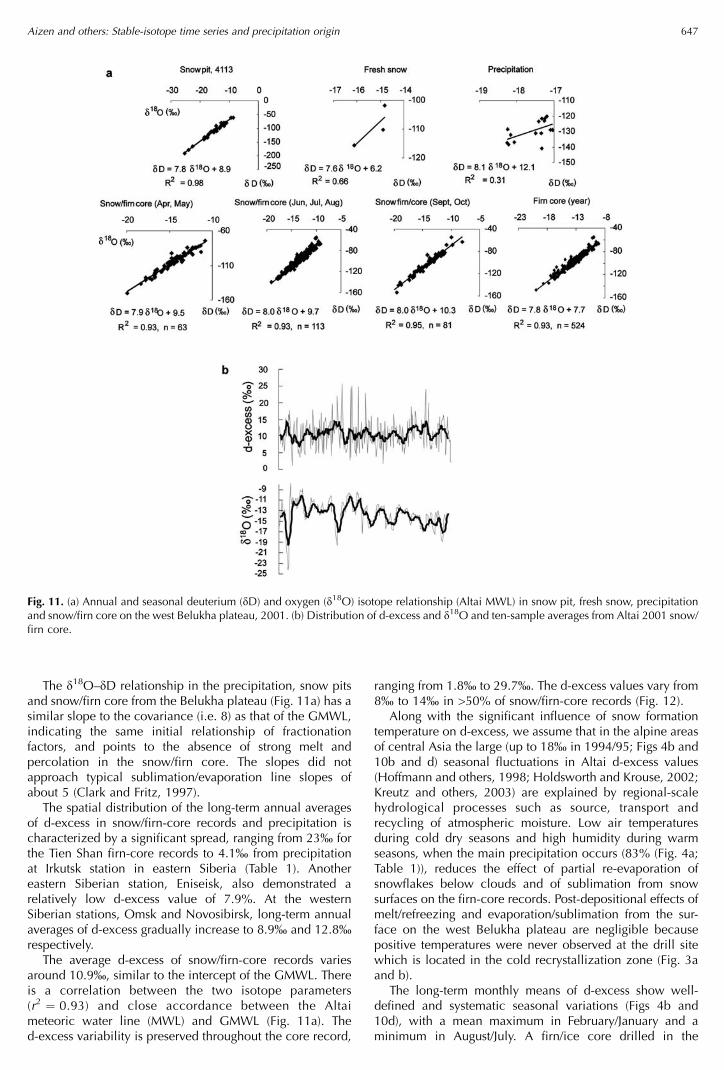
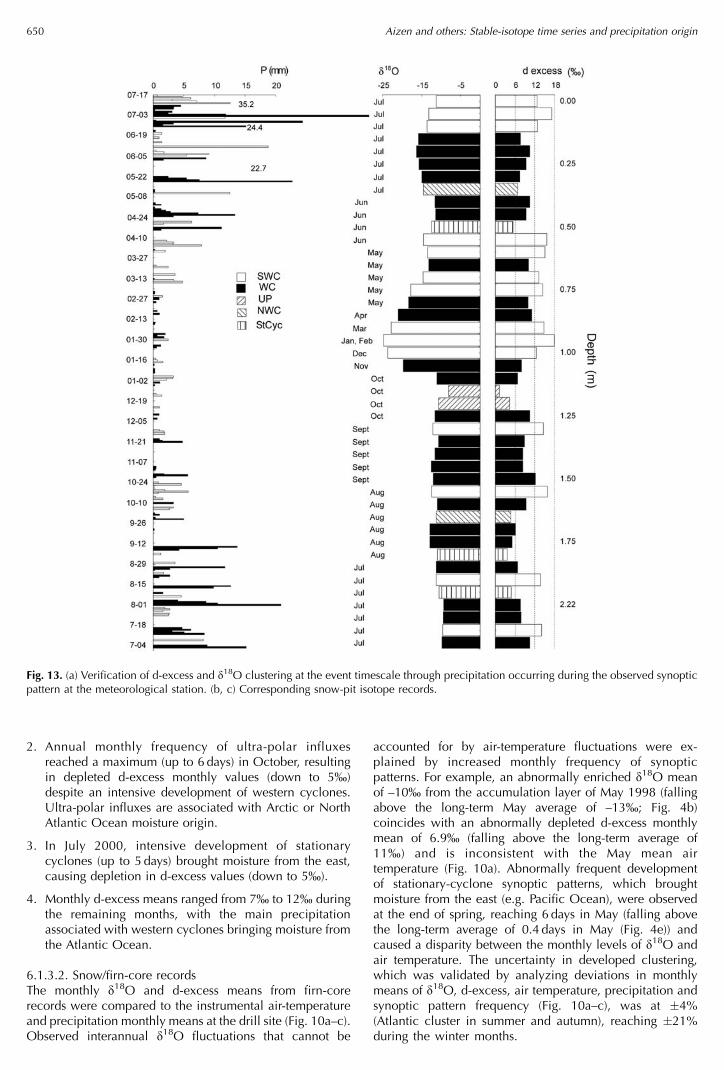