Snow!. Snowball Snowman Snow fort One piece of snow: Snowflake.

Stable-isotope and trace element time series from Fedchenkoglacier (Pamirs) snow/firn cores
Vladimir B. AIZEN,1 Paul A. MAYEWSKI,2 Elena M. AIZEN,1 Daniel R. JOSWIAK,1
Arzhan B. SURAZAKOV,1 Susan KASPARI,2 Bijorn GRIGHOLM,2 Michael KRACHLER,3
Mike HANDLEY,2 Alexander FINAEV4
1College of Science, University of Idaho, PO Box 443025, Moscow, Idaho 83844, USAE-mail: [email protected]
2Climate Change Institute, University of Maine, 133 Sawyer Environmental Research Center, Orono, Maine 04469, USA3Institute of Environmental Geochemistry, University of Heidelberg, Im Neuenheimer Feld 236, D-69120 Heidelberg,
Germany4Institute of Water Problems, Hydroenergy and Ecology, Academy of Sciences of Tajikistan, Dushanbe, Tajikistan
ABSTRACT. In summer 2005, two pilot snow/firn cores were obtained at 5365 and 5206ma.s.l. onFedchenko glacier, Pamirs, Tajikistan, the world’s longest and deepest alpine glacier. The well-definedseasonal layering appearing in stable-isotope and trace element distribution identified the physical linkscontrolling the climate and aerosol concentration signals. Air temperature and humidity/precipitationwere the primary determinants of stable-isotope ratios. Most precipitation over the Pamirs originated inthe Atlantic. In summer, water vapor was re-evaporated from semi-arid regions in central Eurasia. Thesemi-arid regions contribute to non-soluble aerosol loading in snow accumulated on Fedchenko glacier.In the Pamir core, concentrations of rare earth elements, major and other elements were less than thosein the Tien Shan but greater than those in Antarctica, Greenland, the Alps and the Altai. The content ofheavy metals in the Fedchenko cores is 2–14 times lower than in the Altai glaciers. Loess from Afghan–Tajik deposits is the predominant lithogenic material transported to the Pamirs. Trace elements generallyshowed that aerosol concentration tended to increase on the windward slopes during dust storms buttended to decrease with altitude under clear conditions. The trace element profile documented one ofthe most severe droughts in the 20th century.
‘There is no culture without glaciers. Without the mountainranges where the snow is accumulated over winter andeventually packed to become ice, the flat lands would bedesert lands’
W. Rickmer Rickmers (1929); after hisexpedition to the Pamirs with R. Finsterwalder
INTRODUCTIONHigh-resolution ice-core records from alpine glaciers provideproxy records for natural and anthropogenic changes inclimate and in the environment during intervals of up tothousands of years. Despite apparent extensive spatial cover-age of ice-core records in Asia (e.g. from the Himalaya, Tibet,the Tien Shan and the Altai (Central Asian Deep Ice-CoringProject; data: http://www/sci.uidaho.edu/cae/projects/cadip/index.html)), there remains a great need to obtain recordsfrom poorly documented parts of the Asian mountain system.One such region, the Pamir mountains, is one of the keyregions for studying atmospheric circulation dynamics andchanges in terrestrial systems at mid- to low latitudes. Thehigh-elevation snowfields of the Pamirs contain robustrecords documenting moisture advection into central Asiafrom the Atlantic and Arctic, dynamics of the westerly jetstream, the Siberian High and Asian monsoon, and naturaland anthropogenic environmental change over central Asia.Little information about past climate has been obtained fromthe Pamirs (Shackleton and others, 1995; Dodonov andothers, 1999; Li and others, 2006) or from central Asia. This,despite the fact that Asia has a long history of diverse
civilizations and a high potential for dramatic human impactin the near future, related to demands for land use, water andgeneral social development.
The Pamirs are near the second largest loess-soil depositin the world, which is in southwest Tajikistan and northwestAfghanistan, while the largest deposit is in northwest China.Given the abundance of atmospheric aerosols in northcentral Asia, glaciochemical time-series data may provideinsight into terrestrial/marine sources, the spatio-temporalextent of central Asian dust outbreaks and their potentialimpacts on climate. Concentrations of major elements andrare elements in snow and ice can be used to infer thelocation of sources of aerosols.
A team from the University of Idaho (UI) and the ClimateChange Institute at the University of Maine (CCI UM)conducted reconnaissance on Fedchenko glacier during thesummer of 2005. The primary purpose of our study was toidentify and calibrate the physical links controlling themodern climate and atmospheric aerosol concentrationsignals preserved in the cores and to determine thelocation of a prospective deep drilling site from which torecover long-term paleoclimatic records potentially to1000m depth.
STUDY REGIONFedchenko glacier (Fig. 1) is one of the largest alpine dendriteglaciers in the mid–subtropical latitudes of the NorthernHemisphere (388150 N, 728150 E). It has a total area of649 km2, a length of 77 km, an elevation of 2900–
Journal of Glaciology, Vol. 55, No. 190, 2009 275

6300ma.s.l., and an equilibrium-line altitude at 4700ma.s.l.(Dolgushin and Osipova, 1989). According to seismic andgravitational surveys conducted during the InternationalGeophysical Year (1957/58) (Berzon and others, 1962), thethickness of the glacier varies from 250m at the glaciertongue to 800m in the middle part of the glacier at4000ma.s.l. At 5000ma.s.l., the thickness reaches 1000m,offering a unique opportunity to recover the deepest ice coresoutside of the polar regions.
The Asian interior is a dynamically complex region, andassessing the main atmospheric circulation patterns overwestern central Asia is a challenging problem. The mainmoisture to the region comes with the westerlies, south-western cyclones and sometimes with Indian monsoons.Unlike precipitation in the Himalaya, Tibet, the central andeastern Tien Shan, or the Altai, precipitation in the Pamirs isgreatest during the winter and spring (Fig. 2), because of therelieved impact of the Siberian/Tibetan high-pressure sys-tems during winter. Summer and autumn are dry seasonsover southwestern central Asia. Seasonal distribution ofrelative humidity is inversely related to air temperature,more typical for the subtropical (tropical) areas where theabsolute humidity is not a strong function of air temperaturebut rather of vertical convection. Although rare, in June andJuly the Indian monsoons may reach the Pamirs as, typically,individual 2–3 day intrusions with heavy precipitation at thesouthern and eastern border, and they probably can reachthe central Pamirs (Zabirov, 1955; Agahanyanc, 1965;Arushev and others, 1976; Demchenko and others, 1985).
The trace of the Indian monsoon over the Pamirs and itsimpact on the central Pamirs is still questionable.
The main synoptic processes over central Asia wereidentified based on the 14 types of macro-synoptic processesdeveloped in central Asia (Bugaev and others, 1957;Subbotina 1995). This classification was based on theprobability of different synoptic conditions tracking themain troposphere airflows (e.g. cyclonic and anticyclonicflows at the surface and at 500mbar). The classification wasdescribed by Il’inova and others (1965), Barry and Perry(1973) and Aizen and others (2004).
In southwestern central Asia, steady high air temperaturesand dust storms are a common synoptic process during thewarm season. Pamir glaciers are contaminated by dustprimarily during the development of thermal depressions(Fig. 3). At the same time, in Tibet, the Himalaya and theTien Shan, extensive summer precipitation washes aerosolsout of the atmosphere.
FIRN-/ICE-CORE SAMPLING, PROCESSING ANDANALYSESThe absence of snow redistribution by avalanches in thelarge (10 km�5 km), high-elevation accumulation area ofFedchenko glacier (Fig. 4) provides a favorable environmentfor the accumulation of undisturbed, horizontal layers ofsnow. The drilling sites therefore provide a suitable locationfor the recovery of ice cores and subsequent development ofpaleoclimatic records. The upper accumulation zone of the
Fig. 1. Location map of Fedchenko glacier, Pamir mountains, central Asia.
Aizen and others: Stable-isotope and trace element time series from Fedchenko glacier276

glacier is characterized by a gently sloping surface (0–18inclination) with no specific local conditions (e.g. depres-sion or saddle location). The Fedchenko glacier accumu-lation area is located at the cold recrystallization zone,where the glacier ice is frozen to the underlying bedrock andglacier velocity is minimal. The glacier ice surface velocitymeasured between two global positioning system (GPS)surveys in 2005 and 2006 was 1ma–1 at the proposed deepdrilling site at 5206ma.s.l.
During 2005 fieldwork on Fedchenko glacier, snow-pitsamples were collected and two shallow snow/firn cores of12.6 and 9.0m depth and of 7.5 cm diameter were drilledwith a ‘Mini-Felix’ Swiss solar-powered electromechanicaldrill. The lower drilling site at 5206ma.s.l. was placed onthe leeward slope, while the higher site at 5365ma.s.l. wasset on the windward slope of the vast accumulation area.
Snow samples were collected every 5–10 cm from two2m snow pits dug near the drilling sites. The stratigraphy ofthe snow pits was described in the field (Fig. 5). From
stratigraphic analysis of the snow pits and firn cores, wefound no sign of water percolation. The ice temperaturemeasured at 9m depth and at 5206ma.s.l. was –88C.Summer daytime air temperatures did not exceed –28C.Winter air temperatures fell to –388C at 5420ma.s.l.,measured by an automatic weather station (AWS) from2 August 2005 until 18 February 2006 (Fig. 2b).
Snow samples and firn/ice cores were processed in thebase camp (5210ma.s.l.) for further chemical analyses. Eachcore section was scraped (10mm), such that all surface andsubsurface contamination from the drilling process wasremoved. The inner 5 cm diameter cleaned core sectionswere then cut at 5–12 cm length intervals and were split intothree 4mL Nalgene bottles. The diameter, length and weightof each recovered core section were measured to convertthe original snow depths to water equivalent. Snow-pitsamples and core sections were packed into insulatedshipping containers for transportation. The processed sam-ples were distributed to UI for stable-isotope analyses (d18O
Fig. 2. (a) Monthly distribution of air temperature T, precipitation P and relative humidity h at Fedchenko station (4169ma.s.l.). (b, c) Hourlyair temperature (b) and relative humidity (c) measured at Fedchenko glacier by AWS (5420ma.s.l.). Date format is month/day/year.
Aizen and others: Stable-isotope and trace element time series from Fedchenko glacier 277

and dD) and to dedicated laboratories at CCI UM and theUniversity of Heidelberg (UH) for analyses of rare earthelements (REE) and other trace elements.
Oxygen isotope ratios were measured using a standardCO2 equilibration technique (Craig, 1957). Hydrogen isotoperatios were measured using Cr reduction in a continuous flowsystem (Morrison and others, 2001). Data are reported instandard delta (d) notation vs Standard Mean Ocean Water(SMOW). The analytical precision for measurements of oxy-gen and deuterium isotope ratios was �0.05% and �0.5%respectively. Analytic uncertainty in d-excess was 0.52%.
An inductively coupled plasma mass spectrometer (ICP-MS) (Element II ICP-SFMS, Finnigan, Bremen, Germany) atCCI UM was used for the analysis of REE (La, Ce, Pr, Nd, Sm,Eu, Gd, Tb, Dy, Ho, Er, Tm, Yb, Lu), heavy metals (As, Sr, Cd,Sb, Cs, Ba, Tl, Pb, Bi, U) and other elements (Al, S, Ca, Ti,V,Cr, Mn, Fe, Co) (Table 1). The ICP-SFMS generated very high-resolution data (�0.5 cm), allowing identification of seasonalsignals. Trace metal concentrations from the firn cores wereobtained at parts per thousand (ppt) levels. Since theinstrument detection limit is defined as three times thestandard deviation of ten acidified (1% optima HNO3)deionized water samples, the limit varies based on theelement analyzed. For a full description of individualinstrumental element detection limits, reproducibility basedon parallel ice-core section analysis, and results of icedecontamination see Osterberg and others (2006). Theblanks data were used to calculate the method detectionlimits (3�) listed in the Appendix (Table 5). An Apex sampleintroduction system with a 100 mLmin–1 uptake was used totake into account spectral interface. The Apex is a desolvatingnebulizer similar to that used by Gabrielli and others (2006).
Samples from two pilot Fedchenko snow/firn cores andsnow pits were also analyzed by ICP-MS for concentrationsof major and other elements and heavy metals (i.e. As, Rb,Sr, Mo, Ag, Cd, Sb, Ba, Tl, Pb, Bi, U, Na, Mg, Al, Ca, Sc, V,Cr, Mn, Fe, Co, Cu, Zn) at UH. Original samples wereanalyzed after acidification with high-purity nitric acid to1% with double sub-boiled HNO3.
Fig. 4. Map of the drilling sites on Fedchenko glacier, summer 2005: (1) 5206ma.s.l.; (2) 5365ma.s.l.
Fig. 3. The main synoptic processes observed during dust-stormdevelopment in central Asia: (a) warm half-year; (b) cold half-year.Numbers indicate the synoptic processes as follows, where thepercentage frequency of processes is in parentheses, the numeratorcorresponding to warm, and the denominator to cold half-years: 1.western cold intrusion (16/14); 2. northwestern cold intrusion (13/9); 3. northern cold intrusion (9/4); 4. south Caspian cyclone (3/11);5. Murgab cyclone (0/31); 6. periphery of anticyclones (26/31); 7.thermal depression (5/0).
Aizen and others: Stable-isotope and trace element time series from Fedchenko glacier278

To test accuracy, the riverine water reference materialSLRS-4 from the National Research Council Canada wasanalyzed at CCI UM and at UH. The same check standardwould exclude any calibration problems. The SLRS-4 is onlycertified for the elements listed in Table 5, so the quality-control data (QC standards) cover all the elements that wererunning. QC samples and the SLRS-4 were run for each run,and every 10–15 samples throughout the run to check fordrift or other problems. The SLRS-4 is run for accuracy; theQC standard for reproducibility and for calculating overallprecision. The results of the calibration through the samecheck standard were in accordance with the certified values.
Measurement results for concentrations of heavy metals,REEs, major and other (<1 wt.%) elements were similar fromboth the UH and CCI UM laboratories (Table 2). Comparisonof measurements from UH with those from CCI UM showshigh correlations (0.70–0.90) and slope close to 1 for all themajor dust elements. For calcium, the correlation wasslightly lower and with a maximum number of outliers. Thiscould be associated with the distribution of evaporitemineral particles, which showed more variability in thecores than other mineral dust particles (personal commu-nication from E. Osterberg, 2008. Results from the twolaboratories for the non-evaporite elements (Al, Fe, Mn, Cr,Co, etc.) generally match well but diverge at concentrationpeaks. This probably reflects an uneven distribution ofparticles in the samples. The low-concentration valuesmatch almost perfectly, while the peaks sometimes havedifferent values. The variation in slope around 1, i.e. from0.8 to 1.2, indicates an absence of systematic calibrationerrors between the CCI UM and UH data.
Adjustments were made by omitting a record from theanalysis when the discrepancy between concentrations fromthe two laboratories exceeded the average element standarddeviation.
For the climatic analysis, we used meteorological datafrom the Fedchenko meteorological station established in1932 on a rocky ledge at the center of Fedchenko glacier at4169ma.s.l. and an AWS installed at 5420ma.s.l. near(within 2 km of) the drill site at 5365ma.s.l. (Fig. 6).
RESULTSAnnual accumulation rateNo significant post-depositional effects were apparent in theoxygen/hydrogen records from the firn core. The amplitudeof the signal near the bottom of the core was similar to thatobserved near the surface (Fig. 7). To determine annual snowaccumulation layers, we used stable-isotope records andselected geochemical records with existing, well-preserved,seasonal signals (Figs 7 and 14). Identification of annualaccumulation layers in the snow/firn core was based on theextreme values of d18O and dD because minimum winterand maximum summer air temperatures are a distinctivecharacteristic of the Pamir meteorological regime (Fig. 2a).Distribution of selected major elements and REE presentswell-defined seasonal signals that respond to specificseasonal precipitation distribution in the Pamirs. Concen-tration maxima with distinguishing REE and major-elementpeaks are related to dry summer seasons. Background valuesin geochemical records are related to winter and autumnseasons (Figs 7 and 14).
Fig. 5. (a, b) The snow-/firn-core density and snow accumulation in snow water equivalent (SWE) from the two core sites: 5206ma.s.l. (a)and 5365ma.s.l. (b). (c) Stratigraphic profile within the snow pit (5365ma.s.l.): 1. new and fine-grained snow (1–2mm); 2. medium-grainedsnow (2–3mm ); 3. medium- to coarse-grained snow (>3mm); 4. ice crusts.
Aizen and others: Stable-isotope and trace element time series from Fedchenko glacier 279

Table 1. Concentrations of rare earth elements, heavy metals and other elements in snow-/firn-core samples (5365ma.s.l.) collected in 2005from the Pamirs and in samples from other compared regions. ‘High’ is mean concentration among samples with dust records >2�; ‘Mid’ ismean concentration among samples with records 2� � concentration > �; ‘Low’ is mean concentration among samples with records � �.Max, Min and Ave are absolute maximum, absolute minimum and average concentration
La Ce Pr Nd Sm Eu Gd Tb Dy Ho Er Tm Yb Lu
pg g–1 pg g–1 pg g–1 pg g–1 pg g–1 pg g–1 pg g–1 pg g–1 pg g–1 pg g–1 pg g–1 pg g–1 pg g–1 pg g–1
Pamirs, Fedchenko Ave 90 186 22 90 20 5 6 2.9 15.8 2.9 7.3 1 6.2 0.8Mid 198 465 53 152 49 12 14 8 39 7 18 2 15 2
Tien Shan (a)1 Mid 536 1350 142 479 88 21 73 11 63 11 29 26 4Altai (l)2 Ave 15 31 3 14 2 1 3 0 2 0 1 0 1 0
Pamirs, Fedchenko Max 1124 2361 273 1119 244 54.9 70 34.7 189 33.6 86.9 11.6 72.6 9.4High 517 1144 136 555 125 31 36 19 102 19 48 6 38 5
Tien Shan (a) High 2309 5813 624 2066 373 92 309 45 251 45 118 108 15Altai (l) Max 143 309 34 135 27 7 27 4 19 3 9 1 7 1
Pamirs, Fedchenko Min 1 3 0 1 0.35 0.08 0.07 0.06 0.24 0.05 0.12 0.02 0.13 0.02Low 41 87 10 32 9.10 2.07 2.89 1.32 6.75 1.25 3.15 0.44 2.67 0.35
Tien Shan (a) Low 229 586 61 203 38 9 32 5 27 5 12 11 2Altai (l) Min 1.0 0 0 1.0 0 0 1.0 0 0 0 0 0 0 0
Greenland (b)5 45.1 99.6 7.5 26.0 4.7 1.0 4.6 0.6 3.2 0.7 1.8 0.7 1.8 0.2Antarctica (c)6 0.9 1.7 0.2Antarctica (d)7 73.4 167.5 51.9 7.2 2.1 1.2
Al S Ca Ti V Cr Mn Fe Co As Sr Cd Sb Cs Ba Tl Pb Bi U
ng g–1 ng g–1 ng g–1 pg g–1 pg g–1 pg g–1 pg g–1 ng g–1 pg g–1 pg g–1 pg g–1 pg g–1 pg g–1 pg g–1 pg g–1 pg g–1 pg g–1 pg g–1 pg g–1
Pamirs, Fedchenko Ave 46 60 262 1402 137 146 4199 48 60 119 951 12 11 12 817 2 461 3 7.4Mid 100 132 810 3356 345 301 10 599 121 146 254 1814 56 29 25 1958 3.1 1004 7 12.5
Abramova (h)4 Ave 50Tien Shan (a) Mid 1007 246 5192 485Altai (l) Ave 12 80 1820 5.8 10 340 2120 210 1200 1470European Alps (g, j)8 Mid 31East European Alps(j)8
Mid 11
Pamirs, Fedchenko Max 424 750 3171 15171 1735 1455 55 965 478 672 1045 11550 375 115 113 8790 15 4543 27 57High 260 544 2031 10628 892 750 25 419 343 370 671 5279 184 79 70 5212 8.1 2682 18 33
Tien Shan (a) High 5478 264 33398 2306Altai (l) Max 147 350 5530 50 100 1900 11810 3830 3450 7360Altai (e)3 Max 5900 100 5400 3000 5Alps (g, j) Max 16 000 6300 3100 38East Alps (j) Max 6200 38Mont Blanc (j)8 Max 109Greenland (g, i) Max 236 4.4 90Arctic (k)8 Max 108Antarctica (f)8 Max 20 6.1 10 0.21
Pamirs, Fedchenko Min 2 4 3 95 9 12 81 3 5 8 27 1 1 1 29 0 26 0 2 0.3Low 24 39 140 644 73 72 1820 22 28 64 497 7 7 6 418 1.2 183 3.5
Tien Shan (a) Low 421 221 2896 224Altai (l) Min 1.5 30 300 1 10 60 65 53 79 108Altai (e) Min 1800 20 810 480 2Alps (g, j) Min 95 365 65 0.7East Alps (j) Min 1.7 0.7Mont Blanc (j) Min 0.2Greenland (g, i) Min 21 0.2 14Arctic Min 0.5Antarctica (f) Min 0.6 5 0.3 0.01
Sources: (a) Kreutz and Sholkovitz (2000); (b) Svensson and others (2000); (c) Ikegawa and others (1999); (d) Grousset and others (1992); (e) Nikolaeva andothers (2003); (f) Planchon and others (2001); (g) Shotyk and others (2005); (h) Hinkley (1997); (i) Barbante and others (2003); (j) Barbante and others (1999); (k)Krachler and others (2004); (l) central Asian database.1Tien Shan ice core, Inilchek glacier, 1992–98. 2Altai, Belucha glacier, 1965–2001. 3Altai, Belucha glacier, layer at end of 60th. 4Alai–Pamir range,snow sample middle/end of 90th. 5Greenland 12 samples, ice core, for Younger Dryas, Bølling, Last Glacial Maximum and glacial periods back to44 kyr BP. 6Antarctica, Mizuho, surface snow samples for 1991–93. 7Antarctica, Dome, ice-core dust for 18 kyr BP. 8Fresh modern snow and old ice-coresamples.
Aizen and others: Stable-isotope and trace element time series from Fedchenko glacier280

Snow and firn–ice densities (Fig. 5a) were used to establishprofiles of cumulative depth and accumulation water equiva-lent. On average from 2002 to 2005, the mean annualaccumulation rate, calculated at drill site 1 (5365ma.s.l.),was 2090mmw.e. At drill site 2 (5206ma.s.l.), averageaccumulation was 1380mmw.e. for the same period. The9.14m core from 5206m a.s.l. revealed more annualaccumulation layers than the 12.58m core from 5365ma.s.l.Considering that both sites were located within the samelarge accumulation area, about 5 km from each other (Fig. 4),we assumed that the rate of snow accumulation was verysimilar to the amount of precipitation deposited at the drillingsites. The upper drilling site, on the windward slope of theadjusted valley, has a higher precipitation rate than the lowdrilling site, which is located in the precipitation shadow onthe leeward slope, 5 km east of the upper site. Therefore thedifference in accumulation between these two sites (5206–5365ma.s.l.) was significant, with accumulation/altitudegradient averaging �4.6mmm–1. This difference is similar tothe altitudinal distribution of snow water equivalent at highelevations of marine alpine regions of the northwestern Alpsand southeastern Tibet (4.0mmm–1), and southwesternScandinavian mountains (up to 5.5mmm–1) (Loktionova-Aizen, 1995; Aizen and Aizen, 1997).
Stable isotopes in snow pits and firn cores
Means and amplitudesConcentrations of stable isotopes in glacial cores aredetermined by air temperature, relative humidity, precipi-tation, and the trajectory of air masses from their sourceregions. In the Pamirs, the majority (68%) of precipitationoccurs during the cold season (November–April; Fig. 2a).This leads to mean isotope ratios that are lower in the Pamirs(i.e. d18O5365 ¼ �17:2% and d18O5206 ¼ �17:6%) than inthe Tien Shan (–16.3%) or the Altai (–13.6%) (Aizen andothers, 2004, 2005) despite lower air temperatures duringthe corresponding periods (Table 3). For example, at theAltai drill site in Siberia, 24% of the precipitation occursduring the cold season when the mean minimum d18O is–16%. This results in a 2.4% decrease in the annual meand18O. In the Pamirs, 68% of the precipitation occurs in thecold season, coinciding with the mean minimum d18O value
of –23% and resulting in a 5.8% decrease in the annualmean d18O. About 40% of the firn-core records fromFedchenko glacier (5365ma.s.l.) exhibit d18O values below–20%, whereas �2% of the Altai’s firn/snow core comprisesrecords below –20% (Fig. 8).
Fig. 6. (a) Fedchenko meteorological station and (b) AWS.
Table 2. Across-laboratory correlation of processes for analyses of heavy metals, major and other trace elements. Ave and Ave0 are averageconcentration of elements from the Pamir pilot snow/firn cores processed in laboratories of the CCI UM and UH respectively, r is thecorrelation coefficient, a is the slope of the linear relationship between concentrations processed in the two laboratories, and no is thenumber of outliers in samples where the discrepancy exceeded mean standard deviation of the concentration differences for an element
Altitude Al Ca V Cr Mn Fe Co As Sr Cd Sb Ba Tl Pb Bi U
ma.s.l. pg g–1 pg g–1 pg g–1 pg g–1 pg g–1 pg g–1 pg g–1 pg g–1 pg g–1 pg g–1 pg g–1 pg g–1 pg g–1 pg g–1 pg g–1 pg g–1
5206 Ave 47 103 159 103 127 142 3892 48 103 66 123 605 51 12 1070 2 463 3.1 7Ave0 55 103 157 103 116 156 3180 56 103 47 68 598 35 8 934 2 425 2.3 6r 0.97 0.63 0.96 0.77 0.88 0.97 0.93 0.9 0.70 0.91 0.84 0.92 0.88 0.89 0.93 0.92a 1.2 0.8 1.0 1.0 0.9 1.1 0.8 0.5 0.9 0.9 0.7 0.9 0.95 0.9 0.8 0.8no 2 6 1 3 3 2 1 2 3 0 3 2 1 2 2 0
5365 Ave 46 103 262 103 137 146 4199 48103 60 119 951 12 11 817 2.2 460 2.9 7.0Ave0 50 103 289 103 115 144 3319 50103 44 85 999 7 7 806 1.8 421 2.4 5.9r 0.95 0.87 0.96 0.83 0.95 0.94 0.96 0.94 0.92 0.92 0.89 0.94 0.94 0.96 0.88 0.93a 1.07 1.09 0.9 0.83 0.7 1.0 0.7 0.8 1.1 0.7 0.6 0.97 0.9 0.8 0.8 0.8no 0 2 1 2 3 0 2 1 3 4 5 2 1 1 3 1
Aizen and others: Stable-isotope and trace element time series from Fedchenko glacier 281

The difference between the maximum and minimummonthly air temperatures at the Pamir meteorological stationis large (�T ¼ 218C). This difference is reflected in the largerange (22.9%) in d18O ratios (Table 3).
Spatial distribution of isotope ratio from twoFedchenko pilot snow/firn coresThe two Fedchenko glacier snow/firn cores exhibit similarmean isotope ratios, but different minimum and maximumvalues (Fig. 7). Minimum isotope concentrations were lowerat high altitude (5365m a.s.l.) than at low altitude(5206ma.s.l.). This reflects a decrease in air temperaturewith increasing altitude and an increase in precipitation with
increasing altitude during cold seasons. More enrichedvalues of isotopes related to warm seasons were found in thehigh- than in the low-altitude core. The inverse distributionof isotope concentration probably reflects an inverse distri-bution of air temperatures during the warm season. Thehigher maximum air temperature at higher altitudes iscaused by increasing night condensation processes withincreased altitudes, through the heating of the atmosphere asa result of energy released during the condensation process.High values of relative humidity, up to 100%, were recordedby AWS at 5420ma.s.l. mainly during night-time in August(Fig. 2c). The air humidity close to saturation confirmsintensive condensation processes at high altitudes.
Fig. 7. Fedchenko isotopic composition, d18O and d-excess (bold curve is 5 years smoothed): REE, heavy metal, major elements and traceelements in snow/firn cores at 5365 and 5206ma.s.l.
Table 3. Means and seasonal amplitudes of d18O and d-excess, and correlation between d18O and d-excess, r, from the central Asian snow/firn cores. T is long-term mean annual air temperature for the quoted periods, corresponding to the ice-core records at nearby stations
Pamirs Tien Shana Altaib
Glacier, altitude (ma.s.l.) Fedchenko, 5365 Fedchenko, 5206 Inilchek, 5200 Belukha, 4150Period of ice-core records 2005–02 2005–01 1998–92 2001–1965d18O mean (%) –17.2 –17.5 –16.35 –13.6Amplitude of d18O (%) 22.9 16.8 25 24.5d-excess mean (%) 18.1 16.9 22.69 10.7Amplitude of d-excess (%) 25.8 28.4 39 16.6r(d18O –d-excess) 0.71 0.30 –0.85 -0.39
Station, altitude (ma.s.l.) Fedchenko, 4169 Tien Shan, 3614 Akkem, 2045Periods of averaging air temperatures 2005–02 2005–01 1995–65 1995–92 1998–92 2005–02 2001–1965 2005–02T (8C) at station no data no data –6.9 –7.1 –7.5 –6.1 –3.8 –2.2
aAizen and others (2004); bAizen and others (2005).
Aizen and others: Stable-isotope and trace element time series from Fedchenko glacier282

Relationship between stable hydrogen-isotope andoxygen-isotope ratiosThe d18O/dD relationships in the Fedchenko snow/firn cores(Fig. 9) have similar slopes (8.5 at the higher site, 8.3 at thelower site) to that of the oxygen/hydrogen covariance for theglobal meteoric water-line (GMWL; 8.0). Of the threecentral Asian mountain ranges, the Pamir (Fedchenkoglacier) d18O/dD slope value is closest to that of the GMWL(Fig. 9). This suggests that the relationship between fraction-ation factors in the Pamir pilot cores most resembles that ofthe GMWL, explaining the absence of strong melt andpercolation in the Fedchenko snow/firn cores.
Deuterium excessThe deuterium excess (d-excess) is a parameter reflectingnon-equilibrium fractionation during initial evaporationfrom the ocean, re-evaporation at land surfaces and/ormixing along air-mass trajectories (Merlivat and Jouzel,1979; Jouzel and Merlivat, 1984). A smaller or largerintercept than the GMWL intercept (10) in the local d18O/dDrelationships from the snow/firn core, snow pits andprecipitation reflects different kinetic evaporation effectson the transferred water vapor. For example, initial watervapor may be evaporated quickly or slowly under non-equilibrium conditions (Kendall and McDonnell, 1998). Thelong-term mean d-excess value (18.1%) and seasonalamplitude (25.8%) in the Pamir snow-/firn-core records(Table 3) are intermediate between the values for the TienShan (22.7% and 39% respectively) and Altai (10.7% and16.6% respectively). That is, water vapor contributing to
precipitation in the Pamirs probably evaporates more (less)slowly or is less (more) often re-evaporated than water vaporcontributing to precipitation in the Tien Shan (Altai).
Seasonal deuterium-excess variationThe Pamir snow/firn cores differ from the Tien Shan and Altaicores (Fig. 7) in that the maximum d-excess values, occurringin summer, and minimum values, occurring in winter, relateto seasonal d18O and air-temperature variations, andinversely to relative air humidity. Snow/firn cores drilled inInilchek glacier, Tien Shan, and in west Belukha glacier,Siberian Altai, exhibit inverted seasonal d-excess and d18Ovariability (Aizen and others, 2004, 2005). Low precipitationand air humidity from June to September in the Pamirs causeintensive summer evaporation over plains and at lowaltitudes of the ablation zone (Lebedeva, 1976) on the Pamirglaciers (e.g. at 4169ma.s.l.; Figs 2a and 10). This suggestsenhanced continental water recycling, i.e. the return of landsurface evaporation water to the glacier surface as precipi-tation. The western and northwestern cold intrusions (Fig. 3)transfer and recycle moisture originated over eastern Europe,northern Africa, the eastern Mediterranean and the Black,Caspian and Aral Seas during warm seasons (Bugaev andothers, 1957; Barry and Perry, 1973; Kuznezova 1978, 1983;Rodionov, 1994; Subbotina, 1995; Meleshko and others1998; Arpe and others, 2000; Kreutz and others, 2003; Aizenand others, 2004, 2005; Kurita and others, 2004; Elguindiand Giorgi, 2006).
However, at high altitudes of the accumulation zonewhere the snow/firn cores were drilled (e.g. at 5420ma.s.l.),the condensation process intensifies; air humidity reachessaturation (Fig. 2c) and the condensation significantlydominates the evaporation that leads to increases in thesummer d-excess records (Fig. 7), similar to processesobserved in Antarctica (Kendall and McDonnell, 1998).
Low air humidity and high air temperature and d-excessvalues in summer at the Fedchenko glacier station (Fig. 2)correspond to the seasonal variation of d-excess in precipi-tation estimated from the long-term values at the stationslocated between 308N and 408N (Froehlich and others,2002). The low relative humidity and accordingly highd-excess in summer indicates the prevailing influence ofrelative humidity over air temperature in seasonal distri-bution of the d-excess.
Seasonal fluctuations of the d18O and d-excess relation-ship may provide insights into variability in the pattern ofmesoscale atmospheric circulation. During winter/earlyspring, when precipitation is greatest, d-excess values forthe Pamir snow/firn core range from 8% to 14% (Fig. 7).These values are similar to those for the GMWL. Western,
Fig. 8. (a) Absolute (f) and (b) integrated (�f) probable distribution ofd18O records in different central Asian ice/firn cores. Periods of ice-core records are presented in Table 3.
Fig. 9. Relationship between deuterium (dD) and oxygen (d18O) isotope ratios for snow/firn cores from (a) the Pamirs (5365 and5206ma.s.l.), (b) the Altai (4150ma.s.l.) and (c) the Tien Shan (5200ma.s.l.). Periods of ice-core records are presented in Table 3.
Aizen and others: Stable-isotope and trace element time series from Fedchenko glacier 283

northwestern and northern air masses bring precipitation tothe Pamirs that clearly originated over the Atlantic Oceanwithout further modified recycling. During the summer/autumn seasons, d-excess increases by up to 28.5% (Fig. 7).This reflects complex sources of precipitation (Bugaev andothers, 1957; Kuznetsova, 1978, 1983; Subbotina, 1995)such as air masses originating over warm oceanic waters(South Atlantic and Indian Oceans) or warm southernCaspian Sea waters combined with the modification of airmasses during passage over relatively warm continentalwaters. In the Pamir pilot firn core obtained from the higheraltitude (5365ma.s.l.), there are two maxima in stable-isotope and d-excess distribution during the warm seasoneach year (Fig. 7), which could be caused by variations inthe origin of moisture.
REE, major-element and heavy-metal concentrationsin the Pamir firn core
High, medium and low concentrationsThe range of concentrations, in the snow/firn cores, ofbackground and high dust conditions was large: for Nd, Aland Ca the concentration ranges were 1–1119, 2–424 and3–3171ng g–1 respectively (Table 1). For this reason, sampleswere divided into two groups with three clusters in eachgroup. The first group was based on three arbitrary concen-trations: high dust (samples with concentration >2�),medium dust (2� � concentration > �) and low dust(concentration � �), where � is the standard deviation of theconcentration measurements. The second group comprisesthree clusters based on values of absolute maximum,minimum and average. Concentrations of REE, major
elements and other elements in each cluster within eachgroup are given in Table 1.
Medium concentrations of REE and major elements, aswell as high and low concentrations, (Table 1) from theFedchenko snow/firn cores are an order of magnitude lower(up to 20 times) than those from the Inilchek snow/firn core(Kreutz and Sholkovitz, 2000). The proximity of the TaklaMakan desert to the central Tien Shan and associated fohnincursions causes excessive loading of aerosol in the TienShan region. Furthermore, the greater aerosol loading of drydeposition in the Tien Shan glaciers is caused by the absenceof winter precipitation and snow cover in low-lyingsurrounding areas. In contrast, snow is accumulated year-round at Fedchenko glacier where the greatest accumulationoccurs during winter and spring. The concentration ofcalcium (Ca) is also lower in the Pamirs than in the TienShan. The exception is the concentration of sulfur (S), whichis higher in the Pamirs than in the Tien Shan. This may beassociated with dust brought from the fertilized westerncentral Asian lowlands, which are closer to the Pamirs.Average and maximum concentrations of REE in the Pamirsare about an order of magnitude (three to nine times) greaterthan in Altai ice cores as well as in polar ice cores (Table 1).
Content of heavy metals and other trace elementsThe average and maximum contents of the light traceelements (e.g. Al, V, Mn, Fe and Co) in snow and firn onFedchenko glacier are two to nine times greater than on theAltai glaciers, which are heavily polluted (Nikolaeva andothers, 2003). At the same time, average, maximum andminimum content of the heavy metals As, Sr, Cd, Ba and Pbin snow and firn on Fedchenko glacier are two to fourteentimes lower than in snow and firn from the Altai glaciers(Table 1). The average content of Ba is an exception.
Maximum content of Mn and Ba is two to three timesgreater than in snow and firn from the Alps, which is also ahighly polluted region (Van de Velde and others, 2000).Among the trace elements, concentrations of antimony (Sb)were comparable with concentrations in the CanadianArctic (Krachler and others, 2004) and Mont Blanc in theEuropean Alps (Barbante and others, 1999) but significantlyless than in the eastern European Alps (Table 1). Intensiveatmospheric pollution over the Pamirs is caused primarily byrecovery and refining of natural gas, oil, antimony, lead,uranium and gold in Tajikistan, Turkmenistan, Iran andUzbekistan. Southwestern Tajikistan still has the secondlargest aluminum production in the former Soviet Union.The desiccated Aral Sea is also a source of large mineralaerosol production that spreads eastward over central Asia.
Seasonality in aerosol loadingsThere is substantial seasonal variability in the deposition ofnon-soluble aerosol. This variability is illustrated by thedepth profiles for REE, major elements and other elements,which are identical in timing to changes in dD and d18Ostable isotopes (Figs 7 and. 14). S and Ca are exceptions thatdid not demonstrate an obvious seasonal pattern.
Several peaks in REE, major and other elements wereobserved in warm seasons (Figs 7 and 14). Summer is charac-terized by dust storms and dry, hot, hazy weather. Well-known regional winds called ‘Afghanis’ bring dust from Iran,Afghanistan and Turkmenistan. Regional loess from Tajikistanis loaded during the development of summer thermal de-pressions (type 7; Fig. 3). Regional loess could also be brought
Fig. 10. ‘Penitent snow’ in the ablation zone of Fedchenko glacier(4600ma.s.l.) (photo courtesy of L. Braun).
Aizen and others: Stable-isotope and trace element time series from Fedchenko glacier284
by southern cyclones (e.g. southern Caspian and Murgabcyclones (types 4 and 5; Fig. 3)). Background minimumaerosol loading is observed in winter. Wet ground and lowconvection levels suppress transport of aerosols in the Pamirsduring the cold season when precipitation is at a maximum.
Drought and aerosol loadingIn southwestern Asia, a drought developed from 1998/99 to2002. This has intensified the frequency, duration and areacoverage of severe dust/loess storms in Afghanistan andTajikistan (Barlow and others, 2002). Records of pilot snow/firn cores from the Pamirs are lacking for the first 2 years ofdrought. However, there are records for 2001 and 2002 fromthe site at 5206m and for 2002 at 5365ma.s.l. For bothsites, the concentrations of REE and major elements for latesummer/autumn are about two times greater for 2002 and2001 than for other years (Figs 7 and 13). However, S doesnot show the same pattern.
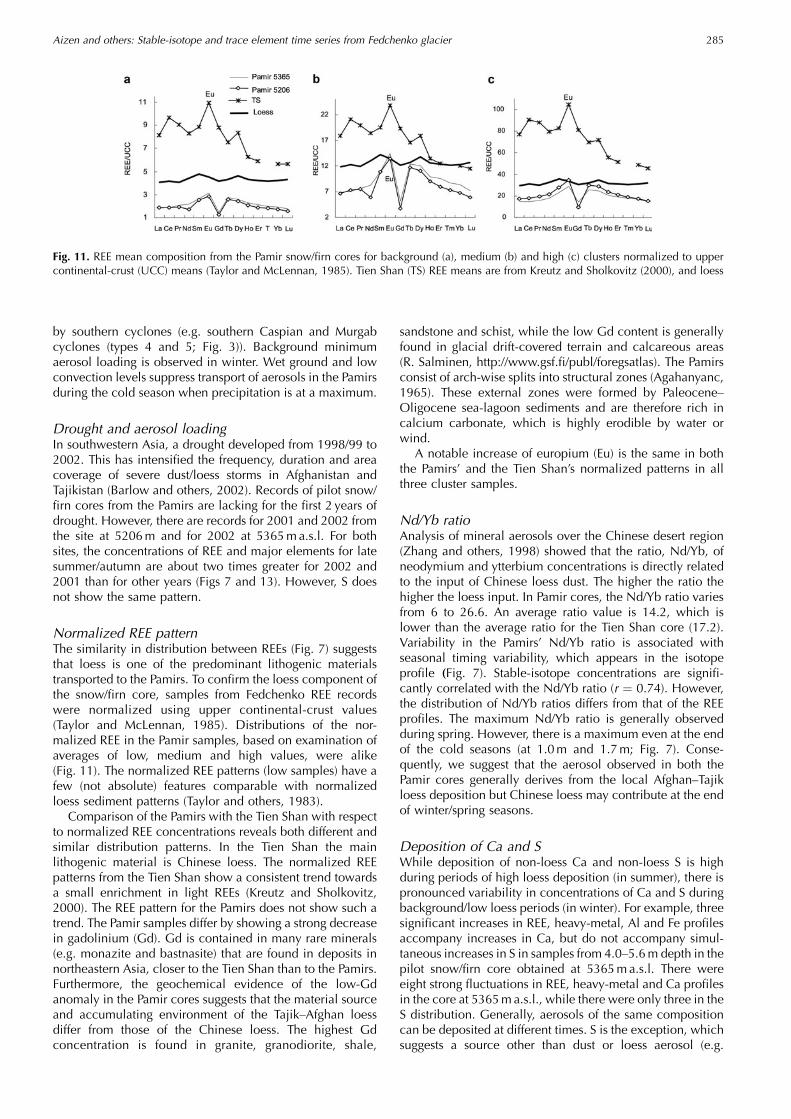
Normalized REE patternThe similarity in distribution between REEs (Fig. 7) suggeststhat loess is one of the predominant lithogenic materialstransported to the Pamirs. To confirm the loess component ofthe snow/firn core, samples from Fedchenko REE recordswere normalized using upper continental-crust values(Taylor and McLennan, 1985). Distributions of the nor-malized REE in the Pamir samples, based on examination ofaverages of low, medium and high values, were alike(Fig. 11). The normalized REE patterns (low samples) have afew (not absolute) features comparable with normalizedloess sediment patterns (Taylor and others, 1983).
Comparison of the Pamirs with the Tien Shan with respectto normalized REE concentrations reveals both different andsimilar distribution patterns. In the Tien Shan the mainlithogenic material is Chinese loess. The normalized REEpatterns from the Tien Shan show a consistent trend towardsa small enrichment in light REEs (Kreutz and Sholkovitz,2000). The REE pattern for the Pamirs does not show such atrend. The Pamir samples differ by showing a strong decreasein gadolinium (Gd). Gd is contained in many rare minerals(e.g. monazite and bastnasite) that are found in deposits innortheastern Asia, closer to the Tien Shan than to the Pamirs.Furthermore, the geochemical evidence of the low-Gdanomaly in the Pamir cores suggests that the material sourceand accumulating environment of the Tajik–Afghan loessdiffer from those of the Chinese loess. The highest Gdconcentration is found in granite, granodiorite, shale,
sandstone and schist, while the low Gd content is generallyfound in glacial drift-covered terrain and calcareous areas(R. Salminen, http://www.gsf.fi/publ/foregsatlas). The Pamirsconsist of arch-wise splits into structural zones (Agahanyanc,1965). These external zones were formed by Paleocene–Oligocene sea-lagoon sediments and are therefore rich incalcium carbonate, which is highly erodible by water orwind.
A notable increase of europium (Eu) is the same in boththe Pamirs’ and the Tien Shan’s normalized patterns in allthree cluster samples.
Nd/Yb ratioAnalysis of mineral aerosols over the Chinese desert region(Zhang and others, 1998) showed that the ratio, Nd/Yb, ofneodymium and ytterbium concentrations is directly relatedto the input of Chinese loess dust. The higher the ratio thehigher the loess input. In Pamir cores, the Nd/Yb ratio variesfrom 6 to 26.6. An average ratio value is 14.2, which islower than the average ratio for the Tien Shan core (17.2).Variability in the Pamirs’ Nd/Yb ratio is associated withseasonal timing variability, which appears in the isotopeprofile (Fig. 7). Stable-isotope concentrations are signifi-cantly correlated with the Nd/Yb ratio (r ¼ 0.74). However,the distribution of Nd/Yb ratios differs from that of the REEprofiles. The maximum Nd/Yb ratio is generally observedduring spring. However, there is a maximum even at the endof the cold seasons (at 1.0m and 1.7m; Fig. 7). Conse-quently, we suggest that the aerosol observed in both thePamir cores generally derives from the local Afghan–Tajikloess deposition but Chinese loess may contribute at the endof winter/spring seasons.
Deposition of Ca and SWhile deposition of non-loess Ca and non-loess S is highduring periods of high loess deposition (in summer), there ispronounced variability in concentrations of Ca and S duringbackground/low loess periods (in winter). For example, threesignificant increases in REE, heavy-metal, Al and Fe profilesaccompany increases in Ca, but do not accompany simul-taneous increases in S in samples from 4.0–5.6m depth in thepilot snow/firn core obtained at 5365ma.s.l. There wereeight strong fluctuations in REE, heavy-metal and Ca profilesin the core at 5365ma.s.l., while there were only three in theS distribution. Generally, aerosols of the same compositioncan be deposited at different times. S is the exception, whichsuggests a source other than dust or loess aerosol (e.g.
Fig. 11. REE mean composition from the Pamir snow/firn cores for background (a), medium (b) and high (c) clusters normalized to uppercontinental-crust (UCC) means (Taylor and McLennan, 1985). Tien Shan (TS) REE means are from Kreutz and Sholkovitz (2000), and loess
Aizen and others: Stable-isotope and trace element time series from Fedchenko glacier 285

anthropogenic). The aerosol observed in both cores from thePamirs was characterized by high concentrations of REE andAl, high or moderate concentrations of Ca and a backgroundconcentration of S. Concentrations of elements in aerosolsobtained from different central Asian sites surrounding thePamirs are broadly similar (Table 4) to records obtained fromthe pilot snow/firn core at 5365ma.s.l.
DISCUSSION: SPATIAL DISTRIBUTION OFAEROSOL RECORDS DURING HIGH AND LOWAEROSOL LOADINGTo avoid the interannual variability associated with theinfluence of local conditions on aerosol loading distribution,we analyzed records for each year (Tables 6 and 7 inAppendix) and averaged records for the whole consideredperiod (Figs 12 and 13). A consistent pattern, which isobserved each recorded year, was considered significant.
The main component of the aerosol loading to Fedchenkoglacier consisted of the elements Ca, Fe, Al and S. Onaverage, the concentration of Ca was 51% and 62% at thetwo sites. Concentrations of Fe, Al and S averaged 18–11%.At the drilling site located on the leeward slope during thehigh/maximum aerosol loading, the proportion of Ca and Sdecreased and the proportion of Fe and Al increased by 10%(Fig. 12; Table 6) compared to low/minimum aerosol loadingconditions.
To analyze the spatial distribution of REE, major andother elements we computed the difference in concen-trations between the two drill locations. The difference wasconsidered significant if the sign of the difference was thesame during each recorded year and if the differenceexceeded the sum of instrumental and method detectionlimits (Table 7). Concentrations of the light REE, La, Ce, Pr,Nd, Sm and Eu, were greater at the drilling site located onthe windward slope than on the leeward slope in a clusterof high/maximum aerosol loadings during the three con-sidered years (Fig. 13). Dust storms produce greaterconcentrations of light REE at the windward slope than atthe leeward slope located 5 km from the windward slope.For medium and low clusters, REE concentrations de-creased with altitude independent of distance or slopeexposition, indicating the existence of atmospheric back-ground REE loading that decreases with altitude while thecomponents remain the same.
For each considered year, during the high aerosolloading, concentrations of light trace elements and heavymetals demonstrated positive differences between wind-ward and leeward slopes. The concentrations of Ti and Asare exceptions, showing an opposite tendency to otherelements. During background conditions, the differences intrace elements and heavy metals between the two locationsare insignificant, being less than the instrumental detectionlimit.
Table 4. Element ratios in Fedchenko glacier snow-/firn-core samples, and the closest values for central Asian aerosols
Fedchenko glacier Closest value Source
Fe/Al 1.07 1.06 East China dust (Zhang and others, 1993)Ca/Al 6.52 6.1 Inilchek (Kreutz and Sholkovitz, 2000)Ca/S 4.28 3.95 Tajik (Gomes and Gillette, 1993)Fe/S 0.70 1.78 Tajik (Gomes and Gillette, 1993)La/Sm 4.48 4.43 China sediments, Quaternary deposition (Taylor and McLennan, 1985)
Fig. 12.Main components of the insoluble aerosol loading to Fedchenko glacier for the high/maximum, medium/average and low/minimumclusters.
Aizen and others: Stable-isotope and trace element time series from Fedchenko glacier286
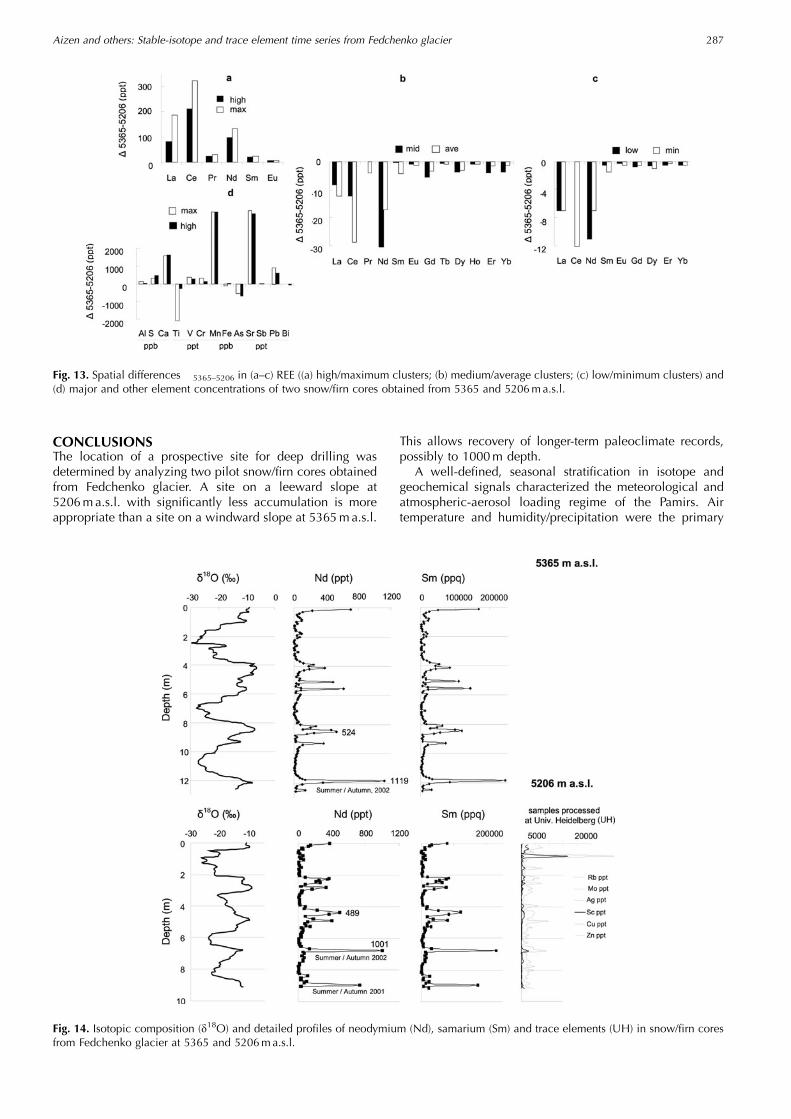
CONCLUSIONSThe location of a prospective site for deep drilling wasdetermined by analyzing two pilot snow/firn cores obtainedfrom Fedchenko glacier. A site on a leeward slope at5206ma.s.l. with significantly less accumulation is moreappropriate than a site on a windward slope at 5365ma.s.l.
This allows recovery of longer-term paleoclimate records,possibly to 1000m depth.
A well-defined, seasonal stratification in isotope andgeochemical signals characterized the meteorological andatmospheric-aerosol loading regime of the Pamirs. Airtemperature and humidity/precipitation were the primary
Fig. 13. Spatial differences �5365–5206 in (a–c) REE ((a) high/maximum clusters; (b) medium/average clusters; (c) low/minimum clusters) and(d) major and other element concentrations of two snow/firn cores obtained from 5365 and 5206ma.s.l.
Fig. 14. Isotopic composition (d18O) and detailed profiles of neodymium (Nd), samarium (Sm) and trace elements (UH) in snow/firn coresfrom Fedchenko glacier at 5365 and 5206ma.s.l.
Aizen and others: Stable-isotope and trace element time series from Fedchenko glacier 287

controls on the stable-isotope records, i.e. precipitation wasmore depleted during the low temperatures of the wintermonths and more enriched during the higher temperaturesof the summer. Spring–winter maximum and summer–autumn minimum precipitation typical of the central Pamirsresulted in the lowest mean isotope ratios among valuesobtained from other glaciers in central Asia. Low-humidity,intensive re-evaporated/recycled moisture brought from thesurrounding low-elevation areas, and prevailing conden-sation at high elevations of the glacier accumulation zoneduring the warm season with minimum precipitation,resulted in increasing d-excess values. Pilot snow-/firn-corerecords for the Pamirs are also distinctive in the matchedseasonal variation in d-excess and d18O. Values of d-excessas well as d18O were greater in warm seasons.
Annual minima in isotope ratios decreased with altitudebecause of decreasing winter air temperatures and increas-ing precipitation. The inverse relationship between altitudeand maximum air temperature was probably due to theincreasing condensation with altitude.
The alpine areas of the Pamirs have climatic features tran-sitional between marine-originated precipitation and the re-cycling of atmospheric moisture. The most similar (relative toGMWL) interpretation is the d18O–dD relationship from themost depleted Pamir isotope records, related to greater pre-cipitation during the cold season that originated in the Atlan-tic without modified recycling. For summer/autumn seasons,increased d-excess reflects complicated sources of precipi-tation (e.g. South Atlantic and Indian Oceans, warm southernCaspian Sea waters or relatively warm continental waters).
The similarity in REE concentration patterns suggests thatloess is the predominant lithogenic material transported tothe Pamirs from Afghan–Tajik loess deposits. Those depositsare characterized by high concentrations of REE and Al, highor median content of Ca, and a background S concentration.Samples from the Pamirs differed in having low concen-trations of Gd. We do not exclude occasional intrusion ofChinese loess into Pamir glaciers.
Aerosol concentrations in Fedchenko glacier samples arelower than in Tien Shan cores. However, the REE profile ofboth pilot Pamir cores documented one of the most extremedroughts of 2001 and 2002 that developed in southwestAsia. At the same time, concentrations of REE, major andother elements in snow and firn samples from the Pamirsexceeded those from Antarctica, Greenland and even therelatively contaminated Alps and Altai. Heavy-metal con-centrations in Fedchenko glacier samples were several timeslower than in snow and firn from the Altai glaciers.Concentrations of trace elements (e.g. antimony) weresimilar to those in the Alps and Arctic Canada. Extensivefertilization in areas close to the Pamirs probably explainsthe significant concentrations of sulfur observed even duringbackground aerosol loading. Heavy-industrial and agricul-tural development since the mid-20th century have con-tributed to intensive atmospheric pollution over central Asia.
ACKNOWLEDGEMENTSThis research was supported by grants awarded by the USNational Science Foundation (ATM-0754644 and ATM-0754479) and US National Oceanic and AtmosphericAdministration (NA04OAR4600179) to UI and UM. Weappreciate valuable comments and corrections suggested byC. Barbante.
REFERENCES
Agahanyanc, O.E. 1965. Osnovnie problemi fiziceskoi geografiiPamira [Main problem of physical geography of the Pamir]. Vol.1. Dushanbe, Academiya Nauk Tadjikistana. [In Russian.]
Aizen, V.B. and E.M. Aizen. 1997. Hydrological cycles on the northand south peripheries of mountain glacial basins of central Asia.Hydrol. Process., 11(5), 451–469.
Aizen, V.B., E.M. Aizen, J.M. Melack, K.J. Kreutz and L.D. Cecil.2004. Association between atmospheric circulation patterns andfirn–ice core records from the Inilchek glacierized area, centralTien Shan. J. Geophys. Res., 109(D8), D08304. (10.1029/2003JD003894.)
Aizen, V.B., E. Aizen, K. Fujita, S.A. Nikitin, K.J. Kreutz andN. Takeuchi. 2005. Stable-isotope time series and precipitationorigin from firn-core and snow samples, Altai glaciers, Siberia.J. Glaciol., 51(175), 637–654.
Arpe, K., L. Bengtsson, G.S. Golitsyn, I.I. Mokhov, V.A. Semenovand P.V. Sporyshev. 2000. Connection between Caspian Sealevel variability and ENSO. Geophys. Res. Lett., 27(17),2693–2696.
Arushev, M.L., B.K. Tsarev and A.S. Shetinnikov. 1977. K voprosu ovliyanii Indiiskogo mussona na regim lednikov Pamira [Thequestion about influence of Indian monsoon on the regime ofPamir’s glaciers]. Mater. Glyatsiol. Issled. 36, 145–148. [InRussian with English summary.]
Barbante, C. and 6 others. 1999. Trace element determination inalpine snow and ice by double focusing inductively coupledplasma mass spectrometry with microconcentric nebulization.J. Analy. Atom. Spectrom., 14(9), 1433–1438.
Barbante, C. and 7 others. 2003. Seasonal variations of heavymetals in central Greenland snow deposited from 1991 to 1995.J. Environ. Monitor., 5(2), 328–335.
Barlow, M., H. Cullen and B. Lyon. 2002. Drought in central andsouthwest Asia: La Nina, the warm pool, and Indian Oceanprecipitation. J. Climate, 15(7), 697–700.
Barry, R.G. and A.H. Perry. 1973. Synoptic climatology: methodsand applications. London, Routledge, Chapman & Hall.
Berzon, I.S., V.A. Pak and V.N. Yakovlev. 1962. Stroenie lednikaFedchenko po geofizicheskim dannim (seismo-razvedka, gravi-metriya) [Structure of Fedchenko Glacier by geophysical data(seismic and gravimetric surveys)]. Mater. Glyatsiol. Issled. 6,90–96. [In Russian.]
Bugaev, V.A., V.A. Dzordzio and E.M. Kozik. 1957. Sinopticheskieprocessi nad Srednei Aziey [Synoptic processes of central Asia].Tashkent, Academiya Nauk Uzbekistoi SSR. [In Russian.]
Craig, H. 1957. Isotopic standards for carbon and oxygen andcorrection factors for mass-spectrometric analysis of carbondioxide. Geochim. Cosmochim. Acta, 12(1–2), 133–149.
Demchenko, B.B., M.Yu. Medvedev and A.F. Finaev. 1985.Phitoindicaciya osadkov v doline reki Karadjilgasai, basseinozera Zorkul [Phyto-indication of precipitation in theKaradjilgasai river basin, Sorkul lake, east Pamirs]. In Respu-blikanskaya nauchno-teoreticheskaya Konferenciya molodihuchenih i specialistov Tadjikstoi SSR [Proceedings of theRepublican Scientific Theoretical Conference of Young Scientistsand Specialists of the Tajik Republic]. Dushanbe, Donish,39–40. [In Russian.]
Dodonov, A.E., N.J. Sheckleton, L.P. Zhou, S.P. Lomov andA.F. Finaev. 1999. Loess-soil stratigraphy Quaternary MiddleAsia: geochronology, correlation and evolution of palaeoenvironment. Stratigr. Geol. Correl., 7(6), 66–80.
Dolgushin, L.D. and G.B. Osipova. 1989. Ledniki [Glaciers].Second edition. Moscow, Misl’. [In Russian.]
Elguindi, N. and F. Giorgi. 2006. Simulating multi-decadalvariability of Caspian Sea level changes using regional climatemodel outputs. Climate Dyn., 26(2–3), 167–181.
Froelich, K., J.J. Gibson and P.K. Aggarwal. 2002. Deuterium excessin precipitation and its climatological significance. In Study ofEnvironmental Change Using Isotope Techniques. Proceedings
Aizen and others: Stable-isotope and trace element time series from Fedchenko glacier288

of an International Conference in Vienna, Austria, 23–27 April2001. Vienna, International Atomic Energy Agency, 54–65. (C&SPapers Series No. 13.)
Gabrielli, P. and 8 others. 2009. Direct determination of rare earthelements at the subpicogram per gram level in Antarctic ice byICP-SFMS using a desolvation system. Anal. Chem., 78(6),1883–1889.
Gomes, L. and D.A. Gillette. 1993. A comparison of characteristicsof aerosol from dust storms in central Asia with soil-derived dustfrom other regions. Atmos. Environ., 27(6), 2539–2544.
Grousset, F.E. and 6 others. 1992. Antarctic (Dome C) ice-core dustat 18 k.y. B.P.: isotopic constraints on origin. Earth Planet. Sci.Lett., 111(1), 175–182.
Hinkley, T.K., F. Pertsiger and L. Zavjalova. 1997. The modernatmospheric background dust load: recognition in central Asiansnowpack and compositional constraints. Geophys. Res. Lett.,24(13), 1607–1610.
Ikegawa, M. and 7 others. 1999. Geographical variations of majorand trace elements in East Antarctica. Atmos. Environ., 33(9),1457–1467.
Il’inova, E.S., A.Yu. Tursunov and Z.G. Emm. 1965. Statistiko-stohasticheskaya charakteristika sinopticheskih situacii nadcentral’noi Asiaei [Statistical–stochastic characteristic of synop-tic situation over central Asia]. Trudi SARNIIGMI, 20(35),201–243. [In Russian.]
Jouzel, J. and L. Merlivat. 1984. Deuterium and oxygen 18 inprecipitation: modeling of the isotopic effect during snowformation. J. Geophys. Res., 89(D7), 11,749–11,757.
Kendall, C. and J.J. McDonnell. 1998. Isotope tracers in catchmenthydrology. New York, Elsevier.
Krachler, M., J. Zheng, D. Fisher and W. Shotyk. 2004. Novelcalibration procedure for improving trace element determina-tions in ice and water samples using ICP-SMS. J. Analy. Atom.Spectrom., 19(8), 1017–1019.
Kreutz, K.J. and E.R. Sholkovitz. 2000. Major element, rare earthelement, and sulfur isotopic composition of a high-elevation icecore: sources and transport of mineral dust in central Asia.Geochem. Geophys. Geosyst., 1(11), 1048. (10.1029/2000GC000082.)
Kreutz, K.J., C.P. Wake, V.B. Aizen, L.D. Cecil and H.A. Synal.2003. Seasonal deuterium excess in a Tien Shan ice core:influence of moisture transport and recycling in Central Asia.Geophys. Res. Lett., 30(18), 1922. (10.1029/2003GL017896.)
Kurita, N., N. Yoshida, G. Inoue and E.A. Chayanova. 2004.Modern isotope climatology of Russia: a first assessment.J. Geophys. Res., 109(D3), D03102. (10.1029/2003JD003404.)
Kuznezova, L.P. 1978. Perenos vlagi v atmosfere nad territorieiSSSR [Moisture transport in the atmosphere over the territory ofUSSR]. Moscow, Nauka. [In Russian.]
Kuznezova, L.P. 1983. Atmosfernyi vlagoobmen nad territorei USSR[Atmospheric water exchange over the territory of USSR].Moscow, Nauka. [In Russian.]
Lebedeva, I.M. 1976. Intensivnost’ ispareniya s lednikov Srednei iCentralnoi Azii [Glacier surface evaporation intensity in CentralAsia]. Mater. Glyatsiol. Issled. 26, 119–129. [In Russian withEnglish summary.]
Li, Y. and 6 others. 2006. Recent changes of atmospheric heavymetals in high-elevation ice core from Muztagh Ata, east Pamirs:initial results. Ann. Glaciol., 43, 154–159.
Loktionova-Aizen, E.M. 1995. [Number of days with snow cover:maximum water equivalent of snow cover, dates of itsmaximum 1:2500000 (USSR, Europe) and 1:150000(Apees, Alps, Balkan, Carpathian, Scandinavia)]. In Kotlyakov,V.M., ed. [International Hydrological Project: World atlas ofsnow and ice resources]. Moscow, Russian Academy ofSciences. [In Russian.]
Meleshko, V.P. and 8 others. 1998. Calculation of water balancecomponents over the Caspian Sea watershed with a set ofatmospheric general circulation models. Izv. Akad. Nauk, Fiz.Atmos. Okeana, 34(4), 591–599.
Merlivat, L. and J. Jouzel. 1979. Global climatic interpretation ofthe deuterium–oxygen 18 relationship for precipitation.J. Geophys. Res., 84(C8), 5029–5033.
Morrison, J., T. Brockwell, T. Merren, F. Fourel and A.M. Phillips.2001. On-line high-precision stable hydrogen isotopicanalyses on nanoliter water samples. Anal. Chem., 73(15),3570–3575.
Nikolaeva, I.V., A.I. Saprykin and S.V. Palesski. 2003. ICP-MSdetermination of heavy metal content and isotopic compositionof lead in the Altai glaciers. J. Phys. IV [Paris], 107(1),957–960.
Osterberg, E.C., M.J. Handley, S.B. Sneed, P.A. Mayewski andK.J. Kreutz. 2006. Continuous ice core melter system withdiscrete sampling for major ion, trace element, and stableisotope analyses. Environ. Sci. Technol., 40(10), 3355–3361.
Planchon, F.A.M. and 7 others. 2001. Ultrasensitive determinationof heavy metals at the sub-picogram per gram level inultraclean Antarctic snow samples by inductively coupledplasma sector field mass spectrometry. Anal. Chim. Acta,450(1–2), 193–205.
Rickmers, W.R. 1929. On the fringe of the Pamirs. Alp. J.,41(238–239).
Rodionov, S.N. 1994. Global and regional climate interaction: theCaspian Sea experience. Baton Rouge, LA, Kluwer AcademicPress.
Shackleton, N.J. and 6 others. 1995. Accumulation rate of loess inTajikistan and China: relationship with global ice volume cycles.Quat. Proc., 4, 1–6.
Shotyk, W., M. Krachler and B. Chen. 2005. Anthropogenic impactson the biogeochemistry and cycling of antimony. Metal IonsBiol. Sys., 44, 177–203.
Subbotina, O.I. 1995. Atmosfernaya circulaciaya [Atmosphericcirculation]. In Muminova, F.A. and S.I. Inagamova, eds.Izmenenie klimata v Srednei Azii [Change of climate in middleAsia]. Tashkent, SARNIIGMI, 8–34. [In Russian.]
Svensson, A., P.E. Biscaye and F.E. Grousset. 2000. Characterizationof late glacial continental dust in the Greenland Ice Core Projectice core. J. Geophys. Res., 105(D4), 4637–4656.
Taylor, S.R. and S.M. McLennan. 1985. The continental crust: itscomposition and evolution. Oxford, Blackwell Scientific Pub-lications.
Taylor, S.R., S.M. McLennan and M.T. McCulloch. 1983. Geo-chemistry of loess, continental crustal composition and crustalmodel ages. Geochim. Cosmochim. Acta, 47(11), 1897–1905.
Van de Velde, K. and 8 others. 2000. A two hundred years record ofatmospheric cadmium, copper and zinc concentrations in highaltitude snow and ice from the French–Italian Alps. Geophys.Res. Lett., 27(2), 249–252.
Zabirov, R.D. 1955. Oledenenie Pamira [Glaciation of the Pamir].Moscow, Geogragiz. [In Russian.]
Zhang, X.Y., R. Arimoto, Z.A.T. Chen, G. Zhang, G. Zhu andX. Wang. 1993. Atmospheric trace elements over source regionsfor Chinese dust: concentrations, sources and atmosphericdeposition on the Loess Plateau. Atmos. Environ., 27(13),2051–2067.
Zhang, X.Y., R. Arimoto, G.H. Zhu, T. Chen and G.Y. Zhang. 1998.Concentration, size-distribution and deposition of mineralaerosol over Chinese desert regions. Tellus, 50B(4), 317–330.
APPENDIX
DETAILED DATA ON APPLIED METHODOLOGY ININTERPRETATION OF TRACE ELEMENT SERIESTo avoid the influence of patching patterns on the distri-bution of major-element and REE concentration, we ana-lyzed the records from two drilling sites showing thecharacteristics in terms of accuracy, detection limit, repro-ducibility and distribution.
Aizen and others: Stable-isotope and trace element time series from Fedchenko glacier 289
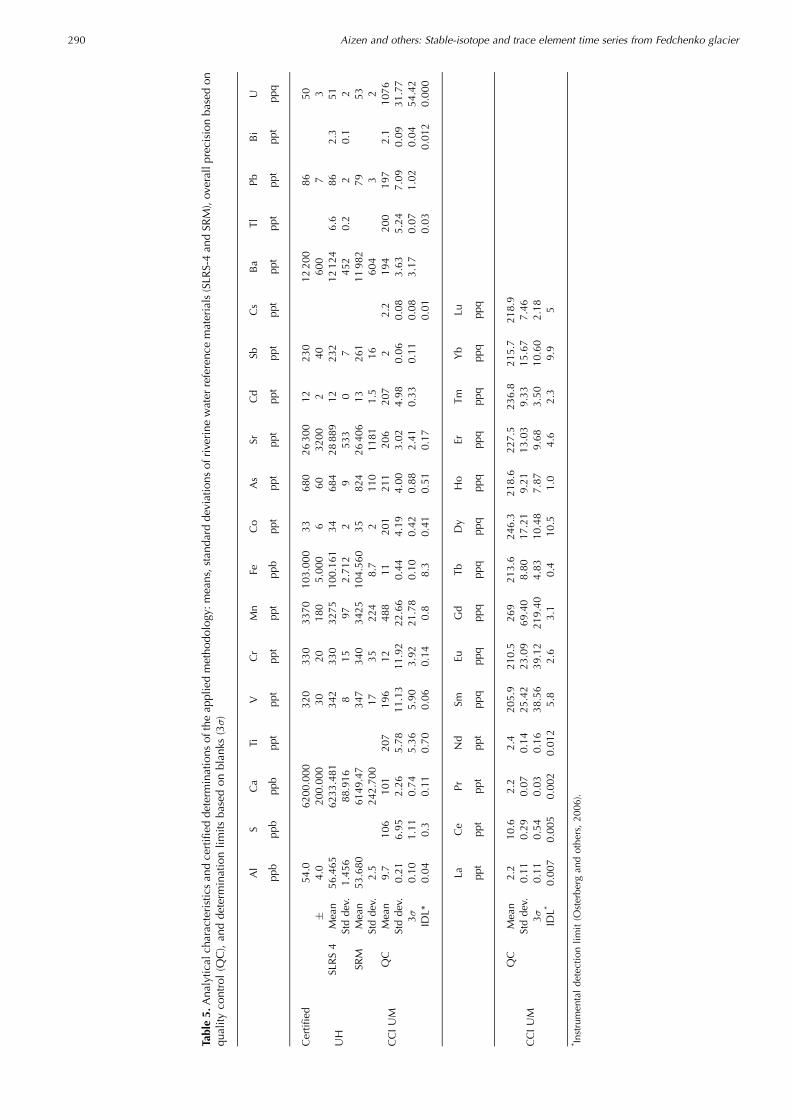
Table5.
Ana
lytic
alch
arac
teristicsan
dce
rtified
determ
inations
oftheap
pliedmetho
dology
:mea
ns,stand
ardde
viations
ofriverine
water
referenc
ematerials(SLR
S-4an
dSR
M),ov
erallp
recision
basedon
quality
control(Q
C),an
dde
term
inationlim
itsba
sedon
blan
ks(3�)
Al
SCa
TiV
Cr
Mn
FeCo
As
SrCd
SbCs
Ba
TlPb
Bi
U
ppb
ppb
ppb
ppt
ppt
ppt
ppt
ppb
ppt
ppt
ppt
ppt
ppt
ppt
ppt
ppt
ppt
ppt
ppq
Certified
54.0
6200
.000
320
330
3370
103.00
033
680
2630
012
230
1220
086
50�
4.0
200.00
030
2018
05.00
06
6032
002
4060
07
3
UH
SLRS4
Mea
n56
.465
6233
.481
342
330
3275
100.16
134
684
2888
912
232
1212
46.6
862.3
51Stdde
v.1.45
688
.916
815
972.71
22
953
30
745
20.2
20.1
2
CCIUM
SRM
Mea
n53
.680
6149
.47
347
340
3425
104.56
035
824
2640
613
261
1198
279
53Stdde
v.2.5
242.70
017
3522
48.7
211
011
811.5
1660
43
2QC
Mea
n9.7
106
101
207
196
1248
811
201
211
206
207
22.2
194
200
197
2.1
1076
Stdde
v.0.21
6.95
2.26
5.78
11.13
11.92
22.66
0.44
4.19
4.00
3.02
4.98
0.06
0.08
3.63
5.24
7.09
0.09
31.77
3�0.10
1.11
0.74
5.36
5.90
3.92
21.78
0.10
0.42
0.88
2.41
0.33
0.11
0.08
3.17
0.07
1.02
0.04
54.42
IDL*
0.04
0.3
0.11
0.70
0.06
0.14
0.8
8.3
0.41
0.51
0.17
0.01
0.03
0.01
20.00
0
LaCe
PrNd
SmEu
Gd
TbDy
Ho
ErTm
Yb
Lu
ppt
ppt
ppt
ppt
ppq
ppq
ppq
ppq
ppq
ppq
ppq
ppq
ppq
ppq
CCIUM
QC
Mea
n2.2
10.6
2.2
2.4
205.9
210.5
269
213.6
246.3
218.6
227.5
236.8
215.7
218.9
Stdde
v.0.11
0.29
0.07
0.14
25.42
23.09
69.40
8.80
17.21
9.21
13.03
9.33
15.67
7.46
3�0.11
0.54
0.03
0.16
38.56
39.12
219.40
4.83
10.48
7.87
9.68
3.50
10.60
2.18
IDL*
0.00
70.00
50.00
20.01
25.8
2.6
3.1
0.4
10.5
1.0
4.6
2.3
9.9
5
* Instrum
entalde
tectionlim
it(O
sterbe
rgan
dothe
rs,20
06).
Aizen and others: Stable-isotope and trace element time series from Fedchenko glacier290

Table 6. Annual share of the main components (%) of the insoluble aerosol loading to Fedchenko glacier pilot snow/firn cores obtained from5365 and 5206ma.s.l. for the maximum, average and minimum clusters
Sum Al S Ca Ti Mn Fe
Year H 5365 5206 5365 5206 5365 5206 5365 5206 5365 5206 5365 5206 5365 5206
m
2004 Max 0.2 0.4 13.0 19.8 13.1 14.8 52.0 35.3 0.4 1.0 1.1 1.8 20.1 26.82004 Ave 0.2 0.4 10.7 17.1 12.3 13.7 64.0 48.3 0.3 0.5 1.0 1.6 11.5 18.32004 Min 0.4 0.3 8.5 14.6 20.8 27.2 58.8 41.5 0.4 0.4 0.5 0.7 10.6 15.32003 Max 0.1 0.3 14.8 13.7 16.9 7.1 51.4 52.2 0.2 0.7 0.5 1.3 16.2 24.72003 Ave 0.2 0.3 7.5 17.6 17.9 10.4 65.5 51.8 0.2 0.5 0.8 1.4 8.0 18.02003 Min 0.4 0.3 7.5 11.5 21.2 18.8 60.7 56.2 0.5 0.5 0.6 1.6 9.0 11.12002 Max 0.4 0.5 16.5 27.8 4.8 4.6 55.5 34.1 0.5 1.0 2.3 2.0 20.0 30.12002 Ave 0.3 0.3 13.9 16.6 11.3 8.7 56.8 56.0 0.4 0.5 1.7 1.2 15.6 16.62002 Min 0.2 0.3 4.7 9.6 28.4 26.2 55.7 54.2 0.2 0.4 0.3 0.3 10.6 9.1
Table 7. Differences�5365–5206 in REE and major and other element concentrations of two cores obtained on Fedchenko glacier, at 5365 and5206ma.s.l.
REE
�5365–5206 La Ce Pr Nd Sm Eu Gd Tb Dy Ho Er Tm Yb Lu
ppt ppt ppt ppt ppq ppq ppq ppq ppq ppq ppq ppq ppq ppq
DL* 0.12 0.55 0.03 0.17 44.36 41.72 221.5 5.23 20.98 8.87 14.28 5.8 20.5 7.18
Ave2004 –16 –40 –4 –17 –4034 –1004 –1391 –602 –3225 –592 –1410 –211 –1340 –1832003 –15 –35 –5 –19 –4254 –883 –2239 –510 –2393 –482 –1205 –158 –934 –1412002 –6 –11 –3 –14 –4226 –1248 –6005 –740 –2830 –691 –2026 –245 –998 –264Max2004 224 427 60 246 58844 13 371 11 250 7194 37189 7333 18677 2843 13091 13542003 81 155 9 34 1894 657 –2271 –1588 –9948 –1671 –3821 –791 –5767 –5022002 250 389 28 117 13293 336 –34 233 503 11356 –109 –1042 35 2157 –397Min2004 –4 –9 –1 –3 –618 –258 –448 –118 –564 –94 –235 –44 –216 –342003 –3 –7 –1 –3 –743 –201 –245 –86 –493 –73 –135 –21 –153 –142002 –14 –31 –4 –15 –3084 –728 –871 –410 –1818 –271 –619 –45 –784 –37
Major or other element
Al S Ca Ti V Cr Mn Fe Co As Sr Cd Sb Cs Ba Tl Pb Bi U
ppb ppb ppb ppt ppt ppt ppt ppb ppt ppt ppt ppt ppt ppt ppt ppt ppt ppt ppq
DL* 0.14 1.41 0.85 6.06 5.96 4.06 22.58 8.4 0.83 1.39 2.58 0.09 0.1 0.05 54.42
Ave2004 –4 12 129 –106 15 –7 –274 –4 –16 –4 331 –33 0 –4 –322 0 –72 0 1352003 –9 71 219 –195 21 2 178 –7 –5 17 694 –19 8 –3 74 1 11 –4 –5272002 –23 3 –41 –936 –25 –7 706 –17 –25 –100 –117 –4 5 –7 –461 0 –20 –1 –1237Max2004 228 279 1535 –3613 1143 896 18596 –192 183 –544 4419 –116 67 35 1772 4 882 –3 15 9632003 30 656 2476 –1806 34 50 5848 –54 36 –276 9264 –80 87 –6 2481 4 1001 –73 1862002 100 33 717 –6000 68 46 20785 –57 –5 –780 2105 81 48 –26 –935 2 884 –3 –3075Min2004 –3 –3 –10 –84 0 –14 –158 –3 –3 –7 –26 –3 –1 –1 –61 0 –24 0 –4102003 0 –2 –11 –50 –1 –5 –449 1 –2 2 –41 –2 0 –1 –22 0 –16 –1 –232002 –3 0 0 –134 –4 0 –22 –1 –2 0 0 –1 0 0 –5 0 –29 0 –29
*Determination limit.
MS received 6 September 2007 and accepted in revised form 11 August 2008
Aizen and others: Stable-isotope and trace element time series from Fedchenko glacier 291