Mercury in the snow and firn at Summit Station, Central ...
49
HAL Id: hal-00328252 https://hal.archives-ouvertes.fr/hal-00328252 Submitted on 19 Dec 2007 HAL is a multi-disciplinary open access archive for the deposit and dissemination of sci- entific research documents, whether they are pub- lished or not. The documents may come from teaching and research institutions in France or abroad, or from public or private research centers. L’archive ouverte pluridisciplinaire HAL, est destinée au dépôt et à la diffusion de documents scientifiques de niveau recherche, publiés ou non, émanant des établissements d’enseignement et de recherche français ou étrangers, des laboratoires publics ou privés. Mercury in the snow and firn at Summit Station, Central Greenland, and implications for the study of past atmospheric mercury levels X. Faïn, C. P. Ferrari, A. Dommergue, M. Albert, M. Battle, L. Arnaud, J.-M. Barnola, W. Cairns, C. Barbante, C. Boutron To cite this version: X. Faïn, C. P. Ferrari, A. Dommergue, M. Albert, M. Battle, et al.. Mercury in the snow and firn at Summit Station, Central Greenland, and implications for the study of past atmospheric mercury levels. Atmospheric Chemistry and Physics Discussions, European Geosciences Union, 2007, 7 (6), pp.18221-18268. hal-00328252
Transcript of Mercury in the snow and firn at Summit Station, Central ...
HAL Id: hal-00328252https://hal.archives-ouvertes.fr/hal-00328252
Submitted on 19 Dec 2007
HAL is a multi-disciplinary open accessarchive for the deposit and dissemination of sci-entific research documents, whether they are pub-lished or not. The documents may come fromteaching and research institutions in France orabroad, or from public or private research centers.
L’archive ouverte pluridisciplinaire HAL, estdestinée au dépôt et à la diffusion de documentsscientifiques de niveau recherche, publiés ou non,émanant des établissements d’enseignement et derecherche français ou étrangers, des laboratoirespublics ou privés.
Mercury in the snow and firn at Summit Station,Central Greenland, and implications for the study of
past atmospheric mercury levelsX. Faïn, C. P. Ferrari, A. Dommergue, M. Albert, M. Battle, L. Arnaud, J.-M.
Barnola, W. Cairns, C. Barbante, C. Boutron
To cite this version:X. Faïn, C. P. Ferrari, A. Dommergue, M. Albert, M. Battle, et al.. Mercury in the snow and firnat Summit Station, Central Greenland, and implications for the study of past atmospheric mercurylevels. Atmospheric Chemistry and Physics Discussions, European Geosciences Union, 2007, 7 (6),pp.18221-18268. �hal-00328252�
ACPD
7, 18221–18268, 2007
Mercury in the snow
and firn at Summit
Station, Greenland
X. Faın et al.
Title Page
Abstract Introduction
Conclusions References
Tables Figures
◭ ◮
◭ ◮
Back Close
Full Screen / Esc
Printer-friendly Version
Interactive Discussion
EGU
Atmos. Chem. Phys. Discuss., 7, 18221–18268, 2007
www.atmos-chem-phys-discuss.net/7/18221/2007/
© Author(s) 2007. This work is licensed
under a Creative Commons License.
AtmosphericChemistry
and PhysicsDiscussions
Mercury in the snow and firn at Summit
Station, Central Greenland, and
implications for the study of past
atmospheric mercury levels
X. Faın1, C. P. Ferrari
1,4,7, A. Dommergue
1,4, M. Albert
2, M. Battle
3, L. Arnaud
1,
J.-M. Barnola3, W. Cairns
5, C. Barbante
5, and C. Boutron
1,6,7
1Laboratoire de Glaciologie et Geophysique de l’Environnement (UMR 5183 CNRS/Universite
Joseph Fourier), 54 rue Moliere, B.P. 96, 38402 St. Martin d’Heres cedex, France2Geophysical Sciences Division – ERDC Cold Regions Research and Engineering Lab, 72
Lyme Road, Hanover, N.H. 03755, USA3Dept. of Physics and Astronomy – Bowdoin College, 8800 College Station, Brunswick, ME
04011-8488, USA4Polytech’ Grenoble, Universite Joseph Fourier, 28 avenue Benoıt Frachon, B.P. 53, 38041
Grenoble cedex, France
18221

ACPD
7, 18221–18268, 2007
Mercury in the snow
and firn at Summit
Station, Greenland
X. Faın et al.
Title Page
Abstract Introduction
Conclusions References
Tables Figures
◭ ◮
◭ ◮
Back Close
Full Screen / Esc
Printer-friendly Version
Interactive Discussion
EGU
5Environmental Sciences Department, University of Venice, Calle Larga S. Marta, 2137, 30123
Venice, Italy6Unite de Formation et de Recherche de Physique, Universite Joseph Fourier, B.P. 53, 38041
Grenoble cedex, France7Institut Universitaire de France, 103 boulevard Saint-Michel, 75005 Paris, France
Received: 18 September 2007 – Accepted: 2 December 2007 – Published: 19 December 2007
Correspondence to: X. Faın ([email protected])
18222
ACPD
7, 18221–18268, 2007
Mercury in the snow
and firn at Summit
Station, Greenland
X. Faın et al.
Title Page
Abstract Introduction
Conclusions References
Tables Figures
◭ ◮
◭ ◮
Back Close
Full Screen / Esc
Printer-friendly Version
Interactive Discussion
EGU
Abstract
Gaseous Elemental Mercury (Hg◦
or GEM) was investigated at Summit Station, Green-
land, in the interstitial air extracted from the perennial snowpack (firn) at depths ranging
from the surface to 30 m, during summer 2005 and spring 2006. Photolytic production
and destruction of Hg◦
were observed close to the snow surface during summer 20055
and spring 2006, and we observed dark oxidation of GEM up to 270 cm depth in June
2006. Photochemical transformation of gaseous mercury resulted in diel variations in
the concentrations of this gas in the near-surface interstitial air, but destruction of Hg◦
was predominant in June, and production was the main process in July. This seasonal
evolution of the chemical mechanisms involving gaseous elemental mercury produces10
a signal that propagates downward through the firn air, but is unobservably small below
15 m in depth. As a consequence, multi-annual averaged records of GEM concentra-
tion should be well preserved in deep firn air at depths below 15 m, and available for
the reconstruction of the past atmospheric history of GEM over the last decades.
1 Introduction15
Mercury is a persistent and toxic heavy metal present in the environment in various
chemical forms. In the atmosphere, gaseous elemental mercury (Hg◦, GEM) is the
predominant form of mercury (>95%) and has a global atmospheric residence time of
about 6–24 months (Lamborg et al., 2002). The relatively inert GEM can undergo long-
range transport whereas oxidized species of mercury such as particulate mercury (PM)20
and reactive gaseous mercury (RGM) are subject to rapid deposition near their emis-
sion sources. Atmospheric mercury depletion events (AMDEs) were first observed at
Alert, Canada (Schroeder et al., 1998). They commonly occur during the spring in po-
lar environments and are characterized by rapidly decreasing concentrations of GEM
in the atmosphere. The decrease is caused by photochemically initiated oxidation re-25
actions involving marine halogens (Lu et al., 2001; Lindberg et al., 2002; Skov et al.,
18223
ACPD
7, 18221–18268, 2007
Mercury in the snow
and firn at Summit
Station, Greenland
X. Faın et al.
Title Page
Abstract Introduction
Conclusions References
Tables Figures
◭ ◮
◭ ◮
Back Close
Full Screen / Esc
Printer-friendly Version
Interactive Discussion
EGU
2004) that transform GEM to RGM and PM. These oxidized species can be deposited
onto snow surfaces. As a result, the arctic seasonal snowpack is suspected to con-
tribute to the contamination of the aquatic reservoir during snowmelt. Conversely, the
polar snowpack can also act as a source of GEM to the atmosphere. Direct photore-
duction of divalent mercury (Hg(II)) complexes deposited onto snow surfaces lead to5
an emission of GEM to the atmosphere. AMDEs have only been observed in coastal
areas. Brooks et al. (2007) reported preliminary observations about mercury chem-
istry at the South Pole, but there is still a clear lack of data on inland Greenland and
Antarctica, even though these ice sheets represent a surface of ∼14 millions km2
of
snow which could strongly interact with the lower atmosphere and influence the global10
cycle of mercury.
Atmospheric mercury pollution over the last 150 years has greatly increased mercury
deposition to terrestrial and aquatic ecosystems in remote areas. Modern measure-
ments combined with historical records from lake sediments and peat suggest a three-
fold increase in mercury deposition since pre-industrial times (Engstrom and Swain,15
1997; Lamborg et al., 2002). A single ice core profile from the Freemont Glacier
(Wyoming, USA) showed a 20-fold increase since 1840 (Schuster et al., 2002) for
Hg(II) deposition. Mason et al. (1994) and Mason and Sheu (2002) used archives of
deposited mercury and modelling studies to estimate an increase in the global atmo-
spheric reservoir’s GEM concentrations by a factor of 2–5 since the beginning of the20
industrialized period. Only total and reactive mercury can be investigated in sediment,
peat and ice archives, however, post-deposition processes may strongly modify the
chemical information trapped into these records (see e.g. Biester et al., 2007). Conse-
quently, these archives do not provide direct information on the evolution of the global
background concentration of atmospheric GEM over time.25
The potential of the polar ice sheets to serve as an archive for the reconstruction of
past atmospheric GEM composition has been well recognized. From the top surface
to ∼60–120 m depth is the firn, an openly porous and permeable media through which
air can diffuse. The solid ice is located below the firn, and the transition between firn
18224
ACPD
7, 18221–18268, 2007
Mercury in the snow
and firn at Summit
Station, Greenland
X. Faın et al.
Title Page
Abstract Introduction
Conclusions References
Tables Figures
◭ ◮
◭ ◮
Back Close
Full Screen / Esc
Printer-friendly Version
Interactive Discussion
EGU
and ice is called the close-off. Ice core records of trapped gases and interstitial firn
air have been used extensively to study the past history of atmospheric greenhouse
gases (Schwander et al., 1988; Siegenthaler et al., 2005). In principle, both firn air
and ice cores should also be useful for quantifying the histories of atmospheric GEM
concentrations.5
However, to correctly interpret GEM measurements from the deep firn air or in the
ice air, we first need to quantify any perturbations in the GEM records arising from
surface phenomena. For example, chemical processes leading to production and/or
destruction of GEM close to the snow-air interface might distort atmospheric properties
preserved in the glacial records. More generally, physical and chemical modifications of10
GEM signals in the lower atmosphere, the surface snowpack and the deep firn have to
be understood to determine the transfer function. The GEM transfer function is defined
as the relation between GEM atmospheric concentrations and GEM concentrations in
deep ice bubbles. This function has to be determined in order to reconstruct the past
history of GEM in the atmosphere.15
We measured, for the first time, GEM concentrations from the top surface to a depth
of 30 m at Summit Station, Central Greenland, during two field campaigns during sum-
mer 2005 and spring 2006. The aims of this study were (i) to document the chemical
processes involving GEM in the shallow firn air and (ii) to understand the influence
of these surface processes on the GEM levels in the deep firn air. We also discuss20
the feasibility of using the GEM transfer function to reconstruct past atmospheric GEM
levels from deep firn air and air trapped in ice.
2 Experimental
2.1 Study site
GEM was investigated on the Greenland ice sheet at the Greenland Environmental25
Observatory (72.6◦N, 38.5
◦W, 3200 m elevation) from 23 to 29 July 2005 (summer
18225
ACPD
7, 18221–18268, 2007
Mercury in the snow
and firn at Summit
Station, Greenland
X. Faın et al.
Title Page
Abstract Introduction
Conclusions References
Tables Figures
◭ ◮
◭ ◮
Back Close
Full Screen / Esc
Printer-friendly Version
Interactive Discussion
EGU
2005) and 29 May to 6 June 2006 (spring 2006). In 2005, atmospheric and snow air
sampling were carried out close to the Science Trench: a clean area where access
was restricted. In 2006, atmospheric air, snow air and firn air were sampled in a re-
mote location 10 km away from the station. These measurements were part of the
collaborative firn air sampling campaign “Firn structure, interstitial processes, and the5
composition of firn air at Summit, Greenland” led by CREEL, Hanover, N.H. (USA).
2.2 In situ air analysis
We measured GEM levels with two Tekran gas phase GEM analyzers (Model 2537A;
Tekran Inc., Toronto, Canada). One was dedicated to ambient and shallow firn mea-
surements, while the other was used exclusively for deeper firn measurements. The10
pre-filtered air stream (soda lime trap and 0.2µm Teflon particle filter) is collected on
two gold cartridges. GEM is thermally desorbed from the cartridges and detected by
cold vapor atomic fluorescence spectrometry (AFS) at 253.7 nm (Tekran, 1999). Dual
gold cartridges allow alternate sampling and desorption, resulting in continuous mea-
surement of GEM on a predefined time base. The set-up, accuracy and precision of this15
instrument have been assessed during field intercomparisons at an urban/industrial
site (Schroeder et al., 1995) and at a remote marine background location (Ebinghaus
et al., 1999). The Tekran analyzer was operated with a 5-min sampling frequency and
the air was sampled at a flow rate of 1 l min−1
. The analyzer was calibrated every 25 h
with an internal automatic permeation source injection. The detection limit for GEM20
in this operational mode is roughly 0.15 ng m−3
(Aspmo et al., 2005). All GEM data
discussed in this paper are presented with one StDv.
We measured GEM concentrations between depths of 40 and 330 cm below the
snow surface using GAMAS probes (Gaseous Mercury in Interstitial Air in Snow), de-
vices dedicated to the sampling of GEM and temperature measurements in the air25
of snowpacks (Dommergue et al., 2003a). This system has been used successfully in
different Arctic sites, for example, at Station Nord, Greenland (Ferrari et al., 2004a; Fer-
rari et al., 2004b), Kuujjuarapik, Canada (Dommergue et al., 2003b) and Col de Porte,
18226
ACPD
7, 18221–18268, 2007
Mercury in the snow
and firn at Summit
Station, Greenland
X. Faın et al.
Title Page
Abstract Introduction
Conclusions References
Tables Figures
◭ ◮
◭ ◮
Back Close
Full Screen / Esc
Printer-friendly Version
Interactive Discussion
EGU
French Alps (Faın et al., 2007). Ten GAMAS probes and an atmospheric sampling line
were connected to the Tekran analyzer using an 11-port Teflon solenoid switch. This
set-up allowed a cyclic sampling of each probe every 10 min.
2.3 Firn air sampling
Firn air was sampled using established methods (Schwander et al., 1988; Battle et al.,5
1996; Butler et al., 1999) from one hole at the depths of 15, 25, 30, 40, 50, 58, 63,
66, 70, 72, 74, 76, 78 and 79.5 m, but only the top three depths will be discussed in
this manuscript. Briefly, a 5-m long bladder was lowered into the borehole after drilling
to the sampling depth, and was pressurized, effectively sealing the borehole. Two
Dekabon® (polyethylene/aluminum composite) lines were used to pump firn air from10
a space left immediately below the bladder. These lines drew air from two separate
openings separated by a horizontal stainless steel baffle nearly as wide as the hole.
Air was pumped from the upper opening at ∼20 l min−1
and was directed to waste after
measuring the CO2 concentration (in situ measurements using a LICOR instrument).
When CO2 levels stabilized, indicating effective removal of contamination by younger15
and/or ambient air, sampling started from the lower opening. Pumping from the upper
opening continued during sampling to remove any air leaking from within or around the
bladder. It also served to keep sampled air out of contact with the bladder itself. Firn
air was collected in pressurized flasks for analysis of other gas species at a flow of
4 l min−1
during approximately one hour. Afterwards, the sampling line was connected20
to a Vacuubrand PTFE pump (MZ-2C) and GEM analyses commenced. The pump
delivered firn air to the inlet of a 2537A Tekran analyzer at a flow rate of 1 l min−1
.
Blanks of the Dekabon sampling line were checked both at the beginning and at the
end of the field work. They were 0.08±0.13 ng.m−3
(n=8, before sampling, on 25 May)
and 0.01±0.06 ng.m−3
(n=18, after sampling, on 1 June). We measured blanks of25
the PTFE pump before and after sampling at all depths to quantify any contamination
introduced by this additional pump.
18227
ACPD
7, 18221–18268, 2007
Mercury in the snow
and firn at Summit
Station, Greenland
X. Faın et al.
Title Page
Abstract Introduction
Conclusions References
Tables Figures
◭ ◮
◭ ◮
Back Close
Full Screen / Esc
Printer-friendly Version
Interactive Discussion
EGU
2.4 Pressure influence on GEM analysis
Summit Station elevation is 3200 m, and an atmospheric pressure of ∼675 mbar was
observed both during July 2005 and June 2006. While our 2537 analyzers are op-
timized for GEM determination in the air from the sea-level atmosphere up to 2000 m
(Tekran Inc., Toronto, Canada), Ebinghaus and Slemr (2000) have shown that low pres-5
sures can influence the operation of these analyzers. Using ground calibrations, these
authors reported a pressure dependency of the AFS detector of about 0.1% mbar−1
over the tested range of pressures (980 to 620 mbar). Unfortunately, we could not
use such results because we calibrated both Tekran analyzers automatically using an
internal calibration source every 25 h at Summit Station. Instead, we carried out lab-10
oratory studies to obtain information about the effect of low pressure on internal cali-
brations. While both analyzers were at ambient pressure (∼990 mbar), all the inlet and
outlets (including internal calibration inlets) were introduced into a low-pressure cham-
ber. This equipment, located at the Centre de Recherche du Service de Sante des
Armees (CRSSA, La Tronche, France) and initially designed for biological studies, had15
a volume of 2000 liters and could reach a stable pressure from ambient to 500 mbar
in a few minutes. The accuracy of the pressure measurement in the chamber was
±6 mbar. We first did internal calibrations at 675 mbar to reproduce the conditions of
Summit Station. Then, we performed 14 manual injections (∼120 pg of Hg◦) using a
primary mercury vapor source (Tekran 2505), using the manual injection port. Because20
the instruments were at a higher pressure than their internal plumbing, we also sam-
pled mercury free air to check that no invasion of ambient air occurred. The response
of both instruments was found to be pressure dependent: at 675 mbar we observed an
increase of the GEM signal by 6.2 and 9.4% for the two analyzers (serial numbers 209
and 238, respectively). All data discussed in this study were pressure corrected.25
18228
ACPD
7, 18221–18268, 2007
Mercury in the snow
and firn at Summit
Station, Greenland
X. Faın et al.
Title Page
Abstract Introduction
Conclusions References
Tables Figures
◭ ◮
◭ ◮
Back Close
Full Screen / Esc
Printer-friendly Version
Interactive Discussion
EGU
2.5 Snow sampling
A 2-m snowpit was dug in the clean air sector of Summit Station, 500 m south of the
Science Tower. The pit was sampled for total mercury (HgT ) on 23 July 2005, in a
location where the snow had not been previously disturbed. All samples were imme-
diately stored in the dark at −20◦C until analysis. For HgT samples, we used ultra5
clean Teflon bottles and clean snow sampling procedures (Ferrari et al., 2000). HgT
includes species such as HgCl2, Hg(OH)2, HgC2O4 that are easily reducible by SnCl2or NaBH4, as well as stable complexes such as HgS and Hg
2+bound to sulfur in
humic compounds, and some organomercuric species (Lindqvist and Rodhe, 1985).
HgT was determined at the Department of Environmental Science of the University10
Ca’Foscari of Venice (Italy), using an Element ICP-SFMS (Thermo Finnigan MAT In-
strument, Bremen, Germany). Planchon et al. (2004) gave a detailed description of
the analytical technique. Instrumental calibrations were carried out with Hg standards
prepared from serial dilutions of a monoelemental Hg2+
solution at 1000 mg l−1
(CPI
International Santa Rosa, CA, USA). Using these techniques, the laboratory achieved15
a lower detection limit of ∼0.18 ng l−1
. The precision of the measurements was esti-
mated to be 15% (the relative standard deviation of five replicates). Snow samples
were melted just prior to analysis to minimize mercury transformation during storage.
3 Results and discussion
3.1 Meteorological conditions20
During both field measurement campaigns, there was 24-h daylight. During sum-
mer 2005, atmospheric temperatures and wind speeds exhibited two different periods.
From 18 to 25 July, wind speeds were always below 3 m s−1
while from 26 and 27 July,
wind speed was typically between 3 and 5 m s−1
. From 18 to 22 July, atmospheric
temperatures ranged from −20◦C at night to −5
◦C during the day. From 24 to 27 July25
18229
ACPD
7, 18221–18268, 2007
Mercury in the snow
and firn at Summit
Station, Greenland
X. Faın et al.
Title Page
Abstract Introduction
Conclusions References
Tables Figures
◭ ◮
◭ ◮
Back Close
Full Screen / Esc
Printer-friendly Version
Interactive Discussion
EGU
2005, air temperatures during the days were close to 0◦C. During spring 2006, the
daily temperature ranged between −30◦C at night and −15
◦C during the day. Weather
conditions were generally calm and clear with a maximum wind speed of 4 m s−1
(mea-
sured two meters above the snow surface). The only exception was on 6 June, when a
maximum wind speed of 6 m s−1
was recorded. The hemispherical integrated incoming5
radiation measured at a height of two meters during both field campaigns are shown,
along with the shallow firn air data, in Figs. 3 and 4.
3.2 Snow and firn characteristics
The physical properties of the Summit snowpack have been intensively studied before.
We measured density in 2-m pits both in summer 2005 and spring 2006, finding a10
pattern similar to that of Albert and Shultz (2002). Our 2-m pit represented about
three years of snow accumulation. In May and early June, most of the top 50 cm of
snow is fine-grained wind-packed snow. Low-density hoar layers form occasionally
during summer. In accumulated firn from previous years, the layers of hoar from the
summer alternate visibly with high density wind-pack layers characteristic of winters.15
The density and permeability measurements from the top two meters of firn from the
early June 2006 snow pit are shown on Fig. 1. In spring 2006, the snowpack exhibited
thick layers of hoar centered at approximately ∼55 and ∼140 cm depths, with large
grains and low snow density of about 0.2 g cm−3
. In summer 2005, similar hoar layers
were observed centered at ∼80 and ∼150 cm depths. At Summit, the permeability20
generally increases with depth by more than an order of magnitude in the first 3 m of
the snowpack (Albert and Shultz, 2002), and generally decreases below 3 m.
To assess the role of total mercury in chemical processes, we sampled the full 2 m of
our pit for Ca2+
and Na+
abundance, as well as for HgT in summer 2005. We used Ca2+
and Na+
measurements (not shown here) for pit dating. Ca2+
concentration peaks at25
∼10, ∼90 and ∼150 cm depths indicating spring layers, while Na+
concentration peaks
at ∼40, ∼110 and ∼170 cm depths showing winter layers were observed. HgT concen-
18230
ACPD
7, 18221–18268, 2007
Mercury in the snow
and firn at Summit
Station, Greenland
X. Faın et al.
Title Page
Abstract Introduction
Conclusions References
Tables Figures
◭ ◮
◭ ◮
Back Close
Full Screen / Esc
Printer-friendly Version
Interactive Discussion
EGU
trations shown in Fig. 2 ranged from 2.6 to 20.2 ng l−1
, with a mean value of 10.3 ng l−1
and a mean analytical uncertainty of 0.7 ng l−1
. We collected duplicate samples at the
snow surface and at 10, 20, 60, 100, 140, and 180 cm depths, the concentrations re-
ported at these depths on Fig. 2 are the means of duplicate analysis and error bars
represent the variability between these duplicates. While there are substantial uncer-5
tainties in our measurements, we observed neither a seasonal cycle, nor an annual
change in HgT deposition over this period.
Although these are the first measurements of HgT made at Summit, reactive mercury
(HgR) has been studied at this site in the past, both in the first seven meters of the snow
and firn (Mann et al., 2004) and in the deep firn (Boutron et al., 1998). HgR corresponds10
to the fraction of mercury bound in complexes that are easily reducible by SnCl2 or
NaBH4. Examples include HgCl2, Hg(OH)2 and HgC2O4 (Lindqvist and Rodhe, 1985).
Reactive mercury represents less than 10% of HgT in the Summit snowpack. Mann
et al. (2004) reported a high variability of HgR concentrations in the first 2 m of the
snowpack, with values ranging from 0.25 to 0.68 ng l−1
(mean value of ∼0.46 ng l−1
).15
3.3 GEM in the atmosphere
We measured GEM levels in atmospheric air at Summit Station during summer 2005
and spring 2006. Concentrations were stable, and no atmospheric GEM depletion
events were observed. Mean concentrations were 1.61±0.14 ng m−3
(n=1102) from
27 May to 6 June 2006, and 1.80±0.14 ng m−3
(n=112) from 23 to 29 July 2005. GEM20
atmospheric levels measured during both spring and summer at Summit were a bit
higher than concentrations reported for Alert at the same season (Steffen et al., 2005).
This slight difference (∼10%) was not confirmed by inter-calibrations and comparison
measurements of the instruments used at Alert and Summit. However, the air masses
at Alert and Summit have different origins: the chemical loading to the atmosphere25
above Summit is influenced by air masses arriving at high altitude (500 hPa) (Khal et
al., 1997). Moreover, springtime displays a strong variability of GEM concentrations in
18231
ACPD
7, 18221–18268, 2007
Mercury in the snow
and firn at Summit
Station, Greenland
X. Faın et al.
Title Page
Abstract Introduction
Conclusions References
Tables Figures
◭ ◮
◭ ◮
Back Close
Full Screen / Esc
Printer-friendly Version
Interactive Discussion
EGU
the atmosphere at Alert due to the atmospheric mercury depletion events (AMDEs).
These phenomena, leading to a complete depletion of GEM in the atmosphere, occur
simultaneously with the post-solar sunrise destruction of ozone. Helmig et al. (2007b)
investigated the surface ozone mixing ratio at Summit Station from 2000 to 2004 and
reported concentrations ranging from ∼40 to ∼70 ppbv without any ozone depletion5
event. No atmospheric ozone and mercury depletion events were observed at Summit,
indicating no strong variations in their atmospheric concentrations throughout the year.
3.4 GEM from the top surface snow to 3 m depth
3.4.1 Variations in GEM concentrations with depth
Evolution of GEM concentrations with depth, from the top surface to a depth of 30 m, is10
presented in Fig. 3. The dashed line represents the mean atmospheric GEM concen-
tration of ∼1.65 ng m−3
, estimated from data obtained both during summer 2005 and
spring 2006. At lower concentrations (left side of the dashed line) is the profile mea-
sured during spring 2006. Higher concentrations correspond to the profile measured
during summer 2005 (right side of the dashed line). For each depth, all of the data15
collected are graphed and the corresponding mean GEM concentrations at each depth
are given with the solid and open circles. In spring 2006, we observed a decrease
in the mean GEM concentration with depth in the snow interstitial air (SIA) with level
close or below the atmospheric one. During summer 2005, mean GEM concentrations
were always above the atmospheric level, increasing from 40 cm to 120 cm depths,20
and decreasing at a depth of 160 cm. Finally, mean concentration at a depth of 200 cm
was close to the one recorded at a depth of 140 cm. The evolution of mean GEM
concentrations in the SIA during spring 2006 presented a similar trend to that reported
for Station Nord, (North Greenland) by Ferrari et al. (2004a). At this site, a seasonal
snowpack ∼1 m thick was investigated, and an exponential decrease of GEM concen-25
trations was observed from atmospheric levels at the snow surface to 0.1–0.2 ng m−3
at
the bottom of the snowpack. Hence, GEM consumption at a depth of 100 cm in arctic
18232

ACPD
7, 18221–18268, 2007
Mercury in the snow
and firn at Summit
Station, Greenland
X. Faın et al.
Title Page
Abstract Introduction
Conclusions References
Tables Figures
◭ ◮
◭ ◮
Back Close
Full Screen / Esc
Printer-friendly Version
Interactive Discussion
EGU
snow has been previously observed. On the other hand, we report for the first time
an increase of mean GEM concentrations with depth in snow and firn air at Summit
Station during summer 2005, but these measurements could be strongly influenced by
sampler-induced advection, as discussed in Sect. 3.4.3.
3.4.2 Daily variations in GEM concentrations5
Evolution of GEM concentrations with time in the SIA and above the snow surface,
from 18 to 27 July 2005 (summer 2005), and from 29 May to 6 June 2006 (spring
2006), are reported in Figs. 4 and 5 respectively. As presented in the previous sec-
tion, summer 2005 and spring 2006 differed strongly regarding the evolution of mean
GEM concentrations with depth in the SIA. However, during both periods, GEM con-10
centrations exhibited a diel variation anti-correlated to solar irradiation in the first two
meters of the snowpack. We measured production and depletion of GEM in the SIA,
with maximum concentrations at midnight and minimum concentrations at midday.
GEM levels measured at 200 and 270 cm depths during spring 2006 were close to
the detection limit of the 2537A Tekran analyzer, and the fluctuations observed were15
below 0.15 ng m−3
, the uncertainty reported for this analyzer. Indeed we measured
0.09±0.08 ng m−3
(n=41) at a depth of 200 cm, and 0.08±0.10 ng m−3
(n=117) at a
depth of 270 cm. At a depth of 330 cm, the GEM concentration was monitored continu-
ously during 48 h: no diel variation was observed, and levels were stable with a mean
value of 0.27±0.04 ng m−3
(n=34). In summer 2005, diel variations of GEM concentra-20
tions were observed from the surface to a depth of 200 cm. Of the many recordings,
only very few measurements fell below the atmospheric level at a depth of 40 cm; most
measurements in the near-surface in July were higher than the ambient atmospheric
concentration. Due to equipment maintenance, we were not able to collect data on
22 and 23 July. In the following section, we investigate the different roles of physical25
processes and chemical mechanisms in the daily variations of GEM concentrations in
the SIA.
18233
ACPD
7, 18221–18268, 2007
Mercury in the snow
and firn at Summit
Station, Greenland
X. Faın et al.
Title Page
Abstract Introduction
Conclusions References
Tables Figures
◭ ◮
◭ ◮
Back Close
Full Screen / Esc
Printer-friendly Version
Interactive Discussion
EGU
3.4.3 Chemical or physical processes in the SIA?
Diel variations of GEM concentrations were observed both during spring and summer
(see Figs. 4 and 5). Five possible phenomena could potentially explain the variations
observed: i) adsorption of GEM on snow grains, ii) natural ventilation, iii) diffusion within
the deeper snowpack, iv) chemical processes leading to destruction and/or production5
of GEM and v) advective flow induced by the sampling procedure. Due to the high
adsorption energy of GEM on snow evaluated at ∼61 kJ mol−1
(Ferrari et al., 2004a),
the adsorption of GEM is extremely reduced and cannot explain these observations.
Similarly, natural ventilation could not induce the variation of GEM concentrations ob-
served. Albert and Shultz (2002) showed at Summit Station that gas transport in high10
permeability layers 15 cm beneath the snow surface under low winds (∼3 m s−1
) was
not influenced by natural ventilation, but controlled by diffusion.
To identify the potential role of diffusion in the interstitial air in the snow and firn, we
simulated the diffusion of the diel variation of GEM recorded in spring 2006 at a depth
of 40 cm. We first determined diffusion constants characterizing GEM and the firn15
structure at Summit Station. The GEM diffusivity in air at Summit Station DSurface(T,P )
was
determined using the value reported by Massman (1999) corrected for Summit tem-
perature and pressure (Schwander et al., 1988).
DSurface(T,P )
= DT0,P0×P0/
P ×
(
T/T0
)1.85
(1)
where T0=253.16◦K, P0=1013.25 mbar, T=241
◦K and P=675 mbar. T and P are mean20
annual atmospheric values of temperature and pressure for the site of Summit. Equa-
tion (1) gives the GEM diffusivity in the atmosphere above the firn surface. To obtain
the effective diffusivity of GEM in the SIA (Deff), we used the following relation:
Deff = φ/τ × DSurface(T,P )
(2)
where φ is the snow porosity determined using the densities fo snow and ice25
φ = 1 − ρsnow/ρice (3)
18234
ACPD
7, 18221–18268, 2007
Mercury in the snow
and firn at Summit
Station, Greenland
X. Faın et al.
Title Page
Abstract Introduction
Conclusions References
Tables Figures
◭ ◮
◭ ◮
Back Close
Full Screen / Esc
Printer-friendly Version
Interactive Discussion
EGU
τ is the firn tortuosity. The tortuosity of a porous medium represents the complexity of
the pathway, and is commonly calculated as the ratio of the mean path length to the
minimum possible (straight line) path length. Albert and Shultz (2002) reported that
the tortuosity of the surface wind pack at Summit in June was 2.0. A value of 2.0 is
the maximum tortuosity value that can be considered in the first several meters of the5
snowpack, because the top 50 cm of snow is wind-pack, and is less permeable than the
underlying layers at Summit, as can be seen in Fig. 2. With the definition of tortuosity
in Eq. (2), the tortuosity in the underlying, more permeable layers below a depth of
50 cm, may be lower than 2.0. Considering a tortuosity of 1.4–2.0 and a snow porosity
of 0.7, we obtained Deff for GEM of 0.06–0.08 cm2
s−1
.10
Diel cycles of GEM concentrations in the SIA showed a time shift with increasing
depth both during summer (Fig. 4) and spring (Fig. 5), suggesting that diffusion was
occurring. To better assess the transport of GEM by diffusion in the SIA, we modeled
this physical process from 40 to 270 cm depths. In this model, we used GEM spring
measurements at a depth of 40 cm (GEM40) and a constant concentration of 0.1 ng m−3
15
at a depth of 270 cm as boundary conditions. The modeled diffusion of GEM40 deeper
in the snowpack is shown on Fig. 6. A comparison of modeled data and measurements
is also represented. Peak concentrations from field data exhibit a slight shift in time
when depth increases but modeling results show that this shift should be larger if only
diffusion took place in the SIA. This effect could be due of induced air advection in the20
firn, as we discuss in the following paragraph.
Albert et al. (2002) showed that interstitial air sampling in snow with sampler flow
rates of 1 l min−1
(and higher) draws in a substantial amount of ambient air into the
sampler, even when one assumes that the sampler has perfect contact with the sur-
rounding snow. Thus, we investigated the role of induced interstitial advection in the25
shallow firn. Using the multidimensional model (Albert, 1996; Albert et al., 2002), along
with the measured permeability profile depicted in Fig. 1 for the permeability of the top
two meters for spring 2006, and the published permeability profile deeper in the firn
at Summit (Albert and Shultz, 2002), we investigate the impacts of sampler-induced
18235
ACPD
7, 18221–18268, 2007
Mercury in the snow
and firn at Summit
Station, Greenland
X. Faın et al.
Title Page
Abstract Introduction
Conclusions References
Tables Figures
◭ ◮
◭ ◮
Back Close
Full Screen / Esc
Printer-friendly Version
Interactive Discussion
EGU
advection on the measured concentration profiles in the firn air. Using a sampler intake
rate of 1 l min−1
for each simulation, Fig. 7 depicts the air flow patterns when the intake
is at depths of 40, 120, and 160 cm in the firn. The closer the intake is to the atmo-
sphere/snow interface, the more air is drawn vertically down through the surrounding
snow into the sampler intake, thus diluting the sampled air at the sampled depth with5
air from above. This is clearly evident when the sample intake is at a depth of 40 cm
(Fig. 7a); most of the air into the inlet is coming directly down from the near-surface
snow. As the inlet gets deeper, the contribution from the snow-air interface decreases,
and the contribution from nearby permeable layers (whether above or below the inlet)
increases. Considering the inlet at a depth of 120 cm (Fig. 7b), there is still surface10
air coming down, but a greater part of the sample comes from the high-permeability
layer locate between 50–95 cm depths in the snow. At a depth of 160 cm (Fig. 7c),
much of the air sampled comes from the high-permeability layer above the intake: this
high-permeability layer serves as a channel for lateral flow in the firn. Sampler-induced
advection transports down photochemically-induced changes in GEM concentrations15
from the near-surface snow. On one hand, we assume that diel cycles observed from
80 to 160 cm depths during spring 2006 are due to sampler-induced advection. The
decrease with depth of the amplitude of the diel GEM variations is consistent with our
modeling, showing less influence of the forced advection as depth increases. We note
that dilution/mixing of interstitial air measurements by flow samplers is not unique to20
this study; in fact it is an unavoidable artifact of all firn air measurements that have
been carried out by flow samplers to date (Albert et al., 2002; Domine et al., 2007).
On the other hand, sampler-induced advection could not explain the decrease in min-
imum GEM concentrations with depth measured close to midday. Diffusion modeling,
reported on Fig. 5, could not reproduce either this destruction of GEM, which may re-25
flect chemical mechanisms involving GEM from 40 to 270 cm that will be discussed in
the following section.
Snow permeability data was not available for summer 2005. However, modeling
showed that diffusion of GEM was too slow to explain the diel cycles deeper in the
18236
ACPD
7, 18221–18268, 2007
Mercury in the snow
and firn at Summit
Station, Greenland
X. Faın et al.
Title Page
Abstract Introduction
Conclusions References
Tables Figures
◭ ◮
◭ ◮
Back Close
Full Screen / Esc
Printer-friendly Version
Interactive Discussion
EGU
SIA. Similarly to spring data, we assume that diel GEM variations below a depth of
80 cm could be an artifact due to sampler-induced advection. Forced advection could
also lead to an underestimation of GEM concentrations in the first meter due to the
mixing of low-concentrated air from the atmosphere and high concentrated air from the
SIA. Thus, the increase of the mean GEM concentrations with depth during summer5
2005 could not be explained by diffusion, but may be an artifact of sampler-induced
advection. Dark chemical production of GEM should also be considered as a possible
mechanism for the observed increase in GEM concentrations.
In summary, measurements in the field when compared to gas transport modeling
lead to the evidence that natural diffusion was not the main process driving the evo-10
lution of GEM concentrations in the SIA. On the other hand, photochemical changes
in GEM that occur in the top centimeters to tens of centimeters of snow are likely ad-
vected down into the sampler, giving the appearance that photochemical reactions are
occurring deeper in the snow than is actually the case. Despite this sampler-induced
artifact, there is evidence of chemical processes involving GEM in the SIA, with both15
photolytic mechanisms close to the surface and dark processes in the first three meters
of the snowpack.
3.4.4 Chemical mechanisms within the snowpack
The photochemical processes in snow and the exchanges of reactive trace gases be-
tween the SIA and the Atmospheric Boundary Layer (ABL) have been largely investi-20
gated at Summit Station (Dibb et al., 2007). Galbavy et al. (2007) measured irradiance
in the snow and firn at Summit, and found actinometry e-folding depths near 12 cm.
Less than 2% of monochromatic light penetrates deeper than the top half-meter at
Summit. Thus, photochemistry can directly play a role from the top surface to ∼60 cm
depth in the snow at Summit. In this area, defined as the sunlit snow, diel variations25
of GEM observed during spring and summer in the SIA were probably the result of
the co-existence of GEM oxidation and Hg(II) reduction. These two competitive phe-
nomena have already been observed in coastal snowpacks in the Arctic (Dommergue
18237
ACPD
7, 18221–18268, 2007
Mercury in the snow
and firn at Summit
Station, Greenland
X. Faın et al.
Title Page
Abstract Introduction
Conclusions References
Tables Figures
◭ ◮
◭ ◮
Back Close
Full Screen / Esc
Printer-friendly Version
Interactive Discussion
EGU
et al., 2003b; Ferrari et al., 2004b). In our case, oxidation was predominant during
spring and Hg(II) reduction was predominant during summer. According to e-folding
depth values reported by Gavaldy et al. (2007), there is no evidence that significant,
naturally-occurring photochemical reactions involving GEM could occur below ∼60 cm
depth. However, at Dome C (Antarctica), irradiance attenuation in the shallow firn de-5
pends on the snow layers considered: at higher depths, Warren et al. (2006) observed
a lower irradiance attenuation related to an increase in snow grain size. A similar study
is necessary at Summit Station to better characterised the photochemical processes
in the snowpack. Assuming that light does not penetrate below ∼60 cm depth, the diel
variation of GEM concentrations from 80 to 200 cm depths in the SIA is probably due10
to the transport of the photochemically-induced gas composition in the top half-meter
to deeper depths by the sampler flow, as shown by our modeling (see Fig. 7). This
effect occurred both during summer 2005 and spring 2006. However, the decrease of
mean GEM levels during spring 2006, and their stabilization to zero (see Fig. 3) from
200 to 270 cm could not be explained by the transport of the depleted air but only by15
dark oxidation processes in the SIA. The active photochemistry involving both GEM
and Hg(II) complexes implies that one must exhibit great caution when using HgR and
HgT profiles to infer depositional histories. Hg(II) species could be perturbed by post-
deposition processes occurring close to the surface, leading to HgR or HgT profiles in
the firn that would not be simply linked to the history of mercury deposition on the sur-20
face. In the next sections we discuss the photolytic and dark mechanisms which could
be involved in the destruction and production of GEM.
3.4.5 GEM depletion within the snowpack
In the sunlit snow, we observed GEM depletion with concentrations lower than atmo-
spheric ones and a diel evolution which was anti-correlated to solar irradiation during25
both summer 2005 and spring 2006. During spring 2006, we also observed a deple-
tion of GEM in the SIA below the sunlit zone, with GEM concentrations close to zero
from 200 to 270 cm (see Fig. 3). Thus, both photolytic and dark oxidation of GEM were
18238
ACPD
7, 18221–18268, 2007
Mercury in the snow
and firn at Summit
Station, Greenland
X. Faın et al.
Title Page
Abstract Introduction
Conclusions References
Tables Figures
◭ ◮
◭ ◮
Back Close
Full Screen / Esc
Printer-friendly Version
Interactive Discussion
EGU
occurring in the SIA at Summit.
Using backward transport model simulations, Sjostedt et al. (2007) showed that the
boundary layer at Summit could be periodically impacted by halogens, and the bromine
mixing ratio in the SIA at Summit was estimated at 1–4 ppbv by Peterson et al. (2001).
Br•
is probably the most efficient oxidant for GEM in the Arctic troposphere (Ariya et al.,5
2004; Skov et al., 2004), and GEM depletion within the snowpack could be the result
of homogenous and/or heterogeneous chemistry with Br radicals (Ferrari et al., 2004b;
Goodsite et al., 2004). The following mechanism has been proposed by Goodsite et
al. (2004):
Hg◦+ Br• → HgBr• (R1)10
HgBr• + Br• → HgBr2 (R2)
These authors demonstrated that a recombination of Hg◦
with Br•
(R1), followed by
the addition of a second radical Br•
(R2) was able to explain the observed rate of Hg◦
removal during AMDEs. Radicals I•
and OH•
could also interact with HgBr, but their
concentrations within the snowpack are to low for these compounds to be considered.15
Br2 is also an oxidant for GEM according to the following reaction:
Hg◦+ Br2 → HgBr2 (R3)
However, the rate constant for reaction (R3) is much lower (by a factor ∼105) than
the rate constants for (R1) and (R2) (Ariya et al., 2002; Goodsite et al., 2004). Since
reactions (R1), (R2) and (R3) are exothermic in gas and aqueous phases (Tossel,20
2003), they could occur in a dark environment if Br•
radicals or Br2 are available.
Modeling and measurements of photolyzable bromine (Br2, BrCl, HOBr) and bromine
radicals at Alert, Canada, showed that the snowpack is a bromine source (Tang and
McConnell, 1996). Foster et al. (2001) reported Br2 concentrations in the SIA at Alert,
Canada, that were the double of those measured in the overlying air during the sunlight25
period, which provides evidence for the production of Br2 in natural snowpacks. There
18239
ACPD
7, 18221–18268, 2007
Mercury in the snow
and firn at Summit
Station, Greenland
X. Faın et al.
Title Page
Abstract Introduction
Conclusions References
Tables Figures
◭ ◮
◭ ◮
Back Close
Full Screen / Esc
Printer-friendly Version
Interactive Discussion
EGU
are now several observations suggesting that halogen chemistry may also be impor-
tant at Summit: Swanson et al. (2007) provided evidence for production of alkyl halide
in the SIA, and Sjostedt et al. (2007) suggested that HOx chemistry could be linked to
halogen oxides at Summit Station. In the lower atmosphere, Br•
radicals are formed
by Br2 photodissociation at wavelengths below 620 nm. Such wavelengths are avail-5
able in the top centimeters of the snowpack at Summit Station (Galbavy et al., 2007).
In July at Summit, Peterson and Honrath (2001) measured diel variations of ozone
concentrations at a depth of 30 cm with minimum concentrations at midday, and levels
close to atmospheric ones during the night. They demonstrated that only destruction
by bromine radicals is sufficiently efficient to explain such rapid processes. Such ozone10
depletions are similar to GEM measurements we report for the sunlit zone both during
summer and spring. We finally assume that the mechanisms involved in the destruc-
tion of GEM in the sunlit snow (from the surface to ∼60 cm depth) are similar to the
ones happening during AMDEs and ODEs in the polar atmosphere during spring, as
previously suggested (Ferrari et al., 2004b): GEM is actively converted to its oxidized15
form Hg(II) when solar irradiation is strong enough to produce Br•
by the photolysis of
Br2.
Deeper, the snowpack may also act as a source of Br2, even if there is no light. Oum
et al. (1998) reported laboratory measurements suggesting that the oxidation of Br−
ions by ozone at the surface of the snow crystals could produce Br2 in the dark. These20
authors proposed the following reactions:
O3 + Br− → BrO−+ O2 (R4)
BrO−+ H+
→ HOBr (R5)
HOBr + H++ Br− → Br2 + H2O (R6)
This mechanism is consistent with field observations reported before the polar sun-25
rise at Alert by Foster et al. (2001). These authors reported the simultaneous depletion
of ozone and production of Br2 in the SIA. Recently, Helmig et al. (2007a) reported O3
18240

ACPD
7, 18221–18268, 2007
Mercury in the snow
and firn at Summit
Station, Greenland
X. Faın et al.
Title Page
Abstract Introduction
Conclusions References
Tables Figures
◭ ◮
◭ ◮
Back Close
Full Screen / Esc
Printer-friendly Version
Interactive Discussion
EGU
measurements in the SIA at Summit from April to June 2004. These authors did not
observed any ozone destruction in the SIA during the polar night (beginning of April)
but they did not investigated ozone below a depth of 60 cm. Deeper measurements are
necessary to conclude whether or not dark ozone oxidation occurred during this period
of the year. On the other hand, they reported permanent minimum ozone levels at a5
depth of one meter for June. Such a decrease in concentration with depth cannot be
explained by diffusion or sampler-induced advection. Considering that the actinic flux
is null at this depth in the Summit snowpack (Galbavy et al., 2007), dark destruction of
ozone in the SIA must be occurring. We assume that such dark oxidation reported for
O3 at Alert by Foster et al. (2001) also occurred in the SIA at Summit Station according10
to the mechanisms described previously (R4-R5-R6). This destruction of ozone is a
source of Br2, which becomes available for GEM oxidation in the SIA via reaction (R3).
More measurements during different seasons are now necessary to better under-
stand the dark chemical processes involving both ozone and GEM. During summer
2005, we did not observe dark destruction of GEM directly, but rather diffusion of GEM15
produced in the sunlit snow through deeper layers. Sampling-induced artifacts could
have also hidden this process.
3.4.6 GEM production in the snowpack
GEM photo-production in the shallow firn was observed both during spring and sum-
mer, from the top surface to a depth of ∼60 cm where light could penetrate. GEM20
production processes were much more active relative to oxidation during the summer
rather than during spring. GEM production was previously reported in interstitial air of
both polar (Dommergue et al., 2003b; Ferrari et al., 2004b) and mid-latitude snowpacks
(Poulain et al., 2004; Faın et al., 2007). Most authors assumed that such production is
the result of direct photodissociation of Hg(II) complexes. This reduction mechanism25
was also observed in water solutions (Xiao et al., 1994) and was suggested to occur
in snow (Lalonde et al., 2002; Lalonde et al., 2003). GEM could also be produced
by the reduction of Hg(II) complexes by photochemically produced compounds. Hy-
18241
ACPD
7, 18221–18268, 2007
Mercury in the snow
and firn at Summit
Station, Greenland
X. Faın et al.
Title Page
Abstract Introduction
Conclusions References
Tables Figures
◭ ◮
◭ ◮
Back Close
Full Screen / Esc
Printer-friendly Version
Interactive Discussion
EGU
droperoxyl radical (HO•
2) was proposed as a potential reductant of Hg(II) in liquid water
(Lin and Pehkonen, 1999). This hypothesis has to be considered carefully, since a
recent study based on thermodynamic considerations showed that reduction of Hg(II)
by HO•
2 radicals should be of minor importance (Gardfeldt and Jonsson, 2003). Sjost-
edt et al. (2007) reported the first measurements of peroxy radicals above the Summit5
snowpack. The majority of HO•
2 radicals in the SIA are generated via the photolysis
of O3, H2O2, HONO and CH2O. Thus HO•
2 concentrations exhibit a diel pattern with
maximum values at midday, but levels above zero at night. Humic acids may also play
a central role in the degradation of Hg(II) molecules by producing reactive species.
These mixtures of organic macromolecules can transfer electrons to species adsorbed10
on their surfaces when irradiated over broad spectral regions.
Laboratory flux chamber measurements indicated that GEM is first driven by solar
radiation (especially UVA and UVB radiation), and then could be enhanced when liq-
uid water is observed in the snowpack (Dommergue et al., 2007; Faın et al., 2007).
Global irradiation and air temperatures were higher during summer 2005 as compared15
to spring 2006: the evolution of these two environmental parameters from spring to
summer favored an increase in the photo-production processes of GEM. Higher atmo-
spheric GEM concentrations measured during summer (∼1.8 ng m−3
) as compared to
spring background levels (∼1.6 ng m−3
) could be the result of GEM emission from the
snowpack to the atmosphere.20
Our 2005 data showed an increase in the mean GEM concentration with depth, and
a maximum was measured at a depth of 120 cm. This could be explained by sampler-
induced advection from concentrated layers located close to the surface. However,
dark production of GEM could also occur, as previously reported from snow samples
collected in a mid-latitude snowpack (Lalonde et al., 2003), inside an alpine snowpack25
(Faın et al., 2007) and inside an arctic snowpack (Ferrari et al., 2004b).
18242
ACPD
7, 18221–18268, 2007
Mercury in the snow
and firn at Summit
Station, Greenland
X. Faın et al.
Title Page
Abstract Introduction
Conclusions References
Tables Figures
◭ ◮
◭ ◮
Back Close
Full Screen / Esc
Printer-friendly Version
Interactive Discussion
EGU
3.4.7 Seasonal variations of GEM concentration
Environmental parameters such as irradiation and temperature, as well as the snow
and the snow air compositions, evolved from spring to summer and led to a change in
the relative importance of both GEM destruction and GEM production mechanisms in
the SIA at Summit. However, we observed mean GEM concentrations in the SIA that5
were lower during spring and higher during summer than the atmospheric level. This
suggests that GEM concentrations, up to a depth of three meters in the SIA, could ex-
hibit a yearly variation with low concentrations during spring and higher concentrations
during summer. However, no measurements were available for winter time. Using GEM
concentrations collected from 15 to 30 m depths and diffusion modeling, we first inves-10
tigated if any seasonal variations in GEM concentrations close to the surface could
affect GEM levels in the deep firn air, thereby affecting the long-term record that is rep-
resented by the deep firn air. We then characterized the mean value and the amplitude
of the seasonal variation expected in the shallow firn.
3.5 GEM in the firn air15
3.5.1 Do chemical processes exist in the deep firn air?
GEM concentrations measured at 15, 25 and 30 m depths in the firn were respectively
1.78±0.17 ng m−3
(n=6), 1.68±0.08 ng m−3
(n=2) and 1.70±0.17 ng m−3
(n=6). These
measurements were taken at depths too high to be significantly impacted by sampler-
induced air flow from the snow surface down to these levels; rather, these concen-20
trations represent interstitial air from the nearest permeable layer. These values are
all close to the atmospheric level of ∼1.65 ng m−3
. As discussed in Sect. 3.4.2., dark
destruction of GEM was occurring in the SIA close to the surface. Such processes ob-
viously do not exit in the firn at depths of 15 to 30 m, because the GEM concentrations
observed are not null. However, the temperature at both 15 and 2 m depths are similar25
during spring, and close to the mean annual temperature of the site (i.e. ∼-32◦C). We
18243

ACPD
7, 18221–18268, 2007
Mercury in the snow
and firn at Summit
Station, Greenland
X. Faın et al.
Title Page
Abstract Introduction
Conclusions References
Tables Figures
◭ ◮
◭ ◮
Back Close
Full Screen / Esc
Printer-friendly Version
Interactive Discussion
EGU
assume that the source of Br2 required for dark GEM destruction no longer exists in
the firn air at a depth of 15 m and below. To our knowledge, measurements of ozone
concentrations have never been reported for deep polar firn air, but O3 is a rather re-
active gas which is not preserved in the air bubbles trapped in ice cores. The sinks of
ozone are multiple, in the sunlit snow as well as in dark conditions. The atmospheric5
sources of ozone are much more limited and always require solar radiation. Thus, we
suggest that the entire firn air column from a depth of 15 m to the bottom could exhibit
null concentrations of ozone, and consequently null Br2 concentrations, an oxidant for
GEM in dark conditions.
3.5.2 Firn structure and modeling10
Figure 8 presents a conceptual model of the firn at Summit Station. We can think of
the firn as having three primary zones: the chemical zone (CZ), the diffusion zone
(DZ) and the lock-in zone. The chemical zone extends from the surface to 2.7 m (zC)
and GEM levels within this zone are determined by both chemical and physical pro-
cesses. These are discussed in detail in the previous section. Daily variations of GEM15
concentrations in the near-surface snow air lead to bi-directional fluxes between the
shallow firn and the lower atmosphere. The diffusion zone extends from the bottom of
the chemical zone to the top of the lock-in zone, and is comprised of an openly porous
and permeable matrix in which the air’s composition is determined solely by physical
processes (as shown in Sect. 3.5.1., there is no chemical alteration of GEM below zC).20
The diffusion zone ends at the top of the lock-in zone (zD). Within the lock-in zone, im-
permeable winter layers prevent the vertical diffusion of air, but persistent open porosity
in the summer layers allows the extraction of samples (Martinerie et al., 1992). At still-
greater depths, when the overburden is sufficient, all pores become closed and air can
no longer be extracted. This defines the firn-ice transition.25
We used a 1-D forward model developed by Rommelaere et al. (1997) to under-
stand how the variations of GEM concentrations occurring in the chemical zone could
influence the GEM levels recorded in the air of the diffusion zone. Diffusion zone pro-
18244
ACPD
7, 18221–18268, 2007
Mercury in the snow
and firn at Summit
Station, Greenland
X. Faın et al.
Title Page
Abstract Introduction
Conclusions References
Tables Figures
◭ ◮
◭ ◮
Back Close
Full Screen / Esc
Printer-friendly Version
Interactive Discussion
EGU
cesses taken into account to simulate GEM transport were molecular diffusion, gravi-
tational fractionation, and a downward air flux due to bubble closure sequestering air
from open pores (see Fig. 8). This sequestered air must be replaced by air coming
from the upper part of the firn, thus creating a downward flux. Surface temperature
and accumulation rate were set to their present day values and assumed to be con-5
stant throughout the model run. We used firn structure parameters (density, open and
closed porosity) from EUROCORE drilling (Schwander et al., 1993). Free-air diffusivity
of GEM is given by Eq. (1) while Eq. (2) gives the diffusivity of GEM within the firn
(i.e. Deff, see Sect. 3.4.3). Deff depends on the firn tortuosity which increases progres-
sively with depth. A null value of the ratio l/τ at the top of the lock-in zone means that10
diffusion ceases at this depth. In short, the GEM effective diffusivity decreases from
the snow surface value to zero at the close-off. We used tortuosity data reconstructed
from CO2 record to determine the GEM Deff profile at Summit. See Fabre et al. (2000)
for a more complete description of the method.
3.5.3 Age distribution15
Due to transport processes, the firn air at a given depth is not characterized by a single
age, but by a distribution of ages (Schwander et al., 1993; Trudinger et al., 2002). We
used our diffusion model to generate age distributions G(z,t) of GEM. This approach
has been used in various studies for a variety of gases with seasonal atmospheric cy-
cles (Trudinger et al., 2002; Montzka et al., 2004; Assonov et al., 2007). The distribution20
for depth z represents the relative contribution of different ages, where∑
G(z, t)≡1. The
age distributions at the depths of 30 m, 40 m, 50 m, 60 m, 69 m and 70 m are shown
in Fig. 9. For example, point A indicates that 20% of GEM in the firn air at a depth of
30 m was in the atmosphere 2 years ago. Point B shows that 4% of GEM at a depth
of 70 m is 15 years old. Above 70 m, the distributions show non-zero values for the25
first year (for example, ∼4% at a depth of 60 m). At 70 m and below, air is at least two
years old. Consequently, the annual variations of GEM concentrations at the bottom
of the chemical zone (depth zC) cannot influence the firn air record below 70 m. In
18245
ACPD
7, 18221–18268, 2007
Mercury in the snow
and firn at Summit
Station, Greenland
X. Faın et al.
Title Page
Abstract Introduction
Conclusions References
Tables Figures
◭ ◮
◭ ◮
Back Close
Full Screen / Esc
Printer-friendly Version
Interactive Discussion
EGU
short, GEM values below a depth of 70 m record the annual mean concentrations of
the bottom of the CZ.
For the firn air above 70 m, we have to examine to which extent GEM variations in
the CZ influence the GEM concentrations that are measured deeper. Using an intuitive
approach, we perceive that the amplitude of the variations of GEM concentrations in5
the CZ decreases as the depth increases. Indeed, GEM diffusion takes longer as the
air is deeper. For a better estimate of the diffusion of GEM variations in the CZ, we
can adapt our transport model using different variation scenarios. We modeled their
diffusion from the bottom of the CZ into the diffusion zone and compare this data to our
field measurements.10
3.5.4 Downward diffusion of seasonal GEM variations
As discussed in Sect. 3.4.5, GEM concentrations were stable in the atmosphere, but
showed seasonal variations in the firn down to zC (2.7 m) due to chemical processes
and transport. These variations have an influence even below the chemical zone as
they diffuse downward. However, due to decreasing diffusivity of the firn with depth,15
the amplitude of the seasonal GEM cycle also steadily decreases with depth, vanishing
completely at a depth of 70 m (see Sect. 3.5.2). In order to understand the downward
propagation of this seasonal signal through the diffusion zone, we simulated seven
different seasonal cycles and compared them to firn-air observations between 15 and
30 m depths. The cycles we considered are shown in Fig. 10 and are composed of20
three distinct modes: constant concentrations close to the atmospheric background,
periods with elevated GEM concentrations relative to atmospheric background and
periods with depleted GEM concentrations relative to background. A constant con-
centration of ∼1.65 ng m−3
at the bottom of the chemical zone will arise if there is no
chemistry in the shallow firn, or if there is equilibrium between production and destruc-25
tion of GEM. Concentrations higher than atmospheric values occur when production
processes dominate, as we observed during summer 2005. GEM concentrations be-
low atmospheric levels will occur when oxidation exceeds production in the shallow firn,
18246
ACPD
7, 18221–18268, 2007
Mercury in the snow
and firn at Summit
Station, Greenland
X. Faın et al.
Title Page
Abstract Introduction
Conclusions References
Tables Figures
◭ ◮
◭ ◮
Back Close
Full Screen / Esc
Printer-friendly Version
Interactive Discussion
EGU
as we observed during spring 2006. All cycles were run for 16 years with a time step
of 7.3 days. The age distribution (see Fig. 9) shows that 98 % of the firn air is between
0 to 16 year old at a depth of 30 m (16∑
t=0
G(30, t)=98%). For each of the scenarios de-
scribed in Fig. 10, we calculated the depth zSEAS at which the amplitude of any GEM
variation is less than 0.15 ng m−3
, the uncertainty of our GEM analyzer. These values5
are presented in Table 1. The location of zSEAS depends on both the amplitude of the
GEM variations and the length of the constant concentration period (with GEM level
of ∼1.65 ng m−3
). Table 1 also includes the concentration of GEM at zSEAS. Below
zSEAS, the GEM variations originating in the top layers of the snowpack are no longer
observable. As shown by scenario 1, 2 and 3, an increase of the amplitude between10
maximum and minimum concentrations leads to an increase in the depth zSEAS. An in-
crease in the period with stable concentrations (of about ∼1.65 ng m−3
) reduces zSEAS
(compare cycles 2, 6 and 7). As expected, for all cycles, concentrations at zSEAS are
close to the mean concentration at the bottom of the chemical zone. While the different
trial cycles do lead to a range of values for zSEAS, none has any influence on the firn15
air below a depth of 35 m.
Using our observations from 15 to 30 m depths, we are able to further constrain the
shape of the seasonal GEM cycle expected at the depth zc. We begin by assum-
ing zSEAS is at most 15 m, since GEM concentrations were constant from 15 to 30 m
depths. To be consistent with measurements carried out in the chemical zone in both20
summer 2005 and spring 2006, we considered GEM concentrations at depth zC rang-
ing from a minimum at the beginning June (0.1 ng m−3
) to a maximum at the end of July
(2.9 ng m−3
), and we adjust winter concentrations to the constant atmospheric back-
ground (i.e. 1.65 ng m−3
). We fitted the mean annual concentration to ∼1.65 ng m−3
to
match the observed value at a depth of 15 m, and we adjusted the length of the winter25
(i.e. constant concentration period) so as to not observe GEM variations deeper than
15 meters. These constraints lead to cycle 7 in Fig. 10. The expression of this cycle in
the firn between zC and 30 m is shown in Fig. 11. The blue line indicates the expected
18247
ACPD
7, 18221–18268, 2007
Mercury in the snow
and firn at Summit
Station, Greenland
X. Faın et al.
Title Page
Abstract Introduction
Conclusions References
Tables Figures
◭ ◮
◭ ◮
Back Close
Full Screen / Esc
Printer-friendly Version
Interactive Discussion
EGU
GEM concentration profile in June and is consistent with data collected at 3.3, 15, 25
and 30 m. As discussed in Sect. 3.4.4, production or destruction of GEM in the shallow
firn can dominate, depending on season (spring vs. summer), leading to elevated or
depleted GEM concentrations. The results from the model presented in Fig. 11 lead
us to conclude that the annual mean concentration at a depth of 2.7 m in the firn air at5
Summit Station is close to the atmospheric level. This result is of prime importance:
we can interpret the signal from a depth of 15 m and the close-off solely as a record
of the long-term atmospheric trend. Moreover, the shape of cycle 7 (Fig. 10) indicates
that GEM chemistry in the snowpack probably occurs only during the brief period be-
tween May and September, which suggests that chemical processes involving GEM10
in the shallow firn could be linked to solar radiation. We assumed in this study that
no photochemical processes were occurring in the SIA below 60 cm depth, according
to Galbavy et al. (2007). However we expect that future studies will investigate the
transmission of solar irradiance deeper within the snowpack.
3.6 Implications for the transfer function15
Our measurements of GEM close to the surface revealed a high variability of GEM
concentrations on a daily time scale, as well as a seasonal shift in the chemical mech-
anisms affecting GEM levels. Daily fluctuations in GEM concentrations are too fast
relative to diffusion times to influence the firn GEM record beyond a depth of ∼3 m.
Moreover, our modeling work showed that seasonal variations are not expressed in the20
deep firn. In principle, the first 70 m of the firn could show signs of seasonality, but
our best estimates of the seasonal variations of GEM lead us to expect that only the
first 15 m of the firn air contain detectable influences of shallow-firn chemistry. This
implies that firn air from a depth of 15 m to the close-off has the potential to be used
to reconstruct the atmospheric history of GEM over the last decades. Furthermore,25
the conservative nature of GEM below ∼3 m indicates that it is possible to calculate
the GEM transfer function at Summit Station using more detailed information on the
diffusivity of the firn between ∼3 m and the close-off.
18248
ACPD
7, 18221–18268, 2007
Mercury in the snow
and firn at Summit
Station, Greenland
X. Faın et al.
Title Page
Abstract Introduction
Conclusions References
Tables Figures
◭ ◮
◭ ◮
Back Close
Full Screen / Esc
Printer-friendly Version
Interactive Discussion
EGU
4 Conclusions
Atmospheric Mercury Depletion Events were not observed at Summit Station during
both summer 2005 and spring 2006, and are unlikely to occur, since Ozone Deple-
tion Events have never been reported for this site. In air extracted from the snowpack
between 40 and 200 cm depths, GEM concentrations showed variability at daily and5
seasonal time scales. Both production and oxidation of GEM were observed during
spring (beginning of June) and summer (end of July), but the respective contributions
of each process change with time during the season. Oxidation is the dominant mech-
anism during spring, and production dominates during summer. We postulate that dark
oxidation chemistry can influence GEM levels in the SIA. While the shallowest firn at10
Summit Station acts as a source and a sink of GEM for the lower atmosphere, the
deeper firn air contains a record of the evolution of atmospheric GEM concentrations
since it is not perturbed by surface processes. In particular, the daily variations of GEM
concentrations are too rapid to influence the firn record and the influence of seasonal
variations does not extend below the first 15 m of the firn. From a depth of 15 m to the15
close-off (about ∼79.5 m at Summit Station), the firn air should provide a record of the
past atmospheric GEM composition.
Acknowledgements. This research was funded by U.S. National Science Foundation Office
of Polar Programs project NSF-OPP 0520445, the French PNCA program “Echanges Neige
Polaire”, the French Ministry of Research (A.C.I. JC 3012) and the Laboratoire de Glaciolo-20
gie et Geophysique de l’Environnement (LGGE, Grenoble, France). We thank our Summit
collaborators for their assistance during the field campaigns (especially Z. Courville of Dart-
mouth/CRREL, Chandler Engel of UVM, and Meaghan Tanguay of Bowdoin College). The
summer Summit crew, VECO Polar Resources and the Air National Guard provided logistical
support during the field experiments. We thank the Danish Polar Board and Greenlandic Home25
Rule Government for permission to work in Greenland, and the technical staff of LGGE for help
in preparing our field campaigns. Thanks are also due to X. Bigard and N. Simler who helped
for the calibration of our instruments (CRSSA, La Tronche France), and to the Institute for Atmo-
spheric and Climate Science (ETH, Zurich, Switzerland) for providing us meteorological data.
C. Ferrari thanks the Institut Universitaire de France (I.U.F.) for helping to finance this study. In30
18249
ACPD
7, 18221–18268, 2007
Mercury in the snow
and firn at Summit
Station, Greenland
X. Faın et al.
Title Page
Abstract Introduction
Conclusions References
Tables Figures
◭ ◮
◭ ◮
Back Close
Full Screen / Esc
Printer-friendly Version
Interactive Discussion
EGU
Italy this work was supported by the Consorzio per l’Attuazione del Programma Nazionale delle
Ricerche in Antartide, under projects on Environmental Contamination and Glaciology. ELGA
LabWater is acknowledged for providing the PURELAB Option-R and Ultra Analytic systems,
which produced the ultra-pure water used in ICPMS experiments.
References5
Albert, M. R.: Modeling heat, mass, and species transport in polar firn, Ann. Glaciol., 23, 138–
143, 1996.
Albert, M. R., Grannas, A. M., Bottenheim, J., Shepson, P. B., and Perron Jr., F. E.: Processes
and properties of snow-air transfer in the high Arctic with application to interstitial ozone at
Alert, Canada, Atmos. Environ., 36, 2779–2787, 2002.10
Albert, M. R. and Shultz, E. F.: Snow and firn properties and air-snow transport processes at
Summit, Greenland, Atmos. Environ., 36, 2789–2797, 2002.
Ariya, P. A., Dastoor, A. P., Aymot, M., Schroeder, W. H., Barrie, L. A., Anlauf, K., Raofie, F.,
Ryzhkov, A., Davignon, D., Lalonde, J. D., and Steffen, A.: The Artic, a sink for mercury,
Tellus, 56B, 397–403, 2004.15
Ariya, P. A., Khalizov, A., and Gidas, A.: Reactions of gaseous mercury with atomic and molec-
ular halogens: kinetics, product studies, and atmospheric implications, J. Phys. Chem. A,
106, 7310–7320, 2002.
Aspmo, K., Gauchard, P. A., Steffen, A., Temme, C., Berg, T., Balhmann, E., Banic, C., Dom-
mergue, A., Ebinghaus, R., Ferrari, C., Pirrone, N., Sprovieri, F., and Wibetoe, G.: Measure-20
ments of atmospheric mercury species during an international study of mercury depletion
events at Ny-Alesund, Svalbard, spring 2003. How reproducible are our present methods?,
Atmos. Environ., 39, 7607–7619, doi:10.1016/j.atmosenv.2005.07.065, 2005.
Assonov, S. S., Brenninkmeijer, C. A. M., Jockel, P., Mulvaney, R., Bernard, S., and Chappellaz,
J.: Evidence for a CO increase in the SH during the 20th century based on firn air samples25
from Berkner Island, Antarctica, Atmos. Chem. Phys., 7, 295–308, 2007,
http://www.atmos-chem-phys.net/7/295/2007/.
Battle, M., Bender, M. L., Sowers, T., Tans, P. P., Butler, J. H., Elkins, J. W., Ellis, J. T., Conway,
T., Zhang, N., Lang, P., and Clarke, A. D.: Atmospheric gas concentrations over the past
century measured in air from firn at the South Pole, Nature, 383, 231–235, 1996.30
18250
ACPD
7, 18221–18268, 2007
Mercury in the snow
and firn at Summit
Station, Greenland
X. Faın et al.
Title Page
Abstract Introduction
Conclusions References
Tables Figures
◭ ◮
◭ ◮
Back Close
Full Screen / Esc
Printer-friendly Version
Interactive Discussion
EGU
Biester, H., Bindler, R., Martinez-Cortizas, A., and Engstrom, D. R.: Modeling the past atmo-
spheric deposition of mercury using natural archives, Environ. Sci. Technol., 41, 4851–4860,
doi:10.1021/es0704232, 2007.
Boutron, C. F., Vandal, G. M., Fitzgerald, W. F., and Ferrari, C. P.: A forty-year record of mercury
in central Greenland snow, Geophys. Res. Lett., 25, 3315–3318, 1998.5
Brooks, S., Arimoto, R., Lindberg, S., and Southwork, G.: Antarctic polar plateau snow surface
conversion of deposited oxidized mercury to gaseous elemental mercury with fractional long-
term burial, Atmos. Environ., doi:10.1016/j.atmosenv.2007.05.029, 2007.
Butler, J. H., Battle, M., Bender, M. L., Montzka, S. A., Clarke, A. D., Saltzmank, E. S., Sucher,
C. M., Severinghaus, J. P., and Elkins, J. W.: A record of atmospheric halocarbons during10
the twentieth century from polar firn air, Nature, 399, 749–755, 1999.
Dibb, J. E., Albert, M., Anastasio, C., Atlas, E., Beyersdorf, A. J., Blake, N. J., Blake, D. R.,
Bocquet, F., Burkhart, J. F., Chen, G., Cohen, L., Conway, T. J., Courville, Z., Frey, M. M.,
Friel, D. K., Galbavy, E. S., Hall, S., Hastings, M. G., Helmig, D., Huey, L. G., Hutterli, M.
A., Jarvis, J. C., Lefer, B. L., Meinardi, S., Neff, W., Oltmans, S. J., Rowland, F. S., Sjost-15
edt, S. J., Steig, E. J., Swanson, A., and Tanner, D. J.: An overview of air-snow exchange
at Summit, Greenland: recent experiments and findings, Atmos. Environ., 41, 4995–5006,
doi:10.1016/j.atmosenv.2006.12.006, 2007.
Domine, F., Albert, M. R., Huthwelker, T., Jacobi, H.-W., Kokhanovsky, A. A., Lehning, M.,
Picard, G., and Simpson, W. R.: Snow physics as relevant to snow photochemistry, Atmos.20
Chem. Phys. Discuss., 7, 5941–6036, 2007,
http://www.atmos-chem-phys-discuss.net/7/5941/2007/.
Dommergue, A., Balhmann, E., Ebinghaus, R., Ferrari, C., and Boutron, C.: Laboratory sim-
ulation of Hg◦
emissions from a snowpack, Anal. Bioanal. Chem., doi:10.1007/s00216-007-
1186-2, 2007.25
Dommergue, A., Ferrari, C. P., and Boutron, C. F.: First investigation of an original device
dedicated to the determination of gaseous mercury in interstitial air in snow, Anal. Bioanal.
Chem., 375, 106–111, 2003a.
Dommergue, A., Ferrari, C. P., Poissant, L., Gauchard, P.-A., and Boutron, C. F.: Diurnal cycles
of gaseous mercury within the snowpack at Kuujjuarapik/Whapmagoostui, Quebec, Canada,30
Environ. Sci. Technol., 37, 3289–3297, 2003b.
Ebinghaus, R., Jennings, S. G., Schroeder, W. H., Berg, T., Donaghy, T., Guentzel, J., Kenny,
C., Kock, H. H., Kvietkus, K., Landing, W., Muhleck, T., Munthe, J., Prestbo, E. M., Schnee-
18251
ACPD
7, 18221–18268, 2007
Mercury in the snow
and firn at Summit
Station, Greenland
X. Faın et al.
Title Page
Abstract Introduction
Conclusions References
Tables Figures
◭ ◮
◭ ◮
Back Close
Full Screen / Esc
Printer-friendly Version
Interactive Discussion
EGU
berger, D., Slemr, F., Sommar, J., Urba, A., Wallschlager, D., and Xiao, Z.: International field
intercomparison measurements of atmospheric mercury species at Mace Head, Ireland, At-
mos. Environ., 33, 3063–3073, 1999.
Ebinghaus, R. and Slemr, F.: Aircraft measurements of atmospheric mercury over southern
and eastern Germany, Atmos. Environ., 34, 895–903, 2000.5
Engstrom, D. R. and Swain, E. B.: Recent Declines in Atmospheric Mercury Deposition in the
Upper Midwest, Environ. Sci. Technol., 31, 960–967, 1997.
Fabre, A., Barnola, J.-M., Arnaud, L., and Chappellaz, J.: Determination of gas diffusivity in po-
lar firn: comparison between experimental measurements and inverse modeling, Geophys.
Res. Lett., 27, 557–560, 2000.10
Faın, X., Grangeon, S., Balhmann, E., Fritsche, J., Obrist, D., Dommergue, A., Ferrari, C.,
Cairns, W., Ebinghaus, R., Barbante, C., Cescon, P., and Boutron, C.: Diurnal production of
Gaseous Mercury in the alpine snowpack before snowmelt, J. Geophys. Res., 112, D21311,
doi:10.1029/2007JD008520, 2007.
Ferrari, C. P., Dommergue, A., and Boutron, C. F.: Profiles of Mercury in the snow pack15
at Station Nord, Greenland shortly after polar sunrise, Geophys. Res. Lett., 31, L03401,
doi:10.1029/2003GL018961, 2004a.
Ferrari, C. P., Dommergue, A., Skov, H., Goodsite, M., and Boutron, C. F.: Nighttime production
of elemental gaseous mercury in interstitial air of snow at Station Nord, Greenland, Atmos.
Environ., 38, 2727–2735, 2004b.20
Ferrari, C. P., Moreau, A. L., and Boutron, C. F.: Clean conditions for the determination of
ultra-low levels of mercury in ice and snow samples, Fresen, J. Anal. Chem., 366, 433–437,
2000.
Foster, K. L., Plastridge, R. A., Bottenheim, J., Shepson, P., Finlayson-Pitts, B. J., and Spicer,
C. W.: The role of Br2 and BrCl in surface ozone destruction at polar sunrise, Science, 291,25
471, 2001.
Galbavy, E. S., Anastasio, C., Lefer, B. L., and Hall, S.: Light penetration in the snow-
pack at Summit, Greenland: part 2 nitrate photolysis, Atmos. Environ., 41, 5091–5100,
doi:10.1016/j.atmosenv.2006.01.066, 2007.
Gardfeldt, K. and Jonsson, M.: Is bimolecular reduction of Hg(II) complexes possible in aque-30
ous systems of environmental importance, J. Phys. Chem. A, 107, 4478–4482, 2003.
Goodsite, M. E., Plane, J. M. C., and Skov, H.: A Theoretical Study of the Oxidation of Hg◦
to
HgBr2 in the Troposphere, Environ. Sci. Technol., 38, 1772–1776, 2004.
18252
ACPD
7, 18221–18268, 2007
Mercury in the snow
and firn at Summit
Station, Greenland
X. Faın et al.
Title Page
Abstract Introduction
Conclusions References
Tables Figures
◭ ◮
◭ ◮
Back Close
Full Screen / Esc
Printer-friendly Version
Interactive Discussion
EGU
Helmig, D., Bocquet, F., Cohen, L., and Oltmans, S. J.: Ozone uptake to the polar snowpack at
Summit, Greenland, Atmos. Environ., 41, 5061–5076, doi:10.1016/j.atmosenv.2006.06.064,
2007a.
Helmig, D., Oltmans, S. J., Carlsona, D., Lamarque, J.-F., Jones, A., Labuschagne, C., Anlauf,
K., and Hayden, K.: A review of surface ozone in the polar regions, Atmos. Environ., 41,5
5138–5161, doi:10.1016/j.atmosenv.2006.09.053, 2007b.
Khal, J. D., Martinez, D. A., Kuhns, H., Davidson, C. I., Jaffrezo, J.-L., and Harris, J. M.: Air
mass trajectories to Summit, Greenland: a 44-year climatology and some episodic events,
J. Geophys. Res, 102, 26 861–26 875, 1997.
Lalonde, J. D., Amyot, M., Doyon, M.-R., and Auclair, J.-C.: Photo-induced Hg(II) reduction in10
snow from the remote and temperate Experimental Lake Area (Ontario, Canada), J. Geo-
phys. Res, 108, doi:10.1029/2001JD001534, 2003.
Lalonde, J. D., Poulain, A. J., and Amyot, M.: The Role of Mercury Redox Reactions in Snow
on Snow-to-Air Mercury Transfer, Environ. Sci. Technol., 36, 174–178, 2002.
Lamborg, C. H., Fitzgerald, W. F., O’Donnell, J., and Torgersen, T.: A nonsteady-state com-15
partemental model of global-scale mercury biogeochemistry with interhemispheric atmo-
spheric gradients, Geochim. Cosmochim. Ac., 66, 1105–18, 2002.
Lin, C.-J. and Pehkonen, S. O.: The chemistry of atmospheric mercury: a review, Atmos.
Environ., 33, 2067–2079, 1999.
Lindberg, S. E., Brooks, S., Lin, C.-J., Scott, K. J., Landis, M. S., Stevens, R. K., Goodsite, M.,20
and Richter, A.: Dynamic Oxidation of Gaseous Mercury in the Arctic Troposphere at Polar
Sunrise, Environ. Sci. Technol., 36, 1245–1256, 2002.
Lindqvist, O. and Rodhe, H.: Atmospheric mercury-a review, Tellus, 37B, 136–159, 1985.
Lu, J. Y., Schroeder, W. H., Barrie, L. A., Steffen, A., Welch, H. E., Martin, K., Lockhart, L.,
Hunt, R. V., Boila, G., and Richter, A.: Magnification of atmospheric mercury deposition to25
polar regions in springtime: the link to tropospheric ozone depletion chemistry, Geophys.
Res. Lett., 28, 3219–3222, 2001.
Mann, J. L., Long, S. E., Shuman, C. A., and Kelly, W. R.: Determination of mercury content
in a shallow firn core from greenland by isotope dilution inductively coupled plasma mass
spectrometry, Water Air Soil Poll., 163, 29–32, 2004.30
Martinerie, P., Raynaud, D., Etheridge, D. M., Barnola, J.-M., and Mazaudier, D.: Physical and
climatic parameters which influence the air content in polar ice, Earth Planet. Sci. Lett., 112,
1–13, 1992.
18253
ACPD
7, 18221–18268, 2007
Mercury in the snow
and firn at Summit
Station, Greenland
X. Faın et al.
Title Page
Abstract Introduction
Conclusions References
Tables Figures
◭ ◮
◭ ◮
Back Close
Full Screen / Esc
Printer-friendly Version
Interactive Discussion
EGU
Mason, R. P., Fitzgerald, W. F., and Morel, F. M. M.: The biogeochemical cycling of elemental
mercury : anthropogenic influences, Geochim. Cosmochim. Ac., 58, 3191–3198, 1994.
Mason, R. P. and Sheu, G.-R.: Role of the ocean in the global mercury cycle, Global. Bio-
gechem. Cy., 16, 1093, 2002.
Massman, W. J.: Molecular diffusivities of Hg vapor in air, O2 and N2 near STP and the kine-5
matic viscosity and thermal diffusivity of air near STP, Atmos. Environ., 33, 453–457, 1999.
Montzka, S. A., Aydin, M., Battle, M., Butler, J. H., Saltzman, E. S., Hall, B. D., Clarke,
A. D., Mondeel, D., and Elkins, J. W.: A 350-year atmospheric history for carbonyl sul-
fide inferred from Antarctic firn air and air trapped in ice, J. Geophys. Res, 109, D22302,
doi:10.1029/2004JD004686, 2004.10
Oum, K. W., Lakin, M. J., and Finlayson-Pitts, B. J.: Bromine activation in the troposphere by
the dark reaction of O3 with seawater ice, Geophys. Res. Lett., 25, 3929–3926, 1998.
Peterson, M. C. and Honrath, R. E.: Observations of rapid photochemical destruction of ozone
in snowpack interstitial air, Geophys. Res. Lett., 28, 511–514, 2001.
Planchon, F. A. M., Gabrielli, P., Gauchard, P. A., Dommergue, A., Barbante, C., Cairns, W.15
R. L., Cozzi, G., Nagorski, S. A., Ferrari, C. P., Boutron, C. F., Capodaglio, G., Cescon,
P., Varga, A., and Wolff, E. W.: Direct determination of mercury at the sub-picogram per
gram level in polar snow and ice by ICP-SFMS, J. Anal. Atmo. Spectrom., 19, 823–830,
doi:10.1039/b402711f, 2004.
Poulain, A. J., Lalonde, J. D., Amyot, M., Shead, J. A., Raofie, F., and Ariya, P. A.: Redox20
transformations of mercury in an Arctic snowpack at springtime, Atmos. Environ., 38, 6763–
6774, 2004.
Rommelaere, V., Arnaud, L., and Barnola, J.-M.: Reconstructing recent atmospheric trace gas
concentrations from polar firn and bubbly ice data by inverse methods, J. Geophys. Res, 102,
30 069–30 083, 1997.25
Schroeder, W. H., Anlauf, K. G., Barrie, L. A., Lu, J. Y., Steffen, A., Schneeberger, D. R., and
Berg, T.: Arctic springtime depletion of mercury, Nature, 394, 331–332, 1998.
Schroeder, W. H., Keeler, G., Kock, H., Roussel, P., Schneeberger, D., and Schaedlich, F.:
International field intercomparison of atmospheric mercury measurement methods, Water
Air Soil Poll., 80, 611–620, 1995.30
Schuster, P. F., Krabbenhoft, D. P., Naftz, D. L., Dewayne Cecil, L., Olson, M. L., Dewild, J. F.,
Susong, D. D., Green, J. R., and Abbott, M. L.: Atmospheric Mercury Deposition during the
Last 270 Years: A Glacial Ice Core Record of Natural and Anthropogenic Sources, Environ.
18254
ACPD
7, 18221–18268, 2007
Mercury in the snow
and firn at Summit
Station, Greenland
X. Faın et al.
Title Page
Abstract Introduction
Conclusions References
Tables Figures
◭ ◮
◭ ◮
Back Close
Full Screen / Esc
Printer-friendly Version
Interactive Discussion
EGU
Sci. Technol., 36, 2303–2310, 2002.
Schwander, J., Barnola, J.-M., Andrie, C., Leuenberger, M., Ludin, A., Raynaud, D., and Stauf-
fer, B.: The age of the air in the firn and the ice at Summit, Greenland, J. Geophys. Res, 98,
2831–2838, 1993.
Schwander, J., Stauffer, B., and Sigg, A.: Air mixing in firn and the age of the air at pore5
close-off, Ann. Glaciol., 10, 141–145, 1988.
Siegenthaler, U., Stocker, T., Monnin, E., Luthi, D., Schwander, J., Stauffer, B., Raynaud, D.,
Barnola, J.-M., Fischer, H., Masson-Delmotte, V., and Jouzel, J.: Stable carbon cycle–climate
relationship during the late pleistocene, Science, 310, 1313–1317, 2005.
Sjostedt, S. J., Huey, L. G., Tanner, D. J., Peischl, J., Chen, G., Dibb, J. E., B. Lefer, Hutterli,10
M. A., Beyersdor, A. J., Blake, N. J., Blake, D. R., Sueper, D., Ryerson, T., Burkhart, J., and
Stohl, A.: Observations of hydroxyl and the sum of peroxy radicals at Summit, Greenland dur-
ing summer 2003, Atmos. Environ., 41, 5122–5137, doi:10.1016/j.atmosenv.2006.06.065,
2007.
Skov, H., Christensen, J., Goodsite, M., Heidam, N. Z., Jensen, B., Wahlin, P., and Geernaert,15
G.: Fate of Elemental Mercury in the Arctic during Atmospheric Mercury Depletion Episodes
and the Load of Atmospheric Mercury to the Arctic, Environ. Sci. Technol., 38, 2373–2382,
2004.
Steffen, A., Schroeder, B., MacDonald, R. W., Poissant, L., and Konoplav, A.: Mercury in the
Arctic atmosphere: An analysis of eight years of measurements of GEM at Alert (Canada)20
and a comparison with observations at Amderma (Russia) and Kuujjuarapik (Canada), Sci.
Total. Environ., 342, 185–198, doi:10.1016/j.scitotenv.2004.12.048, 2005.
Swanson, A., Blake, N. J., Blake, D. R., Rowland, F. S., Dibb, J. E., Lefer, B. L., and Atlas, E.:
Are methyl halides produced on all ice surfaces? Observations from snow-laden .eld sites,
Atmos. Environ., 41, 5162–5177, doi:10.1016/j.atmosenv.2006.11.064, 2007.25
Tang, T. and McConnell, J. C.: Autocatalytic release of bromine from Arctic snowpack during
polar sunrise, Geophys. Res. Lett., 23, 2633–2636, 1996.
Tossel, J. A.: Calculation of the Energetics for Oxidation of Gas-Phase Elemental Hg by Br and
BrO, J. Phys. Chem. A, 107, 7804–7808, 2003.
Trudinger, C. M., Etheridge, D. M., Rayner, P. J., Enting, I. G., Sturrock, G. A., and Langenfelds,30
R. L.: Reconstructing atmospheric histories from measurements of air composition in firn, J.
Geophys. Res., 107, 2002.
Warren, S. G., Brandt, R. E., and Grenfell, T. C.: Visible and near-ultraviolet absorption spec-
18255
ACPD
7, 18221–18268, 2007
Mercury in the snow
and firn at Summit
Station, Greenland
X. Faın et al.
Title Page
Abstract Introduction
Conclusions References
Tables Figures
◭ ◮
◭ ◮
Back Close
Full Screen / Esc
Printer-friendly Version
Interactive Discussion
EGU
trum of ice from transmission of solar radiation into snow, Appl. Optics, 45, 5320–5334,
2006.
18256
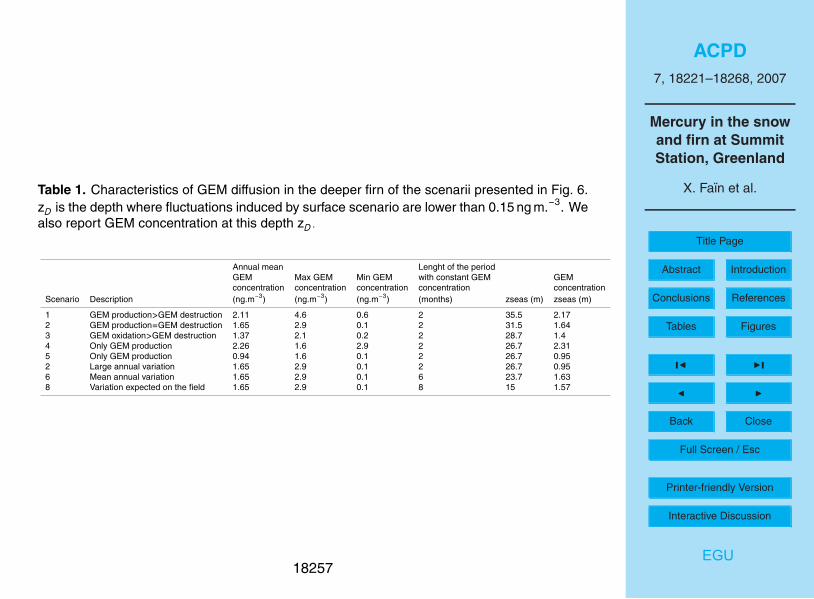
ACPD
7, 18221–18268, 2007
Mercury in the snow
and firn at Summit
Station, Greenland
X. Faın et al.
Title Page
Abstract Introduction
Conclusions References
Tables Figures
◭ ◮
◭ ◮
Back Close
Full Screen / Esc
Printer-friendly Version
Interactive Discussion
EGU
Table 1. Characteristics of GEM diffusion in the deeper firn of the scenarii presented in Fig. 6.
zD is the depth where fluctuations induced by surface scenario are lower than 0.15 ng m.−3
. We
also report GEM concentration at this depth zD.
Annual mean Lenght of the period
GEM Max GEM Min GEM with constant GEM GEM
concentration concentration concentration concentration concentration
Scenario Description (ng.m−3
) (ng.m−3
) (ng.m−3
) (months) zseas (m) zseas (m)
1 GEM production>GEM destruction 2.11 4.6 0.6 2 35.5 2.17
2 GEM production=GEM destruction 1.65 2.9 0.1 2 31.5 1.64
3 GEM oxidation>GEM destruction 1.37 2.1 0.2 2 28.7 1.4
4 Only GEM production 2.26 1.6 2.9 2 26.7 2.31
5 Only GEM production 0.94 1.6 0.1 2 26.7 0.95
2 Large annual variation 1.65 2.9 0.1 2 26.7 0.95
6 Mean annual variation 1.65 2.9 0.1 6 23.7 1.63
8 Variation expected on the field 1.65 2.9 0.1 8 15 1.57
18257
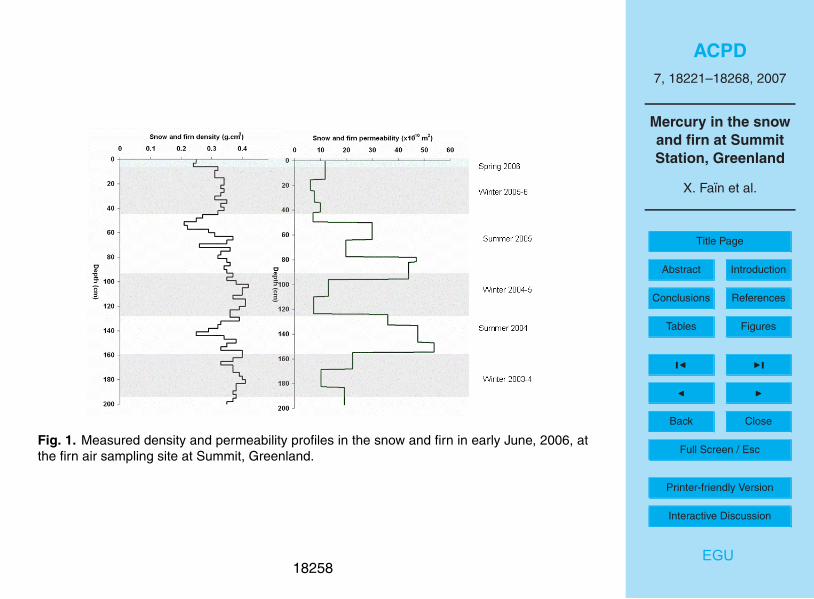
ACPD
7, 18221–18268, 2007
Mercury in the snow
and firn at Summit
Station, Greenland
X. Faın et al.
Title Page
Abstract Introduction
Conclusions References
Tables Figures
◭ ◮
◭ ◮
Back Close
Full Screen / Esc
Printer-friendly Version
Interactive Discussion
EGU
Fig. 1. Measured density and permeability profiles in the snow and firn in early June, 2006, at
the firn air sampling site at Summit, Greenland.
18258
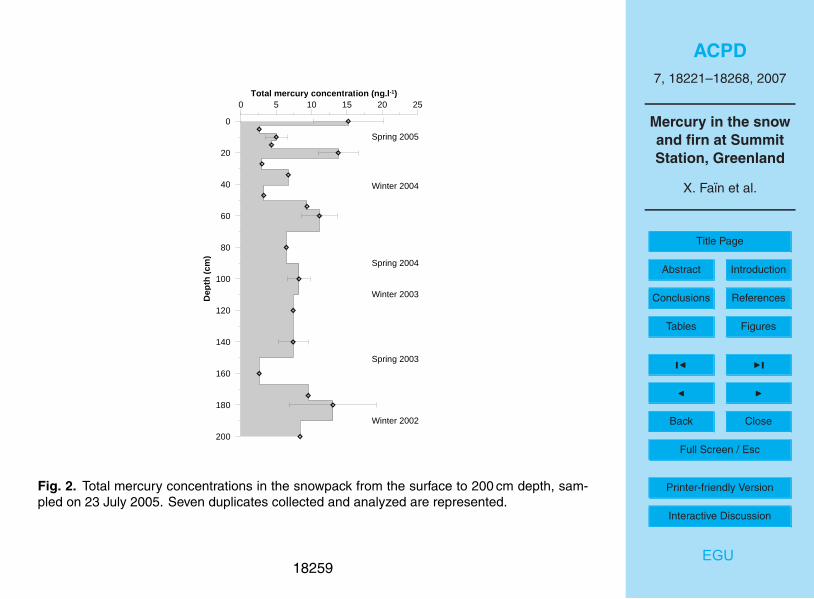
ACPD
7, 18221–18268, 2007
Mercury in the snow
and firn at Summit
Station, Greenland
X. Faın et al.
Title Page
Abstract Introduction
Conclusions References
Tables Figures
◭ ◮
◭ ◮
Back Close
Full Screen / Esc
Printer-friendly Version
Interactive Discussion
EGU
0 5 10 15 20 25Total mercury concentration (ng.l -1)
200
180
160
140
120
100
80
60
40
20
0
Dep
th (
cm)
Spring 2005
Winter 2004
Spring 2004
Spring 2003
Winter 2003
Winter 2002
Fig. 2. Total mercury concentrations in the snowpack from the surface to 200 cm depth, sam-
pled on 23 July 2005. Seven duplicates collected and analyzed are represented.
18259
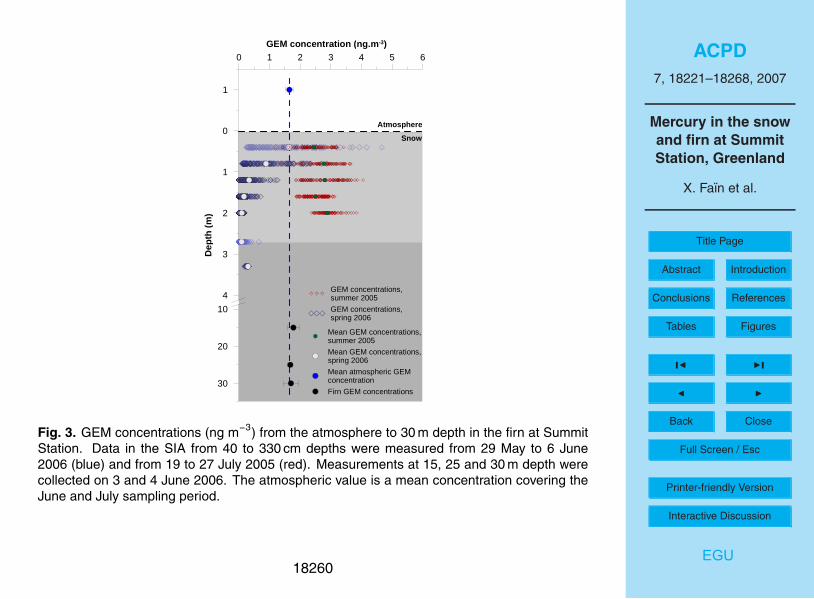
ACPD
7, 18221–18268, 2007
Mercury in the snow
and firn at Summit
Station, Greenland
X. Faın et al.
Title Page
Abstract Introduction
Conclusions References
Tables Figures
◭ ◮
◭ ◮
Back Close
Full Screen / Esc
Printer-friendly Version
Interactive Discussion
EGU
0 1 2 3 4 5 6
GEM concentration (ng.m-3)
4
3
2
1
0
-1
30
20
10
Dep
th (
m)
Mean GEM concentrations,summer 2005
Mean GEM concentrations,spring 2006
Mean atmospheric GEM concentration
Firn GEM concentrations
GEM concentrations,summer 2005
GEM concentrations,spring 2006
Atmosphere
Snow
Fig. 3. GEM concentrations (ng m−3
) from the atmosphere to 30 m depth in the firn at Summit
Station. Data in the SIA from 40 to 330 cm depths were measured from 29 May to 6 June
2006 (blue) and from 19 to 27 July 2005 (red). Measurements at 15, 25 and 30 m depth were
collected on 3 and 4 June 2006. The atmospheric value is a mean concentration covering the
June and July sampling period.
18260

ACPD
7, 18221–18268, 2007
Mercury in the snow
and firn at Summit
Station, Greenland
X. Faın et al.
Title Page
Abstract Introduction
Conclusions References
Tables Figures
◭ ◮
◭ ◮
Back Close
Full Screen / Esc
Printer-friendly Version
Interactive Discussion
EGU
18/7/05 19/7/05 20/7/05 21/7/05 22/7/05 24/7/05 25/7/05 26/7/05 27/7/05
Time
1
2
3
4
GE
M c
once
ntra
tion
(ng.
m- 3
)
Atmosphere40 cm depth80 cm depth120 cm depth180 cm depth200 cm depthIrradiation
0
200
400
600
800
So
lar
irra
dia
tio
n (
W.m
-2)
2
3
4
GE
M c
once
ntra
tion
(ng.
m-3
)
Fig. 4. GEM concentrations 1.5 m above the snow surface and at 40, 80, 120, 160 and 200 cm
depths in the SIA, from 18 to 27 July 2005, at Summit Station. The grey line reports the global
irradiation (W m−2
).
18261
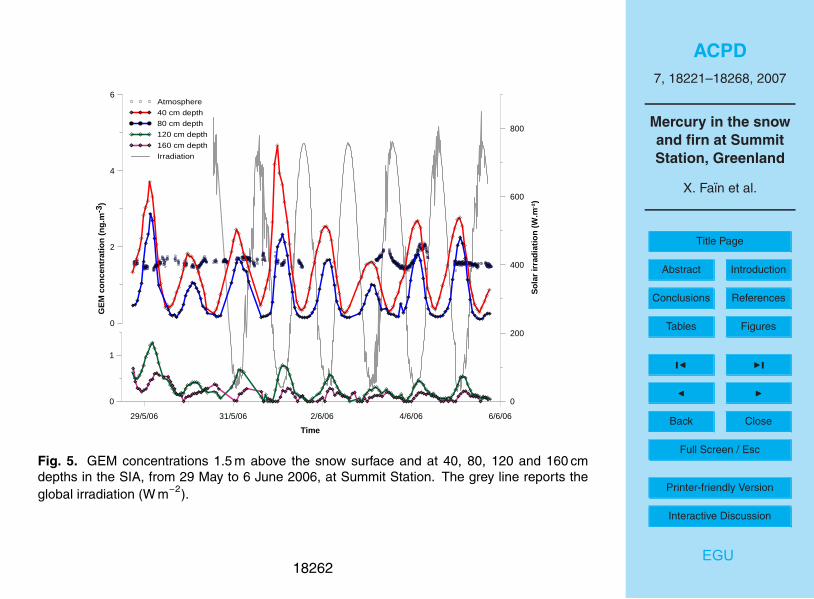
ACPD
7, 18221–18268, 2007
Mercury in the snow
and firn at Summit
Station, Greenland
X. Faın et al.
Title Page
Abstract Introduction
Conclusions References
Tables Figures
◭ ◮
◭ ◮
Back Close
Full Screen / Esc
Printer-friendly Version
Interactive Discussion
EGU
29/5/06 31/5/06 2/6/06 4/6/06 6/6/06
Time
0
1
0
200
400
600
800
So
lar
irra
dia
tio
n (
W.m
- ²)
Atmosphere
40 cm depth
80 cm depth
120 cm depth
160 cm depth
Irradiation
0
2
4
6G
EM
con
cent
ratio
n (n
g.m
-3)
Fig. 5. GEM concentrations 1.5 m above the snow surface and at 40, 80, 120 and 160 cm
depths in the SIA, from 29 May to 6 June 2006, at Summit Station. The grey line reports the
global irradiation (W m−2
).
18262
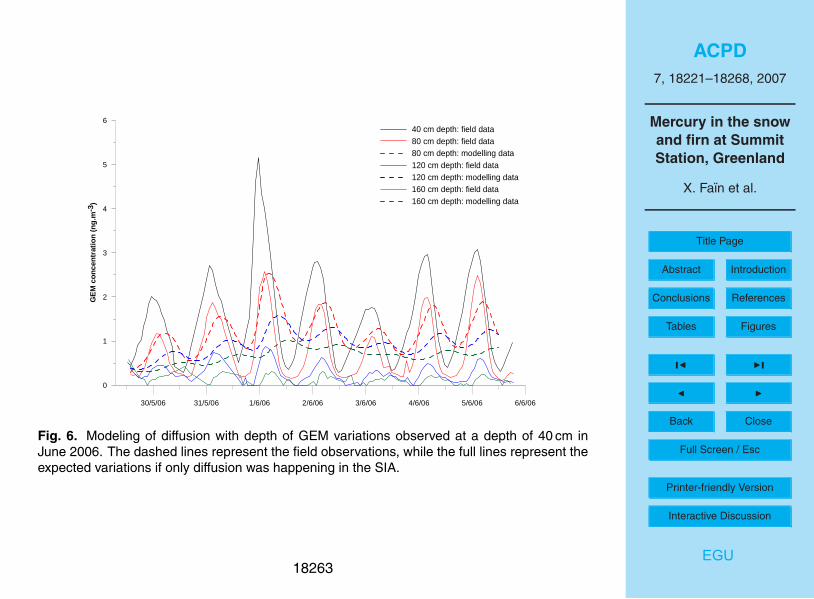
ACPD
7, 18221–18268, 2007
Mercury in the snow
and firn at Summit
Station, Greenland
X. Faın et al.
Title Page
Abstract Introduction
Conclusions References
Tables Figures
◭ ◮
◭ ◮
Back Close
Full Screen / Esc
Printer-friendly Version
Interactive Discussion
EGU
30/5/06 31/5/06 1/6/06 2/6/06 3/6/06 4/6/06 5/6/06 6/6/06
0
1
2
3
4
5
6
GE
M c
once
ntra
tion
(ng.
m-3
)
40 cm depth: field data80 cm depth: field data80 cm depth: modelling data120 cm depth: field data120 cm depth: modelling data160 cm depth: field data160 cm depth: modelling data
Fig. 6. Modeling of diffusion with depth of GEM variations observed at a depth of 40 cm in
June 2006. The dashed lines represent the field observations, while the full lines represent the
expected variations if only diffusion was happening in the SIA.
18263
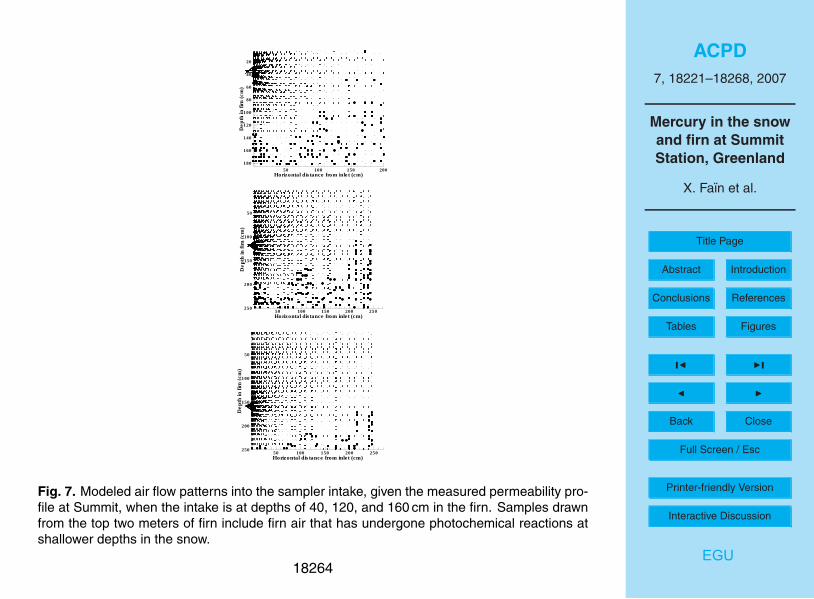
ACPD
7, 18221–18268, 2007
Mercury in the snow
and firn at Summit
Station, Greenland
X. Faın et al.
Title Page
Abstract Introduction
Conclusions References
Tables Figures
◭ ◮
◭ ◮
Back Close
Full Screen / Esc
Printer-friendly Version
Interactive Discussion
EGU
Horizontal dis tance from inle t (cm)
De
pth
infir
n(c
m)
50 100 150 200 250
50
100
150
200
250
Horizontal dis tance from inle t (cm)
Dep
thin
firn
(cm
)
50 100 150 200 250
50
100
150
200
250
Horizontal dis tance from inle t (cm)
Dep
thin
firn
(cm
)
50 100 150 200
20
40
60
80
100
120
140
160
180
Horizontal dis tance from inle t (cm)
De
pth
infir
n(c
m)
50 100 150 200 250
50
100
150
200
250
Horizontal dis tance from inle t (cm)
Dep
thin
firn
(cm
)
50 100 150 200 250
50
100
150
200
250
Horizontal dis tance from inle t (cm)
Dep
thin
firn
(cm
)
50 100 150 200
20
40
60
80
100
120
140
160
180
Fig. 7. Modeled air flow patterns into the sampler intake, given the measured permeability pro-
file at Summit, when the intake is at depths of 40, 120, and 160 cm in the firn. Samples drawn
from the top two meters of firn include firn air that has undergone photochemical reactions at
shallower depths in the snow.
18264
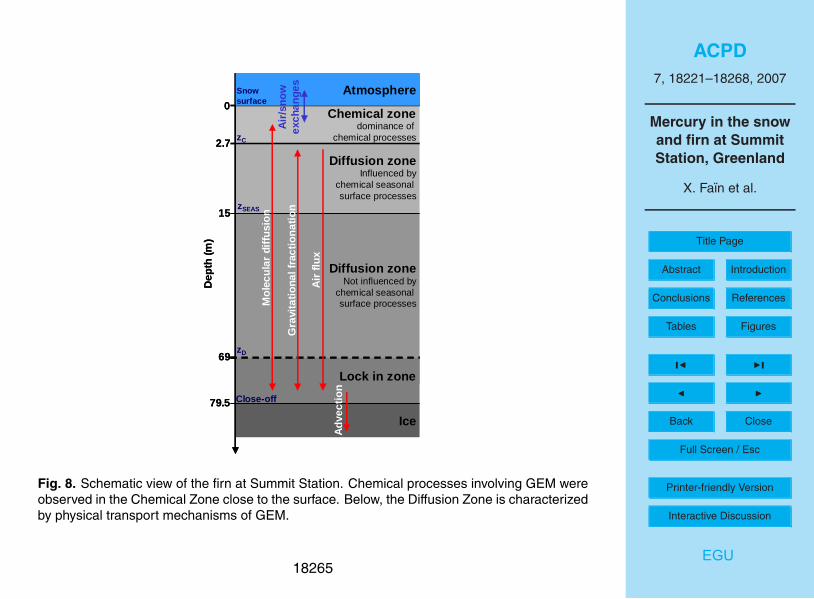
ACPD
7, 18221–18268, 2007
Mercury in the snow
and firn at Summit
Station, Greenland
X. Faın et al.
Title Page
Abstract Introduction
Conclusions References
Tables Figures
◭ ◮
◭ ◮
Back Close
Full Screen / Esc
Printer-friendly Version
Interactive Discussion
EGU
Atmosphere
Chemical zonedominance of
chemical processes
Diffusion zoneInfluenced by
chemical seasonal surface processes
Lock in zone
Ice
0
79.5
Diffusion zoneNot influenced by
chemical seasonal surface processesM
olec
ular
diff
usio
n
Gra
vita
tiona
l fra
ctio
natio
n
Air
flux
Adv
ectio
n
Dep
th (m
)
Air/
snow
exch
ange
s
Snow surface
zC
zD
zSEAS
Close-off
2.7
15
69
Fig. 8. Schematic view of the firn at Summit Station. Chemical processes involving GEM were
observed in the Chemical Zone close to the surface. Below, the Diffusion Zone is characterized
by physical transport mechanisms of GEM.
18265
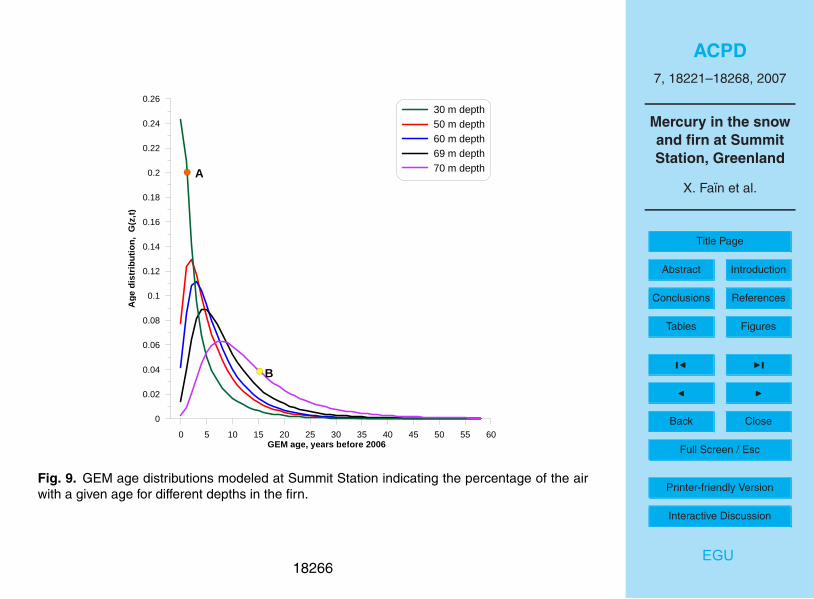
ACPD
7, 18221–18268, 2007
Mercury in the snow
and firn at Summit
Station, Greenland
X. Faın et al.
Title Page
Abstract Introduction
Conclusions References
Tables Figures
◭ ◮
◭ ◮
Back Close
Full Screen / Esc
Printer-friendly Version
Interactive Discussion
EGU
0 5 10 15 20 25 30 35 40 45 50 55 60GEM age, years before 2006
0
0.02
0.04
0.06
0.08
0.1
0.12
0.14
0.16
0.18
0.2
0.22
0.24
0.26
Ag
e d
istr
ibu
tio
n,
G(z
,t)
30 m depth50 m depth60 m depth69 m depth70 m depthA
B
Fig. 9. GEM age distributions modeled at Summit Station indicating the percentage of the air
with a given age for different depths in the firn.
18266
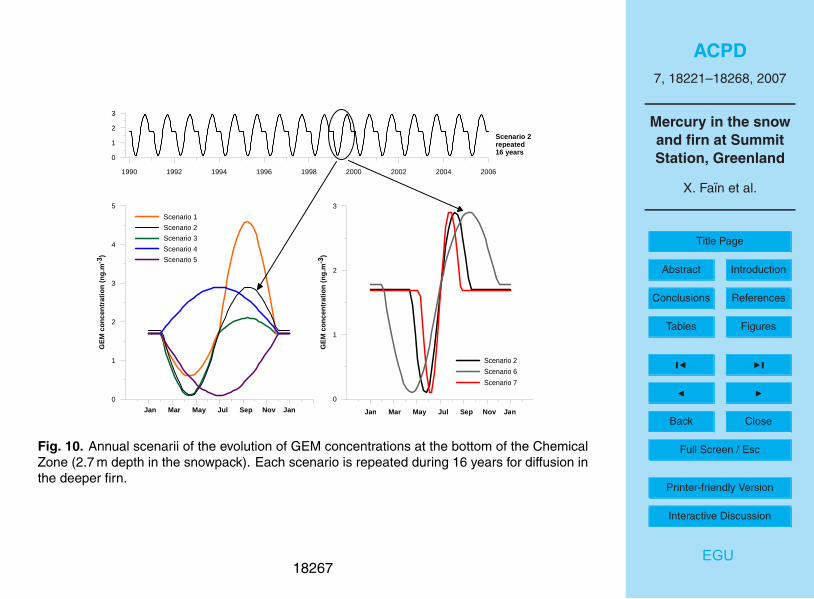
ACPD
7, 18221–18268, 2007
Mercury in the snow
and firn at Summit
Station, Greenland
X. Faın et al.
Title Page
Abstract Introduction
Conclusions References
Tables Figures
◭ ◮
◭ ◮
Back Close
Full Screen / Esc
Printer-friendly Version
Interactive Discussion
EGU
0
1
2
3
GE
M c
once
ntra
tion
(ng.
m-3
)
Scenario 2
Scenario 6
Scenario 7
1990 1992 1994 1996 1998 2000 2002 2004 2006
0
1
2
3
0
1
2
3
4
5
GE
M c
once
ntra
tion
(ng.
m-3
)
Scenario 1
Scenario 2
Scenario 3
Scenario 4
Scenario 5
Jan Mar May Jul Sep Nov Jan Jan Mar May Jul Sep Nov Jan
Scenario 2 repeated 16 years
Fig. 10. Annual scenarii of the evolution of GEM concentrations at the bottom of the Chemical
Zone (2.7 m depth in the snowpack). Each scenario is repeated during 16 years for diffusion in
the deeper firn.
18267
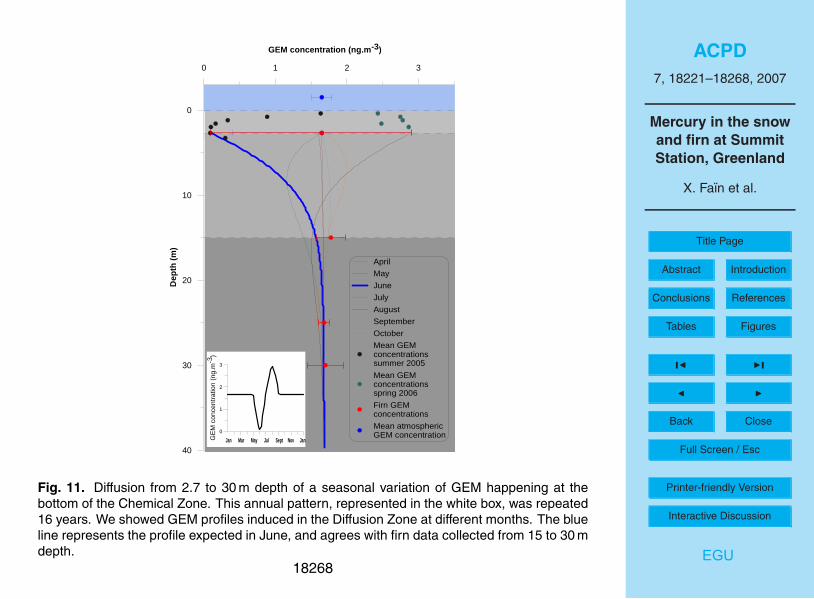
ACPD
7, 18221–18268, 2007
Mercury in the snow
and firn at Summit
Station, Greenland
X. Faın et al.
Title Page
Abstract Introduction
Conclusions References
Tables Figures
◭ ◮
◭ ◮
Back Close
Full Screen / Esc
Printer-friendly Version
Interactive Discussion
EGU
0 1 2 3
GEM concentration (ng.m -3)
40
30
20
10
0
Dep
th (
m)
April
May
June
July
August
September
October
Mean GEM concentrationssummer 2005
Mean GEM concentrationsspring 2006
Firn GEM concentrations
Mean atmospheric GEM concentration
Jan Mar May Jul Sept No v Jan0
1
2
3
GE
M c
once
ntra
tion
(ng.
m-3
)
Fig. 11. Diffusion from 2.7 to 30 m depth of a seasonal variation of GEM happening at the
bottom of the Chemical Zone. This annual pattern, represented in the white box, was repeated
16 years. We showed GEM profiles induced in the Diffusion Zone at different months. The blue
line represents the profile expected in June, and agrees with firn data collected from 15 to 30 m
depth.
18268