Semi Annual Report 6.30 - sheltonfunds.com
40
This report is intended only for the information of shareholders or those who have received the offering prospectus covering shares of beneficial interest of The SCM Trust which contains information about the management fee and other costs. Investments in shares of The SCM Trust are neither insured nor guaranteed by the U.S. Government. SEMI-ANNUAL REPORT June 30, 2021 Shelton BDC Income Fund Shelton Emerging Markets Fund Shelton International Select Equity Fund Shelton Tactical Credit Fund
Transcript of Semi Annual Report 6.30 - sheltonfunds.com
This report is intended only for the information of shareholders or those who have received the offering prospectus covering shares of beneficial interest of The SCM Trust which contains information about the management fee and other costs. Investments in shares of The SCM Trust are neither insured nor guaranteed by the U.S. Government.
SEMI-ANNUAL REPORT
June 30, 2021
Shelton BDC Income FundShelton Emerging Markets FundShelton International Select Equity FundShelton Tactical Credit Fund

1
About Your Fund’s Expenses ...................................................................................................................................... 2Top Holdings and Sector Breakdown .......................................................................................................................... 3Portfolio of Investments ............................................................................................................................................... 5Statements of Assets and Liabilities ............................................................................................................................ 9Statements of Operations ............................................................................................................................................ 10Statements of Changes in Net Assets ......................................................................................................................... 11Statement of Cash Flows ............................................................................................................................................ 14Financial Highlights ..................................................................................................................................................... 15Notes to Financial Statements ..................................................................................................................................... 23Additional Information .................................................................................................................................................. 30Board of Trustees and Executive Officers ................................................................................................................... 31Board Approval of the Investment Advisory Agreement .............................................................................................. 32
Table of Contents June 30, 2021

2
About Your Fund’s Expenses (Unaudited) June 30, 2021
As a shareholder of the Funds, you incur two types of costs: (1) transaction costs, including sales charges (loads) on purchase payments, reinvested dividends, or other distributions, redemption fees, and exchange fees; and (2) ongoing costs, including management fees, distribution fees and other Fund expenses. Operating expenses, which are deducted from the Funds’ gross income, directly reduce the investment return of the Funds. The Funds’ expenses are expressed as a percentage of its average net assets. This figure is known as the expense ratio. This example is intended to help you understand your ongoing cost (in dollars) of investing in the Funds and to compare these costs with the ongoing costs of investing in other mutual funds. The examples are based on an investment of $1,000 invested at the beginning of the period and held for the entire period from January 1, 2021 to June 30, 2021.
Actual Expenses
The first line of the tables below provides information about actual account values and actual expenses. You may use the information in this line, together with the amount you invested, to estimate the expenses you have paid over the period. Simply divide your account value by $1,000 (for example, an $8,600 account value divided by $1,000 = 8.6), then multiply the result by the number in the first line under the heading entitled “Expenses Paid During Period” to estimate the expenses you paid on your account during this period.
Hypothetical Example for Comparison Purposes
The second line of the table provides information about hypothetical account values and hypothetical expenses based on the Funds’ actual expense ratio and an assumed rate of return of 5% per year before expenses, which is not the Funds’ actual return. The hypothetical account values and expenses may not be used to estimate the actual ending account balance or expenses you paid for the period. You may use this information to compare the ongoing costs of investing in the Funds and other funds. To do so, compare this 5% hypothetical example with the 5% hypothetical examples that appear in the shareholder reports of the other funds. The Funds do not charge any sales charges. Please note that the expenses shown in the tables are meant to highlight your ongoing costs only and do not reflect any transactional cost, such as sales charges (loads), redemption fees, or exchange fees. Therefore, the second line of the tables are useful in comparing ongoing costs only, and will not help you determine the relative total costs of owning different funds. In addition, if these transactional costs were included, your costs would have been higher. The calculations assume no shares were bought or sold during the period.
Beginning Account Value January 1, 2021
Ending Account Value
June 30, 2021
Expenses Paid During Period*
Net Annual Expense Ratio
Shelton BDC Income FundInstitutional Shares
Based on Actual Fund Return $ 1,000 $ 1,205 $ 6.83 1.25%Based on Hypothetical 5% Return before expenses $ 1,000 $ 1,019 $ 6.26 1.25%
Investor SharesBased on Actual Fund Return $ 1,000 $ 1,204 $ 8.20 1.50%Based on Hypothetical 5% Return before expenses $ 1,000 $ 1,018 $ 7.51 1.50%
Shelton Emerging Markets FundInstitutional Shares
Based on Actual Fund Return $ 1,000 $ 1,025 $ 7.73 1.54%Based on Hypothetical 5% Return before expenses $ 1,000 $ 1,017 $ 7.70 1.54%
Investor SharesBased on Actual Fund Return $ 1,000 $ 1,024 $ 9.03 1.80%Based on Hypothetical 5% Return before expenses $ 1,000 $ 1,016 $ 9.00 1.80%
Shelton International Select Equity FundInstitutional Shares
Based on Actual Fund Return $ 1,000 $ 1,058 $ 5.10 1.00%Based on Hypothetical 5% Return before expenses $ 1,000 $ 1,020 $ 5.01 1.00%
Investor SharesBased on Actual Fund Return $ 1,000 $ 1,057 $ 6.32 1.24%Based on Hypothetical 5% Return before expenses $ 1,000 $ 1,019 $ 6.21 1.24%
Shelton Tactical Credit FundInstitutional Shares
Based on Actual Fund Return $ 1,000 $ 1,072 $ 11.41 2.22%Based on Hypothetical 5% Return before expenses $ 1,000 $ 1,014 $ 11.09 2.22%
Investor SharesBased on Actual Fund Return $ 1,000 $ 1,071 $ 12.63 2.46%Based on Hypothetical 5% Return before expenses $ 1,000 $ 1,013 $ 12.28 2.46%
* Expenses are equal to the Fund’s annualized expense ratio listed in the “Net Annual Expense Ratio” column, multiplied by the average account value over the period, multiplied by 181/365 (to reflect the one-half year period).

3
Top Holdings and Sector Breakdown (Unaudited) June 30, 2021
Shelton BDC Income Fund
Security
Market Value (in U.S. Dollars)
Percentage of Total
Investment
0.0%
20.0%
40.0%
60.0%
80.0%
100.0%100.0%
Financial
0.0%
20.0%
40.0%
60.0%
80.0%
100.0%99.80%
Specialized FinanceAsset Management & Custody Banks
0.20%
1 Ares Capital Corp $ 549,715 13.4%2 Owl Rock Capital Corp 494,812 12.1%3 Hercules Capital Inc 379,585 9.3%4 FS KKR Capital Corp 359,571 8.8%5 Sixth Street Specialty Lending Inc 308,441 7.5%6 Main Street Capital Corp 279,412 6.8%7 Oaktree Specialty Lending Corp 262,703 6.4%8 Barings BDC Inc 228,096 5.6%9 Golub Capital BDC Inc 212,025 5.2%10 SuRo Capital Corp 188,860 4.6%
Shelton Emerging Markets Fund
Security
Market Value (in U.S. Dollars)
Percentage of Total
Investment
0.0%
10.0%
20.0%
30.0%
40.0%
30.60%
Technology
22.40%
11.30%16.70%
10.20%5.70%
3.10%
Communicatio
ns
Financia
l
Consumer
, Non-cy
clica
l
Consumer
, Cyc
lical
Energy
Industr
ial
1 Samsung Electronics Co Ltd $ 2,048,223 7.2%2 Taiwan Semiconductor Manufacturing Co Ltd 1,966,422 6.9%3 eMemory Technology Inc 1,280,180 4.5%4 Accton Technology Corp 1,188,895 4.2%5 Infosys Ltd 1,185,538 4.2%6 HDFC Bank Ltd 1,169,554 4.1%7 Kimberly-Clark de Mexico 1,168,846 4.1%8 China Meidong Auto Holdings Ltd 1,154,944 4.1%9 MediaTek Inc 1,151,840 4.1%10 Haier Smart Home Co Ltd 1,103,472 3.9%

4
Top Holdings and Sector Breakdown (Unaudited) (Continued) June 30, 2021
Shelton International Select Equity Fund
Security
Market Value (in U.S. Dollars)
Percentage of Total
Investment
0.0%
10.0%
20.0%
30.0%25.80%
15.00%
26.70%
6.00%
Industr
ial
Consumer
, Non-cy
clica
l
Consumer
, Cyc
lical
Technology
Financia
l
Basic
Mate
rials
16.10%
10.40%1 Element Fleet Management Corp $ 8,755,744 5.5%2 CRH PLC 8,421,163 5.3%3 ASML Holding NV 7,286,289 4.6%4 DBS Group Holdings Ltd 6,884,287 4.3%5 Taiwan Semiconductor Manufacturing Co Ltd 6,091,151 3.8%6 Nestle SA 6,034,672 3.8%7 Kimberly-Clark de Mexico SAB de CV 5,862,689 3.7%8 AIA Group Ltd 5,781,911 3.6%9 KBC Group NV 5,762,318 3.6%10 Constellation Software Inc 5,512,608 3.5%
Shelton Tactical Credit Fund — Long Positions
Security
Market Value (in U.S. Dollars)
Percentage of Total
Investment
Mate
rials
0.0%
5.0%
10.0%
15.0%
20.0%
25.0%
Med
ical
Consumer
Discre
tionar
y
Financia
ls
Develo
pment
Industr
ials
Energy
Higher
Educa
tion
Gener
al Oblig
ation
Purchas
ed O
ptions
Housing
Tobacco
Settlem
ent
Transp
ortatio
n
Consumer
Staples
Gener
al
Wate
r
20.10%19.60%
8.70%8.00%
7.70%
4.90%3.80% 2.30%
2.30%
6.70%
1.90%1.90%0.10%
6.50%6.10% 5.80%
1 Iron Mountain Inc, 4.875%, 9/15/2029 (144A) $ 2,064,400 4.0%2 Massachusetts Development Finance
Agency, 5.000%, 7/1/2044 2,011,400 3.9%
3 Bay Area Toll Authority, 0.010%, 4/1/2053 2,000,000 3.8%4 City of Murray UT, 0.010%, 5/15/2036 2,000,000 3.8%5 City of New York NY, 0.010%, 10/1/2046 2,000,000 3.8%6 Massachusetts Water Resources Authority,
0.030%, 11/1/2026 2,000,000 3.8%
7 New York City Transitional Finance Authority Future Tax Secured Revenue, 0.010%, 11/1/2042
2,000,000 3.8%
8 New York City Water & Sewer System, 0.010%, 6/15/2050 2,000,000 3.8%
9 State of Ohio, 0.020%, 1/1/2052 2,000,000 3.8%10 Station Casinos LLC, 4.500%,
2/15/2028 (144A)1,932,386 3.7%
Shelton Tactical Credit Fund — Short Positions
Security
Market Value (in U.S. Dollars)
Percentage of Total
Investment
-5.0%
-4.0%
-3.0%
-2.0%
-1.0%
0.0%
-3.30% -3.10%
Consumer
D
iscre
tionar
y
Financia
ls
1 Wynn Las Vegas LLC / Wynn Las Vegas Capital Corp, 5.500%, 03/01/2025 $ (1,722,976) -3.3%
2 Navient Corp, 5.875%, 10/25/2024 (1,618,125) -3.1%

5
See accompanying notes to financial statements.
Security Description Shares Value
Common Stock (99.31%)
Financial (99.31%)Diversified Financial Services (0.47%)Medley Management Inc* ............................. 1,863 $ 11,476Newstar Financial Inc CVR*,(a) ...................... 100,410 8,033
19,509Investment Company (98.84%)Apollo Investment Corp ................................ 5,076 69,287Ares Capital Corp ......................................... 28,061 549,715Barings BDC Inc ........................................... 21,600 228,096BlackRock TCP Capital Corp ....................... 6,200 85,684Capital Southwest Corp ................................ 5,500 127,765FS KKR Capital Corp .................................... 16,716 359,571Goldman Sachs BDC Inc .............................. 2,580 50,568Golub Capital BDC Inc ................................. 13,750 212,025Hercules Capital Inc ..................................... 22,250 379,585Main Street Capital Corp .............................. 6,800 279,412New Mountain Finance Corp ........................ 11,900 156,723Oaktree Specialty Lending Corp ................... 39,268 262,703Owl Rock Capital Corp ................................. 34,675 494,812Saratoga Investment Corp ............................ 6,100 163,907Sixth Street Specialty Lending Inc ................ 13,900 308,441SLR Investment Corp ................................... 4,429 82,557SuRo Capital Corp ........................................ 14,000 188,860
Shelton BDC Income FundPortfolio of Investments (Expressed in U.S. Dollars) (Unaudited)
June 30, 2021
Security Description Shares Value
TriplePoint Venture Growth BDC Corp ......... 4,728 $ 71,8184,071,529
Total Common Stock (Cost $3,783,605) 4,091,038
Total Investments (Cost $3,783,605)(b) (99.31%) $ 4,091,038
Other Net Assets (0.69%) 28,276 Net Assets (100.00%) $ 4,119,314
* Non-income producing security.(a) Level 3 security fair valued under procedures established by the Board of
Trustees, represents 0.20% of net assets. The total value of the fair value security is $8,033.
(b) Aggregate cost for federal income tax purposes is $3,790,802At June 30, 2021, unrealized appreciation/(depreciation) of securities for federal income tax purposes is as follows:
Unrealized appreciation .......................................................... $ 527,362Unrealized depreciation .......................................................... (227,126)Net unrealized appreciation .................................................... $ 300,236
Security Description Shares Value
Common Stock (93.51%)
Argentina (2.60%)MercadoLibre Inc* ........................................ 505 $ 786,684
Brazil (7.90%)Arco Platform Ltd* ........................................ 33,230 1,018,832Notre Dame Intermedica Participacoes SA .. 37,400 639,901Sul America SA ............................................. 105,769 737,053Total Brazil 2,395,786
China (15.37%)Autohome Inc ............................................... 6,300 402,948China Meidong Auto Holdings Ltd ................ 212,000 1,154,944Haier Smart Home Co Ltd ............................ 316,400 1,103,472New Oriental Education & Technology
Group Inc* ................................................ 57,660 473,557Ping An Insurance Group Co of China Ltd ... 66,200 647,131Xinyi Solar Holdings Ltd ............................... 407,000 876,036Total China 4,658,088
India (7.77%)HDFC Bank Ltd* ........................................... 15,995 1,169,554Infosys Ltd .................................................... 55,948 1,185,538Total India 2,355,092
Indonesia (10.41%)Ace Hardware Indonesia Tbk PT .................. 7,477,000 645,676Bank Rakyat Indonesia Persero Tbk PT ...... 3,856,000 1,048,428
Security Description Shares Value
Indofood CBP Sukses Makmur Tbk PT ........ 993,000 $ 558,410Sarana Menara Nusantara Tbk PT ............... 10,537,900 901,962Total Indonesia 3,154,476
Mexico (7.37%)Kimberly-Clark de Mexico SAB de CV ......... 658,000 1,168,846Regional SAB de CV .................................... 180,000 1,066,690Total Mexico 2,235,536
South Korea (12.35%)Dentium Co Ltd ............................................. 15,000 864,432Samsung Electronics Co Ltd ........................ 28,612 2,048,223Samsung SDI Co Ltd .................................... 1,342 830,883Total South Korea 3,743,538
Taiwan (25.47%)Accton Technology Corp ............................... 100,400 1,188,895Chailease Holding Co Ltd ............................. 122,000 886,676eMemory Technology Inc .............................. 26,700 1,280,180MediaTek Inc ................................................ 33,400 1,151,840Sporton International Inc .............................. 61,000 526,095Taiwan Semiconductor Manufacturing
Co Ltd ....................................................... 91,300 1,966,422Voltronic Power Technology Corp ................. 15,000 723,602Total Taiwan 7,723,710
Thailand (4.27%)Bangkok Bank PCL ...................................... 223,000 786,948Charoen Pokphand Foods PCL .................... 614,000 508,104Total Thailand 1,295,052
Shelton Emerging Markets FundPortfolio of Investments (Expressed in U.S. Dollars) (Unaudited)
June 30, 2021

6
See accompanying notes to financial statements.
Shelton International Select Equity FundPortfolio of Investments (Expressed in U.S. Dollars) (Unaudited)
June 30, 2021
Security Description Shares Value
Common Stock (91.99%)
Belgium (3.32%)KBC Group NV ............................................. 75,568 $ 5,762,318
Canada (12.45%)CAE Inc* ....................................................... 131,311 4,048,659Constellation Software Inc ............................ 3,636 5,512,608Element Fleet Management Corp ................. 749,809 8,755,744Linamar Corp ................................................ 52,000 3,264,960Total Canada 21,581,971
China (5.59%)China Meidong Auto Holdings Ltd ................ 718,000 3,915,515New Oriental Education & Technology
Group Inc* ................................................ 162,400 1,338,372Ping An Insurance Group Co of China Ltd ... 453,900 4,444,986Total China 9,698,873
France (9.19%)BNP Paribas SA ........................................... 84,387 5,290,944L’Oreal SA ..................................................... 11,937 5,319,861Valeo ............................................................. 176,879 5,321,634Total France 15,932,439
Germany (5.00%)adidas AG ..................................................... 10,962 4,080,650MTU Aero Engines AG ................................. 18,496 4,582,100Total Germany 8,662,750
Great Britain (5.79%)Intertek Group PLC ....................................... 68,135 5,205,118Unilever PLC ................................................ 82,562 4,829,877Total Great Britain ......................................... 10,034,995
Hong Kong (6.09%)AIA Group Ltd ............................................... 465,300 5,781,911Techtronic Industries Co Ltd ......................... 273,400 4,773,855Total Hong Kong 10,555,766
India (2.49%)HDFC Bank Ltd* ........................................... 59,159 4,325,706
Indonesia (2.55%)Bank Rakyat Indonesia Persero Tbk PT ...... 16,268,450 4,420,531
Ireland (7.65%)CRH PLC ...................................................... 167,084 8,421,163Smurfit Kappa Group PLC ............................ 89,315 4,845,781Total Ireland 13,266,944
Security Description Shares Value
Japan (5.03%)Daikin Industries Ltd ..................................... 11,400 $ 2,125,110Nomura Research Institute Ltd ..................... 134,700 4,460,064Santen Pharmaceutical Co Ltd ..................... 155,500 2,143,571Total Japan 8,728,745
Mexico (3.38%)Kimberly-Clark de Mexico SAB de CV ......... 3,296,500 5,862,689
Netherlands (5.54%)ASML Holding NV ......................................... 10,547 7,286,289Topicus.com Inc* .......................................... 31,858 2,316,735Total Netherlands 9,603,024
Singapore (3.97%)DBS Group Holdings Ltd .............................. 310,428 6,884,287
Switzerland (7.98%)Givaudan SA ................................................. 1,004 4,673,784Nestle SA ...................................................... 48,378 6,034,672Straumann Holding AG ................................. 1,964 3,133,986Total Switzerland 13,842,442
Taiwan (3.51%)Taiwan Semiconductor Manufacturing
Co Ltd ....................................................... 50,692 6,091,151
Thailand (2.46%)Bangkok Bank PCL ...................................... 1,211,100 4,270,025
Total Common Stock (Cost $132,078,663) 159,524,656
Total Investments (Cost $132,078,663)(a) (91.99%) $ 159,524,656
Other Net Assets (8.01%) 13,897,689 Net Assets (100.00%) $ 173,422,345
* Non-income producing security. (a) Aggregate cost for federal income tax purposes is $134,306,434At June 30, 2021, unrealized appreciation/(depreciation) of securities for federal income tax purposes is as follows:
Unrealized appreciation .......................................................... $ 28,578,015Unrealized depreciation .......................................................... (3,359,793)Net unrealized appreciation .................................................... $ 25,218,222
Shelton Emerging Markets FundPortfolio of Investments (Expressed in U.S. Dollars) (Unaudited) (Continued)
June 30, 2021
Security Description Shares Value
Total Common Stock (Cost $20,445,726) $ 28,347,962
Total Investments (Cost $20,445,726)(a) (93.51%) $ 28,347,962
Other Net Assets (6.49%) 1,966,023 Net Assets (100.00%) $ 30,313,985
* Non-income producing security.(a) Aggregate cost for federal income tax purposes is $21,004,661At June 30, 2021, unrealized appreciation/(depreciation) of securities for federal income tax purposes is as follows:
Unrealized appreciation .......................................................... $ 7,982,477Unrealized depreciation .......................................................... (639,176)Net unrealized appreciation .................................................... $ 7,343,301

7
See accompanying notes to financial statements.
Security Description / Long Positions Shares Value
Common Stock (0.84%)
Consumer, Cyclical (0.25%)Copper Earnout Trust(a) ................................. 891 $ 9,133Propco Earnout Trust(a) ................................. 6,682 120,276
129,409
Consumer, Non-cyclical (0.58%)Pyxus International Inc* ................................ 83,441 304,560
Energy (0.01%)CHC Group LLC*,(b) ....................................... 187,153 6,363
Total Common Stock (Cost $2,228,812) 440,332
Par Value
Corporate Debt (46.27%) Basic Materials (5.74%)Cleveland-Cliffs Inc, 9.875%,
10/17/2025 (144A)(c) ................................. $ 1,239,000 1,452,120Ferroglobe PLC / Globe Specialty
Metals Inc, 9.375%, 3/1/2022 (144A)(c) .... 1,500,000 1,567,500Total Basic Materials 3,019,620
Consumer, Cyclical (21.53%)The Bon-Ton Department Stores Inc,
8.000%, 6/15/2021(d) ................................ 4,958,932 37,192Boyd Gaming Corp, 4.750%,
6/15/2031 (144A)(c) ................................... 500,000 519,515Carnival Corp, 5.750%, 3/1/2027 (144A)(c) ... 1,750,000 1,833,125Hawaiian Brand Intellectual Property
Ltd / HawaiianMiles Loyalty Ltd, 5.750%, 1/20/2026 (144A)(c) ..................... 1,750,000 1,881,250
JC Penney Corp Inc, 5.875%, 7/1/2023 (144A)(a),(d) ................................................. 1,400,000 3,500
The Michaels Cos Inc, 5.250%, 5/1/2028 (144A)(c) ..................................... 1,100,000 1,128,523
PetSmart Inc / PetSmart Finance Corp, 7.750%, 2/15/2029 (144A)(c) ..................... 750,000 824,828
Six Flags Entertainment Corp, 4.875%, 7/31/2024 (144A)(c) ................................... 1,500,000 1,505,625
Spirit Loyalty Cayman Ltd / Spirit IP Cayman Ltd, 8.000%, 9/20/2025 (144A) .. 538,554 609,105
Station Casinos LLC, 4.500%, 2/15/2028 (144A)(c) ................................... 1,900,000 1,932,386
Titan International Inc, 7.000%, 4/30/2028 (144A)(c) ................................... 1,000,000 1,046,250
Total Consumer, Cyclical 11,321,299
Consumer, Non-Cyclical (2.01%)Herc Holdings Inc, 5.500%, 7/15/2027
(144A)(c) .................................................... 1,000,000 1,054,220
Energy (6.45%)Energy Ventures Gom LLC / EnVen
Finance Corp, 11.750%, 4/15/2026 (144A)(c) .................................................... 1,000,000 1,042,880
Talos Production Inc, 12.000%, 1/15/2026(c) 1,000,000 1,060,000Transocean Inc, 7.500%, 1/15/2026
(144A)(c) .................................................... 1,500,000 1,290,000Total Energy 3,392,880
Security Description / Long Positions Par Value Value
Financial (6.63%)CBL & Associates LP, 4.600%, 10/15/2024(d) $ 1,000,000 $ 562,500CBL & Associates LP, 5.950%, 12/15/2026(d) 1,526,000 858,375Iron Mountain Inc, 4.875%, 9/15/2029
(144A)(c) .................................................... 2,000,000 2,064,400Total Financial 3,485,275
Industrial (3.91%)Eletson Holdings Inc / Eletson Finance
US LLC / Agathonissos Finance LLC, 9.625%, 1/15/2022 .......................... 548,153 187,057
Scorpio Tankers Inc, 3.000%, 5/15/2022(c) ... 1,875,000 1,870,025Total Industrial 2,057,082
Total Corporate Debt (Cost $24,572,618) 24,330,376
Municipal Bonds (56.79%)
Development (8.67%)California Pollution Control Financing
Authority, 7.500%, 12/1/2040 (144A)(c) ..... 1,500,000 1,641,019California Pollution Control Financing
Authority, 7.500%, 7/1/2032 (144A) ......... 250,000 233,727California Pollution Control Financing
Authority, 8.000%, 7/1/2039 (144A)(d) ....... 2,050,000 1,332,500New York Transportation Development
Corp, 4.000%, 4/30/2053(c) ....................... 325,000 378,877New York Transportation Development
Corp, 5.000%, 10/1/2035(c) ....................... 750,000 972,097Total Development 4,558,220
General Obligation (9.81%)City of New York NY, 0.010%, 10/1/2046(e) ... 2,000,000 2,000,000New York City Transitional Finance
Authority Future Tax Secured Revenue, 0.010%, 11/1/2042(e) ................ 2,000,000 2,000,000
Puerto Rico Public Finance Corp, 5.500%, 8/1/2031(c),(d) ............................... 400,000 4,800
Puerto Rico Sales Tax Financing Corp Sales Tax Revenue, 5.000%, 7/1/2058(c) .. 1,000,000 1,152,617
Total General Obligation 5,157,417
Higher Education (1.90%)Board of Regents of the University of
Texas System, 0.010%, 8/1/2034(e) .......... 1,000,000 1,000,000
Housing (2.27%)California Municipal Finance Authority,
5.000%, 5/15/2051(c) ................................. 1,000,000 1,194,757
Medical (19.38%)City of Murray UT, 0.010%, 5/15/2036(e) ....... 2,000,000 2,000,000County of Cuyahoga OH, 5.500%,
2/15/2052(c) ............................................... 1,300,000 1,543,924County of Cuyahoga OH, 5.500%,
2/15/2057(c) ............................................... 760,000 900,823Illinois Finance Authority, 0.010%,
8/15/2049(e) ............................................... 500,000 500,000Massachusetts Development Finance
Agency, 5.000%, 7/1/2044(c) ..................... 1,765,000 2,011,400New York State Dormitory Authority,
5.000%, 8/1/2035(c) ................................... 1,000,000 1,231,246State of Ohio, 0.020%, 1/1/2052(e) ................ 2,000,000 2,000,000Total Medical 10,187,393
Shelton Tactical Credit FundPortfolio of Investments (Expressed in U.S. Dollars) (Unaudited)
June 30, 2021

8
See accompanying notes to financial statements.
Shelton Tactical Credit FundPortfolio of Investments (Expressed in U.S. Dollars) (Unaudited) (Continued)
June 30, 2021
Security Description / Long Positions Par Value Value
Tobacco Settlement (2.26%)Tobacco Settlement Financing Corp,
5.000%, 6/1/2046(c) ................................... $ 1,000,000 $ 1,188,515
Transportation (4.89%)Bay Area Toll Authority, 0.010%, 4/1/2053(e) . 2,000,000 2,000,000Texas Private Activity Bond Surface
Transportation Corp, 7.000%, 12/31/2038(c) ............................................. 500,000 569,389
Total Transportation 2,569,389
Water (7.61%)Massachusetts Water Resources
Authority, 0.030%, 11/1/2026(e) ................. 2,000,000 2,000,000New York City Water & Sewer System,
0.010%, 6/15/2050(e) ................................ 2,000,000 2,000,000Total Water 4,000,000
Total Municipal Debt (Cost $23,758,297) 29,855,691
Term Loans (1.42%)JC Penney, Penney Borrower LLC, 3M
US LIBOR (floor 1.500%) + 9.500%, 12/07/2026(e) ............................................. 46,212 44,941
Pyxus International Loan, 3M US LIBOR (floor 1.500%) + 9.500%, 2/24/25(e) ............ 722,750 704,081
Total Term Loans (Cost $2,372,965) 749,022
Contracts
Purchased Options - Puts (0.02%)
Reference Asset10-Year US Treasury Note Futures
Notional amount $655,000, premiums paid $42,969, exercise price $131, expires 7/26/21* ................ 50 5,469
10-Year US Treasury Note FuturesNotional amount $975,000,
premiums paid $43,360, exercise price $130, expires 7/26/21* ................ 75 2,344
10-Year US Treasury Note Futures Notional amount $1,290,000,
premiums paid $37,500, exercise price $129, expires 7/26/21* ................ 100 1,563
Total Purchased Options - Puts (Cost $123,828) 9,376
Total Long Positions (Cost $57,364,321)(f) (105.34%) 55,384,797
Liabilities in Excess of Other Assets (-5.34%) (2,812,498)
Net Assets (100.00%) $ 52,572,299
Security Description / Short Positions Par Value Value
Short Corporate Debt (-6.36%)
Consumer, Cyclical (-3.28%)Wynn Las Vegas LLC / Wynn Las
Vegas Capital Corp, 5.500%, 3/1/2025 (144A)(c) ..................................... $ (1,600,000) $ (1,722,976)
Financial (-3.08%)Navient Corp, 5.875%, 10/25/2024(c) ............ (1,500,000) (1,618,125)
Total Short Corporate Debt (Proceeds $3,141,425) (3,341,101)
(144A) Security was purchased pursuant to Rule 144A or Section 4(a)(2) under the Securities Act of 1933 and may be resold in transactions exempt from registration only to qualified institutional buyers. As of June 30, 2021, these securities had a total aggregate market value of $21,239,497, which represented approximately 40.40% of net assets.
* Non-income producing security.(a) Level 3 security fair valued under procedures established by the Board of
Trustees, represents 0.25% of net assets. The total value of the fair value security is $132,909.
(b) Security is illiquid. (c) All or a portion of this security has been segregated as collateral. (d) Defaulted security. (e) Variable rate security. (f) Aggregate cost for federal income tax purposes is $54,441,455At June 30, 2021, unrealized appreciation/(depreciation) of securities for federal income tax purposes is as follows:
Unrealized appreciation .......................................................... $ 2,683,776Unrealized depreciation .......................................................... (5,081,535)Net unrealized depreciation .................................................... $ (2,397,759)

9
See accompanying notes to financial statements.
Statements of Assets and Liabilities (Unaudited)June 30, 2021
Shelton BDC Income
Fund
Shelton Emerging
Markets Fund
Shelton International Select Equity
Fund
Shelton Tactical Credit
Fund
AssetsInvestments in securities
Cost of investments .............................................................................. $ 3,783,605 $ 20,445,726 $ 132,078,663 $ 57,240,493Cost of purchased options .................................................................... — — — 123,828Market value of investments (Note 1) ................................................... 4,091,038 28,347,962 159,524,656 55,375,421Market value of purchased options (Note 1) ........................................ — — — 9,376
Cash ......................................................................................................... 92,567 2,599,015 13,982,961 28,642Interest receivable .................................................................................... — — — 651,113Dividend receivable .................................................................................. 32,327 62,320 540,019 —Receivable from investment advisor ........................................................ 484 5,769 16,893 9,402Receivable for fund shares sold ............................................................... 55,525 90,368 446,727 535,289Prepaid expenses ..................................................................................... 636 38,869 39,942 1,799
Total assets ...................................................................................... $ 4,272,577 $ 31,144,303 $ 174,551,198 $ 56,611,042
LiabilitiesPayables and other liabilities
Short positions, at value (proceeds $3,141,425) .................................. — — — 3,341,101Interest payable .................................................................................... — — — 45,490Payable for fund shares repurchased .................................................. 4,033 4,383 115,494 50,450Payable to investment advisor ............................................................. 558 27,738 117,679 55,114Distributions payable ............................................................................ 116,601 824 1,065 478,273Payable for securities purchased ......................................................... — 734,883 742,287 —Accrued 12b-1 fees .............................................................................. 920 369 5,888 1,060Accrued administration fees ................................................................. 356 2,506 14,376 4,258Accrued CCO fees ............................................................................... 348 1,192 27,388 1,976Accrued custody fees ........................................................................... 24 3,691 11,312 1,887Accrued expenses ................................................................................ 10,079 22,844 41,524 31,940Accrued fund Accounting fees .............................................................. 6,023 11,046 22,240 18,744Accrued printing fees ............................................................................ 2,048 (1,156) (2,359) 1,298Accrued registration fees ...................................................................... 8,540 — — —Accrued transfer agent fees ................................................................. 2,741 21,058 29,974 5,996Accrued trustee fees ............................................................................ 992 940 1,985 1,156
Total liabilities ................................................................................... 153,263 830,318 1,128,853 4,038,743
Net assets .................................................................................................. $ 4,119,314 $ 30,313,985 $ 173,422,345 $ 52,572,299
Net assets at June 30, 2021 consist ofPaid-in capital ........................................................................................... 8,478,217 24,475,866 189,790,873 59,907,524Distributable earnings/(loss) ..................................................................... (4,358,903) 5,838,119 (16,368,528) (7,335,225)
Total net assets ............................................................................................. $ 4,119,314 $ 30,313,985 $ 173,422,345 $ 52,572,299
Net assetsInstitutional Shares ................................................................................... $ 270,390 $ 28,667,069 $ 147,450,949 $ 47,886,237Investor Shares ........................................................................................ $ 3,848,924 $ 1,646,916 $ 25,971,396 $ 4,686,062
Shares outstandingInstitutional Shares (no par value, unlimited shares authorized) .............. 32,505 1,391,671 5,407,562 4,263,677Investor Shares (no par value, unlimited shares authorized) ................... 458,447 80,745 959,105 417,748
Net asset value per shareInstitutional Shares ................................................................................... $ 8.32 $ 20.60 $ 27.27 $ 11.23Investor Shares ........................................................................................ $ 8.40 $ 20.40 $ 27.08 $ 11.22

10
See accompanying notes to financial statements.
Shelton BDC Income
Fund
Shelton Emerging
Markets Fund
Shelton International Select Equity
Fund
Shelton Tactical Credit Fund
Period Ended June 30,
2021
Period Ended June 30,
2021
Period Ended June 30,
2021
Period Ended June 30,
2021
Investment incomeInterest income ......................................................................................... $ — $ 62 $ 1,464 $ 1,232,928Dividend income (net of foreign tax withheld:
$—, $35,214, $170,759 and $— respectively) ...................................... 239,109 241,438 1,556,532 1,945Total ...................................................................................................... $ 239,109 $ 241,500 $ 1,557,996 $ 1,234,873
ExpensesInterest on short positions ........................................................................ $ — $ — $ — $ 109,012Management fees (Note 2) ....................................................................... 19,188 144,429 581,314 280,514Administration fees (Note 2) ..................................................................... 1,937 13,145 71,407 21,785Transfer agent fees .................................................................................. 5,286 17,420 43,054 9,536Accounting services ................................................................................. 10,421 14,834 28,737 25,533Broker fees ............................................................................................... — — 220 91,292Custodian fees ......................................................................................... 164 10,148 17,732 3,547Legal and audit fees ................................................................................. 3,052 5,835 20,026 7,537CCO fees (Note 2) .................................................................................... 181 1,347 8,043 2,235Trustees fees ............................................................................................ 2,017 2,330 2,549 2,286Insurance .................................................................................................. 71 558 3,295 886Printing ..................................................................................................... 5,975 6,306 7,205 8,674Registration and dues .............................................................................. 11,766 15,123 31,107 14,27612b-1 fees Investor Shares (Note 2) ........................................................ 4,986 2,033 27,224 6,275
Total expenses ..................................................................................... $ 65,044 $ 233,508 $ 841,913 $ 583,388Less reimbursement from manager (Note 2) ................................... (33,220) (5,769) (27,810) (41,100)
Net expenses ....................................................................................... $ 31,824 $ 227,739 $ 814,103 $ 542,288Net investment income ..................................................................... $ 207,285 $ 13,761 $ 743,893 $ 692,585
Realized and unrealized gain/(loss) on investmentsNet realized gain/(loss) from security transactions and foreign currency . $ 9,870 $ 909,215 $ 8,238,417 $ 740,215Net realized gain/(loss) from futures contracts ......................................... — — — (22,869)Net realized gain/(loss) from purchased option contracts ........................ — — — (20,585)Net realized gain/(loss) from written options contracts ............................. — — — 74,599Total Net Realized gain/(loss) ................................................................... 9,870 909,215 8,238,417 771,360
Change in unrealized appreciation/(depreciation) of investments ............ 553,820 (189,637) (558,583) 1,837,264Change in unrealized appreciation/(depreciation) of purchased option
contracts ............................................................................................... — — — 95,695Change in unrealized appreciation/(depreciation) of written option contracts — — — (88,726)Net realized and unrealized gain/(loss) on investments ........................... $ 563,690 $ 719,578 $ 7,679,834 $ 2,615,593Net increase/(decrease) in net assets resulting from operations ............. $ 770,975 $ 733,339 $ 8,423,727 $ 3,308,178
Statements of Operations (Unaudited) June 30, 2021

11
See accompanying notes to financial statements.
Shelton BDC Income Fund Shelton Emerging Markets Fund
Shelton International Select Equity Fund
Period Ended
June 30, 2021
Year Ended December 31,
2020
Period Ended
June 30, 2021
Period Ended
December 31, 2020
Year Ended September 30,
2020
Period Ended
June 30, 2021
Year Ended December 31,
2020
OperationsNet investment income/(loss) .................. $ 207,285 $ 417,271 $ 13,761 $ (41,404) $ 50,062 $ 743,893 $ 425,800Net realized gain/(loss) from security
transactions and foreign currency ....... 9,870 (683,527) 909,215 3,489,313 (3,886,642) 8,238,417 38,555Change in unrealized appreciation/
(depreciation) of investments .............. 553,820 (598,529) (189,637) 3,281,869 4,945,157 (558,583) 19,176,951Net increase/(decrease) in net
assets resulting from operations ... 770,975 (864,785) 733,339 6,729,778 1,108,577 8,423,727 19,641,306
Distributions to shareholdersDistributions
Institutional Shares .............................. (15,321) (21,443) — (47,123) (802,092) — (810,174)Investor Shares ................................... (212,829) (396,171) — (2,929) (49,976) — (75,408)
Total Distributions .................................... (228,150) (417,614) — (50,052) (852,068) — (885,582)
Capital share transactionsIncrease/(decrease) in net assets
resulting from capital share transactions ......................................... (466,640) (1,057,698) 2,243,469 (2,092,602) (21,276,448) 21,242,447 64,229,063
Total increase/(decrease) ................ 76,185 (2,340,097) 2,976,808 4,587,124 (21,019,939) 29,666,174 82,984,787
Net assetsBeginning of period ................................. 4,043,129 6,383,226 27,337,177 22,750,053 43,769,992 143,756,171 60,771,384End of period ........................................... $ 4,119,314 $ 4,043,129 $ 30,313,985 $ 27,337,177 $ 22,750,053 $ 173,422,345 $ 143,756,171
Shelton Tactical Credit Fund
Period Ended June 30,
2021
Year Ended December 31,
2020
OperationsNet investment income/(loss) ................................................................................................................................ $ 692,585 $ 2,304,569Net realized gain/(loss) from security transactions and foreign currency .............................................................. 740,215 786,483Net realized gain/(loss) from futures contracts ...................................................................................................... (22,869) (1,876,622)Net realized gain/(loss) from purchased option contracts ..................................................................................... (20,585) (1,086,795)Net realized gain/(loss) from written options contracts .......................................................................................... 74,599 385,413Change in unrealized appreciation/(depreciation) of investments ......................................................................... 1,837,264 (1,465,185)Change in unrealized appreciation/(depreciation) of futures ................................................................................. — (401,601)Change in unrealized appreciation/(depreciation) of purchased option contracts ................................................. 95,695 (210,148)Change in unrealized appreciation/(depreciation) of written option contracts ....................................................... (88,726) 88,726
Net increase/(decrease) in net assets resulting from operations .................................................................. 3,308,178 (1,475,160)
Distributions to shareholdersDistributions
Institutional Shares ............................................................................................................................................ (942,109) (1,860,085)Investor Shares ................................................................................................................................................. (101,293) (443,874)
Total Distributions .................................................................................................................................................. (1,043,402) (2,303,959)
Capital share transactionsIncrease/(Decrease) in net assets resulting from capital share transactions ........................................................ 3,324,789 (39,592,702)
Total increase/(decrease) .............................................................................................................................. 5,589,565 (43,371,821)
Net assetsBeginning of period ............................................................................................................................................... 46,982,734 90,354,555End of period ......................................................................................................................................................... $ 52,572,299 $ 46,982,734
Statements of Changes in Net Assets

12
See accompanying notes to financial statements.
Statements of Changes in Net Assets(Continued)
Shelton BDC Income Fund Institutional Shares
Period Ended June 30, 2021
Year Ended December 31, 2020
Shares Value Shares Value
Shares sold ................................................................................................... 340 $ 2,703 36,291 $ 252,509Shares issued in reinvestment of distributions ............................................. 639 5,227 874 5,237Shares repurchased ..................................................................................... (2,529) (21,936) (37,260) (265,506)
Net increase/(decrease) ........................................................................... (1,550) $ (14,006) (95) $ (7,760)
Investor Shares
Period Ended June 30, 2021
Year Ended December 31, 2020
Shares Value Shares Value
Shares sold ................................................................................................... 69,935 $ 591,440 23,280 $ 160,788Shares issued in reinvestment of distributions ............................................. 12,674 104,544 33,743 209,253Shares repurchased ..................................................................................... (139,726) (1,148,618) (210,958) (1,419,979)
Net increase/(decrease) ........................................................................... (57,117) $ (452,634) (153,935) $ (1,049,938)
Shelton Emerging Market Fund Institutional Shares
Period Ended June 30, 2021
Period Ended December 31, 2020
Year Ended September 30, 2020
Shares Value Shares Value Shares Value
Shares sold ............................................................... 320,832 $ 6,530,525 55,023 $ 972,867 361,269 $ 5,104,041Shares issued in reinvestment of distributions ......... — — 2,309 46,398 47,764 772,818Shares repurchased ................................................. (210,522) (4,303,605) (166,946) (2,859,468) (1,842,250) (26,676,989)
Net increase/(decrease) ....................................... 110,310 $ 2,226,920 (109,614) $ (1,840,203) (1,433,217) $ (20,800,130)
Investor Shares
Period Ended June 30, 2021
Period Ended December 31, 2020
Year Ended September 30, 2020
Shares Value Shares Value Shares Value
Shares sold ............................................................... 31,247 $ 630,892 1,032 $ 18,262 14,115 $ 217,500Shares issued in reinvestment of distributions ......... — — 137 2,728 2,782 44,734Shares repurchased ................................................. (30,243) (614,343) (15,622) (273,389) (53,368) (738,552)
Net increase/(decrease) ....................................... 1,004 $ 16,549 (14,453) $ (252,399) (36,471) $ (476,318)
Shelton International Select Equity Fund Institutional Shares
Period Ended June 30, 2021
Year Ended December 31, 2020
Shares Value Shares Value
Shares sold ................................................................................................... 1,862,335 $ 50,005,684 2,852,650 $ 61,496,737Shares issued in reinvestment of distributions ............................................. — — 33,046 794,614Shares gained with reorganization (Note 5) ................................................. — — 1,027,306 21,305,921Shares repurchased ..................................................................................... (1,417,464) (37,744,849) (1,475,934) (27,928,354)
Net increase/(decrease) ........................................................................... 444,871 $ 12,260,835 2,437,068 $ 55,668,918
Investor Shares
Period Ended June 30, 2021
Year Ended December 31, 2020
Shares Value Shares Value
Shares sold ................................................................................................... 437,449 $ 11,581,828 411,822 $ 9,231,323Shares issued in reinvestment of distributions ............................................. — — 2,976 71,947Shares gained with reorganization (Note 5) ................................................. — — 94,062 1,938,316Shares repurchased ..................................................................................... (97,426) (2,600,216) (124,979) (2,681,441)
Net increase/(decrease) ........................................................................... 340,023 $ 8,981,612 383,881 $ 8,560,145
13
See accompanying notes to financial statements.
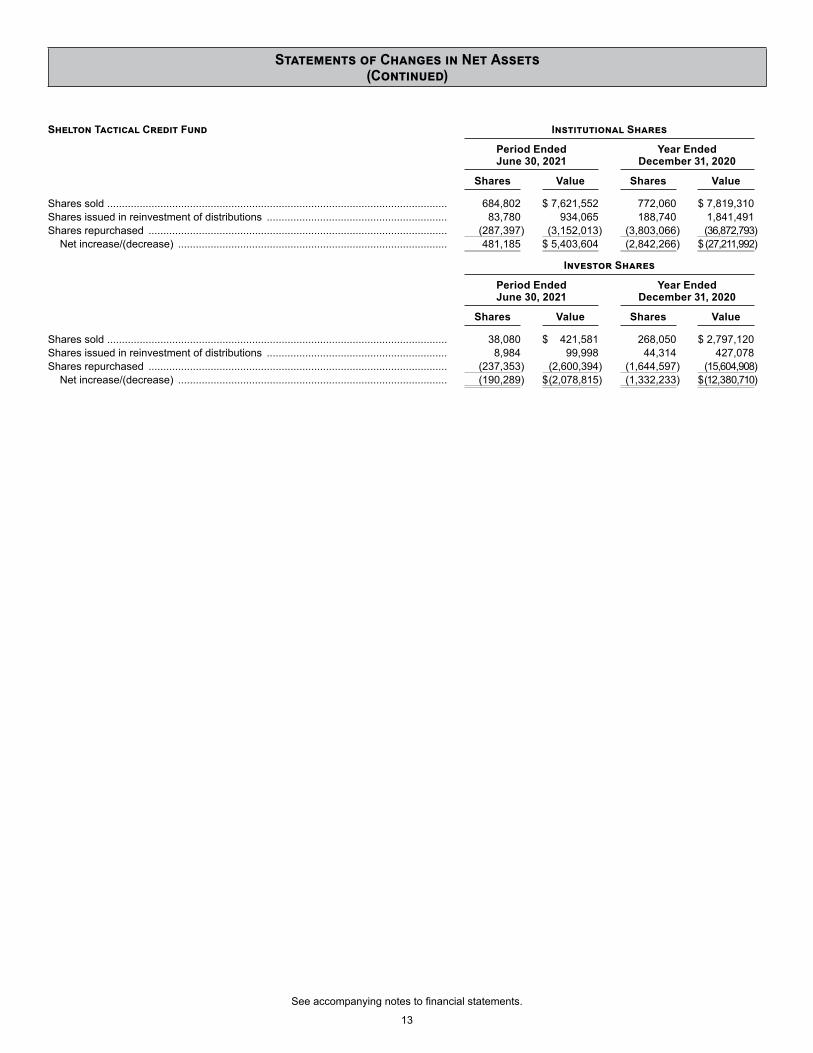
Shelton Tactical Credit Fund Institutional Shares
Period Ended June 30, 2021
Year Ended December 31, 2020
Shares Value Shares Value
Shares sold ................................................................................................................... 684,802 $ 7,621,552 772,060 $ 7,819,310Shares issued in reinvestment of distributions ............................................................. 83,780 934,065 188,740 1,841,491Shares repurchased ..................................................................................................... (287,397) (3,152,013) (3,803,066) (36,872,793)
Net increase/(decrease) ........................................................................................... 481,185 $ 5,403,604 (2,842,266) $ (27,211,992)
Investor Shares
Period Ended June 30, 2021
Year Ended December 31, 2020
Shares Value Shares Value
Shares sold ................................................................................................................... 38,080 $ 421,581 268,050 $ 2,797,120Shares issued in reinvestment of distributions ............................................................. 8,984 99,998 44,314 427,078Shares repurchased ..................................................................................................... (237,353) (2,600,394) (1,644,597) (15,604,908)
Net increase/(decrease) ........................................................................................... (190,289) $ (2,078,815) (1,332,233) $ (12,380,710)
Statements of Changes in Net Assets(Continued)

14
See accompanying notes to financial statements.
Increase/(Decrease) in Cash:Cash flows provided by/(used for) operating activities:
Net increase in net assets resulting from operations ...................................................................................................................... $ 3,308,178Adjustments to reconcile net decrease in net assets from operations
to net cash provided by (used for) operating activities:Purchases of long-term portfolio investments ............................................................................................................................. (48,499,108)Sales of long-term portfolio investments ..................................................................................................................................... 53,430,166Proceeds from securities sold short ............................................................................................................................................ —Cover short securities .................................................................................................................................................................. (3,236,580)Purchases of Options .................................................................................................................................................................. (357,951)Written Options ............................................................................................................................................................................ 457,037Sales/(Purchases) of short-term investments, net ...................................................................................................................... —Consent payment income received ............................................................................................................................................. —Return of capital received ............................................................................................................................................................ —Cash used for corporate actions ................................................................................................................................................. —Decrease/(Increase) in investment securities sold receivable .................................................................................................... 2,093,906Increase/(Decrease) in payable for securities purchased ........................................................................................................... (2,730,000)Increase/(Decrease) in payable for fund shares repurchased .................................................................................................... (107,589)Decrease/(Increase) in dividends and interest receivable ........................................................................................................... 162,474Increase/(Decrease) in distributions payable .............................................................................................................................. 473,026Decrease/(Increase) in Fund Shares Sold .................................................................................................................................. (487,693)Decrease/(Increase) in due from advisor .................................................................................................................................... (9,402)Decrease/(Increase) in prepaid expenses ................................................................................................................................... 2,184Increase/(Decrease) in advisory fees .......................................................................................................................................... 5,465Increase/(Decrease) in short dividends and interest payable ..................................................................................................... (59,857)Increase/(Decrease) in accrued expenses .................................................................................................................................. 29,456Net amortization on investments ................................................................................................................................................. (182,553)Net realized loss/(gain) on investments ...................................................................................................................................... (771,360)Net change in unrealized appreciation/depreciation ................................................................................................................... (1,844,233)Net cash provided by operating activities .................................................................................................................................... 1,675,566
Cash flows provided by (used for) financing activities:Proceeds from shares sold .......................................................................................................................................................... 9,077,196Cost of shares redeemed ............................................................................................................................................................ (5,752,407)Dividends paid to shareholders, net of reinvestments ................................................................................................................. (9,339)Net cash provided by financing activities .................................................................................................................................... 3,315,450
Net increase in cash ............................................................................................................................................................................ 4,991,015
Cash and cash equivalents:Beginning cash balance .................................................................................................................................................................. —Beginning cash held at broker ......................................................................................................................................................... (4,962,373)
Total beginning cash and cash equivalents ......................................................................................................................................... (4,962,373)
Ending cash balance ....................................................................................................................................................................... 28,642Ending cash held at/(due to) broker ................................................................................................................................................ —
Total ending cash and cash equivalents .............................................................................................................................................. $ 28,642
Shelton Tactical Credit FundStatement of Cash Flows (Unaudited)
For the Period Ended June 30, 2021

15
See accompanying notes to financial statements.
Financial HighlightsFor a Share Outstanding Throughout Each Year or Period
Shelton BDC Income Fund
Institutional Shares
Formerly AR Capital
BDC Income Fund
Period Ended June 30,
2021 (Unaudited)
Year Ended December 31,
2020
Year Ended December 31,
2019
Year Ended December 31,
2018
Year Ended December 31,
2017
Period Ended December 31,
2016(a)(b)
Year Ended March 31,
2016(c)
Net asset value, beginning of year $ 7.30 $ 8.96 $ 7.75 $ 8.92 $ 9.11 $ 8.40 $ 9.65INCOME FROM INVESTMENT
OPERATIONSNet investment income/(loss)(d) .. 0.41 0.65 0.52 0.71 0.59 0.44 0.80Net gain/(loss) on securities
(both realized and unrealized) 1.05 (1.61) 1.41 (1.10) (0.22) 0.72 (1.36)Total from investment
operations .......................... 1.46 (0.96) 1.93 (0.39) 0.37 1.16 (0.56)LESS DISTRIBUTIONS
Dividends from net investment income ................................... (0.44) (0.70) (0.65) (0.78) (0.56) (0.45) (0.69)
Distributions from return of capital .................................... — — (0.07) — — — —Total distributions ................... (0.44) (0.70) (0.72) (0.78) (0.56) (0.45) (0.69)
Net asset value, end of year .......... $ 8.32 $ 7.30 $ 8.96 $ 7.75 $ 8.92 $ 9.11 $ 8.40
Total return ..................................... 20.50%(e) (9.00)% 25.32% (4.80)% 3.94% 14.07%(e) (5.76)%(f)
RATIOS / SUPPLEMENTAL DATANet assets, end of year or
period (000s) ......................... $ 270 $ 249 $ 306 $ 1,173 $ 1,610 $ 420 $ 443Ratio of expenses to
average net assets:(g) Before expense
reimbursements ................. 2.14%(h) 2.62% 1.95% 1.78% 1.78% 2.53%(h) 2.47%After expense
reimbursements ................. 1.25%(h),(i) 1.26%(i) 1.27%(i) 1.26%(i) 1.25% 1.24%(h) 1.25%Ratio of net investment
income/(loss) to average net assets(j) 9.30%Before expense
reimbursements ................. 9.16%(h) 8.11% 5.35% 7.56% 5.82% 5.26%(h)
After expense reimbursements ................. 10.06%(h) 9.47% 6.04% 8.08% 6.34% 6.55%(h)
Portfolio turnover ....................... 27%(e) 28% 37% 30% 118% 38%(e) 166%
(a) For the nine months ended December 31, 2016. (b) Following the acquisition on November 4, 2016, advisor class and class A were renamed Institutional and Investor Class.(c) Audited by other independent registered public accounting firm.(d) Calculated based upon average shares outstanding.(e) Not annualized(f) Total returns shown exclude the effect of applicable sales loads/redemption fees. If the Adviser did not reimburse/waive a portion of the Fund’s expenses, total
return would have been lower. Returns are not annualized(g) Does not include expenses of investment companies in which the Fund invests.(h) Annualized(i) CCO Fees are not included in the expense limitation.(j) Recognition of net investment income by the Fund is affected by the timing in which the Fund invests. The ratio does not include the net income of the
investment companies in which the Fund invests.

16
See accompanying notes to financial statements.
Shelton BDC Income Fund
Investor Shares
Formerly AR Capital
BDC Income Fund
Period Ended June 30,
2021 (Unaudited)
Year Ended December 31,
2020
Year Ended December 31,
2019
Year Ended December 31,
2018
Year Ended December 31,
2017
Period Ended December 31,
2016(a)(b)
Year Ended March 31,
2016(c)
Net asset value, beginning of year $ 7.36 $ 9.08 $ 7.83 $ 9.01 $ 9.21 $ 8.51 $ 9.66INCOME FROM INVESTMENT
OPERATIONSNet investment income/(loss)(d) .. 0.39 0.68 0.60 0.68 0.54 0.44 0.70Net gain/(loss) on securities
(both realized and unrealized) 1.12 (1.68) 1.34 (1.11) (0.19) 0.71 (1.17)Total from investment
operations .......................... 1.51 (1.00) 1.94 (0.43) 0.35 1.15 (0.47)LESS DISTRIBUTIONS
Dividends from net investment income ................................... (0.47) (0.72) (0.62) (0.75) (0.55) (0.45) (0.68)
Distributions from return of capital .................................... — — (0.07) — — — —Total distributions ................... (0.47) (0.72) (0.69) (0.75) (0.55) (0.45) (0.68)
Net asset value, end of year .......... $ 8.40 $ 7.36 $ 9.08 $ 7.83 $ 9.01 $ 9.21 $ 8.51
Total return ..................................... 20.43%(e) (9.26)% 25.31% (5.13)% 3.73% 13.74%(e) (4.83)%(f)
RATIOS / SUPPLEMENTAL DATANet assets, end of year or
period (000s) ......................... $ 3,849 $ 3,795 $ 6,077 $ 8,430 $ 13,486 $ 13,614 $ 12,853Ratio of expenses to
average net assets:(g) Before expense
reimbursements ................. 2.38%(h) 2.87% 2.25% 2.03% 2.04% 2.82%(h) 2.66%After expense
reimbursements ................. 1.50%(h),(i) 1.51%(i) 1.52%(i) 1.51%(i) 1.50% 1.50%(h) 1.45%Ratio of net investment
income/(loss) to average net assets(j) 7.89%Before expense
reimbursements ................. 8.72%(h) 8.36% 6.10% 7.13% 5.21% 5.16%(h)
After expense reimbursements ................. 9.62%(h) 9.72% 6.83% 7.65% 5.73% 6.48%(h)
Portfolio turnover ....................... 27%(e) 28% 37% 30% 118% 38%(e) 166%
(a) For the nine months ended December 31, 2016.(b) Following the acquisition on November 4, 2016, advisor class and class A were renamed Institutional and Investor Class.(c) Audited by other independent registered public accounting firm.(d) Calculated based upon average shares outstanding.(e) Not annualized(f) Total returns shown exclude the effect of applicable sales loads/redemption fees. If the Adviser did not reimburse/waive a portion of the Fund’s expenses, total
return would have been lower. Returns are not annualized(g) Does not include expenses of investment companies in which the Fund invests.(h) Annualized(i) CCO Fees are not included in the expense limitation.(j) Recognition of net investment income by the Fund is affected by the timing in which the Fund invests. The ratio does not include the net income of the
investment companies in which the Fund invests.
Financial HighlightsFor a Share Outstanding Throughout Each Year or Period
(Continued)

17
See accompanying notes to financial statements.
Financial HighlightsFor a Share Outstanding Throughout Each Year or Period
(Continued)
Shelton Emerging Markets Fund(a)
Institutional Shares(b)
Period Ended June 30,
2021 (Unaudited)
Period Ended December 31,
2020(c)
Year Ended September 30,
2020
Year Ended September 30,
2019(d)
Year Ended September 30,
2018(d)
Year Ended September 30,
2017(d)
Year Ended September 30,
2016(d)
Net asset value, beginning of year .... $ 20.09 $ 15.33 $ 14.82 $ 16.22 $ 15.90 $ 14.28 $ 12.95INCOME FROM INVESTMENT
OPERATIONSNet investment income/(loss)(e) .. 0.01 (0.04) 0.01 0.31 0.31 0.07 (0.00)(f)
Net gain/(loss) on securities (both realized and unrealized) .. 0.50 4.84 0.87 (1.24) 0.04 1.55 1.33Total from investment
operations .......................... 0.51 4.80 0.88 (0.93) 0.35 1.62 1.33LESS DISTRIBUTIONS
Dividends from net investment income ................................... — (0.04) (0.37) (0.31) (0.03) — —
Distributions from capital gains ... — — — (0.16) — — —Total distributions ................... — (0.04) (0.37) (0.47) (0.03) — —
Net asset value, end of year or period ........................................ $ 20.60 $ 20.09 $ 15.33 $ 14.82 $ 16.22 $ 15.90 $ 14.28
Total return ..................................... 2.54%(g) 31.29%(g) 5.78% (5.60)% 2.21% 11.34% 10.27%
RATIOS / SUPPLEMENTAL DATANet assets, end of year (000s) .. $ 28,667 $ 25,749 $ 21,354 $ 41,845 $ 50,897 $ 51,833 $ 45,786Ratio of expenses to
average net assets:Before expense
reimbursements ................. 1.58%(h) 1.48%(h) 1.89% 1.78% 1.61% 1.72% 1.85%After expense
reimbursements(i) ............... 1.54%(h) 1.48%(h) 1.61% 1.56% 1.55% 1.55% 1.55%Ratio of net investment
income/(loss) to average net assetsBefore expense
reimbursements ................. 0.08%(h) (0.88)%(h) (0.20)% 1.81% 1.83% 0.29% (0.32)%After expense
reimbursements ................. 0.12%(h) (0.88)%(h) 0.08% 2.03% 1.89% 0.46% (0.32)%Portfolio turnover ....................... 12%(g) 27%(g) 58% 78% 63% 169% 156%
(a) Formerly named ICON Emerging Markets Fund.(b) Formerly named ICON Emerging Markets Fund - Class S.(c) Fund changed its fiscal year end from September 30 to December 31.(d) Audited by other independent registered public accounting firm.(e) Calculated based upon average shares outstanding.(f) Amount less than $(0.005).(g) Not Annualized.(h) Annualized.(i) Effective for the year ended September 30, 2020 and thereafter, CCO Fees are not included in the expense limitation. For the year ended September 30, 2020,
reorganization costs not included. For all years presented, interest expense, when applicable, is not included in the expense limitation.

18
See accompanying notes to financial statements.
Shelton Emerging Markets Fund(a)
Investor Shares(b)
Period Ended June 30,
2021 (Unaudited)
Period Ended December 31,
2020(c)
Year Ended September 30,
2020
Year Ended September 30,
2019(d)
Year Ended September 30,
2018(d)
Year Ended September 30,
2017(d)
Year Ended September 30,
2016(d)
Net asset value, beginning of year .... $ 19.92 $ 15.20 $ 14.73 $ 16.08 $ 15.77 $ 14.20 $ 12.91INCOME FROM INVESTMENT
OPERATIONSNet investment income/(loss)(e) .. (0.02) (0.05) (0.01) 0.14 0.24 0.06 (0.01)Net gain/(loss) on securities
(both realized and unrealized) .. 0.50 4.81 0.84 (1.10) 0.07 1.51 1.30Total from investment
operations .......................... 0.48 4.76 0.83 (0.96) 0.31 1.57 1.29LESS DISTRIBUTIONS
Dividends from net investment income ................................... — (0.04) (0.36) (0.23) (0.00)(f) — —
Distributions from capital gains ... — — — (0.16) — — —Total distributions ................... — (0.04) (0.36) (0.39) (0.00) — —
Net asset value, end of year or period ........................................ $ 20.40 $ 19.92 $ 15.20 $ 14.73 $ 16.08 $ 15.77 $ 14.20
Total return(g) .................................. 2.41%(h) 31.29%(h) 5.48% (5.87)% 1.97% 11.06% 9.99%
RATIOS / SUPPLEMENTAL DATANet assets, end of year (000s) .. $ 1,647 $ 1,588 $ 1,432 $ 1,925 $ 6,436 $ 12,887 $ 9,072Ratio of expenses to
average net assets:Before expense
reimbursements ................. 1.84%(i) 1.73%(i) 2.54% 2.26% 1.96% 2.12% 2.16%After expense
reimbursements(j) ............... 1.80%(i) 1.73%(i) 1.89% 1.81% 1.80% 1.80% 1.80%Ratio of net investment
income/(loss) to average net assetsBefore expense
reimbursements ................. (0.26)%(i) (1.12)%(i) (0.74)% 0.45% 1.32% 0.08% (0.43)%After expense
reimbursements ................. (0.22)%(i) (1.12)%(i) (0.08)% 0.90% 1.48% 0.40% (0.07)%Portfolio turnover ....................... 12%(h) 27%(h) 58% 78% 63% 169% 156%
(a) Formerly named ICON Emerging Markets Fund.(b) Formerly named ICON Emerging Markets Fund - Class A.(c) Fund changed its fiscal year end from September 30 to December 31.(d) Audited by other independent registered public accounting firm.(e) Calculated based upon average shares outstanding.(f) Amount less than $(0.005).(g) The total return calculation excludes any sales charges.(h) Not annualized.(i) Annualized.(j) Effective for the year ended September 30, 2020 and thereafter, CCO Fees are not included in the expense limitation. For the year ended September 30, 2020,
reorganization costs not included. For all years presented, interest expense, when applicable, is not included in the expense limitation.
Financial HighlightsFor a Share Outstanding Throughout Each Year or Period
(Continued)

19
See accompanying notes to financial statements.
Financial HighlightsFor a Share Outstanding Throughout Each Year
(Continued)
Shelton International Select Equity Fund Institutional Shares(a)
Period Ended June 30,
2021 (Unaudited)
Year Ended December 31,
2020
Year Ended December 31,
2019
Year Ended December 31,
2018
Period Ended December 31,
2017(b)
Year Ended April 30,
2017
Year Ended April 30, 2016 (c)
Net asset value, beginning of year .... $ 25.77 $ 22.02 $ 18.35 $ 21.34 $ 18.03 $ 15.90 $ 21.20INCOME FROM INVESTMENT
OPERATIONSNet investment income/(loss)(d) .. 0.13 0.12 0.29 0.19 0.10 0.22 0.25Net gain/(loss) on securities
(both realized and unrealized) .. 1.37 3.84 3.84 (2.97) 3.61 2.13 (5.01)Total from investment
operations .......................... 1.50 3.96 4.13 (2.78) 3.71 2.35 (4.76)LESS DISTRIBUTIONS
Dividends from net investment income ................................... — (0.21) (0.46) (0.21) (0.39) (0.22) (0.54)
Distributions from return of capital ...................................... — — — — (0.01) — —
Distributions from capital gains . — — — — — — —Total distributions ................... — (0.21) (0.46) (0.21) (0.40) (0.22) (0.54)
Redemption Fees ...................... — — — — — — —Net asset value, end of year .......... $ 27.27 $ 25.77 $ 22.02 $ 18.35 $ 21.34 $ 18.03 $ 15.90
Total return ..................................... 5.82%(e) 18.07% 22.53% (13.17)% 20.74% 14.89%(e) (22.36)%(f)
RATIOS / SUPPLEMENTAL DATA Net assets, end of year or
period (000s) ......................... $ 147,451 $ 127,893 $ 55,619 $ 41,424 $ 42,824 $ 38,737 $ 44,133Ratio of expenses to
average net assets:Before expense
reimbursements ................. 1.02%(g) 1.04% 1.12% 1.36% 1.32% 1.76%(h) 1.28%(h)
After expense reimbursements . 1.00%(g) 0.99% 1.01% 1.17% 0.99% 0.99% 1.23%Ratio of net investment
income/(loss) to average net assets
Before expense reimbursements ................. 0.92%(g) 0.49% 1.28% 0.73% 0.41%
After expense reimbursements . 0.96%(g) 0.54% 1.40% 0.92% 0.74% 1.32% 1.36%Portfolio turnover ....................... 34%(e) 46% 49% 65% 24% 41% 40%
(a) As of July 28, 2017 Class A shares and I shares were renamed to Investor shares and Institutional shares, respectively.(b) For the eight month period ended December 31, 2017.(c) Audited by other independent registered public accounting firm.(d) Calculated based upon average shares outstanding.(e) Not annualized.(f) Total investment return is calculated assuming a purchase of shares on the first day and a sale of shares on the last day of each period reported and includes
reinvestment of dividends and distributions, if any. For Investor Shares (Formerly Class A Shares), total investment return does not reflect the impact of the maximum front-end sales load of 5.75%. If reflected, the return would be lower.
(g) Annualized.(h) During the period, certain fees were waived and/or reimbursed; or recouped, if any. If such fee waivers and/or reimbursements or recoupments had not
occurred, the ratios would have been as indicated.

20
See accompanying notes to financial statements.
Financial HighlightsFor a Share Outstanding Throughout Each Year or Period
(Continued)
Shelton International Select Equity FundInvestor Shares(a)
Period Ended June 30,
2021 (Unaudited)
Year Ended December 31,
2020
Year Ended December 31,
2019
Year Ended December 31,
2018
Period Ended December 31,
2017(b)
Year Ended April 30,
2017
Year Ended April 30, 2016(c)
Net asset value, beginning of year .... $ 25.62 $ 21.91 $ 18.29 $ 21.30 $ 18.02 $ 15.88 $ 21.16INCOME FROM INVESTMENT
OPERATIONSNet investment income/(loss)(d) .. 0.11 0.05 0.24 0.11 0.08 0.17 0.19Net gain/(loss) on securities
(both realized and unrealized) .. 1.35 3.80 3.83 (2.94) 3.60 2.13 (4.97)Total from investment
operations .......................... 1.46 3.85 4.07 (2.83) 3.68 2.30 (4.78)LESS DISTRIBUTIONS
Dividends from net investment income ................................... — (0.14) (0.45) (0.18) (0.39) (0.16) (0.50)
Distributions from return of capital ...................................... — — — — (0.01) — —
Distributions from capital gains . — — — — — — —Total distributions ................... — (0.14) (0.45) (0.18) (0.40) (0.16) (0.50)
Redemption Fees ...................... — — — — — — —Net asset value, end of year .......... $ 27.08 $ 25.62 $ 21.91 $ 18.29 $ 21.30 $ 18.02 $ 15.88
Total return ..................................... 5.70%(e) 17.64% 22.25% (13.41)% 20.53% 14.55%(e) (22.51)%(f)
RATIOS / SUPPLEMENTAL DATA Net assets, end of year or
period (000s) ......................... $ 25,971 $ 15,863 $ 5,152 $ 5,904 $ 3,785 $ 4,488 $ 8,488Ratio of expenses to
average net assets:Before expense
reimbursements ................. 1.28%(g) 1.29% 1.38% 1.56% 1.59% 2.02%(h) 1.53%(h)
After expense reimbursements . 1.24%(g) 1.25% 1.26% 1.38% 1.24% 1.24% 1.48%Ratio of net investment
income/(loss) to average net assets
Before expense reimbursements ................. 0.82%(g) 0.19% 1.06% 0.33% 0.23%
After expense reimbursements . 0.86%(g) 0.24% 1.17% 0.51% 0.58% 1.06% 1.11%Portfolio turnover ....................... 34%(e) 46% 49% 65% 24% 41% 40%
(a) As of July 28, 2017 Class A shares and I shares were renamed to Investor shares and Institutional shares, respectively.(b) For the eight month period ended December 31, 2017.(c) Audited by other independent registered public accounting firm.(d) Calculated based upon average shares outstanding.(e) Not annualized.(f) Total investment return is calculated assuming a purchase of shares on the first day and a sale of shares on the last day of each period reported and includes
reinvestment of dividends and distributions, if any. For Investor Shares (Formerly Class A Shares), total investment return does not reflect the impact of the maximum front-end sales load of 5.75%. If reflected, the return would be lower.
(g) Annualized.(h) During the period, certain fees were waived and/or reimbursed; or recouped, if any. If such fee waivers and/or reimbursements or recoupments had not
occurred, the ratios would have been as indicated.

21
See accompanying notes to financial statements.
Financial HighlightsFor a Share Outstanding Throughout Each Year or Period
(Continued)
Shelton Tactical Credit FundInstitutional Shares Period
Ended June 30,
2021 (Unaudited)
Year Ended December
31, 2020
For the Period
November 1, 2019
through December 31,
2019(a)
Year Ended October 31,
2019
Year Ended October 31,
2018
For the Period
December 1, 2016
through October 31,
2017(b)
Year Ended November
30, 2016
Year Ended November
30, 2015
Net asset value, beginning of year ........ $ 10.70 $ 10.55 $ 10.53 $ 10.97 $ 10.75 $ 10.68 $ 10.48 $ 10.93INCOME FROM INVESTMENT
OPERATIONSNet investment income/(loss)(c) ...... 0.16 0.40 0.04 0.12 0.17 0.22 0.25 0.26Net gain/(loss) on securities
(both realized and unrealized) ...... 0.61 0.18 0.02 (0.09) 0.38 0.27 0.21 (0.45)Total from investment
operations .............................. 0.77 0.58 0.06 0.03 0.55 0.49 0.46 (0.19)LESS DISTRIBUTIONS
Dividends from net investment income ....................................... (0.24) (0.43) (0.04) (0.36) (0.29) (0.28) (0.26) (0.26)
Distributions from capital gains ..... — — — (0.11) (0.04) (0.14) — —Total distributions ....................... (0.24) (0.43) (0.04) (0.47) (0.33) (0.42) (0.26) (0.26)
Redemption fees(c) ............................. — — — — —(d) —(d) —(d) —(d)
Net asset value, end of year .............. $ 11.23 $ 10.70 $ 10.55 $ 10.53 $ 10.97 $ 10.75 $ 10.68 $ 10.48
Total return ......................................... 7.21%(e) 5.89% 0.60%(e) 0.37% 5.20% 4.63%(e) 4.41% (1.80)%
RATIOS / SUPPLEMENTAL DATA Net assets, end of year or
period (000s) ......................... $ 47,886 $ 40,473 $ 69,877 $ 77,405 $ 66,195 $ 67,084 $ 57,555 $ 44,465Ratio of expenses to
average net assets:Before expense reimbursements .. 2.38%(f),(g) 3.45%(f) 2.83%(f),(g),(h) 3.12%(h) 5.18%(h) 4.35%(g),(h) 4.26%(h) 3.83%(h)
After expense reimbursements . 2.22%(f),(g) 3.35%(f) 2.72%(f),(g),(h) 3.01%(h) 4.95%(h) 4.15%(g),(h) 3.93%(h) 3.47%(h)
Ratio of net investment income/(loss) to average net assets
Before expense reimbursements .. 2.72%(g) 3.83% 2.34%(g) 1.00% 1.38% 2.03%(g) 2.02% 2.11%After expense reimbursements ..... 2.88%(g) 3.93% 2.45%(g) 1.11% 1.61% 2.23%(g) 2.35% 2.47%Portfolio turnover ........................... 81%(e) 249% 20%(e) 116% 63% 69%(e) 70% 64%
(a) Fiscal year end changed from October 31 to December 31.(b) Fiscal year end changed from November 30 to October 31.(c) Based on average shares outstanding for the period.(d) Amount less than $0.01 per share.(e) Not annualized.(f) If interest expense and dividends on borrowings and securities sold short had been excluded, the expense ratios would have been lowered by 0.45% for the
period ended June 30, 2021, and 1.13% for the year ended December 31, 2020 and 1.03% for the period ended December 31, 2019.(g) Annualized.(h) If interest expense and dividends on securities sold short had been excluded, the expense ratios would have been lowered by 0.66% for the year ended
October 31, 2019, 3.56% for the year ended October 31, 2018, 2.76% for the period December 1, 2016 through October 31, 2017, and by 2.54%, 2.08%, and 1.44% for the periods ended November 30, respectively.

22
See accompanying notes to financial statements.
Shelton Tactical Credit FundInvestor Shares Period
Ended June 30,
2021 (Unaudited)
Year Ended December
31, 2020
For the Period
November 1, 2019
through December 31,
2019(a)
Year Ended October 31,
2019
Year Ended October 31,
2018
For the Period
December 1, 2016
through October 31,
2017(b)
Year Ended November
30, 2016
Year Ended November
30, 2015
Net asset value, beginning of year ........ $ 10.71 $ 10.55 $ 10.54 $ 10.96 $ 10.74 $ 10.68 $ 10.48 $ 10.93INCOME FROM INVESTMENT
OPERATIONSNet investment income/(loss)(c) ...... 0.15 0.36 0.04 0.08 0.15 0.20 0.23 0.24Net gain/(loss) on securities
(both realized and unrealized) ... 0.61 0.21 — (0.06) 0.37 0.25 0.21 (0.46)Total from investment
operations .............................. 0.76 0.57 0.04 0.02 0.52 0.45 0.44 (0.22)LESS DISTRIBUTIONS
Dividends from net investment income ....................................... (0.25) (0.41) (0.03) (0.33) (0.26) (0.25) (0.24) (0.23)
Distributions from capital gains ..... — — — (0.11) (0.04) (0.14) — —Total distributions ....................... (0.25) (0.41) (0.03) (0.44) (0.30) (0.39) (0.24) (0.23)
Redemption fees(c) ............................. — — — — —(d) —(d) —(d) —(d)
Net asset value, end of year .............. $ 11.22 $ 10.71 $ 10.55 $ 10.54 $ 10.96 $ 10.74 $ 10.68 $ 10.48
Total return ......................................... 7.08%(e) 5.77% 0.43%(e) 0.22% 4.93% 4.28%(e) 4.17% (2.04)%
RATIOS / SUPPLEMENTAL DATA Net assets, end of year or
period (000s) ......................... $ 4,686 $ 6,510 $ 20,478 $ 20,942 $ 12,044 $ 22,964 $ 18,206 $ 5,627Ratio of expenses to
average net assets:Before expense reimbursements .. 2.62%(f),(g) 3.70%(f) 3.08%(f),(g),(h) 3.51%(h) 5.43%(h) 4.60%(g),(h) 4.51%(h) 4.08%(h)
After expense reimbursements . 2.46%(f),(g) 3.60%(f) 2.97%(f),(g),(h) 3.45%(h) 5.20%(h) 4.40%(g),(h) 4.18%(h) 3.72%(h)
Ratio of net investment income/(loss) to average net assets
Before expense reimbursements .. 2.54%(g) 3.51% 1.99%(g) 0.70% 1.13% 1.78%(g) 1.77% 1.86%After expense reimbursements ..... 2.70%(g) 3.63% 2.10%(g) 0.76% 1.36% 1.98%(g) 2.10% 2.22%Portfolio turnover ........................... 81%(e) 249% 20%(e) 116% 63% 69%(e) 70% 64%
(a) Fiscal year end changed from October 31 to December 31.(b) Fiscal year end changed from November 30 to October 31.(c) Based on average shares outstanding for the period.(d) Amount less than $0.01 per share.(e) Not annualized.(f) If interest expense and dividends on borrowings and securities sold short had been excluded, the expense ratios would have been lowered by 0.47% for the
period ended June 30, 2021, and 1.13% for the year ended December 31, 2020 and 1.03% for the period ended December 31, 2019.(g) Annualized.(h) If interest expense and dividends on securities sold short had been excluded, the expense ratios would have been lowered by 0.66% for the year ended
October 31, 2019, 3.56% for the year ended October 31, 2018, 2.76% for the period December 1, 2016 through October 31, 2017, and by 2.54%, 2.08%, and 1.44% for the periods ended November 30, respectively.
Financial HighlightsFor a Share Outstanding Throughout Each Year or Period
(Continued)

23
SCM Trust Notes to Financial Statements (Unaudited) June 30, 2021
NOTE 1 – SUMMARY OF SIGNIFICANT ACCOUNTING POLICIES
SCM Trust (the “Trust”), a Massachusetts business trust formed in July 1988 is registered as an investment company under the Investment Company Act of 1940, as amended. As of June 30, 2021 the Trust consists of eleven separate series, four of which are included in these financial statements.
Shelton BDC Income Fund (“BDC Income Fund”) is an open-end, non-diversified series of the Trust. The Fund’s inception date is April 22, 2014, and the commencement date of operations is May 2, 2014. The investment objective is to provide a high level of income with the potential for capital appreciation. Effective July 1, 2016, CCM Partners d/b/a Shelton Capital Management, a California limited partnership (“Shelton” or the “Advisor”) became the advisor to the Fund.
The Shelton Emerging Markets Fund (“Emerging Markets Fund”) is an open-end diversified series of the Trust. The Fund’s inception date of the Fund is June 26, 2020. The Fund’s investment objective is to seek long-term capital appreciation. The Fund is the successor fund to the ICON Emerging Markets Fund, a series of ICON Funds, pursuant to a reorganization that occurred after the close of business on June 26, 2020. All historic performance and financial information presented is that of the ICON Emerging Markets Fund, which was the accounting and performance survivor of the reorganizations. Historic information presented for the Institutional Class and Investor Classes shares is based on that of the Class S and Class A shares, respectively, of the ICON Emerging Markets Fund.
Shelton Tactical Credit Fund (“Tactical Credit Fund”) is an open-end, diversified series of the Trust. The Fund’s inception date is December 16, 2014. The Fund’s investment objective is to seek current income and capital appreciation. Effective July 1, 2016, Shelton became the advisor to the Fund. The Tactical Credit Fund is a successor to a series of the FundVantage Trust, a Delaware statutory trust, pursuant to a reorganization that took place after the close of business on March 17, 2017. Prior to March 17, 2017, the Successor Fund had no investment operations. As a result of the reorganization, holders of Class A Shares and Class C Shares of the former Tactical Credit Fund received Investor Shares of the successor Tactical Credit Fund and holders of Advisor Class Shares of the former Tactical Credit Fund received Institutional Shares of the successor Tactical Credit Fund. On June 19, 2019, the shareholders of the Cedar Ridge Unconstrained Credit Fund (the “Cedar Ridge Fund”) approved the agreement and plan of reorganization providing for the transfer of assets and assumption of liabilities into the Shelton Tactical Credit Fund. Cedar Ridge Unconstrained Credit Fund is the performance and accounting survivor of the reorganization, Shelton Tactical Credit is the legal and tax survivor. The reorganization was effective as of the close of business on June 21, 2019. See Note 7 for more information.
Shelton International Select Equity Fund (“International Select Fund”, and together with the BDC Income Fund, the Emerging Markets Fund, and the Tactical Credit Fund, each a “Fund” and collectively, the “Funds”) is an open-end, diversified series of the Trust. The Fund’s inception date is July 31, 2009. The Fund’s investment objective is to achieve long-term capital appreciation. Effective July 18, 2016, Shelton became the advisor to the Fund. The International Select Fund is a successor to a series of the FundVantage Trust, a Delaware statutory trust, pursuant to a reorganization that took place after the close of business on July 28, 2017. Prior to July 28, 2017, the Successor Fund had no investment operations. As a result of the reorganization, holders of Class A Shares of the former International Select Fund received Investor Shares of the successor International Select Equity Fund and holders of Class I Shares of the former International Select Equity Fund received Institutional Shares of the successor International Select Equity Fund.
On June 3, 2020 the shareholders of the ICON International Equity Fund, a series of ICON Funds approved the agreement and plan of reorganization providing for the transfer of assets and assumption of liabilities into the Shelton International Select Equity Fund. The International Select Fund is the performance and accounting, legal and tax survivor of the reorganization. The reorganization was effective as of the open of business on June 29, 2020. See Note 7 for more information.
The Trust follows the investment company accounting and reporting guidance of the Financial Accounting Standards Board (“FASB”) Accounting Standards Codification Topic 946, “Financial Services – Investment Companies”.
(a) Security Valuation — Inputs used to value corporate debt securities generally include relative credit information, observed market movements, sector news, U.S. Treasury yield curve or relevant benchmark curve, and other market information, which may include benchmark yields, reported trades, broker-dealer quotes, issuer spreads, benchmark securities, bids, offers, and reference data, such as market research publications, when available (“Other Market Information”). Equity securities listed on a national or international exchange are valued at the last reported sales price. Futures contracts are valued at the settle price, depending on the exchange the contract trades on, typically as of 4:15 p.m., Eastern Time. Municipal securities are valued by an independent pricing service at a price determined by a matrix pricing method. This technique generally considers such factors as yields or prices of bonds of comparable quality, type of issue, coupon, maturity, ratings and general market conditions. U.S. government securities for which market quotations are readily available are valued at the mean between the closing bid and asked prices provided by an independent pricing service. U.S. agency securities consisting of mortgage pass-through certificates are valued using dealer quotations provided by an independent pricing service. U.S. Treasury Bills are valued at amortized cost which approximates market value. Securities with remaining maturities of 60 days or less are valued on the amortized cost basis as reflecting fair value.
Securities for which market quotes are not readily available from the Trust’s third-party pricing service are valued at fair value, determined in good faith and in accordance with procedures adopted by the Board of Trustees. The Board has delegated to the Advisor’s Pricing Committee the responsibility for determining the fair value, subject to the Board oversight and the review of the pricing decisions at its quarterly meetings. For a description of the Advisor, see Note 2.
(b) Federal Income Taxes — No provision is considered necessary for federal income taxes. The Funds intend to qualify for and elect the tax treatment applicable to regulated investment companies under the Internal Revenue Code and to distribute all their taxable income to shareholders.
(c) Short Sales — Short sales are transactions under which the Tactical Credit Fund sells a security it does not own in anticipation of a decline in the value of that security. To complete such a transaction, the Fund must borrow the security to make delivery to the buyer. The Fund then is obligated to replace the security borrowed by purchasing the security at market price at the time of replacement. The price at such time may be more or less than the price at which the security was sold by the Fund. When a security is sold short a decrease in the value of the security will be recognized as a gain and an increase in the value of the security will be recognized as a loss, which is potentially limitless. Until the security is replaced, the Fund is required to pay the lender amounts equal to dividend or interest that accrue during the period of the loan which is recorded as an expense. To borrow the security, the Fund also may be required to pay a premium or an interest fee, which are recorded as interest expense. Cash or securities are segregated for the broker to meet the necessary margin requirements. The Fund is subject to the risk that it may not always be able to close out a short position at a particular time or at an acceptable price.

24
SCM Trust Notes to Financial Statements (Unaudited) (Continued) June 30, 2021
(d) Municipal Bonds — Municipal bonds are debt obligations issued by the states, possessions, or territories of the United States (including the District of Columbia) or a political subdivision, public instrumentality, agency, public authority or other governmental unit of such states, possessions, or territories (e.g., counties, cities, towns, villages, districts and authorities). Municipal bonds may be issued as taxable securities, or as federally tax-exempt securities. States, possessions, territories and municipalities may issue municipal bonds to raise funds for various public purposes such as airports, housing, hospitals, mass transportation, schools, water and sewer works, gas, and electric utilities. They may also issue municipal bonds to refund outstanding obligations and to meet general operating expenses. Municipal bonds may be general obligation bonds or revenue bonds. General obligation bonds are secured by the issuer’s pledge of its full faith, credit and taxing power for the payment of principal and interest. Revenue bonds are payable from revenues derived from particular facilities, from the proceeds of a special excise tax or from other specific revenue sources. They are not usually payable from the general taxing power of a municipality. In addition, certain types of “private activity” bonds may be issued by public authorities to obtain funding for privately operated facilities, such as housing and pollution control facilities, for industrial facilities and for water supply, gas, electricity and waste disposal facilities. Other types of private activity bonds are used to finance the construction, repair or improvement of, or to obtain equipment for, privately operated industrial or commercial facilities. Current federal tax laws place substantial limitations on the size of certain of such issues. In certain cases, the interest on a private activity bond may not be exempt from federal income tax or the alternative minimum tax.
(e) Security Transactions, Investment Income and Distributions to Shareholders — Security transactions are recorded on the trade date. Interest income is recorded on the accrual basis. Dividend income is recorded on the ex-dividend date. Withholding taxes on foreign dividends have been provided for, in accordance with the Trust’s understanding of the applicable country’s tax rules and rates. Discounts or premiums on debt securities are accreted or amortized to interest income over the lives of the respective securities using the effective interest method or, where applicable, to the first call date of the securities. Distributions to shareholders are recorded on the ex-dividend date for the Funds. Income distributions and capital gain distributions are determined in accordance with income tax regulations which may differ from accounting principles generally accepted in the United States of America. These differences are primarily due to differing treatments for PFICs, wash sales, REIT adjustments and post-October capital losses.
Distributions received from investments in securities that represent a return of capital or capital gains are recorded as a reduction of cost of investment or as a realized gain, respectively. The calendar year-end amounts of ordinary income, capital gains, and return of capital included in distributions received from a Fund’s investments in real estate investment trusts (“REITs”) are reported to the Fund after the end of the calendar year; accordingly, the Funds estimate these amounts for accounting purposes until the characterization of REIT distributions is reported to the Fund after the end of the calendar year. Estimates are based on the most recent REIT distribution information available.
These “Book/tax” differences are considered either temporary (i.e., deferred losses, capital loss carry forwards) or permanent in nature. To the extent these differences are permanent in nature, such amounts are reclassified within the composition of net assets based on their federal tax basis treatment; temporary differences do not require reclassification.
(f) Foreign Currency Translation — Investment securities and other assets and liabilities denominated in foreign currencies are translated into U.S. dollar amounts at the date of valuation. Purchases and sales of investment securities and income and expense items denominated in foreign currencies are translated into U.S. dollar amounts on the respective dates of such transactions. The Trust does not isolate that portion of the results of operations resulting from changes in foreign exchange rates on investments from the fluctuations arising from changes in market prices of securities held. Such fluctuations are included with the net realized and unrealized gain or loss from investments.
Reported net realized foreign exchange gains or losses arise from sales of foreign currencies, currency gains or losses realized between the trade and settlement dates on securities transactions, and the difference between the amounts of dividends, interest, and foreign withholding taxes recorded on the company’s books and the U.S. dollar equivalent of the amounts actually received or paid. Net unrealized foreign exchange gains and losses arise from changes in the fair values of assets and liabilities, other than investments in securities at fiscal period end, resulting from changes in exchange rates.
(g) Concentration — The BDC Income Fund invests substantially all (and under normal market conditions, at least 80%) of its net assets (plus any borrowings for investment purposes) in common stocks and other equity securities of business development companies (“BDCs”) that are traded on one or more nationally recognized securities exchanges. The equity securities in which the Fund may invest consist of common stocks, securities convertible into common stocks; and preferred stocks. In addition, although the Fund typically invests in equity securities, the Fund may invest up to 20% of its net assets in debt securities of BDCs and other issuers of any maturity, duration or credit rating.
The Tactical Credit Fund aims to use related credit asset classes on both the long and short side to generate an attractive rate of return with low volatility. Portfolio construction is implemented with a relative value framework and looks across the entire balance sheet of a corporation from senior secured down through subordinated, equity-linked bonds. This hedged approach is designed to generate performance that is less reliant on the direction of the overall market than a typical credit-based fund.
Cash & Cash Equivalents: The Funds consider their investment in a Federal Deposit Insurance Corporation (“FDIC”) insured interest bearing account to be cash and cash equivalents. Cash and cash equivalents are valued at cost plus any accrued interest. The Funds maintain cash balances, which, at times may exceed federally insured limits. The Funds maintain these balances with a high-quality financial institution.
Concentration of Credit Risk: Each Fund places its cash with a banking institution, which is insured by FDIC. The FDIC limit is $250,000. At various times throughout the year, the amount on deposit may exceed the FDIC limit and subject the Funds to a credit risk. The Funds do not believe that such deposits are subject to any unusual risk associated with investment activities.
(h) Use of Estimates in Financial Statements — In preparing financial statements in conformity with accounting principles generally accepted in the United States of America, Shelton Capital makes estimates and assumptions that affect the reported amounts of assets and liabilities at the date of the financial statements, as well as the reported amounts of income and expense during the year. Actual results may differ from these estimates.
(i) Share Valuations — The net asset value (“NAV”) per share of each Fund is calculated by dividing the sum of the value of the securities held by the Fund, plus cash or other assets, minus all liabilities (including estimated accrued expenses) by the total number of shares outstanding of the Fund, rounded to the nearest cent. A Fund’s shares will not be priced on the days on which the NYSE is closed for trading. The offering and redemption price per share of each Fund is equal to a Fund’s NAV per share.

25
SCM Trust Notes to Financial Statements (Unaudited) (Continued) June 30, 2021
(j) Accounting for Uncertainty in Income Taxes — The Funds recognize the tax benefits of uncertain tax positions only where the position is “more likely than not” to be sustained assuming examination by tax authorities. Shelton Capital has analyzed the Fund’s tax positions, and has concluded that no liability for unrecognized tax benefits should be recorded related to uncertain tax positions taken on returns filed for open tax years (2017-2019) or expected to be taken in the Fund’s 2020 tax returns. The Funds identify its major tax jurisdictions as U.S. Federal, however the Funds are not aware of any tax positions for which it is reasonably possible that the total amounts of unrecognized tax benefits will change materially in the next twelve months.
(k) Fair Value Measurements — The Funds utilize various methods to measure the fair value of most of its investments on a recurring basis. U.S. GAAP establishes a hierarchy that prioritizes inputs to valuation methods. The three levels of inputs are:
Level 1 – Unadjusted quoted prices in active markets for identical assets or liabilities that the company has the ability to access.
Level 2 – Observable inputs other than quoted prices included in Level 1 that are observable for the asset or liability, either directly or indirectly. These inputs may include quoted prices for the identical instrument on an inactive market, prices for similar instruments, interest rates, prepayment speeds, credit risk, yield curves, default rates and similar data.
Level 3 – Unobservable inputs for the asset or liability, to the extent relevant observable inputs are not available, representing the Fund’s own assumptions about the assumptions a market participant would use in valuing the asset or liability, and would be based on the best information available.
The availability of observable inputs can vary from security to security and is affected by a wide variety of factors, including, for example, the type of security, whether the security is new and not yet established in the marketplace, the liquidity of markets, and other characteristics particular to the security. To the extent that valuation is based on models or inputs that are less observable or unobservable in the market, the determination of fair value requires more judgment. Accordingly, the degree of judgment exercised in determining fair value is greatest for instruments categorized in Level 3.
The inputs used to measure fair value may fall into different levels of the fair value hierarchy. In such cases, for disclosure purposes, the level in the fair value hierarchy within which the fair value measurement falls in its entirety, is determined based on the lowest level input that is significant to the fair value measurement in its entirety.
The following table summarizes the valuation of the Trust’s securities at June 30, 2021 using fair value hierarchy:
Level 1(a) Level 2(a) Level 3(a) Level 2(a) Level 2(a)
FundInvestments in
Securities(b)Investments in
Securities(c)Investments in Securities
Total Investments
Purchased Options
Written Options
BDC Income Fund ............... $ 4,083,005 $ — $ 8,033 $ 4,091,038 $ — $ —Emerging Markets Fund ...... $ 28,347,962 $ — $ — $ 28,347,962 $ — $ —International Select Fund ..... $ 159,524,656 $ — $ — $ 159,524,656 $ — $ —Tactical Credit Fund - Assets $ 310,923 $ 54,931,589 $ 132,909 $ 55,375,421 $ 9,376 $ —
Tactical Credit Fund - Liabilities ........................ $ — $ 3,341,101 $ — $ 3,341,101 $ — $ —
(a) It is the Funds’ policy to recognize transfers between levels on the last day of the fiscal reporting period.(b) For a detailed break-out of common stocks by major industry classification, please refer to the Portfolio of Investments.(c) All fixed income securities held in the Funds are Level 2 securities. For a detailed break-out of fixed income securities by type, please refer to the Portfolio of
Investments.
Level 3 SecuritiesBDC Income
FundInternational Select Fund
Tactical Credit Fund
Beginning Balance .......................................................................................................... $ 8,033 $ 171,856 $ 5,346Net Purchases ................................................................................................................ — — —Net Sales ........................................................................................................................ — — —Total Realized Gain/(Loss) ............................................................................................. — — —Change in Unrealized Appreciation/(Depreciation) ......................................................... — — (1,097,807)Accrued Interest ............................................................................................................. — — —Transfers into Level 3 ..................................................................................................... — — 1,225,370Transfers out of Level 3 .................................................................................................. — 171,856 —Ending Balance .............................................................................................................. $ 8,033 — $ 132,909
Fair Value as of 06/30/2021 Valuation Techniques Unobservable Input Input Values
Impact to valuation from
an increase to input
BDC Income FundNewstar Financial Inc CVR $ 8,033 Estimated recovery proceeds Expected remaining distributions $0.08 IncreaseTactical Credit FundCopper Earnout Trust $ 9,133 Offering documents, secondary offers Market assessment $10.25 IncreaseJC Penney Corp Inc $ 3,500 Offering documents, secondary offers Market assessment $0.25 IncreasePropco Earnout Trust $ 120,276 Offering documents, secondary offers Market assessment $18.00 Increase

26
SCM Trust Notes to Financial Statements (Unaudited) (Continued) June 30, 2021
(l) Disclosure about Derivative Instruments and Hedging Activities — The Fund has adopted enhanced disclosure regarding derivative and hedging activity intended to improve financial reporting of derivative instruments by enabling investors to understand how and why an entity uses derivatives, how derivatives are accounted for, and how derivative instruments affect an entity’s results of operations and financial position.
The effect of derivative instruments on the Statements of Assets & Liabilities for the six months ended June 30, 2021:
Derivatives Not Accounted for as Hedging InstrumentsTactical
Credit Fund
Asset DerivativesPurchased Options ................................................................................................................................................................................ $ 9,376
Liability DerivativesWritten Options ...................................................................................................................................................................................... $ —
The effect of derivative instruments on the Statements of Operations for the year ended June 30, 2021:
Derivatives Not Accounted for as Hedging InstrumentsTactical
Credit Fund
Amount of Realized Gain/(Loss) Recognized on DerivativesInterest Rate Futures ............................................................................................................................................................................. $ 142,968Purchased Interest Rate Options .......................................................................................................................................................... 60,328Written Interest Rate Options ................................................................................................................................................................ 10,155Purchased Equity Options ..................................................................................................................................................................... (163,554)Written Equity Options ........................................................................................................................................................................... 64,445Total ....................................................................................................................................................................................................... $ 31,145
Amount of Change in Unrealized Appreciation/Depreciation Recognized on DerivativesInterest Rate Futures ............................................................................................................................................................................. $ —Purchased Interest Rate Options .......................................................................................................................................................... (55,859)Written Interest Rate Options ................................................................................................................................................................ (25,781)Purchased Equity Options ..................................................................................................................................................................... 151,554Written Equity Options ........................................................................................................................................................................... (62,945)Total ....................................................................................................................................................................................................... $ 6,969
The previously disclosed derivative instruments outstanding as of June 30, 2021, and their effect on the Statement of Operations for the six month January 1, 2021 through June 30, 2021, serve as indicators of the volume of financial derivative activity for the company. The following table indicates the average volume for the six month period:
Average Month End Notional
Value
Purchased Options ................................................................................................................................................................................ $ 26,191,667Written Options ...................................................................................................................................................................................... 2,200,000
(m) LIBOR Transition Risk — The United Kingdom’s Financial Conduct Authority announced a phase out of the London Interbank Offered Rate (“LIBOR”) by the end of 2021, On November 30, 2020, the administrator of LIBOR announced its intention to delay the phase out of the majority of the U.S. dollar LIBOR publications until June 30, 2023, with the remainder of LIBOR publications to still end at the end of 2021. The Funds may be exposed to financial instruments tied to LIBOR to determine payment obligations, financing terms, hedging strategies or investment value. The transition process away from LIBOR might lead to increased volatility and illiquidity in markets for, and reduce the effectiveness of new hedges placed against, instruments whose terms currently include LIBOR. The ultimate effect of the LIBOR transition process on the Funds Is uncertain.
(n) COVID-19 Risks — An outbreak of respiratory disease caused by a novel coronavirus was first detected in December 2019 and has now spread internationally. This coronavirus has resulted in closing borders, enhanced health screenings, partial population vaccination, healthcare service preparation and delivery, quarantines, cancellations, disruptions to supply chains and customer activity, government sponsored fiscal stimulus programs, various moratoria on the applicability of certain laws and regulations, as well as general concern and uncertainty. The impact of this coronavirus, (and the variants of such virus) and other epidemics and pandemics that may arise in the future, could affect the economies of many nations, individual companies, their securities (including equity and debt), and the market in general in ways that cannot necessarily be foreseen at the present time. In addition, the impact of infectious diseases in developing or emerging market countries may be greater due to less established health care systems. Health crises caused by the recent coronavirus outbreak may exacerbate other pre-existing political, social, financial, and economic risks in certain countries. The impact of the outbreak may last for an extended period of time.

27
SCM Trust Notes to Financial Statements (Unaudited) (Continued) June 30, 2021
NOTE 2 - INVESTMENT MANAGEMENT FEE AND OTHER RELATED PARTY TRANSACTIONS
Shelton provides each Fund with management and administrative services pursuant to investment management and administration servicing agreements.
In accordance with the terms of the management agreement, the Advisor receives compensation at the following annual rates:
FundNet
Assets
BDC Income Fund ................................................................................................................................................................................. 0.90%Emerging Markets Fund ........................................................................................................................................................................ 1.00%International Select Fund ....................................................................................................................................................................... 0.74%Tactical Credit Fund ............................................................................................................................................................................... 1.17%
The Advisor contractually agreed to reduce total operating expense to certain Funds of the Trust. This additional contractual reimbursement (excluding certain compliance costs, extraordinary expenses such as litigation or merger and reorganization expenses, for example and with respect to the BDC Income Fund, acquired fund fees and expenses) is effective until the dates listed below, unless renewed, and is subject to recoupment within three fiscal years following reimbursement. Recoupment is limited to the extent the reimbursement does not exceed any applicable expense limit and the effect of the reimbursement is measured after all ordinary operating expenses are calculated; any such reimbursement is subject to the Board of Trustees’ review and approval. Reimbursements from the Advisor to affected Funds, and the contractual expense limits, for the year ended June 30, 2021 are as follows:
Contractual Expense Limitation
FundInstitutional
SharesInvestor Shares Expiration
BDC Income Fund ................................................................................................................ 1.25% 1.50% 5/1/22Emerging Markets Fund ....................................................................................................... 1.55% 1.80% 5/1/22International Select Fund ...................................................................................................... 0.99% 1.24% 5/1/22Tactical Credit Fund .............................................................................................................. 1.39% 1.64% 5/1/22
At June 30, 2021, the remaining cumulative unreimbursed amount paid and/or waived by the Advisor on behalf of the Funds that may be reimbursed was $703,469. The Advisor may recapture a portion of the above amount no later than the dates as stated below.
FundExpires 10/31/21
Expires 12/31/21
Expires 10/31/22
Expires 12/31/22
Expires 9/30/23
Expires 12/31/23 Total
BDC Income Fund ....................................... $ — $ 48,779* $ — $ 58,429 $ — $ 58,825 $ 166,033Emerging Markets Fund .............................. — — — — 634 — 634International Select Fund ............................. — 91,289 — 66,303 — 44,901 202,493Tactical Credit Fund ..................................... 168,854 — 82,500 20,815 — 62,140 334,309Total ............................................................. $ 168,854 $ 140,068 $ 82,500 $ 145,547 $ 634 $ 165,866 $ 703,469
* The financial information presented reflects the expense reimbursement by Shelton Capital Management in effect from May 1, 2018 to December 31, 2018.
A Fund must pay its current ordinary operating expenses before the Advisor is entitled to any reimbursement of fees and/or expenses. Any such reimbursement is contingent upon the Board of Trustees review and approval prior to the time the reimbursement is initiated.
As compensation for administrative duties not covered by the management agreement, Shelton receives an administration fee, which was revised on January 1, 2011. The administration fee is based on assets held, in aggregate, by the SCM Trust and other funds within the same “family” of investment companies managed and administered by Shelton. The fee rates are 0.10% on the first $500 million, 0.08% on the next $500 million, and 0.06% on combined assets over $1 billion. Administration fees are disclosed in the Statement of Operations.
Certain officers and trustees of the Trust are also partners of Shelton. Steve Rogers has served as a trustee and Chairman of the Board of Trustees of the Trust since 1998, and President of the Trust since 1999. Mr. Rogers is also Chief Executive Officer of the Adviser. Gregory T. Pusch has served as the Chief Compliance Officer (“CCO”) of the Trust since March 2017. Mr. Pusch is also employed by Shelton, the Advisor and Administrator to the Trust. The Trust is responsible for the portion of his salary allocated to his duties as the CCO of the Trust during his employment, and Shelton is reimbursed by the Trust for this portion of his salary. The level of reimbursement is reviewed and determined by the Board of Trustees at least annually.
The Trust has adopted a Distribution Plan (the “Plan”), as amended July 29, 2017, pursuant to Rule 12b-1 under the Investment Company Act of 1940, whereby the Investor Shares of each Fund pays RFS Partners, the Funds’ distributor (the “Distributor”), an affiliate of Shelton, for expenses that relate to the promotion and distribution of shares. Under the Plan, the Investor Shares of the Funds will pay the Distributor a fee at an annual rate of 0.25%, payable monthly, of the daily net assets attributable to such Fund’s Investor Shares.
For the year ended June 30, 2021 the following were paid:
FundInvestor Class
12b-1 Fees
BDC Income Fund ................................................................................................................................................................................. $ 4,986Emerging Markets Fund* ....................................................................................................................................................................... 2,033International Select Fund ....................................................................................................................................................................... 27,224Tactical Credit Fund ............................................................................................................................................................................... 6,275
* Period from January 1, 2021, through June 30, 2021.

28
SCM Trust Notes to Financial Statements (Unaudited) (Continued) June 30, 2021
Management fees, Administration fees, Expense reimbursement from the manager, CCO fees and Trustees fees incurred during the year are included in the Statement of Operations.
NOTE 3 - PURCHASES AND SALES OF SECURITIES
Purchases and sales of securities other than short-term instruments for the year ended June 30, 2021 were as follows:
Fund Purchases Sales
BDC Income Fund ................................................................................................................................................. $ 650,971 $ 1,132,735Emerging Markets Fund ........................................................................................................................................ 3,093,781 1,782,684International Select Fund ....................................................................................................................................... 49,515,259 30,610,131Tactical Credit Fund ............................................................................................................................................... 19,415,465 27,135,798
NOTE 4 - TAX CHARACTER
Tax Basis of Distributable Earnings: The tax character of distributable earnings at December 31, 2020 was as follows:
Undistributed Ordinary Income
Undistributed Long-Term
Capital Gain
Capital Loss Carry Forwards
Unrealized Appreciation/ (Depreciation)
Post October and Other
Losses
Total Distributable
Earnings
BDC Income Fund ............... $ 41,363 $ — $ (4,647,801) $ (295,290) $ — $ (4,901,728)Emerging Markets Fund ...... 593,515 — (3,020,220) 7,531,566 — 5,104,861International Select Fund ..... 742,014 — (51,221,761) 25,687,492 — (24,792,255)Tactical Credit Fund ............. 707,997 — (5,977,277) (4,330,721) — (9,600,001)
The difference between book basis and tax basis unrealized appreciation/(depreciation) is attributable primarily to wash sales and PFICs.
Capital Losses: Capital loss carry forwards, as of December 21, 2020, available to offset future capital gains, if any, are as follows:
ExpiringBDC Income
FundEmerging
Markets FundInternational Select Fund*
Tactical Credit Fund**
Long Term with No Expiration ............................................................... $ (2,038,826) $ (3,020,220) $ (46,167,307) $ (3,536,329)Short Term with No Expiration .............................................................. (2,608,975) — (5,054,454) (2,440,948)Long Term with Expiration .................................................................... — — — —Short Term with Expiration .................................................................... — — — —Total ...................................................................................................... $ (4,647,801) $ (3,020,220) $ (51,221,761) $ (5,977,277)
* Subject to annual limitation under §382 of The Code of $214,635 in 2021 and 2022, and $27,391 in 2023.** Subject to annual limitation of $561,798 under §382 of The Code through 2023 with $527,580 available in 2024.
Distributions to Shareholders: Income distributions and capital gain distributions are determined in accordance with income tax regulations, which may differ from U.S. generally accepted accounting principles. These differences are primarily due to differing treatments of income and gains on various investment securities held by each Fund, timing differences and differing characterization of distributions made by each Fund.
The tax character of distributions paid during the year ended December 31, 2020 are as follows:
FundYear or
Period EndedReturn of Capital
Ordinary Income
Long-Term Capital Gains(a)
Exempt-Interest Dividends
Total Distributions
BDC Income Fund ............. December 31, 2019 $ 63,262 $ 545,542 $ — $ — $ 608,804December 31, 2020 — 417,614 — — 417,614
Emerging Markets Fund .... September 30, 2019 — 1,506,869 75,722 — 1,582,591September 30, 2020 — 852,068 — — 852,068December 31, 2020 — 50,052 — — 50,052
International Select Fund ... December 31, 2019 — 1,253,877 — — 1,253,877December 31, 2020 — 885,582 — — 885,582
Tactical Credit Fund ........... October 31, 2019(b) — 161,752 647,005 2,260,001 3,068,758December 31, 2019(b) — 375,685 — 707,607 1,083,292December 31, 2020 — 2,303,959 — — 2,303,959
(a) The Funds designate Long-Term Capital Gain dividends pursuant to Section 852(b)(3) of the Internal Revenue Code for the year ended December 31, 2019.(b) The tax distributions for the period ended December 31, 2019 differ from book distributions by $723,486 of which $264,188 was included in the book
distribution for the year ended October 31, 2019 and $459,292 of income earned by Shelton Tactical Credit Fund prior to the merger date but not included inthe book distributions as the Cedar Ridge Fund was the accounting survivor (see note 7) of the merger.
The tax distributions for October 31, 2019 differ from the book distributions by $264,188 as that amount was included in the tax distributions post-merger for the period ending December 31, 2019.
A final tax returned for the Cedar Ridge Unconstrained Credit Fund was filed for the period ended June 21, 2019 the date of the merger (see note 7).

29
SCM Trust Notes to Financial Statements (Unaudited) (Continued) June 30, 2021
NOTE 5 - RECENT ACCOUNTING PRONOUNCEMENTS
In August 2018, FASB issued Accounting Standards Update No. 2018-13, “Fair Value Measurement (Topic 820: Disclosure Framework — Changes to the Disclosure Requirements for Fair Value Measurement” (“ASU 2018-13”). ASU 2018-13 eliminates the requirement to disclose the amount of and reasons for transfers between Level 1 and Level 2 of the fair value hierarchy, the timing of transfers between levels of the fair value hierarchy and the valuation processes for Level 3 fair value measurements. ASU 2018-13 will require the need to disclose the range and weighted average used to develop significant unobservable inputs for Level 3 fair value measurements and the changes in unrealized gains and losses for recurring Level 3 fair value measurements. ASU 2018-13 will also require that information is provided about the measurement uncertainty of Level 3 fair value measurements as of the reporting date. The guidance is effective for fiscal years, and interim periods within those fiscal years, beginning after December 15, 2019, and allows for early adoption of either the entire standard or only the provisions that eliminate or modify the requirements. Management has elected to adopt early the provisions that eliminate the disclosure requirements. Management is still currently evaluating the impact of applying the rest of the guidance.
NOTE 6 - BORROWINGS
In connection with the short sale arrangement of Shelton Tactical Credit Fund, the Fund may borrow in excess of the short sale proceeds. At June 30, 2021, the total amount outstanding in excess of the short sale proceeds was $0. Amounts borrowed under this arrangement bear interest at an interest rate based on the bank’s margin rate. For the period ended June 30, 2021, the weighted average interest rate of this arrangement was 1.82%, the average amount outstanding was $79,052 and the maximum outstanding balance was $4,982,778. The total amount of interest charged under the arrangement was $725 and is included in the balance of Interest and fees on borrowings and short sale arrangement in the Statement of Operations.
NOTE 7 - REORGANIZATION
On June 19, 2019, the shareholders of the Cedar Ridge Unconstrained Credit Fund approved the agreement and plan of reorganization providing for the transfer of assets and assumption of liabilities into the Shelton Tactical Credit Fund. Cedar Ridge Unconstrained Credit Fund is the performance and accounting survivor of the reorganization, Shelton Tactical Credit is the legal and tax survivor. The reorganization was effective as of the close of business on June 21, 2019. The following table illustrates the specifics of the Fund’s reorganization:
Shelton Tactical Credit Fund Pre-Reorganization
Net Assets
New Shares issued to Shareholders of Shelton
Tactical Credit Fund
Cedar Ridge Unconstrained Credit
Fund Net Assets Combined Net AssetsTax Status of Transfer
$23,813,547 2,227,883 $76,412,507 $100,226,054(a) Non-taxable
(a) Includes undistributed net investment income, accumulated realized gains and unrealized depreciation in the amounts of $-, $- and $760,216 respectively.As of close of business on June 21, 2019, the classes were converted at the following rates:
Pre-Merger ClassPre-Merger
NAV Rate Shares DollarsPost-Merger
NAV Post Merger Class
Shelton Tactical Credit – Institutional Class 10.17 0.9514 1,323,638 $14,151,144 10.69
Shelton Tactical Credit – Institutional Class
Shelton Tactical Credit – Investor Class 10.15 0.9499 904,245 $9,662,403 10.69
Shelton Tactical Credit – Investor Class
Cedar Ridge Unconstrained Credit Fund – Institutional Class 10.69 1.0000 6,189,879 $66,176,655 10.69
Shelton Tactical Credit – Institutional Class
Cedar Ridge Unconstrained Credit Fund – Investor Class 10.69 1.0000 957,909 $10,235,852 10.69
Shelton Tactical Credit – Investor Class
On May 23, 2020, the shareholders of the ICON International Equity Fund approved the agreement and plan of reorganization providing for the transfer of assets and assumption of liabilities into the Shelton International Select Equity Fund. Shelton International Select Equity Fund is the survivor of the reorganization. The reorganization was effective as of the close of business on June 26, 2020. The following table illustrates the specifics of the Fund’s reorganization:
ICON International Equity Fund
Pre-Reorganization Net Assets
New Shares issued to Shareholders of ICON International
Equity Fund
Shelton International Select Equity Fund
Net AssetsCombined Net Assets
Tax Status of Transfer
$23,244,237(a) 1,121,368 $62,750,633 $85,994,870 Non-taxable
(a) Includes undistributed net investment income, accumulated realized losses and unrealized appreciation in the amounts of $528,663, $(9,724,470) and $2,157,152, respectively, from the merged fund.

30
SCM Trust Notes to Financial Statements (Unaudited) (Continued) June 30, 2021
As of close of business on June 26, 2020, the classes were converted at the following rates:
Pre-Merger ClassPre-Merger
NAV Rate Shares DollarsPost-Merger
NAV Post Merger Class
ICON International Equity Fund – Class S $9.40 0.4532 1,027,306 $21,305,921 $20.74
Shelton International Select Equity Fund –
Institutional Class
ICON International Equity Fund – Class A $9.18 0.4454 69,706 $1,435,990 $20.61
Shelton International Select Equity Fund –
Investor Class
ICON International Equity Fund – Class C $8.08 0.3920 24,356 $502,326 $20.61
Shelton International Select Equity Fund –
Investor Class
Additional Information
Fund Holdings
The Fund holdings shown in this report are as of June 30, 2021. Holdings are subject to change at any time, so holdings shown in the report may not reflect current Fund holdings. The Fund’s Form N-PORT is available on the SEC’s website at www.sec.gov. The information filed in the form N-PORT also may be obtained by calling (800) 955-9988.
Proxy Voting Policy
The Fund’s Statement of Additional Information (“SAI”) containing a description of the policies and procedures that the SCM Trust uses to determine how to vote proxies relating to portfolio securities, along with the Fund’s proxy voting record relating to portfolio securities held during the 12-month period ended June 30, 2020 is available upon request, at no charge, at the phone number above, or on the SEC’s website at www.sec.gov.
About this Report
This report is submitted for the general information of the shareholders of the SCM Trust. It is authorized for distribution only if preceded or accompanied by a current SCM Trust prospectus. Additional copies of the prospectus may be obtained by calling (800) 955-9988 or can be downloaded from the Fund’s website at www.sheltoncap.com. Please read the prospectus carefully before you invest or send money, as it explains the risks, fees and expenses of investing in the Fund.

31
Overall responsibility for management of the Funds rests with the Board of Trustees. The Trustees serve during the lifetime of the Trust and until its termination, or until death, resignation, retirement or removal. The Trustees, in turn, elect the officers of the Fund to actively supervise its day-to-day operations. The officers have been elected for an annual term. The following are the Trustees and Executive Officers of the Funds:
Name Address Year of Birth Position Held with the TrustLength of
Time Served
Stephen C. Rogers 1875 Lawrence Street, Suite 300 Denver, CO 80202
1966 Chairman of the Board, Trustee, President
Since August 1999 Since August 1999 Since August 1999
Kevin T. Kogler 1875 Lawrence Street, Suite 300 Denver, CO 80202
1966 Trustee Since May 2006
Marco L. Quazzo 1875 Lawrence Street, Suite 300 Denver, CO 80202
1962 Trustee Since August 2014
Stephen H. Sutro 1875 Lawrence Street, Suite 300 Denver, CO 80202
1969 Trustee Since May 2006
William P. Mock 1875 Lawrence Street, Suite 300 Denver, CO 80202
1966 Treasurer Since February 2010
Gregory T. Pusch 1875 Lawrence Street, Suite 300 Denver, CO 80202
1966 Chief Compliance Officer, Secretary
Since March 2017
Each Trustee oversees the Trust’s four Funds. The principal occupations of the Trustees and Executive Officers of the Funds during the past five years and public directorships held by the Trustees are set forth below:
Stephen C. Rogers* Chief Executive Officer, Shelton Capital Management, 1999 to present.
Kevin T. Kogler President & Founder of MicroBiz, LLC, 2012 to present; Principal, Robertson Piper Software Group, 2006 to 2012; Senior Vice President, Investment Banking, Friedman, Billings Ramsey, 2003 to 2006.
Marco L. Quazzo Principal, Bartko Zankel Bunzel & Miller, March 2015-Present; Partner, Barg Coffin Lewis & Trapp LLP (law firm), 2008 to March 2015.
Stephen H. Sutro Managing Partner, Duane Morris, LLP (law firm) 2014 to present; Partner, Duane Morris LLP (law firm), 2003 to present.
William P. Mock Portfolio Manager, Shelton Capital Management, 2010 to present.
Gregory T. Pusch Principal Occupations Past five years: Global Head of Risk & Compliance, Matthews Asia 2015-2016; Head of Legal & Regulatory Compliance / CCO, HarbourVest Partners 2012-2015.
Additional information about the Trustees may be found in the SAI, which is available without charge by calling (800) 955-9988.
* Trustee deemed to be an “interested person” of the Trust, as defined in the Investment Company Act of 1940. Mr. Rogers is an interested person because he is the CEO of Shelton Capital Management, the Trust’s Advisor and Administrator.
Board of Trustees and Executive Officers

32
The Investment Company Act of 1940 (the “1940 Act”) requires that the full board of the SCM Trust (the “Board”) and a majority of the Independent Trustees annually approve the continuation of:
• The Investment Advisory Agreement (the “Advisory Agreement”) dated October 11, 2016 between SCM Trust, on behalf of the funds listed below, and Shelton Capital Management (“SCM”):o Shelton International Select Equity Fund;o Shelton BDC Income Fund; ando Shelton Tactical Credit Fund (each, a “Fund” and collectively, the Funds”).
At a meeting held on February 26, 2021, the Board, including a majority of the Independent Trustees, considered and approved the continuation of the Advisory Agreement for an additional one-year period:
Prior to the Meeting, the Independent Trustees requested information from SCM and third-party sources. This information, together with other information provided by SCM, and the information provided to the Independent Trustees throughout the course of the year, formed the primary (but not exclusive) basis for the Board’s determinations, as summarized below. In addition to the information identified above, other material factors and conclusions that formed the basis for the Board’s subsequent approval are described below.
Information Received
Materials Received. During the course of each year, the Independent Trustees receive a wide variety of materials relating to the services provided by SCM, including reports on each applicable Fund’s investment results; portfolio composition; third party fund rankings; investment strategy; portfolio trading practices; shareholder services; and other information relating to the nature, extent and quality of services provided by SCM to the applicable Funds. In addition, the Board requests and reviews supplementary information that includes materials regarding each Fund’s investment results, advisory fee and expense comparisons, the costs of operating the Funds and financial and profitability information regarding Shelton Capital, descriptions of various functions such as compliance monitoring and portfolio trading practices, and information about the personnel providing investment management services to each applicable Fund.
Review Process. The Board received assistance and advice regarding legal and industry standards from independent legal counsel to the Independent Trustees and fund counsel. The Board discussed the renewal of the Advisory Agreement with SCM representatives, and in a private session with independent legal counsel at which representatives of SCM were not present. In deciding to approve the renewal of the Advisory Agreement, the Independent Trustees considered the total mix of information requested by and made available to them and did not identify any single issue or particular information that, in isolation, was the controlling factor. This summary describes the most important, but not all, of the factors considered by the Board.
Nature, Extent and Quality of Services
SCM, its personnel and its resources. The Board considered the depth and quality of Shelton Capital’s investment management process; the experience, capability and integrity of its senior management and other personnel; operating performance and the overall financial strength and stability of its organization. The Board also considered that SCM made available to its investment professionals a variety of resources relating to investment management, compliance, trading, performance and portfolio accounting. The Board further considered SCM’s continuing need to attract and retain qualified personnel and, noting SCM’s additions over recent years, determined that SCM was adequately managing matters related to the Funds.
Other Services. The Board considered, in connection with the performance of its investment management services to the Funds: SCM’s policies, procedures and systems to ensure compliance with applicable laws and regulations and each of their commitment to these programs; each of their efforts to keep the Trustees informed; and each of their attention to matters that may involve conflicts of interest with the applicable Funds. As a point of comparison, the Board also considered the nature, extent, quality and cost of certain non-investment related administrative services provided by SCM to the Funds under the administration servicing agreements.
The Board concluded that SCM had the quality and depth of personnel and investment methods essential to performing its duties under the applicable Advisory Agreements, and that the nature, extent and overall quality of such services provided by SCM, respectively, are satisfactory and reliable.
Investment Performance
The Board considered each Fund’s investment results in comparison to its stated investment objectives. The Trustees reviewed the short-term and long-term performance of each Fund on both an absolute basis and against its benchmark indices. The Trustees also reviewed performance rankings for each Fund as provided by an independent third-party service provider, as applicable. Among the factors considered in this regard, were the following:
• For the Shelton International Select Equity Fund, it was noted that the performance of the Fund relative to its peer category was in the highest performing quartile over the 1-year and 3-year periods.
• For the Shelton BDC Income Fund, it was noted that the performance of the Fund relative to its peer category was in the second lowest performing quartile over the 3-year period, and in the lowest performing quartile over the 1-year and 5-year periods.
• For the Shelton Tactical Credit Fund, it was noted that the performance of the Fund relative to its peer category was in the second highest performing quartile over the 1-year and 3-year periods and in the second lowest performing quartile over the 5-year period.
The Board received a satisfactory explanation of the reasons underlying the performance of the lower performing Funds and SCM articulated a strategy for improving performance of these Funds. The Board ultimately concluded that SCM’s performance records in managing the applicable Fund was satisfactory, and in some cases excellent, supporting the determination that SCM’s continued management under the Advisory Agreement would be consistent with the best interests of each applicable Fund and its shareholders.
Board Approval of the Investment Advisory Agreement (Unaudited) June 30, 2021

33
Board Approval of the Investment Advisory Agreement (Unaudited) (Continued) June 30, 2021
Management Fees and Total Annual Operating Expense Ratios
The Board reviewed the management fees and total operating expenses of each Fund and compared such amounts with the management fees and total operating expenses of other funds in the industry that are found within the same style category as defined by a third-party independent service provider. The Board considered the asset size, advisory fees and total fees and expenses of each Fund in comparison to the asset size, advisory fees and other fees and expenses of other funds in each Fund’s relevant category. The Trustees considered both the gross advisory fee rates, as well as the effective advisory rates charged by SCM after taking into consideration the expense limitation arrangements and voluntary fee waivers on certain Funds.
The Board noted that the maximum management fee charged to each Fund was higher than the relevant Fund’s peer category median.
The Board also observed that each Fund’s total annual operating expense ratios, after taking into account the expense limitations and waivers applicable to certain Funds (and excluding acquired fund fees and expenses for the Shelton BDC Income Fund), were higher than the relevant Fund’s peer category median, except for the net expense ratio of the Institutional Class of the Shelton BDC Income Fund, which (excluding acquired fund fees and expenses) was slightly below the Fund’s peer category median.
Comparable Accounts
The Board noted certain information provided by SCM regarding fees charged to other clients utilizing a strategy similar to that employed by an applicable Fund. The Board determined that, bearing in mind the limitations of comparing different types of managed accounts and the different levels of service typically associated with such accounts, the fee structures applicable to SCM’s other clients employing a comparable strategy to each applicable Fund was not indicative of any unreasonableness with respect to the advisory fee payable by such Fund.
Cost Structure, Level of Profits, Economies of Scale and Ancillary Benefits
The Board reviewed information regarding SCM’s costs of providing services to the applicable Funds. The Board also reviewed the resulting level of profits to SCM, including the cost allocation methodologies used to calculate such profits. The Independent Trustees received financial and other information from SCM.
The Board noted its intention to continue to monitor assets under management, and the resulting impact on SCM’s profitability, in order to ensure that each has sufficient resources to continue to provide the services that shareholders in the applicable Funds require. The Trustees also noted that currently, SCM has contractually agreed to limit its advisory fees on certain Funds so that those Funds do not exceed their respective specified operating expense limitations, and may extend those limits in the future.
The Board also considered that SCM does not receive material indirect benefits from managing the applicable Funds. For example, SCM does not currently employ a “soft dollar” program, but noted that Shelton Capital may seek to employ a soft dollar program in the near future.
Based on the foregoing, together with the other information provided to it at the Meeting and throughout the year, the Board concluded that each applicable Fund’s cost structure and level of profits for SCM, were reasonable and that economies of scale and ancillary benefits, to the extent present with respect to a Fund, were not material.
Conclusions
The Board indicated that the information presented and the discussion of the information were adequate for making a determination regarding the renewal of the Advisory Agreement. During the review process, the Board noted certain instances where clarification or follow-up was appropriate and others where the Board determined that further clarification or follow-up was not necessary. In those instances where clarification or follow-up was requested, the Board determined that in each case either information responsive to its requests had been provided, or where any request was outstanding in whole or in part, given the totality of the information provided with respect to the Advisory Agreement, the Board had received sufficient information to renew and approve the Advisory Agreement.
Based on their review, including but not limited to their consideration of each of the factors referred to above, the Board concluded that the Advisory Agreement, taking into account the separate administration fees, is and would be fair and reasonable to each Fund and its shareholders, that each Fund’s shareholders received or should receive reasonable value in return for the advisory fees and other amounts paid to SCM by the Funds, and that the renewal of the Advisory Agreement was in the best interests of each Fund and its shareholders.

THIS PAGE INTENTIONALLY LEFT BLANK

THIS PAGE INTENTIONALLY LEFT BLANK

THIS PAGE INTENTIONALLY LEFT BLANK

THIS PAGE INTENTIONALLY LEFT BLANK

THIS PAGE INTENTIONALLY LEFT BLANK