
SEMI-ANNUAL DE-
19
COMPREHENSIVE INTESTIGATION OF THE LIBERATION CHARACTERISTICS OF PYRITE AND OTHER MINERAL MATTER FROM COAL SEMI-ANNUAL 12/31/1997 FG22 End Date: 07/31/1996 Report Title: Report Type: Professor R. Peter King Claudio Schneider 01/31/1997 DOE Award No.: Reporting Period Start Date: Principal Author(s): Report Issue Date: Submitting Organization(s) Name & Address Comminution Center 306 W. Browning Building Salt Lake City, Utah 84112 95PC95220 University of Utah DE- - (1) (2) (3) (4) (5)
Transcript of SEMI-ANNUAL DE-

COMPREHENSIVE INTESTIGATION OF THE LIBERATIONCHARACTERISTICS OF PYRITE AND OTHER
MINERAL MATTER FROM COAL
SEMI-ANNUAL 12/31/1997
FG22
End Date: 07/31/1996
Report Title:
Report Type:
Professor R. Peter King Claudio Schneider
01/31/1997 DOE Award No.:
Reporting Period Start Date:
Principal Author(s):
Report Issue Date:
SubmittingOrganization(s)
Name & Address
Comminution Center
306 W. Browning Building Salt Lake City, Utah 84112
95PC95220 University of Utah
DE- -
(1)
(2)
(3)
(4)
(5)

2
DISCLAIMER
This report was prepared as an account of work sponsored by an agency of the UnitedStates Government. Neither the United States Government nor any agency thereof,nor any of their employees, makes any warranty, express or implied, or assumes anylegal liability or responsibility for the accuracy, completeness, or usefulness of anyinformation, apparatus, product, or process disclosed, or represents that its use wouldnot infringe privately owned rights. Reference herein to any specific commercialproduct, process, or service by trade name, trademark, manufacturer, or otherwisedoes not necessarily constitute or imply its endorsement, recommendation, or favoringby the United States Government or any agency thereof. The views and opinions ofauthors expressed herein do not necessarily state or reflect those of the United StatesGovernment or any agency thereof.

3
ABSTRACT
A technique has been developed for generating scanning electron microscope imagesof sections of polished coal and coal particles that are suitable for the measurement ofthe linear intercept distribution functions and the distribution of three-phase lineargrades. The three phases used are; pyrite, ash forming minerals, and coal. Thephase-to-phase transition probabilities for the unbroken ore can also be estimatedusing conventional image analysis techniques. The distribution of linear interceptlengths through the pyrite, ash and coal phases were found to be described by sums of2, 3 and 4 exponentials respectively. This reflects the presence of distinct texturalregions in the coal. The linear grade distributions were determined in 710 - 1000micron coal particles that had previously been carefully fractionated using dense liquids. The three phase linear grade distributions reflect the variation in particle compositionthat results from the fractionation and they provide a detailed picture of the three-phasecomposition of the various fractions. It is not yet possible to stereologically correctthese three-phase distributions. However, the measured uncorrected distributions arevery encouraging and a viable stereological correction procedure will be developedduring the next phase of work on this project.

4
TABLE OF CONTENTS
Disclaimer . . . . . . . . . . . . . . . . . . . . . . . . . . . . . . . . . . . . . . . . . . . . . . . . . . . . . . . . . . . 2
Abstract . . . . . . . . . . . . . . . . . . . . . . . . . . . . . . . . . . . . . . . . . . . . . . . . . . . . . . . . . . . . 3
Executive Summary . . . . . . . . . . . . . . . . . . . . . . . . . . . . . . . . . . . . . . . . . . . . . . . . . . . 5
Results and Discussion. . . . . . . . . . . . . . . . . . . . . . . . . . . . . . . . . . . . . . . . . . . . . . . . . . . . . . . . . . . . . . 5
Conclusion . . . . . . . . . . . . . . . . . . . . . . . . . . . . . . . . . . . . . . . . . . . . . . . . . . . . . . . . . . 9
References . . . . . . . . . . . . . . . . . . . . . . . . . . . . . . . . . . . . . . . . . . . . . . . . . . . . . . . . 10

5
EXECUTIVE SUMMARY
The objectives of the project are:
1. Develop laboratory and theoretical techniques for the quantitativemeasurement of the liberation spectra in samples of coal particles in thesize range 50)m - 1 mm. Three dimensional spectra will be required toaccount for the mineral matter and pyrite separately.
2. Establish, experimentally, the Andrews-Mika diagram for a number oftypical U.S. coals and to develop an appropriate parameterizeddescription for the Andrews-Mika diagram so that it may be determinedeasily and quickly for coals of different origin and different type.
3. Establish an effective and reliable simulation technique so that liberationof both pyritic sulfur and ash during comminution operations can bemodeled and the operation of coal preparation facilities simulated. Thesemodels will be incorporated into a computer simulation system for coalcleaning plants.
The main conclusion from the work done during this reporting period is that theessential information required to predict and measure the liberation of ash and pyritefrom coal during grinding can be measured using image analysis techniques. Linearintercept distributions and linear grade distributions have been successfully measuredin “unbroken” coal and particles in the 1000 - 710 )m size range.
RESULTS AND DISCUSSION
1. Experimental
The experimental work undertaken during the reporting period has been directed primarily towards the generation of SEM images of coal samples. To achievethe objectives of this project these images must be of sufficient quality to allowthe three phases of interest, namely pyrite, ash-forming minerals and theremaining “coal” to be identified correctly. Furthermore the images must beobtained at sufficient resolution to ensure that all of the essential geometricalinformation that describes the texture of the material can be established. Imaging of coal is difficult. Our technique is based on back-scattered electronimages. Two major difficulties had to be overcome in order to produce images ofacceptable quality: sufficient contrast must be obtained between eachcomponent in the sample and the mounting medium and sufficient contrast anddefinition must be obtained between each phase in each particle cross section. The former problem was solved by mounting particles in epoxy (Buehler Epo-thin) saturated with iodoform. The heavy iodine atoms in the matrix providesufficient BSE intensity to ensure that the background mounting material can be
6
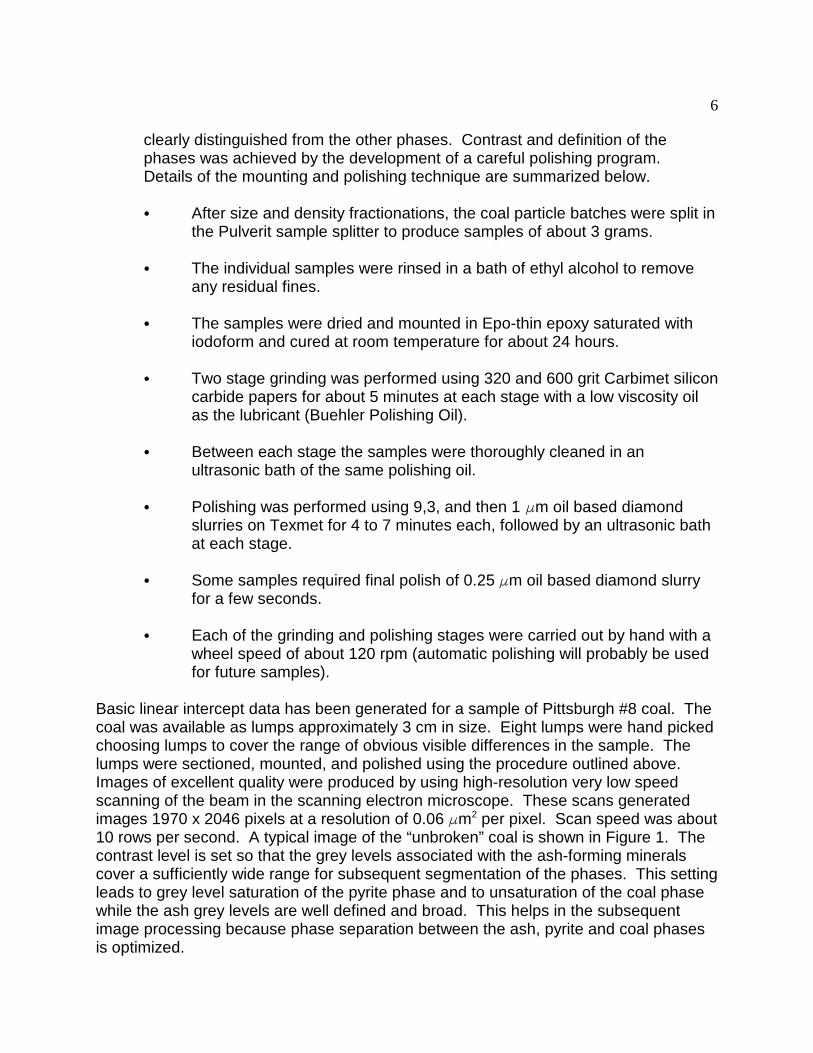
clearly distinguished from the other phases. Contrast and definition of thephases was achieved by the development of a careful polishing program. Details of the mounting and polishing technique are summarized below.
& After size and density fractionations, the coal particle batches were split inthe Pulverit sample splitter to produce samples of about 3 grams.
& The individual samples were rinsed in a bath of ethyl alcohol to removeany residual fines.
& The samples were dried and mounted in Epo-thin epoxy saturated withiodoform and cured at room temperature for about 24 hours.
& Two stage grinding was performed using 320 and 600 grit Carbimet siliconcarbide papers for about 5 minutes at each stage with a low viscosity oilas the lubricant (Buehler Polishing Oil).
& Between each stage the samples were thoroughly cleaned in anultrasonic bath of the same polishing oil.
& Polishing was performed using 9,3, and then 1 )m oil based diamondslurries on Texmet for 4 to 7 minutes each, followed by an ultrasonic bathat each stage.
& Some samples required final polish of 0.25 )m oil based diamond slurryfor a few seconds.
& Each of the grinding and polishing stages were carried out by hand with awheel speed of about 120 rpm (automatic polishing will probably be usedfor future samples).
Basic linear intercept data has been generated for a sample of Pittsburgh #8 coal. Thecoal was available as lumps approximately 3 cm in size. Eight lumps were hand pickedchoosing lumps to cover the range of obvious visible differences in the sample. Thelumps were sectioned, mounted, and polished using the procedure outlined above. Images of excellent quality were produced by using high-resolution very low speedscanning of the beam in the scanning electron microscope. These scans generatedimages 1970 x 2046 pixels at a resolution of 0.06 )m per pixel. Scan speed was about2
10 rows per second. A typical image of the “unbroken” coal is shown in Figure 1. Thecontrast level is set so that the grey levels associated with the ash-forming mineralscover a sufficiently wide range for subsequent segmentation of the phases. This settingleads to grey level saturation of the pyrite phase and to unsaturation of the coal phasewhile the ash grey levels are well defined and broad. This helps in the subsequentimage processing because phase separation between the ash, pyrite and coal phases is optimized.

7
SEM Image Acquisition Procedures for Unbroken Coal
& Coal pieces were sectioned across the stratification using a slow speed diamondcutting saw.
& 8 pieces 20 to 30 mm in size were mounted in a 52 mm mold using Epo-thinepoxy saturated with iodoform
& Polishing procedures are described above.& Samples were coated with carbon and the sides painted with silver paint& SEM Settings:
& 200X magnification & 30 kV accelerating voltage& Working distance was 40 mm& Brightness was set at a minimum& Contrast was set so that the pyrite was saturated at 255, the coal was
saturated at 0, and the ash was in between
& Images were the true averages of 2 images (1970 x 2046)& The scan speed was 0.0005 frames per second (the lowest possible)& Between 2 and 8 images were taken in each coal piece, depending on the size
of the piece.& The sample was then rotated counter clockwise 90 degrees on the SEM stage
and images were taken again (between 2 and 8 piece)
Particles of coal were prepared by crushing using the procedure outlined in Figure 2. This procedure was adopted to maximize the yield of particles in the size range1000 -710 )m. These particles will be used as parent particles in the proposed experimentsfor the measurement of the Andrews-Mika diagram for this material.
A sample of 1000 - 710 )m particles was carefully fractionated using heavy liquids asdescribed in our previous report. Representative samples of particles from thesefractions were mounted and polished using the procedure described below. Figures 3, 4 and 5 show images collected from the fractionated coal particles and thus containingdifferent relative amounts of ash and pyrite. Several images have been generated foreach particle mount. These images give some idea of the success that we have had inthe generation of suitable images of coal particles.
SEM Image Acquisition Procedures for Particulate Coal (-1000 + 710 )m)
& Samples were coated with a thin film of carbon, and silver paint was used on thesides to provide electrical contact with the SEM mount.
& SEM images were photo images (1898 x 1480)& Backscattered electron images& thirty to thirty-five images per sample& 25X magnification& Working distance was 67 mm

1 F (5) 0.454e0.0835� 0.312e0.0225
� 0.143e0.00425� 0.139e0.000785
1 F (5) 0.598e0.2295� 0.291e0.0515
� 0.081e0.0135
1 F (5) 0.858e0.1005� 0.136e0.0175
8
(1)
(2)
(3)
& 30 kV accelerating voltage& The brightness was set at the minimum allowable& Contrast was set so that the coal was completely saturated at zero and the
background registered a peak just to the right of zero.
The images of the “unbroken” coal were ultimately converted to ternary images bysegmentation of each of the three phases. The segmentation procedure used iscomplex, and relies in background correction, edge detection followed by delineation,“finger print” identification of the ash phase and a series of Euclidean Distance Mapsegmentations to eliminate artifacts in all phases. The linear intercept lengthdistributions were measured using the usual line scanning technique. The measuredlinear intercept length distributions for each of the phases is shown in Figure 6. Thesedistributions have the characteristics of exponential sums. The distributions of linearintercepts for the coal phase is a sum of four exponentials
The linear intercept distribution is the sum of three exponentials
and that for the pyrite phase in a sum of two exponentials
These functional forms are not unusual and have been observed before in othermineral systems (King 1994). However, the need for 4 exponentials to describe thecoal phase is unusual and this reflects the geometrical complexity of the texture of thismaterial. Each exponential in the sum accounts for a single textural region from smallscale (approximately 12 pixels) to large scale (approximately 1200 pixels).
The linear intercept distributions are the primary data required to generate a liberationmodel for the three components in the coal together with the phase transitionprobabilities. These were measured at the same time as the linear interceptdistributions and are recorded in Table 1.

9
Table 1. Phase Transition Probabilities for the Three Phases In A Sample ofPittsburgh #8 Coal
Coal Ash Pyrite
Coal * 0.462 0.016
Ash 0.464 * 0.021
Pyrite 0.015 0.022 *
These transition probabilities represent the relative frequency of observing the indicatedphase transition as the material is traversed by a linear probe. Reference 1 should beconsulted for a detailed discussion of the role played by the linear intercept distributionsand the transition probabilities in defining the liberation model.
The particle images were processed in a similar way and the distribution of 3-phaselinear grades was determined in each of these dense liquid fractions. The results areshown in Figures 7 to 12. They represent the linear grade distributions uncorrected forstereological bias.
Personnel
Personnel who have contributed to this project during the reporting period are:
Professor R. P. King Principle InvestigatorDr. C. L. Schneider Postdoctoral AssociateMr. Naiyang Ma PhD StudentMr. K. Oliphant Undergraduate StudentMr. D. FitzGerald TechnicianMrs. C. Gundersen Program Administrator
CONCLUSION
1. A procedure has been developed to measure the linear intercept distribution ofthe three phases, coal, ash, and pyrite in samples of “unbroken” coal and inparticles after comminution.
2. The linear intercept distribution for each phase is described well by a sum ofexponentials with the coal phase exhibiting the greatest geometrical complexitythen the ash and finally the pyrite, which appears to consist of no more than twodistinct grain populations.

10
3. The measured linear grade distributions, when plotted as three-phasehistograms, are consistent with the expected volumetric distributions for eachdense-liquid fraction that has been studied.
REFERENCES
King, RP. Linear Statistic Models for Mineral Liberation. Powder Technology 81 (1994)217-234.

11
Figure 1: High resolution, high contrast BSE image from a Pittsburgh #8 coal lump. Red and black pixels represent "coal", grey isash forming minerals and white and blue pixels are pyrite.

12
Raw Coal (∼35 kg)
Figure 2: Coal particles crushing procedure
596 µm Screen
Rifler
Control sample (∼17 kg)1mm Screen
Roll crusher
>1 mm
< 1 mm
>596 µm
710 µm screen
500, 355, 250 and 180 µm dry screening
<596 µm
106, 75, 53, 45, 38 and 25 µmwet screening
Samples 1000-710 µm
<180 µm
Samples 710-500, 500-355, 355-250 and 250-180 µm
Samples: 180-106, 106-75, 75-53 53-45, 45-38, 38-25 and 25-0 µm

13
Figure 3: BSE image from Pittsburgh #8 fractionated coal particles, -1000 +710 microns, -1.33 +1.31 g/cc. Red and black pixelsrepresent "coal", dark grey is background, light grey is ash forming minerals and white and blue pixels are pyrite.

14
Figure 4: BSE image from Pittsburgh #8 fractionated coal particles, -1000 +710 microns, -1.50 +1.39 g/cc. Red and black pixelsrepresent "coal", dark grey is background, light grey is ash forming minerals and white and blue pixels are pyrite.

15
Figure 5: BSE image from Pittsburgh #8 fractionated coal particles, -1000 +710 microns, +1.60 g/cc. Red and black pixels represent"coal", dark grey is background, light grey is ash forming minerals and white and blue pixels are pyrite.

0 100 200 300 400 500 600 700 800 900 1000
Linear intercept length Pixels
10-2
10-1
100
Cum
ulat
ive
dist
ribut
ion
1 -
F(l)
Measured distribution for coal phaseFitted using equation (1)Measured distribution for ash phaseFitted using equation (2)Measured distribution for pyrite phaseFitted using equation (3)
16
Figure 6: Measured intercept distributions on each phase of unbroken Pittsburgh #8 lumps andthe best fits using the exponential models in equations 1, 2 and 3

0
100
80 - 100
60 - 80
40 - 60
20 - 40
0 - 20
0
0 - 20
20 - 40
40 - 60
60 - 80
80 - 100
100 0
0 - 20
20 - 40
40 - 60
60 - 80
80 - 100
100
0 20
40 60
80 100
0
20
40
60
80
100 0
20
40
60
80
100
Phase 2
Phase 0
Phase 1
0
100
80 - 100
60 - 80
40 - 60
20 - 40
0 - 20
0
0 - 20
20 - 40
40 - 60
60 - 80
80 - 100
100 0
0 - 20
20 - 40
40 - 60
60 - 80
80 - 100
100
0 20
40 60
80 100
0
20
40
60
80
100 0
20
40
60
80
100
Phase 2
Phase 0
Phase 1
17
Figure 7: Measured linear grade distibution on fractionated Pittsburgh #8 particles, -1000+710microns, +1.60 g/cc
Figure 8: Measured linear grade distribution on fractionated Pittsburgh #8 particles, -1000+710microns, -1.27+1.25 g/cc

0
100
80 - 100
60 - 80
40 - 60
20 - 40
0 - 20
0
0 - 20
20 - 40
40 - 60
60 - 80
80 - 100
100 0
0 - 20
20 - 40
40 - 60
60 - 80
80 - 100
100
0 20
40 60
80 100
0
20
40
60
80
100 0
20
40
60
80
100
Phase 2
Phase 0
Phase 1
0
100
80 - 100
60 - 80
40 - 60
20 - 40
0 - 20
0
0 - 20
20 - 40
40 - 60
60 - 80
80 - 100
100 0
0 - 20
20 - 40
40 - 60
60 - 80
80 - 100
100
0 20
40 60
80 100
0
20
40
60
80
100 0
20
40
60
80
100
Phase 2
Phase 0
Phase 1
18
Figure 9: Measured linear grade distribution on fractionated Pittsburgh #8 particles, -1000+710microns, -1.29 +1.27 g/cc
Figure 10:Measured linear grade distribution on fractionated Pttsburgh #8 particles,-1000+710microns, -1.31 +1.29 g/cc

0
100
80 - 100
60 - 80
40 - 60
20 - 40
0 - 20
0
0 - 20
20 - 40
40 - 60
60 - 80
80 - 100
100 0
0 - 20
20 - 40
40 - 60
60 - 80
80 - 100
100
0 20
40 60
80 100
0
20
40
60
80
100 0
20
40
60
80
100
Phase 2
Phase 0
Phase 1
0
100
80 - 100
60 - 80
40 - 60
20 - 40
0 - 20
0
0 - 20
20 - 40
40 - 60
60 - 80
80 - 100
100 0
0 - 20
20 - 40
40 - 60
60 - 80
80 - 100
100
0 20
40 60
80 100
0
20
40
60
80
100 0
20
40
60
80
100
Phase 2
Phase 0
Phase 1
19
Figure 11: Measured linear grade distribution on fractionated Pittsburgh #8 particles, -1000+710microns, -1.50 +1.39 g/cc
Figure 12: Measured linear grade distribution on composite Pittsburgh #8 particles, -1000 +710microns