
ScotiaFunds Semi-Annual Report
475
Cash Equivalent Funds Scotia T-Bill Fund Scotia Premium T-Bill Fund Scotia Money Market Fund Scotia U.S. $ Money Market Fund Income Funds Scotia Short Term Bond Fund Scotia Private Short-Mid Government Bond Pool Scotia Mortgage Income Fund Scotia Floating Rate Income Fund Scotia Conservative Income Fund Scotia Bond Fund Scotia Canadian Income Fund Scotia Private Canadian Corporate Bond Pool Scotia U.S. $ Bond Fund Scotia Global Bond Fund Balanced Funds Scotia Diversified Monthly Income Fund Scotia Income Advantage Fund Scotia Canadian Balanced Fund Scotia Dividend Balanced Fund Scotia Balanced Opportunities Fund Scotia Global Balanced Fund Scotia U.S. $ Balanced Fund Equity Funds Canadian Equity Funds Scotia Private Canadian Preferred Share Pool Scotia Canadian Dividend Fund Scotia Canadian Blue Chip Fund Scotia Private Canadian Equity Pool Scotia Canadian Growth Fund Scotia Canadian Small Cap Fund Scotia Resource Fund Scotia Private Real Estate Income Pool Scotia Private North American Dividend Pool U.S. Equity Funds Scotia U.S. Dividend Fund Scotia Private U.S. Dividend Pool Scotia Private U.S. Equity Pool Scotia U.S. Blue Chip Fund Scotia U.S. Opportunities Fund International Equity Funds Scotia Private International Core Equity Pool Scotia International Value Fund Scotia European Fund Scotia Pacific Rim Fund Scotia Latin American Fund Global Equity Funds Scotia Global Dividend Fund Scotia Global Growth Fund Scotia Global Small Cap Fund Scotia Global Opportunities Fund Specialty Funds Scotia Private Options Income Pool Index Funds Scotia Canadian Bond Index Fund Scotia Canadian Index Fund Scotia U.S. Index Fund Scotia CanAm Index Fund Scotia Nasdaq Index Fund Scotia International Index Fund Scotia Portfolios Scotia Selected ® Portfolios Scotia Selected Income Portfolio Scotia Selected Balanced Income Portfolio Scotia Selected Balanced Growth Portfolio Scotia Selected Growth Portfolio Scotia Selected Maximum Growth Portfolio Scotia Partners Portfolios ® Scotia Partners Income Portfolio Scotia Partners Balanced Income Portfolio Scotia Partners Balanced Growth Portfolio Scotia Partners Growth Portfolio Scotia Partners Maximum Growth Portfolio Scotia INNOVA Portfolios ® Scotia INNOVA Income Portfolio Scotia INNOVA Balanced Income Portfolio Scotia INNOVA Balanced Growth Portfolio Scotia INNOVA Growth Portfolio Scotia INNOVA Maximum Growth Portfolio Scotia Aria™ Portfolios Scotia Aria Conservative Build Portfolio Scotia Aria Conservative Core Portfolio Scotia Aria Conservative Pay Portfolio Scotia Aria Moderate Build Portfolio Scotia Aria Moderate Core Portfolio Scotia Aria Moderate Pay Portfolio Scotia Aria Progressive Build Portfolio Scotia Aria Progressive Core Portfolio Scotia Aria Progressive Pay Portfolio Scotia Corporate Class Funds Scotia Short Term Yield Class Scotia Conservative Government Bond Capital Yield Class Scotia Canadian Corporate Bond Capital Yield Class Scotia Fixed Income Blend Class Scotia Canadian Dividend Class Scotia Canadian Equity Blend Class Scotia Private Canadian Equity Class Scotia Private U.S. Dividend Class Scotia Private U.S. Equity Class Scotia U.S. Equity Blend Class Scotia Global Dividend Class Scotia International Equity Blend Class Scotia INNOVA Income Portfolio Class Scotia INNOVA Balanced Income Portfolio Class Scotia INNOVA Balanced Growth Portfolio Class Scotia INNOVA Growth Portfolio Class Scotia INNOVA Maximum Growth Portfolio Class ScotiaFunds ® Semi-Annual Report June 30, 2015
Transcript of ScotiaFunds Semi-Annual Report
1
Cash Equivalent FundsScotia T-Bill FundScotia Premium T-Bill FundScotia Money Market FundScotia U.S. $ Money Market Fund
Income FundsScotia Short Term Bond FundScotia Private Short-Mid Government Bond PoolScotia Mortgage Income FundScotia Floating Rate Income FundScotia Conservative Income Fund Scotia Bond FundScotia Canadian Income FundScotia Private Canadian Corporate Bond PoolScotia U.S. $ Bond FundScotia Global Bond Fund
Balanced FundsScotia Diversified Monthly Income FundScotia Income Advantage FundScotia Canadian Balanced FundScotia Dividend Balanced FundScotia Balanced Opportunities FundScotia Global Balanced FundScotia U.S. $ Balanced Fund
Equity FundsCanadian Equity FundsScotia Private Canadian Preferred Share PoolScotia Canadian Dividend FundScotia Canadian Blue Chip FundScotia Private Canadian Equity PoolScotia Canadian Growth FundScotia Canadian Small Cap FundScotia Resource FundScotia Private Real Estate Income PoolScotia Private North American Dividend Pool
U.S. Equity FundsScotia U.S. Dividend Fund Scotia Private U.S. Dividend PoolScotia Private U.S. Equity PoolScotia U.S. Blue Chip FundScotia U.S. Opportunities Fund
International Equity FundsScotia Private International Core Equity PoolScotia International Value FundScotia European FundScotia Pacific Rim FundScotia Latin American Fund
Global Equity FundsScotia Global Dividend FundScotia Global Growth FundScotia Global Small Cap FundScotia Global Opportunities Fund
Specialty FundsScotia Private Options Income Pool
Index FundsScotia Canadian Bond Index FundScotia Canadian Index FundScotia U.S. Index FundScotia CanAm Index FundScotia Nasdaq Index FundScotia International Index Fund
Scotia PortfoliosScotia Selected® PortfoliosScotia Selected Income PortfolioScotia Selected Balanced Income PortfolioScotia Selected Balanced Growth PortfolioScotia Selected Growth PortfolioScotia Selected Maximum Growth PortfolioScotia Partners Portfolios®
Scotia Partners Income PortfolioScotia Partners Balanced Income PortfolioScotia Partners Balanced Growth PortfolioScotia Partners Growth PortfolioScotia Partners Maximum Growth PortfolioScotia INNOVA Portfolios®
Scotia INNOVA Income PortfolioScotia INNOVA Balanced Income PortfolioScotia INNOVA Balanced Growth PortfolioScotia INNOVA Growth PortfolioScotia INNOVA Maximum Growth PortfolioScotia Aria™ PortfoliosScotia Aria Conservative Build PortfolioScotia Aria Conservative Core PortfolioScotia Aria Conservative Pay PortfolioScotia Aria Moderate Build PortfolioScotia Aria Moderate Core PortfolioScotia Aria Moderate Pay PortfolioScotia Aria Progressive Build PortfolioScotia Aria Progressive Core PortfolioScotia Aria Progressive Pay Portfolio
Scotia Corporate Class FundsScotia Short Term Yield ClassScotia Conservative Government Bond Capital Yield ClassScotia Canadian Corporate Bond Capital Yield ClassScotia Fixed Income Blend ClassScotia Canadian Dividend ClassScotia Canadian Equity Blend ClassScotia Private Canadian Equity ClassScotia Private U.S. Dividend ClassScotia Private U.S. Equity ClassScotia U.S. Equity Blend ClassScotia Global Dividend ClassScotia International Equity Blend ClassScotia INNOVA Income Portfolio ClassScotia INNOVA Balanced Income Portfolio ClassScotia INNOVA Balanced Growth Portfolio ClassScotia INNOVA Growth Portfolio ClassScotia INNOVA Maximum Growth Portfolio Class
ScotiaFunds®
Semi-Annual ReportJune 30, 2015
1
F O R M O R E I N F O R M A T I O N A B O U T
ScotiaFunds®
visit :
www.scotiafunds.com
call :
1-800-268-9269 (English)1-800-387-5004 (French)
write:
1832 Asset Management L.P.1 Adelaide Street East
28th FloorToronto, Ontario
M5C 2V9
® Registered trademarks of The Bank of Nova Scotia, used under licence.
9471219 (08/15)
1 1 11
007408-Eng Cover.CC14.indd 1 8/27/15 1:02 PM
Tableof Contents
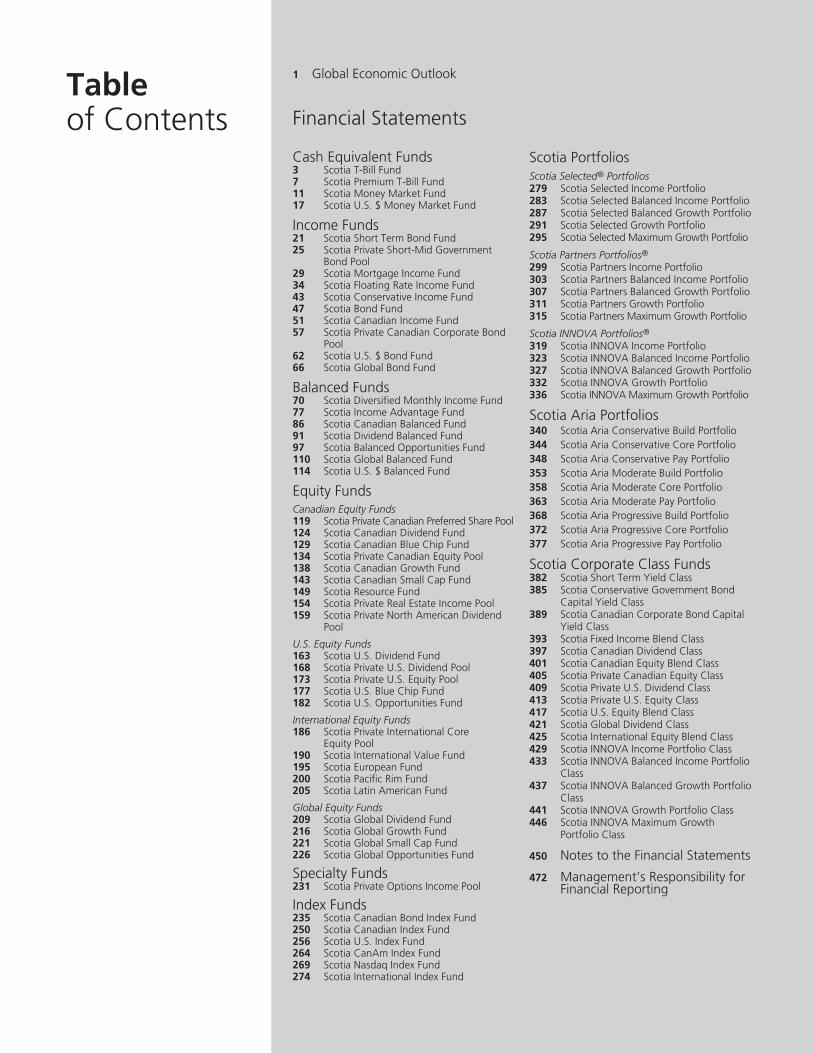
1 Global Economic Outlook
Financial Statements
Cash Equivalent Funds3 Scotia T-Bill Fund7 Scotia Premium T-Bill Fund11 Scotia Money Market Fund17 Scotia U.S. $ Money Market Fund
Income Funds21 Scotia Short Term Bond Fund25 Scotia Private Short-Mid Government
Bond Pool29 Scotia Mortgage Income Fund34 Scotia Floating Rate Income Fund43 Scotia Conservative Income Fund47 Scotia Bond Fund51 Scotia Canadian Income Fund57 Scotia Private Canadian Corporate Bond
Pool62 Scotia U.S. $ Bond Fund66 Scotia Global Bond Fund
Balanced Funds70 Scotia Diversified Monthly Income Fund77 Scotia Income Advantage Fund86 Scotia Canadian Balanced Fund91 Scotia Dividend Balanced Fund97 Scotia Balanced Opportunities Fund110 Scotia Global Balanced Fund114 Scotia U.S. $ Balanced Fund
Equity FundsCanadian Equity Funds119 Scotia Private Canadian Preferred Share Pool124 Scotia Canadian Dividend Fund129 Scotia Canadian Blue Chip Fund134 Scotia Private Canadian Equity Pool138 Scotia Canadian Growth Fund143 Scotia Canadian Small Cap Fund149 Scotia Resource Fund154 Scotia Private Real Estate Income Pool159 Scotia Private North American Dividend
Pool
U.S. Equity Funds163 Scotia U.S. Dividend Fund168 Scotia Private U.S. Dividend Pool173 Scotia Private U.S. Equity Pool177 Scotia U.S. Blue Chip Fund182 Scotia U.S. Opportunities Fund
International Equity Funds186 Scotia Private International Core
Equity Pool190 Scotia International Value Fund195 Scotia European Fund200 Scotia Pacific Rim Fund205 Scotia Latin American Fund
Global Equity Funds209 Scotia Global Dividend Fund216 Scotia Global Growth Fund221 Scotia Global Small Cap Fund226 Scotia Global Opportunities Fund
Specialty Funds231 Scotia Private Options Income Pool
Index Funds235 Scotia Canadian Bond Index Fund250 Scotia Canadian Index Fund256 Scotia U.S. Index Fund264 Scotia CanAm Index Fund269 Scotia Nasdaq Index Fund274 Scotia International Index Fund
Scotia PortfoliosScotia Selected® Portfolios279 Scotia Selected Income Portfolio283 Scotia Selected Balanced Income Portfolio287 Scotia Selected Balanced Growth Portfolio291 Scotia Selected Growth Portfolio295 Scotia Selected Maximum Growth Portfolio
Scotia Partners Portfolios®
299 Scotia Partners Income Portfolio303 Scotia Partners Balanced Income Portfolio307 Scotia Partners Balanced Growth Portfolio311 Scotia Partners Growth Portfolio315 Scotia Partners Maximum Growth Portfolio
Scotia INNOVA Portfolios®
319 Scotia INNOVA Income Portfolio323 Scotia INNOVA Balanced Income Portfolio327 Scotia INNOVA Balanced Growth Portfolio332 Scotia INNOVA Growth Portfolio336 Scotia INNOVA Maximum Growth Portfolio
Scotia Aria Portfolios340 Scotia Aria Conservative Build Portfolio344 Scotia Aria Conservative Core Portfolio348 Scotia Aria Conservative Pay Portfolio353 Scotia Aria Moderate Build Portfolio358 Scotia Aria Moderate Core Portfolio363 Scotia Aria Moderate Pay Portfolio368 Scotia Aria Progressive Build Portfolio372 Scotia Aria Progressive Core Portfolio377 Scotia Aria Progressive Pay Portfolio
Scotia Corporate Class Funds382 Scotia Short Term Yield Class385 Scotia Conservative Government Bond
Capital Yield Class389 Scotia Canadian Corporate Bond Capital
Yield Class393 Scotia Fixed Income Blend Class397 Scotia Canadian Dividend Class401 Scotia Canadian Equity Blend Class405 Scotia Private Canadian Equity Class409 Scotia Private U.S. Dividend Class413 Scotia Private U.S. Equity Class417 Scotia U.S. Equity Blend Class421 Scotia Global Dividend Class425 Scotia International Equity Blend Class429 Scotia INNOVA Income Portfolio Class433 Scotia INNOVA Balanced Income Portfolio
Class437 Scotia INNOVA Balanced Growth Portfolio
Class441 Scotia INNOVA Growth Portfolio Class446 Scotia INNOVA Maximum Growth
Portfolio Class
450 Notes to the Financial Statements
472 Management’s Responsibility forFinancial Reporting

Global Economic OutlookAron GampelVice-President and Deputy Chief EconomistScotiabank
Too Few Growth Engines
The pace of global output growth remains quitemoderate, a reflection of the continuing cyclicalunderperformance in many nations, and the structuraladjustments underway in a number of economicallyrelevant countries. A chronic shortfall in aggregatedemand remains the significant hurdle to strongergrowth internationally. At the same time, economies arebeing challenged by both temporary weather-inducedsetbacks, the latest involving significant drought and fireconditions in a number of regions, and the dampening ofconfidence related to the fallout from Greece’s latestdebt struggle, and the renewed decline in global stockmarket valuations, especially in China.
The economic underperformance continues to bereflected in disappointing trade data. The volume ofworld trade — the combination of exports andimports — has now contracted in four out of the firstfive months of 2015, dragging the year-over-year growthrate down to just under 2%. This performance is not onlywell below the post-2000 average of about 5%, but it isalso weaker than the tepid advance of roughly 3% inglobal output growth. The continuing weakness in globaltrade is worrisome because it is affecting most advancedand emerging market economies simultaneously.
Lackluster demand and increasing oversupply conditionsare continuing to pressure many markets and businessinvestment. An example is the broad-based weakness incommodity markets, where a stronger U.S. dollar isadding to the downside risks. The softness in capitalexpenditures may also reflect structural shifts, such asmore efficient and integrated manufacturing nodeswithin the faster-growing emerging market economies,and in some cases, the rise in protectionism despite thecontinuing push to reduce barriers to international trade.
Outside of a few sectors, motor vehicles and aerospaceproducts for example, industrial production remains at alow ebb around the world, with the continuing softnessin orders highlighting the slow return to stronger outputgrowth. For the most part, many businesses are focusedon consolidation and restructuring to meet the
challenges of persistently sluggish growth, as evidencedby the increasing pace of merger and acquisition activity.
Much of the uncertainty surrounding the outlook isfocused on China. The world’s second largest economyremains a relative outperformer, with recent monetaryand fiscal initiatives appearing to have provided somerenewed support for the languishing housing sector.However, China continues to transition to a much sloweroverall growth trajectory, relying more on consumer-ledactivity and less on government-sponsored investmentsand credit-sensitive borrowing. The moderating trend ingrowth and reduced demand for commodity andmanufactured inputs has rippled across both regionaland global supply chains, affecting the country’s diversemix of regional and international trading partners.China’s large equity market sell-off and currencydevaluation add another layer of uncertainty to analready less buoyant outlook.
Growth in much of the world’s major commodityexporting countries has slowed. For many of thesecountries, Canada and Australia for example, bifurcatedeconomic performances reflect the underlying buoyancyin the interest rate-sensitive consumer and housing-related sectors which are being underpinned by generallyfavourable job and service sector conditions. However, afurther consolidation in most commodity sectors will beneeded to bring output and profitability back into betterrealignment with sluggish demand and much lowerinternational terms of trade. This will take a further tollon country-specific output and local currencies.
Among the world’s other large economies, the U.K. willlead its European counterparts by a substantial margin.India should post the strongest growth rateinternationally this year and next. Both nations are beingsupported by stronger domestic demand conditions. Eurozone activity is slowly gaining momentum, led by Spainand Ireland, which are benefiting from their respectivecompetitive revivals, and Germany, which continues towitness relatively balanced growth.
After another slow start this year, the U.S. economyappears to be regaining some momentum. Consumershave been progressively loosening their purse strings.
1
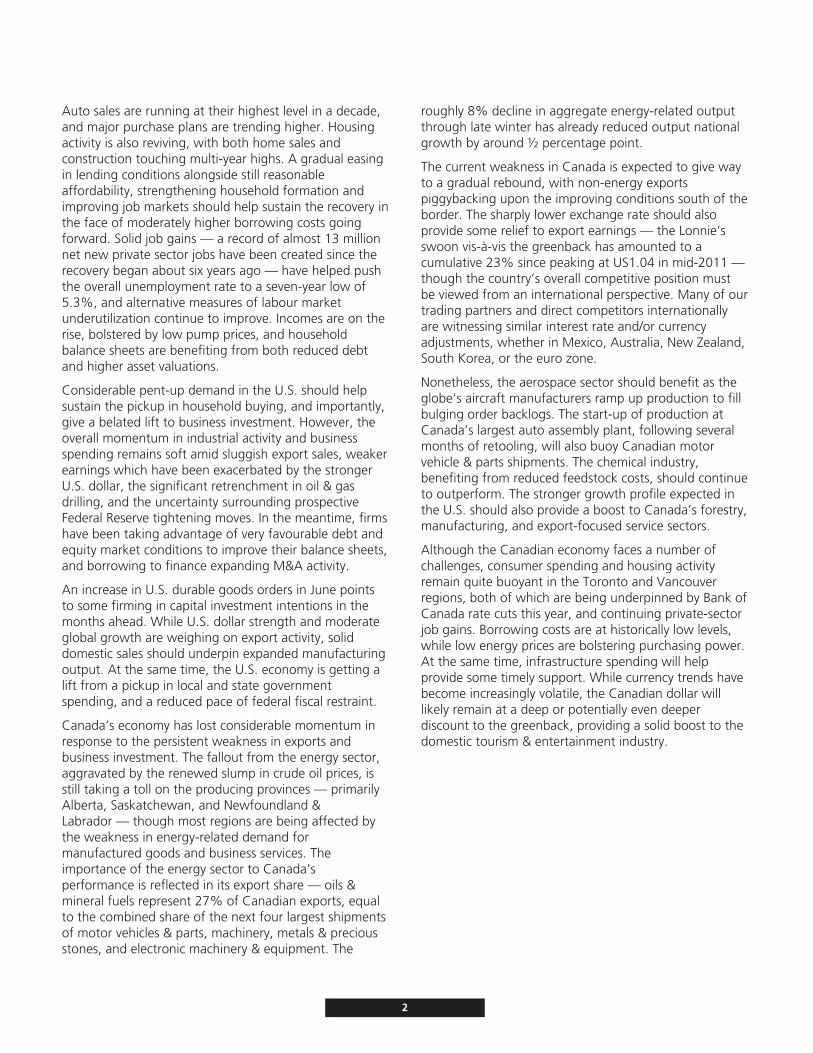
Auto sales are running at their highest level in a decade,and major purchase plans are trending higher. Housingactivity is also reviving, with both home sales andconstruction touching multi-year highs. A gradual easingin lending conditions alongside still reasonableaffordability, strengthening household formation andimproving job markets should help sustain the recovery inthe face of moderately higher borrowing costs goingforward. Solid job gains — a record of almost 13 millionnet new private sector jobs have been created since therecovery began about six years ago — have helped pushthe overall unemployment rate to a seven-year low of5.3%, and alternative measures of labour marketunderutilization continue to improve. Incomes are on therise, bolstered by low pump prices, and householdbalance sheets are benefiting from both reduced debtand higher asset valuations.
Considerable pent-up demand in the U.S. should helpsustain the pickup in household buying, and importantly,give a belated lift to business investment. However, theoverall momentum in industrial activity and businessspending remains soft amid sluggish export sales, weakerearnings which have been exacerbated by the strongerU.S. dollar, the significant retrenchment in oil & gasdrilling, and the uncertainty surrounding prospectiveFederal Reserve tightening moves. In the meantime, firmshave been taking advantage of very favourable debt andequity market conditions to improve their balance sheets,and borrowing to finance expanding M&A activity.
An increase in U.S. durable goods orders in June pointsto some firming in capital investment intentions in themonths ahead. While U.S. dollar strength and moderateglobal growth are weighing on export activity, soliddomestic sales should underpin expanded manufacturingoutput. At the same time, the U.S. economy is getting alift from a pickup in local and state governmentspending, and a reduced pace of federal fiscal restraint.
Canada’s economy has lost considerable momentum inresponse to the persistent weakness in exports andbusiness investment. The fallout from the energy sector,aggravated by the renewed slump in crude oil prices, isstill taking a toll on the producing provinces — primarilyAlberta, Saskatchewan, and Newfoundland &Labrador — though most regions are being affected bythe weakness in energy-related demand formanufactured goods and business services. Theimportance of the energy sector to Canada’sperformance is reflected in its export share — oils &mineral fuels represent 27% of Canadian exports, equalto the combined share of the next four largest shipmentsof motor vehicles & parts, machinery, metals & preciousstones, and electronic machinery & equipment. The
roughly 8% decline in aggregate energy-related outputthrough late winter has already reduced output nationalgrowth by around ½ percentage point.
The current weakness in Canada is expected to give wayto a gradual rebound, with non-energy exportspiggybacking upon the improving conditions south of theborder. The sharply lower exchange rate should alsoprovide some relief to export earnings — the Lonnie’sswoon vis-a-vis the greenback has amounted to acumulative 23% since peaking at US1.04 in mid-2011 —though the country’s overall competitive position mustbe viewed from an international perspective. Many of ourtrading partners and direct competitors internationallyare witnessing similar interest rate and/or currencyadjustments, whether in Mexico, Australia, New Zealand,South Korea, or the euro zone.
Nonetheless, the aerospace sector should benefit as theglobe’s aircraft manufacturers ramp up production to fillbulging order backlogs. The start-up of production atCanada’s largest auto assembly plant, following severalmonths of retooling, will also buoy Canadian motorvehicle & parts shipments. The chemical industry,benefiting from reduced feedstock costs, should continueto outperform. The stronger growth profile expected inthe U.S. should also provide a boost to Canada’s forestry,manufacturing, and export-focused service sectors.
Although the Canadian economy faces a number ofchallenges, consumer spending and housing activityremain quite buoyant in the Toronto and Vancouverregions, both of which are being underpinned by Bank ofCanada rate cuts this year, and continuing private-sectorjob gains. Borrowing costs are at historically low levels,while low energy prices are bolstering purchasing power.At the same time, infrastructure spending will helpprovide some timely support. While currency trends havebecome increasingly volatile, the Canadian dollar willlikely remain at a deep or potentially even deeperdiscount to the greenback, providing a solid boost to thedomestic tourism & entertainment industry.
2
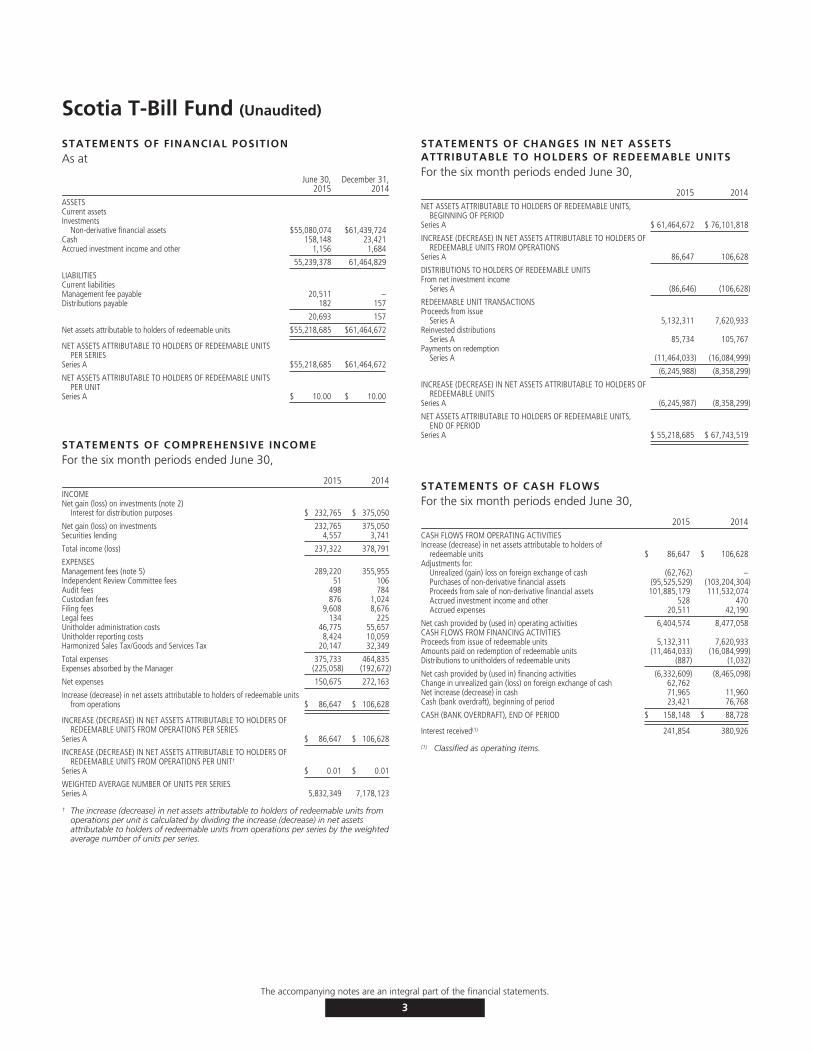
Scotia T-Bill Fund (Unaudited)
STATEMENTS OF FINANCIAL POSITIONAs at
June 30,2015
December 31,2014
ASSETSCurrent assetsInvestments
Non-derivative financial assets $55,080,074 $61,439,724Cash 158,148 23,421Accrued investment income and other 1,156 1,684
55,239,378 61,464,829
LIABILITIESCurrent liabilitiesManagement fee payable 20,511 –Distributions payable 182 157
20,693 157
Net assets attributable to holders of redeemable units $55,218,685 $61,464,672
NET ASSETS ATTRIBUTABLE TO HOLDERS OF REDEEMABLE UNITSPER SERIES
Series A $55,218,685 $61,464,672
NET ASSETS ATTRIBUTABLE TO HOLDERS OF REDEEMABLE UNITSPER UNIT
Series A $ 10.00 $ 10.00
STATEMENTS OF COMPREHENSIVE INCOMEFor the six month periods ended June 30,
2015 2014INCOMENet gain (loss) on investments (note 2)
Interest for distribution purposes $ 232,765 $ 375,050
Net gain (loss) on investments 232,765 375,050Securities lending 4,557 3,741
Total income (loss) 237,322 378,791
EXPENSESManagement fees (note 5) 289,220 355,955Independent Review Committee fees 51 106Audit fees 498 784Custodian fees 876 1,024Filing fees 9,608 8,676Legal fees 134 225Unitholder administration costs 46,775 55,657Unitholder reporting costs 8,424 10,059Harmonized Sales Tax/Goods and Services Tax 20,147 32,349
Total expenses 375,733 464,835Expenses absorbed by the Manager (225,058) (192,672)
Net expenses 150,675 272,163
Increase (decrease) in net assets attributable to holders of redeemable unitsfrom operations $ 86,647 $ 106,628
INCREASE (DECREASE) IN NET ASSETS ATTRIBUTABLE TO HOLDERS OFREDEEMABLE UNITS FROM OPERATIONS PER SERIES
Series A $ 86,647 $ 106,628
INCREASE (DECREASE) IN NET ASSETS ATTRIBUTABLE TO HOLDERS OFREDEEMABLE UNITS FROM OPERATIONS PER UNIT†
Series A $ 0.01 $ 0.01
WEIGHTED AVERAGE NUMBER OF UNITS PER SERIESSeries A 5,832,349 7,178,123
† The increase (decrease) in net assets attributable to holders of redeemable units fromoperations per unit is calculated by dividing the increase (decrease) in net assetsattributable to holders of redeemable units from operations per series by the weightedaverage number of units per series.
STATEMENTS OF CHANGES IN NET ASSETSATTRIBUTABLE TO HOLDERS OF REDEEMABLE UNITSFor the six month periods ended June 30,
2015 2014NET ASSETS ATTRIBUTABLE TO HOLDERS OF REDEEMABLE UNITS,
BEGINNING OF PERIODSeries A $ 61,464,672 $ 76,101,818
INCREASE (DECREASE) IN NET ASSETS ATTRIBUTABLE TO HOLDERS OFREDEEMABLE UNITS FROM OPERATIONS
Series A 86,647 106,628
DISTRIBUTIONS TO HOLDERS OF REDEEMABLE UNITSFrom net investment income
Series A (86,646) (106,628)
REDEEMABLE UNIT TRANSACTIONSProceeds from issue
Series A 5,132,311 7,620,933Reinvested distributions
Series A 85,734 105,767Payments on redemption
Series A (11,464,033) (16,084,999)
(6,245,988) (8,358,299)
INCREASE (DECREASE) IN NET ASSETS ATTRIBUTABLE TO HOLDERS OFREDEEMABLE UNITS
Series A (6,245,987) (8,358,299)
NET ASSETS ATTRIBUTABLE TO HOLDERS OF REDEEMABLE UNITS,END OF PERIOD
Series A $ 55,218,685 $ 67,743,519
STATEMENTS OF CASH FLOWSFor the six month periods ended June 30,
2015 2014CASH FLOWS FROM OPERATING ACTIVITIESIncrease (decrease) in net assets attributable to holders of
redeemable units $ 86,647 $ 106,628Adjustments for:
Unrealized (gain) loss on foreign exchange of cash (62,762) –Purchases of non-derivative financial assets (95,525,529) (103,204,304)Proceeds from sale of non-derivative financial assets 101,885,179 111,532,074Accrued investment income and other 528 470Accrued expenses 20,511 42,190
Net cash provided by (used in) operating activities 6,404,574 8,477,058CASH FLOWS FROM FINANCING ACTIVITIESProceeds from issue of redeemable units 5,132,311 7,620,933Amounts paid on redemption of redeemable units (11,464,033) (16,084,999)Distributions to unitholders of redeemable units (887) (1,032)
Net cash provided by (used in) financing activities (6,332,609) (8,465,098)Change in unrealized gain (loss) on foreign exchange of cash 62,762Net increase (decrease) in cash 71,965 11,960Cash (bank overdraft), beginning of period 23,421 76,768
CASH (BANK OVERDRAFT), END OF PERIOD $ 158,148 $ 88,728
Interest received(1) 241,854 380,926
(1) Classified as operating items.
The accompanying notes are an integral part of the financial statements.
3
Scotia T-Bill Fund (Unaudited – Continued)
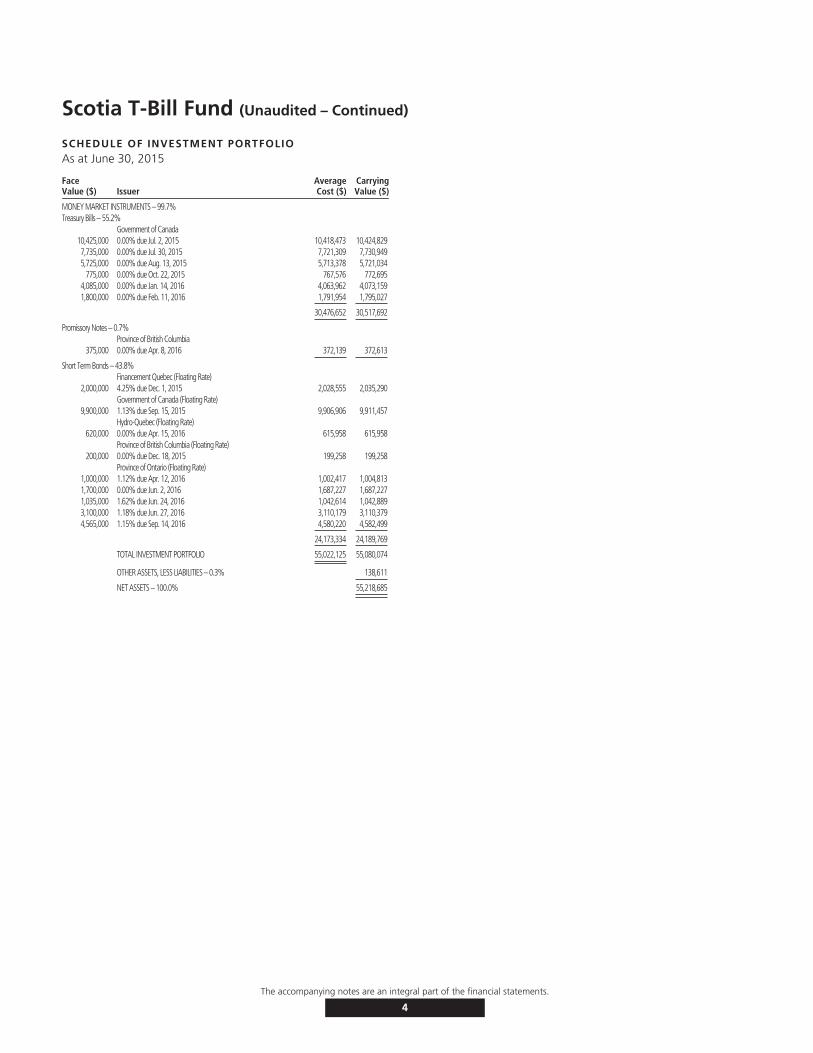
SCHEDULE OF INVESTMENT PORTFOLIOAs at June 30, 2015
FaceValue ($) Issuer
AverageCost ($)
CarryingValue ($)
MONEY MARKET INSTRUMENTS – 99.7%Treasury Bills – 55.2%
Government of Canada10,425,000 0.00% due Jul. 2, 2015 10,418,473 10,424,8297,735,000 0.00% due Jul. 30, 2015 7,721,309 7,730,9495,725,000 0.00% due Aug. 13, 2015 5,713,378 5,721,034
775,000 0.00% due Oct. 22, 2015 767,576 772,6954,085,000 0.00% due Jan. 14, 2016 4,063,962 4,073,1591,800,000 0.00% due Feb. 11, 2016 1,791,954 1,795,027
30,476,652 30,517,692
Promissory Notes – 0.7%Province of British Columbia
375,000 0.00% due Apr. 8, 2016 372,139 372,613
Short Term Bonds – 43.8%Financement Quebec (Floating Rate)
2,000,000 4.25% due Dec. 1, 2015 2,028,555 2,035,290Government of Canada (Floating Rate)
9,900,000 1.13% due Sep. 15, 2015 9,906,906 9,911,457Hydro-Quebec (Floating Rate)
620,000 0.00% due Apr. 15, 2016 615,958 615,958Province of British Columbia (Floating Rate)
200,000 0.00% due Dec. 18, 2015 199,258 199,258Province of Ontario (Floating Rate)
1,000,000 1.12% due Apr. 12, 2016 1,002,417 1,004,8131,700,000 0.00% due Jun. 2, 2016 1,687,227 1,687,2271,035,000 1.62% due Jun. 24, 2016 1,042,614 1,042,8893,100,000 1.18% due Jun. 27, 2016 3,110,179 3,110,3794,565,000 1.15% due Sep. 14, 2016 4,580,220 4,582,499
24,173,334 24,189,769
TOTAL INVESTMENT PORTFOLIO 55,022,125 55,080,074
OTHER ASSETS, LESS LIABILITIES – 0.3% 138,611
NET ASSETS – 100.0% 55,218,685
The accompanying notes are an integral part of the financial statements.
4
Scotia T-Bill Fund (Unaudited)
FUND SPECIFIC NOTESFor the periods indicated in Note 1.
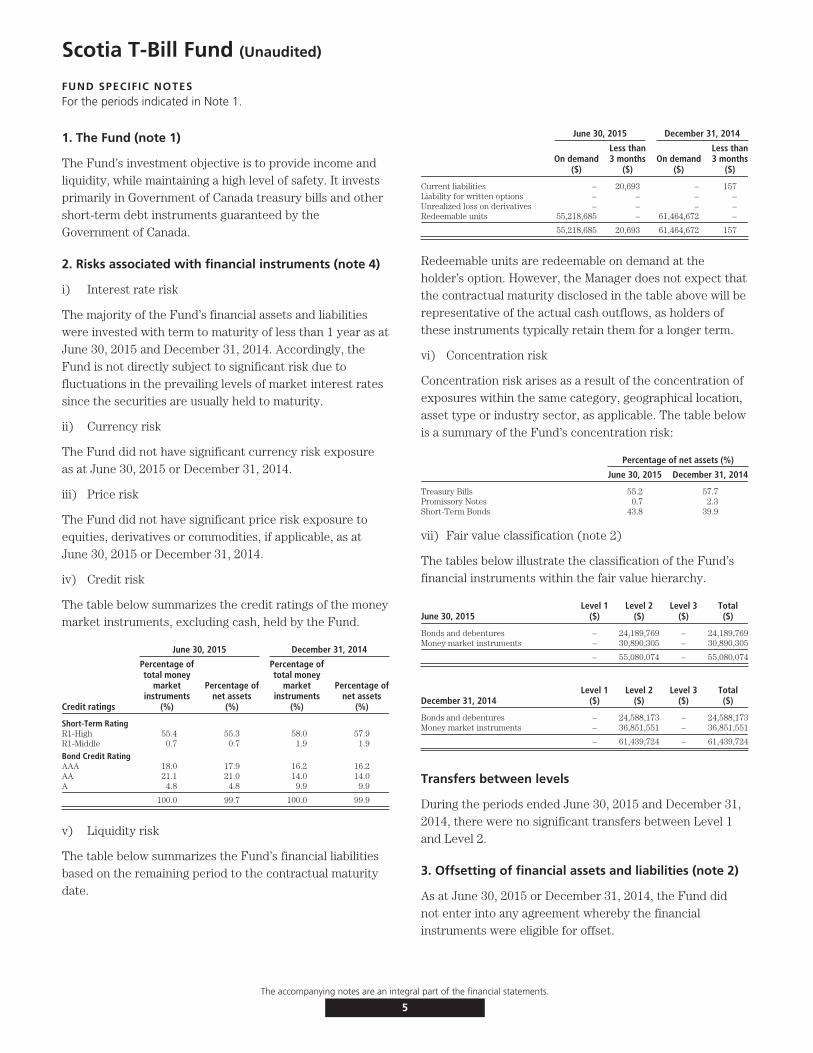
1. The Fund (note 1)
The Fund’s investment objective is to provide income andliquidity, while maintaining a high level of safety. It investsprimarily in Government of Canada treasury bills and othershort-term debt instruments guaranteed by theGovernment of Canada.
2. Risks associated with financial instruments (note 4)
i) Interest rate risk
The majority of the Fund’s financial assets and liabilitieswere invested with term to maturity of less than 1 year as atJune 30, 2015 and December 31, 2014. Accordingly, theFund is not directly subject to significant risk due tofluctuations in the prevailing levels of market interest ratessince the securities are usually held to maturity.
ii) Currency risk
The Fund did not have significant currency risk exposureas at June 30, 2015 or December 31, 2014.
iii) Price risk
The Fund did not have significant price risk exposure toequities, derivatives or commodities, if applicable, as atJune 30, 2015 or December 31, 2014.
iv) Credit risk
The table below summarizes the credit ratings of the moneymarket instruments, excluding cash, held by the Fund.
June 30, 2015 December 31, 2014
Credit ratings
Percentage oftotal money
marketinstruments
(%)
Percentage ofnet assets
(%)
Percentage oftotal money
marketinstruments
(%)
Percentage ofnet assets
(%)
Short-Term RatingR1-High 55.4 55.3 58.0 57.9R1-Middle 0.7 0.7 1.9 1.9
Bond Credit RatingAAA 18.0 17.9 16.2 16.2AA 21.1 21.0 14.0 14.0A 4.8 4.8 9.9 9.9
100.0 99.7 100.0 99.9
v) Liquidity risk
The table below summarizes the Fund’s financial liabilitiesbased on the remaining period to the contractual maturitydate.
June 30, 2015 December 31, 2014
On demand($)
Less than3 months
($)On demand
($)
Less than3 months
($)
Current liabilities – 20,693 – 157Liability for written options – – – –Unrealized loss on derivatives – – – –Redeemable units 55,218,685 – 61,464,672 –
55,218,685 20,693 61,464,672 157
Redeemable units are redeemable on demand at theholder’s option. However, the Manager does not expect thatthe contractual maturity disclosed in the table above will berepresentative of the actual cash outflows, as holders ofthese instruments typically retain them for a longer term.
vi) Concentration risk
Concentration risk arises as a result of the concentration ofexposures within the same category, geographical location,asset type or industry sector, as applicable. The table belowis a summary of the Fund’s concentration risk:
Percentage of net assets (%)
June 30, 2015 December 31, 2014
Treasury Bills 55.2 57.7Promissory Notes 0.7 2.3Short-Term Bonds 43.8 39.9
vii) Fair value classification (note 2)
The tables below illustrate the classification of the Fund’sfinancial instruments within the fair value hierarchy.
June 30, 2015Level 1
($)Level 2
($)Level 3
($)Total($)
Bonds and debentures – 24,189,769 – 24,189,769Money market instruments – 30,890,305 – 30,890,305
– 55,080,074 – 55,080,074
December 31, 2014Level 1
($)Level 2
($)Level 3
($)Total($)
Bonds and debentures – 24,588,173 – 24,588,173Money market instruments – 36,851,551 – 36,851,551
– 61,439,724 – 61,439,724
Transfers between levels
During the periods ended June 30, 2015 and December 31,2014, there were no significant transfers between Level 1and Level 2.
3. Offsetting of financial assets and liabilities (note 2)
As at June 30, 2015 or December 31, 2014, the Fund didnot enter into any agreement whereby the financialinstruments were eligible for offset.
The accompanying notes are an integral part of the financial statements.
5
Scotia T-Bill Fund (Unaudited – Continued)
FUND SPECIFIC NOTESFor the periods indicated in Note 1.
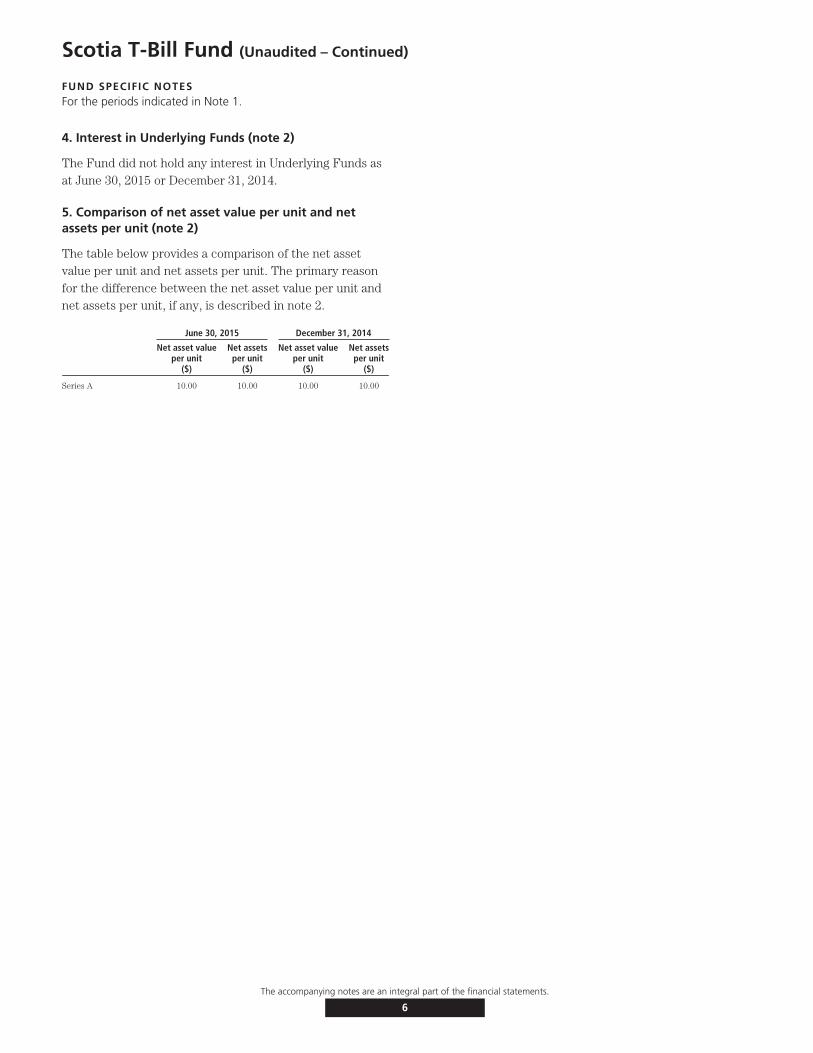
4. Interest in Underlying Funds (note 2)
The Fund did not hold any interest in Underlying Funds asat June 30, 2015 or December 31, 2014.
5. Comparison of net asset value per unit and netassets per unit (note 2)
The table below provides a comparison of the net assetvalue per unit and net assets per unit. The primary reasonfor the difference between the net asset value per unit andnet assets per unit, if any, is described in note 2.
June 30, 2015 December 31, 2014
Net asset valueper unit
($)
Net assetsper unit
($)
Net asset valueper unit
($)
Net assetsper unit
($)
Series A 10.00 10.00 10.00 10.00
The accompanying notes are an integral part of the financial statements.
6
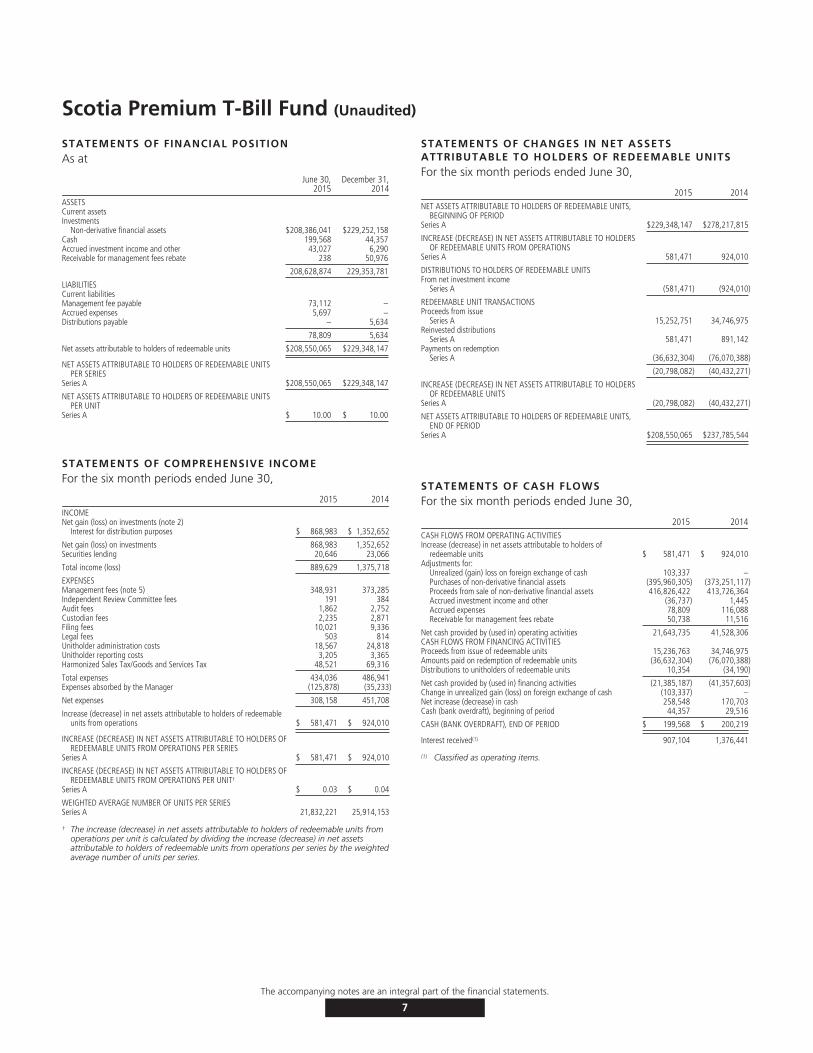
Scotia Premium T-Bill Fund (Unaudited)
STATEMENTS OF FINANCIAL POSITIONAs at
June 30,2015
December 31,2014
ASSETSCurrent assetsInvestments
Non-derivative financial assets $208,386,041 $229,252,158Cash 199,568 44,357Accrued investment income and other 43,027 6,290Receivable for management fees rebate 238 50,976
208,628,874 229,353,781
LIABILITIESCurrent liabilitiesManagement fee payable 73,112 –Accrued expenses 5,697 –Distributions payable – 5,634
78,809 5,634
Net assets attributable to holders of redeemable units $208,550,065 $229,348,147
NET ASSETS ATTRIBUTABLE TO HOLDERS OF REDEEMABLE UNITSPER SERIES
Series A $208,550,065 $229,348,147
NET ASSETS ATTRIBUTABLE TO HOLDERS OF REDEEMABLE UNITSPER UNIT
Series A $ 10.00 $ 10.00
STATEMENTS OF COMPREHENSIVE INCOMEFor the six month periods ended June 30,
2015 2014INCOMENet gain (loss) on investments (note 2)
Interest for distribution purposes $ 868,983 $ 1,352,652
Net gain (loss) on investments 868,983 1,352,652Securities lending 20,646 23,066
Total income (loss) 889,629 1,375,718
EXPENSESManagement fees (note 5) 348,931 373,285Independent Review Committee fees 191 384Audit fees 1,862 2,752Custodian fees 2,235 2,871Filing fees 10,021 9,336Legal fees 503 814Unitholder administration costs 18,567 24,818Unitholder reporting costs 3,205 3,365Harmonized Sales Tax/Goods and Services Tax 48,521 69,316
Total expenses 434,036 486,941Expenses absorbed by the Manager (125,878) (35,233)
Net expenses 308,158 451,708
Increase (decrease) in net assets attributable to holders of redeemableunits from operations $ 581,471 $ 924,010
INCREASE (DECREASE) IN NET ASSETS ATTRIBUTABLE TO HOLDERS OFREDEEMABLE UNITS FROM OPERATIONS PER SERIES
Series A $ 581,471 $ 924,010
INCREASE (DECREASE) IN NET ASSETS ATTRIBUTABLE TO HOLDERS OFREDEEMABLE UNITS FROM OPERATIONS PER UNIT†
Series A $ 0.03 $ 0.04
WEIGHTED AVERAGE NUMBER OF UNITS PER SERIESSeries A 21,832,221 25,914,153
† The increase (decrease) in net assets attributable to holders of redeemable units fromoperations per unit is calculated by dividing the increase (decrease) in net assetsattributable to holders of redeemable units from operations per series by the weightedaverage number of units per series.
STATEMENTS OF CHANGES IN NET ASSETSATTRIBUTABLE TO HOLDERS OF REDEEMABLE UNITSFor the six month periods ended June 30,
2015 2014NET ASSETS ATTRIBUTABLE TO HOLDERS OF REDEEMABLE UNITS,
BEGINNING OF PERIODSeries A $229,348,147 $278,217,815
INCREASE (DECREASE) IN NET ASSETS ATTRIBUTABLE TO HOLDERSOF REDEEMABLE UNITS FROM OPERATIONS
Series A 581,471 924,010
DISTRIBUTIONS TO HOLDERS OF REDEEMABLE UNITSFrom net investment income
Series A (581,471) (924,010)
REDEEMABLE UNIT TRANSACTIONSProceeds from issue
Series A 15,252,751 34,746,975Reinvested distributions
Series A 581,471 891,142Payments on redemption
Series A (36,632,304) (76,070,388)
(20,798,082) (40,432,271)
INCREASE (DECREASE) IN NET ASSETS ATTRIBUTABLE TO HOLDERSOF REDEEMABLE UNITS
Series A (20,798,082) (40,432,271)
NET ASSETS ATTRIBUTABLE TO HOLDERS OF REDEEMABLE UNITS,END OF PERIOD
Series A $208,550,065 $237,785,544
STATEMENTS OF CASH FLOWSFor the six month periods ended June 30,
2015 2014CASH FLOWS FROM OPERATING ACTIVITIESIncrease (decrease) in net assets attributable to holders of
redeemable units $ 581,471 $ 924,010Adjustments for:
Unrealized (gain) loss on foreign exchange of cash 103,337 –Purchases of non-derivative financial assets (395,960,305) (373,251,117)Proceeds from sale of non-derivative financial assets 416,826,422 413,726,364Accrued investment income and other (36,737) 1,445Accrued expenses 78,809 116,088Receivable for management fees rebate 50,738 11,516
Net cash provided by (used in) operating activities 21,643,735 41,528,306CASH FLOWS FROM FINANCING ACTIVITIESProceeds from issue of redeemable units 15,236,763 34,746,975Amounts paid on redemption of redeemable units (36,632,304) (76,070,388)Distributions to unitholders of redeemable units 10,354 (34,190)
Net cash provided by (used in) financing activities (21,385,187) (41,357,603)Change in unrealized gain (loss) on foreign exchange of cash (103,337) –Net increase (decrease) in cash 258,548 170,703Cash (bank overdraft), beginning of period 44,357 29,516
CASH (BANK OVERDRAFT), END OF PERIOD $ 199,568 $ 200,219
Interest received(1) 907,104 1,376,441
(1) Classified as operating items.
The accompanying notes are an integral part of the financial statements.
7
Scotia Premium T-Bill Fund (Unaudited – Continued)
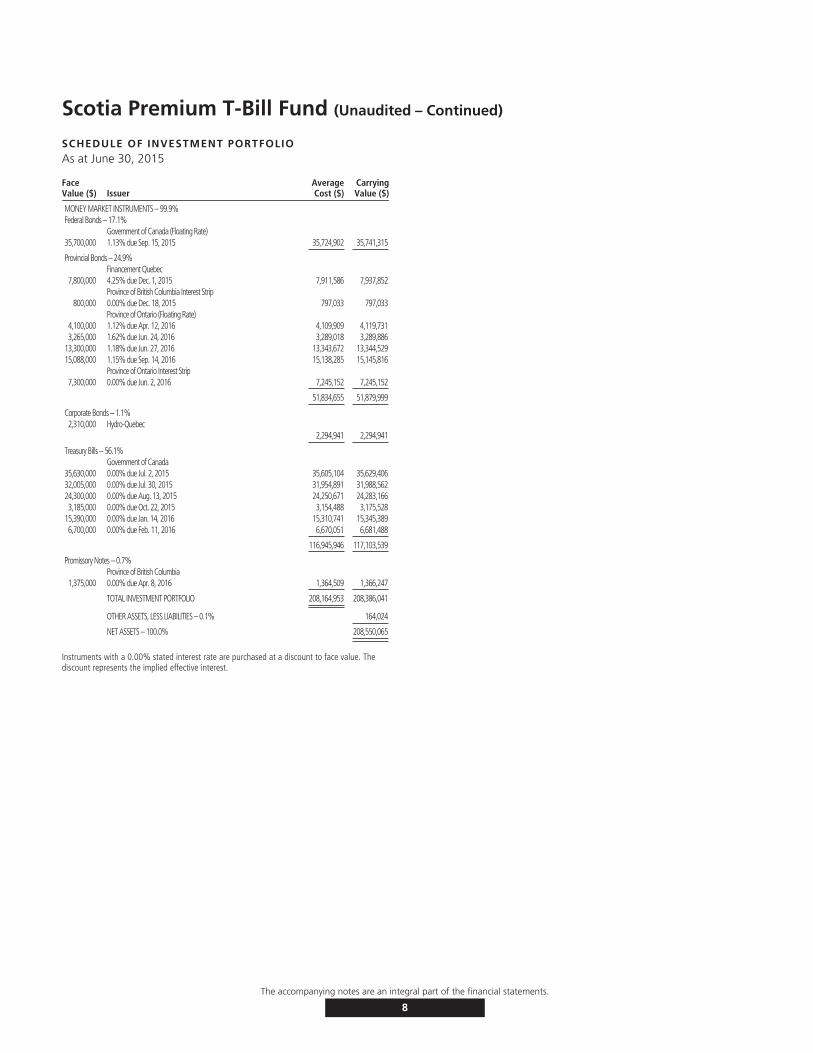
SCHEDULE OF INVESTMENT PORTFOLIOAs at June 30, 2015
FaceValue ($) Issuer
AverageCost ($)
CarryingValue ($)
MONEY MARKET INSTRUMENTS – 99.9%Federal Bonds – 17.1%
Government of Canada (Floating Rate)35,700,000 1.13% due Sep. 15, 2015 35,724,902 35,741,315
Provincial Bonds – 24.9%Financement Quebec
7,800,000 4.25% due Dec. 1, 2015 7,911,586 7,937,852Province of British Columbia Interest Strip
800,000 0.00% due Dec. 18, 2015 797,033 797,033Province of Ontario (Floating Rate)
4,100,000 1.12% due Apr. 12, 2016 4,109,909 4,119,7313,265,000 1.62% due Jun. 24, 2016 3,289,018 3,289,886
13,300,000 1.18% due Jun. 27, 2016 13,343,672 13,344,52915,088,000 1.15% due Sep. 14, 2016 15,138,285 15,145,816
Province of Ontario Interest Strip7,300,000 0.00% due Jun. 2, 2016 7,245,152 7,245,152
51,834,655 51,879,999
Corporate Bonds – 1.1%2,310,000 Hydro-Quebec
2,294,941 2,294,941
Treasury Bills – 56.1%Government of Canada
35,630,000 0.00% due Jul. 2, 2015 35,605,104 35,629,40632,005,000 0.00% due Jul. 30, 2015 31,954,891 31,988,56224,300,000 0.00% due Aug. 13, 2015 24,250,671 24,283,1663,185,000 0.00% due Oct. 22, 2015 3,154,488 3,175,528
15,390,000 0.00% due Jan. 14, 2016 15,310,741 15,345,3896,700,000 0.00% due Feb. 11, 2016 6,670,051 6,681,488
116,945,946 117,103,539
Promissory Notes – 0.7%Province of British Columbia
1,375,000 0.00% due Apr. 8, 2016 1,364,509 1,366,247
TOTAL INVESTMENT PORTFOLIO 208,164,953 208,386,041
OTHER ASSETS, LESS LIABILITIES – 0.1% 164,024
NET ASSETS – 100.0% 208,550,065
Instruments with a 0.00% stated interest rate are purchased at a discount to face value. Thediscount represents the implied effective interest.
The accompanying notes are an integral part of the financial statements.
8
Scotia Premium T-Bill Fund (Unaudited)
FUND SPECIFIC NOTESFor the periods indicated in Note 1.
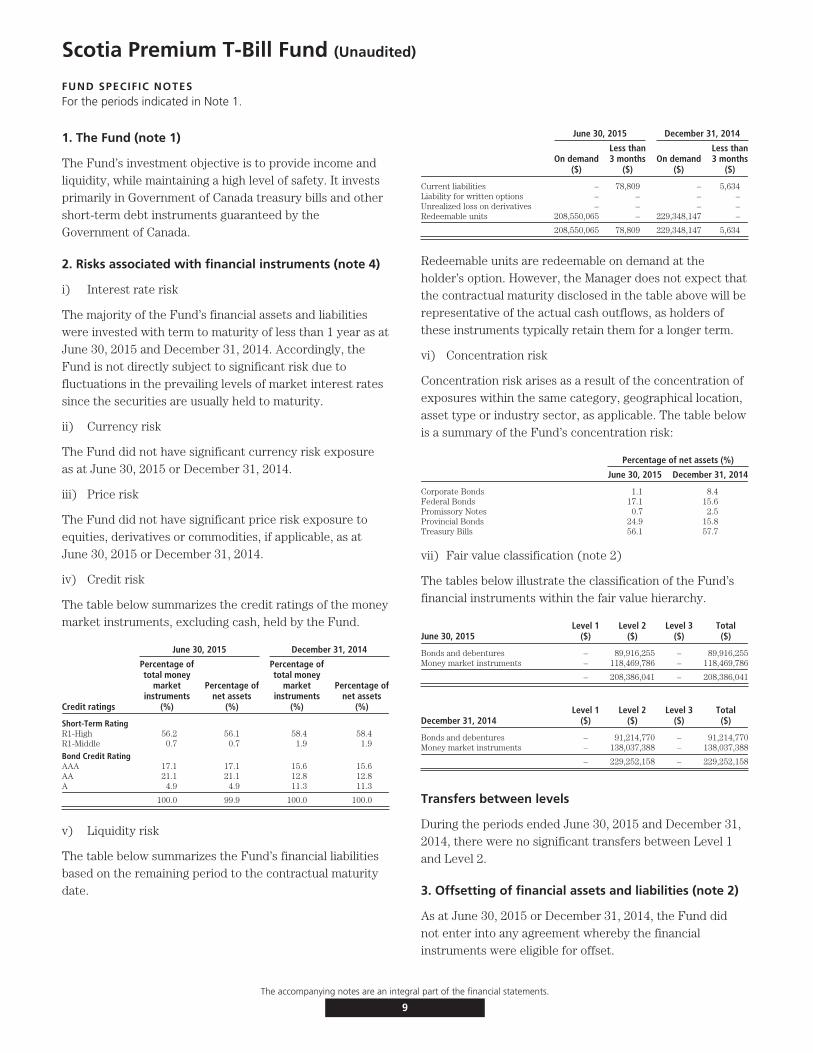
1. The Fund (note 1)
The Fund’s investment objective is to provide income andliquidity, while maintaining a high level of safety. It investsprimarily in Government of Canada treasury bills and othershort-term debt instruments guaranteed by theGovernment of Canada.
2. Risks associated with financial instruments (note 4)
i) Interest rate risk
The majority of the Fund’s financial assets and liabilitieswere invested with term to maturity of less than 1 year as atJune 30, 2015 and December 31, 2014. Accordingly, theFund is not directly subject to significant risk due tofluctuations in the prevailing levels of market interest ratessince the securities are usually held to maturity.
ii) Currency risk
The Fund did not have significant currency risk exposureas at June 30, 2015 or December 31, 2014.
iii) Price risk
The Fund did not have significant price risk exposure toequities, derivatives or commodities, if applicable, as atJune 30, 2015 or December 31, 2014.
iv) Credit risk
The table below summarizes the credit ratings of the moneymarket instruments, excluding cash, held by the Fund.
June 30, 2015 December 31, 2014
Credit ratings
Percentage oftotal money
marketinstruments
(%)
Percentage ofnet assets
(%)
Percentage oftotal money
marketinstruments
(%)
Percentage ofnet assets
(%)
Short-Term RatingR1-High 56.2 56.1 58.4 58.4R1-Middle 0.7 0.7 1.9 1.9
Bond Credit RatingAAA 17.1 17.1 15.6 15.6AA 21.1 21.1 12.8 12.8A 4.9 4.9 11.3 11.3
100.0 99.9 100.0 100.0
v) Liquidity risk
The table below summarizes the Fund’s financial liabilitiesbased on the remaining period to the contractual maturitydate.
June 30, 2015 December 31, 2014
On demand($)
Less than3 months
($)On demand
($)
Less than3 months
($)
Current liabilities – 78,809 – 5,634Liability for written options – – – –Unrealized loss on derivatives – – – –Redeemable units 208,550,065 – 229,348,147 –
208,550,065 78,809 229,348,147 5,634
Redeemable units are redeemable on demand at theholder’s option. However, the Manager does not expect thatthe contractual maturity disclosed in the table above will berepresentative of the actual cash outflows, as holders ofthese instruments typically retain them for a longer term.
vi) Concentration risk
Concentration risk arises as a result of the concentration ofexposures within the same category, geographical location,asset type or industry sector, as applicable. The table belowis a summary of the Fund’s concentration risk:
Percentage of net assets (%)
June 30, 2015 December 31, 2014
Corporate Bonds 1.1 8.4Federal Bonds 17.1 15.6Promissory Notes 0.7 2.5Provincial Bonds 24.9 15.8Treasury Bills 56.1 57.7
vii) Fair value classification (note 2)
The tables below illustrate the classification of the Fund’sfinancial instruments within the fair value hierarchy.
June 30, 2015Level 1
($)Level 2
($)Level 3
($)Total($)
Bonds and debentures – 89,916,255 – 89,916,255Money market instruments – 118,469,786 – 118,469,786
– 208,386,041 – 208,386,041
December 31, 2014Level 1
($)Level 2
($)Level 3
($)Total($)
Bonds and debentures – 91,214,770 – 91,214,770Money market instruments – 138,037,388 – 138,037,388
– 229,252,158 – 229,252,158
Transfers between levels
During the periods ended June 30, 2015 and December 31,2014, there were no significant transfers between Level 1and Level 2.
3. Offsetting of financial assets and liabilities (note 2)
As at June 30, 2015 or December 31, 2014, the Fund didnot enter into any agreement whereby the financialinstruments were eligible for offset.
The accompanying notes are an integral part of the financial statements.
9

Scotia Premium T-Bill Fund (Unaudited – Continued)
FUND SPECIFIC NOTESFor the periods indicated in Note 1.
4. Interest in Underlying Funds (note 2)
The Fund did not hold any interest in Underlying Funds asat June 30, 2015 or December 31, 2014.
5. Comparison of net asset value per unit and netassets per unit (note 2)
The table below provides a comparison of the net assetvalue per unit and net assets per unit. The primary reasonfor the difference between the net asset value per unit andnet assets per unit, if any, is described in note 2.
June 30, 2015 December 31, 2014
Net asset valueper unit
($)
Net assetsper unit
($)
Net asset valueper unit
($)
Net assetsper unit
($)
Series A 10.00 10.00 10.00 10.00
The accompanying notes are an integral part of the financial statements.
10
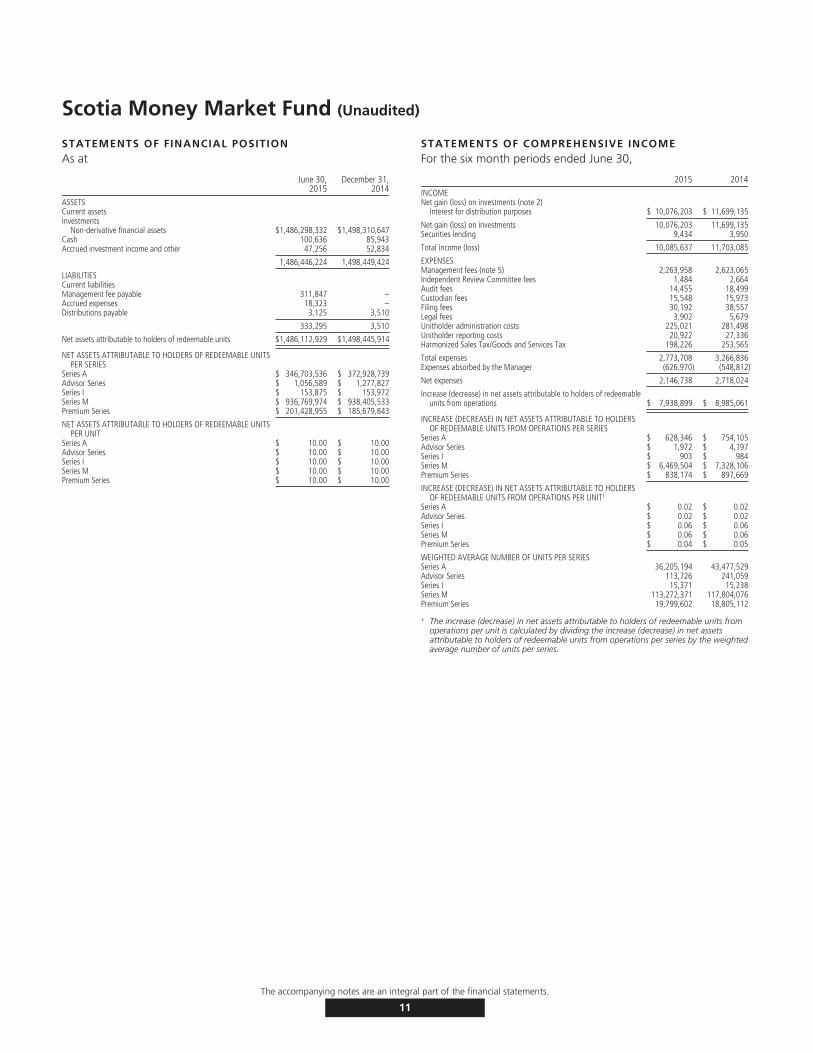
Scotia Money Market Fund (Unaudited)
STATEMENTS OF FINANCIAL POSITIONAs at
June 30,2015
December 31,2014
ASSETSCurrent assetsInvestments
Non-derivative financial assets $1,486,298,332 $1,498,310,647Cash 100,636 85,943Accrued investment income and other 47,256 52,834
1,486,446,224 1,498,449,424
LIABILITIESCurrent liabilitiesManagement fee payable 311,847 –Accrued expenses 18,323 –Distributions payable 3,125 3,510
333,295 3,510
Net assets attributable to holders of redeemable units $1,486,112,929 $1,498,445,914
NET ASSETS ATTRIBUTABLE TO HOLDERS OF REDEEMABLE UNITSPER SERIES
Series A $ 346,703,536 $ 372,928,739Advisor Series $ 1,056,589 $ 1,277,827Series I $ 153,875 $ 153,972Series M $ 936,769,974 $ 938,405,533Premium Series $ 201,428,955 $ 185,679,843
NET ASSETS ATTRIBUTABLE TO HOLDERS OF REDEEMABLE UNITSPER UNIT
Series A $ 10.00 $ 10.00Advisor Series $ 10.00 $ 10.00Series I $ 10.00 $ 10.00Series M $ 10.00 $ 10.00Premium Series $ 10.00 $ 10.00
STATEMENTS OF COMPREHENSIVE INCOMEFor the six month periods ended June 30,
2015 2014INCOMENet gain (loss) on investments (note 2)
Interest for distribution purposes $ 10,076,203 $ 11,699,135
Net gain (loss) on investments 10,076,203 11,699,135Securities lending 9,434 3,950
Total income (loss) 10,085,637 11,703,085
EXPENSESManagement fees (note 5) 2,263,958 2,623,065Independent Review Committee fees 1,484 2,664Audit fees 14,455 18,499Custodian fees 15,548 15,973Filing fees 30,192 38,557Legal fees 3,902 5,679Unitholder administration costs 225,021 281,498Unitholder reporting costs 20,922 27,336Harmonized Sales Tax/Goods and Services Tax 198,226 253,565
Total expenses 2,773,708 3,266,836Expenses absorbed by the Manager (626,970) (548,812)
Net expenses 2,146,738 2,718,024
Increase (decrease) in net assets attributable to holders of redeemableunits from operations $ 7,938,899 $ 8,985,061
INCREASE (DECREASE) IN NET ASSETS ATTRIBUTABLE TO HOLDERSOF REDEEMABLE UNITS FROM OPERATIONS PER SERIES
Series A $ 628,346 $ 754,105Advisor Series $ 1,972 $ 4,197Series I $ 903 $ 984Series M $ 6,469,504 $ 7,328,106Premium Series $ 838,174 $ 897,669
INCREASE (DECREASE) IN NET ASSETS ATTRIBUTABLE TO HOLDERSOF REDEEMABLE UNITS FROM OPERATIONS PER UNIT†
Series A $ 0.02 $ 0.02Advisor Series $ 0.02 $ 0.02Series I $ 0.06 $ 0.06Series M $ 0.06 $ 0.06Premium Series $ 0.04 $ 0.05
WEIGHTED AVERAGE NUMBER OF UNITS PER SERIESSeries A 36,205,194 43,477,529Advisor Series 113,726 241,059Series I 15,371 15,238Series M 113,272,371 117,804,076Premium Series 19,799,602 18,805,112
† The increase (decrease) in net assets attributable to holders of redeemable units fromoperations per unit is calculated by dividing the increase (decrease) in net assetsattributable to holders of redeemable units from operations per series by the weightedaverage number of units per series.
The accompanying notes are an integral part of the financial statements.
11
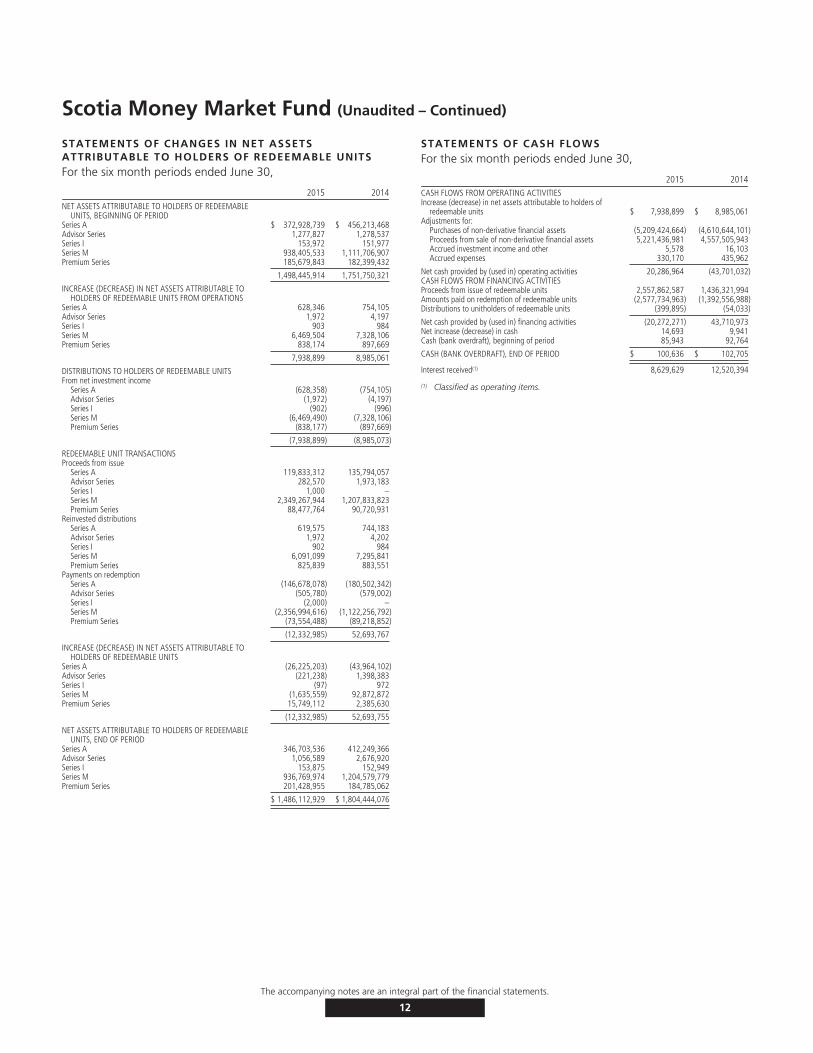
Scotia Money Market Fund (Unaudited – Continued)
STATEMENTS OF CHANGES IN NET ASSETSATTRIBUTABLE TO HOLDERS OF REDEEMABLE UNITSFor the six month periods ended June 30,
2015 2014NET ASSETS ATTRIBUTABLE TO HOLDERS OF REDEEMABLE
UNITS, BEGINNING OF PERIODSeries A $ 372,928,739 $ 456,213,468Advisor Series 1,277,827 1,278,537Series I 153,972 151,977Series M 938,405,533 1,111,706,907Premium Series 185,679,843 182,399,432
1,498,445,914 1,751,750,321
INCREASE (DECREASE) IN NET ASSETS ATTRIBUTABLE TOHOLDERS OF REDEEMABLE UNITS FROM OPERATIONS
Series A 628,346 754,105Advisor Series 1,972 4,197Series I 903 984Series M 6,469,504 7,328,106Premium Series 838,174 897,669
7,938,899 8,985,061
DISTRIBUTIONS TO HOLDERS OF REDEEMABLE UNITSFrom net investment income
Series A (628,358) (754,105)Advisor Series (1,972) (4,197)Series I (902) (996)Series M (6,469,490) (7,328,106)Premium Series (838,177) (897,669)
(7,938,899) (8,985,073)
REDEEMABLE UNIT TRANSACTIONSProceeds from issue
Series A 119,833,312 135,794,057Advisor Series 282,570 1,973,183Series I 1,000 –Series M 2,349,267,944 1,207,833,823Premium Series 88,477,764 90,720,931
Reinvested distributionsSeries A 619,575 744,183Advisor Series 1,972 4,202Series I 902 984Series M 6,091,099 7,295,841Premium Series 825,839 883,551
Payments on redemptionSeries A (146,678,078) (180,502,342)Advisor Series (505,780) (579,002)Series I (2,000) –Series M (2,356,994,616) (1,122,256,792)Premium Series (73,554,488) (89,218,852)
(12,332,985) 52,693,767
INCREASE (DECREASE) IN NET ASSETS ATTRIBUTABLE TOHOLDERS OF REDEEMABLE UNITS
Series A (26,225,203) (43,964,102)Advisor Series (221,238) 1,398,383Series I (97) 972Series M (1,635,559) 92,872,872Premium Series 15,749,112 2,385,630
(12,332,985) 52,693,755
NET ASSETS ATTRIBUTABLE TO HOLDERS OF REDEEMABLEUNITS, END OF PERIOD
Series A 346,703,536 412,249,366Advisor Series 1,056,589 2,676,920Series I 153,875 152,949Series M 936,769,974 1,204,579,779Premium Series 201,428,955 184,785,062
$ 1,486,112,929 $ 1,804,444,076
STATEMENTS OF CASH FLOWSFor the six month periods ended June 30,
2015 2014CASH FLOWS FROM OPERATING ACTIVITIESIncrease (decrease) in net assets attributable to holders of
redeemable units $ 7,938,899 $ 8,985,061Adjustments for:
Purchases of non-derivative financial assets (5,209,424,664) (4,610,644,101)Proceeds from sale of non-derivative financial assets 5,221,436,981 4,557,505,943Accrued investment income and other 5,578 16,103Accrued expenses 330,170 435,962
Net cash provided by (used in) operating activities 20,286,964 (43,701,032)CASH FLOWS FROM FINANCING ACTIVITIESProceeds from issue of redeemable units 2,557,862,587 1,436,321,994Amounts paid on redemption of redeemable units (2,577,734,963) (1,392,556,988)Distributions to unitholders of redeemable units (399,895) (54,033)
Net cash provided by (used in) financing activities (20,272,271) 43,710,973Net increase (decrease) in cash 14,693 9,941Cash (bank overdraft), beginning of period 85,943 92,764
CASH (BANK OVERDRAFT), END OF PERIOD $ 100,636 $ 102,705
Interest received(1) 8,629,629 12,520,394
(1) Classified as operating items.
The accompanying notes are an integral part of the financial statements.
12
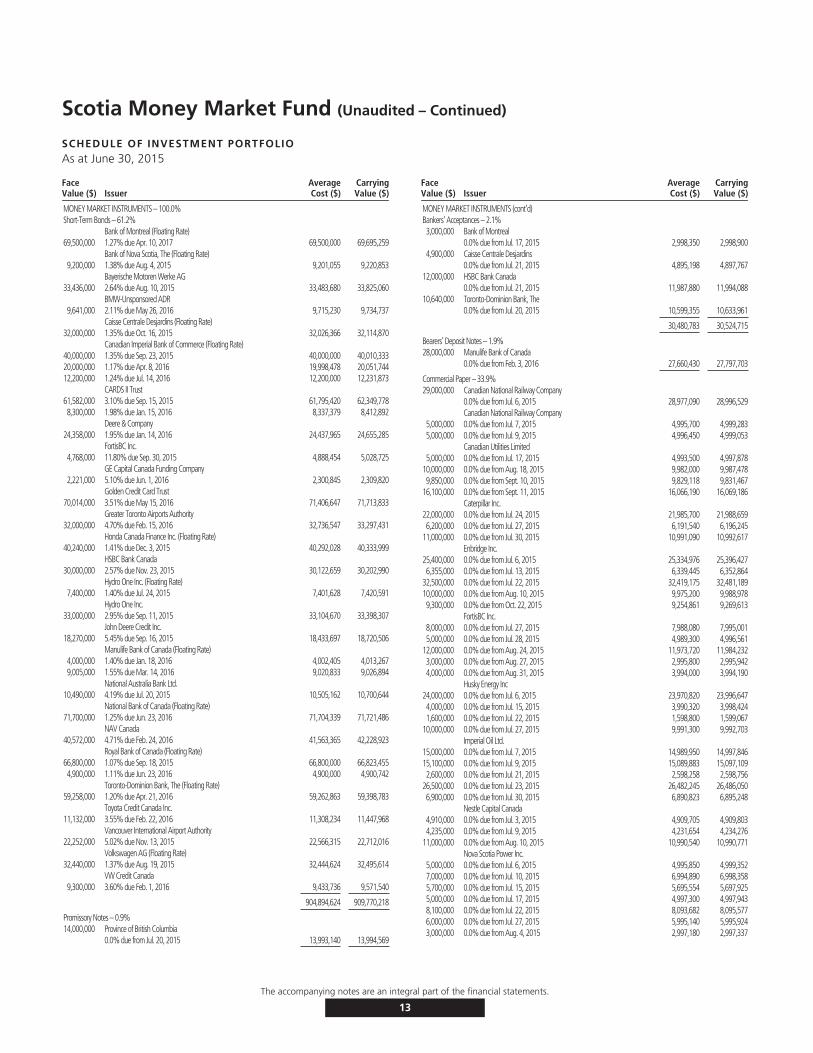
Scotia Money Market Fund (Unaudited – Continued)
SCHEDULE OF INVESTMENT PORTFOLIOAs at June 30, 2015
FaceValue ($) Issuer
AverageCost ($)
CarryingValue ($)
MONEY MARKET INSTRUMENTS – 100.0%Short-Term Bonds – 61.2%
Bank of Montreal (Floating Rate)69,500,000 1.27% due Apr. 10, 2017 69,500,000 69,695,259
Bank of Nova Scotia, The (Floating Rate)9,200,000 1.38% due Aug. 4, 2015 9,201,055 9,220,853
Bayerische Motoren Werke AG33,436,000 2.64% due Aug. 10, 2015 33,483,680 33,825,060
BMW-Unsponsored ADR9,641,000 2.11% due May 26, 2016 9,715,230 9,734,737
Caisse Centrale Desjardins (Floating Rate)32,000,000 1.35% due Oct. 16, 2015 32,026,366 32,114,870
Canadian Imperial Bank of Commerce (Floating Rate)40,000,000 1.35% due Sep. 23, 2015 40,000,000 40,010,33320,000,000 1.17% due Apr. 8, 2016 19,998,478 20,051,74412,200,000 1.24% due Jul. 14, 2016 12,200,000 12,231,873
CARDS II Trust61,582,000 3.10% due Sep. 15, 2015 61,795,420 62,349,7788,300,000 1.98% due Jan. 15, 2016 8,337,379 8,412,892
Deere & Company24,358,000 1.95% due Jan. 14, 2016 24,437,965 24,655,285
FortisBC Inc.4,768,000 11.80% due Sep. 30, 2015 4,888,454 5,028,725
GE Capital Canada Funding Company2,221,000 5.10% due Jun. 1, 2016 2,300,845 2,309,820
Golden Credit Card Trust70,014,000 3.51% due May 15, 2016 71,406,647 71,713,833
Greater Toronto Airports Authority32,000,000 4.70% due Feb. 15, 2016 32,736,547 33,297,431
Honda Canada Finance Inc. (Floating Rate)40,240,000 1.41% due Dec. 3, 2015 40,292,028 40,333,999
HSBC Bank Canada30,000,000 2.57% due Nov. 23, 2015 30,122,659 30,202,990
Hydro One Inc. (Floating Rate)7,400,000 1.40% due Jul. 24, 2015 7,401,628 7,420,591
Hydro One Inc.33,000,000 2.95% due Sep. 11, 2015 33,104,670 33,398,307
John Deere Credit Inc.18,270,000 5.45% due Sep. 16, 2015 18,433,697 18,720,506
Manulife Bank of Canada (Floating Rate)4,000,000 1.40% due Jan. 18, 2016 4,002,405 4,013,2679,005,000 1.55% due Mar. 14, 2016 9,020,833 9,026,894
National Australia Bank Ltd.10,490,000 4.19% due Jul. 20, 2015 10,505,162 10,700,644
National Bank of Canada (Floating Rate)71,700,000 1.25% due Jun. 23, 2016 71,704,339 71,721,486
NAV Canada40,572,000 4.71% due Feb. 24, 2016 41,563,365 42,228,923
Royal Bank of Canada (Floating Rate)66,800,000 1.07% due Sep. 18, 2015 66,800,000 66,823,4554,900,000 1.11% due Jun. 23, 2016 4,900,000 4,900,742
Toronto-Dominion Bank, The (Floating Rate)59,258,000 1.20% due Apr. 21, 2016 59,262,863 59,398,783
Toyota Credit Canada Inc.11,132,000 3.55% due Feb. 22, 2016 11,308,234 11,447,968
Vancouver International Airport Authority22,252,000 5.02% due Nov. 13, 2015 22,566,315 22,712,016
Volkswagen AG (Floating Rate)32,440,000 1.37% due Aug. 19, 2015 32,444,624 32,495,614
VW Credit Canada9,300,000 3.60% due Feb. 1, 2016 9,433,736 9,571,540
904,894,624 909,770,218
Promissory Notes – 0.9%14,000,000 Province of British Columbia
0.0% due from Jul. 20, 2015 13,993,140 13,994,569
FaceValue ($) Issuer
AverageCost ($)
CarryingValue ($)
MONEY MARKET INSTRUMENTS (cont’d)Bankers’ Acceptances – 2.1%3,000,000 Bank of Montreal
0.0% due from Jul. 17, 2015 2,998,350 2,998,9004,900,000 Caisse Centrale Desjardins
0.0% due from Jul. 21, 2015 4,895,198 4,897,76712,000,000 HSBC Bank Canada
0.0% due from Jul. 21, 2015 11,987,880 11,994,08810,640,000 Toronto-Dominion Bank, The
0.0% due from Jul. 20, 2015 10,599,355 10,633,961
30,480,783 30,524,715
Bearers’ Deposit Notes – 1.9%28,000,000 Manulife Bank of Canada
0.0% due from Feb. 3, 2016 27,660,430 27,797,703
Commercial Paper – 33.9%29,000,000 Canadian National Railway Company
0.0% due from Jul. 6, 2015 28,977,090 28,996,529Canadian National Railway Company
5,000,000 0.0% due from Jul. 7, 2015 4,995,700 4,999,2835,000,000 0.0% due from Jul. 9, 2015 4,996,450 4,999,053
Canadian Utilities Limited5,000,000 0.0% due from Jul. 17, 2015 4,993,500 4,997,878
10,000,000 0.0% due from Aug. 18, 2015 9,982,000 9,987,4789,850,000 0.0% due from Sept. 10, 2015 9,829,118 9,831,467
16,100,000 0.0% due from Sept. 11, 2015 16,066,190 16,069,186Caterpillar Inc.
22,000,000 0.0% due from Jul. 24, 2015 21,985,700 21,988,6596,200,000 0.0% due from Jul. 27, 2015 6,191,540 6,196,245
11,000,000 0.0% due from Jul. 30, 2015 10,991,090 10,992,617Enbridge Inc.
25,400,000 0.0% due from Jul. 6, 2015 25,334,976 25,396,4276,355,000 0.0% due from Jul. 13, 2015 6,339,445 6,352,864
32,500,000 0.0% due from Jul. 22, 2015 32,419,175 32,481,18910,000,000 0.0% due from Aug. 10, 2015 9,975,200 9,988,9789,300,000 0.0% due from Oct. 22, 2015 9,254,861 9,269,613
FortisBC Inc.8,000,000 0.0% due from Jul. 27, 2015 7,988,080 7,995,0015,000,000 0.0% due from Jul. 28, 2015 4,989,300 4,996,561
12,000,000 0.0% due from Aug. 24, 2015 11,973,720 11,984,2323,000,000 0.0% due from Aug. 27, 2015 2,995,800 2,995,9424,000,000 0.0% due from Aug. 31, 2015 3,994,000 3,994,190
Husky Energy Inc24,000,000 0.0% due from Jul. 6, 2015 23,970,820 23,996,6474,000,000 0.0% due from Jul. 15, 2015 3,990,320 3,998,4241,600,000 0.0% due from Jul. 22, 2015 1,598,800 1,599,067
10,000,000 0.0% due from Jul. 27, 2015 9,991,300 9,992,703Imperial Oil Ltd.
15,000,000 0.0% due from Jul. 7, 2015 14,989,950 14,997,84615,100,000 0.0% due from Jul. 9, 2015 15,089,883 15,097,1092,600,000 0.0% due from Jul. 21, 2015 2,598,258 2,598,756
26,500,000 0.0% due from Jul. 23, 2015 26,482,245 26,486,0506,900,000 0.0% due from Jul. 30, 2015 6,890,823 6,895,248
Nestle Capital Canada4,910,000 0.0% due from Jul. 3, 2015 4,909,705 4,909,8034,235,000 0.0% due from Jul. 9, 2015 4,231,654 4,234,276
11,000,000 0.0% due from Aug. 10, 2015 10,990,540 10,990,771Nova Scotia Power Inc.
5,000,000 0.0% due from Jul. 6, 2015 4,995,850 4,999,3527,000,000 0.0% due from Jul. 10, 2015 6,994,890 6,998,3585,700,000 0.0% due from Jul. 15, 2015 5,695,554 5,697,9255,000,000 0.0% due from Jul. 17, 2015 4,997,300 4,997,9438,100,000 0.0% due from Jul. 22, 2015 8,093,682 8,095,5776,000,000 0.0% due from Jul. 27, 2015 5,995,140 5,995,9243,000,000 0.0% due from Aug. 4, 2015 2,997,180 2,997,337
The accompanying notes are an integral part of the financial statements.
13

Scotia Money Market Fund (Unaudited – Continued)
SCHEDULE OF INVESTMENT PORTFOLIO
FaceValue ($) Issuer
AverageCost ($)
CarryingValue ($)
MONEY MARKET INSTRUMENTS (cont’d)Commercial Paper (cont’d)
Omers Finance Trust900,000 0.0% due from Jul. 2, 2015 898,119 899,979
20,000,000 0.0% due from Jul. 13, 2015 19,986,000 19,999,7609,500,000 0.0% due from Jul. 23, 2015 9,481,000 9,495,195
13,837,000 0.0% due from Aug. 5, 2015 13,808,081 13,825,87828,050,000 0.0% due from Aug. 7, 2015 27,993,339 28,026,177
Wells Fargo Financial Canada Corporation4,000,000 0.0% due from Aug. 11, 2015 3,983,720 3,996,3335,000,000 0.0% due from Nov. 6, 2015 4,936,000 4,977,495
10,000,000 0.0% due from Nov. 9, 2015 9,872,350 9,953,93310,000,000 0.0% due from Dec. 8, 2015 9,915,600 9,956,9943,000,000 0.0% due from Dec. 3, 2015 2,974,320 2,986,875
503,625,358 504,211,126
TOTAL INVESTMENT PORTFOLIO 1,480,654,335 1,486,298,332
OTHER ASSETS, LESS LIABILITIES – 0.0% (185,403)
NET ASSETS – 100.0% 1,486,112,929
Instruments with a 0.00% stated interest rate are purchased at a discount to face value. Thediscount represents the implied effective interest.
The accompanying notes are an integral part of the financial statements.
14

Scotia Money Market Fund (Unaudited)
FUND SPECIFIC NOTESFor the periods indicated in Note 1.
1. The Fund (note 1)
The Fund’s investment objective is to provide income andliquidity, while maintaining a high level of safety. It investsprimarily in high quality, short-term fixed income securitiesissued by Canadian federal, provincial and municipalgovernments, Canadian chartered banks, trust companies,and corporations.
2. Risks associated with financial instruments (note 4)
i) Interest rate risk
The majority of the Fund’s financial assets and liabilitieswere invested with term to maturity of less than 1 year as atJune 30, 2015 and December 31, 2014. Accordingly, theFund is not directly subject to significant risk due tofluctuations in the prevailing levels of market interest ratessince the securities are usually held to maturity.
ii) Currency risk
The Fund did not have significant currency risk exposureas at June 30, 2015 or December 31, 2014.
iii) Price risk
The Fund did not have significant price risk exposure toequities, derivatives or commodities, if applicable, as atJune 30, 2015 or December 31, 2014.
iv) Credit risk
The table below summarizes the credit ratings of the moneymarket instruments, excluding cash, held by the Fund.
June 30, 2015 December 31, 2014
Credit ratings
Percentage oftotal money
marketinstruments
(%)
Percentage ofnet assets
(%)
Percentage oftotal money
marketinstruments
(%)
Percentage ofnet assets
(%)
Short-Term RatingR1-High 10.6 10.6 26.7 26.7R1-Middle 6.2 6.2 3.6 3.6R1-Low 19.4 19.4 12.8 12.8NOT RATED 2.6 2.6 – –
Bond Credit RatingAAA 9.5 9.5 9.2 9.2AA 33.9 33.9 29.0 29.0A 17.8 17.8 18.7 18.7
100.0 100.0 100.0 100.0
v) Liquidity risk
The table below summarizes the Fund’s financial liabilitiesbased on the remaining period to the contractual maturitydate.
June 30, 2015 December 31, 2014
On demand($)
Less than3 months
($)On demand
($)
Less than3 months
($)
Current liabilities – 333,295 – 3,510Liability for written options – – – –Unrealized loss on derivatives – – – –Redeemable units 1,486,112,929 – 1,498,445,914 –
1,486,112,929 333,295 1,498,445,914 3,510
Redeemable units are redeemable on demand at theholder’s option. However, the Manager does not expect thatthe contractual maturity disclosed in the table above will berepresentative of the actual cash outflows, as holders ofthese instruments typically retain them for a longer term.
vi) Concentration risk
Concentration risk arises as a result of the concentration ofexposures within the same category, geographical location,asset type or industry sector, as applicable. The table belowis a summary of the Fund’s concentration risk:
Percentage of net assets (%)
June 30, 2015 December 31, 2014
Bankers’ Acceptances 2.1 1.6Bearers’ Deposit Notes 1.9 2.1Commercial Paper 33.9 22.9Promissory Notes 0.9 2.0Short-Term Bonds 61.2 56.9Treasury Bills – 14.5
vii) Fair value classification (note 2)
The tables below illustrate the classification of the Fund’sfinancial instruments within the fair value hierarchy.
June 30, 2015Level 1
($)Level 2
($)Level 3
($)Total($)
Bonds and debentures – 909,770,218 – 909,770,218Money market instruments – 576,528,114 – 576,528,114
– 1,486,298,332 – 1,486,298,332
December 31, 2014Level 1
($)Level 2
($)Level 3
($)Total($)
Bonds and debentures – 851,951,566 – 851,951,566Money market instruments – 646,359,081 – 646,359,081
– 1,498,310,647 – 1,498,310,647
The accompanying notes are an integral part of the financial statements.
15
Scotia Money Market Fund (Unaudited – Continued)
FUND SPECIFIC NOTESFor the periods indicated in Note 1.
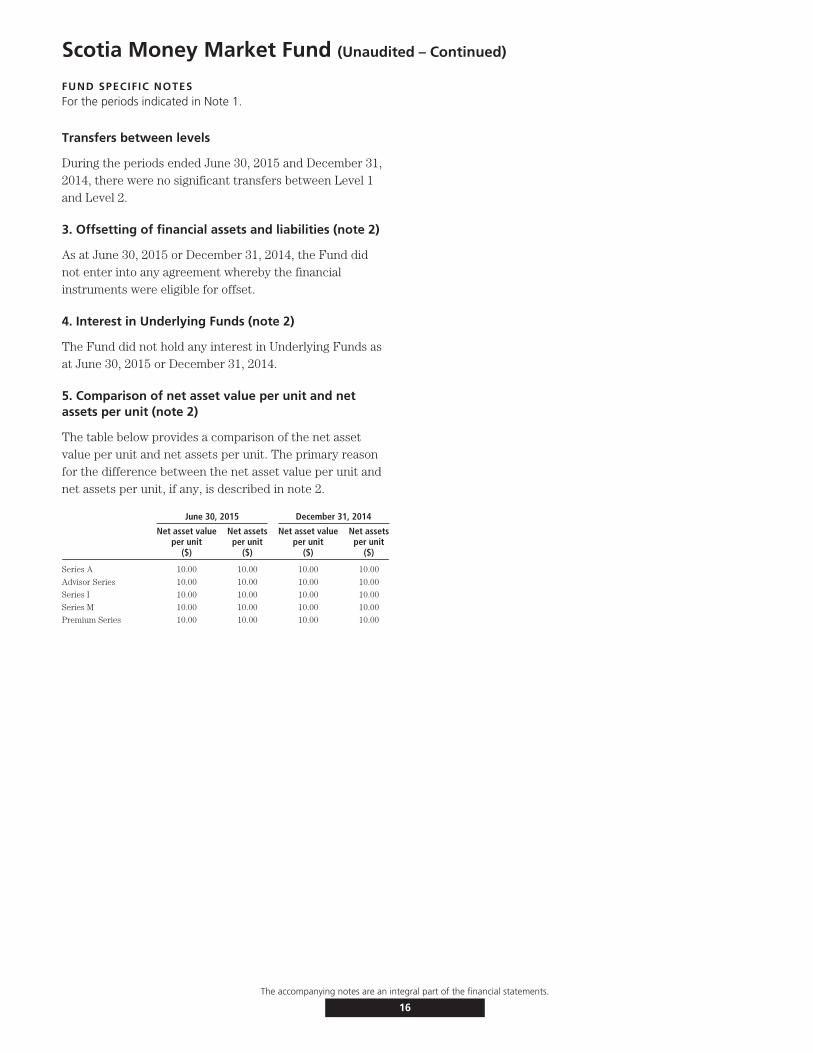
Transfers between levels
During the periods ended June 30, 2015 and December 31,2014, there were no significant transfers between Level 1and Level 2.
3. Offsetting of financial assets and liabilities (note 2)
As at June 30, 2015 or December 31, 2014, the Fund didnot enter into any agreement whereby the financialinstruments were eligible for offset.
4. Interest in Underlying Funds (note 2)
The Fund did not hold any interest in Underlying Funds asat June 30, 2015 or December 31, 2014.
5. Comparison of net asset value per unit and netassets per unit (note 2)
The table below provides a comparison of the net assetvalue per unit and net assets per unit. The primary reasonfor the difference between the net asset value per unit andnet assets per unit, if any, is described in note 2.
June 30, 2015 December 31, 2014
Net asset valueper unit
($)
Net assetsper unit
($)
Net asset valueper unit
($)
Net assetsper unit
($)
Series A 10.00 10.00 10.00 10.00
Advisor Series 10.00 10.00 10.00 10.00
Series I 10.00 10.00 10.00 10.00
Series M 10.00 10.00 10.00 10.00
Premium Series 10.00 10.00 10.00 10.00
The accompanying notes are an integral part of the financial statements.
16

Scotia U.S.$ Money Market Fund (Unaudited)
STATEMENTS OF FINANCIAL POSITIONAs at
June 30,2015
December 31,2014
U.S. $ U.S. $ASSETSCurrent assetsInvestments
Non-derivative financial assets $65,454,878 $64,704,404Cash 100,004 97,823Subscriptions receivable – 6,221,310Accrued investment income and other 174,677 174,670
65,729,559 71,198,207
LIABILITIESCurrent liabilitiesManagement fee payable 12,482 –Redemptions payable – 7,239Distributions payable 70 –
12,552 7,239
Net assets attributable to holders of redeemable units $65,717,007 $71,190,968
NET ASSETS ATTRIBUTABLE TO HOLDERS OF REDEEMABLE UNITSPER SERIES
Series A $65,717,007 $71,190,968
NET ASSETS ATTRIBUTABLE TO HOLDERS OF REDEEMABLE UNITSPER UNIT
Series A $ 10.00 $ 10.00
STATEMENTS OF COMPREHENSIVE INCOMEFor the six month periods ended June 30,
2015 2014U.S. $ U.S. $
INCOMENet gain (loss) on investments (note 2)
Interest for distribution purposes $ 86,668 $ 79,994
EXPENSESManagement fees (note 5) 323,447 329,863Independent Review Committee fees 57 98Audit fees 556 742Custodian fees 1,579 1,859Filing fees 9,407 5,845Legal fees 150 209Unitholder administration costs 11,823 12,598Unitholder reporting costs 3,147 3,325Harmonized Sales Tax/Goods and Services Tax 7,717 7,391
Total expenses 357,883 361,930Expenses absorbed by the Manager (287,315) (298,587)
Net expenses 70,568 63,343
Increase (decrease) in net assets attributable to holders of redeemable unitsfrom operations $ 16,100 $ 16,651
INCREASE (DECREASE) IN NET ASSETS ATTRIBUTABLE TO HOLDERS OFREDEEMABLE UNITS FROM OPERATIONS PER SERIES
Series A $ 16,100 16,651
INCREASE (DECREASE) IN NET ASSETS ATTRIBUTABLE TO HOLDERS OFREDEEMABLE UNITS FROM OPERATIONS PER UNIT†
Series A $ 0.00 $ 0.00
WEIGHTED AVERAGE NUMBER OF UNITS PER SERIESSeries A 6,522,580 6,651,942
† The increase (decrease) in net assets attributable to holders of redeemable units fromoperations per unit is calculated by dividing the increase (decrease) in net assetsattributable to holders of redeemable units from operations per series by the weightedaverage number of units per series.
STATEMENTS OF CHANGES IN NET ASSETSATTRIBUTABLE TO HOLDERS OF REDEEMABLE UNITSFor the six month periods ended June 30,
2015 2014U.S. $ U.S. $
NET ASSETS ATTRIBUTABLE TO HOLDERS OF REDEEMABLE UNITS,BEGINNING OF PERIOD
Series A $ 71,190,968 $ 69,516,949
INCREASE (DECREASE) IN NET ASSETS ATTRIBUTABLE TO HOLDERS OFREDEEMABLE UNITS FROM OPERATIONS
Series A 16,100 16,651
DISTRIBUTIONS TO HOLDERS OF REDEEMABLE UNITSFrom net investment income
Series A (16,100) (16,651)
REDEEMABLE UNIT TRANSACTIONSProceeds from issue
Series A 16,633,041 19,170,644Reinvested distributions
Series A 16,179 16,651Payments on redemption
Series A (22,123,181) (24,729,755)
(5,473,961) (5,542,460)
INCREASE (DECREASE) IN NET ASSETS ATTRIBUTABLE TO HOLDERS OFREDEEMABLE UNITS
Series A (5,473,961) (5,542,460)
NET ASSETS ATTRIBUTABLE TO HOLDERS OF REDEEMABLE UNITS,END OF PERIOD
Series A $ 65,717,007 $ 63,974,489
STATEMENTS OF CASH FLOWSFor the six month periods ended June 30,
2015 2014U.S. $ U.S. $
CASH FLOWS FROM OPERATING ACTIVITIESIncrease (decrease) in net assets attributable to holders of
redeemable units $ 16,100 $ 16,651Adjustments for:
Purchases of non-derivative financial assets (197,845,021) (146,302,161)Proceeds from sale of non-derivative financial assets 197,094,547 151,791,869Accrued investment income and other (7) 1,157Accrued expenses 12,482 9,019
Net cash provided by (used in) operating activities (721,899) 5,516,535CASH FLOWS FROM FINANCING ACTIVITIESProceeds from issue of redeemable units 22,854,351 19,170,710Amounts paid on redemption of redeemable units (22,130,420) (24,729,755)Distributions to unitholders of redeemable units 149 (61)
Net cash provided by (used in) financing activities 724,080 (5,559,106)Net increase (decrease) in cash 2,181 (42,571)Cash (bank overdraft), beginning of period 97,823 103,275
CASH (BANK OVERDRAFT), END OF PERIOD $ 100,004 $ 60,704
Interest received(1) 11,079 126,585
(1) Classified as operating items.
The accompanying notes are an integral part of the financial statements.
17
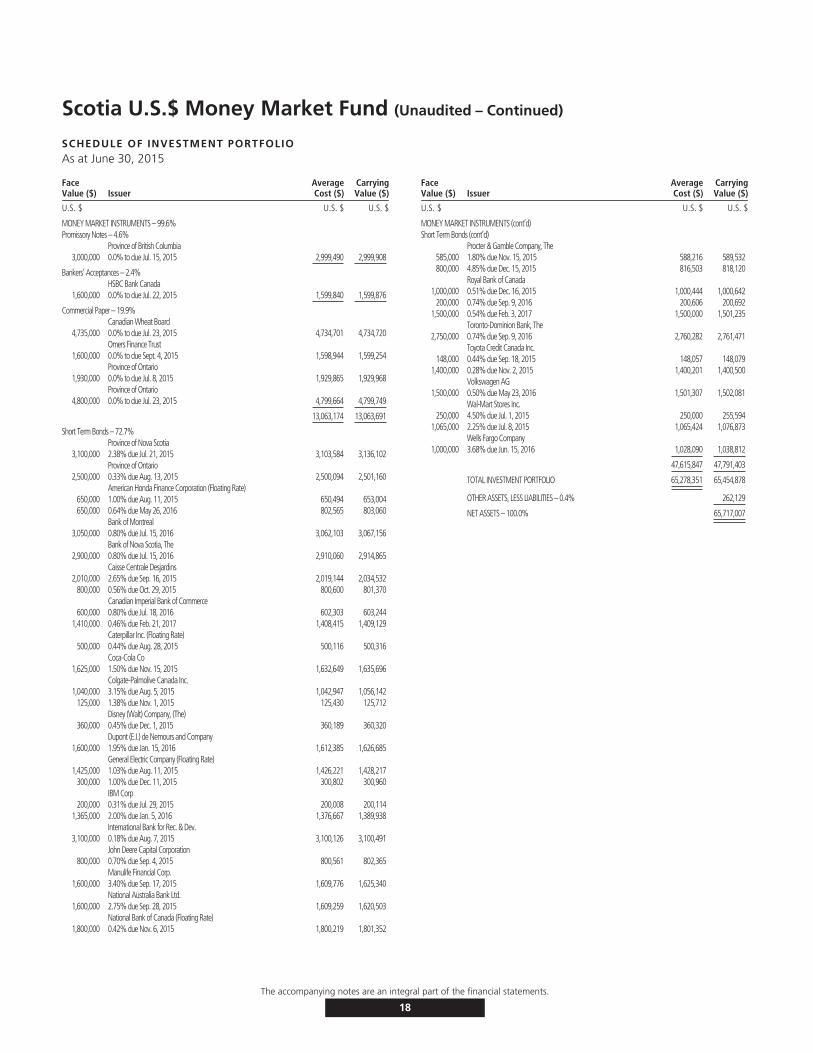
Scotia U.S.$ Money Market Fund (Unaudited – Continued)
SCHEDULE OF INVESTMENT PORTFOLIOAs at June 30, 2015
FaceValue ($) Issuer
AverageCost ($)
CarryingValue ($)
U.S. $ U.S. $ U.S. $
MONEY MARKET INSTRUMENTS – 99.6%Promissory Notes – 4.6%
Province of British Columbia3,000,000 0.0% to due Jul. 15, 2015 2,999,490 2,999,908
Bankers’ Acceptances – 2.4%HSBC Bank Canada
1,600,000 0.0% to due Jul. 22, 2015 1,599,840 1,599,876
Commercial Paper – 19.9%Canadian Wheat Board
4,735,000 0.0% to due Jul. 23, 2015 4,734,701 4,734,720Omers Finance Trust
1,600,000 0.0% to due Sept. 4, 2015 1,598,944 1,599,254Province of Ontario
1,930,000 0.0% to due Jul. 8, 2015 1,929,865 1,929,968Province of Ontario
4,800,000 0.0% to due Jul. 23, 2015 4,799,664 4,799,749
13,063,174 13,063,691
Short Term Bonds – 72.7%Province of Nova Scotia
3,100,000 2.38% due Jul. 21, 2015 3,103,584 3,136,102Province of Ontario
2,500,000 0.33% due Aug. 13, 2015 2,500,094 2,501,160American Honda Finance Corporation (Floating Rate)
650,000 1.00% due Aug. 11, 2015 650,494 653,004650,000 0.64% due May 26, 2016 802,565 803,060
Bank of Montreal3,050,000 0.80% due Jul. 15, 2016 3,062,103 3,067,156
Bank of Nova Scotia, The2,900,000 0.80% due Jul. 15, 2016 2,910,060 2,914,865
Caisse Centrale Desjardins2,010,000 2.65% due Sep. 16, 2015 2,019,144 2,034,532
800,000 0.56% due Oct. 29, 2015 800,600 801,370Canadian Imperial Bank of Commerce
600,000 0.80% due Jul. 18, 2016 602,303 603,2441,410,000 0.46% due Feb. 21, 2017 1,408,415 1,409,129
Caterpillar Inc. (Floating Rate)500,000 0.44% due Aug. 28, 2015 500,116 500,316
Coca-Cola Co1,625,000 1.50% due Nov. 15, 2015 1,632,649 1,635,696
Colgate-Palmolive Canada Inc.1,040,000 3.15% due Aug. 5, 2015 1,042,947 1,056,142
125,000 1.38% due Nov. 1, 2015 125,430 125,712Disney (Walt) Company, (The)
360,000 0.45% due Dec. 1, 2015 360,189 360,320Dupont (E.I.) de Nemours and Company
1,600,000 1.95% due Jan. 15, 2016 1,612,385 1,626,685General Electric Company (Floating Rate)
1,425,000 1.03% due Aug. 11, 2015 1,426,221 1,428,217300,000 1.00% due Dec. 11, 2015 300,802 300,960
IBM Corp200,000 0.31% due Jul. 29, 2015 200,008 200,114
1,365,000 2.00% due Jan. 5, 2016 1,376,667 1,389,938International Bank for Rec. & Dev.
3,100,000 0.18% due Aug. 7, 2015 3,100,126 3,100,491John Deere Capital Corporation
800,000 0.70% due Sep. 4, 2015 800,561 802,365Manulife Financial Corp.
1,600,000 3.40% due Sep. 17, 2015 1,609,776 1,625,340National Australia Bank Ltd.
1,600,000 2.75% due Sep. 28, 2015 1,609,259 1,620,503National Bank of Canada (Floating Rate)
1,800,000 0.42% due Nov. 6, 2015 1,800,219 1,801,352
FaceValue ($) Issuer
AverageCost ($)
CarryingValue ($)
U.S. $ U.S. $ U.S. $
MONEY MARKET INSTRUMENTS (cont’d)Short Term Bonds (cont’d)
Procter & Gamble Company, The585,000 1.80% due Nov. 15, 2015 588,216 589,532800,000 4.85% due Dec. 15, 2015 816,503 818,120
Royal Bank of Canada1,000,000 0.51% due Dec. 16, 2015 1,000,444 1,000,642
200,000 0.74% due Sep. 9, 2016 200,606 200,6921,500,000 0.54% due Feb. 3, 2017 1,500,000 1,501,235
Toronto-Dominion Bank, The2,750,000 0.74% due Sep. 9, 2016 2,760,282 2,761,471
Toyota Credit Canada Inc.148,000 0.44% due Sep. 18, 2015 148,057 148,079
1,400,000 0.28% due Nov. 2, 2015 1,400,201 1,400,500Volkswagen AG
1,500,000 0.50% due May 23, 2016 1,501,307 1,502,081Wal-Mart Stores Inc.
250,000 4.50% due Jul. 1, 2015 250,000 255,5941,065,000 2.25% due Jul. 8, 2015 1,065,424 1,076,873
Wells Fargo Company1,000,000 3.68% due Jun. 15, 2016 1,028,090 1,038,812
47,615,847 47,791,403
TOTAL INVESTMENT PORTFOLIO 65,278,351 65,454,878
OTHER ASSETS, LESS LIABILITIES – 0.4% 262,129
NET ASSETS – 100.0% 65,717,007
The accompanying notes are an integral part of the financial statements.
18
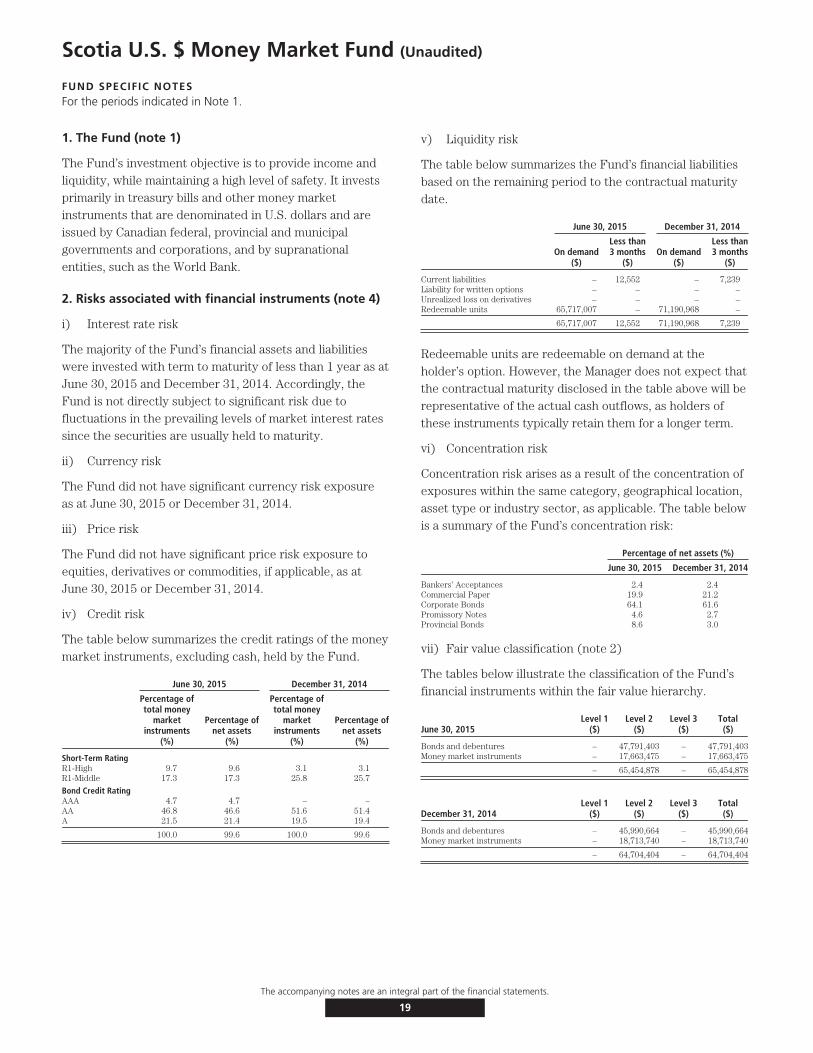
Scotia U.S. $ Money Market Fund (Unaudited)
FUND SPECIFIC NOTESFor the periods indicated in Note 1.
1. The Fund (note 1)
The Fund’s investment objective is to provide income andliquidity, while maintaining a high level of safety. It investsprimarily in treasury bills and other money marketinstruments that are denominated in U.S. dollars and areissued by Canadian federal, provincial and municipalgovernments and corporations, and by supranationalentities, such as the World Bank.
2. Risks associated with financial instruments (note 4)
i) Interest rate risk
The majority of the Fund’s financial assets and liabilitieswere invested with term to maturity of less than 1 year as atJune 30, 2015 and December 31, 2014. Accordingly, theFund is not directly subject to significant risk due tofluctuations in the prevailing levels of market interest ratessince the securities are usually held to maturity.
ii) Currency risk
The Fund did not have significant currency risk exposureas at June 30, 2015 or December 31, 2014.
iii) Price risk
The Fund did not have significant price risk exposure toequities, derivatives or commodities, if applicable, as atJune 30, 2015 or December 31, 2014.
iv) Credit risk
The table below summarizes the credit ratings of the moneymarket instruments, excluding cash, held by the Fund.
June 30, 2015 December 31, 2014
Percentage oftotal money
marketinstruments
(%)
Percentage ofnet assets
(%)
Percentage oftotal money
marketinstruments
(%)
Percentage ofnet assets
(%)
Short-Term RatingR1-High 9.7 9.6 3.1 3.1R1-Middle 17.3 17.3 25.8 25.7
Bond Credit RatingAAA 4.7 4.7 – –AA 46.8 46.6 51.6 51.4A 21.5 21.4 19.5 19.4
100.0 99.6 100.0 99.6
v) Liquidity risk
The table below summarizes the Fund’s financial liabilitiesbased on the remaining period to the contractual maturitydate.
June 30, 2015 December 31, 2014
On demand($)
Less than3 months
($)On demand
($)
Less than3 months
($)
Current liabilities – 12,552 – 7,239Liability for written options – – – –Unrealized loss on derivatives – – – –Redeemable units 65,717,007 – 71,190,968 –
65,717,007 12,552 71,190,968 7,239
Redeemable units are redeemable on demand at theholder’s option. However, the Manager does not expect thatthe contractual maturity disclosed in the table above will berepresentative of the actual cash outflows, as holders ofthese instruments typically retain them for a longer term.
vi) Concentration risk
Concentration risk arises as a result of the concentration ofexposures within the same category, geographical location,asset type or industry sector, as applicable. The table belowis a summary of the Fund’s concentration risk:
Percentage of net assets (%)
June 30, 2015 December 31, 2014
Bankers’ Acceptances 2.4 2.4Commercial Paper 19.9 21.2Corporate Bonds 64.1 61.6Promissory Notes 4.6 2.7Provincial Bonds 8.6 3.0
vii) Fair value classification (note 2)
The tables below illustrate the classification of the Fund’sfinancial instruments within the fair value hierarchy.
June 30, 2015Level 1
($)Level 2
($)Level 3
($)Total($)
Bonds and debentures – 47,791,403 – 47,791,403Money market instruments – 17,663,475 – 17,663,475
– 65,454,878 – 65,454,878
December 31, 2014Level 1
($)Level 2
($)Level 3
($)Total($)
Bonds and debentures – 45,990,664 – 45,990,664Money market instruments – 18,713,740 – 18,713,740
– 64,704,404 – 64,704,404
The accompanying notes are an integral part of the financial statements.
19
Scotia U.S. $ Money Market Fund (Unaudited – Continued)
FUND SPECIFIC NOTESFor the periods indicated in Note 1.
Transfers between levels
During the periods ended June 30, 2015 and December 31,2014, there were no significant transfers between Level 1and Level 2.
3. Offsetting of financial assets and liabilities (note 2)
As at June 30, 2015 or December 31, 2014, the Fund didnot enter into any agreement whereby the financialinstruments were eligible for offset.
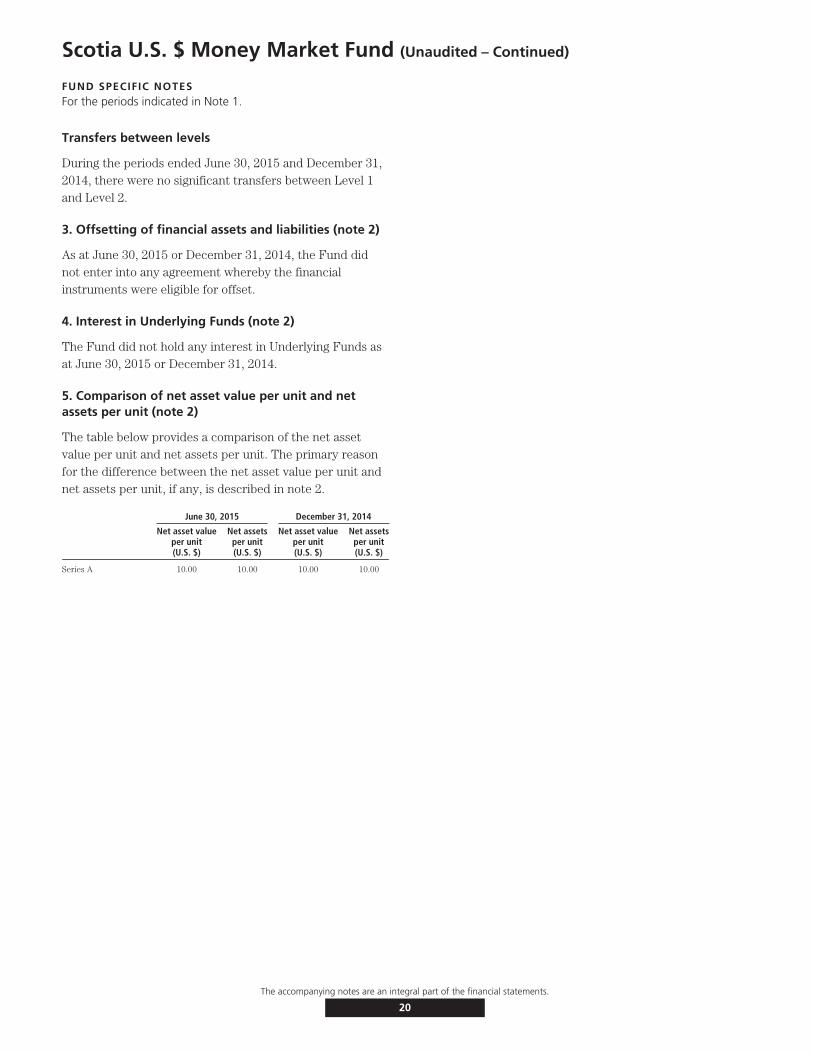
4. Interest in Underlying Funds (note 2)
The Fund did not hold any interest in Underlying Funds asat June 30, 2015 or December 31, 2014.
5. Comparison of net asset value per unit and netassets per unit (note 2)
The table below provides a comparison of the net assetvalue per unit and net assets per unit. The primary reasonfor the difference between the net asset value per unit andnet assets per unit, if any, is described in note 2.
June 30, 2015 December 31, 2014
Net asset valueper unit(U.S. $)
Net assetsper unit(U.S. $)
Net asset valueper unit(U.S. $)
Net assetsper unit(U.S. $)
Series A 10.00 10.00 10.00 10.00
The accompanying notes are an integral part of the financial statements.
20
Scotia Short Term Bond Fund (Unaudited)
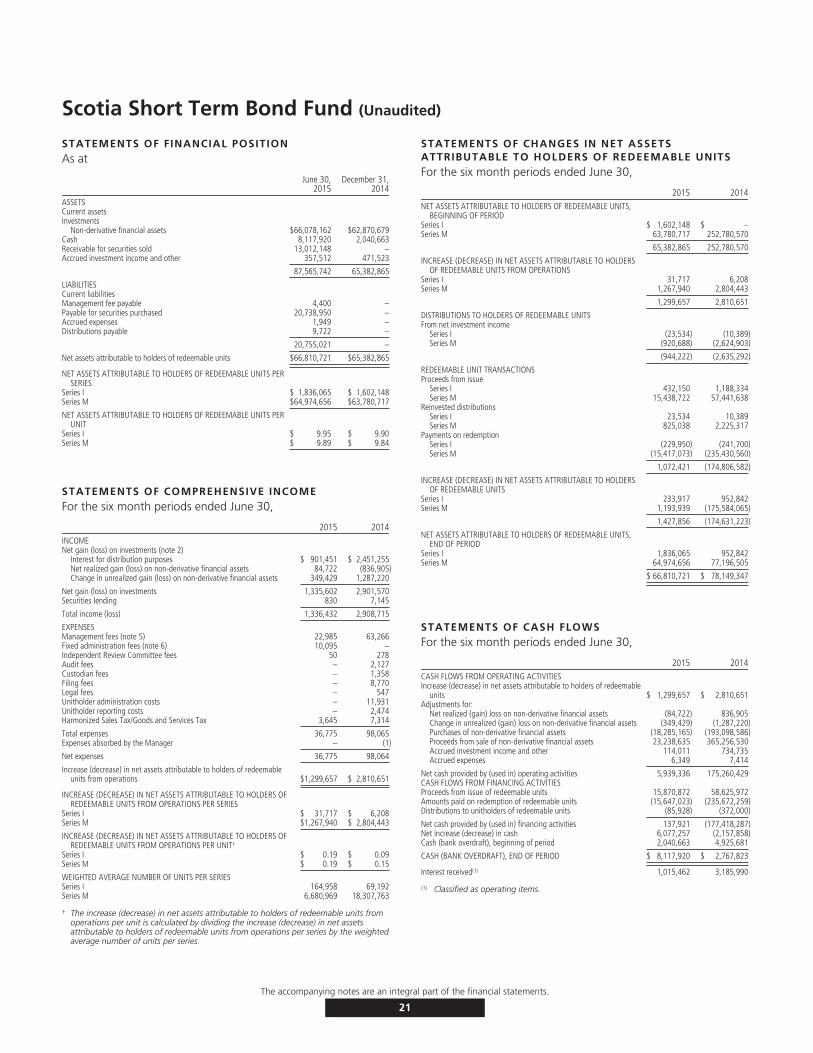
STATEMENTS OF FINANCIAL POSITIONAs at
June 30,2015
December 31,2014
ASSETSCurrent assetsInvestments
Non-derivative financial assets $66,078,162 $62,870,679Cash 8,117,920 2,040,663Receivable for securities sold 13,012,148 –Accrued investment income and other 357,512 471,523
87,565,742 65,382,865
LIABILITIESCurrent liabilitiesManagement fee payable 4,400 –Payable for securities purchased 20,738,950 –Accrued expenses 1,949 –Distributions payable 9,722 –
20,755,021 –
Net assets attributable to holders of redeemable units $66,810,721 $65,382,865
NET ASSETS ATTRIBUTABLE TO HOLDERS OF REDEEMABLE UNITS PERSERIES
Series I $ 1,836,065 $ 1,602,148Series M $64,974,656 $63,780,717
NET ASSETS ATTRIBUTABLE TO HOLDERS OF REDEEMABLE UNITS PERUNIT
Series I $ 9.95 $ 9.90Series M $ 9.89 $ 9.84
STATEMENTS OF COMPREHENSIVE INCOMEFor the six month periods ended June 30,
2015 2014INCOMENet gain (loss) on investments (note 2)
Interest for distribution purposes $ 901,451 $ 2,451,255Net realized gain (loss) on non-derivative financial assets 84,722 (836,905)Change in unrealized gain (loss) on non-derivative financial assets 349,429 1,287,220
Net gain (loss) on investments 1,335,602 2,901,570Securities lending 830 7,145
Total income (loss) 1,336,432 2,908,715
EXPENSESManagement fees (note 5) 22,985 63,266Fixed administration fees (note 6) 10,095 –Independent Review Committee fees 50 278Audit fees – 2,127Custodian fees – 1,358Filing fees – 8,770Legal fees – 547Unitholder administration costs – 11,931Unitholder reporting costs – 2,474Harmonized Sales Tax/Goods and Services Tax 3,645 7,314
Total expenses 36,775 98,065Expenses absorbed by the Manager – (1)
Net expenses 36,775 98,064
Increase (decrease) in net assets attributable to holders of redeemableunits from operations $1,299,657 $ 2,810,651
INCREASE (DECREASE) IN NET ASSETS ATTRIBUTABLE TO HOLDERS OFREDEEMABLE UNITS FROM OPERATIONS PER SERIES
Series I $ 31,717 $ 6,208Series M $1,267,940 $ 2,804,443
INCREASE (DECREASE) IN NET ASSETS ATTRIBUTABLE TO HOLDERS OFREDEEMABLE UNITS FROM OPERATIONS PER UNIT†
Series I $ 0.19 $ 0.09Series M $ 0.19 $ 0.15
WEIGHTED AVERAGE NUMBER OF UNITS PER SERIESSeries I 164,958 69,192Series M 6,680,969 18,307,763
† The increase (decrease) in net assets attributable to holders of redeemable units fromoperations per unit is calculated by dividing the increase (decrease) in net assetsattributable to holders of redeemable units from operations per series by the weightedaverage number of units per series.
STATEMENTS OF CHANGES IN NET ASSETSATTRIBUTABLE TO HOLDERS OF REDEEMABLE UNITSFor the six month periods ended June 30,
2015 2014NET ASSETS ATTRIBUTABLE TO HOLDERS OF REDEEMABLE UNITS,
BEGINNING OF PERIODSeries I $ 1,602,148 $ –Series M 63,780,717 252,780,570
65,382,865 252,780,570
INCREASE (DECREASE) IN NET ASSETS ATTRIBUTABLE TO HOLDERSOF REDEEMABLE UNITS FROM OPERATIONS
Series I 31,717 6,208Series M 1,267,940 2,804,443
1,299,657 2,810,651
DISTRIBUTIONS TO HOLDERS OF REDEEMABLE UNITSFrom net investment income
Series I (23,534) (10,389)Series M (920,688) (2,624,903)
(944,222) (2,635,292)
REDEEMABLE UNIT TRANSACTIONSProceeds from issue
Series I 432,150 1,188,334Series M 15,438,722 57,441,638
Reinvested distributionsSeries I 23,534 10,389Series M 825,038 2,225,317
Payments on redemptionSeries I (229,950) (241,700)Series M (15,417,073) (235,430,560)
1,072,421 (174,806,582)
INCREASE (DECREASE) IN NET ASSETS ATTRIBUTABLE TO HOLDERSOF REDEEMABLE UNITS
Series I 233,917 952,842Series M 1,193,939 (175,584,065)
1,427,856 (174,631,223)
NET ASSETS ATTRIBUTABLE TO HOLDERS OF REDEEMABLE UNITS,END OF PERIOD
Series I 1,836,065 952,842Series M 64,974,656 77,196,505
$ 66,810,721 $ 78,149,347
STATEMENTS OF CASH FLOWSFor the six month periods ended June 30,
2015 2014CASH FLOWS FROM OPERATING ACTIVITIESIncrease (decrease) in net assets attributable to holders of redeemable
units $ 1,299,657 $ 2,810,651Adjustments for:
Net realized (gain) loss on non-derivative financial assets (84,722) 836,905Change in unrealized (gain) loss on non-derivative financial assets (349,429) (1,287,220)Purchases of non-derivative financial assets (18,285,165) (193,098,586)Proceeds from sale of non-derivative financial assets 23,238,635 365,256,530Accrued investment income and other 114,011 734,735Accrued expenses 6,349 7,414
Net cash provided by (used in) operating activities 5,939,336 175,260,429CASH FLOWS FROM FINANCING ACTIVITIESProceeds from issue of redeemable units 15,870,872 58,625,972Amounts paid on redemption of redeemable units (15,647,023) (235,672,259)Distributions to unitholders of redeemable units (85,928) (372,000)
Net cash provided by (used in) financing activities 137,921 (177,418,287)Net increase (decrease) in cash 6,077,257 (2,157,858)Cash (bank overdraft), beginning of period 2,040,663 4,925,681
CASH (BANK OVERDRAFT), END OF PERIOD $ 8,117,920 $ 2,767,823
Interest received(1) 1,015,462 3,185,990
(1) Classified as operating items.
The accompanying notes are an integral part of the financial statements.
21
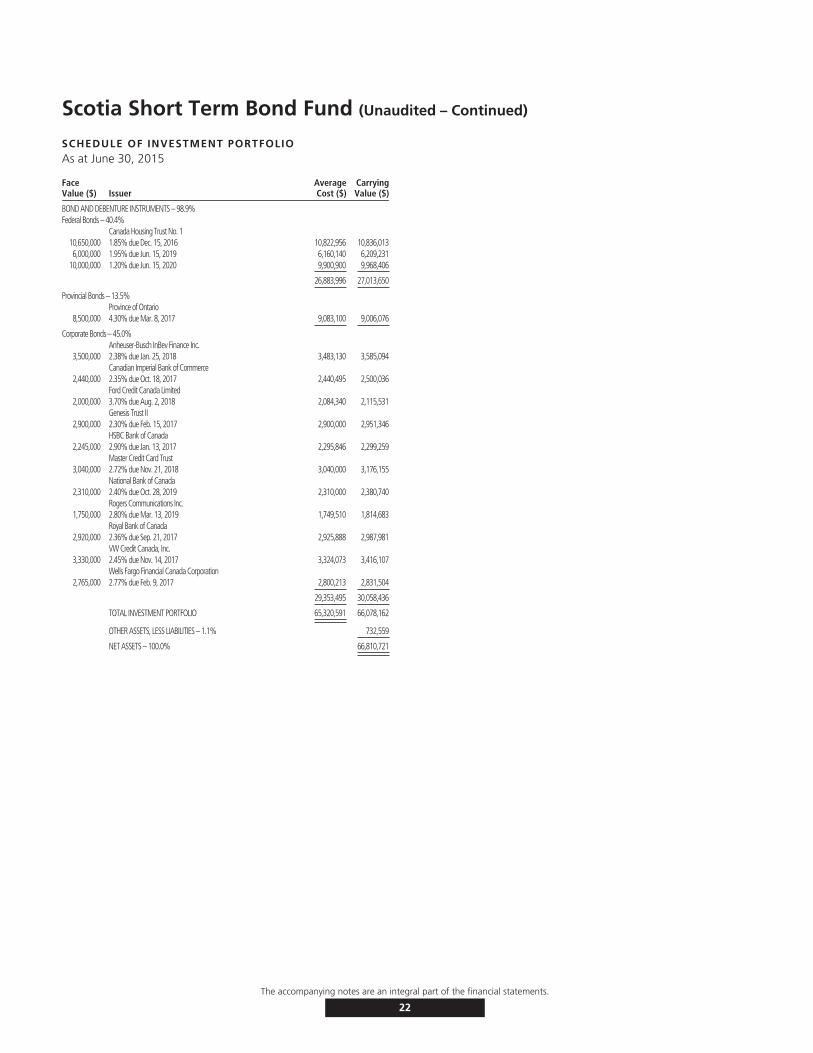
Scotia Short Term Bond Fund (Unaudited – Continued)
SCHEDULE OF INVESTMENT PORTFOLIOAs at June 30, 2015
FaceValue ($) Issuer
AverageCost ($)
CarryingValue ($)
BOND AND DEBENTURE INSTRUMENTS – 98.9%Federal Bonds – 40.4%
Canada Housing Trust No. 110,650,000 1.85% due Dec. 15, 2016 10,822,956 10,836,0136,000,000 1.95% due Jun. 15, 2019 6,160,140 6,209,231
10,000,000 1.20% due Jun. 15, 2020 9,900,900 9,968,406
26,883,996 27,013,650
Provincial Bonds – 13.5%Province of Ontario
8,500,000 4.30% due Mar. 8, 2017 9,083,100 9,006,076
Corporate Bonds – 45.0%Anheuser-Busch InBev Finance Inc.
3,500,000 2.38% due Jan. 25, 2018 3,483,130 3,585,094Canadian Imperial Bank of Commerce
2,440,000 2.35% due Oct. 18, 2017 2,440,495 2,500,036Ford Credit Canada Limited
2,000,000 3.70% due Aug. 2, 2018 2,084,340 2,115,531Genesis Trust II
2,900,000 2.30% due Feb. 15, 2017 2,900,000 2,951,346HSBC Bank of Canada
2,245,000 2.90% due Jan. 13, 2017 2,295,846 2,299,259Master Credit Card Trust
3,040,000 2.72% due Nov. 21, 2018 3,040,000 3,176,155National Bank of Canada
2,310,000 2.40% due Oct. 28, 2019 2,310,000 2,380,740Rogers Communications Inc.
1,750,000 2.80% due Mar. 13, 2019 1,749,510 1,814,683Royal Bank of Canada
2,920,000 2.36% due Sep. 21, 2017 2,925,888 2,987,981VW Credit Canada, Inc.
3,330,000 2.45% due Nov. 14, 2017 3,324,073 3,416,107Wells Fargo Financial Canada Corporation
2,765,000 2.77% due Feb. 9, 2017 2,800,213 2,831,504
29,353,495 30,058,436
TOTAL INVESTMENT PORTFOLIO 65,320,591 66,078,162
OTHER ASSETS, LESS LIABILITIES – 1.1% 732,559
NET ASSETS – 100.0% 66,810,721
The accompanying notes are an integral part of the financial statements.
22
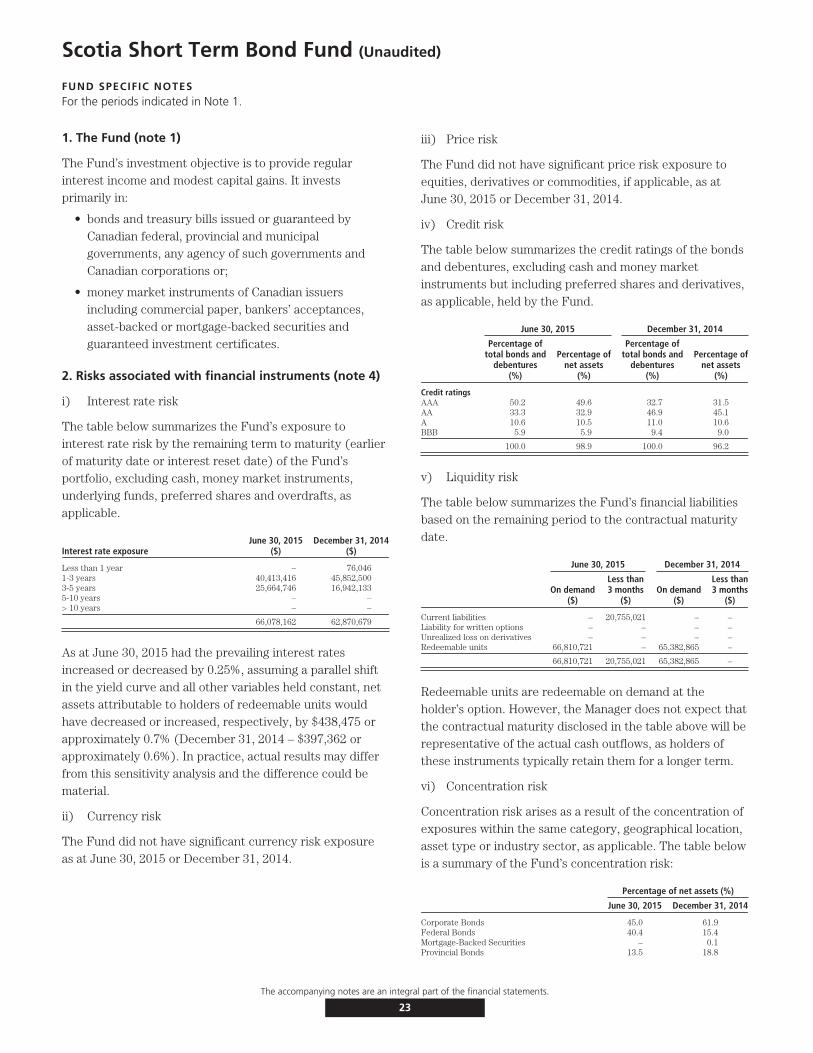
Scotia Short Term Bond Fund (Unaudited)
FUND SPECIFIC NOTESFor the periods indicated in Note 1.
1. The Fund (note 1)
The Fund’s investment objective is to provide regularinterest income and modest capital gains. It investsprimarily in:
• bonds and treasury bills issued or guaranteed byCanadian federal, provincial and municipalgovernments, any agency of such governments andCanadian corporations or;
• money market instruments of Canadian issuersincluding commercial paper, bankers’ acceptances,asset-backed or mortgage-backed securities andguaranteed investment certificates.
2. Risks associated with financial instruments (note 4)
i) Interest rate risk
The table below summarizes the Fund’s exposure tointerest rate risk by the remaining term to maturity (earlierof maturity date or interest reset date) of the Fund’sportfolio, excluding cash, money market instruments,underlying funds, preferred shares and overdrafts, asapplicable.
Interest rate exposureJune 30, 2015
($)December 31, 2014
($)
Less than 1 year – 76,0461-3 years 40,413,416 45,852,5003-5 years 25,664,746 16,942,1335-10 years – –> 10 years – –
66,078,162 62,870,679
As at June 30, 2015 had the prevailing interest ratesincreased or decreased by 0.25%, assuming a parallel shiftin the yield curve and all other variables held constant, netassets attributable to holders of redeemable units wouldhave decreased or increased, respectively, by $438,475 orapproximately 0.7% (December 31, 2014 – $397,362 orapproximately 0.6%). In practice, actual results may differfrom this sensitivity analysis and the difference could bematerial.
ii) Currency risk
The Fund did not have significant currency risk exposureas at June 30, 2015 or December 31, 2014.
iii) Price risk
The Fund did not have significant price risk exposure toequities, derivatives or commodities, if applicable, as atJune 30, 2015 or December 31, 2014.
iv) Credit risk
The table below summarizes the credit ratings of the bondsand debentures, excluding cash and money marketinstruments but including preferred shares and derivatives,as applicable, held by the Fund.
June 30, 2015 December 31, 2014
Percentage oftotal bonds and
debentures(%)
Percentage ofnet assets
(%)
Percentage oftotal bonds and
debentures(%)
Percentage ofnet assets
(%)
Credit ratingsAAA 50.2 49.6 32.7 31.5AA 33.3 32.9 46.9 45.1A 10.6 10.5 11.0 10.6BBB 5.9 5.9 9.4 9.0
100.0 98.9 100.0 96.2
v) Liquidity risk
The table below summarizes the Fund’s financial liabilitiesbased on the remaining period to the contractual maturitydate.
June 30, 2015 December 31, 2014
On demand($)
Less than3 months
($)On demand
($)
Less than3 months
($)
Current liabilities – 20,755,021 – –Liability for written options – – – –Unrealized loss on derivatives – – – –Redeemable units 66,810,721 – 65,382,865 –
66,810,721 20,755,021 65,382,865 –
Redeemable units are redeemable on demand at theholder’s option. However, the Manager does not expect thatthe contractual maturity disclosed in the table above will berepresentative of the actual cash outflows, as holders ofthese instruments typically retain them for a longer term.
vi) Concentration risk
Concentration risk arises as a result of the concentration ofexposures within the same category, geographical location,asset type or industry sector, as applicable. The table belowis a summary of the Fund’s concentration risk:
Percentage of net assets (%)
June 30, 2015 December 31, 2014
Corporate Bonds 45.0 61.9Federal Bonds 40.4 15.4Mortgage-Backed Securities – 0.1Provincial Bonds 13.5 18.8
The accompanying notes are an integral part of the financial statements.
23

Scotia Short Term Bond Fund (Unaudited – Continued)
FUND SPECIFIC NOTESFor the periods indicated in Note 1.
vii) Fair value classification (note 2)
The tables below illustrate the classification of the Fund’sfinancial instruments within the fair value hierarchy.
June 30, 2015Level 1
($)Level 2
($)Level 3
($)Total($)
Bonds and debentures – 66,078,162 – 66,078,162
– 66,078,162 – 66,078,162
December 31, 2014Level 1
($)Level 2
($)Level 3
($)Total($)
Bonds and debentures – 62,870,679 – 62,870,679
– 62,870,679 – 62,870,679
Transfers between levels
During the periods ended June 30, 2015 and December 31,2014, there were no significant transfers between Level 1and Level 2.
3. Offsetting of financial assets and liabilities (note 2)
As at June 30, 2015 or December 31, 2014, the Fund didnot enter into any agreement whereby the financialinstruments were eligible for offset.
4. Interest in Underlying Funds (note 2)
The Fund did not hold any interest in Underlying Funds asat June 30, 2015 or December 31, 2014.
5. Comparison of net asset value per unit and netassets per unit (note 2)
The table below provides a comparison of the net assetvalue per unit and net assets per unit. The primary reasonfor the difference between the net asset value per unit andnet assets per unit, if any, is described in note 2.
June 30, 2015 December 31, 2014
Net asset valueper unit
($)
Net assetsper unit
($)
Net asset valueper unit
($)
Net assetsper unit
($)
Series I 9.95 9.95 9.90 9.90
Series M 9.89 9.89 9.84 9.84
The accompanying notes are an integral part of the financial statements.
24

Scotia Private Short-Mid Government Bond Pool (Unaudited)
STATEMENTS OF FINANCIAL POSITIONAs at
June 30,2015
December 31,2014
ASSETSCurrent assetsInvestments
Non-derivative financial assets $1,441,265,375 $1,569,311,545Cash 50,959,808 65,641,427Margin deposited on futures 2,937,110 677,600Receivable for securities sold 40,155,920 –Subscriptions receivable 2,378,877 2,093,059Accrued investment income and other 2,629,772 3,579,215
1,540,326,862 1,641,302,846
LIABILITIESCurrent liabilitiesManagement fee payable 72,057 –Payable for securities purchased 40,022,950 –Redemptions payable 1,513,752 1,219,293Accrued expenses 29,136 –Distributions payable 385,452 –
42,023,347 1,219,293
Net assets attributable to holders of redeemable units $1,498,303,515 $1,640,083,553
NET ASSETS ATTRIBUTABLE TO HOLDERS OF REDEEMABLE UNITSPER SERIES
Series I $ 429,656,070 $ 481,430,988Series M $1,068,647,445 $1,158,652,565
NET ASSETS ATTRIBUTABLE TO HOLDERS OF REDEEMABLE UNITSPER UNIT
Series I $ 10.63 $ 10.61Series M $ 10.63 $ 10.61
STATEMENTS OF COMPREHENSIVE INCOMEFor the six month periods ended June 30,
2015 2014INCOMENet gain (loss) on investments (note 2)
Interest for distribution purposes $ 21,515,385 $18,454,217Net realized gain (loss) on non-derivative financial assets 997,357 (3,521,914)Net realized gain (loss) on futures contracts (3,827,005) (2,847,418)Change in unrealized gain (loss) on non-derivative financial assets 9,393,367 27,904,274
Net gain (loss) on investments 28,079,104 39,989,159Securities lending 18,924 38,333
Total income (loss) 28,098,028 40,027,492
EXPENSESManagement fees (note 5) 375,337 301,218Fixed administration fees (note 6) 155,461 –Independent Review Committee fees 1,161 1,959Interest expense and bank overdraft charges – 78Audit fees – 14,098Custodian fees – 9,074Filing fees – 15,148Legal fees – 4,229Unitholder administration costs – 87,097Unitholder reporting costs – 5,489Harmonized Sales Tax/Goods and Services Tax 55,624 40,325Transaction costs 10,425 4,306
Total expenses 598,008 483,021
Increase (decrease) in net assets attributable to holders of redeemableunits from operations $ 27,500,020 $39,544,471
INCREASE (DECREASE) IN NET ASSETS ATTRIBUTABLE TO HOLDERS OFREDEEMABLE UNITS FROM OPERATIONS PER SERIES
Series I $ 7,533,107 $14,604,684Series M $ 19,966,913 $24,939,787
INCREASE (DECREASE) IN NET ASSETS ATTRIBUTABLE TO HOLDERS OFREDEEMABLE UNITS FROM OPERATIONS PER UNIT†
Series I $ 0.17 $ 0.33Series M $ 0.20 $ 0.30
WEIGHTED AVERAGE NUMBER OF UNITS PER SERIESSeries I 45,302,891 43,988,879Series M 100,790,574 82,679,409
† The increase (decrease) in net assets attributable to holders of redeemable units fromoperations per unit is calculated by dividing the increase (decrease) in net assetsattributable to holders of redeemable units from operations per series by the weightedaverage number of units per series.
STATEMENTS OF CHANGES IN NET ASSETSATTRIBUTABLE TO HOLDERS OF REDEEMABLE UNITSFor the six month periods ended June 30,
2015 2014NET ASSETS ATTRIBUTABLE TO HOLDERS OF REDEEMABLE
UNITS, BEGINNING OF PERIODSeries I $ 481,430,988 $ 560,942,762Series M 1,158,652,565 734,450,581
1,640,083,553 1,295,393,343
INCREASE (DECREASE) IN NET ASSETS ATTRIBUTABLE TOHOLDERS OF REDEEMABLE UNITS FROM OPERATIONS
Series I 7,533,107 14,604,684Series M 19,966,913 24,939,787
27,500,020 39,544,471
DISTRIBUTIONS TO HOLDERS OF REDEEMABLE UNITSFrom net investment income
Series I (7,281,382) (6,952,699)Series M (15,806,690) (12,616,042)
(23,088,072) (19,568,741)
REDEEMABLE UNIT TRANSACTIONSProceeds from issue
Series I 47,051,197 36,490,450Series M 128,701,597 411,281,390
Reinvested distributionsSeries I 7,281,372 6,952,708Series M 13,351,542 10,789,335
Payments on redemptionSeries I (106,359,212) (170,400,219)Series M (236,218,482) (113,954,978)
(146,191,986) 181,158,686
INCREASE (DECREASE) IN NET ASSETS ATTRIBUTABLE TOHOLDERS OF REDEEMABLE UNITS
Series I (51,774,918) (119,305,076)Series M (90,005,120) 320,439,492
(141,780,038) 201,134,416
NET ASSETS ATTRIBUTABLE TO HOLDERS OF REDEEMABLEUNITS, END OF PERIOD
Series I 429,656,070 441,637,686Series M 1,068,647,445 1,054,890,073
$1,498,303,515 $1,496,527,759
STATEMENTS OF CASH FLOWSFor the six month periods ended June 30,
2015 2014CASH FLOWS FROM OPERATING ACTIVITIESIncrease (decrease) in net assets attributable to holders of
redeemable units $ 27,500,020 $ 39,544,471Adjustments for:
Net realized (gain) loss on non-derivative financial assets (997,357) 3,521,914Change in unrealized (gain) loss on non-derivative financial
assets (9,393,367) (27,904,274)Purchases of non-derivative financial assets (646,365,294) (1,525,109,181)Proceeds from sale of non-derivative financial assets 784,669,218 1,387,721,238Margin deposited on futures (2,259,510) 400,893Accrued investment income and other 949,443 1,236,785Accrued expenses 101,193 90,798
Net cash provided by (used in) operating activities 154,204,346 (120,497,356)CASH FLOWS FROM FINANCING ACTIVITIESProceeds from issue of redeemable units 175,466,976 443,523,168Amounts paid on redemption of redeemable units (342,283,235) (282,086,825)Distributions to unitholders of redeemable units (2,069,706) (1,446,727)
Net cash provided by (used in) financing activities (168,885,965) 159,989,616Net increase (decrease) in cash (14,681,619) 39,492,260Cash (bank overdraft), beginning of period 65,641,427 56,635
CASH (BANK OVERDRAFT), END OF PERIOD $ 50,959,808 $ 39,548,895
Interest received(1) 22,464,830 19,691,002
(1) Classified as operating items.
The accompanying notes are an integral part of the financial statements.
25
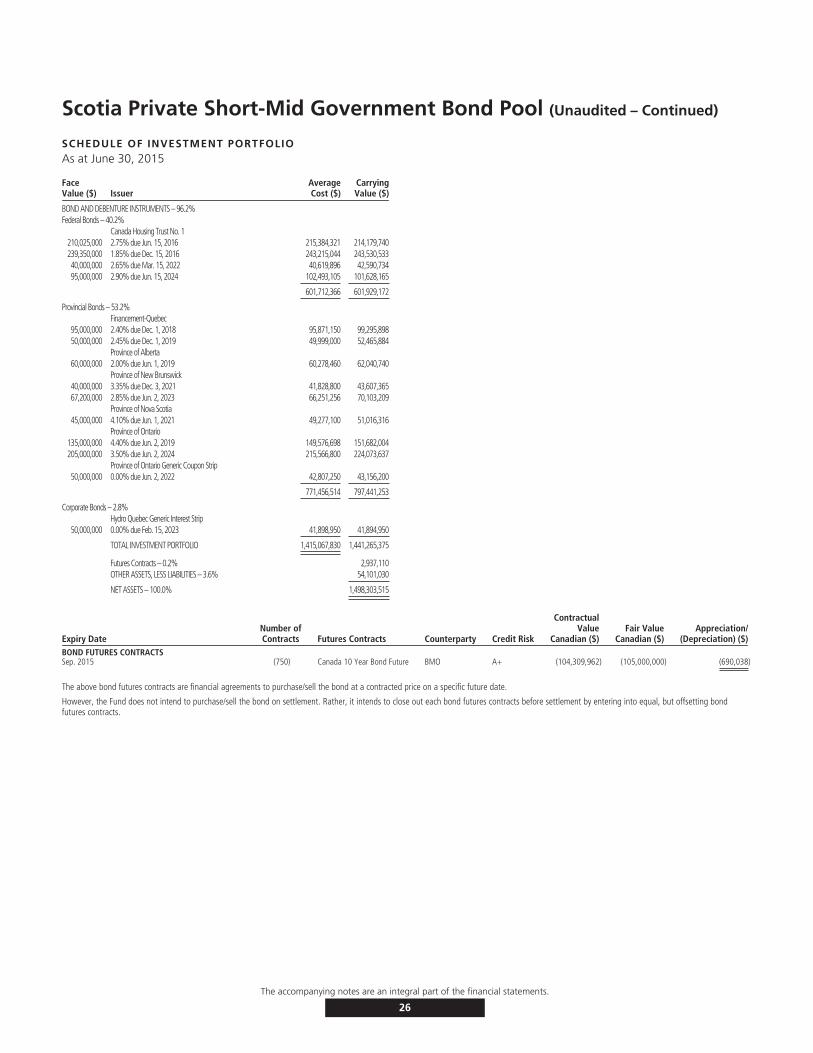
Scotia Private Short-Mid Government Bond Pool (Unaudited – Continued)
SCHEDULE OF INVESTMENT PORTFOLIOAs at June 30, 2015
FaceValue ($) Issuer
AverageCost ($)
CarryingValue ($)
BOND AND DEBENTURE INSTRUMENTS – 96.2%Federal Bonds – 40.2%
Canada Housing Trust No. 1210,025,000 2.75% due Jun. 15, 2016 215,384,321 214,179,740239,350,000 1.85% due Dec. 15, 2016 243,215,044 243,530,53340,000,000 2.65% due Mar. 15, 2022 40,619,896 42,590,73495,000,000 2.90% due Jun. 15, 2024 102,493,105 101,628,165
601,712,366 601,929,172
Provincial Bonds – 53.2%Financement-Quebec
95,000,000 2.40% due Dec. 1, 2018 95,871,150 99,295,89850,000,000 2.45% due Dec. 1, 2019 49,999,000 52,465,884
Province of Alberta60,000,000 2.00% due Jun. 1, 2019 60,278,460 62,040,740
Province of New Brunswick40,000,000 3.35% due Dec. 3, 2021 41,828,800 43,607,36567,200,000 2.85% due Jun. 2, 2023 66,251,256 70,103,209
Province of Nova Scotia45,000,000 4.10% due Jun. 1, 2021 49,277,100 51,016,316
Province of Ontario135,000,000 4.40% due Jun. 2, 2019 149,576,698 151,682,004205,000,000 3.50% due Jun. 2, 2024 215,566,800 224,073,637
Province of Ontario Generic Coupon Strip50,000,000 0.00% due Jun. 2, 2022 42,807,250 43,156,200
771,456,514 797,441,253
Corporate Bonds – 2.8%Hydro Quebec Generic Interest Strip
50,000,000 0.00% due Feb. 15, 2023 41,898,950 41,894,950
TOTAL INVESTMENT PORTFOLIO 1,415,067,830 1,441,265,375
Futures Contracts – 0.2% 2,937,110OTHER ASSETS, LESS LIABILITIES – 3.6% 54,101,030
NET ASSETS – 100.0% 1,498,303,515
Expiry DateNumber ofContracts Futures Contracts Counterparty Credit Risk
ContractualValue
Canadian ($)Fair Value
Canadian ($)Appreciation/
(Depreciation) ($)BOND FUTURES CONTRACTSSep. 2015 (750) Canada 10 Year Bond Future BMO A+ (104,309,962) (105,000,000) (690,038)
The above bond futures contracts are financial agreements to purchase/sell the bond at a contracted price on a specific future date.
However, the Fund does not intend to purchase/sell the bond on settlement. Rather, it intends to close out each bond futures contracts before settlement by entering into equal, but offsetting bondfutures contracts.
The accompanying notes are an integral part of the financial statements.
26
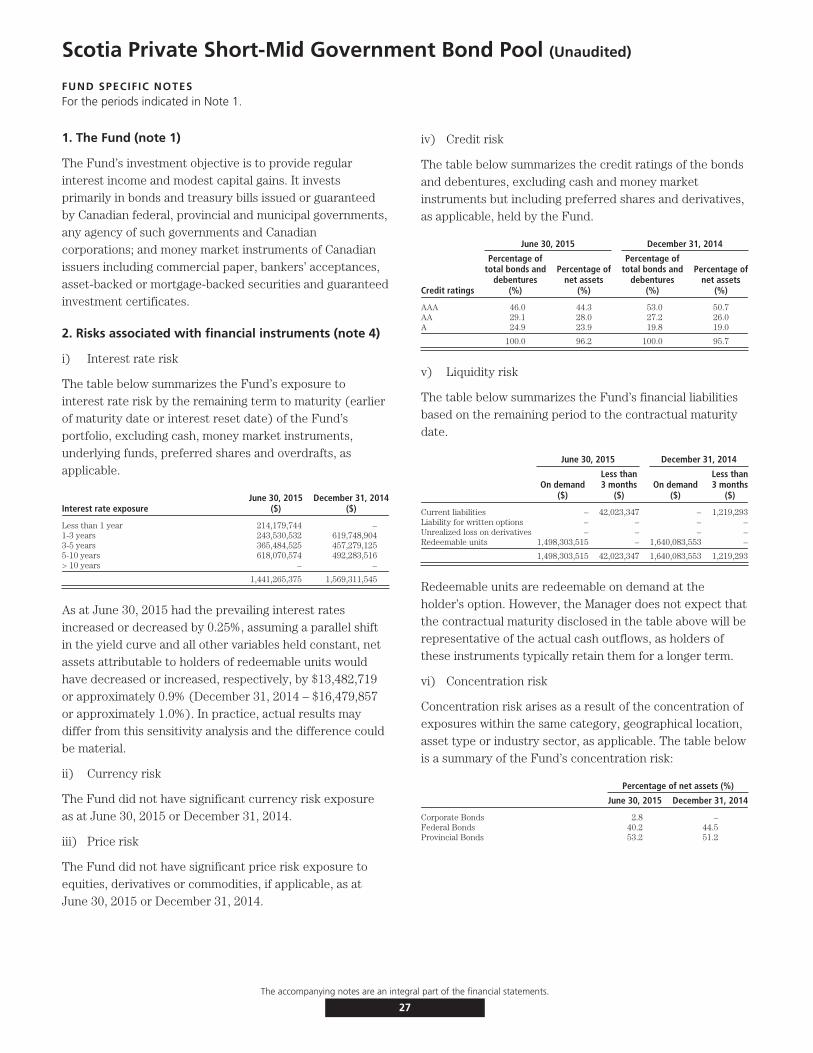
Scotia Private Short-Mid Government Bond Pool (Unaudited)
FUND SPECIFIC NOTESFor the periods indicated in Note 1.
1. The Fund (note 1)
The Fund’s investment objective is to provide regularinterest income and modest capital gains. It investsprimarily in bonds and treasury bills issued or guaranteedby Canadian federal, provincial and municipal governments,any agency of such governments and Canadiancorporations; and money market instruments of Canadianissuers including commercial paper, bankers’ acceptances,asset-backed or mortgage-backed securities and guaranteedinvestment certificates.
2. Risks associated with financial instruments (note 4)
i) Interest rate risk
The table below summarizes the Fund’s exposure tointerest rate risk by the remaining term to maturity (earlierof maturity date or interest reset date) of the Fund’sportfolio, excluding cash, money market instruments,underlying funds, preferred shares and overdrafts, asapplicable.
Interest rate exposureJune 30, 2015
($)December 31, 2014
($)
Less than 1 year 214,179,744 –1-3 years 243,530,532 619,748,9043-5 years 365,484,525 457,279,1255-10 years 618,070,574 492,283,516> 10 years – –
1,441,265,375 1,569,311,545
As at June 30, 2015 had the prevailing interest ratesincreased or decreased by 0.25%, assuming a parallel shiftin the yield curve and all other variables held constant, netassets attributable to holders of redeemable units wouldhave decreased or increased, respectively, by $13,482,719or approximately 0.9% (December 31, 2014 – $16,479,857or approximately 1.0%). In practice, actual results maydiffer from this sensitivity analysis and the difference couldbe material.
ii) Currency risk
The Fund did not have significant currency risk exposureas at June 30, 2015 or December 31, 2014.
iii) Price risk
The Fund did not have significant price risk exposure toequities, derivatives or commodities, if applicable, as atJune 30, 2015 or December 31, 2014.
iv) Credit risk
The table below summarizes the credit ratings of the bondsand debentures, excluding cash and money marketinstruments but including preferred shares and derivatives,as applicable, held by the Fund.
June 30, 2015 December 31, 2014
Credit ratings
Percentage oftotal bonds and
debentures(%)
Percentage ofnet assets
(%)
Percentage oftotal bonds and
debentures(%)
Percentage ofnet assets
(%)
AAA 46.0 44.3 53.0 50.7AA 29.1 28.0 27.2 26.0A 24.9 23.9 19.8 19.0
100.0 96.2 100.0 95.7
v) Liquidity risk
The table below summarizes the Fund’s financial liabilitiesbased on the remaining period to the contractual maturitydate.
June 30, 2015 December 31, 2014
On demand($)
Less than3 months
($)On demand
($)
Less than3 months
($)
Current liabilities – 42,023,347 – 1,219,293Liability for written options – – – –Unrealized loss on derivatives – – – –Redeemable units 1,498,303,515 – 1,640,083,553 –
1,498,303,515 42,023,347 1,640,083,553 1,219,293
Redeemable units are redeemable on demand at theholder’s option. However, the Manager does not expect thatthe contractual maturity disclosed in the table above will berepresentative of the actual cash outflows, as holders ofthese instruments typically retain them for a longer term.
vi) Concentration risk
Concentration risk arises as a result of the concentration ofexposures within the same category, geographical location,asset type or industry sector, as applicable. The table belowis a summary of the Fund’s concentration risk:
Percentage of net assets (%)
June 30, 2015 December 31, 2014
Corporate Bonds 2.8 –Federal Bonds 40.2 44.5Provincial Bonds 53.2 51.2
The accompanying notes are an integral part of the financial statements.
27
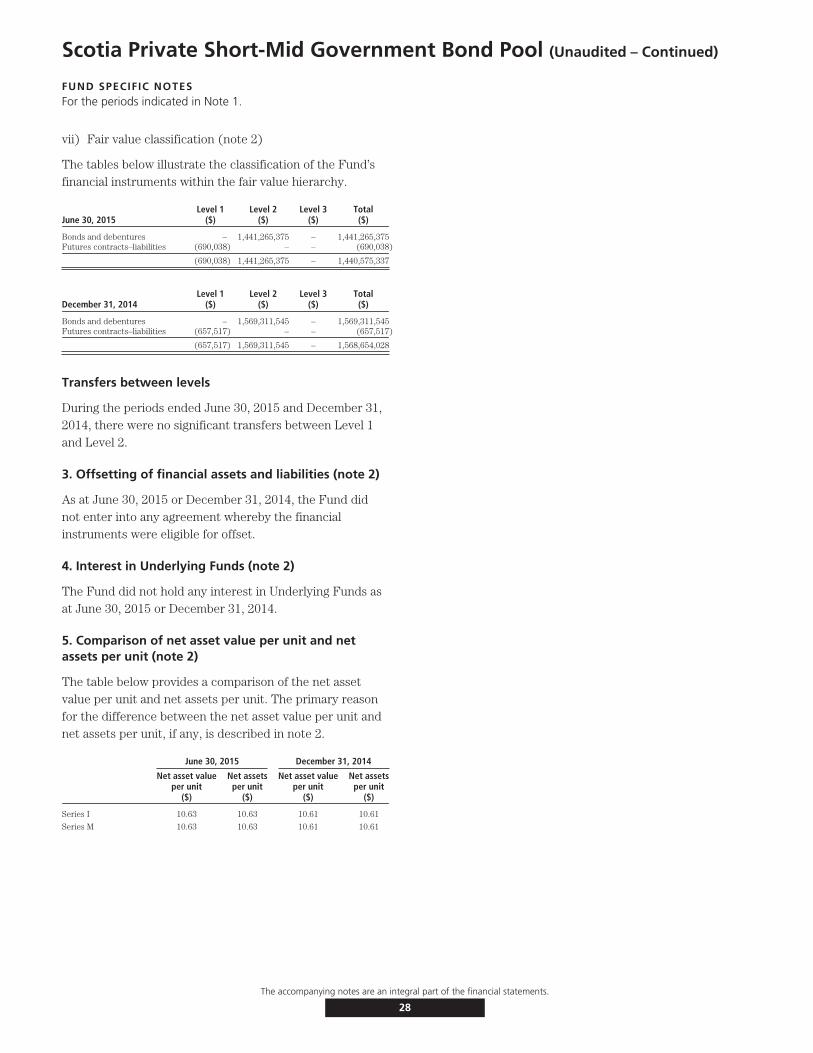
Scotia Private Short-Mid Government Bond Pool (Unaudited – Continued)
FUND SPECIFIC NOTESFor the periods indicated in Note 1.
vii) Fair value classification (note 2)
The tables below illustrate the classification of the Fund’sfinancial instruments within the fair value hierarchy.
June 30, 2015Level 1
($)Level 2
($)Level 3
($)Total($)
Bonds and debentures – 1,441,265,375 – 1,441,265,375Futures contracts–liabilities (690,038) – – (690,038)
(690,038) 1,441,265,375 – 1,440,575,337
December 31, 2014Level 1
($)Level 2
($)Level 3
($)Total($)
Bonds and debentures – 1,569,311,545 – 1,569,311,545Futures contracts–liabilities (657,517) – – (657,517)
(657,517) 1,569,311,545 – 1,568,654,028
Transfers between levels
During the periods ended June 30, 2015 and December 31,2014, there were no significant transfers between Level 1and Level 2.
3. Offsetting of financial assets and liabilities (note 2)
As at June 30, 2015 or December 31, 2014, the Fund didnot enter into any agreement whereby the financialinstruments were eligible for offset.
4. Interest in Underlying Funds (note 2)
The Fund did not hold any interest in Underlying Funds asat June 30, 2015 or December 31, 2014.
5. Comparison of net asset value per unit and netassets per unit (note 2)
The table below provides a comparison of the net assetvalue per unit and net assets per unit. The primary reasonfor the difference between the net asset value per unit andnet assets per unit, if any, is described in note 2.
June 30, 2015 December 31, 2014
Net asset valueper unit
($)
Net assetsper unit
($)
Net asset valueper unit
($)
Net assetsper unit
($)
Series I 10.63 10.63 10.61 10.61
Series M 10.63 10.63 10.61 10.61
The accompanying notes are an integral part of the financial statements.
28

Scotia Mortgage Income Fund (Unaudited)
STATEMENTS OF FINANCIAL POSITIONAs at
June 30,2015
December 31,2014
ASSETSCurrent assetsInvestments
Non-derivative financial assets $149,327,638 $138,041,488Cash 14,310,352 19,274,699Subscriptions receivable 109,943 99,693Accrued investment income and other 248,107 231,355Mortgage payments receivable 1,143,281 165,190
165,139,321 157,812,425
LIABILITIESCurrent liabilitiesManagement fee payable 82,305 –Redemptions payable 93,524 244,244Accrued expenses 69,595 –Distributions payable 110,008 81
355,432 244,325
Net assets attributable to holders of redeemable units $164,783,889 $157,568,100
NET ASSETS ATTRIBUTABLE TO HOLDERS OF REDEEMABLE UNITSPER SERIES
Series A $109,757,641 $121,873,510Series F $ 331,063 $ 376,586Series I $ 1,527,120 $ 1,332,703Series M $ 53,168,065 $ 33,985,301
NET ASSETS ATTRIBUTABLE TO HOLDERS OF REDEEMABLE UNITSPER UNIT
Series A $ 10.69 $ 10.67Series F $ 10.66 $ 10.65Series I $ 10.61 $ 10.61Series M $ 9.95 $ 9.94
STATEMENTS OF COMPREHENSIVE INCOMEFor the six month periods ended June 30,
2015 2014INCOMENet gain (loss) on investments (note 2)
Interest for distribution purposes $ 2,315,818 $ 5,393,677Net realized gain (loss) on non-derivative financial assets (657) (29,987)Change in unrealized gain (loss) on non-derivative financial assets 182,833 871,751
Net gain (loss) on investments 2,497,994 6,235,441Other income 670 2,175
Total income (loss) 2,498,664 6,237,616
EXPENSESManagement fees (note 5) 731,563 906,575Fixed administration fees (note 6) 351,983 –Independent Review Committee fees 121 428Interest expense and bank overdraft charges 2,339 –Audit fees – 3,127Custodian fees – 4Filing fees – 15,183Legal fees – 899Unitholder administration costs – 68,188Unitholder reporting costs – 9,767Harmonized Sales Tax/Goods and Services Tax 121,070 172,502Mortgage service fees – 581,157
Total expenses 1,207,076 1,757,830Expenses absorbed by the Manager – (133,176)
Net expenses 1,207,076 1,624,654
Increase (decrease) in net assets attributable to holders of redeemableunits from operations $ 1,291,588 $ 4,612,962
INCREASE (DECREASE) IN NET ASSETS ATTRIBUTABLE TO HOLDERS OFREDEEMABLE UNITS FROM OPERATIONS PER SERIES
Series A $ 666,822 $ 1,748,551Series F $ 3,212 $ 13,370Series I $ 18,717 $ 2,608,182Series M $ 602,837 $ 242,859
INCREASE (DECREASE) IN NET ASSETS ATTRIBUTABLE TO HOLDERS OFREDEEMABLE UNITS FROM OPERATIONS PER UNIT†
Series A $ 0.06 $ 0.13Series F $ 0.10 $ 0.18Series I $ 0.14 $ 0.22Series M $ 0.13 $ 0.16
WEIGHTED AVERAGE NUMBER OF UNITS PER SERIESSeries A 10,794,351 13,458,224Series F 33,256 75,904Series I 129,132 12,117,092Series M 4,776,715 1,529,531
† The increase (decrease) in net assets attributable to holders of redeemable units fromoperations per unit is calculated by dividing the increase (decrease) in net assetsattributable to holders of redeemable units from operations per series by the weightedaverage number of units per series.
The accompanying notes are an integral part of the financial statements.
29
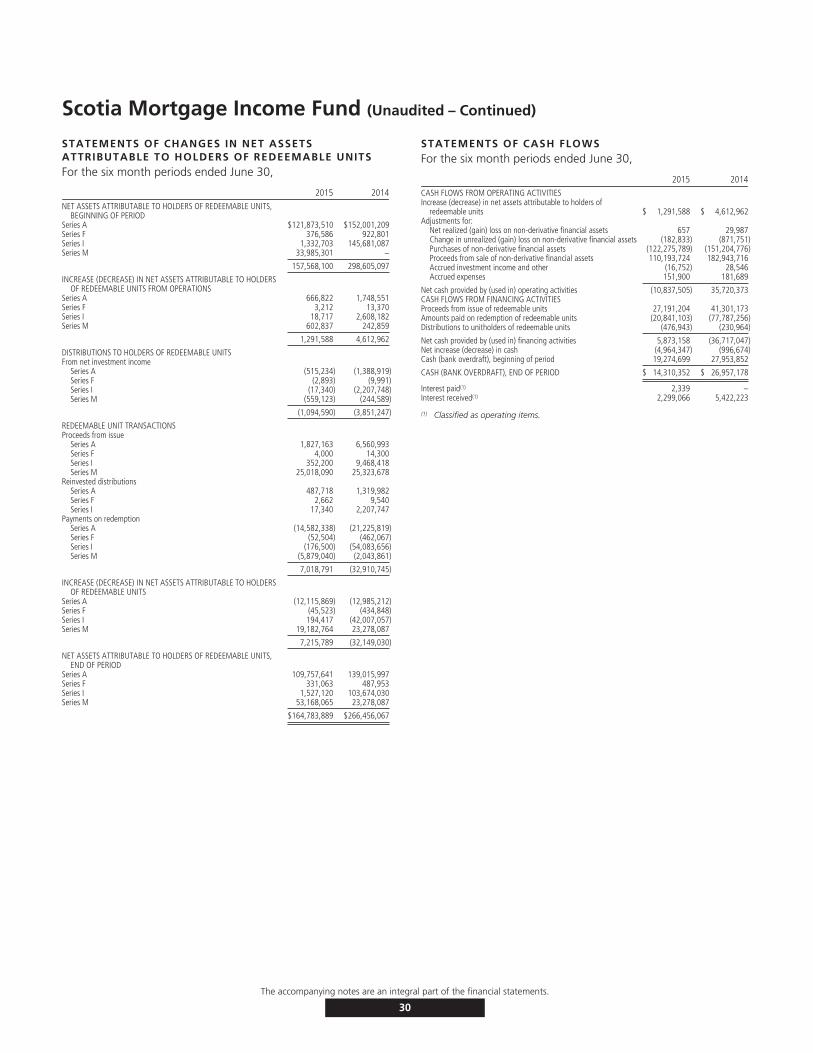
Scotia Mortgage Income Fund (Unaudited – Continued)
STATEMENTS OF CHANGES IN NET ASSETSATTRIBUTABLE TO HOLDERS OF REDEEMABLE UNITSFor the six month periods ended June 30,
2015 2014NET ASSETS ATTRIBUTABLE TO HOLDERS OF REDEEMABLE UNITS,
BEGINNING OF PERIODSeries A $121,873,510 $152,001,209Series F 376,586 922,801Series I 1,332,703 145,681,087Series M 33,985,301 –
157,568,100 298,605,097
INCREASE (DECREASE) IN NET ASSETS ATTRIBUTABLE TO HOLDERSOF REDEEMABLE UNITS FROM OPERATIONS
Series A 666,822 1,748,551Series F 3,212 13,370Series I 18,717 2,608,182Series M 602,837 242,859
1,291,588 4,612,962
DISTRIBUTIONS TO HOLDERS OF REDEEMABLE UNITSFrom net investment income
Series A (515,234) (1,388,919)Series F (2,893) (9,991)Series I (17,340) (2,207,748)Series M (559,123) (244,589)
(1,094,590) (3,851,247)
REDEEMABLE UNIT TRANSACTIONSProceeds from issue
Series A 1,827,163 6,560,993Series F 4,000 14,300Series I 352,200 9,468,418Series M 25,018,090 25,323,678
Reinvested distributionsSeries A 487,718 1,319,982Series F 2,662 9,540Series I 17,340 2,207,747
Payments on redemptionSeries A (14,582,338) (21,225,819)Series F (52,504) (462,067)Series I (176,500) (54,083,656)Series M (5,879,040) (2,043,861)
7,018,791 (32,910,745)
INCREASE (DECREASE) IN NET ASSETS ATTRIBUTABLE TO HOLDERSOF REDEEMABLE UNITS
Series A (12,115,869) (12,985,212)Series F (45,523) (434,848)Series I 194,417 (42,007,057)Series M 19,182,764 23,278,087
7,215,789 (32,149,030)
NET ASSETS ATTRIBUTABLE TO HOLDERS OF REDEEMABLE UNITS,END OF PERIOD
Series A 109,757,641 139,015,997Series F 331,063 487,953Series I 1,527,120 103,674,030Series M 53,168,065 23,278,087
$164,783,889 $266,456,067
STATEMENTS OF CASH FLOWSFor the six month periods ended June 30,
2015 2014CASH FLOWS FROM OPERATING ACTIVITIESIncrease (decrease) in net assets attributable to holders of
redeemable units $ 1,291,588 $ 4,612,962Adjustments for:
Net realized (gain) loss on non-derivative financial assets 657 29,987Change in unrealized (gain) loss on non-derivative financial assets (182,833) (871,751)Purchases of non-derivative financial assets (122,275,789) (151,204,776)Proceeds from sale of non-derivative financial assets 110,193,724 182,943,716Accrued investment income and other (16,752) 28,546Accrued expenses 151,900 181,689
Net cash provided by (used in) operating activities (10,837,505) 35,720,373CASH FLOWS FROM FINANCING ACTIVITIESProceeds from issue of redeemable units 27,191,204 41,301,173Amounts paid on redemption of redeemable units (20,841,103) (77,787,256)Distributions to unitholders of redeemable units (476,943) (230,964)
Net cash provided by (used in) financing activities 5,873,158 (36,717,047)Net increase (decrease) in cash (4,964,347) (996,674)Cash (bank overdraft), beginning of period 19,274,699 27,953,852
CASH (BANK OVERDRAFT), END OF PERIOD $ 14,310,352 $ 26,957,178
Interest paid(1) 2,339 –Interest received(1) 2,299,066 5,422,223
(1) Classified as operating items.
The accompanying notes are an integral part of the financial statements.
30
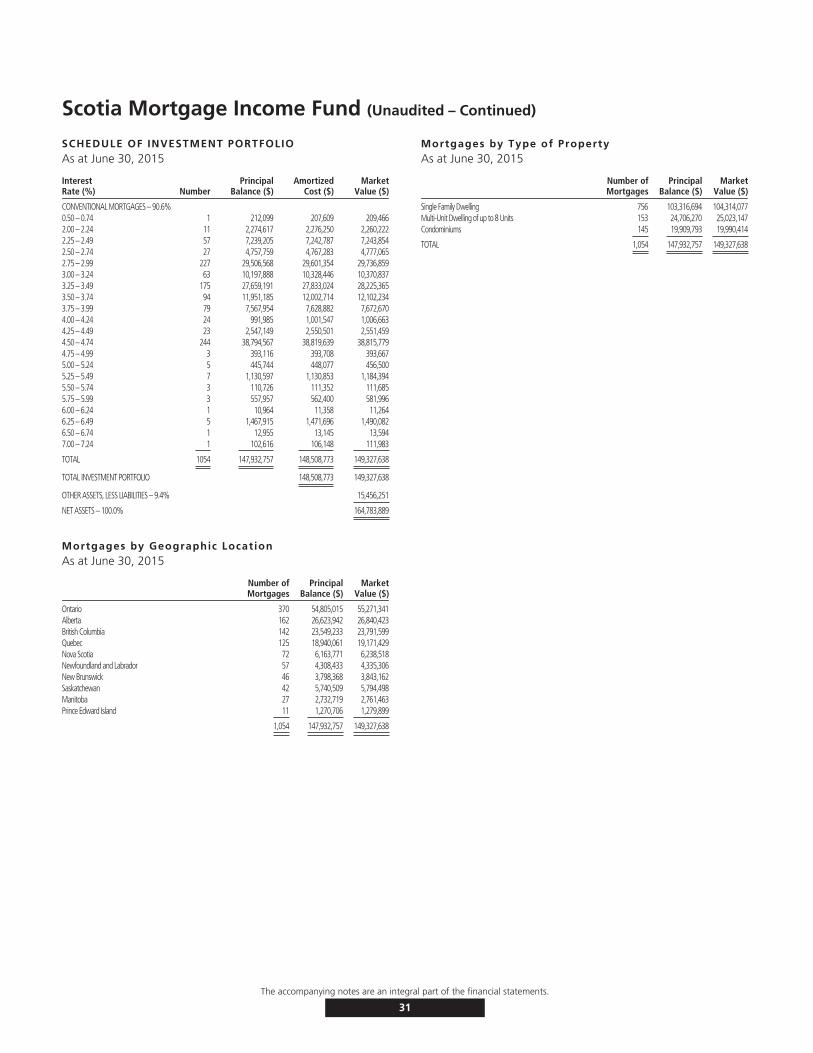
Scotia Mortgage Income Fund (Unaudited – Continued)
SCHEDULE OF INVESTMENT PORTFOLIOAs at June 30, 2015
InterestRate (%) Number
PrincipalBalance ($)
AmortizedCost ($)
MarketValue ($)
CONVENTIONAL MORTGAGES – 90.6%0.50 – 0.74 1 212,099 207,609 209,4662.00 – 2.24 11 2,274,617 2,276,250 2,260,2222.25 – 2.49 57 7,239,205 7,242,787 7,243,8542.50 – 2.74 27 4,757,759 4,767,283 4,777,0652.75 – 2.99 227 29,506,568 29,601,354 29,736,8593.00 – 3.24 63 10,197,888 10,328,446 10,370,8373.25 – 3.49 175 27,659,191 27,833,024 28,225,3653.50 – 3.74 94 11,951,185 12,002,714 12,102,2343.75 – 3.99 79 7,567,954 7,628,882 7,672,6704.00 – 4.24 24 991,985 1,001,547 1,006,6634.25 – 4.49 23 2,547,149 2,550,501 2,551,4594.50 – 4.74 244 38,794,567 38,819,639 38,815,7794.75 – 4.99 3 393,116 393,708 393,6675.00 – 5.24 5 445,744 448,077 456,5005.25 – 5.49 7 1,130,597 1,130,853 1,184,3945.50 – 5.74 3 110,726 111,352 111,6855.75 – 5.99 3 557,957 562,400 581,9966.00 – 6.24 1 10,964 11,358 11,2646.25 – 6.49 5 1,467,915 1,471,696 1,490,0826.50 – 6.74 1 12,955 13,145 13,5947.00 – 7.24 1 102,616 106,148 111,983
TOTAL 1054 147,932,757 148,508,773 149,327,638
TOTAL INVESTMENT PORTFOLIO 148,508,773 149,327,638
OTHER ASSETS, LESS LIABILITIES – 9.4% 15,456,251
NET ASSETS – 100.0% 164,783,889
Mortgages by Geographic LocationAs at June 30, 2015
Number ofMortgages
PrincipalBalance ($)
MarketValue ($)
Ontario 370 54,805,015 55,271,341Alberta 162 26,623,942 26,840,423British Columbia 142 23,549,233 23,791,599Quebec 125 18,940,061 19,171,429Nova Scotia 72 6,163,771 6,238,518Newfoundland and Labrador 57 4,308,433 4,335,306New Brunswick 46 3,798,368 3,843,162Saskatchewan 42 5,740,509 5,794,498Manitoba 27 2,732,719 2,761,463Prince Edward Island 11 1,270,706 1,279,899
1,054 147,932,757 149,327,638
Mortgages by Type of PropertyAs at June 30, 2015
Number ofMortgages
PrincipalBalance ($)
MarketValue ($)
Single Family Dwelling 756 103,316,694 104,314,077Multi-Unit Dwelling of up to 8 Units 153 24,706,270 25,023,147Condominiums 145 19,909,793 19,990,414
TOTAL 1,054 147,932,757 149,327,638
The accompanying notes are an integral part of the financial statements.
31
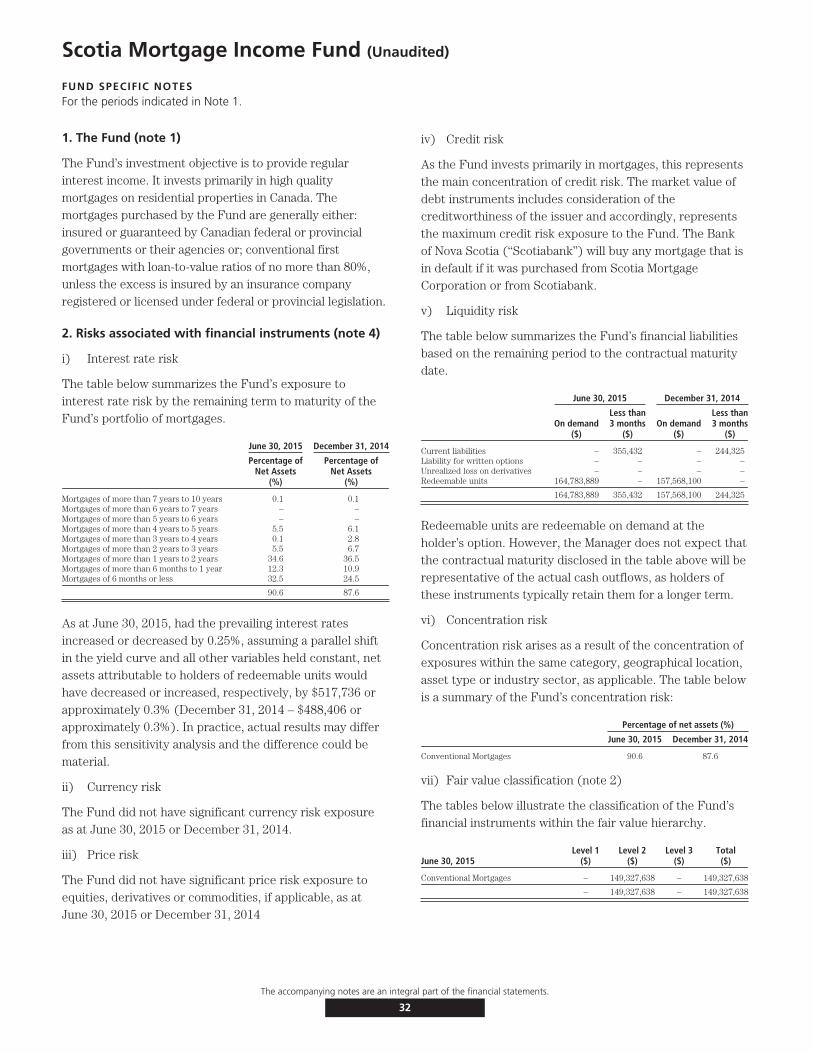
Scotia Mortgage Income Fund (Unaudited)
FUND SPECIFIC NOTESFor the periods indicated in Note 1.
1. The Fund (note 1)
The Fund’s investment objective is to provide regularinterest income. It invests primarily in high qualitymortgages on residential properties in Canada. Themortgages purchased by the Fund are generally either:insured or guaranteed by Canadian federal or provincialgovernments or their agencies or; conventional firstmortgages with loan-to-value ratios of no more than 80%,unless the excess is insured by an insurance companyregistered or licensed under federal or provincial legislation.
2. Risks associated with financial instruments (note 4)
i) Interest rate risk
The table below summarizes the Fund’s exposure tointerest rate risk by the remaining term to maturity of theFund’s portfolio of mortgages.
June 30, 2015 December 31, 2014
Percentage ofNet Assets
(%)
Percentage ofNet Assets
(%)
Mortgages of more than 7 years to 10 years 0.1 0.1Mortgages of more than 6 years to 7 years – –Mortgages of more than 5 years to 6 years – –Mortgages of more than 4 years to 5 years 5.5 6.1Mortgages of more than 3 years to 4 years 0.1 2.8Mortgages of more than 2 years to 3 years 5.5 6.7Mortgages of more than 1 years to 2 years 34.6 36.5Mortgages of more than 6 months to 1 year 12.3 10.9Mortgages of 6 months or less 32.5 24.5
90.6 87.6
As at June 30, 2015, had the prevailing interest ratesincreased or decreased by 0.25%, assuming a parallel shiftin the yield curve and all other variables held constant, netassets attributable to holders of redeemable units wouldhave decreased or increased, respectively, by $517,736 orapproximately 0.3% (December 31, 2014 – $488,406 orapproximately 0.3%). In practice, actual results may differfrom this sensitivity analysis and the difference could bematerial.
ii) Currency risk
The Fund did not have significant currency risk exposureas at June 30, 2015 or December 31, 2014.
iii) Price risk
The Fund did not have significant price risk exposure toequities, derivatives or commodities, if applicable, as atJune 30, 2015 or December 31, 2014
iv) Credit risk
As the Fund invests primarily in mortgages, this representsthe main concentration of credit risk. The market value ofdebt instruments includes consideration of thecreditworthiness of the issuer and accordingly, representsthe maximum credit risk exposure to the Fund. The Bankof Nova Scotia (“Scotiabank”) will buy any mortgage that isin default if it was purchased from Scotia MortgageCorporation or from Scotiabank.
v) Liquidity risk
The table below summarizes the Fund’s financial liabilitiesbased on the remaining period to the contractual maturitydate.
June 30, 2015 December 31, 2014
On demand($)
Less than3 months
($)On demand
($)
Less than3 months
($)
Current liabilities – 355,432 – 244,325Liability for written options – – – –Unrealized loss on derivatives – – – –Redeemable units 164,783,889 – 157,568,100 –
164,783,889 355,432 157,568,100 244,325
Redeemable units are redeemable on demand at theholder’s option. However, the Manager does not expect thatthe contractual maturity disclosed in the table above will berepresentative of the actual cash outflows, as holders ofthese instruments typically retain them for a longer term.
vi) Concentration risk
Concentration risk arises as a result of the concentration ofexposures within the same category, geographical location,asset type or industry sector, as applicable. The table belowis a summary of the Fund’s concentration risk:
Percentage of net assets (%)
June 30, 2015 December 31, 2014
Conventional Mortgages 90.6 87.6
vii) Fair value classification (note 2)
The tables below illustrate the classification of the Fund’sfinancial instruments within the fair value hierarchy.
June 30, 2015Level 1
($)Level 2
($)Level 3
($)Total($)
Conventional Mortgages – 149,327,638 – 149,327,638
– 149,327,638 – 149,327,638
The accompanying notes are an integral part of the financial statements.
32
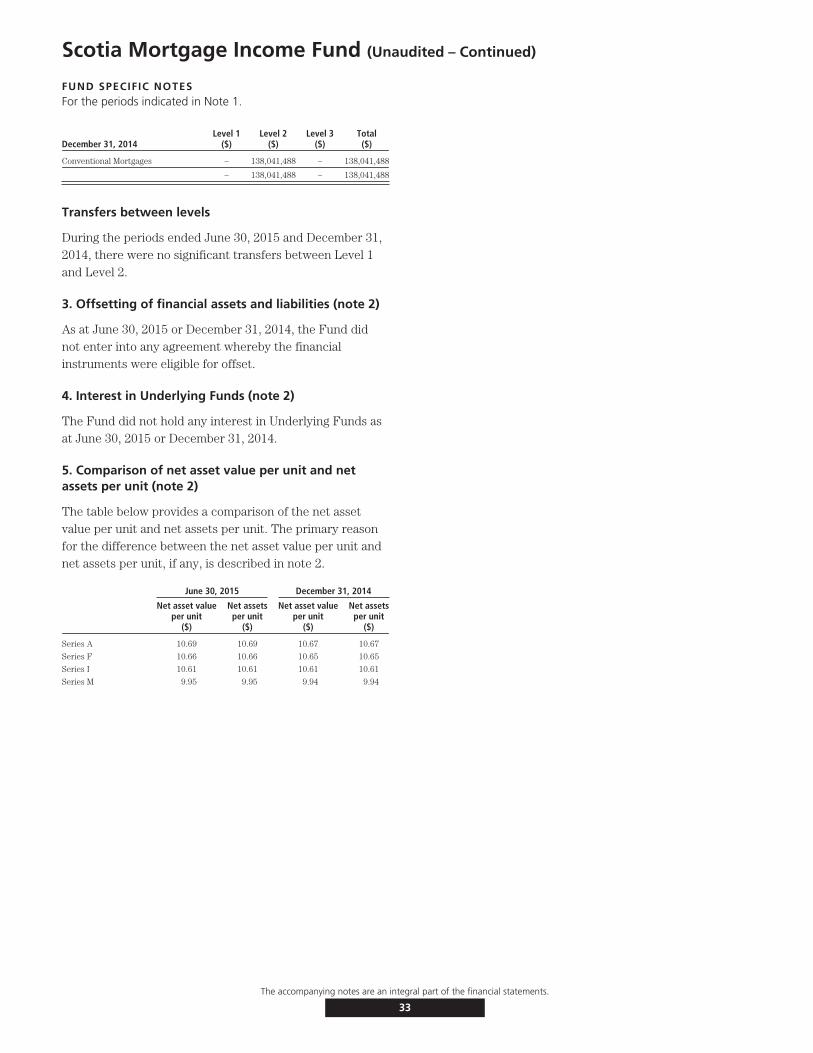
Scotia Mortgage Income Fund (Unaudited – Continued)
FUND SPECIFIC NOTESFor the periods indicated in Note 1.
December 31, 2014Level 1
($)Level 2
($)Level 3
($)Total($)
Conventional Mortgages – 138,041,488 – 138,041,488
– 138,041,488 – 138,041,488
Transfers between levels
During the periods ended June 30, 2015 and December 31,2014, there were no significant transfers between Level 1and Level 2.
3. Offsetting of financial assets and liabilities (note 2)
As at June 30, 2015 or December 31, 2014, the Fund didnot enter into any agreement whereby the financialinstruments were eligible for offset.
4. Interest in Underlying Funds (note 2)
The Fund did not hold any interest in Underlying Funds asat June 30, 2015 or December 31, 2014.
5. Comparison of net asset value per unit and netassets per unit (note 2)
The table below provides a comparison of the net assetvalue per unit and net assets per unit. The primary reasonfor the difference between the net asset value per unit andnet assets per unit, if any, is described in note 2.
June 30, 2015 December 31, 2014
Net asset valueper unit
($)
Net assetsper unit
($)
Net asset valueper unit
($)
Net assetsper unit
($)
Series A 10.69 10.69 10.67 10.67
Series F 10.66 10.66 10.65 10.65
Series I 10.61 10.61 10.61 10.61
Series M 9.95 9.95 9.94 9.94
The accompanying notes are an integral part of the financial statements.
33
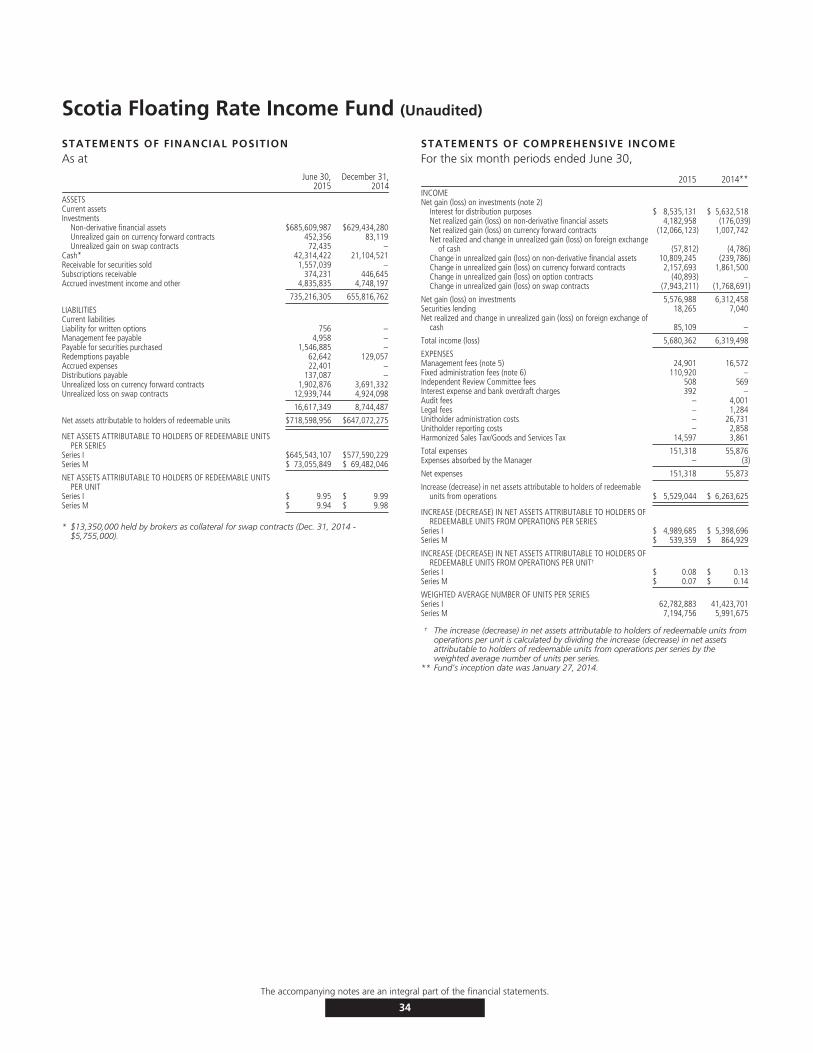
Scotia Floating Rate Income Fund (Unaudited)
STATEMENTS OF FINANCIAL POSITIONAs at
June 30,2015
December 31,2014
ASSETSCurrent assetsInvestments
Non-derivative financial assets $685,609,987 $629,434,280Unrealized gain on currency forward contracts 452,356 83,119Unrealized gain on swap contracts 72,435 –
Cash* 42,314,422 21,104,521Receivable for securities sold 1,557,039 –Subscriptions receivable 374,231 446,645Accrued investment income and other 4,835,835 4,748,197
735,216,305 655,816,762
LIABILITIESCurrent liabilitiesLiability for written options 756 –Management fee payable 4,958 –Payable for securities purchased 1,546,885 –Redemptions payable 62,642 129,057Accrued expenses 22,401 –Distributions payable 137,087 –Unrealized loss on currency forward contracts 1,902,876 3,691,332Unrealized loss on swap contracts 12,939,744 4,924,098
16,617,349 8,744,487
Net assets attributable to holders of redeemable units $718,598,956 $647,072,275
NET ASSETS ATTRIBUTABLE TO HOLDERS OF REDEEMABLE UNITSPER SERIES
Series I $645,543,107 $577,590,229Series M $ 73,055,849 $ 69,482,046
NET ASSETS ATTRIBUTABLE TO HOLDERS OF REDEEMABLE UNITSPER UNIT
Series I $ 9.95 $ 9.99Series M $ 9.94 $ 9.98
* $13,350,000 held by brokers as collateral for swap contracts (Dec. 31, 2014 -$5,755,000).
STATEMENTS OF COMPREHENSIVE INCOMEFor the six month periods ended June 30,
2015 2014**INCOMENet gain (loss) on investments (note 2)
Interest for distribution purposes $ 8,535,131 $ 5,632,518Net realized gain (loss) on non-derivative financial assets 4,182,958 (176,039)Net realized gain (loss) on currency forward contracts (12,066,123) 1,007,742Net realized and change in unrealized gain (loss) on foreign exchange
of cash (57,812) (4,786)Change in unrealized gain (loss) on non-derivative financial assets 10,809,245 (239,786)Change in unrealized gain (loss) on currency forward contracts 2,157,693 1,861,500Change in unrealized gain (loss) on option contracts (40,893) –Change in unrealized gain (loss) on swap contracts (7,943,211) (1,768,691)
Net gain (loss) on investments 5,576,988 6,312,458Securities lending 18,265 7,040Net realized and change in unrealized gain (loss) on foreign exchange of
cash 85,109 –
Total income (loss) 5,680,362 6,319,498
EXPENSESManagement fees (note 5) 24,901 16,572Fixed administration fees (note 6) 110,920 –Independent Review Committee fees 508 569Interest expense and bank overdraft charges 392 –Audit fees – 4,001Legal fees – 1,284Unitholder administration costs – 26,731Unitholder reporting costs – 2,858Harmonized Sales Tax/Goods and Services Tax 14,597 3,861
Total expenses 151,318 55,876Expenses absorbed by the Manager – (3)
Net expenses 151,318 55,873
Increase (decrease) in net assets attributable to holders of redeemableunits from operations $ 5,529,044 $ 6,263,625
INCREASE (DECREASE) IN NET ASSETS ATTRIBUTABLE TO HOLDERS OFREDEEMABLE UNITS FROM OPERATIONS PER SERIES
Series I $ 4,989,685 $ 5,398,696Series M $ 539,359 $ 864,929
INCREASE (DECREASE) IN NET ASSETS ATTRIBUTABLE TO HOLDERS OFREDEEMABLE UNITS FROM OPERATIONS PER UNIT†
Series I $ 0.08 $ 0.13Series M $ 0.07 $ 0.14
WEIGHTED AVERAGE NUMBER OF UNITS PER SERIESSeries I 62,782,883 41,423,701Series M 7,194,756 5,991,675
† The increase (decrease) in net assets attributable to holders of redeemable units fromoperations per unit is calculated by dividing the increase (decrease) in net assetsattributable to holders of redeemable units from operations per series by theweighted average number of units per series.
** Fund’s inception date was January 27, 2014.
The accompanying notes are an integral part of the financial statements.
34
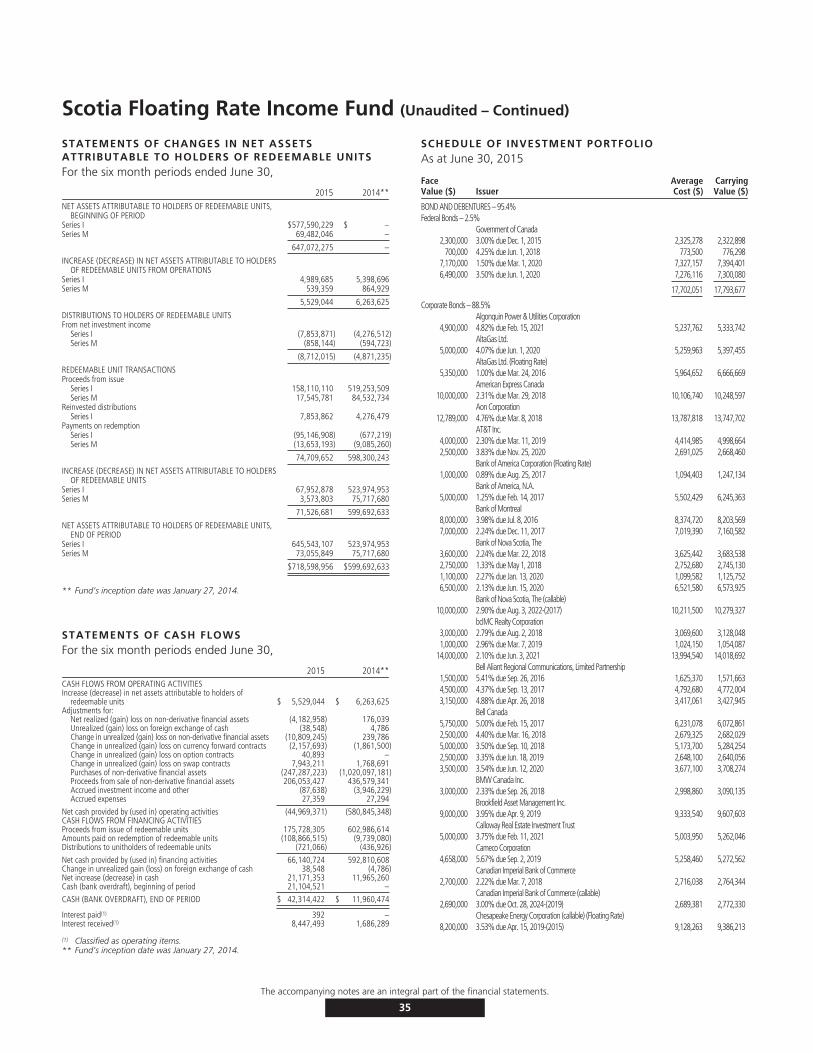
Scotia Floating Rate Income Fund (Unaudited – Continued)
STATEMENTS OF CHANGES IN NET ASSETSATTRIBUTABLE TO HOLDERS OF REDEEMABLE UNITSFor the six month periods ended June 30,
2015 2014**NET ASSETS ATTRIBUTABLE TO HOLDERS OF REDEEMABLE UNITS,
BEGINNING OF PERIODSeries I $577,590,229 $ –Series M 69,482,046 –
647,072,275 –
INCREASE (DECREASE) IN NET ASSETS ATTRIBUTABLE TO HOLDERSOF REDEEMABLE UNITS FROM OPERATIONS
Series I 4,989,685 5,398,696Series M 539,359 864,929
5,529,044 6,263,625
DISTRIBUTIONS TO HOLDERS OF REDEEMABLE UNITSFrom net investment income
Series I (7,853,871) (4,276,512)Series M (858,144) (594,723)
(8,712,015) (4,871,235)
REDEEMABLE UNIT TRANSACTIONSProceeds from issue
Series I 158,110,110 519,253,509Series M 17,545,781 84,532,734
Reinvested distributionsSeries I 7,853,862 4,276,479
Payments on redemptionSeries I (95,146,908) (677,219)Series M (13,653,193) (9,085,260)
74,709,652 598,300,243
INCREASE (DECREASE) IN NET ASSETS ATTRIBUTABLE TO HOLDERSOF REDEEMABLE UNITS
Series I 67,952,878 523,974,953Series M 3,573,803 75,717,680
71,526,681 599,692,633
NET ASSETS ATTRIBUTABLE TO HOLDERS OF REDEEMABLE UNITS,END OF PERIOD
Series I 645,543,107 523,974,953Series M 73,055,849 75,717,680
$718,598,956 $599,692,633
** Fund’s inception date was January 27, 2014.
STATEMENTS OF CASH FLOWSFor the six month periods ended June 30,
2015 2014**CASH FLOWS FROM OPERATING ACTIVITIESIncrease (decrease) in net assets attributable to holders of
redeemable units $ 5,529,044 $ 6,263,625Adjustments for:
Net realized (gain) loss on non-derivative financial assets (4,182,958) 176,039Unrealized (gain) loss on foreign exchange of cash (38,548) 4,786Change in unrealized (gain) loss on non-derivative financial assets (10,809,245) 239,786Change in unrealized (gain) loss on currency forward contracts (2,157,693) (1,861,500)Change in unrealized (gain) loss on option contracts 40,893 –Change in unrealized (gain) loss on swap contracts 7,943,211 1,768,691Purchases of non-derivative financial assets (247,287,223) (1,020,097,181)Proceeds from sale of non-derivative financial assets 206,053,427 436,579,341Accrued investment income and other (87,638) (3,946,229)Accrued expenses 27,359 27,294
Net cash provided by (used in) operating activities (44,969,371) (580,845,348)CASH FLOWS FROM FINANCING ACTIVITIESProceeds from issue of redeemable units 175,728,305 602,986,614Amounts paid on redemption of redeemable units (108,866,515) (9,739,080)Distributions to unitholders of redeemable units (721,066) (436,926)
Net cash provided by (used in) financing activities 66,140,724 592,810,608Change in unrealized gain (loss) on foreign exchange of cash 38,548 (4,786)Net increase (decrease) in cash 21,171,353 11,965,260Cash (bank overdraft), beginning of period 21,104,521 –
CASH (BANK OVERDRAFT), END OF PERIOD $ 42,314,422 $ 11,960,474
Interest paid(1) 392 –Interest received(1) 8,447,493 1,686,289
(1) Classified as operating items.** Fund’s inception date was January 27, 2014.
SCHEDULE OF INVESTMENT PORTFOLIOAs at June 30, 2015
FaceValue ($) Issuer
AverageCost ($)
CarryingValue ($)
BOND AND DEBENTURES – 95.4%Federal Bonds – 2.5%
Government of Canada2,300,000 3.00% due Dec. 1, 2015 2,325,278 2,322,898
700,000 4.25% due Jun. 1, 2018 773,500 776,2987,170,000 1.50% due Mar. 1, 2020 7,327,157 7,394,4016,490,000 3.50% due Jun. 1, 2020 7,276,116 7,300,080
17,702,051 17,793,677
Corporate Bonds – 88.5%Algonquin Power & Utilities Corporation
4,900,000 4.82% due Feb. 15, 2021 5,237,762 5,333,742AltaGas Ltd.
5,000,000 4.07% due Jun. 1, 2020 5,259,963 5,397,455AltaGas Ltd. (Floating Rate)
5,350,000 1.00% due Mar. 24, 2016 5,964,652 6,666,669American Express Canada
10,000,000 2.31% due Mar. 29, 2018 10,106,740 10,248,597Aon Corporation
12,789,000 4.76% due Mar. 8, 2018 13,787,818 13,747,702AT&T Inc.
4,000,000 2.30% due Mar. 11, 2019 4,414,985 4,998,6642,500,000 3.83% due Nov. 25, 2020 2,691,025 2,668,460
Bank of America Corporation (Floating Rate)1,000,000 0.89% due Aug. 25, 2017 1,094,403 1,247,134
Bank of America, N.A.5,000,000 1.25% due Feb. 14, 2017 5,502,429 6,245,363
Bank of Montreal8,000,000 3.98% due Jul. 8, 2016 8,374,720 8,203,5697,000,000 2.24% due Dec. 11, 2017 7,019,390 7,160,582
Bank of Nova Scotia, The3,600,000 2.24% due Mar. 22, 2018 3,625,442 3,683,5382,750,000 1.33% due May 1, 2018 2,752,680 2,745,1301,100,000 2.27% due Jan. 13, 2020 1,099,582 1,125,7526,500,000 2.13% due Jun. 15, 2020 6,521,580 6,573,925
Bank of Nova Scotia, The (callable)10,000,000 2.90% due Aug. 3, 2022-(2017) 10,211,500 10,279,327
bcIMC Realty Corporation3,000,000 2.79% due Aug. 2, 2018 3,069,600 3,128,0481,000,000 2.96% due Mar. 7, 2019 1,024,150 1,054,087
14,000,000 2.10% due Jun. 3, 2021 13,994,540 14,018,692Bell Aliant Regional Communications, Limited Partnership
1,500,000 5.41% due Sep. 26, 2016 1,625,370 1,571,6634,500,000 4.37% due Sep. 13, 2017 4,792,680 4,772,0043,150,000 4.88% due Apr. 26, 2018 3,417,061 3,427,945
Bell Canada5,750,000 5.00% due Feb. 15, 2017 6,231,078 6,072,8612,500,000 4.40% due Mar. 16, 2018 2,679,325 2,682,0295,000,000 3.50% due Sep. 10, 2018 5,173,700 5,284,2542,500,000 3.35% due Jun. 18, 2019 2,648,100 2,640,0563,500,000 3.54% due Jun. 12, 2020 3,677,100 3,708,274
BMW Canada Inc.3,000,000 2.33% due Sep. 26, 2018 2,998,860 3,090,135
Brookfield Asset Management Inc.9,000,000 3.95% due Apr. 9, 2019 9,333,540 9,607,603
Calloway Real Estate Investment Trust5,000,000 3.75% due Feb. 11, 2021 5,003,950 5,262,046
Cameco Corporation4,658,000 5.67% due Sep. 2, 2019 5,258,460 5,272,562
Canadian Imperial Bank of Commerce2,700,000 2.22% due Mar. 7, 2018 2,716,038 2,764,344
Canadian Imperial Bank of Commerce (callable)2,690,000 3.00% due Oct. 28, 2024-(2019) 2,689,381 2,772,330
Chesapeake Energy Corporation (callable) (Floating Rate)8,200,000 3.53% due Apr. 15, 2019-(2015) 9,128,263 9,386,213
The accompanying notes are an integral part of the financial statements.
35
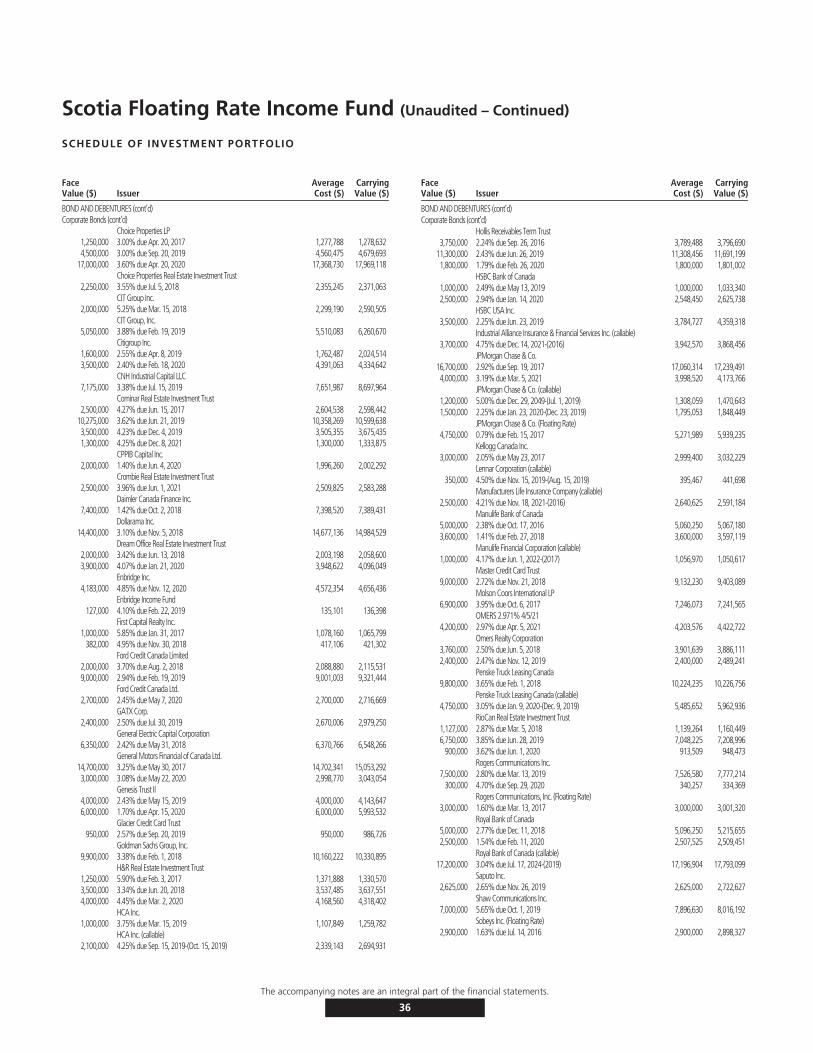
Scotia Floating Rate Income Fund (Unaudited – Continued)
SCHEDULE OF INVESTMENT PORTFOLIO
FaceValue ($) Issuer
AverageCost ($)
CarryingValue ($)
BOND AND DEBENTURES (cont’d)Corporate Bonds (cont’d)
Choice Properties LP1,250,000 3.00% due Apr. 20, 2017 1,277,788 1,278,6324,500,000 3.00% due Sep. 20, 2019 4,560,475 4,679,693
17,000,000 3.60% due Apr. 20, 2020 17,368,730 17,969,118Choice Properties Real Estate Investment Trust
2,250,000 3.55% due Jul. 5, 2018 2,355,245 2,371,063CIT Group Inc.
2,000,000 5.25% due Mar. 15, 2018 2,299,190 2,590,505CIT Group, Inc.
5,050,000 3.88% due Feb. 19, 2019 5,510,083 6,260,670Citigroup Inc.
1,600,000 2.55% due Apr. 8, 2019 1,762,487 2,024,5143,500,000 2.40% due Feb. 18, 2020 4,391,063 4,334,642
CNH Industrial Capital LLC7,175,000 3.38% due Jul. 15, 2019 7,651,987 8,697,964
Cominar Real Estate Investment Trust2,500,000 4.27% due Jun. 15, 2017 2,604,538 2,598,442
10,275,000 3.62% due Jun. 21, 2019 10,358,269 10,599,6383,500,000 4.23% due Dec. 4, 2019 3,505,355 3,675,4351,300,000 4.25% due Dec. 8, 2021 1,300,000 1,333,875
CPPIB Capital Inc.2,000,000 1.40% due Jun. 4, 2020 1,996,260 2,002,292
Crombie Real Estate Investment Trust2,500,000 3.96% due Jun. 1, 2021 2,509,825 2,583,288
Daimler Canada Finance Inc.7,400,000 1.42% due Oct. 2, 2018 7,398,520 7,389,431
Dollarama Inc.14,400,000 3.10% due Nov. 5, 2018 14,677,136 14,984,529
Dream Office Real Estate Investment Trust2,000,000 3.42% due Jun. 13, 2018 2,003,198 2,058,6003,900,000 4.07% due Jan. 21, 2020 3,948,622 4,096,049
Enbridge Inc.4,183,000 4.85% due Nov. 12, 2020 4,572,354 4,656,436
Enbridge Income Fund127,000 4.10% due Feb. 22, 2019 135,101 136,398
First Capital Realty Inc.1,000,000 5.85% due Jan. 31, 2017 1,078,160 1,065,799
382,000 4.95% due Nov. 30, 2018 417,106 421,302Ford Credit Canada Limited
2,000,000 3.70% due Aug. 2, 2018 2,088,880 2,115,5319,000,000 2.94% due Feb. 19, 2019 9,001,003 9,321,444
Ford Credit Canada Ltd.2,700,000 2.45% due May 7, 2020 2,700,000 2,716,669
GATX Corp.2,400,000 2.50% due Jul. 30, 2019 2,670,006 2,979,250
General Electric Capital Corporation6,350,000 2.42% due May 31, 2018 6,370,766 6,548,266
General Motors Financial of Canada Ltd.14,700,000 3.25% due May 30, 2017 14,702,341 15,053,2923,000,000 3.08% due May 22, 2020 2,998,770 3,043,054
Genesis Trust II4,000,000 2.43% due May 15, 2019 4,000,000 4,143,6476,000,000 1.70% due Apr. 15, 2020 6,000,000 5,993,532
Glacier Credit Card Trust950,000 2.57% due Sep. 20, 2019 950,000 986,726
Goldman Sachs Group, Inc.9,900,000 3.38% due Feb. 1, 2018 10,160,222 10,330,895
H&R Real Estate Investment Trust1,250,000 5.90% due Feb. 3, 2017 1,371,888 1,330,5703,500,000 3.34% due Jun. 20, 2018 3,537,485 3,637,5514,000,000 4.45% due Mar. 2, 2020 4,168,560 4,318,402
HCA Inc.1,000,000 3.75% due Mar. 15, 2019 1,107,849 1,259,782
HCA Inc. (callable)2,100,000 4.25% due Sep. 15, 2019-(Oct. 15, 2019) 2,339,143 2,694,931
FaceValue ($) Issuer
AverageCost ($)
CarryingValue ($)
BOND AND DEBENTURES (cont’d)Corporate Bonds (cont’d)
Hollis Receivables Term Trust3,750,000 2.24% due Sep. 26, 2016 3,789,488 3,796,690
11,300,000 2.43% due Jun. 26, 2019 11,308,456 11,691,1991,800,000 1.79% due Feb. 26, 2020 1,800,000 1,801,002
HSBC Bank of Canada1,000,000 2.49% due May 13, 2019 1,000,000 1,033,3402,500,000 2.94% due Jan. 14, 2020 2,548,450 2,625,738
HSBC USA Inc.3,500,000 2.25% due Jun. 23, 2019 3,784,727 4,359,318
Industrial Alliance Insurance & Financial Services Inc. (callable)3,700,000 4.75% due Dec. 14, 2021-(2016) 3,942,570 3,868,456
JPMorgan Chase & Co.16,700,000 2.92% due Sep. 19, 2017 17,060,314 17,239,4914,000,000 3.19% due Mar. 5, 2021 3,998,520 4,173,766
JPMorgan Chase & Co. (callable)1,200,000 5.00% due Dec. 29, 2049-(Jul. 1, 2019) 1,308,059 1,470,6431,500,000 2.25% due Jan. 23, 2020-(Dec. 23, 2019) 1,795,053 1,848,449
JPMorgan Chase & Co. (Floating Rate)4,750,000 0.79% due Feb. 15, 2017 5,271,989 5,939,235
Kellogg Canada Inc.3,000,000 2.05% due May 23, 2017 2,999,400 3,032,229
Lennar Corporation (callable)350,000 4.50% due Nov. 15, 2019-(Aug. 15, 2019) 395,467 441,698
Manufacturers Life Insurance Company (callable)2,500,000 4.21% due Nov. 18, 2021-(2016) 2,640,625 2,591,184
Manulife Bank of Canada5,000,000 2.38% due Oct. 17, 2016 5,060,250 5,067,1803,600,000 1.41% due Feb. 27, 2018 3,600,000 3,597,119
Manulife Financial Corporation (callable)1,000,000 4.17% due Jun. 1, 2022-(2017) 1,056,970 1,050,617
Master Credit Card Trust9,000,000 2.72% due Nov. 21, 2018 9,132,230 9,403,089
Molson Coors International LP6,900,000 3.95% due Oct. 6, 2017 7,246,073 7,241,565
OMERS 2.971% 4/5/214,200,000 2.97% due Apr. 5, 2021 4,203,576 4,422,722
Omers Realty Corporation3,760,000 2.50% due Jun. 5, 2018 3,901,639 3,886,1112,400,000 2.47% due Nov. 12, 2019 2,400,000 2,489,241
Penske Truck Leasing Canada9,800,000 3.65% due Feb. 1, 2018 10,224,235 10,226,756
Penske Truck Leasing Canada (callable)4,750,000 3.05% due Jan. 9, 2020-(Dec. 9, 2019) 5,485,652 5,962,936
RioCan Real Estate Investment Trust1,127,000 2.87% due Mar. 5, 2018 1,139,264 1,160,4496,750,000 3.85% due Jun. 28, 2019 7,048,225 7,208,996
900,000 3.62% due Jun. 1, 2020 913,509 948,473Rogers Communications Inc.
7,500,000 2.80% due Mar. 13, 2019 7,526,580 7,777,214300,000 4.70% due Sep. 29, 2020 340,257 334,369
Rogers Communications, Inc. (Floating Rate)3,000,000 1.60% due Mar. 13, 2017 3,000,000 3,001,320
Royal Bank of Canada5,000,000 2.77% due Dec. 11, 2018 5,096,250 5,215,6552,500,000 1.54% due Feb. 11, 2020 2,507,525 2,509,451
Royal Bank of Canada (callable)17,200,000 3.04% due Jul. 17, 2024-(2019) 17,196,904 17,793,099
Saputo Inc.2,625,000 2.65% due Nov. 26, 2019 2,625,000 2,722,627
Shaw Communications Inc.7,000,000 5.65% due Oct. 1, 2019 7,896,630 8,016,192
Sobeys Inc. (Floating Rate)2,900,000 1.63% due Jul. 14, 2016 2,900,000 2,898,327
The accompanying notes are an integral part of the financial statements.
36

Scotia Floating Rate Income Fund (Unaudited – Continued)
SCHEDULE OF INVESTMENT PORTFOLIO
FaceValue ($) Issuer
AverageCost ($)
CarryingValue ($)
BOND AND DEBENTURES (cont’d)Corporate Bonds (cont’d)
Standard Life Canada (callable)14,907,000 3.94% due Sep. 21, 2022-(2017) 15,688,732 15,669,214
Sun Life Financial Inc.12,900,000 4.38% due Mar. 2, 2017 13,689,651 13,506,054
TELUS Corporation7,350,000 1.50% due Mar. 27, 2018 7,347,207 7,347,511
The Toronto-Dominion Bank1,000,000 2.17% due Apr. 2, 2018 1,027,690 1,022,6885,550,000 2.69% due Jun. 24, 2025 5,545,970 5,590,162
Toyota Credit Canada Inc.2,000,000 2.75% due Jul. 18, 2018 2,033,440 2,080,9632,100,000 2.25% due May 23, 2019 2,096,241 2,157,6924,700,000 1.80% due Feb. 19, 2020 4,695,535 4,710,0984,200,000 2.05% due May 20, 2020 4,199,202 4,245,853
TransAlta Corporation3,000,000 5.00% due Nov. 25, 2020 3,164,340 3,136,752
Veresen Inc.4,750,000 3.95% due Mar. 14, 2017 4,967,313 4,908,6273,200,000 3.06% due Jun. 13, 2019 3,194,298 3,252,032
Verizon Communications Inc.1,350,000 2.55% due Jun. 17, 2019 1,496,305 1,703,421
VW Credit Canada, Inc.1,500,000 2.50% due Oct. 1, 2019 1,499,160 1,551,551
Wells Fargo Financial Canada Corporation700,000 2.77% due Feb. 9, 2017 722,309 716,836
12,584,000 2.78% due Nov. 15, 2018 12,752,095 13,142,5065,250,000 2.94% due Jul. 25, 2019 5,424,338 5,519,847
620,661,985 636,230,365
FaceValue ($) Issuer
AverageCost ($)
CarryingValue ($)
BOND AND DEBENTURES (cont’d)Mortgage-backed Securities – 4.4%
Ares Clo Ltd.3,000,000 1.66% due Jan. 17, 2024 3,246,622 3,738,570
ARES XXVI CLO Ltd. (Floating Rate)3,300,000 1.38% due Apr. 15, 2025 3,607,736 4,074,869
BlueMountian CLO Ltd., Series 2013-1A, Class 1A (Floating Rate)3,300,000 1.47% due May 15, 2025 3,610,203 4,087,102
BlueMountian CLO Ltd., Series 2014-1A, Class A (Floating Rate)5,000,000 1.80% due Apr. 30, 2026 5,592,226 6,238,505
OZLM Ltd.5,250,000 1.71% due Oct. 17, 2026 5,701,635 6,547,959
OZLM Ltd. (Floating Rate)2,500,000 1.76% due Jul. 17, 2026 2,705,544 3,125,021
Washington Mill CLO Ltd.3,000,000 1.78% due Apr. 20, 2026 3,289,647 3,740,809
27,753,613 31,552,835
Options – 0.0%5,500,000 USD CALL/CAD PUT SK$1.255 EX 07/14/15 111,390 33,110(5,500,000) USD CALL/CAD PUT SK$1.305 EX 07/14/15 (38,143) (756)
73,247 32,354
TOTAL INVESTMENT PORTFOLIO 666,190,896 685,609,231
Currency Forward Contracts – (0.2%) (1,450,520)Swap Contracts – (1.8%) (12,867,309)OTHER ASSETS, LESS LIABILITIES – 6.6% 47,307,554
NET ASSETS – 100.0% 718,598,956
CURRENCY FORWARD CONTRACTS
Settlement Date Currency To Be ReceivedContractual
Amount Currency To Be DeliveredContractual
AmountCanadian Value as at
June 30, 2015 ($)
Canadian ($)Appreciation/
(Depreciation)Jul. 16, 2015 Canadian Dollar 25,204,000 U.S. Dollar 20,000,000 24,991,253 212,747Jul. 16, 2015 Canadian Dollar 3,001,250 U.S. Dollar 2,500,000 3,123,907 (122,657)Jul. 16, 2015 U.S. Dollar 1,000,000 Canadian Dollar 1,237,050 1,236,460 12,494Aug. 20, 2015 Canadian Dollar 24,407,854 U.S. Dollar 19,340,000 24,183,464 224,389Aug. 20, 2015 Canadian Dollar 3,002,625 U.S. Dollar 2,500,000 3,126,094 (123,469)Aug. 20, 2015 U.S. Dollar 200,000 Canadian Dollar 247,355 247,065 2,726Sep. 15, 2015 Canadian Dollar 29,777,938 U.S. Dollar 24,785,000 31,002,176 (1,224,237)Oct. 15, 2015 Canadian Dollar 29,316,358 U.S. Dollar 23,775,000 29,748,871 (432,513)
(1,450,520)
The currency forward contracts outstanding at June 30, 2015 are placed with a financial institution with a credit rating of A+ by Standard & Poor’s.
INTEREST RATE SWAP CONTRACTS
Description Counterparty CurrencyTerminationDate
NotionalAmount ($)
InterestRate %
Appreciation/(Depreciation) ($)
Fixed to Floating Interest Rate Swap – Fixed Rate Coupon Merrill Lynch International CAD Feb. 5, 2016 10,000,000 1.293% –Fixed to Floating Interest Rate Swap – CAD-BA-CDOR Variable Rate Coupon Merrill Lynch International CAD Feb. 5, 2016 (10,000,000) 0.982% (35,835)Fixed to Floating Interest Rate Swap – Fixed Rate Coupon Merrill Lynch International CAD Feb. 21, 2016 25,000,000 1.325% –Fixed to Floating Interest Rate Swap – CAD-BA-CDOR Variable Rate Coupon Merrill Lynch International CAD Feb. 21, 2016 (25,000,000) 0.912% (103,537)Fixed to Floating Interest Rate Swap – Fixed Rate Coupon Merrill Lynch International CAD Feb. 5, 2017 25,000,000 1.485% –Fixed to Floating Interest Rate Swap – CAD-BA-CDOR Variable Rate Coupon Merrill Lynch International CAD Feb. 5, 2017 (25,000,000) 0.982% (291,319)Fixed to Floating Interest Rate Swap – Fixed Rate Coupon TD Securities Inc. CAD Mar. 13, 2017 16,000,000 1.523% –Fixed to Floating Interest Rate Swap – CAD-BA-CDOR Variable Rate Coupon TD Securities Inc. CAD Mar. 13, 2017 (16,000,000) 1.001% (197,076)Fixed to Floating Interest Rate Swap – Fixed Rate Coupon Merrill Lynch International CAD Mar. 27, 2017 2,700,000 0.920% –Fixed to Floating Interest Rate Swap – CAD-BA-CDOR Variable Rate Coupon Merrill Lynch International CAD Mar. 27, 2017 (2,700,000) 1.000% (901)Fixed to Floating Interest Rate Swap – Fixed Rate Coupon Merrill Lynch International CAD Apr. 9, 2017 5,000,000 1.613% –Fixed to Floating Interest Rate Swap – CAD-BA-CDOR Variable Rate Coupon Merrill Lynch International CAD Apr. 9, 2017 (5,000,000) 0.996% (70,420)Fixed to Floating Interest Rate Swap – Fixed Rate Coupon TD Securities Inc. CAD May. 21, 2017 5,000,000 1.559% –Fixed to Floating Interest Rate Swap – CAD-BA-CDOR Variable Rate Coupon TD Securities Inc. CAD May. 21, 2017 (5,000,000) 0.998% (64,556)Fixed to Floating Interest Rate Swap – Fixed Rate Coupon Merrill Lynch International CAD May. 28, 2017 16,000,000 1.530% –Fixed to Floating Interest Rate Swap – CAD-BA-CDOR Variable Rate Coupon Merrill Lynch International CAD May. 28, 2017 (16,000,000) 0.998% (196,810)Fixed to Floating Interest Rate Swap – Fixed Rate Coupon Merrill Lynch International CAD Aug. 12, 2017 15,000,000 1.685% –Fixed to Floating Interest Rate Swap – CAD-BA-CDOR Variable Rate Coupon Merrill Lynch International CAD Aug. 12, 2017 (15,000,000) 0.955% (278,959)
The accompanying notes are an integral part of the financial statements.
37

Scotia Floating Rate Income Fund (Unaudited – Continued)
SCHEDULE OF INVESTMENT PORTFOLIO
INTEREST RATE SWAP CONTRACTS
Description Counterparty CurrencyTerminationDate
NotionalAmount ($)
InterestRate %
Appreciation/(Depreciation) ($)
Fixed to Floating Interest Rate Swap – Fixed Rate Coupon Merrill Lynch International CAD Nov. 30, 2017 10,000,000 1.635% –Fixed to Floating Interest Rate Swap – CAD-BA-CDOR Variable Rate Coupon Merrill Lynch International CAD Nov. 30, 2017 (10,000,000) 0.997% (166,703)Fixed to Floating Interest Rate Swap – Fixed Rate Coupon TD Securities Inc. CAD Feb. 5, 2018 25,000,000 1.731% –Fixed to Floating Interest Rate Swap – CAD-BA-CDOR Variable Rate Coupon TD Securities Inc. CAD Feb. 5, 2018 (25,000,000) 0.982% (555,138)Fixed to Floating Interest Rate Swap – Fixed Rate Coupon TD Securities Inc. CAD Feb. 6, 2018 15,000,000 1.751% –Fixed to Floating Interest Rate Swap – CAD-BA-CDOR Variable Rate Coupon TD Securities Inc. CAD Feb. 6, 2018 (15,000,000) 0.983% (341,599)Fixed to Floating Interest Rate Swap – Fixed Rate Coupon TD Securities Inc. CAD Feb. 14, 2018 15,000,000 1.804% –Fixed to Floating Interest Rate Swap – CAD-BA-CDOR Variable Rate Coupon TD Securities Inc. CAD Feb. 14, 2018 (15,000,000) 0.946% (364,932)Fixed to Floating Interest Rate Swap – Fixed Rate Coupon TD Securities Inc. CAD Feb. 21, 2018 15,000,000 1.779% –Fixed to Floating Interest Rate Swap – CAD-BA-CDOR Variable Rate Coupon TD Securities Inc. CAD Feb. 21, 2018 (15,000,000) 0.912% (354,218)Fixed to Floating Interest Rate Swap – Fixed Rate Coupon Bank of Nova Scotia, The CAD Feb. 24, 2018 5,000,000 0.933% –Fixed to Floating Interest Rate Swap – CAD-BA-CDOR Variable Rate Coupon Bank of Nova Scotia, The CAD Feb. 24, 2018 (5,000,000) 0.912% 7,350Fixed to Floating Interest Rate Swap – Fixed Rate Coupon Bank of Nova Scotia, The CAD Feb. 27, 2018 2,400,000 1.665% –Fixed to Floating Interest Rate Swap – CAD-BA-CDOR Variable Rate Coupon Bank of Nova Scotia, The CAD Feb. 27, 2018 (2,400,000) 0.974% (48,190)Fixed to Floating Interest Rate Swap – Fixed Rate Coupon TD Securities Inc. CAD Mar. 5, 2018 4,000,000 1.123% –Fixed to Floating Interest Rate Swap – CAD-BA-CDOR Variable Rate Coupon TD Securities Inc. CAD Mar. 5, 2018 (4,000,000) 1.006% (15,534)Fixed to Floating Interest Rate Swap – Fixed Rate Coupon Merrill Lynch International CAD Mar. 24, 2018 6,250,000 0.918% –Fixed to Floating Interest Rate Swap – CAD-BA-CDOR Variable Rate Coupon Merrill Lynch International CAD Mar. 24, 2018 (6,250,000) 0.990% 14,668Fixed to Floating Interest Rate Swap – Fixed Rate Coupon TD Securities Inc. CAD Apr. 9, 2018 5,000,000 1.861% –Fixed to Floating Interest Rate Swap – CAD-BA-CDOR Variable Rate Coupon TD Securities Inc. CAD Apr. 9, 2018 (5,000,000) 1.000% (127,449)Fixed to Floating Interest Rate Swap – Fixed Rate Coupon Merrill Lynch International CAD Apr. 10, 2018 10,000,000 1.823% –Fixed to Floating Interest Rate Swap – CAD-BA-CDOR Variable Rate Coupon Merrill Lynch International CAD Apr. 10, 2018 (10,000,000) 0.996% (243,196)Fixed to Floating Interest Rate Swap – Fixed Rate Coupon Merrill Lynch International CAD May. 6, 2018 5,000,000 1.815% –Fixed to Floating Interest Rate Swap – CAD-BA-CDOR Variable Rate Coupon Merrill Lynch International CAD May. 6, 2018 (5,000,000) 0.998% (119,172)Fixed to Floating Interest Rate Swap – Fixed Rate Coupon Merrill Lynch International CAD Jun. 9, 2018 4,000,000 1.785% –Fixed to Floating Interest Rate Swap – CAD-BA-CDOR Variable Rate Coupon Merrill Lynch International CAD Jun. 9, 2018 (4,000,000) 0.998% (90,293)Fixed to Floating Interest Rate Swap – Fixed Rate Coupon Merrill Lynch International CAD Sep. 20, 2018 7,400,000 0.968% –Fixed to Floating Interest Rate Swap – CAD-BA-CDOR Variable Rate Coupon Merrill Lynch International CAD Sep. 20, 2018 (7,400,000) 0.990% 22,196Fixed to Floating Interest Rate Swap – Fixed Rate Coupon TD Securities Inc. CAD Feb. 4, 2019 1,000,000 1.906% –Fixed to Floating Interest Rate Swap – CAD-BA-CDOR Variable Rate Coupon TD Securities Inc. CAD Feb. 4, 2019 (1,000,000) 0.997% (31,634)Fixed to Floating Interest Rate Swap – Fixed Rate Coupon TD Securities Inc. CAD Feb. 4, 2019 5,000,000 1.933% –Fixed to Floating Interest Rate Swap – CAD-BA-CDOR Variable Rate Coupon TD Securities Inc. CAD Feb. 4, 2019 (5,000,000) 0.992% (163,441)Fixed to Floating Interest Rate Swap – Fixed Rate Coupon TD Securities Inc. CAD Feb. 5, 2019 25,000,000 1.970% –Fixed to Floating Interest Rate Swap – CAD-BA-CDOR Variable Rate Coupon TD Securities Inc. CAD Feb. 5, 2019 (25,000,000) 0.982% (853,935)Fixed to Floating Interest Rate Swap – Fixed Rate Coupon Merrill Lynch International CAD Feb. 6, 2019 20,000,000 1.995% –Fixed to Floating Interest Rate Swap – CAD-BA-CDOR Variable Rate Coupon Merrill Lynch International CAD Feb. 6, 2019 (20,000,000) 0.983% (702,410)Fixed to Floating Interest Rate Swap – Fixed Rate Coupon Merrill Lynch International CAD Feb. 11, 2019 20,000,000 2.003% –Fixed to Floating Interest Rate Swap – CAD-BA-CDOR Variable Rate Coupon Merrill Lynch International CAD Feb. 11, 2019 (20,000,000) 0.959% (707,490)Fixed to Floating Interest Rate Swap – Fixed Rate Coupon Merrill Lynch International CAD Feb. 26, 2019 10,000,000 1.950% –Fixed to Floating Interest Rate Swap – CAD-BA-CDOR Variable Rate Coupon Merrill Lynch International CAD Feb. 26, 2019 (10,000,000) 0.968% (330,060)Fixed to Floating Interest Rate Swap – Fixed Rate Coupon Bank of Nova Scotia, The CAD Mar. 5, 2019 4,500,000 1.244% –Fixed to Floating Interest Rate Swap – CAD-BA-CDOR Variable Rate Coupon Bank of Nova Scotia, The CAD Mar. 5, 2019 (4,500,000) 1.006% (22,724)Fixed to Floating Interest Rate Swap – Fixed Rate Coupon Merrill Lynch International CAD Mar. 27, 2019 3,800,000 1.105% –Fixed to Floating Interest Rate Swap – CAD-BA-CDOR Variable Rate Coupon Merrill Lynch International CAD Mar. 27, 2019 (3,800,000) 1.000% 2,986Fixed to Floating Interest Rate Swap – Fixed Rate Coupon Merrill Lynch International CAD Apr. 4, 2019 5,000,000 2.100% –Fixed to Floating Interest Rate Swap – CAD-BA-CDOR Variable Rate Coupon Merrill Lynch International CAD Apr. 4, 2019 (5,000,000) 1.000% (190,279)Fixed to Floating Interest Rate Swap – Fixed Rate Coupon Merrill Lynch International CAD May. 13, 2019 5,500,000 2.005% –Fixed to Floating Interest Rate Swap – CAD-BA-CDOR Variable Rate Coupon Merrill Lynch International CAD May. 13, 2019 (5,500,000) 0.996% (184,686)Fixed to Floating Interest Rate Swap – Fixed Rate Coupon TD Securities Inc. CAD May. 15, 2019 4,000,000 1.888% –Fixed to Floating Interest Rate Swap – CAD-BA-CDOR Variable Rate Coupon TD Securities Inc. CAD May. 15, 2019 (4,000,000) 0.996% (115,756)Fixed to Floating Interest Rate Swap – Fixed Rate Coupon TD Securities Inc. CAD May. 22, 2019 5,000,000 1.970% –Fixed to Floating Interest Rate Swap – CAD-BA-CDOR Variable Rate Coupon TD Securities Inc. CAD May. 22, 2019 (5,000,000) 0.998% (160,070)Fixed to Floating Interest Rate Swap – Fixed Rate Coupon Merrill Lynch International CAD Jun. 3, 2019 3,000,000 1.993% –Fixed to Floating Interest Rate Swap – CAD-BA-CDOR Variable Rate Coupon Merrill Lynch International CAD Jun. 3, 2019 (3,000,000) 0.990% (97,934)Fixed to Floating Interest Rate Swap – Fixed Rate Coupon Merrill Lynch International CAD Jun. 11, 2019 8,500,000 1.995% –Fixed to Floating Interest Rate Swap – CAD-BA-CDOR Variable Rate Coupon Merrill Lynch International CAD Jun. 11, 2019 (8,500,000) 0.998% (276,689)Fixed to Floating Interest Rate Swap – Fixed Rate Coupon Merrill Lynch International CAD Jun. 17, 2019 45,000,000 2.000% –Fixed to Floating Interest Rate Swap – CAD-BA-CDOR Variable Rate Coupon Merrill Lynch International CAD Jun. 17, 2019 (45,000,000) 0.998% (1,467,436)Fixed to Floating Interest Rate Swap – Fixed Rate Coupon Merrill Lynch International CAD Jul. 11, 2019 10,000,000 1.958% –Fixed to Floating Interest Rate Swap – CAD-BA-CDOR Variable Rate Coupon Merrill Lynch International CAD Jul. 11, 2019 (10,000,000) 1.298% (344,065)Fixed to Floating Interest Rate Swap – Fixed Rate Coupon TD Securities Inc. CAD Sep. 17, 2019 5,000,000 2.053% –Fixed to Floating Interest Rate Swap – CAD-BA-CDOR Variable Rate Coupon TD Securities Inc. CAD Sep. 17, 2019 (5,000,000) 1.000% (189,016)Fixed to Floating Interest Rate Swap – Fixed Rate Coupon Merrill Lynch International CAD Sep. 24, 2019 4,000,000 2.025% –Fixed to Floating Interest Rate Swap – CAD-BA-CDOR Variable Rate Coupon Merrill Lynch International CAD Sep. 24, 2019 (4,000,000) 0.990% (145,775)Fixed to Floating Interest Rate Swap – Fixed Rate Coupon Bank of Nova Scotia, The CAD Oct. 21, 2019 2,500,000 1.808% –Fixed to Floating Interest Rate Swap – CAD-BA-CDOR Variable Rate Coupon Bank of Nova Scotia, The CAD Oct. 21, 2019 (2,500,000) 0.996% (65,421)Fixed to Floating Interest Rate Swap – Fixed Rate Coupon Bank of Nova Scotia, The CAD Oct. 24, 2019 2,750,000 1.876% –Fixed to Floating Interest Rate Swap – CAD-BA-CDOR Variable Rate Coupon Bank of Nova Scotia, The CAD Oct. 24, 2019 (2,750,000) 0.996% (80,057)Fixed to Floating Interest Rate Swap – Fixed Rate Coupon Merrill Lynch International CAD Nov. 14, 2019 3,000,000 1.898% –Fixed to Floating Interest Rate Swap – CAD-BA-CDOR Variable Rate Coupon Merrill Lynch International CAD Nov. 14, 2019 (3,000,000) 0.996% (88,607)Fixed to Floating Interest Rate Swap – Fixed Rate Coupon Merrill Lynch International CAD Nov. 21, 2019 2,500,000 1.910% –Fixed to Floating Interest Rate Swap – CAD-BA-CDOR Variable Rate Coupon Merrill Lynch International CAD Nov. 21, 2019 (2,500,000) 0.998% (74,733)Fixed to Floating Interest Rate Swap – Fixed Rate Coupon Bank of Nova Scotia, The CAD Dec. 3, 2019 2,500,000 1.889% –Fixed to Floating Interest Rate Swap – CAD-BA-CDOR Variable Rate Coupon Bank of Nova Scotia, The CAD Dec. 3, 2019 (2,500,000) 0.990% (71,607)Fixed to Floating Interest Rate Swap – Fixed Rate Coupon Merrill Lynch International CAD Feb. 6, 2020 10,000,000 2.208% –Fixed to Floating Interest Rate Swap – CAD-BA-CDOR Variable Rate Coupon Merrill Lynch International CAD Feb. 6, 2020 (10,000,000) 0.983% (468,449)Fixed to Floating Interest Rate Swap – Fixed Rate Coupon Merrill Lynch International CAD Feb. 7, 2020 10,000,000 2.188% –Fixed to Floating Interest Rate Swap – CAD-BA-CDOR Variable Rate Coupon Merrill Lynch International CAD Feb. 7, 2020 (10,000,000) 0.978% (457,923)
The accompanying notes are an integral part of the financial statements.
38
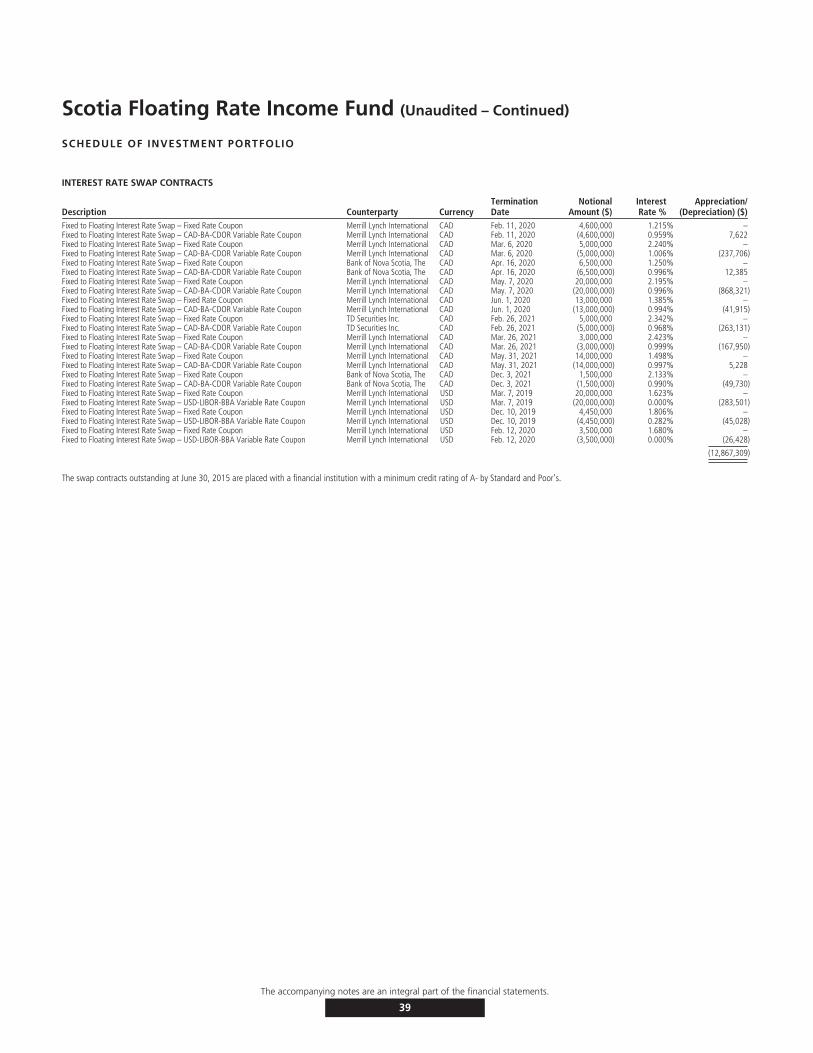
Scotia Floating Rate Income Fund (Unaudited – Continued)
SCHEDULE OF INVESTMENT PORTFOLIO
INTEREST RATE SWAP CONTRACTS
Description Counterparty CurrencyTerminationDate
NotionalAmount ($)
InterestRate %
Appreciation/(Depreciation) ($)
Fixed to Floating Interest Rate Swap – Fixed Rate Coupon Merrill Lynch International CAD Feb. 11, 2020 4,600,000 1.215% –Fixed to Floating Interest Rate Swap – CAD-BA-CDOR Variable Rate Coupon Merrill Lynch International CAD Feb. 11, 2020 (4,600,000) 0.959% 7,622Fixed to Floating Interest Rate Swap – Fixed Rate Coupon Merrill Lynch International CAD Mar. 6, 2020 5,000,000 2.240% –Fixed to Floating Interest Rate Swap – CAD-BA-CDOR Variable Rate Coupon Merrill Lynch International CAD Mar. 6, 2020 (5,000,000) 1.006% (237,706)Fixed to Floating Interest Rate Swap – Fixed Rate Coupon Bank of Nova Scotia, The CAD Apr. 16, 2020 6,500,000 1.250% –Fixed to Floating Interest Rate Swap – CAD-BA-CDOR Variable Rate Coupon Bank of Nova Scotia, The CAD Apr. 16, 2020 (6,500,000) 0.996% 12,385Fixed to Floating Interest Rate Swap – Fixed Rate Coupon Merrill Lynch International CAD May. 7, 2020 20,000,000 2.195% –Fixed to Floating Interest Rate Swap – CAD-BA-CDOR Variable Rate Coupon Merrill Lynch International CAD May. 7, 2020 (20,000,000) 0.996% (868,321)Fixed to Floating Interest Rate Swap – Fixed Rate Coupon Merrill Lynch International CAD Jun. 1, 2020 13,000,000 1.385% –Fixed to Floating Interest Rate Swap – CAD-BA-CDOR Variable Rate Coupon Merrill Lynch International CAD Jun. 1, 2020 (13,000,000) 0.994% (41,915)Fixed to Floating Interest Rate Swap – Fixed Rate Coupon TD Securities Inc. CAD Feb. 26, 2021 5,000,000 2.342% –Fixed to Floating Interest Rate Swap – CAD-BA-CDOR Variable Rate Coupon TD Securities Inc. CAD Feb. 26, 2021 (5,000,000) 0.968% (263,131)Fixed to Floating Interest Rate Swap – Fixed Rate Coupon Merrill Lynch International CAD Mar. 26, 2021 3,000,000 2.423% –Fixed to Floating Interest Rate Swap – CAD-BA-CDOR Variable Rate Coupon Merrill Lynch International CAD Mar. 26, 2021 (3,000,000) 0.999% (167,950)Fixed to Floating Interest Rate Swap – Fixed Rate Coupon Merrill Lynch International CAD May. 31, 2021 14,000,000 1.498% –Fixed to Floating Interest Rate Swap – CAD-BA-CDOR Variable Rate Coupon Merrill Lynch International CAD May. 31, 2021 (14,000,000) 0.997% 5,228Fixed to Floating Interest Rate Swap – Fixed Rate Coupon Bank of Nova Scotia, The CAD Dec. 3, 2021 1,500,000 2.133% –Fixed to Floating Interest Rate Swap – CAD-BA-CDOR Variable Rate Coupon Bank of Nova Scotia, The CAD Dec. 3, 2021 (1,500,000) 0.990% (49,730)Fixed to Floating Interest Rate Swap – Fixed Rate Coupon Merrill Lynch International USD Mar. 7, 2019 20,000,000 1.623% –Fixed to Floating Interest Rate Swap – USD-LIBOR-BBA Variable Rate Coupon Merrill Lynch International USD Mar. 7, 2019 (20,000,000) 0.000% (283,501)Fixed to Floating Interest Rate Swap – Fixed Rate Coupon Merrill Lynch International USD Dec. 10, 2019 4,450,000 1.806% –Fixed to Floating Interest Rate Swap – USD-LIBOR-BBA Variable Rate Coupon Merrill Lynch International USD Dec. 10, 2019 (4,450,000) 0.282% (45,028)Fixed to Floating Interest Rate Swap – Fixed Rate Coupon Merrill Lynch International USD Feb. 12, 2020 3,500,000 1.680% –Fixed to Floating Interest Rate Swap – USD-LIBOR-BBA Variable Rate Coupon Merrill Lynch International USD Feb. 12, 2020 (3,500,000) 0.000% (26,428)
(12,867,309)
The swap contracts outstanding at June 30, 2015 are placed with a financial institution with a minimum credit rating of A- by Standard and Poor’s.
The accompanying notes are an integral part of the financial statements.
39
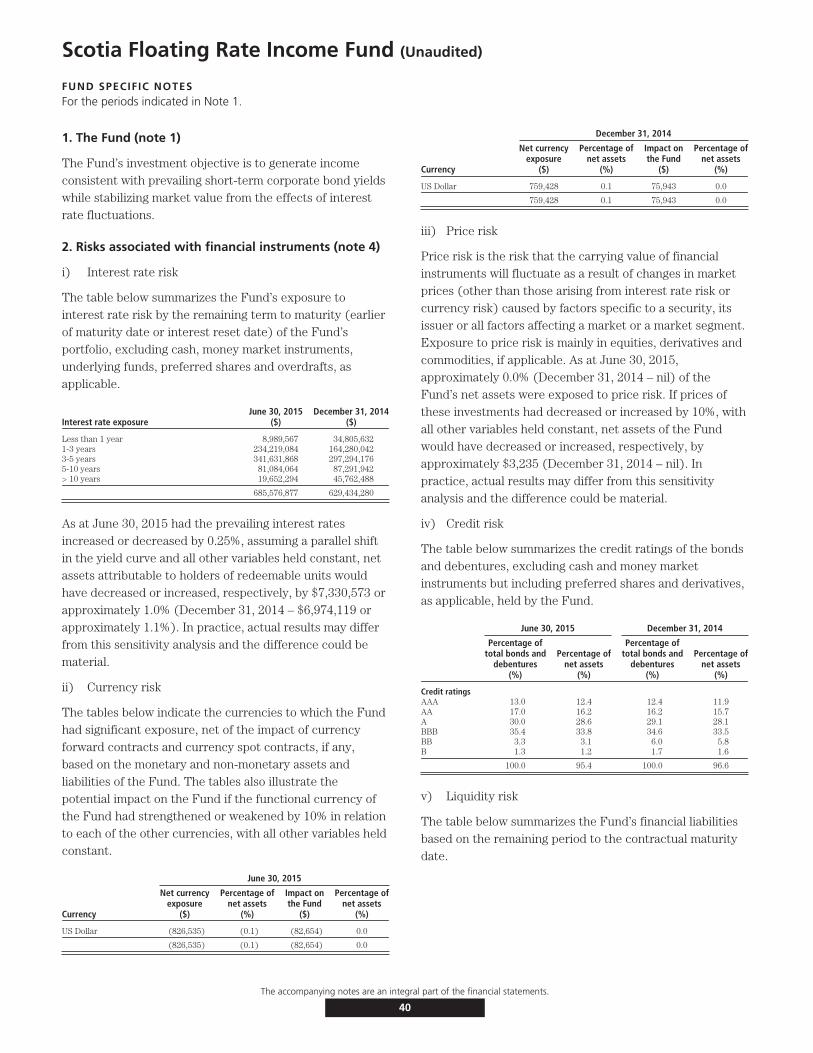
Scotia Floating Rate Income Fund (Unaudited)
FUND SPECIFIC NOTESFor the periods indicated in Note 1.
1. The Fund (note 1)
The Fund’s investment objective is to generate incomeconsistent with prevailing short-term corporate bond yieldswhile stabilizing market value from the effects of interestrate fluctuations.
2. Risks associated with financial instruments (note 4)
i) Interest rate risk
The table below summarizes the Fund’s exposure tointerest rate risk by the remaining term to maturity (earlierof maturity date or interest reset date) of the Fund’sportfolio, excluding cash, money market instruments,underlying funds, preferred shares and overdrafts, asapplicable.
Interest rate exposureJune 30, 2015
($)December 31, 2014
($)
Less than 1 year 8,989,567 34,805,6321-3 years 234,219,084 164,280,0423-5 years 341,631,868 297,294,1765-10 years 81,084,064 87,291,942> 10 years 19,652,294 45,762,488
685,576,877 629,434,280
As at June 30, 2015 had the prevailing interest ratesincreased or decreased by 0.25%, assuming a parallel shiftin the yield curve and all other variables held constant, netassets attributable to holders of redeemable units wouldhave decreased or increased, respectively, by $7,330,573 orapproximately 1.0% (December 31, 2014 – $6,974,119 orapproximately 1.1%). In practice, actual results may differfrom this sensitivity analysis and the difference could bematerial.
ii) Currency risk
The tables below indicate the currencies to which the Fundhad significant exposure, net of the impact of currencyforward contracts and currency spot contracts, if any,based on the monetary and non-monetary assets andliabilities of the Fund. The tables also illustrate thepotential impact on the Fund if the functional currency ofthe Fund had strengthened or weakened by 10% in relationto each of the other currencies, with all other variables heldconstant.
June 30, 2015
Currency
Net currencyexposure
($)
Percentage ofnet assets
(%)
Impact onthe Fund
($)
Percentage ofnet assets
(%)
US Dollar (826,535) (0.1) (82,654) 0.0
(826,535) (0.1) (82,654) 0.0
December 31, 2014
Currency
Net currencyexposure
($)
Percentage ofnet assets
(%)
Impact onthe Fund
($)
Percentage ofnet assets
(%)
US Dollar 759,428 0.1 75,943 0.0
759,428 0.1 75,943 0.0
iii) Price risk
Price risk is the risk that the carrying value of financialinstruments will fluctuate as a result of changes in marketprices (other than those arising from interest rate risk orcurrency risk) caused by factors specific to a security, itsissuer or all factors affecting a market or a market segment.Exposure to price risk is mainly in equities, derivatives andcommodities, if applicable. As at June 30, 2015,approximately 0.0% (December 31, 2014 – nil) of theFund’s net assets were exposed to price risk. If prices ofthese investments had decreased or increased by 10%, withall other variables held constant, net assets of the Fundwould have decreased or increased, respectively, byapproximately $3,235 (December 31, 2014 – nil). Inpractice, actual results may differ from this sensitivityanalysis and the difference could be material.
iv) Credit risk
The table below summarizes the credit ratings of the bondsand debentures, excluding cash and money marketinstruments but including preferred shares and derivatives,as applicable, held by the Fund.
June 30, 2015 December 31, 2014
Percentage oftotal bonds and
debentures(%)
Percentage ofnet assets
(%)
Percentage oftotal bonds and
debentures(%)
Percentage ofnet assets
(%)
Credit ratingsAAA 13.0 12.4 12.4 11.9AA 17.0 16.2 16.2 15.7A 30.0 28.6 29.1 28.1BBB 35.4 33.8 34.6 33.5BB 3.3 3.1 6.0 5.8B 1.3 1.2 1.7 1.6
100.0 95.4 100.0 96.6
v) Liquidity risk
The table below summarizes the Fund’s financial liabilitiesbased on the remaining period to the contractual maturitydate.
The accompanying notes are an integral part of the financial statements.
40
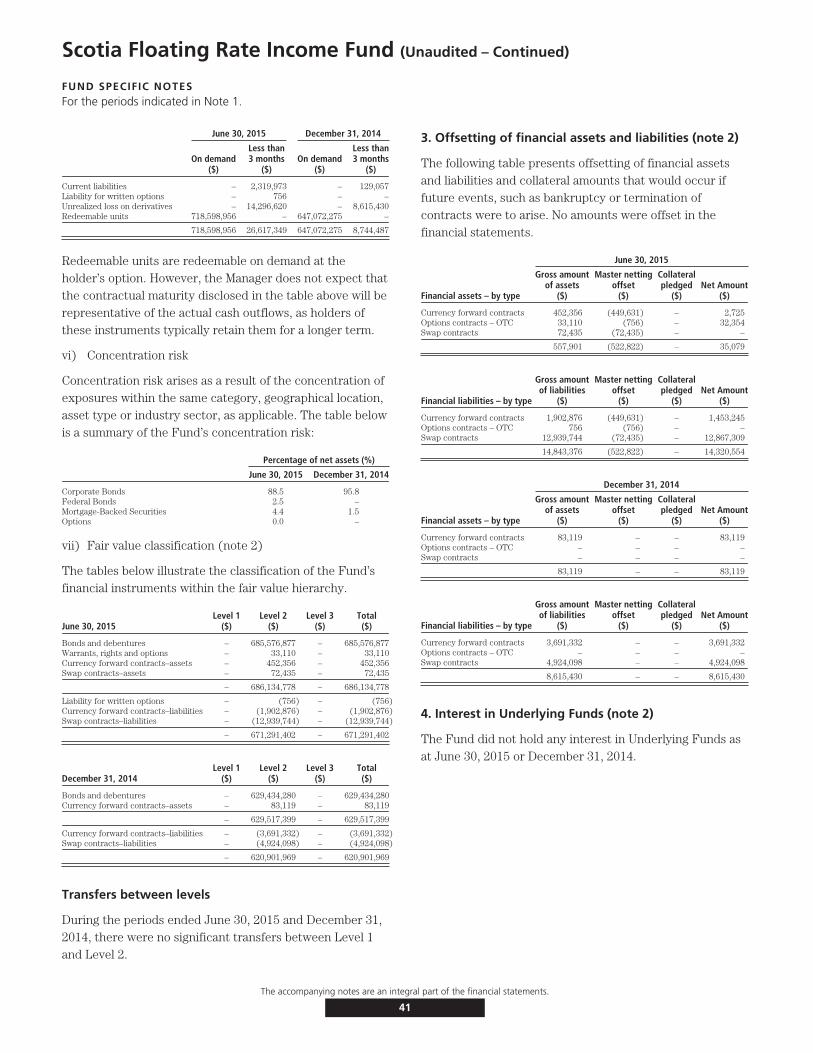
Scotia Floating Rate Income Fund (Unaudited – Continued)
FUND SPECIFIC NOTESFor the periods indicated in Note 1.
June 30, 2015 December 31, 2014
On demand($)
Less than3 months
($)On demand
($)
Less than3 months
($)
Current liabilities – 2,319,973 – 129,057Liability for written options – 756 – –Unrealized loss on derivatives – 14,296,620 – 8,615,430Redeemable units 718,598,956 – 647,072,275 –
718,598,956 26,617,349 647,072,275 8,744,487
Redeemable units are redeemable on demand at theholder’s option. However, the Manager does not expect thatthe contractual maturity disclosed in the table above will berepresentative of the actual cash outflows, as holders ofthese instruments typically retain them for a longer term.
vi) Concentration risk
Concentration risk arises as a result of the concentration ofexposures within the same category, geographical location,asset type or industry sector, as applicable. The table belowis a summary of the Fund’s concentration risk:
Percentage of net assets (%)
June 30, 2015 December 31, 2014
Corporate Bonds 88.5 95.8Federal Bonds 2.5 –Mortgage-Backed Securities 4.4 1.5Options 0.0 –
vii) Fair value classification (note 2)
The tables below illustrate the classification of the Fund’sfinancial instruments within the fair value hierarchy.
June 30, 2015Level 1
($)Level 2
($)Level 3
($)Total($)
Bonds and debentures – 685,576,877 – 685,576,877Warrants, rights and options – 33,110 – 33,110Currency forward contracts–assets – 452,356 – 452,356Swap contracts–assets – 72,435 – 72,435
– 686,134,778 – 686,134,778
Liability for written options – (756) – (756)Currency forward contracts–liabilities – (1,902,876) – (1,902,876)Swap contracts–liabilities – (12,939,744) – (12,939,744)
– 671,291,402 – 671,291,402
December 31, 2014Level 1
($)Level 2
($)Level 3
($)Total($)
Bonds and debentures – 629,434,280 – 629,434,280Currency forward contracts–assets – 83,119 – 83,119
– 629,517,399 – 629,517,399
Currency forward contracts–liabilities – (3,691,332) – (3,691,332)Swap contracts–liabilities – (4,924,098) – (4,924,098)
– 620,901,969 – 620,901,969
Transfers between levels
During the periods ended June 30, 2015 and December 31,2014, there were no significant transfers between Level 1and Level 2.
3. Offsetting of financial assets and liabilities (note 2)
The following table presents offsetting of financial assetsand liabilities and collateral amounts that would occur iffuture events, such as bankruptcy or termination ofcontracts were to arise. No amounts were offset in thefinancial statements.
June 30, 2015
Financial assets – by type
Gross amountof assets
($)
Master nettingoffset
($)
Collateralpledged
($)Net Amount
($)
Currency forward contracts 452,356 (449,631) – 2,725Options contracts – OTC 33,110 (756) – 32,354Swap contracts 72,435 (72,435) – –
557,901 (522,822) – 35,079
Financial liabilities – by type
Gross amountof liabilities
($)
Master nettingoffset
($)
Collateralpledged
($)Net Amount
($)
Currency forward contracts 1,902,876 (449,631) – 1,453,245Options contracts – OTC 756 (756) – –Swap contracts 12,939,744 (72,435) – 12,867,309
14,843,376 (522,822) – 14,320,554
December 31, 2014
Financial assets – by type
Gross amountof assets
($)
Master nettingoffset
($)
Collateralpledged
($)Net Amount
($)
Currency forward contracts 83,119 – – 83,119Options contracts – OTC – – – –Swap contracts – – – –
83,119 – – 83,119
Financial liabilities – by type
Gross amountof liabilities
($)
Master nettingoffset
($)
Collateralpledged
($)Net Amount
($)
Currency forward contracts 3,691,332 – – 3,691,332Options contracts – OTC – – – –Swap contracts 4,924,098 – – 4,924,098
8,615,430 – – 8,615,430
4. Interest in Underlying Funds (note 2)
The Fund did not hold any interest in Underlying Funds asat June 30, 2015 or December 31, 2014.
The accompanying notes are an integral part of the financial statements.
41

Scotia Floating Rate Income Fund (Unaudited – Continued)
FUND SPECIFIC NOTESFor the periods indicated in Note 1.
5. Comparison of net asset value per unit and netassets per unit (note 2)
The table below provides a comparison of the net assetvalue per unit and net assets per unit. The primary reasonfor the difference between the net asset value per unit andnet assets per unit, if any, is described in note 2.
June 30, 2015 December 31, 2014
Net asset valueper unit
($)
Net assetsper unit
($)
Net asset valueper unit
($)
Net assetsper unit
($)
Series I 9.95 9.95 9.99 9.99
Series M 9.94 9.94 9.98 9.98
The accompanying notes are an integral part of the financial statements.
42

Scotia Conservative Income Fund (Unaudited)
STATEMENTS OF FINANCIAL POSITIONAs at
June 30,2015
December 31,2014
ASSETSCurrent assetsInvestments
Non-derivative financial assets $6,104,590 $5,333,659Cash 121,810 94,641Subscriptions receivable 11,675 4,327Accrued investment income and other 80 74
6,238,155 5,432,701
LIABILITIESCurrent liabilitiesManagement fee payable 6,574 –Redemptions payable 3,300 –Accrued expenses 599 –Distributions payable 353 54
10,826 54
Net assets attributable to holders of redeemable units $6,227,329 $5,432,647
NET ASSETS ATTRIBUTABLE TO HOLDERS OF REDEEMABLE UNITSPER SERIES
Series A $6,227,329 $5,432,647
NET ASSETS ATTRIBUTABLE TO HOLDERS OF REDEEMABLE UNITSPER UNIT
Series A $ 9.90 $ 9.98
STATEMENTS OF COMPREHENSIVE INCOMEFor the six month periods ended June 30,
2015 2014INCOMENet gain (loss) on investments (note 2)
Dividends $ 489 $ 362Interest for distribution purposes 71,170 32,455Net realized gain (loss) on non-derivative financial assets (102) 3,255Change in unrealized gain (loss) on non-derivative financial assets (45,265) 4,328
Net gain (loss) on investments 26,292 40,400Other income 76 28
Total income (loss) 26,368 40,428
EXPENSESManagement fees (note 5) 30,304 10,747Fixed administration fees (note 6) 2,756 –Independent Review Committee fees 4 3Interest expense and bank overdraft charges 208 209Audit fees – 20Legal fees – 6Unitholder administration costs – 196Unitholder reporting costs – 1,756Harmonized Sales Tax/Goods and Services Tax 3,683 1,444
Total expenses 36,955 14,381Expenses absorbed by the Manager – (566)
Net expenses 36,955 13,815
Increase (decrease) in net assets attributable to holders of redeemable unitsfrom operations $ (10,587) $ 26,613
INCREASE (DECREASE) IN NET ASSETS ATTRIBUTABLE TO HOLDERS OFREDEEMABLE UNITS FROM OPERATIONS PER SERIES
Series A $ (10,587) $ 26,613
INCREASE (DECREASE) IN NET ASSETS ATTRIBUTABLE TO HOLDERS OFREDEEMABLE UNITS FROM OPERATIONS PER UNIT†
Series A $ (0.02) $ 0.12
WEIGHTED AVERAGE NUMBER OF UNITS PER SERIESSeries A 558,345 216,266
† The increase (decrease) in net assets attributable to holders of redeemable units fromoperations per unit is calculated by dividing the increase (decrease) in net assetsattributable to holders of redeemable units from operations per series by the weightedaverage number of units per series.
STATEMENTS OF CHANGES IN NET ASSETSATTRIBUTABLE TO HOLDERS OF REDEEMABLE UNITSFor the six month periods ended June 30,
2015 2014NET ASSETS ATTRIBUTABLE TO HOLDERS OF REDEEMABLE UNITS,
BEGINNING OF PERIODSeries A $ 5,432,647 $ –
INCREASE (DECREASE) IN NET ASSETS ATTRIBUTABLE TO HOLDERS OFREDEEMABLE UNITS FROM OPERATIONS
Series A (10,587) 26,613
DISTRIBUTIONS TO HOLDERS OF REDEEMABLE UNITSFrom net investment income
Series A (34,780) (19,031)
REDEEMABLE UNIT TRANSACTIONSProceeds from issue
Series A 2,373,121 4,244,915Reinvested distributions
Series A 33,713 18,721Payments on redemption
Series A (1,566,785) (1,103,115)
840,049 3,160,521
INCREASE (DECREASE) IN NET ASSETS ATTRIBUTABLE TO HOLDERS OFREDEEMABLE UNITS
Series A 794,682 3,168,103
NET ASSETS ATTRIBUTABLE TO HOLDERS OF REDEEMABLE UNITS, ENDOF PERIOD
Series A $ 6,227,329 $ 3,168,103
STATEMENTS OF CASH FLOWSFor the six month periods ended June 30,
2015 2014CASH FLOWS FROM OPERATING ACTIVITIESIncrease (decrease) in net assets attributable to holders of redeemable
units $ (10,587) $ 26,613Adjustments for:
Net realized (gain) loss on non-derivative financial assets 102 (3,255)Change in unrealized (gain) loss on non-derivative financial assets 45,265 (4,328)Purchases of non-derivative financial assets (1,512,348) (4,021,595)Proceeds from sale of non-derivative financial assets 696,050 867,584Accrued investment income and other (6) (40)Accrued expenses 7,173 3,657
Net cash provided by (used in) operating activities (774,351) (3,131,364)CASH FLOWS FROM FINANCING ACTIVITIESProceeds from issue of redeemable units 2,365,773 4,244,330Amounts paid on redemption of redeemable units (1,563,485) (1,033,452)Distributions to unitholders of redeemable units (768) (137)
Net cash provided by (used in) financing activities 801,520 3,210,741Net increase (decrease) in cash 27,169 79,377Cash (bank overdraft), beginning of period 94,641 –
CASH (BANK OVERDRAFT), END OF PERIOD $ 121,810 $ 79,377
Interest paid(1) 208 –Interest received(1) 71,163 32,415Dividends received, net of withholding taxes(1) 489 362
(1) Classified as operating items.
The accompanying notes are an integral part of the financial statements.
43
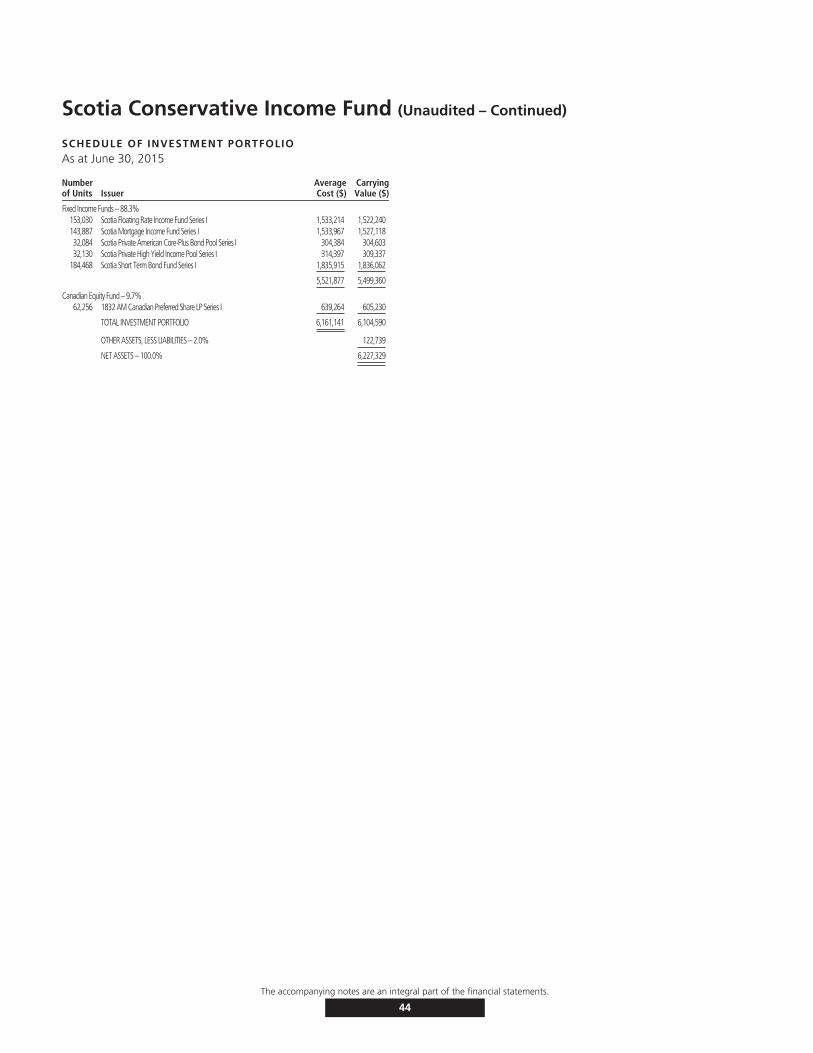
Scotia Conservative Income Fund (Unaudited – Continued)
SCHEDULE OF INVESTMENT PORTFOLIOAs at June 30, 2015
Numberof Units Issuer
AverageCost ($)
CarryingValue ($)
Fixed Income Funds – 88.3%153,030 Scotia Floating Rate Income Fund Series I 1,533,214 1,522,240143,887 Scotia Mortgage Income Fund Series I 1,533,967 1,527,11832,084 Scotia Private American Core-Plus Bond Pool Series I 304,384 304,60332,130 Scotia Private High Yield Income Pool Series I 314,397 309,337
184,468 Scotia Short Term Bond Fund Series I 1,835,915 1,836,062
5,521,877 5,499,360
Canadian Equity Fund – 9.7%62,256 1832 AM Canadian Preferred Share LP Series I 639,264 605,230
TOTAL INVESTMENT PORTFOLIO 6,161,141 6,104,590
OTHER ASSETS, LESS LIABILITIES – 2.0% 122,739
NET ASSETS – 100.0% 6,227,329
The accompanying notes are an integral part of the financial statements.
44
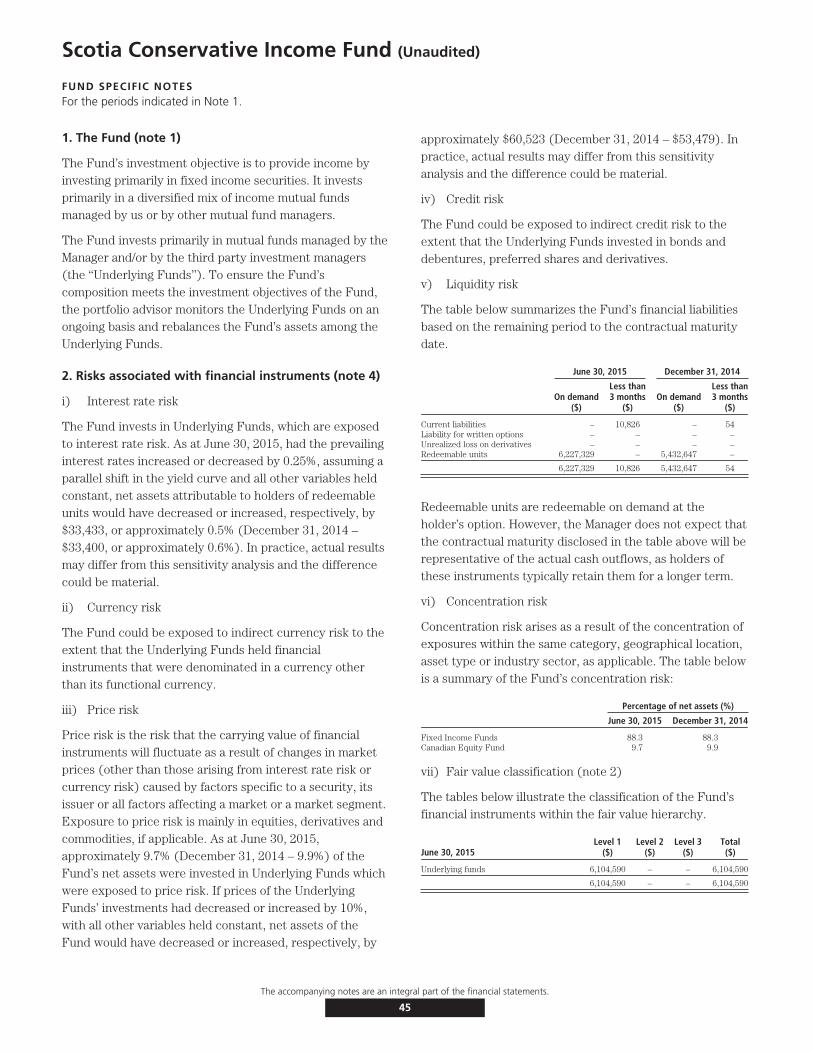
Scotia Conservative Income Fund (Unaudited)
FUND SPECIFIC NOTESFor the periods indicated in Note 1.
1. The Fund (note 1)
The Fund’s investment objective is to provide income byinvesting primarily in fixed income securities. It investsprimarily in a diversified mix of income mutual fundsmanaged by us or by other mutual fund managers.
The Fund invests primarily in mutual funds managed by theManager and/or by the third party investment managers(the ‘‘Underlying Funds’’). To ensure the Fund’scomposition meets the investment objectives of the Fund,the portfolio advisor monitors the Underlying Funds on anongoing basis and rebalances the Fund’s assets among theUnderlying Funds.
2. Risks associated with financial instruments (note 4)
i) Interest rate risk
The Fund invests in Underlying Funds, which are exposedto interest rate risk. As at June 30, 2015, had the prevailinginterest rates increased or decreased by 0.25%, assuming aparallel shift in the yield curve and all other variables heldconstant, net assets attributable to holders of redeemableunits would have decreased or increased, respectively, by$33,433, or approximately 0.5% (December 31, 2014 –$33,400, or approximately 0.6%). In practice, actual resultsmay differ from this sensitivity analysis and the differencecould be material.
ii) Currency risk
The Fund could be exposed to indirect currency risk to theextent that the Underlying Funds held financialinstruments that were denominated in a currency otherthan its functional currency.
iii) Price risk
Price risk is the risk that the carrying value of financialinstruments will fluctuate as a result of changes in marketprices (other than those arising from interest rate risk orcurrency risk) caused by factors specific to a security, itsissuer or all factors affecting a market or a market segment.Exposure to price risk is mainly in equities, derivatives andcommodities, if applicable. As at June 30, 2015,approximately 9.7% (December 31, 2014 – 9.9%) of theFund’s net assets were invested in Underlying Funds whichwere exposed to price risk. If prices of the UnderlyingFunds’ investments had decreased or increased by 10%,with all other variables held constant, net assets of theFund would have decreased or increased, respectively, by
approximately $60,523 (December 31, 2014 – $53,479). Inpractice, actual results may differ from this sensitivityanalysis and the difference could be material.
iv) Credit risk
The Fund could be exposed to indirect credit risk to theextent that the Underlying Funds invested in bonds anddebentures, preferred shares and derivatives.
v) Liquidity risk
The table below summarizes the Fund’s financial liabilitiesbased on the remaining period to the contractual maturitydate.
June 30, 2015 December 31, 2014
On demand($)
Less than3 months
($)On demand
($)
Less than3 months
($)
Current liabilities – 10,826 – 54Liability for written options – – – –Unrealized loss on derivatives – – – –Redeemable units 6,227,329 – 5,432,647 –
6,227,329 10,826 5,432,647 54
Redeemable units are redeemable on demand at theholder’s option. However, the Manager does not expect thatthe contractual maturity disclosed in the table above will berepresentative of the actual cash outflows, as holders ofthese instruments typically retain them for a longer term.
vi) Concentration risk
Concentration risk arises as a result of the concentration ofexposures within the same category, geographical location,asset type or industry sector, as applicable. The table belowis a summary of the Fund’s concentration risk:
Percentage of net assets (%)
June 30, 2015 December 31, 2014
Fixed Income Funds 88.3 88.3Canadian Equity Fund 9.7 9.9
vii) Fair value classification (note 2)
The tables below illustrate the classification of the Fund’sfinancial instruments within the fair value hierarchy.
June 30, 2015Level 1
($)Level 2
($)Level 3
($)Total($)
Underlying funds 6,104,590 – – 6,104,590
6,104,590 – – 6,104,590
The accompanying notes are an integral part of the financial statements.
45
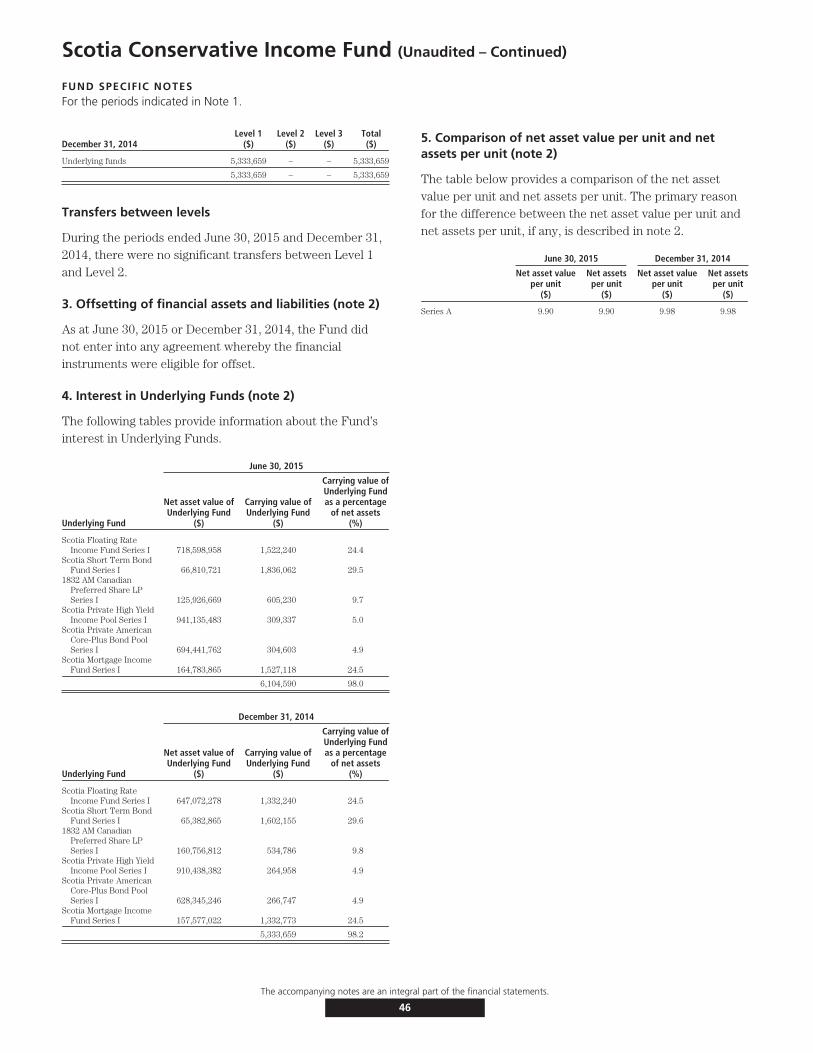
Scotia Conservative Income Fund (Unaudited – Continued)
FUND SPECIFIC NOTESFor the periods indicated in Note 1.
December 31, 2014Level 1
($)Level 2
($)Level 3
($)Total($)
Underlying funds 5,333,659 – – 5,333,659
5,333,659 – – 5,333,659
Transfers between levels
During the periods ended June 30, 2015 and December 31,2014, there were no significant transfers between Level 1and Level 2.
3. Offsetting of financial assets and liabilities (note 2)
As at June 30, 2015 or December 31, 2014, the Fund didnot enter into any agreement whereby the financialinstruments were eligible for offset.
4. Interest in Underlying Funds (note 2)
The following tables provide information about the Fund’sinterest in Underlying Funds.
June 30, 2015
Underlying Fund
Net asset value ofUnderlying Fund
($)
Carrying value ofUnderlying Fund
($)
Carrying value ofUnderlying Fundas a percentage
of net assets(%)
Scotia Floating RateIncome Fund Series I 718,598,958 1,522,240 24.4
Scotia Short Term BondFund Series I 66,810,721 1,836,062 29.5
1832 AM CanadianPreferred Share LPSeries I 125,926,669 605,230 9.7
Scotia Private High YieldIncome Pool Series I 941,135,483 309,337 5.0
Scotia Private AmericanCore-Plus Bond PoolSeries I 694,441,762 304,603 4.9
Scotia Mortgage IncomeFund Series I 164,783,865 1,527,118 24.5
6,104,590 98.0
December 31, 2014
Underlying Fund
Net asset value ofUnderlying Fund
($)
Carrying value ofUnderlying Fund
($)
Carrying value ofUnderlying Fundas a percentage
of net assets(%)
Scotia Floating RateIncome Fund Series I 647,072,278 1,332,240 24.5
Scotia Short Term BondFund Series I 65,382,865 1,602,155 29.6
1832 AM CanadianPreferred Share LPSeries I 160,756,812 534,786 9.8
Scotia Private High YieldIncome Pool Series I 910,438,382 264,958 4.9
Scotia Private AmericanCore-Plus Bond PoolSeries I 628,345,246 266,747 4.9
Scotia Mortgage IncomeFund Series I 157,577,022 1,332,773 24.5
5,333,659 98.2
5. Comparison of net asset value per unit and netassets per unit (note 2)
The table below provides a comparison of the net assetvalue per unit and net assets per unit. The primary reasonfor the difference between the net asset value per unit andnet assets per unit, if any, is described in note 2.
June 30, 2015 December 31, 2014
Net asset valueper unit
($)
Net assetsper unit
($)
Net asset valueper unit
($)
Net assetsper unit
($)
Series A 9.90 9.90 9.98 9.98
The accompanying notes are an integral part of the financial statements.
46
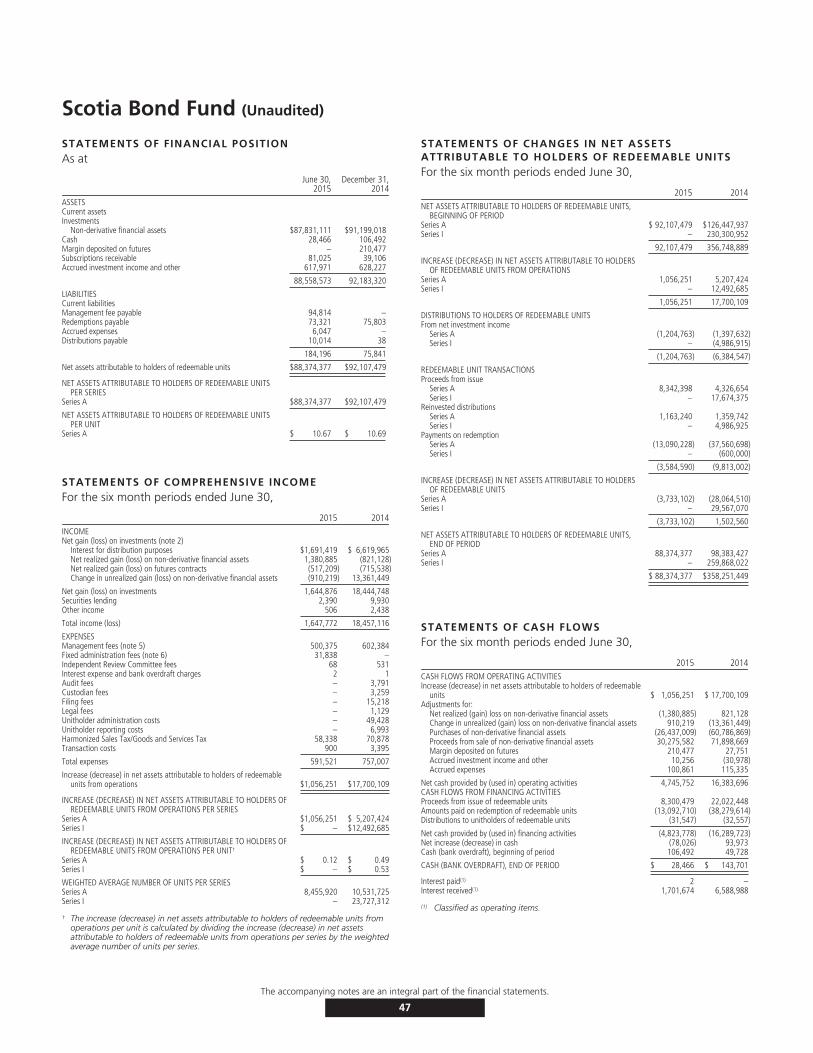
Scotia Bond Fund (Unaudited)
STATEMENTS OF FINANCIAL POSITIONAs at
June 30,2015
December 31,2014
ASSETSCurrent assetsInvestments
Non-derivative financial assets $87,831,111 $91,199,018Cash 28,466 106,492Margin deposited on futures – 210,477Subscriptions receivable 81,025 39,106Accrued investment income and other 617,971 628,227
88,558,573 92,183,320
LIABILITIESCurrent liabilitiesManagement fee payable 94,814 –Redemptions payable 73,321 75,803Accrued expenses 6,047 –Distributions payable 10,014 38
184,196 75,841
Net assets attributable to holders of redeemable units $88,374,377 $92,107,479
NET ASSETS ATTRIBUTABLE TO HOLDERS OF REDEEMABLE UNITSPER SERIES
Series A $88,374,377 $92,107,479
NET ASSETS ATTRIBUTABLE TO HOLDERS OF REDEEMABLE UNITSPER UNIT
Series A $ 10.67 $ 10.69
STATEMENTS OF COMPREHENSIVE INCOMEFor the six month periods ended June 30,
2015 2014INCOMENet gain (loss) on investments (note 2)
Interest for distribution purposes $1,691,419 $ 6,619,965Net realized gain (loss) on non-derivative financial assets 1,380,885 (821,128)Net realized gain (loss) on futures contracts (517,209) (715,538)Change in unrealized gain (loss) on non-derivative financial assets (910,219) 13,361,449
Net gain (loss) on investments 1,644,876 18,444,748Securities lending 2,390 9,930Other income 506 2,438
Total income (loss) 1,647,772 18,457,116
EXPENSESManagement fees (note 5) 500,375 602,384Fixed administration fees (note 6) 31,838 –Independent Review Committee fees 68 531Interest expense and bank overdraft charges 2 1Audit fees – 3,791Custodian fees – 3,259Filing fees – 15,218Legal fees – 1,129Unitholder administration costs – 49,428Unitholder reporting costs – 6,993Harmonized Sales Tax/Goods and Services Tax 58,338 70,878Transaction costs 900 3,395
Total expenses 591,521 757,007
Increase (decrease) in net assets attributable to holders of redeemableunits from operations $1,056,251 $17,700,109
INCREASE (DECREASE) IN NET ASSETS ATTRIBUTABLE TO HOLDERS OFREDEEMABLE UNITS FROM OPERATIONS PER SERIES
Series A $1,056,251 $ 5,207,424Series I $ – $12,492,685
INCREASE (DECREASE) IN NET ASSETS ATTRIBUTABLE TO HOLDERS OFREDEEMABLE UNITS FROM OPERATIONS PER UNIT†
Series A $ 0.12 $ 0.49Series I $ – $ 0.53
WEIGHTED AVERAGE NUMBER OF UNITS PER SERIESSeries A 8,455,920 10,531,725Series I – 23,727,312
† The increase (decrease) in net assets attributable to holders of redeemable units fromoperations per unit is calculated by dividing the increase (decrease) in net assetsattributable to holders of redeemable units from operations per series by the weightedaverage number of units per series.
STATEMENTS OF CHANGES IN NET ASSETSATTRIBUTABLE TO HOLDERS OF REDEEMABLE UNITSFor the six month periods ended June 30,
2015 2014NET ASSETS ATTRIBUTABLE TO HOLDERS OF REDEEMABLE UNITS,
BEGINNING OF PERIODSeries A $ 92,107,479 $126,447,937Series I – 230,300,952
92,107,479 356,748,889
INCREASE (DECREASE) IN NET ASSETS ATTRIBUTABLE TO HOLDERSOF REDEEMABLE UNITS FROM OPERATIONS
Series A 1,056,251 5,207,424Series I – 12,492,685
1,056,251 17,700,109
DISTRIBUTIONS TO HOLDERS OF REDEEMABLE UNITSFrom net investment income
Series A (1,204,763) (1,397,632)Series I – (4,986,915)
(1,204,763) (6,384,547)
REDEEMABLE UNIT TRANSACTIONSProceeds from issue
Series A 8,342,398 4,326,654Series I – 17,674,375
Reinvested distributionsSeries A 1,163,240 1,359,742Series I – 4,986,925
Payments on redemptionSeries A (13,090,228) (37,560,698)Series I – (600,000)
(3,584,590) (9,813,002)
INCREASE (DECREASE) IN NET ASSETS ATTRIBUTABLE TO HOLDERSOF REDEEMABLE UNITS
Series A (3,733,102) (28,064,510)Series I – 29,567,070
(3,733,102) 1,502,560
NET ASSETS ATTRIBUTABLE TO HOLDERS OF REDEEMABLE UNITS,END OF PERIOD
Series A 88,374,377 98,383,427Series I – 259,868,022
$ 88,374,377 $358,251,449
STATEMENTS OF CASH FLOWSFor the six month periods ended June 30,
2015 2014CASH FLOWS FROM OPERATING ACTIVITIESIncrease (decrease) in net assets attributable to holders of redeemable
units $ 1,056,251 $ 17,700,109Adjustments for:
Net realized (gain) loss on non-derivative financial assets (1,380,885) 821,128Change in unrealized (gain) loss on non-derivative financial assets 910,219 (13,361,449)Purchases of non-derivative financial assets (26,437,009) (60,786,869)Proceeds from sale of non-derivative financial assets 30,275,582 71,898,669Margin deposited on futures 210,477 27,751Accrued investment income and other 10,256 (30,978)Accrued expenses 100,861 115,335
Net cash provided by (used in) operating activities 4,745,752 16,383,696CASH FLOWS FROM FINANCING ACTIVITIESProceeds from issue of redeemable units 8,300,479 22,022,448Amounts paid on redemption of redeemable units (13,092,710) (38,279,614)Distributions to unitholders of redeemable units (31,547) (32,557)
Net cash provided by (used in) financing activities (4,823,778) (16,289,723)Net increase (decrease) in cash (78,026) 93,973Cash (bank overdraft), beginning of period 106,492 49,728
CASH (BANK OVERDRAFT), END OF PERIOD $ 28,466 $ 143,701
Interest paid(1) 2 –Interest received(1) 1,701,674 6,588,988
(1) Classified as operating items.
The accompanying notes are an integral part of the financial statements.
47
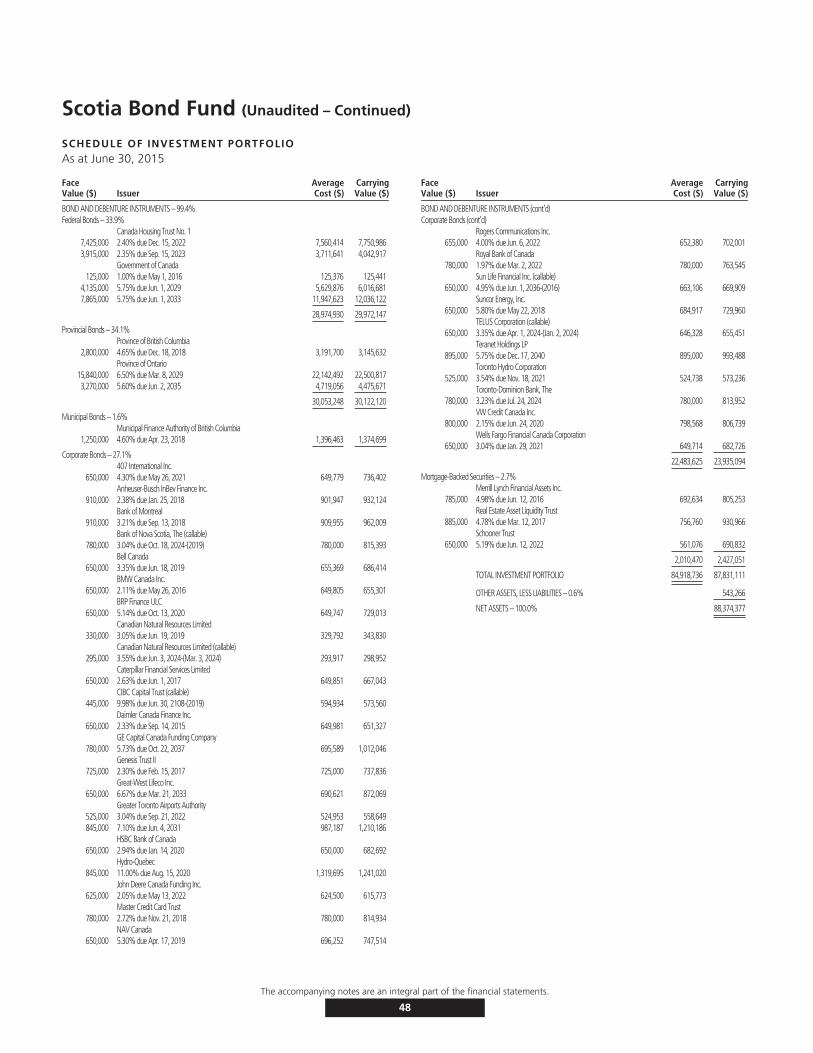
Scotia Bond Fund (Unaudited – Continued)
SCHEDULE OF INVESTMENT PORTFOLIOAs at June 30, 2015
FaceValue ($) Issuer
AverageCost ($)
CarryingValue ($)
BOND AND DEBENTURE INSTRUMENTS – 99.4%Federal Bonds – 33.9%
Canada Housing Trust No. 17,425,000 2.40% due Dec. 15, 2022 7,560,414 7,750,9863,915,000 2.35% due Sep. 15, 2023 3,711,641 4,042,917
Government of Canada125,000 1.00% due May 1, 2016 125,376 125,441
4,135,000 5.75% due Jun. 1, 2029 5,629,876 6,016,6817,865,000 5.75% due Jun. 1, 2033 11,947,623 12,036,122
28,974,930 29,972,147
Provincial Bonds – 34.1%Province of British Columbia
2,800,000 4.65% due Dec. 18, 2018 3,191,700 3,145,632Province of Ontario
15,840,000 6.50% due Mar. 8, 2029 22,142,492 22,500,8173,270,000 5.60% due Jun. 2, 2035 4,719,056 4,475,671
30,053,248 30,122,120
Municipal Bonds – 1.6%Municipal Finance Authority of British Columbia
1,250,000 4.60% due Apr. 23, 2018 1,396,463 1,374,699
Corporate Bonds – 27.1%407 International Inc.
650,000 4.30% due May 26, 2021 649,779 736,402Anheuser-Busch InBev Finance Inc.
910,000 2.38% due Jan. 25, 2018 901,947 932,124Bank of Montreal
910,000 3.21% due Sep. 13, 2018 909,955 962,009Bank of Nova Scotia, The (callable)
780,000 3.04% due Oct. 18, 2024-(2019) 780,000 815,393Bell Canada
650,000 3.35% due Jun. 18, 2019 655,369 686,414BMW Canada Inc.
650,000 2.11% due May 26, 2016 649,805 655,301BRP Finance ULC
650,000 5.14% due Oct. 13, 2020 649,747 729,013Canadian Natural Resources Limited
330,000 3.05% due Jun. 19, 2019 329,792 343,830Canadian Natural Resources Limited (callable)
295,000 3.55% due Jun. 3, 2024-(Mar. 3, 2024) 293,917 298,952Caterpillar Financial Services Limited
650,000 2.63% due Jun. 1, 2017 649,851 667,043CIBC Capital Trust (callable)
445,000 9.98% due Jun. 30, 2108-(2019) 594,934 573,560Daimler Canada Finance Inc.
650,000 2.33% due Sep. 14, 2015 649,981 651,327GE Capital Canada Funding Company
780,000 5.73% due Oct. 22, 2037 695,589 1,012,046Genesis Trust II
725,000 2.30% due Feb. 15, 2017 725,000 737,836Great-West Lifeco Inc.
650,000 6.67% due Mar. 21, 2033 690,621 872,069Greater Toronto Airports Authority
525,000 3.04% due Sep. 21, 2022 524,953 558,649845,000 7.10% due Jun. 4, 2031 987,187 1,210,186
HSBC Bank of Canada650,000 2.94% due Jan. 14, 2020 650,000 682,692
Hydro-Quebec845,000 11.00% due Aug. 15, 2020 1,319,695 1,241,020
John Deere Canada Funding Inc.625,000 2.05% due May 13, 2022 624,500 615,773
Master Credit Card Trust780,000 2.72% due Nov. 21, 2018 780,000 814,934
NAV Canada650,000 5.30% due Apr. 17, 2019 696,252 747,514
FaceValue ($) Issuer
AverageCost ($)
CarryingValue ($)
BOND AND DEBENTURE INSTRUMENTS (cont’d)Corporate Bonds (cont’d)
Rogers Communications Inc.655,000 4.00% due Jun. 6, 2022 652,380 702,001
Royal Bank of Canada780,000 1.97% due Mar. 2, 2022 780,000 763,545
Sun Life Financial Inc. (callable)650,000 4.95% due Jun. 1, 2036-(2016) 663,106 669,909
Suncor Energy, Inc.650,000 5.80% due May 22, 2018 684,917 729,960
TELUS Corporation (callable)650,000 3.35% due Apr. 1, 2024-(Jan. 2, 2024) 646,328 655,451
Teranet Holdings LP895,000 5.75% due Dec. 17, 2040 895,000 993,488
Toronto Hydro Corporation525,000 3.54% due Nov. 18, 2021 524,738 573,236
Toronto-Dominion Bank, The780,000 3.23% due Jul. 24, 2024 780,000 813,952
VW Credit Canada Inc.800,000 2.15% due Jun. 24, 2020 798,568 806,739
Wells Fargo Financial Canada Corporation650,000 3.04% due Jan. 29, 2021 649,714 682,726
22,483,625 23,935,094
Mortgage-Backed Securities – 2.7%Merrill Lynch Financial Assets Inc.
785,000 4.98% due Jun. 12, 2016 692,634 805,253Real Estate Asset Liquidity Trust
885,000 4.78% due Mar. 12, 2017 756,760 930,966Schooner Trust
650,000 5.19% due Jun. 12, 2022 561,076 690,832
2,010,470 2,427,051
TOTAL INVESTMENT PORTFOLIO 84,918,736 87,831,111
OTHER ASSETS, LESS LIABILITIES – 0.6% 543,266
NET ASSETS – 100.0% 88,374,377
The accompanying notes are an integral part of the financial statements.
48

Scotia Bond Fund (Unaudited)
FUND SPECIFIC NOTESFor the periods indicated in Note 1.
1. The Fund (note 1)
The Fund’s investment objective is to provide a steady flowof income and modest capital gains. It invests primarily inhigh-quality fixed income securities issued by Canadianfederal, provincial and municipal governments andCanadian corporations.
2. Risks associated with financial instruments (note 4)
i) Interest rate risk
The table below summarizes the Fund’s exposure tointerest rate risk by the remaining term to maturity (earlierof maturity date or interest reset date) of the Fund’sportfolio, excluding cash, money market instruments,underlying funds, preferred shares and overdrafts, asapplicable.
Interest rate exposureJune 30, 2015
($)December 31, 2014
($)
Less than 1 year 2,907,231 653,2941-3 years 6,063,460 11,186,7533-5 years 9,578,718 16,363,8345-10 years 20,164,623 17,805,825> 10 years 49,117,079 45,189,312
87,831,111 91,199,018
As at June 30, 2015 had the prevailing interest ratesincreased or decreased by 0.25%, assuming a parallel shiftin the yield curve and all other variables held constant, netassets attributable to holders of redeemable units wouldhave decreased or increased, respectively, by $1,812,049 orapproximately 2.1% (December 31, 2014 – $1,745,803 orapproximately 1.9%). In practice, actual results may differfrom this sensitivity analysis and the difference could bematerial.
ii) Currency risk
The Fund did not have significant currency risk exposureas at June 30, 2015 or December 31, 2014.
iii) Price risk
The Fund did not have significant price risk exposure toequities, derivatives or commodities, if applicable, as atJune 30, 2015 or December 31, 2014.
iv) Credit risk
The table below summarizes the credit ratings of the bondsand debentures, excluding cash and money market
instruments but including preferred shares and derivatives,as applicable, held by the Fund.
June 30, 2015 December 31, 2014
Percentage oftotal bonds and
debentures(%)
Percentage ofnet assets
(%)
Percentage oftotal bonds and
debentures(%)
Percentage ofnet assets
(%)
Credit ratingsAAA 40.3 40.0 45.9 45.4AA 41.5 41.3 34.8 34.5A 14.0 13.9 15.0 14.8BBB 4.2 4.2 4.3 4.3
100.0 99.4 100.0 99.0
v) Liquidity risk
The table below summarizes the Fund’s financial liabilitiesbased on the remaining period to the contractual maturitydate.
June 30, 2015 December 31, 2014
On demand($)
Less than3 months
($)On demand
($)
Less than3 months
($)
Current liabilities – 184,196 – 75,841Liability for written options – – – –Unrealized loss on derivatives – – – –Redeemable units 88,374,377 – 92,107,479 –
88,374,377 184,196 92,107,479 75,841
Redeemable units are redeemable on demand at theholder’s option. However, the Manager does not expect thatthe contractual maturity disclosed in the table above will berepresentative of the actual cash outflows, as holders ofthese instruments typically retain them for a longer term.
vi) Concentration risk
Concentration risk arises as a result of the concentration ofexposures within the same category, geographical location,asset type or industry sector, as applicable. The table belowis a summary of the Fund’s concentration risk:
Percentage of net assets (%)
June 30, 2015 December 31, 2014
Corporate Bonds 27.1 27.0Federal Bonds 33.9 38.1Mortgage-Backed Securities 2.7 3.4Municipal Bonds 1.6 1.5Provincial Bonds 34.1 29.0
The accompanying notes are an integral part of the financial statements.
49
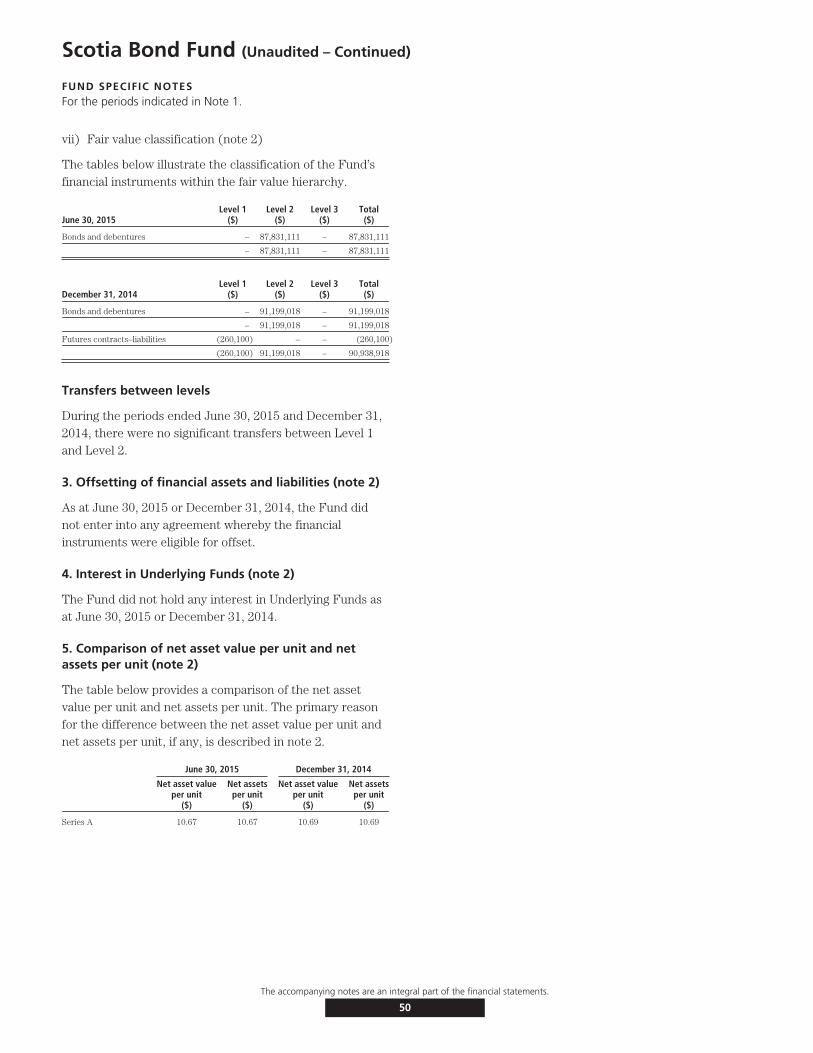
Scotia Bond Fund (Unaudited – Continued)
FUND SPECIFIC NOTESFor the periods indicated in Note 1.
vii) Fair value classification (note 2)
The tables below illustrate the classification of the Fund’sfinancial instruments within the fair value hierarchy.
June 30, 2015Level 1
($)Level 2
($)Level 3
($)Total($)
Bonds and debentures – 87,831,111 – 87,831,111
– 87,831,111 – 87,831,111
December 31, 2014Level 1
($)Level 2
($)Level 3
($)Total($)
Bonds and debentures – 91,199,018 – 91,199,018
– 91,199,018 – 91,199,018
Futures contracts–liabilities (260,100) – – (260,100)
(260,100) 91,199,018 – 90,938,918
Transfers between levels
During the periods ended June 30, 2015 and December 31,2014, there were no significant transfers between Level 1and Level 2.
3. Offsetting of financial assets and liabilities (note 2)
As at June 30, 2015 or December 31, 2014, the Fund didnot enter into any agreement whereby the financialinstruments were eligible for offset.
4. Interest in Underlying Funds (note 2)
The Fund did not hold any interest in Underlying Funds asat June 30, 2015 or December 31, 2014.
5. Comparison of net asset value per unit and netassets per unit (note 2)
The table below provides a comparison of the net assetvalue per unit and net assets per unit. The primary reasonfor the difference between the net asset value per unit andnet assets per unit, if any, is described in note 2.
June 30, 2015 December 31, 2014
Net asset valueper unit
($)
Net assetsper unit
($)
Net asset valueper unit
($)
Net assetsper unit
($)
Series A 10.67 10.67 10.69 10.69
The accompanying notes are an integral part of the financial statements.
50

Scotia Canadian Income Fund (Unaudited)
STATEMENTS OF FINANCIAL POSITIONAs at
June 30,2015
December 31,2014
ASSETSCurrent assetsInvestments
Non-derivative financial assets $5,812,256,777 $5,865,741,064Cash 85,127,860 79,311,665Margin deposited on futures 13,380,507 4,627,756Subscriptions receivable 4,544,730 3,025,158Accrued investment income and other 39,819,161 39,339,056
5,955,129,035 5,992,044,699
LIABILITIESCurrent liabilitiesManagement fee payable 1,238,958 –Redemptions payable 2,717,847 1,903,179Accrued expenses 164,099 –Distributions payable 296,798 415Unrealized loss on futures contracts – 76,447
4,417,702 1,980,041
Net assets attributable to holders of redeemable units $5,950,711,333 $5,990,064,658
NET ASSETS ATTRIBUTABLE TO HOLDERS OF REDEEMABLE UNITSPER SERIES
Series A $ 966,349,420 $1,042,706,530Advisor Series $ 3,865,615 $ 6,390,031Series F $ 396,740 $ 258,070Series I $4,219,582,354 $4,158,385,364Series M $ 760,517,204 $ 782,324,663
NET ASSETS ATTRIBUTABLE TO HOLDERS OF REDEEMABLE UNITSPER UNIT
Series A $ 13.77 $ 13.98Advisor Series $ 13.74 $ 13.95Series F $ 13.73 $ 13.95Series I $ 13.69 $ 13.91Series M $ 13.70 $ 13.91
STATEMENTS OF COMPREHENSIVE INCOMEFor the six month periods ended June 30,
2015 2014INCOMENet gain (loss) on investments (note 2)
Interest for distribution purposes $ 99,692,720 $106,628,579Net realized gain (loss) on non-derivative financial assets 66,616,805 (25,329,198)Net realized gain (loss) on futures contracts (139,179,142) (15,646,377)Net realized and change in unrealized gain (loss) on foreign
exchange – 305,716Change in unrealized gain (loss) on non-derivative financial assets (17,323,018) 247,337,443
Net gain (loss) on investments 9,807,365 313,296,163Securities lending 250,306 322,485Net realized and change in unrealized gain (loss) on foreign exchange
of cash 532,044 –Other income 4,579 14,891
Total income (loss) 10,594,294 313,633,539
EXPENSESManagement fees (note 5) 6,625,714 7,671,648Fixed administration fees and operating expense (note 6) 866,281 –Independent Review Committee fees 4,493 8,982Interest expense and bank overdraft charges 31,024 2,566Audit fees – 65,250Custodian fees – 43,313Filing fees – 45,477Legal fees – 19,048Unitholder administration costs – 667,514Unitholder reporting costs – 64,788Harmonized Sales Tax/Goods and Services Tax 829,659 917,393Transaction costs 390,325 254,409
Total expenses 8,747,496 9,760,388Expenses absorbed by the Manager (2,322) (1,205)
Net expenses 8,745,174 9,759,183
Increase (decrease) in net assets attributable to holders ofredeemable units from operations $ 1,849,120 $303,874,356
INCREASE (DECREASE) IN NET ASSETS ATTRIBUTABLE TO HOLDERSOF REDEEMABLE UNITS FROM OPERATIONS PER SERIES
Series A $ (4,219,505) $ 54,404,424Advisor Series $ 15,545 $ 387,167Series F $ (2,330) $ 24,652Series I $ 3,689,408 $217,392,989Series M $ 2,366,002 $ 31,665,124
INCREASE (DECREASE) IN NET ASSETS ATTRIBUTABLE TO HOLDERSOF REDEEMABLE UNITS FROM OPERATIONS PER UNIT†
Series A $ (0.06) $ 0.62Advisor Series $ 0.04 $ 0.62Series F $ (0.09) $ 0.95Series I $ 0.01 $ 0.70Series M $ 0.04 $ 0.68
WEIGHTED AVERAGE NUMBER OF UNITS PER SERIESSeries A 72,379,582 87,137,461Advisor Series 361,377 623,390Series F 25,538 25,830Series I 306,766,313 310,112,349Series M 55,118,893 46,868,117
† The increase (decrease) in net assets attributable to holders of redeemable units fromoperations per unit is calculated by dividing the increase (decrease) in net assetsattributable to holders of redeemable units from operations per series by the weightedaverage number of units per series.
The accompanying notes are an integral part of the financial statements.
51

Scotia Canadian Income Fund (Unaudited – Continued)
STATEMENTS OF CHANGES IN NET ASSETSATTRIBUTABLE TO HOLDERS OF REDEEMABLE UNITSFor the six month periods ended June 30,
2015 2014NET ASSETS ATTRIBUTABLE TO HOLDERS OF REDEEMABLE
UNITS, BEGINNING OF PERIODSeries A $1,042,706,530 $ 1,294,398,167Advisor Series 6,390,031 8,841,710Series F 258,070 820,988Series I 4,158,385,364 4,361,295,723Series M 782,324,663 608,408,568
5,990,064,658 6,273,765,156
INCREASE (DECREASE) IN NET ASSETS ATTRIBUTABLE TOHOLDERS OF REDEEMABLE UNITS FROM OPERATIONS
Series A (4,219,505) 54,404,424Advisor Series 15,545 387,167Series F (2,330) 24,652Series I 3,689,408 217,392,989Series M 2,366,002 31,665,124
1,849,120 303,874,356
DISTRIBUTIONS TO HOLDERS OF REDEEMABLE UNITSFrom net investment income
Series A (9,983,053) (13,254,865)Advisor Series (41,428) (89,997)Series F (5,089) (3,903)Series I (76,214,694) (80,914,744)Series M (13,392,360) (12,033,280)
(99,636,624) (106,296,789)
REDEEMABLE UNIT TRANSACTIONSProceeds from issue
Series A 48,188,617 34,641,034Advisor Series 45,851 47,983Series F 231,352 10,000Series I 425,382,354 468,790,470Series M 129,961,608 134,100,612
Reinvested distributionsSeries A 9,706,980 12,902,179Advisor Series 16,312 37,517Series F 1,759 3,676Series I 76,214,695 80,914,744Series M 11,818,272 10,202,667
Payments on redemptionSeries A (120,050,149) (266,482,045)Advisor Series (2,560,696) (1,329,352)Series F (87,022) (727,138)Series I (367,874,773) (1,010,104,630)Series M (152,560,981) (94,977,505)
58,434,179 (631,969,788)
INCREASE (DECREASE) IN NET ASSETS ATTRIBUTABLE TOHOLDERS OF REDEEMABLE UNITS
Series A (76,357,110) (177,789,273)Advisor Series (2,524,416) (946,682)Series F 138,670 (692,713)Series I 61,196,990 (323,921,171)Series M (21,807,459) 68,957,618
(39,353,325) (434,392,221)
NET ASSETS ATTRIBUTABLE TO HOLDERS OF REDEEMABLEUNITS, END OF PERIOD
Series A 966,349,420 1,116,608,894Advisor Series 3,865,615 7,895,028Series F 396,740 128,275Series I 4,219,582,354 4,037,374,552Series M 760,517,204 677,366,186
$5,950,711,333 $ 5,839,372,935
STATEMENTS OF CASH FLOWSFor the six month periods ended June 30,
2015 2014CASH FLOWS FROM OPERATING ACTIVITIESIncrease (decrease) in net assets attributable to holders of
redeemable units $ 1,849,120 $ 303,874,356Adjustments for:
Net realized (gain) loss on non-derivative financial assets (66,616,805) 25,329,198Unrealized (gain) loss on foreign exchange of cash (1,013,862) (305,716)Change in unrealized (gain) loss on non-derivative financial
assets 17,323,018 (247,337,443)Purchases of non-derivative financial assets (1,514,476,774) (1,329,848,007)Proceeds from sale of non-derivative financial assets 1,617,254,847 2,008,921,972Margin deposited on futures (8,829,198) (706,241)Accrued investment income and other (480,105) 2,038,900Accrued expenses 1,403,057 1,535,522
Net cash provided by (used in) operating activities 46,413,298 763,502,541CASH FLOWS FROM FINANCING ACTIVITIESProceeds from issue of redeemable units 602,290,211 633,551,504Amounts paid on redemption of redeemable units (642,318,953) (1,372,436,326)Distributions to unitholders of redeemable units (1,582,223) (1,893,241)
Net cash provided by (used in) financing activities (41,610,965) (740,778,063)Change in unrealized gain (loss) on foreign exchange of cash 1,013,862 305,716Net increase (decrease) in cash 4,802,333 22,724,478Cash (bank overdraft), beginning of period 79,311,665 8,843,103
CASH (BANK OVERDRAFT), END OF PERIOD $ 85,127,860 $ 31,873,297
Interest paid(1) 31,024 –Interest received(1) 99,212,615 108,667,479
(1) Classified as operating items.
The accompanying notes are an integral part of the financial statements.
52
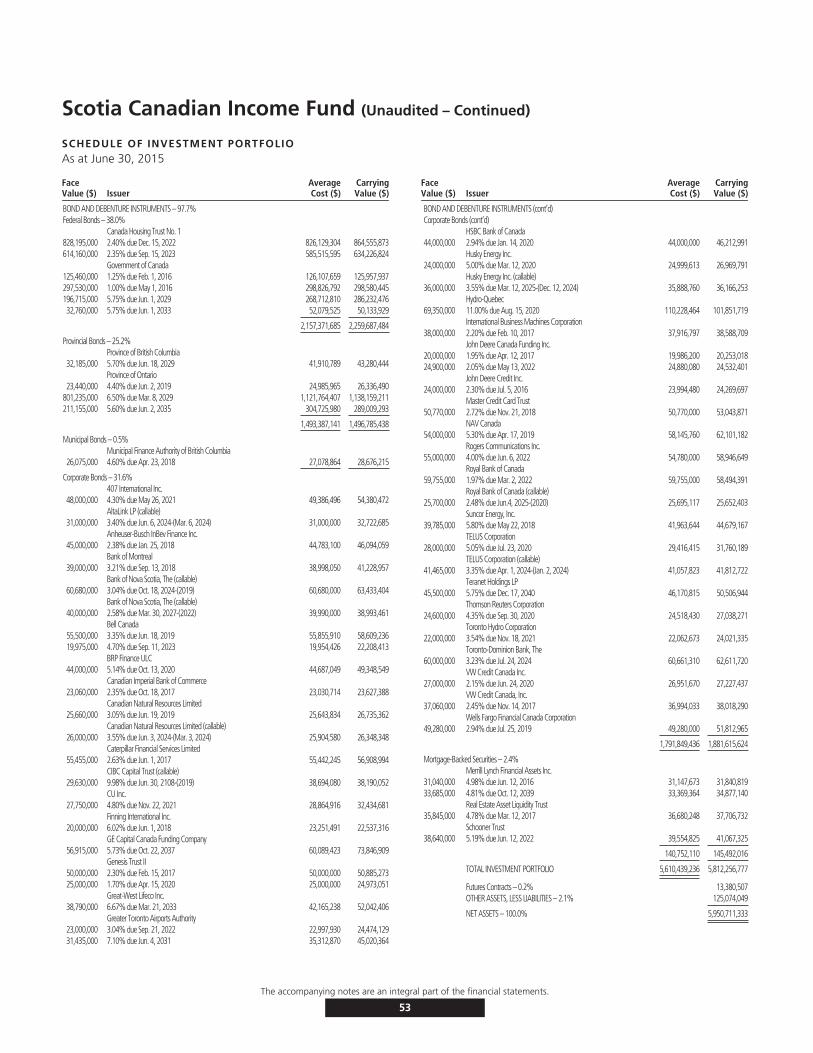
Scotia Canadian Income Fund (Unaudited – Continued)
SCHEDULE OF INVESTMENT PORTFOLIOAs at June 30, 2015
FaceValue ($) Issuer
AverageCost ($)
CarryingValue ($)
BOND AND DEBENTURE INSTRUMENTS – 97.7%Federal Bonds – 38.0%
Canada Housing Trust No. 1828,195,000 2.40% due Dec. 15, 2022 826,129,304 864,555,873614,160,000 2.35% due Sep. 15, 2023 585,515,595 634,226,824
Government of Canada125,460,000 1.25% due Feb. 1, 2016 126,107,659 125,957,937297,530,000 1.00% due May 1, 2016 298,826,792 298,580,445196,715,000 5.75% due Jun. 1, 2029 268,712,810 286,232,47632,760,000 5.75% due Jun. 1, 2033 52,079,525 50,133,929
2,157,371,685 2,259,687,484
Provincial Bonds – 25.2%Province of British Columbia
32,185,000 5.70% due Jun. 18, 2029 41,910,789 43,280,444Province of Ontario
23,440,000 4.40% due Jun. 2, 2019 24,985,965 26,336,490801,235,000 6.50% due Mar. 8, 2029 1,121,764,407 1,138,159,211211,155,000 5.60% due Jun. 2, 2035 304,725,980 289,009,293
1,493,387,141 1,496,785,438
Municipal Bonds – 0.5%Municipal Finance Authority of British Columbia
26,075,000 4.60% due Apr. 23, 2018 27,078,864 28,676,215
Corporate Bonds – 31.6%407 International Inc.
48,000,000 4.30% due May 26, 2021 49,386,496 54,380,472AltaLink LP (callable)
31,000,000 3.40% due Jun. 6, 2024-(Mar. 6, 2024) 31,000,000 32,722,685Anheuser-Busch InBev Finance Inc.
45,000,000 2.38% due Jan. 25, 2018 44,783,100 46,094,059Bank of Montreal
39,000,000 3.21% due Sep. 13, 2018 38,998,050 41,228,957Bank of Nova Scotia, The (callable)
60,680,000 3.04% due Oct. 18, 2024-(2019) 60,680,000 63,433,404Bank of Nova Scotia, The (callable)
40,000,000 2.58% due Mar. 30, 2027-(2022) 39,990,000 38,993,461Bell Canada
55,500,000 3.35% due Jun. 18, 2019 55,855,910 58,609,23619,975,000 4.70% due Sep. 11, 2023 19,954,426 22,208,413
BRP Finance ULC44,000,000 5.14% due Oct. 13, 2020 44,687,049 49,348,549
Canadian Imperial Bank of Commerce23,060,000 2.35% due Oct. 18, 2017 23,030,714 23,627,388
Canadian Natural Resources Limited25,660,000 3.05% due Jun. 19, 2019 25,643,834 26,735,362
Canadian Natural Resources Limited (callable)26,000,000 3.55% due Jun. 3, 2024-(Mar. 3, 2024) 25,904,580 26,348,348
Caterpillar Financial Services Limited55,455,000 2.63% due Jun. 1, 2017 55,442,245 56,908,994
CIBC Capital Trust (callable)29,630,000 9.98% due Jun. 30, 2108-(2019) 38,694,080 38,190,052
CU Inc.27,750,000 4.80% due Nov. 22, 2021 28,864,916 32,434,681
Finning International Inc.20,000,000 6.02% due Jun. 1, 2018 23,251,491 22,537,316
GE Capital Canada Funding Company56,915,000 5.73% due Oct. 22, 2037 60,089,423 73,846,909
Genesis Trust II50,000,000 2.30% due Feb. 15, 2017 50,000,000 50,885,27325,000,000 1.70% due Apr. 15, 2020 25,000,000 24,973,051
Great-West Lifeco Inc.38,790,000 6.67% due Mar. 21, 2033 42,165,238 52,042,406
Greater Toronto Airports Authority23,000,000 3.04% due Sep. 21, 2022 22,997,930 24,474,12931,435,000 7.10% due Jun. 4, 2031 35,312,870 45,020,364
FaceValue ($) Issuer
AverageCost ($)
CarryingValue ($)
BOND AND DEBENTURE INSTRUMENTS (cont’d)Corporate Bonds (cont’d)
HSBC Bank of Canada44,000,000 2.94% due Jan. 14, 2020 44,000,000 46,212,991
Husky Energy Inc.24,000,000 5.00% due Mar. 12, 2020 24,999,613 26,969,791
Husky Energy Inc. (callable)36,000,000 3.55% due Mar. 12, 2025-(Dec. 12, 2024) 35,888,760 36,166,253
Hydro-Quebec69,350,000 11.00% due Aug. 15, 2020 110,228,464 101,851,719
International Business Machines Corporation38,000,000 2.20% due Feb. 10, 2017 37,916,797 38,588,709
John Deere Canada Funding Inc.20,000,000 1.95% due Apr. 12, 2017 19,986,200 20,253,01824,900,000 2.05% due May 13, 2022 24,880,080 24,532,401
John Deere Credit Inc.24,000,000 2.30% due Jul. 5, 2016 23,994,480 24,269,697
Master Credit Card Trust50,770,000 2.72% due Nov. 21, 2018 50,770,000 53,043,871
NAV Canada54,000,000 5.30% due Apr. 17, 2019 58,145,760 62,101,182
Rogers Communications Inc.55,000,000 4.00% due Jun. 6, 2022 54,780,000 58,946,649
Royal Bank of Canada59,755,000 1.97% due Mar. 2, 2022 59,755,000 58,494,391
Royal Bank of Canada (callable)25,700,000 2.48% due Jun.4, 2025-(2020) 25,695,117 25,652,403
Suncor Energy, Inc.39,785,000 5.80% due May 22, 2018 41,963,644 44,679,167
TELUS Corporation28,000,000 5.05% due Jul. 23, 2020 29,416,415 31,760,189
TELUS Corporation (callable)41,465,000 3.35% due Apr. 1, 2024-(Jan. 2, 2024) 41,057,823 41,812,722
Teranet Holdings LP45,500,000 5.75% due Dec. 17, 2040 46,170,815 50,506,944
Thomson Reuters Corporation24,600,000 4.35% due Sep. 30, 2020 24,518,430 27,038,271
Toronto Hydro Corporation22,000,000 3.54% due Nov. 18, 2021 22,062,673 24,021,335
Toronto-Dominion Bank, The60,000,000 3.23% due Jul. 24, 2024 60,661,310 62,611,720
VW Credit Canada Inc.27,000,000 2.15% due Jun. 24, 2020 26,951,670 27,227,437
VW Credit Canada, Inc.37,060,000 2.45% due Nov. 14, 2017 36,994,033 38,018,290
Wells Fargo Financial Canada Corporation49,280,000 2.94% due Jul. 25, 2019 49,280,000 51,812,965
1,791,849,436 1,881,615,624
Mortgage-Backed Securities – 2.4%Merrill Lynch Financial Assets Inc.
31,040,000 4.98% due Jun. 12, 2016 31,147,673 31,840,81933,685,000 4.81% due Oct. 12, 2039 33,369,364 34,877,140
Real Estate Asset Liquidity Trust35,845,000 4.78% due Mar. 12, 2017 36,680,248 37,706,732
Schooner Trust38,640,000 5.19% due Jun. 12, 2022 39,554,825 41,067,325
140,752,110 145,492,016
TOTAL INVESTMENT PORTFOLIO 5,610,439,236 5,812,256,777
Futures Contracts – 0.2% 13,380,507OTHER ASSETS, LESS LIABILITIES – 2.1% 125,074,049
NET ASSETS – 100.0% 5,950,711,333
The accompanying notes are an integral part of the financial statements.
53

Scotia Canadian Income Fund (Unaudited – Continued)
SCHEDULE OF INVESTMENT PORTFOLIO
Expiry DateNumber ofContracts Futures Contracts Counterparty Credit Risk
ContractualValue
Canadian ($)Fair Value
Canadian ($)Appreciation/
(Depreciation) ($)BOND FUTURES CONTRACTSSep. 2015 8,350 U.S. Treasury Long Bond Futures BMO A+ 1,602,700,768 1,573,114,158 (29,586,610)Sep. 2015 (10,500) Canada 10 Year Bond Future BMO A+ (1,459,976,785) (1,470,000,000) (10,023,215)
(39,609,825)
The above bond futures contracts are financial agreements to purchase/sell the bond at a contracted price on a specific future date. However, the Fund does not intend to purchase/sell the bond onsettlement. Rather, it intends to close out each bond futures contracts before settlement by entering into equal, but offsetting bond futures contracts.
With respect to the above future contracts, $34,000,000 of the February 1, 2016 Government of Canada Federal Bonds 1.25% and $38,250,000 of the December 15, 2022 Canada Housing Trust No.12.4% are held on margin.
The accompanying notes are an integral part of the financial statements.
54
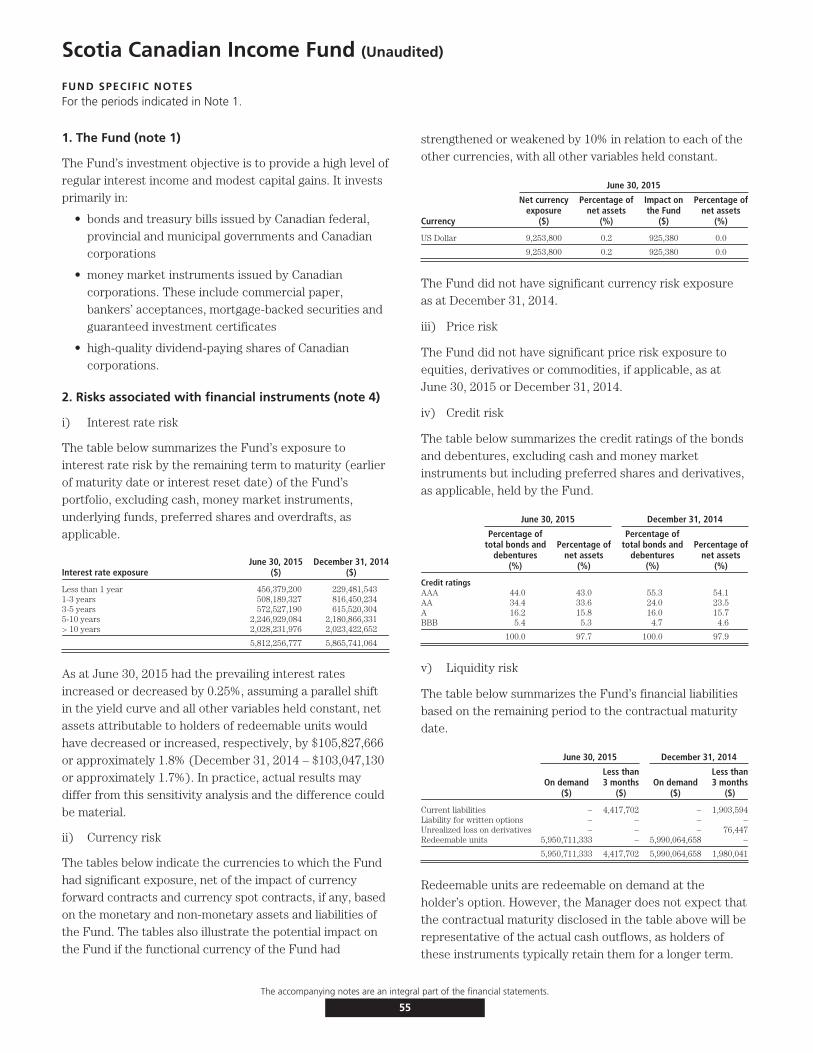
Scotia Canadian Income Fund (Unaudited)
FUND SPECIFIC NOTESFor the periods indicated in Note 1.
1. The Fund (note 1)
The Fund’s investment objective is to provide a high level ofregular interest income and modest capital gains. It investsprimarily in:
• bonds and treasury bills issued by Canadian federal,provincial and municipal governments and Canadiancorporations
• money market instruments issued by Canadiancorporations. These include commercial paper,bankers’ acceptances, mortgage-backed securities andguaranteed investment certificates
• high-quality dividend-paying shares of Canadiancorporations.
2. Risks associated with financial instruments (note 4)
i) Interest rate risk
The table below summarizes the Fund’s exposure tointerest rate risk by the remaining term to maturity (earlierof maturity date or interest reset date) of the Fund’sportfolio, excluding cash, money market instruments,underlying funds, preferred shares and overdrafts, asapplicable.
Interest rate exposureJune 30, 2015
($)December 31, 2014
($)
Less than 1 year 456,379,200 229,481,5431-3 years 508,189,327 816,450,2343-5 years 572,527,190 615,520,3045-10 years 2,246,929,084 2,180,866,331> 10 years 2,028,231,976 2,023,422,652
5,812,256,777 5,865,741,064
As at June 30, 2015 had the prevailing interest ratesincreased or decreased by 0.25%, assuming a parallel shiftin the yield curve and all other variables held constant, netassets attributable to holders of redeemable units wouldhave decreased or increased, respectively, by $105,827,666or approximately 1.8% (December 31, 2014 – $103,047,130or approximately 1.7%). In practice, actual results maydiffer from this sensitivity analysis and the difference couldbe material.
ii) Currency risk
The tables below indicate the currencies to which the Fundhad significant exposure, net of the impact of currencyforward contracts and currency spot contracts, if any, basedon the monetary and non-monetary assets and liabilities ofthe Fund. The tables also illustrate the potential impact onthe Fund if the functional currency of the Fund had
strengthened or weakened by 10% in relation to each of theother currencies, with all other variables held constant.
June 30, 2015
Currency
Net currencyexposure
($)
Percentage ofnet assets
(%)
Impact onthe Fund
($)
Percentage ofnet assets
(%)
US Dollar 9,253,800 0.2 925,380 0.0
9,253,800 0.2 925,380 0.0
The Fund did not have significant currency risk exposureas at December 31, 2014.
iii) Price risk
The Fund did not have significant price risk exposure toequities, derivatives or commodities, if applicable, as atJune 30, 2015 or December 31, 2014.
iv) Credit risk
The table below summarizes the credit ratings of the bondsand debentures, excluding cash and money marketinstruments but including preferred shares and derivatives,as applicable, held by the Fund.
June 30, 2015 December 31, 2014
Percentage oftotal bonds and
debentures(%)
Percentage ofnet assets
(%)
Percentage oftotal bonds and
debentures(%)
Percentage ofnet assets
(%)
Credit ratingsAAA 44.0 43.0 55.3 54.1AA 34.4 33.6 24.0 23.5A 16.2 15.8 16.0 15.7BBB 5.4 5.3 4.7 4.6
100.0 97.7 100.0 97.9
v) Liquidity risk
The table below summarizes the Fund’s financial liabilitiesbased on the remaining period to the contractual maturitydate.
June 30, 2015 December 31, 2014
On demand($)
Less than3 months
($)On demand
($)
Less than3 months
($)
Current liabilities – 4,417,702 – 1,903,594Liability for written options – – – –Unrealized loss on derivatives – – – 76,447Redeemable units 5,950,711,333 – 5,990,064,658 –
5,950,711,333 4,417,702 5,990,064,658 1,980,041
Redeemable units are redeemable on demand at theholder’s option. However, the Manager does not expect thatthe contractual maturity disclosed in the table above will berepresentative of the actual cash outflows, as holders ofthese instruments typically retain them for a longer term.
The accompanying notes are an integral part of the financial statements.
55
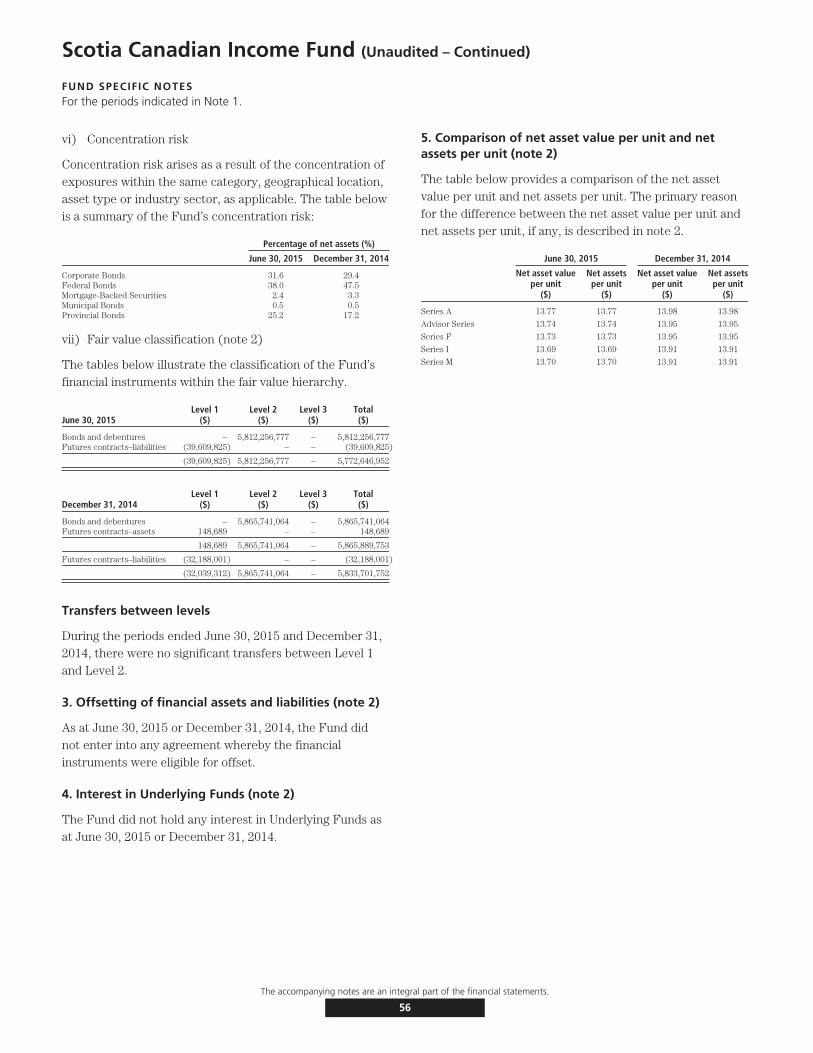
Scotia Canadian Income Fund (Unaudited – Continued)
FUND SPECIFIC NOTESFor the periods indicated in Note 1.
vi) Concentration risk
Concentration risk arises as a result of the concentration ofexposures within the same category, geographical location,asset type or industry sector, as applicable. The table belowis a summary of the Fund’s concentration risk:
Percentage of net assets (%)
June 30, 2015 December 31, 2014
Corporate Bonds 31.6 29.4Federal Bonds 38.0 47.5Mortgage-Backed Securities 2.4 3.3Municipal Bonds 0.5 0.5Provincial Bonds 25.2 17.2
vii) Fair value classification (note 2)
The tables below illustrate the classification of the Fund’sfinancial instruments within the fair value hierarchy.
June 30, 2015Level 1
($)Level 2
($)Level 3
($)Total($)
Bonds and debentures – 5,812,256,777 – 5,812,256,777Futures contracts–liabilities (39,609,825) – – (39,609,825)
(39,609,825) 5,812,256,777 – 5,772,646,952
December 31, 2014Level 1
($)Level 2
($)Level 3
($)Total($)
Bonds and debentures – 5,865,741,064 – 5,865,741,064Futures contracts–assets 148,689 – – 148,689
148,689 5,865,741,064 – 5,865,889,753
Futures contracts–liabilities (32,188,001) – – (32,188,001)
(32,039,312) 5,865,741,064 – 5,833,701,752
Transfers between levels
During the periods ended June 30, 2015 and December 31,2014, there were no significant transfers between Level 1and Level 2.
3. Offsetting of financial assets and liabilities (note 2)
As at June 30, 2015 or December 31, 2014, the Fund didnot enter into any agreement whereby the financialinstruments were eligible for offset.
4. Interest in Underlying Funds (note 2)
The Fund did not hold any interest in Underlying Funds asat June 30, 2015 or December 31, 2014.
5. Comparison of net asset value per unit and netassets per unit (note 2)
The table below provides a comparison of the net assetvalue per unit and net assets per unit. The primary reasonfor the difference between the net asset value per unit andnet assets per unit, if any, is described in note 2.
June 30, 2015 December 31, 2014
Net asset valueper unit
($)
Net assetsper unit
($)
Net asset valueper unit
($)
Net assetsper unit
($)
Series A 13.77 13.77 13.98 13.98
Advisor Series 13.74 13.74 13.95 13.95
Series F 13.73 13.73 13.95 13.95
Series I 13.69 13.69 13.91 13.91
Series M 13.70 13.70 13.91 13.91
The accompanying notes are an integral part of the financial statements.
56

Scotia Private Canadian Corporate Bond Pool (Unaudited)
STATEMENTS OF FINANCIAL POSITIONAs at
June 30,2015
December 31,2014
ASSETSCurrent assetsInvestments
Non-derivative financial assets $4,813,824,608 $4,092,869,215Cash 18,963,245 11,988,227Margin deposited on futures 8,526,349 7,610,224Subscriptions receivable 5,743,674 3,679,375Accrued investment income and other 33,868,493 29,297,814
4,880,926,369 4,145,444,855
LIABILITIESCurrent liabilitiesManagement fee payable 154,056 –Payable for securities purchased 15,604,168 –Redemptions payable 3,404,711 1,765,273Accrued expenses 94,361 –Distributions payable 1,049,323 –
20,306,619 1,765,273
Net assets attributable to holders of redeemable units $4,860,619,750 $4,143,679,582
NET ASSETS ATTRIBUTABLE TO HOLDERS OF REDEEMABLE UNITSPER SERIES
Series I $2,570,759,687 $1,871,893,210Series M $2,289,860,063 $2,271,786,372
NET ASSETS ATTRIBUTABLE TO HOLDERS OF REDEEMABLE UNITSPER UNIT
Series I $ 10.94 $ 10.84Series M $ 10.94 $ 10.84
STATEMENTS OF COMPREHENSIVE INCOMEFor the six month periods ended June 30,
2015 2014INCOMENet gain (loss) on investments (note 2)
Dividends $ 265,498 $ –Interest for distribution purposes 75,547,320 65,727,955Net realized gain (loss) on non-derivative financial assets 31,410,502 16,654,192Net realized gain (loss) on futures contracts (7,414,633) (15,343,834)Net realized and change in unrealized gain (loss) on foreign exchange – 8,848Change in unrealized gain (loss) on non-derivative financial assets 22,087,477 73,265,250
Net gain (loss) on investments 121,896,164 140,312,411Securities lending 44,279 58,821Net realized and change in unrealized gain (loss) on foreign exchange
of cash 108,408 –
Total income (loss) 122,048,851 140,371,232
EXPENSESManagement fees (note 5) 787,490 669,560Fixed administration fees (note 6) 436,840 –Independent Review Committee fees 3,164 5,152Interest expense and bank overdraft charges 589 17Audit fees – 37,123Custodian fees – 22,355Filing fees – 24,351Legal fees – 11,026Unitholder administration costs – 228,561Unitholder reporting costs – 10,985Harmonized Sales Tax/Goods and Services Tax 128,384 87,920Transaction costs 98,229 21,284
Total expenses 1,454,696 1,118,334
Increase (decrease) in net assets attributable to holders of redeemableunits from operations $120,594,155 $139,252,898
INCREASE (DECREASE) IN NET ASSETS ATTRIBUTABLE TO HOLDERSOF REDEEMABLE UNITS FROM OPERATIONS PER SERIES
Series I $ 57,004,793 $ 60,939,344Series M $ 63,589,362 $ 78,313,554
INCREASE (DECREASE) IN NET ASSETS ATTRIBUTABLE TO HOLDERSOF REDEEMABLE UNITS FROM OPERATIONS PER UNIT†
Series I $ 0.29 $ 0.42Series M $ 0.31 $ 0.44
WEIGHTED AVERAGE NUMBER OF UNITS PER SERIESSeries I 194,356,480 145,916,616Series M 205,915,526 179,735,314
† The increase (decrease) in net assets attributable to holders of redeemable units fromoperations per unit is calculated by dividing the increase (decrease) in net assetsattributable to holders of redeemable units from operations per series by the weightedaverage number of units per series.
STATEMENTS OF CHANGES IN NET ASSETSATTRIBUTABLE TO HOLDERS OF REDEEMABLE UNITSFor the six month periods ended June 30,
2015 2014NET ASSETS ATTRIBUTABLE TO HOLDERS OF REDEEMABLE
UNITS, BEGINNING OF PERIODSeries I $1,871,893,210 $1,356,859,788Series M 2,271,786,372 1,931,974,119
4,143,679,582 3,288,833,907
INCREASE (DECREASE) IN NET ASSETS ATTRIBUTABLE TOHOLDERS OF REDEEMABLE UNITS FROM OPERATIONS
Series I 57,004,793 60,939,344Series M 63,589,362 78,313,554
120,594,155 139,252,898
DISTRIBUTIONS TO HOLDERS OF REDEEMABLE UNITSFrom net investment income
Series I (39,650,964) (31,873,749)Series M (41,079,675) (38,257,437)
(80,730,639) (70,131,186)
REDEEMABLE UNIT TRANSACTIONSProceeds from issue
Series I 650,958,210 330,368,838Series M 261,018,088 292,242,215
Reinvested distributionsSeries I 39,650,932 31,873,749Series M 34,383,824 31,762,970
Payments on redemptionSeries I (9,096,494) (26,979,278)Series M (299,837,908) (320,643,709)
677,076,652 338,624,785
INCREASE (DECREASE) IN NET ASSETS ATTRIBUTABLE TOHOLDERS OF REDEEMABLE UNITS
Series I 698,866,477 364,328,904Series M 18,073,691 43,417,593
716,940,168 407,746,497
NET ASSETS ATTRIBUTABLE TO HOLDERS OF REDEEMABLEUNITS, END OF PERIOD
Series I 2,570,759,687 1,721,188,692Series M 2,289,860,063 1,975,391,712
$4,860,619,750 $3,696,580,404
STATEMENTS OF CASH FLOWSFor the six month periods ended June 30,
2015 2014CASH FLOWS FROM OPERATING ACTIVITIESIncrease (decrease) in net assets attributable to holders of
redeemable units $ 120,594,155 $ 139,252,898Adjustments for:
Net realized (gain) loss on non-derivative financial assets (31,410,502) (16,654,192)Unrealized (gain) loss on foreign exchange of cash (145,693) (8,848)Change in unrealized (gain) loss on non-derivative financial
assets (22,087,477) (73,265,250)Purchases of non-derivative financial assets (1,833,848,256) (1,230,390,661)Proceeds from sale of non-derivative financial assets 1,181,964,011 908,038,974Transaction costs 31,000 –Margin deposited on futures (916,125) (748,153)Accrued investment income and other (4,570,679) 884,599Accrued expenses 248,417 181,512
Net cash provided by (used in) operating activities (590,141,149) (272,709,121)CASH FLOWS FROM FINANCING ACTIVITIESProceeds from issue of redeemable units 909,911,999 616,536,480Amounts paid on redemption of redeemable units (307,294,964) (339,660,882)Distributions to unitholders of redeemable units (5,646,561) (5,468,245)
Net cash provided by (used in) financing activities 596,970,474 271,407,353Change in unrealized gain (loss) on foreign exchange of cash 145,693 8,848Net increase (decrease) in cash 6,829,325 (1,301,768)Cash (bank overdraft), beginning of period 11,988,227 10,176,995
CASH (BANK OVERDRAFT), END OF PERIOD $ 18,963,245 $ 8,884,075
Interest paid(1) 589 –Interest received(1) 71,117,201 66,612,554Dividends received, net of withholding taxes(1) 124,938 –
(1) Classified as operating items.
The accompanying notes are an integral part of the financial statements.
57
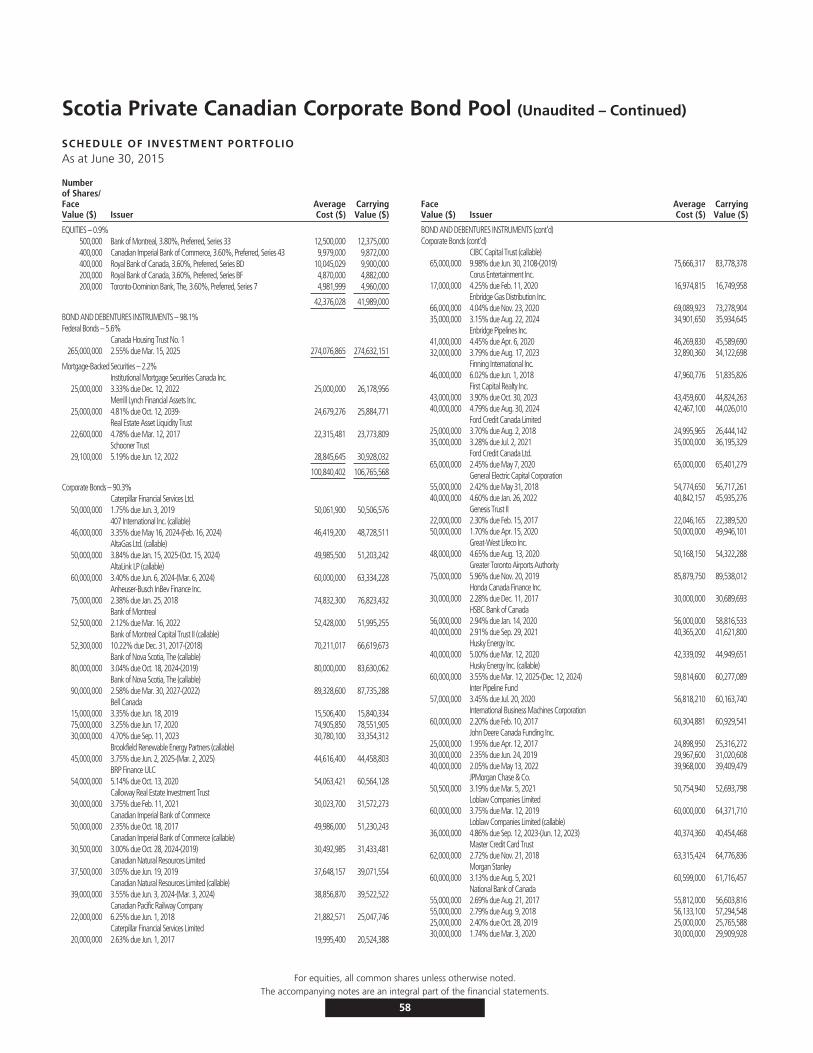
Scotia Private Canadian Corporate Bond Pool (Unaudited – Continued)
SCHEDULE OF INVESTMENT PORTFOLIOAs at June 30, 2015
Numberof Shares/FaceValue ($) Issuer
AverageCost ($)
CarryingValue ($)
EQUITIES – 0.9%500,000 Bank of Montreal, 3.80%, Preferred, Series 33 12,500,000 12,375,000400,000 Canadian Imperial Bank of Commerce, 3.60%, Preferred, Series 43 9,979,000 9,872,000400,000 Royal Bank of Canada, 3.60%, Preferred, Series BD 10,045,029 9,900,000200,000 Royal Bank of Canada, 3.60%, Preferred, Series BF 4,870,000 4,882,000200,000 Toronto-Dominion Bank, The, 3.60%, Preferred, Series 7 4,981,999 4,960,000
42,376,028 41,989,000
BOND AND DEBENTURES INSTRUMENTS – 98.1%Federal Bonds – 5.6%
Canada Housing Trust No. 1265,000,000 2.55% due Mar. 15, 2025 274,076,865 274,632,151
Mortgage-Backed Securities – 2.2%Institutional Mortgage Securities Canada Inc.
25,000,000 3.33% due Dec. 12, 2022 25,000,000 26,178,956Merrill Lynch Financial Assets Inc.
25,000,000 4.81% due Oct. 12, 2039- 24,679,276 25,884,771Real Estate Asset Liquidity Trust
22,600,000 4.78% due Mar. 12, 2017 22,315,481 23,773,809Schooner Trust
29,100,000 5.19% due Jun. 12, 2022 28,845,645 30,928,032
100,840,402 106,765,568
Corporate Bonds – 90.3%Caterpillar Financial Services Ltd.
50,000,000 1.75% due Jun. 3, 2019 50,061,900 50,506,576407 International Inc. (callable)
46,000,000 3.35% due May 16, 2024-(Feb. 16, 2024) 46,419,200 48,728,511AltaGas Ltd. (callable)
50,000,000 3.84% due Jan. 15, 2025-(Oct. 15, 2024) 49,985,500 51,203,242AltaLink LP (callable)
60,000,000 3.40% due Jun. 6, 2024-(Mar. 6, 2024) 60,000,000 63,334,228Anheuser-Busch InBev Finance Inc.
75,000,000 2.38% due Jan. 25, 2018 74,832,300 76,823,432Bank of Montreal
52,500,000 2.12% due Mar. 16, 2022 52,428,000 51,995,255Bank of Montreal Capital Trust II (callable)
52,300,000 10.22% due Dec. 31, 2017-(2018) 70,211,017 66,619,673Bank of Nova Scotia, The (callable)
80,000,000 3.04% due Oct. 18, 2024-(2019) 80,000,000 83,630,062Bank of Nova Scotia, The (callable)
90,000,000 2.58% due Mar. 30, 2027-(2022) 89,328,600 87,735,288Bell Canada
15,000,000 3.35% due Jun. 18, 2019 15,506,400 15,840,33475,000,000 3.25% due Jun. 17, 2020 74,905,850 78,551,90530,000,000 4.70% due Sep. 11, 2023 30,780,100 33,354,312
Brookfield Renewable Energy Partners (callable)45,000,000 3.75% due Jun. 2, 2025-(Mar. 2, 2025) 44,616,400 44,458,803
BRP Finance ULC54,000,000 5.14% due Oct. 13, 2020 54,063,421 60,564,128
Calloway Real Estate Investment Trust30,000,000 3.75% due Feb. 11, 2021 30,023,700 31,572,273
Canadian Imperial Bank of Commerce50,000,000 2.35% due Oct. 18, 2017 49,986,000 51,230,243
Canadian Imperial Bank of Commerce (callable)30,500,000 3.00% due Oct. 28, 2024-(2019) 30,492,985 31,433,481
Canadian Natural Resources Limited37,500,000 3.05% due Jun. 19, 2019 37,648,157 39,071,554
Canadian Natural Resources Limited (callable)39,000,000 3.55% due Jun. 3, 2024-(Mar. 3, 2024) 38,856,870 39,522,522
Canadian Pacific Railway Company22,000,000 6.25% due Jun. 1, 2018 21,882,571 25,047,746
Caterpillar Financial Services Limited20,000,000 2.63% due Jun. 1, 2017 19,995,400 20,524,388
FaceValue ($) Issuer
AverageCost ($)
CarryingValue ($)
BOND AND DEBENTURES INSTRUMENTS (cont’d)Corporate Bonds (cont’d)
CIBC Capital Trust (callable)65,000,000 9.98% due Jun. 30, 2108-(2019) 75,666,317 83,778,378
Corus Entertainment Inc.17,000,000 4.25% due Feb. 11, 2020 16,974,815 16,749,958
Enbridge Gas Distribution Inc.66,000,000 4.04% due Nov. 23, 2020 69,089,923 73,278,90435,000,000 3.15% due Aug. 22, 2024 34,901,650 35,934,645
Enbridge Pipelines Inc.41,000,000 4.45% due Apr. 6, 2020 46,269,830 45,589,69032,000,000 3.79% due Aug. 17, 2023 32,890,360 34,122,698
Finning International Inc.46,000,000 6.02% due Jun. 1, 2018 47,960,776 51,835,826
First Capital Realty Inc.43,000,000 3.90% due Oct. 30, 2023 43,459,600 44,824,26340,000,000 4.79% due Aug. 30, 2024 42,467,100 44,026,010
Ford Credit Canada Limited25,000,000 3.70% due Aug. 2, 2018 24,995,965 26,444,14235,000,000 3.28% due Jul. 2, 2021 35,000,000 36,195,329
Ford Credit Canada Ltd.65,000,000 2.45% due May 7, 2020 65,000,000 65,401,279
General Electric Capital Corporation55,000,000 2.42% due May 31, 2018 54,774,650 56,717,26140,000,000 4.60% due Jan. 26, 2022 40,842,157 45,935,276
Genesis Trust II22,000,000 2.30% due Feb. 15, 2017 22,046,165 22,389,52050,000,000 1.70% due Apr. 15, 2020 50,000,000 49,946,101
Great-West Lifeco Inc.48,000,000 4.65% due Aug. 13, 2020 50,168,150 54,322,288
Greater Toronto Airports Authority75,000,000 5.96% due Nov. 20, 2019 85,879,750 89,538,012
Honda Canada Finance Inc.30,000,000 2.28% due Dec. 11, 2017 30,000,000 30,689,693
HSBC Bank of Canada56,000,000 2.94% due Jan. 14, 2020 56,000,000 58,816,53340,000,000 2.91% due Sep. 29, 2021 40,365,200 41,621,800
Husky Energy Inc.40,000,000 5.00% due Mar. 12, 2020 42,339,092 44,949,651
Husky Energy Inc. (callable)60,000,000 3.55% due Mar. 12, 2025-(Dec. 12, 2024) 59,814,600 60,277,089
Inter Pipeline Fund57,000,000 3.45% due Jul. 20, 2020 56,818,210 60,163,740
International Business Machines Corporation60,000,000 2.20% due Feb. 10, 2017 60,304,881 60,929,541
John Deere Canada Funding Inc.25,000,000 1.95% due Apr. 12, 2017 24,898,950 25,316,27230,000,000 2.35% due Jun. 24, 2019 29,967,600 31,020,60840,000,000 2.05% due May 13, 2022 39,968,000 39,409,479
JPMorgan Chase & Co.50,500,000 3.19% due Mar. 5, 2021 50,754,940 52,693,798
Loblaw Companies Limited60,000,000 3.75% due Mar. 12, 2019 60,000,000 64,371,710
Loblaw Companies Limited (callable)36,000,000 4.86% due Sep. 12, 2023-(Jun. 12, 2023) 40,374,360 40,454,468
Master Credit Card Trust62,000,000 2.72% due Nov. 21, 2018 63,315,424 64,776,836
Morgan Stanley60,000,000 3.13% due Aug. 5, 2021 60,599,000 61,716,457
National Bank of Canada55,000,000 2.69% due Aug. 21, 2017 55,812,000 56,603,81655,000,000 2.79% due Aug. 9, 2018 56,133,100 57,294,54825,000,000 2.40% due Oct. 28, 2019 25,000,000 25,765,58830,000,000 1.74% due Mar. 3, 2020 30,000,000 29,909,928
For equities, all common shares unless otherwise noted.The accompanying notes are an integral part of the financial statements.
58

Scotia Private Canadian Corporate Bond Pool (Unaudited – Continued)
SCHEDULE OF INVESTMENT PORTFOLIO
FaceValue ($) Issuer
AverageCost ($)
CarryingValue ($)
BOND AND DEBENTURES INSTRUMENTS (cont’d)Corporate Bonds (cont’d)
NAV Canada47,000,000 5.30% due Apr. 17, 2019 52,269,387 54,051,02934,000,000 4.40% due Feb. 18, 2021 35,156,180 38,801,051
North West Redwater Partnership (callable)30,000,000 2.10% due Feb. 23, 2022-(Jan. 23, 2022) 29,939,700 29,777,19817,000,000 3.20% due Jul. 22, 2024-(Apr. 23, 2024) 17,076,970 17,589,622
RioCan Real Estate Investment Trust20,000,000 3.75% due May 30, 2022 20,000,000 20,872,14556,500,000 3.29% due Feb. 12, 2024 56,447,075 55,561,852
Rogers Communications Inc.68,000,000 5.34% due Mar. 22, 2021 71,400,500 78,140,66227,500,000 4.00% due Jun. 6, 2022 27,434,150 29,473,325
Royal Bank of Canada (callable)91,000,000 2.99% due Dec. 6, 2024-(2019) 91,279,583 94,943,882
Royal Bank of Canada48,000,000 1.97% due Mar. 2, 2022 48,000,000 46,987,378
Royal Bank of Canada (callable)95,000,000 2.48% due Jun.4,2025-(2020) 94,981,950 94,824,056
Scotiabank Tier I Trust (callable)41,500,000 7.80% due Jun. 30, 2018-(2019) 46,270,484 50,329,910
Shaw Communications Inc.50,000,000 5.65% due Oct. 1, 2019 50,173,826 57,258,51627,000,000 4.35% due Jan. 31, 2024 28,091,210 28,843,440
Sobeys Inc.38,000,000 3.52% due Aug. 8, 2018 37,984,420 39,977,219
Suncor Energy, Inc.50,000,000 5.80% due May 22, 2018 52,450,827 56,150,769
Suncor Energy, Inc. (callable)40,000,000 3.10% due Nov. 26, 2021-(Oct. 26, 2021) 39,921,150 41,782,818
TD Capital Trust III (callable)37,000,000 7.24% due Dec. 31, 2049-(2018) 39,751,558 43,669,893
FaceValue ($) Issuer
AverageCost ($)
CarryingValue ($)
BOND AND DEBENTURES INSTRUMENTS (cont’d)Corporate Bonds (cont’d)
TELUS Corporation (callable)40,000,000 3.35% due Mar. 15, 2023-(Dec. 15, 2022) 39,953,200 40,915,57260,000,000 3.35% due Apr. 1, 2024-(Jan. 2, 2024) 59,488,100 60,503,155
Teranet Holdings LP50,000,000 4.81% due Dec. 16, 2020 49,942,593 55,872,529
Thomson Reuters Corporation60,500,000 4.35% due Sep. 30, 2020 64,134,120 66,496,561
Toronto Hydro Corporation25,000,000 3.54% due Nov. 18, 2021 25,220,557 27,296,972
Toronto Hydro Corporation (callable)25,000,000 2.91% due Apr. 10, 2023-(Jan. 10, 2023) 24,169,750 25,842,598
Toronto-Dominion Bank, The50,000,000 2.62% due Dec. 22, 2021 50,000,000 51,375,830
125,000,000 3.23% due Jul. 24, 2024 128,306,550 130,441,080Toyota Credit Canada Inc.
35,000,000 2.05% due May 20, 2020 34,993,350 35,382,110VW Credit Canada Inc.
64,500,000 2.15% due Jun. 24, 2020 64,384,545 65,043,323Wells Fargo & Company
45,000,000 3.87% due May 21, 2025 45,000,000 45,775,808Wells Fargo Financial Canada Corporation
67,500,000 3.04% due Jan. 29, 2021 68,024,465 70,898,495
4,235,123,136 4,390,437,889
TOTAL INVESTMENT PORTFOLIO 4,652,416,431 4,813,824,608
Futures Contracts – 0.2% 8,526,349OTHER ASSETS, LESS LIABILITIES – 0.8% 38,268,793
NET ASSETS – 100.0% 4,860,619,750
Expiry DateNumber ofContracts Futures Contracts Counterparty Credit Risk
ContractualValue
Canadian ($)Fair Value
Canadian ($)Appreciation/
(Depreciation) ($)BOND FUTURES CONTRACTSSep. 2015 1,600 U.S. Treasury Long Bond Futures BMO A+ 254,263,070 252,132,589 (2,130,481)Sep. 2015 (2,800) Canada 10 Year Bond Future BMO A+ (389,423,857) (392,000,000) (2,576,143)
(4,706,624)
The above bond futures contracts are financial agreements to purchase/sell the bond at a contracted price on a specific future date.
However, the Fund does not intend to purchase/sell the bond on settlement. Rather, it intends to close out each bond futures contracts before settlement by entering into equal, but offsetting bondfutures contracts.
With respect to the above future contracts, $2,500,000 of the March 15, 2025 Canada Housing Trust No. 1 2.55% is held on margin.
The accompanying notes are an integral part of the financial statements.
59
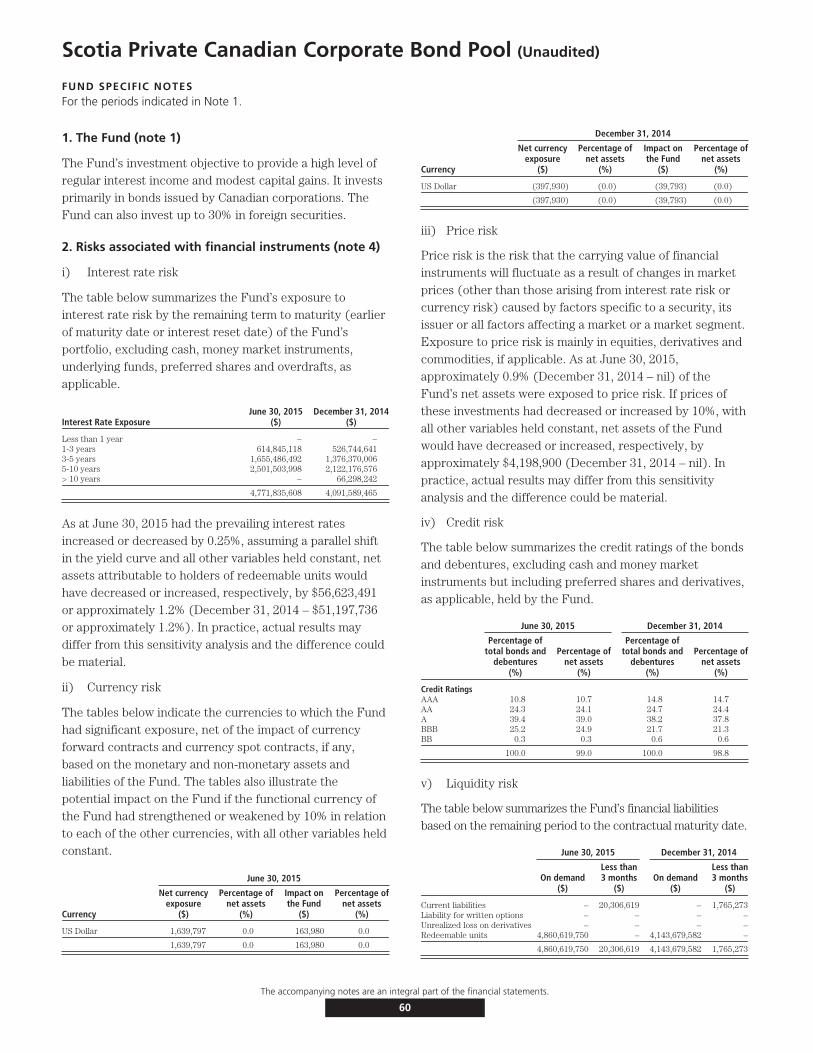
Scotia Private Canadian Corporate Bond Pool (Unaudited)
FUND SPECIFIC NOTESFor the periods indicated in Note 1.
1. The Fund (note 1)
The Fund’s investment objective to provide a high level ofregular interest income and modest capital gains. It investsprimarily in bonds issued by Canadian corporations. TheFund can also invest up to 30% in foreign securities.
2. Risks associated with financial instruments (note 4)
i) Interest rate risk
The table below summarizes the Fund’s exposure tointerest rate risk by the remaining term to maturity (earlierof maturity date or interest reset date) of the Fund’sportfolio, excluding cash, money market instruments,underlying funds, preferred shares and overdrafts, asapplicable.
Interest Rate ExposureJune 30, 2015
($)December 31, 2014
($)
Less than 1 year – –1-3 years 614,845,118 526,744,6413-5 years 1,655,486,492 1,376,370,0065-10 years 2,501,503,998 2,122,176,576> 10 years – 66,298,242
4,771,835,608 4,091,589,465
As at June 30, 2015 had the prevailing interest ratesincreased or decreased by 0.25%, assuming a parallel shiftin the yield curve and all other variables held constant, netassets attributable to holders of redeemable units wouldhave decreased or increased, respectively, by $56,623,491or approximately 1.2% (December 31, 2014 – $51,197,736or approximately 1.2%). In practice, actual results maydiffer from this sensitivity analysis and the difference couldbe material.
ii) Currency risk
The tables below indicate the currencies to which the Fundhad significant exposure, net of the impact of currencyforward contracts and currency spot contracts, if any,based on the monetary and non-monetary assets andliabilities of the Fund. The tables also illustrate thepotential impact on the Fund if the functional currency ofthe Fund had strengthened or weakened by 10% in relationto each of the other currencies, with all other variables heldconstant.
June 30, 2015
Currency
Net currencyexposure
($)
Percentage ofnet assets
(%)
Impact onthe Fund
($)
Percentage ofnet assets
(%)
US Dollar 1,639,797 0.0 163,980 0.0
1,639,797 0.0 163,980 0.0
December 31, 2014
Currency
Net currencyexposure
($)
Percentage ofnet assets
(%)
Impact onthe Fund
($)
Percentage ofnet assets
(%)
US Dollar (397,930) (0.0) (39,793) (0.0)
(397,930) (0.0) (39,793) (0.0)
iii) Price risk
Price risk is the risk that the carrying value of financialinstruments will fluctuate as a result of changes in marketprices (other than those arising from interest rate risk orcurrency risk) caused by factors specific to a security, itsissuer or all factors affecting a market or a market segment.Exposure to price risk is mainly in equities, derivatives andcommodities, if applicable. As at June 30, 2015,approximately 0.9% (December 31, 2014 – nil) of theFund’s net assets were exposed to price risk. If prices ofthese investments had decreased or increased by 10%, withall other variables held constant, net assets of the Fundwould have decreased or increased, respectively, byapproximately $4,198,900 (December 31, 2014 – nil). Inpractice, actual results may differ from this sensitivityanalysis and the difference could be material.
iv) Credit risk
The table below summarizes the credit ratings of the bondsand debentures, excluding cash and money marketinstruments but including preferred shares and derivatives,as applicable, held by the Fund.
June 30, 2015 December 31, 2014
Percentage oftotal bonds and
debentures(%)
Percentage ofnet assets
(%)
Percentage oftotal bonds and
debentures(%)
Percentage ofnet assets
(%)
Credit RatingsAAA 10.8 10.7 14.8 14.7AA 24.3 24.1 24.7 24.4A 39.4 39.0 38.2 37.8BBB 25.2 24.9 21.7 21.3BB 0.3 0.3 0.6 0.6
100.0 99.0 100.0 98.8
v) Liquidity risk
The table below summarizes the Fund’s financial liabilitiesbased on the remaining period to the contractual maturity date.
June 30, 2015 December 31, 2014
On demand($)
Less than3 months
($)On demand
($)
Less than3 months
($)
Current liabilities – 20,306,619 – 1,765,273Liability for written options – – – –Unrealized loss on derivatives – – – –Redeemable units 4,860,619,750 – 4,143,679,582 –
4,860,619,750 20,306,619 4,143,679,582 1,765,273
The accompanying notes are an integral part of the financial statements.
60
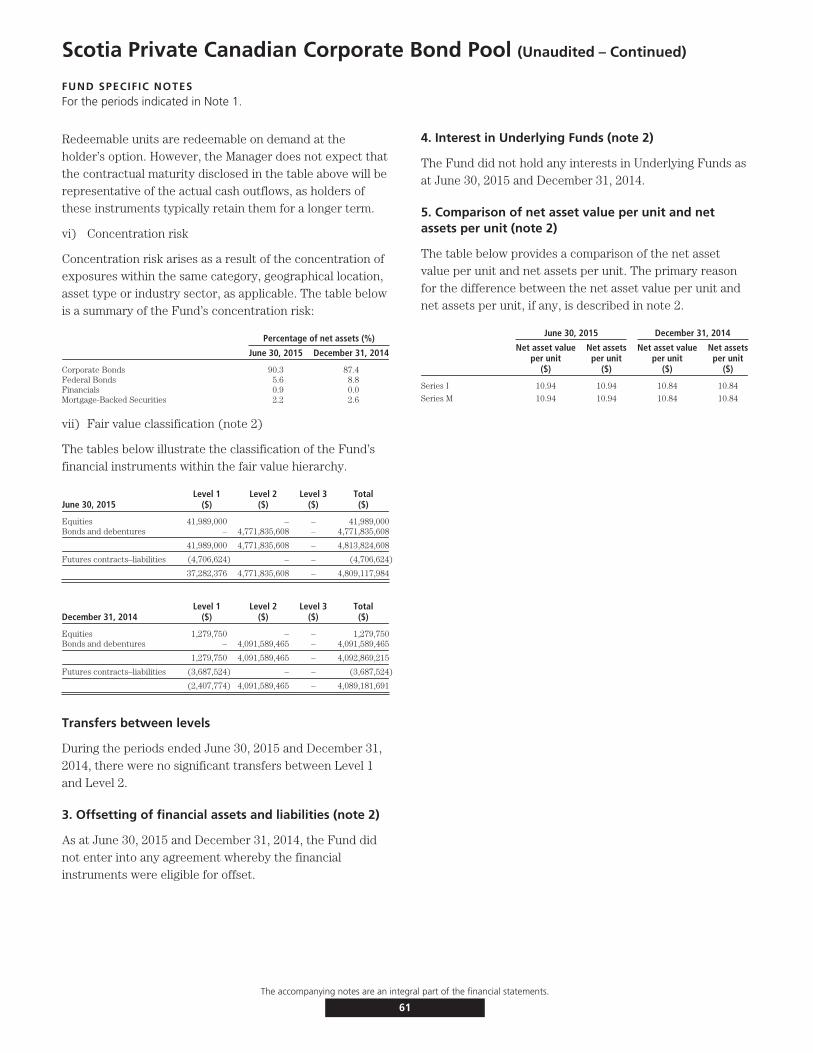
Scotia Private Canadian Corporate Bond Pool (Unaudited – Continued)
FUND SPECIFIC NOTESFor the periods indicated in Note 1.
Redeemable units are redeemable on demand at theholder’s option. However, the Manager does not expect thatthe contractual maturity disclosed in the table above will berepresentative of the actual cash outflows, as holders ofthese instruments typically retain them for a longer term.
vi) Concentration risk
Concentration risk arises as a result of the concentration ofexposures within the same category, geographical location,asset type or industry sector, as applicable. The table belowis a summary of the Fund’s concentration risk:
Percentage of net assets (%)
June 30, 2015 December 31, 2014
Corporate Bonds 90.3 87.4Federal Bonds 5.6 8.8Financials 0.9 0.0Mortgage-Backed Securities 2.2 2.6
vii) Fair value classification (note 2)
The tables below illustrate the classification of the Fund’sfinancial instruments within the fair value hierarchy.
June 30, 2015Level 1
($)Level 2
($)Level 3
($)Total($)
Equities 41,989,000 – – 41,989,000Bonds and debentures – 4,771,835,608 – 4,771,835,608
41,989,000 4,771,835,608 – 4,813,824,608
Futures contracts–liabilities (4,706,624) – – (4,706,624)
37,282,376 4,771,835,608 – 4,809,117,984
December 31, 2014Level 1
($)Level 2
($)Level 3
($)Total($)
Equities 1,279,750 – – 1,279,750Bonds and debentures – 4,091,589,465 – 4,091,589,465
1,279,750 4,091,589,465 – 4,092,869,215
Futures contracts–liabilities (3,687,524) – – (3,687,524)
(2,407,774) 4,091,589,465 – 4,089,181,691
Transfers between levels
During the periods ended June 30, 2015 and December 31,2014, there were no significant transfers between Level 1and Level 2.
3. Offsetting of financial assets and liabilities (note 2)
As at June 30, 2015 and December 31, 2014, the Fund didnot enter into any agreement whereby the financialinstruments were eligible for offset.
4. Interest in Underlying Funds (note 2)
The Fund did not hold any interests in Underlying Funds asat June 30, 2015 and December 31, 2014.
5. Comparison of net asset value per unit and netassets per unit (note 2)
The table below provides a comparison of the net assetvalue per unit and net assets per unit. The primary reasonfor the difference between the net asset value per unit andnet assets per unit, if any, is described in note 2.
June 30, 2015 December 31, 2014
Net asset valueper unit
($)
Net assetsper unit
($)
Net asset valueper unit
($)
Net assetsper unit
($)
Series I 10.94 10.94 10.84 10.84
Series M 10.94 10.94 10.84 10.84
The accompanying notes are an integral part of the financial statements.
61
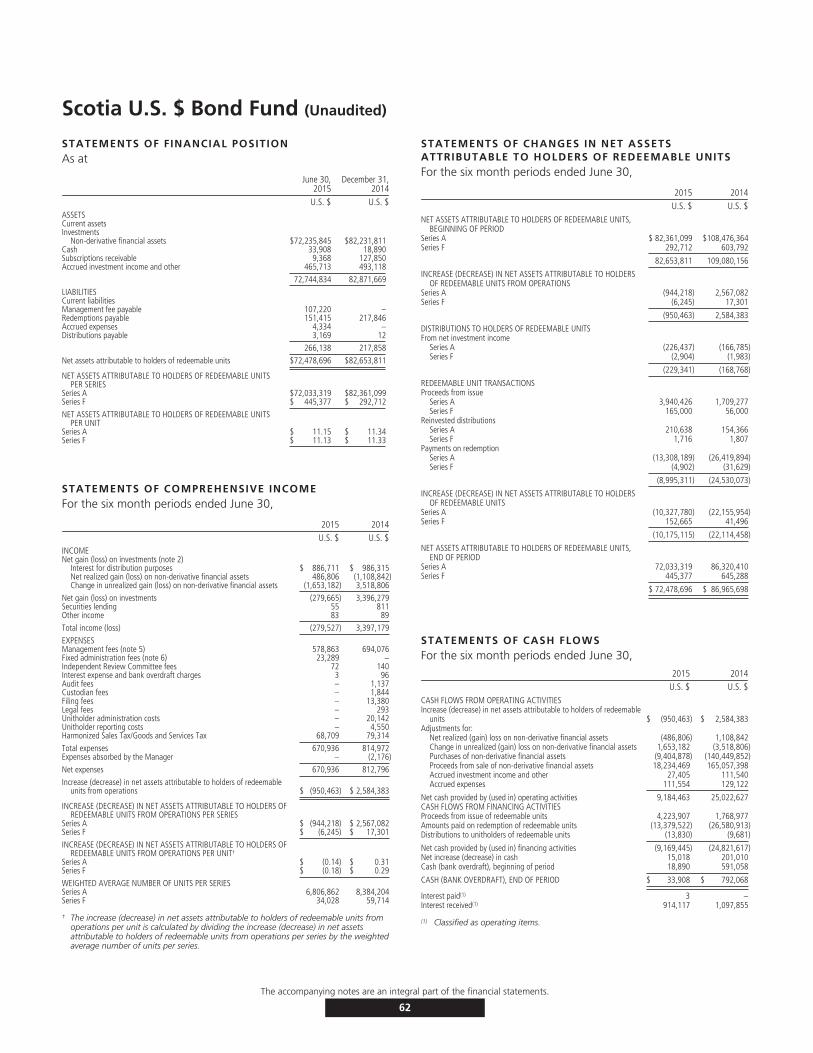
Scotia U.S. $ Bond Fund (Unaudited)
STATEMENTS OF FINANCIAL POSITIONAs at
June 30,2015
December 31,2014
U.S. $ U.S. $ASSETSCurrent assetsInvestments
Non-derivative financial assets $72,235,845 $82,231,811Cash 33,908 18,890Subscriptions receivable 9,368 127,850Accrued investment income and other 465,713 493,118
72,744,834 82,871,669
LIABILITIESCurrent liabilitiesManagement fee payable 107,220 –Redemptions payable 151,415 217,846Accrued expenses 4,334 –Distributions payable 3,169 12
266,138 217,858
Net assets attributable to holders of redeemable units $72,478,696 $82,653,811
NET ASSETS ATTRIBUTABLE TO HOLDERS OF REDEEMABLE UNITSPER SERIES
Series A $72,033,319 $82,361,099Series F $ 445,377 $ 292,712
NET ASSETS ATTRIBUTABLE TO HOLDERS OF REDEEMABLE UNITSPER UNIT
Series A $ 11.15 $ 11.34Series F $ 11.13 $ 11.33
STATEMENTS OF COMPREHENSIVE INCOMEFor the six month periods ended June 30,
2015 2014U.S. $ U.S. $
INCOMENet gain (loss) on investments (note 2)
Interest for distribution purposes $ 886,711 $ 986,315Net realized gain (loss) on non-derivative financial assets 486,806 (1,108,842)Change in unrealized gain (loss) on non-derivative financial assets (1,653,182) 3,518,806
Net gain (loss) on investments (279,665) 3,396,279Securities lending 55 811Other income 83 89
Total income (loss) (279,527) 3,397,179
EXPENSESManagement fees (note 5) 578,863 694,076Fixed administration fees (note 6) 23,289 –Independent Review Committee fees 72 140Interest expense and bank overdraft charges 3 96Audit fees – 1,137Custodian fees – 1,844Filing fees – 13,380Legal fees – 293Unitholder administration costs – 20,142Unitholder reporting costs – 4,550Harmonized Sales Tax/Goods and Services Tax 68,709 79,314
Total expenses 670,936 814,972Expenses absorbed by the Manager – (2,176)
Net expenses 670,936 812,796
Increase (decrease) in net assets attributable to holders of redeemableunits from operations $ (950,463) $ 2,584,383
INCREASE (DECREASE) IN NET ASSETS ATTRIBUTABLE TO HOLDERS OFREDEEMABLE UNITS FROM OPERATIONS PER SERIES
Series A $ (944,218) $ 2,567,082Series F $ (6,245) $ 17,301
INCREASE (DECREASE) IN NET ASSETS ATTRIBUTABLE TO HOLDERS OFREDEEMABLE UNITS FROM OPERATIONS PER UNIT†
Series A $ (0.14) $ 0.31Series F $ (0.18) $ 0.29
WEIGHTED AVERAGE NUMBER OF UNITS PER SERIESSeries A 6,806,862 8,384,204Series F 34,028 59,714
† The increase (decrease) in net assets attributable to holders of redeemable units fromoperations per unit is calculated by dividing the increase (decrease) in net assetsattributable to holders of redeemable units from operations per series by the weightedaverage number of units per series.
STATEMENTS OF CHANGES IN NET ASSETSATTRIBUTABLE TO HOLDERS OF REDEEMABLE UNITSFor the six month periods ended June 30,
2015 2014U.S. $ U.S. $
NET ASSETS ATTRIBUTABLE TO HOLDERS OF REDEEMABLE UNITS,BEGINNING OF PERIOD
Series A $ 82,361,099 $108,476,364Series F 292,712 603,792
82,653,811 109,080,156
INCREASE (DECREASE) IN NET ASSETS ATTRIBUTABLE TO HOLDERSOF REDEEMABLE UNITS FROM OPERATIONS
Series A (944,218) 2,567,082Series F (6,245) 17,301
(950,463) 2,584,383
DISTRIBUTIONS TO HOLDERS OF REDEEMABLE UNITSFrom net investment income
Series A (226,437) (166,785)Series F (2,904) (1,983)
(229,341) (168,768)
REDEEMABLE UNIT TRANSACTIONSProceeds from issue
Series A 3,940,426 1,709,277Series F 165,000 56,000
Reinvested distributionsSeries A 210,638 154,366Series F 1,716 1,807
Payments on redemptionSeries A (13,308,189) (26,419,894)Series F (4,902) (31,629)
(8,995,311) (24,530,073)
INCREASE (DECREASE) IN NET ASSETS ATTRIBUTABLE TO HOLDERSOF REDEEMABLE UNITS
Series A (10,327,780) (22,155,954)Series F 152,665 41,496
(10,175,115) (22,114,458)
NET ASSETS ATTRIBUTABLE TO HOLDERS OF REDEEMABLE UNITS,END OF PERIOD
Series A 72,033,319 86,320,410Series F 445,377 645,288
$ 72,478,696 $ 86,965,698
STATEMENTS OF CASH FLOWSFor the six month periods ended June 30,
2015 2014U.S. $ U.S. $
CASH FLOWS FROM OPERATING ACTIVITIESIncrease (decrease) in net assets attributable to holders of redeemable
units $ (950,463) $ 2,584,383Adjustments for:
Net realized (gain) loss on non-derivative financial assets (486,806) 1,108,842Change in unrealized (gain) loss on non-derivative financial assets 1,653,182 (3,518,806)Purchases of non-derivative financial assets (9,404,878) (140,449,852)Proceeds from sale of non-derivative financial assets 18,234,469 165,057,398Accrued investment income and other 27,405 111,540Accrued expenses 111,554 129,122
Net cash provided by (used in) operating activities 9,184,463 25,022,627CASH FLOWS FROM FINANCING ACTIVITIESProceeds from issue of redeemable units 4,223,907 1,768,977Amounts paid on redemption of redeemable units (13,379,522) (26,580,913)Distributions to unitholders of redeemable units (13,830) (9,681)
Net cash provided by (used in) financing activities (9,169,445) (24,821,617)Net increase (decrease) in cash 15,018 201,010Cash (bank overdraft), beginning of period 18,890 591,058
CASH (BANK OVERDRAFT), END OF PERIOD $ 33,908 $ 792,068
Interest paid(1) 3 –Interest received(1) 914,117 1,097,855
(1) Classified as operating items.
The accompanying notes are an integral part of the financial statements.
62
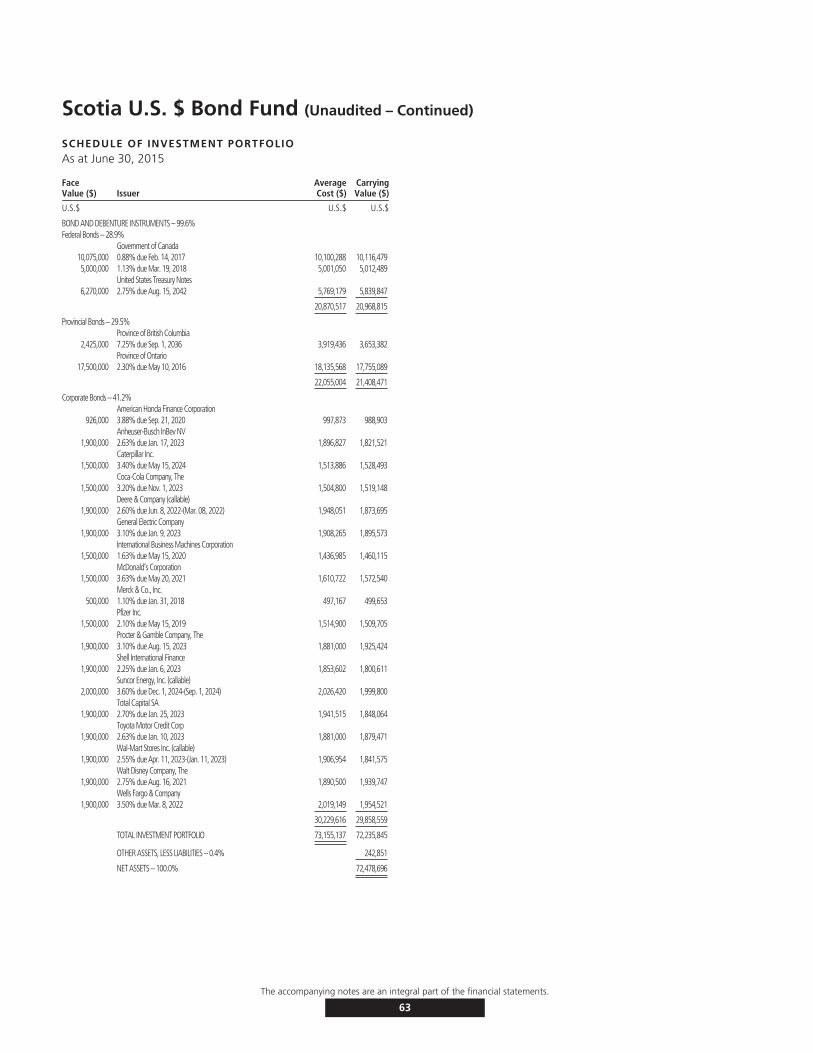
Scotia U.S. $ Bond Fund (Unaudited – Continued)
SCHEDULE OF INVESTMENT PORTFOLIOAs at June 30, 2015
FaceValue ($) Issuer
AverageCost ($)
CarryingValue ($)
U.S.$ U.S.$ U.S.$
BOND AND DEBENTURE INSTRUMENTS – 99.6%Federal Bonds – 28.9%
Government of Canada10,075,000 0.88% due Feb. 14, 2017 10,100,288 10,116,4795,000,000 1.13% due Mar. 19, 2018 5,001,050 5,012,489
United States Treasury Notes6,270,000 2.75% due Aug. 15, 2042 5,769,179 5,839,847
20,870,517 20,968,815
Provincial Bonds – 29.5%Province of British Columbia
2,425,000 7.25% due Sep. 1, 2036 3,919,436 3,653,382Province of Ontario
17,500,000 2.30% due May 10, 2016 18,135,568 17,755,089
22,055,004 21,408,471
Corporate Bonds – 41.2%American Honda Finance Corporation
926,000 3.88% due Sep. 21, 2020 997,873 988,903Anheuser-Busch InBev NV
1,900,000 2.63% due Jan. 17, 2023 1,896,827 1,821,521Caterpillar Inc.
1,500,000 3.40% due May 15, 2024 1,513,886 1,528,493Coca-Cola Company, The
1,500,000 3.20% due Nov. 1, 2023 1,504,800 1,519,148Deere & Company (callable)
1,900,000 2.60% due Jun. 8, 2022-(Mar. 08, 2022) 1,948,051 1,873,695General Electric Company
1,900,000 3.10% due Jan. 9, 2023 1,908,265 1,895,573International Business Machines Corporation
1,500,000 1.63% due May 15, 2020 1,436,985 1,460,115McDonald’s Corporation
1,500,000 3.63% due May 20, 2021 1,610,722 1,572,540Merck & Co., Inc.
500,000 1.10% due Jan. 31, 2018 497,167 499,653Pfizer Inc.
1,500,000 2.10% due May 15, 2019 1,514,900 1,509,705Procter & Gamble Company, The
1,900,000 3.10% due Aug. 15, 2023 1,881,000 1,925,424Shell International Finance
1,900,000 2.25% due Jan. 6, 2023 1,853,602 1,800,611Suncor Energy, Inc. (callable)
2,000,000 3.60% due Dec. 1, 2024-(Sep. 1, 2024) 2,026,420 1,999,800Total Capital SA
1,900,000 2.70% due Jan. 25, 2023 1,941,515 1,848,064Toyota Motor Credit Corp
1,900,000 2.63% due Jan. 10, 2023 1,881,000 1,879,471Wal-Mart Stores Inc. (callable)
1,900,000 2.55% due Apr. 11, 2023-(Jan. 11, 2023) 1,906,954 1,841,575Walt Disney Company, The
1,900,000 2.75% due Aug. 16, 2021 1,890,500 1,939,747Wells Fargo & Company
1,900,000 3.50% due Mar. 8, 2022 2,019,149 1,954,521
30,229,616 29,858,559
TOTAL INVESTMENT PORTFOLIO 73,155,137 72,235,845
OTHER ASSETS, LESS LIABILITIES – 0.4% 242,851
NET ASSETS – 100.0% 72,478,696
The accompanying notes are an integral part of the financial statements.
63

Scotia U.S. $ Bond Fund (Unaudited)
FUND SPECIFIC NOTESFor the periods indicated in Note 1.
1. The Fund (note 1)
The Fund’s investment objective is to provide a high level ofinterest income. It invests primarily in bonds and treasurybills that are denominated in U.S. dollars and are issued byCanadian federal, provincial and municipal governments,Canadian corporations, and supranational entities, such asthe World Bank.
2. Risks associated with financial instruments (note 4)
i) Interest rate risk
The table below summarizes the Fund’s exposure tointerest rate risk by the remaining term to maturity (earlierof maturity date or interest reset date) of the Fund’sportfolio, excluding cash, money market instruments,underlying funds, preferred shares and overdrafts, asapplicable.
Interest rate exposureJune 30, 2015
($)December 31, 2014
($)
Less than 1 year 17,755,091 –1-3 years 15,628,622 41,048,7453-5 years 2,969,820 2,012,0875-10 years 26,389,083 28,149,294> 10 years 9,493,229 11,021,685
72,235,845 82,231,811
As at June 30, 2015 had the prevailing interest ratesincreased or decreased by 0.25%, assuming a parallel shiftin the yield curve and all other variables held constant, netassets attributable to holders of redeemable units wouldhave decreased or increased, respectively, by $963,516 orapproximately 1.3% (December 31, 2014 – $1,178,971 orapproximately 1.4%). In practice, actual results may differfrom this sensitivity analysis and the difference could bematerial.
ii) Currency risk
The Fund did not have significant currency risk exposureas at June 30, 2015 or December 31, 2014.
iii) Price risk
The Fund did not have significant price risk exposure toequities, derivatives or commodities, if applicable, as atJune 30, 2015 or December 31, 2014.
iv) Credit risk
The table below summarizes the credit ratings of the bondsand debentures, excluding cash and money market
instruments but including preferred shares and derivatives,as applicable, held by the Fund.
June 30, 2015 December 31, 2014
Percentage oftotal bonds and
debentures(%)
Percentage ofnet assets
(%)
Percentage oftotal bonds and
debentures(%)
Percentage ofnet assets
(%)
Credit ratingsAAA 29.0 28.9 36.4 36.2AA 47.3 47.0 42.5 42.3A 23.7 23.7 21.1 21.0
100.0 99.6 100.0 99.5
v) Liquidity risk
The table below summarizes the Fund’s financial liabilitiesbased on the remaining period to the contractual maturitydate.
June 30, 2015 December 31, 2014
On demand($)
Less than3 months
($)On demand
($)
Less than3 months
($)
Current liabilities – 266,138 – 217,858Liability for written options – – – –Unrealized loss on derivatives – – – –Redeemable units 72,478,696 – 82,653,811 –
72,478,696 266,138 82,653,811 217,858
Redeemable units are redeemable on demand at theholder’s option. However, the Manager does not expect thatthe contractual maturity disclosed in the table above will berepresentative of the actual cash outflows, as holders ofthese instruments typically retain them for a longer term.
vi) Concentration risk
Concentration risk arises as a result of the concentration ofexposures within the same category, geographical location,asset type or industry sector, as applicable. The table belowis a summary of the Fund’s concentration risk:
Percentage of net assets (%)
June 30, 2015 December 31, 2014
Corporate Bonds 41.2 36.5Federal Bonds 28.9 36.2Provincial Bonds 29.5 26.8
vii) Fair value classification (note 2)
The tables below illustrate the classification of the Fund’sfinancial instruments within the fair value hierarchy.
June 30, 2015Level 1
($)Level 2
($)Level 3
($)Total($)
Bonds and debentures – 72,235,845 – 72,235,845
– 72,235,845 – 72,235,845
The accompanying notes are an integral part of the financial statements.
64
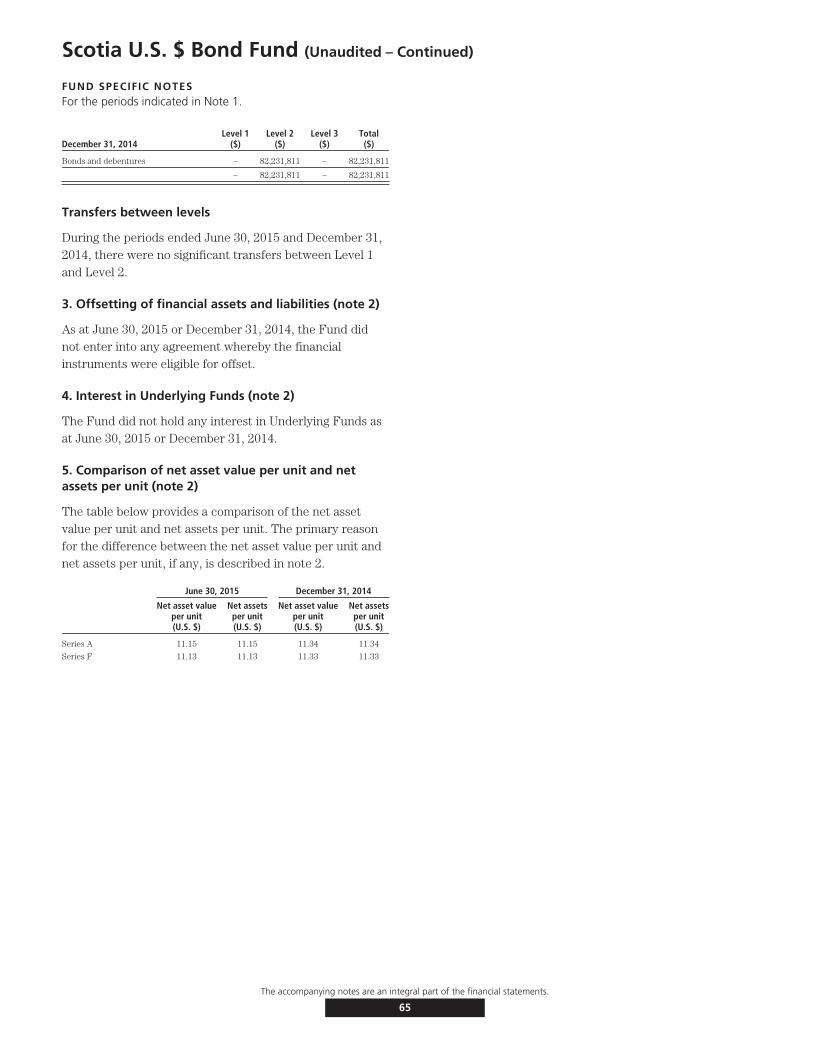
Scotia U.S. $ Bond Fund (Unaudited – Continued)
FUND SPECIFIC NOTESFor the periods indicated in Note 1.
December 31, 2014Level 1
($)Level 2
($)Level 3
($)Total($)
Bonds and debentures – 82,231,811 – 82,231,811
– 82,231,811 – 82,231,811
Transfers between levels
During the periods ended June 30, 2015 and December 31,2014, there were no significant transfers between Level 1and Level 2.
3. Offsetting of financial assets and liabilities (note 2)
As at June 30, 2015 or December 31, 2014, the Fund didnot enter into any agreement whereby the financialinstruments were eligible for offset.
4. Interest in Underlying Funds (note 2)
The Fund did not hold any interest in Underlying Funds asat June 30, 2015 or December 31, 2014.
5. Comparison of net asset value per unit and netassets per unit (note 2)
The table below provides a comparison of the net assetvalue per unit and net assets per unit. The primary reasonfor the difference between the net asset value per unit andnet assets per unit, if any, is described in note 2.
June 30, 2015 December 31, 2014
Net asset valueper unit(U.S. $)
Net assetsper unit(U.S. $)
Net asset valueper unit(U.S. $)
Net assetsper unit(U.S. $)
Series A 11.15 11.15 11.34 11.34
Series F 11.13 11.13 11.33 11.33
The accompanying notes are an integral part of the financial statements.
65
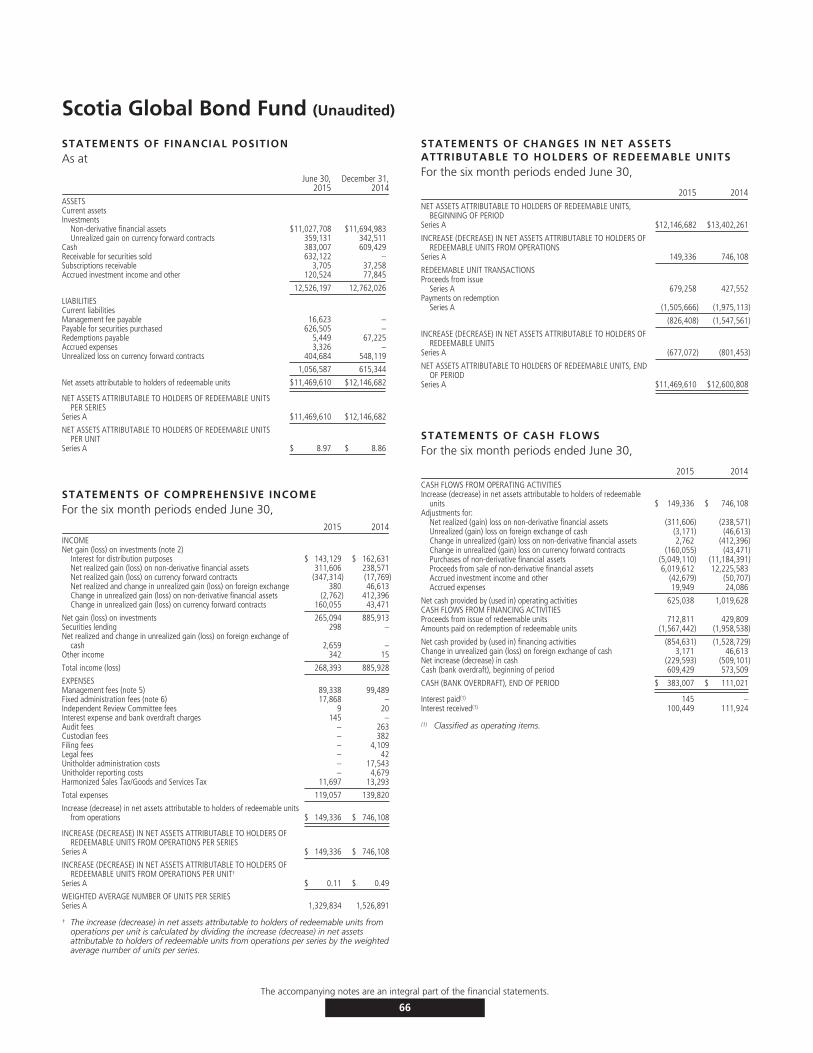
Scotia Global Bond Fund (Unaudited)
STATEMENTS OF FINANCIAL POSITIONAs at
June 30,2015
December 31,2014
ASSETSCurrent assetsInvestments
Non-derivative financial assets $11,027,708 $11,694,983Unrealized gain on currency forward contracts 359,131 342,511
Cash 383,007 609,429Receivable for securities sold 632,122 –Subscriptions receivable 3,705 37,258Accrued investment income and other 120,524 77,845
12,526,197 12,762,026
LIABILITIESCurrent liabilitiesManagement fee payable 16,623 –Payable for securities purchased 626,505 –Redemptions payable 5,449 67,225Accrued expenses 3,326 –Unrealized loss on currency forward contracts 404,684 548,119
1,056,587 615,344
Net assets attributable to holders of redeemable units $11,469,610 $12,146,682
NET ASSETS ATTRIBUTABLE TO HOLDERS OF REDEEMABLE UNITSPER SERIES
Series A $11,469,610 $12,146,682
NET ASSETS ATTRIBUTABLE TO HOLDERS OF REDEEMABLE UNITSPER UNIT
Series A $ 8.97 $ 8.86
STATEMENTS OF COMPREHENSIVE INCOMEFor the six month periods ended June 30,
2015 2014INCOMENet gain (loss) on investments (note 2)
Interest for distribution purposes $ 143,129 $ 162,631Net realized gain (loss) on non-derivative financial assets 311,606 238,571Net realized gain (loss) on currency forward contracts (347,314) (17,769)Net realized and change in unrealized gain (loss) on foreign exchange 380 46,613Change in unrealized gain (loss) on non-derivative financial assets (2,762) 412,396Change in unrealized gain (loss) on currency forward contracts 160,055 43,471
Net gain (loss) on investments 265,094 885,913Securities lending 298 –Net realized and change in unrealized gain (loss) on foreign exchange of
cash 2,659 –Other income 342 15
Total income (loss) 268,393 885,928
EXPENSESManagement fees (note 5) 89,338 99,489Fixed administration fees (note 6) 17,868 –Independent Review Committee fees 9 20Interest expense and bank overdraft charges 145 –Audit fees – 263Custodian fees – 382Filing fees – 4,109Legal fees – 42Unitholder administration costs – 17,543Unitholder reporting costs – 4,679Harmonized Sales Tax/Goods and Services Tax 11,697 13,293
Total expenses 119,057 139,820
Increase (decrease) in net assets attributable to holders of redeemable unitsfrom operations $ 149,336 $ 746,108
INCREASE (DECREASE) IN NET ASSETS ATTRIBUTABLE TO HOLDERS OFREDEEMABLE UNITS FROM OPERATIONS PER SERIES
Series A $ 149,336 $ 746,108
INCREASE (DECREASE) IN NET ASSETS ATTRIBUTABLE TO HOLDERS OFREDEEMABLE UNITS FROM OPERATIONS PER UNIT†
Series A $ 0.11 $ 0.49
WEIGHTED AVERAGE NUMBER OF UNITS PER SERIESSeries A 1,329,834 1,526,891
† The increase (decrease) in net assets attributable to holders of redeemable units fromoperations per unit is calculated by dividing the increase (decrease) in net assetsattributable to holders of redeemable units from operations per series by the weightedaverage number of units per series.
STATEMENTS OF CHANGES IN NET ASSETSATTRIBUTABLE TO HOLDERS OF REDEEMABLE UNITSFor the six month periods ended June 30,
2015 2014NET ASSETS ATTRIBUTABLE TO HOLDERS OF REDEEMABLE UNITS,
BEGINNING OF PERIODSeries A $12,146,682 $13,402,261
INCREASE (DECREASE) IN NET ASSETS ATTRIBUTABLE TO HOLDERS OFREDEEMABLE UNITS FROM OPERATIONS
Series A 149,336 746,108
REDEEMABLE UNIT TRANSACTIONSProceeds from issue
Series A 679,258 427,552Payments on redemption
Series A (1,505,666) (1,975,113)
(826,408) (1,547,561)
INCREASE (DECREASE) IN NET ASSETS ATTRIBUTABLE TO HOLDERS OFREDEEMABLE UNITS
Series A (677,072) (801,453)
NET ASSETS ATTRIBUTABLE TO HOLDERS OF REDEEMABLE UNITS, ENDOF PERIOD
Series A $11,469,610 $12,600,808
STATEMENTS OF CASH FLOWSFor the six month periods ended June 30,
2015 2014CASH FLOWS FROM OPERATING ACTIVITIESIncrease (decrease) in net assets attributable to holders of redeemable
units $ 149,336 $ 746,108Adjustments for:
Net realized (gain) loss on non-derivative financial assets (311,606) (238,571)Unrealized (gain) loss on foreign exchange of cash (3,171) (46,613)Change in unrealized (gain) loss on non-derivative financial assets 2,762 (412,396)Change in unrealized (gain) loss on currency forward contracts (160,055) (43,471)Purchases of non-derivative financial assets (5,049,110) (11,184,391)Proceeds from sale of non-derivative financial assets 6,019,612 12,225,583Accrued investment income and other (42,679) (50,707)Accrued expenses 19,949 24,086
Net cash provided by (used in) operating activities 625,038 1,019,628CASH FLOWS FROM FINANCING ACTIVITIESProceeds from issue of redeemable units 712,811 429,809Amounts paid on redemption of redeemable units (1,567,442) (1,958,538)
Net cash provided by (used in) financing activities (854,631) (1,528,729)Change in unrealized gain (loss) on foreign exchange of cash 3,171 46,613Net increase (decrease) in cash (229,593) (509,101)Cash (bank overdraft), beginning of period 609,429 573,509
CASH (BANK OVERDRAFT), END OF PERIOD $ 383,007 $ 111,021
Interest paid(1) 145 –Interest received(1) 100,449 111,924
(1) Classified as operating items.
The accompanying notes are an integral part of the financial statements.
66
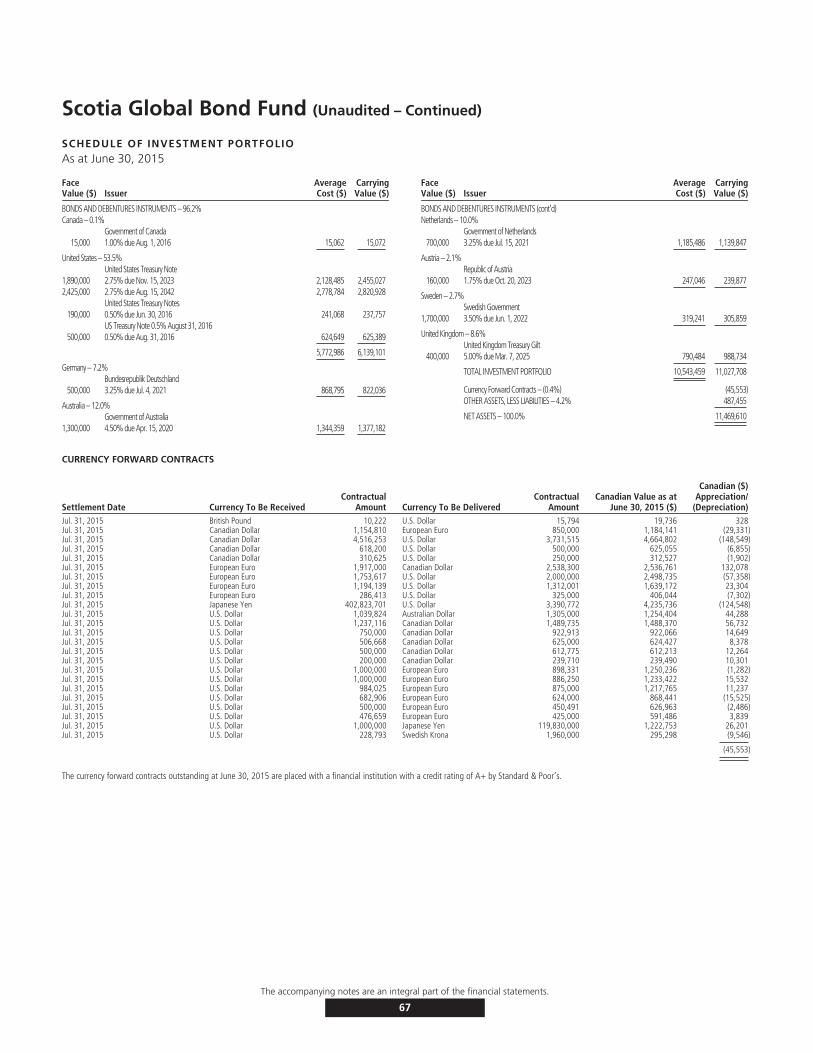
Scotia Global Bond Fund (Unaudited – Continued)
SCHEDULE OF INVESTMENT PORTFOLIOAs at June 30, 2015
FaceValue ($) Issuer
AverageCost ($)
CarryingValue ($)
BONDS AND DEBENTURES INSTRUMENTS – 96.2%Canada – 0.1%
Government of Canada15,000 1.00% due Aug. 1, 2016 15,062 15,072
United States – 53.5%United States Treasury Note
1,890,000 2.75% due Nov. 15, 2023 2,128,485 2,455,0272,425,000 2.75% due Aug. 15, 2042 2,778,784 2,820,928
United States Treasury Notes190,000 0.50% due Jun. 30, 2016 241,068 237,757
US Treasury Note 0.5% August 31, 2016500,000 0.50% due Aug. 31, 2016 624,649 625,389
5,772,986 6,139,101
Germany – 7.2%Bundesrepublik Deutschland
500,000 3.25% due Jul. 4, 2021 868,795 822,036
Australia – 12.0%Government of Australia
1,300,000 4.50% due Apr. 15, 2020 1,344,359 1,377,182
FaceValue ($) Issuer
AverageCost ($)
CarryingValue ($)
BONDS AND DEBENTURES INSTRUMENTS (cont’d)Netherlands – 10.0%
Government of Netherlands700,000 3.25% due Jul. 15, 2021 1,185,486 1,139,847
Austria – 2.1%Republic of Austria
160,000 1.75% due Oct. 20, 2023 247,046 239,877
Sweden – 2.7%Swedish Government
1,700,000 3.50% due Jun. 1, 2022 319,241 305,859
United Kingdom – 8.6%United Kingdom Treasury Gilt
400,000 5.00% due Mar. 7, 2025 790,484 988,734
TOTAL INVESTMENT PORTFOLIO 10,543,459 11,027,708
Currency Forward Contracts – (0.4%) (45,553)OTHER ASSETS, LESS LIABILITIES – 4.2% 487,455
NET ASSETS – 100.0% 11,469,610
CURRENCY FORWARD CONTRACTS
Settlement Date Currency To Be ReceivedContractual
Amount Currency To Be DeliveredContractual
AmountCanadian Value as at
June 30, 2015 ($)
Canadian ($)Appreciation/
(Depreciation)Jul. 31, 2015 British Pound 10,222 U.S. Dollar 15,794 19,736 328Jul. 31, 2015 Canadian Dollar 1,154,810 European Euro 850,000 1,184,141 (29,331)Jul. 31, 2015 Canadian Dollar 4,516,253 U.S. Dollar 3,731,515 4,664,802 (148,549)Jul. 31, 2015 Canadian Dollar 618,200 U.S. Dollar 500,000 625,055 (6,855)Jul. 31, 2015 Canadian Dollar 310,625 U.S. Dollar 250,000 312,527 (1,902)Jul. 31, 2015 European Euro 1,917,000 Canadian Dollar 2,538,300 2,536,761 132,078Jul. 31, 2015 European Euro 1,753,617 U.S. Dollar 2,000,000 2,498,735 (57,358)Jul. 31, 2015 European Euro 1,194,139 U.S. Dollar 1,312,001 1,639,172 23,304Jul. 31, 2015 European Euro 286,413 U.S. Dollar 325,000 406,044 (7,302)Jul. 31, 2015 Japanese Yen 402,823,701 U.S. Dollar 3,390,772 4,235,736 (124,548)Jul. 31, 2015 U.S. Dollar 1,039,824 Australian Dollar 1,305,000 1,254,404 44,288Jul. 31, 2015 U.S. Dollar 1,237,116 Canadian Dollar 1,489,735 1,488,370 56,732Jul. 31, 2015 U.S. Dollar 750,000 Canadian Dollar 922,913 922,066 14,649Jul. 31, 2015 U.S. Dollar 506,668 Canadian Dollar 625,000 624,427 8,378Jul. 31, 2015 U.S. Dollar 500,000 Canadian Dollar 612,775 612,213 12,264Jul. 31, 2015 U.S. Dollar 200,000 Canadian Dollar 239,710 239,490 10,301Jul. 31, 2015 U.S. Dollar 1,000,000 European Euro 898,331 1,250,236 (1,282)Jul. 31, 2015 U.S. Dollar 1,000,000 European Euro 886,250 1,233,422 15,532Jul. 31, 2015 U.S. Dollar 984,025 European Euro 875,000 1,217,765 11,237Jul. 31, 2015 U.S. Dollar 682,906 European Euro 624,000 868,441 (15,525)Jul. 31, 2015 U.S. Dollar 500,000 European Euro 450,491 626,963 (2,486)Jul. 31, 2015 U.S. Dollar 476,659 European Euro 425,000 591,486 3,839Jul. 31, 2015 U.S. Dollar 1,000,000 Japanese Yen 119,830,000 1,222,753 26,201Jul. 31, 2015 U.S. Dollar 228,793 Swedish Krona 1,960,000 295,298 (9,546)
(45,553)
The currency forward contracts outstanding at June 30, 2015 are placed with a financial institution with a credit rating of A+ by Standard & Poor’s.
The accompanying notes are an integral part of the financial statements.
67
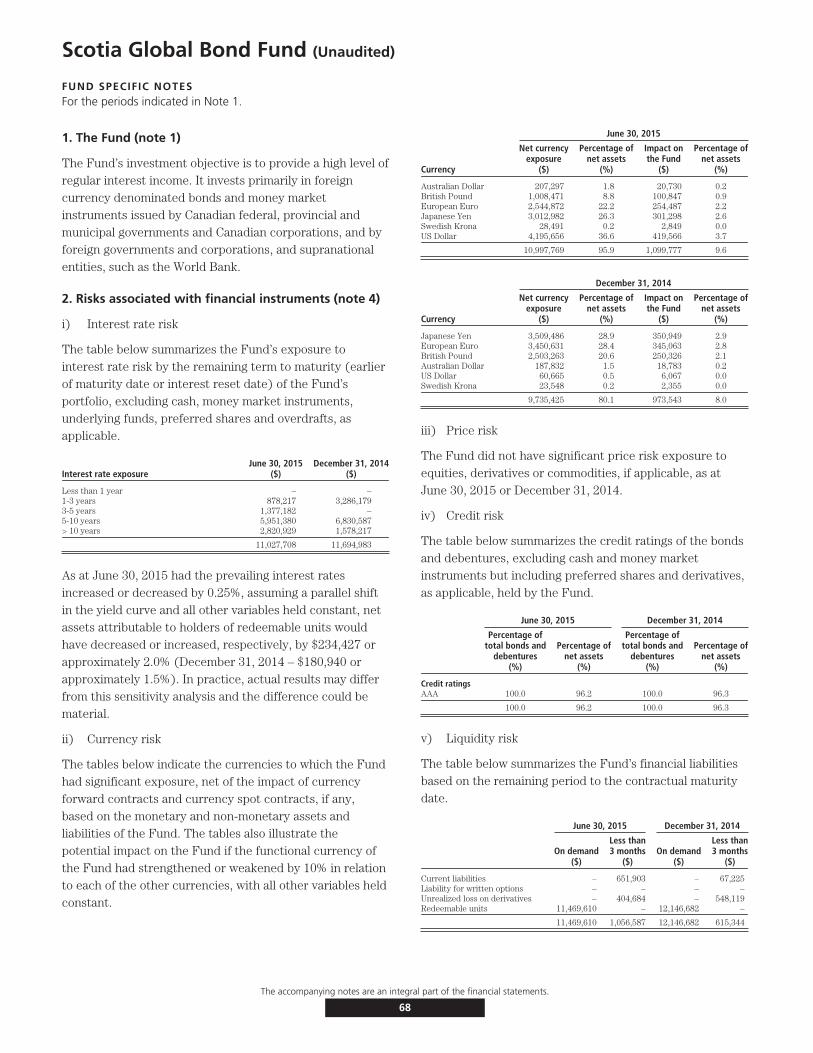
Scotia Global Bond Fund (Unaudited)
FUND SPECIFIC NOTESFor the periods indicated in Note 1.
1. The Fund (note 1)
The Fund’s investment objective is to provide a high level ofregular interest income. It invests primarily in foreigncurrency denominated bonds and money marketinstruments issued by Canadian federal, provincial andmunicipal governments and Canadian corporations, and byforeign governments and corporations, and supranationalentities, such as the World Bank.
2. Risks associated with financial instruments (note 4)
i) Interest rate risk
The table below summarizes the Fund’s exposure tointerest rate risk by the remaining term to maturity (earlierof maturity date or interest reset date) of the Fund’sportfolio, excluding cash, money market instruments,underlying funds, preferred shares and overdrafts, asapplicable.
Interest rate exposureJune 30, 2015
($)December 31, 2014
($)
Less than 1 year – –1-3 years 878,217 3,286,1793-5 years 1,377,182 –5-10 years 5,951,380 6,830,587> 10 years 2,820,929 1,578,217
11,027,708 11,694,983
As at June 30, 2015 had the prevailing interest ratesincreased or decreased by 0.25%, assuming a parallel shiftin the yield curve and all other variables held constant, netassets attributable to holders of redeemable units wouldhave decreased or increased, respectively, by $234,427 orapproximately 2.0% (December 31, 2014 – $180,940 orapproximately 1.5%). In practice, actual results may differfrom this sensitivity analysis and the difference could bematerial.
ii) Currency risk
The tables below indicate the currencies to which the Fundhad significant exposure, net of the impact of currencyforward contracts and currency spot contracts, if any,based on the monetary and non-monetary assets andliabilities of the Fund. The tables also illustrate thepotential impact on the Fund if the functional currency ofthe Fund had strengthened or weakened by 10% in relationto each of the other currencies, with all other variables heldconstant.
June 30, 2015
Currency
Net currencyexposure
($)
Percentage ofnet assets
(%)
Impact onthe Fund
($)
Percentage ofnet assets
(%)
Australian Dollar 207,297 1.8 20,730 0.2British Pound 1,008,471 8.8 100,847 0.9European Euro 2,544,872 22.2 254,487 2.2Japanese Yen 3,012,982 26.3 301,298 2.6Swedish Krona 28,491 0.2 2,849 0.0US Dollar 4,195,656 36.6 419,566 3.7
10,997,769 95.9 1,099,777 9.6
December 31, 2014
Currency
Net currencyexposure
($)
Percentage ofnet assets
(%)
Impact onthe Fund
($)
Percentage ofnet assets
(%)
Japanese Yen 3,509,486 28.9 350,949 2.9European Euro 3,450,631 28.4 345,063 2.8British Pound 2,503,263 20.6 250,326 2.1Australian Dollar 187,832 1.5 18,783 0.2US Dollar 60,665 0.5 6,067 0.0Swedish Krona 23,548 0.2 2,355 0.0
9,735,425 80.1 973,543 8.0
iii) Price risk
The Fund did not have significant price risk exposure toequities, derivatives or commodities, if applicable, as atJune 30, 2015 or December 31, 2014.
iv) Credit risk
The table below summarizes the credit ratings of the bondsand debentures, excluding cash and money marketinstruments but including preferred shares and derivatives,as applicable, held by the Fund.
June 30, 2015 December 31, 2014
Percentage oftotal bonds and
debentures(%)
Percentage ofnet assets
(%)
Percentage oftotal bonds and
debentures(%)
Percentage ofnet assets
(%)
Credit ratingsAAA 100.0 96.2 100.0 96.3
100.0 96.2 100.0 96.3
v) Liquidity risk
The table below summarizes the Fund’s financial liabilitiesbased on the remaining period to the contractual maturitydate.
June 30, 2015 December 31, 2014
On demand($)
Less than3 months
($)On demand
($)
Less than3 months
($)
Current liabilities – 651,903 – 67,225Liability for written options – – – –Unrealized loss on derivatives – 404,684 – 548,119Redeemable units 11,469,610 – 12,146,682 –
11,469,610 1,056,587 12,146,682 615,344
The accompanying notes are an integral part of the financial statements.
68

Scotia Global Bond Fund (Unaudited – Continued)
FUND SPECIFIC NOTESFor the periods indicated in Note 1.
Redeemable units are redeemable on demand at theholder’s option. However, the Manager does not expect thatthe contractual maturity disclosed in the table above will berepresentative of the actual cash outflows, as holders ofthese instruments typically retain them for a longer term.
vi) Concentration risk
Concentration risk arises as a result of the concentration ofexposures within the same category, geographical location,asset type or industry sector, as applicable. The table belowis a summary of the Fund’s concentration risk:
Percentage of net assets (%)
June 30, 2015 December 31, 2014
Australia 12.0 11.3Austria 2.1 2.0Canada 0.1 7.0Germany 7.2 7.0Netherlands 10.0 9.6Sweden 2.7 2.5United Kingdom 8.6 7.8United States 53.5 49.1
vii) Fair value classification (note 2)
The tables below illustrate the classification of the Fund’sfinancial instruments within the fair value hierarchy.
June 30, 2015Level 1
($)Level 2
($)Level 3
($)Total($)
Bonds and debentures – 11,027,708 – 11,027,708Currency forward contracts–assets – 359,131 – 359,131
– 11,386,839 – 11,386,839
Currency forward contracts–liabilities – (404,684) – (404,684)
– 10,982,155 – 10,982,155
December 31, 2014Level 1
($)Level 2
($)Level 3
($)Total($)
Bonds and debentures – 11,694,983 – 11,694,983Currency forward contracts–assets – 342,511 – 342,511
– 12,037,494 – 12,037,494
Currency forward contracts–liabilities – (548,119) – (548,119)
– 11,489,375 – 11,489,375
Transfers between levels
During the periods ended June 30, 2015 and December 31,2014, there were no significant transfers between Level 1and Level 2.
3. Offsetting of financial assets and liabilities (note 2)
The following table presents offsetting of financial assetsand liabilities and collateral amounts that would occur iffuture events, such as bankruptcy or termination ofcontracts were to arise. No amounts were offset in thefinancial statements.
June 30, 2015
Financial assets – by type
Gross amountof assets
($)
Master nettingoffset
($)
Collateralpledged
($)Net Amount
($)
Currency forward contracts 359,131 (227,051) – 132,080Options contracts – OTC – – – –Swap contracts – – – –
359,131 (227,051) – 132,080
Financial liabilities – by type
Gross amountof liabilities
($)
Master nettingoffset
($)
Collateralpledged
($)Net Amount
($)
Currency forward contracts 404,684 (227,051) – 177,633Options contracts – OTC – – – –Swap contracts – – – –
404,684 (227,051) – 177,633
December 31, 2014
Financial assets – by type
Gross amountof assets
($)
Master nettingoffset
($)
Collateralpledged
($)Net Amount
($)
Currency forward contracts 342,511 (317,459) – 25,052Options contracts – OTC – – – –Swap contracts – – – –
342,511 (317,459) – 25,052
Financial liabilities – by type
Gross amountof liabilities
($)
Master nettingoffset
($)
Collateralpledged
($)Net Amount
($)
Currency forward contracts 548,119 (317,459) – 230,660Options contracts – OTC – – – –Swap contracts – – –
548,119 (317,459) – 230,660
4. Interest in Underlying Funds (note 2)
The Fund did not hold any interest in Underlying Funds asat June 30, 2015 or December 31, 2014.
5. Comparison of net asset value per unit and netassets per unit (note 2)
The table below provides a comparison of the net assetvalue per unit and net assets per unit. The primary reasonfor the difference between the net asset value per unit andnet assets per unit, if any, is described in note 2.
June 30, 2015 December 31, 2014
Net asset valueper unit
($)
Net assetsper unit
($)
Net asset valueper unit
($)
Net assetsper unit
($)
Series A 8.97 8.97 8.86 8.86
The accompanying notes are an integral part of the financial statements.
69

Scotia Diversified Monthly Income Fund (Unaudited)
STATEMENTS OF FINANCIAL POSITIONAs at
June 30,2015
December 31,2014
ASSETSCurrent assetsInvestments
Non-derivative financial assets $2,431,006,944 $2,462,514,742Unrealized gain on accumulator contracts – 14,432Unrealized gain on currency forward contracts 12,177 859,740
Cash* 386,309,575 311,861,823Receivable for securities sold 16,544,404 6,969,315Subscriptions receivable 2,922,051 3,053,850Accrued investment income and other 3,562,981 4,530,899
2,840,358,132 2,789,804,801
LIABILITIESCurrent liabilitiesLiability for written options 4,349,004 1,911,413Management fee payable 3,449,914 –Payable for securities purchased – 107,450Redemptions payable 3,137,099 1,949,280Accrued expenses 167,029 –Distributions payable 848,595 632,024Unrealized loss on currency forward contracts – 1,618,778
11,951,641 6,218,945
Net assets attributable to holders of redeemable units $2,828,406,491 $2,783,585,856
NET ASSETS ATTRIBUTABLE TO HOLDERS OF REDEEMABLE UNITSPER SERIES
Series A $2,822,906,340 $2,777,525,341Advisor Series $ 3,944,589 $ 5,032,840Series D $ 2,243 $ –Series F $ 1,553,319 $ 1,027,675
NET ASSETS ATTRIBUTABLE TO HOLDERS OF REDEEMABLE UNITSPER UNIT
Series A $ 11.10 $ 11.02Advisor Series $ 10.73 $ 10.68Series D $ 9.67 $ –Series F $ 11.69 $ 11.56
* $59,109,522 held by brokers as collateral for options (December 31, 2014 –$40,614,085).
STATEMENTS OF COMPREHENSIVE INCOMEFor the six month periods ended June 30,
2015 2014INCOMENet gain (loss) on investments (note 2)
Dividends $ 20,691,424 $ 24,497,698Interest for distribution purposes 20,590,723 21,588,816Capital gains distributions received 17,400 437,926Net realized gain (loss) on non-derivative financial assets 76,650,122 61,340,486Net realized gain (loss) on currency forward contracts (7,623,866) (4,513,762)Net realized gain (loss) on futures contracts (564,680) 589,320Net realized gain (loss) on option contracts 6,177,873 –Net realized gain (loss) on swap contracts – (1,880,792)Net realized and change in unrealized gain (loss) on foreign
exchange (512,913) (2,170,244)Change in unrealized gain (loss) on non-derivative financial assets (33,070,618) 77,841,162Change in unrealized gain (loss) on accumulator contracts (14,432) –Change in unrealized gain (loss) on currency forward contracts 771,215 4,706,746Change in unrealized gain (loss) on option contracts (305,528) –Change in unrealized gain (loss) on swap contracts – 2,988
Net gain (loss) on investments 82,806,720 182,440,344Securities lending 4,142 67,724Net realized and change in unrealized gain (loss) on foreign exchange
of cash 5,703,283 –Other income 22,434 31,378
Total income (loss) 88,536,579 182,539,446
EXPENSESManagement fees (note 5) 17,752,866 16,823,577Fixed administration fees and operating expenses (note 6) 859,591 –Independent Review Committee fees 2,100 4,007Interest expense and bank overdraft charges 31 5Foreign withholding taxes/tax reclaims 1,073,245 1,055,299Audit fees – 28,953Custodian fees – 16,927Filing fees – 57,031Legal fees – 8,546Unitholder administration costs – 532,767Unitholder reporting costs – 74,490Harmonized Sales Tax/Goods and Services Tax 2,063,852 1,929,222Transaction costs 1,114,368 778,913
Total expenses 22,866,053 21,309,737Expenses absorbed by the Manager (1,493) (2,956)
Net expenses 22,864,560 21,306,781
Increase (decrease) in net assets attributable to holders of redeemableunits from operations $ 65,672,019 $161,232,665
INCREASE (DECREASE) IN NET ASSETS ATTRIBUTABLE TO HOLDERSOF REDEEMABLE UNITS FROM OPERATIONS PER SERIES
Series A $ 65,535,130 $160,763,664Advisor Series $ 111,403 $ 412,176Series D $ (34) $ –Series F $ 25,520 $ 56,825
INCREASE (DECREASE) IN NET ASSETS ATTRIBUTABLE TO HOLDERSOF REDEEMABLE UNITS FROM OPERATIONS PER UNIT†
Series A $ 0.26 $ 0.64Advisor Series $ 0.27 $ 0.60Series D $ (0.21) $ –Series F $ 0.21 $ 0.71
WEIGHTED AVERAGE NUMBER OF UNITS PER SERIESSeries A 253,440,378 250,446,242Advisor Series 417,106 681,880Series D 163 –Series F 121,082 80,018
† The increase (decrease) in net assets attributable to holders of redeemable units fromoperations per unit is calculated by dividing the increase (decrease) in net assetsattributable to holders of redeemable units from operations per series by the weightedaverage number of units per series.
The accompanying notes are an integral part of the financial statements.
70
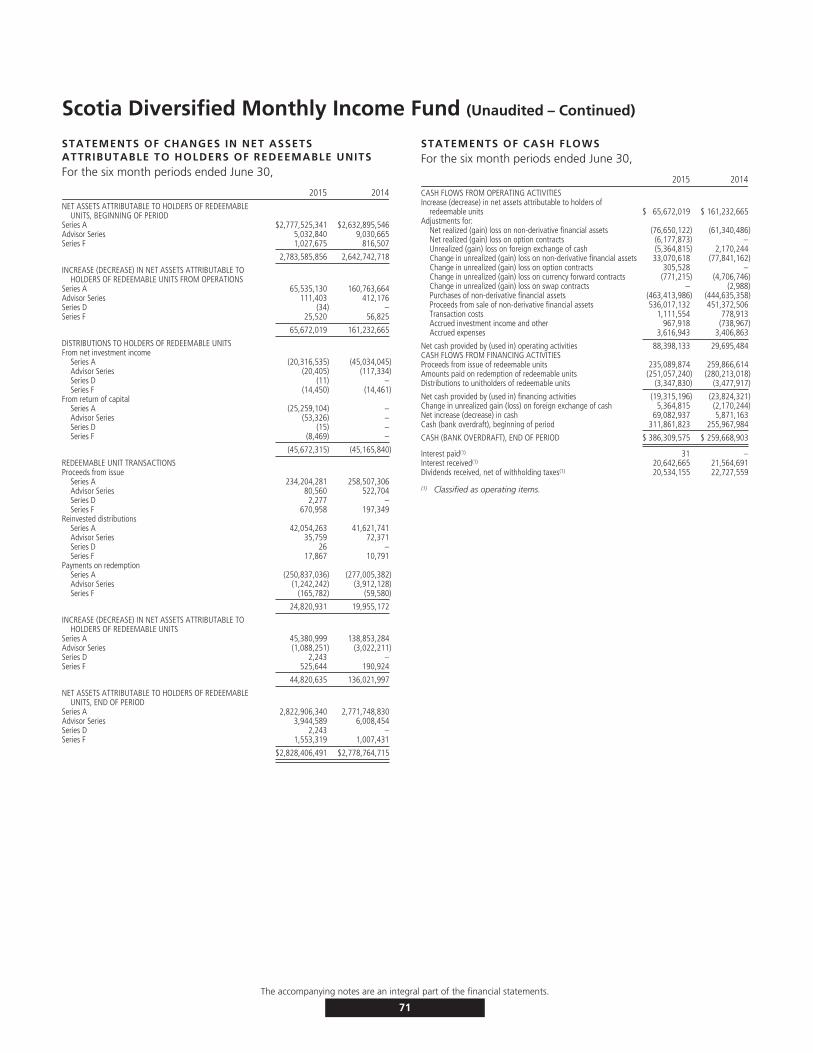
Scotia Diversified Monthly Income Fund (Unaudited – Continued)
STATEMENTS OF CHANGES IN NET ASSETSATTRIBUTABLE TO HOLDERS OF REDEEMABLE UNITSFor the six month periods ended June 30,
2015 2014NET ASSETS ATTRIBUTABLE TO HOLDERS OF REDEEMABLE
UNITS, BEGINNING OF PERIODSeries A $2,777,525,341 $2,632,895,546Advisor Series 5,032,840 9,030,665Series F 1,027,675 816,507
2,783,585,856 2,642,742,718
INCREASE (DECREASE) IN NET ASSETS ATTRIBUTABLE TOHOLDERS OF REDEEMABLE UNITS FROM OPERATIONS
Series A 65,535,130 160,763,664Advisor Series 111,403 412,176Series D (34) –Series F 25,520 56,825
65,672,019 161,232,665
DISTRIBUTIONS TO HOLDERS OF REDEEMABLE UNITSFrom net investment income
Series A (20,316,535) (45,034,045)Advisor Series (20,405) (117,334)Series D (11) –Series F (14,450) (14,461)
From return of capitalSeries A (25,259,104) –Advisor Series (53,326) –Series D (15) –Series F (8,469) –
(45,672,315) (45,165,840)
REDEEMABLE UNIT TRANSACTIONSProceeds from issue
Series A 234,204,281 258,507,306Advisor Series 80,560 522,704Series D 2,277 –Series F 670,958 197,349
Reinvested distributionsSeries A 42,054,263 41,621,741Advisor Series 35,759 72,371Series D 26 –Series F 17,867 10,791
Payments on redemptionSeries A (250,837,036) (277,005,382)Advisor Series (1,242,242) (3,912,128)Series F (165,782) (59,580)
24,820,931 19,955,172
INCREASE (DECREASE) IN NET ASSETS ATTRIBUTABLE TOHOLDERS OF REDEEMABLE UNITS
Series A 45,380,999 138,853,284Advisor Series (1,088,251) (3,022,211)Series D 2,243 –Series F 525,644 190,924
44,820,635 136,021,997
NET ASSETS ATTRIBUTABLE TO HOLDERS OF REDEEMABLEUNITS, END OF PERIOD
Series A 2,822,906,340 2,771,748,830Advisor Series 3,944,589 6,008,454Series D 2,243 –Series F 1,553,319 1,007,431
$2,828,406,491 $2,778,764,715
STATEMENTS OF CASH FLOWSFor the six month periods ended June 30,
2015 2014CASH FLOWS FROM OPERATING ACTIVITIESIncrease (decrease) in net assets attributable to holders of
redeemable units $ 65,672,019 $ 161,232,665Adjustments for:
Net realized (gain) loss on non-derivative financial assets (76,650,122) (61,340,486)Net realized (gain) loss on option contracts (6,177,873) –Unrealized (gain) loss on foreign exchange of cash (5,364,815) 2,170,244Change in unrealized (gain) loss on non-derivative financial assets 33,070,618 (77,841,162)Change in unrealized (gain) loss on option contracts 305,528 –Change in unrealized (gain) loss on currency forward contracts (771,215) (4,706,746)Change in unrealized (gain) loss on swap contracts – (2,988)Purchases of non-derivative financial assets (463,413,986) (444,635,358)Proceeds from sale of non-derivative financial assets 536,017,132 451,372,506Transaction costs 1,111,554 778,913Accrued investment income and other 967,918 (738,967)Accrued expenses 3,616,943 3,406,863
Net cash provided by (used in) operating activities 88,398,133 29,695,484CASH FLOWS FROM FINANCING ACTIVITIESProceeds from issue of redeemable units 235,089,874 259,866,614Amounts paid on redemption of redeemable units (251,057,240) (280,213,018)Distributions to unitholders of redeemable units (3,347,830) (3,477,917)
Net cash provided by (used in) financing activities (19,315,196) (23,824,321)Change in unrealized gain (loss) on foreign exchange of cash 5,364,815 (2,170,244)Net increase (decrease) in cash 69,082,937 5,871,163Cash (bank overdraft), beginning of period 311,861,823 255,967,984
CASH (BANK OVERDRAFT), END OF PERIOD $ 386,309,575 $ 259,668,903
Interest paid(1) 31 –Interest received(1) 20,642,665 21,564,691Dividends received, net of withholding taxes(1) 20,534,155 22,727,559
(1) Classified as operating items.
The accompanying notes are an integral part of the financial statements.
71
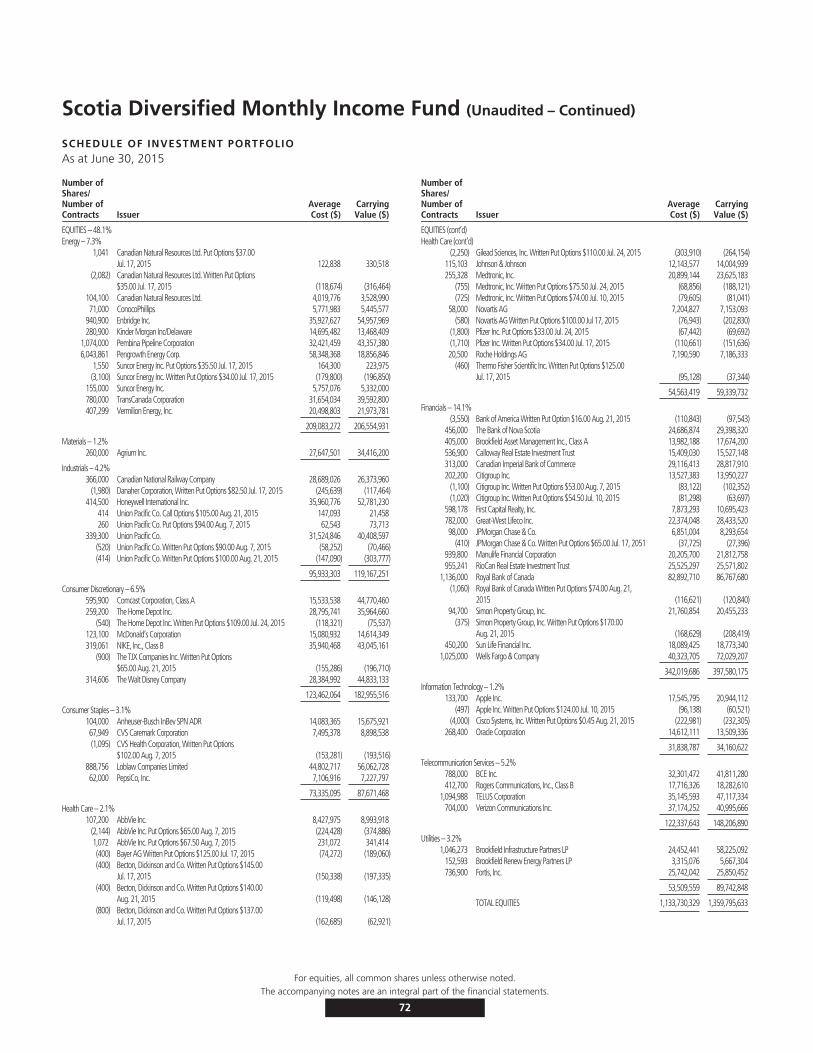
Scotia Diversified Monthly Income Fund (Unaudited – Continued)
SCHEDULE OF INVESTMENT PORTFOLIOAs at June 30, 2015
Number ofShares/Number ofContracts Issuer
AverageCost ($)
CarryingValue ($)
EQUITIES – 48.1%Energy – 7.3%
1,041 Canadian Natural Resources Ltd. Put Options $37.00Jul. 17, 2015 122,838 330,518
(2,082) Canadian Natural Resources Ltd. Written Put Options$35.00 Jul. 17, 2015 (118,674) (316,464)
104,100 Canadian Natural Resources Ltd. 4,019,776 3,528,99071,000 ConocoPhillips 5,771,983 5,445,577
940,900 Enbridge Inc. 35,927,627 54,957,969280,900 Kinder Morgan Inc/Delaware 14,695,482 13,468,409
1,074,000 Pembina Pipeline Corporation 32,421,459 43,357,3806,043,861 Pengrowth Energy Corp. 58,348,368 18,856,846
1,550 Suncor Energy Inc. Put Options $35.50 Jul. 17, 2015 164,300 223,975(3,100) Suncor Energy Inc. Written Put Options $34.00 Jul. 17, 2015 (179,800) (196,850)
155,000 Suncor Energy Inc. 5,757,076 5,332,000780,000 TransCanada Corporation 31,654,034 39,592,800407,299 Vermilion Energy, Inc. 20,498,803 21,973,781
209,083,272 206,554,931
Materials – 1.2%260,000 Agrium Inc. 27,647,501 34,416,200
Industrials – 4.2%366,000 Canadian National Railway Company 28,689,026 26,373,960
(1,980) Danaher Corporation, Written Put Options $82.50 Jul. 17, 2015 (245,639) (117,464)414,500 Honeywell International Inc. 35,960,776 52,781,230
414 Union Pacific Co. Call Options $105.00 Aug. 21, 2015 147,093 21,458260 Union Pacific Co. Put Options $94.00 Aug. 7, 2015 62,543 73,713
339,300 Union Pacific Co. 31,524,846 40,408,597(520) Union Pacific Co. Written Put Options $90.00 Aug. 7, 2015 (58,252) (70,466)(414) Union Pacific Co. Written Put Options $100.00 Aug. 21, 2015 (147,090) (303,777)
95,933,303 119,167,251
Consumer Discretionary – 6.5%595,900 Comcast Corporation, Class A 15,533,538 44,770,460259,200 The Home Depot Inc. 28,795,741 35,964,660
(540) The Home Depot Inc. Written Put Options $109.00 Jul. 24, 2015 (118,321) (75,537)123,100 McDonald’s Corporation 15,080,932 14,614,349319,061 NIKE, Inc., Class B 35,940,468 43,045,161
(900) The TJX Companies Inc. Written Put Options$65.00 Aug. 21, 2015 (155,286) (196,710)
314,606 The Walt Disney Company 28,384,992 44,833,133
123,462,064 182,955,516
Consumer Staples – 3.1%104,000 Anheuser-Busch InBev SPN ADR 14,083,365 15,675,92167,949 CVS Caremark Corporation 7,495,378 8,898,538(1,095) CVS Health Corporation, Written Put Options
$102.00 Aug. 7, 2015 (153,281) (193,516)888,756 Loblaw Companies Limited 44,802,717 56,062,72862,000 PepsiCo, Inc. 7,106,916 7,227,797
73,335,095 87,671,468
Health Care – 2.1%107,200 AbbVie Inc. 8,427,975 8,993,918
(2,144) AbbVie Inc. Put Options $65.00 Aug. 7, 2015 (224,428) (374,886)1,072 AbbVie Inc. Put Options $67.50 Aug. 7, 2015 231,072 341,414(400) Bayer AG Written Put Options $125.00 Jul. 17, 2015 (74,272) (189,060)(400) Becton, Dickinson and Co. Written Put Options $145.00
Jul. 17, 2015 (150,338) (197,335)(400) Becton, Dickinson and Co. Written Put Options $140.00
Aug. 21, 2015 (119,498) (146,128)(800) Becton, Dickinson and Co. Written Put Options $137.00
Jul. 17, 2015 (162,685) (62,921)
Number ofShares/Number ofContracts Issuer
AverageCost ($)
CarryingValue ($)
EQUITIES (cont’d)Health Care (cont’d)
(2,250) Gilead Sciences, Inc. Written Put Options $110.00 Jul. 24, 2015 (303,910) (264,154)115,103 Johnson & Johnson 12,143,577 14,004,939255,328 Medtronic, Inc. 20,899,144 23,625,183
(755) Medtronic, Inc. Written Put Options $75.50 Jul. 24, 2015 (68,856) (188,121)(725) Medtronic, Inc. Written Put Options $74.00 Jul. 10, 2015 (79,605) (81,041)
58,000 Novartis AG 7,204,827 7,153,093(580) Novartis AG Written Put Options $100.00 Jul 17, 2015 (76,943) (202,830)
(1,800) Pfizer Inc. Put Options $33.00 Jul. 24, 2015 (67,442) (69,692)(1,710) Pfizer Inc. Written Put Options $34.00 Jul. 17, 2015 (110,661) (151,636)20,500 Roche Holdings AG 7,190,590 7,186,333
(460) Thermo Fisher Scientific Inc. Written Put Options $125.00Jul. 17, 2015 (95,128) (37,344)
54,563,419 59,339,732
Financials – 14.1%(3,550) Bank of America Written Put Option $16.00 Aug. 21, 2015 (110,843) (97,543)
456,000 The Bank of Nova Scotia 24,686,874 29,398,320405,000 Brookfield Asset Management Inc., Class A 13,982,188 17,674,200536,900 Calloway Real Estate Investment Trust 15,409,030 15,527,148313,000 Canadian Imperial Bank of Commerce 29,116,413 28,817,910202,200 Citigroup Inc. 13,527,383 13,950,227
(1,100) Citigroup Inc. Written Put Options $53.00 Aug. 7, 2015 (83,122) (102,352)(1,020) Citigroup Inc. Written Put Options $54.50 Jul. 10, 2015 (81,298) (63,697)
598,178 First Capital Realty, Inc. 7,873,293 10,695,423782,000 Great-West Lifeco Inc. 22,374,048 28,433,52098,000 JPMorgan Chase & Co. 6,851,004 8,293,654
(410) JPMorgan Chase & Co. Written Put Options $65.00 Jul. 17, 2051 (37,725) (27,396)939,800 Manulife Financial Corporation 20,205,700 21,812,758955,241 RioCan Real Estate Investment Trust 25,525,297 25,571,802
1,136,000 Royal Bank of Canada 82,892,710 86,767,680(1,060) Royal Bank of Canada Written Put Options $74.00 Aug. 21,
2015 (116,621) (120,840)94,700 Simon Property Group, Inc. 21,760,854 20,455,233
(375) Simon Property Group, Inc. Written Put Options $170.00Aug. 21, 2015 (168,629) (208,419)
450,200 Sun Life Financial Inc. 18,089,425 18,773,3401,025,000 Wells Fargo & Company 40,323,705 72,029,207
342,019,686 397,580,175
Information Technology – 1.2%133,700 Apple Inc. 17,545,795 20,944,112
(497) Apple Inc. Written Put Options $124.00 Jul. 10, 2015 (96,138) (60,521)(4,000) Cisco Systems, Inc. Written Put Options $0.45 Aug. 21, 2015 (222,981) (232,305)
268,400 Oracle Corporation 14,612,111 13,509,336
31,838,787 34,160,622
Telecommunication Services – 5.2%788,000 BCE Inc. 32,301,472 41,811,280412,700 Rogers Communications, Inc., Class B 17,716,326 18,282,610
1,094,988 TELUS Corporation 35,145,593 47,117,334704,000 Verizon Communications Inc. 37,174,252 40,995,666
122,337,643 148,206,890
Utilities – 3.2%1,046,273 Brookfield Infrastructure Partners LP 24,452,441 58,225,092
152,593 Brookfield Renew Energy Partners LP 3,315,076 5,667,304736,900 Fortis, Inc. 25,742,042 25,850,452
53,509,559 89,742,848
TOTAL EQUITIES 1,133,730,329 1,359,795,633
For equities, all common shares unless otherwise noted.The accompanying notes are an integral part of the financial statements.
72
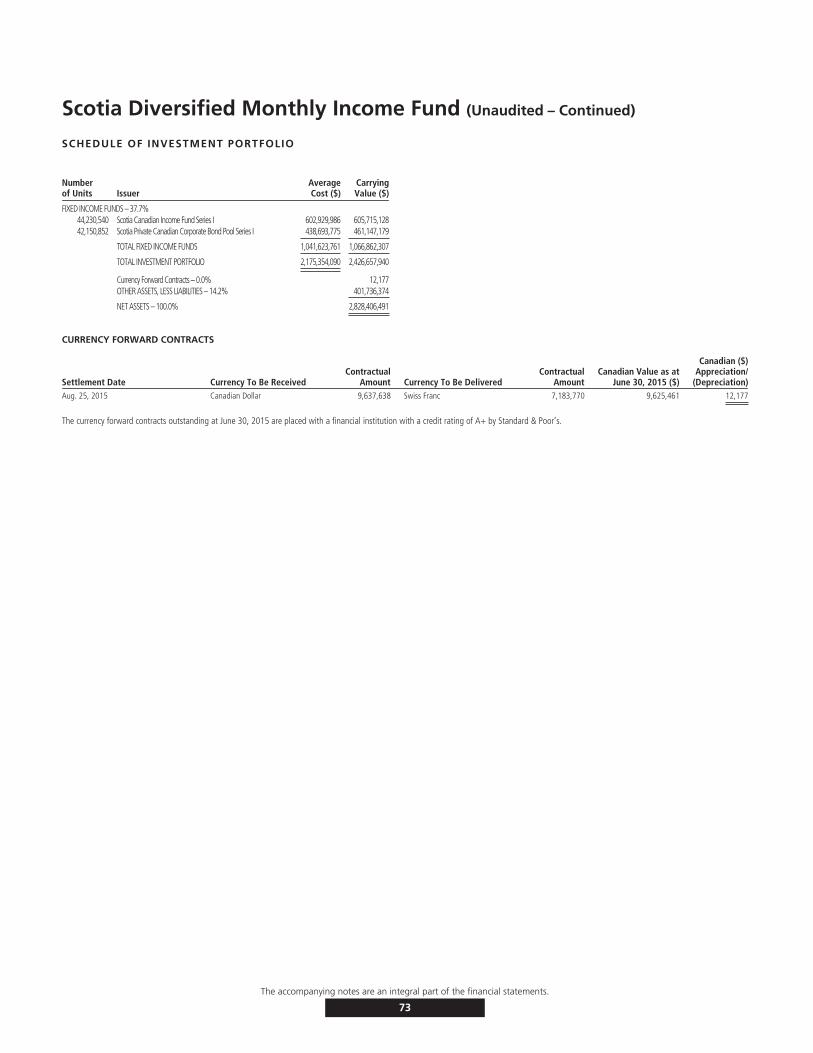
Scotia Diversified Monthly Income Fund (Unaudited – Continued)
SCHEDULE OF INVESTMENT PORTFOLIO
Numberof Units Issuer
AverageCost ($)
CarryingValue ($)
FIXED INCOME FUNDS – 37.7%44,230,540 Scotia Canadian Income Fund Series I 602,929,986 605,715,12842,150,852 Scotia Private Canadian Corporate Bond Pool Series I 438,693,775 461,147,179
TOTAL FIXED INCOME FUNDS 1,041,623,761 1,066,862,307
TOTAL INVESTMENT PORTFOLIO 2,175,354,090 2,426,657,940
Currency Forward Contracts – 0.0% 12,177OTHER ASSETS, LESS LIABILITIES – 14.2% 401,736,374
NET ASSETS – 100.0% 2,828,406,491
CURRENCY FORWARD CONTRACTS
Settlement Date Currency To Be ReceivedContractual
Amount Currency To Be DeliveredContractual
AmountCanadian Value as at
June 30, 2015 ($)
Canadian ($)Appreciation/
(Depreciation)Aug. 25, 2015 Canadian Dollar 9,637,638 Swiss Franc 7,183,770 9,625,461 12,177
The currency forward contracts outstanding at June 30, 2015 are placed with a financial institution with a credit rating of A+ by Standard & Poor’s.
The accompanying notes are an integral part of the financial statements.
73
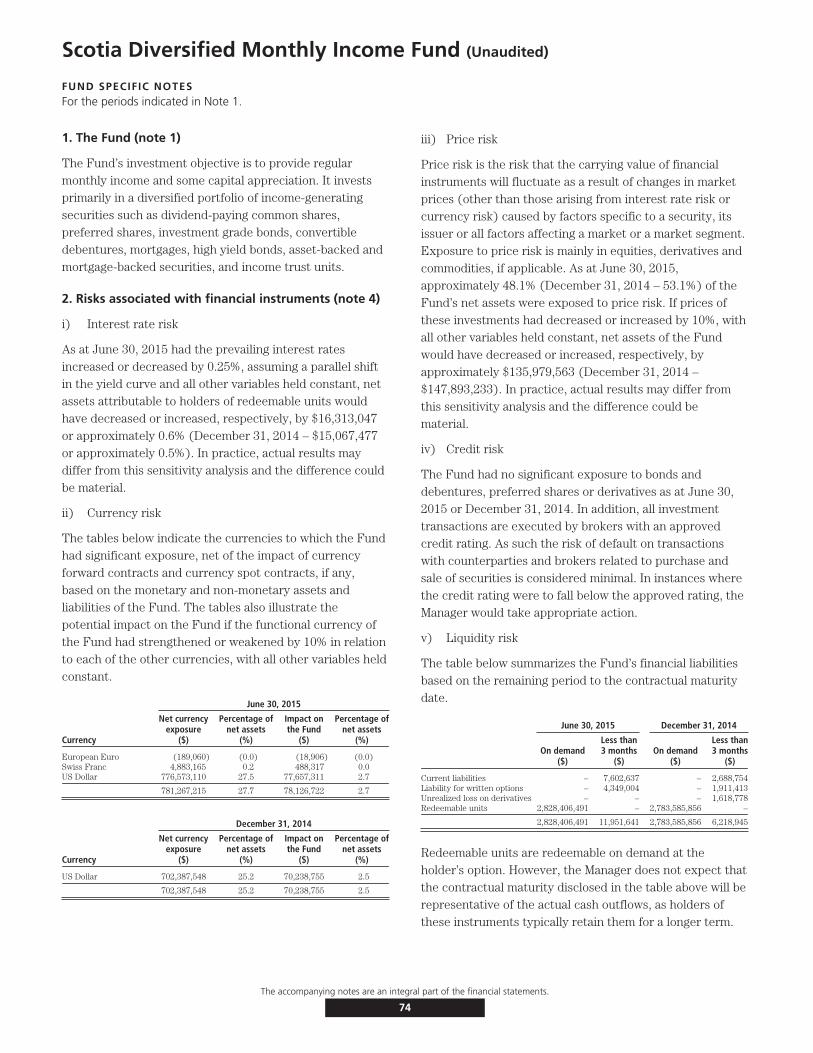
Scotia Diversified Monthly Income Fund (Unaudited)
FUND SPECIFIC NOTESFor the periods indicated in Note 1.
1. The Fund (note 1)
The Fund’s investment objective is to provide regularmonthly income and some capital appreciation. It investsprimarily in a diversified portfolio of income-generatingsecurities such as dividend-paying common shares,preferred shares, investment grade bonds, convertibledebentures, mortgages, high yield bonds, asset-backed andmortgage-backed securities, and income trust units.
2. Risks associated with financial instruments (note 4)
i) Interest rate risk
As at June 30, 2015 had the prevailing interest ratesincreased or decreased by 0.25%, assuming a parallel shiftin the yield curve and all other variables held constant, netassets attributable to holders of redeemable units wouldhave decreased or increased, respectively, by $16,313,047or approximately 0.6% (December 31, 2014 – $15,067,477or approximately 0.5%). In practice, actual results maydiffer from this sensitivity analysis and the difference couldbe material.
ii) Currency risk
The tables below indicate the currencies to which the Fundhad significant exposure, net of the impact of currencyforward contracts and currency spot contracts, if any,based on the monetary and non-monetary assets andliabilities of the Fund. The tables also illustrate thepotential impact on the Fund if the functional currency ofthe Fund had strengthened or weakened by 10% in relationto each of the other currencies, with all other variables heldconstant.
June 30, 2015
Currency
Net currencyexposure
($)
Percentage ofnet assets
(%)
Impact onthe Fund
($)
Percentage ofnet assets
(%)
European Euro (189,060) (0.0) (18,906) (0.0)Swiss Franc 4,883,165 0.2 488,317 0.0US Dollar 776,573,110 27.5 77,657,311 2.7
781,267,215 27.7 78,126,722 2.7
December 31, 2014
Currency
Net currencyexposure
($)
Percentage ofnet assets
(%)
Impact onthe Fund
($)
Percentage ofnet assets
(%)
US Dollar 702,387,548 25.2 70,238,755 2.5
702,387,548 25.2 70,238,755 2.5
iii) Price risk
Price risk is the risk that the carrying value of financialinstruments will fluctuate as a result of changes in marketprices (other than those arising from interest rate risk orcurrency risk) caused by factors specific to a security, itsissuer or all factors affecting a market or a market segment.Exposure to price risk is mainly in equities, derivatives andcommodities, if applicable. As at June 30, 2015,approximately 48.1% (December 31, 2014 – 53.1%) of theFund’s net assets were exposed to price risk. If prices ofthese investments had decreased or increased by 10%, withall other variables held constant, net assets of the Fundwould have decreased or increased, respectively, byapproximately $135,979,563 (December 31, 2014 –$147,893,233). In practice, actual results may differ fromthis sensitivity analysis and the difference could bematerial.
iv) Credit risk
The Fund had no significant exposure to bonds anddebentures, preferred shares or derivatives as at June 30,2015 or December 31, 2014. In addition, all investmenttransactions are executed by brokers with an approvedcredit rating. As such the risk of default on transactionswith counterparties and brokers related to purchase andsale of securities is considered minimal. In instances wherethe credit rating were to fall below the approved rating, theManager would take appropriate action.
v) Liquidity risk
The table below summarizes the Fund’s financial liabilitiesbased on the remaining period to the contractual maturitydate.
June 30, 2015 December 31, 2014
On demand($)
Less than3 months
($)On demand
($)
Less than3 months
($)
Current liabilities – 7,602,637 – 2,688,754Liability for written options – 4,349,004 – 1,911,413Unrealized loss on derivatives – – – 1,618,778Redeemable units 2,828,406,491 – 2,783,585,856 –
2,828,406,491 11,951,641 2,783,585,856 6,218,945
Redeemable units are redeemable on demand at theholder’s option. However, the Manager does not expect thatthe contractual maturity disclosed in the table above will berepresentative of the actual cash outflows, as holders ofthese instruments typically retain them for a longer term.
The accompanying notes are an integral part of the financial statements.
74
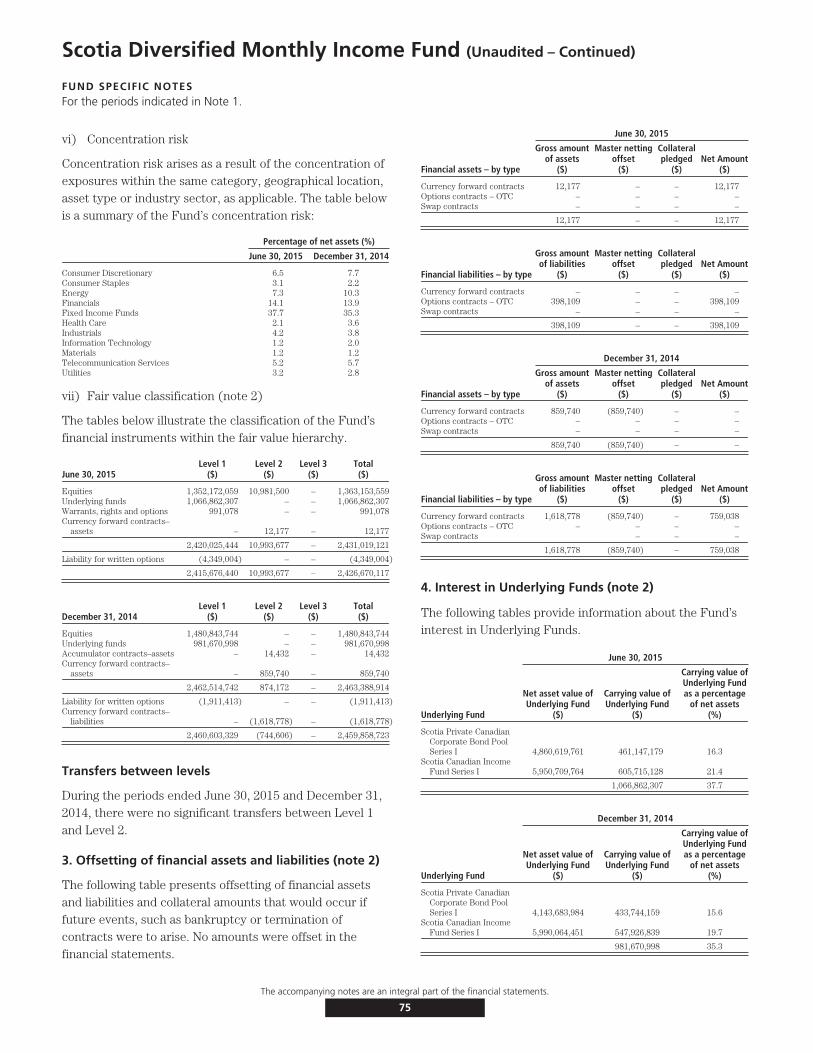
Scotia Diversified Monthly Income Fund (Unaudited – Continued)
FUND SPECIFIC NOTESFor the periods indicated in Note 1.
vi) Concentration risk
Concentration risk arises as a result of the concentration ofexposures within the same category, geographical location,asset type or industry sector, as applicable. The table belowis a summary of the Fund’s concentration risk:
Percentage of net assets (%)
June 30, 2015 December 31, 2014
Consumer Discretionary 6.5 7.7Consumer Staples 3.1 2.2Energy 7.3 10.3Financials 14.1 13.9Fixed Income Funds 37.7 35.3Health Care 2.1 3.6Industrials 4.2 3.8Information Technology 1.2 2.0Materials 1.2 1.2Telecommunication Services 5.2 5.7Utilities 3.2 2.8
vii) Fair value classification (note 2)
The tables below illustrate the classification of the Fund’sfinancial instruments within the fair value hierarchy.
June 30, 2015Level 1
($)Level 2
($)Level 3
($)Total($)
Equities 1,352,172,059 10,981,500 – 1,363,153,559Underlying funds 1,066,862,307 – – 1,066,862,307Warrants, rights and options 991,078 – – 991,078Currency forward contracts–
assets – 12,177 – 12,177
2,420,025,444 10,993,677 – 2,431,019,121
Liability for written options (4,349,004) – – (4,349,004)
2,415,676,440 10,993,677 – 2,426,670,117
December 31, 2014Level 1
($)Level 2
($)Level 3
($)Total($)
Equities 1,480,843,744 – – 1,480,843,744Underlying funds 981,670,998 – – 981,670,998Accumulator contracts–assets – 14,432 – 14,432Currency forward contracts–
assets – 859,740 – 859,740
2,462,514,742 874,172 – 2,463,388,914
Liability for written options (1,911,413) – – (1,911,413)Currency forward contracts–
liabilities – (1,618,778) – (1,618,778)
2,460,603,329 (744,606) – 2,459,858,723
Transfers between levels
During the periods ended June 30, 2015 and December 31,2014, there were no significant transfers between Level 1and Level 2.
3. Offsetting of financial assets and liabilities (note 2)
The following table presents offsetting of financial assetsand liabilities and collateral amounts that would occur iffuture events, such as bankruptcy or termination ofcontracts were to arise. No amounts were offset in thefinancial statements.
June 30, 2015
Financial assets – by type
Gross amountof assets
($)
Master nettingoffset
($)
Collateralpledged
($)Net Amount
($)
Currency forward contracts 12,177 – – 12,177Options contracts – OTC – – – –Swap contracts – – – –
12,177 – – 12,177
Financial liabilities – by type
Gross amountof liabilities
($)
Master nettingoffset
($)
Collateralpledged
($)Net Amount
($)
Currency forward contracts – – – –Options contracts – OTC 398,109 – – 398,109Swap contracts – – – –
398,109 – – 398,109
December 31, 2014
Financial assets – by type
Gross amountof assets
($)
Master nettingoffset
($)
Collateralpledged
($)Net Amount
($)
Currency forward contracts 859,740 (859,740) – –Options contracts – OTC – – – –Swap contracts – – – –
859,740 (859,740) – –
Financial liabilities – by type
Gross amountof liabilities
($)
Master nettingoffset
($)
Collateralpledged
($)Net Amount
($)
Currency forward contracts 1,618,778 (859,740) – 759,038Options contracts – OTC – – – –Swap contracts – – –
1,618,778 (859,740) – 759,038
4. Interest in Underlying Funds (note 2)
The following tables provide information about the Fund’sinterest in Underlying Funds.
June 30, 2015
Underlying Fund
Net asset value ofUnderlying Fund
($)
Carrying value ofUnderlying Fund
($)
Carrying value ofUnderlying Fundas a percentage
of net assets(%)
Scotia Private CanadianCorporate Bond PoolSeries I 4,860,619,761 461,147,179 16.3
Scotia Canadian IncomeFund Series I 5,950,709,764 605,715,128 21.4
1,066,862,307 37.7
December 31, 2014
Underlying Fund
Net asset value ofUnderlying Fund
($)
Carrying value ofUnderlying Fund
($)
Carrying value ofUnderlying Fundas a percentage
of net assets(%)
Scotia Private CanadianCorporate Bond PoolSeries I 4,143,683,984 433,744,159 15.6
Scotia Canadian IncomeFund Series I 5,990,064,451 547,926,839 19.7
981,670,998 35.3
The accompanying notes are an integral part of the financial statements.
75

Scotia Diversified Monthly Income Fund (Unaudited – Continued)
FUND SPECIFIC NOTESFor the periods indicated in Note 1.
5. Comparison of net asset value per unit and netassets per unit (note 2)
The table below provides a comparison of the net assetvalue per unit and net assets per unit. The primary reasonfor the difference between the net asset value per unit andnet assets per unit, if any, is described in note 2.
June 30, 2015 December 31, 2014
Net asset valueper unit
($)
Net assetsper unit
($)
Net asset valueper unit
($)
Net assetsper unit
($)
Series A 11.10 11.10 11.02 11.02
Advisor Series 10.73 10.73 10.68 10.68
Series D 9.67 9.67 – –
Series F 11.69 11.69 11.56 11.56
The accompanying notes are an integral part of the financial statements.
76
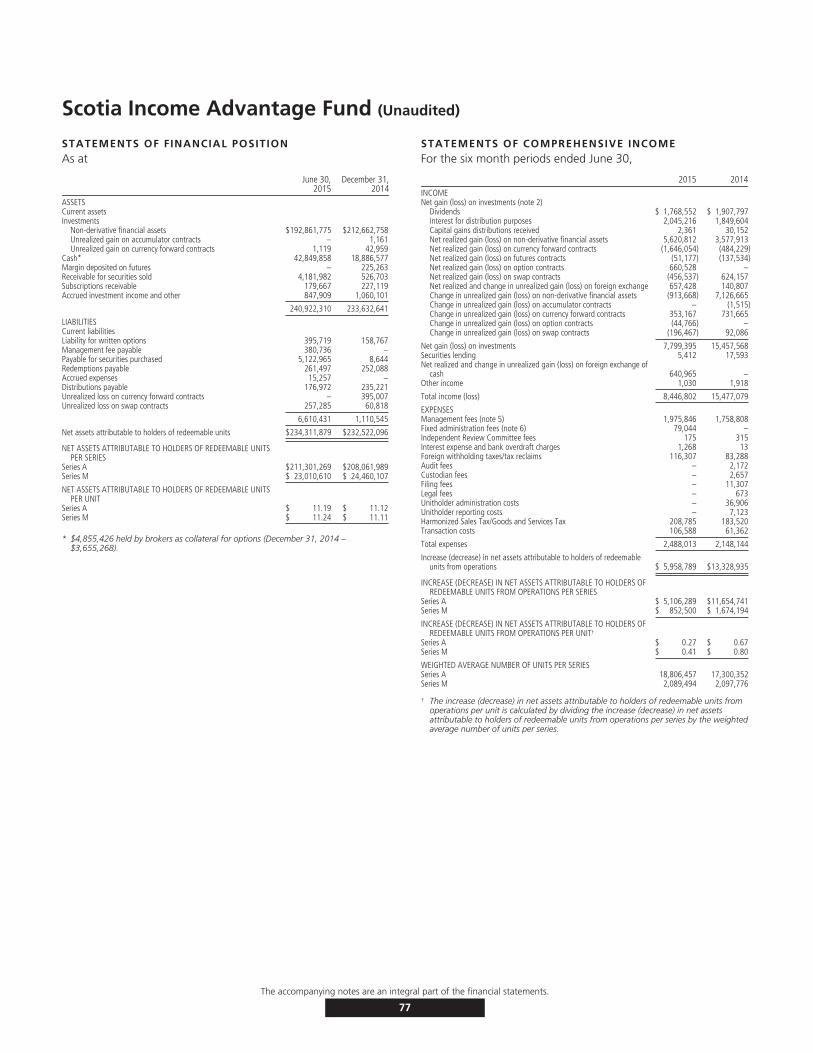
Scotia Income Advantage Fund (Unaudited)
STATEMENTS OF FINANCIAL POSITIONAs at
June 30,2015
December 31,2014
ASSETSCurrent assetsInvestments
Non-derivative financial assets $192,861,775 $212,662,758Unrealized gain on accumulator contracts – 1,161Unrealized gain on currency forward contracts 1,119 42,959
Cash* 42,849,858 18,886,577Margin deposited on futures – 225,263Receivable for securities sold 4,181,982 526,703Subscriptions receivable 179,667 227,119Accrued investment income and other 847,909 1,060,101
240,922,310 233,632,641
LIABILITIESCurrent liabilitiesLiability for written options 395,719 158,767Management fee payable 380,736 –Payable for securities purchased 5,122,965 8,644Redemptions payable 261,497 252,088Accrued expenses 15,257 –Distributions payable 176,972 235,221Unrealized loss on currency forward contracts – 395,007Unrealized loss on swap contracts 257,285 60,818
6,610,431 1,110,545
Net assets attributable to holders of redeemable units $234,311,879 $232,522,096
NET ASSETS ATTRIBUTABLE TO HOLDERS OF REDEEMABLE UNITSPER SERIES
Series A $211,301,269 $208,061,989Series M $ 23,010,610 $ 24,460,107
NET ASSETS ATTRIBUTABLE TO HOLDERS OF REDEEMABLE UNITSPER UNIT
Series A $ 11.19 $ 11.12Series M $ 11.24 $ 11.11
* $4,855,426 held by brokers as collateral for options (December 31, 2014 –$3,655,268).
STATEMENTS OF COMPREHENSIVE INCOMEFor the six month periods ended June 30,
2015 2014INCOMENet gain (loss) on investments (note 2)
Dividends $ 1,768,552 $ 1,907,797Interest for distribution purposes 2,045,216 1,849,604Capital gains distributions received 2,361 30,152Net realized gain (loss) on non-derivative financial assets 5,620,812 3,577,913Net realized gain (loss) on currency forward contracts (1,646,054) (484,229)Net realized gain (loss) on futures contracts (51,177) (137,534)Net realized gain (loss) on option contracts 660,528 –Net realized gain (loss) on swap contracts (456,537) 624,157Net realized and change in unrealized gain (loss) on foreign exchange 657,428 140,807Change in unrealized gain (loss) on non-derivative financial assets (913,668) 7,126,665Change in unrealized gain (loss) on accumulator contracts – (1,515)Change in unrealized gain (loss) on currency forward contracts 353,167 731,665Change in unrealized gain (loss) on option contracts (44,766) –Change in unrealized gain (loss) on swap contracts (196,467) 92,086
Net gain (loss) on investments 7,799,395 15,457,568Securities lending 5,412 17,593Net realized and change in unrealized gain (loss) on foreign exchange of
cash 640,965 –Other income 1,030 1,918
Total income (loss) 8,446,802 15,477,079
EXPENSESManagement fees (note 5) 1,975,846 1,758,808Fixed administration fees (note 6) 79,044 –Independent Review Committee fees 175 315Interest expense and bank overdraft charges 1,268 13Foreign withholding taxes/tax reclaims 116,307 83,288Audit fees – 2,172Custodian fees – 2,657Filing fees – 11,307Legal fees – 673Unitholder administration costs – 36,906Unitholder reporting costs – 7,123Harmonized Sales Tax/Goods and Services Tax 208,785 183,520Transaction costs 106,588 61,362
Total expenses 2,488,013 2,148,144
Increase (decrease) in net assets attributable to holders of redeemableunits from operations $ 5,958,789 $13,328,935
INCREASE (DECREASE) IN NET ASSETS ATTRIBUTABLE TO HOLDERS OFREDEEMABLE UNITS FROM OPERATIONS PER SERIES
Series A $ 5,106,289 $11,654,741Series M $ 852,500 $ 1,674,194
INCREASE (DECREASE) IN NET ASSETS ATTRIBUTABLE TO HOLDERS OFREDEEMABLE UNITS FROM OPERATIONS PER UNIT†
Series A $ 0.27 $ 0.67Series M $ 0.41 $ 0.80
WEIGHTED AVERAGE NUMBER OF UNITS PER SERIESSeries A 18,806,457 17,300,352Series M 2,089,494 2,097,776
† The increase (decrease) in net assets attributable to holders of redeemable units fromoperations per unit is calculated by dividing the increase (decrease) in net assetsattributable to holders of redeemable units from operations per series by the weightedaverage number of units per series.
The accompanying notes are an integral part of the financial statements.
77
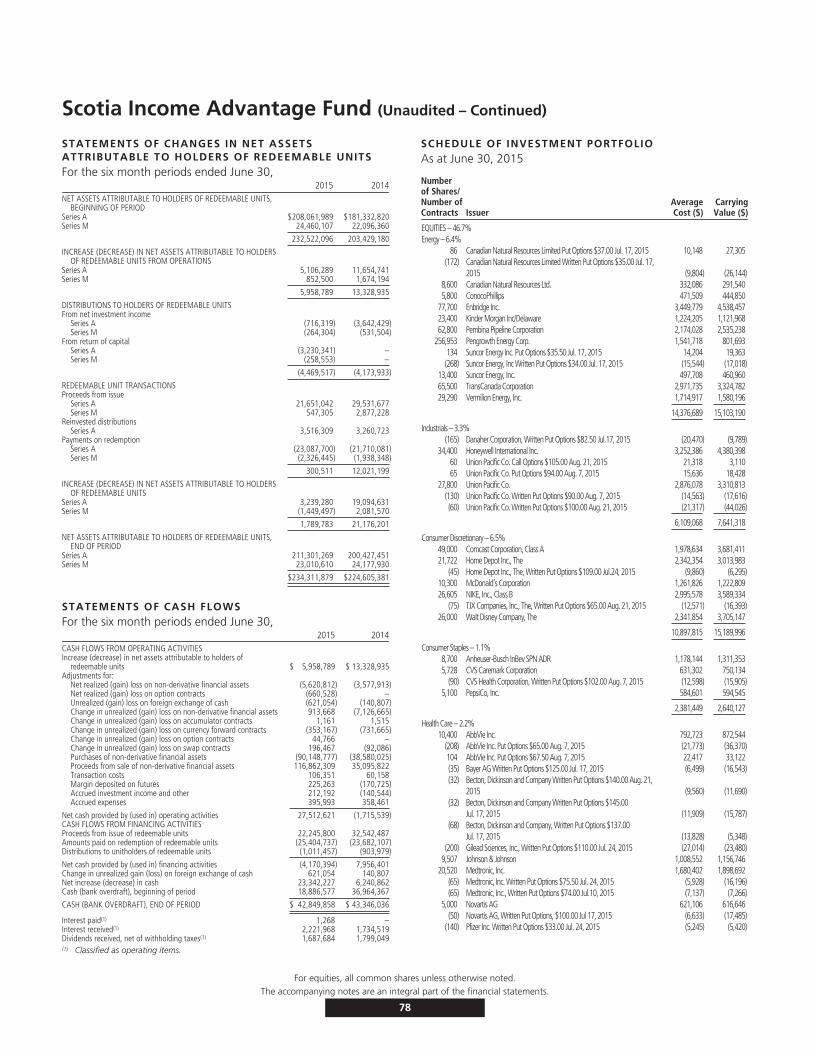
Scotia Income Advantage Fund (Unaudited – Continued)
STATEMENTS OF CHANGES IN NET ASSETSATTRIBUTABLE TO HOLDERS OF REDEEMABLE UNITSFor the six month periods ended June 30,
2015 2014NET ASSETS ATTRIBUTABLE TO HOLDERS OF REDEEMABLE UNITS,
BEGINNING OF PERIODSeries A $208,061,989 $181,332,820Series M 24,460,107 22,096,360
232,522,096 203,429,180
INCREASE (DECREASE) IN NET ASSETS ATTRIBUTABLE TO HOLDERSOF REDEEMABLE UNITS FROM OPERATIONS
Series A 5,106,289 11,654,741Series M 852,500 1,674,194
5,958,789 13,328,935
DISTRIBUTIONS TO HOLDERS OF REDEEMABLE UNITSFrom net investment income
Series A (716,319) (3,642,429)Series M (264,304) (531,504)
From return of capitalSeries A (3,230,341) –Series M (258,553) –
(4,469,517) (4,173,933)
REDEEMABLE UNIT TRANSACTIONSProceeds from issue
Series A 21,651,042 29,531,677Series M 547,305 2,877,228
Reinvested distributionsSeries A 3,516,309 3,260,723
Payments on redemptionSeries A (23,087,700) (21,710,081)Series M (2,326,445) (1,938,348)
300,511 12,021,199
INCREASE (DECREASE) IN NET ASSETS ATTRIBUTABLE TO HOLDERSOF REDEEMABLE UNITS
Series A 3,239,280 19,094,631Series M (1,449,497) 2,081,570
1,789,783 21,176,201
NET ASSETS ATTRIBUTABLE TO HOLDERS OF REDEEMABLE UNITS,END OF PERIOD
Series A 211,301,269 200,427,451Series M 23,010,610 24,177,930
$234,311,879 $224,605,381
STATEMENTS OF CASH FLOWSFor the six month periods ended June 30,
2015 2014CASH FLOWS FROM OPERATING ACTIVITIESIncrease (decrease) in net assets attributable to holders of
redeemable units $ 5,958,789 $ 13,328,935Adjustments for:
Net realized (gain) loss on non-derivative financial assets (5,620,812) (3,577,913)Net realized (gain) loss on option contracts (660,528) –Unrealized (gain) loss on foreign exchange of cash (621,054) (140,807)Change in unrealized (gain) loss on non-derivative financial assets 913,668 (7,126,665)Change in unrealized (gain) loss on accumulator contracts 1,161 1,515Change in unrealized (gain) loss on currency forward contracts (353,167) (731,665)Change in unrealized (gain) loss on option contracts 44,766 –Change in unrealized (gain) loss on swap contracts 196,467 (92,086)Purchases of non-derivative financial assets (90,148,777) (38,580,025)Proceeds from sale of non-derivative financial assets 116,862,309 35,095,822Transaction costs 106,351 60,158Margin deposited on futures 225,263 (170,725)Accrued investment income and other 212,192 (140,544)Accrued expenses 395,993 358,461
Net cash provided by (used in) operating activities 27,512,621 (1,715,539)CASH FLOWS FROM FINANCING ACTIVITIESProceeds from issue of redeemable units 22,245,800 32,542,487Amounts paid on redemption of redeemable units (25,404,737) (23,682,107)Distributions to unitholders of redeemable units (1,011,457) (903,979)
Net cash provided by (used in) financing activities (4,170,394) 7,956,401Change in unrealized gain (loss) on foreign exchange of cash 621,054 140,807Net increase (decrease) in cash 23,342,227 6,240,862Cash (bank overdraft), beginning of period 18,886,577 36,964,367
CASH (BANK OVERDRAFT), END OF PERIOD $ 42,849,858 $ 43,346,036
Interest paid(1) 1,268 –Interest received(1) 2,221,968 1,734,519Dividends received, net of withholding taxes(1) 1,687,684 1,799,049(1) Classified as operating items.
SCHEDULE OF INVESTMENT PORTFOLIOAs at June 30, 2015
Numberof Shares/Number ofContracts Issuer
AverageCost ($)
CarryingValue ($)
EQUITIES – 46.7%Energy – 6.4%
86 Canadian Natural Resources Limited Put Options $37.00 Jul. 17, 2015 10,148 27,305(172) Canadian Natural Resources Limited Written Put Options $35.00 Jul. 17,
2015 (9,804) (26,144)8,600 Canadian Natural Resources Ltd. 332,086 291,5405,800 ConocoPhillips 471,509 444,850
77,700 Enbridge Inc. 3,449,779 4,538,45723,400 Kinder Morgan Inc/Delaware 1,224,205 1,121,96862,800 Pembina Pipeline Corporation 2,174,028 2,535,238
256,953 Pengrowth Energy Corp. 1,541,718 801,693134 Suncor Energy Inc. Put Options $35.50 Jul. 17, 2015 14,204 19,363(268) Suncor Energy, Inc Written Put Options $34.00 Jul. 17, 2015 (15,544) (17,018)
13,400 Suncor Energy, Inc. 497,708 460,96065,500 TransCanada Corporation 2,971,735 3,324,78229,290 Vermilion Energy, Inc. 1,714,917 1,580,196
14,376,689 15,103,190
Industrials – 3.3%(165) Danaher Corporation, Written Put Options $82.50 Jul.17, 2015 (20,470) (9,789)
34,400 Honeywell International Inc. 3,252,386 4,380,39860 Union Pacific Co. Call Options $105.00 Aug. 21, 2015 21,318 3,11065 Union Pacific Co. Put Options $94.00 Aug. 7, 2015 15,636 18,428
27,800 Union Pacific Co. 2,876,078 3,310,813(130) Union Pacific Co. Written Put Options $90.00 Aug. 7, 2015 (14,563) (17,616)(60) Union Pacific Co. Written Put Options $100.00 Aug. 21, 2015 (21,317) (44,026)
6,109,068 7,641,318
Consumer Discretionary – 6.5%49,000 Comcast Corporation, Class A 1,978,634 3,681,41121,722 Home Depot Inc., The 2,342,354 3,013,983
(45) Home Depot Inc., The, Written Put Options $109.00 Jul.24, 2015 (9,860) (6,295)10,300 McDonald’s Corporation 1,261,826 1,222,80926,605 NIKE, Inc., Class B 2,995,578 3,589,334
(75) TJX Companies, Inc., The, Written Put Options $65.00 Aug. 21, 2015 (12,571) (16,393)26,000 Walt Disney Company, The 2,341,854 3,705,147
10,897,815 15,189,996
Consumer Staples – 1.1%8,700 Anheuser-Busch InBev SPN ADR 1,178,144 1,311,3535,728 CVS Caremark Corporation 631,302 750,134
(90) CVS Health Corporation, Written Put Options $102.00 Aug. 7, 2015 (12,598) (15,905)5,100 PepsiCo, Inc. 584,601 594,545
2,381,449 2,640,127
Health Care – 2.2%10,400 AbbVie Inc. 792,723 872,544
(208) AbbVie Inc. Put Options $65.00 Aug. 7, 2015 (21,773) (36,370)104 AbbVie Inc. Put Options $67.50 Aug. 7, 2015 22,417 33,122(35) Bayer AG Written Put Options $125.00 Jul. 17, 2015 (6,499) (16,543)(32) Becton, Dickinson and Company Written Put Options $140.00 Aug. 21,
2015 (9,560) (11,690)(32) Becton, Dickinson and Company Written Put Options $145.00
Jul. 17, 2015 (11,909) (15,787)(68) Becton, Dickinson and Company, Written Put Options $137.00
Jul. 17, 2015 (13,828) (5,348)(200) Gilead Sciences, Inc., Written Put Options $110.00 Jul. 24, 2015 (27,014) (23,480)
9,507 Johnson & Johnson 1,008,552 1,156,74620,520 Medtronic, Inc. 1,680,402 1,898,692
(65) Medtronic, Inc. Written Put Options $75.50 Jul. 24, 2015 (5,928) (16,196)(65) Medtronic, Inc., Written Put Options $74.00 Jul.10, 2015 (7,137) (7,266)
5,000 Novartis AG 621,106 616,646(50) Novartis AG, Written Put Options, $100.00 Jul 17, 2015 (6,633) (17,485)
(140) Pfizer Inc. Written Put Options $33.00 Jul. 24, 2015 (5,245) (5,420)
For equities, all common shares unless otherwise noted.The accompanying notes are an integral part of the financial statements.
78
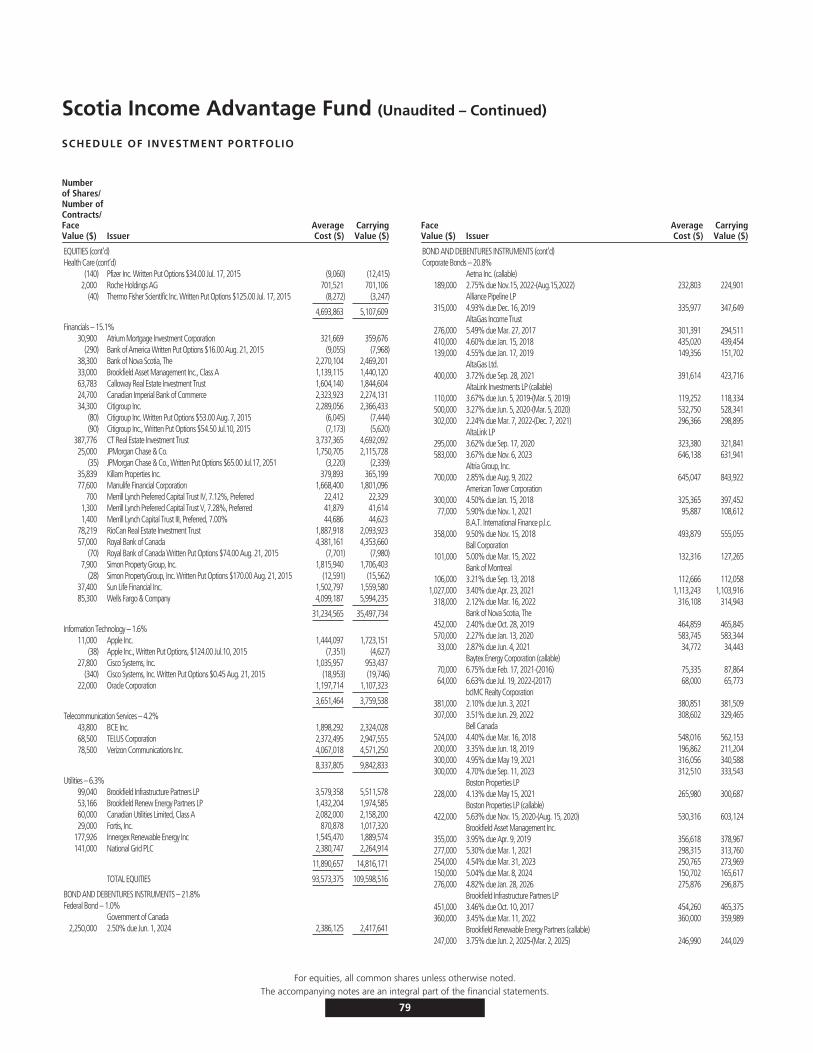
Scotia Income Advantage Fund (Unaudited – Continued)
SCHEDULE OF INVESTMENT PORTFOLIO
Numberof Shares/Number ofContracts/FaceValue ($) Issuer
AverageCost ($)
CarryingValue ($)
EQUITIES (cont’d)Health Care (cont’d)
(140) Pfizer Inc. Written Put Options $34.00 Jul. 17, 2015 (9,060) (12,415)2,000 Roche Holdings AG 701,521 701,106
(40) Thermo Fisher Scientific Inc. Written Put Options $125.00 Jul. 17, 2015 (8,272) (3,247)
4,693,863 5,107,609
Financials – 15.1%30,900 Atrium Mortgage Investment Corporation 321,669 359,676
(290) Bank of America Written Put Options $16.00 Aug. 21, 2015 (9,055) (7,968)38,300 Bank of Nova Scotia, The 2,270,104 2,469,20133,000 Brookfield Asset Management Inc., Class A 1,139,115 1,440,12063,783 Calloway Real Estate Investment Trust 1,604,140 1,844,60424,700 Canadian Imperial Bank of Commerce 2,323,923 2,274,13134,300 Citigroup Inc. 2,289,056 2,366,433
(80) Citigroup Inc. Written Put Options $53.00 Aug. 7, 2015 (6,045) (7,444)(90) Citigroup Inc., Written Put Options $54.50 Jul.10, 2015 (7,173) (5,620)
387,776 CT Real Estate Investment Trust 3,737,365 4,692,09225,000 JPMorgan Chase & Co. 1,750,705 2,115,728
(35) JPMorgan Chase & Co., Written Put Options $65.00 Jul.17, 2051 (3,220) (2,339)35,839 Killam Properties Inc. 379,893 365,19977,600 Manulife Financial Corporation 1,668,400 1,801,096
700 Merrill Lynch Preferred Capital Trust IV, 7.12%, Preferred 22,412 22,3291,300 Merrill Lynch Preferred Capital Trust V, 7.28%, Preferred 41,879 41,6141,400 Merrill Lynch Capital Trust III, Preferred, 7.00% 44,686 44,623
78,219 RioCan Real Estate Investment Trust 1,887,918 2,093,92357,000 Royal Bank of Canada 4,381,161 4,353,660
(70) Royal Bank of Canada Written Put Options $74.00 Aug. 21, 2015 (7,701) (7,980)7,900 Simon Property Group, Inc. 1,815,940 1,706,403
(28) Simon PropertyGroup, Inc. Written Put Options $170.00 Aug. 21, 2015 (12,591) (15,562)37,400 Sun Life Financial Inc. 1,502,797 1,559,58085,300 Wells Fargo & Company 4,099,187 5,994,235
31,234,565 35,497,734
Information Technology – 1.6%11,000 Apple Inc. 1,444,097 1,723,151
(38) Apple Inc., Written Put Options, $124.00 Jul.10, 2015 (7,351) (4,627)27,800 Cisco Systems, Inc. 1,035,957 953,437
(340) Cisco Systems, Inc. Written Put Options $0.45 Aug. 21, 2015 (18,953) (19,746)22,000 Oracle Corporation 1,197,714 1,107,323
3,651,464 3,759,538
Telecommunication Services – 4.2%43,800 BCE Inc. 1,898,292 2,324,02868,500 TELUS Corporation 2,372,495 2,947,55578,500 Verizon Communications Inc. 4,067,018 4,571,250
8,337,805 9,842,833
Utilities – 6.3%99,040 Brookfield Infrastructure Partners LP 3,579,358 5,511,57853,166 Brookfield Renew Energy Partners LP 1,432,204 1,974,58560,000 Canadian Utilities Limited, Class A 2,082,000 2,158,20029,000 Fortis, Inc. 870,878 1,017,320
177,926 Innergex Renewable Energy Inc 1,545,470 1,889,574141,000 National Grid PLC 2,380,747 2,264,914
11,890,657 14,816,171
TOTAL EQUITIES 93,573,375 109,598,516
BOND AND DEBENTURES INSTRUMENTS – 21.8%Federal Bond – 1.0%
Government of Canada2,250,000 2.50% due Jun. 1, 2024 2,386,125 2,417,641
FaceValue ($) Issuer
AverageCost ($)
CarryingValue ($)
BOND AND DEBENTURES INSTRUMENTS (cont’d)Corporate Bonds – 20.8%
Aetna Inc. (callable)189,000 2.75% due Nov.15, 2022-(Aug.15,2022) 232,803 224,901
Alliance Pipeline LP315,000 4.93% due Dec. 16, 2019 335,977 347,649
AltaGas Income Trust276,000 5.49% due Mar. 27, 2017 301,391 294,511410,000 4.60% due Jan. 15, 2018 435,020 439,454139,000 4.55% due Jan. 17, 2019 149,356 151,702
AltaGas Ltd.400,000 3.72% due Sep. 28, 2021 391,614 423,716
AltaLink Investments LP (callable)110,000 3.67% due Jun. 5, 2019-(Mar. 5, 2019) 119,252 118,334500,000 3.27% due Jun. 5, 2020-(Mar. 5, 2020) 532,750 528,341302,000 2.24% due Mar. 7, 2022-(Dec. 7, 2021) 296,366 298,895
AltaLink LP295,000 3.62% due Sep. 17, 2020 323,380 321,841583,000 3.67% due Nov. 6, 2023 646,138 631,941
Altria Group, Inc.700,000 2.85% due Aug. 9, 2022 645,047 843,922
American Tower Corporation300,000 4.50% due Jan. 15, 2018 325,365 397,45277,000 5.90% due Nov. 1, 2021 95,887 108,612
B.A.T. International Finance p.l.c.358,000 9.50% due Nov. 15, 2018 493,879 555,055
Ball Corporation101,000 5.00% due Mar. 15, 2022 132,316 127,265
Bank of Montreal106,000 3.21% due Sep. 13, 2018 112,666 112,058
1,027,000 3.40% due Apr. 23, 2021 1,113,243 1,103,916318,000 2.12% due Mar. 16, 2022 316,108 314,943
Bank of Nova Scotia, The452,000 2.40% due Oct. 28, 2019 464,859 465,845570,000 2.27% due Jan. 13, 2020 583,745 583,34433,000 2.87% due Jun. 4, 2021 34,772 34,443
Baytex Energy Corporation (callable)70,000 6.75% due Feb. 17, 2021-(2016) 75,335 87,86464,000 6.63% due Jul. 19, 2022-(2017) 68,000 65,773
bcIMC Realty Corporation381,000 2.10% due Jun. 3, 2021 380,851 381,509307,000 3.51% due Jun. 29, 2022 308,602 329,465
Bell Canada524,000 4.40% due Mar. 16, 2018 548,016 562,153200,000 3.35% due Jun. 18, 2019 196,862 211,204300,000 4.95% due May 19, 2021 316,056 340,588300,000 4.70% due Sep. 11, 2023 312,510 333,543
Boston Properties LP228,000 4.13% due May 15, 2021 265,980 300,687
Boston Properties LP (callable)422,000 5.63% due Nov. 15, 2020-(Aug. 15, 2020) 530,316 603,124
Brookfield Asset Management Inc.355,000 3.95% due Apr. 9, 2019 356,618 378,967277,000 5.30% due Mar. 1, 2021 298,315 313,760254,000 4.54% due Mar. 31, 2023 250,765 273,969150,000 5.04% due Mar. 8, 2024 150,702 165,617276,000 4.82% due Jan. 28, 2026 275,876 296,875
Brookfield Infrastructure Partners LP451,000 3.46% due Oct. 10, 2017 454,260 465,375360,000 3.45% due Mar. 11, 2022 360,000 359,989
Brookfield Renewable Energy Partners (callable)247,000 3.75% due Jun. 2, 2025-(Mar. 2, 2025) 246,990 244,029
For equities, all common shares unless otherwise noted.The accompanying notes are an integral part of the financial statements.
79
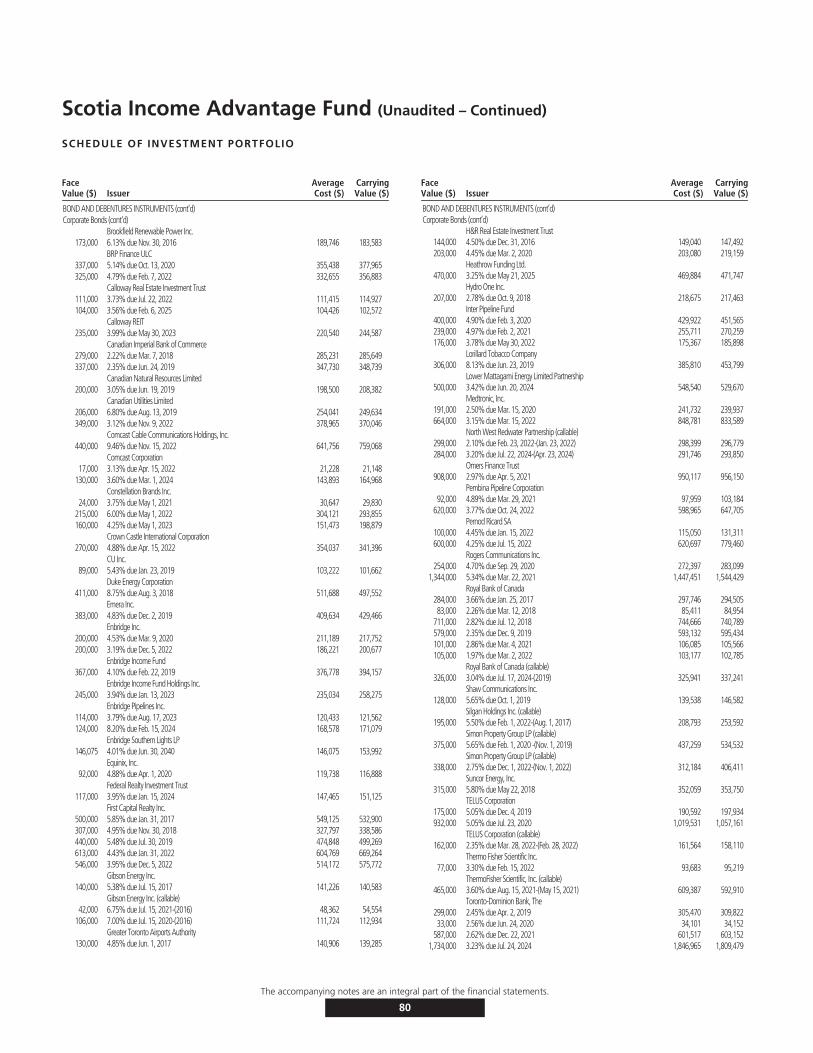
Scotia Income Advantage Fund (Unaudited – Continued)
SCHEDULE OF INVESTMENT PORTFOLIO
FaceValue ($) Issuer
AverageCost ($)
CarryingValue ($)
BOND AND DEBENTURES INSTRUMENTS (cont’d)Corporate Bonds (cont’d)
Brookfield Renewable Power Inc.173,000 6.13% due Nov. 30, 2016 189,746 183,583
BRP Finance ULC337,000 5.14% due Oct. 13, 2020 355,438 377,965325,000 4.79% due Feb. 7, 2022 332,655 356,883
Calloway Real Estate Investment Trust111,000 3.73% due Jul. 22, 2022 111,415 114,927104,000 3.56% due Feb. 6, 2025 104,426 102,572
Calloway REIT235,000 3.99% due May 30, 2023 220,540 244,587
Canadian Imperial Bank of Commerce279,000 2.22% due Mar. 7, 2018 285,231 285,649337,000 2.35% due Jun. 24, 2019 347,730 348,739
Canadian Natural Resources Limited200,000 3.05% due Jun. 19, 2019 198,500 208,382
Canadian Utilities Limited206,000 6.80% due Aug. 13, 2019 254,041 249,634349,000 3.12% due Nov. 9, 2022 378,965 370,046
Comcast Cable Communications Holdings, Inc.440,000 9.46% due Nov. 15, 2022 641,756 759,068
Comcast Corporation17,000 3.13% due Apr. 15, 2022 21,228 21,148
130,000 3.60% due Mar. 1, 2024 143,893 164,968Constellation Brands Inc.
24,000 3.75% due May 1, 2021 30,647 29,830215,000 6.00% due May 1, 2022 304,121 293,855160,000 4.25% due May 1, 2023 151,473 198,879
Crown Castle International Corporation270,000 4.88% due Apr. 15, 2022 354,037 341,396
CU Inc.89,000 5.43% due Jan. 23, 2019 103,222 101,662
Duke Energy Corporation411,000 8.75% due Aug. 3, 2018 511,688 497,552
Emera Inc.383,000 4.83% due Dec. 2, 2019 409,634 429,466
Enbridge Inc.200,000 4.53% due Mar. 9, 2020 211,189 217,752200,000 3.19% due Dec. 5, 2022 186,221 200,677
Enbridge Income Fund367,000 4.10% due Feb. 22, 2019 376,778 394,157
Enbridge Income Fund Holdings Inc.245,000 3.94% due Jan. 13, 2023 235,034 258,275
Enbridge Pipelines Inc.114,000 3.79% due Aug. 17, 2023 120,433 121,562124,000 8.20% due Feb. 15, 2024 168,578 171,079
Enbridge Southern Lights LP146,075 4.01% due Jun. 30, 2040 146,075 153,992
Equinix, Inc.92,000 4.88% due Apr. 1, 2020 119,738 116,888
Federal Realty Investment Trust117,000 3.95% due Jan. 15, 2024 147,465 151,125
First Capital Realty Inc.500,000 5.85% due Jan. 31, 2017 549,125 532,900307,000 4.95% due Nov. 30, 2018 327,797 338,586440,000 5.48% due Jul. 30, 2019 474,848 499,269613,000 4.43% due Jan. 31, 2022 604,769 669,264546,000 3.95% due Dec. 5, 2022 514,172 575,772
Gibson Energy Inc.140,000 5.38% due Jul. 15, 2017 141,226 140,583
Gibson Energy Inc. (callable)42,000 6.75% due Jul. 15, 2021-(2016) 48,362 54,554
106,000 7.00% due Jul. 15, 2020-(2016) 111,724 112,934Greater Toronto Airports Authority
130,000 4.85% due Jun. 1, 2017 140,906 139,285
FaceValue ($) Issuer
AverageCost ($)
CarryingValue ($)
BOND AND DEBENTURES INSTRUMENTS (cont’d)Corporate Bonds (cont’d)
H&R Real Estate Investment Trust144,000 4.50% due Dec. 31, 2016 149,040 147,492203,000 4.45% due Mar. 2, 2020 203,080 219,159
Heathrow Funding Ltd.470,000 3.25% due May 21, 2025 469,884 471,747
Hydro One Inc.207,000 2.78% due Oct. 9, 2018 218,675 217,463
Inter Pipeline Fund400,000 4.90% due Feb. 3, 2020 429,922 451,565239,000 4.97% due Feb. 2, 2021 255,711 270,259176,000 3.78% due May 30, 2022 175,367 185,898
Lorillard Tobacco Company306,000 8.13% due Jun. 23, 2019 385,810 453,799
Lower Mattagami Energy Limited Partnership500,000 3.42% due Jun. 20, 2024 548,540 529,670
Medtronic, Inc.191,000 2.50% due Mar. 15, 2020 241,732 239,937664,000 3.15% due Mar. 15, 2022 848,781 833,589
North West Redwater Partnership (callable)299,000 2.10% due Feb. 23, 2022-(Jan. 23, 2022) 298,399 296,779284,000 3.20% due Jul. 22, 2024-(Apr. 23, 2024) 291,746 293,850
Omers Finance Trust908,000 2.97% due Apr. 5, 2021 950,117 956,150
Pembina Pipeline Corporation92,000 4.89% due Mar. 29, 2021 97,959 103,184
620,000 3.77% due Oct. 24, 2022 598,965 647,705Pernod Ricard SA
100,000 4.45% due Jan. 15, 2022 115,050 131,311600,000 4.25% due Jul. 15, 2022 620,697 779,460
Rogers Communications Inc.254,000 4.70% due Sep. 29, 2020 272,397 283,099
1,344,000 5.34% due Mar. 22, 2021 1,447,451 1,544,429Royal Bank of Canada
284,000 3.66% due Jan. 25, 2017 297,746 294,50583,000 2.26% due Mar. 12, 2018 85,411 84,954
711,000 2.82% due Jul. 12, 2018 744,666 740,789579,000 2.35% due Dec. 9, 2019 593,132 595,434101,000 2.86% due Mar. 4, 2021 106,085 105,566105,000 1.97% due Mar. 2, 2022 103,177 102,785
Royal Bank of Canada (callable)326,000 3.04% due Jul. 17, 2024-(2019) 325,941 337,241
Shaw Communications Inc.128,000 5.65% due Oct. 1, 2019 139,538 146,582
Silgan Holdings Inc. (callable)195,000 5.50% due Feb. 1, 2022-(Aug. 1, 2017) 208,793 253,592
Simon Property Group LP (callable)375,000 5.65% due Feb. 1, 2020 -(Nov. 1, 2019) 437,259 534,532
Simon Property Group LP (callable)338,000 2.75% due Dec. 1, 2022-(Nov. 1, 2022) 312,184 406,411
Suncor Energy, Inc.315,000 5.80% due May 22, 2018 352,059 353,750
TELUS Corporation175,000 5.05% due Dec. 4, 2019 190,592 197,934932,000 5.05% due Jul. 23, 2020 1,019,531 1,057,161
TELUS Corporation (callable)162,000 2.35% due Mar. 28, 2022-(Feb. 28, 2022) 161,564 158,110
Thermo Fisher Scientific Inc.77,000 3.30% due Feb. 15, 2022 93,683 95,219
ThermoFisher Scientific, Inc. (callable)465,000 3.60% due Aug. 15, 2021-(May 15, 2021) 609,387 592,910
Toronto-Dominion Bank, The299,000 2.45% due Apr. 2, 2019 305,470 309,82233,000 2.56% due Jun. 24, 2020 34,101 34,152
587,000 2.62% due Dec. 22, 2021 601,517 603,1521,734,000 3.23% due Jul. 24, 2024 1,846,965 1,809,479
The accompanying notes are an integral part of the financial statements.
80
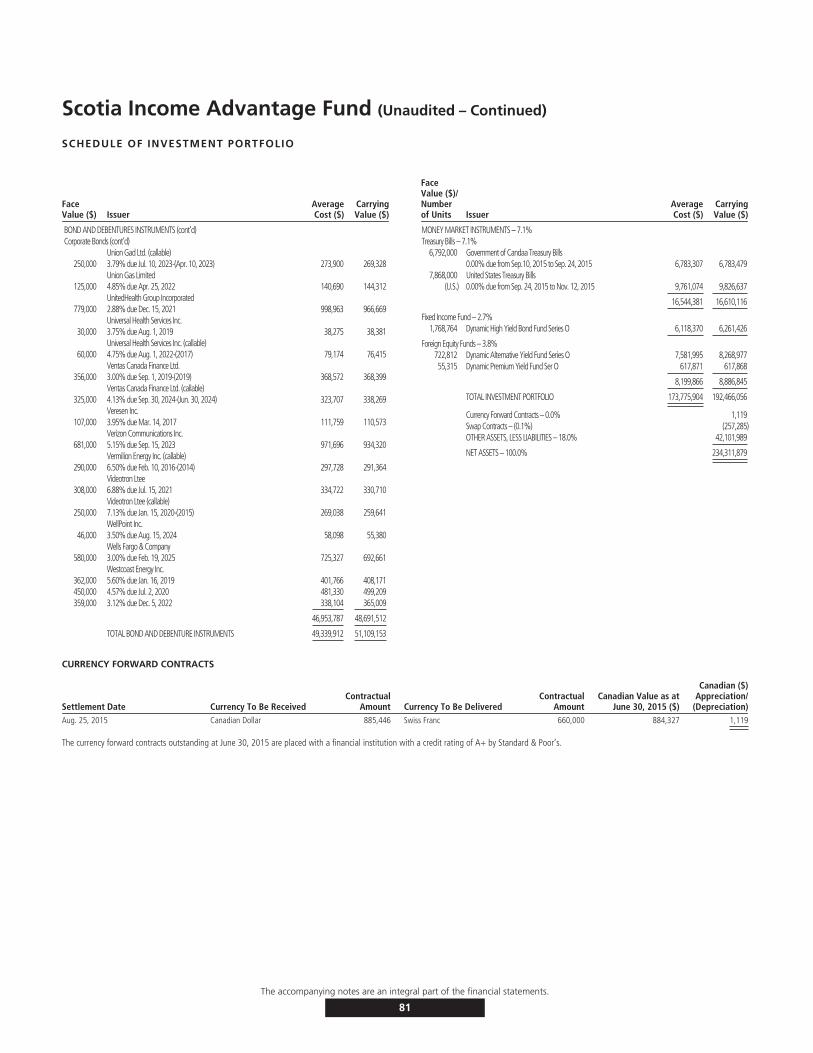
Scotia Income Advantage Fund (Unaudited – Continued)
SCHEDULE OF INVESTMENT PORTFOLIO
FaceValue ($) Issuer
AverageCost ($)
CarryingValue ($)
BOND AND DEBENTURES INSTRUMENTS (cont’d)Corporate Bonds (cont’d)
Union Gad Ltd. (callable)250,000 3.79% due Jul. 10, 2023-(Apr. 10, 2023) 273,900 269,328
Union Gas Limited125,000 4.85% due Apr. 25, 2022 140,690 144,312
UnitedHealth Group Incorporated779,000 2.88% due Dec. 15, 2021 998,963 966,669
Universal Health Services Inc.30,000 3.75% due Aug. 1, 2019 38,275 38,381
Universal Health Services Inc. (callable)60,000 4.75% due Aug. 1, 2022-(2017) 79,174 76,415
Ventas Canada Finance Ltd.356,000 3.00% due Sep. 1, 2019-(2019) 368,572 368,399
Ventas Canada Finance Ltd. (callable)325,000 4.13% due Sep. 30, 2024-(Jun. 30, 2024) 323,707 338,269
Veresen Inc.107,000 3.95% due Mar. 14, 2017 111,759 110,573
Verizon Communications Inc.681,000 5.15% due Sep. 15, 2023 971,696 934,320
Vermilion Energy Inc. (callable)290,000 6.50% due Feb. 10, 2016-(2014) 297,728 291,364
Videotron Ltee308,000 6.88% due Jul. 15, 2021 334,722 330,710
Videotron Ltee (callable)250,000 7.13% due Jan. 15, 2020-(2015) 269,038 259,641
WellPoint Inc.46,000 3.50% due Aug. 15, 2024 58,098 55,380
Wells Fargo & Company580,000 3.00% due Feb. 19, 2025 725,327 692,661
Westcoast Energy Inc.362,000 5.60% due Jan. 16, 2019 401,766 408,171450,000 4.57% due Jul. 2, 2020 481,330 499,209359,000 3.12% due Dec. 5, 2022 338,104 365,009
46,953,787 48,691,512
TOTAL BOND AND DEBENTURE INSTRUMENTS 49,339,912 51,109,153
FaceValue ($)/Numberof Units Issuer
AverageCost ($)
CarryingValue ($)
MONEY MARKET INSTRUMENTS – 7.1%Treasury Bills – 7.1%
6,792,000 Government of Candaa Treasury Bills0.00% due from Sep.10, 2015 to Sep. 24, 2015 6,783,307 6,783,479
7,868,000 United States Treasury Bills(U.S.) 0.00% due from Sep. 24, 2015 to Nov. 12, 2015 9,761,074 9,826,637
16,544,381 16,610,116
Fixed Income Fund – 2.7%1,768,764 Dynamic High Yield Bond Fund Series O 6,118,370 6,261,426
Foreign Equity Funds – 3.8%722,812 Dynamic Alternative Yield Fund Series O 7,581,995 8,268,97755,315 Dynamic Premium Yield Fund Ser O 617,871 617,868
8,199,866 8,886,845
TOTAL INVESTMENT PORTFOLIO 173,775,904 192,466,056
Currency Forward Contracts – 0.0% 1,119Swap Contracts – (0.1%) (257,285)OTHER ASSETS, LESS LIABILITIES – 18.0% 42,101,989
NET ASSETS – 100.0% 234,311,879
CURRENCY FORWARD CONTRACTS
Settlement Date Currency To Be ReceivedContractual
Amount Currency To Be DeliveredContractual
AmountCanadian Value as at
June 30, 2015 ($)
Canadian ($)Appreciation/
(Depreciation)Aug. 25, 2015 Canadian Dollar 885,446 Swiss Franc 660,000 884,327 1,119
The currency forward contracts outstanding at June 30, 2015 are placed with a financial institution with a credit rating of A+ by Standard & Poor’s.
The accompanying notes are an integral part of the financial statements.
81
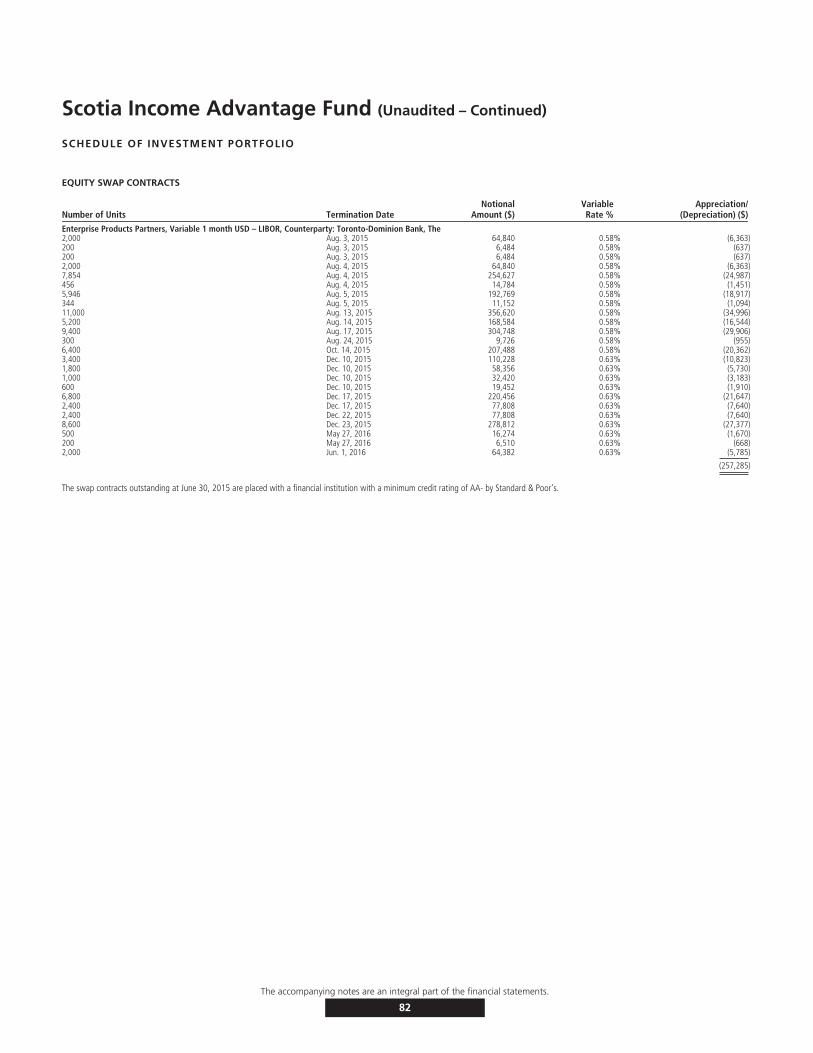
Scotia Income Advantage Fund (Unaudited – Continued)
SCHEDULE OF INVESTMENT PORTFOLIO
EQUITY SWAP CONTRACTS
Number of Units Termination DateNotional
Amount ($)VariableRate %
Appreciation/(Depreciation) ($)
Enterprise Products Partners, Variable 1 month USD – LIBOR, Counterparty: Toronto-Dominion Bank, The2,000 Aug. 3, 2015 64,840 0.58% (6,363)200 Aug. 3, 2015 6,484 0.58% (637)200 Aug. 3, 2015 6,484 0.58% (637)2,000 Aug. 4, 2015 64,840 0.58% (6,363)7,854 Aug. 4, 2015 254,627 0.58% (24,987)456 Aug. 4, 2015 14,784 0.58% (1,451)5,946 Aug. 5, 2015 192,769 0.58% (18,917)344 Aug. 5, 2015 11,152 0.58% (1,094)11,000 Aug. 13, 2015 356,620 0.58% (34,996)5,200 Aug. 14, 2015 168,584 0.58% (16,544)9,400 Aug. 17, 2015 304,748 0.58% (29,906)300 Aug. 24, 2015 9,726 0.58% (955)6,400 Oct. 14, 2015 207,488 0.58% (20,362)3,400 Dec. 10, 2015 110,228 0.63% (10,823)1,800 Dec. 10, 2015 58,356 0.63% (5,730)1,000 Dec. 10, 2015 32,420 0.63% (3,183)600 Dec. 10, 2015 19,452 0.63% (1,910)6,800 Dec. 17, 2015 220,456 0.63% (21,647)2,400 Dec. 17, 2015 77,808 0.63% (7,640)2,400 Dec. 22, 2015 77,808 0.63% (7,640)8,600 Dec. 23, 2015 278,812 0.63% (27,377)500 May 27, 2016 16,274 0.63% (1,670)200 May 27, 2016 6,510 0.63% (668)2,000 Jun. 1, 2016 64,382 0.63% (5,785)
(257,285)
The swap contracts outstanding at June 30, 2015 are placed with a financial institution with a minimum credit rating of AA- by Standard & Poor’s.
The accompanying notes are an integral part of the financial statements.
82
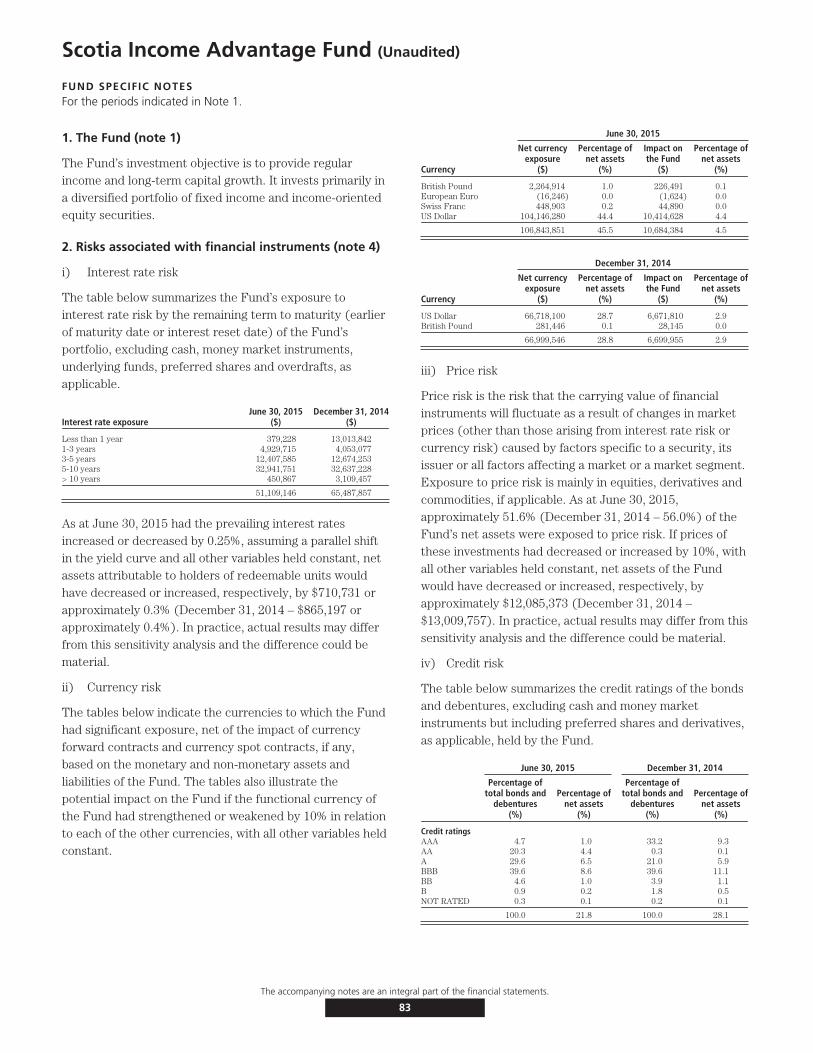
Scotia Income Advantage Fund (Unaudited)
FUND SPECIFIC NOTESFor the periods indicated in Note 1.
1. The Fund (note 1)
The Fund’s investment objective is to provide regularincome and long-term capital growth. It invests primarily ina diversified portfolio of fixed income and income-orientedequity securities.
2. Risks associated with financial instruments (note 4)
i) Interest rate risk
The table below summarizes the Fund’s exposure tointerest rate risk by the remaining term to maturity (earlierof maturity date or interest reset date) of the Fund’sportfolio, excluding cash, money market instruments,underlying funds, preferred shares and overdrafts, asapplicable.
Interest rate exposureJune 30, 2015
($)December 31, 2014
($)
Less than 1 year 379,228 13,013,8421-3 years 4,929,715 4,053,0773-5 years 12,407,585 12,674,2535-10 years 32,941,751 32,637,228> 10 years 450,867 3,109,457
51,109,146 65,487,857
As at June 30, 2015 had the prevailing interest ratesincreased or decreased by 0.25%, assuming a parallel shiftin the yield curve and all other variables held constant, netassets attributable to holders of redeemable units wouldhave decreased or increased, respectively, by $710,731 orapproximately 0.3% (December 31, 2014 – $865,197 orapproximately 0.4%). In practice, actual results may differfrom this sensitivity analysis and the difference could bematerial.
ii) Currency risk
The tables below indicate the currencies to which the Fundhad significant exposure, net of the impact of currencyforward contracts and currency spot contracts, if any,based on the monetary and non-monetary assets andliabilities of the Fund. The tables also illustrate thepotential impact on the Fund if the functional currency ofthe Fund had strengthened or weakened by 10% in relationto each of the other currencies, with all other variables heldconstant.
June 30, 2015
Currency
Net currencyexposure
($)
Percentage ofnet assets
(%)
Impact onthe Fund
($)
Percentage ofnet assets
(%)
British Pound 2,264,914 1.0 226,491 0.1European Euro (16,246) 0.0 (1,624) 0.0Swiss Franc 448,903 0.2 44,890 0.0US Dollar 104,146,280 44.4 10,414,628 4.4
106,843,851 45.5 10,684,384 4.5
December 31, 2014
Currency
Net currencyexposure
($)
Percentage ofnet assets
(%)
Impact onthe Fund
($)
Percentage ofnet assets
(%)
US Dollar 66,718,100 28.7 6,671,810 2.9British Pound 281,446 0.1 28,145 0.0
66,999,546 28.8 6,699,955 2.9
iii) Price risk
Price risk is the risk that the carrying value of financialinstruments will fluctuate as a result of changes in marketprices (other than those arising from interest rate risk orcurrency risk) caused by factors specific to a security, itsissuer or all factors affecting a market or a market segment.Exposure to price risk is mainly in equities, derivatives andcommodities, if applicable. As at June 30, 2015,approximately 51.6% (December 31, 2014 – 56.0%) of theFund’s net assets were exposed to price risk. If prices ofthese investments had decreased or increased by 10%, withall other variables held constant, net assets of the Fundwould have decreased or increased, respectively, byapproximately $12,085,373 (December 31, 2014 –$13,009,757). In practice, actual results may differ from thissensitivity analysis and the difference could be material.
iv) Credit risk
The table below summarizes the credit ratings of the bondsand debentures, excluding cash and money marketinstruments but including preferred shares and derivatives,as applicable, held by the Fund.
June 30, 2015 December 31, 2014
Percentage oftotal bonds and
debentures(%)
Percentage ofnet assets
(%)
Percentage oftotal bonds and
debentures(%)
Percentage ofnet assets
(%)
Credit ratingsAAA 4.7 1.0 33.2 9.3AA 20.3 4.4 0.3 0.1A 29.6 6.5 21.0 5.9BBB 39.6 8.6 39.6 11.1BB 4.6 1.0 3.9 1.1B 0.9 0.2 1.8 0.5NOT RATED 0.3 0.1 0.2 0.1
100.0 21.8 100.0 28.1
The accompanying notes are an integral part of the financial statements.
83
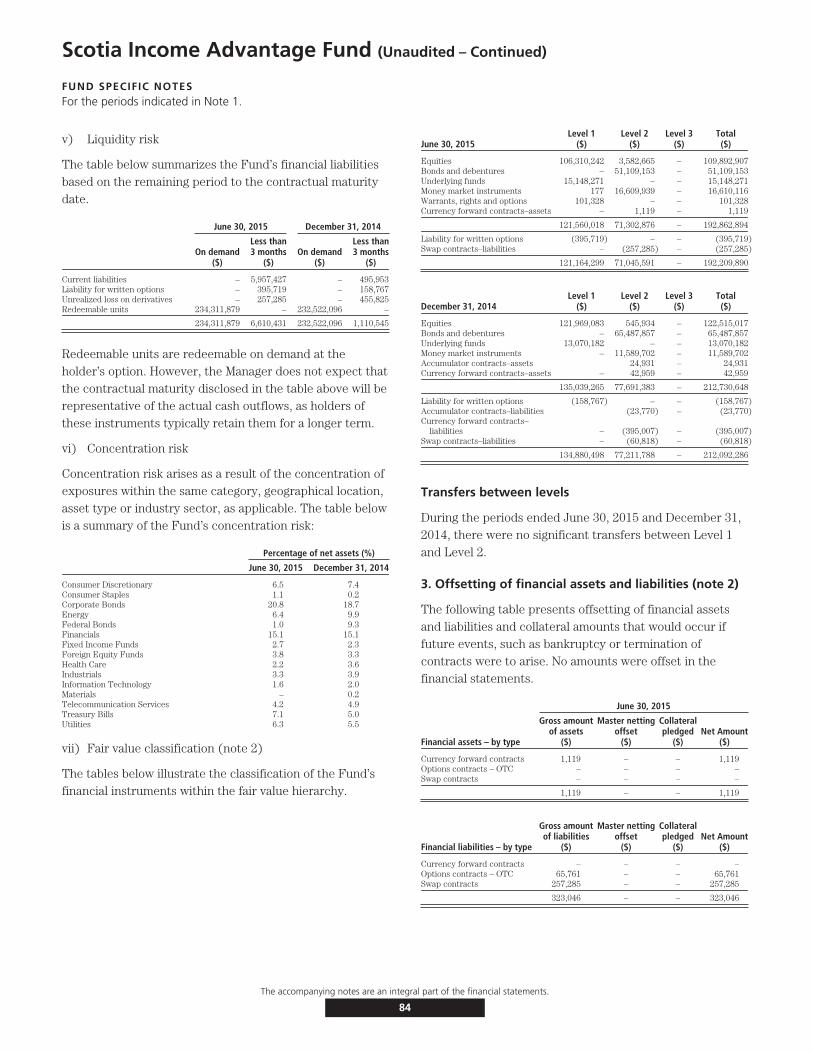
Scotia Income Advantage Fund (Unaudited – Continued)
FUND SPECIFIC NOTESFor the periods indicated in Note 1.
v) Liquidity risk
The table below summarizes the Fund’s financial liabilitiesbased on the remaining period to the contractual maturitydate.
June 30, 2015 December 31, 2014
On demand($)
Less than3 months
($)On demand
($)
Less than3 months
($)
Current liabilities – 5,957,427 – 495,953Liability for written options – 395,719 – 158,767Unrealized loss on derivatives – 257,285 – 455,825Redeemable units 234,311,879 – 232,522,096 –
234,311,879 6,610,431 232,522,096 1,110,545
Redeemable units are redeemable on demand at theholder’s option. However, the Manager does not expect thatthe contractual maturity disclosed in the table above will berepresentative of the actual cash outflows, as holders ofthese instruments typically retain them for a longer term.
vi) Concentration risk
Concentration risk arises as a result of the concentration ofexposures within the same category, geographical location,asset type or industry sector, as applicable. The table belowis a summary of the Fund’s concentration risk:
Percentage of net assets (%)
June 30, 2015 December 31, 2014
Consumer Discretionary 6.5 7.4Consumer Staples 1.1 0.2Corporate Bonds 20.8 18.7Energy 6.4 9.9Federal Bonds 1.0 9.3Financials 15.1 15.1Fixed Income Funds 2.7 2.3Foreign Equity Funds 3.8 3.3Health Care 2.2 3.6Industrials 3.3 3.9Information Technology 1.6 2.0Materials – 0.2Telecommunication Services 4.2 4.9Treasury Bills 7.1 5.0Utilities 6.3 5.5
vii) Fair value classification (note 2)
The tables below illustrate the classification of the Fund’sfinancial instruments within the fair value hierarchy.
June 30, 2015Level 1
($)Level 2
($)Level 3
($)Total($)
Equities 106,310,242 3,582,665 – 109,892,907Bonds and debentures – 51,109,153 – 51,109,153Underlying funds 15,148,271 – – 15,148,271Money market instruments 177 16,609,939 – 16,610,116Warrants, rights and options 101,328 – – 101,328Currency forward contracts–assets – 1,119 – 1,119
121,560,018 71,302,876 – 192,862,894
Liability for written options (395,719) – – (395,719)Swap contracts–liabilities – (257,285) – (257,285)
121,164,299 71,045,591 – 192,209,890
December 31, 2014Level 1
($)Level 2
($)Level 3
($)Total($)
Equities 121,969,083 545,934 – 122,515,017Bonds and debentures – 65,487,857 – 65,487,857Underlying funds 13,070,182 – – 13,070,182Money market instruments – 11,589,702 – 11,589,702Accumulator contracts–assets 24,931 – 24,931Currency forward contracts–assets – 42,959 – 42,959
135,039,265 77,691,383 – 212,730,648
Liability for written options (158,767) – – (158,767)Accumulator contracts–liabilities (23,770) – (23,770)Currency forward contracts–
liabilities – (395,007) – (395,007)Swap contracts–liabilities – (60,818) – (60,818)
134,880,498 77,211,788 – 212,092,286
Transfers between levels
During the periods ended June 30, 2015 and December 31,2014, there were no significant transfers between Level 1and Level 2.
3. Offsetting of financial assets and liabilities (note 2)
The following table presents offsetting of financial assetsand liabilities and collateral amounts that would occur iffuture events, such as bankruptcy or termination ofcontracts were to arise. No amounts were offset in thefinancial statements.
June 30, 2015
Financial assets – by type
Gross amountof assets
($)
Master nettingoffset
($)
Collateralpledged
($)Net Amount
($)
Currency forward contracts 1,119 – – 1,119Options contracts – OTC – – – –Swap contracts – – – –
1,119 – – 1,119
Financial liabilities – by type
Gross amountof liabilities
($)
Master nettingoffset
($)
Collateralpledged
($)Net Amount
($)
Currency forward contracts – – – –Options contracts – OTC 65,761 – – 65,761Swap contracts 257,285 – – 257,285
323,046 – – 323,046
The accompanying notes are an integral part of the financial statements.
84

Scotia Income Advantage Fund (Unaudited – Continued)
FUND SPECIFIC NOTESFor the periods indicated in Note 1.
December 31, 2014
Financial assets – by type
Gross amountof assets
($)
Master nettingoffset
($)
Collateralpledged
($)Net Amount
($)
Currency forward contracts 42,959 (35,860) – 7,099Options contracts – OTC – – – –Swap contracts – – – –
42,959 (35,860) – 7,099
Financial liabilities – by type
Gross amountof liabilities
($)
Master nettingoffset
($)
Collateralpledged
($)Net Amount
($)
Currency forward contracts 395,007 (35,860) – 359,147Options contracts – OTC – – – –Swap contracts 60,818 – – 60,818
455,825 (35,860) – 419,965
4. Interest in Underlying Funds (note 2)
The following tables provide information about the Fund’sinterest in Underlying Funds.
June 30, 2015
Underlying Fund
Net asset value ofUnderlying Fund
($)
Carrying value ofUnderlying Fund
($)
Carrying value ofUnderlying Fundas a percentage
of net assets(%)
Dynamic High Yield BondFund Series O 833,989,452 $ 6,261,426 2.7
Dynamic Alternative YieldFund Series O 1,541,430,083 8,268,977 3.5
Dynamic Premium YieldFund Series O 673,834,820 617,868 0.3
15,148,271 6.5
December 31, 2014
Underlying Fund
Net asset value ofUnderlying Fund
($)
Carrying value ofUnderlying Fund
($)
Carrying value ofUnderlying Fundas a percentage
of net assets(%)
Dynamic High Yield BondFund Series O 849,677,494 5,328,859 2.3
Dynamic Alternative YieldFund Series O 1,092,406,574 7,741,323 3.3
13,070,182 5.6
5. Comparison of net asset value per unit and netassets per unit (note 2)
The table below provides a comparison of the net assetvalue per unit and net assets per unit. The primary reasonfor the difference between the net asset value per unit andnet assets per unit, if any, is described in note 2.
June 30, 2015 December 31, 2014
Net asset valueper unit
($)
Net assetsper unit
($)
Net asset valueper unit
($)
Net assetsper unit
($)
Series A 11.19 11.19 11.12 11.12
Series M 11.24 11.24 11.11 11.11
The accompanying notes are an integral part of the financial statements.
85
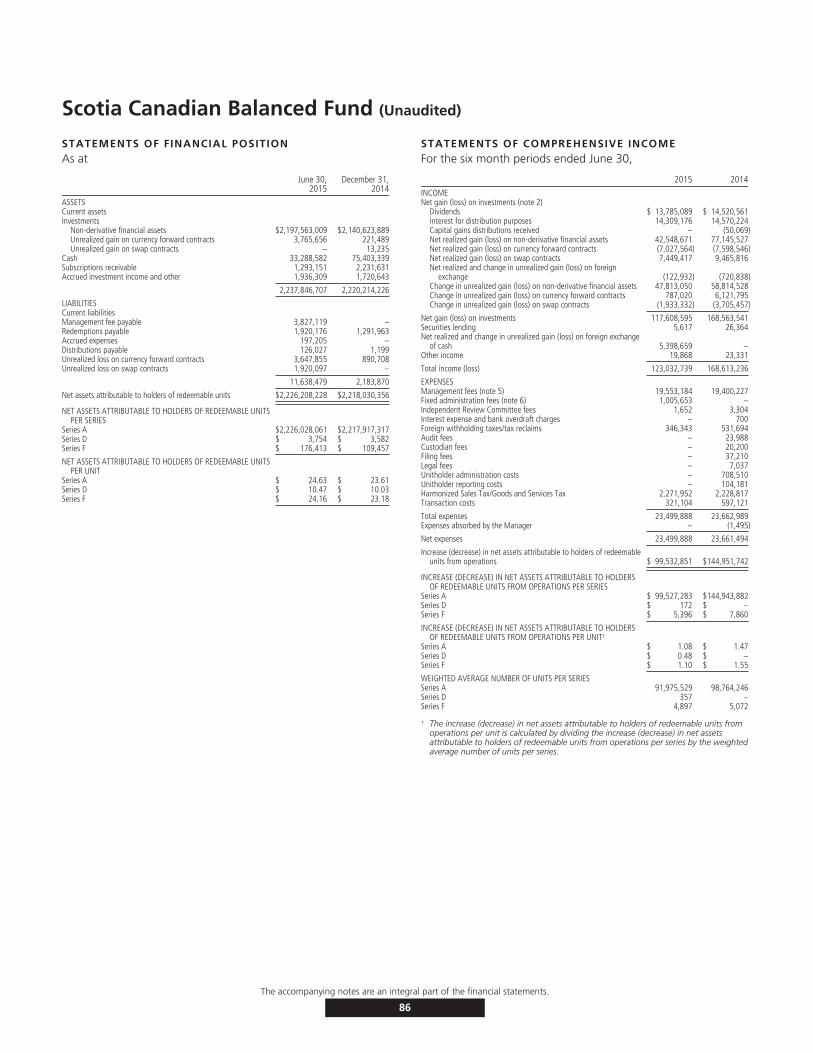
Scotia Canadian Balanced Fund (Unaudited)
STATEMENTS OF FINANCIAL POSITIONAs at
June 30,2015
December 31,2014
ASSETSCurrent assetsInvestments
Non-derivative financial assets $2,197,563,009 $2,140,623,889Unrealized gain on currency forward contracts 3,765,656 221,489Unrealized gain on swap contracts – 13,235
Cash 33,288,582 75,403,339Subscriptions receivable 1,293,151 2,231,631Accrued investment income and other 1,936,309 1,720,643
2,237,846,707 2,220,214,226
LIABILITIESCurrent liabilitiesManagement fee payable 3,827,119 –Redemptions payable 1,920,176 1,291,963Accrued expenses 197,205 –Distributions payable 126,027 1,199Unrealized loss on currency forward contracts 3,647,855 890,708Unrealized loss on swap contracts 1,920,097 –
11,638,479 2,183,870
Net assets attributable to holders of redeemable units $2,226,208,228 $2,218,030,356
NET ASSETS ATTRIBUTABLE TO HOLDERS OF REDEEMABLE UNITSPER SERIES
Series A $2,226,028,061 $2,217,917,317Series D $ 3,754 $ 3,582Series F $ 176,413 $ 109,457
NET ASSETS ATTRIBUTABLE TO HOLDERS OF REDEEMABLE UNITSPER UNIT
Series A $ 24.63 $ 23.61Series D $ 10.47 $ 10.03Series F $ 24.16 $ 23.18
STATEMENTS OF COMPREHENSIVE INCOMEFor the six month periods ended June 30,
2015 2014INCOMENet gain (loss) on investments (note 2)
Dividends $ 13,785,089 $ 14,520,561Interest for distribution purposes 14,309,176 14,570,224Capital gains distributions received – (50,069)Net realized gain (loss) on non-derivative financial assets 42,548,671 77,145,527Net realized gain (loss) on currency forward contracts (7,027,564) (7,598,546)Net realized gain (loss) on swap contracts 7,449,417 9,465,816Net realized and change in unrealized gain (loss) on foreign
exchange (122,932) (720,838)Change in unrealized gain (loss) on non-derivative financial assets 47,813,050 58,814,528Change in unrealized gain (loss) on currency forward contracts 787,020 6,121,795Change in unrealized gain (loss) on swap contracts (1,933,332) (3,705,457)
Net gain (loss) on investments 117,608,595 168,563,541Securities lending 5,617 26,364Net realized and change in unrealized gain (loss) on foreign exchange
of cash 5,398,659 –Other income 19,868 23,331
Total income (loss) 123,032,739 168,613,236
EXPENSESManagement fees (note 5) 19,553,184 19,400,227Fixed administration fees (note 6) 1,005,653 –Independent Review Committee fees 1,652 3,304Interest expense and bank overdraft charges – 700Foreign withholding taxes/tax reclaims 346,343 531,694Audit fees – 23,988Custodian fees – 20,200Filing fees – 37,210Legal fees – 7,037Unitholder administration costs – 708,510Unitholder reporting costs – 104,181Harmonized Sales Tax/Goods and Services Tax 2,271,952 2,228,817Transaction costs 321,104 597,121
Total expenses 23,499,888 23,662,989Expenses absorbed by the Manager – (1,495)
Net expenses 23,499,888 23,661,494
Increase (decrease) in net assets attributable to holders of redeemableunits from operations $ 99,532,851 $144,951,742
INCREASE (DECREASE) IN NET ASSETS ATTRIBUTABLE TO HOLDERSOF REDEEMABLE UNITS FROM OPERATIONS PER SERIES
Series A $ 99,527,283 $144,943,882Series D $ 172 $ –Series F $ 5,396 $ 7,860
INCREASE (DECREASE) IN NET ASSETS ATTRIBUTABLE TO HOLDERSOF REDEEMABLE UNITS FROM OPERATIONS PER UNIT†
Series A $ 1.08 $ 1.47Series D $ 0.48 $ –Series F $ 1.10 $ 1.55
WEIGHTED AVERAGE NUMBER OF UNITS PER SERIESSeries A 91,975,529 98,764,246Series D 357 –Series F 4,897 5,072
† The increase (decrease) in net assets attributable to holders of redeemable units fromoperations per unit is calculated by dividing the increase (decrease) in net assetsattributable to holders of redeemable units from operations per series by the weightedaverage number of units per series.
The accompanying notes are an integral part of the financial statements.
86
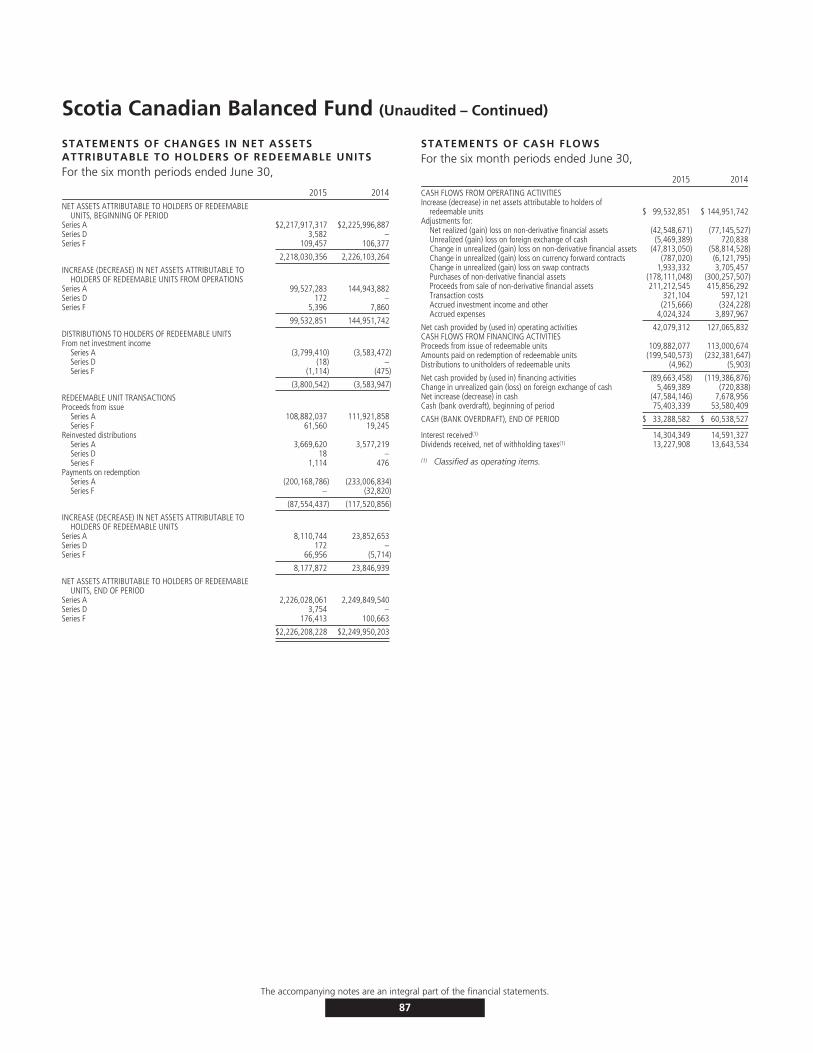
Scotia Canadian Balanced Fund (Unaudited – Continued)
STATEMENTS OF CHANGES IN NET ASSETSATTRIBUTABLE TO HOLDERS OF REDEEMABLE UNITSFor the six month periods ended June 30,
2015 2014NET ASSETS ATTRIBUTABLE TO HOLDERS OF REDEEMABLE
UNITS, BEGINNING OF PERIODSeries A $2,217,917,317 $2,225,996,887Series D 3,582 –Series F 109,457 106,377
2,218,030,356 2,226,103,264
INCREASE (DECREASE) IN NET ASSETS ATTRIBUTABLE TOHOLDERS OF REDEEMABLE UNITS FROM OPERATIONS
Series A 99,527,283 144,943,882Series D 172 –Series F 5,396 7,860
99,532,851 144,951,742
DISTRIBUTIONS TO HOLDERS OF REDEEMABLE UNITSFrom net investment income
Series A (3,799,410) (3,583,472)Series D (18) –Series F (1,114) (475)
(3,800,542) (3,583,947)
REDEEMABLE UNIT TRANSACTIONSProceeds from issue
Series A 108,882,037 111,921,858Series F 61,560 19,245
Reinvested distributionsSeries A 3,669,620 3,577,219Series D 18 –Series F 1,114 476
Payments on redemptionSeries A (200,168,786) (233,006,834)Series F – (32,820)
(87,554,437) (117,520,856)
INCREASE (DECREASE) IN NET ASSETS ATTRIBUTABLE TOHOLDERS OF REDEEMABLE UNITS
Series A 8,110,744 23,852,653Series D 172 –Series F 66,956 (5,714)
8,177,872 23,846,939
NET ASSETS ATTRIBUTABLE TO HOLDERS OF REDEEMABLEUNITS, END OF PERIOD
Series A 2,226,028,061 2,249,849,540Series D 3,754 –Series F 176,413 100,663
$2,226,208,228 $2,249,950,203
STATEMENTS OF CASH FLOWSFor the six month periods ended June 30,
2015 2014CASH FLOWS FROM OPERATING ACTIVITIESIncrease (decrease) in net assets attributable to holders of
redeemable units $ 99,532,851 $ 144,951,742Adjustments for:
Net realized (gain) loss on non-derivative financial assets (42,548,671) (77,145,527)Unrealized (gain) loss on foreign exchange of cash (5,469,389) 720,838Change in unrealized (gain) loss on non-derivative financial assets (47,813,050) (58,814,528)Change in unrealized (gain) loss on currency forward contracts (787,020) (6,121,795)Change in unrealized (gain) loss on swap contracts 1,933,332 3,705,457Purchases of non-derivative financial assets (178,111,048) (300,257,507)Proceeds from sale of non-derivative financial assets 211,212,545 415,856,292Transaction costs 321,104 597,121Accrued investment income and other (215,666) (324,228)Accrued expenses 4,024,324 3,897,967
Net cash provided by (used in) operating activities 42,079,312 127,065,832CASH FLOWS FROM FINANCING ACTIVITIESProceeds from issue of redeemable units 109,882,077 113,000,674Amounts paid on redemption of redeemable units (199,540,573) (232,381,647)Distributions to unitholders of redeemable units (4,962) (5,903)
Net cash provided by (used in) financing activities (89,663,458) (119,386,876)Change in unrealized gain (loss) on foreign exchange of cash 5,469,389 (720,838)Net increase (decrease) in cash (47,584,146) 7,678,956Cash (bank overdraft), beginning of period 75,403,339 53,580,409
CASH (BANK OVERDRAFT), END OF PERIOD $ 33,288,582 $ 60,538,527
Interest received(1) 14,304,349 14,591,327Dividends received, net of withholding taxes(1) 13,227,908 13,643,534
(1) Classified as operating items.
The accompanying notes are an integral part of the financial statements.
87

Scotia Canadian Balanced Fund (Unaudited – Continued)
SCHEDULE OF INVESTMENT PORTFOLIOAs at June 30, 2015
Numberof Shares Issuer
AverageCost ($)
CarryingValue ($)
EQUITIES – 63.0%Energy – 8.3%
5,810,600 Canadian Energy Services & Technology Corporation 31,112,099 41,836,320434,800 Canadian Natural Resources Ltd. 18,335,178 14,739,720477,970 Enbridge Inc. 15,003,676 27,918,228737,800 Paramount Resources Ltd. 22,967,360 21,174,860569,000 PrairieSky Royalty Ltd. 15,572,906 17,929,190514,900 Suncor Energy, Inc. 23,943,528 17,712,560841,140 TransCanada Corporation 34,339,181 42,696,266
161,273,928 184,007,144
Materials – 2.0%207,400 Franco-Nevada Corporation 13,324,949 12,354,818471,800 West Fraser Timber Co., Ltd. 23,935,257 32,379,634
37,260,206 44,734,452
Industrials – 6.0%752,900 Canadian National Railway Company 29,878,076 54,253,97470,400 Canadian Pacific Railway Limited 15,584,294 14,081,408
515,800 Danaher Corporation 31,854,266 55,112,206315,000 Progressive Waste Solutions Ltd. 11,328,217 10,552,500
88,644,853 134,000,088
Consumer Discretionary – 9.0%524,300 Dollarama Inc. 14,661,291 39,689,510292,600 Hudson’s Bay Company 7,637,795 8,119,650783,205 Magna International Inc. 24,001,612 54,902,671423,224 Restaurant Brands International Inc. 19,897,869 20,207,893
676 Restaurant Brands International Limited Partnership 27,885 30,589311,700 Starwood Hotels & Resorts Worldwide, Inc. 16,570,377 31,568,253327,900 Walt Disney Company, The 16,734,785 46,727,603
99,531,614 201,246,169
Consumer Staples – 3.7%601,900 Coca-Cola Company, The 23,440,443 29,479,696827,400 Loblaw Companies Limited 40,135,572 52,192,392
63,576,015 81,672,088
Number ofSharesNumberof Units Issuer
AverageCost ($)
CarryingValue ($)
EQUITIES (cont’d)Health Care – 4.5%
361,000 Valeant Pharmaceuticals International, Inc. 44,090,504 100,022,270
Financials – 18.9%693,400 American International Group, Inc. 35,224,449 53,537,647966,300 Bank of Nova Scotia, The 51,927,264 62,297,361
1,009,900 Citigroup Inc. 40,485,983 69,675,2421,960,700 Element Financial Corp. Subscription Receipts 33,331,900 38,527,7551,933,900 Manulife Financial Corporation 41,812,678 44,885,819
994,400 Royal Bank of Canada 48,533,216 75,952,2721,425,200 Toronto-Dominion Bank, The 52,906,332 75,592,608
304,221,822 420,468,704
Information Technology – 8.4%1,199,862 Davis + Henderson Income Corporation 46,760,167 47,898,491
103,884 Google Inc. Class C 42,577,335 67,534,2661,311,700 Microsoft Corporation 38,121,160 72,328,868
127,458,662 187,761,625
Telecommunication Services – 2.2%536,000 Rogers Communications, Inc., Class B 22,896,378 23,744,800575,200 TELUS Corporation 20,121,008 24,750,856
43,017,386 48,495,656
TOTAL EQUITIES 969,074,990 1,402,408,196
FIXED INCOME FUND – 35.7%58,063,808 Scotia Canadian Income Fund Series I 798,090,340 795,154,813
TOTAL INVESTMENT PORTFOLIO 1,767,165,330 2,197,563,009
Currency Forward Contracts – 0.0% 117,801Swap Contracts – (0.1%) (1,920,097)OTHER ASSETS, LESS LIABILITIES – 1.4% 30,447,515
NET ASSETS – 100.0% 2,226,208,228
CURRENCY FORWARD CONTRACTS
Settlement Date Currency To Be ReceivedContractual
Amount Currency To Be DeliveredContractual
AmountCanadian Value as at
June 30, 2015 ($)
Canadian ($)Appreciation/
(Depreciation)Jul. 16, 2015 Canadian Dollar 38,811,331 U.S. Dollar 32,182,000 40,213,425 (1,402,094)Jul. 16, 2015 Canadian Dollar 22,265,796 U.S. Dollar 18,418,000 23,014,445 (748,649)Jul. 16, 2015 U.S. Dollar 32,182,000 Canadian Dollar 39,305,293 39,286,545 907,293Jul. 16, 2015 U.S. Dollar 18,418,000 Canadian Dollar 22,485,542 22,474,817 528,418Aug. 20, 2015 Canadian Dollar 73,897,800 U.S. Dollar 60,000,000 75,026,259 (1,128,459)Aug. 20, 2015 Canadian Dollar 24,640,100 U.S. Dollar 20,000,000 25,008,753 (368,653)Aug. 20, 2015 U.S. Dollar 60,000,000 Canadian Dollar 73,288,620 73,202,696 1,734,544Aug. 20, 2015 U.S. Dollar 20,000,000 Canadian Dollar 24,412,300 24,383,679 595,401
117,801
The currency forward contracts outstanding at June 30, 2015 are placed with a financial institution with a credit rating of A by Standard & Poor’s.
EQUITY SWAP CONTRACTS
Number of Units Termination DateNotional
Amount ($)VariableRate %
Appreciation/(Depreciation) ($)
Blackstone Group, Variable 1 month USD – LIBOR, Counterparty: Toronto-Dominion Bank, The220,360 Dec. 4, 2015 9,651,768 0.63% (812,116)300,640 Dec. 7, 2015 13,168,032 0.63% (1,107,981)
(1,920,097)
The swap contracts outstanding at June 30, 2015 are placed with a financial institution with a minimum credit rating of AA- by Standard & Poor’s.
For equities, all common shares unless otherwise noted.The accompanying notes are an integral part of the financial statements.
88
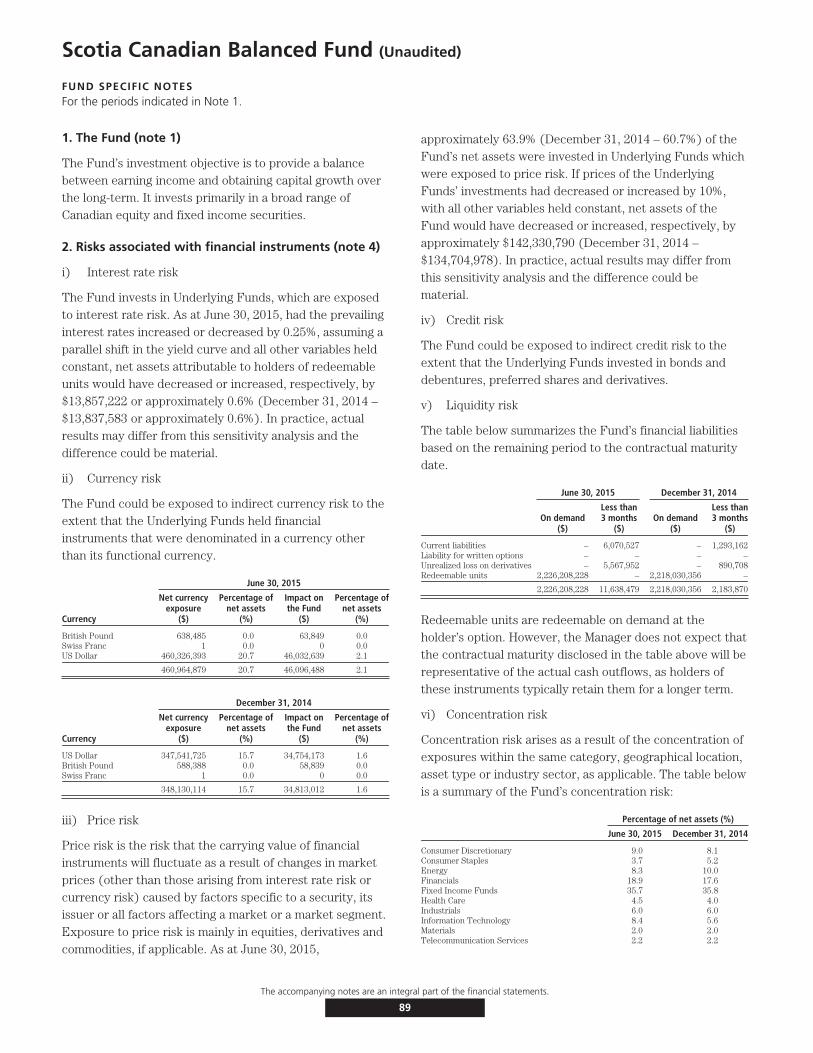
Scotia Canadian Balanced Fund (Unaudited)
FUND SPECIFIC NOTESFor the periods indicated in Note 1.
1. The Fund (note 1)
The Fund’s investment objective is to provide a balancebetween earning income and obtaining capital growth overthe long-term. It invests primarily in a broad range ofCanadian equity and fixed income securities.
2. Risks associated with financial instruments (note 4)
i) Interest rate risk
The Fund invests in Underlying Funds, which are exposedto interest rate risk. As at June 30, 2015, had the prevailinginterest rates increased or decreased by 0.25%, assuming aparallel shift in the yield curve and all other variables heldconstant, net assets attributable to holders of redeemableunits would have decreased or increased, respectively, by$13,857,222 or approximately 0.6% (December 31, 2014 –$13,837,583 or approximately 0.6%). In practice, actualresults may differ from this sensitivity analysis and thedifference could be material.
ii) Currency risk
The Fund could be exposed to indirect currency risk to theextent that the Underlying Funds held financialinstruments that were denominated in a currency otherthan its functional currency.
June 30, 2015
Currency
Net currencyexposure
($)
Percentage ofnet assets
(%)
Impact onthe Fund
($)
Percentage ofnet assets
(%)
British Pound 638,485 0.0 63,849 0.0Swiss Franc 1 0.0 0 0.0US Dollar 460,326,393 20.7 46,032,639 2.1
460,964,879 20.7 46,096,488 2.1
December 31, 2014
Currency
Net currencyexposure
($)
Percentage ofnet assets
(%)
Impact onthe Fund
($)
Percentage ofnet assets
(%)
US Dollar 347,541,725 15.7 34,754,173 1.6British Pound 588,388 0.0 58,839 0.0Swiss Franc 1 0.0 0 0.0
348,130,114 15.7 34,813,012 1.6
iii) Price risk
Price risk is the risk that the carrying value of financialinstruments will fluctuate as a result of changes in marketprices (other than those arising from interest rate risk orcurrency risk) caused by factors specific to a security, itsissuer or all factors affecting a market or a market segment.Exposure to price risk is mainly in equities, derivatives andcommodities, if applicable. As at June 30, 2015,
approximately 63.9% (December 31, 2014 – 60.7%) of theFund’s net assets were invested in Underlying Funds whichwere exposed to price risk. If prices of the UnderlyingFunds’ investments had decreased or increased by 10%,with all other variables held constant, net assets of theFund would have decreased or increased, respectively, byapproximately $142,330,790 (December 31, 2014 –$134,704,978). In practice, actual results may differ fromthis sensitivity analysis and the difference could bematerial.
iv) Credit risk
The Fund could be exposed to indirect credit risk to theextent that the Underlying Funds invested in bonds anddebentures, preferred shares and derivatives.
v) Liquidity risk
The table below summarizes the Fund’s financial liabilitiesbased on the remaining period to the contractual maturitydate.
June 30, 2015 December 31, 2014
On demand($)
Less than3 months
($)On demand
($)
Less than3 months
($)
Current liabilities – 6,070,527 – 1,293,162Liability for written options – – – –Unrealized loss on derivatives – 5,567,952 – 890,708Redeemable units 2,226,208,228 – 2,218,030,356 –
2,226,208,228 11,638,479 2,218,030,356 2,183,870
Redeemable units are redeemable on demand at theholder’s option. However, the Manager does not expect thatthe contractual maturity disclosed in the table above will berepresentative of the actual cash outflows, as holders ofthese instruments typically retain them for a longer term.
vi) Concentration risk
Concentration risk arises as a result of the concentration ofexposures within the same category, geographical location,asset type or industry sector, as applicable. The table belowis a summary of the Fund’s concentration risk:
Percentage of net assets (%)
June 30, 2015 December 31, 2014
Consumer Discretionary 9.0 8.1Consumer Staples 3.7 5.2Energy 8.3 10.0Financials 18.9 17.6Fixed Income Funds 35.7 35.8Health Care 4.5 4.0Industrials 6.0 6.0Information Technology 8.4 5.6Materials 2.0 2.0Telecommunication Services 2.2 2.2
The accompanying notes are an integral part of the financial statements.
89
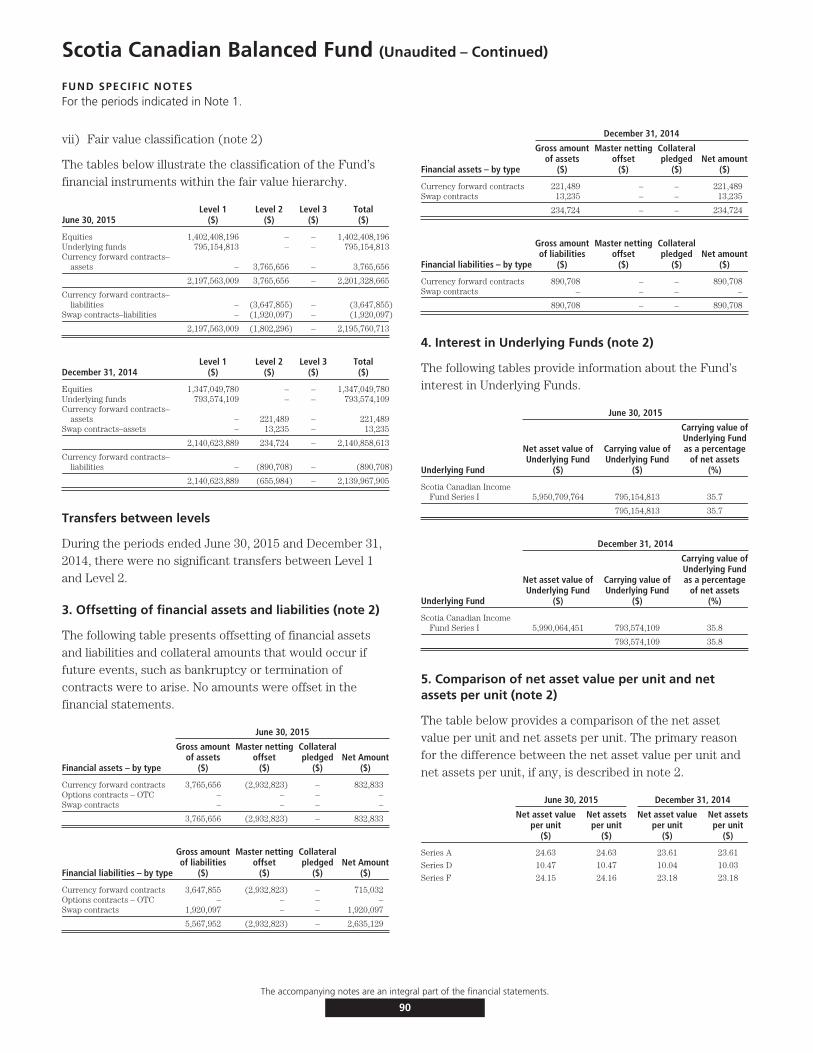
Scotia Canadian Balanced Fund (Unaudited – Continued)
FUND SPECIFIC NOTESFor the periods indicated in Note 1.
vii) Fair value classification (note 2)
The tables below illustrate the classification of the Fund’sfinancial instruments within the fair value hierarchy.
June 30, 2015Level 1
($)Level 2
($)Level 3
($)Total($)
Equities 1,402,408,196 – – 1,402,408,196Underlying funds 795,154,813 – – 795,154,813Currency forward contracts–
assets – 3,765,656 – 3,765,656
2,197,563,009 3,765,656 – 2,201,328,665
Currency forward contracts–liabilities – (3,647,855) – (3,647,855)
Swap contracts–liabilities – (1,920,097) – (1,920,097)
2,197,563,009 (1,802,296) – 2,195,760,713
December 31, 2014Level 1
($)Level 2
($)Level 3
($)Total($)
Equities 1,347,049,780 – – 1,347,049,780Underlying funds 793,574,109 – – 793,574,109Currency forward contracts–
assets – 221,489 – 221,489Swap contracts–assets – 13,235 – 13,235
2,140,623,889 234,724 – 2,140,858,613
Currency forward contracts–liabilities – (890,708) – (890,708)
2,140,623,889 (655,984) – 2,139,967,905
Transfers between levels
During the periods ended June 30, 2015 and December 31,2014, there were no significant transfers between Level 1and Level 2.
3. Offsetting of financial assets and liabilities (note 2)
The following table presents offsetting of financial assetsand liabilities and collateral amounts that would occur iffuture events, such as bankruptcy or termination ofcontracts were to arise. No amounts were offset in thefinancial statements.
June 30, 2015
Financial assets – by type
Gross amountof assets
($)
Master nettingoffset
($)
Collateralpledged
($)Net Amount
($)
Currency forward contracts 3,765,656 (2,932,823) – 832,833Options contracts – OTC – – – –Swap contracts – – – –
3,765,656 (2,932,823) – 832,833
Financial liabilities – by type
Gross amountof liabilities
($)
Master nettingoffset
($)
Collateralpledged
($)Net Amount
($)
Currency forward contracts 3,647,855 (2,932,823) – 715,032Options contracts – OTC – – – –Swap contracts 1,920,097 – – 1,920,097
5,567,952 (2,932,823) – 2,635,129
December 31, 2014
Financial assets – by type
Gross amountof assets
($)
Master nettingoffset
($)
Collateralpledged
($)Net amount
($)
Currency forward contracts 221,489 – – 221,489Swap contracts 13,235 – – 13,235
234,724 – – 234,724
Financial liabilities – by type
Gross amountof liabilities
($)
Master nettingoffset
($)
Collateralpledged
($)Net amount
($)
Currency forward contracts 890,708 – – 890,708Swap contracts – – – –
890,708 – – 890,708
4. Interest in Underlying Funds (note 2)
The following tables provide information about the Fund’sinterest in Underlying Funds.
June 30, 2015
Underlying Fund
Net asset value ofUnderlying Fund
($)
Carrying value ofUnderlying Fund
($)
Carrying value ofUnderlying Fundas a percentage
of net assets(%)
Scotia Canadian IncomeFund Series I 5,950,709,764 795,154,813 35.7
795,154,813 35.7
December 31, 2014
Underlying Fund
Net asset value ofUnderlying Fund
($)
Carrying value ofUnderlying Fund
($)
Carrying value ofUnderlying Fundas a percentage
of net assets(%)
Scotia Canadian IncomeFund Series I 5,990,064,451 793,574,109 35.8
793,574,109 35.8
5. Comparison of net asset value per unit and netassets per unit (note 2)
The table below provides a comparison of the net assetvalue per unit and net assets per unit. The primary reasonfor the difference between the net asset value per unit andnet assets per unit, if any, is described in note 2.
June 30, 2015 December 31, 2014
Net asset valueper unit
($)
Net assetsper unit
($)
Net asset valueper unit
($)
Net assetsper unit
($)
Series A 24.63 24.63 23.61 23.61
Series D 10.47 10.47 10.04 10.03
Series F 24.15 24.16 23.18 23.18
The accompanying notes are an integral part of the financial statements.
90

Scotia Dividend Balanced Fund (Unaudited)
STATEMENTS OF FINANCIAL POSITIONAs at
June 30,2015
December 31,2014
ASSETSCurrent assetsInvestments
Non-derivative financial assets $329,057,403 $332,864,969Unrealized gain on currency forward contracts 66,658 2,584
Cash 14,849,302 21,722,830Receivable for securities sold 5,466,747 107,735Subscriptions receivable 334,649 645,049Accrued investment income and other 616,859 578,443
350,391,618 355,921,610
LIABILITIESCurrent liabilitiesManagement fee payable 563,543 –Payable for securities purchased 1,770,013 4,052,340Redemptions payable 284,475 964,276Accrued expenses 27,383 –Distributions payable – 24Unrealized loss on currency forward contracts 512,160 378,110
3,157,574 5,394,750
Net assets attributable to holders of redeemable units $347,234,044 $350,526,860
NET ASSETS ATTRIBUTABLE TO HOLDERS OF REDEEMABLE UNITSPER SERIES
Series A $347,170,067 $350,526,860Series D $ 63,977 $ –
NET ASSETS ATTRIBUTABLE TO HOLDERS OF REDEEMABLE UNITSPER UNIT
Series A $ 12.48 $ 12.25Series D $ 10.28 $ –
STATEMENTS OF COMPREHENSIVE INCOMEFor the six month periods ended June 30,
2015 2014INCOMENet gain (loss) on investments (note 2)
Dividends $ 3,582,266 $ 2,370,960Interest for distribution purposes 803,783 877,230Capital gains distributions received – 20,488Net realized gain (loss) on non-derivative financial assets 10,014,285 18,360,915Net realized gain (loss) on currency forward contracts (1,215,764) (879,801)Net realized and change in unrealized gain (loss) on foreign exchange 96,982 264,819Change in unrealized gain (loss) on non-derivative financial assets (3,741,834) 10,707,294Change in unrealized gain (loss) on currency forward contracts (69,976) 556,260
Net gain (loss) on investments 9,469,742 32,278,165Securities lending 40,924 12,700Net realized and change in unrealized gain (loss) on foreign exchange of
cash 844,788 –Other income 2,829 4,726
Total income (loss) 10,358,283 32,295,591
EXPENSESManagement fees (note 5) 2,899,798 2,227,563Fixed administration fees (note 6) 140,604 –Independent Review Committee fees 260 400Interest expense and bank overdraft charges 199 793Foreign withholding taxes/tax reclaims 101,677 48,682Audit fees – 2,894Custodian fees – 2,984Filing fees – 10,372Legal fees – 865Unitholder administration costs – 50,091Unitholder reporting costs – 9,219Harmonized Sales Tax/Goods and Services Tax 323,835 241,248Transaction costs 316,628 294,294
Total expenses 3,783,001 2,889,405
Increase (decrease) in net assets attributable to holders of redeemableunits from operations $ 6,575,282 $29,406,186
INCREASE (DECREASE) IN NET ASSETS ATTRIBUTABLE TO HOLDERS OFREDEEMABLE UNITS FROM OPERATIONS PER SERIES
Series A $ 6,576,153 $29,406,186Series D $ (871) $ –
INCREASE (DECREASE) IN NET ASSETS ATTRIBUTABLE TO HOLDERS OFREDEEMABLE UNITS FROM OPERATIONS PER UNIT†
Series A $ 0.23 $ 1.42Series D $ (0.19) $ –
WEIGHTED AVERAGE NUMBER OF UNITS PER SERIESSeries A 28,316,503 20,682,010Series D 4,619 –
† The increase (decrease) in net assets attributable to holders of redeemable units fromoperations per unit is calculated by dividing the increase (decrease) in net assetsattributable to holders of redeemable units from operations per series by the weightedaverage number of units per series.
The accompanying notes are an integral part of the financial statements.
91
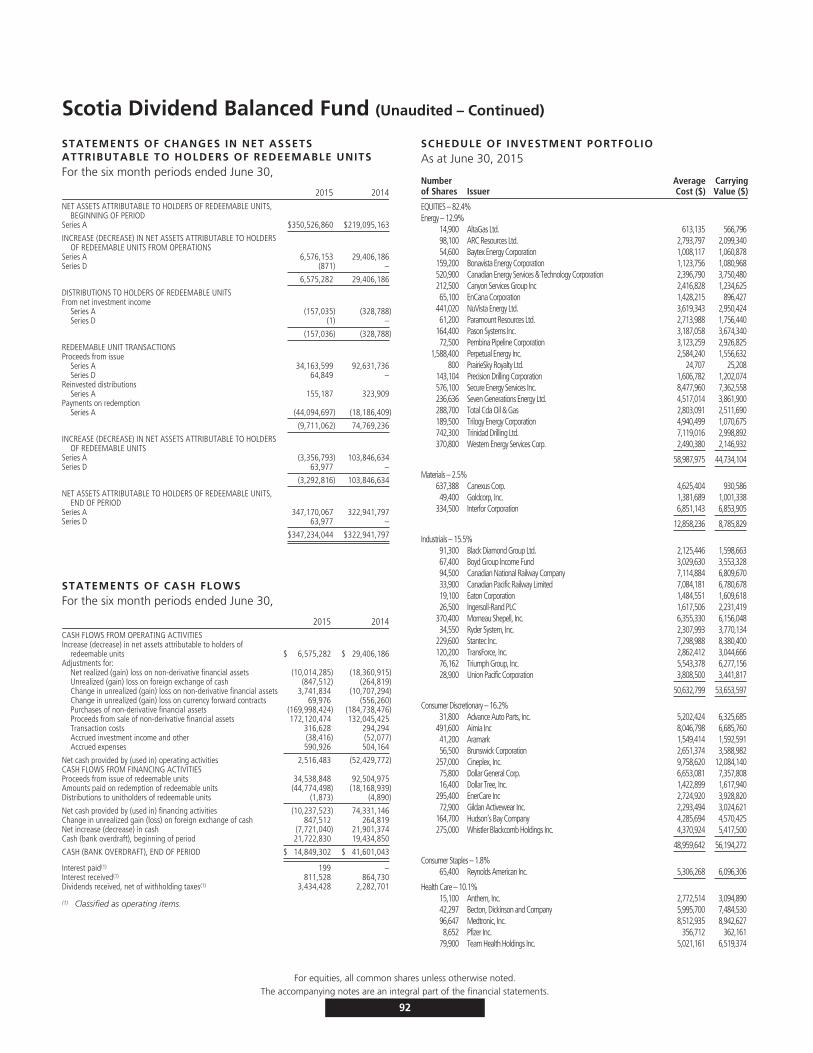
Scotia Dividend Balanced Fund (Unaudited – Continued)
STATEMENTS OF CHANGES IN NET ASSETSATTRIBUTABLE TO HOLDERS OF REDEEMABLE UNITSFor the six month periods ended June 30,
2015 2014NET ASSETS ATTRIBUTABLE TO HOLDERS OF REDEEMABLE UNITS,
BEGINNING OF PERIODSeries A $350,526,860 $219,095,163
INCREASE (DECREASE) IN NET ASSETS ATTRIBUTABLE TO HOLDERSOF REDEEMABLE UNITS FROM OPERATIONS
Series A 6,576,153 29,406,186Series D (871) –
6,575,282 29,406,186
DISTRIBUTIONS TO HOLDERS OF REDEEMABLE UNITSFrom net investment income
Series A (157,035) (328,788)Series D (1) –
(157,036) (328,788)
REDEEMABLE UNIT TRANSACTIONSProceeds from issue
Series A 34,163,599 92,631,736Series D 64,849 –
Reinvested distributionsSeries A 155,187 323,909
Payments on redemptionSeries A (44,094,697) (18,186,409)
(9,711,062) 74,769,236
INCREASE (DECREASE) IN NET ASSETS ATTRIBUTABLE TO HOLDERSOF REDEEMABLE UNITS
Series A (3,356,793) 103,846,634Series D 63,977 –
(3,292,816) 103,846,634
NET ASSETS ATTRIBUTABLE TO HOLDERS OF REDEEMABLE UNITS,END OF PERIOD
Series A 347,170,067 322,941,797Series D 63,977 –
$347,234,044 $322,941,797
STATEMENTS OF CASH FLOWSFor the six month periods ended June 30,
2015 2014CASH FLOWS FROM OPERATING ACTIVITIESIncrease (decrease) in net assets attributable to holders of
redeemable units $ 6,575,282 $ 29,406,186Adjustments for:
Net realized (gain) loss on non-derivative financial assets (10,014,285) (18,360,915)Unrealized (gain) loss on foreign exchange of cash (847,512) (264,819)Change in unrealized (gain) loss on non-derivative financial assets 3,741,834 (10,707,294)Change in unrealized (gain) loss on currency forward contracts 69,976 (556,260)Purchases of non-derivative financial assets (169,998,424) (184,738,476)Proceeds from sale of non-derivative financial assets 172,120,474 132,045,425Transaction costs 316,628 294,294Accrued investment income and other (38,416) (52,077)Accrued expenses 590,926 504,164
Net cash provided by (used in) operating activities 2,516,483 (52,429,772)CASH FLOWS FROM FINANCING ACTIVITIESProceeds from issue of redeemable units 34,538,848 92,504,975Amounts paid on redemption of redeemable units (44,774,498) (18,168,939)Distributions to unitholders of redeemable units (1,873) (4,890)
Net cash provided by (used in) financing activities (10,237,523) 74,331,146Change in unrealized gain (loss) on foreign exchange of cash 847,512 264,819Net increase (decrease) in cash (7,721,040) 21,901,374Cash (bank overdraft), beginning of period 21,722,830 19,434,850
CASH (BANK OVERDRAFT), END OF PERIOD $ 14,849,302 $ 41,601,043
Interest paid(1) 199 –Interest received(1) 811,528 864,730Dividends received, net of withholding taxes(1) 3,434,428 2,282,701
(1) Classified as operating items.
SCHEDULE OF INVESTMENT PORTFOLIOAs at June 30, 2015
Numberof Shares Issuer
AverageCost ($)
CarryingValue ($)
EQUITIES – 82.4%Energy – 12.9%
14,900 AltaGas Ltd. 613,135 566,79698,100 ARC Resources Ltd. 2,793,797 2,099,34054,600 Baytex Energy Corporation 1,008,117 1,060,878
159,200 Bonavista Energy Corporation 1,123,756 1,080,968520,900 Canadian Energy Services & Technology Corporation 2,396,790 3,750,480212,500 Canyon Services Group Inc 2,416,828 1,234,62565,100 EnCana Corporation 1,428,215 896,427
441,020 NuVista Energy Ltd. 3,619,343 2,950,42461,200 Paramount Resources Ltd. 2,713,988 1,756,440
164,400 Pason Systems Inc. 3,187,058 3,674,34072,500 Pembina Pipeline Corporation 3,123,259 2,926,825
1,588,400 Perpetual Energy Inc. 2,584,240 1,556,632800 PrairieSky Royalty Ltd. 24,707 25,208
143,104 Precision Drilling Corporation 1,606,782 1,202,074576,100 Secure Energy Services Inc. 8,477,960 7,362,558236,636 Seven Generations Energy Ltd. 4,517,014 3,861,900288,700 Total Cda Oil & Gas 2,803,091 2,511,690189,500 Trilogy Energy Corporation 4,940,499 1,070,675742,300 Trinidad Drilling Ltd. 7,119,016 2,998,892370,800 Western Energy Services Corp. 2,490,380 2,146,932
58,987,975 44,734,104
Materials – 2.5%637,388 Canexus Corp. 4,625,404 930,58649,400 Goldcorp, Inc. 1,381,689 1,001,338
334,500 Interfor Corporation 6,851,143 6,853,905
12,858,236 8,785,829
Industrials – 15.5%91,300 Black Diamond Group Ltd. 2,125,446 1,598,66367,400 Boyd Group Income Fund 3,029,630 3,553,32894,500 Canadian National Railway Company 7,114,884 6,809,67033,900 Canadian Pacific Railway Limited 7,084,181 6,780,67819,100 Eaton Corporation 1,484,551 1,609,61826,500 Ingersoll-Rand PLC 1,617,506 2,231,419
370,400 Morneau Shepell, Inc. 6,355,330 6,156,04834,550 Ryder System, Inc. 2,307,993 3,770,134
229,600 Stantec Inc. 7,298,988 8,380,400120,200 TransForce, Inc. 2,862,412 3,044,66676,162 Triumph Group, Inc. 5,543,378 6,277,15628,900 Union Pacific Corporation 3,808,500 3,441,817
50,632,799 53,653,597
Consumer Discretionary – 16.2%31,800 Advance Auto Parts, Inc. 5,202,424 6,325,685
491,600 Aimia Inc 8,046,798 6,685,76041,200 Aramark 1,549,414 1,592,59156,500 Brunswick Corporation 2,651,374 3,588,982
257,000 Cineplex, Inc. 9,758,620 12,084,14075,800 Dollar General Corp. 6,653,081 7,357,80816,400 Dollar Tree, Inc. 1,422,899 1,617,940
295,400 EnerCare Inc 2,724,920 3,928,82072,900 Gildan Activewear Inc. 2,293,494 3,024,621
164,700 Hudson’s Bay Company 4,285,694 4,570,425275,000 Whistler Blackcomb Holdings Inc. 4,370,924 5,417,500
48,959,642 56,194,272
Consumer Staples – 1.8%65,400 Reynolds American Inc. 5,306,268 6,096,306
Health Care – 10.1%15,100 Anthem, Inc. 2,772,514 3,094,89042,297 Becton, Dickinson and Company 5,995,700 7,484,53096,647 Medtronic, Inc. 8,512,935 8,942,6278,652 Pfizer Inc. 356,712 362,161
79,900 Team Health Holdings Inc. 5,021,161 6,519,374
The accompanying notes are an integral part of the financial statements.
92
For equities, all common shares unless otherwise noted.

Scotia Dividend Balanced Fund (Unaudited – Continued)
SCHEDULE OF INVESTMENT PORTFOLIO
Numberof Shares Issuer
AverageCost ($)
CarryingValue ($)
EQUITIES (cont’d)Health Care (cont’d)
27,200 Universal Health Services, Inc., Class B 3,308,956 4,827,35728,200 Zimmer Biomet Holdings Inc. 3,073,256 3,836,745
29,041,234 35,067,684
Financials – 18.8%424,317 Altus Group Ltd. 8,603,244 7,552,84315,900 American Express Company 1,647,515 1,543,39295,300 Bank of Nova Scotia, The 6,206,082 6,143,991
849,400 Canaccord Financial Inc. 6,264,486 6,608,33233,000 Canadian Imperial Bank of Commerce 3,159,014 3,038,310
111,500 CI Financial Corporation 3,681,723 3,746,40032,385 Colliers International Group Inc. 699,472 1,548,00388,800 Discover Financial Services 6,208,300 6,388,804
465,300 Fiera Sceptre Inc. 5,494,278 5,765,06730,085 FirstService Corporation 310,104 1,044,551
154,900 Gluskin Sheff + Associates Inc. 4,242,331 3,887,990121,700 Industrial Alliance Insurance and Financial Services Inc. 5,337,117 5,112,617324,000 Manulife Financial Corporation 7,025,586 7,520,04039,300 Royal Bank of Canada 3,122,654 3,001,73455,600 Toronto-Dominion Bank, The 3,004,710 2,949,024
65,006,616 65,851,098
Numberof Shares Issuer
AverageCost ($)
CarryingValue ($)
EQUITIES (cont’d)Information Technology – 3.6%
91,821 Davis + Henderson Income Corporation 3,484,607 3,665,49461,000 Intel Corporation 2,395,070 2,317,20367,600 Open Text Corporation 4,148,628 3,429,34836,738 SAP AG ADR 3,090,403 3,222,438
13,118,708 12,634,483
Telecommunication Services – 1.0%79,616 Rogers Communications, Inc., Class B 3,402,503 3,526,989
TOTAL EQUITIES 287,313,981 286,544,362
Fixed Income Funds – 12.2%2,359,415 Scotia Canadian Income Fund Series I 31,835,120 32,311,004
932,510 Scotia Private Canadian Corporate Bond Pool Series I 9,799,648 10,202,037
41,634,768 42,513,041
TOTAL INVESTMENT PORTFOLIO 328,948,749 329,057,403
Currency Forward Contracts – (0.1%) (445,502)OTHER ASSETS, LESS LIABILITIES – 5.5% 18,622,143
NET ASSETS – 100.0% 347,234,044
CURRENCY FORWARD CONTRACTS
Settlement Date Currency To Be ReceivedContractual
Amount Currency To Be DeliveredContractual
AmountCanadian Value as at
June 30, 2015 ($)
Canadian ($)Appreciation/
(Depreciation)Jul 16, 2015 Canadian Dollar 15,232,329 US Dollar 12,600,000 15,744,489 (512,160)Jul 16, 2015 US Dollar 3,800,000 Canadian Dollar 4,681,600 4,679,367 66,658
(445,502)
The currency forward contracts outstanding at June 30, 2015 are placed with a financial institution with a credit rating of A+ by Standard & Poor’s.
The accompanying notes are an integral part of the financial statements.
93
For equities, all common shares unless otherwise noted.
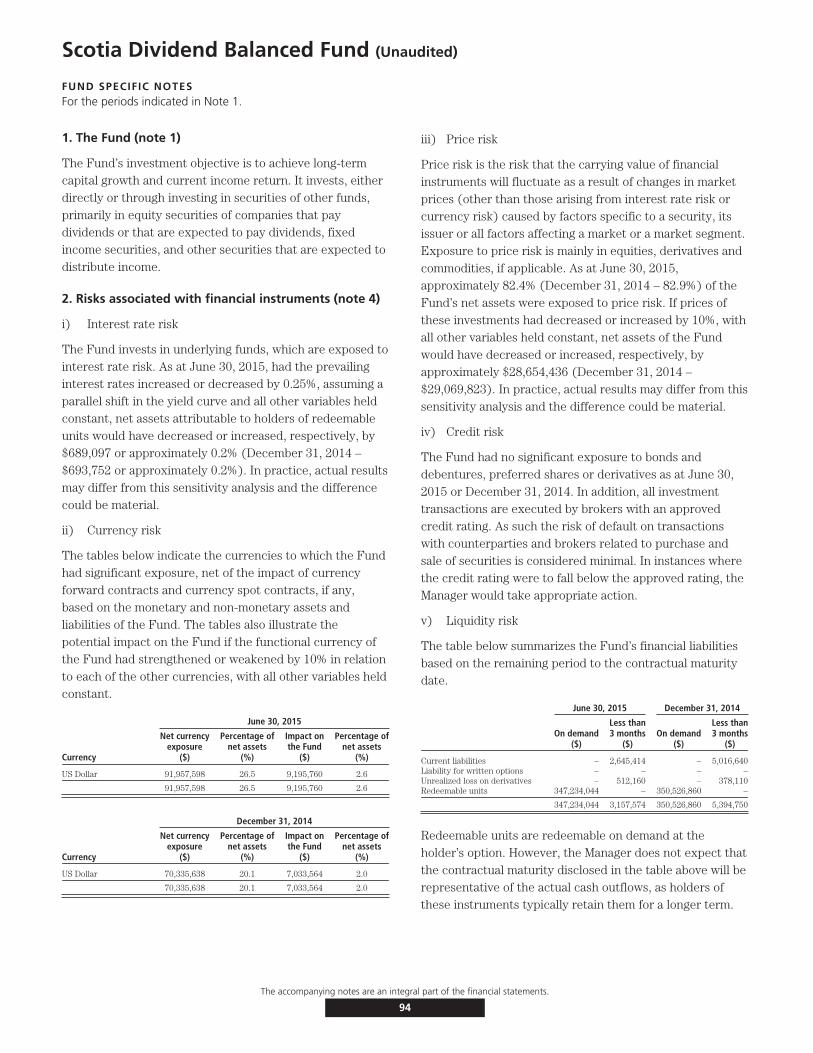
Scotia Dividend Balanced Fund (Unaudited)
FUND SPECIFIC NOTESFor the periods indicated in Note 1.
1. The Fund (note 1)
The Fund’s investment objective is to achieve long-termcapital growth and current income return. It invests, eitherdirectly or through investing in securities of other funds,primarily in equity securities of companies that paydividends or that are expected to pay dividends, fixedincome securities, and other securities that are expected todistribute income.
2. Risks associated with financial instruments (note 4)
i) Interest rate risk
The Fund invests in underlying funds, which are exposed tointerest rate risk. As at June 30, 2015, had the prevailinginterest rates increased or decreased by 0.25%, assuming aparallel shift in the yield curve and all other variables heldconstant, net assets attributable to holders of redeemableunits would have decreased or increased, respectively, by$689,097 or approximately 0.2% (December 31, 2014 –$693,752 or approximately 0.2%). In practice, actual resultsmay differ from this sensitivity analysis and the differencecould be material.
ii) Currency risk
The tables below indicate the currencies to which the Fundhad significant exposure, net of the impact of currencyforward contracts and currency spot contracts, if any,based on the monetary and non-monetary assets andliabilities of the Fund. The tables also illustrate thepotential impact on the Fund if the functional currency ofthe Fund had strengthened or weakened by 10% in relationto each of the other currencies, with all other variables heldconstant.
June 30, 2015
Currency
Net currencyexposure
($)
Percentage ofnet assets
(%)
Impact onthe Fund
($)
Percentage ofnet assets
(%)
US Dollar 91,957,598 26.5 9,195,760 2.6
91,957,598 26.5 9,195,760 2.6
December 31, 2014
Currency
Net currencyexposure
($)
Percentage ofnet assets
(%)
Impact onthe Fund
($)
Percentage ofnet assets
(%)
US Dollar 70,335,638 20.1 7,033,564 2.0
70,335,638 20.1 7,033,564 2.0
iii) Price risk
Price risk is the risk that the carrying value of financialinstruments will fluctuate as a result of changes in marketprices (other than those arising from interest rate risk orcurrency risk) caused by factors specific to a security, itsissuer or all factors affecting a market or a market segment.Exposure to price risk is mainly in equities, derivatives andcommodities, if applicable. As at June 30, 2015,approximately 82.4% (December 31, 2014 – 82.9%) of theFund’s net assets were exposed to price risk. If prices ofthese investments had decreased or increased by 10%, withall other variables held constant, net assets of the Fundwould have decreased or increased, respectively, byapproximately $28,654,436 (December 31, 2014 –$29,069,823). In practice, actual results may differ from thissensitivity analysis and the difference could be material.
iv) Credit risk
The Fund had no significant exposure to bonds anddebentures, preferred shares or derivatives as at June 30,2015 or December 31, 2014. In addition, all investmenttransactions are executed by brokers with an approvedcredit rating. As such the risk of default on transactionswith counterparties and brokers related to purchase andsale of securities is considered minimal. In instances wherethe credit rating were to fall below the approved rating, theManager would take appropriate action.
v) Liquidity risk
The table below summarizes the Fund’s financial liabilitiesbased on the remaining period to the contractual maturitydate.
June 30, 2015 December 31, 2014
On demand($)
Less than3 months
($)On demand
($)
Less than3 months
($)
Current liabilities – 2,645,414 – 5,016,640Liability for written options – – – –Unrealized loss on derivatives – 512,160 – 378,110Redeemable units 347,234,044 – 350,526,860 –
347,234,044 3,157,574 350,526,860 5,394,750
Redeemable units are redeemable on demand at theholder’s option. However, the Manager does not expect thatthe contractual maturity disclosed in the table above will berepresentative of the actual cash outflows, as holders ofthese instruments typically retain them for a longer term.
The accompanying notes are an integral part of the financial statements.
94
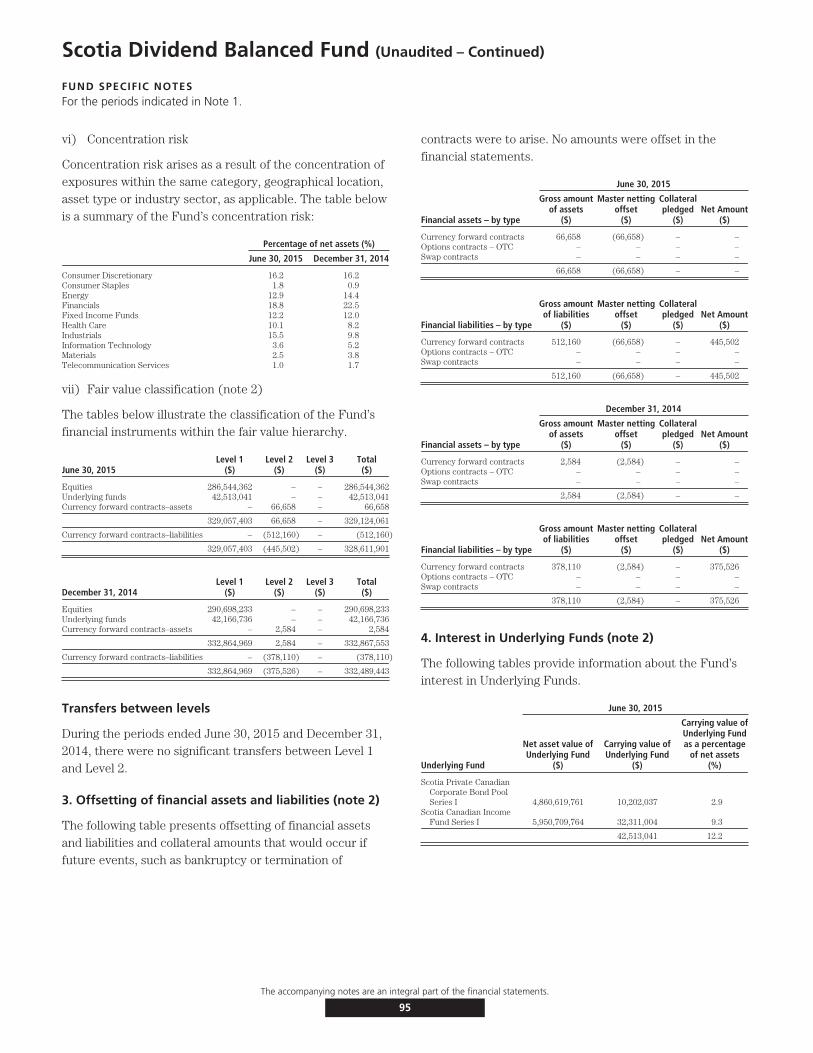
Scotia Dividend Balanced Fund (Unaudited – Continued)
FUND SPECIFIC NOTESFor the periods indicated in Note 1.
vi) Concentration risk
Concentration risk arises as a result of the concentration ofexposures within the same category, geographical location,asset type or industry sector, as applicable. The table belowis a summary of the Fund’s concentration risk:
Percentage of net assets (%)
June 30, 2015 December 31, 2014
Consumer Discretionary 16.2 16.2Consumer Staples 1.8 0.9Energy 12.9 14.4Financials 18.8 22.5Fixed Income Funds 12.2 12.0Health Care 10.1 8.2Industrials 15.5 9.8Information Technology 3.6 5.2Materials 2.5 3.8Telecommunication Services 1.0 1.7
vii) Fair value classification (note 2)
The tables below illustrate the classification of the Fund’sfinancial instruments within the fair value hierarchy.
June 30, 2015Level 1
($)Level 2
($)Level 3
($)Total($)
Equities 286,544,362 – – 286,544,362Underlying funds 42,513,041 – – 42,513,041Currency forward contracts–assets – 66,658 – 66,658
329,057,403 66,658 – 329,124,061
Currency forward contracts–liabilities – (512,160) – (512,160)
329,057,403 (445,502) – 328,611,901
December 31, 2014Level 1
($)Level 2
($)Level 3
($)Total($)
Equities 290,698,233 – – 290,698,233Underlying funds 42,166,736 – – 42,166,736Currency forward contracts–assets – 2,584 – 2,584
332,864,969 2,584 – 332,867,553
Currency forward contracts–liabilities – (378,110) – (378,110)
332,864,969 (375,526) – 332,489,443
Transfers between levels
During the periods ended June 30, 2015 and December 31,2014, there were no significant transfers between Level 1and Level 2.
3. Offsetting of financial assets and liabilities (note 2)
The following table presents offsetting of financial assetsand liabilities and collateral amounts that would occur iffuture events, such as bankruptcy or termination of
contracts were to arise. No amounts were offset in thefinancial statements.
June 30, 2015
Financial assets – by type
Gross amountof assets
($)
Master nettingoffset
($)
Collateralpledged
($)Net Amount
($)
Currency forward contracts 66,658 (66,658) – –Options contracts – OTC – – – –Swap contracts – – – –
66,658 (66,658) – –
Financial liabilities – by type
Gross amountof liabilities
($)
Master nettingoffset
($)
Collateralpledged
($)Net Amount
($)
Currency forward contracts 512,160 (66,658) – 445,502Options contracts – OTC – – – –Swap contracts – – – –
512,160 (66,658) – 445,502
December 31, 2014
Financial assets – by type
Gross amountof assets
($)
Master nettingoffset
($)
Collateralpledged
($)Net Amount
($)
Currency forward contracts 2,584 (2,584) – –Options contracts – OTC – – – –Swap contracts – – – –
2,584 (2,584) – –
Financial liabilities – by type
Gross amountof liabilities
($)
Master nettingoffset
($)
Collateralpledged
($)Net Amount
($)
Currency forward contracts 378,110 (2,584) – 375,526Options contracts – OTC – – – –Swap contracts – – – –
378,110 (2,584) – 375,526
4. Interest in Underlying Funds (note 2)
The following tables provide information about the Fund’sinterest in Underlying Funds.
June 30, 2015
Underlying Fund
Net asset value ofUnderlying Fund
($)
Carrying value ofUnderlying Fund
($)
Carrying value ofUnderlying Fundas a percentage
of net assets(%)
Scotia Private CanadianCorporate Bond PoolSeries I 4,860,619,761 10,202,037 2.9
Scotia Canadian IncomeFund Series I 5,950,709,764 32,311,004 9.3
42,513,041 12.2
The accompanying notes are an integral part of the financial statements.
95

Scotia Dividend Balanced Fund (Unaudited – Continued)
FUND SPECIFIC NOTESFor the periods indicated in Note 1.
December 31, 2014
Underlying Fund
Net asset value ofUnderlying Fund
($)
Carrying value ofUnderlying Fund
($)
Carrying value ofUnderlying Fundas a percentage
of net assets(%)
Scotia Private CanadianCorporate Bond PoolSeries I 4,143,683,984 9,919,964 2.8
Scotia Canadian IncomeFund Series I 5,990,064,451 32,246,772 9.2
42,166,736 12.0
5. Comparison of net asset value per unit and netassets per unit (note 2)
The table below provides a comparison of the net assetvalue per unit and net assets per unit. The primary reasonfor the difference between the net asset value per unit andnet assets per unit, if any, is described in note 2.
June 30, 2015 December 31, 2014
Net asset valueper unit
($)
Net assetsper unit
($)
Net asset valueper unit
($)
Net assetsper unit
($)
Series A 12.48 12.48 12.25 12.25
Series D 10.28 10.28 – –
The accompanying notes are an integral part of the financial statements.
96
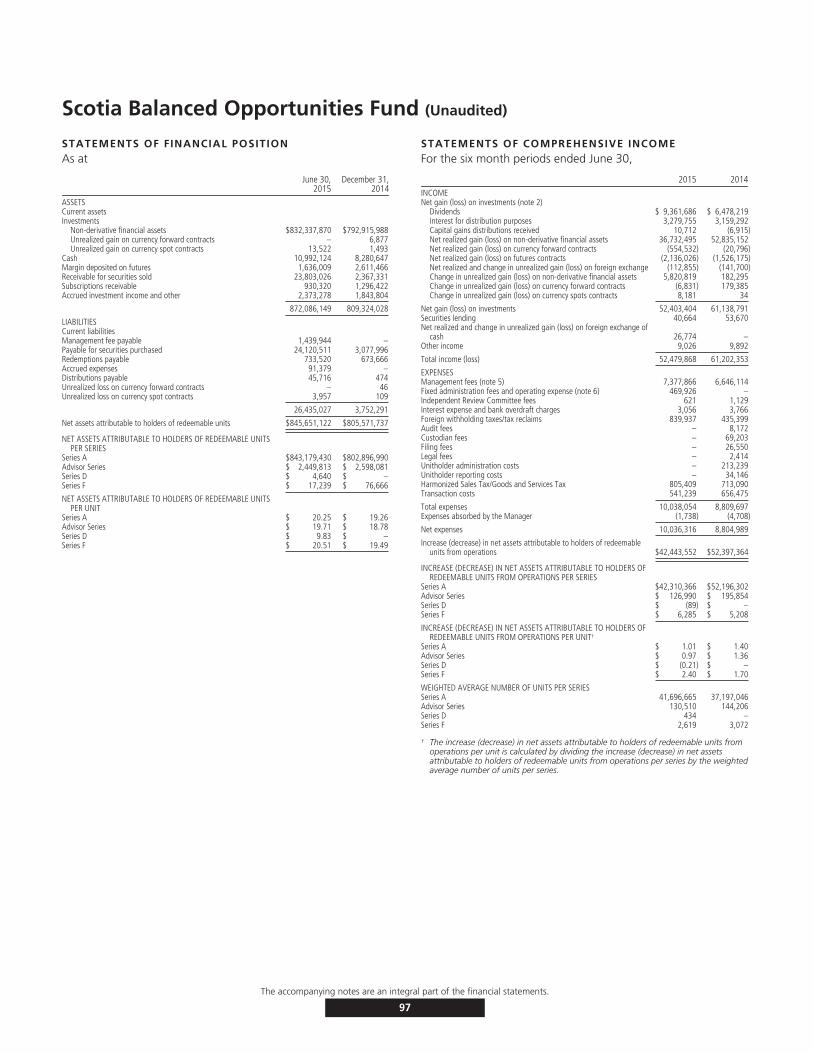
Scotia Balanced Opportunities Fund (Unaudited)
STATEMENTS OF FINANCIAL POSITIONAs at
June 30,2015
December 31,2014
ASSETSCurrent assetsInvestments
Non-derivative financial assets $832,337,870 $792,915,988Unrealized gain on currency forward contracts – 6,877Unrealized gain on currency spot contracts 13,522 1,493
Cash 10,992,124 8,280,647Margin deposited on futures 1,636,009 2,611,466Receivable for securities sold 23,803,026 2,367,331Subscriptions receivable 930,320 1,296,422Accrued investment income and other 2,373,278 1,843,804
872,086,149 809,324,028
LIABILITIESCurrent liabilitiesManagement fee payable 1,439,944 –Payable for securities purchased 24,120,511 3,077,996Redemptions payable 733,520 673,666Accrued expenses 91,379 –Distributions payable 45,716 474Unrealized loss on currency forward contracts – 46Unrealized loss on currency spot contracts 3,957 109
26,435,027 3,752,291
Net assets attributable to holders of redeemable units $845,651,122 $805,571,737
NET ASSETS ATTRIBUTABLE TO HOLDERS OF REDEEMABLE UNITSPER SERIES
Series A $843,179,430 $802,896,990Advisor Series $ 2,449,813 $ 2,598,081Series D $ 4,640 $ –Series F $ 17,239 $ 76,666
NET ASSETS ATTRIBUTABLE TO HOLDERS OF REDEEMABLE UNITSPER UNIT
Series A $ 20.25 $ 19.26Advisor Series $ 19.71 $ 18.78Series D $ 9.83 $ –Series F $ 20.51 $ 19.49
STATEMENTS OF COMPREHENSIVE INCOMEFor the six month periods ended June 30,
2015 2014INCOMENet gain (loss) on investments (note 2)
Dividends $ 9,361,686 $ 6,478,219Interest for distribution purposes 3,279,755 3,159,292Capital gains distributions received 10,712 (6,915)Net realized gain (loss) on non-derivative financial assets 36,732,495 52,835,152Net realized gain (loss) on currency forward contracts (554,532) (20,796)Net realized gain (loss) on futures contracts (2,136,026) (1,526,175)Net realized and change in unrealized gain (loss) on foreign exchange (112,855) (141,700)Change in unrealized gain (loss) on non-derivative financial assets 5,820,819 182,295Change in unrealized gain (loss) on currency forward contracts (6,831) 179,385Change in unrealized gain (loss) on currency spots contracts 8,181 34
Net gain (loss) on investments 52,403,404 61,138,791Securities lending 40,664 53,670Net realized and change in unrealized gain (loss) on foreign exchange of
cash 26,774 –Other income 9,026 9,892
Total income (loss) 52,479,868 61,202,353
EXPENSESManagement fees (note 5) 7,377,866 6,646,114Fixed administration fees and operating expense (note 6) 469,926 –Independent Review Committee fees 621 1,129Interest expense and bank overdraft charges 3,056 3,766Foreign withholding taxes/tax reclaims 839,937 435,399Audit fees – 8,172Custodian fees – 69,203Filing fees – 26,550Legal fees – 2,414Unitholder administration costs – 213,239Unitholder reporting costs – 34,146Harmonized Sales Tax/Goods and Services Tax 805,409 713,090Transaction costs 541,239 656,475
Total expenses 10,038,054 8,809,697Expenses absorbed by the Manager (1,738) (4,708)
Net expenses 10,036,316 8,804,989
Increase (decrease) in net assets attributable to holders of redeemableunits from operations $42,443,552 $52,397,364
INCREASE (DECREASE) IN NET ASSETS ATTRIBUTABLE TO HOLDERS OFREDEEMABLE UNITS FROM OPERATIONS PER SERIES
Series A $42,310,366 $52,196,302Advisor Series $ 126,990 $ 195,854Series D $ (89) $ –Series F $ 6,285 $ 5,208
INCREASE (DECREASE) IN NET ASSETS ATTRIBUTABLE TO HOLDERS OFREDEEMABLE UNITS FROM OPERATIONS PER UNIT†
Series A $ 1.01 $ 1.40Advisor Series $ 0.97 $ 1.36Series D $ (0.21) $ –Series F $ 2.40 $ 1.70
WEIGHTED AVERAGE NUMBER OF UNITS PER SERIESSeries A 41,696,665 37,197,046Advisor Series 130,510 144,206Series D 434 –Series F 2,619 3,072
† The increase (decrease) in net assets attributable to holders of redeemable units fromoperations per unit is calculated by dividing the increase (decrease) in net assetsattributable to holders of redeemable units from operations per series by the weightedaverage number of units per series.
The accompanying notes are an integral part of the financial statements.
97

Scotia Balanced Opportunities Fund (Unaudited – Continued)
STATEMENTS OF CHANGES IN NET ASSETSATTRIBUTABLE TO HOLDERS OF REDEEMABLE UNITSFor the six month periods ended June 30,
2015 2014NET ASSETS ATTRIBUTABLE TO HOLDERS OF REDEEMABLE UNITS,
BEGINNING OF PERIODSeries A $802,896,990 $712,200,891Advisor Series 2,598,081 2,922,653Series F 76,666 16,500
805,571,737 715,140,044
INCREASE (DECREASE) IN NET ASSETS ATTRIBUTABLE TO HOLDERSOF REDEEMABLE UNITS FROM OPERATIONS
Series A 42,310,366 52,196,302Advisor Series 126,990 195,854Series D (89) –Series F 6,285 5,208
42,443,552 52,397,364
DISTRIBUTIONS TO HOLDERS OF REDEEMABLE UNITSFrom net investment income
Series A (1,253,192) (834,231)Advisor Series (1,178) (2,670)Series D (18) –Series F (282) (417)
(1,254,670) (837,318)
REDEEMABLE UNIT TRANSACTIONSProceeds from issue
Series A 69,992,305 90,297,939Advisor Series 96,675 278,912Series D 5,656 –Series F 448 55,480
Reinvested distributionsSeries A 1,206,906 831,885Advisor Series 1,026 2,325Series D 18 –Series F 282 417
Payments on redemptionSeries A (71,973,945) (59,423,133)Advisor Series (371,781) (608,083)Series D (927) –Series F (66,160) (200)
(1,109,497) 31,435,542
INCREASE (DECREASE) IN NET ASSETS ATTRIBUTABLE TO HOLDERSOF REDEEMABLE UNITS
Series A 40,282,440 83,068,762Advisor Series (148,268) (133,662)Series D 4,640 –Series F (59,427) 60,488
40,079,385 82,995,588
NET ASSETS ATTRIBUTABLE TO HOLDERS OF REDEEMABLE UNITS,END OF PERIOD
Series A 843,179,430 795,269,653Advisor Series 2,449,813 2,788,991Series D 4,640 –Series F 17,239 76,988
$845,651,122 $798,135,632
STATEMENTS OF CASH FLOWSFor the six month periods ended June 30,
2015 2014CASH FLOWS FROM OPERATING ACTIVITIESIncrease (decrease) in net assets attributable to holders of
redeemable units $ 42,443,552 $ 52,397,364Adjustments for:
Net realized (gain) loss on non-derivative financial assets (36,732,495) (52,835,152)Unrealized (gain) loss on foreign exchange of cash (159,743) 141,700Change in unrealized (gain) loss on non-derivative financial assets (5,820,819) (182,295)Change in unrealized (gain) loss on currency forward contracts 6,831 (179,385)Change in unrealized (gain) loss on currency spot contracts (8,181) (34)Purchases of non-derivative financial assets (661,188,904) (766,014,710)Proceeds from sale of non-derivative financial assets 663,409,537 734,102,546Transaction costs 517,620 656,475Margin deposited on futures 975,457 (281,062)Accrued investment income and other (529,474) (233,212)Accrued expenses 1,531,323 1,371,255
Net cash provided by (used in) operating activities 4,444,704 (31,056,510)CASH FLOWS FROM FINANCING ACTIVITIESProceeds from issue of redeemable units 70,461,186 90,642,576Amounts paid on redemption of redeemable units (72,352,960) (60,133,727)Distributions to unitholders of redeemable units (1,196) (2,063)
Net cash provided by (used in) financing activities (1,892,970) 30,506,786Change in unrealized gain (loss) on foreign exchange of cash 159,743 (141,700)Net increase (decrease) in cash 2,551,734 (549,724)Cash (bank overdraft), beginning of period 8,280,647 3,436,055
CASH (BANK OVERDRAFT), END OF PERIOD $ 10,992,124 $ 2,744,631
Interest paid(1) 3,056 –Interest received(1) 3,360,163 3,162,695Dividends received, net of withholding taxes(1) 7,911,854 5,802,505
(1) Classified as operating items.
The accompanying notes are an integral part of the financial statements.
98
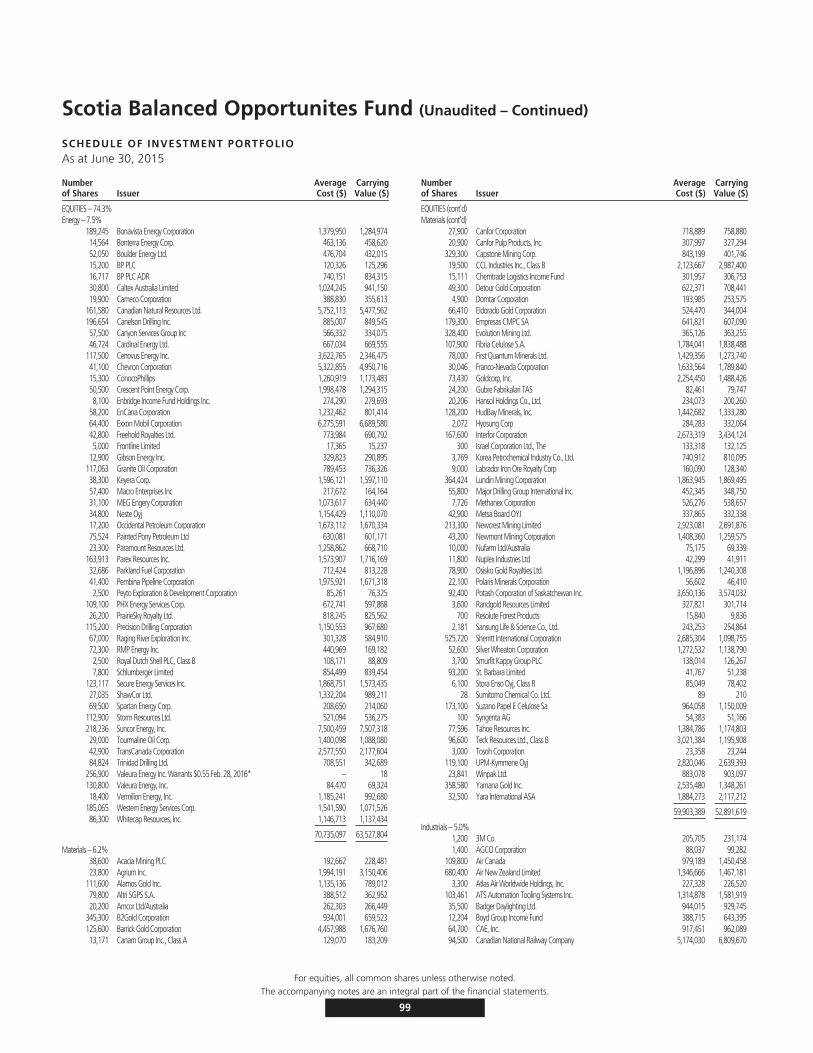
Scotia Balanced Opportunites Fund (Unaudited – Continued)
SCHEDULE OF INVESTMENT PORTFOLIOAs at June 30, 2015
Numberof Shares Issuer
AverageCost ($)
CarryingValue ($)
EQUITIES – 74.3%Energy – 7.5%
189,245 Bonavista Energy Corporation 1,379,950 1,284,97414,564 Bonterra Energy Corp. 463,136 458,62052,050 Boulder Energy Ltd. 476,704 432,01515,200 BP PLC 120,326 125,29616,717 BP PLC ADR 740,151 834,31530,800 Caltex Australia Limited 1,024,245 941,15019,900 Cameco Corporation 388,830 355,613
161,580 Canadian Natural Resources Ltd. 5,752,113 5,477,562196,654 Canelson Drilling Inc. 885,007 849,54557,500 Canyon Services Group Inc 566,332 334,07546,724 Cardinal Energy Ltd. 667,034 669,555
117,500 Cenovus Energy Inc. 3,622,765 2,346,47541,100 Chevron Corporation 5,322,855 4,950,71615,300 ConocoPhillips 1,260,919 1,173,48350,500 Crescent Point Energy Corp. 1,998,478 1,294,3158,100 Enbridge Income Fund Holdings Inc. 274,290 279,693
58,200 EnCana Corporation 1,232,462 801,41464,400 Exxon Mobil Corporation 6,275,591 6,689,58042,800 Freehold Royalties Ltd. 773,984 690,7925,000 Frontline Limited 17,365 15,237
12,900 Gibson Energy Inc. 329,823 290,895117,063 Granite Oil Corporation 789,453 736,32638,300 Keyera Corp. 1,596,121 1,597,11057,400 Macro Enterprises Inc 217,672 164,16431,100 MEG Engery Corporation 1,073,617 634,44034,800 Neste Oyj 1,154,429 1,110,07017,200 Occidental Petroleum Corporation 1,673,112 1,670,33475,524 Painted Pony Petroleum Ltd 630,081 601,17123,300 Paramount Resources Ltd. 1,258,862 668,710
163,913 Parex Resources Inc. 1,573,907 1,716,16932,686 Parkland Fuel Corporation 712,424 813,22841,400 Pembina Pipeline Corporation 1,975,921 1,671,3182,500 Peyto Exploration & Development Corporation 85,261 76,325
109,100 PHX Energy Services Corp. 672,741 597,86826,200 PrairieSky Royalty Ltd. 818,245 825,562
115,200 Precision Drilling Corporation 1,150,553 967,68067,000 Raging River Exploration Inc. 301,328 584,91072,300 RMP Energy Inc. 440,969 169,1822,500 Royal Dutch Shell PLC, Class B 108,171 88,8097,800 Schlumberger Limited 854,499 839,454
123,117 Secure Energy Services Inc. 1,868,751 1,573,43527,035 ShawCor Ltd. 1,332,204 989,21169,500 Spartan Energy Corp. 208,650 214,060
112,900 Storm Resources Ltd. 521,094 536,275218,236 Suncor Energy, Inc. 7,500,459 7,507,31829,000 Tourmaline Oil Corp. 1,400,098 1,088,08042,900 TransCanada Corporation 2,577,550 2,177,60484,824 Trinidad Drilling Ltd. 708,551 342,689
256,900 Valeura Energy Inc. Warrants $0.55 Feb. 28, 2016* – 18130,800 Valeura Energy, Inc. 84,470 69,32418,400 Vermilion Energy, Inc. 1,185,241 992,680
185,065 Western Energy Services Corp. 1,541,590 1,071,52686,300 Whitecap Resources, Inc. 1,146,713 1,137,434
70,735,097 63,527,804
Materials – 6.2%38,600 Acacia Mining PLC 192,662 228,48123,800 Agrium Inc. 1,994,191 3,150,406
111,600 Alamos Gold Inc. 1,135,136 789,01279,800 Altri SGPS S.A. 388,512 362,95220,200 Amcor Ltd/Australia 262,303 266,449
345,300 B2Gold Corporation 934,001 659,523125,600 Barrick Gold Corporation 4,457,988 1,676,76013,171 Canam Group Inc., Class A 129,070 183,209
Numberof Shares Issuer
AverageCost ($)
CarryingValue ($)
EQUITIES (cont’d)Materials (cont’d)
27,900 Canfor Corporation 718,889 758,88020,900 Canfor Pulp Products, Inc. 307,997 327,294
329,300 Capstone Mining Corp. 843,199 401,74619,500 CCL Industries Inc., Class B 2,123,667 2,987,40015,111 Chemtrade Logistics Income Fund 301,957 306,75349,300 Detour Gold Corporation 622,371 708,4414,900 Domtar Corporation 193,985 253,575
66,410 Eldorado Gold Corporation 524,470 344,004179,300 Empresas CMPC SA 641,821 607,090328,400 Evolution Mining Ltd. 365,126 363,255107,900 Fibria Celulose S.A. 1,784,041 1,838,48878,000 First Quantum Minerals Ltd. 1,429,356 1,273,74030,046 Franco-Nevada Corporation 1,633,564 1,789,84073,430 Goldcorp, Inc. 2,254,450 1,488,42624,200 Gubre Fabrikalari TAS 82,461 79,74720,206 Hansol Holdings Co., Ltd. 234,073 200,260
128,200 HudBay Minerals, Inc. 1,442,682 1,333,2802,072 Hyosung Corp 284,283 332,064
167,600 Interfor Corporation 2,673,319 3,434,124300 Israel Corporation Ltd., The 133,318 132,125
3,769 Korea Petrochemical Industry Co., Ltd. 740,912 810,0959,000 Labrador Iron Ore Royalty Corp 160,090 128,340
364,424 Lundin Mining Corporation 1,863,945 1,869,49555,800 Major Drilling Group International Inc. 452,345 348,7507,726 Methanex Corporation 526,276 538,657
42,900 Metsa Board OYJ 337,865 332,338213,300 Newcrest Mining Limited 2,923,081 2,691,87643,200 Newmont Mining Corporation 1,408,360 1,259,57510,000 Nufarm Ltd/Australia 75,175 69,33911,800 Nuplex Industries Ltd 42,299 41,91178,900 Osisko Gold Royalties Ltd. 1,196,896 1,240,30822,100 Polaris Minerals Corporation 56,602 46,41092,400 Potash Corporation of Saskatchewan Inc. 3,650,136 3,574,0323,600 Randgold Resources Limited 327,821 301,714
700 Resolute Forest Products 15,840 9,8362,181 Sansung Life & Science Co., Ltd. 243,253 254,864
525,720 Sherritt International Corporation 2,685,304 1,098,75552,600 Silver Wheaton Corporation 1,272,532 1,138,7903,700 Smurfit Kappy Group PLC 138,014 126,267
93,200 St. Barbara Limited 41,767 51,2386,100 Stora Enso Oyj, Class R 85,049 78,402
28 Sumitomo Chemical Co. Ltd. 89 210173,100 Suzano Papel E Celulose Sa 964,058 1,150,009
100 Syngenta AG 54,383 51,16677,596 Tahoe Resources Inc. 1,384,786 1,174,80396,600 Teck Resources Ltd., Class B 3,021,384 1,195,9083,000 Tosoh Corporation 23,358 23,244
119,100 UPM-Kymmene Oyj 2,820,046 2,639,39323,841 Winpak Ltd. 883,078 903,097
358,580 Yamana Gold Inc. 2,535,480 1,348,26132,500 Yara International ASA 1,884,273 2,117,212
59,903,389 52,891,619
Industrials – 5.0%1,200 3M Co. 205,705 231,1741,400 AGCO Corporation 88,037 99,282
109,800 Air Canada 979,189 1,450,458680,400 Air New Zealand Limited 1,346,666 1,467,181
3,300 Atlas Air Worldwide Holdings, Inc. 227,328 226,520103,461 ATS Automation Tooling Systems Inc. 1,314,878 1,581,91935,500 Badger Daylighting Ltd. 944,015 929,74512,204 Boyd Group Income Fund 388,715 643,39564,700 CAE, Inc. 917,451 962,08994,500 Canadian National Railway Company 5,174,030 6,809,670
For equities, all common shares unless otherwise noted.The accompanying notes are an integral part of the financial statements.
99
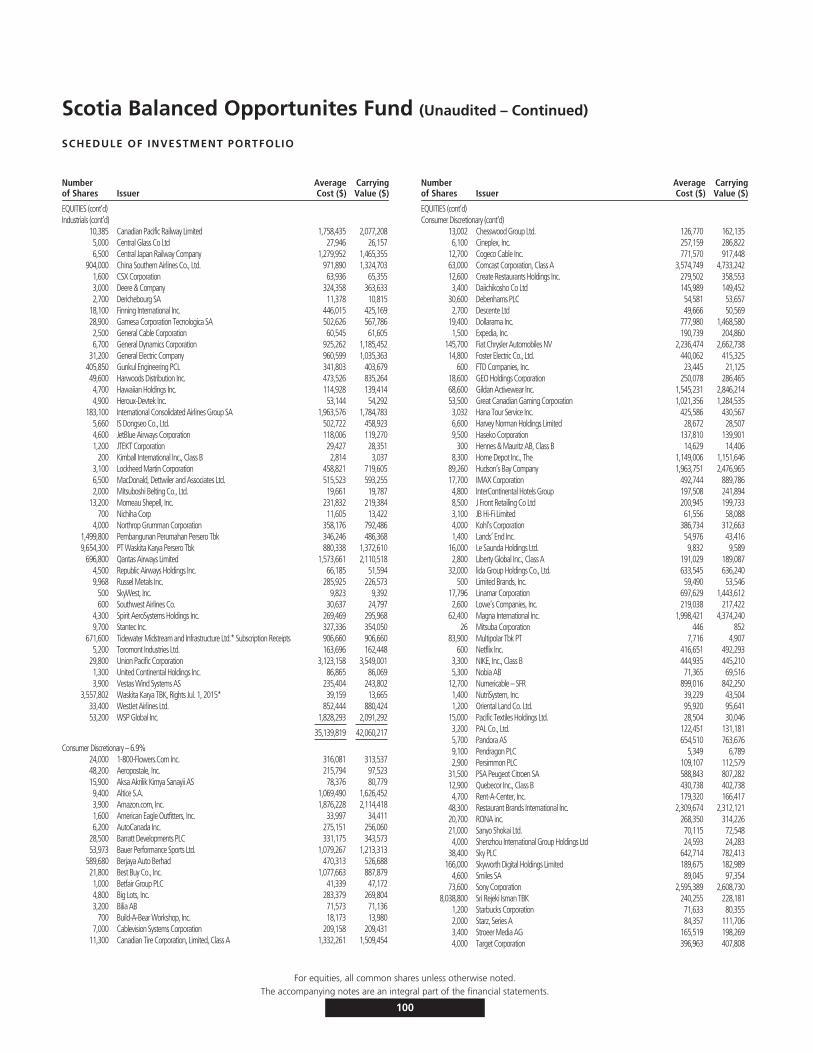
Scotia Balanced Opportunites Fund (Unaudited – Continued)
SCHEDULE OF INVESTMENT PORTFOLIO
Numberof Shares Issuer
AverageCost ($)
CarryingValue ($)
EQUITIES (cont’d)Industrials (cont’d)
10,385 Canadian Pacific Railway Limited 1,758,435 2,077,2085,000 Central Glass Co Ltd 27,946 26,1576,500 Central Japan Railway Company 1,279,952 1,465,355
904,000 China Southern Airlines Co., Ltd. 971,890 1,324,7031,600 CSX Corporation 63,936 65,3553,000 Deere & Company 324,358 363,6332,700 Derichebourg SA 11,378 10,815
18,100 Finning International Inc. 446,015 425,16928,900 Gamesa Corporation Tecnologica SA 502,626 567,7862,500 General Cable Corporation 60,545 61,6056,700 General Dynamics Corporation 925,262 1,185,452
31,200 General Electric Company 960,599 1,035,363405,850 Gunkul Engineering PCL 341,803 403,67949,600 Harwoods Distribution Inc. 473,526 835,2644,700 Hawaiian Holdings Inc. 114,928 139,4144,900 Heroux-Devtek Inc. 53,144 54,292
183,100 International Consolidated Airlines Group SA 1,963,576 1,784,7835,660 IS Dongseo Co., Ltd. 502,722 458,9234,600 JetBlue Airways Corporation 118,006 119,2701,200 JTEKT Corporation 29,427 28,351
200 Kimball International Inc., Class B 2,814 3,0373,100 Lockheed Martin Corporation 458,821 719,6056,500 MacDonald, Dettwiler and Associates Ltd. 515,523 593,2552,000 Mitsuboshi Belting Co., Ltd. 19,661 19,787
13,200 Morneau Shepell, Inc. 231,832 219,384700 Nichiha Corp 11,605 13,422
4,000 Northrop Grumman Corporation 358,176 792,4861,499,800 Pembangunan Perumahan Persero Tbk 346,246 486,3689,654,300 PT Waskita Karya Persero Tbk 880,338 1,372,610
696,800 Qantas Airways Limited 1,573,661 2,110,5184,500 Republic Airways Holdings Inc. 66,185 51,5949,968 Russel Metals Inc. 285,925 226,573
500 SkyWest, Inc. 9,823 9,392600 Southwest Airlines Co. 30,637 24,797
4,300 Spirit AeroSystems Holdings Inc. 269,469 295,9689,700 Stantec Inc. 327,336 354,050
671,600 Tidewater Midstream and Infrastructure Ltd.* Subscription Receipts 906,660 906,6605,200 Toromont Industries Ltd. 163,696 162,448
29,800 Union Pacific Corporation 3,123,158 3,549,0011,300 United Continental Holdings Inc. 86,865 86,0693,900 Vestas Wind Systems AS 235,404 243,802
3,557,802 Waskita Karya TBK, Rights Jul. 1, 2015* 39,159 13,66533,400 WestJet Airlines Ltd. 852,444 880,42453,200 WSP Global Inc. 1,828,293 2,091,292
35,139,819 42,060,217
Consumer Discretionary – 6.9%24,000 1-800-Flowers.Com Inc. 316,081 313,53748,200 Aeropostale, Inc. 215,794 97,52315,900 Aksa Akrilik Kimya Sanayii AS 78,376 80,7799,400 Altice S.A. 1,069,490 1,626,4523,900 Amazon.com, Inc. 1,876,228 2,114,4181,600 American Eagle Outfitters, Inc. 33,997 34,4116,200 AutoCanada Inc. 275,151 256,060
28,500 Barratt Developments PLC 331,175 343,57353,973 Bauer Performance Sports Ltd. 1,079,267 1,213,313
589,680 Berjaya Auto Berhad 470,313 526,68821,800 Best Buy Co., Inc. 1,077,663 887,8791,000 Betfair Group PLC 41,339 47,1724,800 Big Lots, Inc. 283,379 269,8043,200 Bilia AB 71,573 71,136
700 Build-A-Bear Workshop, Inc. 18,173 13,9807,000 Cablevision Systems Corporation 209,158 209,431
11,300 Canadian Tire Corporation, Limited, Class A 1,332,261 1,509,454
Numberof Shares Issuer
AverageCost ($)
CarryingValue ($)
EQUITIES (cont’d)Consumer Discretionary (cont’d)
13,002 Chesswood Group Ltd. 126,770 162,1356,100 Cineplex, Inc. 257,159 286,822
12,700 Cogeco Cable Inc. 771,570 917,44863,000 Comcast Corporation, Class A 3,574,749 4,733,24212,600 Create Restaurants Holdings Inc. 279,502 358,5533,400 Daiichikosho Co Ltd 145,989 149,452
30,600 Debenhams PLC 54,581 53,6572,700 Descente Ltd 49,666 50,569
19,400 Dollarama Inc. 777,980 1,468,5801,500 Expedia, Inc. 190,739 204,860
145,700 Fiat Chrysler Automobiles NV 2,236,474 2,662,73814,800 Foster Electric Co., Ltd. 440,062 415,325
600 FTD Companies, Inc. 23,445 21,12518,600 GEO Holdings Corporation 250,078 286,46568,600 Gildan Activewear Inc. 1,545,231 2,846,21453,500 Great Canadian Gaming Corporation 1,021,356 1,284,5353,032 Hana Tour Service Inc. 425,586 430,5676,600 Harvey Norman Holdings Limited 28,672 28,5079,500 Haseko Corporation 137,810 139,901
300 Hennes & Mauritz AB, Class B 14,629 14,4068,300 Home Depot Inc., The 1,149,006 1,151,646
89,260 Hudson’s Bay Company 1,963,751 2,476,96517,700 IMAX Corporation 492,744 889,7864,800 InterContinental Hotels Group 197,508 241,8948,500 J Front Retailing Co Ltd 200,945 199,7333,100 JB Hi-Fi Limited 61,556 58,0884,000 Kohl’s Corporation 386,734 312,6631,400 Lands’ End Inc. 54,976 43,416
16,000 Le Saunda Holdings Ltd. 9,832 9,5892,800 Liberty Global Inc., Class A 191,029 189,087
32,000 lida Group Holdings Co., Ltd. 633,545 636,240500 Limited Brands, Inc. 59,490 53,546
17,796 Linamar Corporation 697,629 1,443,6122,600 Lowe’s Companies, Inc. 219,038 217,422
62,400 Magna International Inc. 1,998,421 4,374,24026 Mitsuba Corporation 446 852
83,900 Multipolar Tbk PT 7,716 4,907600 Netflix Inc. 416,651 492,293
3,300 NIKE, Inc., Class B 444,935 445,2105,300 Nobia AB 71,365 69,516
12,700 Numericable – SFR 899,016 842,2501,400 NutriSystem, Inc. 39,229 43,5041,200 Oriental Land Co. Ltd. 95,920 95,641
15,000 Pacific Textiles Holdings Ltd. 28,504 30,0463,200 PAL Co., Ltd. 122,451 131,1815,700 Pandora AS 654,510 763,6769,100 Pendragon PLC 5,349 6,7892,900 Persimmon PLC 109,107 112,579
31,500 PSA Peugeot Citroen SA 588,843 807,28212,900 Quebecor Inc., Class B 430,738 402,7384,700 Rent-A-Center, Inc. 179,320 166,417
48,300 Restaurant Brands International Inc. 2,309,674 2,312,12120,700 RONA inc. 268,350 314,22621,000 Sanyo Shokai Ltd. 70,115 72,5484,000 Shenzhou International Group Holdings Ltd 24,593 24,283
38,400 Sky PLC 642,714 782,413166,000 Skyworth Digital Holdings Limited 189,675 182,989
4,600 Smiles SA 89,045 97,35473,600 Sony Corporation 2,595,389 2,608,730
8,038,800 Sri Rejeki Isman TBK 240,255 228,1811,200 Starbucks Corporation 71,633 80,3552,000 Starz, Series A 84,357 111,7063,400 Stroeer Media AG 165,519 198,2694,000 Target Corporation 396,963 407,808
For equities, all common shares unless otherwise noted.The accompanying notes are an integral part of the financial statements.
100
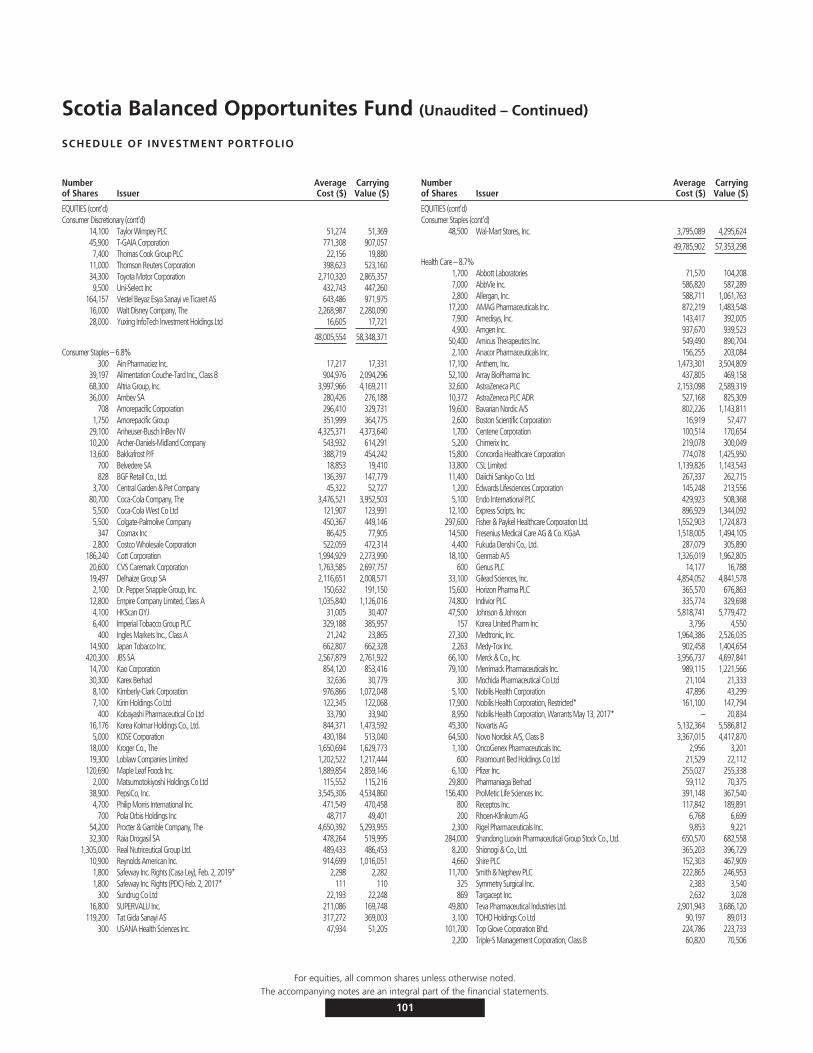
Scotia Balanced Opportunites Fund (Unaudited – Continued)
SCHEDULE OF INVESTMENT PORTFOLIO
Numberof Shares Issuer
AverageCost ($)
CarryingValue ($)
EQUITIES (cont’d)Consumer Discretionary (cont’d)
14,100 Taylor Wimpey PLC 51,274 51,36945,900 T-GAIA Corporation 771,308 907,0577,400 Thomas Cook Group PLC 22,156 19,880
11,000 Thomson Reuters Corporation 398,623 523,16034,300 Toyota Motor Corporation 2,710,320 2,865,3579,500 Uni-Select Inc 432,743 447,260
164,157 Vestel Beyaz Esya Sanayi ve Ticaret AS 643,486 971,97516,000 Walt Disney Company, The 2,268,987 2,280,09028,000 Yuxing InfoTech Investment Holdings Ltd 16,605 17,721
48,005,554 58,348,371
Consumer Staples – 6.8%300 Ain Pharmaciez Inc. 17,217 17,331
39,197 Alimentation Couche-Tard Inc., Class B 904,976 2,094,29668,300 Altria Group, Inc. 3,997,966 4,169,21136,000 Ambev SA 280,426 276,188
708 Amorepacific Corporation 296,410 329,7311,750 Amorepacific Group 351,999 364,775
29,100 Anheuser-Busch InBev NV 4,325,371 4,373,64010,200 Archer-Daniels-Midland Company 543,932 614,29113,600 Bakkafrost P/F 388,719 454,242
700 Belvedere SA 18,853 19,410828 BGF Retail Co., Ltd. 136,397 147,779
3,700 Central Garden & Pet Company 45,322 52,72780,700 Coca-Cola Company, The 3,476,521 3,952,5035,500 Coca-Cola West Co Ltd 121,907 123,9915,500 Colgate-Palmolive Company 450,367 449,146
347 Cosmax Inc 86,425 77,9052,800 Costco Wholesale Corporation 522,059 472,314
186,240 Cott Corporation 1,994,929 2,273,99020,600 CVS Caremark Corporation 1,763,585 2,697,75719,497 Delhaize Group SA 2,116,651 2,008,5712,100 Dr. Pepper Snapple Group, Inc. 150,632 191,150
12,800 Empire Company Limited, Class A 1,035,840 1,126,0164,100 HKScan OYJ 31,005 30,4076,400 Imperial Tobacco Group PLC 329,188 385,957
400 Ingles Markets Inc., Class A 21,242 23,86514,900 Japan Tobacco Inc. 662,807 662,328
420,300 JBS SA 2,567,879 2,761,92214,700 Kao Corporation 854,120 853,41630,300 Karex Berhad 32,636 30,7798,100 Kimberly-Clark Corporation 976,866 1,072,0487,100 Kirin Holdings Co Ltd 122,345 122,068
400 Kobayashi Pharmaceutical Co Ltd 33,790 33,94016,176 Korea Kolmar Holdings Co., Ltd. 844,371 1,473,5925,000 KOSE Corporation 430,184 513,040
18,000 Kroger Co., The 1,650,694 1,629,77319,300 Loblaw Companies Limited 1,202,522 1,217,444
120,690 Maple Leaf Foods Inc. 1,889,854 2,859,1462,000 Matsumotokiyoshi Holdings Co Ltd 115,552 115,216
38,900 PepsiCo, Inc. 3,545,306 4,534,8604,700 Philip Morris International Inc. 471,549 470,458
700 Pola Orbis Holdings Inc 48,717 49,40154,200 Procter & Gamble Company, The 4,650,392 5,293,95532,300 Raia Drogasil SA 478,264 519,995
1,305,000 Real Nutriceutical Group Ltd. 489,433 486,45310,900 Reynolds American Inc. 914,699 1,016,0511,800 Safeway Inc. Rights (Casa Ley), Feb. 2, 2019* 2,298 2,2821,800 Safeway Inc. Rights (PDC) Feb. 2, 2017* 111 110
300 Sundrug Co Ltd 22,193 22,24816,800 SUPERVALU Inc. 211,086 169,748
119,200 Tat Gida Sanayi AS 317,272 369,003300 USANA Health Sciences Inc. 47,934 51,205
Numberof Shares Issuer
AverageCost ($)
CarryingValue ($)
EQUITIES (cont’d)Consumer Staples (cont’d)
48,500 Wal-Mart Stores, Inc. 3,795,089 4,295,624
49,785,902 57,353,298
Health Care – 8.7%1,700 Abbott Laboratories 71,570 104,2087,000 AbbVie Inc. 586,820 587,2892,800 Allergan, Inc. 588,711 1,061,763
17,200 AMAG Pharmaceuticals Inc. 872,219 1,483,5487,900 Amedisys, Inc. 143,417 392,0054,900 Amgen Inc. 937,670 939,523
50,400 Amicus Therapeutics Inc. 549,490 890,7042,100 Anacor Pharmaceuticals Inc. 156,255 203,084
17,100 Anthem, Inc. 1,473,301 3,504,80952,100 Array BioPharma Inc. 437,805 469,15832,600 AstraZeneca PLC 2,153,098 2,589,31910,372 AstraZeneca PLC ADR 527,168 825,30919,600 Bavarian Nordic A/S 802,226 1,143,8112,600 Boston Scientific Corporation 16,919 57,4771,700 Centene Corporation 100,514 170,6545,200 Chimerix Inc. 219,078 300,049
15,800 Concordia Healthcare Corporation 774,078 1,425,95013,800 CSL Limited 1,139,826 1,143,54311,400 Daiichi Sankyo Co. Ltd. 267,337 262,7151,200 Edwards Lifesciences Corporation 145,248 213,5565,100 Endo International PLC 429,923 508,368
12,100 Express Scripts, Inc. 896,929 1,344,092297,600 Fisher & Paykel Healthcare Corporation Ltd. 1,552,903 1,724,87314,500 Fresenius Medical Care AG & Co. KGaA 1,518,005 1,494,1054,400 Fukuda Denshi Co., Ltd. 287,079 305,890
18,100 Genmab A/S 1,326,019 1,962,805600 Genus PLC 14,177 16,788
33,100 Gilead Sciences, Inc. 4,854,052 4,841,57815,600 Horizon Pharma PLC 365,570 676,86374,800 Indivior PLC 335,774 329,69847,500 Johnson & Johnson 5,818,741 5,779,472
157 Korea United Pharm Inc 3,796 4,55027,300 Medtronic, Inc. 1,964,386 2,526,0352,263 Medy-Tox Inc. 902,458 1,404,654
66,100 Merck & Co., Inc. 3,956,737 4,697,84179,100 Merrimack Pharmaceuticals Inc. 989,115 1,221,566
300 Mochida Pharmaceutical Co Ltd 21,104 21,3335,100 Nobilis Health Corporation 47,896 43,299
17,900 Nobilis Health Corporation, Restricted* 161,100 147,7948,950 Nobilis Health Corporation, Warrants May 13, 2017* – 20,834
45,300 Novartis AG 5,132,364 5,586,81264,500 Novo Nordisk A/S, Class B 3,367,015 4,417,8701,100 OncoGenex Pharmaceuticals Inc. 2,956 3,201
600 Paramount Bed Holdings Co Ltd 21,529 22,1126,100 Pfizer Inc. 255,027 255,338
29,800 Pharmaniaga Berhad 59,112 70,375156,400 ProMetic Life Sciences Inc. 391,148 367,540
800 Receptos Inc. 117,842 189,891200 Rhoen-Klinikum AG 6,768 6,699
2,300 Rigel Pharmaceuticals Inc. 9,853 9,221284,000 Shandong Luoxin Pharmaceutical Group Stock Co., Ltd. 650,570 682,558
8,200 Shionogi & Co., Ltd. 365,203 396,7294,660 Shire PLC 152,303 467,909
11,700 Smith & Nephew PLC 222,865 246,953325 Symmetry Surgical Inc. 2,383 3,540869 Targacept Inc. 2,632 3,028
49,800 Teva Pharmaceutical Industries Ltd. 2,901,943 3,686,1203,100 TOHO Holdings Co Ltd 90,197 89,013
101,700 Top Glove Corporation Bhd. 224,786 223,7332,200 Triple-S Management Corporation, Class B 60,820 70,506
For equities, all common shares unless otherwise noted.The accompanying notes are an integral part of the financial statements.
101
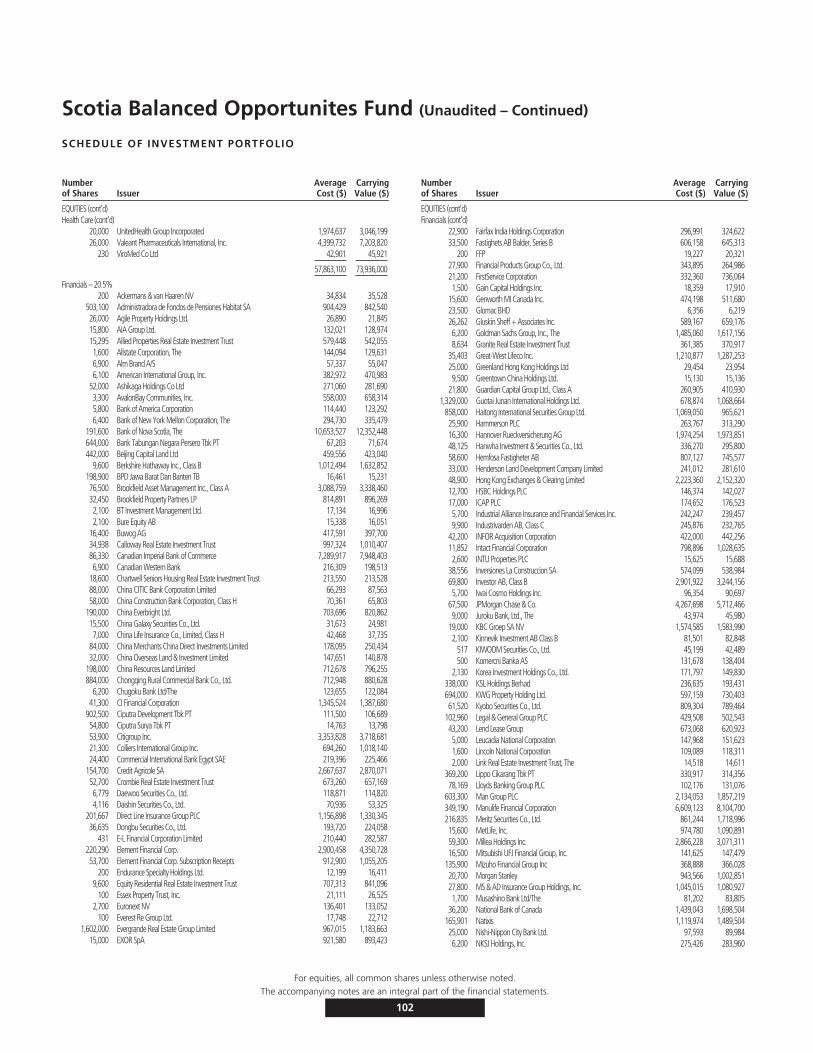
Scotia Balanced Opportunites Fund (Unaudited – Continued)
SCHEDULE OF INVESTMENT PORTFOLIO
Numberof Shares Issuer
AverageCost ($)
CarryingValue ($)
EQUITIES (cont’d)Health Care (cont’d)
20,000 UnitedHealth Group Incorporated 1,974,637 3,046,19926,000 Valeant Pharmaceuticals International, Inc. 4,399,732 7,203,820
230 ViroMed Co Ltd 42,901 45,921
57,863,100 73,936,000
Financials – 20.5%200 Ackermans & van Haaren NV 34,834 35,528
503,100 Administradora de Fondos de Pensiones Habitat SA 904,429 842,54026,000 Agile Property Holdings Ltd. 26,890 21,84515,800 AIA Group Ltd. 132,021 128,97415,295 Allied Properties Real Estate Investment Trust 579,448 542,0551,600 Allstate Corporation, The 144,094 129,6316,900 Alm Brand A/S 57,337 55,0476,100 American International Group, Inc. 382,972 470,983
52,000 Ashikaga Holdings Co Ltd 271,060 281,6903,300 AvalonBay Communities, Inc. 558,000 658,3145,800 Bank of America Corporation 114,440 123,2926,400 Bank of New York Mellon Corporation, The 294,730 335,479
191,600 Bank of Nova Scotia, The 10,653,527 12,352,448644,000 Bank Tabungan Negara Persero Tbk PT 67,203 71,674442,000 Beijing Capital Land Ltd 459,556 423,040
9,600 Berkshire Hathaway Inc., Class B 1,012,494 1,632,852198,900 BPD Jawa Barat Dan Banten TB 16,461 15,23176,500 Brookfield Asset Management Inc., Class A 3,088,759 3,338,46032,450 Brookfield Property Partners LP 814,891 896,2692,100 BT Investment Management Ltd. 17,134 16,9962,100 Bure Equity AB 15,338 16,051
16,400 Buwog AG 417,591 397,70034,938 Calloway Real Estate Investment Trust 997,324 1,010,40786,330 Canadian Imperial Bank of Commerce 7,289,917 7,948,4036,900 Canadian Western Bank 216,309 198,513
18,600 Chartwell Seniors Housing Real Estate Investment Trust 213,550 213,52888,000 China CITIC Bank Corporation Limited 66,293 87,56358,000 China Construction Bank Corporation, Class H 70,361 65,803
190,000 China Everbright Ltd. 703,696 820,86215,500 China Galaxy Securities Co., Ltd. 31,673 24,9817,000 China Life Insurance Co., Limited, Class H 42,468 37,735
84,000 China Merchants China Direct Investments Limited 178,095 250,43432,000 China Overseas Land & Investment Limited 147,651 140,878
198,000 China Resources Land Limited 712,678 796,255884,000 Chongqing Rural Commercial Bank Co., Ltd. 712,948 880,628
6,200 Chugoku Bank Ltd/The 123,655 122,08441,300 CI Financial Corporation 1,345,524 1,387,680
902,500 Ciputra Development Tbk PT 111,500 106,68954,800 Ciputra Surya Tbk PT 14,763 13,79853,900 Citigroup Inc. 3,353,828 3,718,68121,300 Colliers International Group Inc. 694,260 1,018,14024,400 Commercial International Bank Egypt SAE 219,396 225,466
154,700 Credit Agricole SA 2,667,637 2,870,07152,700 Crombie Real Estate Investment Trust 673,260 657,1696,779 Daewoo Securities Co., Ltd. 118,871 114,8204,116 Daishin Securities Co., Ltd. 70,936 53,325
201,667 Direct Line Insurance Group PLC 1,156,898 1,330,34536,635 Dongbu Securities Co., Ltd. 193,720 224,058
431 E-L Financial Corporation Limited 210,440 282,587220,290 Element Financial Corp. 2,900,458 4,350,72853,700 Element Financial Corp. Subscription Receipts 912,900 1,055,205
200 Endurance Specialty Holdings Ltd. 12,199 16,4119,600 Equity Residential Real Estate Investment Trust 707,313 841,096
100 Essex Property Trust, Inc. 21,111 26,5252,700 Euronext NV 136,401 133,052
100 Everest Re Group Ltd. 17,748 22,7121,602,000 Evergrande Real Estate Group Limited 967,015 1,183,663
15,000 EXOR SpA 921,580 893,423
Numberof Shares Issuer
AverageCost ($)
CarryingValue ($)
EQUITIES (cont’d)Financials (cont’d)
22,900 Fairfax India Holdings Corporation 296,991 324,62233,500 Fastighets AB Balder, Series B 606,158 645,313
200 FFP 19,227 20,32127,900 Financial Products Group Co., Ltd. 343,895 264,98621,200 FirstService Corporation 332,360 736,0641,500 Gain Capital Holdings Inc. 18,359 17,910
15,600 Genworth MI Canada Inc. 474,198 511,68023,500 Glomac BHD 6,356 6,21926,262 Gluskin Sheff + Associates Inc. 589,167 659,1766,200 Goldman Sachs Group, Inc., The 1,485,060 1,617,1568,634 Granite Real Estate Investment Trust 361,385 370,917
35,403 Great-West Lifeco Inc. 1,210,877 1,287,25325,000 Greenland Hong Kong Holdings Ltd 29,454 23,9549,500 Greentown China Holdings Ltd. 15,130 15,136
21,800 Guardian Capital Group Ltd., Class A 260,905 410,9301,329,000 Guotai Junan International Holdings Ltd. 678,874 1,068,664
858,000 Haitong International Securities Group Ltd. 1,069,050 965,62125,900 Hammerson PLC 263,767 313,29016,300 Hannover Rueckversicherung AG 1,974,254 1,973,85148,125 Hanwha Investment & Securities Co., Ltd. 336,270 295,80058,600 Hemfosa Fastigheter AB 807,127 745,57733,000 Henderson Land Development Company Limited 241,012 281,61048,900 Hong Kong Exchanges & Clearing Limited 2,223,360 2,152,32012,700 HSBC Holdings PLC 146,374 142,02717,000 ICAP PLC 174,652 176,5235,700 Industrial Alliance Insurance and Financial Services Inc. 242,247 239,4579,900 Industrivarden AB, Class C 245,876 232,765
42,200 INFOR Acquisition Corporation 422,000 442,25611,852 Intact Financial Corporation 798,896 1,028,6352,600 INTU Properties PLC 15,625 15,688
38,556 Inversiones La Construccion SA 574,099 538,98469,800 Investor AB, Class B 2,901,922 3,244,1565,700 Iwai Cosmo Holdings Inc. 96,354 90,697
67,500 JPMorgan Chase & Co. 4,267,698 5,712,4669,000 Juroku Bank, Ltd., The 43,974 45,980
19,000 KBC Groep SA NV 1,574,585 1,583,9902,100 Kinnevik Investment AB Class B 81,501 82,848
517 KIWOOM Securities Co., Ltd. 45,199 42,489500 Komercni Banka AS 131,678 138,404
2,130 Korea Investment Holdings Co., Ltd. 171,797 149,830338,000 KSL Holdings Berhad 236,635 193,431694,000 KWG Property Holding Ltd. 597,159 730,40361,520 Kyobo Securities Co., Ltd. 809,304 789,464
102,960 Legal & General Group PLC 429,508 502,54343,200 Lend Lease Group 673,068 620,9235,000 Leucadia National Corporation 147,968 151,6231,600 Lincoln National Corporation 109,089 118,3112,000 Link Real Estate Investment Trust, The 14,518 14,611
369,200 Lippo Cikarang Tbk PT 330,917 314,35678,169 Lloyds Banking Group PLC 102,176 131,076
603,300 Man Group PLC 2,134,053 1,857,219349,190 Manulife Financial Corporation 6,609,123 8,104,700216,835 Meritz Securities Co., Ltd. 861,244 1,718,99615,600 MetLife, Inc. 974,780 1,090,89159,300 Millea Holdings Inc. 2,866,228 3,071,31116,500 Mitsubishi UFJ Financial Group, Inc. 141,625 147,479
135,900 Mizuho Financial Group Inc 368,888 366,02820,700 Morgan Stanley 943,566 1,002,85127,800 MS & AD Insurance Group Holdings, Inc. 1,045,015 1,080,9271,700 Musashino Bank Ltd/The 81,202 83,805
36,200 National Bank of Canada 1,439,043 1,698,504165,901 Natixis 1,119,974 1,489,50425,000 Nishi-Nippon City Bank Ltd. 97,593 89,9846,200 NKSJ Holdings, Inc. 275,426 283,960
For equities, all common shares unless otherwise noted.The accompanying notes are an integral part of the financial statements.
102
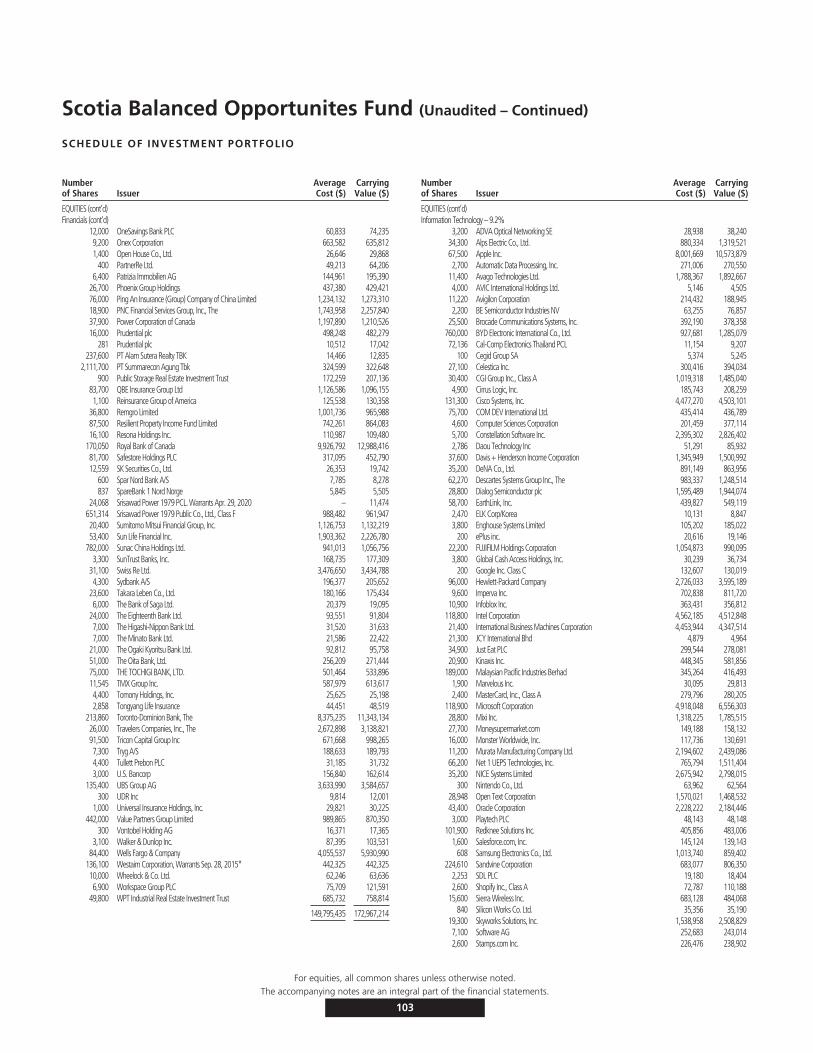
Scotia Balanced Opportunites Fund (Unaudited – Continued)
SCHEDULE OF INVESTMENT PORTFOLIO
Numberof Shares Issuer
AverageCost ($)
CarryingValue ($)
EQUITIES (cont’d)Financials (cont’d)
12,000 OneSavings Bank PLC 60,833 74,2359,200 Onex Corporation 663,582 635,8121,400 Open House Co., Ltd. 26,646 29,868
400 PartnerRe Ltd. 49,213 64,2066,400 Patrizia Immobilien AG 144,961 195,390
26,700 Phoenix Group Holdings 437,380 429,42176,000 Ping An Insurance (Group) Company of China Limited 1,234,132 1,273,31018,900 PNC Financial Services Group, Inc., The 1,743,958 2,257,84037,900 Power Corporation of Canada 1,197,890 1,210,52616,000 Prudential plc 498,248 482,279
281 Prudential plc 10,512 17,042237,600 PT Alam Sutera Realty TBK 14,466 12,835
2,111,700 PT Summarecon Agung Tbk 324,599 322,648900 Public Storage Real Estate Investment Trust 172,259 207,136
83,700 QBE Insurance Group Ltd 1,126,586 1,096,1551,100 Reinsurance Group of America 125,538 130,358
36,800 Remgro Limited 1,001,736 965,98887,500 Resilient Property Income Fund Limited 742,261 864,08316,100 Resona Holdings Inc. 110,987 109,480
170,050 Royal Bank of Canada 9,926,792 12,988,41681,700 Safestore Holdings PLC 317,095 452,79012,559 SK Securities Co., Ltd. 26,353 19,742
600 Spar Nord Bank A/S 7,785 8,278837 SpareBank 1 Nord Norge 5,845 5,505
24,068 Srisawad Power 1979 PCL. Warrants Apr. 29, 2020 – 11,474651,314 Srisawad Power 1979 Public Co., Ltd., Class F 988,482 961,94720,400 Sumitomo Mitsui Financial Group, Inc. 1,126,753 1,132,21953,400 Sun Life Financial Inc. 1,903,362 2,226,780
782,000 Sunac China Holdings Ltd. 941,013 1,056,7563,300 SunTrust Banks, Inc. 168,735 177,309
31,100 Swiss Re Ltd. 3,476,650 3,434,7884,300 Sydbank A/S 196,377 205,652
23,600 Takara Leben Co., Ltd. 180,166 175,4346,000 The Bank of Saga Ltd. 20,379 19,095
24,000 The Eighteenth Bank Ltd. 93,551 91,8047,000 The Higashi-Nippon Bank Ltd. 31,520 31,6337,000 The Minato Bank Ltd. 21,586 22,422
21,000 The Ogaki Kyoritsu Bank Ltd. 92,812 95,75851,000 The Oita Bank, Ltd. 256,209 271,44475,000 THE TOCHIGI BANK, LTD. 501,464 533,89611,545 TMX Group Inc. 587,979 613,6174,400 Tomony Holdings, Inc. 25,625 25,1982,858 Tongyang Life Insurance 44,451 48,519
213,860 Toronto-Dominion Bank, The 8,375,235 11,343,13426,000 Travelers Companies, Inc., The 2,672,898 3,138,82191,500 Tricon Capital Group Inc 671,668 998,2657,300 Tryg A/S 188,633 189,7934,400 Tullett Prebon PLC 31,185 31,7323,000 U.S. Bancorp 156,840 162,614
135,400 UBS Group AG 3,633,990 3,584,657300 UDR Inc 9,814 12,001
1,000 Universal Insurance Holdings, Inc. 29,821 30,225442,000 Value Partners Group Limited 989,865 870,350
300 Vontobel Holding AG 16,371 17,3653,100 Walker & Dunlop Inc. 87,395 103,531
84,400 Wells Fargo & Company 4,055,537 5,930,990136,100 Westaim Corporation, Warrants Sep. 28, 2015* 442,325 442,32510,000 Wheelock & Co. Ltd. 62,246 63,6366,900 Workspace Group PLC 75,709 121,591
49,800 WPT Industrial Real Estate Investment Trust 685,732 758,814
149,795,435 172,967,214
Numberof Shares Issuer
AverageCost ($)
CarryingValue ($)
EQUITIES (cont’d)Information Technology – 9.2%
3,200 ADVA Optical Networking SE 28,938 38,24034,300 Alps Electric Co., Ltd. 880,334 1,319,52167,500 Apple Inc. 8,001,669 10,573,8792,700 Automatic Data Processing, Inc. 271,006 270,550
11,400 Avago Technologies Ltd. 1,788,367 1,892,6674,000 AVIC International Holdings Ltd. 5,146 4,505
11,220 Avigilon Corporation 214,432 188,9452,200 BE Semiconductor Industries NV 63,255 76,857
25,500 Brocade Communications Systems, Inc. 392,190 378,358760,000 BYD Electronic International Co., Ltd. 927,681 1,285,07972,136 Cal-Comp Electronics Thailand PCL 11,154 9,207
100 Cegid Group SA 5,374 5,24527,100 Celestica Inc. 300,416 394,03430,400 CGI Group Inc., Class A 1,019,318 1,485,0404,900 Cirrus Logic, Inc. 185,743 208,259
131,300 Cisco Systems, Inc. 4,477,270 4,503,10175,700 COM DEV International Ltd. 435,414 436,7894,600 Computer Sciences Corporation 201,459 377,1145,700 Constellation Software Inc. 2,395,302 2,826,4022,786 Daou Technology Inc 51,291 85,932
37,600 Davis + Henderson Income Corporation 1,345,949 1,500,99235,200 DeNA Co., Ltd. 891,149 863,95662,270 Descartes Systems Group Inc., The 983,337 1,248,51428,800 Dialog Semiconductor plc 1,595,489 1,944,07458,700 EarthLink, Inc. 439,827 549,1192,470 ELK Corp/Korea 10,131 8,8473,800 Enghouse Systems Limited 105,202 185,022
200 ePlus inc. 20,616 19,14622,200 FUJIFILM Holdings Corporation 1,054,873 990,0953,800 Global Cash Access Holdings, Inc. 30,239 36,734
200 Google Inc. Class C 132,607 130,01996,000 Hewlett-Packard Company 2,726,033 3,595,1899,600 Imperva Inc. 702,838 811,720
10,900 Infoblox Inc. 363,431 356,812118,800 Intel Corporation 4,562,185 4,512,84821,400 International Business Machines Corporation 4,453,944 4,347,51421,300 JCY International Bhd 4,879 4,96434,900 Just Eat PLC 299,544 278,08120,900 Kinaxis Inc. 448,345 581,856
189,000 Malaysian Pacific Industries Berhad 345,264 416,4931,900 Marvelous Inc. 30,095 29,8132,400 MasterCard, Inc., Class A 279,796 280,205
118,900 Microsoft Corporation 4,918,048 6,556,30328,800 Mixi Inc. 1,318,225 1,785,51527,700 Moneysupermarket.com 149,188 158,13216,000 Monster Worldwide, Inc. 117,736 130,69111,200 Murata Manufacturing Company Ltd. 2,194,602 2,439,08666,200 Net 1 UEPS Technologies, Inc. 765,794 1,511,40435,200 NICE Systems Limited 2,675,942 2,798,015
300 Nintendo Co., Ltd. 63,962 62,56428,948 Open Text Corporation 1,570,021 1,468,53243,400 Oracle Corporation 2,228,222 2,184,4463,000 Playtech PLC 48,143 48,148
101,900 Redknee Solutions Inc. 405,856 483,0061,600 Salesforce.com, Inc. 145,124 139,143
608 Samsung Electronics Co., Ltd. 1,013,740 859,402224,610 Sandvine Corporation 683,077 806,350
2,253 SDL PLC 19,180 18,4042,600 Shopify Inc., Class A 72,787 110,188
15,600 Sierra Wireless Inc. 683,128 484,068840 Silicon Works Co. Ltd. 35,356 35,190
19,300 Skyworks Solutions, Inc. 1,538,958 2,508,8297,100 Software AG 252,683 243,0142,600 Stamps.com Inc. 226,476 238,902
For equities, all common shares unless otherwise noted.The accompanying notes are an integral part of the financial statements.
103
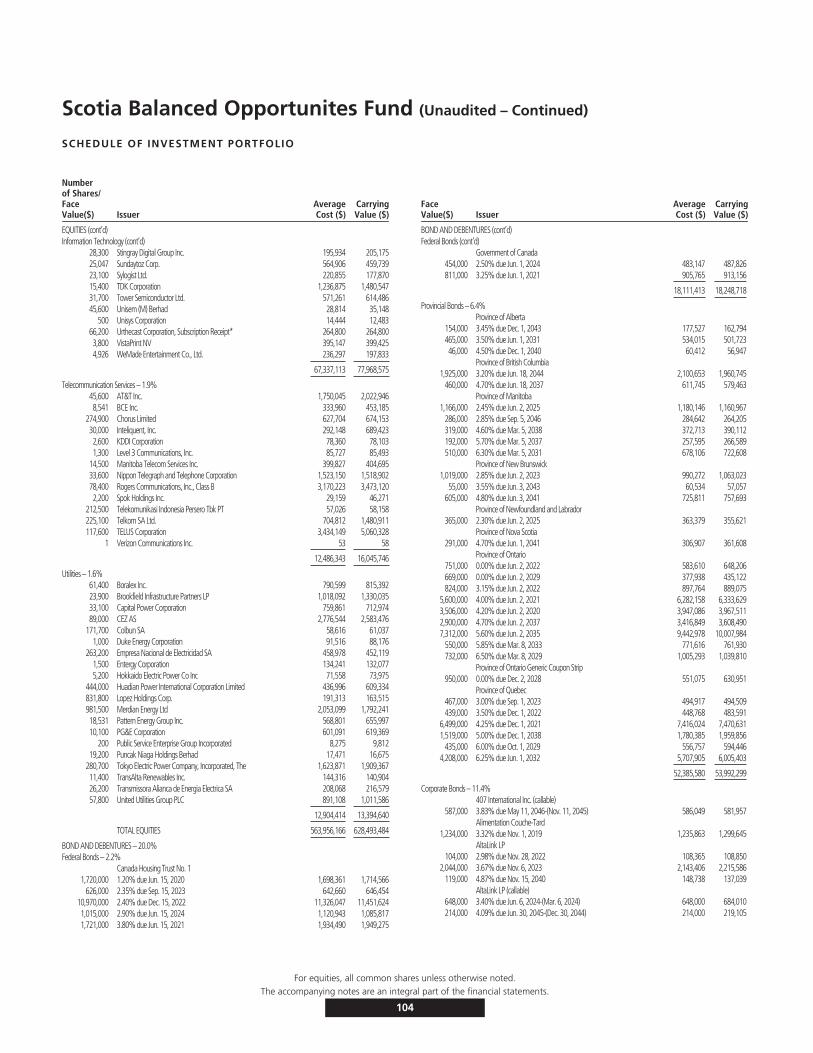
Scotia Balanced Opportunites Fund (Unaudited – Continued)
SCHEDULE OF INVESTMENT PORTFOLIO
Numberof Shares/FaceValue($) Issuer
AverageCost ($)
CarryingValue ($)
EQUITIES (cont’d)Information Technology (cont’d)
28,300 Stingray Digital Group Inc. 195,934 205,17525,047 Sundaytoz Corp. 564,906 459,73923,100 Sylogist Ltd. 220,855 177,87015,400 TDK Corporation 1,236,875 1,480,54731,700 Tower Semiconductor Ltd. 571,261 614,48645,600 Unisem (M) Berhad 28,814 35,148
500 Unisys Corporation 14,444 12,48366,200 Urthecast Corporation, Subscription Receipt* 264,800 264,8003,800 VistaPrint NV 395,147 399,4254,926 WeMade Entertainment Co., Ltd. 236,297 197,833
67,337,113 77,968,575
Telecommunication Services – 1.9%45,600 AT&T Inc. 1,750,045 2,022,9468,541 BCE Inc. 333,960 453,185
274,900 Chorus Limited 627,704 674,15330,000 Inteliquent, Inc. 292,148 689,4232,600 KDDI Corporation 78,360 78,1031,300 Level 3 Communications, Inc. 85,727 85,493
14,500 Manitoba Telecom Services Inc. 399,827 404,69533,600 Nippon Telegraph and Telephone Corporation 1,523,150 1,518,90278,400 Rogers Communications, Inc., Class B 3,170,223 3,473,1202,200 Spok Holdings Inc. 29,159 46,271
212,500 Telekomunikasi Indonesia Persero Tbk PT 57,026 58,158225,100 Telkom SA Ltd. 704,812 1,480,911117,600 TELUS Corporation 3,434,149 5,060,328
1 Verizon Communications Inc. 53 58
12,486,343 16,045,746
Utilities – 1.6%61,400 Boralex Inc. 790,599 815,39223,900 Brookfield Infrastructure Partners LP 1,018,092 1,330,03533,100 Capital Power Corporation 759,861 712,97489,000 CEZ AS 2,776,544 2,583,476
171,700 Colbun SA 58,616 61,0371,000 Duke Energy Corporation 91,516 88,176
263,200 Empresa Nacional de Electricidad SA 458,978 452,1191,500 Entergy Corporation 134,241 132,0775,200 Hokkaido Electric Power Co Inc 71,558 73,975
444,000 Huadian Power International Corporation Limited 436,996 609,334831,800 Lopez Holdings Corp. 191,313 163,515981,500 Merdian Energy Ltd 2,053,099 1,792,24118,531 Pattern Energy Group Inc. 568,801 655,99710,100 PG&E Corporation 601,091 619,369
200 Public Service Enterprise Group Incorporated 8,275 9,81219,200 Puncak Niaga Holdings Berhad 17,471 16,675
280,700 Tokyo Electric Power Company, Incorporated, The 1,623,871 1,909,36711,400 TransAlta Renewables Inc. 144,316 140,90426,200 Transmissora Alianca de Energia Electrica SA 208,068 216,57957,800 United Utilities Group PLC 891,108 1,011,586
12,904,414 13,394,640
TOTAL EQUITIES 563,956,166 628,493,484
BOND AND DEBENTURES – 20.0%Federal Bonds – 2.2%
Canada Housing Trust No. 11,720,000 1.20% due Jun. 15, 2020 1,698,361 1,714,566
626,000 2.35% due Sep. 15, 2023 642,660 646,45410,970,000 2.40% due Dec. 15, 2022 11,326,047 11,451,6241,015,000 2.90% due Jun. 15, 2024 1,120,943 1,085,8171,721,000 3.80% due Jun. 15, 2021 1,934,490 1,949,275
FaceValue($) Issuer
AverageCost ($)
CarryingValue ($)
BOND AND DEBENTURES (cont’d)Federal Bonds (cont’d)
Government of Canada454,000 2.50% due Jun. 1, 2024 483,147 487,826811,000 3.25% due Jun. 1, 2021 905,765 913,156
18,111,413 18,248,718
Provincial Bonds – 6.4%Province of Alberta
154,000 3.45% due Dec. 1, 2043 177,527 162,794465,000 3.50% due Jun. 1, 2031 534,015 501,72346,000 4.50% due Dec. 1, 2040 60,412 56,947
Province of British Columbia1,925,000 3.20% due Jun. 18, 2044 2,100,653 1,960,745
460,000 4.70% due Jun. 18, 2037 611,745 579,463Province of Manitoba
1,166,000 2.45% due Jun. 2, 2025 1,180,146 1,160,967286,000 2.85% due Sep. 5, 2046 284,642 264,205319,000 4.60% due Mar. 5, 2038 372,713 390,112192,000 5.70% due Mar. 5, 2037 257,595 266,589510,000 6.30% due Mar. 5, 2031 678,106 722,608
Province of New Brunswick1,019,000 2.85% due Jun. 2, 2023 990,272 1,063,023
55,000 3.55% due Jun. 3, 2043 60,534 57,057605,000 4.80% due Jun. 3, 2041 725,811 757,693
Province of Newfoundland and Labrador365,000 2.30% due Jun. 2, 2025 363,379 355,621
Province of Nova Scotia291,000 4.70% due Jun. 1, 2041 306,907 361,608
Province of Ontario751,000 0.00% due Jun. 2, 2022 583,610 648,206669,000 0.00% due Jun. 2, 2029 377,938 435,122824,000 3.15% due Jun. 2, 2022 897,764 889,075
5,600,000 4.00% due Jun. 2, 2021 6,282,158 6,333,6293,506,000 4.20% due Jun. 2, 2020 3,947,086 3,967,5112,900,000 4.70% due Jun. 2, 2037 3,416,849 3,608,4907,312,000 5.60% due Jun. 2, 2035 9,442,978 10,007,984
550,000 5.85% due Mar. 8, 2033 771,616 761,930732,000 6.50% due Mar. 8, 2029 1,005,293 1,039,810
Province of Ontario Generic Coupon Strip950,000 0.00% due Dec. 2, 2028 551,075 630,951
Province of Quebec467,000 3.00% due Sep. 1, 2023 494,917 494,509439,000 3.50% due Dec. 1, 2022 448,768 483,591
6,499,000 4.25% due Dec. 1, 2021 7,416,024 7,470,6311,519,000 5.00% due Dec. 1, 2038 1,780,385 1,959,856
435,000 6.00% due Oct. 1, 2029 556,757 594,4464,208,000 6.25% due Jun. 1, 2032 5,707,905 6,005,403
52,385,580 53,992,299
Corporate Bonds – 11.4%407 International Inc. (callable)
587,000 3.83% due May 11, 2046-(Nov. 11, 2045) 586,049 581,957Alimentation Couche-Tard
1,234,000 3.32% due Nov. 1, 2019 1,235,863 1,299,645AltaLink LP
104,000 2.98% due Nov. 28, 2022 108,365 108,8502,044,000 3.67% due Nov. 6, 2023 2,143,406 2,215,586
119,000 4.87% due Nov. 15, 2040 148,738 137,039AltaLink LP (callable)
648,000 3.40% due Jun. 6, 2024-(Mar. 6, 2024) 648,000 684,010214,000 4.09% due Jun. 30, 2045-(Dec. 30, 2044) 214,000 219,105
For equities, all common shares unless otherwise noted.The accompanying notes are an integral part of the financial statements.
104
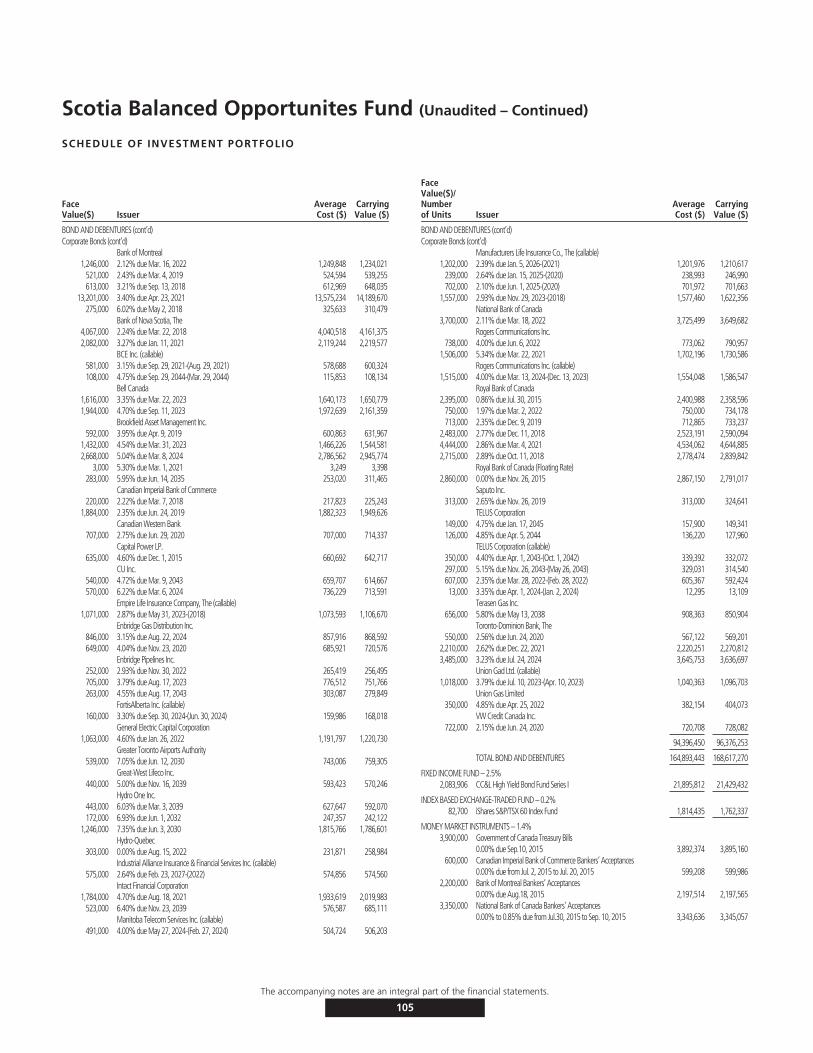
Scotia Balanced Opportunites Fund (Unaudited – Continued)
SCHEDULE OF INVESTMENT PORTFOLIO
FaceValue($) Issuer
AverageCost ($)
CarryingValue ($)
BOND AND DEBENTURES (cont’d)Corporate Bonds (cont’d)
Bank of Montreal1,246,000 2.12% due Mar. 16, 2022 1,249,848 1,234,021
521,000 2.43% due Mar. 4, 2019 524,594 539,255613,000 3.21% due Sep. 13, 2018 612,969 648,035
13,201,000 3.40% due Apr. 23, 2021 13,575,234 14,189,670275,000 6.02% due May 2, 2018 325,633 310,479
Bank of Nova Scotia, The4,067,000 2.24% due Mar. 22, 2018 4,040,518 4,161,3752,082,000 3.27% due Jan. 11, 2021 2,119,244 2,219,577
BCE Inc. (callable)581,000 3.15% due Sep. 29, 2021-(Aug. 29, 2021) 578,688 600,324108,000 4.75% due Sep. 29, 2044-(Mar. 29, 2044) 115,853 108,134
Bell Canada1,616,000 3.35% due Mar. 22, 2023 1,640,173 1,650,7791,944,000 4.70% due Sep. 11, 2023 1,972,639 2,161,359
Brookfield Asset Management Inc.592,000 3.95% due Apr. 9, 2019 600,863 631,967
1,432,000 4.54% due Mar. 31, 2023 1,466,226 1,544,5812,668,000 5.04% due Mar. 8, 2024 2,786,562 2,945,774
3,000 5.30% due Mar. 1, 2021 3,249 3,398283,000 5.95% due Jun. 14, 2035 253,020 311,465
Canadian Imperial Bank of Commerce220,000 2.22% due Mar. 7, 2018 217,823 225,243
1,884,000 2.35% due Jun. 24, 2019 1,882,323 1,949,626Canadian Western Bank
707,000 2.75% due Jun. 29, 2020 707,000 714,337Capital Power LP.
635,000 4.60% due Dec. 1, 2015 660,692 642,717CU Inc.
540,000 4.72% due Mar. 9, 2043 659,707 614,667570,000 6.22% due Mar. 6, 2024 736,229 713,591
Empire Life Insurance Company, The (callable)1,071,000 2.87% due May 31, 2023-(2018) 1,073,593 1,106,670
Enbridge Gas Distribution Inc.846,000 3.15% due Aug. 22, 2024 857,916 868,592649,000 4.04% due Nov. 23, 2020 685,921 720,576
Enbridge Pipelines Inc.252,000 2.93% due Nov. 30, 2022 265,419 256,495705,000 3.79% due Aug. 17, 2023 776,512 751,766263,000 4.55% due Aug. 17, 2043 303,087 279,849
FortisAlberta Inc. (callable)160,000 3.30% due Sep. 30, 2024-(Jun. 30, 2024) 159,986 168,018
General Electric Capital Corporation1,063,000 4.60% due Jan. 26, 2022 1,191,797 1,220,730
Greater Toronto Airports Authority539,000 7.05% due Jun. 12, 2030 743,006 759,305
Great-West Lifeco Inc.440,000 5.00% due Nov. 16, 2039 593,423 570,246
Hydro One Inc.443,000 6.03% due Mar. 3, 2039 627,647 592,070172,000 6.93% due Jun. 1, 2032 247,357 242,122
1,246,000 7.35% due Jun. 3, 2030 1,815,766 1,786,601Hydro-Quebec
303,000 0.00% due Aug. 15, 2022 231,871 258,984Industrial Alliance Insurance & Financial Services Inc. (callable)
575,000 2.64% due Feb. 23, 2027-(2022) 574,856 574,560Intact Financial Corporation
1,784,000 4.70% due Aug. 18, 2021 1,933,619 2,019,983523,000 6.40% due Nov. 23, 2039 576,587 685,111
Manitoba Telecom Services Inc. (callable)491,000 4.00% due May 27, 2024-(Feb. 27, 2024) 504,724 506,203
FaceValue($)/Numberof Units Issuer
AverageCost ($)
CarryingValue ($)
BOND AND DEBENTURES (cont’d)Corporate Bonds (cont’d)
Manufacturers Life Insurance Co., The (callable)1,202,000 2.39% due Jan. 5, 2026-(2021) 1,201,976 1,210,617
239,000 2.64% due Jan. 15, 2025-(2020) 238,993 246,990702,000 2.10% due Jun. 1, 2025-(2020) 701,972 701,663
1,557,000 2.93% due Nov. 29, 2023-(2018) 1,577,460 1,622,356National Bank of Canada
3,700,000 2.11% due Mar. 18, 2022 3,725,499 3,649,682Rogers Communications Inc.
738,000 4.00% due Jun. 6, 2022 773,062 790,9571,506,000 5.34% due Mar. 22, 2021 1,702,196 1,730,586
Rogers Communications Inc. (callable)1,515,000 4.00% due Mar. 13, 2024-(Dec. 13, 2023) 1,554,048 1,586,547
Royal Bank of Canada2,395,000 0.86% due Jul. 30, 2015 2,400,988 2,358,596
750,000 1.97% due Mar. 2, 2022 750,000 734,178713,000 2.35% due Dec. 9, 2019 712,865 733,237
2,483,000 2.77% due Dec. 11, 2018 2,523,191 2,590,0944,444,000 2.86% due Mar. 4, 2021 4,534,062 4,644,8852,715,000 2.89% due Oct. 11, 2018 2,778,474 2,839,842
Royal Bank of Canada (Floating Rate)2,860,000 0.00% due Nov. 26, 2015 2,867,150 2,791,017
Saputo Inc.313,000 2.65% due Nov. 26, 2019 313,000 324,641
TELUS Corporation149,000 4.75% due Jan. 17, 2045 157,900 149,341126,000 4.85% due Apr. 5, 2044 136,220 127,960
TELUS Corporation (callable)350,000 4.40% due Apr. 1, 2043-(Oct. 1, 2042) 339,392 332,072297,000 5.15% due Nov. 26, 2043-(May 26, 2043) 329,031 314,540607,000 2.35% due Mar. 28, 2022-(Feb. 28, 2022) 605,367 592,42413,000 3.35% due Apr. 1, 2024-(Jan. 2, 2024) 12,295 13,109
Terasen Gas Inc.656,000 5.80% due May 13, 2038 908,363 850,904
Toronto-Dominion Bank, The550,000 2.56% due Jun. 24, 2020 567,122 569,201
2,210,000 2.62% due Dec. 22, 2021 2,220,251 2,270,8123,485,000 3.23% due Jul. 24, 2024 3,645,753 3,636,697
Union Gad Ltd. (callable)1,018,000 3.79% due Jul. 10, 2023-(Apr. 10, 2023) 1,040,363 1,096,703
Union Gas Limited350,000 4.85% due Apr. 25, 2022 382,154 404,073
VW Credit Canada Inc.722,000 2.15% due Jun. 24, 2020 720,708 728,082
94,396,450 96,376,253
TOTAL BOND AND DEBENTURES 164,893,443 168,617,270
FIXED INCOME FUND – 2.5%2,083,906 CC&L High Yield Bond Fund Series I 21,895,812 21,429,432
INDEX BASED EXCHANGE-TRADED FUND – 0.2%82,700 iShares S&P/TSX 60 Index Fund 1,814,435 1,762,337
MONEY MARKET INSTRUMENTS – 1.4%3,900,000 Government of Canada Treasury Bills
0.00% due Sep.10, 2015 3,892,374 3,895,160600,000 Canadian Imperial Bank of Commerce Bankers’ Acceptances
0.00% due from Jul. 2, 2015 to Jul. 20, 2015 599,208 599,9862,200,000 Bank of Montreal Bankers’ Acceptances
0.00% due Aug.18, 2015 2,197,514 2,197,5653,350,000 National Bank of Canada Bankers’ Acceptances
0.00% to 0.85% due from Jul.30, 2015 to Sep. 10, 2015 3,343,636 3,345,057
The accompanying notes are an integral part of the financial statements.
105
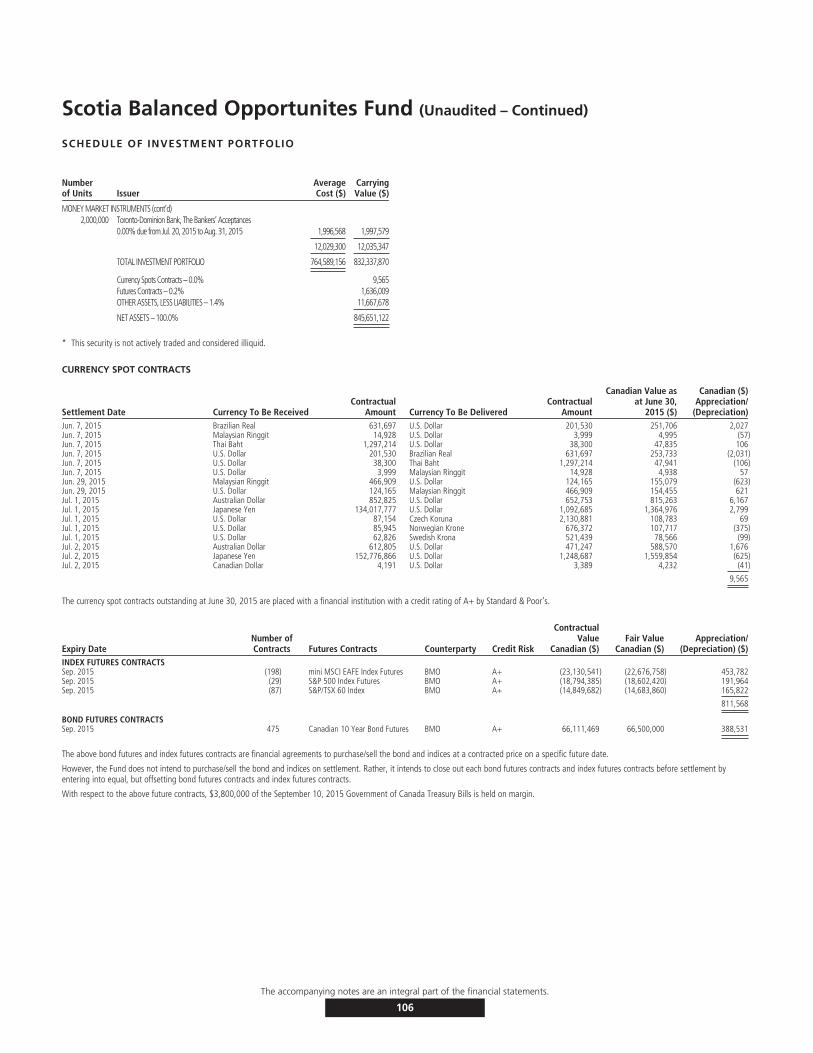
Scotia Balanced Opportunites Fund (Unaudited – Continued)
SCHEDULE OF INVESTMENT PORTFOLIO
Numberof Units Issuer
AverageCost ($)
CarryingValue ($)
MONEY MARKET INSTRUMENTS (cont’d)2,000,000 Toronto-Dominion Bank, The Bankers’ Acceptances
0.00% due from Jul. 20, 2015 to Aug. 31, 2015 1,996,568 1,997,579
12,029,300 12,035,347
TOTAL INVESTMENT PORTFOLIO 764,589,156 832,337,870
Currency Spots Contracts – 0.0% 9,565Futures Contracts – 0.2% 1,636,009OTHER ASSETS, LESS LIABILITIES – 1.4% 11,667,678
NET ASSETS – 100.0% 845,651,122
* This security is not actively traded and considered illiquid.
CURRENCY SPOT CONTRACTS
Settlement Date Currency To Be ReceivedContractual
Amount Currency To Be DeliveredContractual
Amount
Canadian Value asat June 30,
2015 ($)
Canadian ($)Appreciation/
(Depreciation)Jun. 7, 2015 Brazilian Real 631,697 U.S. Dollar 201,530 251,706 2,027Jun. 7, 2015 Malaysian Ringgit 14,928 U.S. Dollar 3,999 4,995 (57)Jun. 7, 2015 Thai Baht 1,297,214 U.S. Dollar 38,300 47,835 106Jun. 7, 2015 U.S. Dollar 201,530 Brazilian Real 631,697 253,733 (2,031)Jun. 7, 2015 U.S. Dollar 38,300 Thai Baht 1,297,214 47,941 (106)Jun. 7, 2015 U.S. Dollar 3,999 Malaysian Ringgit 14,928 4,938 57Jun. 29, 2015 Malaysian Ringgit 466,909 U.S. Dollar 124,165 155,079 (623)Jun. 29, 2015 U.S. Dollar 124,165 Malaysian Ringgit 466,909 154,455 621Jul. 1, 2015 Australian Dollar 852,825 U.S. Dollar 652,753 815,263 6,167Jul. 1, 2015 Japanese Yen 134,017,777 U.S. Dollar 1,092,685 1,364,976 2,799Jul. 1, 2015 U.S. Dollar 87,154 Czech Koruna 2,130,881 108,783 69Jul. 1, 2015 U.S. Dollar 85,945 Norwegian Krone 676,372 107,717 (375)Jul. 1, 2015 U.S. Dollar 62,826 Swedish Krona 521,439 78,566 (99)Jul. 2, 2015 Australian Dollar 612,805 U.S. Dollar 471,247 588,570 1,676Jul. 2, 2015 Japanese Yen 152,776,866 U.S. Dollar 1,248,687 1,559,854 (625)Jul. 2, 2015 Canadian Dollar 4,191 U.S. Dollar 3,389 4,232 (41)
9,565
The currency spot contracts outstanding at June 30, 2015 are placed with a financial institution with a credit rating of A+ by Standard & Poor’s.
Expiry DateNumber ofContracts Futures Contracts Counterparty Credit Risk
ContractualValue
Canadian ($)Fair Value
Canadian ($)Appreciation/
(Depreciation) ($)INDEX FUTURES CONTRACTSSep. 2015 (198) mini MSCI EAFE Index Futures BMO A+ (23,130,541) (22,676,758) 453,782Sep. 2015 (29) S&P 500 Index Futures BMO A+ (18,794,385) (18,602,420) 191,964Sep. 2015 (87) S&P/TSX 60 Index BMO A+ (14,849,682) (14,683,860) 165,822
811,568
BOND FUTURES CONTRACTSSep. 2015 475 Canadian 10 Year Bond Futures BMO A+ 66,111,469 66,500,000 388,531
The above bond futures and index futures contracts are financial agreements to purchase/sell the bond and indices at a contracted price on a specific future date.
However, the Fund does not intend to purchase/sell the bond and indices on settlement. Rather, it intends to close out each bond futures contracts and index futures contracts before settlement byentering into equal, but offsetting bond futures contracts and index futures contracts.
With respect to the above future contracts, $3,800,000 of the September 10, 2015 Government of Canada Treasury Bills is held on margin.
The accompanying notes are an integral part of the financial statements.
106
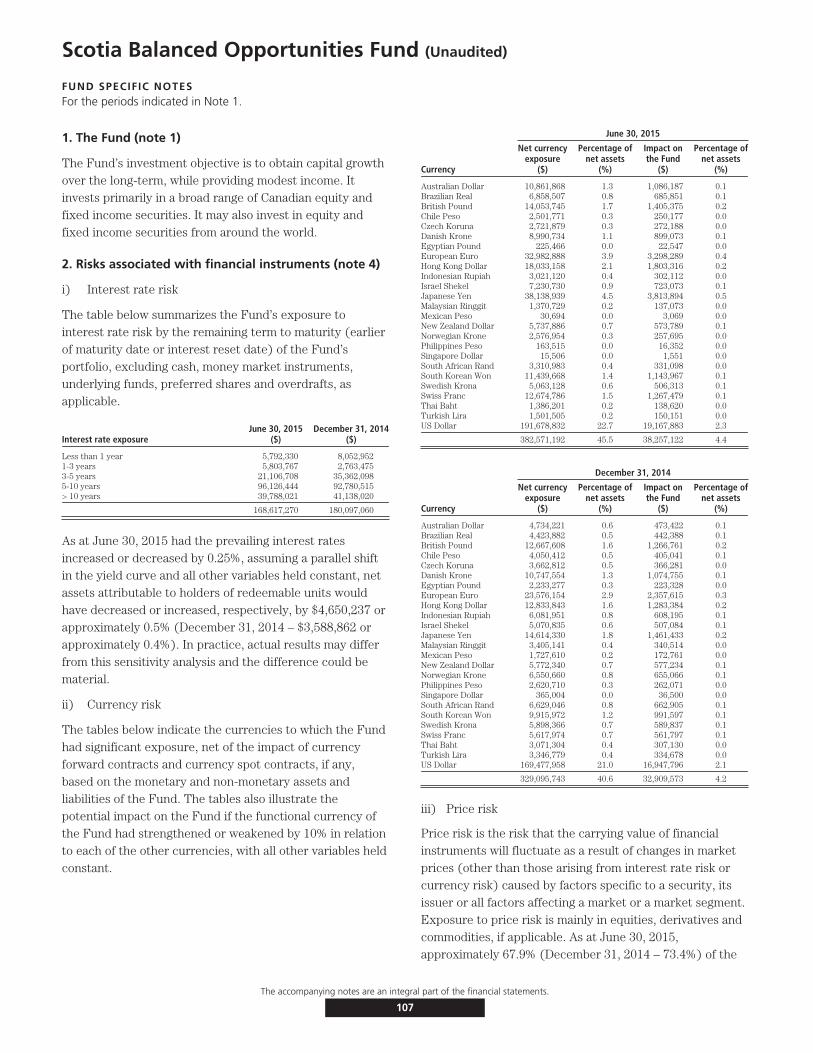
Scotia Balanced Opportunities Fund (Unaudited)
FUND SPECIFIC NOTESFor the periods indicated in Note 1.
1. The Fund (note 1)
The Fund’s investment objective is to obtain capital growthover the long-term, while providing modest income. Itinvests primarily in a broad range of Canadian equity andfixed income securities. It may also invest in equity andfixed income securities from around the world.
2. Risks associated with financial instruments (note 4)
i) Interest rate risk
The table below summarizes the Fund’s exposure tointerest rate risk by the remaining term to maturity (earlierof maturity date or interest reset date) of the Fund’sportfolio, excluding cash, money market instruments,underlying funds, preferred shares and overdrafts, asapplicable.
Interest rate exposureJune 30, 2015
($)December 31, 2014
($)
Less than 1 year 5,792,330 8,052,9521-3 years 5,803,767 2,763,4753-5 years 21,106,708 35,362,0985-10 years 96,126,444 92,780,515> 10 years 39,788,021 41,138,020
168,617,270 180,097,060
As at June 30, 2015 had the prevailing interest ratesincreased or decreased by 0.25%, assuming a parallel shiftin the yield curve and all other variables held constant, netassets attributable to holders of redeemable units wouldhave decreased or increased, respectively, by $4,650,237 orapproximately 0.5% (December 31, 2014 – $3,588,862 orapproximately 0.4%). In practice, actual results may differfrom this sensitivity analysis and the difference could bematerial.
ii) Currency risk
The tables below indicate the currencies to which the Fundhad significant exposure, net of the impact of currencyforward contracts and currency spot contracts, if any,based on the monetary and non-monetary assets andliabilities of the Fund. The tables also illustrate thepotential impact on the Fund if the functional currency ofthe Fund had strengthened or weakened by 10% in relationto each of the other currencies, with all other variables heldconstant.
June 30, 2015
Currency
Net currencyexposure
($)
Percentage ofnet assets
(%)
Impact onthe Fund
($)
Percentage ofnet assets
(%)
Australian Dollar 10,861,868 1.3 1,086,187 0.1Brazilian Real 6,858,507 0.8 685,851 0.1British Pound 14,053,745 1.7 1,405,375 0.2Chile Peso 2,501,771 0.3 250,177 0.0Czech Koruna 2,721,879 0.3 272,188 0.0Danish Krone 8,990,734 1.1 899,073 0.1Egyptian Pound 225,466 0.0 22,547 0.0European Euro 32,982,888 3.9 3,298,289 0.4Hong Kong Dollar 18,033,158 2.1 1,803,316 0.2Indonesian Rupiah 3,021,120 0.4 302,112 0.0Israel Shekel 7,230,730 0.9 723,073 0.1Japanese Yen 38,138,939 4.5 3,813,894 0.5Malaysian Ringgit 1,370,729 0.2 137,073 0.0Mexican Peso 30,694 0.0 3,069 0.0New Zealand Dollar 5,737,886 0.7 573,789 0.1Norwegian Krone 2,576,954 0.3 257,695 0.0Philippines Peso 163,515 0.0 16,352 0.0Singapore Dollar 15,506 0.0 1,551 0.0South African Rand 3,310,983 0.4 331,098 0.0South Korean Won 11,439,668 1.4 1,143,967 0.1Swedish Krona 5,063,128 0.6 506,313 0.1Swiss Franc 12,674,786 1.5 1,267,479 0.1Thai Baht 1,386,201 0.2 138,620 0.0Turkish Lira 1,501,505 0.2 150,151 0.0US Dollar 191,678,832 22.7 19,167,883 2.3
382,571,192 45.5 38,257,122 4.4
December 31, 2014
Currency
Net currencyexposure
($)
Percentage ofnet assets
(%)
Impact onthe Fund
($)
Percentage ofnet assets
(%)
Australian Dollar 4,734,221 0.6 473,422 0.1Brazilian Real 4,423,882 0.5 442,388 0.1British Pound 12,667,608 1.6 1,266,761 0.2Chile Peso 4,050,412 0.5 405,041 0.1Czech Koruna 3,662,812 0.5 366,281 0.0Danish Krone 10,747,554 1.3 1,074,755 0.1Egyptian Pound 2,233,277 0.3 223,328 0.0European Euro 23,576,154 2.9 2,357,615 0.3Hong Kong Dollar 12,833,843 1.6 1,283,384 0.2Indonesian Rupiah 6,081,951 0.8 608,195 0.1Israel Shekel 5,070,835 0.6 507,084 0.1Japanese Yen 14,614,330 1.8 1,461,433 0.2Malaysian Ringgit 3,405,141 0.4 340,514 0.0Mexican Peso 1,727,610 0.2 172,761 0.0New Zealand Dollar 5,772,340 0.7 577,234 0.1Norwegian Krone 6,550,660 0.8 655,066 0.1Philippines Peso 2,620,710 0.3 262,071 0.0Singapore Dollar 365,004 0.0 36,500 0.0South African Rand 6,629,046 0.8 662,905 0.1South Korean Won 9,915,972 1.2 991,597 0.1Swedish Krona 5,898,366 0.7 589,837 0.1Swiss Franc 5,617,974 0.7 561,797 0.1Thai Baht 3,071,304 0.4 307,130 0.0Turkish Lira 3,346,779 0.4 334,678 0.0US Dollar 169,477,958 21.0 16,947,796 2.1
329,095,743 40.6 32,909,573 4.2
iii) Price risk
Price risk is the risk that the carrying value of financialinstruments will fluctuate as a result of changes in marketprices (other than those arising from interest rate risk orcurrency risk) caused by factors specific to a security, itsissuer or all factors affecting a market or a market segment.Exposure to price risk is mainly in equities, derivatives andcommodities, if applicable. As at June 30, 2015,approximately 67.9% (December 31, 2014 – 73.4%) of the
The accompanying notes are an integral part of the financial statements.
107
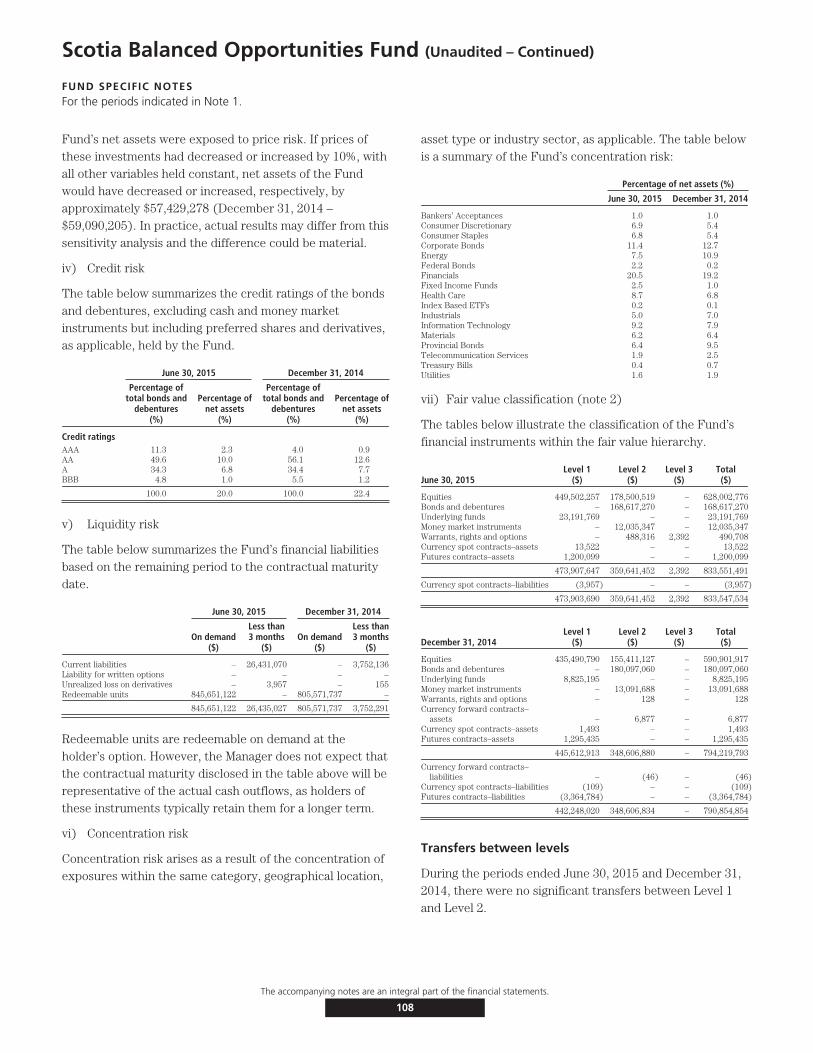
Scotia Balanced Opportunities Fund (Unaudited – Continued)
FUND SPECIFIC NOTESFor the periods indicated in Note 1.
Fund’s net assets were exposed to price risk. If prices ofthese investments had decreased or increased by 10%, withall other variables held constant, net assets of the Fundwould have decreased or increased, respectively, byapproximately $57,429,278 (December 31, 2014 –$59,090,205). In practice, actual results may differ from thissensitivity analysis and the difference could be material.
iv) Credit risk
The table below summarizes the credit ratings of the bondsand debentures, excluding cash and money marketinstruments but including preferred shares and derivatives,as applicable, held by the Fund.
June 30, 2015 December 31, 2014
Percentage oftotal bonds and
debentures(%)
Percentage ofnet assets
(%)
Percentage oftotal bonds and
debentures(%)
Percentage ofnet assets
(%)
Credit ratingsAAA 11.3 2.3 4.0 0.9AA 49.6 10.0 56.1 12.6A 34.3 6.8 34.4 7.7BBB 4.8 1.0 5.5 1.2
100.0 20.0 100.0 22.4
v) Liquidity risk
The table below summarizes the Fund’s financial liabilitiesbased on the remaining period to the contractual maturitydate.
June 30, 2015 December 31, 2014
On demand($)
Less than3 months
($)On demand
($)
Less than3 months
($)
Current liabilities – 26,431,070 – 3,752,136Liability for written options – – – –Unrealized loss on derivatives – 3,957 – 155Redeemable units 845,651,122 – 805,571,737 –
845,651,122 26,435,027 805,571,737 3,752,291
Redeemable units are redeemable on demand at theholder’s option. However, the Manager does not expect thatthe contractual maturity disclosed in the table above will berepresentative of the actual cash outflows, as holders ofthese instruments typically retain them for a longer term.
vi) Concentration risk
Concentration risk arises as a result of the concentration ofexposures within the same category, geographical location,
asset type or industry sector, as applicable. The table belowis a summary of the Fund’s concentration risk:
Percentage of net assets (%)
June 30, 2015 December 31, 2014
Bankers’ Acceptances 1.0 1.0Consumer Discretionary 6.9 5.4Consumer Staples 6.8 5.4Corporate Bonds 11.4 12.7Energy 7.5 10.9Federal Bonds 2.2 0.2Financials 20.5 19.2Fixed Income Funds 2.5 1.0Health Care 8.7 6.8Index Based ETFs 0.2 0.1Industrials 5.0 7.0Information Technology 9.2 7.9Materials 6.2 6.4Provincial Bonds 6.4 9.5Telecommunication Services 1.9 2.5Treasury Bills 0.4 0.7Utilities 1.6 1.9
vii) Fair value classification (note 2)
The tables below illustrate the classification of the Fund’sfinancial instruments within the fair value hierarchy.
June 30, 2015Level 1
($)Level 2
($)Level 3
($)Total($)
Equities 449,502,257 178,500,519 – 628,002,776Bonds and debentures – 168,617,270 – 168,617,270Underlying funds 23,191,769 – – 23,191,769Money market instruments – 12,035,347 – 12,035,347Warrants, rights and options – 488,316 2,392 490,708Currency spot contracts–assets 13,522 – – 13,522Futures contracts–assets 1,200,099 – – 1,200,099
473,907,647 359,641,452 2,392 833,551,491
Currency spot contracts–liabilities (3,957) – – (3,957)
473,903,690 359,641,452 2,392 833,547,534
December 31, 2014Level 1
($)Level 2
($)Level 3
($)Total($)
Equities 435,490,790 155,411,127 – 590,901,917Bonds and debentures – 180,097,060 – 180,097,060Underlying funds 8,825,195 – – 8,825,195Money market instruments – 13,091,688 – 13,091,688Warrants, rights and options – 128 – 128Currency forward contracts–
assets – 6,877 – 6,877Currency spot contracts–assets 1,493 – – 1,493Futures contracts–assets 1,295,435 – – 1,295,435
445,612,913 348,606,880 – 794,219,793
Currency forward contracts–liabilities – (46) – (46)
Currency spot contracts–liabilities (109) – – (109)Futures contracts–liabilities (3,364,784) – – (3,364,784)
442,248,020 348,606,834 – 790,854,854
Transfers between levels
During the periods ended June 30, 2015 and December 31,2014, there were no significant transfers between Level 1and Level 2.
The accompanying notes are an integral part of the financial statements.
108
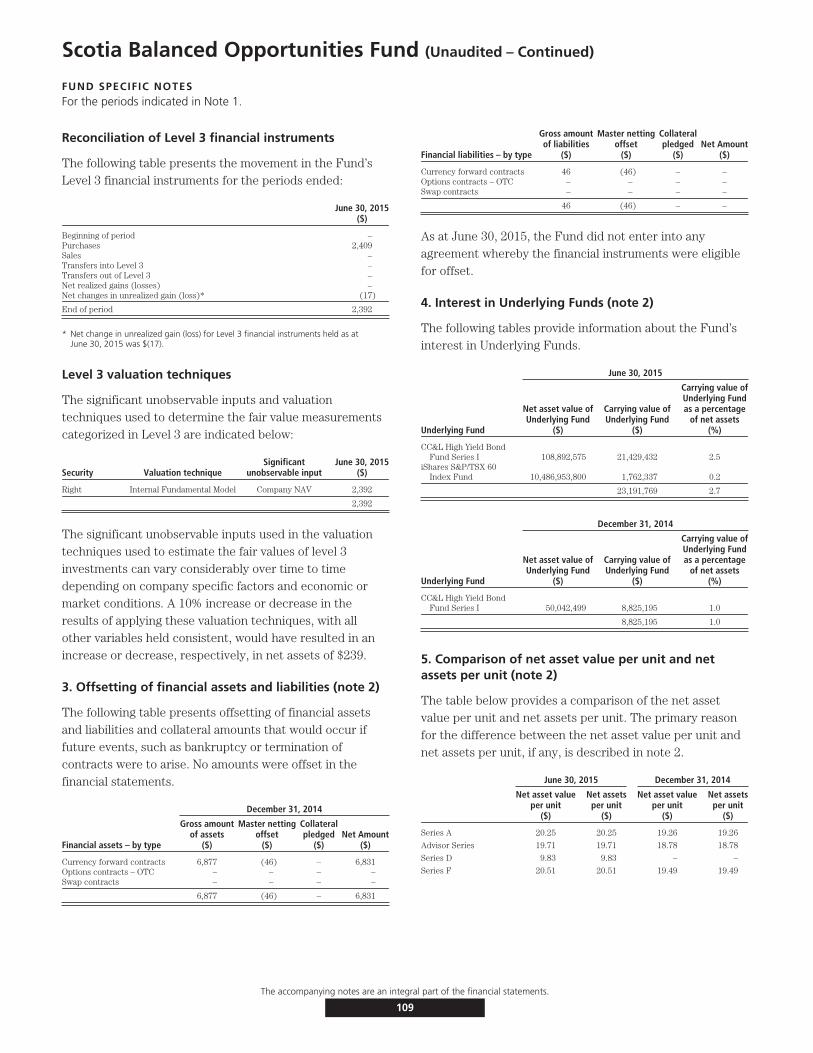
Scotia Balanced Opportunities Fund (Unaudited – Continued)
FUND SPECIFIC NOTESFor the periods indicated in Note 1.
Reconciliation of Level 3 financial instruments
The following table presents the movement in the Fund’sLevel 3 financial instruments for the periods ended:
June 30, 2015($)
Beginning of period –Purchases 2,409Sales –Transfers into Level 3 –Transfers out of Level 3 –Net realized gains (losses) –Net changes in unrealized gain (loss)* (17)
End of period 2,392
* Net change in unrealized gain (loss) for Level 3 financial instruments held as atJune 30, 2015 was $(17).
Level 3 valuation techniques
The significant unobservable inputs and valuationtechniques used to determine the fair value measurementscategorized in Level 3 are indicated below:
Security Valuation techniqueSignificant
unobservable inputJune 30, 2015
($)
Right Internal Fundamental Model Company NAV 2,392
2,392
The significant unobservable inputs used in the valuationtechniques used to estimate the fair values of level 3investments can vary considerably over time to timedepending on company specific factors and economic ormarket conditions. A 10% increase or decrease in theresults of applying these valuation techniques, with allother variables held consistent, would have resulted in anincrease or decrease, respectively, in net assets of $239.
3. Offsetting of financial assets and liabilities (note 2)
The following table presents offsetting of financial assetsand liabilities and collateral amounts that would occur iffuture events, such as bankruptcy or termination ofcontracts were to arise. No amounts were offset in thefinancial statements.
December 31, 2014
Financial assets – by type
Gross amountof assets
($)
Master nettingoffset
($)
Collateralpledged
($)Net Amount
($)
Currency forward contracts 6,877 (46) – 6,831Options contracts – OTC – – – –Swap contracts – – – –
6,877 (46) – 6,831
Financial liabilities – by type
Gross amountof liabilities
($)
Master nettingoffset
($)
Collateralpledged
($)Net Amount
($)
Currency forward contracts 46 (46) – –Options contracts – OTC – – – –Swap contracts – – – –
46 (46) – –
As at June 30, 2015, the Fund did not enter into anyagreement whereby the financial instruments were eligiblefor offset.
4. Interest in Underlying Funds (note 2)
The following tables provide information about the Fund’sinterest in Underlying Funds.
June 30, 2015
Underlying Fund
Net asset value ofUnderlying Fund
($)
Carrying value ofUnderlying Fund
($)
Carrying value ofUnderlying Fundas a percentage
of net assets(%)
CC&L High Yield BondFund Series I 108,892,575 21,429,432 2.5
iShares S&P/TSX 60Index Fund 10,486,953,800 1,762,337 0.2
23,191,769 2.7
December 31, 2014
Underlying Fund
Net asset value ofUnderlying Fund
($)
Carrying value ofUnderlying Fund
($)
Carrying value ofUnderlying Fundas a percentage
of net assets(%)
CC&L High Yield BondFund Series I 50,042,499 8,825,195 1.0
8,825,195 1.0
5. Comparison of net asset value per unit and netassets per unit (note 2)
The table below provides a comparison of the net assetvalue per unit and net assets per unit. The primary reasonfor the difference between the net asset value per unit andnet assets per unit, if any, is described in note 2.
June 30, 2015 December 31, 2014
Net asset valueper unit
($)
Net assetsper unit
($)
Net asset valueper unit
($)
Net assetsper unit
($)
Series A 20.25 20.25 19.26 19.26
Advisor Series 19.71 19.71 18.78 18.78
Series D 9.83 9.83 – –
Series F 20.51 20.51 19.49 19.49
The accompanying notes are an integral part of the financial statements.
109
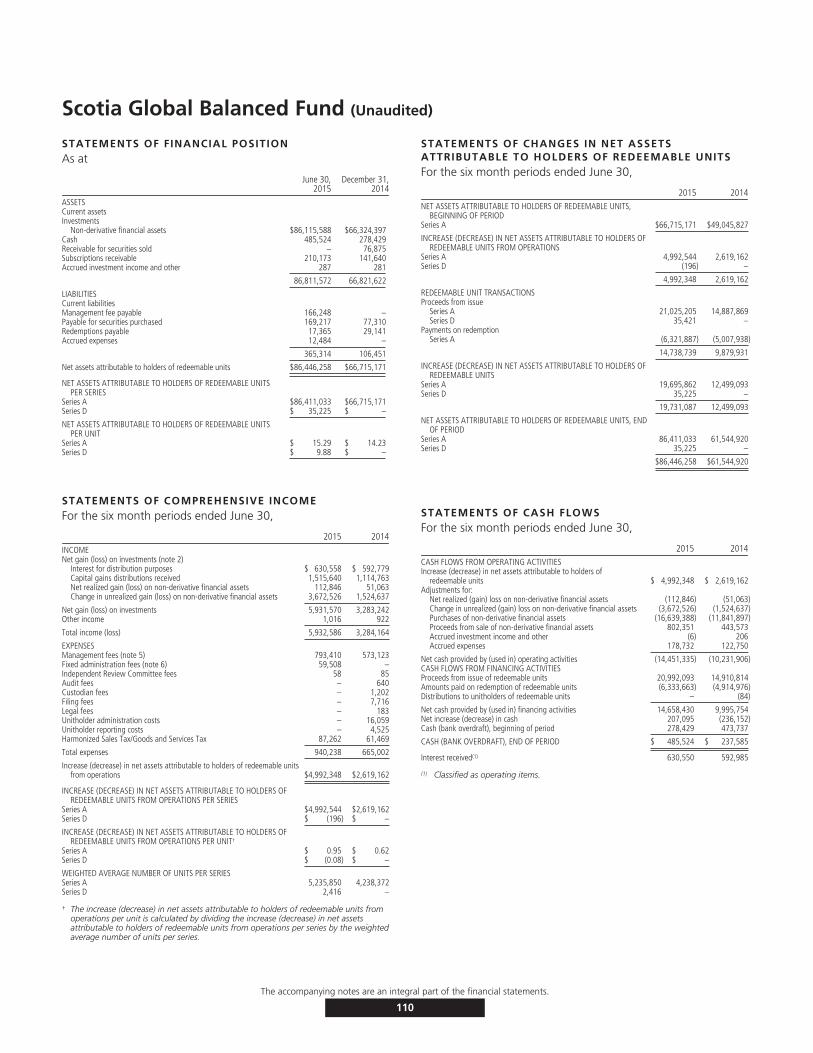
Scotia Global Balanced Fund (Unaudited)
STATEMENTS OF FINANCIAL POSITIONAs at
June 30,2015
December 31,2014
ASSETSCurrent assetsInvestments
Non-derivative financial assets $86,115,588 $66,324,397Cash 485,524 278,429Receivable for securities sold – 76,875Subscriptions receivable 210,173 141,640Accrued investment income and other 287 281
86,811,572 66,821,622
LIABILITIESCurrent liabilitiesManagement fee payable 166,248 –Payable for securities purchased 169,217 77,310Redemptions payable 17,365 29,141Accrued expenses 12,484 –
365,314 106,451
Net assets attributable to holders of redeemable units $86,446,258 $66,715,171
NET ASSETS ATTRIBUTABLE TO HOLDERS OF REDEEMABLE UNITSPER SERIES
Series A $86,411,033 $66,715,171Series D $ 35,225 $ –
NET ASSETS ATTRIBUTABLE TO HOLDERS OF REDEEMABLE UNITSPER UNIT
Series A $ 15.29 $ 14.23Series D $ 9.88 $ –
STATEMENTS OF COMPREHENSIVE INCOMEFor the six month periods ended June 30,
2015 2014INCOMENet gain (loss) on investments (note 2)
Interest for distribution purposes $ 630,558 $ 592,779Capital gains distributions received 1,515,640 1,114,763Net realized gain (loss) on non-derivative financial assets 112,846 51,063Change in unrealized gain (loss) on non-derivative financial assets 3,672,526 1,524,637
Net gain (loss) on investments 5,931,570 3,283,242Other income 1,016 922
Total income (loss) 5,932,586 3,284,164
EXPENSESManagement fees (note 5) 793,410 573,123Fixed administration fees (note 6) 59,508 –Independent Review Committee fees 58 85Audit fees – 640Custodian fees – 1,202Filing fees – 7,716Legal fees – 183Unitholder administration costs – 16,059Unitholder reporting costs – 4,525Harmonized Sales Tax/Goods and Services Tax 87,262 61,469
Total expenses 940,238 665,002
Increase (decrease) in net assets attributable to holders of redeemable unitsfrom operations $4,992,348 $2,619,162
INCREASE (DECREASE) IN NET ASSETS ATTRIBUTABLE TO HOLDERS OFREDEEMABLE UNITS FROM OPERATIONS PER SERIES
Series A $4,992,544 $2,619,162Series D $ (196) $ –
INCREASE (DECREASE) IN NET ASSETS ATTRIBUTABLE TO HOLDERS OFREDEEMABLE UNITS FROM OPERATIONS PER UNIT†
Series A $ 0.95 $ 0.62Series D $ (0.08) $ –
WEIGHTED AVERAGE NUMBER OF UNITS PER SERIESSeries A 5,235,850 4,238,372Series D 2,416 –
† The increase (decrease) in net assets attributable to holders of redeemable units fromoperations per unit is calculated by dividing the increase (decrease) in net assetsattributable to holders of redeemable units from operations per series by the weightedaverage number of units per series.
STATEMENTS OF CHANGES IN NET ASSETSATTRIBUTABLE TO HOLDERS OF REDEEMABLE UNITSFor the six month periods ended June 30,
2015 2014NET ASSETS ATTRIBUTABLE TO HOLDERS OF REDEEMABLE UNITS,
BEGINNING OF PERIODSeries A $66,715,171 $49,045,827
INCREASE (DECREASE) IN NET ASSETS ATTRIBUTABLE TO HOLDERS OFREDEEMABLE UNITS FROM OPERATIONS
Series A 4,992,544 2,619,162Series D (196) –
4,992,348 2,619,162
REDEEMABLE UNIT TRANSACTIONSProceeds from issue
Series A 21,025,205 14,887,869Series D 35,421 –
Payments on redemptionSeries A (6,321,887) (5,007,938)
14,738,739 9,879,931
INCREASE (DECREASE) IN NET ASSETS ATTRIBUTABLE TO HOLDERS OFREDEEMABLE UNITS
Series A 19,695,862 12,499,093Series D 35,225 –
19,731,087 12,499,093
NET ASSETS ATTRIBUTABLE TO HOLDERS OF REDEEMABLE UNITS, ENDOF PERIOD
Series A 86,411,033 61,544,920Series D 35,225 –
$86,446,258 $61,544,920
STATEMENTS OF CASH FLOWSFor the six month periods ended June 30,
2015 2014CASH FLOWS FROM OPERATING ACTIVITIESIncrease (decrease) in net assets attributable to holders of
redeemable units $ 4,992,348 $ 2,619,162Adjustments for:
Net realized (gain) loss on non-derivative financial assets (112,846) (51,063)Change in unrealized (gain) loss on non-derivative financial assets (3,672,526) (1,524,637)Purchases of non-derivative financial assets (16,639,388) (11,841,897)Proceeds from sale of non-derivative financial assets 802,351 443,573Accrued investment income and other (6) 206Accrued expenses 178,732 122,750
Net cash provided by (used in) operating activities (14,451,335) (10,231,906)CASH FLOWS FROM FINANCING ACTIVITIESProceeds from issue of redeemable units 20,992,093 14,910,814Amounts paid on redemption of redeemable units (6,333,663) (4,914,976)Distributions to unitholders of redeemable units – (84)
Net cash provided by (used in) financing activities 14,658,430 9,995,754Net increase (decrease) in cash 207,095 (236,152)Cash (bank overdraft), beginning of period 278,429 473,737
CASH (BANK OVERDRAFT), END OF PERIOD $ 485,524 $ 237,585
Interest received(1) 630,550 592,985
(1) Classified as operating items.
The accompanying notes are an integral part of the financial statements.
110

Scotia Global Balanced Fund (Unaudited – Continued)
SCHEDULE OF INVESTMENT PORTFOLIOAs at June 30, 2015
Numberof Units Issuer
AverageCost ($)
CarryingValue ($)
FIXED INCOME FUND – 99.6%9,180,766 CI Signature Global Income & Growth Fund Series I 74,389,045 86,115,588
TOTAL INVESTMENT PORTFOLIO 74,389,045 86,115,588
OTHER ASSETS, LESS LIABILITIES – 0.4% 330,670
NET ASSETS – 100.0% 86,446,258
The accompanying notes are an integral part of the financial statements.
111
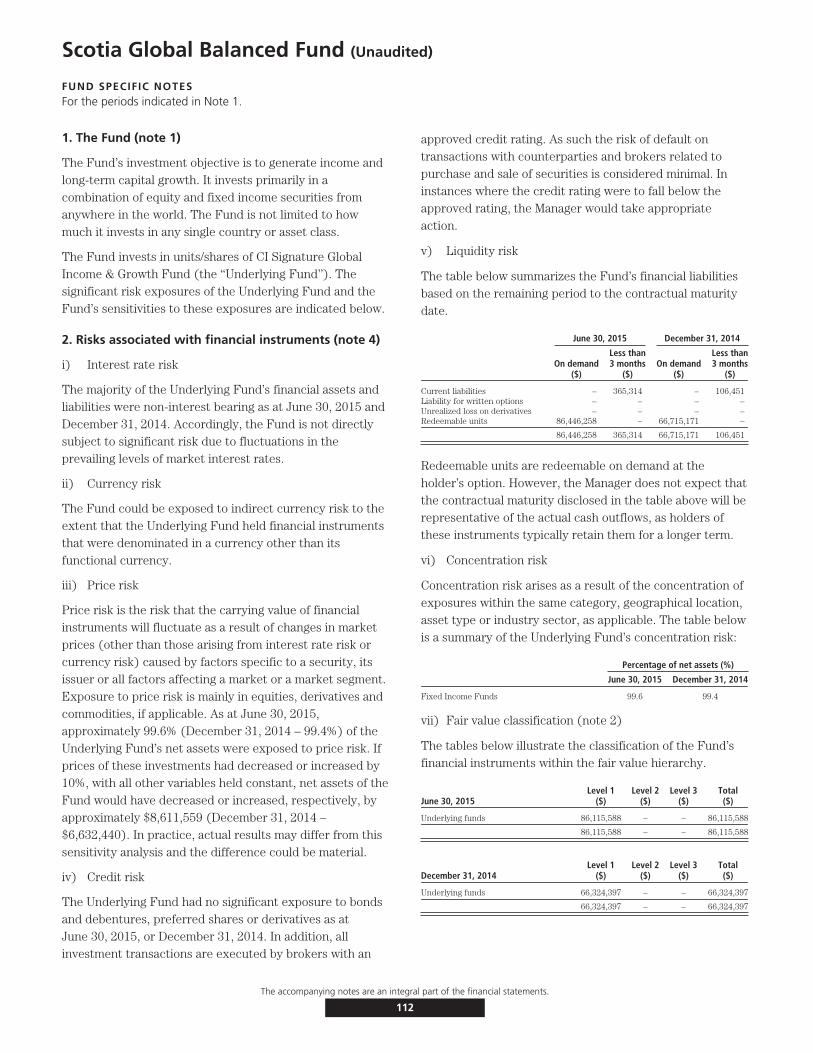
Scotia Global Balanced Fund (Unaudited)
FUND SPECIFIC NOTESFor the periods indicated in Note 1.
1. The Fund (note 1)
The Fund’s investment objective is to generate income andlong-term capital growth. It invests primarily in acombination of equity and fixed income securities fromanywhere in the world. The Fund is not limited to howmuch it invests in any single country or asset class.
The Fund invests in units/shares of CI Signature GlobalIncome & Growth Fund (the ‘‘Underlying Fund’’). Thesignificant risk exposures of the Underlying Fund and theFund’s sensitivities to these exposures are indicated below.
2. Risks associated with financial instruments (note 4)
i) Interest rate risk
The majority of the Underlying Fund’s financial assets andliabilities were non-interest bearing as at June 30, 2015 andDecember 31, 2014. Accordingly, the Fund is not directlysubject to significant risk due to fluctuations in theprevailing levels of market interest rates.
ii) Currency risk
The Fund could be exposed to indirect currency risk to theextent that the Underlying Fund held financial instrumentsthat were denominated in a currency other than itsfunctional currency.
iii) Price risk
Price risk is the risk that the carrying value of financialinstruments will fluctuate as a result of changes in marketprices (other than those arising from interest rate risk orcurrency risk) caused by factors specific to a security, itsissuer or all factors affecting a market or a market segment.Exposure to price risk is mainly in equities, derivatives andcommodities, if applicable. As at June 30, 2015,approximately 99.6% (December 31, 2014 – 99.4%) of theUnderlying Fund’s net assets were exposed to price risk. Ifprices of these investments had decreased or increased by10%, with all other variables held constant, net assets of theFund would have decreased or increased, respectively, byapproximately $8,611,559 (December 31, 2014 –$6,632,440). In practice, actual results may differ from thissensitivity analysis and the difference could be material.
iv) Credit risk
The Underlying Fund had no significant exposure to bondsand debentures, preferred shares or derivatives as atJune 30, 2015, or December 31, 2014. In addition, allinvestment transactions are executed by brokers with an
approved credit rating. As such the risk of default ontransactions with counterparties and brokers related topurchase and sale of securities is considered minimal. Ininstances where the credit rating were to fall below theapproved rating, the Manager would take appropriateaction.
v) Liquidity risk
The table below summarizes the Fund’s financial liabilitiesbased on the remaining period to the contractual maturitydate.
June 30, 2015 December 31, 2014
On demand($)
Less than3 months
($)On demand
($)
Less than3 months
($)
Current liabilities – 365,314 – 106,451Liability for written options – – – –Unrealized loss on derivatives – – – –Redeemable units 86,446,258 – 66,715,171 –
86,446,258 365,314 66,715,171 106,451
Redeemable units are redeemable on demand at theholder’s option. However, the Manager does not expect thatthe contractual maturity disclosed in the table above will berepresentative of the actual cash outflows, as holders ofthese instruments typically retain them for a longer term.
vi) Concentration risk
Concentration risk arises as a result of the concentration ofexposures within the same category, geographical location,asset type or industry sector, as applicable. The table belowis a summary of the Underlying Fund’s concentration risk:
Percentage of net assets (%)
June 30, 2015 December 31, 2014
Fixed Income Funds 99.6 99.4
vii) Fair value classification (note 2)
The tables below illustrate the classification of the Fund’sfinancial instruments within the fair value hierarchy.
June 30, 2015Level 1
($)Level 2
($)Level 3
($)Total($)
Underlying funds 86,115,588 – – 86,115,588
86,115,588 – – 86,115,588
December 31, 2014Level 1
($)Level 2
($)Level 3
($)Total($)
Underlying funds 66,324,397 – – 66,324,397
66,324,397 – – 66,324,397
The accompanying notes are an integral part of the financial statements.
112
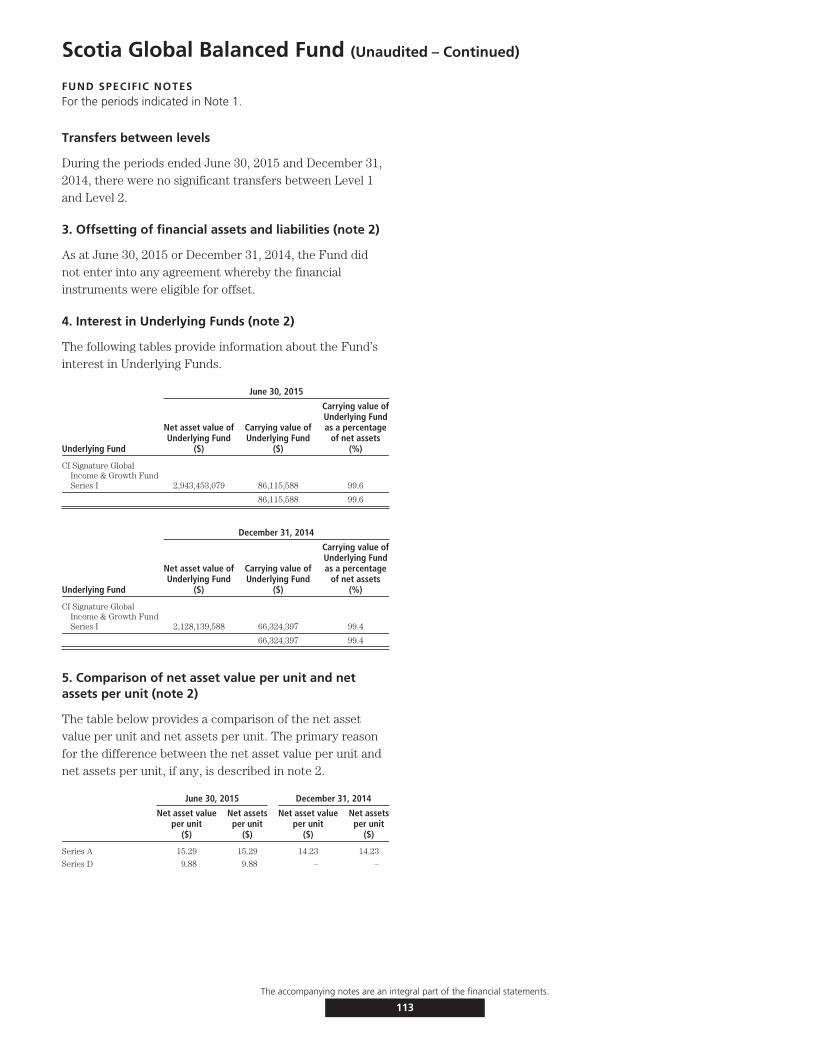
Scotia Global Balanced Fund (Unaudited – Continued)
FUND SPECIFIC NOTESFor the periods indicated in Note 1.
Transfers between levels
During the periods ended June 30, 2015 and December 31,2014, there were no significant transfers between Level 1and Level 2.
3. Offsetting of financial assets and liabilities (note 2)
As at June 30, 2015 or December 31, 2014, the Fund didnot enter into any agreement whereby the financialinstruments were eligible for offset.
4. Interest in Underlying Funds (note 2)
The following tables provide information about the Fund’sinterest in Underlying Funds.
June 30, 2015
Underlying Fund
Net asset value ofUnderlying Fund
($)
Carrying value ofUnderlying Fund
($)
Carrying value ofUnderlying Fundas a percentage
of net assets(%)
CI Signature GlobalIncome & Growth FundSeries I 2,943,453,079 86,115,588 99.6
86,115,588 99.6
December 31, 2014
Underlying Fund
Net asset value ofUnderlying Fund
($)
Carrying value ofUnderlying Fund
($)
Carrying value ofUnderlying Fundas a percentage
of net assets(%)
CI Signature GlobalIncome & Growth FundSeries I 2,128,139,588 66,324,397 99.4
66,324,397 99.4
5. Comparison of net asset value per unit and netassets per unit (note 2)
The table below provides a comparison of the net assetvalue per unit and net assets per unit. The primary reasonfor the difference between the net asset value per unit andnet assets per unit, if any, is described in note 2.
June 30, 2015 December 31, 2014
Net asset valueper unit
($)
Net assetsper unit
($)
Net asset valueper unit
($)
Net assetsper unit
($)
Series A 15.29 15.29 14.23 14.23
Series D 9.88 9.88 – –
The accompanying notes are an integral part of the financial statements.
113
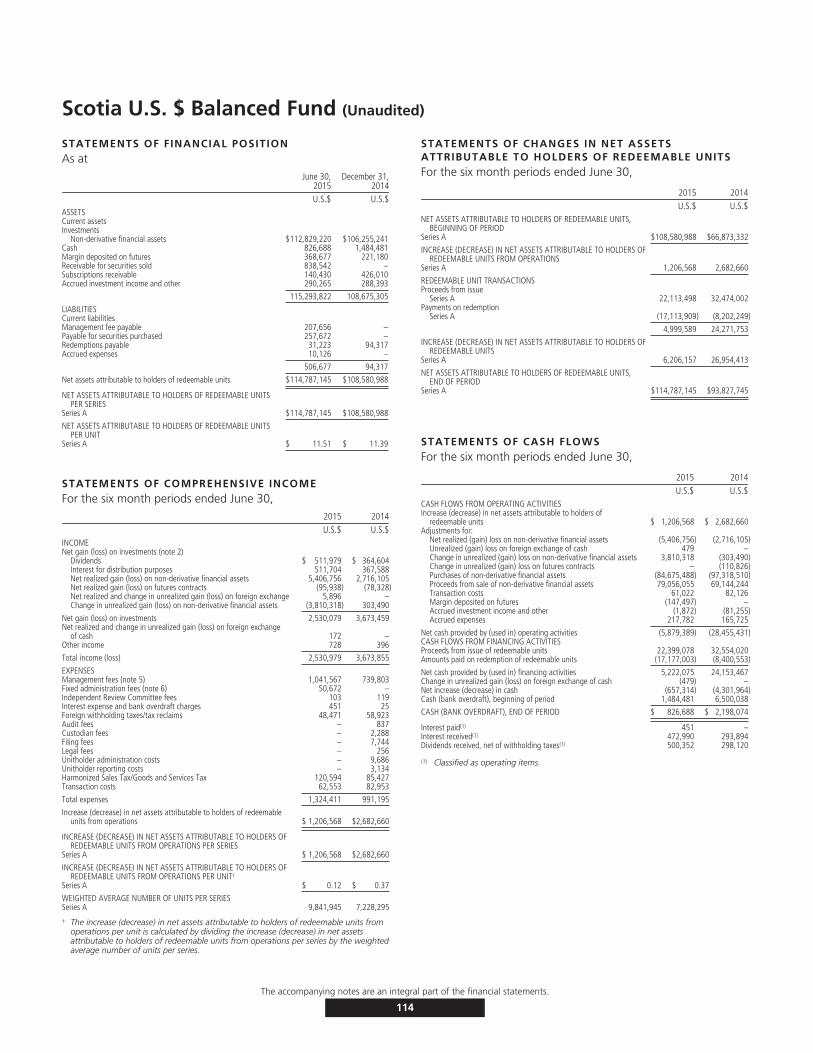
Scotia U.S. $ Balanced Fund (Unaudited)
STATEMENTS OF FINANCIAL POSITIONAs at
June 30,2015
December 31,2014
U.S.$ U.S.$ASSETSCurrent assetsInvestments
Non-derivative financial assets $112,829,220 $106,255,241Cash 826,688 1,484,481Margin deposited on futures 368,677 221,180Receivable for securities sold 838,542 –Subscriptions receivable 140,430 426,010Accrued investment income and other 290,265 288,393
115,293,822 108,675,305
LIABILITIESCurrent liabilitiesManagement fee payable 207,656 –Payable for securities purchased 257,672 –Redemptions payable 31,223 94,317Accrued expenses 10,126 –
506,677 94,317
Net assets attributable to holders of redeemable units $114,787,145 $108,580,988
NET ASSETS ATTRIBUTABLE TO HOLDERS OF REDEEMABLE UNITSPER SERIES
Series A $114,787,145 $108,580,988
NET ASSETS ATTRIBUTABLE TO HOLDERS OF REDEEMABLE UNITSPER UNIT
Series A $ 11.51 $ 11.39
STATEMENTS OF COMPREHENSIVE INCOMEFor the six month periods ended June 30,
2015 2014U.S.$ U.S.$
INCOMENet gain (loss) on investments (note 2)
Dividends $ 511,979 $ 364,604Interest for distribution purposes 511,704 367,588Net realized gain (loss) on non-derivative financial assets 5,406,756 2,716,105Net realized gain (loss) on futures contracts (95,938) (78,328)Net realized and change in unrealized gain (loss) on foreign exchange 5,896 –Change in unrealized gain (loss) on non-derivative financial assets (3,810,318) 303,490
Net gain (loss) on investments 2,530,079 3,673,459Net realized and change in unrealized gain (loss) on foreign exchange
of cash 172 –Other income 728 396
Total income (loss) 2,530,979 3,673,855
EXPENSESManagement fees (note 5) 1,041,567 739,803Fixed administration fees (note 6) 50,672 –Independent Review Committee fees 103 119Interest expense and bank overdraft charges 451 25Foreign withholding taxes/tax reclaims 48,471 58,923Audit fees – 837Custodian fees – 2,288Filing fees – 7,744Legal fees – 256Unitholder administration costs – 9,686Unitholder reporting costs – 3,134Harmonized Sales Tax/Goods and Services Tax 120,594 85,427Transaction costs 62,553 82,953
Total expenses 1,324,411 991,195
Increase (decrease) in net assets attributable to holders of redeemableunits from operations $ 1,206,568 $2,682,660
INCREASE (DECREASE) IN NET ASSETS ATTRIBUTABLE TO HOLDERS OFREDEEMABLE UNITS FROM OPERATIONS PER SERIES
Series A $ 1,206,568 $2,682,660
INCREASE (DECREASE) IN NET ASSETS ATTRIBUTABLE TO HOLDERS OFREDEEMABLE UNITS FROM OPERATIONS PER UNIT†
Series A $ 0.12 $ 0.37
WEIGHTED AVERAGE NUMBER OF UNITS PER SERIESSeries A 9,841,945 7,228,295
† The increase (decrease) in net assets attributable to holders of redeemable units fromoperations per unit is calculated by dividing the increase (decrease) in net assetsattributable to holders of redeemable units from operations per series by the weightedaverage number of units per series.
STATEMENTS OF CHANGES IN NET ASSETSATTRIBUTABLE TO HOLDERS OF REDEEMABLE UNITSFor the six month periods ended June 30,
2015 2014U.S.$ U.S.$
NET ASSETS ATTRIBUTABLE TO HOLDERS OF REDEEMABLE UNITS,BEGINNING OF PERIOD
Series A $108,580,988 $66,873,332
INCREASE (DECREASE) IN NET ASSETS ATTRIBUTABLE TO HOLDERS OFREDEEMABLE UNITS FROM OPERATIONS
Series A 1,206,568 2,682,660
REDEEMABLE UNIT TRANSACTIONSProceeds from issue
Series A 22,113,498 32,474,002Payments on redemption
Series A (17,113,909) (8,202,249)
4,999,589 24,271,753
INCREASE (DECREASE) IN NET ASSETS ATTRIBUTABLE TO HOLDERS OFREDEEMABLE UNITS
Series A 6,206,157 26,954,413
NET ASSETS ATTRIBUTABLE TO HOLDERS OF REDEEMABLE UNITS,END OF PERIOD
Series A $114,787,145 $93,827,745
STATEMENTS OF CASH FLOWSFor the six month periods ended June 30,
2015 2014U.S.$ U.S.$
CASH FLOWS FROM OPERATING ACTIVITIESIncrease (decrease) in net assets attributable to holders of
redeemable units $ 1,206,568 $ 2,682,660Adjustments for:
Net realized (gain) loss on non-derivative financial assets (5,406,756) (2,716,105)Unrealized (gain) loss on foreign exchange of cash 479 –Change in unrealized (gain) loss on non-derivative financial assets 3,810,318 (303,490)Change in unrealized (gain) loss on futures contracts – (110,826)Purchases of non-derivative financial assets (84,675,488) (97,318,510)Proceeds from sale of non-derivative financial assets 79,056,055 69,144,244Transaction costs 61,022 82,126Margin deposited on futures (147,497) –Accrued investment income and other (1,872) (81,255)Accrued expenses 217,782 165,725
Net cash provided by (used in) operating activities (5,879,389) (28,455,431)CASH FLOWS FROM FINANCING ACTIVITIESProceeds from issue of redeemable units 22,399,078 32,554,020Amounts paid on redemption of redeemable units (17,177,003) (8,400,553)
Net cash provided by (used in) financing activities 5,222,075 24,153,467Change in unrealized gain (loss) on foreign exchange of cash (479) –Net increase (decrease) in cash (657,314) (4,301,964)Cash (bank overdraft), beginning of period 1,484,481 6,500,038
CASH (BANK OVERDRAFT), END OF PERIOD $ 826,688 $ 2,198,074
Interest paid(1) 451 –Interest received(1) 472,990 293,894Dividends received, net of withholding taxes(1) 500,352 298,120
(1) Classified as operating items.
The accompanying notes are an integral part of the financial statements.
114
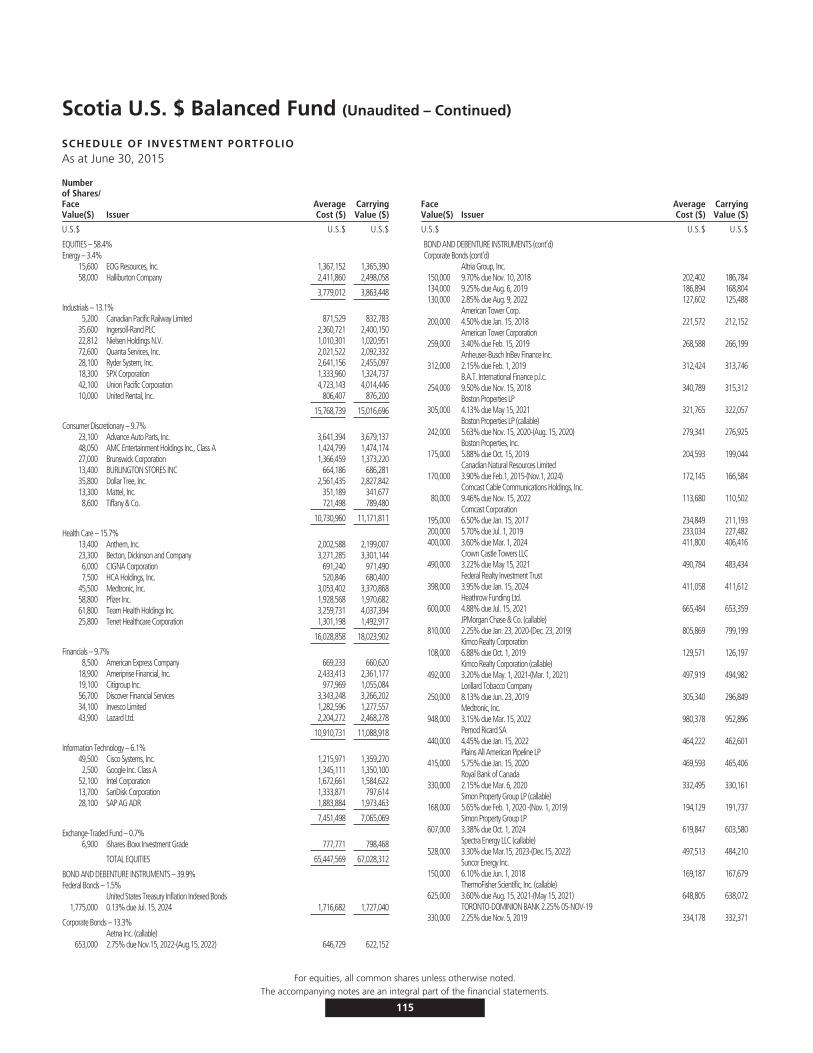
Scotia U.S. $ Balanced Fund (Unaudited – Continued)
SCHEDULE OF INVESTMENT PORTFOLIOAs at June 30, 2015
Numberof Shares/FaceValue($) Issuer
AverageCost ($)
CarryingValue ($)
U.S.$ U.S.$ U.S.$
EQUITIES – 58.4%Energy – 3.4%
15,600 EOG Resources, Inc. 1,367,152 1,365,39058,000 Halliburton Company 2,411,860 2,498,058
3,779,012 3,863,448
Industrials – 13.1%5,200 Canadian Pacific Railway Limited 871,529 832,783
35,600 Ingersoll-Rand PLC 2,360,721 2,400,15022,812 Nielsen Holdings N.V. 1,010,301 1,020,95172,600 Quanta Services, Inc. 2,021,522 2,092,33228,100 Ryder System, Inc. 2,641,156 2,455,09718,300 SPX Corporation 1,333,960 1,324,73742,100 Union Pacific Corporation 4,723,143 4,014,44610,000 United Rental, Inc. 806,407 876,200
15,768,739 15,016,696
Consumer Discretionary – 9.7%23,100 Advance Auto Parts, Inc. 3,641,394 3,679,13748,050 AMC Entertainment Holdings Inc., Class A 1,424,799 1,474,17427,000 Brunswick Corporation 1,366,459 1,373,22013,400 BURLINGTON STORES INC 664,186 686,28135,800 Dollar Tree, Inc. 2,561,435 2,827,84213,300 Mattel, Inc. 351,189 341,6778,600 Tiffany & Co. 721,498 789,480
10,730,960 11,171,811
Health Care – 15.7%13,400 Anthem, Inc. 2,002,588 2,199,00723,300 Becton, Dickinson and Company 3,271,285 3,301,1446,000 CIGNA Corporation 691,240 971,4907,500 HCA Holdings, Inc. 520,846 680,400
45,500 Medtronic, Inc. 3,053,402 3,370,86858,800 Pfizer Inc. 1,928,568 1,970,68261,800 Team Health Holdings Inc. 3,259,731 4,037,39425,800 Tenet Healthcare Corporation 1,301,198 1,492,917
16,028,858 18,023,902
Financials – 9.7%8,500 American Express Company 669,233 660,620
18,900 Ameriprise Financial, Inc. 2,433,413 2,361,17719,100 Citigroup Inc. 977,969 1,055,08456,700 Discover Financial Services 3,343,248 3,266,20234,100 Invesco Limited 1,282,596 1,277,55743,900 Lazard Ltd. 2,204,272 2,468,278
10,910,731 11,088,918
Information Technology – 6.1%49,500 Cisco Systems, Inc. 1,215,971 1,359,2702,500 Google Inc. Class A 1,345,111 1,350,100
52,100 Intel Corporation 1,672,661 1,584,62213,700 SanDisk Corporation 1,333,871 797,61428,100 SAP AG ADR 1,883,884 1,973,463
7,451,498 7,065,069
Exchange-Traded Fund – 0.7%6,900 iShares iBoxx Investment Grade 777,771 798,468
TOTAL EQUITIES 65,447,569 67,028,312
BOND AND DEBENTURE INSTRUMENTS – 39.9%Federal Bonds – 1.5%
United States Treasury Inflation Indexed Bonds1,775,000 0.13% due Jul. 15, 2024 1,716,682 1,727,040
Corporate Bonds – 13.3%Aetna Inc. (callable)
653,000 2.75% due Nov.15, 2022-(Aug.15, 2022) 646,729 622,152
FaceValue($) Issuer
AverageCost ($)
CarryingValue ($)
U.S.$ U.S.$ U.S.$
BOND AND DEBENTURE INSTRUMENTS (cont’d)Corporate Bonds (cont’d)
Altria Group, Inc.150,000 9.70% due Nov. 10, 2018 202,402 186,784134,000 9.25% due Aug. 6, 2019 186,894 168,804130,000 2.85% due Aug. 9, 2022 127,602 125,488
American Tower Corp.200,000 4.50% due Jan. 15, 2018 221,572 212,152
American Tower Corporation259,000 3.40% due Feb. 15, 2019 268,588 266,199
Anheuser-Busch InBev Finance Inc.312,000 2.15% due Feb. 1, 2019 312,424 313,746
B.A.T. International Finance p.l.c.254,000 9.50% due Nov. 15, 2018 340,789 315,312
Boston Properties LP305,000 4.13% due May 15, 2021 321,765 322,057
Boston Properties LP (callable)242,000 5.63% due Nov. 15, 2020-(Aug. 15, 2020) 279,341 276,925
Boston Properties, Inc.175,000 5.88% due Oct. 15, 2019 204,593 199,044
Canadian Natural Resources Limited170,000 3.90% due Feb.1, 2015-(Nov.1, 2024) 172,145 166,584
Comcast Cable Communications Holdings, Inc.80,000 9.46% due Nov. 15, 2022 113,680 110,502
Comcast Corporation195,000 6.50% due Jan. 15, 2017 234,849 211,193200,000 5.70% due Jul. 1, 2019 233,034 227,482400,000 3.60% due Mar. 1, 2024 411,800 406,416
Crown Castle Towers LLC490,000 3.22% due May 15, 2021 490,784 483,434
Federal Realty Investment Trust398,000 3.95% due Jan. 15, 2024 411,058 411,612
Heathrow Funding Ltd.600,000 4.88% due Jul. 15, 2021 665,484 653,359
JPMorgan Chase & Co. (callable)810,000 2.25% due Jan. 23, 2020-(Dec. 23, 2019) 805,869 799,199
Kimco Realty Corporation108,000 6.88% due Oct. 1, 2019 129,571 126,197
Kimco Realty Corporation (callable)492,000 3.20% due May. 1, 2021-(Mar. 1, 2021) 497,919 494,982
Lorillard Tobacco Company250,000 8.13% due Jun. 23, 2019 305,340 296,849
Medtronic, Inc.948,000 3.15% due Mar. 15, 2022 980,378 952,896
Pernod Ricard SA440,000 4.45% due Jan. 15, 2022 464,222 462,601
Plains All American Pipeline LP415,000 5.75% due Jan. 15, 2020 469,593 465,406
Royal Bank of Canada330,000 2.15% due Mar. 6, 2020 332,495 330,161
Simon Property Group LP (callable)168,000 5.65% due Feb. 1, 2020 -(Nov. 1, 2019) 194,129 191,737
Simon Property Group LP607,000 3.38% due Oct. 1, 2024 619,847 603,580
Spectra Energy LLC (callable)528,000 3.30% due Mar.15, 2023-(Dec.15, 2022) 497,513 484,210
Suncor Energy Inc.150,000 6.10% due Jun. 1, 2018 169,187 167,679
ThermoFisher Scientific, Inc. (callable)625,000 3.60% due Aug. 15, 2021-(May 15, 2021) 648,805 638,072
TORONTO-DOMINION BANK 2.25% 05-NOV-19330,000 2.25% due Nov. 5, 2019 334,178 332,371
For equities, all common shares unless otherwise noted.The accompanying notes are an integral part of the financial statements.
115

Scotia U.S. $ Balanced Fund (Unaudited – Continued)
SCHEDULE OF INVESTMENT PORTFOLIO
FaceValue($) Issuer
AverageCost ($)
CarryingValue ($)
U.S.$ U.S.$ U.S.$
BOND AND DEBENTURE INSTRUMENTS (cont’d)Corporate Bonds (cont’d)
UnitedHealth Group Inc. (callable)540,000 3.38% due Nov.15, 2021-(Aug.15, 2021) 564,262 551,256
UnitedHealth Group Incorporated396,000 2.30% due Dec. 15, 2019 401,790 398,760
Ventas Realty LP / Ventas Capital Corp. (callable)802,000 2.70% due Apr. 1, 2020-(Jan. 1, 2020) 802,006 800,528
Verizon Communications Inc.325,000 3.45% due Mar. 15, 2021 326,028 332,023272,000 5.15% due Sep. 15, 2023 306,809 298,793
WellPoint Inc.95,000 3.50% due Aug. 15, 2024 96,145 91,574
Wells Fargo & Company800,000 2.13% due Apr. 22, 2019 806,672 803,240
15,598,291 15,301,359
United States Treasury Notes – 25.1 %3,000,000 3.63% due Feb. 15, 2021 3,329,531 3,291,5132,000,000 1.75% due May 15, 2023 1,904,629 1,935,400
650,000 2.75% due Nov. 15, 2023 651,625 676,0232,000,000 0.88% due Nov. 30, 2016 2,013,214 2,011,5102,005,000 2.50% due Jun. 30, 2017 2,100,575 2,079,0855,000,000 0.63% due Sep. 30, 2017 4,945,995 4,987,3759,500,000 2.38% due May 31, 2018 9,912,971 9,884,015
500,000 1.63% due Jun. 30, 2019 504,375 504,735200,000 2.00% due Feb. 15, 2022 195,047 199,951
1,410,000 1.63% due Nov. 15, 2022 1,366,360 1,363,3291,800,000 2.50% due Aug. 15, 2023 1,758,992 1,839,573
28,683,314 28,772,509
TOTAL BOND AND DEBENTURES 45,998,287 45,800,908
TOTAL INVESTMENT PORTFOLIO 111,445,856 112,829,220
Futures Contracts – 0.3% 368,677OTHER ASSETS, LESS LIABILITIES – 1.4% 1,589,248
NET ASSETS – 100.0% 114,787,145
Expiry DateNumber ofContracts Futures Contracts Counterparty Credit Risk
ContractualValue
U.S. ($)Fair Value
U.S. ($)Appreciation/
(Depreciation) ($)BOND FUTURES CONTRACTSSep. 2015 (35) U.S. 2 Year Treasury Note Futures Societe General Canada Inc A (7,646,406) (7,662,813) (16,406)Sep. 2015 (19) U.S. 5 Year Treasury Note Futures Societe General Canada Inc A (2,262,188) (2,265,869) (3,711)Sep. 2015 (33) U.S. 10 Year Treasury Note Futures Societe General Canada Inc A (4,185,328) (4,163,672) 21,656Sep. 2015 (10) U.S. 10 Year Treasury Note Futures Merrill Lynch A- (1,275,620) (1,261,719) 13,906
15,445
The above bond futures contracts are financial agreements to purchase/sell the bond at a contracted price on a specific future date. However, the Fund does not intend to purchase/sell the bond onsettlement. Rather, it intends to close out each bond futures contracts before settlement by entering into equal, but offsetting bond futures contracts.
The accompanying notes are an integral part of the financial statements.
116

Scotia U.S. $ Balanced Fund (Unaudited)
FUND SPECIFIC NOTESFor the periods indicated in Note 1.
1. The Fund (note 1)
The Fund’s investment objective is to provide long-termcapital growth and current income in U.S. dollars. It investsprimarily in a combination of fixed income and equitysecurities that are denominated in U.S. dollars.
2. Risks associated with financial instruments (note 4)
i) Interest rate risk
The table below summarizes the Fund’s exposure tointerest rate risk by the remaining term to maturity (earlierof maturity date or interest reset date) of the Fund’sportfolio, excluding cash, money market instruments,underlying funds, preferred shares and overdrafts, asapplicable.
Interest rate exposureJune 30, 2015
($)December 31, 2014
($)
Less than 1 year – 226,9721-3 years 19,553,008 11,548,2343-5 years 6,726,554 11,819,1925-10 years 19,521,346 17,734,808> 10 years – –
45,800,908 41,329,206
As at June 30, 2015 had the prevailing interest ratesincreased or decreased by 0.25%, assuming a parallel shiftin the yield curve and all other variables held constant, netassets attributable to holders of redeemable units wouldhave decreased or increased, respectively, by $318,396 orapproximately 0.3% (December 31, 2014 – $470,292 orapproximately 0.4%). In practice, actual results may differfrom this sensitivity analysis and the difference could bematerial.
ii) Currency risk
The Fund did not have significant currency risk exposureas at June 30, 2015 or December 31, 2014.
iii) Price risk
Price risk is the risk that the carrying value of financialinstruments will fluctuate as a result of changes in marketprices (other than those arising from interest rate risk orcurrency risk) caused by factors specific to a security, itsissuer or all factors affecting a market or a market segment.Exposure to price risk is mainly in equities, derivatives andcommodities, if applicable. As at June 30, 2015,approximately 58.4% (December 31, 2014 – 59.8%) of theFund’s net assets were exposed to price risk. If prices ofthese investments had decreased or increased by 10%, withall other variables held constant, net assets of the Fund
would have decreased or increased, respectively, byapproximately $6,702,831 (December 31, 2014 –$6,492,604). In practice, actual results may differ from thissensitivity analysis and the difference could be material.
iv) Credit risk
The table below summarizes the credit ratings of the bondsand debentures, excluding cash and money marketinstruments but including preferred shares and derivatives,as applicable, held by the Fund.
June 30, 2015 December 31, 2014
Percentage oftotal bonds and
debentures(%)
Percentage ofnet assets
(%)
Percentage oftotal bonds and
debentures(%)
Percentage ofnet assets
(%)
Credit ratingsAAA 66.6 26.6 77.6 29.5AA 3.2 1.3 – –A 14.8 5.9 5.2 2.0BBB 15.4 6.1 16.6 6.3BB – – 0.1 0.1B – – 0.5 0.2
100.0 39.9 100.0 38.1
v) Liquidity risk
The table below summarizes the Fund’s financial liabilitiesbased on the remaining period to the contractual maturitydate.
June 30, 2015 December 31, 2014
On demand($)
Less than3 months
($)On demand
($)
Less than3 months
($)
Current liabilities – 506,677 – 94,317Liability for written options – – – –Unrealized loss on derivatives – – – –Redeemable units 114,787,145 – 108,580,988 –
114,787,145 506,677 108,580,988 94,317
Redeemable units are redeemable on demand at theholder’s option. However, the Manager does not expect thatthe contractual maturity disclosed in the table above will berepresentative of the actual cash outflows, as holders ofthese instruments typically retain them for a longer term.
vi) Concentration risk
Concentration risk arises as a result of the concentration ofexposures within the same category, geographical location,
The accompanying notes are an integral part of the financial statements.
117
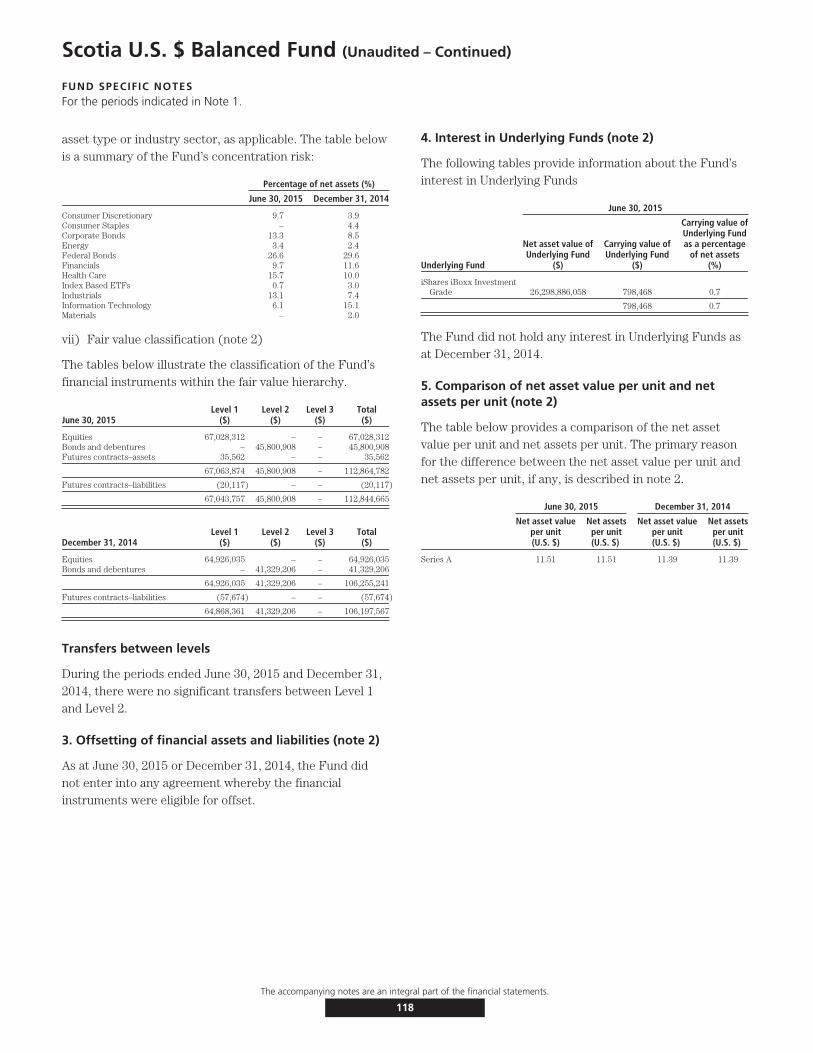
Scotia U.S. $ Balanced Fund (Unaudited – Continued)
FUND SPECIFIC NOTESFor the periods indicated in Note 1.
asset type or industry sector, as applicable. The table belowis a summary of the Fund’s concentration risk:
Percentage of net assets (%)
June 30, 2015 December 31, 2014
Consumer Discretionary 9.7 3.9Consumer Staples – 4.4Corporate Bonds 13.3 8.5Energy 3.4 2.4Federal Bonds 26.6 29.6Financials 9.7 11.6Health Care 15.7 10.0Index Based ETFs 0.7 3.0Industrials 13.1 7.4Information Technology 6.1 15.1Materials – 2.0
vii) Fair value classification (note 2)
The tables below illustrate the classification of the Fund’sfinancial instruments within the fair value hierarchy.
June 30, 2015Level 1
($)Level 2
($)Level 3
($)Total($)
Equities 67,028,312 – – 67,028,312Bonds and debentures – 45,800,908 – 45,800,908Futures contracts–assets 35,562 – – 35,562
67,063,874 45,800,908 – 112,864,782
Futures contracts–liabilities (20,117) – – (20,117)
67,043,757 45,800,908 – 112,844,665
December 31, 2014Level 1
($)Level 2
($)Level 3
($)Total($)
Equities 64,926,035 – – 64,926,035Bonds and debentures – 41,329,206 – 41,329,206
64,926,035 41,329,206 – 106,255,241
Futures contracts–liabilities (57,674) – – (57,674)
64,868,361 41,329,206 – 106,197,567
Transfers between levels
During the periods ended June 30, 2015 and December 31,2014, there were no significant transfers between Level 1and Level 2.
3. Offsetting of financial assets and liabilities (note 2)
As at June 30, 2015 or December 31, 2014, the Fund didnot enter into any agreement whereby the financialinstruments were eligible for offset.
4. Interest in Underlying Funds (note 2)
The following tables provide information about the Fund’sinterest in Underlying Funds
June 30, 2015
Underlying Fund
Net asset value ofUnderlying Fund
($)
Carrying value ofUnderlying Fund
($)
Carrying value ofUnderlying Fundas a percentage
of net assets(%)
iShares iBoxx InvestmentGrade 26,298,886,058 798,468 0.7
798,468 0.7
The Fund did not hold any interest in Underlying Funds asat December 31, 2014.
5. Comparison of net asset value per unit and netassets per unit (note 2)
The table below provides a comparison of the net assetvalue per unit and net assets per unit. The primary reasonfor the difference between the net asset value per unit andnet assets per unit, if any, is described in note 2.
June 30, 2015 December 31, 2014
Net asset valueper unit(U.S. $)
Net assetsper unit(U.S. $)
Net asset valueper unit(U.S. $)
Net assetsper unit(U.S. $)
Series A 11.51 11.51 11.39 11.39
The accompanying notes are an integral part of the financial statements.
118

Scotia Private Canadian Preferred Share Pool (Unaudited)
STATEMENTS OF FINANCIAL POSITIONAs at
June 30,2015
December 31,2014
ASSETSCurrent assetsInvestments
Non-derivative financial assets $420,063,488 $426,231,705Cash 8,148,588 6,635,825Receivable for securities sold – 293,491Subscriptions receivable 1,109,860 547,082Accrued investment income and other 542,004 567,493
429,863,940 434,275,596
LIABILITIESCurrent liabilitiesManagement fee payable 28,984 –Payable for securities purchased 2,900,223 3,655,750Redemptions payable 587,119 240,616Accrued expenses 12,519 –Distributions payable 471,292 –
4,000,137 3,896,366
Net assets attributable to holders of redeemable units $425,863,803 $430,379,230
NET ASSETS ATTRIBUTABLE TO HOLDERS OF REDEEMABLE UNITSPER SERIES
Series I $ 1,455,564 $ –Series M $424,408,239 $430,379,230
NET ASSETS ATTRIBUTABLE TO HOLDERS OF REDEEMABLE UNITSPER UNIT
Series I $ 8.57 $ –Series M $ 8.57 $ 9.47
STATEMENTS OF COMPREHENSIVE INCOMEFor the six month periods ended June 30,
2015 2014INCOMENet gain (loss) on investments (note 2)
Dividends $ 9,803,884 $ 8,060,505Interest for distribution purposes 19,288 81,376Net realized gain (loss) on non-derivative financial assets (10,705,575) (12,836,947)Change in unrealized gain (loss) on non-derivative financial assets (30,018,969) 19,273,560
Net gain (loss) on investments (30,901,372) 14,578,494Securities lending 9,558 5,616
Total income (loss) (30,891,814) 14,584,110
EXPENSESManagement fees (note 5) 148,510 112,448Fixed administration fees (note 6) 63,721 –Independent Review Committee fees 314 538Audit fees – 3,903Custodian fees – 2,749Filing fees – 14,600Legal fees – 1,149Unitholder administration costs – 23,844Unitholder reporting costs – 2,920Harmonized Sales Tax/Goods and Services Tax 21,681 13,725Transaction costs 174,018 578,600
Total expenses 408,244 754,476Expenses absorbed by the Manager – (43)
Net expenses 408,244 754,433
Increase (decrease) in net assets attributable to holders of redeemableunits from operations $(31,300,058) $ 13,829,677
INCREASE (DECREASE) IN NET ASSETS ATTRIBUTABLE TO HOLDERS OFREDEEMABLE UNITS FROM OPERATIONS PER SERIES
Series I $ (41,632) $ 701,096Series M $(31,258,426) $ 13,128,581
INCREASE (DECREASE) IN NET ASSETS ATTRIBUTABLE TO HOLDERS OFREDEEMABLE UNITS FROM OPERATIONS PER UNIT†
Series I $ (0.34) $ 0.13Series M $ (0.66) $ 0.39
WEIGHTED AVERAGE NUMBER OF UNITS PER SERIESSeries I 121,727 5,204,286Series M 47,345,162 34,053,726
† The increase (decrease) in net assets attributable to holders of redeemable units fromoperations per unit is calculated by dividing the increase (decrease) in net assetsattributable to holders of redeemable units from operations per series by the weightedaverage number of units per series.
STATEMENTS OF CHANGES IN NET ASSETSATTRIBUTABLE TO HOLDERS OF REDEEMABLE UNITSFor the six month periods ended June 30,
2015 2014NET ASSETS ATTRIBUTABLE TO HOLDERS OF REDEEMABLE UNITS,
BEGINNING OF PERIODSeries I $ – $ 119,898,357Series M 430,379,230 237,600,423
430,379,230 357,498,780
INCREASE (DECREASE) IN NET ASSETS ATTRIBUTABLE TO HOLDERSOF REDEEMABLE UNITS FROM OPERATIONS
Series I (41,632) 701,096Series M (31,258,426) 13,128,581
(31,300,058) 13,829,677
DISTRIBUTIONS TO HOLDERS OF REDEEMABLE UNITSFrom net investment income
Series I (30,290) (289,117)Series M (11,050,907) (9,355,025)
(11,081,197) (9,644,142)
REDEEMABLE UNIT TRANSACTIONSProceeds from issue
Series I 1,497,196 27,473,547Series M 74,900,561 180,745,876
Reinvested distributionsSeries I 30,290 289,117Series M 9,951,892 8,456,809
Payments on redemptionSeries I – (148,073,000)Series M (48,514,111) (44,907,128)
37,865,828 23,985,221
INCREASE (DECREASE) IN NET ASSETS ATTRIBUTABLE TO HOLDERSOF REDEEMABLE UNITS
Series I 1,455,564 (119,898,357)Series M (5,970,991) 148,069,113
(4,515,427) 28,170,756
NET ASSETS ATTRIBUTABLE TO HOLDERS OF REDEEMABLE UNITS,END OF PERIOD
Series I 1,455,564 –Series M 424,408,239 385,669,536
$425,863,803 $ 385,669,536
STATEMENTS OF CASH FLOWSFor the six month periods ended June 30,
2015 2014CASH FLOWS FROM OPERATING ACTIVITIESIncrease (decrease) in net assets attributable to holders of
redeemable units $ (31,300,058) $ 13,829,677Adjustments for:
Net realized (gain) loss on non-derivative financial assets 10,705,575 12,836,947Change in unrealized (gain) loss on non-derivative financial assets 30,018,969 (19,273,560)Purchases of non-derivative financial assets (101,322,189) (185,932,878)Proceeds from sale of non-derivative financial assets 66,129,807 183,450,681Transaction costs 174,018 578,600Accrued investment income and other 25,489 (112,603)Accrued expenses 41,503 30,108
Net cash provided by (used in) operating activities (25,526,886) 5,406,972CASH FLOWS FROM FINANCING ACTIVITIESProceeds from issue of redeemable units 75,834,980 206,599,773Amounts paid on redemption of redeemable units (48,167,608) (192,674,094)Distributions to unitholders of redeemable units (627,723) (503,774)
Net cash provided by (used in) financing activities 27,039,649 13,421,905Net increase (decrease) in cash 1,512,763 18,828,877Cash (bank overdraft), beginning of period 6,635,825 8,422,940
CASH (BANK OVERDRAFT), END OF PERIOD $ 8,148,588 $ 27,251,817
Interest received(1) 22,750 75,308Dividends received, net of withholding taxes(1) 9,825,911 7,953,972
(1) Classified as operating items.
The accompanying notes are an integral part of the financial statements.
119
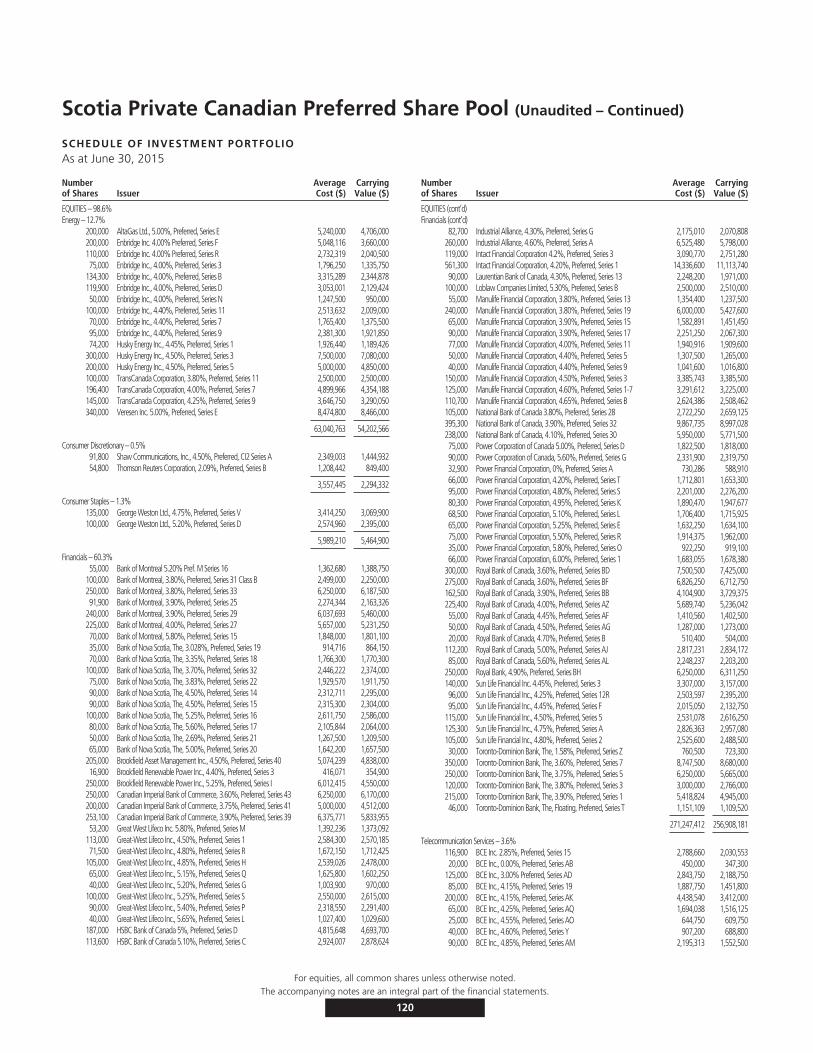
Scotia Private Canadian Preferred Share Pool (Unaudited – Continued)
SCHEDULE OF INVESTMENT PORTFOLIOAs at June 30, 2015
Numberof Shares Issuer
AverageCost ($)
CarryingValue ($)
EQUITIES – 98.6%Energy – 12.7%
200,000 AltaGas Ltd., 5.00%, Preferred, Series E 5,240,000 4,706,000200,000 Enbridge Inc. 4.00% Preferred, Series F 5,048,116 3,660,000110,000 Enbridge Inc. 4.00% Preferred, Series R 2,732,319 2,040,50075,000 Enbridge Inc., 4.00%, Preferred, Series 3 1,796,250 1,335,750
134,300 Enbridge Inc., 4.00%, Preferred, Series B 3,315,289 2,344,878119,900 Enbridge Inc., 4.00%, Preferred, Series D 3,053,001 2,129,42450,000 Enbridge Inc., 4.00%, Preferred, Series N 1,247,500 950,000
100,000 Enbridge Inc., 4.40%, Preferred, Series 11 2,513,632 2,009,00070,000 Enbridge Inc., 4.40%, Preferred, Series 7 1,765,400 1,375,50095,000 Enbridge Inc., 4.40%, Preferred, Series 9 2,381,300 1,921,85074,200 Husky Energy Inc., 4.45%, Preferred, Series 1 1,926,440 1,189,426
300,000 Husky Energy Inc., 4.50%, Preferred, Series 3 7,500,000 7,080,000200,000 Husky Energy Inc., 4.50%, Preferred, Series 5 5,000,000 4,850,000100,000 TransCanada Corporation, 3.80%, Preferred, Series 11 2,500,000 2,500,000196,400 TransCanada Corporation, 4.00%, Preferred, Series 7 4,899,966 4,354,188145,000 TransCanada Corporation, 4.25%, Preferred, Series 9 3,646,750 3,290,050340,000 Veresen Inc. 5.00%, Preferred, Series E 8,474,800 8,466,000
63,040,763 54,202,566
Consumer Discretionary – 0.5%91,800 Shaw Communications, Inc., 4.50%, Preferred, CI2 Series A 2,349,003 1,444,93254,800 Thomson Reuters Corporation, 2.09%, Preferred, Series B 1,208,442 849,400
3,557,445 2,294,332
Consumer Staples – 1.3%135,000 George Weston Ltd., 4.75%, Preferred, Series V 3,414,250 3,069,900100,000 George Weston Ltd., 5.20%, Preferred, Series D 2,574,960 2,395,000
5,989,210 5,464,900
Financials – 60.3%55,000 Bank of Montreal 5.20% Pref. M Series 16 1,362,680 1,388,750
100,000 Bank of Montreal, 3.80%, Preferred, Series 31 Class B 2,499,000 2,250,000250,000 Bank of Montreal, 3.80%, Preferred, Series 33 6,250,000 6,187,50091,900 Bank of Montreal, 3.90%, Preferred, Series 25 2,274,344 2,163,326
240,000 Bank of Montreal, 3.90%, Preferred, Series 29 6,037,693 5,460,000225,000 Bank of Montreal, 4.00%, Preferred, Series 27 5,657,000 5,231,25070,000 Bank of Montreal, 5.80%, Preferred, Series 15 1,848,000 1,801,10035,000 Bank of Nova Scotia, The, 3.028%, Preferred, Series 19 914,716 864,15070,000 Bank of Nova Scotia, The, 3.35%, Preferred, Series 18 1,766,300 1,770,300
100,000 Bank of Nova Scotia, The, 3.70%, Preferred, Series 32 2,446,222 2,374,00075,000 Bank of Nova Scotia, The, 3.83%, Preferred, Series 22 1,929,570 1,911,75090,000 Bank of Nova Scotia, The, 4.50%, Preferred, Series 14 2,312,711 2,295,00090,000 Bank of Nova Scotia, The, 4.50%, Preferred, Series 15 2,315,300 2,304,000
100,000 Bank of Nova Scotia, The, 5.25%, Preferred, Series 16 2,611,750 2,586,00080,000 Bank of Nova Scotia, The, 5.60%, Preferred, Series 17 2,105,844 2,064,00050,000 Bank of Nova Scotia, The, 2.69%, Preferred, Series 21 1,267,500 1,209,50065,000 Bank of Nova Scotia, The, 5.00%, Preferred, Series 20 1,642,200 1,657,500
205,000 Brookfield Asset Management Inc., 4.50%, Preferred, Series 40 5,074,239 4,838,00016,900 Brookfield Renewable Power Inc., 4.40%, Preferred, Series 3 416,071 354,900
250,000 Brookfield Renewable Power Inc., 5.25%, Preferred, Series I 6,012,415 4,550,000250,000 Canadian Imperial Bank of Commerce, 3.60%, Preferred, Series 43 6,250,000 6,170,000200,000 Canadian Imperial Bank of Commerce, 3.75%, Preferred, Series 41 5,000,000 4,512,000253,100 Canadian Imperial Bank of Commerce, 3.90%, Preferred, Series 39 6,375,771 5,833,95553,200 Great West Lifeco Inc. 5.80%, Preferred, Series M 1,392,236 1,373,092
113,000 Great-West Lifeco Inc., 4.50%, Preferred, Series 1 2,584,300 2,570,18571,500 Great-West Lifeco Inc., 4.80%, Preferred, Series R 1,672,150 1,712,425
105,000 Great-West Lifeco Inc., 4.85%, Preferred, Series H 2,539,026 2,478,00065,000 Great-West Lifeco Inc., 5.15%, Preferred, Series Q 1,625,800 1,602,25040,000 Great-West Lifeco Inc., 5.20%, Preferred, Series G 1,003,900 970,000
100,000 Great-West Lifeco Inc., 5.25%, Preferred, Series S 2,550,000 2,615,00090,000 Great-West Lifeco Inc., 5.40%, Preferred, Series P 2,318,550 2,291,40040,000 Great-West Lifeco Inc., 5.65%, Preferred, Series L 1,027,400 1,029,600
187,000 HSBC Bank of Canada 5%, Preferred, Series D 4,815,648 4,693,700113,600 HSBC Bank of Canada 5.10%, Preferred, Series C 2,924,007 2,878,624
Numberof Shares Issuer
AverageCost ($)
CarryingValue ($)
EQUITIES (cont’d)Financials (cont’d)
82,700 Industrial Alliance, 4.30%, Preferred, Series G 2,175,010 2,070,808260,000 Industrial Alliance, 4.60%, Preferred, Series A 6,525,480 5,798,000119,000 Intact Financial Corporation 4.2%, Preferred, Series 3 3,090,770 2,751,280561,300 Intact Financial Corporation, 4.20%, Preferred, Series 1 14,336,600 11,113,74090,000 Laurentian Bank of Canada, 4.30%, Preferred, Series 13 2,248,200 1,971,000
100,000 Loblaw Companies Limited, 5.30%, Preferred, Series B 2,500,000 2,510,00055,000 Manulife Financial Corporation, 3.80%, Preferred, Series 13 1,354,400 1,237,500
240,000 Manulife Financial Corporation, 3.80%, Preferred, Series 19 6,000,000 5,427,60065,000 Manulife Financial Corporation, 3.90%, Preferred, Series 15 1,582,891 1,451,45090,000 Manulife Financial Corporation, 3.90%, Preferred, Series 17 2,251,250 2,067,30077,000 Manulife Financial Corporation, 4.00%, Preferred, Series 11 1,940,916 1,909,60050,000 Manulife Financial Corporation, 4.40%, Preferred, Series 5 1,307,500 1,265,00040,000 Manulife Financial Corporation, 4.40%, Preferred, Series 9 1,041,600 1,016,800
150,000 Manulife Financial Corporation, 4.50%, Preferred, Series 3 3,385,743 3,385,500125,000 Manulife Financial Corporation, 4.60%, Preferred, Series 1-7 3,291,612 3,225,000110,700 Manulife Financial Corporation, 4.65%, Preferred, Series B 2,624,386 2,508,462105,000 National Bank of Canada 3.80%, Preferred, Series 28 2,722,250 2,659,125395,300 National Bank of Canada, 3.90%, Preferred, Series 32 9,867,735 8,997,028238,000 National Bank of Canada, 4.10%, Preferred, Series 30 5,950,000 5,771,50075,000 Power Corporation of Canada 5.00%, Preferred, Series D 1,822,500 1,818,00090,000 Power Corporation of Canada, 5.60%, Preferred, Series G 2,331,900 2,319,75032,900 Power Financial Corporation, 0%, Preferred, Series A 730,286 588,91066,000 Power Financial Corporation, 4.20%, Preferred, Series T 1,712,801 1,653,30095,000 Power Financial Corporation, 4.80%, Preferred, Series S 2,201,000 2,276,20080,300 Power Financial Corporation, 4.95%, Preferred, Series K 1,890,470 1,947,67768,500 Power Financial Corporation, 5.10%, Preferred, Series L 1,706,400 1,715,92565,000 Power Financial Corporation, 5.25%, Preferred, Series E 1,632,250 1,634,10075,000 Power Financial Corporation, 5.50%, Preferred, Series R 1,914,375 1,962,00035,000 Power Financial Corporation, 5.80%, Preferred, Series O 922,250 919,10066,000 Power Financial Corporation, 6.00%, Preferred, Series 1 1,683,055 1,678,380
300,000 Royal Bank of Canada, 3.60%, Preferred, Series BD 7,500,500 7,425,000275,000 Royal Bank of Canada, 3.60%, Preferred, Series BF 6,826,250 6,712,750162,500 Royal Bank of Canada, 3.90%, Preferred, Series BB 4,104,900 3,729,375225,400 Royal Bank of Canada, 4.00%, Preferred, Series AZ 5,689,740 5,236,04255,000 Royal Bank of Canada, 4.45%, Preferred, Series AF 1,410,560 1,402,50050,000 Royal Bank of Canada, 4.50%, Preferred, Series AG 1,287,000 1,273,00020,000 Royal Bank of Canada, 4.70%, Preferred, Series B 510,400 504,000
112,200 Royal Bank of Canada, 5.00%, Preferred, Series AJ 2,817,231 2,834,17285,000 Royal Bank of Canada, 5.60%, Preferred, Series AL 2,248,237 2,203,200
250,000 Royal Bank, 4.90%, Preferred, Series BH 6,250,000 6,311,250140,000 Sun Life Financial Inc. 4.45%, Preferred, Series 3 3,307,000 3,157,00096,000 Sun Life Financial Inc., 4.25%, Preferred, Series 12R 2,503,597 2,395,20095,000 Sun Life Financial Inc., 4.45%, Preferred, Series F 2,015,050 2,132,750
115,000 Sun Life Financial Inc., 4.50%, Preferred, Series 5 2,531,078 2,616,250125,300 Sun Life Financial Inc., 4.75%, Preferred, Series A 2,826,363 2,957,080105,000 Sun Life Financial Inc., 4.80%, Preferred, Series 2 2,525,600 2,488,50030,000 Toronto-Dominion Bank, The, 1.58%, Preferred, Series Z 760,500 723,300
350,000 Toronto-Dominion Bank, The, 3.60%, Preferred, Series 7 8,747,500 8,680,000250,000 Toronto-Dominion Bank, The, 3.75%, Preferred, Series 5 6,250,000 5,665,000120,000 Toronto-Dominion Bank, The, 3.80%, Preferred, Series 3 3,000,000 2,766,000215,000 Toronto-Dominion Bank, The, 3.90%, Preferred, Series 1 5,418,824 4,945,00046,000 Toronto-Dominion Bank, The, Floating, Preferred, Series T 1,151,109 1,109,520
271,247,412 256,908,181
Telecommunication Services – 3.6%116,900 BCE Inc. 2.85%, Preferred, Series 15 2,788,660 2,030,55320,000 BCE Inc., 0.00%, Preferred, Series AB 450,000 347,300
125,000 BCE Inc., 3.00% Preferred, Series AD 2,843,750 2,188,75085,000 BCE Inc., 4.15%, Preferred, Series 19 1,887,750 1,451,800
200,000 BCE Inc., 4.15%, Preferred, Series AK 4,438,540 3,412,00065,000 BCE Inc., 4.25%, Preferred, Series AQ 1,694,038 1,516,12525,000 BCE Inc., 4.55%, Preferred, Series AO 644,750 609,75040,000 BCE Inc., 4.60%, Preferred, Series Y 907,200 688,80090,000 BCE Inc., 4.85%, Preferred, Series AM 2,195,313 1,552,500
For equities, all common shares unless otherwise noted.The accompanying notes are an integral part of the financial statements.
120
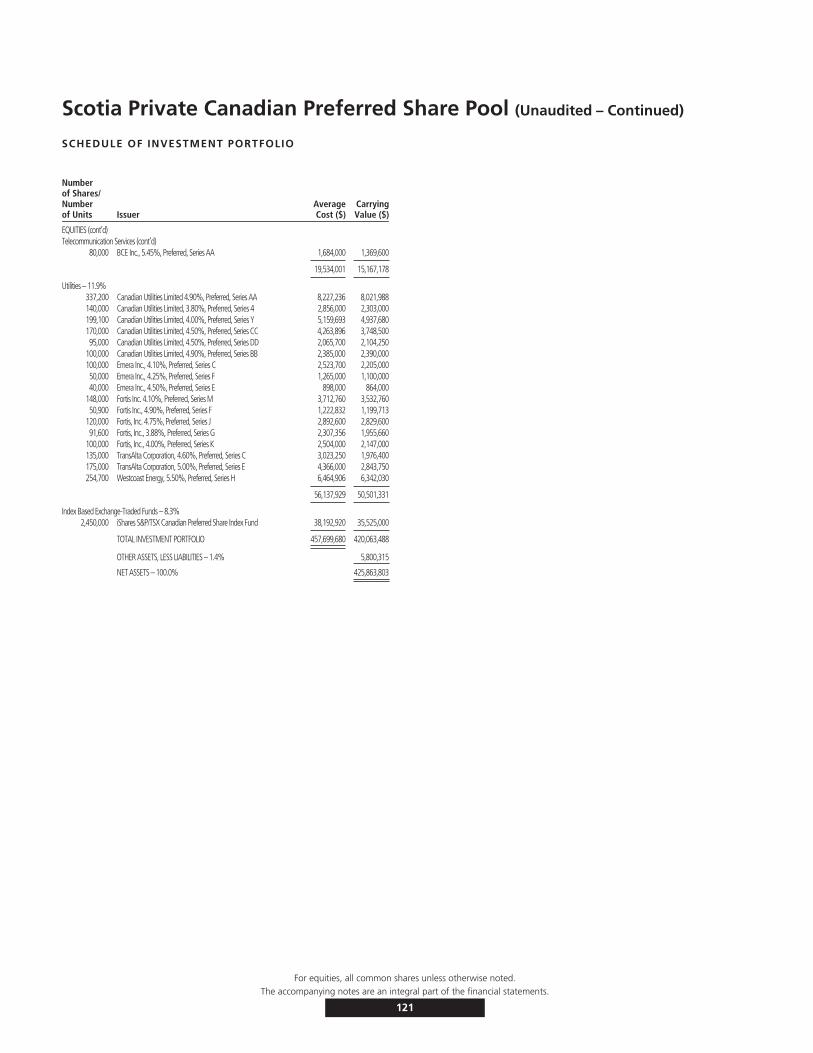
Scotia Private Canadian Preferred Share Pool (Unaudited – Continued)
SCHEDULE OF INVESTMENT PORTFOLIO
Numberof Shares/Numberof Units Issuer
AverageCost ($)
CarryingValue ($)
EQUITIES (cont’d)Telecommunication Services (cont’d)
80,000 BCE Inc., 5.45%, Preferred, Series AA 1,684,000 1,369,600
19,534,001 15,167,178
Utilities – 11.9%337,200 Canadian Utilities Limited 4.90%, Preferred, Series AA 8,227,236 8,021,988140,000 Canadian Utilities Limited, 3.80%, Preferred, Series 4 2,856,000 2,303,000199,100 Canadian Utilities Limited, 4.00%, Preferred, Series Y 5,159,693 4,937,680170,000 Canadian Utilities Limited, 4.50%, Preferred, Series CC 4,263,896 3,748,50095,000 Canadian Utilities Limited, 4.50%, Preferred, Series DD 2,065,700 2,104,250
100,000 Canadian Utilities Limited, 4.90%, Preferred, Series BB 2,385,000 2,390,000100,000 Emera Inc., 4.10%, Preferred, Series C 2,523,700 2,205,00050,000 Emera Inc., 4.25%, Preferred, Series F 1,265,000 1,100,00040,000 Emera Inc., 4.50%, Preferred, Series E 898,000 864,000
148,000 Fortis Inc. 4.10%, Preferred, Series M 3,712,760 3,532,76050,900 Fortis Inc., 4.90%, Preferred, Series F 1,222,832 1,199,713
120,000 Fortis, Inc. 4.75%, Preferred, Series J 2,892,600 2,829,60091,600 Fortis, Inc., 3.88%, Preferred, Series G 2,307,356 1,955,660
100,000 Fortis, Inc., 4.00%, Preferred, Series K 2,504,000 2,147,000135,000 TransAlta Corporation, 4.60%, Preferred, Series C 3,023,250 1,976,400175,000 TransAlta Corporation, 5.00%, Preferred, Series E 4,366,000 2,843,750254,700 Westcoast Energy, 5.50%, Preferred, Series H 6,464,906 6,342,030
56,137,929 50,501,331
Index Based Exchange-Traded Funds – 8.3%2,450,000 iShares S&P/TSX Canadian Preferred Share Index Fund 38,192,920 35,525,000
TOTAL INVESTMENT PORTFOLIO 457,699,680 420,063,488
OTHER ASSETS, LESS LIABILITIES – 1.4% 5,800,315
NET ASSETS – 100.0% 425,863,803
For equities, all common shares unless otherwise noted.The accompanying notes are an integral part of the financial statements.
121
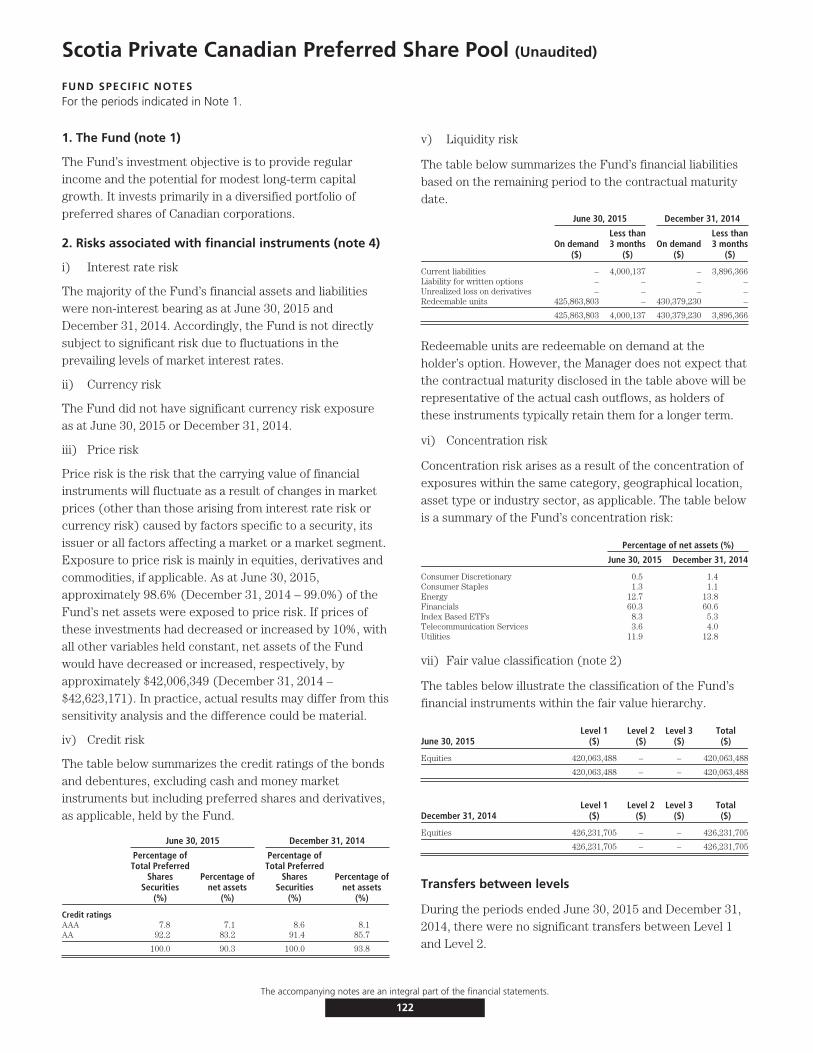
Scotia Private Canadian Preferred Share Pool (Unaudited)
FUND SPECIFIC NOTESFor the periods indicated in Note 1.
1. The Fund (note 1)
The Fund’s investment objective is to provide regularincome and the potential for modest long-term capitalgrowth. It invests primarily in a diversified portfolio ofpreferred shares of Canadian corporations.
2. Risks associated with financial instruments (note 4)
i) Interest rate risk
The majority of the Fund’s financial assets and liabilitieswere non-interest bearing as at June 30, 2015 andDecember 31, 2014. Accordingly, the Fund is not directlysubject to significant risk due to fluctuations in theprevailing levels of market interest rates.
ii) Currency risk
The Fund did not have significant currency risk exposureas at June 30, 2015 or December 31, 2014.
iii) Price risk
Price risk is the risk that the carrying value of financialinstruments will fluctuate as a result of changes in marketprices (other than those arising from interest rate risk orcurrency risk) caused by factors specific to a security, itsissuer or all factors affecting a market or a market segment.Exposure to price risk is mainly in equities, derivatives andcommodities, if applicable. As at June 30, 2015,approximately 98.6% (December 31, 2014 – 99.0%) of theFund’s net assets were exposed to price risk. If prices ofthese investments had decreased or increased by 10%, withall other variables held constant, net assets of the Fundwould have decreased or increased, respectively, byapproximately $42,006,349 (December 31, 2014 –$42,623,171). In practice, actual results may differ from thissensitivity analysis and the difference could be material.
iv) Credit risk
The table below summarizes the credit ratings of the bondsand debentures, excluding cash and money marketinstruments but including preferred shares and derivatives,as applicable, held by the Fund.
June 30, 2015 December 31, 2014
Percentage ofTotal Preferred
SharesSecurities
(%)
Percentage ofnet assets
(%)
Percentage ofTotal Preferred
SharesSecurities
(%)
Percentage ofnet assets
(%)
Credit ratingsAAA 7.8 7.1 8.6 8.1AA 92.2 83.2 91.4 85.7
100.0 90.3 100.0 93.8
v) Liquidity risk
The table below summarizes the Fund’s financial liabilitiesbased on the remaining period to the contractual maturitydate.
June 30, 2015 December 31, 2014
On demand($)
Less than3 months
($)On demand
($)
Less than3 months
($)
Current liabilities – 4,000,137 – 3,896,366Liability for written options – – – –Unrealized loss on derivatives – – – –Redeemable units 425,863,803 – 430,379,230 –
425,863,803 4,000,137 430,379,230 3,896,366
Redeemable units are redeemable on demand at theholder’s option. However, the Manager does not expect thatthe contractual maturity disclosed in the table above will berepresentative of the actual cash outflows, as holders ofthese instruments typically retain them for a longer term.
vi) Concentration risk
Concentration risk arises as a result of the concentration ofexposures within the same category, geographical location,asset type or industry sector, as applicable. The table belowis a summary of the Fund’s concentration risk:
Percentage of net assets (%)
June 30, 2015 December 31, 2014
Consumer Discretionary 0.5 1.4Consumer Staples 1.3 1.1Energy 12.7 13.8Financials 60.3 60.6Index Based ETFs 8.3 5.3Telecommunication Services 3.6 4.0Utilities 11.9 12.8
vii) Fair value classification (note 2)
The tables below illustrate the classification of the Fund’sfinancial instruments within the fair value hierarchy.
June 30, 2015Level 1
($)Level 2
($)Level 3
($)Total($)
Equities 420,063,488 – – 420,063,488
420,063,488 – – 420,063,488
December 31, 2014Level 1
($)Level 2
($)Level 3
($)Total($)
Equities 426,231,705 – – 426,231,705
426,231,705 – – 426,231,705
Transfers between levels
During the periods ended June 30, 2015 and December 31,2014, there were no significant transfers between Level 1and Level 2.
The accompanying notes are an integral part of the financial statements.
122
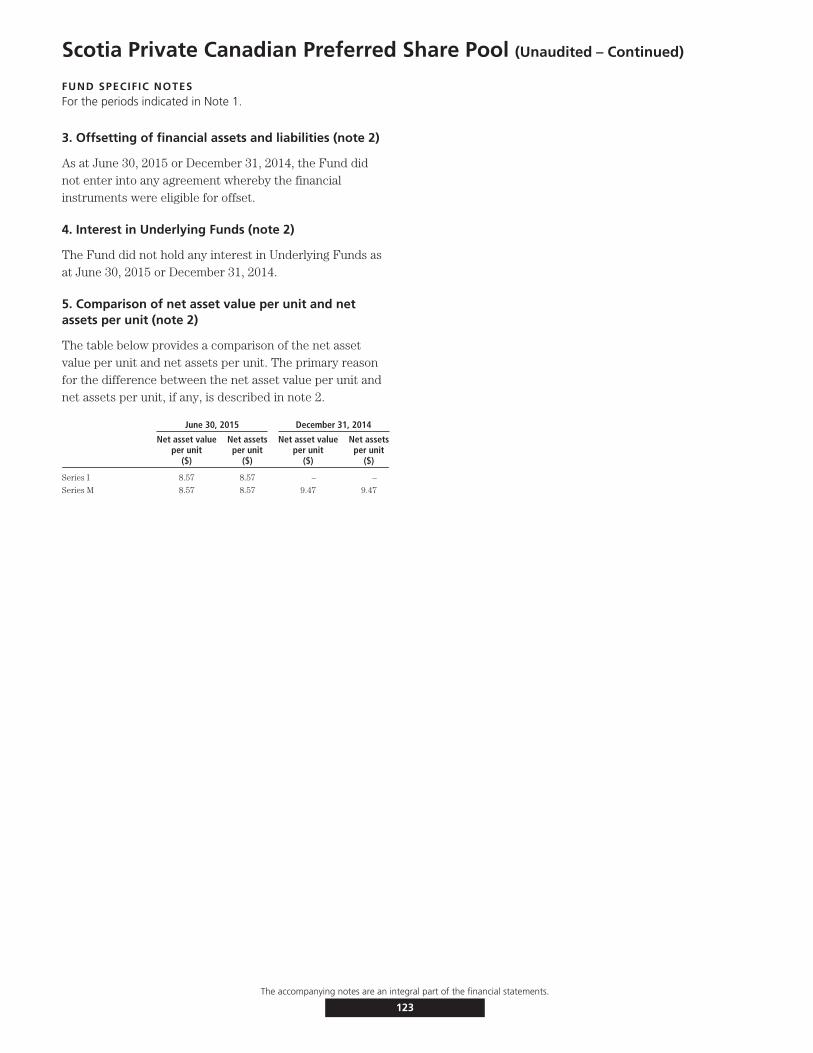
Scotia Private Canadian Preferred Share Pool (Unaudited – Continued)
FUND SPECIFIC NOTESFor the periods indicated in Note 1.
3. Offsetting of financial assets and liabilities (note 2)
As at June 30, 2015 or December 31, 2014, the Fund didnot enter into any agreement whereby the financialinstruments were eligible for offset.
4. Interest in Underlying Funds (note 2)
The Fund did not hold any interest in Underlying Funds asat June 30, 2015 or December 31, 2014.
5. Comparison of net asset value per unit and netassets per unit (note 2)
The table below provides a comparison of the net assetvalue per unit and net assets per unit. The primary reasonfor the difference between the net asset value per unit andnet assets per unit, if any, is described in note 2.
June 30, 2015 December 31, 2014
Net asset valueper unit
($)
Net assetsper unit
($)
Net asset valueper unit
($)
Net assetsper unit
($)
Series I 8.57 8.57 – –
Series M 8.57 8.57 9.47 9.47
The accompanying notes are an integral part of the financial statements.
123
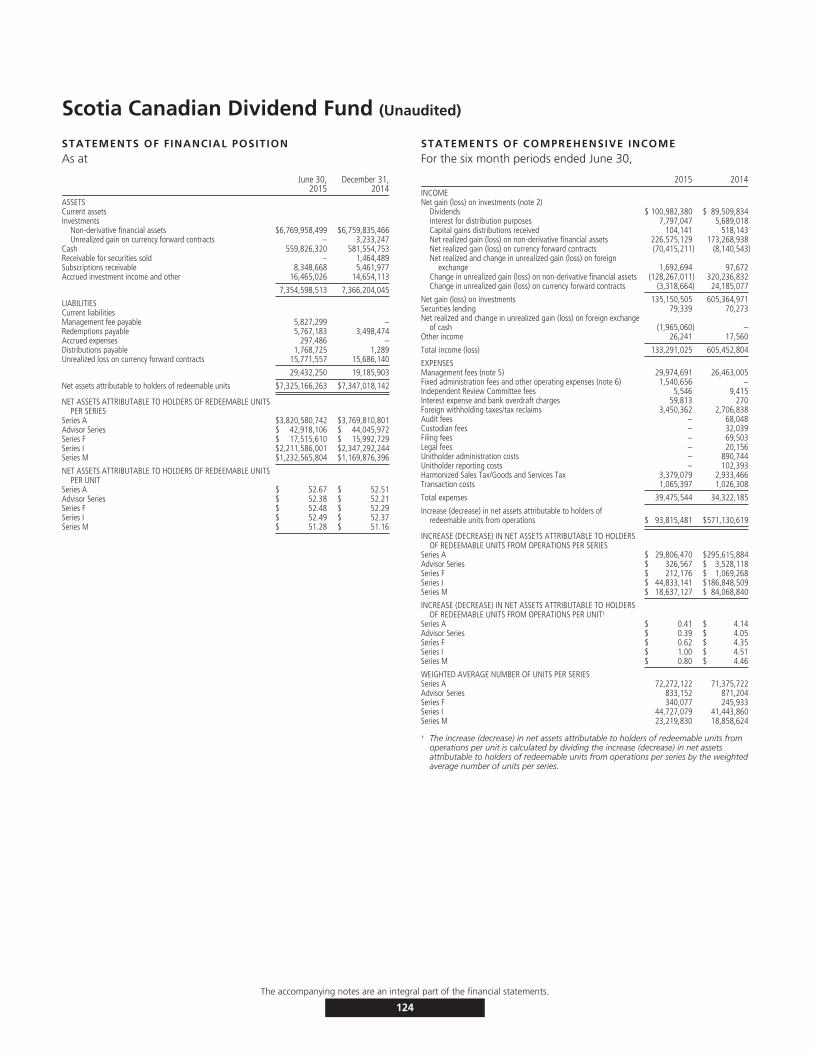
Scotia Canadian Dividend Fund (Unaudited)
STATEMENTS OF FINANCIAL POSITIONAs at
June 30,2015
December 31,2014
ASSETSCurrent assetsInvestments
Non-derivative financial assets $6,769,958,499 $6,759,835,466Unrealized gain on currency forward contracts – 3,233,247
Cash 559,826,320 581,554,753Receivable for securities sold – 1,464,489Subscriptions receivable 8,348,668 5,461,977Accrued investment income and other 16,465,026 14,654,113
7,354,598,513 7,366,204,045
LIABILITIESCurrent liabilitiesManagement fee payable 5,827,299 –Redemptions payable 5,767,183 3,498,474Accrued expenses 297,486 –Distributions payable 1,768,725 1,289Unrealized loss on currency forward contracts 15,771,557 15,686,140
29,432,250 19,185,903
Net assets attributable to holders of redeemable units $7,325,166,263 $7,347,018,142
NET ASSETS ATTRIBUTABLE TO HOLDERS OF REDEEMABLE UNITSPER SERIES
Series A $3,820,580,742 $3,769,810,801Advisor Series $ 42,918,106 $ 44,045,972Series F $ 17,515,610 $ 15,992,729Series I $2,211,586,001 $2,347,292,244Series M $1,232,565,804 $1,169,876,396
NET ASSETS ATTRIBUTABLE TO HOLDERS OF REDEEMABLE UNITSPER UNIT
Series A $ 52.67 $ 52.51Advisor Series $ 52.38 $ 52.21Series F $ 52.48 $ 52.29Series I $ 52.49 $ 52.37Series M $ 51.28 $ 51.16
STATEMENTS OF COMPREHENSIVE INCOMEFor the six month periods ended June 30,
2015 2014INCOMENet gain (loss) on investments (note 2)
Dividends $ 100,982,380 $ 89,509,834Interest for distribution purposes 7,797,047 5,689,018Capital gains distributions received 104,141 518,143Net realized gain (loss) on non-derivative financial assets 226,575,129 173,268,938Net realized gain (loss) on currency forward contracts (70,415,211) (8,140,543)Net realized and change in unrealized gain (loss) on foreign
exchange 1,692,694 97,672Change in unrealized gain (loss) on non-derivative financial assets (128,267,011) 320,236,832Change in unrealized gain (loss) on currency forward contracts (3,318,664) 24,185,077
Net gain (loss) on investments 135,150,505 605,364,971Securities lending 79,339 70,273Net realized and change in unrealized gain (loss) on foreign exchange
of cash (1,965,060) –Other income 26,241 17,560
Total income (loss) 133,291,025 605,452,804
EXPENSESManagement fees (note 5) 29,974,691 26,463,005Fixed administration fees and other operating expenses (note 6) 1,540,656 –Independent Review Committee fees 5,546 9,415Interest expense and bank overdraft charges 59,813 270Foreign withholding taxes/tax reclaims 3,450,362 2,706,838Audit fees – 68,048Custodian fees – 32,039Filing fees – 69,503Legal fees – 20,156Unitholder administration costs – 890,744Unitholder reporting costs – 102,393Harmonized Sales Tax/Goods and Services Tax 3,379,079 2,933,466Transaction costs 1,065,397 1,026,308
Total expenses 39,475,544 34,322,185
Increase (decrease) in net assets attributable to holders ofredeemable units from operations $ 93,815,481 $571,130,619
INCREASE (DECREASE) IN NET ASSETS ATTRIBUTABLE TO HOLDERSOF REDEEMABLE UNITS FROM OPERATIONS PER SERIES
Series A $ 29,806,470 $295,615,884Advisor Series $ 326,567 $ 3,528,118Series F $ 212,176 $ 1,069,268Series I $ 44,833,141 $186,848,509Series M $ 18,637,127 $ 84,068,840
INCREASE (DECREASE) IN NET ASSETS ATTRIBUTABLE TO HOLDERSOF REDEEMABLE UNITS FROM OPERATIONS PER UNIT†
Series A $ 0.41 $ 4.14Advisor Series $ 0.39 $ 4.05Series F $ 0.62 $ 4.35Series I $ 1.00 $ 4.51Series M $ 0.80 $ 4.46
WEIGHTED AVERAGE NUMBER OF UNITS PER SERIESSeries A 72,272,122 71,375,722Advisor Series 833,152 871,204Series F 340,077 245,933Series I 44,727,079 41,443,860Series M 23,219,830 18,858,624
† The increase (decrease) in net assets attributable to holders of redeemable units fromoperations per unit is calculated by dividing the increase (decrease) in net assetsattributable to holders of redeemable units from operations per series by the weightedaverage number of units per series.
The accompanying notes are an integral part of the financial statements.
124
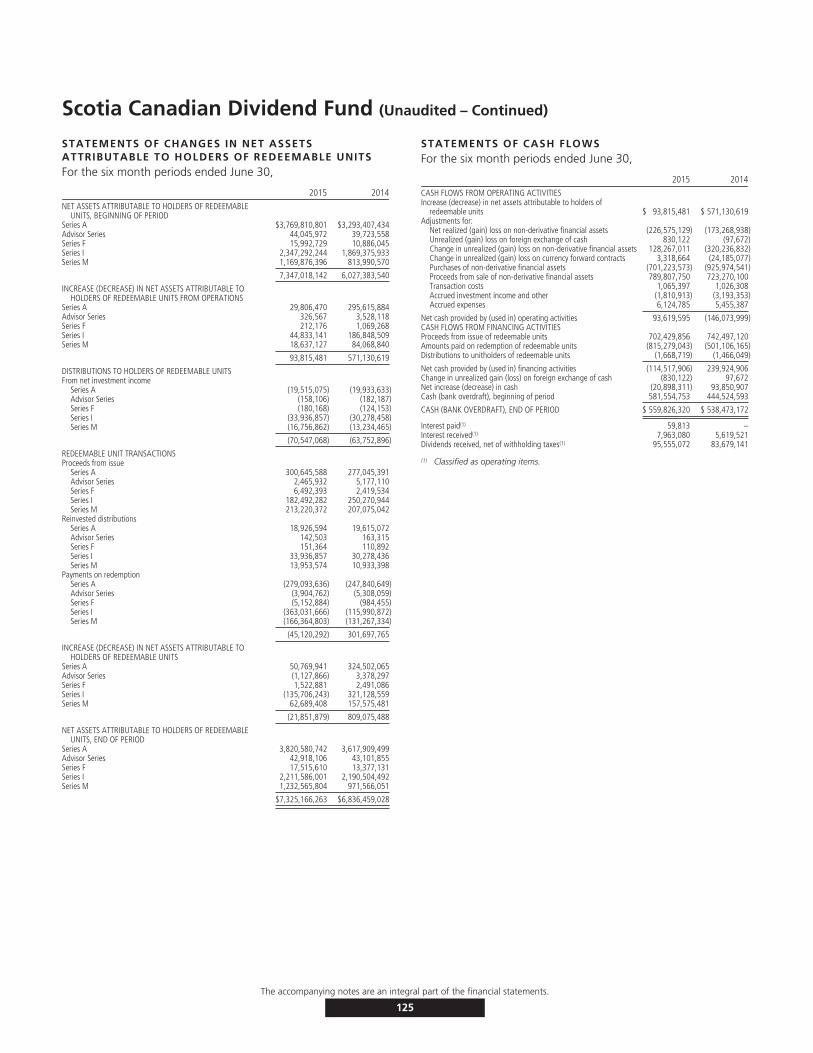
Scotia Canadian Dividend Fund (Unaudited – Continued)
STATEMENTS OF CHANGES IN NET ASSETSATTRIBUTABLE TO HOLDERS OF REDEEMABLE UNITSFor the six month periods ended June 30,
2015 2014NET ASSETS ATTRIBUTABLE TO HOLDERS OF REDEEMABLE
UNITS, BEGINNING OF PERIODSeries A $3,769,810,801 $3,293,407,434Advisor Series 44,045,972 39,723,558Series F 15,992,729 10,886,045Series I 2,347,292,244 1,869,375,933Series M 1,169,876,396 813,990,570
7,347,018,142 6,027,383,540
INCREASE (DECREASE) IN NET ASSETS ATTRIBUTABLE TOHOLDERS OF REDEEMABLE UNITS FROM OPERATIONS
Series A 29,806,470 295,615,884Advisor Series 326,567 3,528,118Series F 212,176 1,069,268Series I 44,833,141 186,848,509Series M 18,637,127 84,068,840
93,815,481 571,130,619
DISTRIBUTIONS TO HOLDERS OF REDEEMABLE UNITSFrom net investment income
Series A (19,515,075) (19,933,633)Advisor Series (158,106) (182,187)Series F (180,168) (124,153)Series I (33,936,857) (30,278,458)Series M (16,756,862) (13,234,465)
(70,547,068) (63,752,896)
REDEEMABLE UNIT TRANSACTIONSProceeds from issue
Series A 300,645,588 277,045,391Advisor Series 2,465,932 5,177,110Series F 6,492,393 2,419,534Series I 182,492,282 250,270,944Series M 213,220,372 207,075,042
Reinvested distributionsSeries A 18,926,594 19,615,072Advisor Series 142,503 163,315Series F 151,364 110,892Series I 33,936,857 30,278,436Series M 13,953,574 10,933,398
Payments on redemptionSeries A (279,093,636) (247,840,649)Advisor Series (3,904,762) (5,308,059)Series F (5,152,884) (984,455)Series I (363,031,666) (115,990,872)Series M (166,364,803) (131,267,334)
(45,120,292) 301,697,765
INCREASE (DECREASE) IN NET ASSETS ATTRIBUTABLE TOHOLDERS OF REDEEMABLE UNITS
Series A 50,769,941 324,502,065Advisor Series (1,127,866) 3,378,297Series F 1,522,881 2,491,086Series I (135,706,243) 321,128,559Series M 62,689,408 157,575,481
(21,851,879) 809,075,488
NET ASSETS ATTRIBUTABLE TO HOLDERS OF REDEEMABLEUNITS, END OF PERIOD
Series A 3,820,580,742 3,617,909,499Advisor Series 42,918,106 43,101,855Series F 17,515,610 13,377,131Series I 2,211,586,001 2,190,504,492Series M 1,232,565,804 971,566,051
$7,325,166,263 $6,836,459,028
STATEMENTS OF CASH FLOWSFor the six month periods ended June 30,
2015 2014CASH FLOWS FROM OPERATING ACTIVITIESIncrease (decrease) in net assets attributable to holders of
redeemable units $ 93,815,481 $ 571,130,619Adjustments for:
Net realized (gain) loss on non-derivative financial assets (226,575,129) (173,268,938)Unrealized (gain) loss on foreign exchange of cash 830,122 (97,672)Change in unrealized (gain) loss on non-derivative financial assets 128,267,011 (320,236,832)Change in unrealized (gain) loss on currency forward contracts 3,318,664 (24,185,077)Purchases of non-derivative financial assets (701,223,573) (925,974,541)Proceeds from sale of non-derivative financial assets 789,807,750 723,270,100Transaction costs 1,065,397 1,026,308Accrued investment income and other (1,810,913) (3,193,353)Accrued expenses 6,124,785 5,455,387
Net cash provided by (used in) operating activities 93,619,595 (146,073,999)CASH FLOWS FROM FINANCING ACTIVITIESProceeds from issue of redeemable units 702,429,856 742,497,120Amounts paid on redemption of redeemable units (815,279,043) (501,106,165)Distributions to unitholders of redeemable units (1,668,719) (1,466,049)
Net cash provided by (used in) financing activities (114,517,906) 239,924,906Change in unrealized gain (loss) on foreign exchange of cash (830,122) 97,672Net increase (decrease) in cash (20,898,311) 93,850,907Cash (bank overdraft), beginning of period 581,554,753 444,524,593
CASH (BANK OVERDRAFT), END OF PERIOD $ 559,826,320 $ 538,473,172
Interest paid(1) 59,813 –Interest received(1) 7,963,080 5,619,521Dividends received, net of withholding taxes(1) 95,555,072 83,679,141
(1) Classified as operating items.
The accompanying notes are an integral part of the financial statements.
125
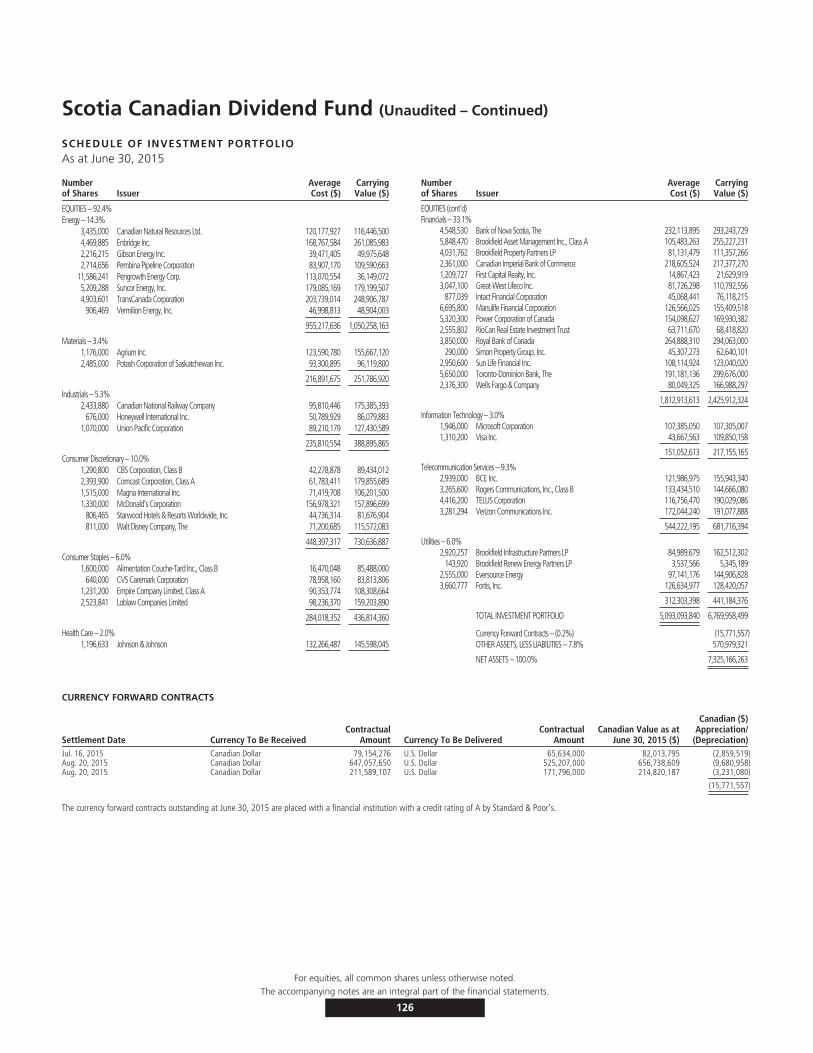
Scotia Canadian Dividend Fund (Unaudited – Continued)
SCHEDULE OF INVESTMENT PORTFOLIOAs at June 30, 2015
Numberof Shares Issuer
AverageCost ($)
CarryingValue ($)
EQUITIES – 92.4%Energy – 14.3%
3,435,000 Canadian Natural Resources Ltd. 120,177,927 116,446,5004,469,885 Enbridge Inc. 168,767,584 261,085,9832,216,215 Gibson Energy Inc. 39,471,405 49,975,6482,714,656 Pembina Pipeline Corporation 83,907,170 109,590,663
11,586,241 Pengrowth Energy Corp. 113,070,554 36,149,0725,209,288 Suncor Energy, Inc. 179,085,169 179,199,5074,903,601 TransCanada Corporation 203,739,014 248,906,787
906,469 Vermilion Energy, Inc. 46,998,813 48,904,003
955,217,636 1,050,258,163
Materials – 3.4%1,176,000 Agrium Inc. 123,590,780 155,667,1202,485,000 Potash Corporation of Saskatchewan Inc. 93,300,895 96,119,800
216,891,675 251,786,920
Industrials – 5.3%2,433,880 Canadian National Railway Company 95,810,446 175,385,393
676,000 Honeywell International Inc. 50,789,929 86,079,8831,070,000 Union Pacific Corporation 89,210,179 127,430,589
235,810,554 388,895,865
Consumer Discretionary – 10.0%1,290,800 CBS Corporation, Class B 42,278,878 89,434,0122,393,900 Comcast Corporation, Class A 61,783,411 179,855,6891,515,000 Magna International Inc. 71,419,708 106,201,5001,330,000 McDonald’s Corporation 156,978,321 157,896,699
806,465 Starwood Hotels & Resorts Worldwide, Inc. 44,736,314 81,676,904811,000 Walt Disney Company, The 71,200,685 115,572,083
448,397,317 730,636,887
Consumer Staples – 6.0%1,600,000 Alimentation Couche-Tard Inc., Class B 16,470,048 85,488,000
640,000 CVS Caremark Corporation 78,958,160 83,813,8061,231,200 Empire Company Limited, Class A 90,353,774 108,308,6642,523,841 Loblaw Companies Limited 98,236,370 159,203,890
284,018,352 436,814,360
Health Care – 2.0%1,196,633 Johnson & Johnson 132,266,487 145,598,045
Numberof Shares Issuer
AverageCost ($)
CarryingValue ($)
EQUITIES (cont’d)Financials – 33.1%
4,548,530 Bank of Nova Scotia, The 232,113,895 293,243,7295,848,470 Brookfield Asset Management Inc., Class A 105,483,263 255,227,2314,031,762 Brookfield Property Partners LP 81,131,479 111,357,2662,361,000 Canadian Imperial Bank of Commerce 218,605,524 217,377,2701,209,727 First Capital Realty, Inc. 14,867,423 21,629,9193,047,100 Great-West Lifeco Inc. 81,726,298 110,792,556
877,039 Intact Financial Corporation 45,068,441 76,118,2156,695,800 Manulife Financial Corporation 126,566,025 155,409,5185,320,300 Power Corporation of Canada 154,098,627 169,930,3822,555,802 RioCan Real Estate Investment Trust 63,711,670 68,418,8203,850,000 Royal Bank of Canada 264,888,310 294,063,000
290,000 Simon Property Group, Inc. 45,307,273 62,640,1012,950,600 Sun Life Financial Inc. 108,114,924 123,040,0205,650,000 Toronto-Dominion Bank, The 191,181,136 299,676,0002,376,300 Wells Fargo & Company 80,049,325 166,988,297
1,812,913,613 2,425,912,324
Information Technology – 3.0%1,946,000 Microsoft Corporation 107,385,050 107,305,0071,310,200 Visa Inc. 43,667,563 109,850,158
151,052,613 217,155,165
Telecommunication Services – 9.3%2,939,000 BCE Inc. 121,986,975 155,943,3403,265,600 Rogers Communications, Inc., Class B 133,434,510 144,666,0804,416,200 TELUS Corporation 116,756,470 190,029,0863,281,294 Verizon Communications Inc. 172,044,240 191,077,888
544,222,195 681,716,394
Utilities – 6.0%2,920,257 Brookfield Infrastructure Partners LP 84,989,679 162,512,302
143,920 Brookfield Renew Energy Partners LP 3,537,566 5,345,1892,555,000 Eversource Energy 97,141,176 144,906,8283,660,777 Fortis, Inc. 126,634,977 128,420,057
312,303,398 441,184,376
TOTAL INVESTMENT PORTFOLIO 5,093,093,840 6,769,958,499
Currency Forward Contracts – (0.2%) (15,771,557)OTHER ASSETS, LESS LIABILITIES – 7.8% 570,979,321
NET ASSETS – 100.0% 7,325,166,263
CURRENCY FORWARD CONTRACTS
Settlement Date Currency To Be ReceivedContractual
Amount Currency To Be DeliveredContractual
AmountCanadian Value as at
June 30, 2015 ($)
Canadian ($)Appreciation/
(Depreciation)Jul. 16, 2015 Canadian Dollar 79,154,276 U.S. Dollar 65,634,000 82,013,795 (2,859,519)Aug. 20, 2015 Canadian Dollar 647,057,650 U.S. Dollar 525,207,000 656,738,609 (9,680,958)Aug. 20, 2015 Canadian Dollar 211,589,107 U.S. Dollar 171,796,000 214,820,187 (3,231,080)
(15,771,557)
The currency forward contracts outstanding at June 30, 2015 are placed with a financial institution with a credit rating of A by Standard & Poor’s.
For equities, all common shares unless otherwise noted.
126
The accompanying notes are an integral part of the financial statements.
Scotia Canadian Dividend Fund (Unaudited)
FUND SPECIFIC NOTESFor the periods indicated in Note 1.
1. The Fund (note 1)
The Fund’s investment objective is to earn a high level ofdividend income with some potential for long-term capitalgrowth. It invests primarily in dividend-paying commonshares and in a broad range of preferred shares, such asfloating rate, convertible and retractable preferred shares ofCanadian companies.
2. Risks associated with financial instruments (note 4)
i) Interest rate risk
The majority of the Fund’s financial assets and liabilitieswere non-interest bearing as at June 30, 2015 andDecember 31, 2014. Accordingly, the Fund is not directlysubject to significant risk due to fluctuations in theprevailing levels of market interest rates.
ii) Currency risk
The tables below indicate the currencies to which the Fundhad significant exposure, net of the impact of currencyforward contracts and currency spot contracts, if any,based on the monetary and non-monetary assets andliabilities of the Fund. The tables also illustrate thepotential impact on the Fund if the functional currency ofthe Fund had strengthened or weakened by 10% in relationto each of the other currencies, with all other variables heldconstant.
June 30, 2015
Currency
Net currencyexposure
($)
Percentage ofnet assets
(%)
Impact onthe Fund
($)
Percentage ofnet assets
(%)
US Dollar 898,759,871 12.3 89,875,987 1.2
898,759,871 12.3 89,875,987 1.2
December 31, 2014
Currency
Net currencyexposure
($)
Percentage ofnet assets
(%)
Impact onthe Fund
($)
Percentage ofnet assets
(%)
US Dollar 901,754,762 12.3 90,175,476 1.2
901,754,762 12.3 90,175,476 1.2
iii) Price risk
Price risk is the risk that the carrying value of financialinstruments will fluctuate as a result of changes in marketprices (other than those arising from interest rate risk orcurrency risk) caused by factors specific to a security, itsissuer or all factors affecting a market or a market segment.Exposure to price risk is mainly in equities, derivatives andcommodities, if applicable. As at June 30, 2015,
approximately 92.4% (December 31, 2014 – 92.0%) of theFund’s net assets were exposed to price risk. If prices ofthese investments had decreased or increased by 10%, withall other variables held constant, net assets of the Fundwould have decreased or increased, respectively, byapproximately $676,995,850 (December 31, 2014 –$675,983,547). In practice, actual results may differ fromthis sensitivity analysis and the difference could bematerial.
iv) Credit risk
The Fund had no significant exposure to bonds anddebentures, preferred shares or derivatives as at June 30,2015 or December 31, 2014. In addition, all investmenttransactions are executed by brokers with an approvedcredit rating. As such the risk of default on transactionswith counterparties and brokers related to purchase andsale of securities is considered minimal. In instances wherethe credit rating were to fall below the approved rating, theManager would take appropriate action.
v) Liquidity risk
The table below summarizes the Fund’s financial liabilitiesbased on the remaining period to the contractual maturitydate.
June 30, 2015 December 31, 2014
On demand($)
Less than3 months
($)On demand
($)
Less than3 months
($)
Current liabilities – 13,660,693 – 3,499,763Liability for written options – – – –Unrealized loss on
derivatives – 15,771,557 – 15,686,140Redeemable units 7,325,166,263 – 7,347,018,142 –
7,325,166,263 29,432,250 7,347,018,142 19,185,903
Redeemable units are redeemable on demand at theholder’s option. However, the Manager does not expect thatthe contractual maturity disclosed in the table above will berepresentative of the actual cash outflows, as holders ofthese instruments typically retain them for a longer term.
vi) Concentration risk
Concentration risk arises as a result of the concentration ofexposures within the same category, geographical location,
The accompanying notes are an integral part of the financial statements.
127

Scotia Canadian Dividend Fund (Unaudited – Continued)
FUND SPECIFIC NOTESFor the periods indicated in Note 1.
asset type or industry sector, as applicable. The table belowis a summary of the Fund’s concentration risk:
Percentage of net assets (%)
June 30, 2015 December 30, 2014
Consumer Discretionary 10.0 9.1Consumer Staples 6.0 5.7Energy 14.3 17.6Financials 33.1 31.3Health Care 2.0 1.5Industrials 5.3 6.0Information Technology 3.0 4.0Materials 3.4 3.2Telecommunication Services 9.3 8.5Utilities 6.0 5.1
vii) Fair value classification (note 2)
The tables below illustrate the classification of the Fund’sfinancial instruments within the fair value hierarchy.
June 30, 2015Level 1
($)Level 2
($)Level 3
($)Total($)
Equities 6,769,958,499 – – 6,769,958,499
6,769,958,499 – – 6,769,958,499
Currency forward contracts–liabilities – (15,771,557) – (15,771,557)
6,769,958,499 (15,771,557) – 6,754,186,942
December 31, 2014Level 1
($)Level 2
($)Level 3
($)Total($)
Equities 6,759,835,466 – – 6,759,835,466Currency forward contracts–
assets – 3,233,247 – 3,233,247
6,759,835,466 3,233,247 – 6,763,068,713
Currency forward contracts–liabilities – (15,686,140) – (15,686,140)
6,759,835,466 (12,452,893) – 6,747,382,573
Transfers between levels
During the periods ended June 30, 2015 and December 31,2014, there were no significant transfers between Level 1and Level 2.
3. Offsetting of financial assets and liabilities (note 2)
The following table presents offsetting of financial assetsand liabilities and collateral amounts that would occur iffuture events, such as bankruptcy or termination ofcontracts were to arise. No amounts were offset in thefinancial statements.
June 30, 2015
Financial assets – by type
Gross amountof assets
($)
Master nettingoffset
($)
Collateralpledged
($)Net Amount
($)
Currency forward contracts – – – –Options contracts – OTC – – – –Swap contracts – – – –
– – – –
Financial liabilities – by type
Gross amountof liabilities
($)
Master nettingoffset
($)
Collateralpledged
($)Net Amount
($)
Currency forward contracts 15,771,557 – – 15,771,557Options contracts – OTC – – – –Swap contracts – – – –
15,771,557 – – 15,771,557
December 31, 2014
Financial assets – by type
Gross amountof assets
($)
Master nettingoffset
($)
Collateralpledged
($)Net Amount
($)
Currency forward contracts 3,233,247 (1,923,589) – 1,309,658Options contracts – OTC – – – –Swap contracts – – – –
3,233,247 (1,923,589) – 1,309,658
Financial liabilities – by type
Gross amountof liabilities
($)
Master nettingoffset
($)
Collateralpledged
($)Net Amount
($)
Currency forward contracts 15,686,140 (1,923,589) – 13,762,551Options contracts – OTC – – – –Swap contracts – – – –
15,686,140 (1,923,589) – 13,762,551
4. Interest in Underlying Funds (note 2)
The Fund did not hold any interest in Underlying Funds asat June 30, 2015 or December 31, 2014.
5. Comparison of net asset value per unit and netassets per unit (note 2)
The table below provides a comparison of the net assetvalue per unit and net assets per unit. The primary reasonfor the difference between the net asset value per unit andnet assets per unit, if any, is described in note 2.
June 30, 2015 December 31, 2014
Net asset valueper unit
($)
Net assetsper unit
($)
Net asset valueper unit
($)
Net assetsper unit
($)
Series A 52.67 52.67 52.51 52.51
Advisor Series 52.38 52.38 52.21 52.21
Series F 52.48 52.48 52.29 52.29
Series I 52.49 52.49 52.37 52.37
Series M 51.28 51.28 51.16 51.16
The accompanying notes are an integral part of the financial statements.
128
Scotia Canadian Blue Chip Fund (Unaudited)
STATEMENTS OF FINANCIAL POSITIONAs at
June 30,2015
December 31,2014
ASSETSCurrent assetsInvestments
Non-derivative financial assets $260,903,339 $249,014,049Unrealized gain on currency forward contracts 646,592 –
Cash 2,864,450 4,971,954Margin deposited on futures 2,241,452 1,736,659Subscriptions receivable 53,324 69,542Accrued investment income and other 298,495 283,882
267,007,652 256,076,086
LIABILITIESCurrent liabilitiesManagement fee payable 480,449 –Payable for securities purchased 886,350 –Redemptions payable 131,055 87,091Accrued expenses 28,641 –Distributions payable – 871Unrealized loss on currency forward contracts 971,043 509,424Unrealized loss on swap contracts 454,411 18,088
2,951,949 615,474
Net assets attributable to holders of redeemable units $264,055,703 $255,460,612
NET ASSETS ATTRIBUTABLE TO HOLDERS OF REDEEMABLE UNITSPER SERIES
Series A $263,716,083 $255,168,800Series F $ 29,856 $ 27,472Series I $ 309,764 $ 264,340
NET ASSETS ATTRIBUTABLE TO HOLDERS OF REDEEMABLE UNITSPER UNIT
Series A $ 31.13 $ 28.73Series F $ 32.36 $ 29.76Series I $ 37.38 $ 34.14
STATEMENTS OF COMPREHENSIVE INCOMEFor the six month periods ended June 30,
2015 2014INCOMENet gain (loss) on investments (note 2)
Dividends $ 2,649,151 $ 2,781,669Interest for distribution purposes 18,575 (2,951)Capital gains distributions received – (13,176)Net realized gain (loss) on non-derivative financial assets 9,733,733 16,038,593Net realized gain (loss) on currency forward contracts (980,076) (740,204)Net realized gain (loss) on futures contracts (157,044) (1,030,817)Net realized gain (loss) on swap contracts 1,741,387 1,710,597Net realized and change in unrealized gain (loss) on foreign exchange (27,648) 75,116Change in unrealized gain (loss) on non-derivative financial assets 11,179,767 457,059Change in unrealized gain (loss) on currency forward contracts 184,973 736,530Change in unrealized gain (loss) on swap contracts (436,323) (728,860)
Net gain (loss) on investments 23,906,495 19,283,556Securities lending 198 3,375Net realized and change in unrealized gain (loss) on foreign exchange of
cash 69,231 –Other income 1,883 1,369
Total income (loss) 23,977,807 19,288,300
EXPENSESManagement fees (note 5) 2,412,293 2,346,245Fixed administration fees and operating expense (note 6) 145,123 –Independent Review Committee fees 192 378Interest expense and bank overdraft charges 132 55Foreign withholding taxes/tax reclaims 79,238 71,826Audit fees – 3,168Custodian fees – 3,512Filing fees – 16,954Legal fees – 805Unitholder administration costs – 89,973Unitholder reporting costs – 14,820Harmonized Sales Tax/Goods and Services Tax 280,907 269,775Transaction costs 63,201 112,164
Total expenses 2,981,086 2,929,675Expenses absorbed by the Manager (1,536) (8,012)
Net expenses 2,979,550 2,921,663
Increase (decrease) in net assets attributable to holders of redeemableunits from operations $20,998,257 $16,366,637
INCREASE (DECREASE) IN NET ASSETS ATTRIBUTABLE TO HOLDERS OFREDEEMABLE UNITS FROM OPERATIONS PER SERIES
Series A $20,969,571 $16,349,289Series F $ 2,384 $ 2,634Series I $ 26,302 $ 14,714
INCREASE (DECREASE) IN NET ASSETS ATTRIBUTABLE TO HOLDERS OFREDEEMABLE UNITS FROM OPERATIONS PER UNIT†
Series A $ 2.42 $ 1.81Series F $ 2.58 $ 3.11Series I $ 3.25 $ 2.77
WEIGHTED AVERAGE NUMBER OF UNITS PER SERIESSeries A 8,669,143 9,017,575Series F 923 847Series I 8,093 5,308
† The increase (decrease) in net assets attributable to holders of redeemable units fromoperations per unit is calculated by dividing the increase (decrease) in net assetsattributable to holders of redeemable units from operations per series by the weightedaverage number of units per series.
The accompanying notes are an integral part of the financial statements.
129

Scotia Canadian Blue Chip Fund (Unaudited – Continued)
STATEMENTS OF CHANGES IN NET ASSETSATTRIBUTABLE TO HOLDERS OF REDEEMABLE UNITSFor the six month periods ended June 30,
2015 2014NET ASSETS ATTRIBUTABLE TO HOLDERS OF REDEEMABLE UNITS,
BEGINNING OF PERIODSeries A $255,168,800 $256,342,591Series F 27,472 3,724Series I 264,340 133,188
255,460,612 256,479,503
INCREASE (DECREASE) IN NET ASSETS ATTRIBUTABLE TO HOLDERSOF REDEEMABLE UNITS FROM OPERATIONS
Series A 20,969,571 16,349,289Series F 2,384 2,634Series I 26,302 14,714
Independent Review Committee fees 20,998,257 16,366,637
REDEEMABLE UNIT TRANSACTIONSProceeds from issue
Series A 5,892,998 5,473,628Series F – 28,777Series I 47,857 142,087
Payments on redemptionSeries A (18,315,286) (18,945,220)Series F – (4,616)Series I (28,735) (52,451)
(12,403,166) (13,357,795)
INCREASE (DECREASE) IN NET ASSETS ATTRIBUTABLE TO HOLDERSOF REDEEMABLE UNITS
Series A 8,547,283 2,877,697Series F 2,384 26,795Series I 45,424 104,350
8,595,091 3,008,842
NET ASSETS ATTRIBUTABLE TO HOLDERS OF REDEEMABLE UNITS,END OF PERIOD
Series A 263,716,083 259,220,288Series F 29,856 30,519Series I 309,764 237,538
$264,055,703 $259,488,345
STATEMENTS OF CASH FLOWSFor the six month periods ended June 30,
2015 2014CASH FLOWS FROM OPERATING ACTIVITIESIncrease (decrease) in net assets attributable to holders of
redeemable units $ 20,998,257 $ 16,366,637Adjustments for:
Net realized (gain) loss on non-derivative financial assets (9,733,733) (16,038,593)Unrealized (gain) loss on foreign exchange of cash (83,918) (75,116)Change in unrealized (gain) loss on non-derivative financial assets (11,179,767) (457,059)Change in unrealized (gain) loss on currency forward contracts (184,973) (736,530)Change in unrealized (gain) loss on swap contracts 436,323 728,860Purchases of non-derivative financial assets (31,862,089) (50,928,769)Proceeds from sale of non-derivative financial assets 41,711,400 60,447,512Transaction costs 61,249 111,367Margin deposited on futures (504,793) (55,104)Accrued investment income and other (14,613) (101,429)Accrued expenses 509,090 475,010
Net cash provided by (used in) operating activities 10,152,433 9,736,786CASH FLOWS FROM FINANCING ACTIVITIESProceeds from issue of redeemable units 5,957,073 5,622,339Amounts paid on redemption of redeemable units (18,300,057) (19,028,905)Distributions to unitholders of redeemable units (871) (2,761)
Net cash provided by (used in) financing activities (12,343,855) (13,409,327)Change in unrealized gain (loss) on foreign exchange of cash 83,918 75,116Independent Review Committee fees (2,191,422) (3,672,541)Cash (bank overdraft), beginning of period 4,971,954 9,120,407
CASH (BANK OVERDRAFT), END OF PERIOD $ 2,864,450 $ 5,522,982
Interest paid(1) 132 –Interest received(1) 18,820 –Dividends received, net of withholding taxes(1) 2,555,055 2,605,463
(1) Classified as operating items.
SCHEDULE OF INVESTMENT PORTFOLIOAs at June 30, 2015
Numberof Shares Issuer
AverageCost ($)
CarryingValue ($)
EQUITIES – 98.7%Energy – 10.5%973,200 Canadian Energy Services & Technology Corporation 5,544,692 7,007,04069,600 Paramount Resources Ltd. 3,979,003 1,997,520
168,100 PrairieSky Royalty Ltd. 4,735,362 5,296,83159,200 Suncor Energy, Inc. 2,747,882 2,036,480
222,450 TransCanada Corporation 7,843,544 11,291,562
24,850,483 27,629,433
Materials – 3.0%30,100 Franco-Nevada Corporation 1,920,569 1,793,05789,000 West Fraser Timber Co., Ltd. 3,721,007 6,108,070
5,641,576 7,901,127
Industrials – 12.6%215,300 Air Canada 1,682,642 2,844,11365,000 Allegion Public Limited Company 3,978,808 4,880,257
166,840 Canadian National Railway Company 3,301,111 12,022,49016,700 Canadian Pacific Railway Limited 3,952,501 3,340,33472,600 Danaher Corporation 4,466,067 7,757,16674,900 Progressive Waste Solutions Ltd. 2,693,600 2,509,150
20,074,729 33,353,510
Consumer Discretionary – 13.6%84,822 Dollarama Inc. 2,645,441 6,421,02534,800 Hudson’s Bay Company 908,327 965,700
103,592 Magna International Inc. 4,950,410 7,261,79999,171 Restaurant Brands International Inc. 4,816,827 4,735,168
129 Restaurant Brands International Limited Partnership 5,321 5,83749,100 Starwood Hotels & Resorts Worldwide, Inc. 2,618,406 4,972,73439,200 Walt Disney Company, The 1,984,903 5,586,222
300,000 Whistler Blackcomb Holdings Inc. 4,162,104 5,910,000
22,091,739 35,858,485
Consumer Staples – 5.0%30,600 Costco Wholesale Corporation 2,768,620 5,161,722
129,500 Loblaw Companies Limited 6,224,124 8,168,860
8,992,744 13,330,582
Health Care – 8.6%28,100 Cooper Companies, Inc., The 4,533,169 6,245,96559,500 Valeant Pharmaceuticals International, Inc. 7,340,792 16,485,665
11,873,961 22,731,630
Financials – 27.2%106,600 American International Group, Inc. 5,622,775 8,230,622203,400 Bank of Nova Scotia, The 10,819,024 13,113,198110,500 Citigroup Inc. 4,380,930 7,623,640506,400 Element Financial Corp. 6,813,710 10,001,400340,600 Manulife Financial Corporation 7,203,414 7,905,326175,400 Royal Bank of Canada 7,540,994 13,397,052213,996 Toronto-Dominion Bank, The 5,631,840 11,350,348
48,012,687 71,621,586
Information Technology – 16.2%100,000 CGI Group Inc., Class A 4,161,955 4,885,000209,500 Davis + Henderson Income Corporation 8,164,400 8,363,240
9,100 Google Inc. Class A 5,442,779 6,137,81514,940 Google Inc. Class C 5,023,630 9,712,390
214,700 Microsoft Corporation 5,939,567 11,838,84145,500 Shopify Inc., Class A 943,626 1,927,302
29,675,957 42,864,588
For equities, all common shares unless otherwise noted.The accompanying notes are an integral part of the financial statements.
130
Scotia Canadian Blue Chip Fund (Unaudited – Continued)
SCHEDULE OF INVESTMENT PORTFOLIO
Numberof Shares Issuer
AverageCost ($)
CarryingValue ($)
EQUITIES (cont’d)Telecommunication Services – 2.1%
62,000 Rogers Communications, Inc., Class B 2,684,761 2,746,60066,600 TELUS Corporation 1,993,538 2,865,798
4,678,299 5,612,398
TOTAL INVESTMENT PORTFOLIO 175,892,175 260,903,339
Currency Forward Contracts – (0.1%) (324,451)Futures Contracts – 0.8% 2,241,452Swap Contracts – (0.1%) (454,411)OTHER ASSETS, LESS LIABILITIES – 0.7% 1,689,774
NET ASSETS – 100.0% 264,055,703
CURRENCY FORWARD CONTRACTS
Settlement Date Currency To Be ReceivedContractual
Amount Currency To Be DeliveredContractual
AmountCanadian Value as at
June 30, 2015 ($)
Canadian ($)Appreciation/
(Depreciation)Jul. 16, 2015 Canadian Dollar 18,286,502 U.S. Dollar 15,163,000 18,947,119 (660,617)Jul. 16, 2015 Canadian Dollar 9,232,484 U.S. Dollar 7,637,000 9,542,910 (310,426)Jul. 16, 2015 U.S. Dollar 15,163,000 Canadian Dollar 18,519,239 18,510,406 427,484Jul. 16, 2015 U.S. Dollar 7,637,000 Canadian Dollar 9,323,601 9,319,154 219,108
(324,451)
The currency forward contracts outstanding at June 30, 2015 are placed with a financial institution with a credit rating of A by Standard & Poor’s.
Expiry DateNumber ofContracts Futures Contracts Counterparty Credit Risk
ContractualValue
Canadian ($)Fair Value
Canadian ($)Appreciation/
(Depreciation) ($)INDEX FUTURES CONTRACTSSep. 2015 (60) S&P 500 Composite Stock Index – E-Mini Futures BMO A+ (7,827,195) (7,697,553) 129,641Sep. 2015 (50) S&P/TSX 60 Index Futures BMO A+ (8,530,550) (8,439,000) 91,550
221,191
The above index futures contracts are financial agreements to purchase/sell the indices at a contracted price on a specific future date. However, the Fund does not intend to purchase/sell the indices onsettlement. Rather, it intends to close out each index futures contracts before settlement by entering into equal, but offsetting index futures contracts.
EQUITY SWAP CONTRACTS
Numberof Units Termination Date
NotionalAmount ($)
VariableRate %
Appreciation/(Depreciation) ($)
Blackstone Group, Variable 1 month USD – LIBOR, Counterparty: Toronto-Dominion Bank, The123,300 Dec. 7, 2015 5,400,540 0.63% (454,411)
The swap contracts outstanding at June 30, 2015 are placed with a financial institution with a minimum credit rating of AA- by Standard & Poor’s.
For equities, all common shares unless otherwise noted.The accompanying notes are an integral part of the financial statements.
131
Scotia Canadian Blue Chip Fund (Unaudited)
FUND SPECIFIC NOTESFor the periods indicated in Note 1.
1. The Fund (note 1)
The Fund’s investment objective is long-term capitalgrowth. It invests primarily in a broad range of high qualityequity securities of large Canadian companies.
2. Risks associated with financial instruments (note 4)
i) Interest rate risk
The Fund invests in swap contracts, which are exposed tointerest rate risk. As at June 30, 2015, had the prevailinginterest rates increased or decreased by 0.25%, assuming aparallel shift in the yield curve and all other variables heldconstant, net assets attributable to holders of redeemableunits would have decreased or increased, respectively, by$13,501 or approximately 0.0% (December 31, 2014 –$22,893 or approximately 0.0%). In practice, actual resultsmay differ from this sensitivity analysis and the differencecould be material.
ii) Currency risk
The tables below indicate the currencies to which the Fundhad significant exposure, net of the impact of currencyforward contracts and currency spot contracts, if any,based on the monetary and non-monetary assets andliabilities of the Fund. The tables also illustrate thepotential impact on the Fund if the functional currency ofthe Fund had strengthened or weakened by 10% in relationto each of the other currencies, with all other variables heldconstant.
June 30, 2015
Currency
Net currencyexposure
($)
Percentage ofnet assets
(%)
Impact onthe Fund
($)
Percentage ofnet assets
(%)
British Pound 14 0.0 1 0.0US Dollar 85,582,106 32.4 8,558,211 3.2
85,582,120 32.4 8,558,212 3.2
December 31, 2014
Currency
Net currencyexposure
($)
Percentage ofnet assets
(%)
Impact onthe Fund
($)
Percentage ofnet assets
(%)
British Pound 13 0.0 1 0.0US Dollar 53,785,686 21.1 5,378,569 2.1
53,785,699 21.1 5,378,570 2.1
iii) Price risk
Price risk is the risk that the carrying value of financialinstruments will fluctuate as a result of changes in marketprices (other than those arising from interest rate risk orcurrency risk) caused by factors specific to a security, its
issuer or all factors affecting a market or a market segment.Exposure to price risk is mainly in equities, derivatives andcommodities, if applicable. As at June 30, 2015,approximately 94.6% (December 31, 2014 – 97.5%) of theFund’s net assets were exposed to price risk. If prices ofthese investments had decreased or increased by 10%, withall other variables held constant, net assets of the Fundwould have decreased or increased, respectively, byapproximately $24,971,291 (December 31, 2014 –$24,901,405). In practice, actual results may differ from thissensitivity analysis and the difference could be material.
iv) Credit risk
The Fund had no significant exposure to bonds anddebentures, preferred shares or derivatives as at June 30,2015 or December 31, 2014. In addition, all investmenttransactions are executed by brokers with an approvedcredit rating. As such the risk of default on transactionswith counterparties and brokers related to purchase andsale of securities is considered minimal. In instances wherethe credit rating were to fall below the approved rating, theManager would take appropriate action.
v) Liquidity risk
The table below summarizes the Fund’s financial liabilitiesbased on the remaining period to the contractual maturitydate.
June 30, 2015 December 31, 2014
On demand($)
Less than3 months
($)On demand
($)
Less than3 months
($)
Current liabilities – 1,526,495 – 87,962Liability for written options – – – –Unrealized loss on derivatives – 1,425,454 – 527,512Redeemable units 264,055,703 – 255,460,612 –
264,055,703 2,951,949 255,460,612 615,474
Redeemable units are redeemable on demand at theholder’s option. However, the Manager does not expect thatthe contractual maturity disclosed in the table above will berepresentative of the actual cash outflows, as holders ofthese instruments typically retain them for a longer term.
vi) Concentration risk
Concentration risk arises as a result of the concentration ofexposures within the same category, geographical location,
The accompanying notes are an integral part of the financial statements.
132
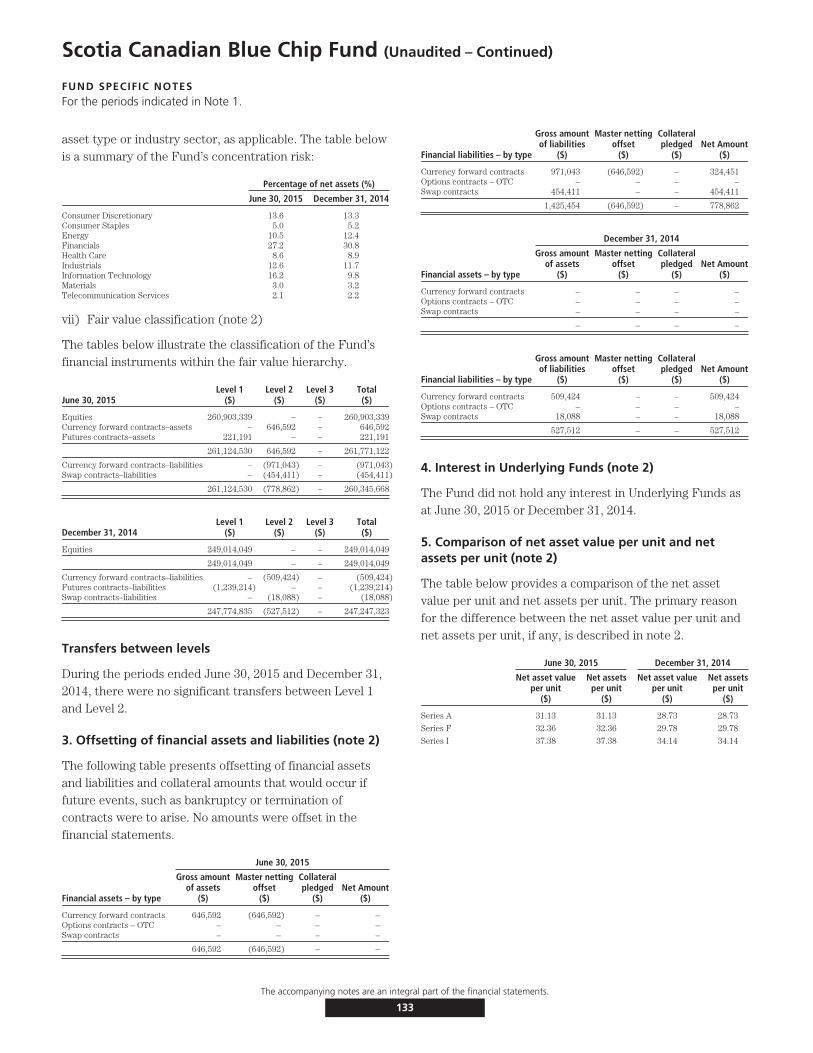
Scotia Canadian Blue Chip Fund (Unaudited – Continued)
FUND SPECIFIC NOTESFor the periods indicated in Note 1.
asset type or industry sector, as applicable. The table belowis a summary of the Fund’s concentration risk:
Percentage of net assets (%)
June 30, 2015 December 31, 2014
Consumer Discretionary 13.6 13.3Consumer Staples 5.0 5.2Energy 10.5 12.4Financials 27.2 30.8Health Care 8.6 8.9Industrials 12.6 11.7Information Technology 16.2 9.8Materials 3.0 3.2Telecommunication Services 2.1 2.2
vii) Fair value classification (note 2)
The tables below illustrate the classification of the Fund’sfinancial instruments within the fair value hierarchy.
June 30, 2015Level 1
($)Level 2
($)Level 3
($)Total($)
Equities 260,903,339 – – 260,903,339Currency forward contracts–assets – 646,592 – 646,592Futures contracts–assets 221,191 – – 221,191
261,124,530 646,592 – 261,771,122
Currency forward contracts–liabilities – (971,043) – (971,043)Swap contracts–liabilities – (454,411) – (454,411)
261,124,530 (778,862) – 260,345,668
December 31, 2014Level 1
($)Level 2
($)Level 3
($)Total($)
Equities 249,014,049 – – 249,014,049
249,014,049 – – 249,014,049
Currency forward contracts–liabilities – (509,424) – (509,424)Futures contracts–liabilities (1,239,214) – – (1,239,214)Swap contracts–liabilities – (18,088) – (18,088)
247,774,835 (527,512) – 247,247,323
Transfers between levels
During the periods ended June 30, 2015 and December 31,2014, there were no significant transfers between Level 1and Level 2.
3. Offsetting of financial assets and liabilities (note 2)
The following table presents offsetting of financial assetsand liabilities and collateral amounts that would occur iffuture events, such as bankruptcy or termination ofcontracts were to arise. No amounts were offset in thefinancial statements.
June 30, 2015
Financial assets – by type
Gross amountof assets
($)
Master nettingoffset
($)
Collateralpledged
($)Net Amount
($)
Currency forward contracts 646,592 (646,592) – –Options contracts – OTC – – – –Swap contracts – – – –
646,592 (646,592) – –
Financial liabilities – by type
Gross amountof liabilities
($)
Master nettingoffset
($)
Collateralpledged
($)Net Amount
($)
Currency forward contracts 971,043 (646,592) – 324,451Options contracts – OTC – – – –Swap contracts 454,411 – – 454,411
1,425,454 (646,592) – 778,862
December 31, 2014
Financial assets – by type
Gross amountof assets
($)
Master nettingoffset
($)
Collateralpledged
($)Net Amount
($)
Currency forward contracts – – – –Options contracts – OTC – – – –Swap contracts – – – –
– – – –
Financial liabilities – by type
Gross amountof liabilities
($)
Master nettingoffset
($)
Collateralpledged
($)Net Amount
($)
Currency forward contracts 509,424 – – 509,424Options contracts – OTC – – – –Swap contracts 18,088 – – 18,088
527,512 – – 527,512
4. Interest in Underlying Funds (note 2)
The Fund did not hold any interest in Underlying Funds asat June 30, 2015 or December 31, 2014.
5. Comparison of net asset value per unit and netassets per unit (note 2)
The table below provides a comparison of the net assetvalue per unit and net assets per unit. The primary reasonfor the difference between the net asset value per unit andnet assets per unit, if any, is described in note 2.
June 30, 2015 December 31, 2014
Net asset valueper unit
($)
Net assetsper unit
($)
Net asset valueper unit
($)
Net assetsper unit
($)
Series A 31.13 31.13 28.73 28.73
Series F 32.36 32.36 29.78 29.78
Series I 37.38 37.38 34.14 34.14
The accompanying notes are an integral part of the financial statements.
133
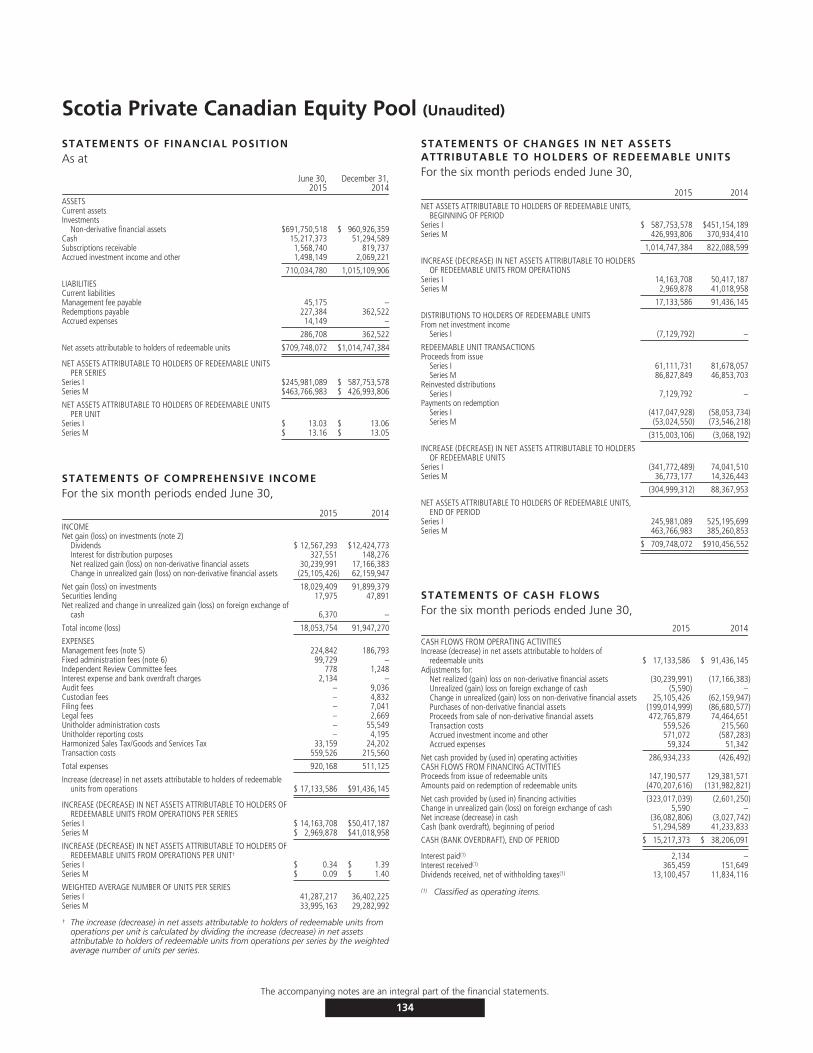
Scotia Private Canadian Equity Pool (Unaudited)
STATEMENTS OF FINANCIAL POSITIONAs at
June 30,2015
December 31,2014
ASSETSCurrent assetsInvestments
Non-derivative financial assets $691,750,518 $ 960,926,359Cash 15,217,373 51,294,589Subscriptions receivable 1,568,740 819,737Accrued investment income and other 1,498,149 2,069,221
710,034,780 1,015,109,906
LIABILITIESCurrent liabilitiesManagement fee payable 45,175 –Redemptions payable 227,384 362,522Accrued expenses 14,149 –
286,708 362,522
Net assets attributable to holders of redeemable units $709,748,072 $1,014,747,384
NET ASSETS ATTRIBUTABLE TO HOLDERS OF REDEEMABLE UNITSPER SERIES
Series I $245,981,089 $ 587,753,578Series M $463,766,983 $ 426,993,806
NET ASSETS ATTRIBUTABLE TO HOLDERS OF REDEEMABLE UNITSPER UNIT
Series I $ 13.03 $ 13.06Series M $ 13.16 $ 13.05
STATEMENTS OF COMPREHENSIVE INCOMEFor the six month periods ended June 30,
2015 2014INCOMENet gain (loss) on investments (note 2)
Dividends $ 12,567,293 $12,424,773Interest for distribution purposes 327,551 148,276Net realized gain (loss) on non-derivative financial assets 30,239,991 17,166,383Change in unrealized gain (loss) on non-derivative financial assets (25,105,426) 62,159,947
Net gain (loss) on investments 18,029,409 91,899,379Securities lending 17,975 47,891Net realized and change in unrealized gain (loss) on foreign exchange of
cash 6,370 –
Total income (loss) 18,053,754 91,947,270
EXPENSESManagement fees (note 5) 224,842 186,793Fixed administration fees (note 6) 99,729 –Independent Review Committee fees 778 1,248Interest expense and bank overdraft charges 2,134 –Audit fees – 9,036Custodian fees – 4,832Filing fees – 7,041Legal fees – 2,669Unitholder administration costs – 55,549Unitholder reporting costs – 4,195Harmonized Sales Tax/Goods and Services Tax 33,159 24,202Transaction costs 559,526 215,560
Total expenses 920,168 511,125
Increase (decrease) in net assets attributable to holders of redeemableunits from operations $ 17,133,586 $91,436,145
INCREASE (DECREASE) IN NET ASSETS ATTRIBUTABLE TO HOLDERS OFREDEEMABLE UNITS FROM OPERATIONS PER SERIES
Series I $ 14,163,708 $50,417,187Series M $ 2,969,878 $41,018,958
INCREASE (DECREASE) IN NET ASSETS ATTRIBUTABLE TO HOLDERS OFREDEEMABLE UNITS FROM OPERATIONS PER UNIT†
Series I $ 0.34 $ 1.39Series M $ 0.09 $ 1.40
WEIGHTED AVERAGE NUMBER OF UNITS PER SERIESSeries I 41,287,217 36,402,225Series M 33,995,163 29,282,992
† The increase (decrease) in net assets attributable to holders of redeemable units fromoperations per unit is calculated by dividing the increase (decrease) in net assetsattributable to holders of redeemable units from operations per series by the weightedaverage number of units per series.
STATEMENTS OF CHANGES IN NET ASSETSATTRIBUTABLE TO HOLDERS OF REDEEMABLE UNITSFor the six month periods ended June 30,
2015 2014NET ASSETS ATTRIBUTABLE TO HOLDERS OF REDEEMABLE UNITS,
BEGINNING OF PERIODSeries I $ 587,753,578 $451,154,189Series M 426,993,806 370,934,410
1,014,747,384 822,088,599
INCREASE (DECREASE) IN NET ASSETS ATTRIBUTABLE TO HOLDERSOF REDEEMABLE UNITS FROM OPERATIONS
Series I 14,163,708 50,417,187Series M 2,969,878 41,018,958
17,133,586 91,436,145
DISTRIBUTIONS TO HOLDERS OF REDEEMABLE UNITSFrom net investment income
Series I (7,129,792) –
REDEEMABLE UNIT TRANSACTIONSProceeds from issue
Series I 61,111,731 81,678,057Series M 86,827,849 46,853,703
Reinvested distributionsSeries I 7,129,792 –
Payments on redemptionSeries I (417,047,928) (58,053,734)Series M (53,024,550) (73,546,218)
(315,003,106) (3,068,192)
INCREASE (DECREASE) IN NET ASSETS ATTRIBUTABLE TO HOLDERSOF REDEEMABLE UNITS
Series I (341,772,489) 74,041,510Series M 36,773,177 14,326,443
(304,999,312) 88,367,953
NET ASSETS ATTRIBUTABLE TO HOLDERS OF REDEEMABLE UNITS,END OF PERIOD
Series I 245,981,089 525,195,699Series M 463,766,983 385,260,853
$ 709,748,072 $910,456,552
STATEMENTS OF CASH FLOWSFor the six month periods ended June 30,
2015 2014CASH FLOWS FROM OPERATING ACTIVITIESIncrease (decrease) in net assets attributable to holders of
redeemable units $ 17,133,586 $ 91,436,145Adjustments for:
Net realized (gain) loss on non-derivative financial assets (30,239,991) (17,166,383)Unrealized (gain) loss on foreign exchange of cash (5,590) –Change in unrealized (gain) loss on non-derivative financial assets 25,105,426 (62,159,947)Purchases of non-derivative financial assets (199,014,999) (86,680,577)Proceeds from sale of non-derivative financial assets 472,765,879 74,464,651Transaction costs 559,526 215,560Accrued investment income and other 571,072 (587,283)Accrued expenses 59,324 51,342
Net cash provided by (used in) operating activities 286,934,233 (426,492)CASH FLOWS FROM FINANCING ACTIVITIESProceeds from issue of redeemable units 147,190,577 129,381,571Amounts paid on redemption of redeemable units (470,207,616) (131,982,821)
Net cash provided by (used in) financing activities (323,017,039) (2,601,250)Change in unrealized gain (loss) on foreign exchange of cash 5,590 –Net increase (decrease) in cash (36,082,806) (3,027,742)Cash (bank overdraft), beginning of period 51,294,589 41,233,833
CASH (BANK OVERDRAFT), END OF PERIOD $ 15,217,373 $ 38,206,091
Interest paid(1) 2,134 –Interest received(1) 365,459 151,649Dividends received, net of withholding taxes(1) 13,100,457 11,834,116
(1) Classified as operating items.
The accompanying notes are an integral part of the financial statements.
134
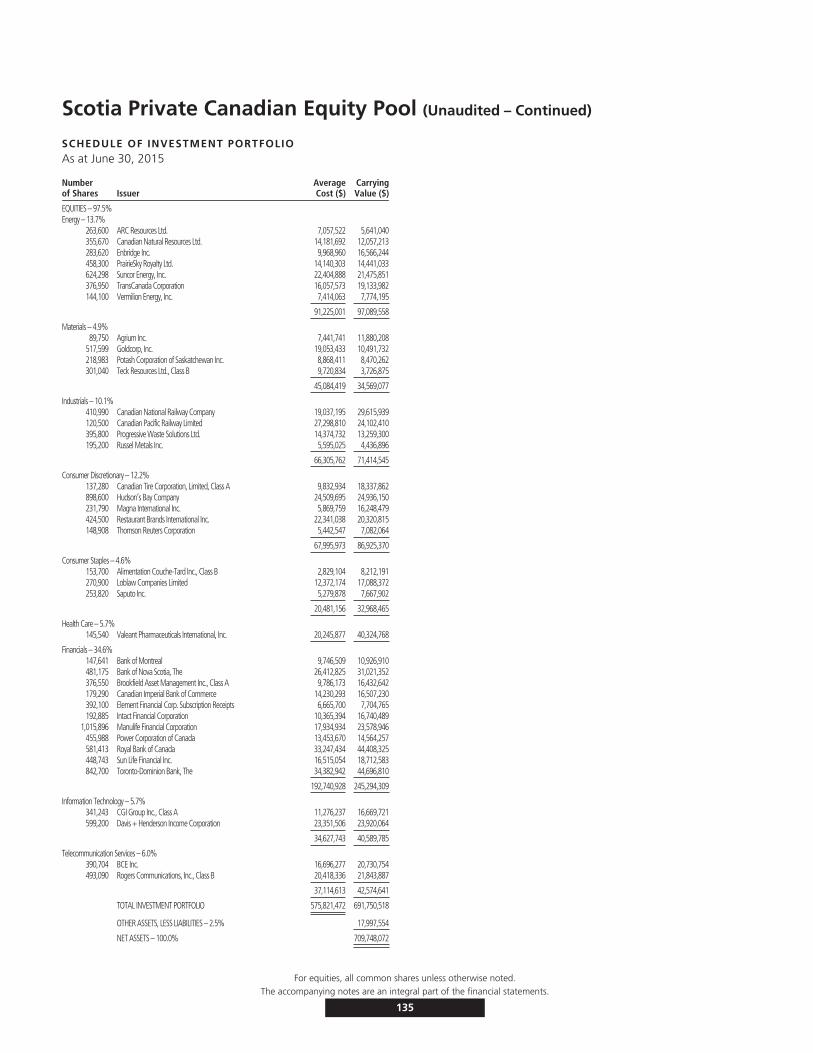
Scotia Private Canadian Equity Pool (Unaudited – Continued)
SCHEDULE OF INVESTMENT PORTFOLIOAs at June 30, 2015
Numberof Shares Issuer
AverageCost ($)
CarryingValue ($)
EQUITIES – 97.5%Energy – 13.7%
263,600 ARC Resources Ltd. 7,057,522 5,641,040355,670 Canadian Natural Resources Ltd. 14,181,692 12,057,213283,620 Enbridge Inc. 9,968,960 16,566,244458,300 PrairieSky Royalty Ltd. 14,140,303 14,441,033624,298 Suncor Energy, Inc. 22,404,888 21,475,851376,950 TransCanada Corporation 16,057,573 19,133,982144,100 Vermilion Energy, Inc. 7,414,063 7,774,195
91,225,001 97,089,558
Materials – 4.9%89,750 Agrium Inc. 7,441,741 11,880,208
517,599 Goldcorp, Inc. 19,053,433 10,491,732218,983 Potash Corporation of Saskatchewan Inc. 8,868,411 8,470,262301,040 Teck Resources Ltd., Class B 9,720,834 3,726,875
45,084,419 34,569,077
Industrials – 10.1%410,990 Canadian National Railway Company 19,037,195 29,615,939120,500 Canadian Pacific Railway Limited 27,298,810 24,102,410395,800 Progressive Waste Solutions Ltd. 14,374,732 13,259,300195,200 Russel Metals Inc. 5,595,025 4,436,896
66,305,762 71,414,545
Consumer Discretionary – 12.2%137,280 Canadian Tire Corporation, Limited, Class A 9,832,934 18,337,862898,600 Hudson’s Bay Company 24,509,695 24,936,150231,790 Magna International Inc. 5,869,759 16,248,479424,500 Restaurant Brands International Inc. 22,341,038 20,320,815148,908 Thomson Reuters Corporation 5,442,547 7,082,064
67,995,973 86,925,370
Consumer Staples – 4.6%153,700 Alimentation Couche-Tard Inc., Class B 2,829,104 8,212,191270,900 Loblaw Companies Limited 12,372,174 17,088,372253,820 Saputo Inc. 5,279,878 7,667,902
20,481,156 32,968,465
Health Care – 5.7%145,540 Valeant Pharmaceuticals International, Inc. 20,245,877 40,324,768
Financials – 34.6%147,641 Bank of Montreal 9,746,509 10,926,910481,175 Bank of Nova Scotia, The 26,412,825 31,021,352376,550 Brookfield Asset Management Inc., Class A 9,786,173 16,432,642179,290 Canadian Imperial Bank of Commerce 14,230,293 16,507,230392,100 Element Financial Corp. Subscription Receipts 6,665,700 7,704,765192,885 Intact Financial Corporation 10,365,394 16,740,489
1,015,896 Manulife Financial Corporation 17,934,934 23,578,946455,988 Power Corporation of Canada 13,453,670 14,564,257581,413 Royal Bank of Canada 33,247,434 44,408,325448,743 Sun Life Financial Inc. 16,515,054 18,712,583842,700 Toronto-Dominion Bank, The 34,382,942 44,696,810
192,740,928 245,294,309
Information Technology – 5.7%341,243 CGI Group Inc., Class A 11,276,237 16,669,721599,200 Davis + Henderson Income Corporation 23,351,506 23,920,064
34,627,743 40,589,785
Telecommunication Services – 6.0%390,704 BCE Inc. 16,696,277 20,730,754493,090 Rogers Communications, Inc., Class B 20,418,336 21,843,887
37,114,613 42,574,641
TOTAL INVESTMENT PORTFOLIO 575,821,472 691,750,518
OTHER ASSETS, LESS LIABILITIES – 2.5% 17,997,554
NET ASSETS – 100.0% 709,748,072
For equities, all common shares unless otherwise noted.The accompanying notes are an integral part of the financial statements.
135
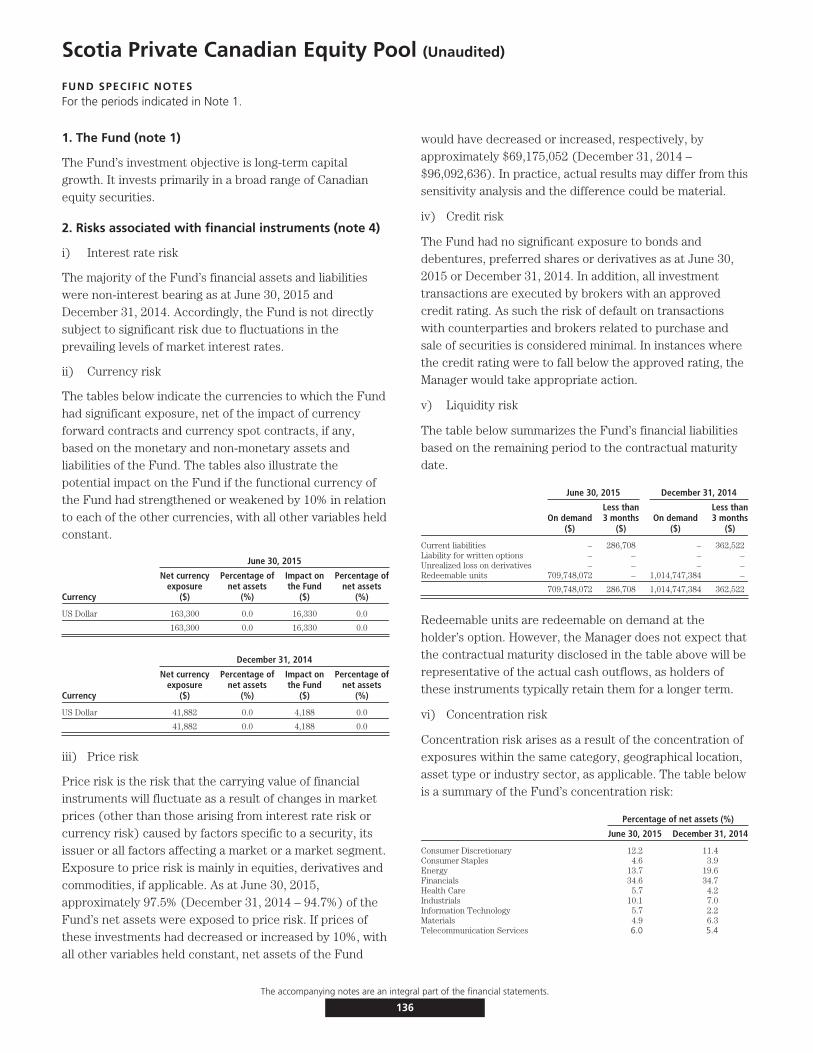
Scotia Private Canadian Equity Pool (Unaudited)
FUND SPECIFIC NOTESFor the periods indicated in Note 1.
1. The Fund (note 1)
The Fund’s investment objective is long-term capitalgrowth. It invests primarily in a broad range of Canadianequity securities.
2. Risks associated with financial instruments (note 4)
i) Interest rate risk
The majority of the Fund’s financial assets and liabilitieswere non-interest bearing as at June 30, 2015 andDecember 31, 2014. Accordingly, the Fund is not directlysubject to significant risk due to fluctuations in theprevailing levels of market interest rates.
ii) Currency risk
The tables below indicate the currencies to which the Fundhad significant exposure, net of the impact of currencyforward contracts and currency spot contracts, if any,based on the monetary and non-monetary assets andliabilities of the Fund. The tables also illustrate thepotential impact on the Fund if the functional currency ofthe Fund had strengthened or weakened by 10% in relationto each of the other currencies, with all other variables heldconstant.
June 30, 2015
Currency
Net currencyexposure
($)
Percentage ofnet assets
(%)
Impact onthe Fund
($)
Percentage ofnet assets
(%)
US Dollar 163,300 0.0 16,330 0.0
163,300 0.0 16,330 0.0
December 31, 2014
Currency
Net currencyexposure
($)
Percentage ofnet assets
(%)
Impact onthe Fund
($)
Percentage ofnet assets
(%)
US Dollar 41,882 0.0 4,188 0.0
41,882 0.0 4,188 0.0
iii) Price risk
Price risk is the risk that the carrying value of financialinstruments will fluctuate as a result of changes in marketprices (other than those arising from interest rate risk orcurrency risk) caused by factors specific to a security, itsissuer or all factors affecting a market or a market segment.Exposure to price risk is mainly in equities, derivatives andcommodities, if applicable. As at June 30, 2015,approximately 97.5% (December 31, 2014 – 94.7%) of theFund’s net assets were exposed to price risk. If prices ofthese investments had decreased or increased by 10%, withall other variables held constant, net assets of the Fund
would have decreased or increased, respectively, byapproximately $69,175,052 (December 31, 2014 –$96,092,636). In practice, actual results may differ from thissensitivity analysis and the difference could be material.
iv) Credit risk
The Fund had no significant exposure to bonds anddebentures, preferred shares or derivatives as at June 30,2015 or December 31, 2014. In addition, all investmenttransactions are executed by brokers with an approvedcredit rating. As such the risk of default on transactionswith counterparties and brokers related to purchase andsale of securities is considered minimal. In instances wherethe credit rating were to fall below the approved rating, theManager would take appropriate action.
v) Liquidity risk
The table below summarizes the Fund’s financial liabilitiesbased on the remaining period to the contractual maturitydate.
June 30, 2015 December 31, 2014
On demand($)
Less than3 months
($)On demand
($)
Less than3 months
($)
Current liabilities – 286,708 – 362,522Liability for written options – – – –Unrealized loss on derivatives – – – –Redeemable units 709,748,072 – 1,014,747,384 –
709,748,072 286,708 1,014,747,384 362,522
Redeemable units are redeemable on demand at theholder’s option. However, the Manager does not expect thatthe contractual maturity disclosed in the table above will berepresentative of the actual cash outflows, as holders ofthese instruments typically retain them for a longer term.
vi) Concentration risk
Concentration risk arises as a result of the concentration ofexposures within the same category, geographical location,asset type or industry sector, as applicable. The table belowis a summary of the Fund’s concentration risk:
Percentage of net assets (%)
June 30, 2015 December 31, 2014
Consumer Discretionary 12.2 11.4Consumer Staples 4.6 3.9Energy 13.7 19.6Financials 34.6 34.7Health Care 5.7 4.2Industrials 10.1 7.0Information Technology 5.7 2.2Materials 4.9 6.3Telecommunication Services 6.0 5.4
The accompanying notes are an integral part of the financial statements.
136

Scotia Private Canadian Equity Pool (Unaudited – Continued)
FUND SPECIFIC NOTESFor the periods indicated in Note 1.
vii) Fair value classification (note 2)
The tables below illustrate the classification of the Fund’sfinancial instruments within the fair value hierarchy.
June 30, 2015Level 1
($)Level 2
($)Level 3
($)Total($)
Equities 691,750,518 – – 691,750,518
691,750,518 – – 691,750,518
December 31, 2014Level 1
($)Level 2
($)Level 3
($)Total($)
Equities 960,926,359 – – 960,926,359
960,926,359 – – 960,926,359
Transfers between levels
During the periods ended June 30, 2015 and December 31,2014, there were no significant transfers between Level 1and Level 2.
3. Offsetting of financial assets and liabilities (note 2)
As at June 30, 2015 or December 31, 2014, the Fund didnot enter into any agreement whereby the financialinstruments were eligible for offset.
4. Interest in Underlying Funds (note 2)
The Fund did not hold any interest in Underlying Funds asat June 30, 2015 or December 31, 2014.
5. Comparison of net asset value per unit and netassets per unit (note 2)
The table below provides a comparison of the net assetvalue per unit and net assets per unit. The primary reasonfor the difference between the net asset value per unit andnet assets per unit, if any, is described in note 2.
June 30, 2015 December 31, 2014
Net asset valueper unit
($)
Net assetsper unit
($)
Net asset valueper unit
($)
Net assetsper unit
($)
Series I 13.03 13.03 13.06 13.06
Series M 13.16 13.16 13.05 13.05
The accompanying notes are an integral part of the financial statements.
137
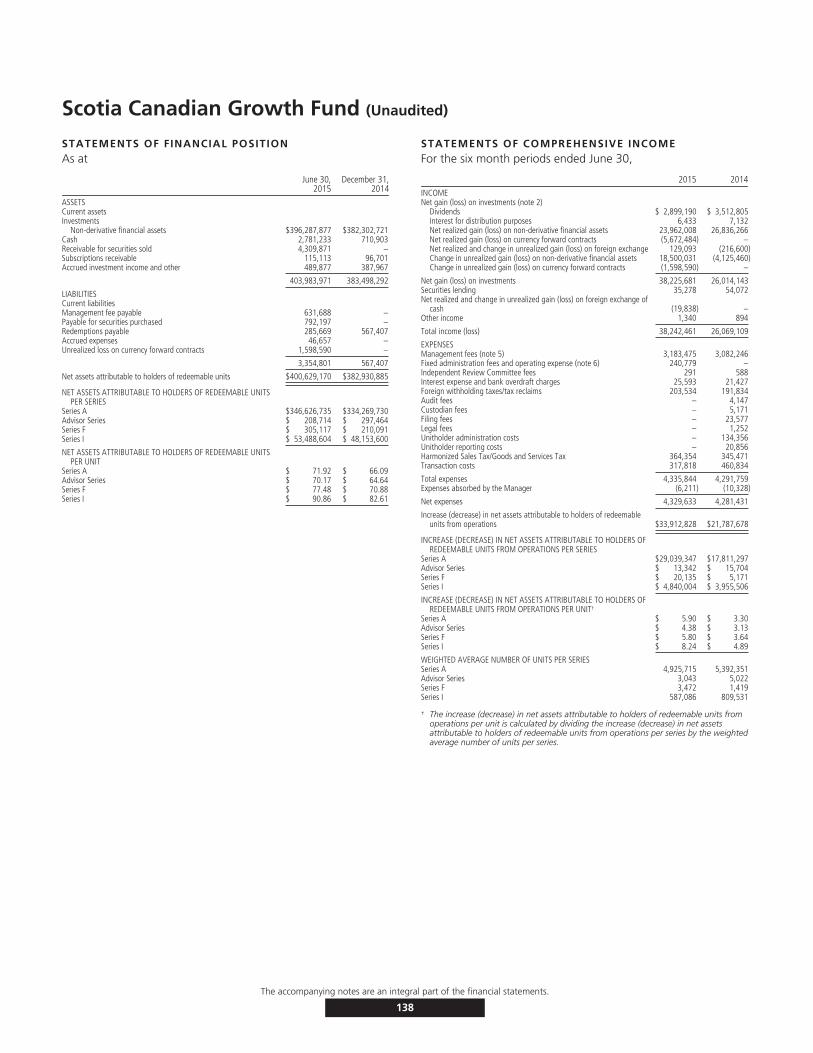
Scotia Canadian Growth Fund (Unaudited)
STATEMENTS OF FINANCIAL POSITIONAs at
June 30,2015
December 31,2014
ASSETSCurrent assetsInvestments
Non-derivative financial assets $396,287,877 $382,302,721Cash 2,781,233 710,903Receivable for securities sold 4,309,871 –Subscriptions receivable 115,113 96,701Accrued investment income and other 489,877 387,967
403,983,971 383,498,292
LIABILITIESCurrent liabilitiesManagement fee payable 631,688 –Payable for securities purchased 792,197 –Redemptions payable 285,669 567,407Accrued expenses 46,657 –Unrealized loss on currency forward contracts 1,598,590 –
3,354,801 567,407
Net assets attributable to holders of redeemable units $400,629,170 $382,930,885
NET ASSETS ATTRIBUTABLE TO HOLDERS OF REDEEMABLE UNITSPER SERIES
Series A $346,626,735 $334,269,730Advisor Series $ 208,714 $ 297,464Series F $ 305,117 $ 210,091Series I $ 53,488,604 $ 48,153,600
NET ASSETS ATTRIBUTABLE TO HOLDERS OF REDEEMABLE UNITSPER UNIT
Series A $ 71.92 $ 66.09Advisor Series $ 70.17 $ 64.64Series F $ 77.48 $ 70.88Series I $ 90.86 $ 82.61
STATEMENTS OF COMPREHENSIVE INCOMEFor the six month periods ended June 30,
2015 2014INCOMENet gain (loss) on investments (note 2)
Dividends $ 2,899,190 $ 3,512,805Interest for distribution purposes 6,433 7,132Net realized gain (loss) on non-derivative financial assets 23,962,008 26,836,266Net realized gain (loss) on currency forward contracts (5,672,484) –Net realized and change in unrealized gain (loss) on foreign exchange 129,093 (216,600)Change in unrealized gain (loss) on non-derivative financial assets 18,500,031 (4,125,460)Change in unrealized gain (loss) on currency forward contracts (1,598,590) –
Net gain (loss) on investments 38,225,681 26,014,143Securities lending 35,278 54,072Net realized and change in unrealized gain (loss) on foreign exchange of
cash (19,838) –Other income 1,340 894
Total income (loss) 38,242,461 26,069,109
EXPENSESManagement fees (note 5) 3,183,475 3,082,246Fixed administration fees and operating expense (note 6) 240,779 –Independent Review Committee fees 291 588Interest expense and bank overdraft charges 25,593 21,427Foreign withholding taxes/tax reclaims 203,534 191,834Audit fees – 4,147Custodian fees – 5,171Filing fees – 23,577Legal fees – 1,252Unitholder administration costs – 134,356Unitholder reporting costs – 20,856Harmonized Sales Tax/Goods and Services Tax 364,354 345,471Transaction costs 317,818 460,834
Total expenses 4,335,844 4,291,759Expenses absorbed by the Manager (6,211) (10,328)
Net expenses 4,329,633 4,281,431
Increase (decrease) in net assets attributable to holders of redeemableunits from operations $33,912,828 $21,787,678
INCREASE (DECREASE) IN NET ASSETS ATTRIBUTABLE TO HOLDERS OFREDEEMABLE UNITS FROM OPERATIONS PER SERIES
Series A $29,039,347 $17,811,297Advisor Series $ 13,342 $ 15,704Series F $ 20,135 $ 5,171Series I $ 4,840,004 $ 3,955,506
INCREASE (DECREASE) IN NET ASSETS ATTRIBUTABLE TO HOLDERS OFREDEEMABLE UNITS FROM OPERATIONS PER UNIT†
Series A $ 5.90 $ 3.30Advisor Series $ 4.38 $ 3.13Series F $ 5.80 $ 3.64Series I $ 8.24 $ 4.89
WEIGHTED AVERAGE NUMBER OF UNITS PER SERIESSeries A 4,925,715 5,392,351Advisor Series 3,043 5,022Series F 3,472 1,419Series I 587,086 809,531
† The increase (decrease) in net assets attributable to holders of redeemable units fromoperations per unit is calculated by dividing the increase (decrease) in net assetsattributable to holders of redeemable units from operations per series by the weightedaverage number of units per series.
The accompanying notes are an integral part of the financial statements.
138
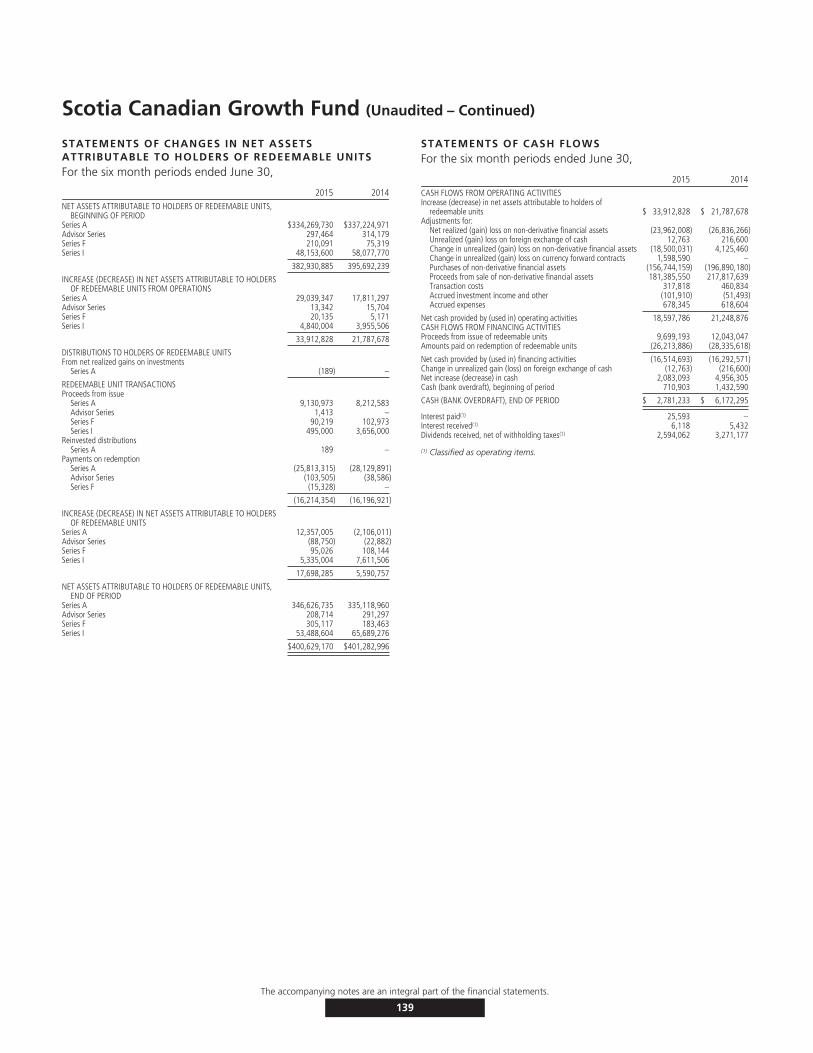
Scotia Canadian Growth Fund (Unaudited – Continued)
STATEMENTS OF CHANGES IN NET ASSETSATTRIBUTABLE TO HOLDERS OF REDEEMABLE UNITSFor the six month periods ended June 30,
2015 2014NET ASSETS ATTRIBUTABLE TO HOLDERS OF REDEEMABLE UNITS,
BEGINNING OF PERIODSeries A $334,269,730 $337,224,971Advisor Series 297,464 314,179Series F 210,091 75,319Series I 48,153,600 58,077,770
382,930,885 395,692,239
INCREASE (DECREASE) IN NET ASSETS ATTRIBUTABLE TO HOLDERSOF REDEEMABLE UNITS FROM OPERATIONS
Series A 29,039,347 17,811,297Advisor Series 13,342 15,704Series F 20,135 5,171Series I 4,840,004 3,955,506
33,912,828 21,787,678
DISTRIBUTIONS TO HOLDERS OF REDEEMABLE UNITSFrom net realized gains on investments
Series A (189) –
REDEEMABLE UNIT TRANSACTIONSProceeds from issue
Series A 9,130,973 8,212,583Advisor Series 1,413 –Series F 90,219 102,973Series I 495,000 3,656,000
Reinvested distributionsSeries A 189 –
Payments on redemptionSeries A (25,813,315) (28,129,891)Advisor Series (103,505) (38,586)Series F (15,328) –
(16,214,354) (16,196,921)
INCREASE (DECREASE) IN NET ASSETS ATTRIBUTABLE TO HOLDERSOF REDEEMABLE UNITS
Series A 12,357,005 (2,106,011)Advisor Series (88,750) (22,882)Series F 95,026 108,144Series I 5,335,004 7,611,506
17,698,285 5,590,757
NET ASSETS ATTRIBUTABLE TO HOLDERS OF REDEEMABLE UNITS,END OF PERIOD
Series A 346,626,735 335,118,960Advisor Series 208,714 291,297Series F 305,117 183,463Series I 53,488,604 65,689,276
$400,629,170 $401,282,996
STATEMENTS OF CASH FLOWSFor the six month periods ended June 30,
2015 2014CASH FLOWS FROM OPERATING ACTIVITIESIncrease (decrease) in net assets attributable to holders of
redeemable units $ 33,912,828 $ 21,787,678Adjustments for:
Net realized (gain) loss on non-derivative financial assets (23,962,008) (26,836,266)Unrealized (gain) loss on foreign exchange of cash 12,763 216,600Change in unrealized (gain) loss on non-derivative financial assets (18,500,031) 4,125,460Change in unrealized (gain) loss on currency forward contracts 1,598,590 –Purchases of non-derivative financial assets (156,744,159) (196,890,180)Proceeds from sale of non-derivative financial assets 181,385,550 217,817,639Transaction costs 317,818 460,834Accrued investment income and other (101,910) (51,493)Accrued expenses 678,345 618,604
Net cash provided by (used in) operating activities 18,597,786 21,248,876CASH FLOWS FROM FINANCING ACTIVITIESProceeds from issue of redeemable units 9,699,193 12,043,047Amounts paid on redemption of redeemable units (26,213,886) (28,335,618)
Net cash provided by (used in) financing activities (16,514,693) (16,292,571)Change in unrealized gain (loss) on foreign exchange of cash (12,763) (216,600)Net increase (decrease) in cash 2,083,093 4,956,305Cash (bank overdraft), beginning of period 710,903 1,432,590
CASH (BANK OVERDRAFT), END OF PERIOD $ 2,781,233 $ 6,172,295
Interest paid(1) 25,593 –Interest received(1) 6,118 5,432Dividends received, net of withholding taxes(1) 2,594,062 3,271,177
(1) Classified as operating items.
The accompanying notes are an integral part of the financial statements.
139
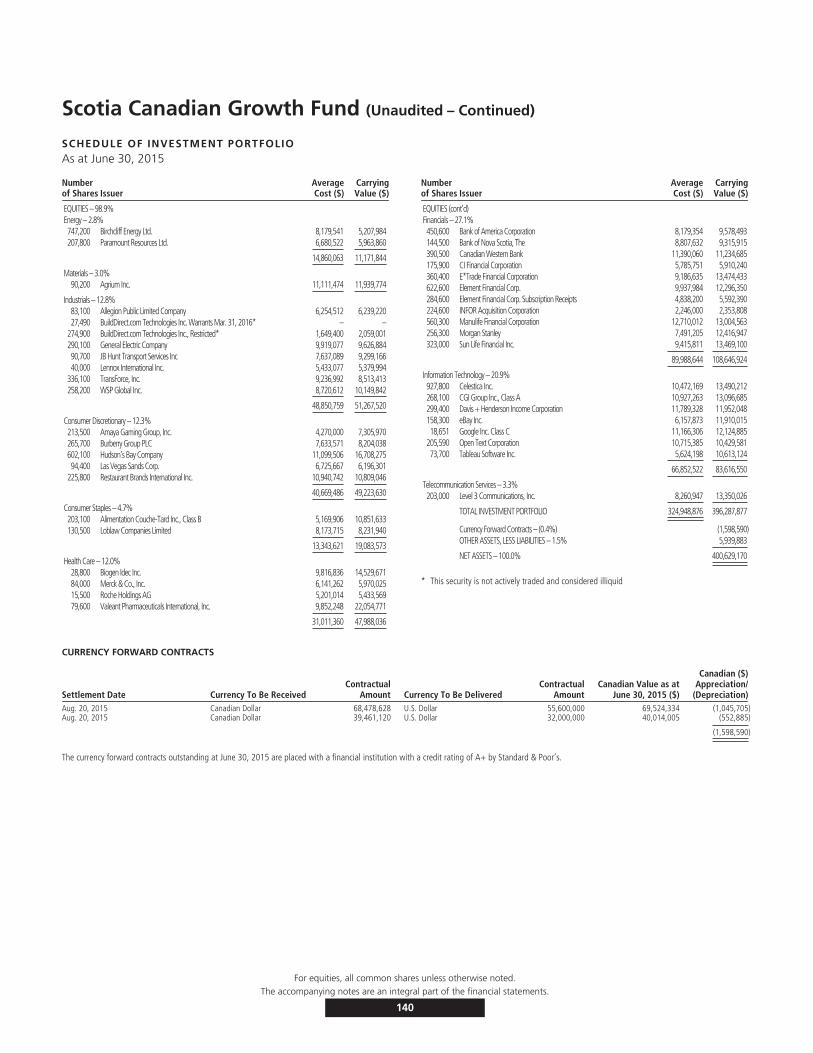
Scotia Canadian Growth Fund (Unaudited – Continued)
SCHEDULE OF INVESTMENT PORTFOLIOAs at June 30, 2015
Numberof Shares Issuer
AverageCost ($)
CarryingValue ($)
EQUITIES – 98.9%Energy – 2.8%747,200 Birchcliff Energy Ltd. 8,179,541 5,207,984207,800 Paramount Resources Ltd. 6,680,522 5,963,860
14,860,063 11,171,844
Materials – 3.0%90,200 Agrium Inc. 11,111,474 11,939,774
Industrials – 12.8%83,100 Allegion Public Limited Company 6,254,512 6,239,22027,490 BuildDirect.com Technologies Inc. Warrants Mar. 31, 2016* – –
274,900 BuildDirect.com Technologies Inc., Restricted* 1,649,400 2,059,001290,100 General Electric Company 9,919,077 9,626,88490,700 JB Hunt Transport Services Inc 7,637,089 9,299,16640,000 Lennox International Inc. 5,433,077 5,379,994
336,100 TransForce, Inc. 9,236,992 8,513,413258,200 WSP Global Inc. 8,720,612 10,149,842
48,850,759 51,267,520
Consumer Discretionary – 12.3%213,500 Amaya Gaming Group, Inc. 4,270,000 7,305,970265,700 Burberry Group PLC 7,633,571 8,204,038602,100 Hudson’s Bay Company 11,099,506 16,708,27594,400 Las Vegas Sands Corp. 6,725,667 6,196,301
225,800 Restaurant Brands International Inc. 10,940,742 10,809,046
40,669,486 49,223,630
Consumer Staples – 4.7%203,100 Alimentation Couche-Tard Inc., Class B 5,169,906 10,851,633130,500 Loblaw Companies Limited 8,173,715 8,231,940
13,343,621 19,083,573
Health Care – 12.0%28,800 Biogen Idec Inc. 9,816,836 14,529,67184,000 Merck & Co., Inc. 6,141,262 5,970,02515,500 Roche Holdings AG 5,201,014 5,433,56979,600 Valeant Pharmaceuticals International, Inc. 9,852,248 22,054,771
31,011,360 47,988,036
Numberof Shares Issuer
AverageCost ($)
CarryingValue ($)
EQUITIES (cont’d)Financials – 27.1%450,600 Bank of America Corporation 8,179,354 9,578,493144,500 Bank of Nova Scotia, The 8,807,632 9,315,915390,500 Canadian Western Bank 11,390,060 11,234,685175,900 CI Financial Corporation 5,785,751 5,910,240360,400 E*Trade Financial Corporation 9,186,635 13,474,433622,600 Element Financial Corp. 9,937,984 12,296,350284,600 Element Financial Corp. Subscription Receipts 4,838,200 5,592,390224,600 INFOR Acquisition Corporation 2,246,000 2,353,808560,300 Manulife Financial Corporation 12,710,012 13,004,563256,300 Morgan Stanley 7,491,205 12,416,947323,000 Sun Life Financial Inc. 9,415,811 13,469,100
89,988,644 108,646,924
Information Technology – 20.9%927,800 Celestica Inc. 10,472,169 13,490,212268,100 CGI Group Inc., Class A 10,927,263 13,096,685299,400 Davis + Henderson Income Corporation 11,789,328 11,952,048158,300 eBay Inc. 6,157,873 11,910,01518,651 Google Inc. Class C 11,166,306 12,124,885
205,590 Open Text Corporation 10,715,385 10,429,58173,700 Tableau Software Inc. 5,624,198 10,613,124
66,852,522 83,616,550
Telecommunication Services – 3.3%203,000 Level 3 Communications, Inc. 8,260,947 13,350,026
TOTAL INVESTMENT PORTFOLIO 324,948,876 396,287,877
Currency Forward Contracts – (0.4%) (1,598,590)OTHER ASSETS, LESS LIABILITIES – 1.5% 5,939,883
NET ASSETS – 100.0% 400,629,170
* This security is not actively traded and considered illiquid
CURRENCY FORWARD CONTRACTS
Settlement Date Currency To Be ReceivedContractual
Amount Currency To Be DeliveredContractual
AmountCanadian Value as at
June 30, 2015 ($)
Canadian ($)Appreciation/
(Depreciation)Aug. 20, 2015 Canadian Dollar 68,478,628 U.S. Dollar 55,600,000 69,524,334 (1,045,705)Aug. 20, 2015 Canadian Dollar 39,461,120 U.S. Dollar 32,000,000 40,014,005 (552,885)
(1,598,590)
The currency forward contracts outstanding at June 30, 2015 are placed with a financial institution with a credit rating of A+ by Standard & Poor’s.
For equities, all common shares unless otherwise noted.The accompanying notes are an integral part of the financial statements.
140

Scotia Canadian Growth Fund (Unaudited)
FUND SPECIFIC NOTESFor the periods indicated in Note 1.
1. The Fund (note 1)
The Fund’s investment objective is long-term capitalgrowth. It invests primarily in a broad range of Canadianequity securities.
2. Risks associated with financial instruments (note 4)
i) Interest rate risk
The majority of the Fund’s financial assets and liabilitieswere non-interest bearing as at June 30, 2015 andDecember 31, 2014. Accordingly, the Fund is not directlysubject to significant risk due to fluctuations in theprevailing levels of market interest rates.
ii) Currency risk
The tables below indicate the currencies to which the Fundhad significant exposure, net of the impact of currencyforward contracts and currency spot contracts, if any,based on the monetary and non-monetary assets andliabilities of the Fund. The tables also illustrate thepotential impact on the Fund if the functional currency ofthe Fund had strengthened or weakened by 10% in relationto each of the other currencies, with all other variables heldconstant.
June 30, 2015
Currency
Net currencyexposure
($)
Percentage ofnet assets
(%)
Impact onthe Fund
($)
Percentage ofnet assets
(%)
British Pound 8,204,037 2.0 820,404 0.2Swiss Franc 5,433,569 1.4 543,357 0.1US Dollar 31,300,214 7.8 3,130,021 0.8
44,937,820 11.2 4,493,782 1.1
December 31, 2014
Currency
Net currencyexposure
($)
Percentage ofnet assets
(%)
Impact onthe Fund
($)
Percentage ofnet assets
(%)
US Dollar 149,215,557 39.0 14,921,556 3.9Swiss Franc 7,138,695 1.9 713,870 0.2British Pound 6,116,186 1.6 611,619 0.2
162,470,438 42.5 16,247,045 4.3
iii) Price risk
Price risk is the risk that the carrying value of financialinstruments will fluctuate as a result of changes in marketprices (other than those arising from interest rate risk orcurrency risk) caused by factors specific to a security, itsissuer or all factors affecting a market or a market segment.Exposure to price risk is mainly in equities, derivatives andcommodities, if applicable. As at June 30, 2015,approximately 98.9% (December 31, 2014 – 99.8%) of theFund’s net assets were exposed to price risk. If prices of
these investments had decreased or increased by 10%, withall other variables held constant, net assets of the Fundwould have decreased or increased, respectively, byapproximately $39,628,788 (December 31, 2014 –$38,230,272). In practice, actual results may differ from thissensitivity analysis and the difference could be material.
iv) Credit risk
The Fund had no significant exposure to bonds anddebentures, preferred shares or derivatives as at June 30,2015 or December 31, 2014. In addition, all investmenttransactions are executed by brokers with an approvedcredit rating. As such the risk of default on transactionswith counterparties and brokers related to purchase andsale of securities is considered minimal. In instances wherethe credit rating were to fall below the approved rating, theManager would take appropriate action.
v) Liquidity risk
The table below summarizes the Fund’s financial liabilitiesbased on the remaining period to the contractual maturitydate.
June 30, 2015 December 31, 2014
On demand($)
Less than3 months
($)On demand
($)
Less than3 months
($)
Current liabilities – 1,756,211 – 567,407Liability for written options – – – –Unrealized loss on derivatives – 1,598,590 – –Redeemable units 400,629,170 – 382,930,885 –
400,629,170 3,354,801 382,930,885 567,407
Redeemable units are redeemable on demand at theholder’s option. However, the Manager does not expect thatthe contractual maturity disclosed in the table above will berepresentative of the actual cash outflows, as holders ofthese instruments typically retain them for a longer term.
vi) Concentration risk
Concentration risk arises as a result of the concentration ofexposures within the same category, geographical location,asset type or industry sector, as applicable. The table belowis a summary of the Fund’s concentration risk:
Percentage of net assets (%)
June 30, 2015 December 31, 2014
Consumer Discretionary 12.3 11.3Consumer Staples 4.7 3.0Energy 2.8 8.2Financials 27.1 26.3Health Care 12.0 13.7Industrials 12.8 13.0Information Technology 20.9 18.3Materials 3.0 2.9Telecommunication Services 3.3 3.1
The accompanying notes are an integral part of the financial statements.
141
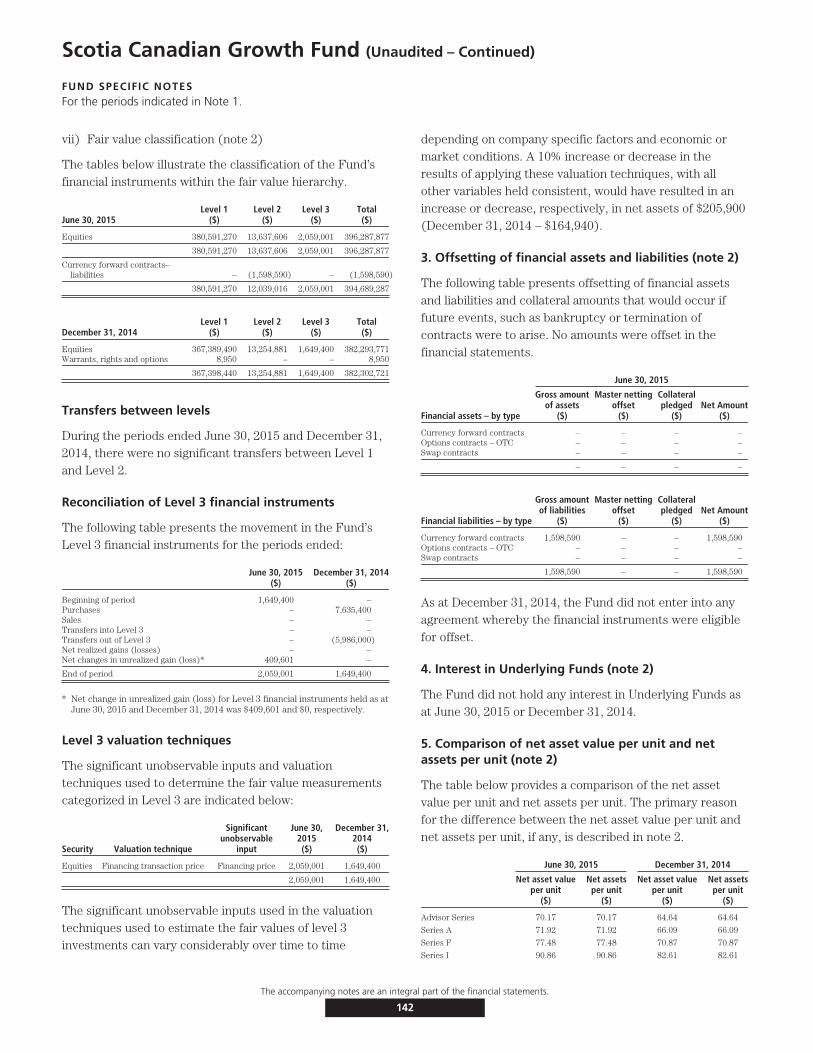
Scotia Canadian Growth Fund (Unaudited – Continued)
FUND SPECIFIC NOTESFor the periods indicated in Note 1.
vii) Fair value classification (note 2)
The tables below illustrate the classification of the Fund’sfinancial instruments within the fair value hierarchy.
June 30, 2015Level 1
($)Level 2
($)Level 3
($)Total($)
Equities 380,591,270 13,637,606 2,059,001 396,287,877
380,591,270 13,637,606 2,059,001 396,287,877
Currency forward contracts–liabilities – (1,598,590) – (1,598,590)
380,591,270 12,039,016 2,059,001 394,689,287
December 31, 2014Level 1
($)Level 2
($)Level 3
($)Total($)
Equities 367,389,490 13,254,881 1,649,400 382,293,771Warrants, rights and options 8,950 – – 8,950
367,398,440 13,254,881 1,649,400 382,302,721
Transfers between levels
During the periods ended June 30, 2015 and December 31,2014, there were no significant transfers between Level 1and Level 2.
Reconciliation of Level 3 financial instruments
The following table presents the movement in the Fund’sLevel 3 financial instruments for the periods ended:
June 30, 2015($)
December 31, 2014($)
Beginning of period 1,649,400 –Purchases – 7,635,400Sales – –Transfers into Level 3 – –Transfers out of Level 3 – (5,986,000)Net realized gains (losses) – –Net changes in unrealized gain (loss)* 409,601 –
End of period 2,059,001 1,649,400
* Net change in unrealized gain (loss) for Level 3 financial instruments held as atJune 30, 2015 and December 31, 2014 was $409,601 and $0, respectively.
Level 3 valuation techniques
The significant unobservable inputs and valuationtechniques used to determine the fair value measurementscategorized in Level 3 are indicated below:
Security Valuation technique
Significantunobservable
input
June 30,2015($)
December 31,2014($)
Equities Financing transaction price Financing price 2,059,001 1,649,400
2,059,001 1,649,400
The significant unobservable inputs used in the valuationtechniques used to estimate the fair values of level 3investments can vary considerably over time to time
depending on company specific factors and economic ormarket conditions. A 10% increase or decrease in theresults of applying these valuation techniques, with allother variables held consistent, would have resulted in anincrease or decrease, respectively, in net assets of $205,900(December 31, 2014 – $164,940).
3. Offsetting of financial assets and liabilities (note 2)
The following table presents offsetting of financial assetsand liabilities and collateral amounts that would occur iffuture events, such as bankruptcy or termination ofcontracts were to arise. No amounts were offset in thefinancial statements.
June 30, 2015
Financial assets – by type
Gross amountof assets
($)
Master nettingoffset
($)
Collateralpledged
($)Net Amount
($)
Currency forward contracts – – – –Options contracts – OTC – – – –Swap contracts – – – –
– – – –
Financial liabilities – by type
Gross amountof liabilities
($)
Master nettingoffset
($)
Collateralpledged
($)Net Amount
($)
Currency forward contracts 1,598,590 – – 1,598,590Options contracts – OTC – – – –Swap contracts – – – –
1,598,590 – – 1,598,590
As at December 31, 2014, the Fund did not enter into anyagreement whereby the financial instruments were eligiblefor offset.
4. Interest in Underlying Funds (note 2)
The Fund did not hold any interest in Underlying Funds asat June 30, 2015 or December 31, 2014.
5. Comparison of net asset value per unit and netassets per unit (note 2)
The table below provides a comparison of the net assetvalue per unit and net assets per unit. The primary reasonfor the difference between the net asset value per unit andnet assets per unit, if any, is described in note 2.
June 30, 2015 December 31, 2014
Net asset valueper unit
($)
Net assetsper unit
($)
Net asset valueper unit
($)
Net assetsper unit
($)
Advisor Series 70.17 70.17 64.64 64.64
Series A 71.92 71.92 66.09 66.09
Series F 77.48 77.48 70.87 70.87
Series I 90.86 90.86 82.61 82.61
The accompanying notes are an integral part of the financial statements.
142
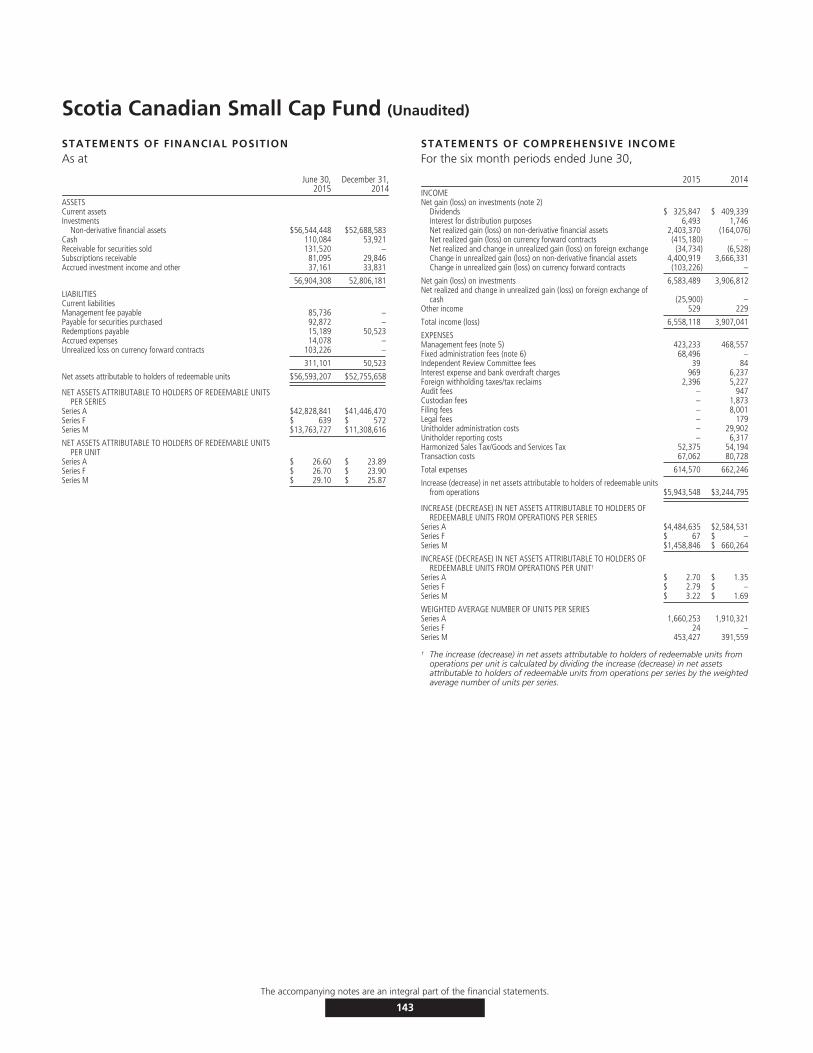
Scotia Canadian Small Cap Fund (Unaudited)
STATEMENTS OF FINANCIAL POSITIONAs at
June 30,2015
December 31,2014
ASSETSCurrent assetsInvestments
Non-derivative financial assets $56,544,448 $52,688,583Cash 110,084 53,921Receivable for securities sold 131,520 –Subscriptions receivable 81,095 29,846Accrued investment income and other 37,161 33,831
56,904,308 52,806,181
LIABILITIESCurrent liabilitiesManagement fee payable 85,736 –Payable for securities purchased 92,872 –Redemptions payable 15,189 50,523Accrued expenses 14,078 –Unrealized loss on currency forward contracts 103,226 –
311,101 50,523
Net assets attributable to holders of redeemable units $56,593,207 $52,755,658
NET ASSETS ATTRIBUTABLE TO HOLDERS OF REDEEMABLE UNITSPER SERIES
Series A $42,828,841 $41,446,470Series F $ 639 $ 572Series M $13,763,727 $11,308,616
NET ASSETS ATTRIBUTABLE TO HOLDERS OF REDEEMABLE UNITSPER UNIT
Series A $ 26.60 $ 23.89Series F $ 26.70 $ 23.90Series M $ 29.10 $ 25.87
STATEMENTS OF COMPREHENSIVE INCOMEFor the six month periods ended June 30,
2015 2014INCOMENet gain (loss) on investments (note 2)
Dividends $ 325,847 $ 409,339Interest for distribution purposes 6,493 1,746Net realized gain (loss) on non-derivative financial assets 2,403,370 (164,076)Net realized gain (loss) on currency forward contracts (415,180) –Net realized and change in unrealized gain (loss) on foreign exchange (34,734) (6,528)Change in unrealized gain (loss) on non-derivative financial assets 4,400,919 3,666,331Change in unrealized gain (loss) on currency forward contracts (103,226) –
Net gain (loss) on investments 6,583,489 3,906,812Net realized and change in unrealized gain (loss) on foreign exchange of
cash (25,900) –Other income 529 229
Total income (loss) 6,558,118 3,907,041
EXPENSESManagement fees (note 5) 423,233 468,557Fixed administration fees (note 6) 68,496 –Independent Review Committee fees 39 84Interest expense and bank overdraft charges 969 6,237Foreign withholding taxes/tax reclaims 2,396 5,227Audit fees – 947Custodian fees – 1,873Filing fees – 8,001Legal fees – 179Unitholder administration costs – 29,902Unitholder reporting costs – 6,317Harmonized Sales Tax/Goods and Services Tax 52,375 54,194Transaction costs 67,062 80,728
Total expenses 614,570 662,246
Increase (decrease) in net assets attributable to holders of redeemable unitsfrom operations $5,943,548 $3,244,795
INCREASE (DECREASE) IN NET ASSETS ATTRIBUTABLE TO HOLDERS OFREDEEMABLE UNITS FROM OPERATIONS PER SERIES
Series A $4,484,635 $2,584,531Series F $ 67 $ –Series M $1,458,846 $ 660,264
INCREASE (DECREASE) IN NET ASSETS ATTRIBUTABLE TO HOLDERS OFREDEEMABLE UNITS FROM OPERATIONS PER UNIT†
Series A $ 2.70 $ 1.35Series F $ 2.79 $ –Series M $ 3.22 $ 1.69
WEIGHTED AVERAGE NUMBER OF UNITS PER SERIESSeries A 1,660,253 1,910,321Series F 24 –Series M 453,427 391,559
† The increase (decrease) in net assets attributable to holders of redeemable units fromoperations per unit is calculated by dividing the increase (decrease) in net assetsattributable to holders of redeemable units from operations per series by the weightedaverage number of units per series.
The accompanying notes are an integral part of the financial statements.
143
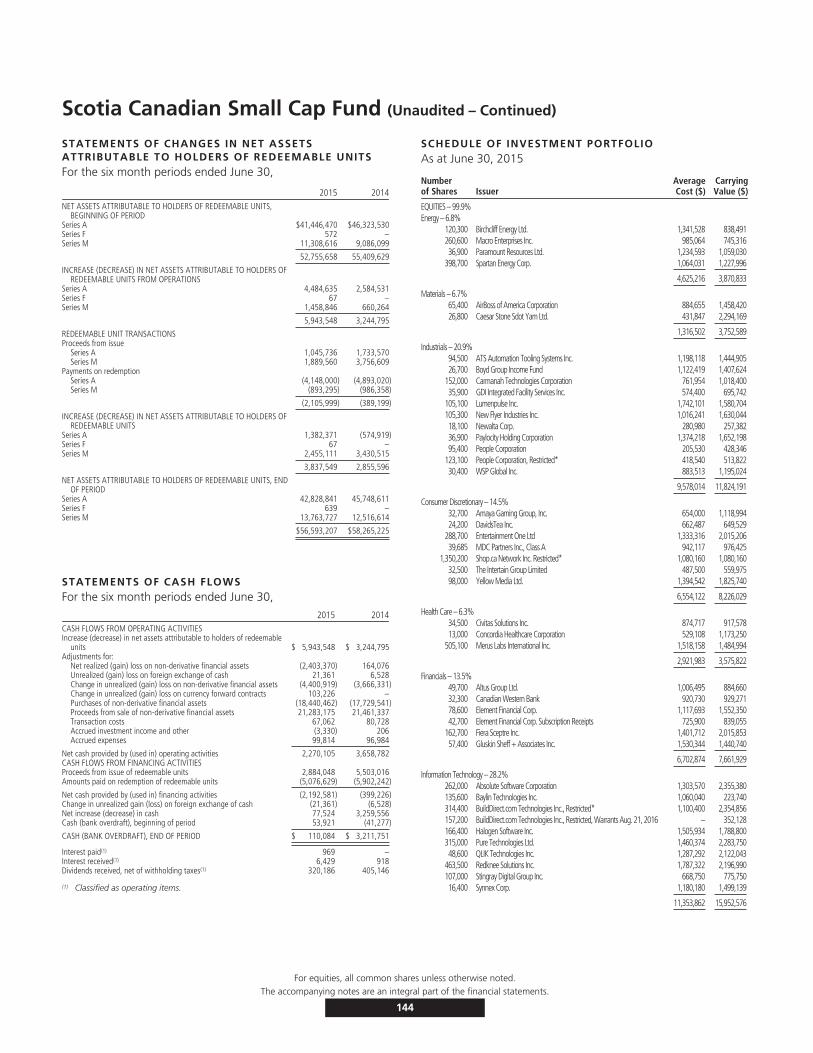
Scotia Canadian Small Cap Fund (Unaudited – Continued)
STATEMENTS OF CHANGES IN NET ASSETSATTRIBUTABLE TO HOLDERS OF REDEEMABLE UNITSFor the six month periods ended June 30,
2015 2014NET ASSETS ATTRIBUTABLE TO HOLDERS OF REDEEMABLE UNITS,
BEGINNING OF PERIODSeries A $41,446,470 $46,323,530Series F 572 –Series M 11,308,616 9,086,099
52,755,658 55,409,629
INCREASE (DECREASE) IN NET ASSETS ATTRIBUTABLE TO HOLDERS OFREDEEMABLE UNITS FROM OPERATIONS
Series A 4,484,635 2,584,531Series F 67 –Series M 1,458,846 660,264
5,943,548 3,244,795
REDEEMABLE UNIT TRANSACTIONSProceeds from issue
Series A 1,045,736 1,733,570Series M 1,889,560 3,756,609
Payments on redemptionSeries A (4,148,000) (4,893,020)Series M (893,295) (986,358)
(2,105,999) (389,199)
INCREASE (DECREASE) IN NET ASSETS ATTRIBUTABLE TO HOLDERS OFREDEEMABLE UNITS
Series A 1,382,371 (574,919)Series F 67 –Series M 2,455,111 3,430,515
3,837,549 2,855,596
NET ASSETS ATTRIBUTABLE TO HOLDERS OF REDEEMABLE UNITS, ENDOF PERIOD
Series A 42,828,841 45,748,611Series F 639 –Series M 13,763,727 12,516,614
$56,593,207 $58,265,225
STATEMENTS OF CASH FLOWSFor the six month periods ended June 30,
2015 2014CASH FLOWS FROM OPERATING ACTIVITIESIncrease (decrease) in net assets attributable to holders of redeemable
units $ 5,943,548 $ 3,244,795Adjustments for:
Net realized (gain) loss on non-derivative financial assets (2,403,370) 164,076Unrealized (gain) loss on foreign exchange of cash 21,361 6,528Change in unrealized (gain) loss on non-derivative financial assets (4,400,919) (3,666,331)Change in unrealized (gain) loss on currency forward contracts 103,226 –Purchases of non-derivative financial assets (18,440,462) (17,729,541)Proceeds from sale of non-derivative financial assets 21,283,175 21,461,337Transaction costs 67,062 80,728Accrued investment income and other (3,330) 206Accrued expenses 99,814 96,984
Net cash provided by (used in) operating activities 2,270,105 3,658,782CASH FLOWS FROM FINANCING ACTIVITIESProceeds from issue of redeemable units 2,884,048 5,503,016Amounts paid on redemption of redeemable units (5,076,629) (5,902,242)
Net cash provided by (used in) financing activities (2,192,581) (399,226)Change in unrealized gain (loss) on foreign exchange of cash (21,361) (6,528)Net increase (decrease) in cash 77,524 3,259,556Cash (bank overdraft), beginning of period 53,921 (41,277)
CASH (BANK OVERDRAFT), END OF PERIOD $ 110,084 $ 3,211,751
Interest paid(1) 969 –Interest received(1) 6,429 918Dividends received, net of withholding taxes(1) 320,186 405,146
(1) Classified as operating items.
SCHEDULE OF INVESTMENT PORTFOLIOAs at June 30, 2015
Numberof Shares Issuer
AverageCost ($)
CarryingValue ($)
EQUITIES – 99.9%Energy – 6.8%
120,300 Birchcliff Energy Ltd. 1,341,528 838,491260,600 Macro Enterprises Inc. 985,064 745,31636,900 Paramount Resources Ltd. 1,234,593 1,059,030
398,700 Spartan Energy Corp. 1,064,031 1,227,996
4,625,216 3,870,833
Materials – 6.7%65,400 AirBoss of America Corporation 884,655 1,458,42026,800 Caesar Stone Sdot Yam Ltd. 431,847 2,294,169
1,316,502 3,752,589
Industrials – 20.9%94,500 ATS Automation Tooling Systems Inc. 1,198,118 1,444,90526,700 Boyd Group Income Fund 1,122,419 1,407,624
152,000 Carmanah Technologies Corporation 761,954 1,018,40035,900 GDI Integrated Facility Services Inc. 574,400 695,742
105,100 Lumenpulse Inc. 1,742,101 1,580,704105,300 New Flyer Industries Inc. 1,016,241 1,630,04418,100 Newalta Corp. 280,980 257,38236,900 Paylocity Holding Corporation 1,374,218 1,652,19895,400 People Corporation 205,530 428,346
123,100 People Corporation, Restricted* 418,540 513,82230,400 WSP Global Inc. 883,513 1,195,024
9,578,014 11,824,191
Consumer Discretionary – 14.5%32,700 Amaya Gaming Group, Inc. 654,000 1,118,99424,200 DavidsTea Inc. 662,487 649,529
288,700 Entertainment One Ltd 1,333,316 2,015,20639,685 MDC Partners Inc., Class A 942,117 976,425
1,350,200 Shop.ca Network Inc. Restricted* 1,080,160 1,080,16032,500 The Intertain Group Limited 487,500 559,97598,000 Yellow Media Ltd. 1,394,542 1,825,740
6,554,122 8,226,029
Health Care – 6.3%34,500 Civitas Solutions Inc. 874,717 917,57813,000 Concordia Healthcare Corporation 529,108 1,173,250
505,100 Merus Labs International Inc. 1,518,158 1,484,994
2,921,983 3,575,822
Financials – 13.5%49,700 Altus Group Ltd. 1,006,495 884,66032,300 Canadian Western Bank 920,730 929,27178,600 Element Financial Corp. 1,117,693 1,552,35042,700 Element Financial Corp. Subscription Receipts 725,900 839,055
162,700 Fiera Sceptre Inc. 1,401,712 2,015,85357,400 Gluskin Sheff + Associates Inc. 1,530,344 1,440,740
6,702,874 7,661,929
Information Technology – 28.2%262,000 Absolute Software Corporation 1,303,570 2,355,380135,600 Baylin Technologies Inc. 1,060,040 223,740314,400 BuildDirect.com Technologies Inc., Restricted* 1,100,400 2,354,856157,200 BuildDirect.com Technologies Inc., Restricted, Warrants Aug. 21, 2016 – 352,128166,400 Halogen Software Inc. 1,505,934 1,788,800315,000 Pure Technologies Ltd. 1,460,374 2,283,75048,600 QLIK Technologies Inc. 1,287,292 2,122,043
463,500 Redknee Solutions Inc. 1,787,322 2,196,990107,000 Stingray Digital Group Inc. 668,750 775,75016,400 Synnex Corp. 1,180,180 1,499,139
11,353,862 15,952,576
For equities, all common shares unless otherwise noted.The accompanying notes are an integral part of the financial statements.
144
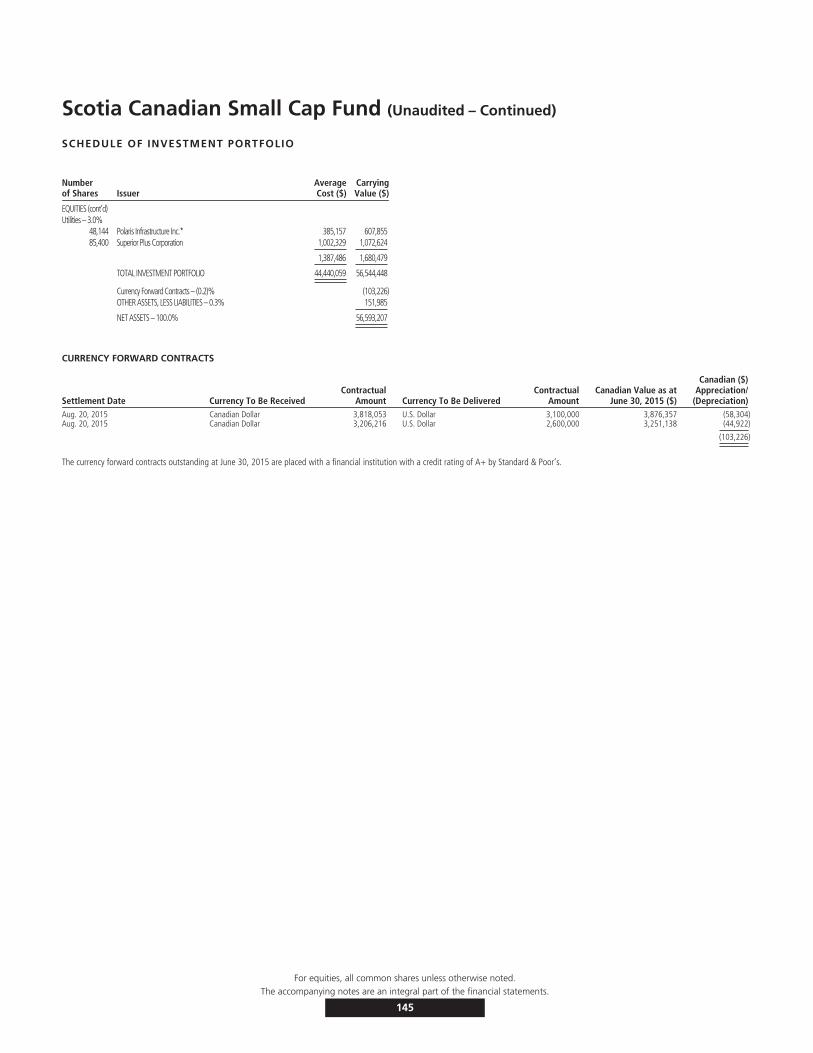
Scotia Canadian Small Cap Fund (Unaudited – Continued)
SCHEDULE OF INVESTMENT PORTFOLIO
Numberof Shares Issuer
AverageCost ($)
CarryingValue ($)
EQUITIES (cont’d)Utilities – 3.0%
48,144 Polaris Infrastructure Inc.* 385,157 607,85585,400 Superior Plus Corporation 1,002,329 1,072,624
1,387,486 1,680,479
TOTAL INVESTMENT PORTFOLIO 44,440,059 56,544,448
Currency Forward Contracts – (0.2)% (103,226)OTHER ASSETS, LESS LIABILITIES – 0.3% 151,985
NET ASSETS – 100.0% 56,593,207
CURRENCY FORWARD CONTRACTS
Settlement Date Currency To Be ReceivedContractual
Amount Currency To Be DeliveredContractual
AmountCanadian Value as at
June 30, 2015 ($)
Canadian ($)Appreciation/
(Depreciation)Aug. 20, 2015 Canadian Dollar 3,818,053 U.S. Dollar 3,100,000 3,876,357 (58,304)Aug. 20, 2015 Canadian Dollar 3,206,216 U.S. Dollar 2,600,000 3,251,138 (44,922)
(103,226)
The currency forward contracts outstanding at June 30, 2015 are placed with a financial institution with a credit rating of A+ by Standard & Poor’s.
For equities, all common shares unless otherwise noted.The accompanying notes are an integral part of the financial statements.
145
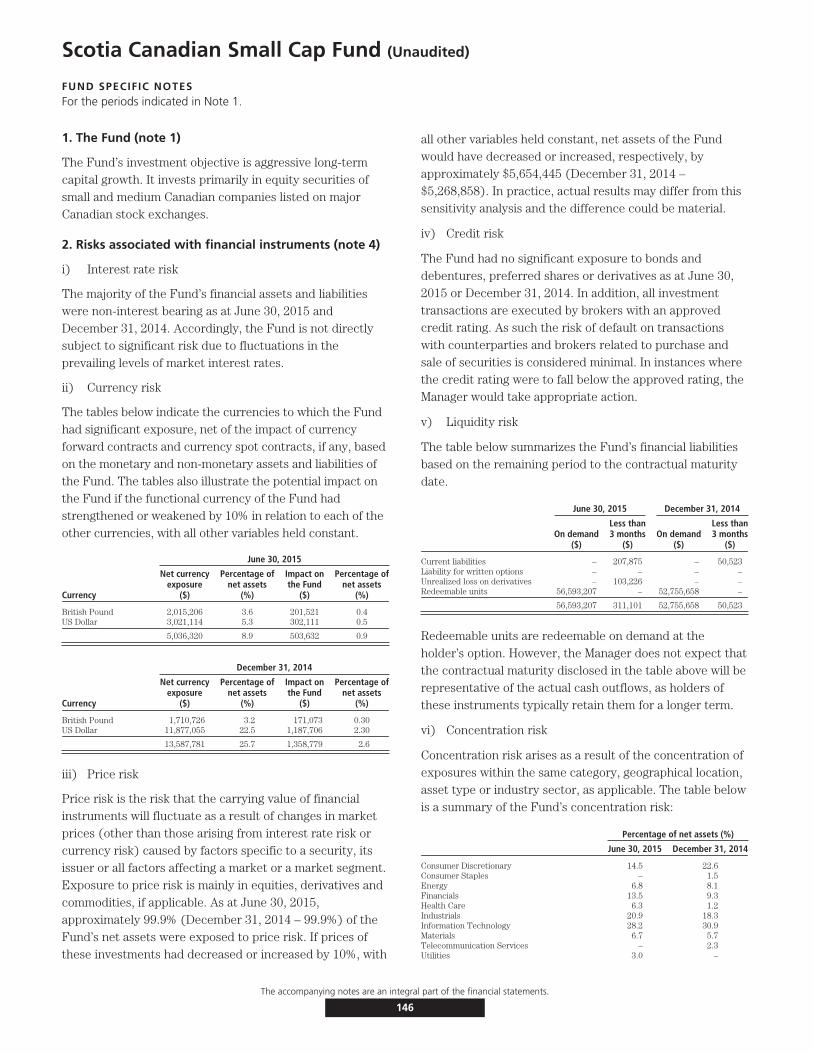
Scotia Canadian Small Cap Fund (Unaudited)
FUND SPECIFIC NOTESFor the periods indicated in Note 1.
1. The Fund (note 1)
The Fund’s investment objective is aggressive long-termcapital growth. It invests primarily in equity securities ofsmall and medium Canadian companies listed on majorCanadian stock exchanges.
2. Risks associated with financial instruments (note 4)
i) Interest rate risk
The majority of the Fund’s financial assets and liabilitieswere non-interest bearing as at June 30, 2015 andDecember 31, 2014. Accordingly, the Fund is not directlysubject to significant risk due to fluctuations in theprevailing levels of market interest rates.
ii) Currency risk
The tables below indicate the currencies to which the Fundhad significant exposure, net of the impact of currencyforward contracts and currency spot contracts, if any, basedon the monetary and non-monetary assets and liabilities ofthe Fund. The tables also illustrate the potential impact onthe Fund if the functional currency of the Fund hadstrengthened or weakened by 10% in relation to each of theother currencies, with all other variables held constant.
June 30, 2015
Currency
Net currencyexposure
($)
Percentage ofnet assets
(%)
Impact onthe Fund
($)
Percentage ofnet assets
(%)
British Pound 2,015,206 3.6 201,521 0.4US Dollar 3,021,114 5.3 302,111 0.5
5,036,320 8.9 503,632 0.9
December 31, 2014
Currency
Net currencyexposure
($)
Percentage ofnet assets
(%)
Impact onthe Fund
($)
Percentage ofnet assets
(%)
British Pound 1,710,726 3.2 171,073 0.30US Dollar 11,877,055 22.5 1,187,706 2.30
13,587,781 25.7 1,358,779 2.6
iii) Price risk
Price risk is the risk that the carrying value of financialinstruments will fluctuate as a result of changes in marketprices (other than those arising from interest rate risk orcurrency risk) caused by factors specific to a security, itsissuer or all factors affecting a market or a market segment.Exposure to price risk is mainly in equities, derivatives andcommodities, if applicable. As at June 30, 2015,approximately 99.9% (December 31, 2014 – 99.9%) of theFund’s net assets were exposed to price risk. If prices ofthese investments had decreased or increased by 10%, with
all other variables held constant, net assets of the Fundwould have decreased or increased, respectively, byapproximately $5,654,445 (December 31, 2014 –$5,268,858). In practice, actual results may differ from thissensitivity analysis and the difference could be material.
iv) Credit risk
The Fund had no significant exposure to bonds anddebentures, preferred shares or derivatives as at June 30,2015 or December 31, 2014. In addition, all investmenttransactions are executed by brokers with an approvedcredit rating. As such the risk of default on transactionswith counterparties and brokers related to purchase andsale of securities is considered minimal. In instances wherethe credit rating were to fall below the approved rating, theManager would take appropriate action.
v) Liquidity risk
The table below summarizes the Fund’s financial liabilitiesbased on the remaining period to the contractual maturitydate.
June 30, 2015 December 31, 2014
On demand($)
Less than3 months
($)On demand
($)
Less than3 months
($)
Current liabilities – 207,875 – 50,523Liability for written options – – – –Unrealized loss on derivatives – 103,226 – –Redeemable units 56,593,207 – 52,755,658 –
56,593,207 311,101 52,755,658 50,523
Redeemable units are redeemable on demand at theholder’s option. However, the Manager does not expect thatthe contractual maturity disclosed in the table above will berepresentative of the actual cash outflows, as holders ofthese instruments typically retain them for a longer term.
vi) Concentration risk
Concentration risk arises as a result of the concentration ofexposures within the same category, geographical location,asset type or industry sector, as applicable. The table belowis a summary of the Fund’s concentration risk:
Percentage of net assets (%)
June 30, 2015 December 31, 2014
Consumer Discretionary 14.5 22.6Consumer Staples – 1.5Energy 6.8 8.1Financials 13.5 9.3Health Care 6.3 1.2Industrials 20.9 18.3Information Technology 28.2 30.9Materials 6.7 5.7Telecommunication Services – 2.3Utilities 3.0 –
The accompanying notes are an integral part of the financial statements.
146
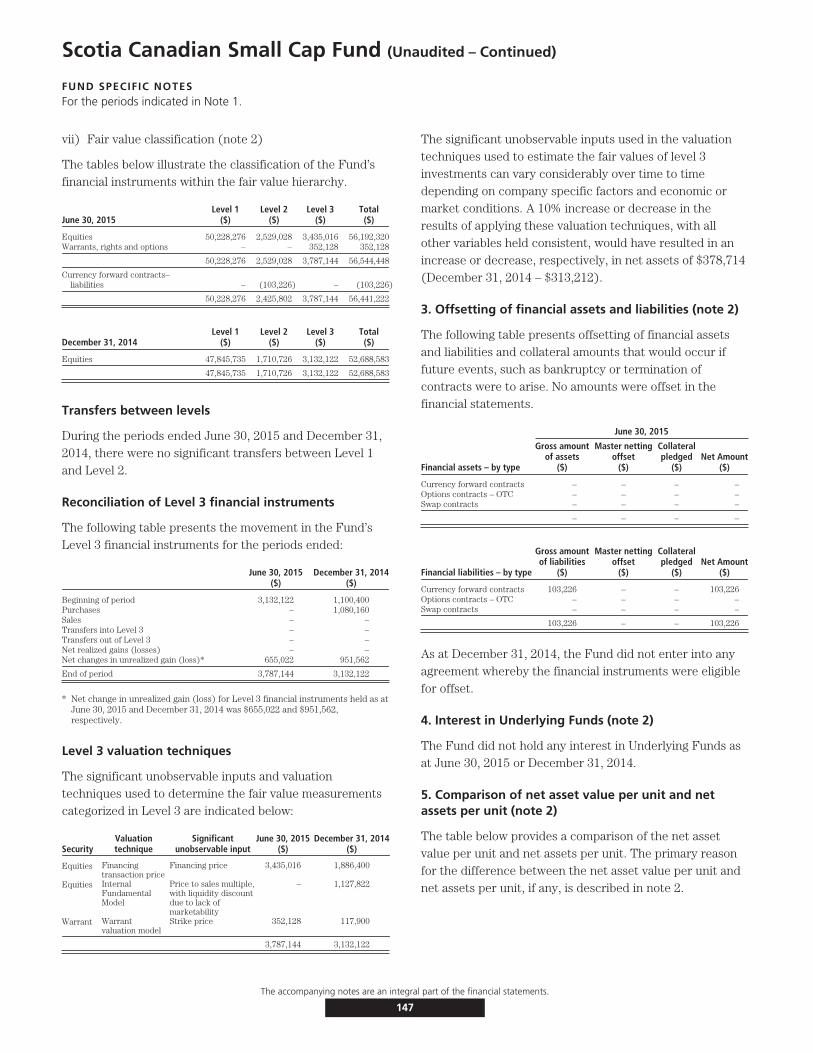
Scotia Canadian Small Cap Fund (Unaudited – Continued)
FUND SPECIFIC NOTESFor the periods indicated in Note 1.
vii) Fair value classification (note 2)
The tables below illustrate the classification of the Fund’sfinancial instruments within the fair value hierarchy.
June 30, 2015Level 1
($)Level 2
($)Level 3
($)Total($)
Equities 50,228,276 2,529,028 3,435,016 56,192,320Warrants, rights and options – – 352,128 352,128
50,228,276 2,529,028 3,787,144 56,544,448
Currency forward contracts–liabilities – (103,226) – (103,226)
50,228,276 2,425,802 3,787,144 56,441,222
December 31, 2014Level 1
($)Level 2
($)Level 3
($)Total($)
Equities 47,845,735 1,710,726 3,132,122 52,688,583
47,845,735 1,710,726 3,132,122 52,688,583
Transfers between levels
During the periods ended June 30, 2015 and December 31,2014, there were no significant transfers between Level 1and Level 2.
Reconciliation of Level 3 financial instruments
The following table presents the movement in the Fund’sLevel 3 financial instruments for the periods ended:
June 30, 2015($)
December 31, 2014($)
Beginning of period 3,132,122 1,100,400Purchases – 1,080,160Sales – –Transfers into Level 3 – –Transfers out of Level 3 – –Net realized gains (losses) – –Net changes in unrealized gain (loss)* 655,022 951,562
End of period 3,787,144 3,132,122
* Net change in unrealized gain (loss) for Level 3 financial instruments held as atJune 30, 2015 and December 31, 2014 was $655,022 and $951,562,respectively.
Level 3 valuation techniques
The significant unobservable inputs and valuationtechniques used to determine the fair value measurementscategorized in Level 3 are indicated below:
SecurityValuationtechnique
Significantunobservable input
June 30, 2015($)
December 31, 2014($)
Equities Financingtransaction price
Financing price 3,435,016 1,886,400
Equities InternalFundamentalModel
Price to sales multiple,with liquidity discountdue to lack ofmarketability
– 1,127,822
Warrant Warrantvaluation model
Strike price 352,128 117,900
3,787,144 3,132,122
The significant unobservable inputs used in the valuationtechniques used to estimate the fair values of level 3investments can vary considerably over time to timedepending on company specific factors and economic ormarket conditions. A 10% increase or decrease in theresults of applying these valuation techniques, with allother variables held consistent, would have resulted in anincrease or decrease, respectively, in net assets of $378,714(December 31, 2014 – $313,212).
3. Offsetting of financial assets and liabilities (note 2)
The following table presents offsetting of financial assetsand liabilities and collateral amounts that would occur iffuture events, such as bankruptcy or termination ofcontracts were to arise. No amounts were offset in thefinancial statements.
June 30, 2015
Financial assets – by type
Gross amountof assets
($)
Master nettingoffset
($)
Collateralpledged
($)Net Amount
($)
Currency forward contracts – – – –Options contracts – OTC – – – –Swap contracts – – – –
– – – –
Financial liabilities – by type
Gross amountof liabilities
($)
Master nettingoffset
($)
Collateralpledged
($)Net Amount
($)
Currency forward contracts 103,226 – – 103,226Options contracts – OTC – – – –Swap contracts – – – –
103,226 – – 103,226
As at December 31, 2014, the Fund did not enter into anyagreement whereby the financial instruments were eligiblefor offset.
4. Interest in Underlying Funds (note 2)
The Fund did not hold any interest in Underlying Funds asat June 30, 2015 or December 31, 2014.
5. Comparison of net asset value per unit and netassets per unit (note 2)
The table below provides a comparison of the net assetvalue per unit and net assets per unit. The primary reasonfor the difference between the net asset value per unit andnet assets per unit, if any, is described in note 2.
The accompanying notes are an integral part of the financial statements.
147
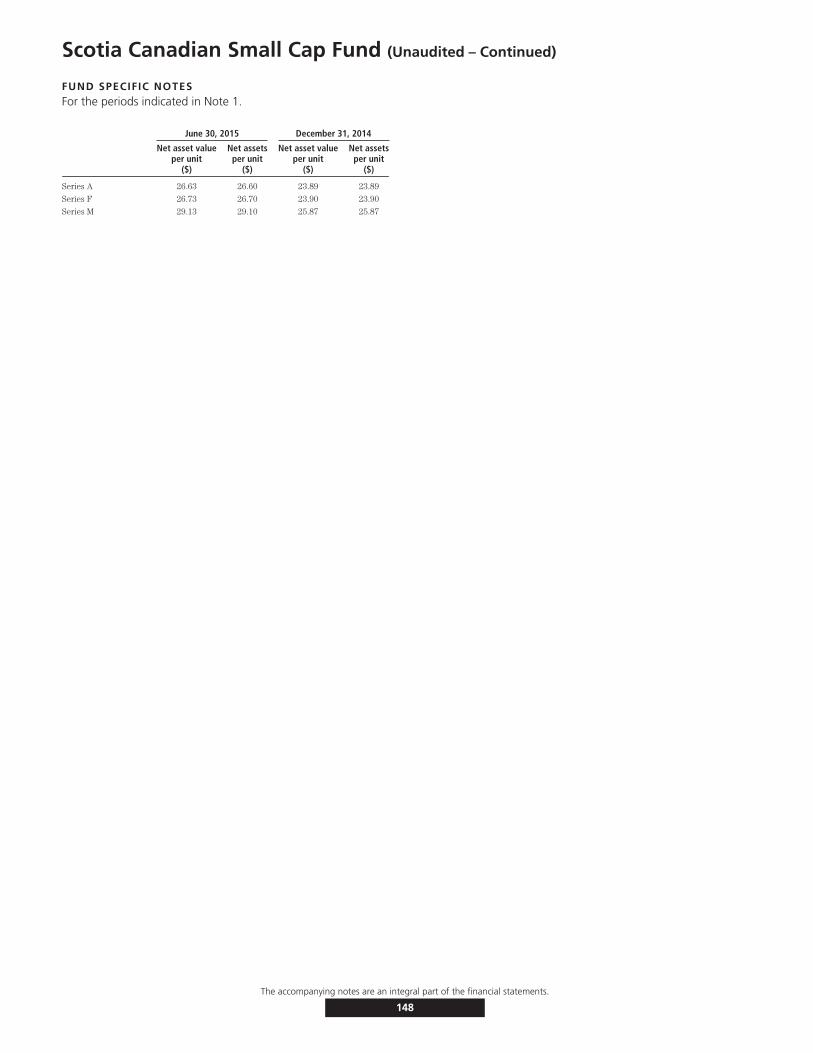
Scotia Canadian Small Cap Fund (Unaudited – Continued)
FUND SPECIFIC NOTESFor the periods indicated in Note 1.
June 30, 2015 December 31, 2014
Net asset valueper unit
($)
Net assetsper unit
($)
Net asset valueper unit
($)
Net assetsper unit
($)
Series A 26.63 26.60 23.89 23.89
Series F 26.73 26.70 23.90 23.90
Series M 29.13 29.10 25.87 25.87
The accompanying notes are an integral part of the financial statements.
148

Scotia Resource Fund (Unaudited)
STATEMENTS OF FINANCIAL POSITIONAs at
June 30,2015
December 31,2014
ASSETSCurrent assetsInvestments
Non-derivative financial assets $ 92,235,712 $ 80,812,514Commodities 2,966,258 2,785,417Unrealized gain on currency forward contracts – 201,686
Cash 8,231,452 18,968,104Receivable for securities sold 362,568 334,598Subscriptions receivable 68,593 110,596Accrued investment income and other 120,930 164,974
103,985,513 103,377,889
LIABILITIESCurrent liabilitiesManagement fee payable 204,238 –Payable for securities purchased 1,241,860 20,626Redemptions payable 38,661 132,211Accrued expenses 16,360 –Unrealized loss on accumulator contracts – 21,844Unrealized loss on currency forward contracts 190,769 89,090Unrealized loss on swap contracts 346,136 294,747
2,038,024 558,518
Net assets attributable to holders of redeemable units $101,947,489 $102,819,371
NET ASSETS ATTRIBUTABLE TO HOLDERS OF REDEEMABLE UNITSPER SERIES
Series A $101,938,205 $102,799,594Series F $ 9,284 $ 19,777
NET ASSETS ATTRIBUTABLE TO HOLDERS OF REDEEMABLE UNITSPER UNIT
Series A $ 17.45 $ 17.16Series F $ 17.99 $ 17.62
STATEMENTS OF COMPREHENSIVE INCOMEFor the six month periods ended June 30,
2015 2014INCOMENet gain (loss) on investments (note 2)
Dividends $ 1,170,191 $ 1,040,816Interest for distribution purposes 19,501 31,474Capital gains distributions received – (68)Net realized gain (loss) on non-derivative financial assets (2,467,155) 3,033,781Net realized gain (loss) on currency forward contracts 115,587 (257,435)Net realized gain (loss) on swap contracts (760,133) 638,843Net realized and change in unrealized gain (loss) on foreign exchange 38,511 (69,190)Change in unrealized gain (loss) on non-derivative financial assets 4,262,998 24,667,700Change in unrealized gain (loss) on commodities 180,841 555,290Change in unrealized gain (loss) on accumulator contracts 21,844 (4,474)Change in unrealized gain (loss) on currency forward contracts (303,365) 109,909Change in unrealized gain (loss) on currency spots contracts – (90)Change in unrealized gain (loss) on swap contracts (51,389) 101,242
Net gain (loss) on investments 2,227,431 29,847,798Securities lending 26,412 29,702Net realized and change in unrealized gain (loss) on foreign exchange of
cash 998,641 –Other income 893 1,297
Total income (loss) 3,253,377 29,878,797
EXPENSESManagement fees (note 5) 1,071,795 1,225,741Fixed administration fees (note 6) 85,760 –Independent Review Committee fees 80 182Interest expense and bank overdraft charges 5 –Foreign withholding taxes/tax reclaims 51,332 8,816Audit fees – 1,750Custodian fees – 5,637Filing fees – 12,058Legal fees – 390Unitholder administration costs – 62,629Unitholder reporting costs – 10,986Harmonized Sales Tax/Goods and Services Tax 114,953 129,773Transaction costs 81,790 93,912
Total expenses 1,405,715 1,551,874Expenses absorbed by the Manager – (4,138)
Net expenses 1,405,715 1,547,736
Increase (decrease) in net assets attributable to holders of redeemableunits from operations $ 1,847,662 $28,331,061
INCREASE (DECREASE) IN NET ASSETS ATTRIBUTABLE TO HOLDERS OFREDEEMABLE UNITS FROM OPERATIONS PER SERIES
Series A $ 1,847,070 $28,321,905Series F $ 592 $ 9,156
INCREASE (DECREASE) IN NET ASSETS ATTRIBUTABLE TO HOLDERS OFREDEEMABLE UNITS FROM OPERATIONS PER UNIT†
Series A $ 0.31 $ 4.34Series F $ 0.97 $ 4.48
WEIGHTED AVERAGE NUMBER OF UNITS PER SERIESSeries A 5,934,693 6,521,632Series F 610 2,044
† The increase (decrease) in net assets attributable to holders of redeemable units fromoperations per unit is calculated by dividing the increase (decrease) in net assetsattributable to holders of redeemable units from operations per series by the weightedaverage number of units per series.
The accompanying notes are an integral part of the financial statements.
149
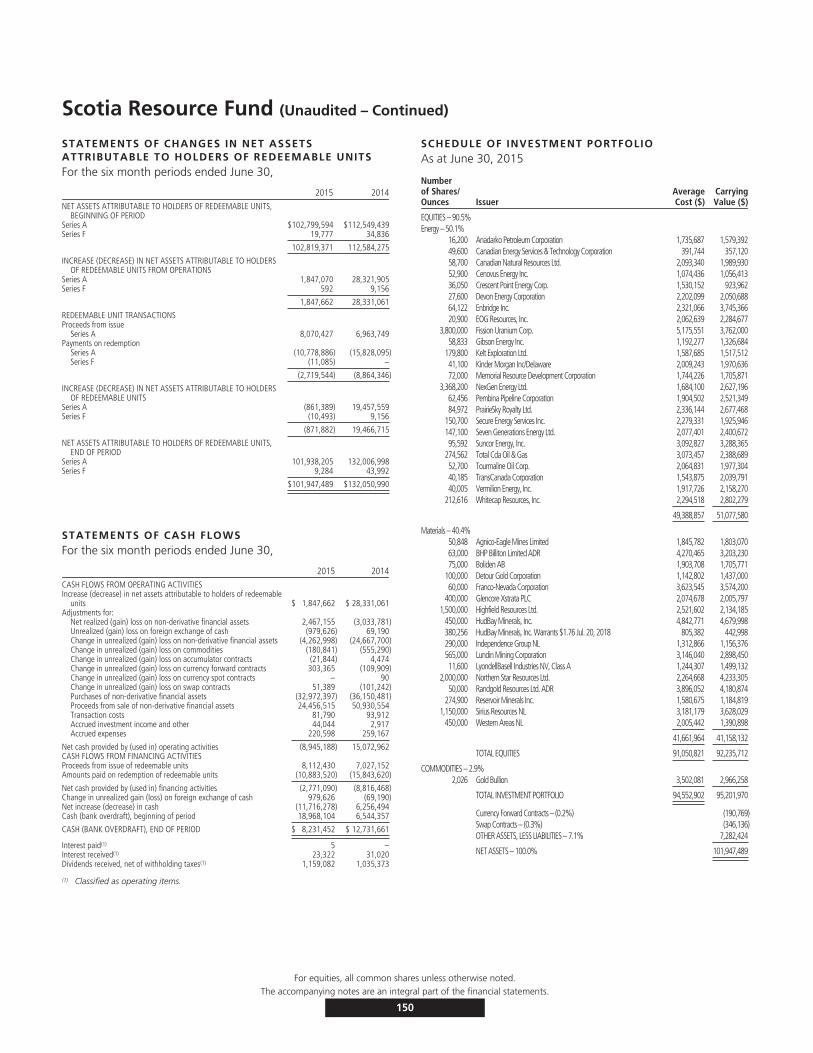
Scotia Resource Fund (Unaudited – Continued)
STATEMENTS OF CHANGES IN NET ASSETSATTRIBUTABLE TO HOLDERS OF REDEEMABLE UNITSFor the six month periods ended June 30,
2015 2014NET ASSETS ATTRIBUTABLE TO HOLDERS OF REDEEMABLE UNITS,
BEGINNING OF PERIODSeries A $102,799,594 $112,549,439Series F 19,777 34,836
102,819,371 112,584,275
INCREASE (DECREASE) IN NET ASSETS ATTRIBUTABLE TO HOLDERSOF REDEEMABLE UNITS FROM OPERATIONS
Series A 1,847,070 28,321,905Series F 592 9,156
1,847,662 28,331,061
REDEEMABLE UNIT TRANSACTIONSProceeds from issue
Series A 8,070,427 6,963,749Payments on redemption
Series A (10,778,886) (15,828,095)Series F (11,085) –
(2,719,544) (8,864,346)
INCREASE (DECREASE) IN NET ASSETS ATTRIBUTABLE TO HOLDERSOF REDEEMABLE UNITS
Series A (861,389) 19,457,559Series F (10,493) 9,156
(871,882) 19,466,715
NET ASSETS ATTRIBUTABLE TO HOLDERS OF REDEEMABLE UNITS,END OF PERIOD
Series A 101,938,205 132,006,998Series F 9,284 43,992
$101,947,489 $132,050,990
STATEMENTS OF CASH FLOWSFor the six month periods ended June 30,
2015 2014CASH FLOWS FROM OPERATING ACTIVITIESIncrease (decrease) in net assets attributable to holders of redeemable
units $ 1,847,662 $ 28,331,061Adjustments for:
Net realized (gain) loss on non-derivative financial assets 2,467,155 (3,033,781)Unrealized (gain) loss on foreign exchange of cash (979,626) 69,190Change in unrealized (gain) loss on non-derivative financial assets (4,262,998) (24,667,700)Change in unrealized (gain) loss on commodities (180,841) (555,290)Change in unrealized (gain) loss on accumulator contracts (21,844) 4,474Change in unrealized (gain) loss on currency forward contracts 303,365 (109,909)Change in unrealized (gain) loss on currency spot contracts – 90Change in unrealized (gain) loss on swap contracts 51,389 (101,242)Purchases of non-derivative financial assets (32,972,397) (36,150,481)Proceeds from sale of non-derivative financial assets 24,456,515 50,930,554Transaction costs 81,790 93,912Accrued investment income and other 44,044 2,917Accrued expenses 220,598 259,167
Net cash provided by (used in) operating activities (8,945,188) 15,072,962CASH FLOWS FROM FINANCING ACTIVITIESProceeds from issue of redeemable units 8,112,430 7,027,152Amounts paid on redemption of redeemable units (10,883,520) (15,843,620)
Net cash provided by (used in) financing activities (2,771,090) (8,816,468)Change in unrealized gain (loss) on foreign exchange of cash 979,626 (69,190)Net increase (decrease) in cash (11,716,278) 6,256,494Cash (bank overdraft), beginning of period 18,968,104 6,544,357
CASH (BANK OVERDRAFT), END OF PERIOD $ 8,231,452 $ 12,731,661
Interest paid(1) 5 –Interest received(1) 23,322 31,020Dividends received, net of withholding taxes(1) 1,159,082 1,035,373
(1) Classified as operating items.
SCHEDULE OF INVESTMENT PORTFOLIOAs at June 30, 2015
Numberof Shares/Ounces Issuer
AverageCost ($)
CarryingValue ($)
EQUITIES – 90.5%Energy – 50.1%
16,200 Anadarko Petroleum Corporation 1,735,687 1,579,39249,600 Canadian Energy Services & Technology Corporation 391,744 357,12058,700 Canadian Natural Resources Ltd. 2,093,340 1,989,93052,900 Cenovus Energy Inc. 1,074,436 1,056,41336,050 Crescent Point Energy Corp. 1,530,152 923,96227,600 Devon Energy Corporation 2,202,099 2,050,68864,122 Enbridge Inc. 2,321,066 3,745,36620,900 EOG Resources, Inc. 2,062,639 2,284,677
3,800,000 Fission Uranium Corp. 5,175,551 3,762,00058,833 Gibson Energy Inc. 1,192,277 1,326,684
179,800 Kelt Exploration Ltd. 1,587,685 1,517,51241,100 Kinder Morgan Inc/Delaware 2,009,243 1,970,63672,000 Memorial Resource Development Corporation 1,744,226 1,705,871
3,368,200 NexGen Energy Ltd. 1,684,100 2,627,19662,456 Pembina Pipeline Corporation 1,904,502 2,521,34984,972 PrairieSky Royalty Ltd. 2,336,144 2,677,468
150,700 Secure Energy Services Inc. 2,279,331 1,925,946147,100 Seven Generations Energy Ltd. 2,077,401 2,400,67295,592 Suncor Energy, Inc. 3,092,827 3,288,365
274,562 Total Cda Oil & Gas 3,073,457 2,388,68952,700 Tourmaline Oil Corp. 2,064,831 1,977,30440,185 TransCanada Corporation 1,543,875 2,039,79140,005 Vermilion Energy, Inc. 1,917,726 2,158,270
212,616 Whitecap Resources, Inc. 2,294,518 2,802,279
49,388,857 51,077,580
Materials – 40.4%50,848 Agnico-Eagle Mines Limited 1,845,782 1,803,07063,000 BHP Billiton Limited ADR 4,270,465 3,203,23075,000 Boliden AB 1,903,708 1,705,771
100,000 Detour Gold Corporation 1,142,802 1,437,00060,000 Franco-Nevada Corporation 3,623,545 3,574,200
400,000 Glencore Xstrata PLC 2,074,678 2,005,7971,500,000 Highfield Resources Ltd. 2,521,602 2,134,185
450,000 HudBay Minerals, Inc. 4,842,771 4,679,998380,256 HudBay Minerals, Inc. Warrants $1.76 Jul. 20, 2018 805,382 442,998290,000 Independence Group NL 1,312,866 1,156,376565,000 Lundin Mining Corporation 3,146,040 2,898,45011,600 LyondellBasell Industries NV, Class A 1,244,307 1,499,132
2,000,000 Northern Star Resources Ltd. 2,264,668 4,233,30550,000 Randgold Resources Ltd. ADR 3,896,052 4,180,874
274,900 Reservoir Minerals Inc. 1,580,675 1,184,8191,150,000 Sirius Resources NL 3,181,179 3,628,029
450,000 Western Areas NL 2,005,442 1,390,898
41,661,964 41,158,132
TOTAL EQUITIES 91,050,821 92,235,712
COMMODITIES – 2.9%2,026 Gold Bullion 3,502,081 2,966,258
TOTAL INVESTMENT PORTFOLIO 94,552,902 95,201,970
Currency Forward Contracts – (0.2%) (190,769)Swap Contracts – (0.3%) (346,136)OTHER ASSETS, LESS LIABILITIES – 7.1% 7,282,424
NET ASSETS – 100.0% 101,947,489
For equities, all common shares unless otherwise noted.The accompanying notes are an integral part of the financial statements.
150

Scotia Resource Fund (Unaudited – Continued)
SCHEDULE OF INVESTMENT PORTFOLIO
CURRENCY FORWARD CONTRACTS
Settlement Date Currency To Be ReceivedContractual
Amount Currency To Be DeliveredContractual
AmountCanadian Value as at
June 30, 2015 ($)
Canadian ($)Appreciation/
(Depreciation)Aug. 28, 2015 Canadian Dollar 8,449,983 Australian Dollar 8,958,000 8,609,571 (159,588)Aug. 28, 2015 Canadian Dollar 689,318 Australian Dollar 731,000 702,567 (13,249)Aug. 28, 2015 Canadian Dollar 1,392,123 British Pound 718,000 1,410,055 (17,932)
(190,769)
The currency forward contracts outstanding at June 30, 2015 are placed with a financial institution with a credit rating of A by Standard & Poor’s.
EQUITY SWAP CONTRACTS
Number of Units Termination DateNotional
Amount ($)VariableRate %
Appreciation/(Depreciation) ($)
Black Stone Minerals LP, Variable 1 month USD – LIBOR, Counterparty: Toronto-Dominion Bank, The3,700 Jun. 13, 2016 66,227 0.63% (3,160)3,700 Jun. 14, 2016 65,947 0.64% (2,808)3,800 Jun. 15, 2016 67,493 0.64% (2,586)3,900 Jun. 16, 2016 69,460 0.64% (2,892)7,800 Jun. 17, 2016 139,178 0.64% (6,097)
16,200 Jun. 20, 2016 287,304 0.64% (10,460)8,000 Jun. 21, 2016 141,608 0.64% (4,825)2,900 Jun. 22, 2016 51,429 0.64% (1,867)
Enterprise Products Partners, Variable 1 month USD – LIBOR, Counterparty: Toronto-Dominion Bank, The3,600 Aug. 3, 2015 116,712 0.58% (11,439)3,400 Aug. 4, 2015 110,228 0.58% (10,804)
13,660 Aug. 4, 2015 442,857 0.58% (43,405)10,340 Aug. 5, 2015 335,223 0.58% (32,856)5,000 Aug. 13, 2015 162,100 0.58% (15,888)2,600 Aug. 14, 2015 84,292 0.58% (8,262)4,200 Aug. 17, 2015 136,164 0.58% (13,346)
100 Aug. 24, 2015 3,242 0.58% (318)3,900 Oct. 14, 2015 126,438 0.58% (12,393)5,600 Apr. 29, 2016 181,552 0.63% (17,803)3,400 May. 2, 2016 110,228 0.63% (10,809)1,600 May. 3, 2016 51,872 0.63% (5,086)
11,600 May. 4, 2016 376,072 0.63% (36,877)800 May. 6, 2016 25,936 0.63% (2,543)
11,000 May. 9, 2016 356,620 0.63% (34,970)1,600 May. 10, 2016 51,872 0.58% (5,084)2,800 May. 18, 2016 95,106 0.64% (14,340)7,600 May. 27, 2016 247,371 0.63% (25,384)3,400 Jun. 1, 2016 109,449 0.63% (9,834)
(346,136)
The swap contracts outstanding at June 30, 2015 are placed with a financial institution with a minimum credit rating of AA- by Standard & Poor’s.
The accompanying notes are an integral part of the financial statements.
151
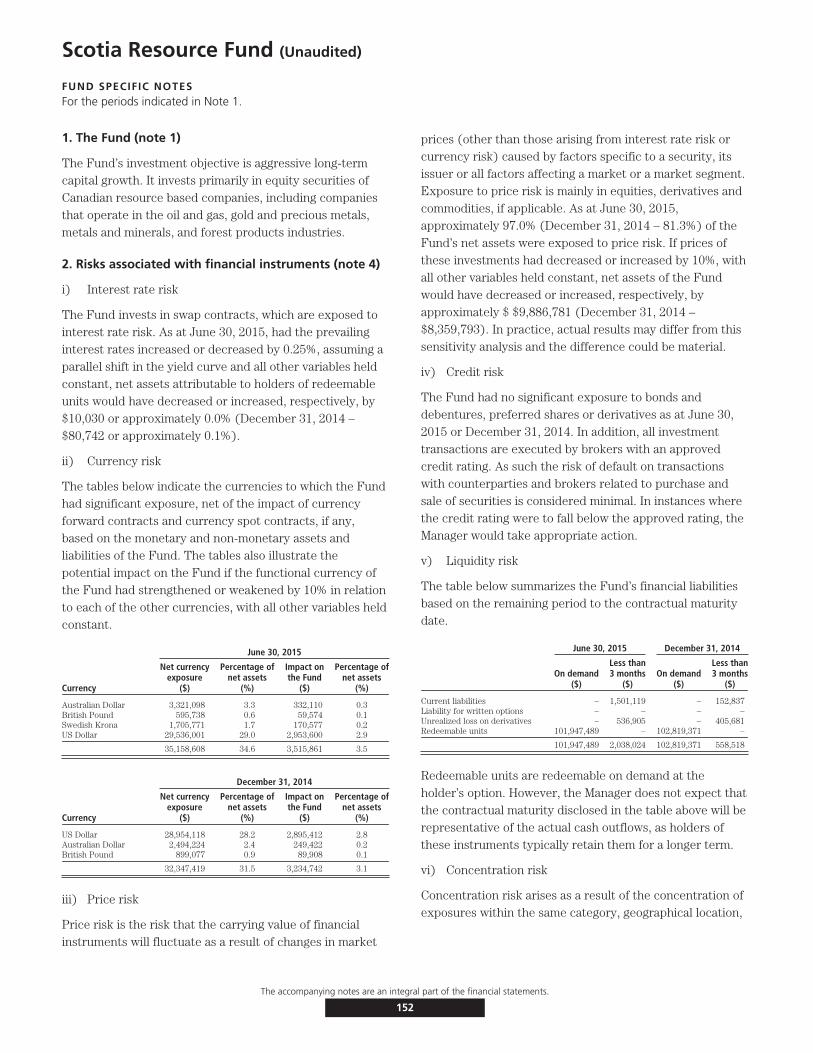
Scotia Resource Fund (Unaudited)
FUND SPECIFIC NOTESFor the periods indicated in Note 1.
1. The Fund (note 1)
The Fund’s investment objective is aggressive long-termcapital growth. It invests primarily in equity securities ofCanadian resource based companies, including companiesthat operate in the oil and gas, gold and precious metals,metals and minerals, and forest products industries.
2. Risks associated with financial instruments (note 4)
i) Interest rate risk
The Fund invests in swap contracts, which are exposed tointerest rate risk. As at June 30, 2015, had the prevailinginterest rates increased or decreased by 0.25%, assuming aparallel shift in the yield curve and all other variables heldconstant, net assets attributable to holders of redeemableunits would have decreased or increased, respectively, by$10,030 or approximately 0.0% (December 31, 2014 –$80,742 or approximately 0.1%).
ii) Currency risk
The tables below indicate the currencies to which the Fundhad significant exposure, net of the impact of currencyforward contracts and currency spot contracts, if any,based on the monetary and non-monetary assets andliabilities of the Fund. The tables also illustrate thepotential impact on the Fund if the functional currency ofthe Fund had strengthened or weakened by 10% in relationto each of the other currencies, with all other variables heldconstant.
June 30, 2015
Currency
Net currencyexposure
($)
Percentage ofnet assets
(%)
Impact onthe Fund
($)
Percentage ofnet assets
(%)
Australian Dollar 3,321,098 3.3 332,110 0.3British Pound 595,738 0.6 59,574 0.1Swedish Krona 1,705,771 1.7 170,577 0.2US Dollar 29,536,001 29.0 2,953,600 2.9
35,158,608 34.6 3,515,861 3.5
December 31, 2014
Currency
Net currencyexposure
($)
Percentage ofnet assets
(%)
Impact onthe Fund
($)
Percentage ofnet assets
(%)
US Dollar 28,954,118 28.2 2,895,412 2.8Australian Dollar 2,494,224 2.4 249,422 0.2British Pound 899,077 0.9 89,908 0.1
32,347,419 31.5 3,234,742 3.1
iii) Price risk
Price risk is the risk that the carrying value of financialinstruments will fluctuate as a result of changes in market
prices (other than those arising from interest rate risk orcurrency risk) caused by factors specific to a security, itsissuer or all factors affecting a market or a market segment.Exposure to price risk is mainly in equities, derivatives andcommodities, if applicable. As at June 30, 2015,approximately 97.0% (December 31, 2014 – 81.3%) of theFund’s net assets were exposed to price risk. If prices ofthese investments had decreased or increased by 10%, withall other variables held constant, net assets of the Fundwould have decreased or increased, respectively, byapproximately $ $9,886,781 (December 31, 2014 –$8,359,793). In practice, actual results may differ from thissensitivity analysis and the difference could be material.
iv) Credit risk
The Fund had no significant exposure to bonds anddebentures, preferred shares or derivatives as at June 30,2015 or December 31, 2014. In addition, all investmenttransactions are executed by brokers with an approvedcredit rating. As such the risk of default on transactionswith counterparties and brokers related to purchase andsale of securities is considered minimal. In instances wherethe credit rating were to fall below the approved rating, theManager would take appropriate action.
v) Liquidity risk
The table below summarizes the Fund’s financial liabilitiesbased on the remaining period to the contractual maturitydate.
June 30, 2015 December 31, 2014
On demand($)
Less than3 months
($)On demand
($)
Less than3 months
($)
Current liabilities – 1,501,119 – 152,837Liability for written options – – – –Unrealized loss on derivatives – 536,905 – 405,681Redeemable units 101,947,489 – 102,819,371 –
101,947,489 2,038,024 102,819,371 558,518
Redeemable units are redeemable on demand at theholder’s option. However, the Manager does not expect thatthe contractual maturity disclosed in the table above will berepresentative of the actual cash outflows, as holders ofthese instruments typically retain them for a longer term.
vi) Concentration risk
Concentration risk arises as a result of the concentration ofexposures within the same category, geographical location,
The accompanying notes are an integral part of the financial statements.
152
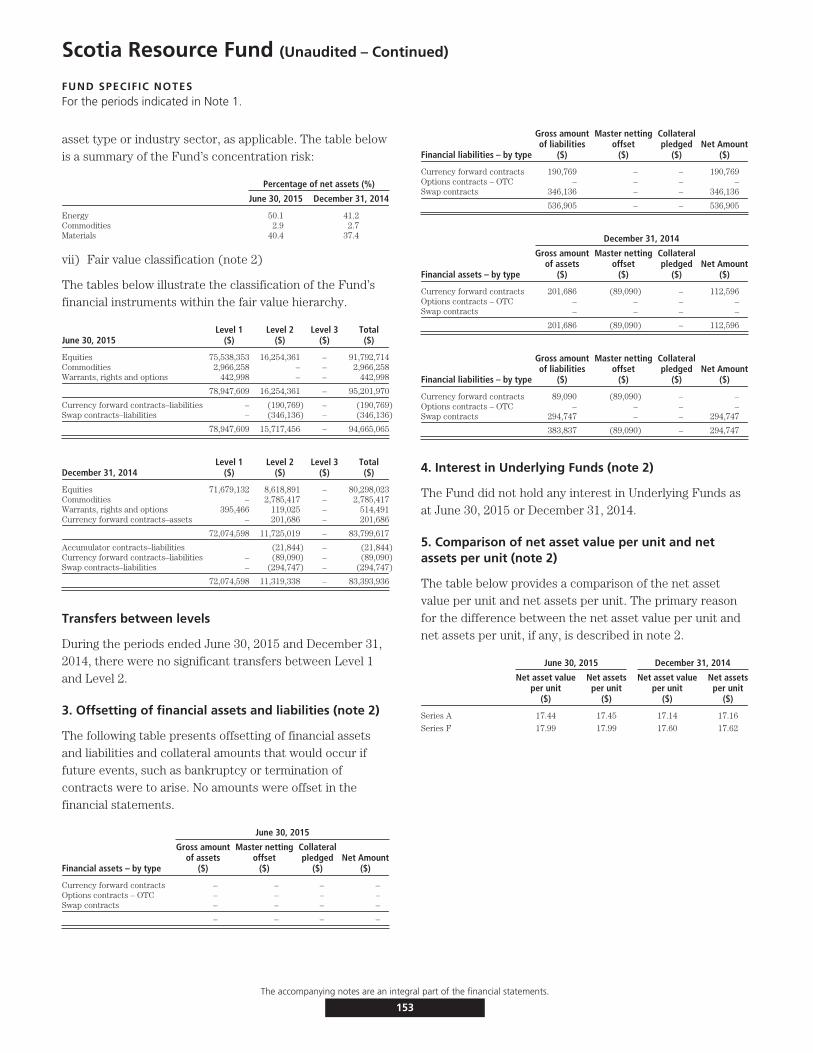
Scotia Resource Fund (Unaudited – Continued)
FUND SPECIFIC NOTESFor the periods indicated in Note 1.
asset type or industry sector, as applicable. The table belowis a summary of the Fund’s concentration risk:
Percentage of net assets (%)
June 30, 2015 December 31, 2014
Energy 50.1 41.2Commodities 2.9 2.7Materials 40.4 37.4
vii) Fair value classification (note 2)
The tables below illustrate the classification of the Fund’sfinancial instruments within the fair value hierarchy.
June 30, 2015Level 1
($)Level 2
($)Level 3
($)Total($)
Equities 75,538,353 16,254,361 – 91,792,714Commodities 2,966,258 – – 2,966,258Warrants, rights and options 442,998 – – 442,998
78,947,609 16,254,361 – 95,201,970
Currency forward contracts–liabilities – (190,769) – (190,769)Swap contracts–liabilities – (346,136) – (346,136)
78,947,609 15,717,456 – 94,665,065
December 31, 2014Level 1
($)Level 2
($)Level 3
($)Total($)
Equities 71,679,132 8,618,891 – 80,298,023Commodities – 2,785,417 – 2,785,417Warrants, rights and options 395,466 119,025 – 514,491Currency forward contracts–assets – 201,686 – 201,686
72,074,598 11,725,019 – 83,799,617
Accumulator contracts–liabilities (21,844) – (21,844)Currency forward contracts–liabilities – (89,090) – (89,090)Swap contracts–liabilities – (294,747) – (294,747)
72,074,598 11,319,338 – 83,393,936
Transfers between levels
During the periods ended June 30, 2015 and December 31,2014, there were no significant transfers between Level 1and Level 2.
3. Offsetting of financial assets and liabilities (note 2)
The following table presents offsetting of financial assetsand liabilities and collateral amounts that would occur iffuture events, such as bankruptcy or termination ofcontracts were to arise. No amounts were offset in thefinancial statements.
June 30, 2015
Financial assets – by type
Gross amountof assets
($)
Master nettingoffset
($)
Collateralpledged
($)Net Amount
($)
Currency forward contracts – – – –Options contracts – OTC – – – –Swap contracts – – – –
– – – –
Financial liabilities – by type
Gross amountof liabilities
($)
Master nettingoffset
($)
Collateralpledged
($)Net Amount
($)
Currency forward contracts 190,769 – – 190,769Options contracts – OTC – – – –Swap contracts 346,136 – – 346,136
536,905 – – 536,905
December 31, 2014
Financial assets – by type
Gross amountof assets
($)
Master nettingoffset
($)
Collateralpledged
($)Net Amount
($)
Currency forward contracts 201,686 (89,090) – 112,596Options contracts – OTC – – – –Swap contracts – – – –
201,686 (89,090) – 112,596
Financial liabilities – by type
Gross amountof liabilities
($)
Master nettingoffset
($)
Collateralpledged
($)Net Amount
($)
Currency forward contracts 89,090 (89,090) – –Options contracts – OTC – – – –Swap contracts 294,747 – – 294,747
383,837 (89,090) – 294,747
4. Interest in Underlying Funds (note 2)
The Fund did not hold any interest in Underlying Funds asat June 30, 2015 or December 31, 2014.
5. Comparison of net asset value per unit and netassets per unit (note 2)
The table below provides a comparison of the net assetvalue per unit and net assets per unit. The primary reasonfor the difference between the net asset value per unit andnet assets per unit, if any, is described in note 2.
June 30, 2015 December 31, 2014
Net asset valueper unit
($)
Net assetsper unit
($)
Net asset valueper unit
($)
Net assetsper unit
($)
Series A 17.44 17.45 17.14 17.16
Series F 17.99 17.99 17.60 17.62
The accompanying notes are an integral part of the financial statements.
153
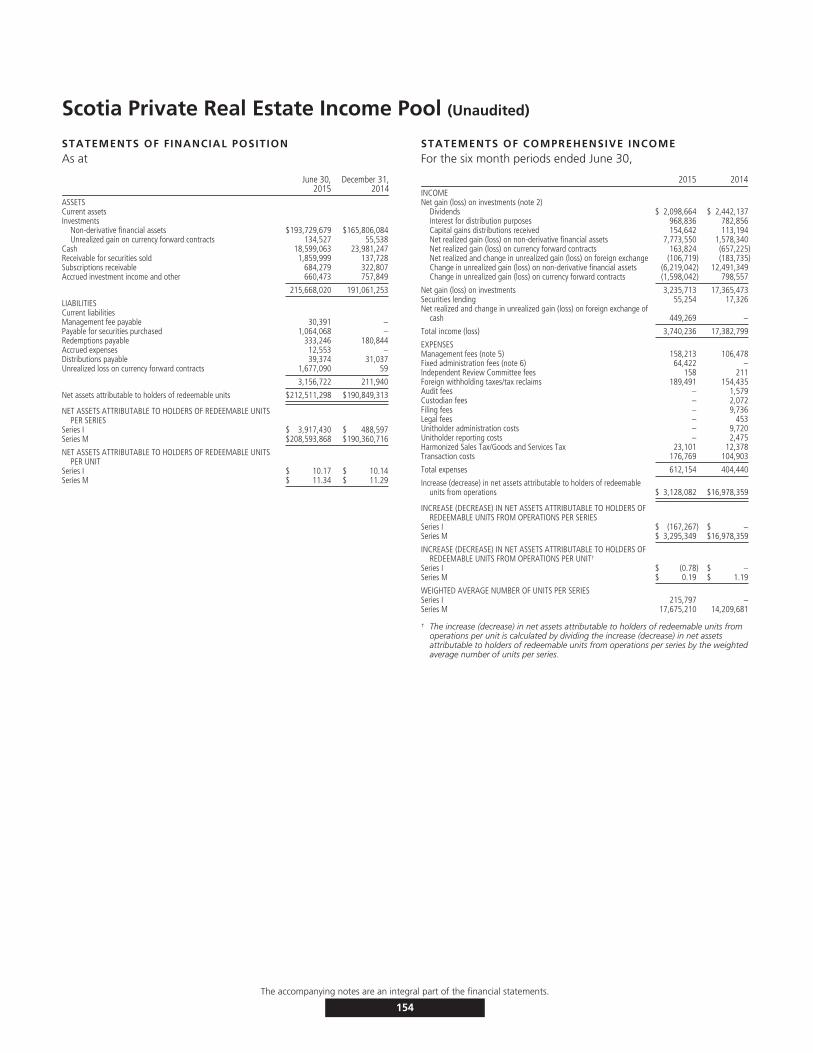
Scotia Private Real Estate Income Pool (Unaudited)
STATEMENTS OF FINANCIAL POSITIONAs at
June 30,2015
December 31,2014
ASSETSCurrent assetsInvestments
Non-derivative financial assets $193,729,679 $165,806,084Unrealized gain on currency forward contracts 134,527 55,538
Cash 18,599,063 23,981,247Receivable for securities sold 1,859,999 137,728Subscriptions receivable 684,279 322,807Accrued investment income and other 660,473 757,849
215,668,020 191,061,253
LIABILITIESCurrent liabilitiesManagement fee payable 30,391 –Payable for securities purchased 1,064,068 –Redemptions payable 333,246 180,844Accrued expenses 12,553 –Distributions payable 39,374 31,037Unrealized loss on currency forward contracts 1,677,090 59
3,156,722 211,940
Net assets attributable to holders of redeemable units $212,511,298 $190,849,313
NET ASSETS ATTRIBUTABLE TO HOLDERS OF REDEEMABLE UNITSPER SERIES
Series I $ 3,917,430 $ 488,597Series M $208,593,868 $190,360,716
NET ASSETS ATTRIBUTABLE TO HOLDERS OF REDEEMABLE UNITSPER UNIT
Series I $ 10.17 $ 10.14Series M $ 11.34 $ 11.29
STATEMENTS OF COMPREHENSIVE INCOMEFor the six month periods ended June 30,
2015 2014INCOMENet gain (loss) on investments (note 2)
Dividends $ 2,098,664 $ 2,442,137Interest for distribution purposes 968,836 782,856Capital gains distributions received 154,642 113,194Net realized gain (loss) on non-derivative financial assets 7,773,550 1,578,340Net realized gain (loss) on currency forward contracts 163,824 (657,225)Net realized and change in unrealized gain (loss) on foreign exchange (106,719) (183,735)Change in unrealized gain (loss) on non-derivative financial assets (6,219,042) 12,491,349Change in unrealized gain (loss) on currency forward contracts (1,598,042) 798,557
Net gain (loss) on investments 3,235,713 17,365,473Securities lending 55,254 17,326Net realized and change in unrealized gain (loss) on foreign exchange of
cash 449,269 –
Total income (loss) 3,740,236 17,382,799
EXPENSESManagement fees (note 5) 158,213 106,478Fixed administration fees (note 6) 64,422 –Independent Review Committee fees 158 211Foreign withholding taxes/tax reclaims 189,491 154,435Audit fees – 1,579Custodian fees – 2,072Filing fees – 9,736Legal fees – 453Unitholder administration costs – 9,720Unitholder reporting costs – 2,475Harmonized Sales Tax/Goods and Services Tax 23,101 12,378Transaction costs 176,769 104,903
Total expenses 612,154 404,440
Increase (decrease) in net assets attributable to holders of redeemableunits from operations $ 3,128,082 $16,978,359
INCREASE (DECREASE) IN NET ASSETS ATTRIBUTABLE TO HOLDERS OFREDEEMABLE UNITS FROM OPERATIONS PER SERIES
Series I $ (167,267) $ –Series M $ 3,295,349 $16,978,359
INCREASE (DECREASE) IN NET ASSETS ATTRIBUTABLE TO HOLDERS OFREDEEMABLE UNITS FROM OPERATIONS PER UNIT†
Series I $ (0.78) $ –Series M $ 0.19 $ 1.19
WEIGHTED AVERAGE NUMBER OF UNITS PER SERIESSeries I 215,797 –Series M 17,675,210 14,209,681
† The increase (decrease) in net assets attributable to holders of redeemable units fromoperations per unit is calculated by dividing the increase (decrease) in net assetsattributable to holders of redeemable units from operations per series by the weightedaverage number of units per series.
The accompanying notes are an integral part of the financial statements.
154
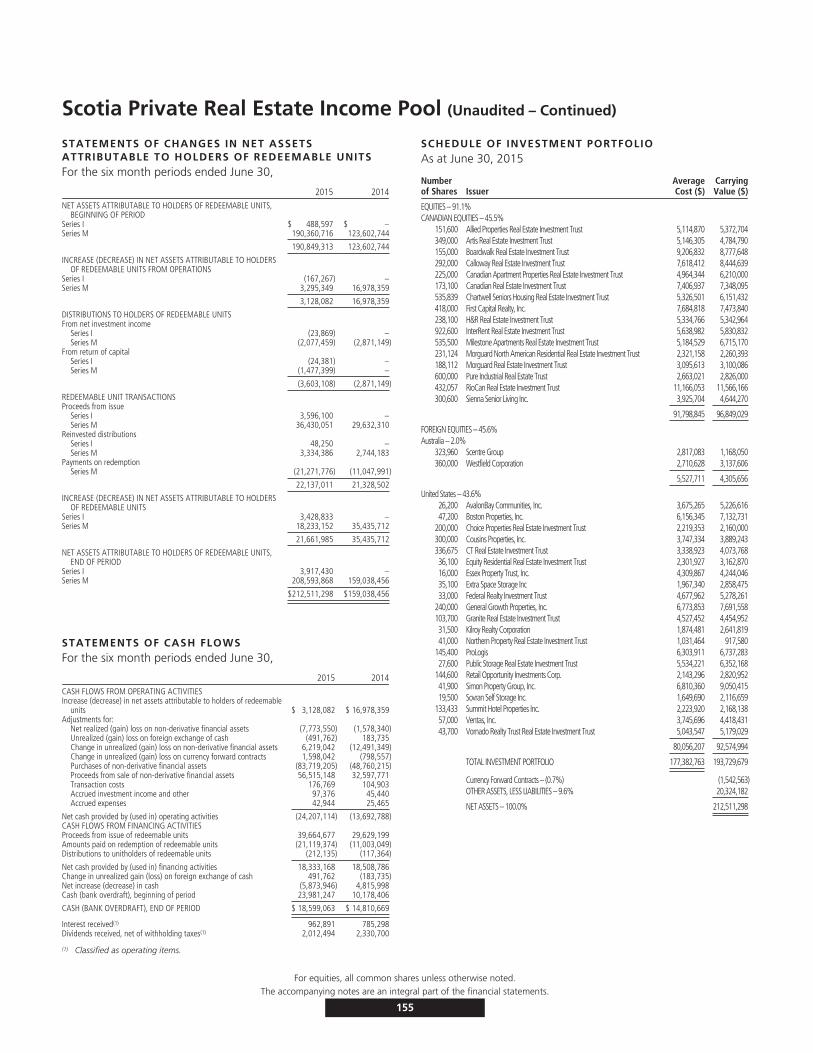
Scotia Private Real Estate Income Pool (Unaudited – Continued)
STATEMENTS OF CHANGES IN NET ASSETSATTRIBUTABLE TO HOLDERS OF REDEEMABLE UNITSFor the six month periods ended June 30,
2015 2014NET ASSETS ATTRIBUTABLE TO HOLDERS OF REDEEMABLE UNITS,
BEGINNING OF PERIODSeries I $ 488,597 $ –Series M 190,360,716 123,602,744
190,849,313 123,602,744
INCREASE (DECREASE) IN NET ASSETS ATTRIBUTABLE TO HOLDERSOF REDEEMABLE UNITS FROM OPERATIONS
Series I (167,267) –Series M 3,295,349 16,978,359
3,128,082 16,978,359
DISTRIBUTIONS TO HOLDERS OF REDEEMABLE UNITSFrom net investment income
Series I (23,869) –Series M (2,077,459) (2,871,149)
From return of capitalSeries I (24,381) –Series M (1,477,399) –
(3,603,108) (2,871,149)
REDEEMABLE UNIT TRANSACTIONSProceeds from issue
Series I 3,596,100 –Series M 36,430,051 29,632,310
Reinvested distributionsSeries I 48,250 –Series M 3,334,386 2,744,183
Payments on redemptionSeries M (21,271,776) (11,047,991)
22,137,011 21,328,502
INCREASE (DECREASE) IN NET ASSETS ATTRIBUTABLE TO HOLDERSOF REDEEMABLE UNITS
Series I 3,428,833 –Series M 18,233,152 35,435,712
21,661,985 35,435,712
NET ASSETS ATTRIBUTABLE TO HOLDERS OF REDEEMABLE UNITS,END OF PERIOD
Series I 3,917,430 –Series M 208,593,868 159,038,456
$212,511,298 $159,038,456
STATEMENTS OF CASH FLOWSFor the six month periods ended June 30,
2015 2014CASH FLOWS FROM OPERATING ACTIVITIESIncrease (decrease) in net assets attributable to holders of redeemable
units $ 3,128,082 $ 16,978,359Adjustments for:
Net realized (gain) loss on non-derivative financial assets (7,773,550) (1,578,340)Unrealized (gain) loss on foreign exchange of cash (491,762) 183,735Change in unrealized (gain) loss on non-derivative financial assets 6,219,042 (12,491,349)Change in unrealized (gain) loss on currency forward contracts 1,598,042 (798,557)Purchases of non-derivative financial assets (83,719,205) (48,760,215)Proceeds from sale of non-derivative financial assets 56,515,148 32,597,771Transaction costs 176,769 104,903Accrued investment income and other 97,376 45,440Accrued expenses 42,944 25,465
Net cash provided by (used in) operating activities (24,207,114) (13,692,788)CASH FLOWS FROM FINANCING ACTIVITIESProceeds from issue of redeemable units 39,664,677 29,629,199Amounts paid on redemption of redeemable units (21,119,374) (11,003,049)Distributions to unitholders of redeemable units (212,135) (117,364)
Net cash provided by (used in) financing activities 18,333,168 18,508,786Change in unrealized gain (loss) on foreign exchange of cash 491,762 (183,735)Net increase (decrease) in cash (5,873,946) 4,815,998Cash (bank overdraft), beginning of period 23,981,247 10,178,406
CASH (BANK OVERDRAFT), END OF PERIOD $ 18,599,063 $ 14,810,669
Interest received(1) 962,891 785,298Dividends received, net of withholding taxes(1) 2,012,494 2,330,700
(1) Classified as operating items.
SCHEDULE OF INVESTMENT PORTFOLIOAs at June 30, 2015
Numberof Shares Issuer
AverageCost ($)
CarryingValue ($)
EQUITIES – 91.1%CANADIAN EQUITIES – 45.5%
151,600 Allied Properties Real Estate Investment Trust 5,114,870 5,372,704349,000 Artis Real Estate Investment Trust 5,146,305 4,784,790155,000 Boardwalk Real Estate Investment Trust 9,206,832 8,777,648292,000 Calloway Real Estate Investment Trust 7,618,412 8,444,639225,000 Canadian Apartment Properties Real Estate Investment Trust 4,964,344 6,210,000173,100 Canadian Real Estate Investment Trust 7,406,937 7,348,095535,839 Chartwell Seniors Housing Real Estate Investment Trust 5,326,501 6,151,432418,000 First Capital Realty, Inc. 7,684,818 7,473,840238,100 H&R Real Estate Investment Trust 5,334,766 5,342,964922,600 InterRent Real Estate Investment Trust 5,638,982 5,830,832535,500 Milestone Apartments Real Estate Investment Trust 5,184,529 6,715,170231,124 Morguard North American Residential Real Estate Investment Trust 2,321,158 2,260,393188,112 Morguard Real Estate Investment Trust 3,095,613 3,100,086600,000 Pure Industrial Real Estate Trust 2,663,021 2,826,000432,057 RioCan Real Estate Investment Trust 11,166,053 11,566,166300,600 Sienna Senior Living Inc. 3,925,704 4,644,270
91,798,845 96,849,029
FOREIGN EQUITIES – 45.6%Australia – 2.0%
323,960 Scentre Group 2,817,083 1,168,050360,000 Westfield Corporation 2,710,628 3,137,606
5,527,711 4,305,656
United States – 43.6%26,200 AvalonBay Communities, Inc. 3,675,265 5,226,61647,200 Boston Properties, Inc. 6,156,345 7,132,731
200,000 Choice Properties Real Estate Investment Trust 2,219,353 2,160,000300,000 Cousins Properties, Inc. 3,747,334 3,889,243336,675 CT Real Estate Investment Trust 3,338,923 4,073,76836,100 Equity Residential Real Estate Investment Trust 2,301,927 3,162,87016,000 Essex Property Trust, Inc. 4,309,867 4,244,04635,100 Extra Space Storage Inc 1,967,340 2,858,47533,000 Federal Realty Investment Trust 4,677,962 5,278,261
240,000 General Growth Properties, Inc. 6,773,853 7,691,558103,700 Granite Real Estate Investment Trust 4,527,452 4,454,95231,500 Kilroy Realty Corporation 1,874,481 2,641,81941,000 Northern Property Real Estate Investment Trust 1,031,464 917,580
145,400 ProLogis 6,303,911 6,737,28327,600 Public Storage Real Estate Investment Trust 5,534,221 6,352,168
144,600 Retail Opportunity Investments Corp. 2,143,296 2,820,95241,900 Simon Property Group, Inc. 6,810,360 9,050,41519,500 Sovran Self Storage Inc. 1,649,690 2,116,659
133,433 Summit Hotel Properties Inc. 2,223,920 2,168,13857,000 Ventas, Inc. 3,745,696 4,418,43143,700 Vornado Realty Trust Real Estate Investment Trust 5,043,547 5,179,029
80,056,207 92,574,994
TOTAL INVESTMENT PORTFOLIO 177,382,763 193,729,679
Currency Forward Contracts – (0.7%) (1,542,563)OTHER ASSETS, LESS LIABILITIES – 9.6% 20,324,182
NET ASSETS – 100.0% 212,511,298
For equities, all common shares unless otherwise noted.The accompanying notes are an integral part of the financial statements.
155
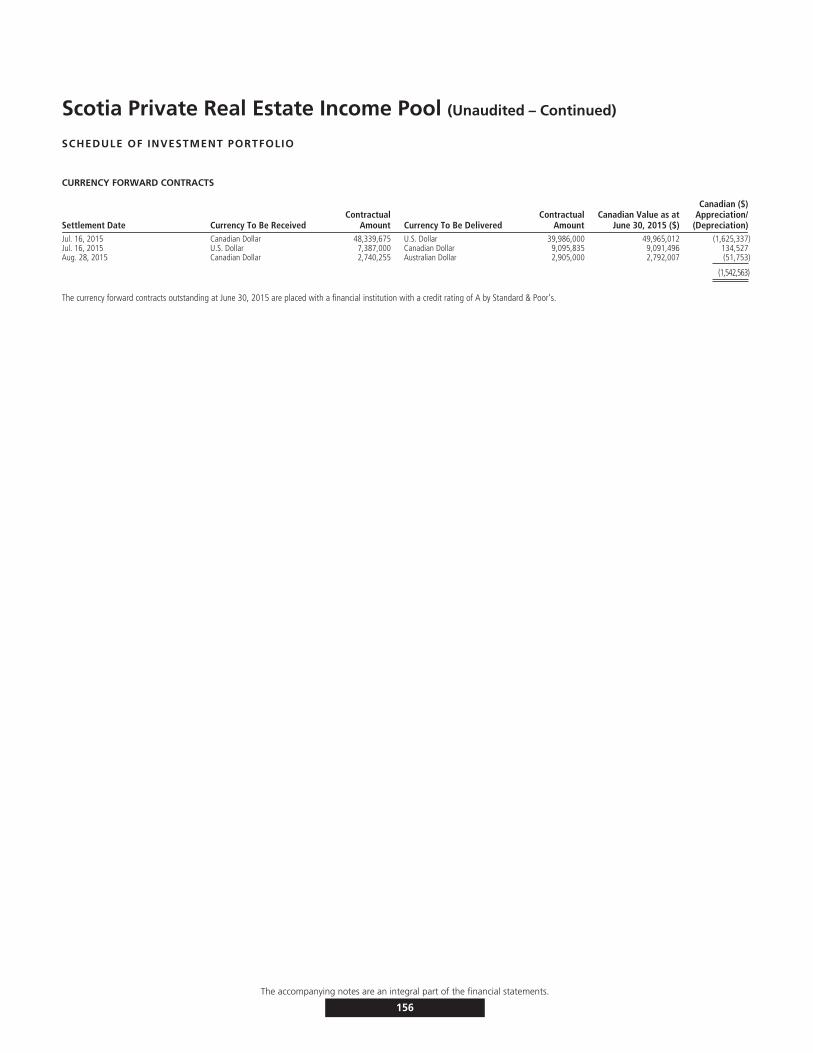
Scotia Private Real Estate Income Pool (Unaudited – Continued)
SCHEDULE OF INVESTMENT PORTFOLIO
CURRENCY FORWARD CONTRACTS
Settlement Date Currency To Be ReceivedContractual
Amount Currency To Be DeliveredContractual
AmountCanadian Value as at
June 30, 2015 ($)
Canadian ($)Appreciation/
(Depreciation)Jul. 16, 2015 Canadian Dollar 48,339,675 U.S. Dollar 39,986,000 49,965,012 (1,625,337)Jul. 16, 2015 U.S. Dollar 7,387,000 Canadian Dollar 9,095,835 9,091,496 134,527Aug. 28, 2015 Canadian Dollar 2,740,255 Australian Dollar 2,905,000 2,792,007 (51,753)
(1,542,563)
The currency forward contracts outstanding at June 30, 2015 are placed with a financial institution with a credit rating of A by Standard & Poor’s.
The accompanying notes are an integral part of the financial statements.
156
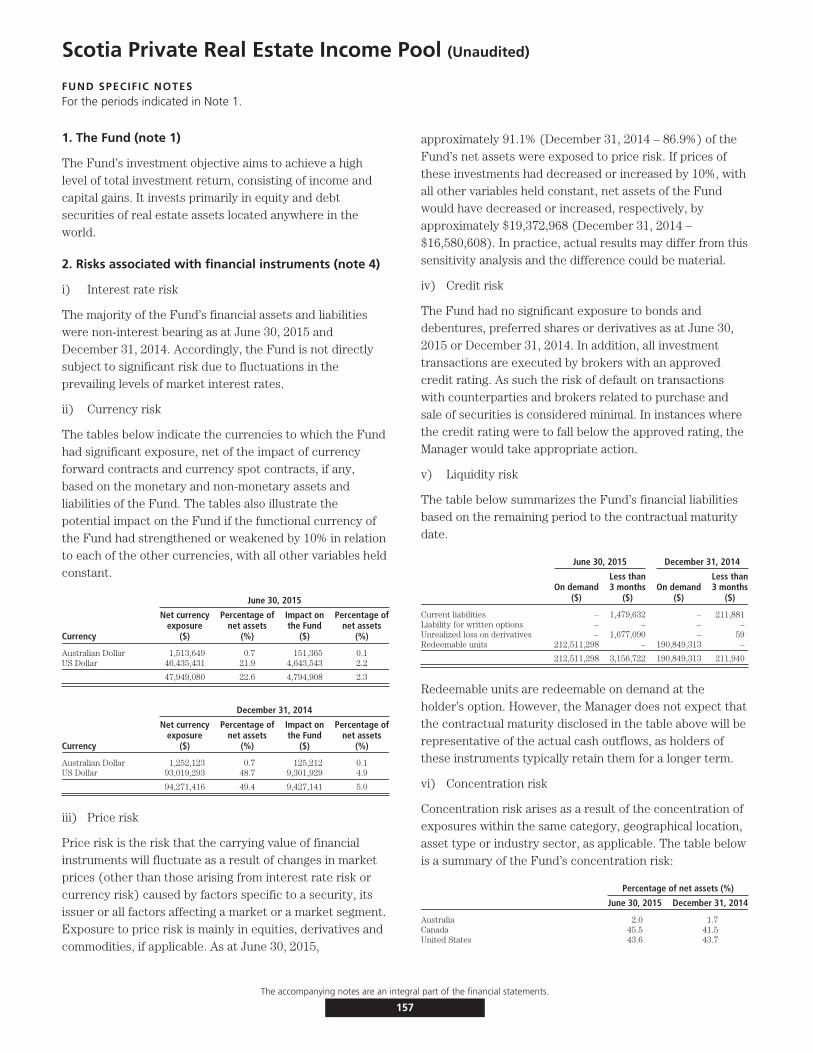
Scotia Private Real Estate Income Pool (Unaudited)
FUND SPECIFIC NOTESFor the periods indicated in Note 1.
1. The Fund (note 1)
The Fund’s investment objective aims to achieve a highlevel of total investment return, consisting of income andcapital gains. It invests primarily in equity and debtsecurities of real estate assets located anywhere in theworld.
2. Risks associated with financial instruments (note 4)
i) Interest rate risk
The majority of the Fund’s financial assets and liabilitieswere non-interest bearing as at June 30, 2015 andDecember 31, 2014. Accordingly, the Fund is not directlysubject to significant risk due to fluctuations in theprevailing levels of market interest rates.
ii) Currency risk
The tables below indicate the currencies to which the Fundhad significant exposure, net of the impact of currencyforward contracts and currency spot contracts, if any,based on the monetary and non-monetary assets andliabilities of the Fund. The tables also illustrate thepotential impact on the Fund if the functional currency ofthe Fund had strengthened or weakened by 10% in relationto each of the other currencies, with all other variables heldconstant.
June 30, 2015
Currency
Net currencyexposure
($)
Percentage ofnet assets
(%)
Impact onthe Fund
($)
Percentage ofnet assets
(%)
Australian Dollar 1,513,649 0.7 151,365 0.1US Dollar 46,435,431 21.9 4,643,543 2.2
47,949,080 22.6 4,794,908 2.3
December 31, 2014
Currency
Net currencyexposure
($)
Percentage ofnet assets
(%)
Impact onthe Fund
($)
Percentage ofnet assets
(%)
Australian Dollar 1,252,123 0.7 125,212 0.1US Dollar 93,019,293 48.7 9,301,929 4.9
94,271,416 49.4 9,427,141 5.0
iii) Price risk
Price risk is the risk that the carrying value of financialinstruments will fluctuate as a result of changes in marketprices (other than those arising from interest rate risk orcurrency risk) caused by factors specific to a security, itsissuer or all factors affecting a market or a market segment.Exposure to price risk is mainly in equities, derivatives andcommodities, if applicable. As at June 30, 2015,
approximately 91.1% (December 31, 2014 – 86.9%) of theFund’s net assets were exposed to price risk. If prices ofthese investments had decreased or increased by 10%, withall other variables held constant, net assets of the Fundwould have decreased or increased, respectively, byapproximately $19,372,968 (December 31, 2014 –$16,580,608). In practice, actual results may differ from thissensitivity analysis and the difference could be material.
iv) Credit risk
The Fund had no significant exposure to bonds anddebentures, preferred shares or derivatives as at June 30,2015 or December 31, 2014. In addition, all investmenttransactions are executed by brokers with an approvedcredit rating. As such the risk of default on transactionswith counterparties and brokers related to purchase andsale of securities is considered minimal. In instances wherethe credit rating were to fall below the approved rating, theManager would take appropriate action.
v) Liquidity risk
The table below summarizes the Fund’s financial liabilitiesbased on the remaining period to the contractual maturitydate.
June 30, 2015 December 31, 2014
On demand($)
Less than3 months
($)On demand
($)
Less than3 months
($)
Current liabilities – 1,479,632 – 211,881Liability for written options – – – –Unrealized loss on derivatives – 1,677,090 – 59Redeemable units 212,511,298 – 190,849,313 –
212,511,298 3,156,722 190,849,313 211,940
Redeemable units are redeemable on demand at theholder’s option. However, the Manager does not expect thatthe contractual maturity disclosed in the table above will berepresentative of the actual cash outflows, as holders ofthese instruments typically retain them for a longer term.
vi) Concentration risk
Concentration risk arises as a result of the concentration ofexposures within the same category, geographical location,asset type or industry sector, as applicable. The table belowis a summary of the Fund’s concentration risk:
Percentage of net assets (%)
June 30, 2015 December 31, 2014
Australia 2.0 1.7Canada 45.5 41.5United States 43.6 43.7
The accompanying notes are an integral part of the financial statements.
157
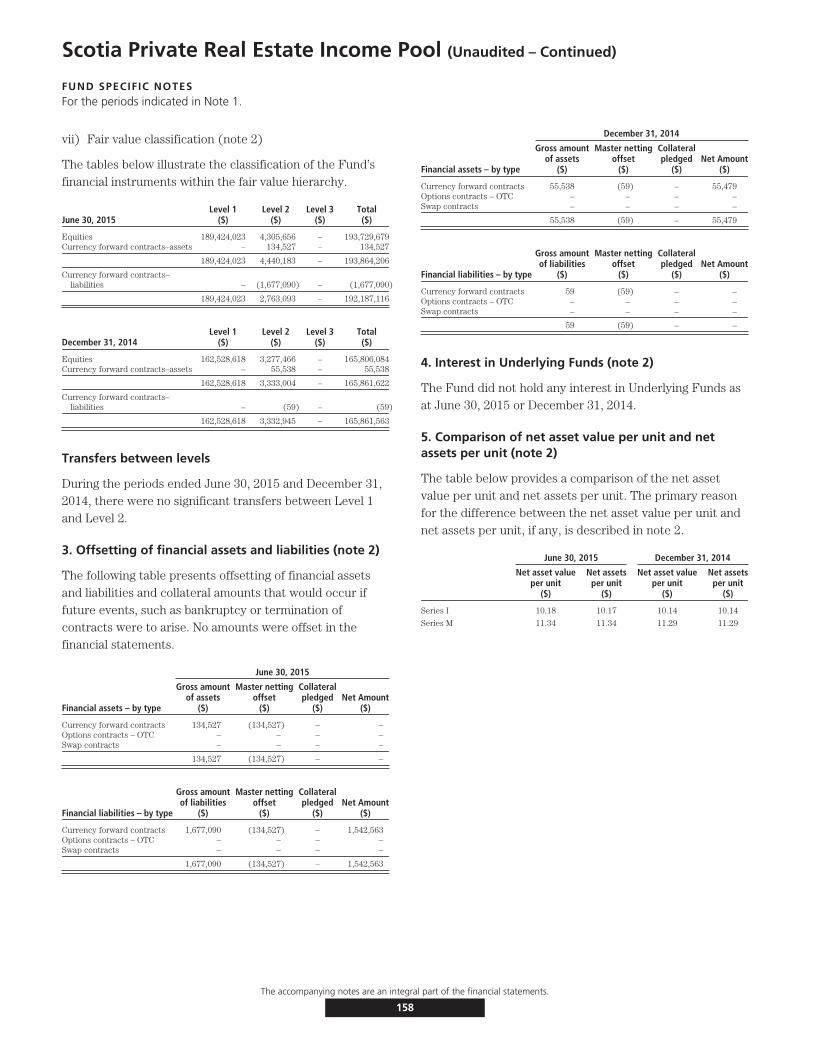
Scotia Private Real Estate Income Pool (Unaudited – Continued)
FUND SPECIFIC NOTESFor the periods indicated in Note 1.
vii) Fair value classification (note 2)
The tables below illustrate the classification of the Fund’sfinancial instruments within the fair value hierarchy.
June 30, 2015Level 1
($)Level 2
($)Level 3
($)Total($)
Equities 189,424,023 4,305,656 – 193,729,679Currency forward contracts–assets – 134,527 – 134,527
189,424,023 4,440,183 – 193,864,206
Currency forward contracts–liabilities – (1,677,090) – (1,677,090)
189,424,023 2,763,093 – 192,187,116
December 31, 2014Level 1
($)Level 2
($)Level 3
($)Total($)
Equities 162,528,618 3,277,466 – 165,806,084Currency forward contracts–assets – 55,538 – 55,538
162,528,618 3,333,004 – 165,861,622
Currency forward contracts–liabilities – (59) – (59)
162,528,618 3,332,945 – 165,861,563
Transfers between levels
During the periods ended June 30, 2015 and December 31,2014, there were no significant transfers between Level 1and Level 2.
3. Offsetting of financial assets and liabilities (note 2)
The following table presents offsetting of financial assetsand liabilities and collateral amounts that would occur iffuture events, such as bankruptcy or termination ofcontracts were to arise. No amounts were offset in thefinancial statements.
June 30, 2015
Financial assets – by type
Gross amountof assets
($)
Master nettingoffset
($)
Collateralpledged
($)Net Amount
($)
Currency forward contracts 134,527 (134,527) – –Options contracts – OTC – – – –Swap contracts – – – –
134,527 (134,527) – –
Financial liabilities – by type
Gross amountof liabilities
($)
Master nettingoffset
($)
Collateralpledged
($)Net Amount
($)
Currency forward contracts 1,677,090 (134,527) – 1,542,563Options contracts – OTC – – – –Swap contracts – – – –
1,677,090 (134,527) – 1,542,563
December 31, 2014
Financial assets – by type
Gross amountof assets
($)
Master nettingoffset
($)
Collateralpledged
($)Net Amount
($)
Currency forward contracts 55,538 (59) – 55,479Options contracts – OTC – – – –Swap contracts – – – –
55,538 (59) – 55,479
Financial liabilities – by type
Gross amountof liabilities
($)
Master nettingoffset
($)
Collateralpledged
($)Net Amount
($)
Currency forward contracts 59 (59) – –Options contracts – OTC – – – –Swap contracts – – – –
59 (59) – –
4. Interest in Underlying Funds (note 2)
The Fund did not hold any interest in Underlying Funds asat June 30, 2015 or December 31, 2014.
5. Comparison of net asset value per unit and netassets per unit (note 2)
The table below provides a comparison of the net assetvalue per unit and net assets per unit. The primary reasonfor the difference between the net asset value per unit andnet assets per unit, if any, is described in note 2.
June 30, 2015 December 31, 2014
Net asset valueper unit
($)
Net assetsper unit
($)
Net asset valueper unit
($)
Net assetsper unit
($)
Series I 10.18 10.17 10.14 10.14
Series M 11.34 11.34 11.29 11.29
The accompanying notes are an integral part of the financial statements.
158
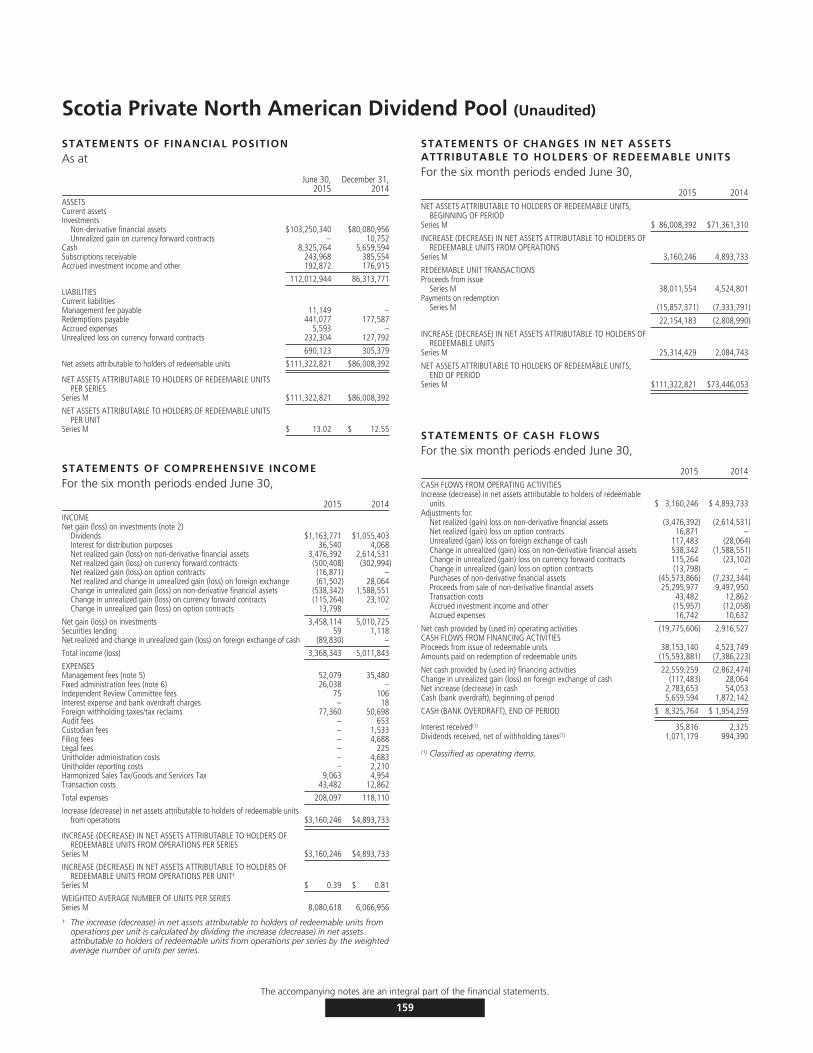
Scotia Private North American Dividend Pool (Unaudited)
STATEMENTS OF FINANCIAL POSITIONAs at
June 30,2015
December 31,2014
ASSETSCurrent assetsInvestments
Non-derivative financial assets $103,250,340 $80,080,956Unrealized gain on currency forward contracts – 10,752
Cash 8,325,764 5,659,594Subscriptions receivable 243,968 385,554Accrued investment income and other 192,872 176,915
112,012,944 86,313,771
LIABILITIESCurrent liabilitiesManagement fee payable 11,149 –Redemptions payable 441,077 177,587Accrued expenses 5,593 –Unrealized loss on currency forward contracts 232,304 127,792
690,123 305,379
Net assets attributable to holders of redeemable units $111,322,821 $86,008,392
NET ASSETS ATTRIBUTABLE TO HOLDERS OF REDEEMABLE UNITSPER SERIES
Series M $111,322,821 $86,008,392
NET ASSETS ATTRIBUTABLE TO HOLDERS OF REDEEMABLE UNITSPER UNIT
Series M $ 13.02 $ 12.55
STATEMENTS OF COMPREHENSIVE INCOMEFor the six month periods ended June 30,
2015 2014INCOMENet gain (loss) on investments (note 2)
Dividends $1,163,771 $1,055,403Interest for distribution purposes 36,540 4,068Net realized gain (loss) on non-derivative financial assets 3,476,392 2,614,531Net realized gain (loss) on currency forward contracts (500,408) (302,994)Net realized gain (loss) on option contracts (16,871) –Net realized and change in unrealized gain (loss) on foreign exchange (61,502) 28,064Change in unrealized gain (loss) on non-derivative financial assets (538,342) 1,588,551Change in unrealized gain (loss) on currency forward contracts (115,264) 23,102Change in unrealized gain (loss) on option contracts 13,798 –
Net gain (loss) on investments 3,458,114 5,010,725Securities lending 59 1,118Net realized and change in unrealized gain (loss) on foreign exchange of cash (89,830) –
Total income (loss) 3,368,343 5,011,843
EXPENSESManagement fees (note 5) 52,079 35,480Fixed administration fees (note 6) 26,038 –Independent Review Committee fees 75 106Interest expense and bank overdraft charges – 18Foreign withholding taxes/tax reclaims 77,360 50,698Audit fees – 653Custodian fees – 1,533Filing fees – 4,688Legal fees – 225Unitholder administration costs – 4,683Unitholder reporting costs – 2,210Harmonized Sales Tax/Goods and Services Tax 9,063 4,954Transaction costs 43,482 12,862
Total expenses 208,097 118,110
Increase (decrease) in net assets attributable to holders of redeemable unitsfrom operations $3,160,246 $4,893,733
INCREASE (DECREASE) IN NET ASSETS ATTRIBUTABLE TO HOLDERS OFREDEEMABLE UNITS FROM OPERATIONS PER SERIES
Series M $3,160,246 $4,893,733
INCREASE (DECREASE) IN NET ASSETS ATTRIBUTABLE TO HOLDERS OFREDEEMABLE UNITS FROM OPERATIONS PER UNIT†
Series M $ 0.39 $ 0.81
WEIGHTED AVERAGE NUMBER OF UNITS PER SERIESSeries M 8,080,618 6,066,956
† The increase (decrease) in net assets attributable to holders of redeemable units fromoperations per unit is calculated by dividing the increase (decrease) in net assetsattributable to holders of redeemable units from operations per series by the weightedaverage number of units per series.
STATEMENTS OF CHANGES IN NET ASSETSATTRIBUTABLE TO HOLDERS OF REDEEMABLE UNITSFor the six month periods ended June 30,
2015 2014NET ASSETS ATTRIBUTABLE TO HOLDERS OF REDEEMABLE UNITS,
BEGINNING OF PERIODSeries M $ 86,008,392 $71,361,310
INCREASE (DECREASE) IN NET ASSETS ATTRIBUTABLE TO HOLDERS OFREDEEMABLE UNITS FROM OPERATIONS
Series M 3,160,246 4,893,733
REDEEMABLE UNIT TRANSACTIONSProceeds from issue
Series M 38,011,554 4,524,801Payments on redemption
Series M (15,857,371) (7,333,791)
22,154,183 (2,808,990)
INCREASE (DECREASE) IN NET ASSETS ATTRIBUTABLE TO HOLDERS OFREDEEMABLE UNITS
Series M 25,314,429 2,084,743
NET ASSETS ATTRIBUTABLE TO HOLDERS OF REDEEMABLE UNITS,END OF PERIOD
Series M $111,322,821 $73,446,053
STATEMENTS OF CASH FLOWSFor the six month periods ended June 30,
2015 2014CASH FLOWS FROM OPERATING ACTIVITIESIncrease (decrease) in net assets attributable to holders of redeemable
units $ 3,160,246 $ 4,893,733Adjustments for:
Net realized (gain) loss on non-derivative financial assets (3,476,392) (2,614,531)Net realized (gain) loss on option contracts 16,871 –Unrealized (gain) loss on foreign exchange of cash 117,483 (28,064)Change in unrealized (gain) loss on non-derivative financial assets 538,342 (1,588,551)Change in unrealized (gain) loss on currency forward contracts 115,264 (23,102)Change in unrealized (gain) loss on option contracts (13,798) –Purchases of non-derivative financial assets (45,573,866) (7,232,344)Proceeds from sale of non-derivative financial assets 25,295,977 9,497,950Transaction costs 43,482 12,862Accrued investment income and other (15,957) (12,058)Accrued expenses 16,742 10,632
Net cash provided by (used in) operating activities (19,775,606) 2,916,527CASH FLOWS FROM FINANCING ACTIVITIESProceeds from issue of redeemable units 38,153,140 4,523,749Amounts paid on redemption of redeemable units (15,593,881) (7,386,223)
Net cash provided by (used in) financing activities 22,559,259 (2,862,474)Change in unrealized gain (loss) on foreign exchange of cash (117,483) 28,064Net increase (decrease) in cash 2,783,653 54,053Cash (bank overdraft), beginning of period 5,659,594 1,872,142
CASH (BANK OVERDRAFT), END OF PERIOD $ 8,325,764 $ 1,954,259
Interest received(1) 35,816 2,325Dividends received, net of withholding taxes(1) 1,071,179 994,390
(1) Classified as operating items.
The accompanying notes are an integral part of the financial statements.
159
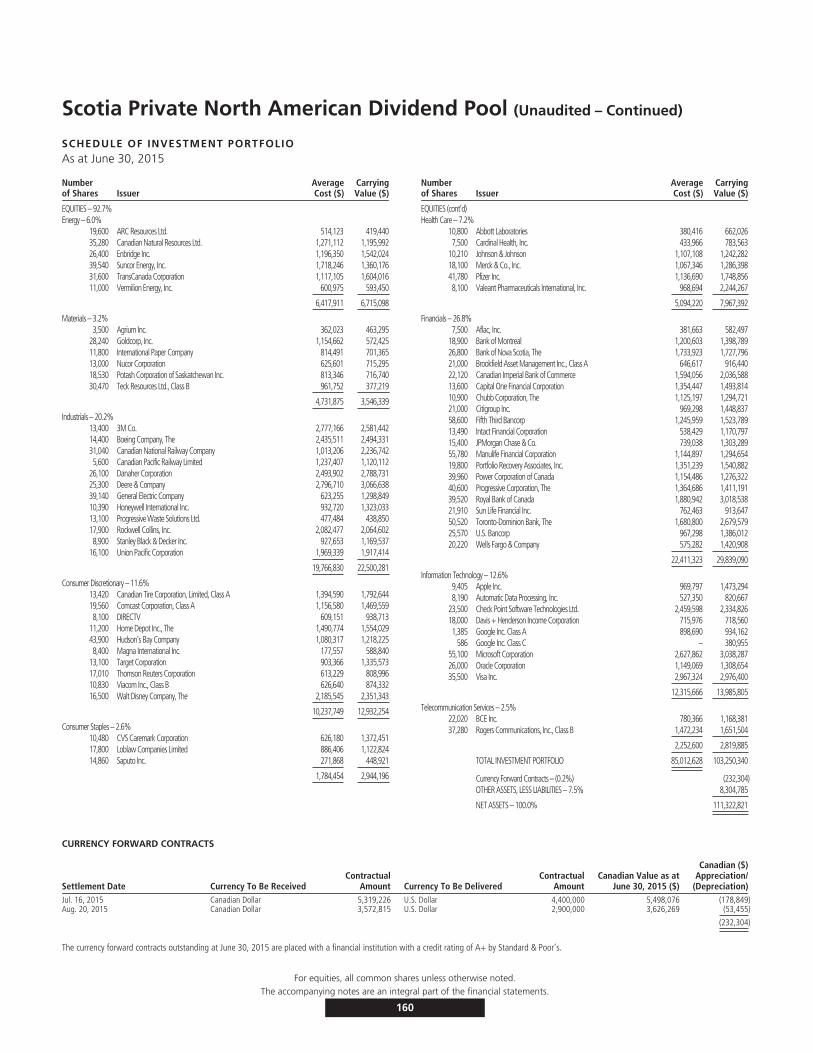
Scotia Private North American Dividend Pool (Unaudited – Continued)
SCHEDULE OF INVESTMENT PORTFOLIOAs at June 30, 2015
Numberof Shares Issuer
AverageCost ($)
CarryingValue ($)
EQUITIES – 92.7%Energy – 6.0%
19,600 ARC Resources Ltd. 514,123 419,44035,280 Canadian Natural Resources Ltd. 1,271,112 1,195,99226,400 Enbridge Inc. 1,196,350 1,542,02439,540 Suncor Energy, Inc. 1,718,246 1,360,17631,600 TransCanada Corporation 1,117,105 1,604,01611,000 Vermilion Energy, Inc. 600,975 593,450
6,417,911 6,715,098
Materials – 3.2%3,500 Agrium Inc. 362,023 463,295
28,240 Goldcorp, Inc. 1,154,662 572,42511,800 International Paper Company 814,491 701,36513,000 Nucor Corporation 625,601 715,29518,530 Potash Corporation of Saskatchewan Inc. 813,346 716,74030,470 Teck Resources Ltd., Class B 961,752 377,219
4,731,875 3,546,339
Industrials – 20.2%13,400 3M Co. 2,777,166 2,581,44214,400 Boeing Company, The 2,435,511 2,494,33131,040 Canadian National Railway Company 1,013,206 2,236,7425,600 Canadian Pacific Railway Limited 1,237,407 1,120,112
26,100 Danaher Corporation 2,493,902 2,788,73125,300 Deere & Company 2,796,710 3,066,63839,140 General Electric Company 623,255 1,298,84910,390 Honeywell International Inc. 932,720 1,323,03313,100 Progressive Waste Solutions Ltd. 477,484 438,85017,900 Rockwell Collins, Inc. 2,082,477 2,064,6028,900 Stanley Black & Decker Inc. 927,653 1,169,537
16,100 Union Pacific Corporation 1,969,339 1,917,414
19,766,830 22,500,281
Consumer Discretionary – 11.6%13,420 Canadian Tire Corporation, Limited, Class A 1,394,590 1,792,64419,560 Comcast Corporation, Class A 1,156,580 1,469,5598,100 DIRECTV 609,151 938,713
11,200 Home Depot Inc., The 1,490,774 1,554,02943,900 Hudson’s Bay Company 1,080,317 1,218,2258,400 Magna International Inc. 177,557 588,840
13,100 Target Corporation 903,366 1,335,57317,010 Thomson Reuters Corporation 613,229 808,99610,830 Viacom Inc., Class B 626,640 874,33216,500 Walt Disney Company, The 2,185,545 2,351,343
10,237,749 12,932,254
Consumer Staples – 2.6%10,480 CVS Caremark Corporation 626,180 1,372,45117,800 Loblaw Companies Limited 886,406 1,122,82414,860 Saputo Inc. 271,868 448,921
1,784,454 2,944,196
Numberof Shares Issuer
AverageCost ($)
CarryingValue ($)
EQUITIES (cont’d)Health Care – 7.2%
10,800 Abbott Laboratories 380,416 662,0267,500 Cardinal Health, Inc. 433,966 783,563
10,210 Johnson & Johnson 1,107,108 1,242,28218,100 Merck & Co., Inc. 1,067,346 1,286,39841,780 Pfizer Inc. 1,136,690 1,748,8568,100 Valeant Pharmaceuticals International, Inc. 968,694 2,244,267
5,094,220 7,967,392
Financials – 26.8%7,500 Aflac, Inc. 381,663 582,497
18,900 Bank of Montreal 1,200,603 1,398,78926,800 Bank of Nova Scotia, The 1,733,923 1,727,79621,000 Brookfield Asset Management Inc., Class A 646,617 916,44022,120 Canadian Imperial Bank of Commerce 1,594,056 2,036,58813,600 Capital One Financial Corporation 1,354,447 1,493,81410,900 Chubb Corporation, The 1,125,197 1,294,72121,000 Citigroup Inc. 969,298 1,448,83758,600 Fifth Third Bancorp 1,245,959 1,523,78913,490 Intact Financial Corporation 538,429 1,170,79715,400 JPMorgan Chase & Co. 739,038 1,303,28955,780 Manulife Financial Corporation 1,144,897 1,294,65419,800 Portfolio Recovery Associates, Inc. 1,351,239 1,540,88239,960 Power Corporation of Canada 1,154,486 1,276,32240,600 Progressive Corporation, The 1,364,686 1,411,19139,520 Royal Bank of Canada 1,880,942 3,018,53821,910 Sun Life Financial Inc. 762,463 913,64750,520 Toronto-Dominion Bank, The 1,680,800 2,679,57925,570 U.S. Bancorp 967,298 1,386,01220,220 Wells Fargo & Company 575,282 1,420,908
22,411,323 29,839,090
Information Technology – 12.6%9,405 Apple Inc. 969,797 1,473,2948,190 Automatic Data Processing, Inc. 527,350 820,667
23,500 Check Point Software Technologies Ltd. 2,459,598 2,334,82618,000 Davis + Henderson Income Corporation 715,976 718,5601,385 Google Inc. Class A 898,690 934,162
586 Google Inc. Class C – 380,95555,100 Microsoft Corporation 2,627,862 3,038,28726,000 Oracle Corporation 1,149,069 1,308,65435,500 Visa Inc. 2,967,324 2,976,400
12,315,666 13,985,805
Telecommunication Services – 2.5%22,020 BCE Inc. 780,366 1,168,38137,280 Rogers Communications, Inc., Class B 1,472,234 1,651,504
2,252,600 2,819,885
TOTAL INVESTMENT PORTFOLIO 85,012,628 103,250,340
Currency Forward Contracts – (0.2%) (232,304)OTHER ASSETS, LESS LIABILITIES – 7.5% 8,304,785
NET ASSETS – 100.0% 111,322,821
CURRENCY FORWARD CONTRACTS
Settlement Date Currency To Be ReceivedContractual
Amount Currency To Be DeliveredContractual
AmountCanadian Value as at
June 30, 2015 ($)
Canadian ($)Appreciation/
(Depreciation)Jul. 16, 2015 Canadian Dollar 5,319,226 U.S. Dollar 4,400,000 5,498,076 (178,849)Aug. 20, 2015 Canadian Dollar 3,572,815 U.S. Dollar 2,900,000 3,626,269 (53,455)
(232,304)
The currency forward contracts outstanding at June 30, 2015 are placed with a financial institution with a credit rating of A+ by Standard & Poor’s.
The accompanying notes are an integral part of the financial statements.
160
For equities, all common shares unless otherwise noted.
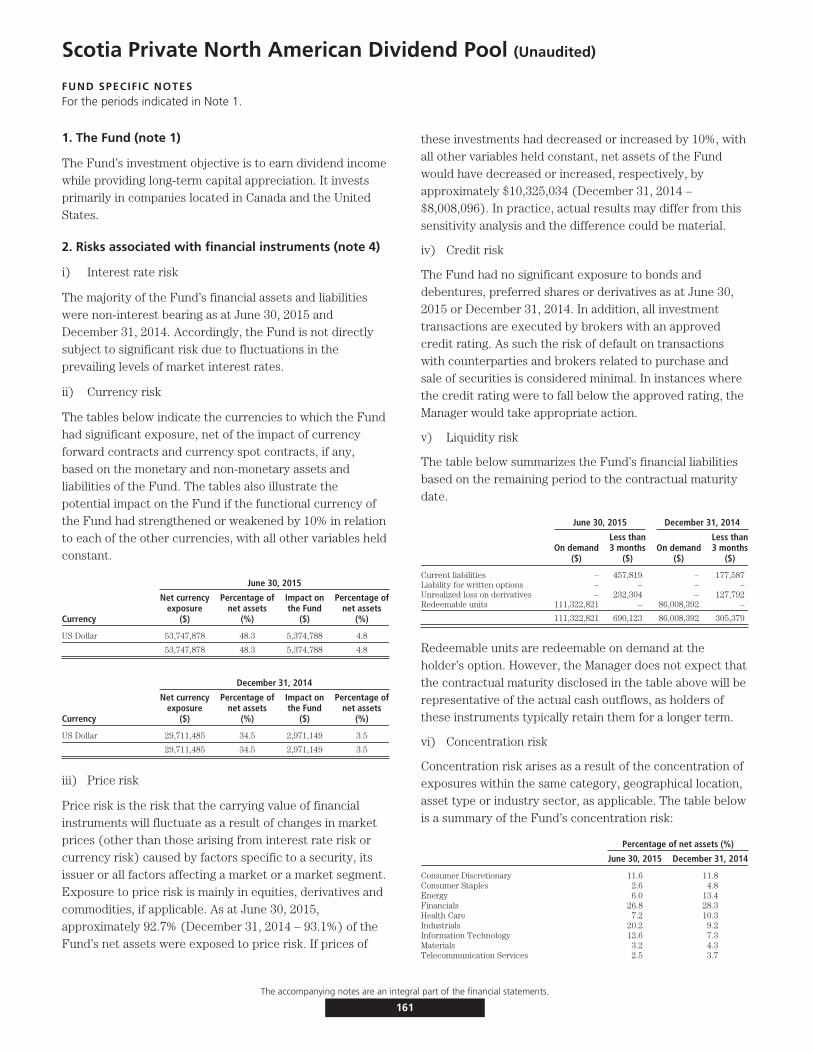
Scotia Private North American Dividend Pool (Unaudited)
FUND SPECIFIC NOTESFor the periods indicated in Note 1.
1. The Fund (note 1)
The Fund’s investment objective is to earn dividend incomewhile providing long-term capital appreciation. It investsprimarily in companies located in Canada and the UnitedStates.
2. Risks associated with financial instruments (note 4)
i) Interest rate risk
The majority of the Fund’s financial assets and liabilitieswere non-interest bearing as at June 30, 2015 andDecember 31, 2014. Accordingly, the Fund is not directlysubject to significant risk due to fluctuations in theprevailing levels of market interest rates.
ii) Currency risk
The tables below indicate the currencies to which the Fundhad significant exposure, net of the impact of currencyforward contracts and currency spot contracts, if any,based on the monetary and non-monetary assets andliabilities of the Fund. The tables also illustrate thepotential impact on the Fund if the functional currency ofthe Fund had strengthened or weakened by 10% in relationto each of the other currencies, with all other variables heldconstant.
June 30, 2015
Currency
Net currencyexposure
($)
Percentage ofnet assets
(%)
Impact onthe Fund
($)
Percentage ofnet assets
(%)
US Dollar 53,747,878 48.3 5,374,788 4.8
53,747,878 48.3 5,374,788 4.8
December 31, 2014
Currency
Net currencyexposure
($)
Percentage ofnet assets
(%)
Impact onthe Fund
($)
Percentage ofnet assets
(%)
US Dollar 29,711,485 34.5 2,971,149 3.5
29,711,485 34.5 2,971,149 3.5
iii) Price risk
Price risk is the risk that the carrying value of financialinstruments will fluctuate as a result of changes in marketprices (other than those arising from interest rate risk orcurrency risk) caused by factors specific to a security, itsissuer or all factors affecting a market or a market segment.Exposure to price risk is mainly in equities, derivatives andcommodities, if applicable. As at June 30, 2015,approximately 92.7% (December 31, 2014 – 93.1%) of theFund’s net assets were exposed to price risk. If prices of
these investments had decreased or increased by 10%, withall other variables held constant, net assets of the Fundwould have decreased or increased, respectively, byapproximately $10,325,034 (December 31, 2014 –$8,008,096). In practice, actual results may differ from thissensitivity analysis and the difference could be material.
iv) Credit risk
The Fund had no significant exposure to bonds anddebentures, preferred shares or derivatives as at June 30,2015 or December 31, 2014. In addition, all investmenttransactions are executed by brokers with an approvedcredit rating. As such the risk of default on transactionswith counterparties and brokers related to purchase andsale of securities is considered minimal. In instances wherethe credit rating were to fall below the approved rating, theManager would take appropriate action.
v) Liquidity risk
The table below summarizes the Fund’s financial liabilitiesbased on the remaining period to the contractual maturitydate.
June 30, 2015 December 31, 2014
On demand($)
Less than3 months
($)On demand
($)
Less than3 months
($)
Current liabilities – 457,819 – 177,587Liability for written options – – – –Unrealized loss on derivatives – 232,304 – 127,792Redeemable units 111,322,821 – 86,008,392 –
111,322,821 690,123 86,008,392 305,379
Redeemable units are redeemable on demand at theholder’s option. However, the Manager does not expect thatthe contractual maturity disclosed in the table above will berepresentative of the actual cash outflows, as holders ofthese instruments typically retain them for a longer term.
vi) Concentration risk
Concentration risk arises as a result of the concentration ofexposures within the same category, geographical location,asset type or industry sector, as applicable. The table belowis a summary of the Fund’s concentration risk:
Percentage of net assets (%)
June 30, 2015 December 31, 2014
Consumer Discretionary 11.6 11.8Consumer Staples 2.6 4.8Energy 6.0 13.4Financials 26.8 28.3Health Care 7.2 10.3Industrials 20.2 9.2Information Technology 12.6 7.3Materials 3.2 4.3Telecommunication Services 2.5 3.7
The accompanying notes are an integral part of the financial statements.
161

Scotia Private North American Dividend Pool (Unaudited – Continued)
FUND SPECIFIC NOTESFor the periods indicated in Note 1.
vii) Fair value classification (note 2)
The tables below illustrate the classification of the Fund’sfinancial instruments within the fair value hierarchy.
June 30, 2015Level 1
($)Level 2
($)Level 3
($)Total($)
Equities 103,250,340 – – 103,250,340
103,250,340 – – 103,250,340
Currency forward contracts–liabilities – (232,304) – (232,304)
103,250,340 (232,304) – 103,018,036
December 31, 2014Level 1
($)Level 2
($)Level 3
($)Total($)
Equities 80,076,987 – – 80,076,987Warrants, rights and options 3,969 – – 3,969Currency forward contracts–assets – 10,752 – 10,752
80,080,956 10,752 – 80,091,708
Currency forward contracts–liabilities – (127,792) – (127,792)
80,080,956 (117,040) – 79,963,916
Transfers between levels
During the periods ended June 30, 2015 and December 31,2014, there were no significant transfers between Level 1and Level 2.
3. Offsetting of financial assets and liabilities (note 2)
The following table presents offsetting of financial assetsand liabilities and collateral amounts that would occur iffuture events, such as bankruptcy or termination ofcontracts were to arise. No amounts were offset in thefinancial statements.
June 30, 2015
Financial assets – by type
Gross amountof assets
($)
Master nettingoffset
($)
Collateralpledged
($)Net Amount
($)
Currency forward contracts – – – –Options contracts – OTC – – – –Swap contracts – – – –
– – – –
Financial liabilities – by type
Gross amountof liabilities
($)
Master nettingoffset
($)
Collateralpledged
($)Net Amount
($)
Currency forward contracts 232,304 – – 232,304Options contracts – OTC – – – –Swap contracts – – – –
232,304 – – 232,304
December 31, 2014
Financial assets – by type
Gross amountof assets
($)
Master nettingoffset
($)
Collateralpledged
($)Net Amount
($)
Currency forward contracts 10,752 – – 10,752Options contracts – OTC – – – –Swap contracts – – – –
10,752 – – 10,752
Financial liabilities – by type
Gross amountof liabilities
($)
Master nettingoffset
($)
Collateralpledged
($)Net Amount
($)
Currency forward contracts 127,792 – – 127,792Options contracts – OTC – – – –Swap contracts – – –
127,792 – – 127,792
4. Interest in Underlying Funds (note 2)
The Fund did not hold any interest in Underlying Funds asat June 30, 2015 or December 31, 2014.
5. Comparison of net asset value per unit and netassets per unit (note 2)
The table below provides a comparison of the net assetvalue per unit and net assets per unit. The primary reasonfor the difference between the net asset value per unit andnet assets per unit, if any, is described in note 2.
June 30, 2015 December 31, 2014
Net asset valueper unit
($)
Net assetsper unit
($)
Net asset valueper unit
($)
Net assetsper unit
($)
Series M 13.02 13.02 12.55 12.55
The accompanying notes are an integral part of the financial statements.
162

Scotia U.S. Dividend Fund (Unaudited)
STATEMENTS OF FINANCIAL POSITIONAs at
June 30,2015
December 31,2014
ASSETSCurrent assetsInvestments
Non-derivative financial assets $177,284,743 $146,966,222Cash 30,340,836 26,951,323Receivable for securities sold 2,797,295 –Subscriptions receivable 120,284 164,403Accrued investment income and other 226,392 110,957
210,769,550 174,192,905
LIABILITIESCurrent liabilitiesManagement fee payable 98,750 –Payable for securities purchased 1,428,278 –Redemptions payable 49,186 6,101Accrued expenses 17,303 –Unrealized loss on currency forward contracts 676,101 –
2,269,618 6,101
Net assets attributable to holders of redeemable units $208,499,932 $174,186,804
NET ASSETS ATTRIBUTABLE TO HOLDERS OF REDEEMABLE UNITSPER SERIES
Series A $ 55,768,681 $ 36,339,248Series I $152,731,251 $137,847,556
NET ASSETS ATTRIBUTABLE TO HOLDERS OF REDEEMABLE UNITSPER UNIT
Series A $ 14.41 $ 13.56Series I $ 14.75 $ 13.73
STATEMENTS OF COMPREHENSIVE INCOMEFor the six month periods ended June 30,
2015 2014INCOMENet gain (loss) on investments (note 2)
Dividends $ 1,824,112 $ 1,953,817Interest for distribution purposes 213,302 174,532Capital gains distributions received 1,010 (3,601)Net realized gain (loss) on non-derivative financial assets 17,159,676 16,984,234Net realized gain (loss) on currency forward contracts 478,210 (4,083,264)Net realized and change in unrealized gain (loss) on foreign exchange 37,752 (55,658)Change in unrealized gain (loss) on non-derivative financial assets (7,603,190) (9,674,277)Change in unrealized gain (loss) on currency forward contracts (676,101) 192,924Change in unrealized gain (loss) on currency spots contracts – (1,015)
Net gain (loss) on investments 11,434,771 5,487,692Securities lending 9 373Net realized and change in unrealized gain (loss) on foreign exchange of
cash 2,001,769 –Other income 1,313 1,102
Total income (loss) 13,437,862 5,489,167
EXPENSESManagement fees (note 5) 458,832 231,419Fixed administration fees (note 6) 81,575 –Independent Review Committee fees 144 223Interest expense and bank overdraft charges 23 –Foreign withholding taxes/tax reclaims 271,956 315,806Audit fees – 1,812Custodian fees – 2,121Filing fees – 10,636Legal fees – 477Unitholder administration costs – 14,043Unitholder reporting costs – 3,377Harmonized Sales Tax/Goods and Services Tax 51,446 22,793Transaction costs 128,436 132,392
Total expenses 992,412 735,099
Increase (decrease) in net assets attributable to holders of redeemableunits from operations $12,445,450 $ 4,754,068
INCREASE (DECREASE) IN NET ASSETS ATTRIBUTABLE TO HOLDERSOF REDEEMABLE UNITS FROM OPERATIONS PER SERIES
Series A $ 2,256,978 $ 525,538Series I $10,188,472 $ 4,228,530
INCREASE (DECREASE) IN NET ASSETS ATTRIBUTABLE TO HOLDERSOF REDEEMABLE UNITS FROM OPERATIONS PER UNIT†
Series A $ 0.65 $ 0.27Series I $ 1.01 $ 0.44
WEIGHTED AVERAGE NUMBER OF UNITS PER SERIESSeries A 3,475,872 1,941,284Series I 10,112,802 9,558,038
† The increase (decrease) in net assets attributable to holders of redeemable units fromoperations per unit is calculated by dividing the increase (decrease) in net assetsattributable to holders of redeemable units from operations per series by the weightedaverage number of units per series.
The accompanying notes are an integral part of the financial statements.
163
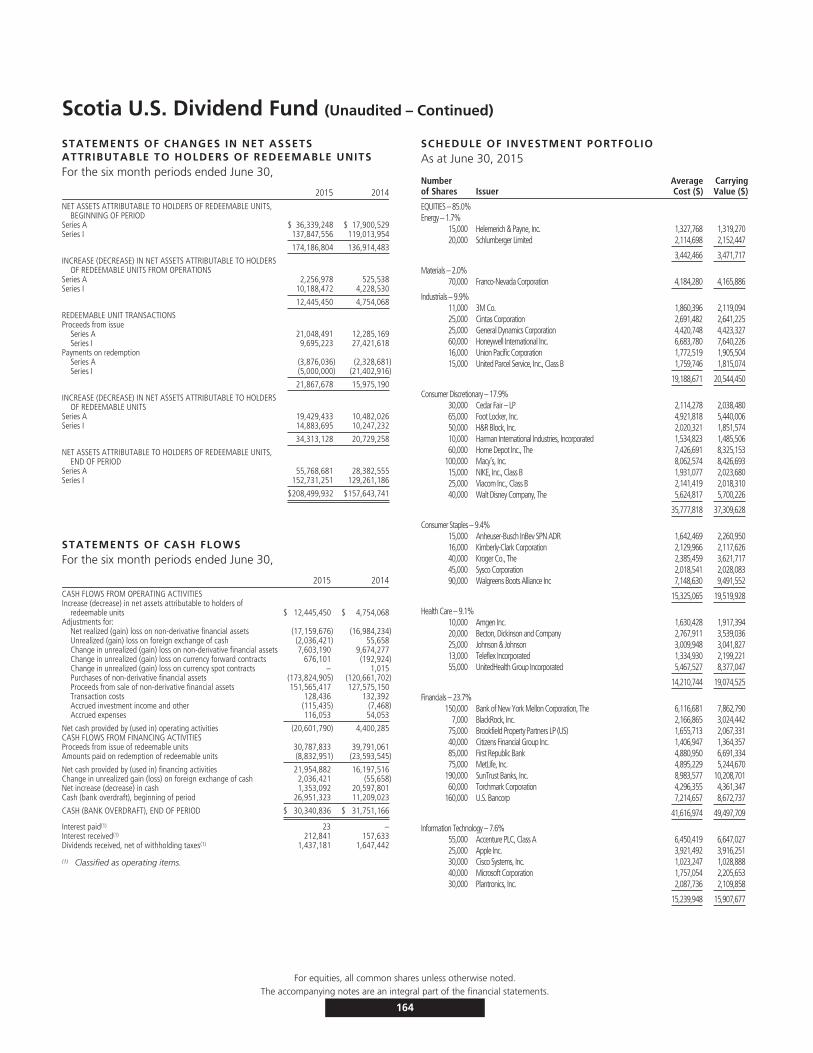
Scotia U.S. Dividend Fund (Unaudited – Continued)
STATEMENTS OF CHANGES IN NET ASSETSATTRIBUTABLE TO HOLDERS OF REDEEMABLE UNITSFor the six month periods ended June 30,
2015 2014NET ASSETS ATTRIBUTABLE TO HOLDERS OF REDEEMABLE UNITS,
BEGINNING OF PERIODSeries A $ 36,339,248 $ 17,900,529Series I 137,847,556 119,013,954
174,186,804 136,914,483
INCREASE (DECREASE) IN NET ASSETS ATTRIBUTABLE TO HOLDERSOF REDEEMABLE UNITS FROM OPERATIONS
Series A 2,256,978 525,538Series I 10,188,472 4,228,530
12,445,450 4,754,068
REDEEMABLE UNIT TRANSACTIONSProceeds from issue
Series A 21,048,491 12,285,169Series I 9,695,223 27,421,618
Payments on redemptionSeries A (3,876,036) (2,328,681)Series I (5,000,000) (21,402,916)
21,867,678 15,975,190
INCREASE (DECREASE) IN NET ASSETS ATTRIBUTABLE TO HOLDERSOF REDEEMABLE UNITS
Series A 19,429,433 10,482,026Series I 14,883,695 10,247,232
34,313,128 20,729,258
NET ASSETS ATTRIBUTABLE TO HOLDERS OF REDEEMABLE UNITS,END OF PERIOD
Series A 55,768,681 28,382,555Series I 152,731,251 129,261,186
$208,499,932 $157,643,741
STATEMENTS OF CASH FLOWSFor the six month periods ended June 30,
2015 2014CASH FLOWS FROM OPERATING ACTIVITIESIncrease (decrease) in net assets attributable to holders of
redeemable units $ 12,445,450 $ 4,754,068Adjustments for:
Net realized (gain) loss on non-derivative financial assets (17,159,676) (16,984,234)Unrealized (gain) loss on foreign exchange of cash (2,036,421) 55,658Change in unrealized (gain) loss on non-derivative financial assets 7,603,190 9,674,277Change in unrealized (gain) loss on currency forward contracts 676,101 (192,924)Change in unrealized (gain) loss on currency spot contracts – 1,015Purchases of non-derivative financial assets (173,824,905) (120,661,702)Proceeds from sale of non-derivative financial assets 151,565,417 127,575,150Transaction costs 128,436 132,392Accrued investment income and other (115,435) (7,468)Accrued expenses 116,053 54,053
Net cash provided by (used in) operating activities (20,601,790) 4,400,285CASH FLOWS FROM FINANCING ACTIVITIESProceeds from issue of redeemable units 30,787,833 39,791,061Amounts paid on redemption of redeemable units (8,832,951) (23,593,545)
Net cash provided by (used in) financing activities 21,954,882 16,197,516Change in unrealized gain (loss) on foreign exchange of cash 2,036,421 (55,658)Net increase (decrease) in cash 1,353,092 20,597,801Cash (bank overdraft), beginning of period 26,951,323 11,209,023
CASH (BANK OVERDRAFT), END OF PERIOD $ 30,340,836 $ 31,751,166
Interest paid(1) 23 –Interest received(1) 212,841 157,633Dividends received, net of withholding taxes(1) 1,437,181 1,647,442
(1) Classified as operating items.
SCHEDULE OF INVESTMENT PORTFOLIOAs at June 30, 2015
Numberof Shares Issuer
AverageCost ($)
CarryingValue ($)
EQUITIES – 85.0%Energy – 1.7%
15,000 Helemerich & Payne, Inc. 1,327,768 1,319,27020,000 Schlumberger Limited 2,114,698 2,152,447
3,442,466 3,471,717
Materials – 2.0%70,000 Franco-Nevada Corporation 4,184,280 4,165,886
Industrials – 9.9%11,000 3M Co. 1,860,396 2,119,09425,000 Cintas Corporation 2,691,482 2,641,22525,000 General Dynamics Corporation 4,420,748 4,423,32760,000 Honeywell International Inc. 6,683,780 7,640,22616,000 Union Pacific Corporation 1,772,519 1,905,50415,000 United Parcel Service, Inc., Class B 1,759,746 1,815,074
19,188,671 20,544,450
Consumer Discretionary – 17.9%30,000 Cedar Fair – LP 2,114,278 2,038,48065,000 Foot Locker, Inc. 4,921,818 5,440,00650,000 H&R Block, Inc. 2,020,321 1,851,57410,000 Harman International Industries, Incorporated 1,534,823 1,485,50660,000 Home Depot Inc., The 7,426,691 8,325,153
100,000 Macy’s, Inc. 8,062,574 8,426,69315,000 NIKE, Inc., Class B 1,931,077 2,023,68025,000 Viacom Inc., Class B 2,141,419 2,018,31040,000 Walt Disney Company, The 5,624,817 5,700,226
35,777,818 37,309,628
Consumer Staples – 9.4%15,000 Anheuser-Busch InBev SPN ADR 1,642,469 2,260,95016,000 Kimberly-Clark Corporation 2,129,966 2,117,62640,000 Kroger Co., The 2,385,459 3,621,71745,000 Sysco Corporation 2,018,541 2,028,08390,000 Walgreens Boots Alliance Inc 7,148,630 9,491,552
15,325,065 19,519,928
Health Care – 9.1%10,000 Amgen Inc. 1,630,428 1,917,39420,000 Becton, Dickinson and Company 2,767,911 3,539,03625,000 Johnson & Johnson 3,009,948 3,041,82713,000 Teleflex Incorporated 1,334,930 2,199,22155,000 UnitedHealth Group Incorporated 5,467,527 8,377,047
14,210,744 19,074,525
Financials – 23.7%150,000 Bank of New York Mellon Corporation, The 6,116,681 7,862,790
7,000 BlackRock, Inc. 2,166,865 3,024,44275,000 Brookfield Property Partners LP (US) 1,655,713 2,067,33140,000 Citizens Financial Group Inc. 1,406,947 1,364,35785,000 First Republic Bank 4,880,950 6,691,33475,000 MetLife, Inc. 4,895,229 5,244,670
190,000 SunTrust Banks, Inc. 8,983,577 10,208,70160,000 Torchmark Corporation 4,296,355 4,361,347
160,000 U.S. Bancorp 7,214,657 8,672,737
41,616,974 49,497,709
Information Technology – 7.6%55,000 Accenture PLC, Class A 6,450,419 6,647,02725,000 Apple Inc. 3,921,492 3,916,25130,000 Cisco Systems, Inc. 1,023,247 1,028,88840,000 Microsoft Corporation 1,757,054 2,205,65330,000 Plantronics, Inc. 2,087,736 2,109,858
15,239,948 15,907,677
For equities, all common shares unless otherwise noted.The accompanying notes are an integral part of the financial statements.
164

Scotia U.S. Dividend Fund (Unaudited – Continued)
SCHEDULE OF INVESTMENT PORTFOLIO
Numberof Shares Issuer
AverageCost ($)
CarryingValue ($)
EQUITIES (cont’d)Utilities – 3.7%
140,000 Brookfield Infrastructure Partners LP 6,102,274 7,793,223
TOTAL INVESTMENT PORTFOLIO 155,088,240 177,284,743
Currency Forward Contracts – (0.3%) (676,101)OTHER ASSETS, LESS LIABILITIES – 15.3% 31,891,290
NET ASSETS – 100.0% 208,499,932
CURRENCY FORWARD CONTRACTS
Settlement Date Currency To Be ReceivedContractual
Amount Currency To Be DeliveredContractual
AmountCanadian Value as at
June 30, 2015 ($)
Canadian ($)Appreciation/
(Depreciation)Sep. 15, 2015 Canadian Dollar 23,536,554 U.S. Dollar 19,088,000 23,876,116 (339,563)Sep. 15, 2015 Canadian Dollar 23,005,467 U.S. Dollar 18,661,000 23,342,006 (336,538)
(676,101)
The currency forward contracts outstanding at June 30, 2015 are placed with a financial institution with a credit rating of A+ by Standard & Poor’s.
For equities, all common shares unless otherwise noted.The accompanying notes are an integral part of the financial statements.
165
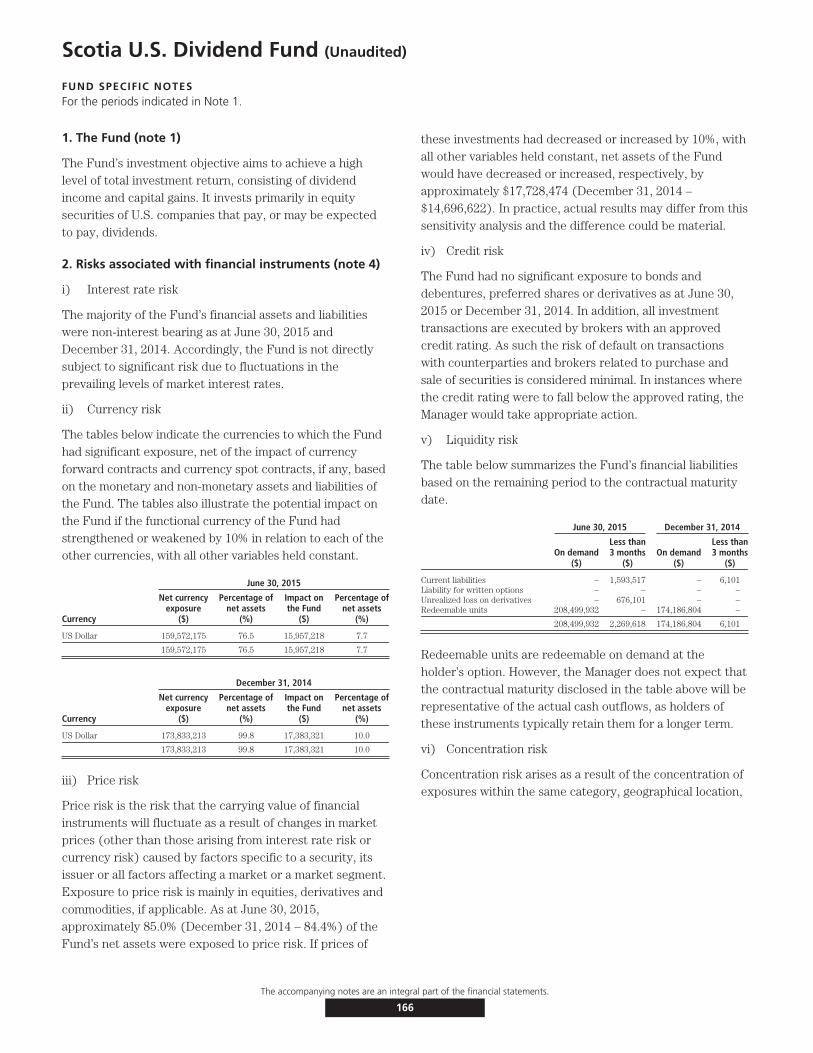
Scotia U.S. Dividend Fund (Unaudited)
FUND SPECIFIC NOTESFor the periods indicated in Note 1.
1. The Fund (note 1)
The Fund’s investment objective aims to achieve a highlevel of total investment return, consisting of dividendincome and capital gains. It invests primarily in equitysecurities of U.S. companies that pay, or may be expectedto pay, dividends.
2. Risks associated with financial instruments (note 4)
i) Interest rate risk
The majority of the Fund’s financial assets and liabilitieswere non-interest bearing as at June 30, 2015 andDecember 31, 2014. Accordingly, the Fund is not directlysubject to significant risk due to fluctuations in theprevailing levels of market interest rates.
ii) Currency risk
The tables below indicate the currencies to which the Fundhad significant exposure, net of the impact of currencyforward contracts and currency spot contracts, if any, basedon the monetary and non-monetary assets and liabilities ofthe Fund. The tables also illustrate the potential impact onthe Fund if the functional currency of the Fund hadstrengthened or weakened by 10% in relation to each of theother currencies, with all other variables held constant.
June 30, 2015
Currency
Net currencyexposure
($)
Percentage ofnet assets
(%)
Impact onthe Fund
($)
Percentage ofnet assets
(%)
US Dollar 159,572,175 76.5 15,957,218 7.7
159,572,175 76.5 15,957,218 7.7
December 31, 2014
Currency
Net currencyexposure
($)
Percentage ofnet assets
(%)
Impact onthe Fund
($)
Percentage ofnet assets
(%)
US Dollar 173,833,213 99.8 17,383,321 10.0
173,833,213 99.8 17,383,321 10.0
iii) Price risk
Price risk is the risk that the carrying value of financialinstruments will fluctuate as a result of changes in marketprices (other than those arising from interest rate risk orcurrency risk) caused by factors specific to a security, itsissuer or all factors affecting a market or a market segment.Exposure to price risk is mainly in equities, derivatives andcommodities, if applicable. As at June 30, 2015,approximately 85.0% (December 31, 2014 – 84.4%) of theFund’s net assets were exposed to price risk. If prices of
these investments had decreased or increased by 10%, withall other variables held constant, net assets of the Fundwould have decreased or increased, respectively, byapproximately $17,728,474 (December 31, 2014 –$14,696,622). In practice, actual results may differ from thissensitivity analysis and the difference could be material.
iv) Credit risk
The Fund had no significant exposure to bonds anddebentures, preferred shares or derivatives as at June 30,2015 or December 31, 2014. In addition, all investmenttransactions are executed by brokers with an approvedcredit rating. As such the risk of default on transactionswith counterparties and brokers related to purchase andsale of securities is considered minimal. In instances wherethe credit rating were to fall below the approved rating, theManager would take appropriate action.
v) Liquidity risk
The table below summarizes the Fund’s financial liabilitiesbased on the remaining period to the contractual maturitydate.
June 30, 2015 December 31, 2014
On demand($)
Less than3 months
($)On demand
($)
Less than3 months
($)
Current liabilities – 1,593,517 – 6,101Liability for written options – – – –Unrealized loss on derivatives – 676,101 – –Redeemable units 208,499,932 – 174,186,804 –
208,499,932 2,269,618 174,186,804 6,101
Redeemable units are redeemable on demand at theholder’s option. However, the Manager does not expect thatthe contractual maturity disclosed in the table above will berepresentative of the actual cash outflows, as holders ofthese instruments typically retain them for a longer term.
vi) Concentration risk
Concentration risk arises as a result of the concentration ofexposures within the same category, geographical location,
The accompanying notes are an integral part of the financial statements.
166

Scotia U.S. Dividend Fund (Unaudited – Continued)
FUND SPECIFIC NOTESFor the periods indicated in Note 1.
asset type or industry sector, as applicable. The table belowis a summary of the Fund’s concentration risk:
Percentage of net assets (%)
June 30, 2015 December 31, 2014
Consumer Discretionary 17.9 4.0Consumer Staples 9.4 16.0Corporate Bonds – –Energy 1.7 5.2Financials 23.7 22.4Health Care 9.1 14.3Industrials 9.9 14.3Information Technology 7.6 4.0Materials 2.0 –Utilities 3.7 4.2
vii) Fair value classification (note 2)
The tables below illustrate the classification of the Fund’sfinancial instruments within the fair value hierarchy.
June 30, 2015Level 1
($)Level 2
($)Level 3
($)Total($)
Equities 177,284,743 – – 177,284,743Currency forward contracts–
liabilities – (676,101) – (676,101)
177,284,743 (676,101) – 176,608,642
December 31, 2014Level 1
($)Level 2
($)Level 3
($)Total($)
Equities 146,966,222 – – 146,966,222
146,966,222 – – 146,966,222
Transfers between levels
During the periods ended June 30, 2015 and December 31,2014, there were no significant transfers between Level 1and Level 2.
3. Offsetting of financial assets and liabilities (note 2)
The following table presents offsetting of financial assetsand liabilities and collateral amounts that would occur iffuture events, such as bankruptcy or termination ofcontracts were to arise. No amounts were offset in thefinancial statements.
June 30, 2015
Financial assets – by type
Gross amountof assets
($)
Master nettingoffset
($)
Collateralpledged
($)Net amount
($)
Currency forward contracts – – – –Options contracts – OTC – – – –Swap contracts – – – –
– – – –
Financial liabilities – by type
Gross amountof liabilities
($)
Master nettingoffset
($)
Collateralpledged
($)Net amount
($)
Currency forward contracts 676,101 – – 676,101Options contracts – OTC – – – –Swap contracts – – – –
676,101 – – 676,101
As at December 31, 2014, the Fund did not enter into anyagreement whereby the financial instruments were eligiblefor offset.
4. Interest in Underlying Funds (note 2)
The Fund did not hold any interest in Underlying Funds asat June 30, 2015 or December 31, 2014.
5. Comparison of net asset value per unit and netassets per unit (note 2)
The table below provides a comparison of the net assetvalue per unit and net assets per unit. The primary reasonfor the difference between the net asset value per unit andnet assets per unit, if any, is described in note 2.
June 30, 2015 December 31, 2014
Net asset valueper unit
($)
Net assetsper unit
($)
Net asset valueper unit
($)
Net assetsper unit
($)
Series A 14.41 14.41 13.56 13.56
Series I 14.75 14.75 13.73 13.73
The accompanying notes are an integral part of the financial statements.
167
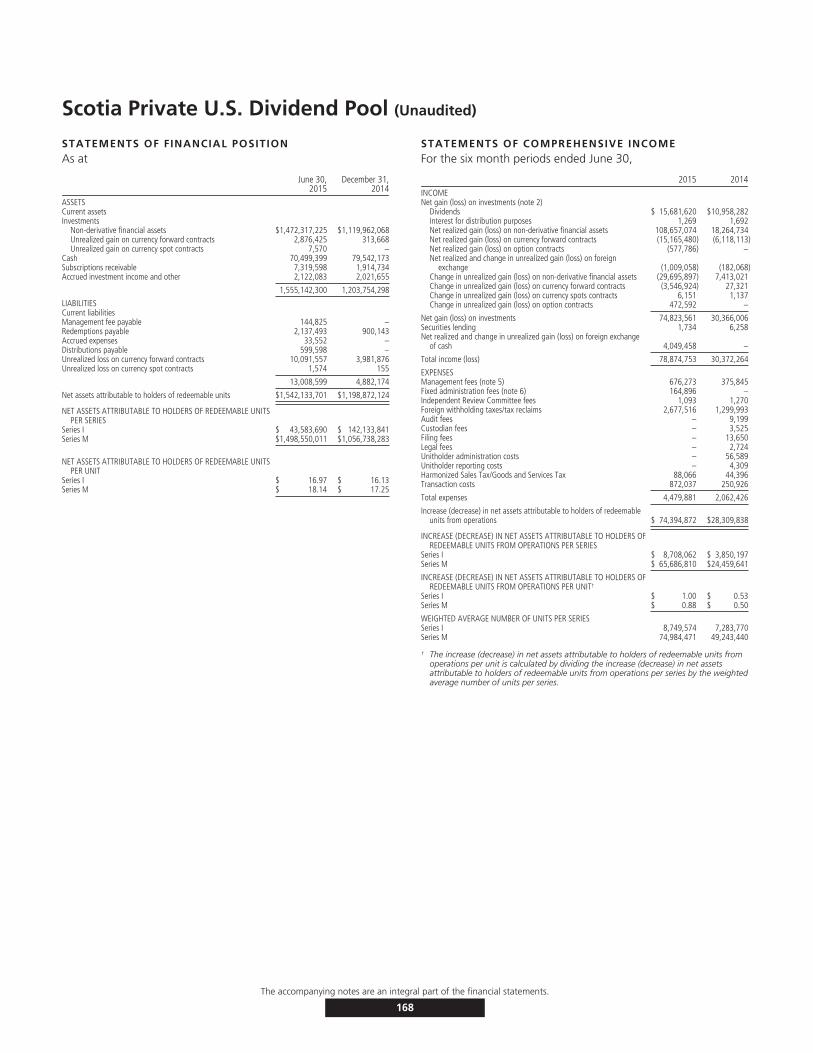
Scotia Private U.S. Dividend Pool (Unaudited)
STATEMENTS OF FINANCIAL POSITIONAs at
June 30,2015
December 31,2014
ASSETSCurrent assetsInvestments
Non-derivative financial assets $1,472,317,225 $1,119,962,068Unrealized gain on currency forward contracts 2,876,425 313,668Unrealized gain on currency spot contracts 7,570 –
Cash 70,499,399 79,542,173Subscriptions receivable 7,319,598 1,914,734Accrued investment income and other 2,122,083 2,021,655
1,555,142,300 1,203,754,298
LIABILITIESCurrent liabilitiesManagement fee payable 144,825 –Redemptions payable 2,137,493 900,143Accrued expenses 33,552 –Distributions payable 599,598 –Unrealized loss on currency forward contracts 10,091,557 3,981,876Unrealized loss on currency spot contracts 1,574 155
13,008,599 4,882,174
Net assets attributable to holders of redeemable units $1,542,133,701 $1,198,872,124
NET ASSETS ATTRIBUTABLE TO HOLDERS OF REDEEMABLE UNITSPER SERIES
Series I $ 43,583,690 $ 142,133,841Series M $1,498,550,011 $1,056,738,283
NET ASSETS ATTRIBUTABLE TO HOLDERS OF REDEEMABLE UNITSPER UNIT
Series I $ 16.97 $ 16.13Series M $ 18.14 $ 17.25
STATEMENTS OF COMPREHENSIVE INCOMEFor the six month periods ended June 30,
2015 2014INCOMENet gain (loss) on investments (note 2)
Dividends $ 15,681,620 $10,958,282Interest for distribution purposes 1,269 1,692Net realized gain (loss) on non-derivative financial assets 108,657,074 18,264,734Net realized gain (loss) on currency forward contracts (15,165,480) (6,118,113)Net realized gain (loss) on option contracts (577,786) –Net realized and change in unrealized gain (loss) on foreign
exchange (1,009,058) (182,068)Change in unrealized gain (loss) on non-derivative financial assets (29,695,897) 7,413,021Change in unrealized gain (loss) on currency forward contracts (3,546,924) 27,321Change in unrealized gain (loss) on currency spots contracts 6,151 1,137Change in unrealized gain (loss) on option contracts 472,592 –
Net gain (loss) on investments 74,823,561 30,366,006Securities lending 1,734 6,258Net realized and change in unrealized gain (loss) on foreign exchange
of cash 4,049,458 –
Total income (loss) 78,874,753 30,372,264
EXPENSESManagement fees (note 5) 676,273 375,845Fixed administration fees (note 6) 164,896 –Independent Review Committee fees 1,093 1,270Foreign withholding taxes/tax reclaims 2,677,516 1,299,993Audit fees – 9,199Custodian fees – 3,525Filing fees – 13,650Legal fees – 2,724Unitholder administration costs – 56,589Unitholder reporting costs – 4,309Harmonized Sales Tax/Goods and Services Tax 88,066 44,396Transaction costs 872,037 250,926
Total expenses 4,479,881 2,062,426
Increase (decrease) in net assets attributable to holders of redeemableunits from operations $ 74,394,872 $28,309,838
INCREASE (DECREASE) IN NET ASSETS ATTRIBUTABLE TO HOLDERS OFREDEEMABLE UNITS FROM OPERATIONS PER SERIES
Series I $ 8,708,062 $ 3,850,197Series M $ 65,686,810 $24,459,641
INCREASE (DECREASE) IN NET ASSETS ATTRIBUTABLE TO HOLDERS OFREDEEMABLE UNITS FROM OPERATIONS PER UNIT†
Series I $ 1.00 $ 0.53Series M $ 0.88 $ 0.50
WEIGHTED AVERAGE NUMBER OF UNITS PER SERIESSeries I 8,749,574 7,283,770Series M 74,984,471 49,243,440
† The increase (decrease) in net assets attributable to holders of redeemable units fromoperations per unit is calculated by dividing the increase (decrease) in net assetsattributable to holders of redeemable units from operations per series by the weightedaverage number of units per series.
The accompanying notes are an integral part of the financial statements.
168
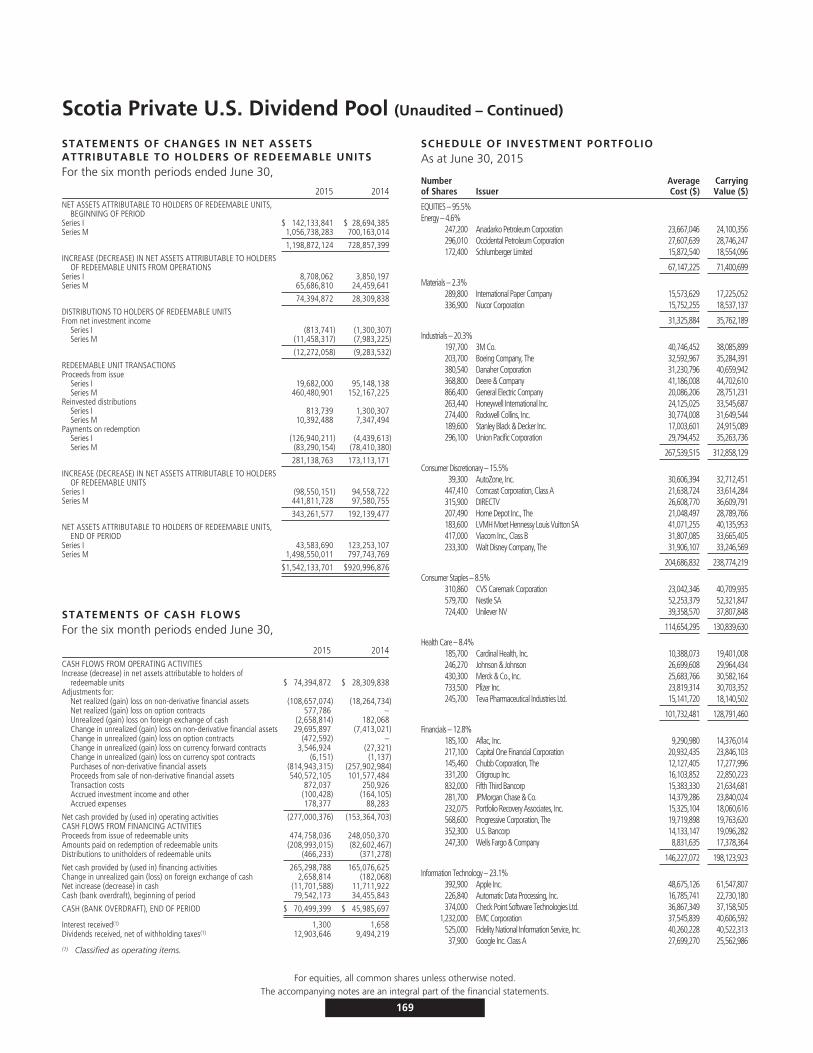
Scotia Private U.S. Dividend Pool (Unaudited – Continued)
STATEMENTS OF CHANGES IN NET ASSETSATTRIBUTABLE TO HOLDERS OF REDEEMABLE UNITSFor the six month periods ended June 30,
2015 2014NET ASSETS ATTRIBUTABLE TO HOLDERS OF REDEEMABLE UNITS,
BEGINNING OF PERIODSeries I $ 142,133,841 $ 28,694,385Series M 1,056,738,283 700,163,014
1,198,872,124 728,857,399
INCREASE (DECREASE) IN NET ASSETS ATTRIBUTABLE TO HOLDERSOF REDEEMABLE UNITS FROM OPERATIONS
Series I 8,708,062 3,850,197Series M 65,686,810 24,459,641
74,394,872 28,309,838
DISTRIBUTIONS TO HOLDERS OF REDEEMABLE UNITSFrom net investment income
Series I (813,741) (1,300,307)Series M (11,458,317) (7,983,225)
(12,272,058) (9,283,532)
REDEEMABLE UNIT TRANSACTIONSProceeds from issue
Series I 19,682,000 95,148,138Series M 460,480,901 152,167,225
Reinvested distributionsSeries I 813,739 1,300,307Series M 10,392,488 7,347,494
Payments on redemptionSeries I (126,940,211) (4,439,613)Series M (83,290,154) (78,410,380)
281,138,763 173,113,171
INCREASE (DECREASE) IN NET ASSETS ATTRIBUTABLE TO HOLDERSOF REDEEMABLE UNITS
Series I (98,550,151) 94,558,722Series M 441,811,728 97,580,755
343,261,577 192,139,477
NET ASSETS ATTRIBUTABLE TO HOLDERS OF REDEEMABLE UNITS,END OF PERIOD
Series I 43,583,690 123,253,107Series M 1,498,550,011 797,743,769
$1,542,133,701 $920,996,876
STATEMENTS OF CASH FLOWSFor the six month periods ended June 30,
2015 2014CASH FLOWS FROM OPERATING ACTIVITIESIncrease (decrease) in net assets attributable to holders of
redeemable units $ 74,394,872 $ 28,309,838Adjustments for:
Net realized (gain) loss on non-derivative financial assets (108,657,074) (18,264,734)Net realized (gain) loss on option contracts 577,786 –Unrealized (gain) loss on foreign exchange of cash (2,658,814) 182,068Change in unrealized (gain) loss on non-derivative financial assets 29,695,897 (7,413,021)Change in unrealized (gain) loss on option contracts (472,592) –Change in unrealized (gain) loss on currency forward contracts 3,546,924 (27,321)Change in unrealized (gain) loss on currency spot contracts (6,151) (1,137)Purchases of non-derivative financial assets (814,943,315) (257,902,984)Proceeds from sale of non-derivative financial assets 540,572,105 101,577,484Transaction costs 872,037 250,926Accrued investment income and other (100,428) (164,105)Accrued expenses 178,377 88,283
Net cash provided by (used in) operating activities (277,000,376) (153,364,703)CASH FLOWS FROM FINANCING ACTIVITIESProceeds from issue of redeemable units 474,758,036 248,050,370Amounts paid on redemption of redeemable units (208,993,015) (82,602,467)Distributions to unitholders of redeemable units (466,233) (371,278)
Net cash provided by (used in) financing activities 265,298,788 165,076,625Change in unrealized gain (loss) on foreign exchange of cash 2,658,814 (182,068)Net increase (decrease) in cash (11,701,588) 11,711,922Cash (bank overdraft), beginning of period 79,542,173 34,455,843
CASH (BANK OVERDRAFT), END OF PERIOD $ 70,499,399 $ 45,985,697
Interest received(1) 1,300 1,658Dividends received, net of withholding taxes(1) 12,903,646 9,494,219
(1) Classified as operating items.
SCHEDULE OF INVESTMENT PORTFOLIOAs at June 30, 2015
Numberof Shares Issuer
AverageCost ($)
CarryingValue ($)
EQUITIES – 95.5%Energy – 4.6%
247,200 Anadarko Petroleum Corporation 23,667,046 24,100,356296,010 Occidental Petroleum Corporation 27,607,639 28,746,247172,400 Schlumberger Limited 15,872,540 18,554,096
67,147,225 71,400,699
Materials – 2.3%289,800 International Paper Company 15,573,629 17,225,052336,900 Nucor Corporation 15,752,255 18,537,137
31,325,884 35,762,189
Industrials – 20.3%197,700 3M Co. 40,746,452 38,085,899203,700 Boeing Company, The 32,592,967 35,284,391380,540 Danaher Corporation 31,230,796 40,659,942368,800 Deere & Company 41,186,008 44,702,610866,400 General Electric Company 20,086,206 28,751,231263,440 Honeywell International Inc. 24,125,025 33,545,687274,400 Rockwell Collins, Inc. 30,774,008 31,649,544189,600 Stanley Black & Decker Inc. 17,003,601 24,915,089296,100 Union Pacific Corporation 29,794,452 35,263,736
267,539,515 312,858,129
Consumer Discretionary – 15.5%39,300 AutoZone, Inc. 30,606,394 32,712,451
447,410 Comcast Corporation, Class A 21,638,724 33,614,284315,900 DIRECTV 26,608,770 36,609,791207,490 Home Depot Inc., The 21,048,497 28,789,766183,600 LVMH Moet Hennessy Louis Vuitton SA 41,071,255 40,135,953417,000 Viacom Inc., Class B 31,807,085 33,665,405233,300 Walt Disney Company, The 31,906,107 33,246,569
204,686,832 238,774,219
Consumer Staples – 8.5%310,860 CVS Caremark Corporation 23,042,346 40,709,935579,700 Nestle SA 52,253,379 52,321,847724,400 Unilever NV 39,358,570 37,807,848
114,654,295 130,839,630
Health Care – 8.4%185,700 Cardinal Health, Inc. 10,388,073 19,401,008246,270 Johnson & Johnson 26,699,608 29,964,434430,300 Merck & Co., Inc. 25,683,766 30,582,164733,500 Pfizer Inc. 23,819,314 30,703,352245,700 Teva Pharmaceutical Industries Ltd. 15,141,720 18,140,502
101,732,481 128,791,460
Financials – 12.8%185,100 Aflac, Inc. 9,290,980 14,376,014217,100 Capital One Financial Corporation 20,932,435 23,846,103145,460 Chubb Corporation, The 12,127,405 17,277,996331,200 Citigroup Inc. 16,103,852 22,850,223832,000 Fifth Third Bancorp 15,383,330 21,634,681281,700 JPMorgan Chase & Co. 14,379,286 23,840,024232,075 Portfolio Recovery Associates, Inc. 15,325,104 18,060,616568,600 Progressive Corporation, The 19,719,898 19,763,620352,300 U.S. Bancorp 14,133,147 19,096,282247,300 Wells Fargo & Company 8,831,635 17,378,364
146,227,072 198,123,923
Information Technology – 23.1%392,900 Apple Inc. 48,675,126 61,547,807226,840 Automatic Data Processing, Inc. 16,785,741 22,730,180374,000 Check Point Software Technologies Ltd. 36,867,349 37,158,505
1,232,000 EMC Corporation 37,545,839 40,606,592525,000 Fidelity National Information Service, Inc. 40,260,228 40,522,31337,900 Google Inc. Class A 27,699,270 25,562,986
For equities, all common shares unless otherwise noted.The accompanying notes are an integral part of the financial statements.
169
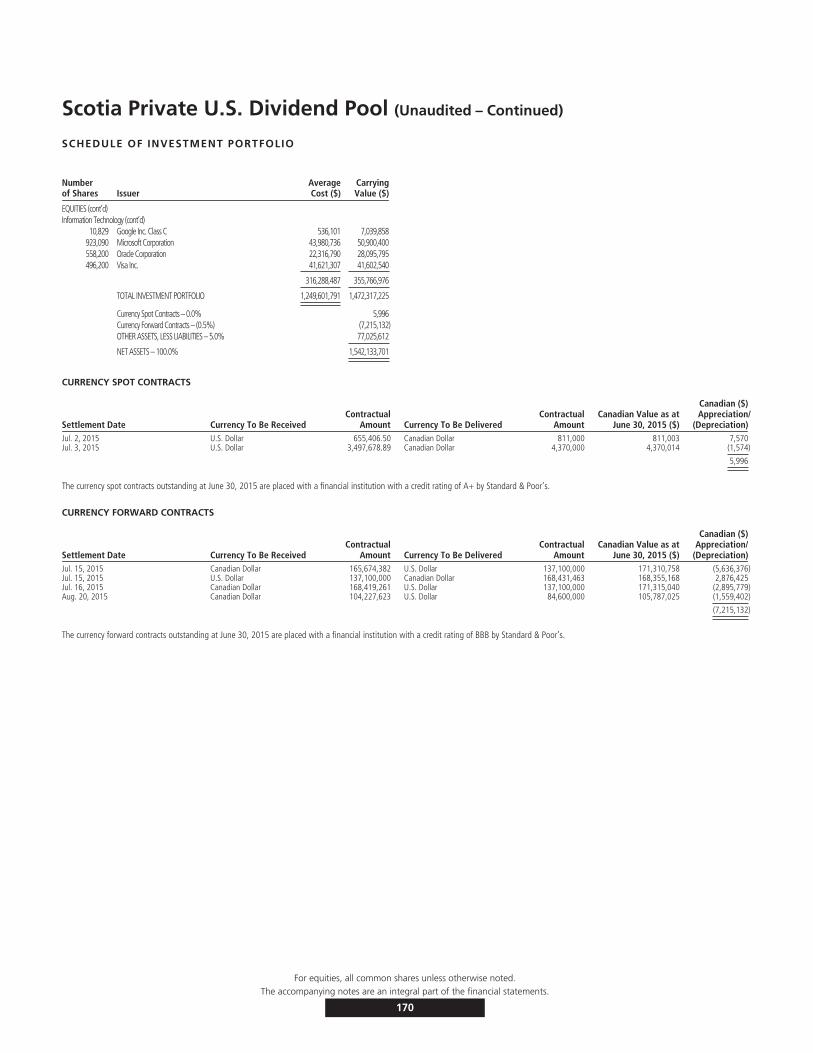
Scotia Private U.S. Dividend Pool (Unaudited – Continued)
SCHEDULE OF INVESTMENT PORTFOLIO
Numberof Shares Issuer
AverageCost ($)
CarryingValue ($)
EQUITIES (cont’d)Information Technology (cont’d)
10,829 Google Inc. Class C 536,101 7,039,858923,090 Microsoft Corporation 43,980,736 50,900,400558,200 Oracle Corporation 22,316,790 28,095,795496,200 Visa Inc. 41,621,307 41,602,540
316,288,487 355,766,976
TOTAL INVESTMENT PORTFOLIO 1,249,601,791 1,472,317,225
Currency Spot Contracts – 0.0% 5,996Currency Forward Contracts – (0.5%) (7,215,132)OTHER ASSETS, LESS LIABILITIES – 5.0% 77,025,612
NET ASSETS – 100.0% 1,542,133,701
CURRENCY SPOT CONTRACTS
Settlement Date Currency To Be ReceivedContractual
Amount Currency To Be DeliveredContractual
AmountCanadian Value as at
June 30, 2015 ($)
Canadian ($)Appreciation/
(Depreciation)Jul. 2, 2015 U.S. Dollar 655,406.50 Canadian Dollar 811,000 811,003 7,570Jul. 3, 2015 U.S. Dollar 3,497,678.89 Canadian Dollar 4,370,000 4,370,014 (1,574)
5,996
The currency spot contracts outstanding at June 30, 2015 are placed with a financial institution with a credit rating of A+ by Standard & Poor’s.
CURRENCY FORWARD CONTRACTS
Settlement Date Currency To Be ReceivedContractual
Amount Currency To Be DeliveredContractual
AmountCanadian Value as at
June 30, 2015 ($)
Canadian ($)Appreciation/
(Depreciation)Jul. 15, 2015 Canadian Dollar 165,674,382 U.S. Dollar 137,100,000 171,310,758 (5,636,376)Jul. 15, 2015 U.S. Dollar 137,100,000 Canadian Dollar 168,431,463 168,355,168 2,876,425Jul. 16, 2015 Canadian Dollar 168,419,261 U.S. Dollar 137,100,000 171,315,040 (2,895,779)Aug. 20, 2015 Canadian Dollar 104,227,623 U.S. Dollar 84,600,000 105,787,025 (1,559,402)
(7,215,132)
The currency forward contracts outstanding at June 30, 2015 are placed with a financial institution with a credit rating of BBB by Standard & Poor’s.
For equities, all common shares unless otherwise noted.The accompanying notes are an integral part of the financial statements.
170
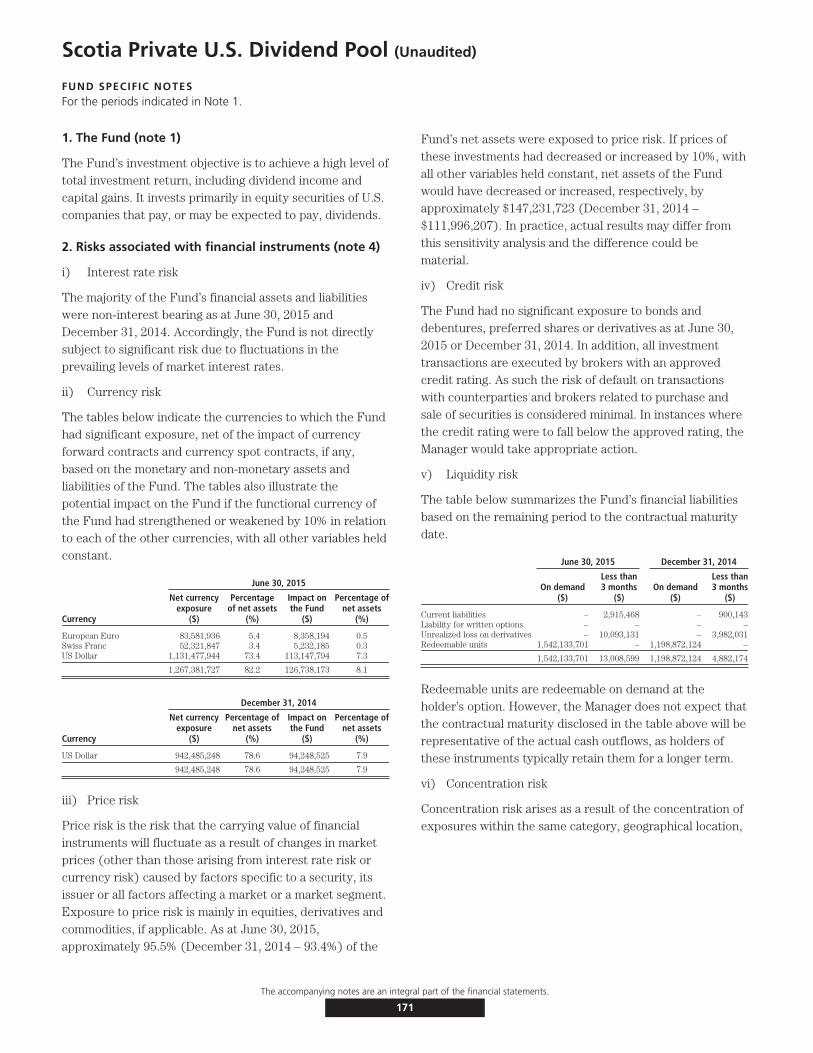
Scotia Private U.S. Dividend Pool (Unaudited)
FUND SPECIFIC NOTESFor the periods indicated in Note 1.
1. The Fund (note 1)
The Fund’s investment objective is to achieve a high level oftotal investment return, including dividend income andcapital gains. It invests primarily in equity securities of U.S.companies that pay, or may be expected to pay, dividends.
2. Risks associated with financial instruments (note 4)
i) Interest rate risk
The majority of the Fund’s financial assets and liabilitieswere non-interest bearing as at June 30, 2015 andDecember 31, 2014. Accordingly, the Fund is not directlysubject to significant risk due to fluctuations in theprevailing levels of market interest rates.
ii) Currency risk
The tables below indicate the currencies to which the Fundhad significant exposure, net of the impact of currencyforward contracts and currency spot contracts, if any,based on the monetary and non-monetary assets andliabilities of the Fund. The tables also illustrate thepotential impact on the Fund if the functional currency ofthe Fund had strengthened or weakened by 10% in relationto each of the other currencies, with all other variables heldconstant.
June 30, 2015
Currency
Net currencyexposure
($)
Percentageof net assets
(%)
Impact onthe Fund
($)
Percentage ofnet assets
(%)
European Euro 83,581,936 5.4 8,358,194 0.5Swiss Franc 52,321,847 3.4 5,232,185 0.3US Dollar 1,131,477,944 73.4 113,147,794 7.3
1,267,381,727 82.2 126,738,173 8.1
December 31, 2014
Currency
Net currencyexposure
($)
Percentage ofnet assets
(%)
Impact onthe Fund
($)
Percentage ofnet assets
(%)
US Dollar 942,485,248 78.6 94,248,525 7.9
942,485,248 78.6 94,248,525 7.9
iii) Price risk
Price risk is the risk that the carrying value of financialinstruments will fluctuate as a result of changes in marketprices (other than those arising from interest rate risk orcurrency risk) caused by factors specific to a security, itsissuer or all factors affecting a market or a market segment.Exposure to price risk is mainly in equities, derivatives andcommodities, if applicable. As at June 30, 2015,approximately 95.5% (December 31, 2014 – 93.4%) of the
Fund’s net assets were exposed to price risk. If prices ofthese investments had decreased or increased by 10%, withall other variables held constant, net assets of the Fundwould have decreased or increased, respectively, byapproximately $147,231,723 (December 31, 2014 –$111,996,207). In practice, actual results may differ fromthis sensitivity analysis and the difference could bematerial.
iv) Credit risk
The Fund had no significant exposure to bonds anddebentures, preferred shares or derivatives as at June 30,2015 or December 31, 2014. In addition, all investmenttransactions are executed by brokers with an approvedcredit rating. As such the risk of default on transactionswith counterparties and brokers related to purchase andsale of securities is considered minimal. In instances wherethe credit rating were to fall below the approved rating, theManager would take appropriate action.
v) Liquidity risk
The table below summarizes the Fund’s financial liabilitiesbased on the remaining period to the contractual maturitydate.
June 30, 2015 December 31, 2014
On demand($)
Less than3 months
($)On demand
($)
Less than3 months
($)
Current liabilities – 2,915,468 – 900,143Liability for written options – – – –Unrealized loss on derivatives – 10,093,131 – 3,982,031Redeemable units 1,542,133,701 – 1,198,872,124 –
1,542,133,701 13,008,599 1,198,872,124 4,882,174
Redeemable units are redeemable on demand at theholder’s option. However, the Manager does not expect thatthe contractual maturity disclosed in the table above will berepresentative of the actual cash outflows, as holders ofthese instruments typically retain them for a longer term.
vi) Concentration risk
Concentration risk arises as a result of the concentration ofexposures within the same category, geographical location,
The accompanying notes are an integral part of the financial statements.
171

Scotia Private U.S. Dividend Pool (Unaudited – Continued)
FUND SPECIFIC NOTESFor the periods indicated in Note 1.
asset type or industry sector, as applicable. The table belowis a summary of the Fund’s concentration risk:
Percentage of net assets (%)
June 30, 2015 December 31, 2014
Consumer Discretionary 15.5 13.7Consumer Staples 8.5 6.9Energy 4.6 9.1Financials 12.8 13.1Health Care 8.4 16.4Industrials 20.3 11.5Information Technology 23.1 16.5Materials 2.3 5.1Telecommunication Services – 1.1
vii) Fair value classification (note 2)
The tables below illustrate the classification of the Fund’sfinancial instruments within the fair value hierarchy.
June 30, 2015Level 1
($)Level 2
($)Level 3
($)Total($)
Equities 1,342,051,577 130,265,648 – 1,472,317,225Currency forward contracts–assets – 2,876,425 – 2,876,425Currency spot contracts–assets 7,570 – – 7,570
1,342,059,147 133,142,073 – 1,475,201,220
Currency forward contracts–liabilities – (10,091,557) – (10,091,557)
Currency spot contracts–liabilities (1,574) – – (1,574)
1,342,057,573 123,050,516 – 1,465,108,089
December 31, 2014Level 1
($)Level 2
($)Level 3
($)Total($)
Equities 1,119,826,133 – – 1,119,826,133Warrants, rights and options 135,935 – – 135,935Currency forward contracts–assets – 313,668 – 313,668
1,119,962,068 313,668 – 1,120,275,736
Currency forward contracts–liabilities – (3,981,876) – (3,981,876)
Currency spot contracts–liabilities (155) – – (155)
1,119,961,913 (3,668,208) – 1,116,293,705
Transfers between levels
During the periods ended June 30, 2015 and December 31,2014, there were no significant transfers between Level 1and Level 2.
3. Offsetting of financial assets and liabilities (note 2)
The following table presents offsetting of financial assetsand liabilities and collateral amounts that would occur iffuture events, such as bankruptcy or termination ofcontracts were to arise. No amounts were offset in thefinancial statements.
June 30, 2015
Financial assets – by type
Gross amountof assets
($)
Master nettingoffset
($)
Collateralpledged
($)Net Amount
($)
Currency forward contracts 2,876,425 (2,876,425) – –Options contracts – OTC – – – –Swap contracts – – – –
2,876,425 (2,876,425) – –
Financial liabilities – by type
Gross amountof liabilities
($)
Master nettingoffset
($)
Collateralpledged
($)Net Amount
($)
Currency forward contracts 10,091,557 (2,876,425) – 7,215,132Options contracts – OTC – – – –Swap contracts – – – –
10,091,557 (2,876,425) – 7,215,132
December 31, 2014
Financial assets – by type
Gross amountof assets
($)
Master nettingoffset
($)
Collateralpledged
($)Net Amount
($)
Currency forward contracts 313,668 – – 313,668Options contracts – OTC – – – –Swap contracts – – – –
313,668 – – 313,668
Financial liabilities – by type
Gross amountof liabilities
($)
Master nettingoffset
($)
Collateralpledged
($)Net Amount
($)
Currency forward contracts 3,981,876 – – 3,981,876Options contracts – OTC – – – –Swap contracts – – – –
3,981,876 – – 3,981,876
4. Interest in Underlying Funds (note 2)
The Fund did not hold any interest in Underlying Funds asat June 30, 2015 or December 31, 2014.
5. Comparison of net asset value per unit and netassets per unit (note 2)
The table below provides a comparison of the net assetvalue per unit and net assets per unit. The primary reasonfor the difference between the net asset value per unit andnet assets per unit, if any, is described in note 2.
June 30, 2015 December 31, 2014
Net asset valueper unit
($)
Net assetsper unit
($)
Net asset valueper unit
($)
Net assetsper unit
($)
Series I 18.14 18.14 16.13 16.13
Series M 16.97 16.97 17.25 17.25
The accompanying notes are an integral part of the financial statements.
172

Scotia Private U.S. Equity Pool (Unaudited)
STATEMENTS OF FINANCIAL POSITIONAs at
June 30,2015
December 31,2014
ASSETSCurrent assetsInvestments
Non-derivative financial assets $396,949,022 $350,693,312Cash 10,880,406 14,456,307Receivable for securities sold 2,788,387 –Subscriptions receivable 1,457,381 476,351Accrued investment income and other 205,240 379,516
412,280,436 366,005,486
LIABILITIESCurrent liabilitiesManagement fee payable 39,350 –Payable for securities purchased 1,536,111 –Redemptions payable 1,126,236 509,948Accrued expenses 8,058 –
2,709,755 509,948
Net assets attributable to holders of redeemable units $409,570,681 $365,495,538
NET ASSETS ATTRIBUTABLE TO HOLDERS OF REDEEMABLE UNITSPER SERIES
Series I $ 6,098,349 $ 5,627,368Series M $403,472,332 $359,868,170
NET ASSETS ATTRIBUTABLE TO HOLDERS OF REDEEMABLE UNITSPER UNIT
Series I $ 11.58 $ 10.41Series M $ 11.74 $ 10.55
STATEMENTS OF COMPREHENSIVE INCOMEFor the six month periods ended June 30,
2015 2014INCOMENet gain (loss) on investments (note 2)
Dividends $ 2,862,850 $ 2,340,362Interest for distribution purposes 6,542 7,240Net realized gain (loss) on non-derivative financial assets 64,959,455 77,585,159Net realized and change in unrealized gain (loss) on foreign exchange 1,302,670 314,723Change in unrealized gain (loss) on non-derivative financial assets (31,940,377) (59,321,541)
Net gain (loss) on investments 37,191,140 20,925,943Securities lending 1,153 2,542Net realized and change in unrealized gain (loss) on foreign exchange
of cash 4,427,733 –
Total income (loss) 41,620,026 20,928,485
EXPENSESManagement fees (note 5) 194,876 160,468Fixed administration fees (note 6) 39,579 –Independent Review Committee fees 291 553Interest expense and bank overdraft charges – 6Foreign withholding taxes/tax reclaims 207,543 389,080Audit fees – 4,039Custodian fees – 5,462Filing fees – 6,215Legal fees – 1,163Unitholder administration costs – 24,439Unitholder reporting costs – 2,957Harmonized Sales Tax/Goods and Services Tax 26,026 20,769Transaction costs 353,450 674,495
Total expenses 821,765 1,289,646
Increase (decrease) in net assets attributable to holders of redeemableunits from operations $ 40,798,261 $ 19,638,839
INCREASE (DECREASE) IN NET ASSETS ATTRIBUTABLE TO HOLDERS OFREDEEMABLE UNITS FROM OPERATIONS PER SERIES
Series I $ 628,981 $ 3,565,289Series M $ 40,169,280 $ 16,073,550
INCREASE (DECREASE) IN NET ASSETS ATTRIBUTABLE TO HOLDERS OFREDEEMABLE UNITS FROM OPERATIONS PER UNIT†
Series I $ 1.17 $ 0.84Series M $ 1.18 $ 0.56
WEIGHTED AVERAGE NUMBER OF UNITS PER SERIESSeries I 535,957 4,229,037Series M 34,149,233 28,735,469
† The increase (decrease) in net assets attributable to holders of redeemable units fromoperations per unit is calculated by dividing the increase (decrease) in net assetsattributable to holders of redeemable units from operations per series by the weightedaverage number of units per series.
The accompanying notes are an integral part of the financial statements.
173
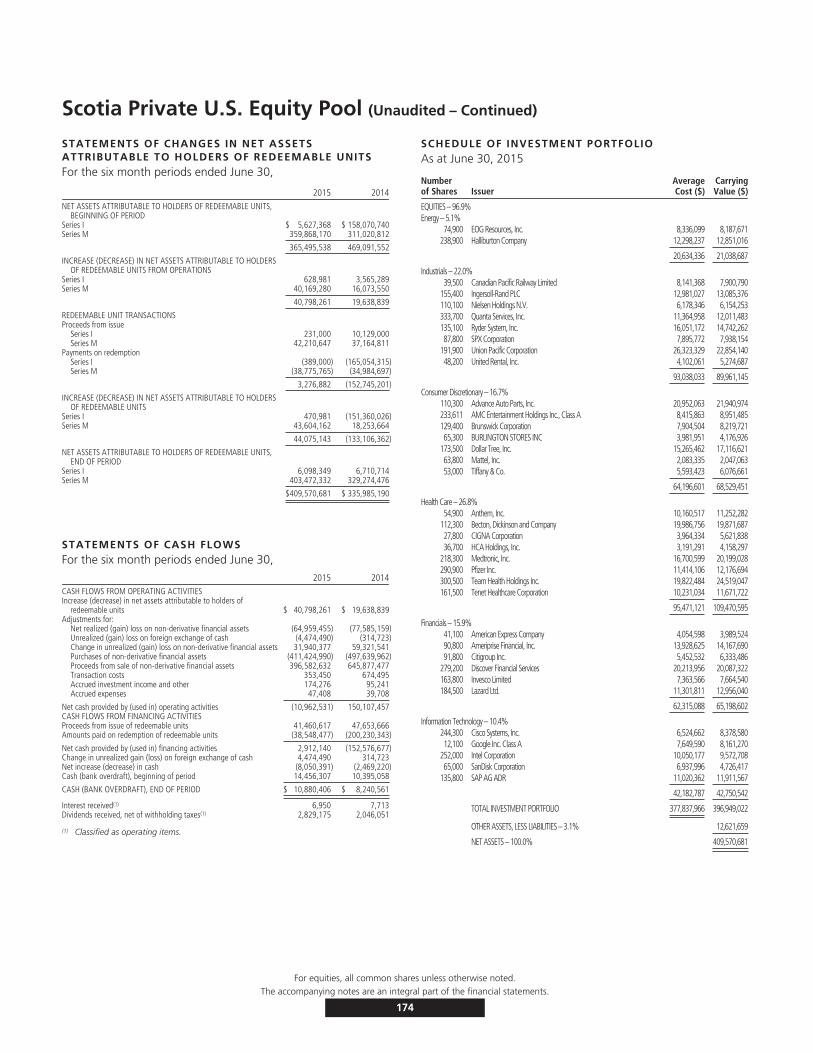
Scotia Private U.S. Equity Pool (Unaudited – Continued)
STATEMENTS OF CHANGES IN NET ASSETSATTRIBUTABLE TO HOLDERS OF REDEEMABLE UNITSFor the six month periods ended June 30,
2015 2014NET ASSETS ATTRIBUTABLE TO HOLDERS OF REDEEMABLE UNITS,
BEGINNING OF PERIODSeries I $ 5,627,368 $ 158,070,740Series M 359,868,170 311,020,812
365,495,538 469,091,552
INCREASE (DECREASE) IN NET ASSETS ATTRIBUTABLE TO HOLDERSOF REDEEMABLE UNITS FROM OPERATIONS
Series I 628,981 3,565,289Series M 40,169,280 16,073,550
40,798,261 19,638,839
REDEEMABLE UNIT TRANSACTIONSProceeds from issue
Series I 231,000 10,129,000Series M 42,210,647 37,164,811
Payments on redemptionSeries I (389,000) (165,054,315)Series M (38,775,765) (34,984,697)
3,276,882 (152,745,201)
INCREASE (DECREASE) IN NET ASSETS ATTRIBUTABLE TO HOLDERSOF REDEEMABLE UNITS
Series I 470,981 (151,360,026)Series M 43,604,162 18,253,664
44,075,143 (133,106,362)
NET ASSETS ATTRIBUTABLE TO HOLDERS OF REDEEMABLE UNITS,END OF PERIOD
Series I 6,098,349 6,710,714Series M 403,472,332 329,274,476
$409,570,681 $ 335,985,190
STATEMENTS OF CASH FLOWSFor the six month periods ended June 30,
2015 2014CASH FLOWS FROM OPERATING ACTIVITIESIncrease (decrease) in net assets attributable to holders of
redeemable units $ 40,798,261 $ 19,638,839Adjustments for:
Net realized (gain) loss on non-derivative financial assets (64,959,455) (77,585,159)Unrealized (gain) loss on foreign exchange of cash (4,474,490) (314,723)Change in unrealized (gain) loss on non-derivative financial assets 31,940,377 59,321,541Purchases of non-derivative financial assets (411,424,990) (497,639,962)Proceeds from sale of non-derivative financial assets 396,582,632 645,877,477Transaction costs 353,450 674,495Accrued investment income and other 174,276 95,241Accrued expenses 47,408 39,708
Net cash provided by (used in) operating activities (10,962,531) 150,107,457CASH FLOWS FROM FINANCING ACTIVITIESProceeds from issue of redeemable units 41,460,617 47,653,666Amounts paid on redemption of redeemable units (38,548,477) (200,230,343)
Net cash provided by (used in) financing activities 2,912,140 (152,576,677)Change in unrealized gain (loss) on foreign exchange of cash 4,474,490 314,723Net increase (decrease) in cash (8,050,391) (2,469,220)Cash (bank overdraft), beginning of period 14,456,307 10,395,058
CASH (BANK OVERDRAFT), END OF PERIOD $ 10,880,406 $ 8,240,561
Interest received(1) 6,950 7,713Dividends received, net of withholding taxes(1) 2,829,175 2,046,051
(1) Classified as operating items.
SCHEDULE OF INVESTMENT PORTFOLIOAs at June 30, 2015
Numberof Shares Issuer
AverageCost ($)
CarryingValue ($)
EQUITIES – 96.9%Energy – 5.1%
74,900 EOG Resources, Inc. 8,336,099 8,187,671238,900 Halliburton Company 12,298,237 12,851,016
20,634,336 21,038,687
Industrials – 22.0%39,500 Canadian Pacific Railway Limited 8,141,368 7,900,790
155,400 Ingersoll-Rand PLC 12,981,027 13,085,376110,100 Nielsen Holdings N.V. 6,178,346 6,154,253333,700 Quanta Services, Inc. 11,364,958 12,011,483135,100 Ryder System, Inc. 16,051,172 14,742,26287,800 SPX Corporation 7,895,772 7,938,154
191,900 Union Pacific Corporation 26,323,329 22,854,14048,200 United Rental, Inc. 4,102,061 5,274,687
93,038,033 89,961,145
Consumer Discretionary – 16.7%110,300 Advance Auto Parts, Inc. 20,952,063 21,940,974233,611 AMC Entertainment Holdings Inc., Class A 8,415,863 8,951,485129,400 Brunswick Corporation 7,904,504 8,219,72165,300 BURLINGTON STORES INC 3,981,951 4,176,926
173,500 Dollar Tree, Inc. 15,265,462 17,116,62163,800 Mattel, Inc. 2,083,335 2,047,06353,000 Tiffany & Co. 5,593,423 6,076,661
64,196,601 68,529,451
Health Care – 26.8%54,900 Anthem, Inc. 10,160,517 11,252,282
112,300 Becton, Dickinson and Company 19,986,756 19,871,68727,800 CIGNA Corporation 3,964,334 5,621,83836,700 HCA Holdings, Inc. 3,191,291 4,158,297
218,300 Medtronic, Inc. 16,700,599 20,199,028290,900 Pfizer Inc. 11,414,106 12,176,694300,500 Team Health Holdings Inc. 19,822,484 24,519,047161,500 Tenet Healthcare Corporation 10,231,034 11,671,722
95,471,121 109,470,595
Financials – 15.9%41,100 American Express Company 4,054,598 3,989,52490,800 Ameriprise Financial, Inc. 13,928,625 14,167,69091,800 Citigroup Inc. 5,452,532 6,333,486
279,200 Discover Financial Services 20,213,956 20,087,322163,800 Invesco Limited 7,363,566 7,664,540184,500 Lazard Ltd. 11,301,811 12,956,040
62,315,088 65,198,602
Information Technology – 10.4%244,300 Cisco Systems, Inc. 6,524,662 8,378,58012,100 Google Inc. Class A 7,649,590 8,161,270
252,000 Intel Corporation 10,050,177 9,572,70865,000 SanDisk Corporation 6,937,996 4,726,417
135,800 SAP AG ADR 11,020,362 11,911,567
42,182,787 42,750,542
TOTAL INVESTMENT PORTFOLIO 377,837,966 396,949,022
OTHER ASSETS, LESS LIABILITIES – 3.1% 12,621,659
NET ASSETS – 100.0% 409,570,681
For equities, all common shares unless otherwise noted.The accompanying notes are an integral part of the financial statements.
174
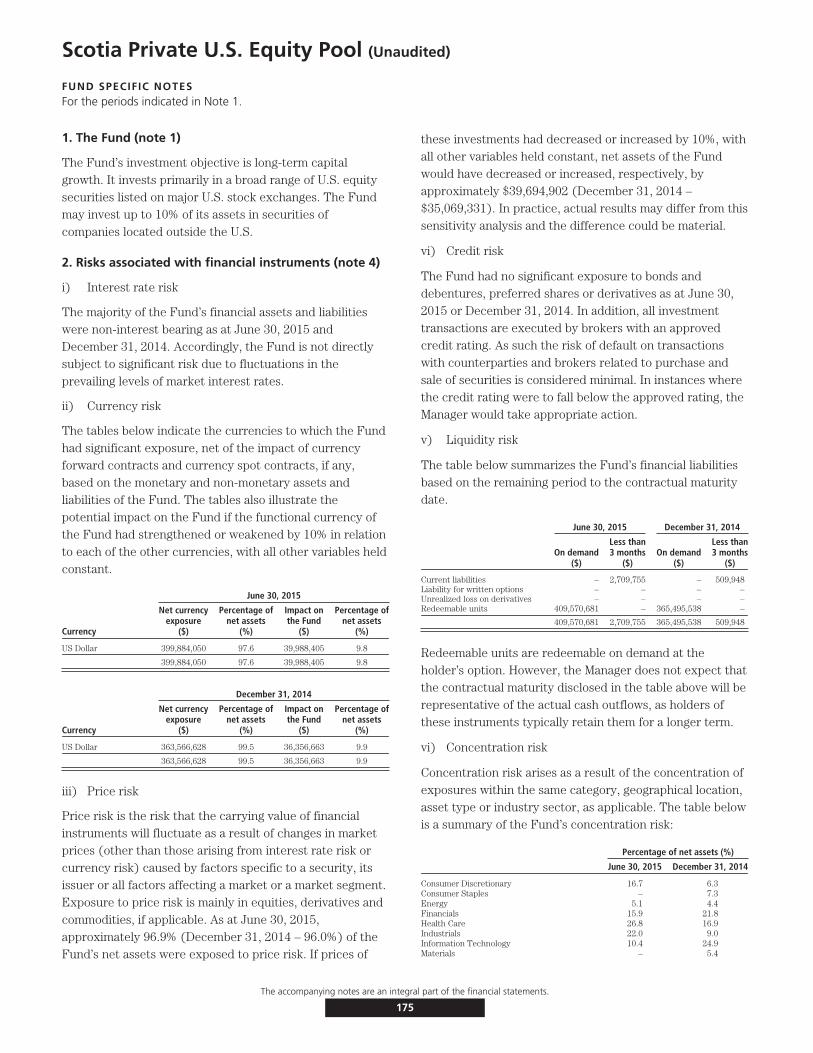
Scotia Private U.S. Equity Pool (Unaudited)
FUND SPECIFIC NOTESFor the periods indicated in Note 1.
1. The Fund (note 1)
The Fund’s investment objective is long-term capitalgrowth. It invests primarily in a broad range of U.S. equitysecurities listed on major U.S. stock exchanges. The Fundmay invest up to 10% of its assets in securities ofcompanies located outside the U.S.
2. Risks associated with financial instruments (note 4)
i) Interest rate risk
The majority of the Fund’s financial assets and liabilitieswere non-interest bearing as at June 30, 2015 andDecember 31, 2014. Accordingly, the Fund is not directlysubject to significant risk due to fluctuations in theprevailing levels of market interest rates.
ii) Currency risk
The tables below indicate the currencies to which the Fundhad significant exposure, net of the impact of currencyforward contracts and currency spot contracts, if any,based on the monetary and non-monetary assets andliabilities of the Fund. The tables also illustrate thepotential impact on the Fund if the functional currency ofthe Fund had strengthened or weakened by 10% in relationto each of the other currencies, with all other variables heldconstant.
June 30, 2015
Currency
Net currencyexposure
($)
Percentage ofnet assets
(%)
Impact onthe Fund
($)
Percentage ofnet assets
(%)
US Dollar 399,884,050 97.6 39,988,405 9.8
399,884,050 97.6 39,988,405 9.8
December 31, 2014
Currency
Net currencyexposure
($)
Percentage ofnet assets
(%)
Impact onthe Fund
($)
Percentage ofnet assets
(%)
US Dollar 363,566,628 99.5 36,356,663 9.9
363,566,628 99.5 36,356,663 9.9
iii) Price risk
Price risk is the risk that the carrying value of financialinstruments will fluctuate as a result of changes in marketprices (other than those arising from interest rate risk orcurrency risk) caused by factors specific to a security, itsissuer or all factors affecting a market or a market segment.Exposure to price risk is mainly in equities, derivatives andcommodities, if applicable. As at June 30, 2015,approximately 96.9% (December 31, 2014 – 96.0%) of theFund’s net assets were exposed to price risk. If prices of
these investments had decreased or increased by 10%, withall other variables held constant, net assets of the Fundwould have decreased or increased, respectively, byapproximately $39,694,902 (December 31, 2014 –$35,069,331). In practice, actual results may differ from thissensitivity analysis and the difference could be material.
vi) Credit risk
The Fund had no significant exposure to bonds anddebentures, preferred shares or derivatives as at June 30,2015 or December 31, 2014. In addition, all investmenttransactions are executed by brokers with an approvedcredit rating. As such the risk of default on transactionswith counterparties and brokers related to purchase andsale of securities is considered minimal. In instances wherethe credit rating were to fall below the approved rating, theManager would take appropriate action.
v) Liquidity risk
The table below summarizes the Fund’s financial liabilitiesbased on the remaining period to the contractual maturitydate.
June 30, 2015 December 31, 2014
On demand($)
Less than3 months
($)On demand
($)
Less than3 months
($)
Current liabilities – 2,709,755 – 509,948Liability for written options – – – –Unrealized loss on derivatives – – – –Redeemable units 409,570,681 – 365,495,538 –
409,570,681 2,709,755 365,495,538 509,948
Redeemable units are redeemable on demand at theholder’s option. However, the Manager does not expect thatthe contractual maturity disclosed in the table above will berepresentative of the actual cash outflows, as holders ofthese instruments typically retain them for a longer term.
vi) Concentration risk
Concentration risk arises as a result of the concentration ofexposures within the same category, geographical location,asset type or industry sector, as applicable. The table belowis a summary of the Fund’s concentration risk:
Percentage of net assets (%)
June 30, 2015 December 31, 2014
Consumer Discretionary 16.7 6.3Consumer Staples – 7.3Energy 5.1 4.4Financials 15.9 21.8Health Care 26.8 16.9Industrials 22.0 9.0Information Technology 10.4 24.9Materials – 5.4
The accompanying notes are an integral part of the financial statements.
175

Scotia Private U.S. Equity Pool (Unaudited – Continued)
FUND SPECIFIC NOTESFor the periods indicated in Note 1.
vii) Fair value classification (note 2)
The tables below illustrate the classification of the Fund’sfinancial instruments within the fair value hierarchy.
June 30, 2015Level 1
($)Level 2
($)Level 3
($)Total($)
Equities 396,949,022 – – 396,949,022
396,949,022 – – 396,949,022
December 31, 2014Level 1
($)Level 2
($)Level 3
($)Total($)
Equities 350,693,312 – – 350,693,312
350,693,312 – – 350,693,312
Transfers between levels
During the periods ended June 30, 2015 and December 31,2014, there were no significant transfers between Level 1and Level 2.
3. Offsetting of financial assets and liabilities (note 2)
As at June 30, 2015 or December 31, 2014, the Fund didnot enter into any agreement whereby the financialinstruments were eligible for offset.
4. Interest in Underlying Funds (note 2)
The Fund did not hold any interest in Underlying Funds asat June 30, 2015 or December 31, 2014.
5. Comparison of net asset value per unit and netassets per unit (note 2)
The table below provides a comparison of the net assetvalue per unit and net assets per unit. The primary reasonfor the difference between the net asset value per unit andnet assets per unit, if any, is described in note 2.
June 30, 2015 December 31, 2014
Net asset valueper unit
($)
Net assetsper unit
($)
Net asset valueper unit
($)
Net assetsper unit
($)
Series I 11.58 11.58 10.41 10.41
Series M 11.74 11.74 10.55 10.55
The accompanying notes are an integral part of the financial statements.
176

Scotia U.S. Blue Chip Fund (Unaudited)
STATEMENTS OF FINANCIAL POSITIONAs at
June 30,2015
December 31,2014
ASSETSCurrent assetsInvestments
Non-derivative financial assets $40,343,294 $34,699,792Unrealized gain on currency forward contracts 312,525 27,166Unrealized gain on swap contracts – 4,074
Cash 4,327,236 1,845,507Subscriptions receivable 186,021 31,306Accrued investment income and other 33,504 38,829
45,202,580 36,646,674
LIABILITIESCurrent liabilitiesManagement fee payable 85,960 –Redemptions payable 16,171 25,981Accrued expenses 10,753 –Unrealized loss on currency forward contracts 348,754 38,366Unrealized loss on swap contracts 74,077
535,715 64,347
Net assets attributable to holders ofredeemable units $44,666,865 $36,582,327
NET ASSETS ATTRIBUTABLE TO HOLDERS OF REDEEMABLE UNITSPER SERIES
Series A $44,659,080 $36,582,024Series F $ 7,785 $ 303
NET ASSETS ATTRIBUTABLE TO HOLDERS OF REDEEMABLE UNITSPER UNIT
Series A $ 10.96 $ 9.74Series F $ 11.04 $ 9.75
STATEMENTS OF COMPREHENSIVE INCOMEFor the six month periods ended June 30,
2015 2014INCOMENet gain (loss) on investments (note 2)
Dividends $ 280,023 $ 238,738Interest for distribution purposes 5,185 1,931Net realized gain (loss) on non-derivative financial assets 3,071,943 1,923,177Net realized gain (loss) on currency forward contracts (153,452) (218,347)Net realized gain (loss) on swap contracts 291,121 142,593Net realized and change in unrealized gain (loss) on foreign exchange 11,103 28,182Change in unrealized gain (loss) on non-derivative financial assets 1,709,569 (386,256)Change in unrealized gain (loss) on currency forward contracts (25,029) 192,607Change in unrealized gain (loss) on swap contracts (78,151) (35,382)
Net gain (loss) on investments 5,112,312 1,887,243Securities lending 148 208
Net realized and change in unrealized gain (loss) on foreign exchange ofcash 195,752 –
Other income 2,572 616
Total income (loss) 5,310,784 1,888,067
EXPENSESManagement fees (note 5) 417,468 339,693Fixed administration fees (note 6) 52,185 –Independent Review Committee fees 31 51Foreign withholding taxes/tax reclaims 47,363 33,541Audit fees – 353Custodian fees – 1,133Filing fees – 7,502Legal fees – 108Unitholder administration costs – 38,821Unitholder reporting costs – 8,255Harmonized Sales Tax/Goods and Services Tax 50,960 42,061Transaction costs 8,774 10,917
Total expenses 576,781 482,435
Increase (decrease) in net assets attributable to holders ofredeemable units from operations $4,734,003 $1,405,632
INCREASE (DECREASE) IN NET ASSETS ATTRIBUTABLE TO HOLDERS OFREDEEMABLE UNITS FROM OPERATIONS PER SERIES
Series A $4,733,741 $1,405,632Series F $ 262 $ –
INCREASE (DECREASE) IN NET ASSETS ATTRIBUTABLE TO HOLDERS OFREDEEMABLE UNITS FROM OPERATIONS PER UNIT†
Series A $ 1.20 $ 0.35Series F $ 0.98 $ –
WEIGHTED AVERAGE NUMBER OF UNITS PER SERIESSeries A 3,942,498 3,963,482Series F 266 –
† The increase (decrease) in net assets attributable to holders of redeemable units fromoperations per unit is calculated by dividing the increase (decrease) in net assetsattributable to holders of redeemable units from operations per series by the weightedaverage number of units per series.
The accompanying notes are an integral part of the financial statements.
177
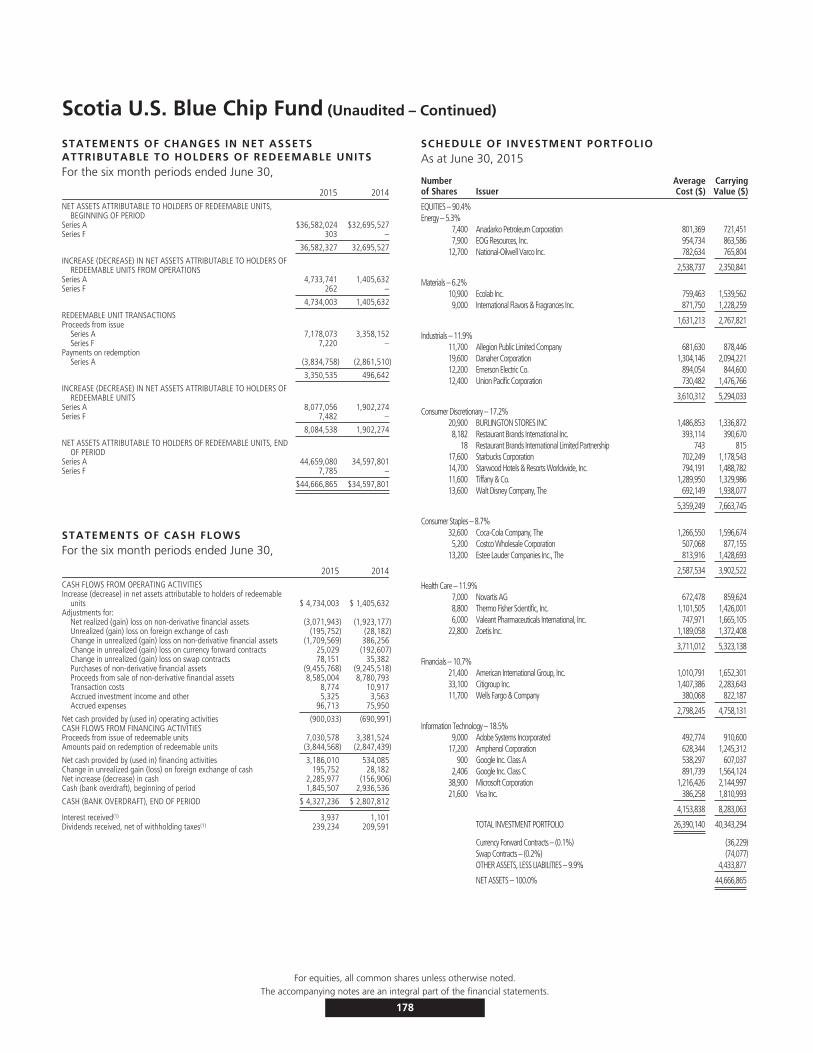
Scotia U.S. Blue Chip Fund (Unaudited – Continued)
STATEMENTS OF CHANGES IN NET ASSETSATTRIBUTABLE TO HOLDERS OF REDEEMABLE UNITSFor the six month periods ended June 30,
2015 2014NET ASSETS ATTRIBUTABLE TO HOLDERS OF REDEEMABLE UNITS,
BEGINNING OF PERIODSeries A $36,582,024 $32,695,527Series F 303 –
36,582,327 32,695,527
INCREASE (DECREASE) IN NET ASSETS ATTRIBUTABLE TO HOLDERS OFREDEEMABLE UNITS FROM OPERATIONS
Series A 4,733,741 1,405,632Series F 262 –
4,734,003 1,405,632
REDEEMABLE UNIT TRANSACTIONSProceeds from issue
Series A 7,178,073 3,358,152Series F 7,220 –
Payments on redemptionSeries A (3,834,758) (2,861,510)
3,350,535 496,642
INCREASE (DECREASE) IN NET ASSETS ATTRIBUTABLE TO HOLDERS OFREDEEMABLE UNITS
Series A 8,077,056 1,902,274Series F 7,482 –
8,084,538 1,902,274
NET ASSETS ATTRIBUTABLE TO HOLDERS OF REDEEMABLE UNITS, ENDOF PERIOD
Series A 44,659,080 34,597,801Series F 7,785 –
$44,666,865 $34,597,801
STATEMENTS OF CASH FLOWSFor the six month periods ended June 30,
2015 2014CASH FLOWS FROM OPERATING ACTIVITIESIncrease (decrease) in net assets attributable to holders of redeemable
units $ 4,734,003 $ 1,405,632Adjustments for:
Net realized (gain) loss on non-derivative financial assets (3,071,943) (1,923,177)Unrealized (gain) loss on foreign exchange of cash (195,752) (28,182)Change in unrealized (gain) loss on non-derivative financial assets (1,709,569) 386,256Change in unrealized (gain) loss on currency forward contracts 25,029 (192,607)Change in unrealized (gain) loss on swap contracts 78,151 35,382Purchases of non-derivative financial assets (9,455,768) (9,245,518)Proceeds from sale of non-derivative financial assets 8,585,004 8,780,793Transaction costs 8,774 10,917Accrued investment income and other 5,325 3,563Accrued expenses 96,713 75,950
Net cash provided by (used in) operating activities (900,033) (690,991)CASH FLOWS FROM FINANCING ACTIVITIESProceeds from issue of redeemable units 7,030,578 3,381,524Amounts paid on redemption of redeemable units (3,844,568) (2,847,439)
Net cash provided by (used in) financing activities 3,186,010 534,085Change in unrealized gain (loss) on foreign exchange of cash 195,752 28,182Net increase (decrease) in cash 2,285,977 (156,906)Cash (bank overdraft), beginning of period 1,845,507 2,936,536
CASH (BANK OVERDRAFT), END OF PERIOD $ 4,327,236 $ 2,807,812
Interest received(1) 3,937 1,101Dividends received, net of withholding taxes(1) 239,234 209,591
SCHEDULE OF INVESTMENT PORTFOLIOAs at June 30, 2015
Numberof Shares Issuer
AverageCost ($)
CarryingValue ($)
EQUITIES – 90.4%Energy – 5.3%
7,400 Anadarko Petroleum Corporation 801,369 721,4517,900 EOG Resources, Inc. 954,734 863,586
12,700 National-Oilwell Varco Inc. 782,634 765,804
2,538,737 2,350,841
Materials – 6.2%10,900 Ecolab Inc. 759,463 1,539,5629,000 International Flavors & Fragrances Inc. 871,750 1,228,259
1,631,213 2,767,821
Industrials – 11.9%11,700 Allegion Public Limited Company 681,630 878,44619,600 Danaher Corporation 1,304,146 2,094,22112,200 Emerson Electric Co. 894,054 844,60012,400 Union Pacific Corporation 730,482 1,476,766
3,610,312 5,294,033
Consumer Discretionary – 17.2%20,900 BURLINGTON STORES INC 1,486,853 1,336,8728,182 Restaurant Brands International Inc. 393,114 390,670
18 Restaurant Brands International Limited Partnership 743 81517,600 Starbucks Corporation 702,249 1,178,54314,700 Starwood Hotels & Resorts Worldwide, Inc. 794,191 1,488,78211,600 Tiffany & Co. 1,289,950 1,329,98613,600 Walt Disney Company, The 692,149 1,938,077
5,359,249 7,663,745
Consumer Staples – 8.7%32,600 Coca-Cola Company, The 1,266,550 1,596,6745,200 Costco Wholesale Corporation 507,068 877,155
13,200 Estee Lauder Companies Inc., The 813,916 1,428,693
2,587,534 3,902,522
Health Care – 11.9%7,000 Novartis AG 672,478 859,6248,800 Thermo Fisher Scientific, Inc. 1,101,505 1,426,0016,000 Valeant Pharmaceuticals International, Inc. 747,971 1,665,105
22,800 Zoetis Inc. 1,189,058 1,372,408
3,711,012 5,323,138
Financials – 10.7%21,400 American International Group, Inc. 1,010,791 1,652,30133,100 Citigroup Inc. 1,407,386 2,283,64311,700 Wells Fargo & Company 380,068 822,187
2,798,245 4,758,131
Information Technology – 18.5%9,000 Adobe Systems Incorporated 492,774 910,600
17,200 Amphenol Corporation 628,344 1,245,312900 Google Inc. Class A 538,297 607,037
2,406 Google Inc. Class C 891,739 1,564,12438,900 Microsoft Corporation 1,216,426 2,144,99721,600 Visa Inc. 386,258 1,810,993
4,153,838 8,283,063
TOTAL INVESTMENT PORTFOLIO 26,390,140 40,343,294
Currency Forward Contracts – (0.1%) (36,229)Swap Contracts – (0.2%) (74,077)OTHER ASSETS, LESS LIABILITIES – 9.9% 4,433,877
NET ASSETS – 100.0% 44,666,865
For equities, all common shares unless otherwise noted.The accompanying notes are an integral part of the financial statements.
178
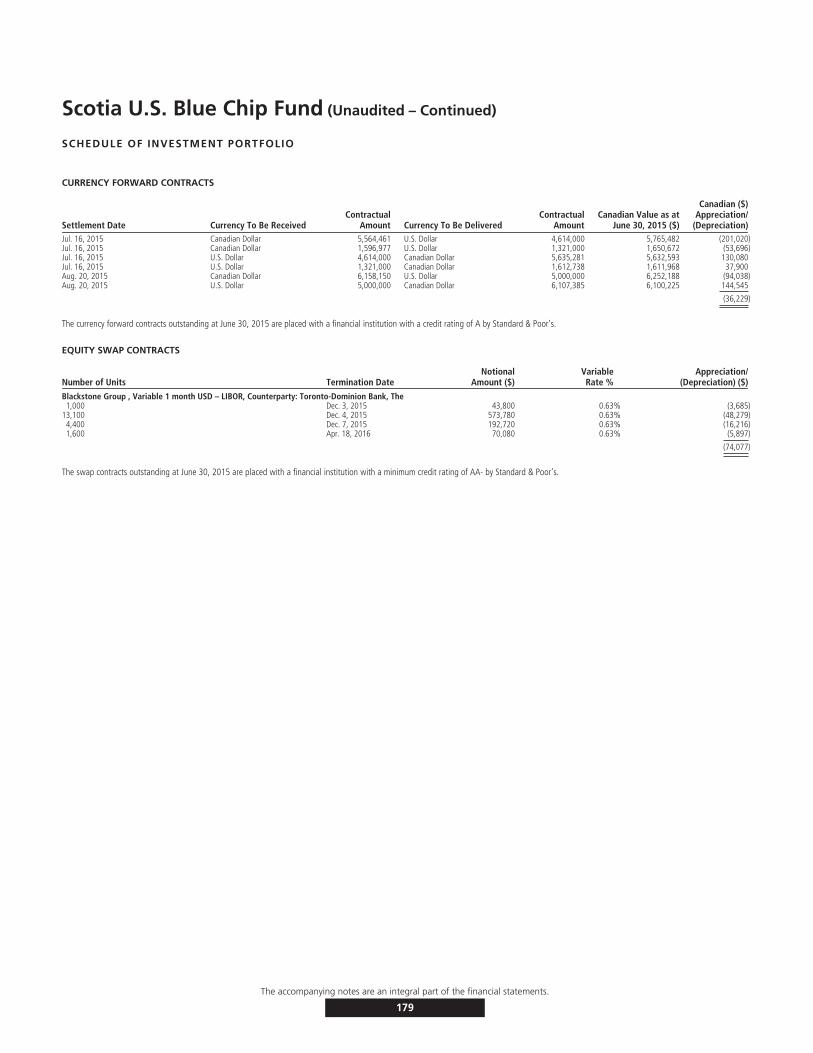
Scotia U.S. Blue Chip Fund (Unaudited – Continued)
SCHEDULE OF INVESTMENT PORTFOLIO
CURRENCY FORWARD CONTRACTS
Settlement Date Currency To Be ReceivedContractual
Amount Currency To Be DeliveredContractual
AmountCanadian Value as at
June 30, 2015 ($)
Canadian ($)Appreciation/
(Depreciation)Jul. 16, 2015 Canadian Dollar 5,564,461 U.S. Dollar 4,614,000 5,765,482 (201,020)Jul. 16, 2015 Canadian Dollar 1,596,977 U.S. Dollar 1,321,000 1,650,672 (53,696)Jul. 16, 2015 U.S. Dollar 4,614,000 Canadian Dollar 5,635,281 5,632,593 130,080Jul. 16, 2015 U.S. Dollar 1,321,000 Canadian Dollar 1,612,738 1,611,968 37,900Aug. 20, 2015 Canadian Dollar 6,158,150 U.S. Dollar 5,000,000 6,252,188 (94,038)Aug. 20, 2015 U.S. Dollar 5,000,000 Canadian Dollar 6,107,385 6,100,225 144,545
(36,229)
The currency forward contracts outstanding at June 30, 2015 are placed with a financial institution with a credit rating of A by Standard & Poor’s.
EQUITY SWAP CONTRACTS
Number of Units Termination DateNotional
Amount ($)VariableRate %
Appreciation/(Depreciation) ($)
Blackstone Group , Variable 1 month USD – LIBOR, Counterparty: Toronto-Dominion Bank, The1,000 Dec. 3, 2015 43,800 0.63% (3,685)
13,100 Dec. 4, 2015 573,780 0.63% (48,279)4,400 Dec. 7, 2015 192,720 0.63% (16,216)1,600 Apr. 18, 2016 70,080 0.63% (5,897)
(74,077)
The swap contracts outstanding at June 30, 2015 are placed with a financial institution with a minimum credit rating of AA- by Standard & Poor’s.
The accompanying notes are an integral part of the financial statements.
179

Scotia U.S. Blue Chip Fund (Unaudited)
FUND SPECIFIC NOTESFor the periods indicated in Note 1.
1. The Fund (note 1)
The Fund’s investment objective is long-term capital growth.It invests primarily in a broad range of U.S. equity securities.
2. Risks associated with financial instruments (note 4)
i) Interest rate risk
The Fund invests in swap contracts, which are exposed tointerest rate risk. As at June 30, 2015, had the prevailinginterest rates increased or decreased by 0.25%, assuming aparallel shift in the yield curve and all other variables heldconstant, net assets attributable to holders of redeemableunits would have decreased or increased, respectively, by$2,201 or approximately 0.0% (December 31, 2014 – $6,304or approximately 0.0%). In practice, actual results maydiffer from this sensitivity analysis and the difference couldbe material.
ii) Currency risk
The tables below indicate the currencies to which the Fundhad significant exposure, net of the impact of currencyforward contracts and currency spot contracts, if any, basedon the monetary and non-monetary assets and liabilities ofthe Fund. The tables also illustrate the potential impact onthe Fund if the functional currency of the Fund hadstrengthened or weakened by 10% in relation to each of theother currencies, with all other variables held constant.
June 30, 2015
Currency
Net currencyexposure
($)
Percentage ofnet assets
(%)
Impact onthe Fund
($)
Percentage ofnet assets
(%)
US Dollar 41,644,243 93.2 4,164,424 9.3
41,644,243 93.2 4,164,424 9.3
December 31, 2014
Currency
Net currencyexposure
($)
Percentage ofnet assets
(%)
Impact onthe Fund
($)
Percentage ofnet assets
(%)
US Dollar 29,769,631 81.4 2,976,963 8.1
29,769,631 81.4 2,976,963 8.0
iii) Price risk
Price risk is the risk that the carrying value of financialinstruments will fluctuate as a result of changes in marketprices (other than those arising from interest rate risk orcurrency risk) caused by factors specific to a security, itsissuer or all factors affecting a market or a market segment.Exposure to price risk is mainly in equities, derivatives andcommodities, if applicable. As at June 30, 2015,
approximately 92.1% (December 31, 2014 – 95.0%) of theFund’s net assets were exposed to price risk. If prices ofthese investments had decreased or increased by 10%, withall other variables held constant, net assets of the Fundwould have decreased or increased, respectively, byapproximately $4,114,960 (December 31, 2014 –$3,469,979). In practice, actual results may differ from thissensitivity analysis and the difference could be material.
iv) Credit risk
The Fund had no significant exposure to bonds anddebentures, preferred shares or derivatives as at June 30,2015 or December 31, 2014. In addition, all investmenttransactions are executed by brokers with an approvedcredit rating. As such the risk of default on transactionswith counterparties and brokers related to purchase andsale of securities is considered minimal. In instances wherethe credit rating were to fall below the approved rating, theManager would take appropriate action.
v) Liquidity risk
The table below summarizes the Fund’s financial liabilitiesbased on the remaining period to the contractual maturitydate.
June 30, 2015 December 31, 2014
On demand($)
Less than3 months
($)On demand
($)
Less than3 months
($)
Current liabilities – 112,884 – 25,981Liability for written options – – – –Unrealized loss on derivatives – 422,831 – 38,366Redeemable units 44,666,865 – 36,582,327 –
44,666,865 535,715 36,582,327 64,347
Redeemable units are redeemable on demand at theholder’s option. However, the Manager does not expect thatthe contractual maturity disclosed in the table above will berepresentative of the actual cash outflows, as holders ofthese instruments typically retain them for a longer term.
vi) Concentration risk
Concentration risk arises as a result of the concentration ofexposures within the same category, geographical location,
The accompanying notes are an integral part of the financial statements.
180

Scotia U.S. Blue Chip Fund (Unaudited – Continued)
FUND SPECIFIC NOTESFor the periods indicated in Note 1.
asset type or industry sector, as applicable. The table belowis a summary of the Fund’s concentration risk:
Percentage of net assets (%)
June 30, 2015 December 31, 2014
Consumer Discretionary 17.2 12.0Consumer Staples 8.7 11.1Energy 5.3 4.4Financials 10.7 11.2Health Care 11.9 13.7Industrials 11.9 15.5Information Technology 18.5 18.8Materials 6.2 8.1
vii) Fair value classification (note 2)
The tables below illustrate the classification of the Fund’sfinancial instruments within the fair value hierarchy.
June 30, 2015Level 1
($)Level 2
($)Level 3
($)Total($)
Equities 40,343,294 – – 40,343,294Currency forward contracts–assets – 312,525 – 312,525
40,343,294 312,525 – 40,655,819
Currency forward contracts–liabilities – (348,754) – (348,754)
40,343,294 (36,229) – 40,307,065
December 31, 2014Level 1
($)Level 2
($)Level 3
($)Total($)
Equities 34,699,792 – – 34,699,792Currency forward contracts–assets – 27,166 – 27,166Swap contracts–assets – 4,720 – 4,720
34,699,792 31,886 – 34,731,678
Currency forward contracts–liabilities – (38,366) – (38,366)Swap contracts–liabilities – (646) – (646)
34,699,792 (7,126) – 34,692,666
Transfers between levels
During the periods ended June 30, 2015 and December 31,2014, there were no significant transfers between Level 1and Level 2.
3. Offsetting of financial assets and liabilities (note 2)
The following table presents offsetting of financial assetsand liabilities and collateral amounts that would occur iffuture events, such as bankruptcy or termination ofcontracts were to arise. No amounts were offset in thefinancial statements.
June 30, 2015
Financial assets – by type
Gross amountof assets
($)
Master nettingoffset
($)
Collateralpledged
($)Net Amount
($)
Currency forward contracts 312,525 (262,018) – 50,507Options contracts – OTC – – – –Swap contracts – – – –
312,525 (262,018) – 50,507
Financial liabilities – by type
Gross amountof liabilities
($)
Master nettingoffset
($)
Collateralpledged
($)Net Amount
($)
Currency forward contracts 348,754 (262,018) – 86,736Options contracts – OTC – – – –Swap contracts 74,077 – – 74,077
422,831 (262,018) – 160,813
December 31, 2014
Financial assets – by type
Gross amountof assets
($)
Master nettingoffset
($)
Collateralpledged
($)Net Amount
($)
Currency forward contracts 27,166 – – 27,166Options contracts – OTC – – – –Swap contracts 4,074 – – 4,074
31,240 – – 31,240
Financial liabilities – by type
Gross amountof liabilities
($)
Master nettingoffset
($)
Collateralpledged
($)Net Amount
($)
Currency forward contracts 38,366 – – 38,366Options contracts – OTC – – – –Swap contracts – – – –
38,366 – – 38,366
4. Interest in Underlying Funds (note 2)
The Fund did not hold any interest in Underlying Funds asat June 30, 2015 or December 31, 2014.
5. Comparison of net asset value per unit and netassets per unit (note 2)
The table below provides a comparison of the net assetvalue per unit and net assets per unit. The primary reasonfor the difference between the net asset value per unit andnet assets per unit, if any, is described in note 2.
June 30, 2015 December 31, 2014
Net asset valueper unit
($)
Net assetsper unit
($)
Net asset valueper unit
($)
Net assetsper unit
($)
Series A 10.96 10.96 9.74 9.74
Series F 11.04 11.04 9.75 9.75
The accompanying notes are an integral part of the financial statements.
181

Scotia U.S. Opportunities Fund (Unaudited)
STATEMENTS OF FINANCIAL POSITIONAs at
June 30,2015
December 31,2014
ASSETSCurrent assetsInvestments
Non-derivative financial assets $28,611,066 $24,284,880Cash 428,679 782,239Receivable for securities sold 186,958 –Subscriptions receivable 16,183 53,097Accrued investment income and other 14,371 26,046
29,257,257 25,146,262
LIABILITIESCurrent liabilitiesManagement fee payable 55,565 –Payable for securities purchased 109,485 –Redemptions payable 10,792 9,790Accrued expenses 10,334 –
186,176 9,790
Net assets attributable to holders of redeemable units $29,071,081 $25,136,472
NET ASSETS ATTRIBUTABLE TO HOLDERS OF REDEEMABLE UNITSPER SERIES
Series A $28,553,366 $24,855,745Series F $ 685 $ 621Series I $ 517,030 $ 280,106
NET ASSETS ATTRIBUTABLE TO HOLDERS OF REDEEMABLE UNITSPER UNIT
Series A $ 12.06 $ 10.98Series F $ 12.13 $ 10.99Series I $ 14.71 $ 13.23
STATEMENTS OF COMPREHENSIVE INCOMEFor the six month periods ended June 30,
2015 2014INCOMENet gain (loss) on investments (note 2)
Dividends $ 204,830 $ 154,535Interest for distribution purposes 1,112 607Net realized gain (loss) on non-derivative financial assets 4,516,817 3,175,614Net realized and change in unrealized gain (loss) on foreign exchange 51,269 8,795Change in unrealized gain (loss) on non-derivative financial assets (2,203,715) (2,120,042)
Net gain (loss) on investments 2,570,313 1,219,509Securities lending 48 35Net realized and change in unrealized gain (loss) on foreign exchange of cash 354,694 –Other income 447 645
Total income (loss) 2,925,502 1,220,189
EXPENSESManagement fees (note 5) 279,257 232,583Fixed administration fees (note 6) 51,885 –Independent Review Committee fees 21 35Interest expense and bank overdraft charges 102 –Foreign withholding taxes/tax reclaims 16,698 25,410Audit fees – 128Custodian fees – 1,697Filing fees – 9,212Legal fees – 74Unitholder administration costs – 18,523Unitholder reporting costs – 4,823Harmonized Sales Tax/Goods and Services Tax 35,235 27,586Transaction costs 25,821 38,247
Total expenses 409,019 358,318Expenses absorbed by the Manager – (4,986)
Net expenses 409,019 353,332
Increase (decrease) in net assets attributable to holders of redeemableunits from operations $ 2,516,483 $ 866,857
INCREASE (DECREASE) IN NET ASSETS ATTRIBUTABLE TO HOLDERS OFREDEEMABLE UNITS FROM OPERATIONS PER SERIES
Series A $ 2,480,297 $ 859,684Series F $ 64 $ –Series I $ 36,122 $ 7,173
INCREASE (DECREASE) IN NET ASSETS ATTRIBUTABLE TO HOLDERS OFREDEEMABLE UNITS FROM OPERATIONS PER UNIT†
Series A $ 1.05 $ 0.37Series F $ 1.14 $ –Series I $ 1.16 $ 0.56
WEIGHTED AVERAGE NUMBER OF UNITS PER SERIESSeries A 2,362,810 2,323,275Series F 56 –Series I 31,011 12,766
† The increase (decrease) in net assets attributable to holders of redeemable units fromoperations per unit is calculated by dividing the increase (decrease) in net assetsattributable to holders of redeemable units from operations per series by the weightedaverage number of units per series.
The accompanying notes are an integral part of the financial statements.
182
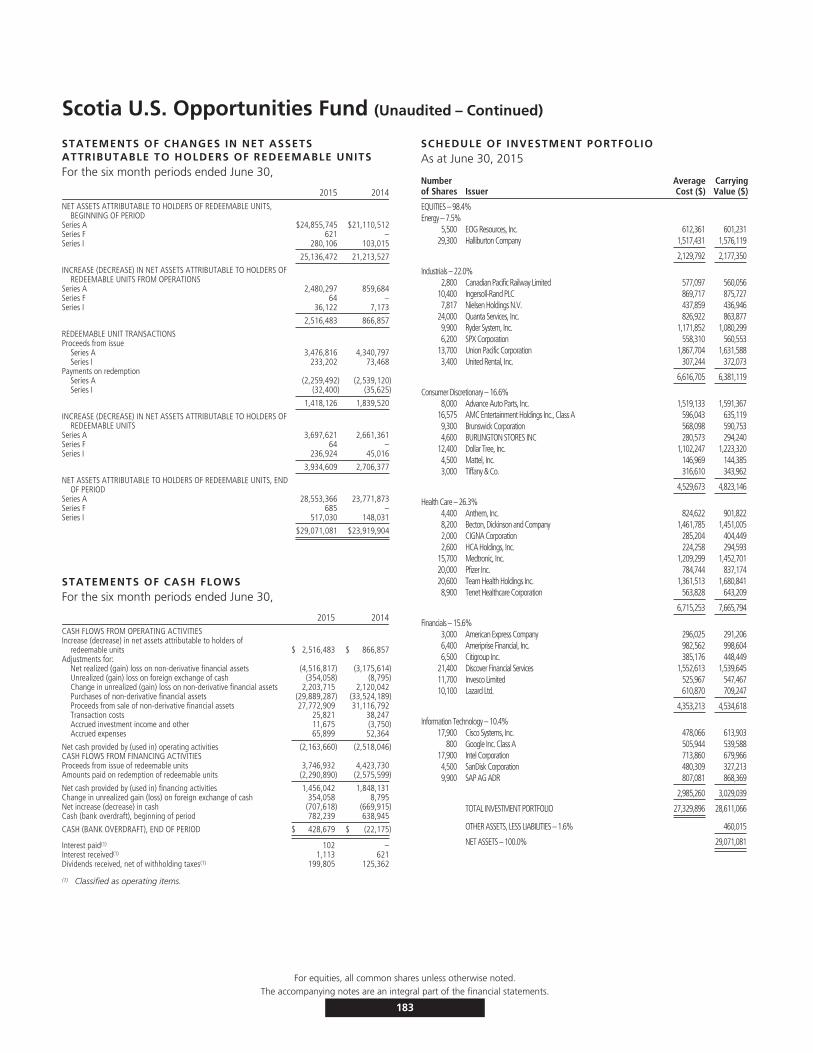
Scotia U.S. Opportunities Fund (Unaudited – Continued)
STATEMENTS OF CHANGES IN NET ASSETSATTRIBUTABLE TO HOLDERS OF REDEEMABLE UNITSFor the six month periods ended June 30,
2015 2014NET ASSETS ATTRIBUTABLE TO HOLDERS OF REDEEMABLE UNITS,
BEGINNING OF PERIODSeries A $24,855,745 $21,110,512Series F 621 –Series I 280,106 103,015
25,136,472 21,213,527
INCREASE (DECREASE) IN NET ASSETS ATTRIBUTABLE TO HOLDERS OFREDEEMABLE UNITS FROM OPERATIONS
Series A 2,480,297 859,684Series F 64 –Series I 36,122 7,173
2,516,483 866,857
REDEEMABLE UNIT TRANSACTIONSProceeds from issue
Series A 3,476,816 4,340,797Series I 233,202 73,468
Payments on redemptionSeries A (2,259,492) (2,539,120)Series I (32,400) (35,625)
1,418,126 1,839,520
INCREASE (DECREASE) IN NET ASSETS ATTRIBUTABLE TO HOLDERS OFREDEEMABLE UNITS
Series A 3,697,621 2,661,361Series F 64 –Series I 236,924 45,016
3,934,609 2,706,377
NET ASSETS ATTRIBUTABLE TO HOLDERS OF REDEEMABLE UNITS, ENDOF PERIOD
Series A 28,553,366 23,771,873Series F 685 –Series I 517,030 148,031
$29,071,081 $23,919,904
STATEMENTS OF CASH FLOWSFor the six month periods ended June 30,
2015 2014CASH FLOWS FROM OPERATING ACTIVITIESIncrease (decrease) in net assets attributable to holders of
redeemable units $ 2,516,483 $ 866,857Adjustments for:
Net realized (gain) loss on non-derivative financial assets (4,516,817) (3,175,614)Unrealized (gain) loss on foreign exchange of cash (354,058) (8,795)Change in unrealized (gain) loss on non-derivative financial assets 2,203,715 2,120,042Purchases of non-derivative financial assets (29,889,287) (33,524,189)Proceeds from sale of non-derivative financial assets 27,772,909 31,116,792Transaction costs 25,821 38,247Accrued investment income and other 11,675 (3,750)Accrued expenses 65,899 52,364
Net cash provided by (used in) operating activities (2,163,660) (2,518,046)CASH FLOWS FROM FINANCING ACTIVITIESProceeds from issue of redeemable units 3,746,932 4,423,730Amounts paid on redemption of redeemable units (2,290,890) (2,575,599)
Net cash provided by (used in) financing activities 1,456,042 1,848,131Change in unrealized gain (loss) on foreign exchange of cash 354,058 8,795Net increase (decrease) in cash (707,618) (669,915)Cash (bank overdraft), beginning of period 782,239 638,945
CASH (BANK OVERDRAFT), END OF PERIOD $ 428,679 $ (22,175)
Interest paid(1) 102 –Interest received(1) 1,113 621Dividends received, net of withholding taxes(1) 199,805 125,362
(1) Classified as operating items.
SCHEDULE OF INVESTMENT PORTFOLIOAs at June 30, 2015
Numberof Shares Issuer
AverageCost ($)
CarryingValue ($)
EQUITIES – 98.4%Energy – 7.5%
5,500 EOG Resources, Inc. 612,361 601,23129,300 Halliburton Company 1,517,431 1,576,119
2,129,792 2,177,350
Industrials – 22.0%2,800 Canadian Pacific Railway Limited 577,097 560,056
10,400 Ingersoll-Rand PLC 869,717 875,7277,817 Nielsen Holdings N.V. 437,859 436,946
24,000 Quanta Services, Inc. 826,922 863,8779,900 Ryder System, Inc. 1,171,852 1,080,2996,200 SPX Corporation 558,310 560,553
13,700 Union Pacific Corporation 1,867,704 1,631,5883,400 United Rental, Inc. 307,244 372,073
6,616,705 6,381,119
Consumer Discretionary – 16.6%8,000 Advance Auto Parts, Inc. 1,519,133 1,591,367
16,575 AMC Entertainment Holdings Inc., Class A 596,043 635,1199,300 Brunswick Corporation 568,098 590,7534,600 BURLINGTON STORES INC 280,573 294,240
12,400 Dollar Tree, Inc. 1,102,247 1,223,3204,500 Mattel, Inc. 146,969 144,3853,000 Tiffany & Co. 316,610 343,962
4,529,673 4,823,146
Health Care – 26.3%4,400 Anthem, Inc. 824,622 901,8228,200 Becton, Dickinson and Company 1,461,785 1,451,0052,000 CIGNA Corporation 285,204 404,4492,600 HCA Holdings, Inc. 224,258 294,593
15,700 Medtronic, Inc. 1,209,299 1,452,70120,000 Pfizer Inc. 784,744 837,17420,600 Team Health Holdings Inc. 1,361,513 1,680,8418,900 Tenet Healthcare Corporation 563,828 643,209
6,715,253 7,665,794
Financials – 15.6%3,000 American Express Company 296,025 291,2066,400 Ameriprise Financial, Inc. 982,562 998,6046,500 Citigroup Inc. 385,176 448,449
21,400 Discover Financial Services 1,552,613 1,539,64511,700 Invesco Limited 525,967 547,46710,100 Lazard Ltd. 610,870 709,247
4,353,213 4,534,618
Information Technology – 10.4%17,900 Cisco Systems, Inc. 478,066 613,903
800 Google Inc. Class A 505,944 539,58817,900 Intel Corporation 713,860 679,9664,500 SanDisk Corporation 480,309 327,2139,900 SAP AG ADR 807,081 868,369
2,985,260 3,029,039
TOTAL INVESTMENT PORTFOLIO 27,329,896 28,611,066
OTHER ASSETS, LESS LIABILITIES – 1.6% 460,015
NET ASSETS – 100.0% 29,071,081
For equities, all common shares unless otherwise noted.The accompanying notes are an integral part of the financial statements.
183

Scotia U.S. Opportunities Fund (Unaudited)
FUND SPECIFIC NOTESFor the periods indicated in Note 1.
1. The Fund (note 1)
The Fund’s investment objective is to achieve long-termcapital growth. It invests primarily in equity securities ofU.S. companies.
2. Risks associated with financial instruments (note 4)
i) Interest rate risk
The majority of the Fund’s financial assets and liabilitieswere non-interest bearing as at June 30, 2015 andDecember 31, 2014. Accordingly, the Fund is not directlysubject to significant risk due to fluctuations in theprevailing levels of market interest rates.
ii) Currency risk
The tables below indicate the currencies to which the Fundhad significant exposure, net of the impact of currencyforward contracts and currency spot contracts, if any,based on the monetary and non-monetary assets andliabilities of the Fund. The tables also illustrate thepotential impact on the Fund if the functional currency ofthe Fund had strengthened or weakened by 10% in relationto each of the other currencies, with all other variables heldconstant.
June 30, 2015
Currency
Net currencyexposure
($)
Percentage ofnet assets
(%)
Impact onthe Fund
($)
Percentage ofnet assets
(%)
US Dollar 28,430,047 97.8 2,843,005 9.8
28,430,047 97.8 2,843,005 9.8
December 31, 2014
Currency
Net currencyexposure
($)
Percentage ofnet assets
(%)
Impact onthe Fund
($)
Percentage ofnet assets
(%)
US Dollar 25,064,681 99.7 2,506,468 10.0
25,064,681 99.7 2,506,468 10.0
iii) Price risk
Price risk is the risk that the carrying value of financialinstruments will fluctuate as a result of changes in marketprices (other than those arising from interest rate risk orcurrency risk) caused by factors specific to a security, itsissuer or all factors affecting a market or a market segment.Exposure to price risk is mainly in equities, derivatives andcommodities, if applicable. As at June 30, 2015,approximately 98.4% (December 31, 2014 – 96.6%) of theFund’s net assets were exposed to price risk. If prices ofthese investments had decreased or increased by 10%, with
all other variables held constant, net assets of the Fundwould have decreased or increased, respectively, byapproximately $2,861,107 (December 31, 2014 –$2,428,488). In practice, actual results may differ from thissensitivity analysis and the difference could be material.
iv) Credit risk
The Fund had no significant exposure to bonds anddebentures, preferred shares or derivatives as at June 30,2015 or December 31, 2014. In addition, all investmenttransactions are executed by brokers with an approvedcredit rating. As such the risk of default on transactionswith counterparties and brokers related to purchase andsale of securities is considered minimal. In instances wherethe credit rating were to fall below the approved rating, theManager would take appropriate action.
v) Liquidity risk
The table below summarizes the Fund’s financial liabilitiesbased on the remaining period to the contractual maturitydate.
June 30, 2015 December 31, 2014
On demand($)
Less than3 months
($)On demand
($)
Less than3 months
($)
Current liabilities – 186,176 – 9,790Liability for written options – – – –Unrealized loss on derivatives – – – –Redeemable units 29,071,081 – 25,136,472 –
29,071,081 186,176 25,136,472 9,790
Redeemable units are redeemable on demand at theholder’s option. However, the Manager does not expect thatthe contractual maturity disclosed in the table above will berepresentative of the actual cash outflows, as holders ofthese instruments typically retain them for a longer term.
vi) Concentration risk
Concentration risk arises as a result of the concentration ofexposures within the same category, geographical location,asset type or industry sector, as applicable. The table belowis a summary of the Fund’s concentration risk:
Percentage of net assets (%)
June 30, 2015 December 31, 2014
Consumer Discretionary 16.6 6.3Consumer Staples – 7.3Energy 7.5 4.5Financials 15.6 22.3Health Care 26.3 17.0Industrials 22.0 8.6Information Technology 10.4 25.1Materials – 5.5
The accompanying notes are an integral part of the financial statements.
184
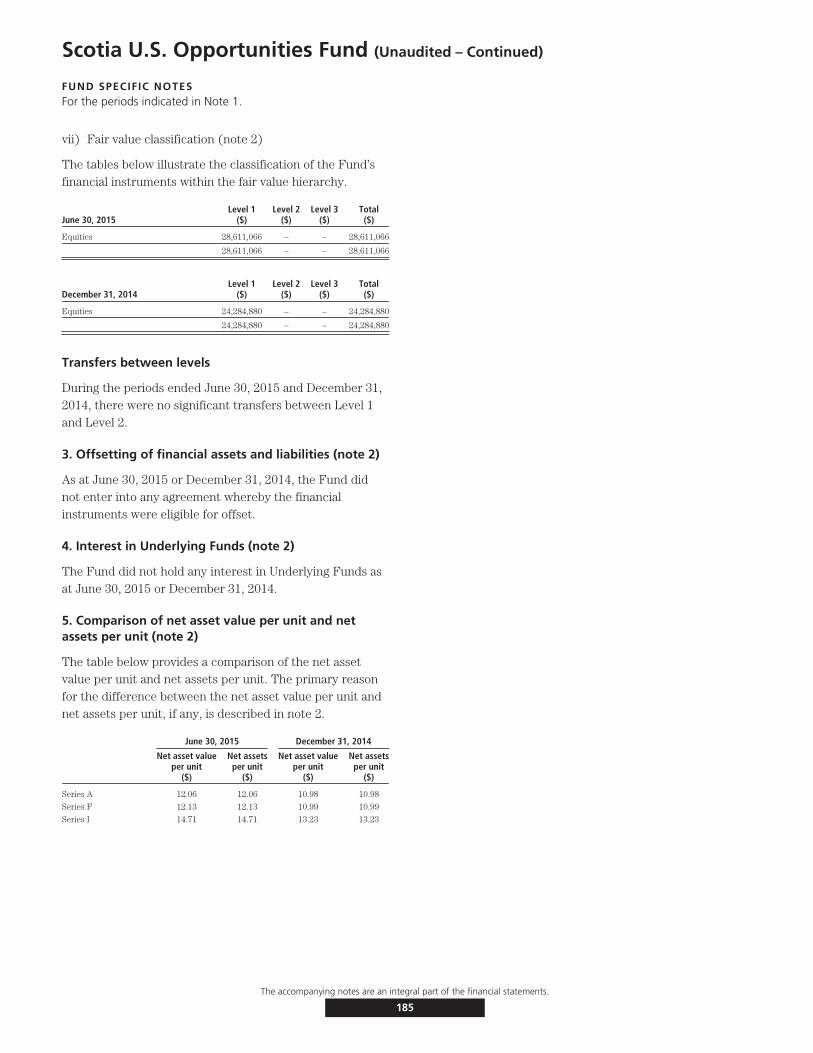
Scotia U.S. Opportunities Fund (Unaudited – Continued)
FUND SPECIFIC NOTESFor the periods indicated in Note 1.
vii) Fair value classification (note 2)
The tables below illustrate the classification of the Fund’sfinancial instruments within the fair value hierarchy.
June 30, 2015Level 1
($)Level 2
($)Level 3
($)Total($)
Equities 28,611,066 – – 28,611,066
28,611,066 – – 28,611,066
December 31, 2014Level 1
($)Level 2
($)Level 3
($)Total($)
Equities 24,284,880 – – 24,284,880
24,284,880 – – 24,284,880
Transfers between levels
During the periods ended June 30, 2015 and December 31,2014, there were no significant transfers between Level 1and Level 2.
3. Offsetting of financial assets and liabilities (note 2)
As at June 30, 2015 or December 31, 2014, the Fund didnot enter into any agreement whereby the financialinstruments were eligible for offset.
4. Interest in Underlying Funds (note 2)
The Fund did not hold any interest in Underlying Funds asat June 30, 2015 or December 31, 2014.
5. Comparison of net asset value per unit and netassets per unit (note 2)
The table below provides a comparison of the net assetvalue per unit and net assets per unit. The primary reasonfor the difference between the net asset value per unit andnet assets per unit, if any, is described in note 2.
June 30, 2015 December 31, 2014
Net asset valueper unit
($)
Net assetsper unit
($)
Net asset valueper unit
($)
Net assetsper unit
($)
Series A 12.06 12.06 10.98 10.98
Series F 12.13 12.13 10.99 10.99
Series I 14.71 14.71 13.23 13.23
The accompanying notes are an integral part of the financial statements.
185

Scotia Private International Core Equity Pool (Unaudited)
STATEMENTS OF FINANCIAL POSITIONAs at
June 30,2015
December 31,2014
ASSETSCurrent assetsInvestments
Non-derivative financial assets $202,825,436 $44,742,607Unrealized gain on currency forward contracts 197,677 –Unrealized gain on currency spot contracts 990 416
Cash 24,912,011 2,264,092Receivable for securities sold – 9,571Subscriptions receivable 2,420,112 49,453Accrued investment income and other 270,444 17,614
230,626,670 47,083,753
LIABILITIESCurrent liabilitiesManagement fee payable 20,904 –Payable for securities purchased 2,343,312 331,931Redemptions payable 80,869 37,569Accrued expenses 39,232 –Unrealized loss on currency forward contracts 599,758 –Unrealized loss on currency spot contracts 353 –
3,084,428 369,500
Net assets attributable to holders of redeemable units $227,542,242 $46,714,253
NET ASSETS ATTRIBUTABLE TO HOLDERS OF REDEEMABLE UNITSPER SERIES
Series M $227,542,242 $46,714,253
NET ASSETS ATTRIBUTABLE TO HOLDERS OF REDEEMABLE UNITSPER UNIT
Series M $ 10.83 $ 9.74
STATEMENTS OF COMPREHENSIVE INCOMEFor the six month periods ended June 30,
2015 2014INCOMENet gain (loss) on investments (note 2)
Dividends $ 5,487,425 $ 1,283,696Interest for distribution purposes 95,736 14,604Net realized gain (loss) on non-derivative financial assets 7,216,801 3,048,688Net realized gain (loss) on currency forward contracts 1,242,534 –Net realized and change in unrealized gain (loss) on foreign exchange 333,385 (26,066)Change in unrealized gain (loss) on non-derivative financial assets (7,005,385) (4,447,731)Change in unrealized gain (loss) on currency forward contracts (402,081) –Change in unrealized gain (loss) on currency spots contracts 221 1,409
Net gain (loss) on investments 6,968,636 (125,400)Securities lending 54,083 4,336Net realized and change in unrealized gain (loss) on foreign exchange of cash (185,970) –
Total income (loss) 6,836,749 (121,064)
EXPENSESManagement fees (note 5) 90,120 82,426Fixed administration fees (note 6) 152,671 –Independent Review Committee fees 116 82Interest expense and bank overdraft charges 864 340Foreign withholding taxes/tax reclaims 502,628 126,020Audit fees – 548Custodian fees – 21,071Filing fees – 4,723Legal fees – 174Unitholder administration costs – 3,630Unitholder reporting costs – 2,168Harmonized Sales Tax/Goods and Services Tax 26,501 12,100Transaction costs 420,652 35,104
Total expenses 1,193,552 288,386
Increase (decrease) in net assets attributable to holders of redeemableunits from operations $ 5,643,197 $ (409,450)
INCREASE (DECREASE) IN NET ASSETS ATTRIBUTABLE TO HOLDERS OFREDEEMABLE UNITS FROM OPERATIONS PER SERIES
Series M $ 5,643,197 $ (409,450)
INCREASE (DECREASE) IN NET ASSETS ATTRIBUTABLE TO HOLDERS OFREDEEMABLE UNITS FROM OPERATIONS PER UNIT†
Series M $ 0.36 $ (0.07)
WEIGHTED AVERAGE NUMBER OF UNITS PER SERIESSeries M 15,777,614 5,728,667
† The increase (decrease) in net assets attributable to holders of redeemable units fromoperations per unit is calculated by dividing the increase (decrease) in net assetsattributable to holders of redeemable units from operations per series by the weightedaverage number of units per series.
STATEMENTS OF CHANGES IN NET ASSETSATTRIBUTABLE TO HOLDERS OF REDEEMABLE UNITSFor the six month periods ended June 30,
2015 2014NET ASSETS ATTRIBUTABLE TO HOLDERS OF REDEEMABLE UNITS,
BEGINNING OF PERIODSeries M $ 46,714,253 $ 52,148,225
INCREASE (DECREASE) IN NET ASSETS ATTRIBUTABLE TO HOLDERSOF REDEEMABLE UNITS FROM OPERATIONS
Series M 5,643,197 (409,450)
REDEEMABLE UNIT TRANSACTIONSProceeds from issue
Series M 185,325,922 16,467,217Payments on redemption
Series M (10,141,130) (13,646,285)
175,184,792 2,820,932
INCREASE (DECREASE) IN NET ASSETS ATTRIBUTABLE TO HOLDERSOF REDEEMABLE UNITS
Series M 180,827,989 2,411,482
NET ASSETS ATTRIBUTABLE TO HOLDERS OF REDEEMABLE UNITS,END OF PERIOD
Series M $227,542,242 $ 54,559,707
STATEMENTS OF CASH FLOWSFor the six month periods ended June 30,
2015 2014CASH FLOWS FROM OPERATING ACTIVITIESIncrease (decrease) in net assets attributable to holders of
redeemable units $ 5,643,197 $ (409,450)Adjustments for:
Net realized (gain) loss on non-derivative financial assets (7,216,801) (3,048,688)Unrealized (gain) loss on foreign exchange of cash (127,763) 26,066Change in unrealized (gain) loss on non-derivative financial assets 7,005,385 4,447,731Change in unrealized (gain) loss on currency forward contracts 402,081 –Change in unrealized (gain) loss on currency spot contracts (221) (1,409)Purchases of non-derivative financial assets (211,342,984) (24,350,433)Proceeds from sale of non-derivative financial assets 55,071,871 21,820,092Transaction costs 420,652 35,104Accrued investment income and other (252,830) (43,625)Accrued expenses 60,136 23,193
Net cash provided by (used in) operating activities (150,337,277) (1,501,419)CASH FLOWS FROM FINANCING ACTIVITIESProceeds from issue of redeemable units 182,955,263 16,620,233Amounts paid on redemption of redeemable units (10,097,830) (13,649,072)
Net cash provided by (used in) financing activities 172,857,433 2,971,161Change in unrealized gain (loss) on foreign exchange of cash 127,763 (26,066)Net increase (decrease) in cash 22,520,156 1,469,742Cash (bank overdraft), beginning of period 2,264,092 1,898,337
CASH (BANK OVERDRAFT), END OF PERIOD $ 24,912,011 $ 3,342,013
Interest paid(1) 864 –Interest received(1) 84,381 14,662Dividends received, net of withholding taxes(1) 4,743,322 1,113,993
(1) Classified as operating items.
The accompanying notes are an integral part of the financial statements.
186
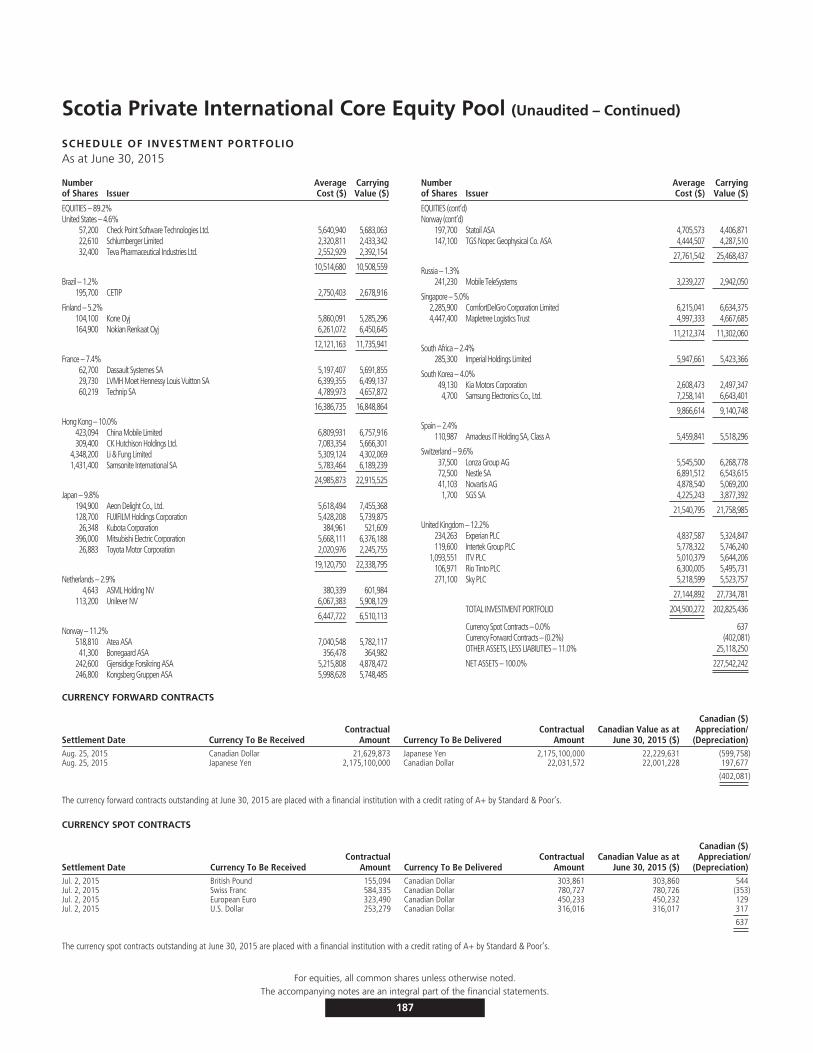
Scotia Private International Core Equity Pool (Unaudited – Continued)
SCHEDULE OF INVESTMENT PORTFOLIOAs at June 30, 2015
Numberof Shares Issuer
AverageCost ($)
CarryingValue ($)
EQUITIES – 89.2%United States – 4.6%
57,200 Check Point Software Technologies Ltd. 5,640,940 5,683,06322,610 Schlumberger Limited 2,320,811 2,433,34232,400 Teva Pharmaceutical Industries Ltd. 2,552,929 2,392,154
10,514,680 10,508,559
Brazil – 1.2%195,700 CETIP 2,750,403 2,678,916
Finland – 5.2%104,100 Kone Oyj 5,860,091 5,285,296164,900 Nokian Renkaat Oyj 6,261,072 6,450,645
12,121,163 11,735,941
France – 7.4%62,700 Dassault Systemes SA 5,197,407 5,691,85529,730 LVMH Moet Hennessy Louis Vuitton SA 6,399,355 6,499,13760,219 Technip SA 4,789,973 4,657,872
16,386,735 16,848,864
Hong Kong – 10.0%423,094 China Mobile Limited 6,809,931 6,757,916309,400 CK Hutchison Holdings Ltd. 7,083,354 5,666,301
4,348,200 Li & Fung Limited 5,309,124 4,302,0691,431,400 Samsonite International SA 5,783,464 6,189,239
24,985,873 22,915,525
Japan – 9.8%194,900 Aeon Delight Co., Ltd. 5,618,494 7,455,368128,700 FUJIFILM Holdings Corporation 5,428,208 5,739,87526,348 Kubota Corporation 384,961 521,609
396,000 Mitsubishi Electric Corporation 5,668,111 6,376,18826,883 Toyota Motor Corporation 2,020,976 2,245,755
19,120,750 22,338,795
Netherlands – 2.9%4,643 ASML Holding NV 380,339 601,984
113,200 Unilever NV 6,067,383 5,908,129
6,447,722 6,510,113
Norway – 11.2%518,810 Atea ASA 7,040,548 5,782,11741,300 Borregaard ASA 356,478 364,982
242,600 Gjensidige Forsikring ASA 5,215,808 4,878,472246,800 Kongsberg Gruppen ASA 5,998,628 5,748,485
Numberof Shares Issuer
AverageCost ($)
CarryingValue ($)
EQUITIES (cont’d)Norway (cont’d)
197,700 Statoil ASA 4,705,573 4,406,871147,100 TGS Nopec Geophysical Co. ASA 4,444,507 4,287,510
27,761,542 25,468,437
Russia – 1.3%241,230 Mobile TeleSystems 3,239,227 2,942,050
Singapore – 5.0%2,285,900 ComfortDelGro Corporation Limited 6,215,041 6,634,3754,447,400 Mapletree Logistics Trust 4,997,333 4,667,685
11,212,374 11,302,060
South Africa – 2.4%285,300 Imperial Holdings Limited 5,947,661 5,423,366
South Korea – 4.0%49,130 Kia Motors Corporation 2,608,473 2,497,3474,700 Samsung Electronics Co., Ltd. 7,258,141 6,643,401
9,866,614 9,140,748
Spain – 2.4%110,987 Amadeus IT Holding SA, Class A 5,459,841 5,518,296
Switzerland – 9.6%37,500 Lonza Group AG 5,545,500 6,268,77872,500 Nestle SA 6,891,512 6,543,61541,103 Novartis AG 4,878,540 5,069,2001,700 SGS SA 4,225,243 3,877,392
21,540,795 21,758,985
United Kingdom – 12.2%234,263 Experian PLC 4,837,587 5,324,847119,600 Intertek Group PLC 5,778,322 5,746,240
1,093,551 ITV PLC 5,010,379 5,644,206106,971 Rio Tinto PLC 6,300,005 5,495,731271,100 Sky PLC 5,218,599 5,523,757
27,144,892 27,734,781
TOTAL INVESTMENT PORTFOLIO 204,500,272 202,825,436
Currency Spot Contracts – 0.0% 637Currency Forward Contracts – (0.2%) (402,081)OTHER ASSETS, LESS LIABILITIES – 11.0% 25,118,250
NET ASSETS – 100.0% 227,542,242
CURRENCY FORWARD CONTRACTS
Settlement Date Currency To Be ReceivedContractual
Amount Currency To Be DeliveredContractual
AmountCanadian Value as at
June 30, 2015 ($)
Canadian ($)Appreciation/
(Depreciation)Aug. 25, 2015 Canadian Dollar 21,629,873 Japanese Yen 2,175,100,000 22,229,631 (599,758)Aug. 25, 2015 Japanese Yen 2,175,100,000 Canadian Dollar 22,031,572 22,001,228 197,677
(402,081)
The currency forward contracts outstanding at June 30, 2015 are placed with a financial institution with a credit rating of A+ by Standard & Poor’s.
CURRENCY SPOT CONTRACTS
Settlement Date Currency To Be ReceivedContractual
Amount Currency To Be DeliveredContractual
AmountCanadian Value as at
June 30, 2015 ($)
Canadian ($)Appreciation/
(Depreciation)Jul. 2, 2015 British Pound 155,094 Canadian Dollar 303,861 303,860 544Jul. 2, 2015 Swiss Franc 584,335 Canadian Dollar 780,727 780,726 (353)Jul. 2, 2015 European Euro 323,490 Canadian Dollar 450,233 450,232 129Jul. 2, 2015 U.S. Dollar 253,279 Canadian Dollar 316,016 316,017 317
637
The currency spot contracts outstanding at June 30, 2015 are placed with a financial institution with a credit rating of A+ by Standard & Poor’s.
For equities, all common shares unless otherwise noted.The accompanying notes are an integral part of the financial statements.
187
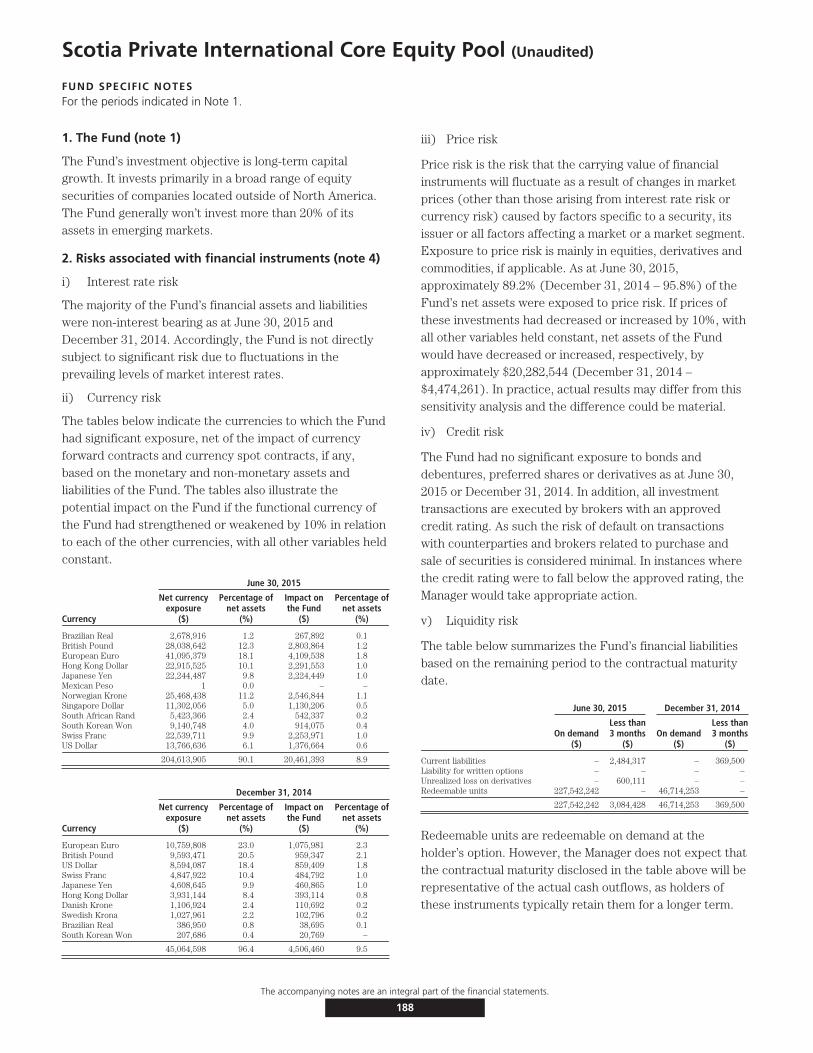
Scotia Private International Core Equity Pool (Unaudited)
FUND SPECIFIC NOTESFor the periods indicated in Note 1.
1. The Fund (note 1)
The Fund’s investment objective is long-term capitalgrowth. It invests primarily in a broad range of equitysecurities of companies located outside of North America.The Fund generally won’t invest more than 20% of itsassets in emerging markets.
2. Risks associated with financial instruments (note 4)
i) Interest rate risk
The majority of the Fund’s financial assets and liabilitieswere non-interest bearing as at June 30, 2015 andDecember 31, 2014. Accordingly, the Fund is not directlysubject to significant risk due to fluctuations in theprevailing levels of market interest rates.
ii) Currency risk
The tables below indicate the currencies to which the Fundhad significant exposure, net of the impact of currencyforward contracts and currency spot contracts, if any,based on the monetary and non-monetary assets andliabilities of the Fund. The tables also illustrate thepotential impact on the Fund if the functional currency ofthe Fund had strengthened or weakened by 10% in relationto each of the other currencies, with all other variables heldconstant.
June 30, 2015
Currency
Net currencyexposure
($)
Percentage ofnet assets
(%)
Impact onthe Fund
($)
Percentage ofnet assets
(%)
Brazilian Real 2,678,916 1.2 267,892 0.1British Pound 28,038,642 12.3 2,803,864 1.2European Euro 41,095,379 18.1 4,109,538 1.8Hong Kong Dollar 22,915,525 10.1 2,291,553 1.0Japanese Yen 22,244,487 9.8 2,224,449 1.0Mexican Peso 1 0.0 – –Norwegian Krone 25,468,438 11.2 2,546,844 1.1Singapore Dollar 11,302,056 5.0 1,130,206 0.5South African Rand 5,423,366 2.4 542,337 0.2South Korean Won 9,140,748 4.0 914,075 0.4Swiss Franc 22,539,711 9.9 2,253,971 1.0US Dollar 13,766,636 6.1 1,376,664 0.6
204,613,905 90.1 20,461,393 8.9
December 31, 2014
Currency
Net currencyexposure
($)
Percentage ofnet assets
(%)
Impact onthe Fund
($)
Percentage ofnet assets
(%)
European Euro 10,759,808 23.0 1,075,981 2.3British Pound 9,593,471 20.5 959,347 2.1US Dollar 8,594,087 18.4 859,409 1.8Swiss Franc 4,847,922 10.4 484,792 1.0Japanese Yen 4,608,645 9.9 460,865 1.0Hong Kong Dollar 3,931,144 8.4 393,114 0.8Danish Krone 1,106,924 2.4 110,692 0.2Swedish Krona 1,027,961 2.2 102,796 0.2Brazilian Real 386,950 0.8 38,695 0.1South Korean Won 207,686 0.4 20,769 –
45,064,598 96.4 4,506,460 9.5
iii) Price risk
Price risk is the risk that the carrying value of financialinstruments will fluctuate as a result of changes in marketprices (other than those arising from interest rate risk orcurrency risk) caused by factors specific to a security, itsissuer or all factors affecting a market or a market segment.Exposure to price risk is mainly in equities, derivatives andcommodities, if applicable. As at June 30, 2015,approximately 89.2% (December 31, 2014 – 95.8%) of theFund’s net assets were exposed to price risk. If prices ofthese investments had decreased or increased by 10%, withall other variables held constant, net assets of the Fundwould have decreased or increased, respectively, byapproximately $20,282,544 (December 31, 2014 –$4,474,261). In practice, actual results may differ from thissensitivity analysis and the difference could be material.
iv) Credit risk
The Fund had no significant exposure to bonds anddebentures, preferred shares or derivatives as at June 30,2015 or December 31, 2014. In addition, all investmenttransactions are executed by brokers with an approvedcredit rating. As such the risk of default on transactionswith counterparties and brokers related to purchase andsale of securities is considered minimal. In instances wherethe credit rating were to fall below the approved rating, theManager would take appropriate action.
v) Liquidity risk
The table below summarizes the Fund’s financial liabilitiesbased on the remaining period to the contractual maturitydate.
June 30, 2015 December 31, 2014
On demand($)
Less than3 months
($)On demand
($)
Less than3 months
($)
Current liabilities – 2,484,317 – 369,500Liability for written options – – – –Unrealized loss on derivatives – 600,111 – –Redeemable units 227,542,242 – 46,714,253 –
227,542,242 3,084,428 46,714,253 369,500
Redeemable units are redeemable on demand at theholder’s option. However, the Manager does not expect thatthe contractual maturity disclosed in the table above will berepresentative of the actual cash outflows, as holders ofthese instruments typically retain them for a longer term.
The accompanying notes are an integral part of the financial statements.
188

Scotia Private International Core Equity Pool (Unaudited – Continued)
FUND SPECIFIC NOTESFor the periods indicated in Note 1.
vi) Concentration risk
Concentration risk arises as a result of the concentration ofexposures within the same category, geographical location,asset type or industry sector, as applicable. The table belowis a summary of the Fund’s concentration risk:
Percentage of net assets (%)
June 30, 2015 December 31, 2014
Brazil 1.2 1.6Denmark – 2.4Finland 5.2 –France 7.4 10.7Germany – 1.2Hong Kong 10.0 8.4Italy – 1.1India – 2.7Japan 9.8 9.9Netherlands 2.9 6.6Norway 11.2 –Russia 1.3 –Singapore 5.0 –South Africa 2.4 –South Korea 4.0 0.4Spain 2.4 3.5Sweden – 2.2Switzerland 9.6 10.4United Kingdom 12.2 22.4United States 4.6 12.3
vii) Fair value classification (note 2)
The tables below illustrate the classification of the Fund’sfinancial instruments within the fair value hierarchy.
June 30, 2015Level 1
($)Level 2
($)Level 3
($)Total($)
Equities 16,129,527 186,695,909 – 202,825,436Currency forward contracts–assets – 197,677 – 197,677Currency spot contracts–assets 990 – – 990
16,130,517 186,893,586 – 203,024,103
Currency forward contracts–liabilities – (599,758) – (599,758)
Currency spot contracts–liabilities (353) – – (353)
16,130,164 186,293,828 – 202,423,992
December 31, 2014Level 1
($)Level 2
($)Level 3
($)Total($)
Equities 8,594,091 36,148,516 – 44,742,607Currency spot contracts–assets 416 – – 416
8,594,507 36,148,516 – 44,743,023
Transfers between levels
During the periods ended June 30, 2015 and December 31,2014, there were no significant transfers between Level 1and Level 2.
3. Offsetting of financial assets and liabilities (note 2)
The following table presents offsetting of financial assetsand liabilities and collateral amounts that would occur iffuture events, such as bankruptcy or termination ofcontracts were to arise. No amounts were offset in thefinancial statements.
June 30, 2015
Financial assets – by type
Gross amountof assets
($)
Master nettingoffset
($)
Collateralpledged
($)Net Amount
($)
Currency forward contracts 197,677 (197,677) – –Options contracts – OTC – – – –Swap contracts – – – –
197,677 (197,677) – –
Financial liabilities – by type
Gross amountof liabilities
($)
Master nettingoffset
($)
Collateralpledged
($)Net Amount
($)
Currency forward contracts 599,758 (197,677) – 402,081Options contracts – OTC – – – –Swap contracts – – – –
599,758 (197,677) – 402,081
As at December 31, 2014, the Fund did not enter into anyagreement whereby the financial instruments were eligiblefor offset.
4. Interest in Underlying Funds (note 2)
The Fund did not hold any interest in Underlying Funds asat June 30, 2015 or December 31, 2014.
5. Comparison of net asset value per unit and netassets per unit (note 2)
The table below provides a comparison of the net assetvalue per unit and net assets per unit. The primary reasonfor the difference between the net asset value per unit andnet assets per unit, if any, is described in note 2.
June 30, 2015 December 31, 2014
Net asset valueper unit
($)
Net assetsper unit
($)
Net asset valueper unit
($)
Net assetsper unit
($)
Series M 10.83 10.83 9.74 9.74
The accompanying notes are an integral part of the financial statements.
189
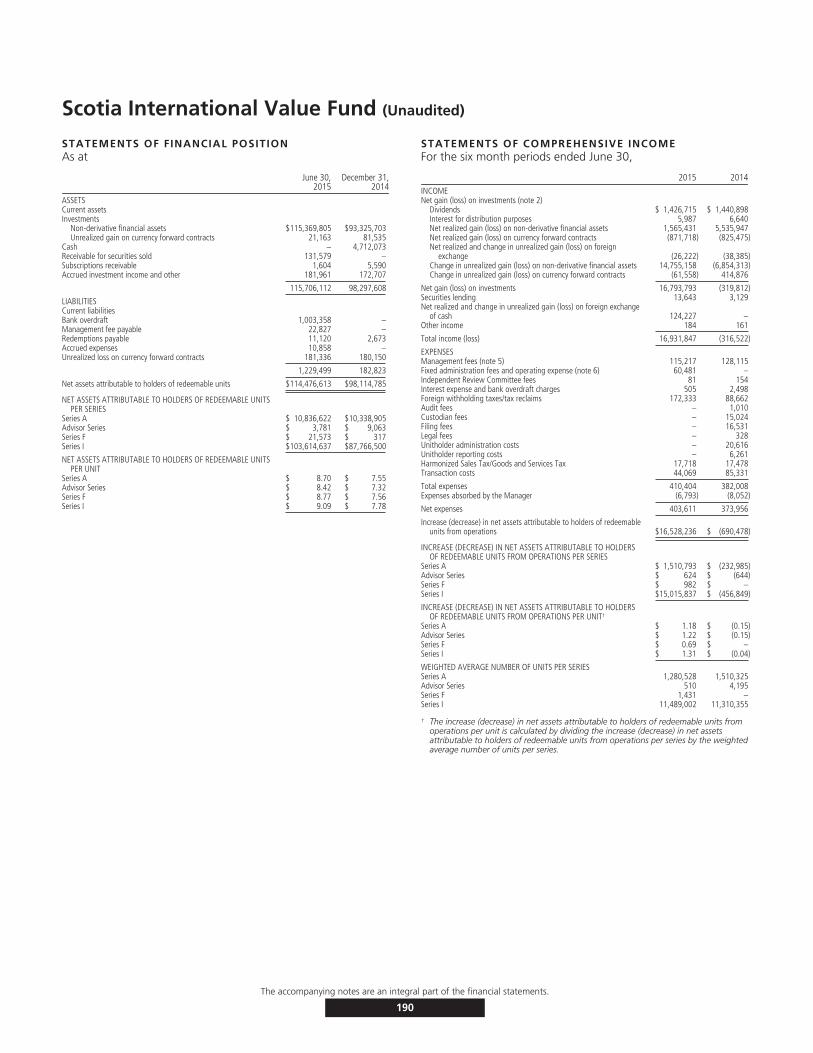
Scotia International Value Fund (Unaudited)
STATEMENTS OF FINANCIAL POSITIONAs at
June 30,2015
December 31,2014
ASSETSCurrent assetsInvestments
Non-derivative financial assets $115,369,805 $93,325,703Unrealized gain on currency forward contracts 21,163 81,535
Cash – 4,712,073Receivable for securities sold 131,579 –Subscriptions receivable 1,604 5,590Accrued investment income and other 181,961 172,707
115,706,112 98,297,608
LIABILITIESCurrent liabilitiesBank overdraft 1,003,358 –Management fee payable 22,827 –Redemptions payable 11,120 2,673Accrued expenses 10,858 –Unrealized loss on currency forward contracts 181,336 180,150
1,229,499 182,823
Net assets attributable to holders of redeemable units $114,476,613 $98,114,785
NET ASSETS ATTRIBUTABLE TO HOLDERS OF REDEEMABLE UNITSPER SERIES
Series A $ 10,836,622 $10,338,905Advisor Series $ 3,781 $ 9,063Series F $ 21,573 $ 317Series I $103,614,637 $87,766,500
NET ASSETS ATTRIBUTABLE TO HOLDERS OF REDEEMABLE UNITSPER UNIT
Series A $ 8.70 $ 7.55Advisor Series $ 8.42 $ 7.32Series F $ 8.77 $ 7.56Series I $ 9.09 $ 7.78
STATEMENTS OF COMPREHENSIVE INCOMEFor the six month periods ended June 30,
2015 2014INCOMENet gain (loss) on investments (note 2)
Dividends $ 1,426,715 $ 1,440,898Interest for distribution purposes 5,987 6,640Net realized gain (loss) on non-derivative financial assets 1,565,431 5,535,947Net realized gain (loss) on currency forward contracts (871,718) (825,475)Net realized and change in unrealized gain (loss) on foreign
exchange (26,222) (38,385)Change in unrealized gain (loss) on non-derivative financial assets 14,755,158 (6,854,313)Change in unrealized gain (loss) on currency forward contracts (61,558) 414,876
Net gain (loss) on investments 16,793,793 (319,812)Securities lending 13,643 3,129Net realized and change in unrealized gain (loss) on foreign exchange
of cash 124,227 –Other income 184 161
Total income (loss) 16,931,847 (316,522)
EXPENSESManagement fees (note 5) 115,217 128,115Fixed administration fees and operating expense (note 6) 60,481 –Independent Review Committee fees 81 154Interest expense and bank overdraft charges 505 2,498Foreign withholding taxes/tax reclaims 172,333 88,662Audit fees – 1,010Custodian fees – 15,024Filing fees – 16,531Legal fees – 328Unitholder administration costs – 20,616Unitholder reporting costs – 6,261Harmonized Sales Tax/Goods and Services Tax 17,718 17,478Transaction costs 44,069 85,331
Total expenses 410,404 382,008Expenses absorbed by the Manager (6,793) (8,052)
Net expenses 403,611 373,956
Increase (decrease) in net assets attributable to holders of redeemableunits from operations $16,528,236 $ (690,478)
INCREASE (DECREASE) IN NET ASSETS ATTRIBUTABLE TO HOLDERSOF REDEEMABLE UNITS FROM OPERATIONS PER SERIES
Series A $ 1,510,793 $ (232,985)Advisor Series $ 624 $ (644)Series F $ 982 $ –Series I $15,015,837 $ (456,849)
INCREASE (DECREASE) IN NET ASSETS ATTRIBUTABLE TO HOLDERSOF REDEEMABLE UNITS FROM OPERATIONS PER UNIT†
Series A $ 1.18 $ (0.15)Advisor Series $ 1.22 $ (0.15)Series F $ 0.69 $ –Series I $ 1.31 $ (0.04)
WEIGHTED AVERAGE NUMBER OF UNITS PER SERIESSeries A 1,280,528 1,510,325Advisor Series 510 4,195Series F 1,431 –Series I 11,489,002 11,310,355
† The increase (decrease) in net assets attributable to holders of redeemable units fromoperations per unit is calculated by dividing the increase (decrease) in net assetsattributable to holders of redeemable units from operations per series by the weightedaverage number of units per series.
The accompanying notes are an integral part of the financial statements.
190
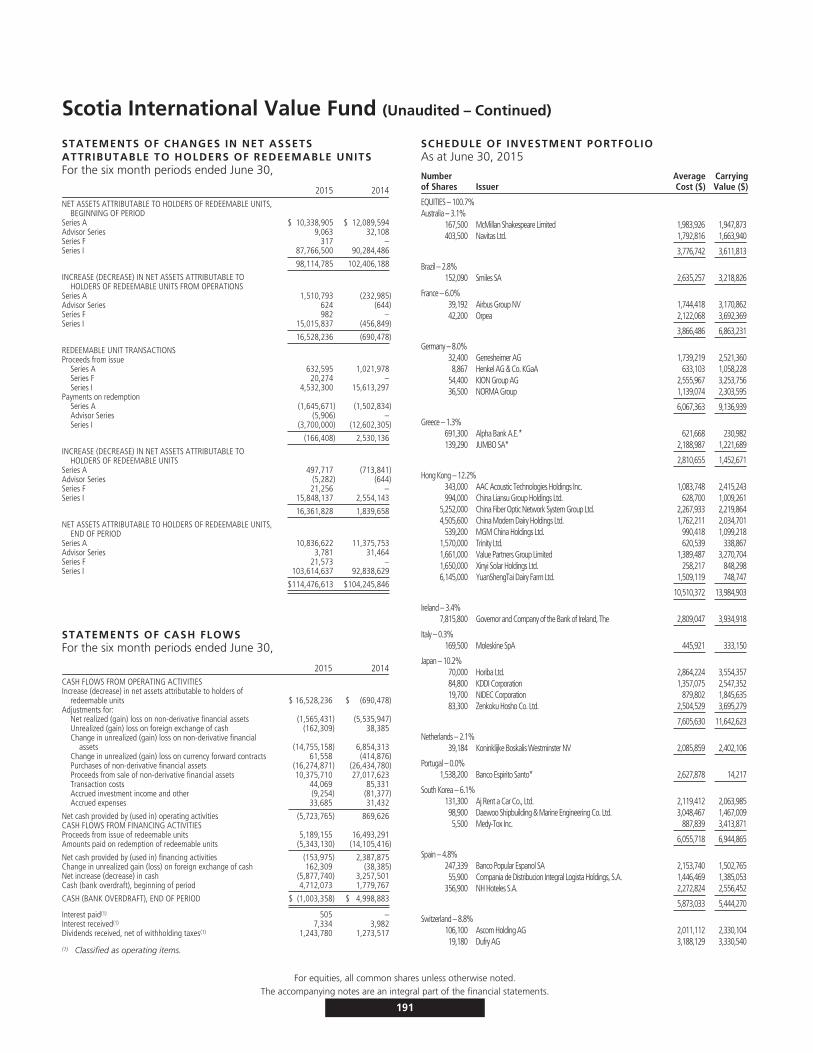
Scotia International Value Fund (Unaudited – Continued)
STATEMENTS OF CHANGES IN NET ASSETSATTRIBUTABLE TO HOLDERS OF REDEEMABLE UNITSFor the six month periods ended June 30,
2015 2014NET ASSETS ATTRIBUTABLE TO HOLDERS OF REDEEMABLE UNITS,
BEGINNING OF PERIODSeries A $ 10,338,905 $ 12,089,594Advisor Series 9,063 32,108Series F 317 –Series I 87,766,500 90,284,486
98,114,785 102,406,188
INCREASE (DECREASE) IN NET ASSETS ATTRIBUTABLE TOHOLDERS OF REDEEMABLE UNITS FROM OPERATIONS
Series A 1,510,793 (232,985)Advisor Series 624 (644)Series F 982 –Series I 15,015,837 (456,849)
16,528,236 (690,478)
REDEEMABLE UNIT TRANSACTIONSProceeds from issue
Series A 632,595 1,021,978Series F 20,274 –Series I 4,532,300 15,613,297
Payments on redemptionSeries A (1,645,671) (1,502,834)Advisor Series (5,906) –Series I (3,700,000) (12,602,305)
(166,408) 2,530,136
INCREASE (DECREASE) IN NET ASSETS ATTRIBUTABLE TOHOLDERS OF REDEEMABLE UNITS
Series A 497,717 (713,841)Advisor Series (5,282) (644)Series F 21,256 –Series I 15,848,137 2,554,143
16,361,828 1,839,658
NET ASSETS ATTRIBUTABLE TO HOLDERS OF REDEEMABLE UNITS,END OF PERIOD
Series A 10,836,622 11,375,753Advisor Series 3,781 31,464Series F 21,573 –Series I 103,614,637 92,838,629
$114,476,613 $104,245,846
STATEMENTS OF CASH FLOWSFor the six month periods ended June 30,
2015 2014CASH FLOWS FROM OPERATING ACTIVITIESIncrease (decrease) in net assets attributable to holders of
redeemable units $ 16,528,236 $ (690,478)Adjustments for:
Net realized (gain) loss on non-derivative financial assets (1,565,431) (5,535,947)Unrealized (gain) loss on foreign exchange of cash (162,309) 38,385Change in unrealized (gain) loss on non-derivative financial
assets (14,755,158) 6,854,313Change in unrealized (gain) loss on currency forward contracts 61,558 (414,876)Purchases of non-derivative financial assets (16,274,871) (26,434,780)Proceeds from sale of non-derivative financial assets 10,375,710 27,017,623Transaction costs 44,069 85,331Accrued investment income and other (9,254) (81,377)Accrued expenses 33,685 31,432
Net cash provided by (used in) operating activities (5,723,765) 869,626CASH FLOWS FROM FINANCING ACTIVITIESProceeds from issue of redeemable units 5,189,155 16,493,291Amounts paid on redemption of redeemable units (5,343,130) (14,105,416)
Net cash provided by (used in) financing activities (153,975) 2,387,875Change in unrealized gain (loss) on foreign exchange of cash 162,309 (38,385)Net increase (decrease) in cash (5,877,740) 3,257,501Cash (bank overdraft), beginning of period 4,712,073 1,779,767
CASH (BANK OVERDRAFT), END OF PERIOD $ (1,003,358) $ 4,998,883
Interest paid(1) 505 –Interest received(1) 7,334 3,982Dividends received, net of withholding taxes(1) 1,243,780 1,273,517
(1) Classified as operating items.
SCHEDULE OF INVESTMENT PORTFOLIOAs at June 30, 2015
Numberof Shares Issuer
AverageCost ($)
CarryingValue ($)
EQUITIES – 100.7%Australia – 3.1%
167,500 McMillan Shakespeare Limited 1,983,926 1,947,873403,500 Navitas Ltd. 1,792,816 1,663,940
3,776,742 3,611,813
Brazil – 2.8%152,090 Smiles SA 2,635,257 3,218,826
France – 6.0%39,192 Airbus Group NV 1,744,418 3,170,86242,200 Orpea 2,122,068 3,692,369
3,866,486 6,863,231
Germany – 8.0%32,400 Gerresheimer AG 1,739,219 2,521,3608,867 Henkel AG & Co. KGaA 633,103 1,058,228
54,400 KION Group AG 2,555,967 3,253,75636,500 NORMA Group 1,139,074 2,303,595
6,067,363 9,136,939
Greece – 1.3%691,300 Alpha Bank A.E.* 621,668 230,982139,290 JUMBO SA* 2,188,987 1,221,689
2,810,655 1,452,671
Hong Kong – 12.2%343,000 AAC Acoustic Technologies Holdings Inc. 1,083,748 2,415,243994,000 China Liansu Group Holdings Ltd. 628,700 1,009,261
5,252,000 China Fiber Optic Network System Group Ltd. 2,267,933 2,219,8644,505,600 China Modern Dairy Holdings Ltd. 1,762,211 2,034,701
539,200 MGM China Holdings Ltd. 990,418 1,099,2181,570,000 Trinity Ltd. 620,539 338,8671,661,000 Value Partners Group Limited 1,389,487 3,270,7041,650,000 Xinyi Solar Holdings Ltd. 258,217 848,2986,145,000 YuanShengTai Dairy Farm Ltd. 1,509,119 748,747
10,510,372 13,984,903
Ireland – 3.4%7,815,800 Governor and Company of the Bank of Ireland, The 2,809,047 3,934,918
Italy – 0.3%169,500 Moleskine SpA 445,921 333,150
Japan – 10.2%70,000 Horiba Ltd. 2,864,224 3,554,35784,800 KDDI Corporation 1,357,075 2,547,35219,700 NIDEC Corporation 879,802 1,845,63583,300 Zenkoku Hosho Co. Ltd. 2,504,529 3,695,279
7,605,630 11,642,623
Netherlands – 2.1%39,184 Koninklijke Boskalis Westminster NV 2,085,859 2,402,106
Portugal – 0.0%1,538,200 Banco Espirito Santo* 2,627,878 14,217
South Korea – 6.1%131,300 Aj Rent a Car Co., Ltd. 2,119,412 2,063,98598,900 Daewoo Shipbuilding & Marine Engineering Co. Ltd. 3,048,467 1,467,0095,500 Medy-Tox Inc. 887,839 3,413,871
6,055,718 6,944,865
Spain – 4.8%247,339 Banco Popular Espanol SA 2,153,740 1,502,76555,900 Compania de Distribucion Integral Logista Holdings, S.A. 1,446,469 1,385,053
356,900 NH Hoteles S.A. 2,272,824 2,556,452
5,873,033 5,444,270
Switzerland – 8.8%106,100 Ascom Holding AG 2,011,112 2,330,10419,180 Dufry AG 3,188,129 3,330,540
For equities, all common shares unless otherwise noted.The accompanying notes are an integral part of the financial statements.
191
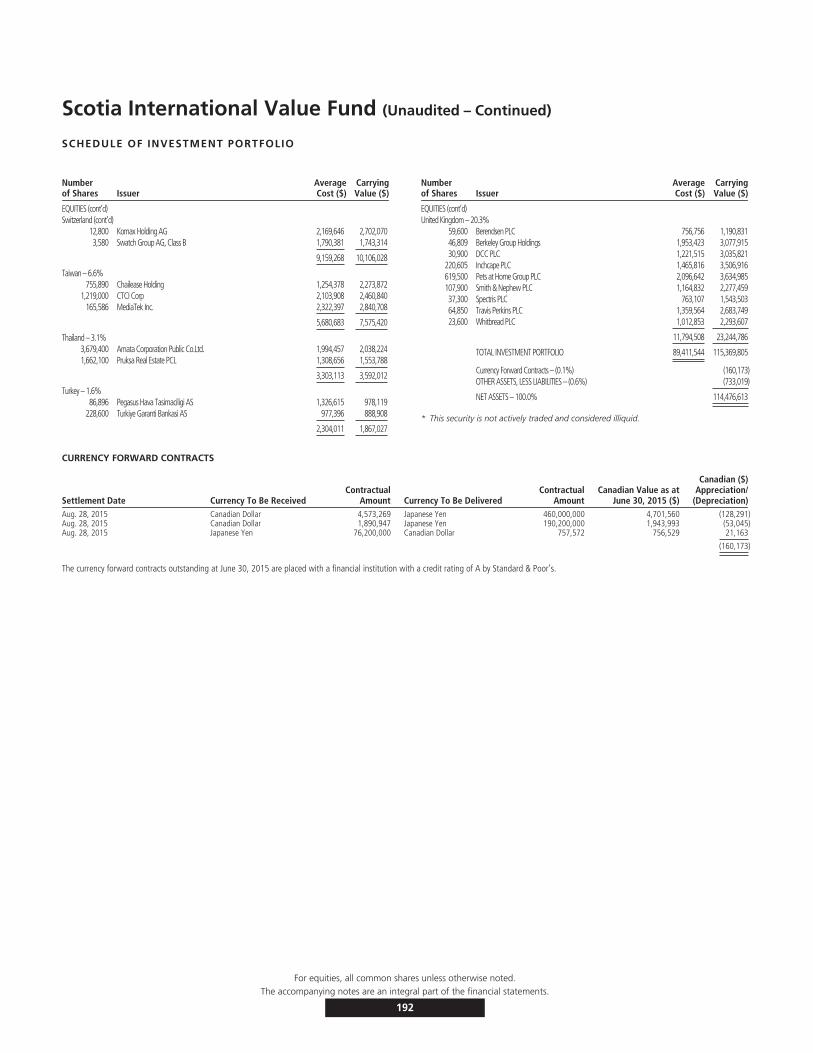
Scotia International Value Fund (Unaudited – Continued)
SCHEDULE OF INVESTMENT PORTFOLIO
Numberof Shares Issuer
AverageCost ($)
CarryingValue ($)
EQUITIES (cont’d)Switzerland (cont’d)
12,800 Komax Holding AG 2,169,646 2,702,0703,580 Swatch Group AG, Class B 1,790,381 1,743,314
9,159,268 10,106,028
Taiwan – 6.6%755,890 Chailease Holding 1,254,378 2,273,872
1,219,000 CTCI Corp 2,103,908 2,460,840165,586 MediaTek Inc. 2,322,397 2,840,708
5,680,683 7,575,420
Thailand – 3.1%3,679,400 Amata Corporation Public Co.Ltd. 1,994,457 2,038,2241,662,100 Pruksa Real Estate PCL 1,308,656 1,553,788
3,303,113 3,592,012
Turkey – 1.6%86,896 Pegasus Hava Tasimaciligi AS 1,326,615 978,119
228,600 Turkiye Garanti Bankasi AS 977,396 888,908
2,304,011 1,867,027
Numberof Shares Issuer
AverageCost ($)
CarryingValue ($)
EQUITIES (cont’d)United Kingdom – 20.3%
59,600 Berendsen PLC 756,756 1,190,83146,809 Berkeley Group Holdings 1,953,423 3,077,91530,900 DCC PLC 1,221,515 3,035,821
220,605 Inchcape PLC 1,465,816 3,506,916619,500 Pets at Home Group PLC 2,096,642 3,634,985107,900 Smith & Nephew PLC 1,164,832 2,277,45937,300 Spectris PLC 763,107 1,543,50364,850 Travis Perkins PLC 1,359,564 2,683,74923,600 Whitbread PLC 1,012,853 2,293,607
11,794,508 23,244,786
TOTAL INVESTMENT PORTFOLIO 89,411,544 115,369,805
Currency Forward Contracts – (0.1%) (160,173)OTHER ASSETS, LESS LIABILITIES – (0.6%) (733,019)
NET ASSETS – 100.0% 114,476,613
* This security is not actively traded and considered illiquid.
CURRENCY FORWARD CONTRACTS
Settlement Date Currency To Be ReceivedContractual
Amount Currency To Be DeliveredContractual
AmountCanadian Value as at
June 30, 2015 ($)
Canadian ($)Appreciation/
(Depreciation)Aug. 28, 2015 Canadian Dollar 4,573,269 Japanese Yen 460,000,000 4,701,560 (128,291)Aug. 28, 2015 Canadian Dollar 1,890,947 Japanese Yen 190,200,000 1,943,993 (53,045)Aug. 28, 2015 Japanese Yen 76,200,000 Canadian Dollar 757,572 756,529 21,163
(160,173)
The currency forward contracts outstanding at June 30, 2015 are placed with a financial institution with a credit rating of A by Standard & Poor’s.
For equities, all common shares unless otherwise noted.The accompanying notes are an integral part of the financial statements.
192
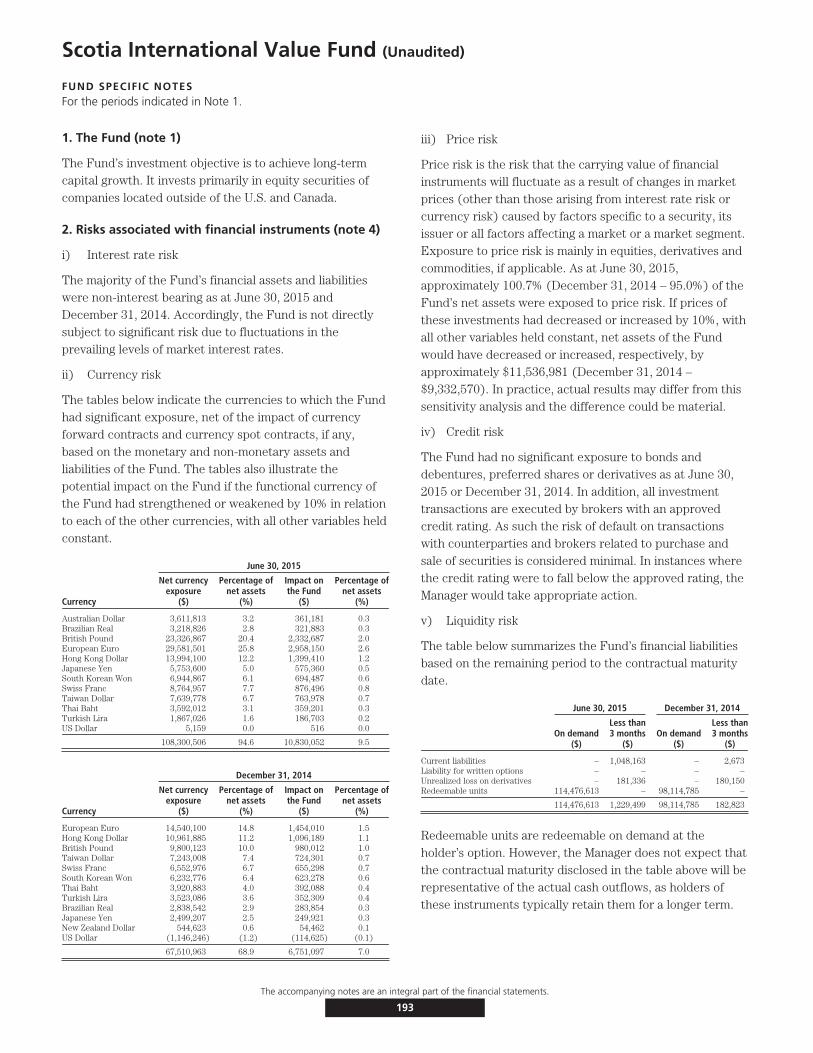
Scotia International Value Fund (Unaudited)
FUND SPECIFIC NOTESFor the periods indicated in Note 1.
1. The Fund (note 1)
The Fund’s investment objective is to achieve long-termcapital growth. It invests primarily in equity securities ofcompanies located outside of the U.S. and Canada.
2. Risks associated with financial instruments (note 4)
i) Interest rate risk
The majority of the Fund’s financial assets and liabilitieswere non-interest bearing as at June 30, 2015 andDecember 31, 2014. Accordingly, the Fund is not directlysubject to significant risk due to fluctuations in theprevailing levels of market interest rates.
ii) Currency risk
The tables below indicate the currencies to which the Fundhad significant exposure, net of the impact of currencyforward contracts and currency spot contracts, if any,based on the monetary and non-monetary assets andliabilities of the Fund. The tables also illustrate thepotential impact on the Fund if the functional currency ofthe Fund had strengthened or weakened by 10% in relationto each of the other currencies, with all other variables heldconstant.
June 30, 2015
Currency
Net currencyexposure
($)
Percentage ofnet assets
(%)
Impact onthe Fund
($)
Percentage ofnet assets
(%)
Australian Dollar 3,611,813 3.2 361,181 0.3Brazilian Real 3,218,826 2.8 321,883 0.3British Pound 23,326,867 20.4 2,332,687 2.0European Euro 29,581,501 25.8 2,958,150 2.6Hong Kong Dollar 13,994,100 12.2 1,399,410 1.2Japanese Yen 5,753,600 5.0 575,360 0.5South Korean Won 6,944,867 6.1 694,487 0.6Swiss Franc 8,764,957 7.7 876,496 0.8Taiwan Dollar 7,639,778 6.7 763,978 0.7Thai Baht 3,592,012 3.1 359,201 0.3Turkish Lira 1,867,026 1.6 186,703 0.2US Dollar 5,159 0.0 516 0.0
108,300,506 94.6 10,830,052 9.5
December 31, 2014
Currency
Net currencyexposure
($)
Percentage ofnet assets
(%)
Impact onthe Fund
($)
Percentage ofnet assets
(%)
European Euro 14,540,100 14.8 1,454,010 1.5Hong Kong Dollar 10,961,885 11.2 1,096,189 1.1British Pound 9,800,123 10.0 980,012 1.0Taiwan Dollar 7,243,008 7.4 724,301 0.7Swiss Franc 6,552,976 6.7 655,298 0.7South Korean Won 6,232,776 6.4 623,278 0.6Thai Baht 3,920,883 4.0 392,088 0.4Turkish Lira 3,523,086 3.6 352,309 0.4Brazilian Real 2,838,542 2.9 283,854 0.3Japanese Yen 2,499,207 2.5 249,921 0.3New Zealand Dollar 544,623 0.6 54,462 0.1US Dollar (1,146,246) (1.2) (114,625) (0.1)
67,510,963 68.9 6,751,097 7.0
iii) Price risk
Price risk is the risk that the carrying value of financialinstruments will fluctuate as a result of changes in marketprices (other than those arising from interest rate risk orcurrency risk) caused by factors specific to a security, itsissuer or all factors affecting a market or a market segment.Exposure to price risk is mainly in equities, derivatives andcommodities, if applicable. As at June 30, 2015,approximately 100.7% (December 31, 2014 – 95.0%) of theFund’s net assets were exposed to price risk. If prices ofthese investments had decreased or increased by 10%, withall other variables held constant, net assets of the Fundwould have decreased or increased, respectively, byapproximately $11,536,981 (December 31, 2014 –$9,332,570). In practice, actual results may differ from thissensitivity analysis and the difference could be material.
iv) Credit risk
The Fund had no significant exposure to bonds anddebentures, preferred shares or derivatives as at June 30,2015 or December 31, 2014. In addition, all investmenttransactions are executed by brokers with an approvedcredit rating. As such the risk of default on transactionswith counterparties and brokers related to purchase andsale of securities is considered minimal. In instances wherethe credit rating were to fall below the approved rating, theManager would take appropriate action.
v) Liquidity risk
The table below summarizes the Fund’s financial liabilitiesbased on the remaining period to the contractual maturitydate.
June 30, 2015 December 31, 2014
On demand($)
Less than3 months
($)On demand
($)
Less than3 months
($)
Current liabilities – 1,048,163 – 2,673Liability for written options – – – –Unrealized loss on derivatives – 181,336 – 180,150Redeemable units 114,476,613 – 98,114,785 –
114,476,613 1,229,499 98,114,785 182,823
Redeemable units are redeemable on demand at theholder’s option. However, the Manager does not expect thatthe contractual maturity disclosed in the table above will berepresentative of the actual cash outflows, as holders ofthese instruments typically retain them for a longer term.
The accompanying notes are an integral part of the financial statements.
193
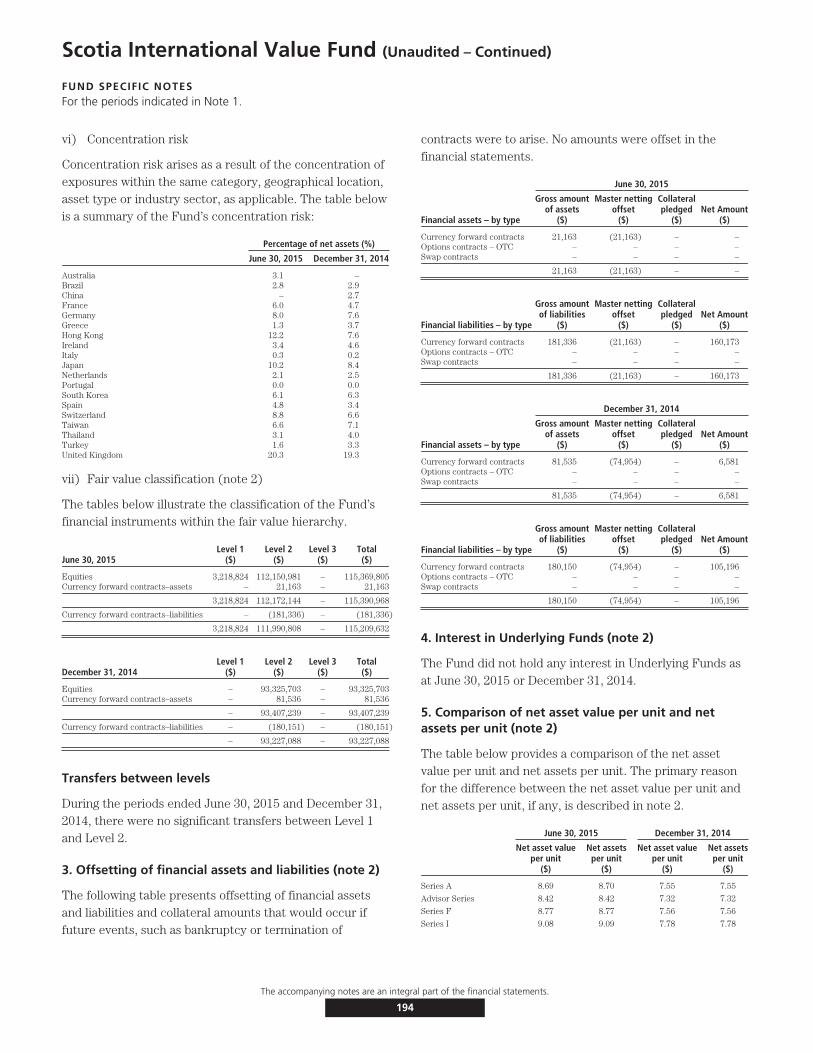
Scotia International Value Fund (Unaudited – Continued)
FUND SPECIFIC NOTESFor the periods indicated in Note 1.
vi) Concentration risk
Concentration risk arises as a result of the concentration ofexposures within the same category, geographical location,asset type or industry sector, as applicable. The table belowis a summary of the Fund’s concentration risk:
Percentage of net assets (%)
June 30, 2015 December 31, 2014
Australia 3.1 –Brazil 2.8 2.9China – 2.7France 6.0 4.7Germany 8.0 7.6Greece 1.3 3.7Hong Kong 12.2 7.6Ireland 3.4 4.6Italy 0.3 0.2Japan 10.2 8.4Netherlands 2.1 2.5Portugal 0.0 0.0South Korea 6.1 6.3Spain 4.8 3.4Switzerland 8.8 6.6Taiwan 6.6 7.1Thailand 3.1 4.0Turkey 1.6 3.3United Kingdom 20.3 19.3
vii) Fair value classification (note 2)
The tables below illustrate the classification of the Fund’sfinancial instruments within the fair value hierarchy.
June 30, 2015Level 1
($)Level 2
($)Level 3
($)Total($)
Equities 3,218,824 112,150,981 – 115,369,805Currency forward contracts–assets – 21,163 – 21,163
3,218,824 112,172,144 – 115,390,968
Currency forward contracts–liabilities – (181,336) – (181,336)
3,218,824 111,990,808 – 115,209,632
December 31, 2014Level 1
($)Level 2
($)Level 3
($)Total($)
Equities – 93,325,703 – 93,325,703Currency forward contracts–assets – 81,536 – 81,536
– 93,407,239 – 93,407,239
Currency forward contracts–liabilities – (180,151) – (180,151)
– 93,227,088 – 93,227,088
Transfers between levels
During the periods ended June 30, 2015 and December 31,2014, there were no significant transfers between Level 1and Level 2.
3. Offsetting of financial assets and liabilities (note 2)
The following table presents offsetting of financial assetsand liabilities and collateral amounts that would occur iffuture events, such as bankruptcy or termination of
contracts were to arise. No amounts were offset in thefinancial statements.
June 30, 2015
Financial assets – by type
Gross amountof assets
($)
Master nettingoffset
($)
Collateralpledged
($)Net Amount
($)
Currency forward contracts 21,163 (21,163) – –Options contracts – OTC – – – –Swap contracts – – – –
21,163 (21,163) – –
Financial liabilities – by type
Gross amountof liabilities
($)
Master nettingoffset
($)
Collateralpledged
($)Net Amount
($)
Currency forward contracts 181,336 (21,163) – 160,173Options contracts – OTC – – – –Swap contracts – – – –
181,336 (21,163) – 160,173
December 31, 2014
Financial assets – by type
Gross amountof assets
($)
Master nettingoffset
($)
Collateralpledged
($)Net Amount
($)
Currency forward contracts 81,535 (74,954) – 6,581Options contracts – OTC – – – –Swap contracts – – – –
81,535 (74,954) – 6,581
Financial liabilities – by type
Gross amountof liabilities
($)
Master nettingoffset
($)
Collateralpledged
($)Net Amount
($)
Currency forward contracts 180,150 (74,954) – 105,196Options contracts – OTC – – – –Swap contracts – – – –
180,150 (74,954) – 105,196
4. Interest in Underlying Funds (note 2)
The Fund did not hold any interest in Underlying Funds asat June 30, 2015 or December 31, 2014.
5. Comparison of net asset value per unit and netassets per unit (note 2)
The table below provides a comparison of the net assetvalue per unit and net assets per unit. The primary reasonfor the difference between the net asset value per unit andnet assets per unit, if any, is described in note 2.
June 30, 2015 December 31, 2014
Net asset valueper unit
($)
Net assetsper unit
($)
Net asset valueper unit
($)
Net assetsper unit
($)
Series A 8.69 8.70 7.55 7.55
Advisor Series 8.42 8.42 7.32 7.32
Series F 8.77 8.77 7.56 7.56
Series I 9.08 9.09 7.78 7.78
The accompanying notes are an integral part of the financial statements.
194
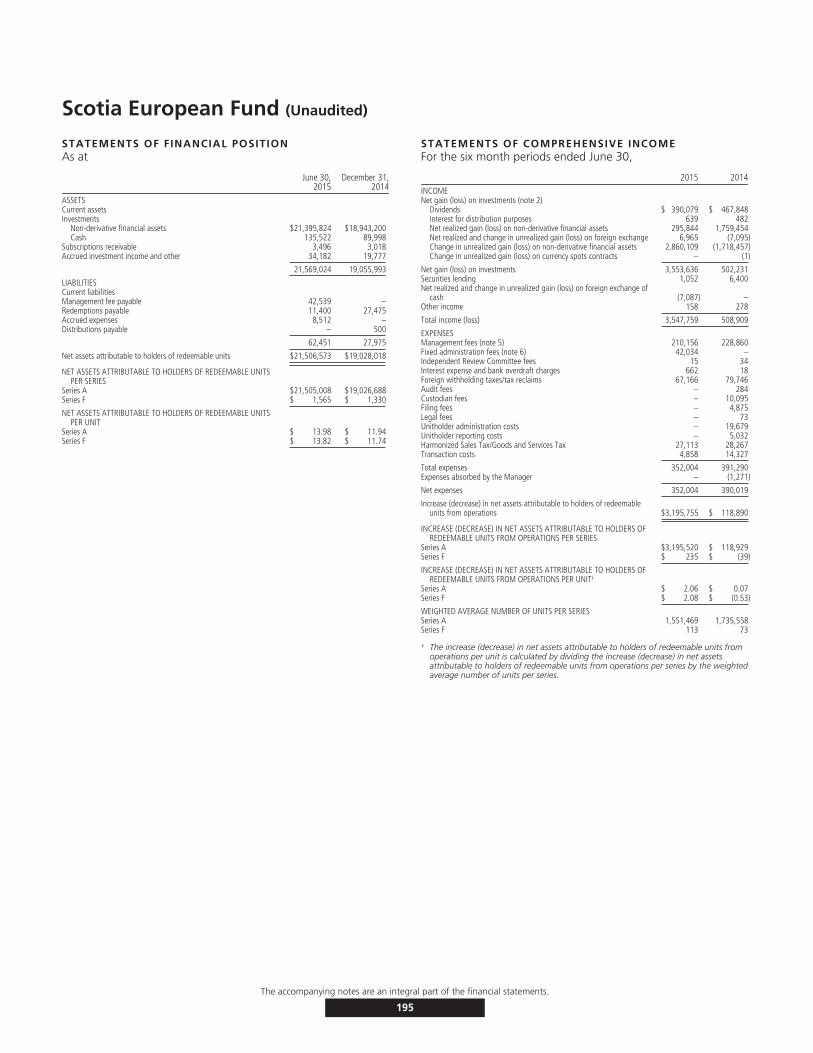
Scotia European Fund (Unaudited)
STATEMENTS OF FINANCIAL POSITIONAs at
June 30,2015
December 31,2014
ASSETSCurrent assetsInvestments
Non-derivative financial assets $21,395,824 $18,943,200Cash 135,522 89,998
Subscriptions receivable 3,496 3,018Accrued investment income and other 34,182 19,777
21,569,024 19,055,993
LIABILITIESCurrent liabilitiesManagement fee payable 42,539 –Redemptions payable 11,400 27,475Accrued expenses 8,512 –Distributions payable – 500
62,451 27,975
Net assets attributable to holders of redeemable units $21,506,573 $19,028,018
NET ASSETS ATTRIBUTABLE TO HOLDERS OF REDEEMABLE UNITSPER SERIES
Series A $21,505,008 $19,026,688Series F $ 1,565 $ 1,330
NET ASSETS ATTRIBUTABLE TO HOLDERS OF REDEEMABLE UNITSPER UNIT
Series A $ 13.98 $ 11.94Series F $ 13.82 $ 11.74
STATEMENTS OF COMPREHENSIVE INCOMEFor the six month periods ended June 30,
2015 2014INCOMENet gain (loss) on investments (note 2)
Dividends $ 390,079 $ 467,848Interest for distribution purposes 639 482Net realized gain (loss) on non-derivative financial assets 295,844 1,759,454Net realized and change in unrealized gain (loss) on foreign exchange 6,965 (7,095)Change in unrealized gain (loss) on non-derivative financial assets 2,860,109 (1,718,457)Change in unrealized gain (loss) on currency spots contracts – (1)
Net gain (loss) on investments 3,553,636 502,231Securities lending 1,052 6,400Net realized and change in unrealized gain (loss) on foreign exchange of
cash (7,087) –Other income 158 278
Total income (loss) 3,547,759 508,909
EXPENSESManagement fees (note 5) 210,156 228,860Fixed administration fees (note 6) 42,034 –Independent Review Committee fees 15 34Interest expense and bank overdraft charges 662 18Foreign withholding taxes/tax reclaims 67,166 79,746Audit fees – 284Custodian fees – 10,095Filing fees – 4,875Legal fees – 73Unitholder administration costs – 19,679Unitholder reporting costs – 5,032Harmonized Sales Tax/Goods and Services Tax 27,113 28,267Transaction costs 4,858 14,327
Total expenses 352,004 391,290Expenses absorbed by the Manager – (1,271)
Net expenses 352,004 390,019
Increase (decrease) in net assets attributable to holders of redeemableunits from operations $3,195,755 $ 118,890
INCREASE (DECREASE) IN NET ASSETS ATTRIBUTABLE TO HOLDERS OFREDEEMABLE UNITS FROM OPERATIONS PER SERIES
Series A $3,195,520 $ 118,929Series F $ 235 $ (39)
INCREASE (DECREASE) IN NET ASSETS ATTRIBUTABLE TO HOLDERS OFREDEEMABLE UNITS FROM OPERATIONS PER UNIT†
Series A $ 2.06 $ 0.07Series F $ 2.08 $ (0.53)
WEIGHTED AVERAGE NUMBER OF UNITS PER SERIESSeries A 1,551,469 1,735,558Series F 113 73
† The increase (decrease) in net assets attributable to holders of redeemable units fromoperations per unit is calculated by dividing the increase (decrease) in net assetsattributable to holders of redeemable units from operations per series by the weightedaverage number of units per series.
The accompanying notes are an integral part of the financial statements.
195
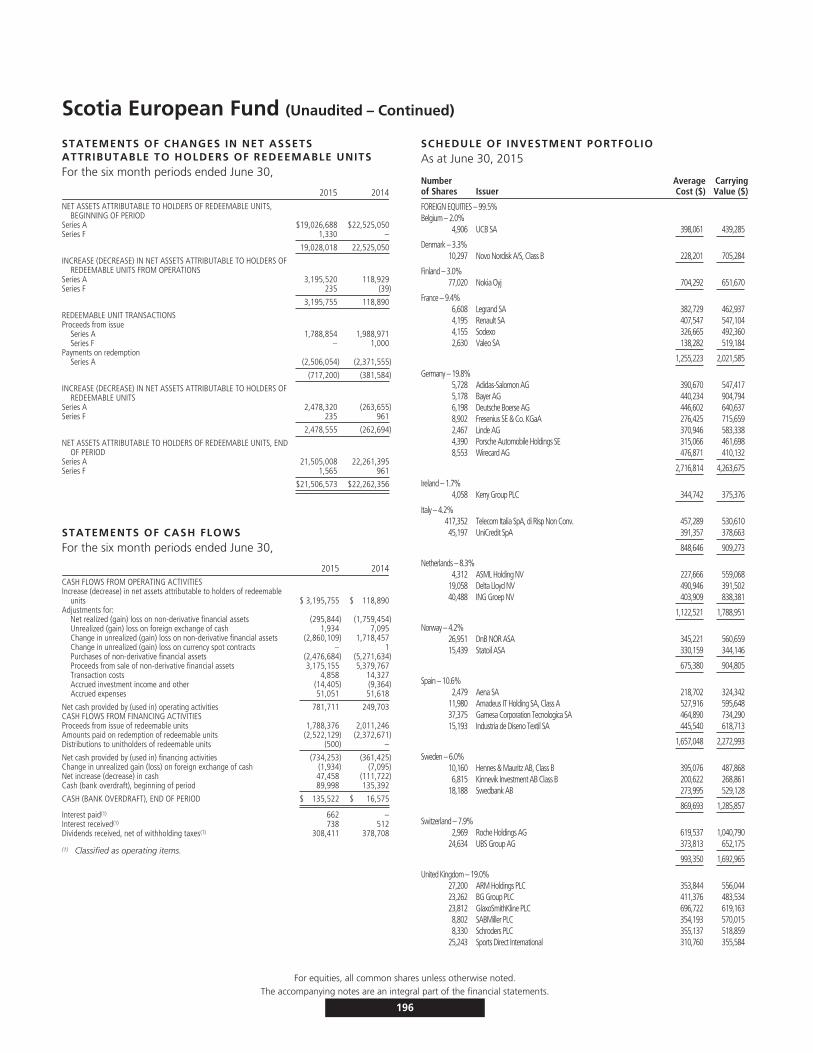
Scotia European Fund (Unaudited – Continued)
STATEMENTS OF CHANGES IN NET ASSETSATTRIBUTABLE TO HOLDERS OF REDEEMABLE UNITSFor the six month periods ended June 30,
2015 2014NET ASSETS ATTRIBUTABLE TO HOLDERS OF REDEEMABLE UNITS,
BEGINNING OF PERIODSeries A $19,026,688 $22,525,050Series F 1,330 –
19,028,018 22,525,050
INCREASE (DECREASE) IN NET ASSETS ATTRIBUTABLE TO HOLDERS OFREDEEMABLE UNITS FROM OPERATIONS
Series A 3,195,520 118,929Series F 235 (39)
3,195,755 118,890
REDEEMABLE UNIT TRANSACTIONSProceeds from issue
Series A 1,788,854 1,988,971Series F – 1,000
Payments on redemptionSeries A (2,506,054) (2,371,555)
(717,200) (381,584)
INCREASE (DECREASE) IN NET ASSETS ATTRIBUTABLE TO HOLDERS OFREDEEMABLE UNITS
Series A 2,478,320 (263,655)Series F 235 961
2,478,555 (262,694)
NET ASSETS ATTRIBUTABLE TO HOLDERS OF REDEEMABLE UNITS, ENDOF PERIOD
Series A 21,505,008 22,261,395Series F 1,565 961
$21,506,573 $22,262,356
STATEMENTS OF CASH FLOWSFor the six month periods ended June 30,
2015 2014CASH FLOWS FROM OPERATING ACTIVITIESIncrease (decrease) in net assets attributable to holders of redeemable
units $ 3,195,755 $ 118,890Adjustments for:
Net realized (gain) loss on non-derivative financial assets (295,844) (1,759,454)Unrealized (gain) loss on foreign exchange of cash 1,934 7,095Change in unrealized (gain) loss on non-derivative financial assets (2,860,109) 1,718,457Change in unrealized (gain) loss on currency spot contracts – 1Purchases of non-derivative financial assets (2,476,684) (5,271,634)Proceeds from sale of non-derivative financial assets 3,175,155 5,379,767Transaction costs 4,858 14,327Accrued investment income and other (14,405) (9,364)Accrued expenses 51,051 51,618
Net cash provided by (used in) operating activities 781,711 249,703CASH FLOWS FROM FINANCING ACTIVITIESProceeds from issue of redeemable units 1,788,376 2,011,246Amounts paid on redemption of redeemable units (2,522,129) (2,372,671)Distributions to unitholders of redeemable units (500) –
Net cash provided by (used in) financing activities (734,253) (361,425)Change in unrealized gain (loss) on foreign exchange of cash (1,934) (7,095)Net increase (decrease) in cash 47,458 (111,722)Cash (bank overdraft), beginning of period 89,998 135,392
CASH (BANK OVERDRAFT), END OF PERIOD $ 135,522 $ 16,575
Interest paid(1) 662 –Interest received(1) 738 512Dividends received, net of withholding taxes(1) 308,411 378,708
(1) Classified as operating items.
SCHEDULE OF INVESTMENT PORTFOLIOAs at June 30, 2015
Numberof Shares Issuer
AverageCost ($)
CarryingValue ($)
FOREIGN EQUITIES – 99.5%Belgium – 2.0%
4,906 UCB SA 398,061 439,285
Denmark – 3.3%10,297 Novo Nordisk A/S, Class B 228,201 705,284
Finland – 3.0%77,020 Nokia Oyj 704,292 651,670
France – 9.4%6,608 Legrand SA 382,729 462,9374,195 Renault SA 407,547 547,1044,155 Sodexo 326,665 492,3602,630 Valeo SA 138,282 519,184
1,255,223 2,021,585
Germany – 19.8%5,728 Adidas-Salomon AG 390,670 547,4175,178 Bayer AG 440,234 904,7946,198 Deutsche Boerse AG 446,602 640,6378,902 Fresenius SE & Co. KGaA 276,425 715,6592,467 Linde AG 370,946 583,3384,390 Porsche Automobile Holdings SE 315,066 461,6988,553 Wirecard AG 476,871 410,132
2,716,814 4,263,675
Ireland – 1.7%4,058 Kerry Group PLC 344,742 375,376
Italy – 4.2%417,352 Telecom Italia SpA, di Risp Non Conv. 457,289 530,61045,197 UniCredit SpA 391,357 378,663
848,646 909,273
Netherlands – 8.3%4,312 ASML Holding NV 227,666 559,068
19,058 Delta Lloyd NV 490,946 391,50240,488 ING Groep NV 403,909 838,381
1,122,521 1,788,951
Norway – 4.2%26,951 DnB NOR ASA 345,221 560,65915,439 Statoil ASA 330,159 344,146
675,380 904,805
Spain – 10.6%2,479 Aena SA 218,702 324,342
11,980 Amadeus IT Holding SA, Class A 527,916 595,64837,375 Gamesa Corporation Tecnologica SA 464,890 734,29015,193 Industria de Diseno Textil SA 445,540 618,713
1,657,048 2,272,993
Sweden – 6.0%10,160 Hennes & Mauritz AB, Class B 395,076 487,8686,815 Kinnevik Investment AB Class B 200,622 268,861
18,188 Swedbank AB 273,995 529,128
869,693 1,285,857
Switzerland – 7.9%2,969 Roche Holdings AG 619,537 1,040,790
24,634 UBS Group AG 373,813 652,175
993,350 1,692,965
United Kingdom – 19.0%27,200 ARM Holdings PLC 353,844 556,04423,262 BG Group PLC 411,376 483,53423,812 GlaxoSmithKline PLC 696,722 619,1638,802 SABMiller PLC 354,193 570,0158,330 Schroders PLC 355,137 518,859
25,243 Sports Direct International 310,760 355,584
For equities, all common shares unless otherwise noted.The accompanying notes are an integral part of the financial statements.
196
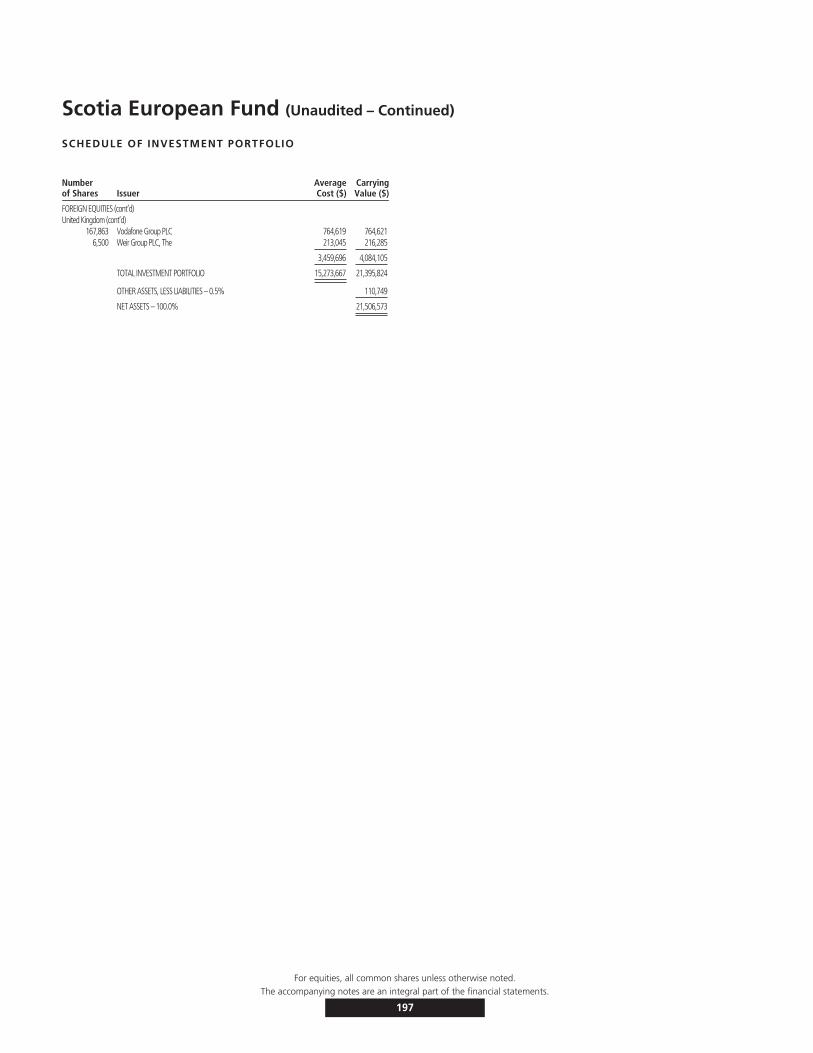
Scotia European Fund (Unaudited – Continued)
SCHEDULE OF INVESTMENT PORTFOLIO
Numberof Shares Issuer
AverageCost ($)
CarryingValue ($)
FOREIGN EQUITIES (cont’d)United Kingdom (cont’d)
167,863 Vodafone Group PLC 764,619 764,6216,500 Weir Group PLC, The 213,045 216,285
3,459,696 4,084,105
TOTAL INVESTMENT PORTFOLIO 15,273,667 21,395,824
OTHER ASSETS, LESS LIABILITIES – 0.5% 110,749
NET ASSETS – 100.0% 21,506,573
For equities, all common shares unless otherwise noted.The accompanying notes are an integral part of the financial statements.
197
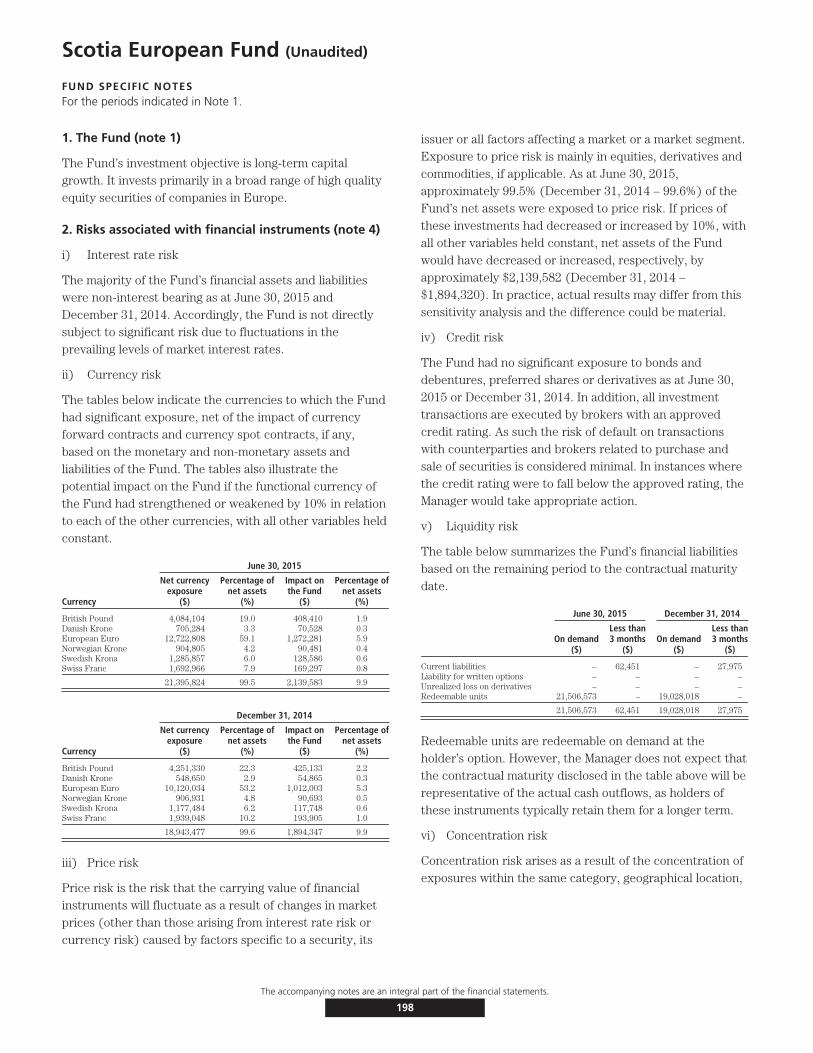
Scotia European Fund (Unaudited)
FUND SPECIFIC NOTESFor the periods indicated in Note 1.
1. The Fund (note 1)
The Fund’s investment objective is long-term capitalgrowth. It invests primarily in a broad range of high qualityequity securities of companies in Europe.
2. Risks associated with financial instruments (note 4)
i) Interest rate risk
The majority of the Fund’s financial assets and liabilitieswere non-interest bearing as at June 30, 2015 andDecember 31, 2014. Accordingly, the Fund is not directlysubject to significant risk due to fluctuations in theprevailing levels of market interest rates.
ii) Currency risk
The tables below indicate the currencies to which the Fundhad significant exposure, net of the impact of currencyforward contracts and currency spot contracts, if any,based on the monetary and non-monetary assets andliabilities of the Fund. The tables also illustrate thepotential impact on the Fund if the functional currency ofthe Fund had strengthened or weakened by 10% in relationto each of the other currencies, with all other variables heldconstant.
June 30, 2015
Currency
Net currencyexposure
($)
Percentage ofnet assets
(%)
Impact onthe Fund
($)
Percentage ofnet assets
(%)
British Pound 4,084,104 19.0 408,410 1.9Danish Krone 705,284 3.3 70,528 0.3European Euro 12,722,808 59.1 1,272,281 5.9Norwegian Krone 904,805 4.2 90,481 0.4Swedish Krona 1,285,857 6.0 128,586 0.6Swiss Franc 1,692,966 7.9 169,297 0.8
21,395,824 99.5 2,139,583 9.9
December 31, 2014
Currency
Net currencyexposure
($)
Percentage ofnet assets
(%)
Impact onthe Fund
($)
Percentage ofnet assets
(%)
British Pound 4,251,330 22.3 425,133 2.2Danish Krone 548,650 2.9 54,865 0.3European Euro 10,120,034 53.2 1,012,003 5.3Norwegian Krone 906,931 4.8 90,693 0.5Swedish Krona 1,177,484 6.2 117,748 0.6Swiss Franc 1,939,048 10.2 193,905 1.0
18,943,477 99.6 1,894,347 9.9
iii) Price risk
Price risk is the risk that the carrying value of financialinstruments will fluctuate as a result of changes in marketprices (other than those arising from interest rate risk orcurrency risk) caused by factors specific to a security, its
issuer or all factors affecting a market or a market segment.Exposure to price risk is mainly in equities, derivatives andcommodities, if applicable. As at June 30, 2015,approximately 99.5% (December 31, 2014 – 99.6%) of theFund’s net assets were exposed to price risk. If prices ofthese investments had decreased or increased by 10%, withall other variables held constant, net assets of the Fundwould have decreased or increased, respectively, byapproximately $2,139,582 (December 31, 2014 –$1,894,320). In practice, actual results may differ from thissensitivity analysis and the difference could be material.
iv) Credit risk
The Fund had no significant exposure to bonds anddebentures, preferred shares or derivatives as at June 30,2015 or December 31, 2014. In addition, all investmenttransactions are executed by brokers with an approvedcredit rating. As such the risk of default on transactionswith counterparties and brokers related to purchase andsale of securities is considered minimal. In instances wherethe credit rating were to fall below the approved rating, theManager would take appropriate action.
v) Liquidity risk
The table below summarizes the Fund’s financial liabilitiesbased on the remaining period to the contractual maturitydate.
June 30, 2015 December 31, 2014
On demand($)
Less than3 months
($)On demand
($)
Less than3 months
($)
Current liabilities – 62,451 – 27,975Liability for written options – – – –Unrealized loss on derivatives – – – –Redeemable units 21,506,573 – 19,028,018 –
21,506,573 62,451 19,028,018 27,975
Redeemable units are redeemable on demand at theholder’s option. However, the Manager does not expect thatthe contractual maturity disclosed in the table above will berepresentative of the actual cash outflows, as holders ofthese instruments typically retain them for a longer term.
vi) Concentration risk
Concentration risk arises as a result of the concentration ofexposures within the same category, geographical location,
The accompanying notes are an integral part of the financial statements.
198
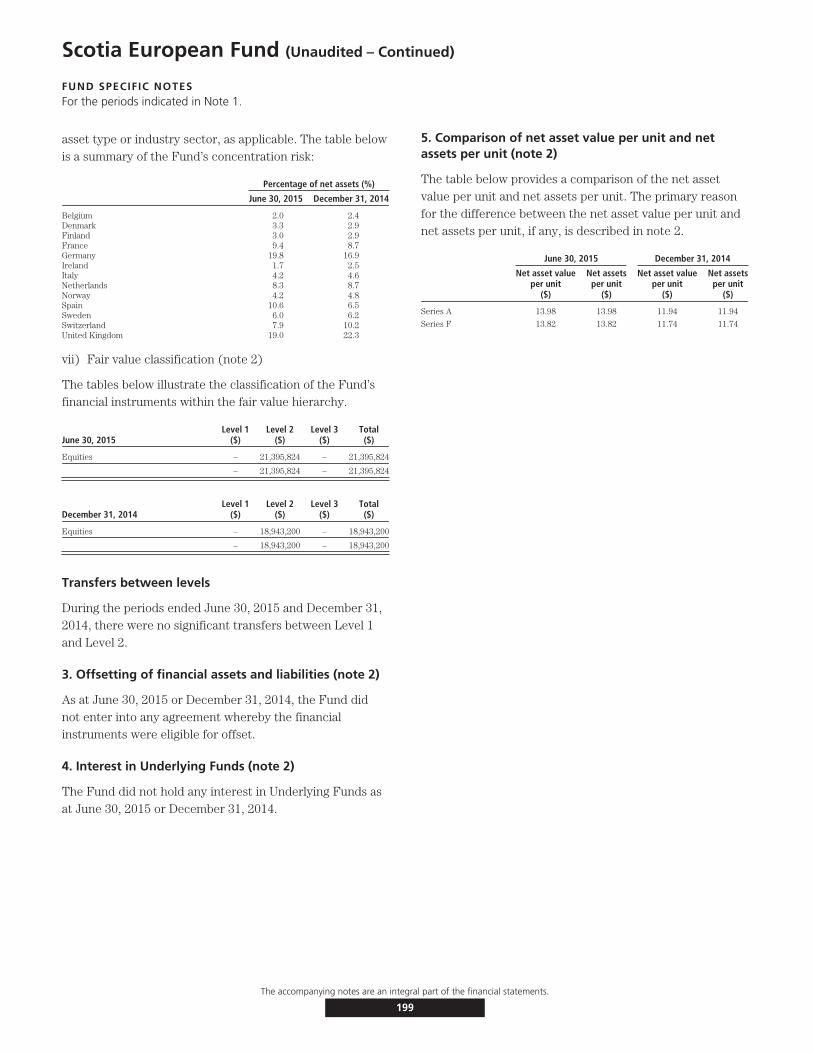
Scotia European Fund (Unaudited – Continued)
FUND SPECIFIC NOTESFor the periods indicated in Note 1.
asset type or industry sector, as applicable. The table belowis a summary of the Fund’s concentration risk:
Percentage of net assets (%)
June 30, 2015 December 31, 2014
Belgium 2.0 2.4Denmark 3.3 2.9Finland 3.0 2.9France 9.4 8.7Germany 19.8 16.9Ireland 1.7 2.5Italy 4.2 4.6Netherlands 8.3 8.7Norway 4.2 4.8Spain 10.6 6.5Sweden 6.0 6.2Switzerland 7.9 10.2United Kingdom 19.0 22.3
vii) Fair value classification (note 2)
The tables below illustrate the classification of the Fund’sfinancial instruments within the fair value hierarchy.
June 30, 2015Level 1
($)Level 2
($)Level 3
($)Total($)
Equities – 21,395,824 – 21,395,824
– 21,395,824 – 21,395,824
December 31, 2014Level 1
($)Level 2
($)Level 3
($)Total($)
Equities – 18,943,200 – 18,943,200
– 18,943,200 – 18,943,200
Transfers between levels
During the periods ended June 30, 2015 and December 31,2014, there were no significant transfers between Level 1and Level 2.
3. Offsetting of financial assets and liabilities (note 2)
As at June 30, 2015 or December 31, 2014, the Fund didnot enter into any agreement whereby the financialinstruments were eligible for offset.
4. Interest in Underlying Funds (note 2)
The Fund did not hold any interest in Underlying Funds asat June 30, 2015 or December 31, 2014.
5. Comparison of net asset value per unit and netassets per unit (note 2)
The table below provides a comparison of the net assetvalue per unit and net assets per unit. The primary reasonfor the difference between the net asset value per unit andnet assets per unit, if any, is described in note 2.
June 30, 2015 December 31, 2014
Net asset valueper unit
($)
Net assetsper unit
($)
Net asset valueper unit
($)
Net assetsper unit
($)
Series A 13.98 13.98 11.94 11.94
Series F 13.82 13.82 11.74 11.74
The accompanying notes are an integral part of the financial statements.
199
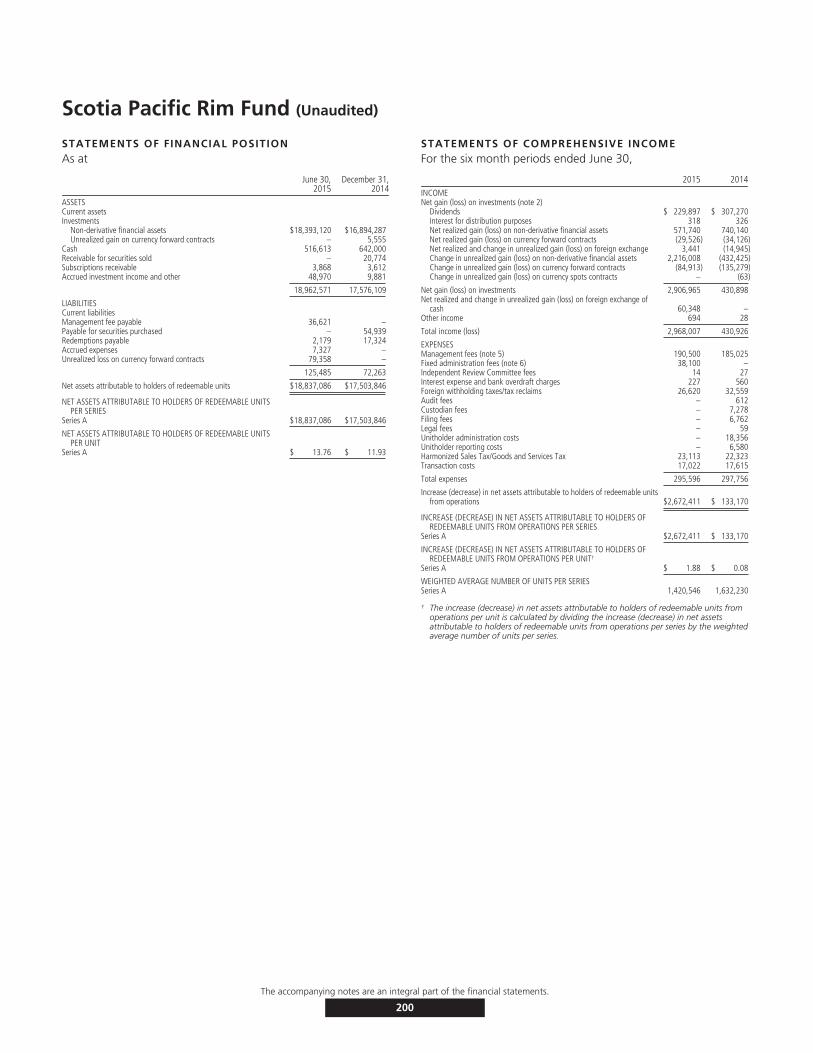
Scotia Pacific Rim Fund (Unaudited)
STATEMENTS OF FINANCIAL POSITIONAs at
June 30,2015
December 31,2014
ASSETSCurrent assetsInvestments
Non-derivative financial assets $18,393,120 $16,894,287Unrealized gain on currency forward contracts – 5,555
Cash 516,613 642,000Receivable for securities sold – 20,774Subscriptions receivable 3,868 3,612Accrued investment income and other 48,970 9,881
18,962,571 17,576,109
LIABILITIESCurrent liabilitiesManagement fee payable 36,621 –Payable for securities purchased – 54,939Redemptions payable 2,179 17,324Accrued expenses 7,327 –Unrealized loss on currency forward contracts 79,358 –
125,485 72,263
Net assets attributable to holders of redeemable units $18,837,086 $17,503,846
NET ASSETS ATTRIBUTABLE TO HOLDERS OF REDEEMABLE UNITSPER SERIES
Series A $18,837,086 $17,503,846
NET ASSETS ATTRIBUTABLE TO HOLDERS OF REDEEMABLE UNITSPER UNIT
Series A $ 13.76 $ 11.93
STATEMENTS OF COMPREHENSIVE INCOMEFor the six month periods ended June 30,
2015 2014INCOMENet gain (loss) on investments (note 2)
Dividends $ 229,897 $ 307,270Interest for distribution purposes 318 326Net realized gain (loss) on non-derivative financial assets 571,740 740,140Net realized gain (loss) on currency forward contracts (29,526) (34,126)Net realized and change in unrealized gain (loss) on foreign exchange 3,441 (14,945)Change in unrealized gain (loss) on non-derivative financial assets 2,216,008 (432,425)Change in unrealized gain (loss) on currency forward contracts (84,913) (135,279)Change in unrealized gain (loss) on currency spots contracts – (63)
Net gain (loss) on investments 2,906,965 430,898Net realized and change in unrealized gain (loss) on foreign exchange of
cash 60,348 –Other income 694 28
Total income (loss) 2,968,007 430,926
EXPENSESManagement fees (note 5) 190,500 185,025Fixed administration fees (note 6) 38,100 –Independent Review Committee fees 14 27Interest expense and bank overdraft charges 227 560Foreign withholding taxes/tax reclaims 26,620 32,559Audit fees – 612Custodian fees – 7,278Filing fees – 6,762Legal fees – 59Unitholder administration costs – 18,356Unitholder reporting costs – 6,580Harmonized Sales Tax/Goods and Services Tax 23,113 22,323Transaction costs 17,022 17,615
Total expenses 295,596 297,756
Increase (decrease) in net assets attributable to holders of redeemable unitsfrom operations $2,672,411 $ 133,170
INCREASE (DECREASE) IN NET ASSETS ATTRIBUTABLE TO HOLDERS OFREDEEMABLE UNITS FROM OPERATIONS PER SERIES
Series A $2,672,411 $ 133,170
INCREASE (DECREASE) IN NET ASSETS ATTRIBUTABLE TO HOLDERS OFREDEEMABLE UNITS FROM OPERATIONS PER UNIT†
Series A $ 1.88 $ 0.08
WEIGHTED AVERAGE NUMBER OF UNITS PER SERIESSeries A 1,420,546 1,632,230
† The increase (decrease) in net assets attributable to holders of redeemable units fromoperations per unit is calculated by dividing the increase (decrease) in net assetsattributable to holders of redeemable units from operations per series by the weightedaverage number of units per series.
The accompanying notes are an integral part of the financial statements.
200
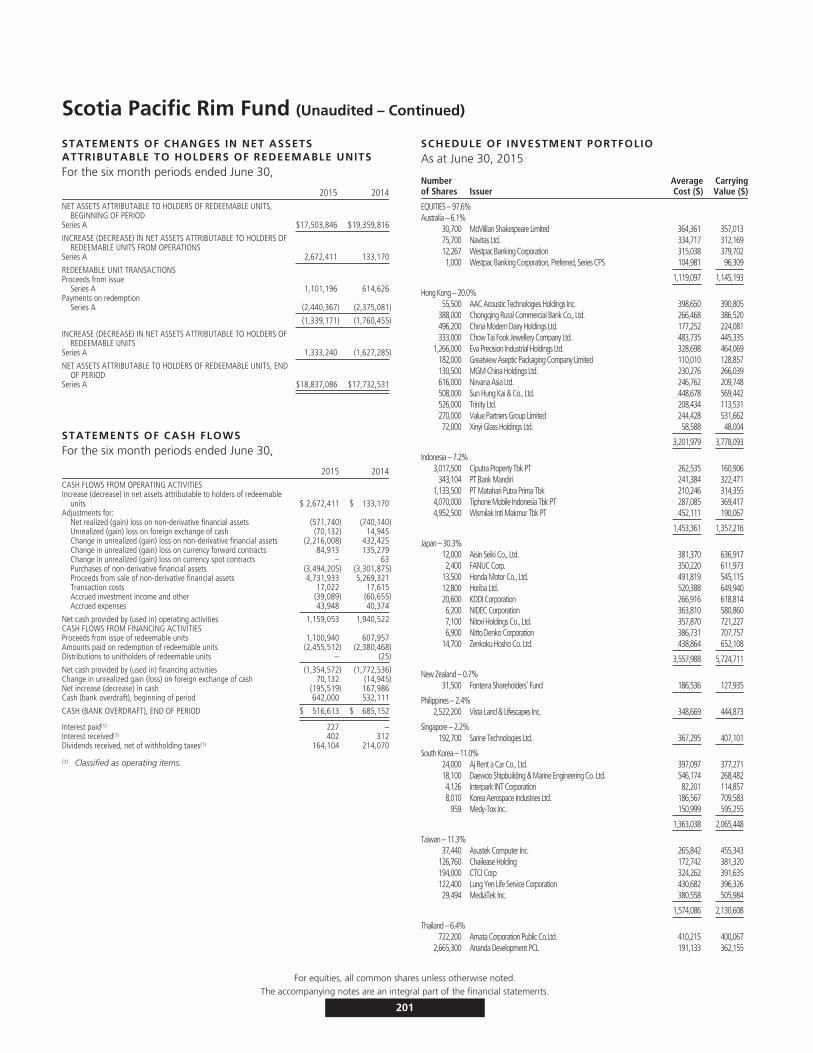
Scotia Pacific Rim Fund (Unaudited – Continued)
STATEMENTS OF CHANGES IN NET ASSETSATTRIBUTABLE TO HOLDERS OF REDEEMABLE UNITSFor the six month periods ended June 30,
2015 2014NET ASSETS ATTRIBUTABLE TO HOLDERS OF REDEEMABLE UNITS,
BEGINNING OF PERIODSeries A $17,503,846 $19,359,816
INCREASE (DECREASE) IN NET ASSETS ATTRIBUTABLE TO HOLDERS OFREDEEMABLE UNITS FROM OPERATIONS
Series A 2,672,411 133,170
REDEEMABLE UNIT TRANSACTIONSProceeds from issue
Series A 1,101,196 614,626Payments on redemption
Series A (2,440,367) (2,375,081)
(1,339,171) (1,760,455)
INCREASE (DECREASE) IN NET ASSETS ATTRIBUTABLE TO HOLDERS OFREDEEMABLE UNITS
Series A 1,333,240 (1,627,285)
NET ASSETS ATTRIBUTABLE TO HOLDERS OF REDEEMABLE UNITS, ENDOF PERIOD
Series A $18,837,086 $17,732,531
STATEMENTS OF CASH FLOWSFor the six month periods ended June 30,
2015 2014CASH FLOWS FROM OPERATING ACTIVITIESIncrease (decrease) in net assets attributable to holders of redeemable
units $ 2,672,411 $ 133,170Adjustments for:
Net realized (gain) loss on non-derivative financial assets (571,740) (740,140)Unrealized (gain) loss on foreign exchange of cash (70,132) 14,945Change in unrealized (gain) loss on non-derivative financial assets (2,216,008) 432,425Change in unrealized (gain) loss on currency forward contracts 84,913 135,279Change in unrealized (gain) loss on currency spot contracts – 63Purchases of non-derivative financial assets (3,494,205) (3,301,875)Proceeds from sale of non-derivative financial assets 4,731,933 5,269,321Transaction costs 17,022 17,615Accrued investment income and other (39,089) (60,655)Accrued expenses 43,948 40,374
Net cash provided by (used in) operating activities 1,159,053 1,940,522CASH FLOWS FROM FINANCING ACTIVITIESProceeds from issue of redeemable units 1,100,940 607,957Amounts paid on redemption of redeemable units (2,455,512) (2,380,468)Distributions to unitholders of redeemable units – (25)
Net cash provided by (used in) financing activities (1,354,572) (1,772,536)Change in unrealized gain (loss) on foreign exchange of cash 70,132 (14,945)Net increase (decrease) in cash (195,519) 167,986Cash (bank overdraft), beginning of period 642,000 532,111
CASH (BANK OVERDRAFT), END OF PERIOD $ 516,613 $ 685,152
Interest paid(1) 227 –Interest received(1) 402 312Dividends received, net of withholding taxes(1) 164,104 214,070
(1) Classified as operating items.
SCHEDULE OF INVESTMENT PORTFOLIOAs at June 30, 2015
Numberof Shares Issuer
AverageCost ($)
CarryingValue ($)
EQUITIES – 97.6%Australia – 6.1%
30,700 McMillan Shakespeare Limited 364,361 357,01375,700 Navitas Ltd. 334,717 312,16912,267 Westpac Banking Corporation 315,038 379,7021,000 Westpac Banking Corporation, Preferred, Series CPS 104,981 96,309
1,119,097 1,145,193
Hong Kong – 20.0%55,500 AAC Acoustic Technologies Holdings Inc. 398,650 390,805
388,000 Chongqing Rural Commercial Bank Co., Ltd. 266,468 386,520496,200 China Modern Dairy Holdings Ltd. 177,252 224,081333,000 Chow Tai Fook Jewellery Company Ltd. 483,735 445,335
1,266,000 Eva Precision Industrial Holdings Ltd. 328,698 464,069182,000 Greatview Aseptic Packaging Company Limited 110,010 128,857130,500 MGM China Holdings Ltd. 230,276 266,039616,000 Nirvana Asia Ltd. 246,762 209,748508,000 Sun Hung Kai & Co., Ltd. 448,678 569,442526,000 Trinity Ltd. 208,434 113,531270,000 Value Partners Group Limited 244,428 531,66272,000 Xinyi Glass Holdings Ltd. 58,588 48,004
3,201,979 3,778,093
Indonesia – 7.2%3,017,500 Ciputra Property Tbk PT 262,535 160,906
343,104 PT Bank Mandiri 241,384 322,4711,133,500 PT Matahari Putra Prima Tbk 210,246 314,3554,070,000 Tiphone Mobile Indonesia Tbk PT 287,085 369,4174,952,500 Wismilak Inti Makmur Tbk PT 452,111 190,067
1,453,361 1,357,216
Japan – 30.3%12,000 Aisin Seiki Co., Ltd. 381,370 636,9172,400 FANUC Corp. 350,220 611,973
13,500 Honda Motor Co., Ltd. 491,819 545,11512,800 Horiba Ltd. 520,388 649,94020,600 KDDI Corporation 266,916 618,8146,200 NIDEC Corporation 363,810 580,8607,100 Nitori Holdings Co., Ltd. 357,870 721,2276,900 Nitto Denko Corporation 386,731 707,757
14,700 Zenkoku Hosho Co. Ltd. 438,864 652,108
3,557,988 5,724,711
New Zealand – 0.7%31,500 Fonterra Shareholders’ Fund 186,536 127,935
Philippines – 2.4%2,522,200 Vista Land & Lifescapes Inc. 348,669 444,873
Singapore – 2.2%192,700 Sarine Technologies Ltd. 367,295 407,101
South Korea – 11.0%24,000 Aj Rent a Car Co., Ltd. 397,097 377,27118,100 Daewoo Shipbuilding & Marine Engineering Co. Ltd. 546,174 268,4824,126 Interpark INT Corporation 82,201 114,8578,010 Korea Aerospace Industries Ltd. 186,567 709,583
959 Medy-Tox Inc. 150,999 595,255
1,363,038 2,065,448
Taiwan – 11.3%37,440 Asustek Computer Inc. 265,842 455,343
126,760 Chailease Holding 172,742 381,320194,000 CTCI Corp 324,262 391,635122,400 Lung Yen Life Service Corporation 430,682 396,32629,494 MediaTek Inc. 380,558 505,984
1,574,086 2,130,608
Thailand – 6.4%722,200 Amata Corporation Public Co.Ltd. 410,215 400,067
2,665,300 Ananda Development PCL 191,133 362,155
For equities, all common shares unless otherwise noted.The accompanying notes are an integral part of the financial statements.
201

Scotia Pacific Rim Fund (Unaudited – Continued)
SCHEDULE OF INVESTMENT PORTFOLIO
Numberof Shares Issuer
AverageCost ($)
CarryingValue ($)
EQUITIES (cont’d)Thailand (cont’d)
237,350 Krung Thai Bank Public Company Limited 136,783 149,545321,100 Pruksa Real Estate PCL 265,276 300,175
1,003,407 1,211,942
TOTAL INVESTMENT PORTFOLIO 14,175,456 18,393,120
Currency Forward Contracts – (0.4%) (79,358)OTHER ASSETS, LESS LIABILITIES – 2.8% 523,324
NET ASSETS – 100.0% 18,837,086
CURRENCY FORWARD CONTRACTS
Settlement Date Currency To Be ReceivedContractual
Amount Currency To Be DeliveredContractual
AmountCanadian Value as at
June 30, 2015 ($)
Canadian ($)Appreciation/
(Depreciation)Aug. 25, 2015 Canadian Dollar 397,772 Japanese Yen 40,000,000 408,802 (11,030)Aug. 28, 2015 Canadian Dollar 1,743,807 Japanese Yen 175,400,000 1,792,725 (48,917)Aug. 28, 2015 Canadian Dollar 691,956 Japanese Yen 69,600,000 711,366 (19,411)
(79,358)
The currency forward contracts outstanding at June 30, 2015 are placed with a financial institution with a credit rating of A by Standard & Poor’s.
For equities, all common shares unless otherwise noted.The accompanying notes are an integral part of the financial statements.
202
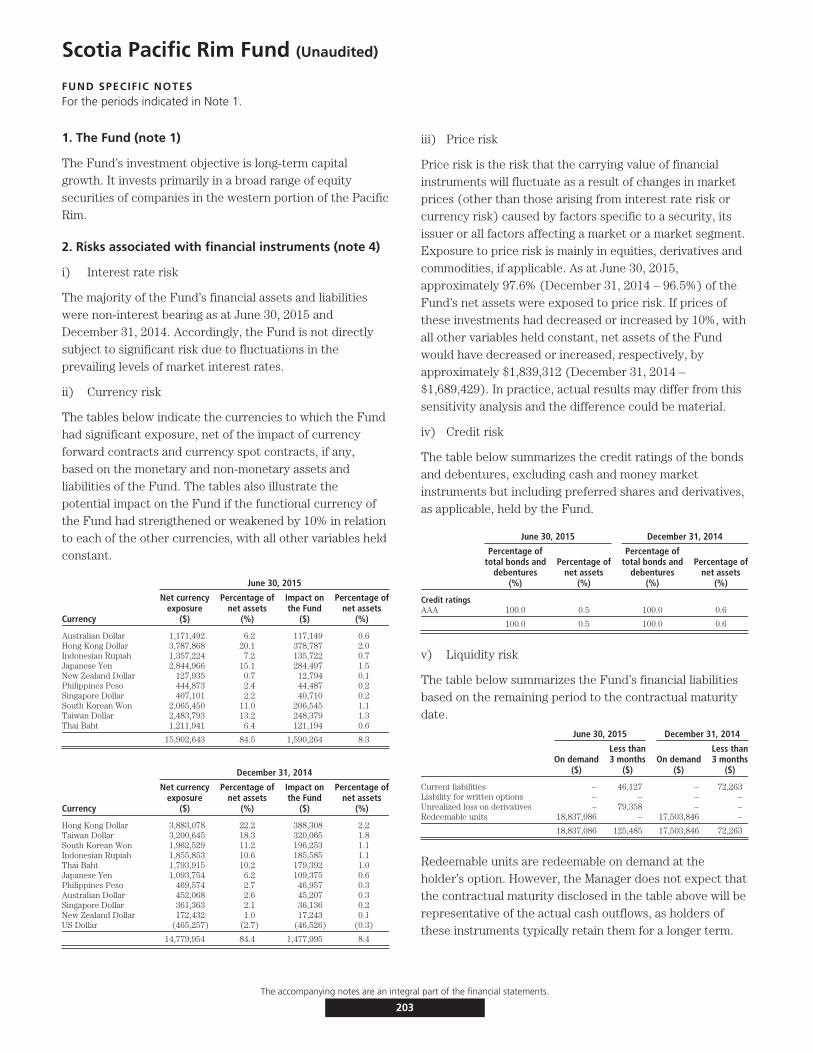
Scotia Pacific Rim Fund (Unaudited)
FUND SPECIFIC NOTESFor the periods indicated in Note 1.
1. The Fund (note 1)
The Fund’s investment objective is long-term capitalgrowth. It invests primarily in a broad range of equitysecurities of companies in the western portion of the PacificRim.
2. Risks associated with financial instruments (note 4)
i) Interest rate risk
The majority of the Fund’s financial assets and liabilitieswere non-interest bearing as at June 30, 2015 andDecember 31, 2014. Accordingly, the Fund is not directlysubject to significant risk due to fluctuations in theprevailing levels of market interest rates.
ii) Currency risk
The tables below indicate the currencies to which the Fundhad significant exposure, net of the impact of currencyforward contracts and currency spot contracts, if any,based on the monetary and non-monetary assets andliabilities of the Fund. The tables also illustrate thepotential impact on the Fund if the functional currency ofthe Fund had strengthened or weakened by 10% in relationto each of the other currencies, with all other variables heldconstant.
June 30, 2015
Currency
Net currencyexposure
($)
Percentage ofnet assets
(%)
Impact onthe Fund
($)
Percentage ofnet assets
(%)
Australian Dollar 1,171,492 6.2 117,149 0.6Hong Kong Dollar 3,787,868 20.1 378,787 2.0Indonesian Rupiah 1,357,224 7.2 135,722 0.7Japanese Yen 2,844,966 15.1 284,497 1.5New Zealand Dollar 127,935 0.7 12,794 0.1Philippines Peso 444,873 2.4 44,487 0.2Singapore Dollar 407,101 2.2 40,710 0.2South Korean Won 2,065,450 11.0 206,545 1.1Taiwan Dollar 2,483,793 13.2 248,379 1.3Thai Baht 1,211,941 6.4 121,194 0.6
15,902,643 84.5 1,590,264 8.3
December 31, 2014
Currency
Net currencyexposure
($)
Percentage ofnet assets
(%)
Impact onthe Fund
($)
Percentage ofnet assets
(%)
Hong Kong Dollar 3,883,078 22.2 388,308 2.2Taiwan Dollar 3,200,645 18.3 320,065 1.8South Korean Won 1,962,529 11.2 196,253 1.1Indonesian Rupiah 1,855,853 10.6 185,585 1.1Thai Baht 1,793,915 10.2 179,392 1.0Japanese Yen 1,093,754 6.2 109,375 0.6Philippines Peso 469,574 2.7 46,957 0.3Australian Dollar 452,068 2.6 45,207 0.3Singapore Dollar 361,363 2.1 36,136 0.2New Zealand Dollar 172,432 1.0 17,243 0.1US Dollar (465,257) (2.7) (46,526) (0.3)
14,779,954 84.4 1,477,995 8.4
iii) Price risk
Price risk is the risk that the carrying value of financialinstruments will fluctuate as a result of changes in marketprices (other than those arising from interest rate risk orcurrency risk) caused by factors specific to a security, itsissuer or all factors affecting a market or a market segment.Exposure to price risk is mainly in equities, derivatives andcommodities, if applicable. As at June 30, 2015,approximately 97.6% (December 31, 2014 – 96.5%) of theFund’s net assets were exposed to price risk. If prices ofthese investments had decreased or increased by 10%, withall other variables held constant, net assets of the Fundwould have decreased or increased, respectively, byapproximately $1,839,312 (December 31, 2014 –$1,689,429). In practice, actual results may differ from thissensitivity analysis and the difference could be material.
iv) Credit risk
The table below summarizes the credit ratings of the bondsand debentures, excluding cash and money marketinstruments but including preferred shares and derivatives,as applicable, held by the Fund.
June 30, 2015 December 31, 2014
Percentage oftotal bonds and
debentures(%)
Percentage ofnet assets
(%)
Percentage oftotal bonds and
debentures(%)
Percentage ofnet assets
(%)
Credit ratingsAAA 100.0 0.5 100.0 0.6
100.0 0.5 100.0 0.6
v) Liquidity risk
The table below summarizes the Fund’s financial liabilitiesbased on the remaining period to the contractual maturitydate.
June 30, 2015 December 31, 2014
On demand($)
Less than3 months
($)On demand
($)
Less than3 months
($)
Current liabilities – 46,127 – 72,263Liability for written options – – – –Unrealized loss on derivatives – 79,358 – –Redeemable units 18,837,086 – 17,503,846 –
18,837,086 125,485 17,503,846 72,263
Redeemable units are redeemable on demand at theholder’s option. However, the Manager does not expect thatthe contractual maturity disclosed in the table above will berepresentative of the actual cash outflows, as holders ofthese instruments typically retain them for a longer term.
The accompanying notes are an integral part of the financial statements.
203
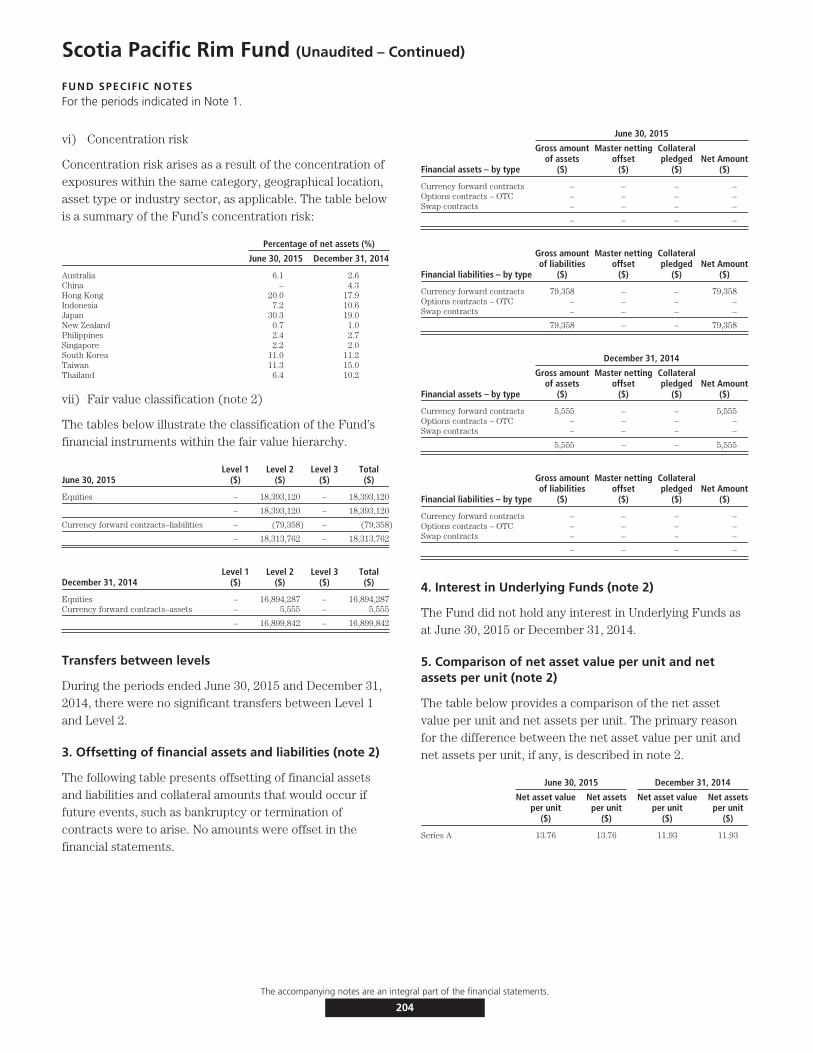
Scotia Pacific Rim Fund (Unaudited – Continued)
FUND SPECIFIC NOTESFor the periods indicated in Note 1.
vi) Concentration risk
Concentration risk arises as a result of the concentration ofexposures within the same category, geographical location,asset type or industry sector, as applicable. The table belowis a summary of the Fund’s concentration risk:
Percentage of net assets (%)
June 30, 2015 December 31, 2014
Australia 6.1 2.6China – 4.3Hong Kong 20.0 17.9Indonesia 7.2 10.6Japan 30.3 19.0New Zealand 0.7 1.0Philippines 2.4 2.7Singapore 2.2 2.0South Korea 11.0 11.2Taiwan 11.3 15.0Thailand 6.4 10.2
vii) Fair value classification (note 2)
The tables below illustrate the classification of the Fund’sfinancial instruments within the fair value hierarchy.
June 30, 2015Level 1
($)Level 2
($)Level 3
($)Total($)
Equities – 18,393,120 – 18,393,120
– 18,393,120 – 18,393,120
Currency forward contracts–liabilities – (79,358) – (79,358)
– 18,313,762 – 18,313,762
December 31, 2014Level 1
($)Level 2
($)Level 3
($)Total($)
Equities – 16,894,287 – 16,894,287Currency forward contracts–assets – 5,555 – 5,555
– 16,899,842 – 16,899,842
Transfers between levels
During the periods ended June 30, 2015 and December 31,2014, there were no significant transfers between Level 1and Level 2.
3. Offsetting of financial assets and liabilities (note 2)
The following table presents offsetting of financial assetsand liabilities and collateral amounts that would occur iffuture events, such as bankruptcy or termination ofcontracts were to arise. No amounts were offset in thefinancial statements.
June 30, 2015
Financial assets – by type
Gross amountof assets
($)
Master nettingoffset
($)
Collateralpledged
($)Net Amount
($)
Currency forward contracts – – – –Options contracts – OTC – – – –Swap contracts – – – –
– – – –
Financial liabilities – by type
Gross amountof liabilities
($)
Master nettingoffset
($)
Collateralpledged
($)Net Amount
($)
Currency forward contracts 79,358 – – 79,358Options contracts – OTC – – – –Swap contracts – – – –
79,358 – – 79,358
December 31, 2014
Financial assets – by type
Gross amountof assets
($)
Master nettingoffset
($)
Collateralpledged
($)Net Amount
($)
Currency forward contracts 5,555 – – 5,555Options contracts – OTC – – – –Swap contracts – – – –
5,555 – – 5,555
Financial liabilities – by type
Gross amountof liabilities
($)
Master nettingoffset
($)
Collateralpledged
($)Net Amount
($)
Currency forward contracts – – – –Options contracts – OTC – – – –Swap contracts – – – –
– – – –
4. Interest in Underlying Funds (note 2)
The Fund did not hold any interest in Underlying Funds asat June 30, 2015 or December 31, 2014.
5. Comparison of net asset value per unit and netassets per unit (note 2)
The table below provides a comparison of the net assetvalue per unit and net assets per unit. The primary reasonfor the difference between the net asset value per unit andnet assets per unit, if any, is described in note 2.
June 30, 2015 December 31, 2014
Net asset valueper unit
($)
Net assetsper unit
($)
Net asset valueper unit
($)
Net assetsper unit
($)
Series A 13.76 13.76 11.93 11.93
The accompanying notes are an integral part of the financial statements.
204

Scotia Latin American Fund (Unaudited)
STATEMENTS OF FINANCIAL POSITIONAs at
June 30,2015
December 31,2014
ASSETSCurrent assetsInvestments
Non-derivative financial assets $25,985,930 $29,371,119Cash 289,553 202,686Receivable for securities sold – 95,288Subscriptions receivable 7,557 5,609Accrued investment income and other 37,476 55,374
26,320,516 29,730,076
LIABILITIESCurrent liabilitiesManagement fee payable 51,105 –Payable for securities purchased – 85,241Redemptions payable 16,470 72,565Accrued expenses 8,437 –Distributions payable – 430
76,012 158,236
Net assets attributable to holders of redeemable units $26,244,504 $29,571,840
NET ASSETS ATTRIBUTABLE TO HOLDERS OF REDEEMABLE UNITSPER SERIES
Series A $26,244,504 $29,571,840
NET ASSETS ATTRIBUTABLE TO HOLDERS OF REDEEMABLE UNITSPER UNIT
Series A $ 17.46 $ 18.01
STATEMENTS OF COMPREHENSIVE INCOMEFor the six month periods ended June 30,
2015 2014INCOMENet gain (loss) on investments (note 2)
Dividends $ 206,998 $ 444,644Interest for distribution purposes 136,416 349,252Net realized gain (loss) on non-derivative financial assets (1,551,657) 298,596Net realized and change in unrealized gain (loss) on foreign exchange 36,050 (114,679)Change in unrealized gain (loss) on non-derivative financial assets 873,213 2,660,008
Net gain (loss) on investments (298,980) 3,637,821Securities lending 132 60Net realized and change in unrealized gain (loss) on foreign exchange of
cash (76,228) –Other income 29 192
Total income (loss) (375,047) 3,638,073
EXPENSESManagement fees (note 5) 350,396 469,259Fixed administration fees (note 6) 46,282 –Independent Review Committee fees 21 56Interest expense and bank overdraft charges 76 36Foreign withholding taxes/tax reclaims 30,853 84,750Audit fees – 443Custodian fees – 22,464Filing fees – 10,616Legal fees – 119Unitholder administration costs – 34,885Unitholder reporting costs – 6,997Harmonized Sales Tax/Goods and Services Tax 34,674 47,261Transaction costs 32,179 38,249
Total expenses 494,481 715,135Expenses absorbed by the Manager (69,896) (97,866)
Net expenses 424,585 617,269Increase (decrease) in net assets attributable to holders of redeemable
units from operations $ (799,632) $3,020,804
INCREASE (DECREASE) IN NET ASSETS ATTRIBUTABLE TO HOLDERS OFREDEEMABLE UNITS FROM OPERATIONS PER SERIES
Series A $ (799,632) $3,022,085Series F $ – $ (1,281)
INCREASE (DECREASE) IN NET ASSETS ATTRIBUTABLE TO HOLDERS OFREDEEMABLE UNITS FROM OPERATIONS PER UNIT†
Series A $ (0.51) $ 1.64Series F $ – $ (2.14)
WEIGHTED AVERAGE NUMBER OF UNITS PER SERIESSeries A 1,570,047 1,840,859Series F – 600
† The increase (decrease) in net assets attributable to holders of redeemable units fromoperations per unit is calculated by dividing the increase (decrease) in net assetsattributable to holders of redeemable units from operations per series by the weightedaverage number of units per series.
The accompanying notes are an integral part of the financial statements.
205

Scotia Latin American Fund (Unaudited – Continued)
STATEMENTS OF CHANGES IN NET ASSETSATTRIBUTABLE TO HOLDERS OF REDEEMABLE UNITSFor the six month periods ended June 30,
2015 2014NET ASSETS ATTRIBUTABLE TO HOLDERS OF REDEEMABLE UNITS,
BEGINNING OF PERIODSeries A $29,571,840 $39,115,614Series F – 47,401
29,571,840 39,163,015
INCREASE (DECREASE) IN NET ASSETS ATTRIBUTABLE TO HOLDERS OFREDEEMABLE UNITS FROM OPERATIONS
Series A (799,632) 3,022,085Series F – (1,281)
(799,632) 3,020,804
REDEEMABLE UNIT TRANSACTIONSProceeds from issue
Series A 954,103 1,438,428Payments on redemption
Series A (3,481,807) (5,274,694)Series F – (39,187)
(2,527,704) (3,875,453)
INCREASE (DECREASE) IN NET ASSETS ATTRIBUTABLE TO HOLDERS OFREDEEMABLE UNITS
Series A (3,327,336) (814,181)Series F – (40,468)
(3,327,336) (854,649)
NET ASSETS ATTRIBUTABLE TO HOLDERS OF REDEEMABLE UNITS, ENDOF PERIOD
Series A 26,244,504 38,301,433Series F – 6,933
$26,244,504 $38,308,366
STATEMENTS OF CASH FLOWSFor the six month periods ended June 30,
2015 2014CASH FLOWS FROM OPERATING ACTIVITIESIncrease (decrease) in net assets attributable to holders of
redeemable units $ (799,632) $ 3,020,804Adjustments for:
Net realized (gain) loss on non-derivative financial assets 1,551,657 (298,596)Unrealized (gain) loss on foreign exchange of cash (5,787) 114,679Change in unrealized (gain) loss on non-derivative financial assets (873,213) (2,660,008)Purchases of non-derivative financial assets (15,872,983) (16,865,324)Proceeds from sale of non-derivative financial assets 18,557,595 20,684,839Transaction costs 32,179 38,249Accrued investment income and other 17,898 (128,274)Accrued expenses 59,542 84,818
Net cash provided by (used in) operating activities 2,667,256 3,991,187CASH FLOWS FROM FINANCING ACTIVITIESProceeds from issue of redeemable units 952,156 1,446,449Amounts paid on redemption of redeemable units (3,537,902) (5,291,812)Distributions to unitholders of redeemable units (430) (697)
Net cash provided by (used in) financing activities (2,586,176) (3,846,060)Change in unrealized gain (loss) on foreign exchange of cash 5,787 (114,679)Net increase (decrease) in cash 81,080 145,127Cash (bank overdraft), beginning of period 202,686 70,931
CASH (BANK OVERDRAFT), END OF PERIOD $ 289,553 $ 101,379
Interest paid(1) 76 –Interest received(1) 136,429 349,235Dividends received, net of withholding taxes(1) 194,030 231,638
(1) Classified as operating items.
SCHEDULE OF INVESTMENT PORTFOLIOAs at June 30, 2015
Numberof Shares Issuer
AverageCost ($)
CarryingValue ($)
EQUITIES – 99.0%Brazil – 39.4%
73,147 Ambev SA 525,873 561,17562,638 Banco Bradesco S.A. 816,875 703,97071,933 Banco Bradesco SA, Preference 1,185,885 823,45875,355 BB Seguridade Participacoes S/A 967,200 1,032,13271,790 BM&F BOVESPA SA 320,339 337,95660,252 Cielo SA 859,358 1,060,50522,603 Embraer SA 930,322 854,66773,068 Estacio Participacoes SA 699,461 528,285
138,230 Itau Unibanco Holding SA, Preference 2,105,500 1,899,98970,620 Lojas Americanas SA 485,006 491,86511,805 M Dias Branco SA 403,624 388,82043,166 Petroleo Brasileiro S.A. 348,017 243,259
168,133 Petroleo Brasileriro S.A., Preferred 1,197,346 858,35644,935 Vale SA 706,136 330,11635,573 Vale SA ADR, Preference 605,655 224,367
12,156,597 10,338,920
Chile – 7.6%429,198 E-CL SA 715,209 727,35558,208 Empresas Copec SA 798,091 772,11558,048 SACI Falabella 557,312 506,569
2,070,612 2,006,039
Mexico – 34.1%703,560 America Movil SAB de CV 877,990 937,13475,022 Banregio Grupo Financiero SAB de CV 505,050 544,807
1,253,383 Cemex SAB de CV 1,519,150 1,435,404389,804 Corporacion Inmobiliaria Vesta SAB de CV 903,966 793,227
8,407 Fomento Economico Mexicano S.A.B de C.V. ADR (FEMSA) 917,602 935,44119,669 Grupo Aeroportuario del Sureste SAB de CV 303,895 348,495
499,983 Grupo Financiero Santander Mex SAB de CV 1,134,723 1,153,92769,637 Industrias Bachoco, S.A., Series B 360,594 390,504
121,318 Infraestructura Energetica Nova SAB de CV 770,494 748,144453,217 Macquarie Mexico Real Estate Management SA de CV 856,494 781,614173,577 Prologis Property Mexico S.A. de C.V. 360,561 364,737200,000 Unifin Financiera SAPI de CV 450,937 523,417
8,961,456 8,956,851
Columbia – 1.7%72,979 Cemex Latam Holdings SA 614,965 446,575
United States – 16.2%39,249 BRF SA 1,001,897 1,025,0123,878 Credicorp Limited 696,044 673,045
21,198 Companhia Brasileira de Distribuicao Grupo Pao de Acucar ADR 893,962 626,67191,553 Cosan Limited 946,783 704,36841,705 Grana y Montero SAA 612,285 366,95734,070 Grupo Aval Acciones y Valores S.A. 512,392 416,58311,562 Southern Copper Corporation 399,488 424,909
5,062,851 4,237,545
TOTAL INVESTMENT PORTFOLIO 28,866,481 25,985,930
OTHER ASSETS, LESS LIABILITIES – 1.0% 258,574
NET ASSETS – 100.0% 26,244,504
For equities, all common shares unless otherwise noted.The accompanying notes are an integral part of the financial statements.
206
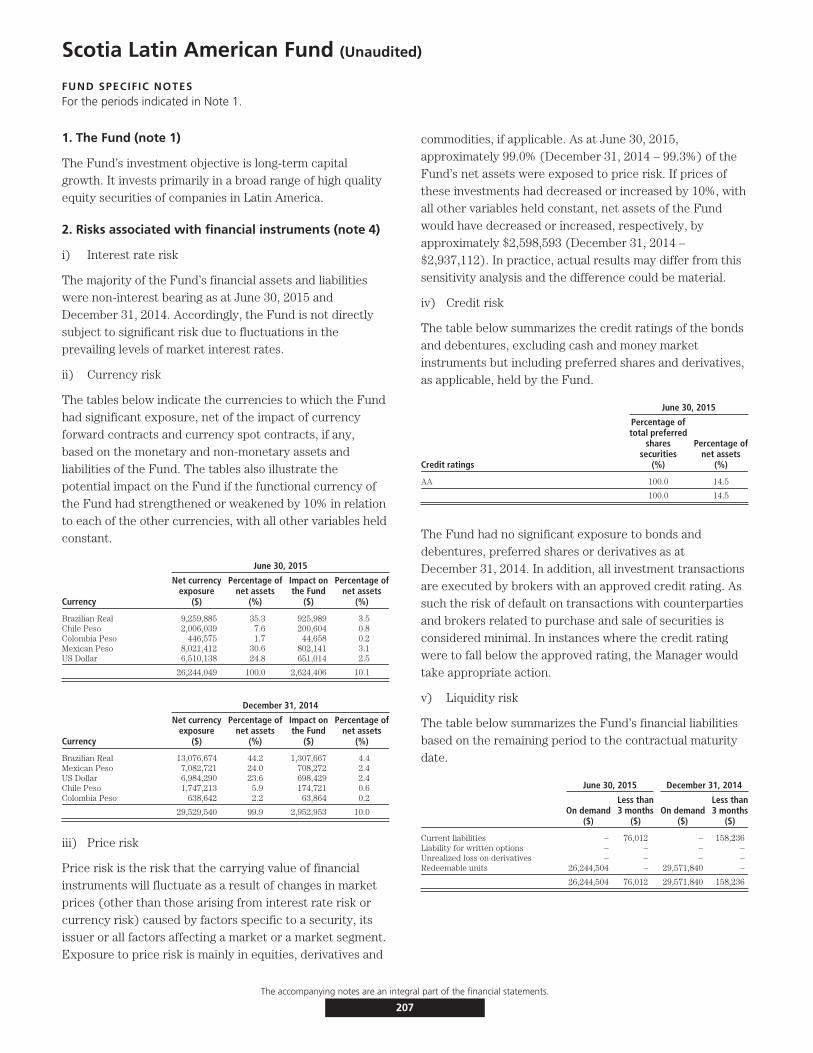
Scotia Latin American Fund (Unaudited)
FUND SPECIFIC NOTESFor the periods indicated in Note 1.
1. The Fund (note 1)
The Fund’s investment objective is long-term capitalgrowth. It invests primarily in a broad range of high qualityequity securities of companies in Latin America.
2. Risks associated with financial instruments (note 4)
i) Interest rate risk
The majority of the Fund’s financial assets and liabilitieswere non-interest bearing as at June 30, 2015 andDecember 31, 2014. Accordingly, the Fund is not directlysubject to significant risk due to fluctuations in theprevailing levels of market interest rates.
ii) Currency risk
The tables below indicate the currencies to which the Fundhad significant exposure, net of the impact of currencyforward contracts and currency spot contracts, if any,based on the monetary and non-monetary assets andliabilities of the Fund. The tables also illustrate thepotential impact on the Fund if the functional currency ofthe Fund had strengthened or weakened by 10% in relationto each of the other currencies, with all other variables heldconstant.
June 30, 2015
Currency
Net currencyexposure
($)
Percentage ofnet assets
(%)
Impact onthe Fund
($)
Percentage ofnet assets
(%)
Brazilian Real 9,259,885 35.3 925,989 3.5Chile Peso 2,006,039 7.6 200,604 0.8Colombia Peso 446,575 1.7 44,658 0.2Mexican Peso 8,021,412 30.6 802,141 3.1US Dollar 6,510,138 24.8 651,014 2.5
26,244,049 100.0 2,624,406 10.1
December 31, 2014
Currency
Net currencyexposure
($)
Percentage ofnet assets
(%)
Impact onthe Fund
($)
Percentage ofnet assets
(%)
Brazilian Real 13,076,674 44.2 1,307,667 4.4Mexican Peso 7,082,721 24.0 708,272 2.4US Dollar 6,984,290 23.6 698,429 2.4Chile Peso 1,747,213 5.9 174,721 0.6Colombia Peso 638,642 2.2 63,864 0.2
29,529,540 99.9 2,952,953 10.0
iii) Price risk
Price risk is the risk that the carrying value of financialinstruments will fluctuate as a result of changes in marketprices (other than those arising from interest rate risk orcurrency risk) caused by factors specific to a security, itsissuer or all factors affecting a market or a market segment.Exposure to price risk is mainly in equities, derivatives and
commodities, if applicable. As at June 30, 2015,approximately 99.0% (December 31, 2014 – 99.3%) of theFund’s net assets were exposed to price risk. If prices ofthese investments had decreased or increased by 10%, withall other variables held constant, net assets of the Fundwould have decreased or increased, respectively, byapproximately $2,598,593 (December 31, 2014 –$2,937,112). In practice, actual results may differ from thissensitivity analysis and the difference could be material.
iv) Credit risk
The table below summarizes the credit ratings of the bondsand debentures, excluding cash and money marketinstruments but including preferred shares and derivatives,as applicable, held by the Fund.
June 30, 2015
Credit ratings
Percentage oftotal preferred
sharessecurities
(%)
Percentage ofnet assets
(%)
AA 100.0 14.5
100.0 14.5
The Fund had no significant exposure to bonds anddebentures, preferred shares or derivatives as atDecember 31, 2014. In addition, all investment transactionsare executed by brokers with an approved credit rating. Assuch the risk of default on transactions with counterpartiesand brokers related to purchase and sale of securities isconsidered minimal. In instances where the credit ratingwere to fall below the approved rating, the Manager wouldtake appropriate action.
v) Liquidity risk
The table below summarizes the Fund’s financial liabilitiesbased on the remaining period to the contractual maturitydate.
June 30, 2015 December 31, 2014
On demand($)
Less than3 months
($)On demand
($)
Less than3 months
($)
Current liabilities – 76,012 – 158,236Liability for written options – – – –Unrealized loss on derivatives – – – –Redeemable units 26,244,504 – 29,571,840 –
26,244,504 76,012 29,571,840 158,236
The accompanying notes are an integral part of the financial statements.
207
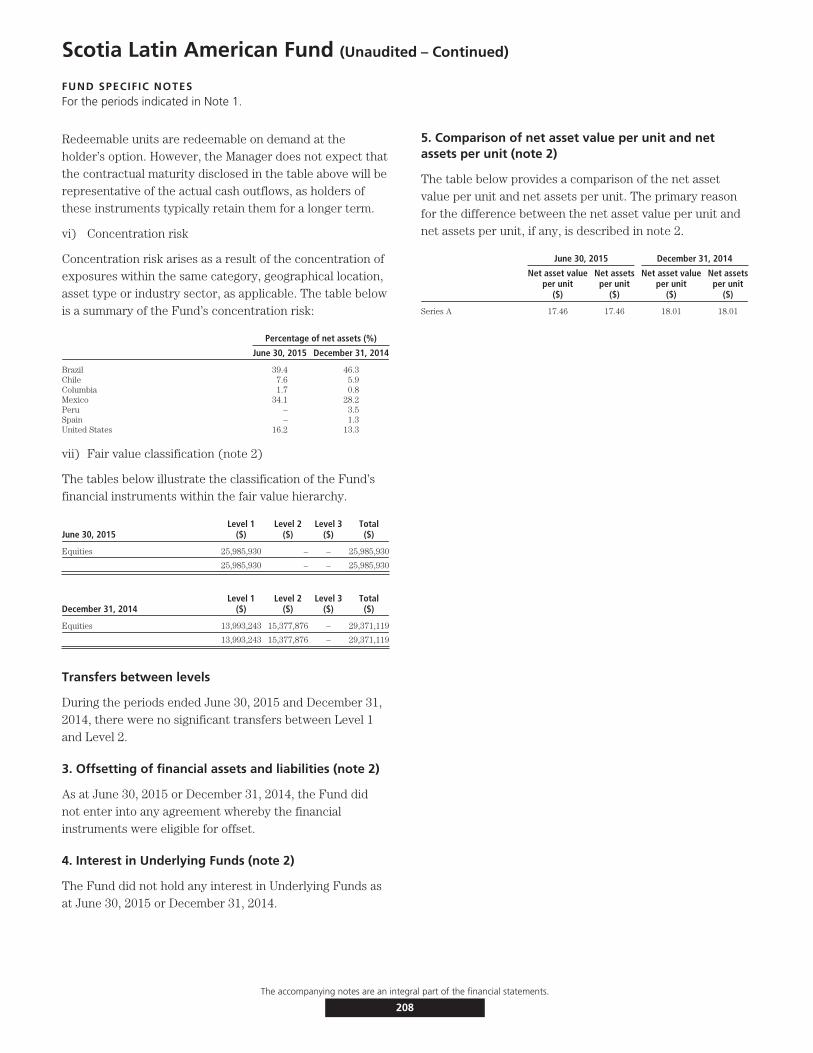
Scotia Latin American Fund (Unaudited – Continued)
FUND SPECIFIC NOTESFor the periods indicated in Note 1.
Redeemable units are redeemable on demand at theholder’s option. However, the Manager does not expect thatthe contractual maturity disclosed in the table above will berepresentative of the actual cash outflows, as holders ofthese instruments typically retain them for a longer term.
vi) Concentration risk
Concentration risk arises as a result of the concentration ofexposures within the same category, geographical location,asset type or industry sector, as applicable. The table belowis a summary of the Fund’s concentration risk:
Percentage of net assets (%)
June 30, 2015 December 31, 2014
Brazil 39.4 46.3Chile 7.6 5.9Columbia 1.7 0.8Mexico 34.1 28.2Peru – 3.5Spain – 1.3United States 16.2 13.3
vii) Fair value classification (note 2)
The tables below illustrate the classification of the Fund’sfinancial instruments within the fair value hierarchy.
June 30, 2015Level 1
($)Level 2
($)Level 3
($)Total($)
Equities 25,985,930 – – 25,985,930
25,985,930 – – 25,985,930
December 31, 2014Level 1
($)Level 2
($)Level 3
($)Total($)
Equities 13,993,243 15,377,876 – 29,371,119
13,993,243 15,377,876 – 29,371,119
Transfers between levels
During the periods ended June 30, 2015 and December 31,2014, there were no significant transfers between Level 1and Level 2.
3. Offsetting of financial assets and liabilities (note 2)
As at June 30, 2015 or December 31, 2014, the Fund didnot enter into any agreement whereby the financialinstruments were eligible for offset.
4. Interest in Underlying Funds (note 2)
The Fund did not hold any interest in Underlying Funds asat June 30, 2015 or December 31, 2014.
5. Comparison of net asset value per unit and netassets per unit (note 2)
The table below provides a comparison of the net assetvalue per unit and net assets per unit. The primary reasonfor the difference between the net asset value per unit andnet assets per unit, if any, is described in note 2.
June 30, 2015 December 31, 2014
Net asset valueper unit
($)
Net assetsper unit
($)
Net asset valueper unit
($)
Net assetsper unit
($)
Series A 17.46 17.46 18.01 18.01
The accompanying notes are an integral part of the financial statements.
208

Scotia Global Dividend Fund (Unaudited)
STATEMENTS OF FINANCIAL POSITIONAs at
June 30,2015
December 31,2014
ASSETSCurrent assetsInvestments
Non-derivative financial assets $465,272,541 $379,658,553Unrealized gain on currency forward contracts 935,201 4,799,773Unrealized gain on currency spot contracts 1,666 –
Cash 40,356,802 39,396,734Receivable for securities sold 1,982,252 –Subscriptions receivable 571,676 340,758Accrued investment income and other 545,949 434,344
509,666,087 424,630,162
LIABILITIESCurrent liabilitiesManagement fee payable 348,383 –Payable for securities purchased – 844,345Redemptions payable 237,979 201,562Accrued expenses 36,861 –Distributions payable – 16Unrealized loss on currency forward contracts 5,035,197 313,494Unrealized loss on currency spot contracts 1,222 104
5,659,642 1,359,521
Net assets attributable to holders of redeemable units $504,006,445 $423,270,641
NET ASSETS ATTRIBUTABLE TO HOLDERS OF REDEEMABLE UNITSPER SERIES
Series A $180,222,175 $137,405,371Series I $323,784,270 $285,865,270
NET ASSETS ATTRIBUTABLE TO HOLDERS OF REDEEMABLE UNITSPER UNIT
Series A $ 17.35 $ 15.92Series I $ 17.49 $ 15.88
STATEMENTS OF COMPREHENSIVE INCOMEFor the six month periods ended June 30,
2015 2014INCOMENet gain (loss) on investments (note 2)
Dividends $ 7,482,419 $ 6,305,139Interest for distribution purposes 83,039 186,852Net realized gain (loss) on non-derivative financial assets 32,365,376 10,647,522Net realized gain (loss) on currency forward contracts 9,027,237 (4,704,943)Net realized and change in unrealized gain (loss) on foreign exchange 430,775 (97,548)Change in unrealized gain (loss) on non-derivative financial assets 1,686,877 13,001,206Change in unrealized gain (loss) on currency forward contracts (8,586,275) 4,517,395Change in unrealized gain (loss) on currency spots contracts 548 (20,037)
Net gain (loss) on investments 42,489,996 29,835,586Securities lending 10,187 34,137Net realized and change in unrealized gain (loss) on foreign exchange of
cash 2,271,998 –Other income 4,043 1,516
Total income (loss) 44,776,224 29,871,239
EXPENSESManagement fees (note 5) 1,650,049 1,077,988Fixed administration fees (note 6) 177,553 –Independent Review Committee fees 350 534Interest expense and bank overdraft charges 124 (2,836)Foreign withholding taxes/tax reclaims 1,005,135 1,080,868Audit fees – 3,908Custodian fees – 21,227Filing fees – 12,033Legal fees – 1,145Unitholder administration costs – 42,437Unitholder reporting costs – 6,698Harmonized Sales Tax/Goods and Services Tax 184,418 115,328Transaction costs 351,170 255,196
Total expenses 3,368,799 2,614,526
Increase (decrease) in net assets attributable to holders of redeemableunits from operations $41,407,425 $27,256,713
INCREASE (DECREASE) IN NET ASSETS ATTRIBUTABLE TO HOLDERS OFREDEEMABLE UNITS FROM OPERATIONS PER SERIES
Series A $12,339,465 $ 7,213,730Series I $29,067,960 $20,042,983
INCREASE (DECREASE) IN NET ASSETS ATTRIBUTABLE TO HOLDERS OFREDEEMABLE UNITS FROM OPERATIONS PER UNIT†
Series A $ 1.28 $ 0.98Series I $ 1.59 $ 1.17
WEIGHTED AVERAGE NUMBER OF UNITS PER SERIESSeries A 9,618,918 7,361,551Series I 18,267,730 17,201,448
† The increase (decrease) in net assets attributable to holders of redeemable units fromoperations per unit is calculated by dividing the increase (decrease) in net assetsattributable to holders of redeemable units from operations per series by the weightedaverage number of units per series.
The accompanying notes are an integral part of the financial statements.
209
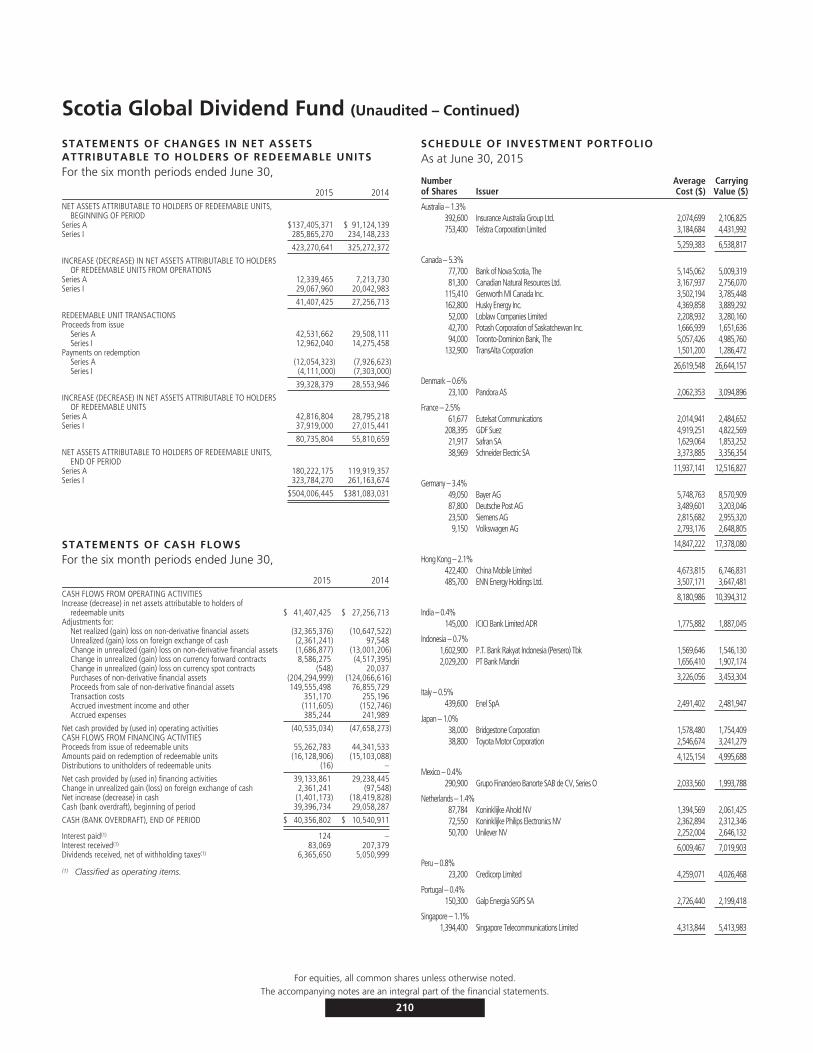
Scotia Global Dividend Fund (Unaudited – Continued)
STATEMENTS OF CHANGES IN NET ASSETSATTRIBUTABLE TO HOLDERS OF REDEEMABLE UNITSFor the six month periods ended June 30,
2015 2014NET ASSETS ATTRIBUTABLE TO HOLDERS OF REDEEMABLE UNITS,
BEGINNING OF PERIODSeries A $137,405,371 $ 91,124,139Series I 285,865,270 234,148,233
423,270,641 325,272,372
INCREASE (DECREASE) IN NET ASSETS ATTRIBUTABLE TO HOLDERSOF REDEEMABLE UNITS FROM OPERATIONS
Series A 12,339,465 7,213,730Series I 29,067,960 20,042,983
41,407,425 27,256,713
REDEEMABLE UNIT TRANSACTIONSProceeds from issue
Series A 42,531,662 29,508,111Series I 12,962,040 14,275,458
Payments on redemptionSeries A (12,054,323) (7,926,623)Series I (4,111,000) (7,303,000)
39,328,379 28,553,946
INCREASE (DECREASE) IN NET ASSETS ATTRIBUTABLE TO HOLDERSOF REDEEMABLE UNITS
Series A 42,816,804 28,795,218Series I 37,919,000 27,015,441
80,735,804 55,810,659
NET ASSETS ATTRIBUTABLE TO HOLDERS OF REDEEMABLE UNITS,END OF PERIOD
Series A 180,222,175 119,919,357Series I 323,784,270 261,163,674
$504,006,445 $381,083,031
STATEMENTS OF CASH FLOWSFor the six month periods ended June 30,
2015 2014CASH FLOWS FROM OPERATING ACTIVITIESIncrease (decrease) in net assets attributable to holders of
redeemable units $ 41,407,425 $ 27,256,713Adjustments for:
Net realized (gain) loss on non-derivative financial assets (32,365,376) (10,647,522)Unrealized (gain) loss on foreign exchange of cash (2,361,241) 97,548Change in unrealized (gain) loss on non-derivative financial assets (1,686,877) (13,001,206)Change in unrealized (gain) loss on currency forward contracts 8,586,275 (4,517,395)Change in unrealized (gain) loss on currency spot contracts (548) 20,037Purchases of non-derivative financial assets (204,294,999) (124,066,616)Proceeds from sale of non-derivative financial assets 149,555,498 76,855,729Transaction costs 351,170 255,196Accrued investment income and other (111,605) (152,746)Accrued expenses 385,244 241,989
Net cash provided by (used in) operating activities (40,535,034) (47,658,273)CASH FLOWS FROM FINANCING ACTIVITIESProceeds from issue of redeemable units 55,262,783 44,341,533Amounts paid on redemption of redeemable units (16,128,906) (15,103,088)Distributions to unitholders of redeemable units (16) –
Net cash provided by (used in) financing activities 39,133,861 29,238,445Change in unrealized gain (loss) on foreign exchange of cash 2,361,241 (97,548)Net increase (decrease) in cash (1,401,173) (18,419,828)Cash (bank overdraft), beginning of period 39,396,734 29,058,287
CASH (BANK OVERDRAFT), END OF PERIOD $ 40,356,802 $ 10,540,911
Interest paid(1) 124 –Interest received(1) 83,069 207,379Dividends received, net of withholding taxes(1) 6,365,650 5,050,999
(1) Classified as operating items.
SCHEDULE OF INVESTMENT PORTFOLIOAs at June 30, 2015
Numberof Shares Issuer
AverageCost ($)
CarryingValue ($)
Australia – 1.3%392,600 Insurance Australia Group Ltd. 2,074,699 2,106,825753,400 Telstra Corporation Limited 3,184,684 4,431,992
5,259,383 6,538,817
Canada – 5.3%77,700 Bank of Nova Scotia, The 5,145,062 5,009,31981,300 Canadian Natural Resources Ltd. 3,167,937 2,756,070
115,410 Genworth MI Canada Inc. 3,502,194 3,785,448162,800 Husky Energy Inc. 4,369,858 3,889,29252,000 Loblaw Companies Limited 2,208,932 3,280,16042,700 Potash Corporation of Saskatchewan Inc. 1,666,939 1,651,63694,000 Toronto-Dominion Bank, The 5,057,426 4,985,760
132,900 TransAlta Corporation 1,501,200 1,286,472
26,619,548 26,644,157
Denmark – 0.6%23,100 Pandora AS 2,062,353 3,094,896
France – 2.5%61,677 Eutelsat Communications 2,014,941 2,484,652
208,395 GDF Suez 4,919,251 4,822,56921,917 Safran SA 1,629,064 1,853,25238,969 Schneider Electric SA 3,373,885 3,356,354
11,937,141 12,516,827
Germany – 3.4%49,050 Bayer AG 5,748,763 8,570,90987,800 Deutsche Post AG 3,489,601 3,203,04623,500 Siemens AG 2,815,682 2,955,3209,150 Volkswagen AG 2,793,176 2,648,805
14,847,222 17,378,080
Hong Kong – 2.1%422,400 China Mobile Limited 4,673,815 6,746,831485,700 ENN Energy Holdings Ltd. 3,507,171 3,647,481
8,180,986 10,394,312
India – 0.4%145,000 ICICI Bank Limited ADR 1,775,882 1,887,045
Indonesia – 0.7%1,602,900 P.T. Bank Rakyat Indonesia (Persero) Tbk 1,569,646 1,546,1302,029,200 PT Bank Mandiri 1,656,410 1,907,174
3,226,056 3,453,304
Italy – 0.5%439,600 Enel SpA 2,491,402 2,481,947
Japan – 1.0%38,000 Bridgestone Corporation 1,578,480 1,754,40938,800 Toyota Motor Corporation 2,546,674 3,241,279
4,125,154 4,995,688
Mexico – 0.4%290,900 Grupo Financiero Banorte SAB de CV, Series O 2,033,560 1,993,788
Netherlands – 1.4%87,784 Koninklijke Ahold NV 1,394,569 2,061,42572,550 Koninklijke Philips Electronics NV 2,362,894 2,312,34650,700 Unilever NV 2,252,004 2,646,132
6,009,467 7,019,903
Peru – 0.8%23,200 Credicorp Limited 4,259,071 4,026,468
Portugal – 0.4%150,300 Galp Energia SGPS SA 2,726,440 2,199,418
Singapore – 1.1%1,394,400 Singapore Telecommunications Limited 4,313,844 5,413,983
For equities, all common shares unless otherwise noted.The accompanying notes are an integral part of the financial statements.
210
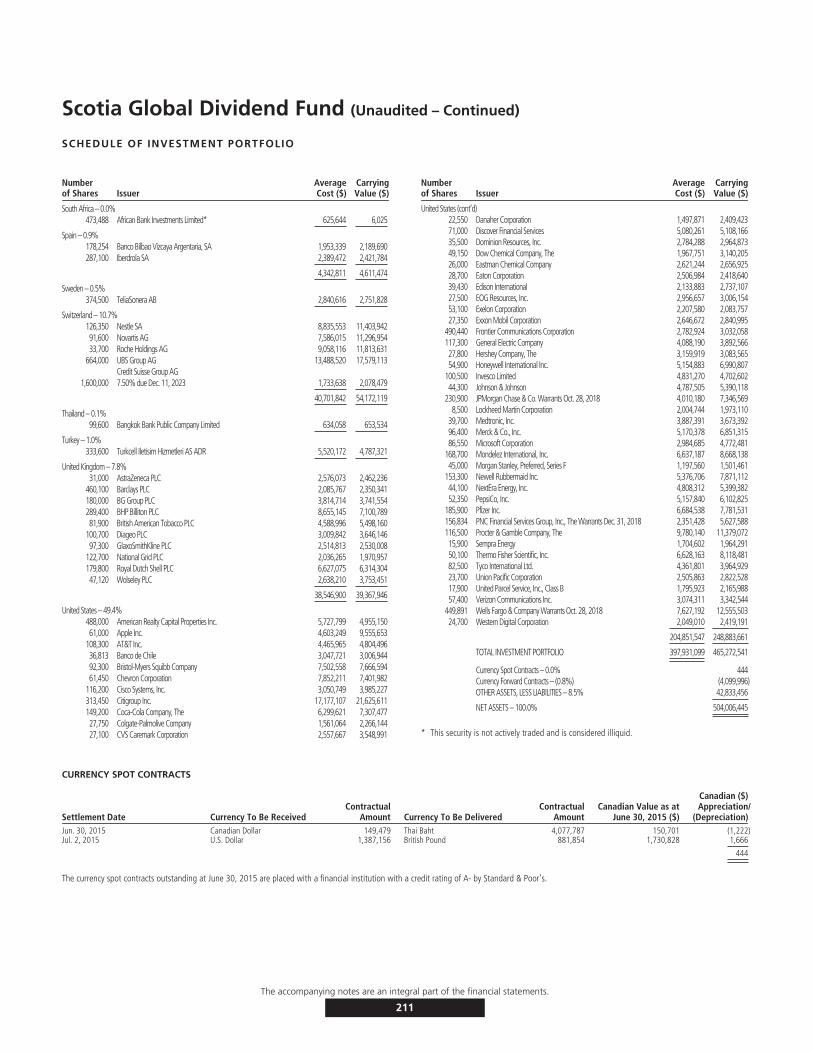
Scotia Global Dividend Fund (Unaudited – Continued)
SCHEDULE OF INVESTMENT PORTFOLIO
Numberof Shares Issuer
AverageCost ($)
CarryingValue ($)
South Africa – 0.0%473,488 African Bank Investments Limited* 625,644 6,025
Spain – 0.9%178,254 Banco Bilbao Vizcaya Argentaria, SA 1,953,339 2,189,690287,100 Iberdrola SA 2,389,472 2,421,784
4,342,811 4,611,474
Sweden – 0.5%374,500 TeliaSonera AB 2,840,616 2,751,828
Switzerland – 10.7%126,350 Nestle SA 8,835,553 11,403,94291,600 Novartis AG 7,586,015 11,296,95433,700 Roche Holdings AG 9,058,116 11,813,631
664,000 UBS Group AG 13,488,520 17,579,113Credit Suisse Group AG
1,600,000 7.50% due Dec. 11, 2023 1,733,638 2,078,479
40,701,842 54,172,119
Thailand – 0.1%99,600 Bangkok Bank Public Company Limited 634,058 653,534
Turkey – 1.0%333,600 Turkcell Iletisim Hizmetleri AS ADR 5,520,172 4,787,321
United Kingdom – 7.8%31,000 AstraZeneca PLC 2,576,073 2,462,236
460,100 Barclays PLC 2,085,767 2,350,341180,000 BG Group PLC 3,814,714 3,741,554289,400 BHP Billiton PLC 8,655,145 7,100,78981,900 British American Tobacco PLC 4,588,996 5,498,160
100,700 Diageo PLC 3,009,842 3,646,14697,300 GlaxoSmithKline PLC 2,514,813 2,530,008
122,700 National Grid PLC 2,036,265 1,970,957179,800 Royal Dutch Shell PLC 6,627,075 6,314,30447,120 Wolseley PLC 2,638,210 3,753,451
38,546,900 39,367,946
United States – 49.4%488,000 American Realty Capital Properties Inc. 5,727,799 4,955,15061,000 Apple Inc. 4,603,249 9,555,653
108,300 AT&T Inc. 4,465,965 4,804,49636,813 Banco de Chile 3,047,721 3,006,94492,300 Bristol-Myers Squibb Company 7,502,558 7,666,59461,450 Chevron Corporation 7,852,211 7,401,982
116,200 Cisco Systems, Inc. 3,050,749 3,985,227313,450 Citigroup Inc. 17,177,107 21,625,611149,200 Coca-Cola Company, The 6,299,621 7,307,47727,750 Colgate-Palmolive Company 1,561,064 2,266,14427,100 CVS Caremark Corporation 2,557,667 3,548,991
Numberof Shares Issuer
AverageCost ($)
CarryingValue ($)
United States (cont’d)22,550 Danaher Corporation 1,497,871 2,409,42371,000 Discover Financial Services 5,080,261 5,108,16635,500 Dominion Resources, Inc. 2,784,288 2,964,87349,150 Dow Chemical Company, The 1,967,751 3,140,20526,000 Eastman Chemical Company 2,621,244 2,656,92528,700 Eaton Corporation 2,506,984 2,418,64039,430 Edison International 2,133,883 2,737,10727,500 EOG Resources, Inc. 2,956,657 3,006,15453,100 Exelon Corporation 2,207,580 2,083,75727,350 Exxon Mobil Corporation 2,646,672 2,840,995
490,440 Frontier Communications Corporation 2,782,924 3,032,058117,300 General Electric Company 4,088,190 3,892,56627,800 Hershey Company, The 3,159,919 3,083,56554,900 Honeywell International Inc. 5,154,883 6,990,807
100,500 Invesco Limited 4,831,270 4,702,60244,300 Johnson & Johnson 4,787,505 5,390,118
230,900 JPMorgan Chase & Co. Warrants Oct. 28, 2018 4,010,180 7,346,5698,500 Lockheed Martin Corporation 2,004,744 1,973,110
39,700 Medtronic, Inc. 3,887,391 3,673,39296,400 Merck & Co., Inc. 5,170,378 6,851,31586,550 Microsoft Corporation 2,984,685 4,772,481
168,700 Mondelez International, Inc. 6,637,187 8,668,13845,000 Morgan Stanley, Preferred, Series F 1,197,560 1,501,461
153,300 Newell Rubbermaid Inc. 5,376,706 7,871,11244,100 NextEra Energy, Inc. 4,808,312 5,399,38252,350 PepsiCo, Inc. 5,157,840 6,102,825
185,900 Pfizer Inc. 6,684,538 7,781,531156,834 PNC Financial Services Group, Inc., The Warrants Dec. 31, 2018 2,351,428 5,627,588116,500 Procter & Gamble Company, The 9,780,140 11,379,07215,900 Sempra Energy 1,704,602 1,964,29150,100 Thermo Fisher Scientific, Inc. 6,628,163 8,118,48182,500 Tyco International Ltd. 4,361,801 3,964,92923,700 Union Pacific Corporation 2,505,863 2,822,52817,900 United Parcel Service, Inc., Class B 1,795,923 2,165,98857,400 Verizon Communications Inc. 3,074,311 3,342,544
449,891 Wells Fargo & Company Warrants Oct. 28, 2018 7,627,192 12,555,50324,700 Western Digital Corporation 2,049,010 2,419,191
204,851,547 248,883,661
TOTAL INVESTMENT PORTFOLIO 397,931,099 465,272,541
Currency Spot Contracts – 0.0% 444Currency Forward Contracts – (0.8%) (4,099,996)OTHER ASSETS, LESS LIABILITIES – 8.5% 42,833,456
NET ASSETS – 100.0% 504,006,445
* This security is not actively traded and is considered illiquid.
CURRENCY SPOT CONTRACTS
Settlement Date Currency To Be ReceivedContractual
Amount Currency To Be DeliveredContractual
AmountCanadian Value as at
June 30, 2015 ($)
Canadian ($)Appreciation/
(Depreciation)Jun. 30, 2015 Canadian Dollar 149,479 Thai Baht 4,077,787 150,701 (1,222)Jul. 2, 2015 U.S. Dollar 1,387,156 British Pound 881,854 1,730,828 1,666
444
The currency spot contracts outstanding at June 30, 2015 are placed with a financial institution with a credit rating of A- by Standard & Poor’s.
The accompanying notes are an integral part of the financial statements.
211
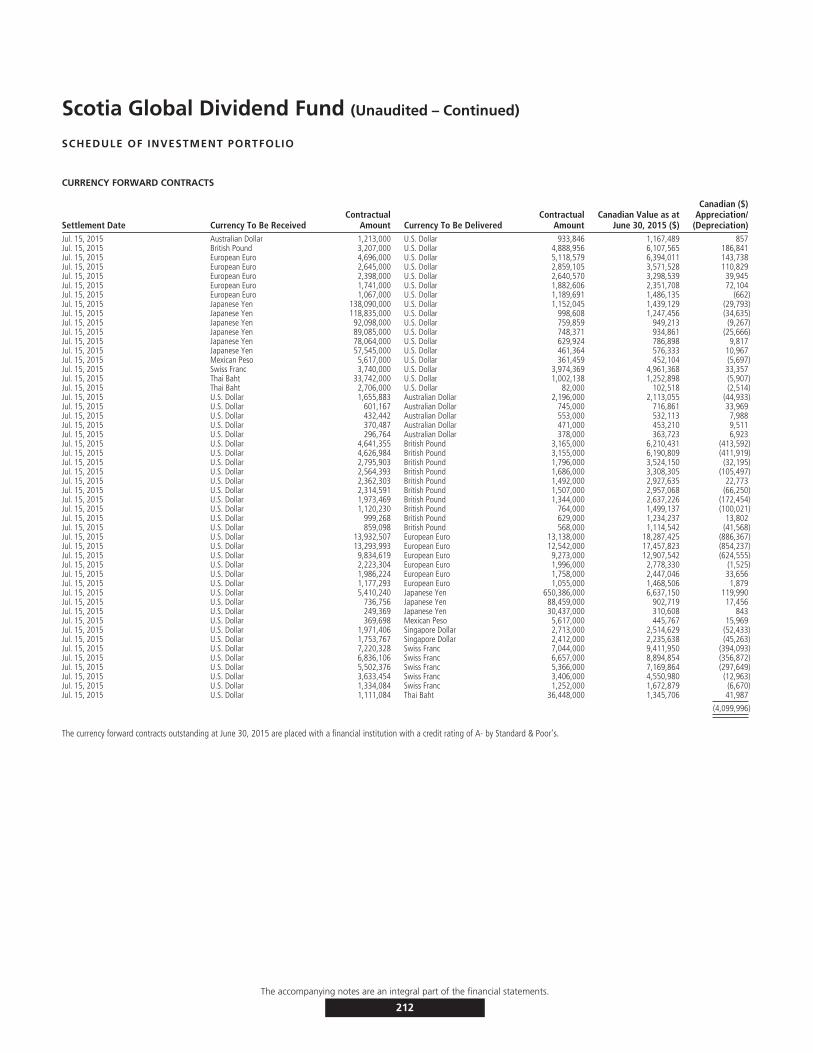
Scotia Global Dividend Fund (Unaudited – Continued)
SCHEDULE OF INVESTMENT PORTFOLIO
CURRENCY FORWARD CONTRACTS
Settlement Date Currency To Be ReceivedContractual
Amount Currency To Be DeliveredContractual
AmountCanadian Value as at
June 30, 2015 ($)
Canadian ($)Appreciation/
(Depreciation)Jul. 15, 2015 Australian Dollar 1,213,000 U.S. Dollar 933,846 1,167,489 857Jul. 15, 2015 British Pound 3,207,000 U.S. Dollar 4,888,956 6,107,565 186,841Jul. 15, 2015 European Euro 4,696,000 U.S. Dollar 5,118,579 6,394,011 143,738Jul. 15, 2015 European Euro 2,645,000 U.S. Dollar 2,859,105 3,571,528 110,829Jul. 15, 2015 European Euro 2,398,000 U.S. Dollar 2,640,570 3,298,539 39,945Jul. 15, 2015 European Euro 1,741,000 U.S. Dollar 1,882,606 2,351,708 72,104Jul. 15, 2015 European Euro 1,067,000 U.S. Dollar 1,189,691 1,486,135 (662)Jul. 15, 2015 Japanese Yen 138,090,000 U.S. Dollar 1,152,045 1,439,129 (29,793)Jul. 15, 2015 Japanese Yen 118,835,000 U.S. Dollar 998,608 1,247,456 (34,635)Jul. 15, 2015 Japanese Yen 92,098,000 U.S. Dollar 759,859 949,213 (9,267)Jul. 15, 2015 Japanese Yen 89,085,000 U.S. Dollar 748,371 934,861 (25,666)Jul. 15, 2015 Japanese Yen 78,064,000 U.S. Dollar 629,924 786,898 9,817Jul. 15, 2015 Japanese Yen 57,545,000 U.S. Dollar 461,364 576,333 10,967Jul. 15, 2015 Mexican Peso 5,617,000 U.S. Dollar 361,459 452,104 (5,697)Jul. 15, 2015 Swiss Franc 3,740,000 U.S. Dollar 3,974,369 4,961,368 33,357Jul. 15, 2015 Thai Baht 33,742,000 U.S. Dollar 1,002,138 1,252,898 (5,907)Jul. 15, 2015 Thai Baht 2,706,000 U.S. Dollar 82,000 102,518 (2,514)Jul. 15, 2015 U.S. Dollar 1,655,883 Australian Dollar 2,196,000 2,113,055 (44,933)Jul. 15, 2015 U.S. Dollar 601,167 Australian Dollar 745,000 716,861 33,969Jul. 15, 2015 U.S. Dollar 432,442 Australian Dollar 553,000 532,113 7,988Jul. 15, 2015 U.S. Dollar 370,487 Australian Dollar 471,000 453,210 9,511Jul. 15, 2015 U.S. Dollar 296,764 Australian Dollar 378,000 363,723 6,923Jul. 15, 2015 U.S. Dollar 4,641,355 British Pound 3,165,000 6,210,431 (413,592)Jul. 15, 2015 U.S. Dollar 4,626,984 British Pound 3,155,000 6,190,809 (411,919)Jul. 15, 2015 U.S. Dollar 2,795,903 British Pound 1,796,000 3,524,150 (32,195)Jul. 15, 2015 U.S. Dollar 2,564,393 British Pound 1,686,000 3,308,305 (105,497)Jul. 15, 2015 U.S. Dollar 2,362,303 British Pound 1,492,000 2,927,635 22,773Jul. 15, 2015 U.S. Dollar 2,314,591 British Pound 1,507,000 2,957,068 (66,250)Jul. 15, 2015 U.S. Dollar 1,973,469 British Pound 1,344,000 2,637,226 (172,454)Jul. 15, 2015 U.S. Dollar 1,120,230 British Pound 764,000 1,499,137 (100,021)Jul. 15, 2015 U.S. Dollar 999,268 British Pound 629,000 1,234,237 13,802Jul. 15, 2015 U.S. Dollar 859,098 British Pound 568,000 1,114,542 (41,568)Jul. 15, 2015 U.S. Dollar 13,932,507 European Euro 13,138,000 18,287,425 (886,367)Jul. 15, 2015 U.S. Dollar 13,293,993 European Euro 12,542,000 17,457,823 (854,237)Jul. 15, 2015 U.S. Dollar 9,834,619 European Euro 9,273,000 12,907,542 (624,555)Jul. 15, 2015 U.S. Dollar 2,223,304 European Euro 1,996,000 2,778,330 (1,525)Jul. 15, 2015 U.S. Dollar 1,986,224 European Euro 1,758,000 2,447,046 33,656Jul. 15, 2015 U.S. Dollar 1,177,293 European Euro 1,055,000 1,468,506 1,879Jul. 15, 2015 U.S. Dollar 5,410,240 Japanese Yen 650,386,000 6,637,150 119,990Jul. 15, 2015 U.S. Dollar 736,756 Japanese Yen 88,459,000 902,719 17,456Jul. 15, 2015 U.S. Dollar 249,369 Japanese Yen 30,437,000 310,608 843Jul. 15, 2015 U.S. Dollar 369,698 Mexican Peso 5,617,000 445,767 15,969Jul. 15, 2015 U.S. Dollar 1,971,406 Singapore Dollar 2,713,000 2,514,629 (52,433)Jul. 15, 2015 U.S. Dollar 1,753,767 Singapore Dollar 2,412,000 2,235,638 (45,263)Jul. 15, 2015 U.S. Dollar 7,220,328 Swiss Franc 7,044,000 9,411,950 (394,093)Jul. 15, 2015 U.S. Dollar 6,836,106 Swiss Franc 6,657,000 8,894,854 (356,872)Jul. 15, 2015 U.S. Dollar 5,502,376 Swiss Franc 5,366,000 7,169,864 (297,649)Jul. 15, 2015 U.S. Dollar 3,633,454 Swiss Franc 3,406,000 4,550,980 (12,963)Jul. 15, 2015 U.S. Dollar 1,334,084 Swiss Franc 1,252,000 1,672,879 (6,670)Jul. 15, 2015 U.S. Dollar 1,111,084 Thai Baht 36,448,000 1,345,706 41,987
(4,099,996)
The currency forward contracts outstanding at June 30, 2015 are placed with a financial institution with a credit rating of A- by Standard & Poor’s.
The accompanying notes are an integral part of the financial statements.
212
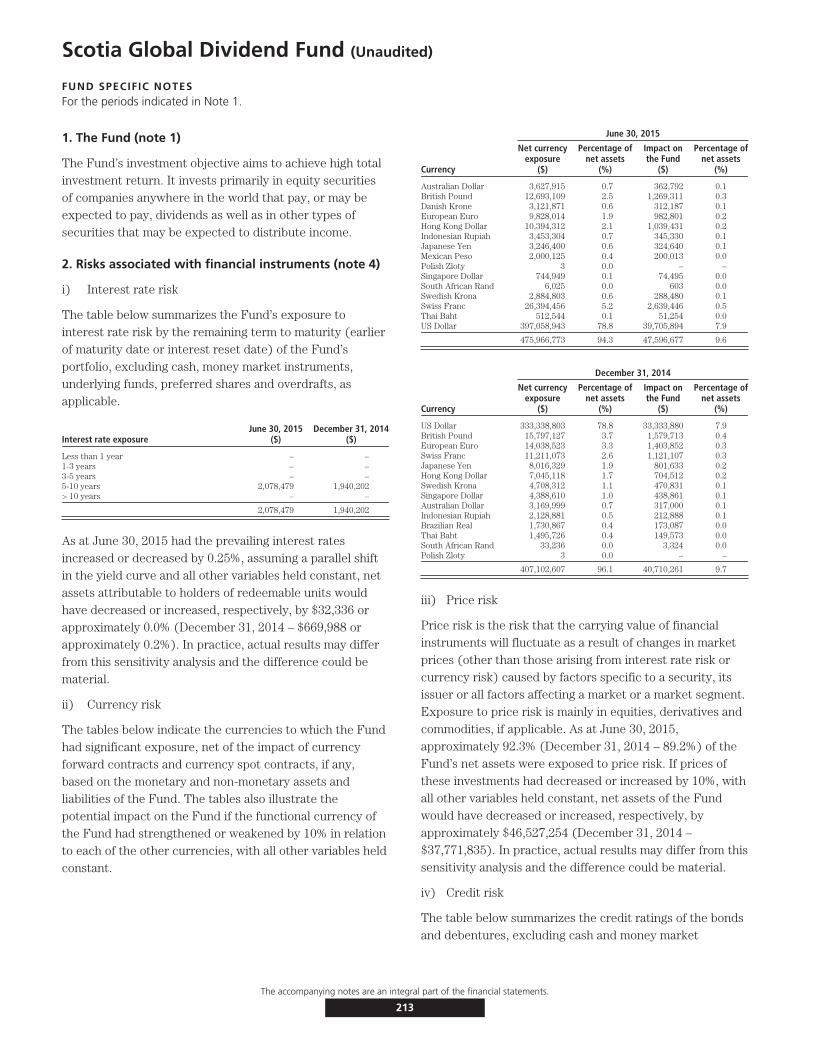
Scotia Global Dividend Fund (Unaudited)
FUND SPECIFIC NOTESFor the periods indicated in Note 1.
1. The Fund (note 1)
The Fund’s investment objective aims to achieve high totalinvestment return. It invests primarily in equity securitiesof companies anywhere in the world that pay, or may beexpected to pay, dividends as well as in other types ofsecurities that may be expected to distribute income.
2. Risks associated with financial instruments (note 4)
i) Interest rate risk
The table below summarizes the Fund’s exposure tointerest rate risk by the remaining term to maturity (earlierof maturity date or interest reset date) of the Fund’sportfolio, excluding cash, money market instruments,underlying funds, preferred shares and overdrafts, asapplicable.
Interest rate exposureJune 30, 2015
($)December 31, 2014
($)
Less than 1 year – –1-3 years – –3-5 years – –5-10 years 2,078,479 1,940,202> 10 years – –
2,078,479 1,940,202
As at June 30, 2015 had the prevailing interest ratesincreased or decreased by 0.25%, assuming a parallel shiftin the yield curve and all other variables held constant, netassets attributable to holders of redeemable units wouldhave decreased or increased, respectively, by $32,336 orapproximately 0.0% (December 31, 2014 – $669,988 orapproximately 0.2%). In practice, actual results may differfrom this sensitivity analysis and the difference could bematerial.
ii) Currency risk
The tables below indicate the currencies to which the Fundhad significant exposure, net of the impact of currencyforward contracts and currency spot contracts, if any,based on the monetary and non-monetary assets andliabilities of the Fund. The tables also illustrate thepotential impact on the Fund if the functional currency ofthe Fund had strengthened or weakened by 10% in relationto each of the other currencies, with all other variables heldconstant.
June 30, 2015
Currency
Net currencyexposure
($)
Percentage ofnet assets
(%)
Impact onthe Fund
($)
Percentage ofnet assets
(%)
Australian Dollar 3,627,915 0.7 362,792 0.1British Pound 12,693,109 2.5 1,269,311 0.3Danish Krone 3,121,871 0.6 312,187 0.1European Euro 9,828,014 1.9 982,801 0.2Hong Kong Dollar 10,394,312 2.1 1,039,431 0.2Indonesian Rupiah 3,453,304 0.7 345,330 0.1Japanese Yen 3,246,400 0.6 324,640 0.1Mexican Peso 2,000,125 0.4 200,013 0.0Polish Zloty 3 0.0 – –Singapore Dollar 744,949 0.1 74,495 0.0South African Rand 6,025 0.0 603 0.0Swedish Krona 2,884,803 0.6 288,480 0.1Swiss Franc 26,394,456 5.2 2,639,446 0.5Thai Baht 512,544 0.1 51,254 0.0US Dollar 397,058,943 78.8 39,705,894 7.9
475,966,773 94.3 47,596,677 9.6
December 31, 2014
Currency
Net currencyexposure
($)
Percentage ofnet assets
(%)
Impact onthe Fund
($)
Percentage ofnet assets
(%)
US Dollar 333,338,803 78.8 33,333,880 7.9British Pound 15,797,127 3.7 1,579,713 0.4European Euro 14,038,523 3.3 1,403,852 0.3Swiss Franc 11,211,073 2.6 1,121,107 0.3Japanese Yen 8,016,329 1.9 801,633 0.2Hong Kong Dollar 7,045,118 1.7 704,512 0.2Swedish Krona 4,708,312 1.1 470,831 0.1Singapore Dollar 4,388,610 1.0 438,861 0.1Australian Dollar 3,169,999 0.7 317,000 0.1Indonesian Rupiah 2,128,881 0.5 212,888 0.1Brazilian Real 1,730,867 0.4 173,087 0.0Thai Baht 1,495,726 0.4 149,573 0.0South African Rand 33,236 0.0 3,324 0.0Polish Zloty 3 0.0 – –
407,102,607 96.1 40,710,261 9.7
iii) Price risk
Price risk is the risk that the carrying value of financialinstruments will fluctuate as a result of changes in marketprices (other than those arising from interest rate risk orcurrency risk) caused by factors specific to a security, itsissuer or all factors affecting a market or a market segment.Exposure to price risk is mainly in equities, derivatives andcommodities, if applicable. As at June 30, 2015,approximately 92.3% (December 31, 2014 – 89.2%) of theFund’s net assets were exposed to price risk. If prices ofthese investments had decreased or increased by 10%, withall other variables held constant, net assets of the Fundwould have decreased or increased, respectively, byapproximately $46,527,254 (December 31, 2014 –$37,771,835). In practice, actual results may differ from thissensitivity analysis and the difference could be material.
iv) Credit risk
The table below summarizes the credit ratings of the bondsand debentures, excluding cash and money market
The accompanying notes are an integral part of the financial statements.
213

Scotia Global Dividend Fund (Unaudited – Continued)
FUND SPECIFIC NOTESFor the periods indicated in Note 1.
instruments but including preferred shares and derivatives,as applicable, held by the Fund.
June 30, 2015 December 31, 2014
Percentage oftotal bonds and
debentures(%)
Percentage ofnet assets
(%)
Percentage oftotal bonds and
debentures(%)
Percentage ofnet assets
(%)
Credit ratingsAA 41.9 0.3 41.7 0.3BB 58.1 0.4 58.3 0.5
100.0 0.7 100.0 0.8
v) Liquidity risk
The table below summarizes the Fund’s financial liabilitiesbased on the remaining period to the contractual maturitydate.
June 30, 2015 December 31, 2014
On demand($)
Less than3 months
($)On demand
($)
Less than3 months
($)
Current liabilities – 623,223 – 1,045,923Liability for written options – – – –Unrealized loss on derivatives – 5,036,419 – 313,598Redeemable units 504,006,445 – 423,270,641 –
504,006,445 5,659,642 423,270,641 1,359,521
Redeemable units are redeemable on demand at theholder’s option. However, the Manager does not expect thatthe contractual maturity disclosed in the table above will berepresentative of the actual cash outflows, as holders ofthese instruments typically retain them for a longer term.
vi) Concentration risk
Concentration risk arises as a result of the concentration ofexposures within the same category, geographical location,asset type or industry sector, as applicable. The table belowis a summary of the Fund’s concentration risk:
Percentage of net assets (%)
June 30, 2015 December 31, 2014
Australia 1.3 0.9Belgium – 0.1Brazil – 0.4Canada 5.3 2.8Denmark 0.6 –France 2.5 5.0Germany 3.4 2.8Hong Kong 2.1 1.6India 0.4 –Indonesia 0.7 0.5Ireland – 0.5Italy 0.5 1.3Japan 1.0 1.9Mexico 0.4 –Netherlands 1.4 1.6Peru 0.8 0.3Portugal 0.4 0.4Singapore 1.1 1.0South Africa 0.0 –Spain 0.9 1.2Sweden 0.5 1.1Switzerland 10.7 10.4Thailand 0.1 0.4Turkey 1.0 1.2United Kingdom 7.8 7.3United States 49.4 46.5
vii) Fair value classification (note 2)
The tables below illustrate the classification of the Fund’sfinancial instruments within the fair value hierarchy.
June 30, 2015Level 1
($)Level 2
($)Level 3
($)Total($)
Equities 268,320,372 169,344,030 – 437,664,402Bonds and debentures – 2,078,479 – 2,078,479Warrants, rights and options 25,529,660 – – 25,529,660Currency forward contracts–assets – 935,201 – 935,201Currency spot contracts–assets 1,666 – – 1,666
293,851,698 172,357,710 – 466,209,408
Currency forward contracts–liabilities – (5,035,197) – (5,035,197)Swap contracts–liabilities (1,222) – – (1,222)
293,850,476 167,322,513 – 461,172,989
December 31, 2014Level 1
($)Level 2
($)Level 3
($)Total($)
Equities 178,237,430 162,974,280 – 341,211,710Bonds and debentures – 1,940,202 – 1,940,202Warrants, rights and options 36,476,572 30,069 – 36,506,641Currency forward contracts–assets – 4,799,773 – 4,799,773
214,714,002 169,744,324 – 384,458,326
Currency forward contracts–liabilities – (313,494) – (313,494)Currency spot contracts–liabilities (104) – – (104)
214,713,898 169,430,830 – 384,144,728
Transfers between levels
During the periods ended June 30, 2015 and December 31,2014, there were no significant transfers between Level 1and Level 2
3. Offsetting of financial assets and liabilities (note 2)
The following table presents offsetting of financial assetsand liabilities and collateral amounts that would occur if
The accompanying notes are an integral part of the financial statements.
214
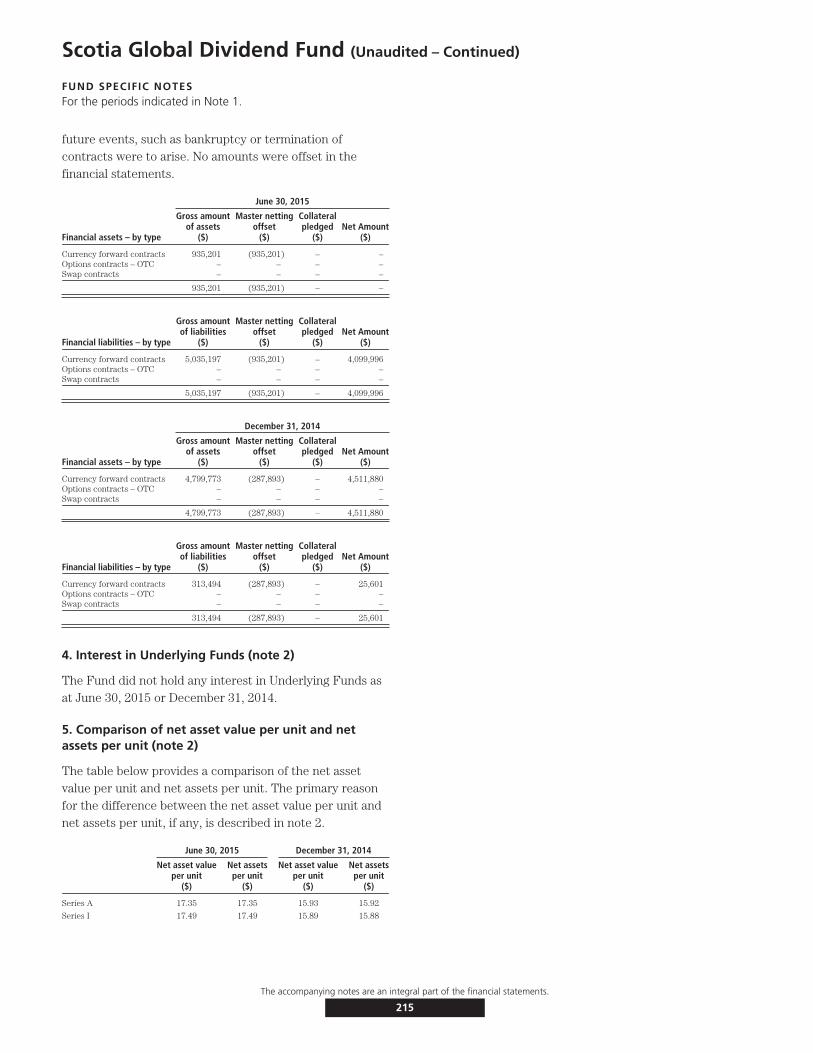
Scotia Global Dividend Fund (Unaudited – Continued)
FUND SPECIFIC NOTESFor the periods indicated in Note 1.
future events, such as bankruptcy or termination ofcontracts were to arise. No amounts were offset in thefinancial statements.
June 30, 2015
Financial assets – by type
Gross amountof assets
($)
Master nettingoffset
($)
Collateralpledged
($)Net Amount
($)
Currency forward contracts 935,201 (935,201) – –Options contracts – OTC – – – –Swap contracts – – – –
935,201 (935,201) – –
Financial liabilities – by type
Gross amountof liabilities
($)
Master nettingoffset
($)
Collateralpledged
($)Net Amount
($)
Currency forward contracts 5,035,197 (935,201) – 4,099,996Options contracts – OTC – – – –Swap contracts – – – –
5,035,197 (935,201) – 4,099,996
December 31, 2014
Financial assets – by type
Gross amountof assets
($)
Master nettingoffset
($)
Collateralpledged
($)Net Amount
($)
Currency forward contracts 4,799,773 (287,893) – 4,511,880Options contracts – OTC – – – –Swap contracts – – – –
4,799,773 (287,893) – 4,511,880
Financial liabilities – by type
Gross amountof liabilities
($)
Master nettingoffset
($)
Collateralpledged
($)Net Amount
($)
Currency forward contracts 313,494 (287,893) – 25,601Options contracts – OTC – – – –Swap contracts – – – –
313,494 (287,893) – 25,601
4. Interest in Underlying Funds (note 2)
The Fund did not hold any interest in Underlying Funds asat June 30, 2015 or December 31, 2014.
5. Comparison of net asset value per unit and netassets per unit (note 2)
The table below provides a comparison of the net assetvalue per unit and net assets per unit. The primary reasonfor the difference between the net asset value per unit andnet assets per unit, if any, is described in note 2.
June 30, 2015 December 31, 2014
Net asset valueper unit
($)
Net assetsper unit
($)
Net asset valueper unit
($)
Net assetsper unit
($)
Series A 17.35 17.35 15.93 15.92
Series I 17.49 17.49 15.89 15.88
The accompanying notes are an integral part of the financial statements.
215
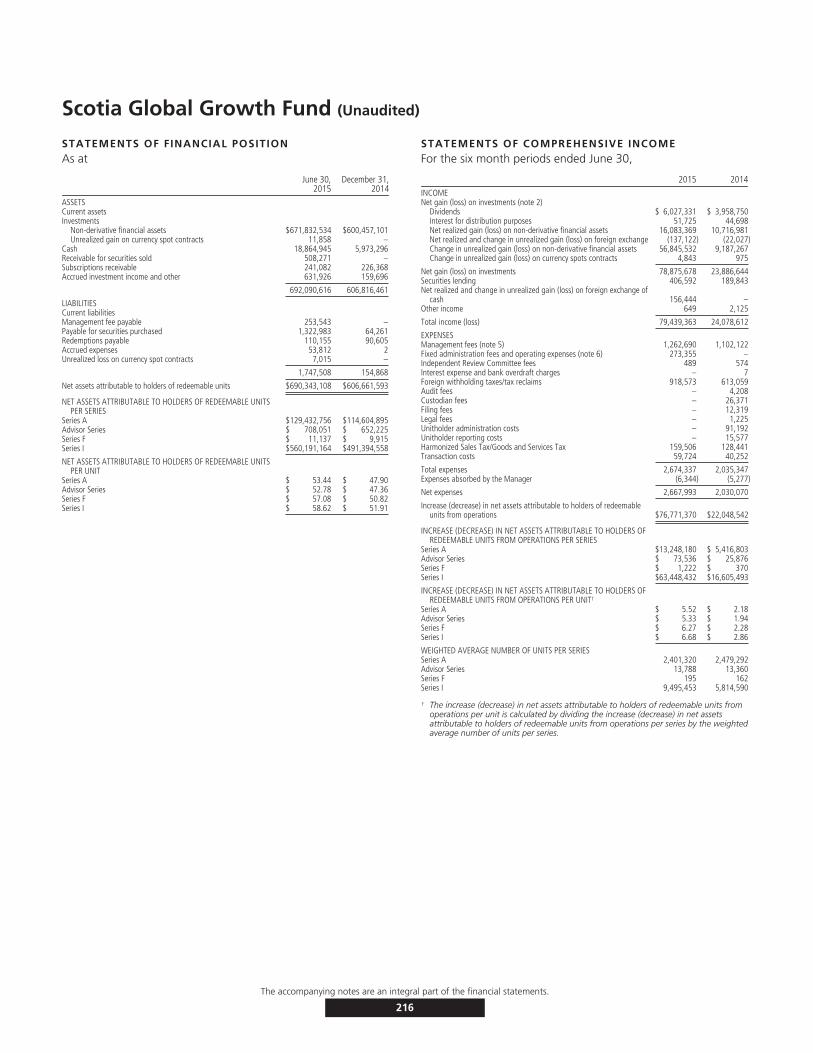
Scotia Global Growth Fund (Unaudited)
STATEMENTS OF FINANCIAL POSITIONAs at
June 30,2015
December 31,2014
ASSETSCurrent assetsInvestments
Non-derivative financial assets $671,832,534 $600,457,101Unrealized gain on currency spot contracts 11,858 –
Cash 18,864,945 5,973,296Receivable for securities sold 508,271 –Subscriptions receivable 241,082 226,368Accrued investment income and other 631,926 159,696
692,090,616 606,816,461
LIABILITIESCurrent liabilitiesManagement fee payable 253,543 –Payable for securities purchased 1,322,983 64,261Redemptions payable 110,155 90,605Accrued expenses 53,812 2Unrealized loss on currency spot contracts 7,015 –
1,747,508 154,868
Net assets attributable to holders of redeemable units $690,343,108 $606,661,593
NET ASSETS ATTRIBUTABLE TO HOLDERS OF REDEEMABLE UNITSPER SERIES
Series A $129,432,756 $114,604,895Advisor Series $ 708,051 $ 652,225Series F $ 11,137 $ 9,915Series I $560,191,164 $491,394,558
NET ASSETS ATTRIBUTABLE TO HOLDERS OF REDEEMABLE UNITSPER UNIT
Series A $ 53.44 $ 47.90Advisor Series $ 52.78 $ 47.36Series F $ 57.08 $ 50.82Series I $ 58.62 $ 51.91
STATEMENTS OF COMPREHENSIVE INCOMEFor the six month periods ended June 30,
2015 2014INCOMENet gain (loss) on investments (note 2)
Dividends $ 6,027,331 $ 3,958,750Interest for distribution purposes 51,725 44,698Net realized gain (loss) on non-derivative financial assets 16,083,369 10,716,981Net realized and change in unrealized gain (loss) on foreign exchange (137,122) (22,027)Change in unrealized gain (loss) on non-derivative financial assets 56,845,532 9,187,267Change in unrealized gain (loss) on currency spots contracts 4,843 975
Net gain (loss) on investments 78,875,678 23,886,644Securities lending 406,592 189,843Net realized and change in unrealized gain (loss) on foreign exchange of
cash 156,444 –Other income 649 2,125
Total income (loss) 79,439,363 24,078,612
EXPENSESManagement fees (note 5) 1,262,690 1,102,122Fixed administration fees and operating expenses (note 6) 273,355 –Independent Review Committee fees 489 574Interest expense and bank overdraft charges – 7Foreign withholding taxes/tax reclaims 918,573 613,059Audit fees – 4,208Custodian fees – 26,371Filing fees – 12,319Legal fees – 1,225Unitholder administration costs – 91,192Unitholder reporting costs – 15,577Harmonized Sales Tax/Goods and Services Tax 159,506 128,441Transaction costs 59,724 40,252
Total expenses 2,674,337 2,035,347Expenses absorbed by the Manager (6,344) (5,277)
Net expenses 2,667,993 2,030,070
Increase (decrease) in net assets attributable to holders of redeemableunits from operations $76,771,370 $22,048,542
INCREASE (DECREASE) IN NET ASSETS ATTRIBUTABLE TO HOLDERS OFREDEEMABLE UNITS FROM OPERATIONS PER SERIES
Series A $13,248,180 $ 5,416,803Advisor Series $ 73,536 $ 25,876Series F $ 1,222 $ 370Series I $63,448,432 $16,605,493
INCREASE (DECREASE) IN NET ASSETS ATTRIBUTABLE TO HOLDERS OFREDEEMABLE UNITS FROM OPERATIONS PER UNIT†
Series A $ 5.52 $ 2.18Advisor Series $ 5.33 $ 1.94Series F $ 6.27 $ 2.28Series I $ 6.68 $ 2.86
WEIGHTED AVERAGE NUMBER OF UNITS PER SERIESSeries A 2,401,320 2,479,292Advisor Series 13,788 13,360Series F 195 162Series I 9,495,453 5,814,590
† The increase (decrease) in net assets attributable to holders of redeemable units fromoperations per unit is calculated by dividing the increase (decrease) in net assetsattributable to holders of redeemable units from operations per series by the weightedaverage number of units per series.
The accompanying notes are an integral part of the financial statements.
216

Scotia Global Growth Fund (Unaudited – Continued)
STATEMENTS OF CHANGES IN NET ASSETSATTRIBUTABLE TO HOLDERS OF REDEEMABLE UNITSFor the six month periods ended June 30,
2015 2014NET ASSETS ATTRIBUTABLE TO HOLDERS OF REDEEMABLE UNITS,
BEGINNING OF PERIODSeries A $114,604,895 $104,339,381Advisor Series 652,225 472,063Series F 9,915 6,684Series I 491,394,558 259,258,740
606,661,593 364,076,868
INCREASE (DECREASE) IN NET ASSETS ATTRIBUTABLE TO HOLDERSOF REDEEMABLE UNITS FROM OPERATIONS
Series A 13,248,180 5,416,803Advisor Series 73,536 25,876Series F 1,222 370Series I 63,448,432 16,605,493
76,771,370 22,048,542
REDEEMABLE UNIT TRANSACTIONSProceeds from issue
Series A 11,797,563 11,020,544Advisor Series 48,410 157,199Series F – 1,000Series I 12,751,141 29,037,674
Payments on redemptionSeries A (10,217,882) (9,374,735)Advisor Series (66,120) (29,729)Series F – (72)Series I (7,402,967) (19,338,301)
6,910,145 11,473,580
INCREASE (DECREASE) IN NET ASSETS ATTRIBUTABLE TO HOLDERSOF REDEEMABLE UNITS
Series A 14,827,861 7,062,612Advisor Series 55,826 153,346Series F 1,222 1,298Series I 68,796,606 26,304,866
83,681,515 33,522,122
NET ASSETS ATTRIBUTABLE TO HOLDERS OF REDEEMABLE UNITS,END OF PERIOD
Series A 129,432,756 111,401,993Advisor Series 708,051 625,409Series F 11,137 7,982Series I 560,191,164 285,563,606
$690,343,108 $397,598,990
STATEMENTS OF CASH FLOWSFor the six month periods ended June 30,
2015 2014CASH FLOWS FROM OPERATING ACTIVITIESIncrease (decrease) in net assets attributable to holders of redeemable
units $ 76,771,370 $ 22,048,542Adjustments for:
Net realized (gain) loss on non-derivative financial assets (16,083,369) (10,716,981)Unrealized (gain) loss on foreign exchange of cash (85,159) 22,027Change in unrealized (gain) loss on non-derivative financial assets (56,845,532) (9,187,267)Change in unrealized (gain) loss on currency spot contracts (4,843) (975)Purchases of non-derivative financial assets (53,743,402) (53,189,307)Proceeds from sale of non-derivative financial assets 55,987,596 37,529,798Transaction costs 59,724 40,252Accrued investment income and other (472,230) 5,973Accrued expenses 307,353 241,122
Net cash provided by (used in) operating activities 5,891,508 (13,206,816)CASH FLOWS FROM FINANCING ACTIVITIESProceeds from issue of redeemable units 24,582,400 40,361,959Amounts paid on redemption of redeemable units (17,667,418) (28,725,571)
Net cash provided by (used in) financing activities 6,914,982 11,636,388Change in unrealized gain (loss) on foreign exchange of cash 85,159 (22,027)Net increase (decrease) in cash 12,806,490 (1,570,428)Cash (bank overdraft), beginning of period 5,973,296 9,720,489
CASH (BANK OVERDRAFT), END OF PERIOD $ 18,864,945 $ 8,128,034
Interest received(1) 46,721 43,777Dividends received, net of withholding taxes(1) 4,640,346 3,352,584
(1) Classified as operating items.
SCHEDULE OF INVESTMENT PORTFOLIOAs at June 30, 2015
Numberof Shares Issuer
AverageCost ($)
CarryingValue ($)
EQUITIES – 97.3%UNITED STATES – 51.4%
100,903 Alibaba Group Holding Ltd. 10,012,747 10,369,81930,942 Amazon.com, Inc. 7,393,386 16,775,46756,415 American Express Company 5,491,176 5,476,13181,196 Anthem, Inc. 8,756,420 16,641,899
163,255 Arcos Dorados Holdings, Inc. 2,253,491 1,069,44522,080 Autohome Inc 1,328,858 1,395,11637,800 Baidu, Inc. 4,881,168 9,398,65974,324 C.H. Robinson Worldwide, Inc. 6,877,022 5,791,493
122,497 CarMax, Inc. 4,530,158 10,129,67478,632 Colgate-Palmolive Company 5,647,593 6,421,314
134,294 Dolby Laboratories Inc., Class A 5,202,539 6,655,409112,232 eBay Inc. 4,700,772 8,443,99878,282 EOG Resources, Inc. 4,873,667 8,557,37339,423 Facebook Inc. 1,813,011 4,222,85510,404 Fairfax Financial Holdings Limited 4,324,766 6,397,97983,115 Financial Engines Inc. 3,795,997 4,409,713
151,103 First Republic Bank 6,666,258 11,895,066150,386 FLIR Systems, Inc. 4,625,099 5,788,77317,653 Google Inc. Class C 7,296,744 11,476,093
126,093 Harley-Davidson, Inc. 7,049,975 8,871,88118,000 Howard Hughes Corporation 2,771,622 3,225,5993,347 Intuitive Surgical, Inc. 1,338,290 2,025,331
117,400 Leucadia National Corporation 3,045,031 3,560,10876,566 Lincoln Electric Holdings, Inc. 5,038,175 5,822,75364,647 M&T Bank Corporation 8,084,254 10,085,77812,533 Markel Corporation 6,517,971 12,542,62740,017 Martin Marietta Materials Inc. 5,125,021 7,071,83477,065 MasterCard, Inc., Class A 3,532,278 8,997,510
146,751 Mindray Medical International Limited ADR 4,548,660 5,223,63044,540 Monsanto Company 5,506,281 5,929,43279,128 Moody’s Corporation 5,665,725 10,669,388
157,021 Myriad Genetics, Inc. 6,014,335 6,668,789160,051 NOW Inc. 5,558,342 3,979,93631,366 Praxair, Inc. 3,071,809 4,683,334
114,100 Qiagen N.V. 2,102,097 3,532,71567,400 QUALCOMM, Inc. 5,024,434 5,272,162
116,702 Ritchie Bros. Auctioneers Incorporated 2,758,699 4,067,305243,300 Royal Caribbean Cruises Ltd. 11,605,045 23,911,57076,300 Seattle Genetics, Inc. 2,009,406 4,612,287
297,542 TD Ameritrade Holding Corporation 8,403,925 13,682,91119,953 Tesla Motors Inc. 2,142,833 6,685,141
251,040 Teradyne, Inc. 4,633,060 6,048,13748,433 TripAdvisor Inc. 3,091,141 5,271,15033,076 Twitter, Inc. 1,201,066 1,496,882
261,335 Ultra Petroleum Corp. 6,089,925 4,086,470101,604 Visa Inc. 4,421,120 8,518,71150,739 Waters Corporation 4,231,462 8,133,626
107,948 Xilinx, Inc. 4,137,884 5,953,74324,293 Zillow Inc., Class A 3,441,456 2,631,764
238,632,194 354,578,780
Australia – 0.8%553,764 Brambles Limited 4,712,711 5,622,787
Brazil – 0.4%627,700 BM&F BOVESPA SA 4,028,602 2,954,938
Denmark – 0.8%49,210 Carlsberg AS, Series B 3,971,763 5,578,219
Germany – 2.0%47,906 Deutsche Boerse AG 3,696,592 4,951,651
104,606 SAP AG 9,023,685 9,102,259
12,720,277 14,053,910
Hong Kong – 2.7%1,523,800 AIA Group Ltd. 8,977,584 12,438,612
For equities, all common shares unless otherwise noted.The accompanying notes are an integral part of the financial statements.
217
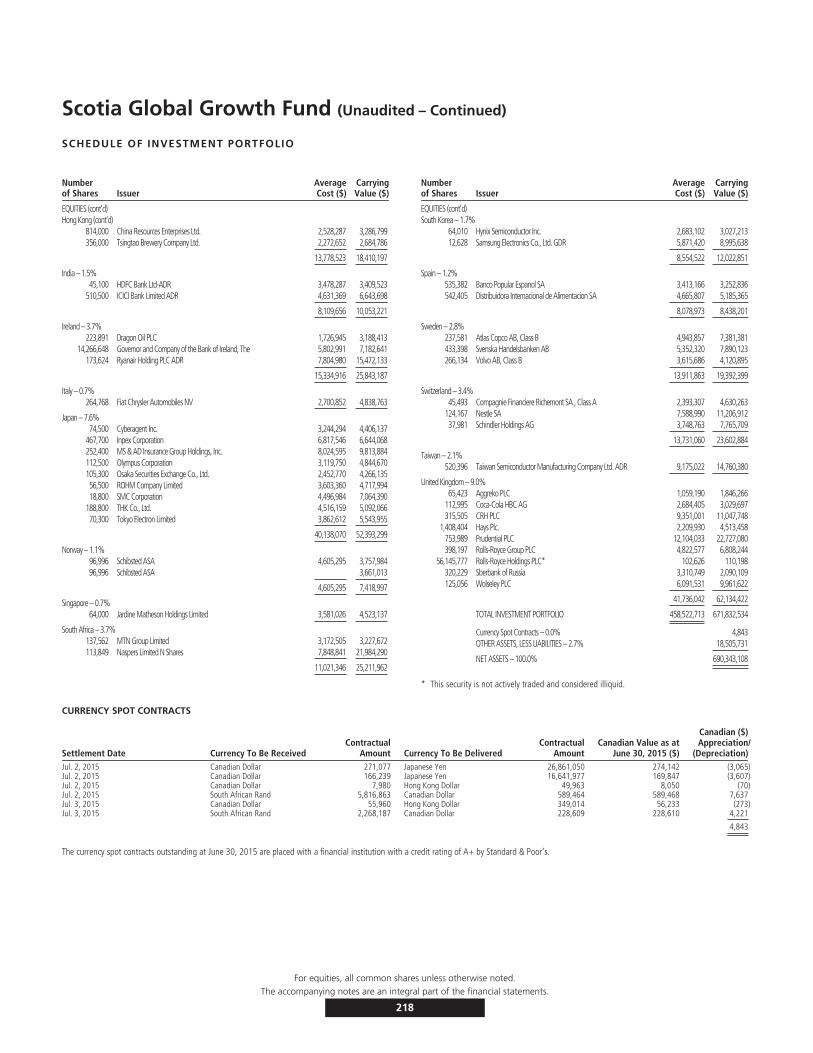
Scotia Global Growth Fund (Unaudited – Continued)
SCHEDULE OF INVESTMENT PORTFOLIO
Numberof Shares Issuer
AverageCost ($)
CarryingValue ($)
EQUITIES (cont’d)Hong Kong (cont’d)
814,000 China Resources Enterprises Ltd. 2,528,287 3,286,799356,000 Tsingtao Brewery Company Ltd. 2,272,652 2,684,786
13,778,523 18,410,197
India – 1.5%45,100 HDFC Bank Ltd-ADR 3,478,287 3,409,523
510,500 ICICI Bank Limited ADR 4,631,369 6,643,698
8,109,656 10,053,221
Ireland – 3.7%223,891 Dragon Oil PLC 1,726,945 3,188,413
14,266,648 Governor and Company of the Bank of Ireland, The 5,802,991 7,182,641173,624 Ryanair Holding PLC ADR 7,804,980 15,472,133
15,334,916 25,843,187
Italy – 0.7%264,768 Fiat Chrysler Automobiles NV 2,700,852 4,838,763
Japan – 7.6%74,500 Cyberagent Inc. 3,244,294 4,406,137
467,700 Inpex Corporation 6,817,546 6,644,068252,400 MS & AD Insurance Group Holdings, Inc. 8,024,595 9,813,884112,500 Olympus Corporation 3,119,750 4,844,670105,300 Osaka Securities Exchange Co., Ltd. 2,452,770 4,266,13556,500 ROHM Company Limited 3,603,360 4,717,99418,800 SMC Corporation 4,496,984 7,064,390
188,800 THK Co., Ltd. 4,516,159 5,092,06670,300 Tokyo Electron Limited 3,862,612 5,543,955
40,138,070 52,393,299
Norway – 1.1%96,996 Schibsted ASA 4,605,295 3,757,98496,996 Schibsted ASA 3,661,013
4,605,295 7,418,997
Singapore – 0.7%64,000 Jardine Matheson Holdings Limited 3,581,026 4,523,137
South Africa – 3.7%137,562 MTN Group Limited 3,172,505 3,227,672113,849 Naspers Limited N Shares 7,848,841 21,984,290
11,021,346 25,211,962
Numberof Shares Issuer
AverageCost ($)
CarryingValue ($)
EQUITIES (cont’d)South Korea – 1.7%
64,010 Hynix Semiconductor Inc. 2,683,102 3,027,21312,628 Samsung Electronics Co., Ltd. GDR 5,871,420 8,995,638
8,554,522 12,022,851
Spain – 1.2%535,382 Banco Popular Espanol SA 3,413,166 3,252,836542,405 Distribuidora Internacional de Alimentacion SA 4,665,807 5,185,365
8,078,973 8,438,201
Sweden – 2.8%237,581 Atlas Copco AB, Class B 4,943,857 7,381,381433,398 Svenska Handelsbanken AB 5,352,320 7,890,123266,134 Volvo AB, Class B 3,615,686 4,120,895
13,911,863 19,392,399
Switzerland – 3.4%45,493 Compagnie Financiere Richemont SA , Class A 2,393,307 4,630,263
124,167 Nestle SA 7,588,990 11,206,91237,981 Schindler Holdings AG 3,748,763 7,765,709
13,731,060 23,602,884
Taiwan – 2.1%520,396 Taiwan Semiconductor Manufacturing Company Ltd. ADR 9,175,022 14,760,380
United Kingdom – 9.0%65,423 Aggreko PLC 1,059,190 1,846,266
112,995 Coca-Cola HBC AG 2,684,405 3,029,697315,505 CRH PLC 9,351,001 11,047,748
1,408,404 Hays Plc. 2,209,930 4,513,458753,989 Prudential PLC 12,104,033 22,727,080398,197 Rolls-Royce Group PLC 4,822,577 6,808,244
56,145,777 Rolls-Royce Holdings PLC* 102,626 110,198320,229 Sberbank of Russia 3,310,749 2,090,109125,056 Wolseley PLC 6,091,531 9,961,622
41,736,042 62,134,422
TOTAL INVESTMENT PORTFOLIO 458,522,713 671,832,534
Currency Spot Contracts – 0.0% 4,843OTHER ASSETS, LESS LIABILITIES – 2.7% 18,505,731
NET ASSETS – 100.0% 690,343,108
* This security is not actively traded and considered illiquid.
CURRENCY SPOT CONTRACTS
Settlement Date Currency To Be ReceivedContractual
Amount Currency To Be DeliveredContractual
AmountCanadian Value as at
June 30, 2015 ($)
Canadian ($)Appreciation/
(Depreciation)Jul. 2, 2015 Canadian Dollar 271,077 Japanese Yen 26,861,050 274,142 (3,065)Jul. 2, 2015 Canadian Dollar 166,239 Japanese Yen 16,641,977 169,847 (3,607)Jul. 2, 2015 Canadian Dollar 7,980 Hong Kong Dollar 49,963 8,050 (70)Jul. 2, 2015 South African Rand 5,816,863 Canadian Dollar 589,464 589,468 7,637Jul. 3, 2015 Canadian Dollar 55,960 Hong Kong Dollar 349,014 56,233 (273)Jul. 3, 2015 South African Rand 2,268,187 Canadian Dollar 228,609 228,610 4,221
4,843
The currency spot contracts outstanding at June 30, 2015 are placed with a financial institution with a credit rating of A+ by Standard & Poor’s.
For equities, all common shares unless otherwise noted.The accompanying notes are an integral part of the financial statements.
218

Scotia Global Growth Fund (Unaudited)
FUND SPECIFIC NOTESFor the periods indicated in Note 1.
1. The Fund (note 1)
The Fund’s investment objective is long-term capitalgrowth. It invests primarily in a broad range of equitysecurities of companies around the world.
2. Risks associated with financial instruments (note 4)
i) Interest rate risk
The majority of the Fund’s financial assets and liabilitieswere non-interest bearing as at June 30, 2015 andDecember 31, 2014. Accordingly, the Fund is not directlysubject to significant risk due to fluctuations in theprevailing levels of market interest rates.
ii) Currency risk
The tables below indicate the currencies to which the Fundhad significant exposure, net of the impact of currencyforward contracts and currency spot contracts, if any, basedon the monetary and non-monetary assets and liabilities ofthe Fund. The tables also illustrate the potential impact onthe Fund if the functional currency of the Fund hadstrengthened or weakened by 10% in relation to each of theother currencies, with all other variables held constant.
June 30, 2015
Currency
Net currencyexposure
($)
Percentage ofnet assets
(%)
Impact onthe Fund
($)
Percentage ofnet assets
(%)
Australian Dollar 5,622,787 0.8 562,279 0.1Brazilian Real 2,954,938 0.4 295,494 –British Pound 63,232,725 9.2 6,323,273 0.9Danish Krone 5,578,219 0.8 557,822 0.1European Euro 34,513,516 5.0 3,451,352 0.5Hong Kong Dollar 18,345,914 2.7 1,834,591 0.3Japanese Yen 52,000,732 7.5 5,200,073 0.8Norwegian Krone 7,418,998 1.1 741,900 0.1South African Rand 26,162,425 3.8 2,616,243 0.4South Korean Won 3,027,213 0.4 302,721 –Swedish Krona 19,392,398 2.8 1,939,240 0.3Swiss Franc 23,602,883 3.4 2,360,288 0.3US Dollar 410,724,823 59.5 41,072,482 5.9
672,577,571 97.4 67,257,758 9.7
December 31, 2014
Currency
Net currencyexposure
($)
Percentage ofnet assets
(%)
Impact onthe Fund
($)
Percentage ofnet assets
(%)
US Dollar 356,081,835 58.7 35,608,184 5.9British Pound 59,714,075 9.8 5,971,408 1.0Japanese Yen 41,262,924 6.8 4,126,292 0.7Swiss Franc 34,079,553 5.6 3,407,955 0.6European Euro 23,209,944 3.8 2,320,994 0.4South African Rand 19,426,129 3.2 1,942,613 0.3Swedish Krona 18,230,371 3.0 1,823,037 0.3Hong Kong Dollar 17,729,181 2.9 1,772,918 0.3Norwegian Krone 10,388,239 1.7 1,038,824 0.2Danish Krone 7,723,952 1.3 772,395 0.1Australian Dollar 5,538,425 0.9 553,843 0.1South Korean Won 3,214,449 0.5 321,445 0.1Brazilian Real 2,699,218 0.4 269,922 0.0Indonesian Rupiah 1,231,063 0.2 123,106 0.0
600,529,358 98.8 60,052,936 10.0
iii) Price risk
Price risk is the risk that the carrying value of financialinstruments will fluctuate as a result of changes in marketprices (other than those arising from interest rate risk orcurrency risk) caused by factors specific to a security, itsissuer or all factors affecting a market or a market segment.Exposure to price risk is mainly in equities, derivatives andcommodities, if applicable. As at June 30, 2015,approximately 97.3% (December 31, 2014 – 99.0%) of theFund’s net assets were exposed to price risk. If prices ofthese investments had decreased or increased by 10%, withall other variables held constant, net assets of the Fundwould have decreased or increased, respectively, byapproximately $67,183,253 (December 31, 2014 –$60,045,710). In practice, actual results may differ from thissensitivity analysis and the difference could be material.
iv) Credit risk
The Fund had no significant exposure to bonds anddebentures, preferred shares or derivatives as at June 30,2015 or December 31, 2014. In addition, all investmenttransactions are executed by brokers with an approvedcredit rating. As such the risk of default on transactionswith counterparties and brokers related to purchase andsale of securities is considered minimal. In instances wherethe credit rating were to fall below the approved rating, theManager would take appropriate action.
v) Liquidity risk
The table below summarizes the Fund’s financial liabilitiesbased on the remaining period to the contractual maturitydate.
June 30, 2015 December 31, 2014
On demand($)
Less than3 months
($)On demand
($)
Less than3 months
($)
Current liabilities – 1,740,493 – 154,868Liability for written options – – – –Unrealized loss on derivatives – 7,015 – –Redeemable units 690,343,108 – 606,661,593 –
690,343,108 1,747,508 606,661,593 154,868
Redeemable units are redeemable on demand at theholder’s option. However, the Manager does not expect thatthe contractual maturity disclosed in the table above will berepresentative of the actual cash outflows, as holders ofthese instruments typically retain them for a longer term.
The accompanying notes are an integral part of the financial statements.
219

Scotia Global Growth Fund (Unaudited – Continued)
FUND SPECIFIC NOTESFor the periods indicated in Note 1.
vi) Concentration risk
Concentration risk arises as a result of the concentration ofexposures within the same category, geographical location,asset type or industry sector, as applicable. The table belowis a summary of the Fund’s concentration risk:
Percentage of net assets (%)
June 30, 2015 December 31, 2014
Australia 0.8 0.9Brazil 0.4 0.5Canada – 1.6Denmark 0.8 1.3Germany 2.0 1.5Hong Kong 2.7 2.9India 1.5 1.1Indonesia – 0.2Ireland 3.7 3.6Italy 0.7 0.6Japan 7.6 6.8Norway 1.1 1.7Singapore 0.7 0.8South Africa 3.7 3.2South Korea 1.7 2.1Spain 1.2 0.7Sweden 2.8 3.0Switzerland 3.4 5.6Taiwan 2.1 2.2United Kingdom 9.0 9.7United States 51.4 49.0
vii) Fair value classification (note 2)
The tables below illustrate the classification of the Fund’sfinancial instruments within the fair value hierarchy.
June 30, 2015Level 1
($)Level 2
($)Level 3
($)Total($)
Equities 397,819,453 274,013,081 – 671,832,534Currency spot contracts–assets 11,858 – – 11,858
397,831,311 274,013,081 – 671,844,392
Currency spot contracts–liabilities (7,015) – – (7,015)
397,824,296 274,013,081 – 671,837,377
December 31, 2014Level 1
($)Level 2
($)Level 3
($)Total($)
Equities 340,348,691 260,108,410 – 600,457,101
340,348,691 260,108,410 – 600,457,101
Transfers between levels
During the periods ended June 30, 2015 and December 31,2014, there were no significant transfers between Level 1and Level 2.
3. Offsetting of financial assets and liabilities (note 2)
As at June 30, 2015 or December 31, 2014, the Fund didnot enter into any agreement whereby the financialinstruments were eligible for offset.
4. Interest in Underlying Funds (note 2)
The Fund did not hold any interest in Underlying Funds asat June 30, 2015 or December 31, 2014.
5. Comparison of net asset value per unit and netassets per unit (note 2)
The table below provides a comparison of the net assetvalue per unit and net assets per unit. The primary reasonfor the difference between the net asset value per unit andnet assets per unit, if any, is described in note 2.
June 30, 2015 December 31, 2014
Net asset valueper unit
($)
Net assetsper unit
($)
Net asset valueper unit
($)
Net assetsper unit
($)
Series A 53.44 53.44 47.90 47.90
Advisor Series 52.78 52.78 47.36 47.36
Series F 57.08 57.08 50.82 50.82
Series I 58.62 58.62 51.90 51.91
The accompanying notes are an integral part of the financial statements.
220

Scotia Global Small Cap Fund (Unaudited)
STATEMENTS OF FINANCIAL POSITIONAs at
June 30,2015
December 31,2014
ASSETSCurrent assetsInvestments
Non-derivative financial assets $52,340,809 $44,486,336Unrealized gain on currency forward contracts 368 1,917Unrealized gain on currency spot contracts – 6
Cash – 1,731,246Receivable for securities sold 478,952 –Subscriptions receivable 5,785 1,110Accrued investment income and other 88,320 4,090
52,914,234 46,224,705
LIABILITIESCurrent liabilitiesBank overdraft 320,662 –Management fee payable 11,283 –Payable for securities purchased 86,380 –Redemptions payable 148,298 6,113Accrued expenses 4,988 –Unrealized loss on currency forward contracts 445,638 2,766
1,017,249 8,879
Net assets attributable to holders of redeemable units $51,896,985 $46,215,826
NET ASSETS ATTRIBUTABLE TO HOLDERS OF REDEEMABLE UNITSPER SERIES
Series A $ 4,979,948 $ 3,174,315Series I $46,917,037 $43,041,511
NET ASSETS ATTRIBUTABLE TO HOLDERS OF REDEEMABLE UNITSPER UNIT
Series A $ 10.56 $ 8.88Series I $ 11.61 $ 9.63
STATEMENTS OF COMPREHENSIVE INCOMEFor the six month periods ended June 30,
2015 2014INCOMENet gain (loss) on investments (note 2)
Dividends $ 640,440 $ 480,378Interest for distribution purposes 1,017 1,498Net realized gain (loss) on non-derivative financial assets 4,838,916 4,003,138Net realized gain (loss) on currency forward contracts (1,044,624) (4,934)Net realized and change in unrealized gain (loss) on foreign exchange 14,647 (1,962)Change in unrealized gain (loss) on non-derivative financial assets 5,320,940 (1,164,715)Change in unrealized gain (loss) on currency forward contracts (444,421) (23,104)Change in unrealized gain (loss) on currency spots contracts (6) (1,271)
Net gain (loss) on investments 9,326,909 3,289,028Securities lending 4,271 8,260Net realized and change in unrealized gain (loss) on foreign exchange of
cash 61,731 –Other income 278 1,618
Total income (loss) 9,393,189 3,298,906
EXPENSESManagement fees (note 5) 46,084 38,831Fixed administration fees (note 6) 24,087 –Independent Review Committee fees 37 89Interest expense and bank overdraft charges 2,724 10,416Foreign withholding taxes/tax reclaims 52,038 50,861Audit fees – 493Custodian fees – 5,434Filing fees – 10,485Legal fees – 189Unitholder administration costs – 6,761Unitholder reporting costs – 4,405Harmonized Sales Tax/Goods and Services Tax 7,221 5,504Transaction costs 50,141 60,480
Total expenses 182,332 193,948Expenses absorbed by the Manager – (8,234)
Net expenses 182,332 185,714
Increase (decrease) in net assets attributable to holders of redeemableunits from operations $ 9,210,857 $ 3,113,192
INCREASE (DECREASE) IN NET ASSETS ATTRIBUTABLE TO HOLDERS OFREDEEMABLE UNITS FROM OPERATIONS PER SERIES
Series A $ 616,431 $ 97,429Series I $ 8,594,426 $ 3,015,763
INCREASE (DECREASE) IN NET ASSETS ATTRIBUTABLE TO HOLDERS OFREDEEMABLE UNITS FROM OPERATIONS PER UNIT†
Series A $ 1.56 $ 0.24Series I $ 2.01 $ 0.47
WEIGHTED AVERAGE NUMBER OF UNITS PER SERIESSeries A 394,830 410,918Series I 4,270,239 6,479,524
† The increase (decrease) in net assets attributable to holders of redeemable units fromoperations per unit is calculated by dividing the increase (decrease) in net assetsattributable to holders of redeemable units from operations per series by the weightedaverage number of units per series.
The accompanying notes are an integral part of the financial statements.
221
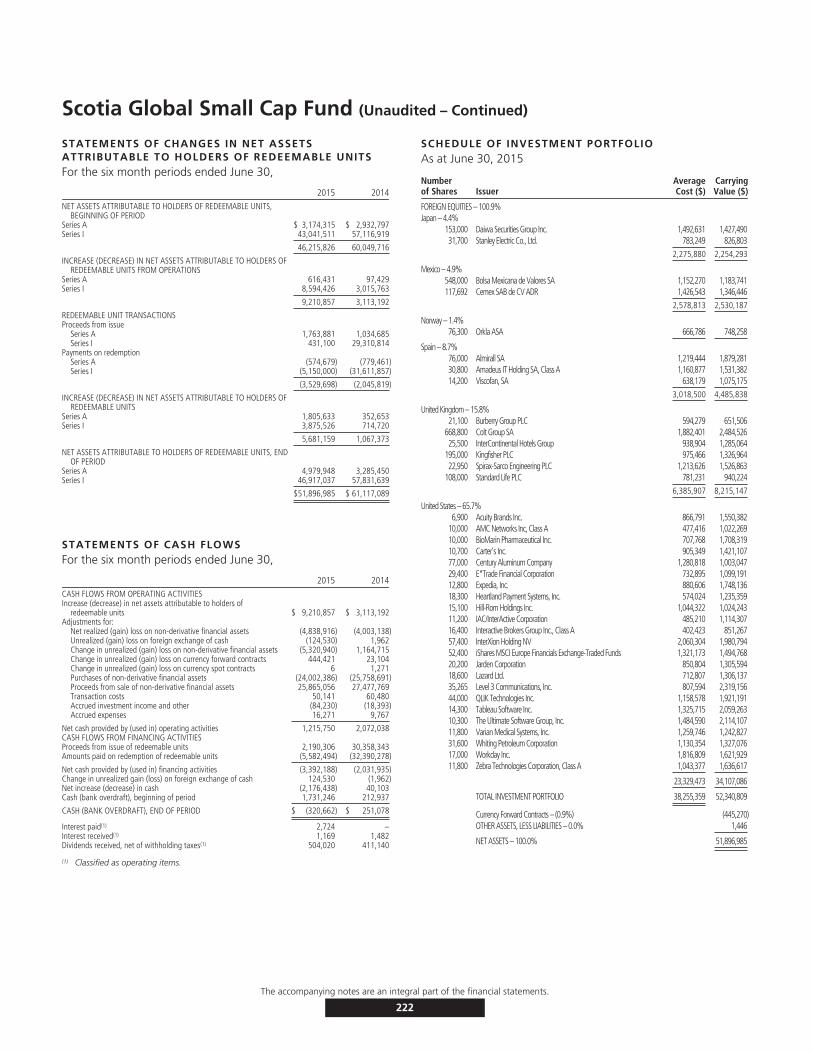
Scotia Global Small Cap Fund (Unaudited – Continued)
STATEMENTS OF CHANGES IN NET ASSETSATTRIBUTABLE TO HOLDERS OF REDEEMABLE UNITSFor the six month periods ended June 30,
2015 2014NET ASSETS ATTRIBUTABLE TO HOLDERS OF REDEEMABLE UNITS,
BEGINNING OF PERIODSeries A $ 3,174,315 $ 2,932,797Series I 43,041,511 57,116,919
46,215,826 60,049,716
INCREASE (DECREASE) IN NET ASSETS ATTRIBUTABLE TO HOLDERS OFREDEEMABLE UNITS FROM OPERATIONS
Series A 616,431 97,429Series I 8,594,426 3,015,763
9,210,857 3,113,192
REDEEMABLE UNIT TRANSACTIONSProceeds from issue
Series A 1,763,881 1,034,685Series I 431,100 29,310,814
Payments on redemptionSeries A (574,679) (779,461)Series I (5,150,000) (31,611,857)
(3,529,698) (2,045,819)
INCREASE (DECREASE) IN NET ASSETS ATTRIBUTABLE TO HOLDERS OFREDEEMABLE UNITS
Series A 1,805,633 352,653Series I 3,875,526 714,720
5,681,159 1,067,373
NET ASSETS ATTRIBUTABLE TO HOLDERS OF REDEEMABLE UNITS, ENDOF PERIOD
Series A 4,979,948 3,285,450Series I 46,917,037 57,831,639
$51,896,985 $ 61,117,089
STATEMENTS OF CASH FLOWSFor the six month periods ended June 30,
2015 2014CASH FLOWS FROM OPERATING ACTIVITIESIncrease (decrease) in net assets attributable to holders of
redeemable units $ 9,210,857 $ 3,113,192Adjustments for:
Net realized (gain) loss on non-derivative financial assets (4,838,916) (4,003,138)Unrealized (gain) loss on foreign exchange of cash (124,530) 1,962Change in unrealized (gain) loss on non-derivative financial assets (5,320,940) 1,164,715Change in unrealized (gain) loss on currency forward contracts 444,421 23,104Change in unrealized (gain) loss on currency spot contracts 6 1,271Purchases of non-derivative financial assets (24,002,386) (25,758,691)Proceeds from sale of non-derivative financial assets 25,865,056 27,477,769Transaction costs 50,141 60,480Accrued investment income and other (84,230) (18,393)Accrued expenses 16,271 9,767
Net cash provided by (used in) operating activities 1,215,750 2,072,038CASH FLOWS FROM FINANCING ACTIVITIESProceeds from issue of redeemable units 2,190,306 30,358,343Amounts paid on redemption of redeemable units (5,582,494) (32,390,278)
Net cash provided by (used in) financing activities (3,392,188) (2,031,935)Change in unrealized gain (loss) on foreign exchange of cash 124,530 (1,962)Net increase (decrease) in cash (2,176,438) 40,103Cash (bank overdraft), beginning of period 1,731,246 212,937
CASH (BANK OVERDRAFT), END OF PERIOD $ (320,662) $ 251,078
Interest paid(1) 2,724 –Interest received(1) 1,169 1,482Dividends received, net of withholding taxes(1) 504,020 411,140
(1) Classified as operating items.
SCHEDULE OF INVESTMENT PORTFOLIOAs at June 30, 2015
Numberof Shares Issuer
AverageCost ($)
CarryingValue ($)
FOREIGN EQUITIES – 100.9%Japan – 4.4%
153,000 Daiwa Securities Group Inc. 1,492,631 1,427,49031,700 Stanley Electric Co., Ltd. 783,249 826,803
2,275,880 2,254,293
Mexico – 4.9%548,000 Bolsa Mexicana de Valores SA 1,152,270 1,183,741117,692 Cemex SAB de CV ADR 1,426,543 1,346,446
2,578,813 2,530,187
Norway – 1.4%76,300 Orkla ASA 666,786 748,258
Spain – 8.7%76,000 Almirall SA 1,219,444 1,879,28130,800 Amadeus IT Holding SA, Class A 1,160,877 1,531,38214,200 Viscofan, SA 638,179 1,075,175
3,018,500 4,485,838
United Kingdom – 15.8%21,100 Burberry Group PLC 594,279 651,506
668,800 Colt Group SA 1,882,401 2,484,52625,500 InterContinental Hotels Group 938,904 1,285,064
195,000 Kingfisher PLC 975,466 1,326,96422,950 Spirax-Sarco Engineering PLC 1,213,626 1,526,863
108,000 Standard Life PLC 781,231 940,2246,385,907 8,215,147
United States – 65.7%6,900 Acuity Brands Inc. 866,791 1,550,382
10,000 AMC Networks Inc, Class A 477,416 1,022,26910,000 BioMarin Pharmaceutical Inc. 707,768 1,708,31910,700 Carter’s Inc. 905,349 1,421,10777,000 Century Aluminum Company 1,280,818 1,003,04729,400 E*Trade Financial Corporation 732,895 1,099,19112,800 Expedia, Inc. 880,606 1,748,13618,300 Heartland Payment Systems, Inc. 574,024 1,235,35915,100 Hill-Rom Holdings Inc. 1,044,322 1,024,24311,200 IAC/InterActive Corporation 485,210 1,114,30716,400 Interactive Brokers Group Inc., Class A 402,423 851,26757,400 InterXion Holding NV 2,060,304 1,980,79452,400 iShares MSCI Europe Financials Exchange-Traded Funds 1,321,173 1,494,76820,200 Jarden Corporation 850,804 1,305,59418,600 Lazard Ltd. 712,807 1,306,13735,265 Level 3 Communications, Inc. 807,594 2,319,15644,000 QLIK Technologies Inc. 1,158,578 1,921,19114,300 Tableau Software Inc. 1,325,715 2,059,26310,300 The Ultimate Software Group, Inc. 1,484,590 2,114,10711,800 Varian Medical Systems, Inc. 1,259,746 1,242,82731,600 Whiting Petroleum Corporation 1,130,354 1,327,07617,000 Workday Inc. 1,816,809 1,621,92911,800 Zebra Technologies Corporation, Class A 1,043,377 1,636,617
23,329,473 34,107,086
TOTAL INVESTMENT PORTFOLIO 38,255,359 52,340,809
Currency Forward Contracts – (0.9%) (445,270)OTHER ASSETS, LESS LIABILITIES – 0.0% 1,446
NET ASSETS – 100.0% 51,896,985
The accompanying notes are an integral part of the financial statements.
222

Scotia Global Small Cap Fund (Unaudited – Continued)
SCHEDULE OF INVESTMENT PORTFOLIO
CURRENCY FORWARD CONTRACTS
Settlement Date Currency To Be ReceivedContractual
Amount Currency To Be DeliveredContractual
AmountCanadian Value as at
June 30, 2015 ($)
Canadian ($)Appreciation/
(Depreciation)Aug. 20, 2015 Canadian Dollar 16,750,168 U.S. Dollar 13,600,000 17,005,952 (255,784)Aug. 20, 2015 Canadian Dollar 8,878,752 U.S. Dollar 7,200,000 9,003,151 (124,399)Aug. 25, 2015 Canadian Dollar 268,496 Japanese Yen 27,000,000 275,941 (7,445)Aug. 28, 2015 Canadian Dollar 2,067,913 Japanese Yen 208,000,000 2,125,923 (58,010)Aug. 28, 2015 Japanese Yen 15,000,000 Canadian Dollar 152,932 152,721 368
(445,270)
The currency forward contracts outstanding at June 30, 2015 are placed with a financial institution with a credit rating of A by Standard & Poor’s.
The accompanying notes are an integral part of the financial statements.
223
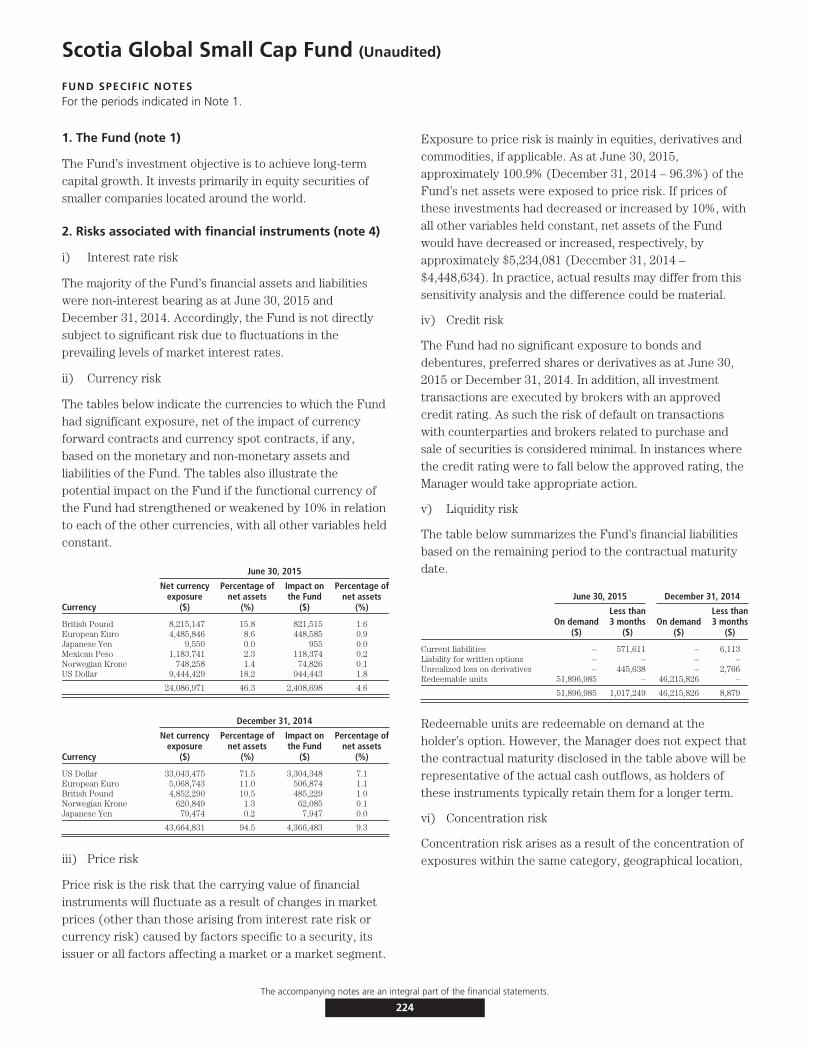
Scotia Global Small Cap Fund (Unaudited)
FUND SPECIFIC NOTESFor the periods indicated in Note 1.
1. The Fund (note 1)
The Fund’s investment objective is to achieve long-termcapital growth. It invests primarily in equity securities ofsmaller companies located around the world.
2. Risks associated with financial instruments (note 4)
i) Interest rate risk
The majority of the Fund’s financial assets and liabilitieswere non-interest bearing as at June 30, 2015 andDecember 31, 2014. Accordingly, the Fund is not directlysubject to significant risk due to fluctuations in theprevailing levels of market interest rates.
ii) Currency risk
The tables below indicate the currencies to which the Fundhad significant exposure, net of the impact of currencyforward contracts and currency spot contracts, if any,based on the monetary and non-monetary assets andliabilities of the Fund. The tables also illustrate thepotential impact on the Fund if the functional currency ofthe Fund had strengthened or weakened by 10% in relationto each of the other currencies, with all other variables heldconstant.
June 30, 2015
Currency
Net currencyexposure
($)
Percentage ofnet assets
(%)
Impact onthe Fund
($)
Percentage ofnet assets
(%)
British Pound 8,215,147 15.8 821,515 1.6European Euro 4,485,846 8.6 448,585 0.9Japanese Yen 9,550 0.0 955 0.0Mexican Peso 1,183,741 2.3 118,374 0.2Norwegian Krone 748,258 1.4 74,826 0.1US Dollar 9,444,429 18.2 944,443 1.8
24,086,971 46.3 2,408,698 4.6
December 31, 2014
Currency
Net currencyexposure
($)
Percentage ofnet assets
(%)
Impact onthe Fund
($)
Percentage ofnet assets
(%)
US Dollar 33,043,475 71.5 3,304,348 7.1European Euro 5,068,743 11.0 506,874 1.1British Pound 4,852,290 10.5 485,229 1.0Norwegian Krone 620,849 1.3 62,085 0.1Japanese Yen 79,474 0.2 7,947 0.0
43,664,831 94.5 4,366,483 9.3
iii) Price risk
Price risk is the risk that the carrying value of financialinstruments will fluctuate as a result of changes in marketprices (other than those arising from interest rate risk orcurrency risk) caused by factors specific to a security, itsissuer or all factors affecting a market or a market segment.
Exposure to price risk is mainly in equities, derivatives andcommodities, if applicable. As at June 30, 2015,approximately 100.9% (December 31, 2014 – 96.3%) of theFund’s net assets were exposed to price risk. If prices ofthese investments had decreased or increased by 10%, withall other variables held constant, net assets of the Fundwould have decreased or increased, respectively, byapproximately $5,234,081 (December 31, 2014 –$4,448,634). In practice, actual results may differ from thissensitivity analysis and the difference could be material.
iv) Credit risk
The Fund had no significant exposure to bonds anddebentures, preferred shares or derivatives as at June 30,2015 or December 31, 2014. In addition, all investmenttransactions are executed by brokers with an approvedcredit rating. As such the risk of default on transactionswith counterparties and brokers related to purchase andsale of securities is considered minimal. In instances wherethe credit rating were to fall below the approved rating, theManager would take appropriate action.
v) Liquidity risk
The table below summarizes the Fund’s financial liabilitiesbased on the remaining period to the contractual maturitydate.
June 30, 2015 December 31, 2014
On demand($)
Less than3 months
($)On demand
($)
Less than3 months
($)
Current liabilities – 571,611 – 6,113Liability for written options – – – –Unrealized loss on derivatives – 445,638 – 2,766Redeemable units 51,896,985 – 46,215,826 –
51,896,985 1,017,249 46,215,826 8,879
Redeemable units are redeemable on demand at theholder’s option. However, the Manager does not expect thatthe contractual maturity disclosed in the table above will berepresentative of the actual cash outflows, as holders ofthese instruments typically retain them for a longer term.
vi) Concentration risk
Concentration risk arises as a result of the concentration ofexposures within the same category, geographical location,
The accompanying notes are an integral part of the financial statements.
224
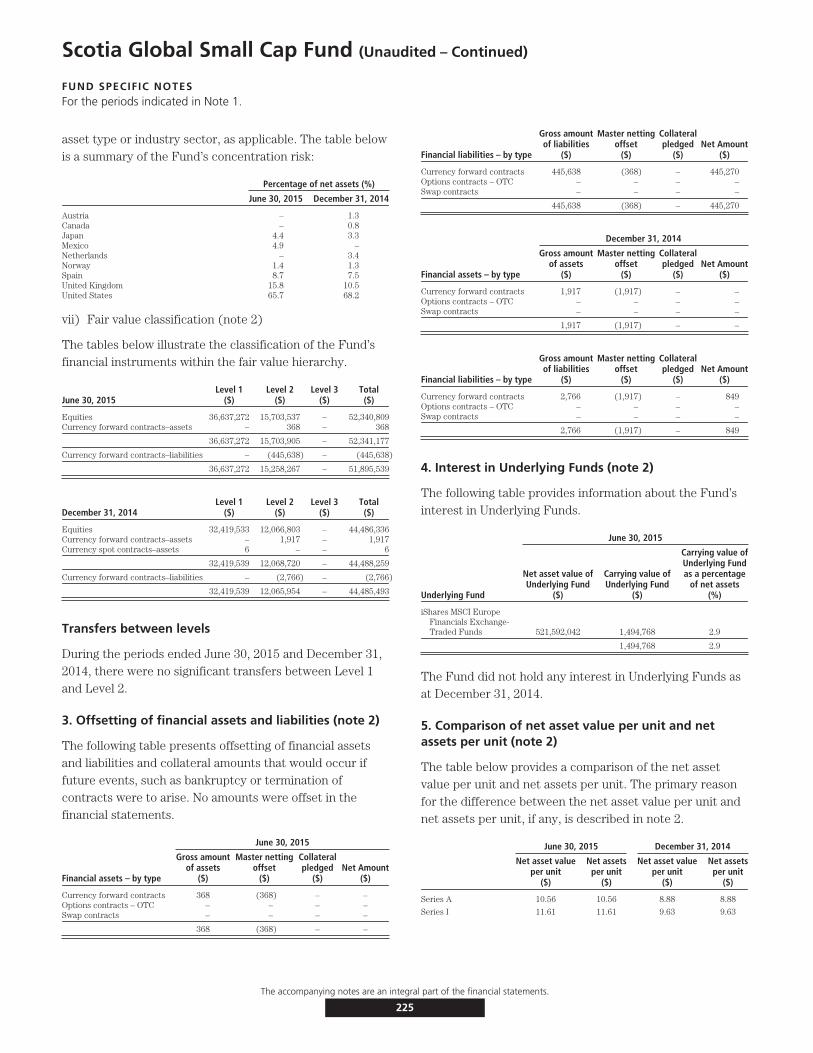
Scotia Global Small Cap Fund (Unaudited – Continued)
FUND SPECIFIC NOTESFor the periods indicated in Note 1.
asset type or industry sector, as applicable. The table belowis a summary of the Fund’s concentration risk:
Percentage of net assets (%)
June 30, 2015 December 31, 2014
Austria – 1.3Canada – 0.8Japan 4.4 3.3Mexico 4.9 –Netherlands – 3.4Norway 1.4 1.3Spain 8.7 7.5United Kingdom 15.8 10.5United States 65.7 68.2
vii) Fair value classification (note 2)
The tables below illustrate the classification of the Fund’sfinancial instruments within the fair value hierarchy.
June 30, 2015Level 1
($)Level 2
($)Level 3
($)Total($)
Equities 36,637,272 15,703,537 – 52,340,809Currency forward contracts–assets – 368 – 368
36,637,272 15,703,905 – 52,341,177
Currency forward contracts–liabilities – (445,638) – (445,638)
36,637,272 15,258,267 – 51,895,539
December 31, 2014Level 1
($)Level 2
($)Level 3
($)Total($)
Equities 32,419,533 12,066,803 – 44,486,336Currency forward contracts–assets – 1,917 – 1,917Currency spot contracts–assets 6 – – 6
32,419,539 12,068,720 – 44,488,259
Currency forward contracts–liabilities – (2,766) – (2,766)
32,419,539 12,065,954 – 44,485,493
Transfers between levels
During the periods ended June 30, 2015 and December 31,2014, there were no significant transfers between Level 1and Level 2.
3. Offsetting of financial assets and liabilities (note 2)
The following table presents offsetting of financial assetsand liabilities and collateral amounts that would occur iffuture events, such as bankruptcy or termination ofcontracts were to arise. No amounts were offset in thefinancial statements.
June 30, 2015
Financial assets – by type
Gross amountof assets
($)
Master nettingoffset
($)
Collateralpledged
($)Net Amount
($)
Currency forward contracts 368 (368) – –Options contracts – OTC – – – –Swap contracts – – – –
368 (368) – –
Financial liabilities – by type
Gross amountof liabilities
($)
Master nettingoffset
($)
Collateralpledged
($)Net Amount
($)
Currency forward contracts 445,638 (368) – 445,270Options contracts – OTC – – – –Swap contracts – – – –
445,638 (368) – 445,270
December 31, 2014
Financial assets – by type
Gross amountof assets
($)
Master nettingoffset
($)
Collateralpledged
($)Net Amount
($)
Currency forward contracts 1,917 (1,917) – –Options contracts – OTC – – – –Swap contracts – – – –
1,917 (1,917) – –
Financial liabilities – by type
Gross amountof liabilities
($)
Master nettingoffset
($)
Collateralpledged
($)Net Amount
($)
Currency forward contracts 2,766 (1,917) – 849Options contracts – OTC – – – –Swap contracts – – – –
2,766 (1,917) – 849
4. Interest in Underlying Funds (note 2)
The following table provides information about the Fund’sinterest in Underlying Funds.
June 30, 2015
Underlying Fund
Net asset value ofUnderlying Fund
($)
Carrying value ofUnderlying Fund
($)
Carrying value ofUnderlying Fundas a percentage
of net assets(%)
iShares MSCI EuropeFinancials Exchange-Traded Funds 521,592,042 1,494,768 2.9
1,494,768 2.9
The Fund did not hold any interest in Underlying Funds asat December 31, 2014.
5. Comparison of net asset value per unit and netassets per unit (note 2)
The table below provides a comparison of the net assetvalue per unit and net assets per unit. The primary reasonfor the difference between the net asset value per unit andnet assets per unit, if any, is described in note 2.
June 30, 2015 December 31, 2014
Net asset valueper unit
($)
Net assetsper unit
($)
Net asset valueper unit
($)
Net assetsper unit
($)
Series A 10.56 10.56 8.88 8.88
Series I 11.61 11.61 9.63 9.63
The accompanying notes are an integral part of the financial statements.
225
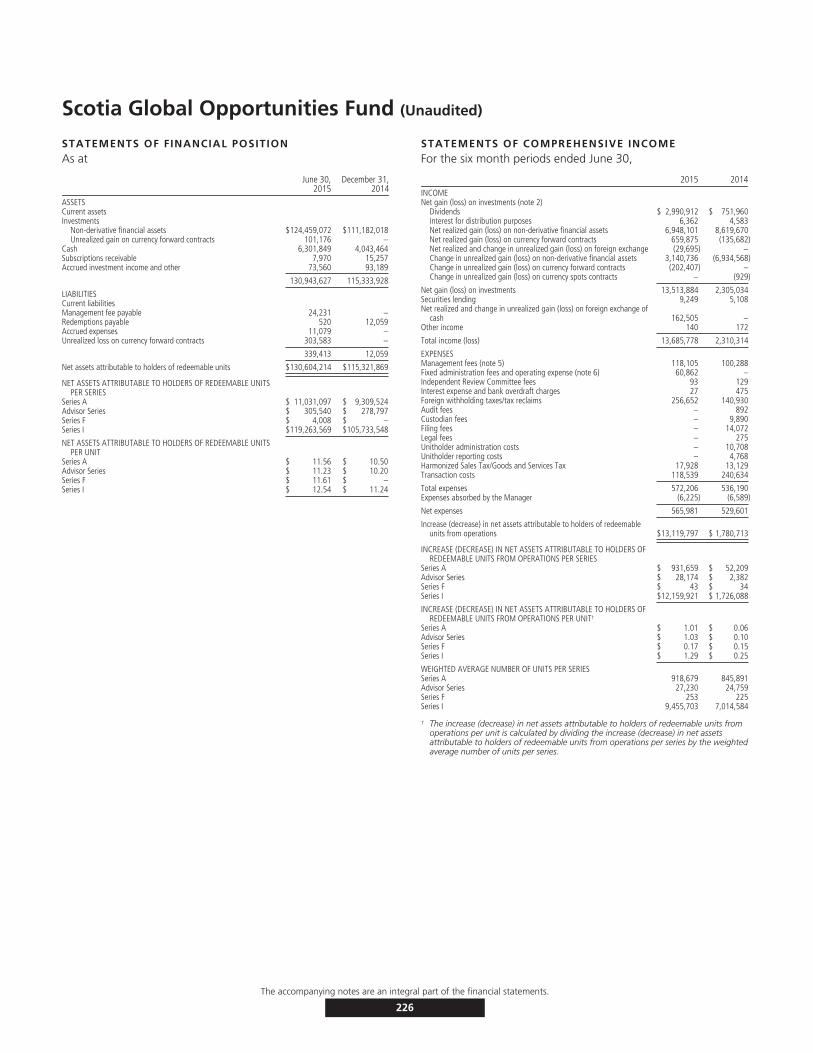
Scotia Global Opportunities Fund (Unaudited)
STATEMENTS OF FINANCIAL POSITIONAs at
June 30,2015
December 31,2014
ASSETSCurrent assetsInvestments
Non-derivative financial assets $124,459,072 $111,182,018Unrealized gain on currency forward contracts 101,176 –
Cash 6,301,849 4,043,464Subscriptions receivable 7,970 15,257Accrued investment income and other 73,560 93,189
130,943,627 115,333,928
LIABILITIESCurrent liabilitiesManagement fee payable 24,231 –Redemptions payable 520 12,059Accrued expenses 11,079 –Unrealized loss on currency forward contracts 303,583 –
339,413 12,059
Net assets attributable to holders of redeemable units $130,604,214 $115,321,869
NET ASSETS ATTRIBUTABLE TO HOLDERS OF REDEEMABLE UNITSPER SERIES
Series A $ 11,031,097 $ 9,309,524Advisor Series $ 305,540 $ 278,797Series F $ 4,008 $ –Series I $119,263,569 $105,733,548
NET ASSETS ATTRIBUTABLE TO HOLDERS OF REDEEMABLE UNITSPER UNIT
Series A $ 11.56 $ 10.50Advisor Series $ 11.23 $ 10.20Series F $ 11.61 $ –Series I $ 12.54 $ 11.24
STATEMENTS OF COMPREHENSIVE INCOMEFor the six month periods ended June 30,
2015 2014INCOMENet gain (loss) on investments (note 2)
Dividends $ 2,990,912 $ 751,960Interest for distribution purposes 6,362 4,583Net realized gain (loss) on non-derivative financial assets 6,948,101 8,619,670Net realized gain (loss) on currency forward contracts 659,875 (135,682)Net realized and change in unrealized gain (loss) on foreign exchange (29,695) –Change in unrealized gain (loss) on non-derivative financial assets 3,140,736 (6,934,568)Change in unrealized gain (loss) on currency forward contracts (202,407) –Change in unrealized gain (loss) on currency spots contracts – (929)
Net gain (loss) on investments 13,513,884 2,305,034Securities lending 9,249 5,108Net realized and change in unrealized gain (loss) on foreign exchange of
cash 162,505 –Other income 140 172
Total income (loss) 13,685,778 2,310,314
EXPENSESManagement fees (note 5) 118,105 100,288Fixed administration fees and operating expense (note 6) 60,862 –Independent Review Committee fees 93 129Interest expense and bank overdraft charges 27 475Foreign withholding taxes/tax reclaims 256,652 140,930Audit fees – 892Custodian fees – 9,890Filing fees – 14,072Legal fees – 275Unitholder administration costs – 10,708Unitholder reporting costs – 4,768Harmonized Sales Tax/Goods and Services Tax 17,928 13,129Transaction costs 118,539 240,634
Total expenses 572,206 536,190Expenses absorbed by the Manager (6,225) (6,589)
Net expenses 565,981 529,601
Increase (decrease) in net assets attributable to holders of redeemableunits from operations $13,119,797 $ 1,780,713
INCREASE (DECREASE) IN NET ASSETS ATTRIBUTABLE TO HOLDERS OFREDEEMABLE UNITS FROM OPERATIONS PER SERIES
Series A $ 931,659 $ 52,209Advisor Series $ 28,174 $ 2,382Series F $ 43 $ 34Series I $12,159,921 $ 1,726,088
INCREASE (DECREASE) IN NET ASSETS ATTRIBUTABLE TO HOLDERS OFREDEEMABLE UNITS FROM OPERATIONS PER UNIT†
Series A $ 1.01 $ 0.06Advisor Series $ 1.03 $ 0.10Series F $ 0.17 $ 0.15Series I $ 1.29 $ 0.25
WEIGHTED AVERAGE NUMBER OF UNITS PER SERIESSeries A 918,679 845,891Advisor Series 27,230 24,759Series F 253 225Series I 9,455,703 7,014,584
† The increase (decrease) in net assets attributable to holders of redeemable units fromoperations per unit is calculated by dividing the increase (decrease) in net assetsattributable to holders of redeemable units from operations per series by the weightedaverage number of units per series.
The accompanying notes are an integral part of the financial statements.
226
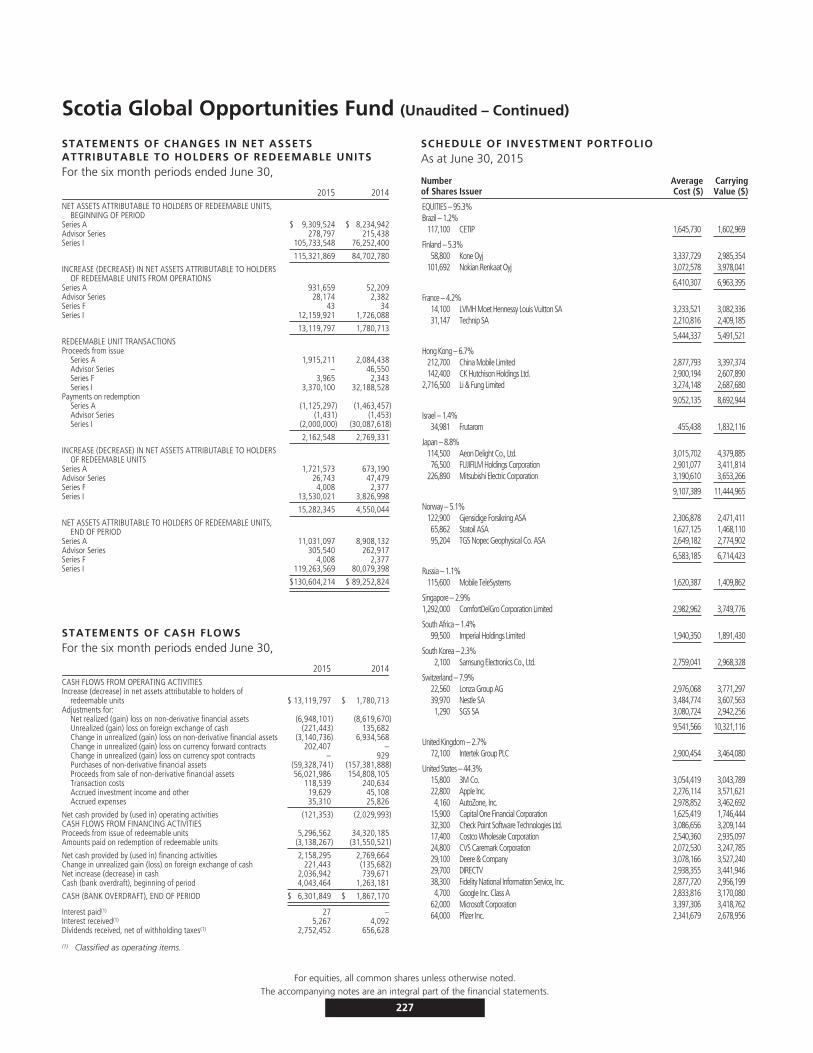
Scotia Global Opportunities Fund (Unaudited – Continued)
STATEMENTS OF CHANGES IN NET ASSETSATTRIBUTABLE TO HOLDERS OF REDEEMABLE UNITSFor the six month periods ended June 30,
2015 2014NET ASSETS ATTRIBUTABLE TO HOLDERS OF REDEEMABLE UNITS,
BEGINNING OF PERIODSeries A $ 9,309,524 $ 8,234,942Advisor Series 278,797 215,438Series I 105,733,548 76,252,400
115,321,869 84,702,780
INCREASE (DECREASE) IN NET ASSETS ATTRIBUTABLE TO HOLDERSOF REDEEMABLE UNITS FROM OPERATIONS
Series A 931,659 52,209Advisor Series 28,174 2,382Series F 43 34Series I 12,159,921 1,726,088
13,119,797 1,780,713
REDEEMABLE UNIT TRANSACTIONSProceeds from issue
Series A 1,915,211 2,084,438Advisor Series – 46,550Series F 3,965 2,343Series I 3,370,100 32,188,528
Payments on redemptionSeries A (1,125,297) (1,463,457)Advisor Series (1,431) (1,453)Series I (2,000,000) (30,087,618)
2,162,548 2,769,331
INCREASE (DECREASE) IN NET ASSETS ATTRIBUTABLE TO HOLDERSOF REDEEMABLE UNITS
Series A 1,721,573 673,190Advisor Series 26,743 47,479Series F 4,008 2,377Series I 13,530,021 3,826,998
15,282,345 4,550,044
NET ASSETS ATTRIBUTABLE TO HOLDERS OF REDEEMABLE UNITS,END OF PERIOD
Series A 11,031,097 8,908,132Advisor Series 305,540 262,917Series F 4,008 2,377Series I 119,263,569 80,079,398
$130,604,214 $ 89,252,824
STATEMENTS OF CASH FLOWSFor the six month periods ended June 30,
2015 2014CASH FLOWS FROM OPERATING ACTIVITIESIncrease (decrease) in net assets attributable to holders of
redeemable units $ 13,119,797 $ 1,780,713Adjustments for:
Net realized (gain) loss on non-derivative financial assets (6,948,101) (8,619,670)Unrealized (gain) loss on foreign exchange of cash (221,443) 135,682Change in unrealized (gain) loss on non-derivative financial assets (3,140,736) 6,934,568Change in unrealized (gain) loss on currency forward contracts 202,407 –Change in unrealized (gain) loss on currency spot contracts – 929Purchases of non-derivative financial assets (59,328,741) (157,381,888)Proceeds from sale of non-derivative financial assets 56,021,986 154,808,105Transaction costs 118,539 240,634Accrued investment income and other 19,629 45,108Accrued expenses 35,310 25,826
Net cash provided by (used in) operating activities (121,353) (2,029,993)CASH FLOWS FROM FINANCING ACTIVITIESProceeds from issue of redeemable units 5,296,562 34,320,185Amounts paid on redemption of redeemable units (3,138,267) (31,550,521)
Net cash provided by (used in) financing activities 2,158,295 2,769,664Change in unrealized gain (loss) on foreign exchange of cash 221,443 (135,682)Net increase (decrease) in cash 2,036,942 739,671Cash (bank overdraft), beginning of period 4,043,464 1,263,181
CASH (BANK OVERDRAFT), END OF PERIOD $ 6,301,849 $ 1,867,170
Interest paid(1) 27 –Interest received(1) 5,267 4,092Dividends received, net of withholding taxes(1) 2,752,452 656,628
(1) Classified as operating items.
SCHEDULE OF INVESTMENT PORTFOLIOAs at June 30, 2015
Numberof Shares Issuer
AverageCost ($)
CarryingValue ($)
EQUITIES – 95.3%Brazil – 1.2%
117,100 CETIP 1,645,730 1,602,969
Finland – 5.3%58,800 Kone Oyj 3,337,729 2,985,354
101,692 Nokian Renkaat Oyj 3,072,578 3,978,041
6,410,307 6,963,395
France – 4.2%14,100 LVMH Moet Hennessy Louis Vuitton SA 3,233,521 3,082,33631,147 Technip SA 2,210,816 2,409,185
5,444,337 5,491,521
Hong Kong – 6.7%212,700 China Mobile Limited 2,877,793 3,397,374142,400 CK Hutchison Holdings Ltd. 2,900,194 2,607,890
2,716,500 Li & Fung Limited 3,274,148 2,687,680
9,052,135 8,692,944
Israel – 1.4%34,981 Frutarom 455,438 1,832,116
Japan – 8.8%114,500 Aeon Delight Co., Ltd. 3,015,702 4,379,88576,500 FUJIFILM Holdings Corporation 2,901,077 3,411,814
226,890 Mitsubishi Electric Corporation 3,190,610 3,653,266
9,107,389 11,444,965
Norway – 5.1%122,900 Gjensidige Forsikring ASA 2,306,878 2,471,41165,862 Statoil ASA 1,627,125 1,468,11095,204 TGS Nopec Geophysical Co. ASA 2,649,182 2,774,902
6,583,185 6,714,423
Russia – 1.1%115,600 Mobile TeleSystems 1,620,387 1,409,862
Singapore – 2.9%1,292,000 ComfortDelGro Corporation Limited 2,982,962 3,749,776
South Africa – 1.4%99,500 Imperial Holdings Limited 1,940,350 1,891,430
South Korea – 2.3%2,100 Samsung Electronics Co., Ltd. 2,759,041 2,968,328
Switzerland – 7.9%22,560 Lonza Group AG 2,976,068 3,771,29739,970 Nestle SA 3,484,774 3,607,5631,290 SGS SA 3,080,724 2,942,256
9,541,566 10,321,116
United Kingdom – 2.7%72,100 Intertek Group PLC 2,900,454 3,464,080
United States – 44.3%15,800 3M Co. 3,054,419 3,043,78922,800 Apple Inc. 2,276,114 3,571,6214,160 AutoZone, Inc. 2,978,852 3,462,692
15,900 Capital One Financial Corporation 1,625,419 1,746,44432,300 Check Point Software Technologies Ltd. 3,086,656 3,209,14417,400 Costco Wholesale Corporation 2,540,360 2,935,09724,800 CVS Caremark Corporation 2,072,530 3,247,78529,100 Deere & Company 3,078,166 3,527,24029,700 DIRECTV 2,938,355 3,441,94638,300 Fidelity National Information Service, Inc. 2,877,720 2,956,1994,700 Google Inc. Class A 2,833,816 3,170,080
62,000 Microsoft Corporation 3,397,306 3,418,76264,000 Pfizer Inc. 2,341,679 2,678,956
For equities, all common shares unless otherwise noted.The accompanying notes are an integral part of the financial statements.
227
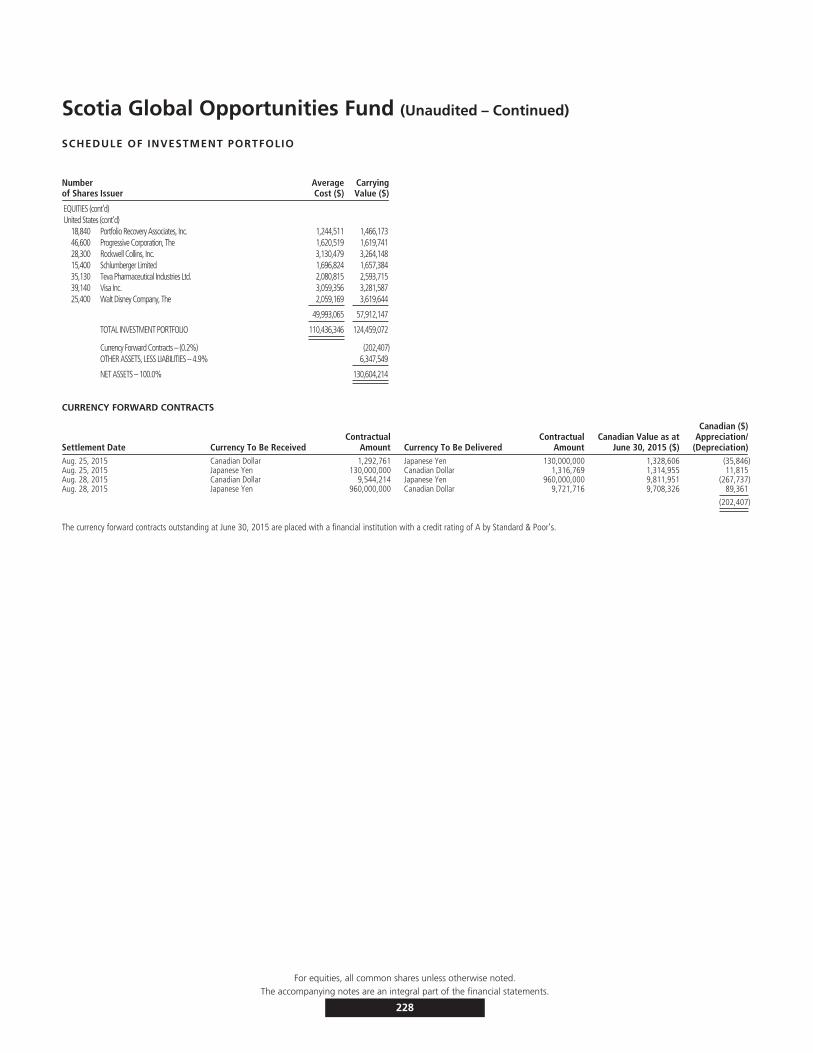
Scotia Global Opportunities Fund (Unaudited – Continued)
SCHEDULE OF INVESTMENT PORTFOLIO
Numberof Shares Issuer
AverageCost ($)
CarryingValue ($)
EQUITIES (cont’d)United States (cont’d)
18,840 Portfolio Recovery Associates, Inc. 1,244,511 1,466,17346,600 Progressive Corporation, The 1,620,519 1,619,74128,300 Rockwell Collins, Inc. 3,130,479 3,264,14815,400 Schlumberger Limited 1,696,824 1,657,38435,130 Teva Pharmaceutical Industries Ltd. 2,080,815 2,593,71539,140 Visa Inc. 3,059,356 3,281,58725,400 Walt Disney Company, The 2,059,169 3,619,644
49,993,065 57,912,147
TOTAL INVESTMENT PORTFOLIO 110,436,346 124,459,072
Currency Forward Contracts – (0.2%) (202,407)OTHER ASSETS, LESS LIABILITIES – 4.9% 6,347,549
NET ASSETS – 100.0% 130,604,214
CURRENCY FORWARD CONTRACTS
Settlement Date Currency To Be ReceivedContractual
Amount Currency To Be DeliveredContractual
AmountCanadian Value as at
June 30, 2015 ($)
Canadian ($)Appreciation/
(Depreciation)Aug. 25, 2015 Canadian Dollar 1,292,761 Japanese Yen 130,000,000 1,328,606 (35,846)Aug. 25, 2015 Japanese Yen 130,000,000 Canadian Dollar 1,316,769 1,314,955 11,815Aug. 28, 2015 Canadian Dollar 9,544,214 Japanese Yen 960,000,000 9,811,951 (267,737)Aug. 28, 2015 Japanese Yen 960,000,000 Canadian Dollar 9,721,716 9,708,326 89,361
(202,407)
The currency forward contracts outstanding at June 30, 2015 are placed with a financial institution with a credit rating of A by Standard & Poor’s.
For equities, all common shares unless otherwise noted.The accompanying notes are an integral part of the financial statements.
228

Scotia Global Opportunities Fund (Unaudited)
FUND SPECIFIC NOTESFor the periods indicated in Note 1.
1. The Fund (note 1)
The Fund’s investment objective is to achieve long-termcapital growth. It invests primarily in a more concentratedportfolio of equity securities of companies located aroundthe world.
2. Risks associated with financial instruments (note 4)
i) Interest rate risk
The majority of the Fund’s financial assets and liabilitieswere non-interest bearing as at June 30, 2015 andDecember 31, 2014. Accordingly, the Fund is not directlysubject to significant risk due to fluctuations in theprevailing levels of market interest rates.
ii) Currency risk
The tables below indicate the currencies to which the Fundhad significant exposure, net of the impact of currencyforward contracts and currency spot contracts, if any,based on the monetary and non-monetary assets andliabilities of the Fund. The tables also illustrate thepotential impact on the Fund if the functional currency ofthe Fund had strengthened or weakened by 10% in relationto each of the other currencies, with all other variables heldconstant.
June 30, 2015
Currency
Net currencyexposure
($)
Percentage ofnet assets
(%)
Impact onthe Fund
($)
Percentage ofnet assets
(%)
Brazilian Real 1,602,969 1.2 160,297 0.1British Pound 3,510,916 2.7 351,092 0.3European Euro 12,656,466 9.7 1,265,647 1.0Hong Kong Dollar 8,884,692 6.8 888,469 0.7Israel Shekel 1,838,721 1.4 183,872 0.1Japanese Yen 11,449,964 8.8 1,144,996 0.9Norwegian Krone 6,938,173 5.3 693,817 0.5Singapore Dollar 3,804,104 2.9 380,410 0.3South African Rand 1,921,884 1.5 192,188 0.1South Korean Won 2,968,328 2.3 296,833 0.2Swiss Franc 10,555,600 8.1 1,055,560 0.8US Dollar 60,919,179 46.6 6,091,918 4.7
127,050,996 97.3 12,705,099 9.7
December 31, 2014
Currency
Net currencyexposure
($)
Percentage ofnet assets
(%)
Impact onthe Fund
($)
Percentage ofnet assets
(%)
US Dollar 64,150,166 55.6 6,415,017 5.6Swiss Franc 11,234,023 9.7 1,123,402 1.0Japanese Yen 10,624,619 9.2 1,062,462 0.9Hong Kong Dollar 8,606,245 7.5 860,625 0.7Israel Shekel 3,590,118 3.1 359,012 0.3British Pound 3,032,936 2.6 303,294 0.3South Korean Won 2,943,978 2.6 294,398 0.3Swedish Krona 2,453,404 2.1 245,340 0.2Norwegian Krone 2,311,464 2.0 231,146 0.2European Euro 2,225,004 1.9 222,500 0.2South African Rand 1,830,154 1.6 183,015 0.2
113,002,111 97.9 11,300,211 9.9
iii) Price risk
Price risk is the risk that the carrying value of financialinstruments will fluctuate as a result of changes in marketprices (other than those arising from interest rate risk orcurrency risk) caused by factors specific to a security, itsissuer or all factors affecting a market or a market segment.Exposure to price risk is mainly in equities, derivatives andcommodities, if applicable. As at June 30, 2015,approximately 95.3% (December 31, 2014 – 96.4%) of theFund’s net assets were exposed to price risk. If prices ofthese investments had decreased or increased by 10%, withall other variables held constant, net assets of the Fundwould have decreased or increased, respectively, byapproximately $12,445,907 (December 31, 2014 –$11,118,202). In practice, actual results may differ from thissensitivity analysis and the difference could be material.
iv) Credit risk
The Fund had no significant exposure to bonds anddebentures, preferred shares or derivatives as at June 30,2015 or December 31, 2014. In addition, all investmenttransactions are executed by brokers with an approvedcredit rating. As such the risk of default on transactionswith counterparties and brokers related to purchase andsale of securities is considered minimal. In instances wherethe credit rating were to fall below the approved rating, theManager would take appropriate action.
v) Liquidity risk
The table below summarizes the Fund’s financial liabilitiesbased on the remaining period to the contractual maturitydate.
June 30, 2015 December 31, 2014
On demand($)
Less than3 months
($)On demand
($)
Less than3 months
($)
Current liabilities – 35,830 – 12,059Liability for written options – – – –Unrealized loss on derivatives – 303,583 – –Redeemable units 130,604,214 – 115,321,869 –
130,604,214 339,413 115,321,869 12,059
Redeemable units are redeemable on demand at theholder’s option. However, the Manager does not expect thatthe contractual maturity disclosed in the table above will berepresentative of the actual cash outflows, as holders ofthese instruments typically retain them for a longer term.
The accompanying notes are an integral part of the financial statements.
229
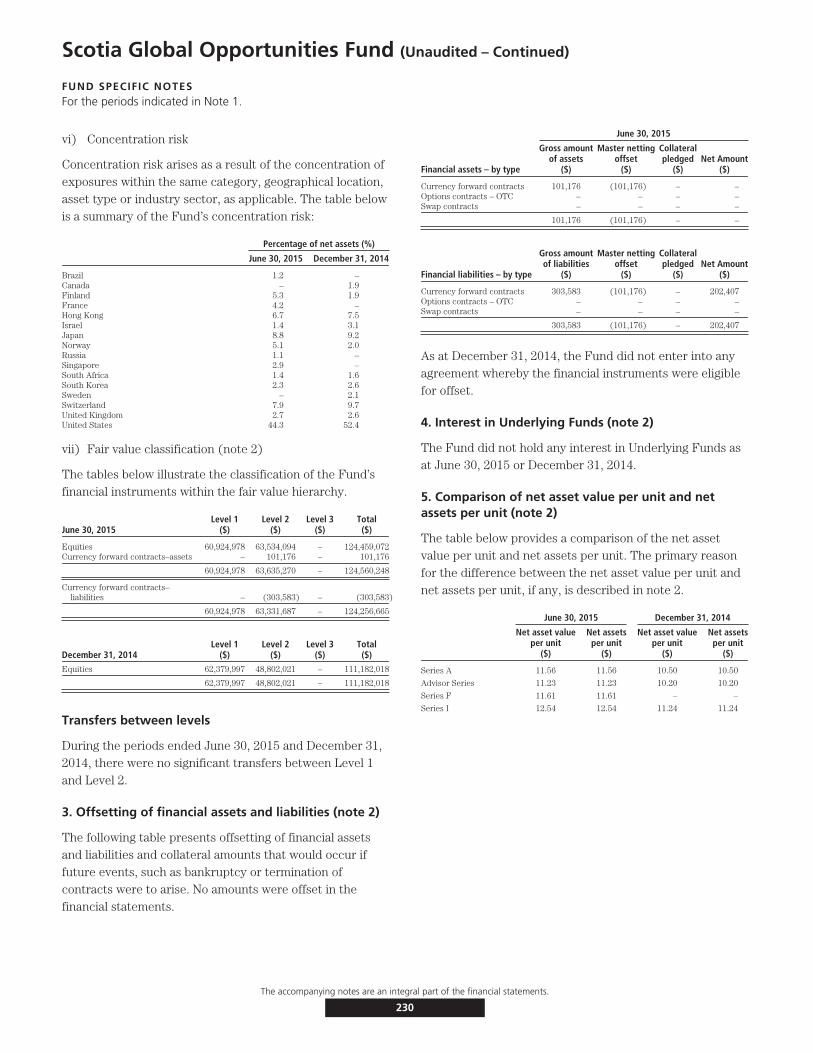
Scotia Global Opportunities Fund (Unaudited – Continued)
FUND SPECIFIC NOTESFor the periods indicated in Note 1.
vi) Concentration risk
Concentration risk arises as a result of the concentration ofexposures within the same category, geographical location,asset type or industry sector, as applicable. The table belowis a summary of the Fund’s concentration risk:
Percentage of net assets (%)
June 30, 2015 December 31, 2014
Brazil 1.2 –Canada – 1.9Finland 5.3 1.9France 4.2 –Hong Kong 6.7 7.5Israel 1.4 3.1Japan 8.8 9.2Norway 5.1 2.0Russia 1.1 –Singapore 2.9 –South Africa 1.4 1.6South Korea 2.3 2.6Sweden – 2.1Switzerland 7.9 9.7United Kingdom 2.7 2.6United States 44.3 52.4
vii) Fair value classification (note 2)
The tables below illustrate the classification of the Fund’sfinancial instruments within the fair value hierarchy.
June 30, 2015Level 1
($)Level 2
($)Level 3
($)Total($)
Equities 60,924,978 63,534,094 – 124,459,072Currency forward contracts–assets – 101,176 – 101,176
60,924,978 63,635,270 – 124,560,248
Currency forward contracts–liabilities – (303,583) – (303,583)
60,924,978 63,331,687 – 124,256,665
December 31, 2014Level 1
($)Level 2
($)Level 3
($)Total($)
Equities 62,379,997 48,802,021 – 111,182,018
62,379,997 48,802,021 – 111,182,018
Transfers between levels
During the periods ended June 30, 2015 and December 31,2014, there were no significant transfers between Level 1and Level 2.
3. Offsetting of financial assets and liabilities (note 2)
The following table presents offsetting of financial assetsand liabilities and collateral amounts that would occur iffuture events, such as bankruptcy or termination ofcontracts were to arise. No amounts were offset in thefinancial statements.
June 30, 2015
Financial assets – by type
Gross amountof assets
($)
Master nettingoffset
($)
Collateralpledged
($)Net Amount
($)
Currency forward contracts 101,176 (101,176) – –Options contracts – OTC – – – –Swap contracts – – – –
101,176 (101,176) – –
Financial liabilities – by type
Gross amountof liabilities
($)
Master nettingoffset
($)
Collateralpledged
($)Net Amount
($)
Currency forward contracts 303,583 (101,176) – 202,407Options contracts – OTC – – – –Swap contracts – – – –
303,583 (101,176) – 202,407
As at December 31, 2014, the Fund did not enter into anyagreement whereby the financial instruments were eligiblefor offset.
4. Interest in Underlying Funds (note 2)
The Fund did not hold any interest in Underlying Funds asat June 30, 2015 or December 31, 2014.
5. Comparison of net asset value per unit and netassets per unit (note 2)
The table below provides a comparison of the net assetvalue per unit and net assets per unit. The primary reasonfor the difference between the net asset value per unit andnet assets per unit, if any, is described in note 2.
June 30, 2015 December 31, 2014
Net asset valueper unit
($)
Net assetsper unit
($)
Net asset valueper unit
($)
Net assetsper unit
($)
Series A 11.56 11.56 10.50 10.50
Advisor Series 11.23 11.23 10.20 10.20
Series F 11.61 11.61 – –
Series I 12.54 12.54 11.24 11.24
The accompanying notes are an integral part of the financial statements.
230
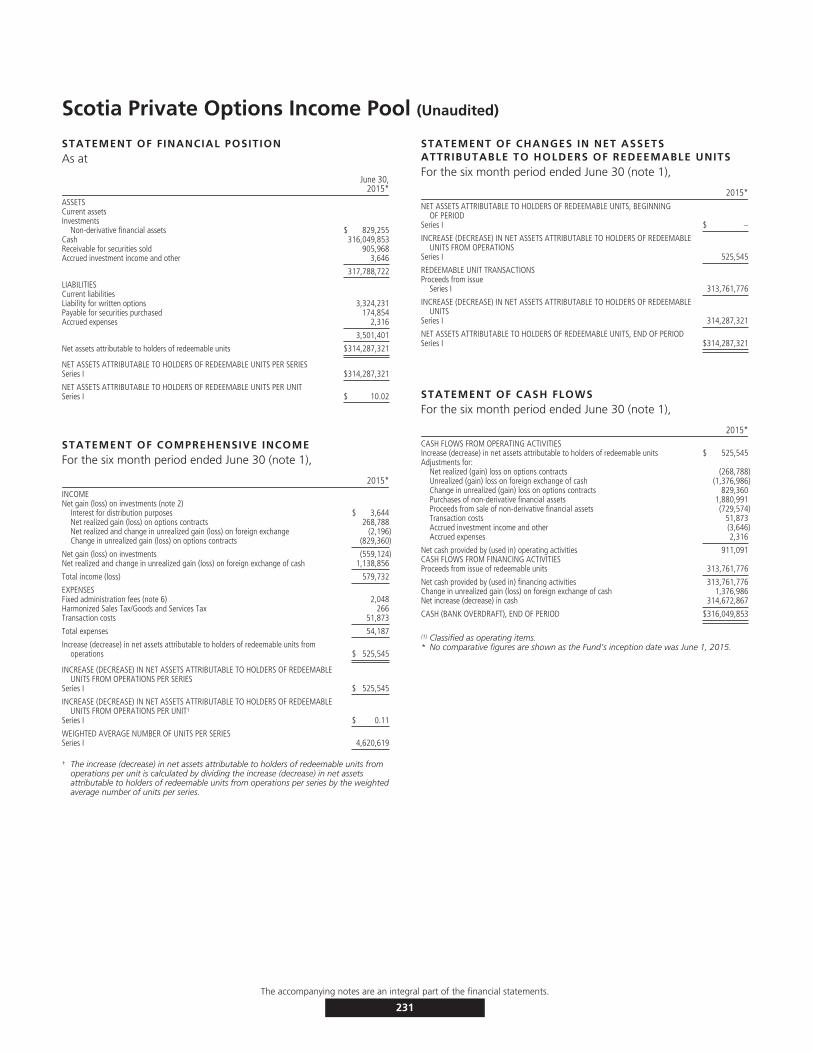
Scotia Private Options Income Pool (Unaudited)
STATEMENT OF FINANCIAL POSITIONAs at
June 30,2015*
ASSETSCurrent assetsInvestments
Non-derivative financial assets $ 829,255Cash 316,049,853Receivable for securities sold 905,968Accrued investment income and other 3,646
317,788,722
LIABILITIESCurrent liabilitiesLiability for written options 3,324,231Payable for securities purchased 174,854Accrued expenses 2,316
3,501,401
Net assets attributable to holders of redeemable units $314,287,321
NET ASSETS ATTRIBUTABLE TO HOLDERS OF REDEEMABLE UNITS PER SERIESSeries I $314,287,321
NET ASSETS ATTRIBUTABLE TO HOLDERS OF REDEEMABLE UNITS PER UNITSeries I $ 10.02
STATEMENT OF COMPREHENSIVE INCOMEFor the six month period ended June 30 (note 1),
2015*INCOMENet gain (loss) on investments (note 2)
Interest for distribution purposes $ 3,644Net realized gain (loss) on options contracts 268,788Net realized and change in unrealized gain (loss) on foreign exchange (2,196)Change in unrealized gain (loss) on options contracts (829,360)
Net gain (loss) on investments (559,124)Net realized and change in unrealized gain (loss) on foreign exchange of cash 1,138,856
Total income (loss) 579,732
EXPENSESFixed administration fees (note 6) 2,048Harmonized Sales Tax/Goods and Services Tax 266Transaction costs 51,873
Total expenses 54,187
Increase (decrease) in net assets attributable to holders of redeemable units fromoperations $ 525,545
INCREASE (DECREASE) IN NET ASSETS ATTRIBUTABLE TO HOLDERS OF REDEEMABLEUNITS FROM OPERATIONS PER SERIES
Series I $ 525,545
INCREASE (DECREASE) IN NET ASSETS ATTRIBUTABLE TO HOLDERS OF REDEEMABLEUNITS FROM OPERATIONS PER UNIT†
Series I $ 0.11
WEIGHTED AVERAGE NUMBER OF UNITS PER SERIESSeries I 4,620,619
† The increase (decrease) in net assets attributable to holders of redeemable units fromoperations per unit is calculated by dividing the increase (decrease) in net assetsattributable to holders of redeemable units from operations per series by the weightedaverage number of units per series.
STATEMENT OF CHANGES IN NET ASSETSATTRIBUTABLE TO HOLDERS OF REDEEMABLE UNITSFor the six month period ended June 30 (note 1),
2015*NET ASSETS ATTRIBUTABLE TO HOLDERS OF REDEEMABLE UNITS, BEGINNING
OF PERIODSeries I $ –
INCREASE (DECREASE) IN NET ASSETS ATTRIBUTABLE TO HOLDERS OF REDEEMABLEUNITS FROM OPERATIONS
Series I 525,545
REDEEMABLE UNIT TRANSACTIONSProceeds from issue
Series I 313,761,776
INCREASE (DECREASE) IN NET ASSETS ATTRIBUTABLE TO HOLDERS OF REDEEMABLEUNITS
Series I 314,287,321
NET ASSETS ATTRIBUTABLE TO HOLDERS OF REDEEMABLE UNITS, END OF PERIODSeries I $314,287,321
STATEMENT OF CASH FLOWSFor the six month period ended June 30 (note 1),
2015*CASH FLOWS FROM OPERATING ACTIVITIESIncrease (decrease) in net assets attributable to holders of redeemable units $ 525,545Adjustments for:
Net realized (gain) loss on options contracts (268,788)Unrealized (gain) loss on foreign exchange of cash (1,376,986)Change in unrealized (gain) loss on options contracts 829,360Purchases of non-derivative financial assets 1,880,991Proceeds from sale of non-derivative financial assets (729,574)Transaction costs 51,873Accrued investment income and other (3,646)Accrued expenses 2,316
Net cash provided by (used in) operating activities 911,091CASH FLOWS FROM FINANCING ACTIVITIESProceeds from issue of redeemable units 313,761,776
Net cash provided by (used in) financing activities 313,761,776Change in unrealized gain (loss) on foreign exchange of cash 1,376,986Net increase (decrease) in cash 314,672,867
CASH (BANK OVERDRAFT), END OF PERIOD $316,049,853
(1) Classified as operating items.* No comparative figures are shown as the Fund’s inception date was June 1, 2015.
The accompanying notes are an integral part of the financial statements.
231
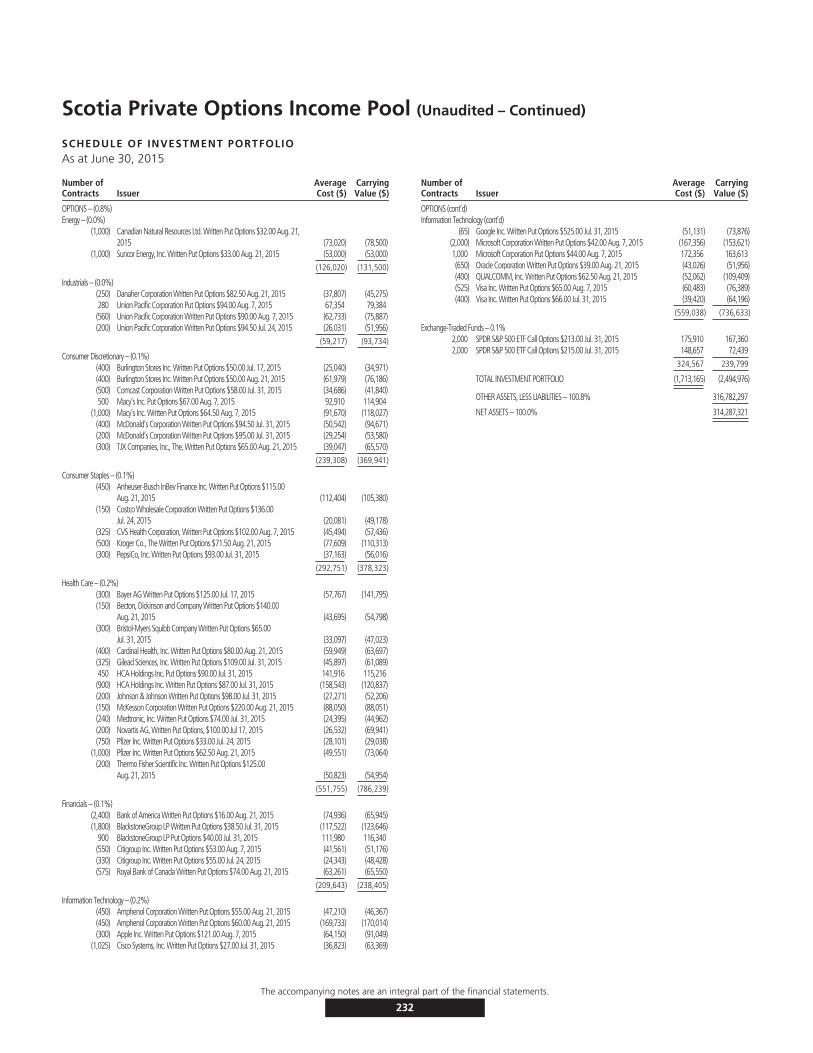
Scotia Private Options Income Pool (Unaudited – Continued)
SCHEDULE OF INVESTMENT PORTFOLIOAs at June 30, 2015
Number ofContracts Issuer
AverageCost ($)
CarryingValue ($)
OPTIONS – (0.8%)Energy – (0.0%)
(1,000) Canadian Natural Resources Ltd. Written Put Options $32.00 Aug. 21,2015 (73,020) (78,500)
(1,000) Suncor Energy, Inc. Written Put Options $33.00 Aug. 21, 2015 (53,000) (53,000)(126,020) (131,500)
Industrials – (0.0%)(250) Danaher Corporation Written Put Options $82.50 Aug. 21, 2015 (37,807) (45,275)280 Union Pacific Corporation Put Options $94.00 Aug. 7, 2015 67,354 79,384(560) Union Pacific Corporation Written Put Options $90.00 Aug. 7, 2015 (62,733) (75,887)(200) Union Pacific Corporation Written Put Options $94.50 Jul. 24, 2015 (26,031) (51,956)
(59,217) (93,734)
Consumer Discretionary – (0.1%)(400) Burlington Stores Inc. Written Put Options $50.00 Jul. 17, 2015 (25,040) (34,971)(400) Burlington Stores Inc. Written Put Options $50.00 Aug. 21, 2015 (61,979) (76,186)(500) Comcast Corporation Written Put Options $58.00 Jul. 31, 2015 (34,686) (41,840)500 Macy’s Inc. Put Options $67.00 Aug. 7, 2015 92,910 114,904
(1,000) Macy’s Inc. Written Put Options $64.50 Aug. 7, 2015 (91,670) (118,027)(400) McDonald’s Corporation Written Put Options $94.50 Jul. 31, 2015 (50,542) (94,671)(200) McDonald’s Corporation Written Put Options $95.00 Jul. 31, 2015 (29,254) (53,580)(300) TJX Companies, Inc., The, Written Put Options $65.00 Aug. 21, 2015 (39,047) (65,570)
(239,308) (369,941)
Consumer Staples – (0.1%)(450) Anheuser-Busch InBev Finance Inc. Written Put Options $115.00
Aug. 21, 2015 (112,404) (105,380)(150) Costco Wholesale Corporation Written Put Options $136.00
Jul. 24, 2015 (20,081) (49,178)(325) CVS Health Corporation, Written Put Options $102.00 Aug. 7, 2015 (45,494) (57,436)(500) Kroger Co., The Written Put Options $71.50 Aug. 21, 2015 (77,609) (110,313)(300) PepsiCo, Inc. Written Put Options $93.00 Jul. 31, 2015 (37,163) (56,016)
(292,751) (378,323)
Health Care – (0.2%)(300) Bayer AG Written Put Options $125.00 Jul. 17, 2015 (57,767) (141,795)(150) Becton, Dickinson and Company Written Put Options $140.00
Aug. 21, 2015 (43,695) (54,798)(300) Bristol-Myers Squibb Company Written Put Options $65.00
Jul. 31, 2015 (33,097) (47,023)(400) Cardinal Health, Inc. Written Put Options $80.00 Aug. 21, 2015 (59,949) (63,697)(325) Gilead Sciences, Inc. Written Put Options $109.00 Jul. 31, 2015 (45,897) (61,089)450 HCA Holdings Inc. Put Options $90.00 Jul. 31, 2015 141,916 115,216(900) HCA Holdings Inc. Written Put Options $87.00 Jul. 31, 2015 (158,543) (120,837)(200) Johnson & Johnson Written Put Options $98.00 Jul. 31, 2015 (27,271) (52,206)(150) McKesson Corporation Written Put Options $220.00 Aug. 21, 2015 (88,050) (88,051)(240) Medtronic, Inc. Written Put Options $74.00 Jul. 31, 2015 (24,395) (44,962)(200) Novartis AG, Written Put Options, $100.00 Jul 17, 2015 (26,532) (69,941)(750) Pfizer Inc. Written Put Options $33.00 Jul. 24, 2015 (28,101) (29,038)
(1,000) Pfizer Inc. Written Put Options $62.50 Aug. 21, 2015 (49,551) (73,064)(200) Thermo Fisher Scientific Inc. Written Put Options $125.00
Aug. 21, 2015 (50,823) (54,954)(551,755) (786,239)
Financials – (0.1%)(2,400) Bank of America Written Put Options $16.00 Aug. 21, 2015 (74,936) (65,945)(1,800) BlackstoneGroup LP Written Put Options $38.50 Jul. 31, 2015 (117,522) (123,646)
900 BlackstoneGroup LP Put Options $40.00 Jul. 31, 2015 111,980 116,340(550) Citigroup Inc. Written Put Options $53.00 Aug. 7, 2015 (41,561) (51,176)(330) Citigroup Inc. Written Put Options $55.00 Jul. 24, 2015 (24,343) (48,428)(575) Royal Bank of Canada Written Put Options $74.00 Aug. 21, 2015 (63,261) (65,550)
(209,643) (238,405)
Information Technology – (0.2%)(450) Amphenol Corporation Written Put Options $55.00 Aug. 21, 2015 (47,210) (46,367)(450) Amphenol Corporation Written Put Options $60.00 Aug. 21, 2015 (169,733) (170,014)(300) Apple Inc. Written Put Options $121.00 Aug. 7, 2015 (64,150) (91,049)
(1,025) Cisco Systems, Inc. Written Put Options $27.00 Jul. 31, 2015 (36,823) (63,369)
Number ofContracts Issuer
AverageCost ($)
CarryingValue ($)
OPTIONS (cont’d)Information Technology (cont’d)
(65) Google Inc. Written Put Options $525.00 Jul. 31, 2015 (51,131) (73,876)(2,000) Microsoft Corporation Written Put Options $42.00 Aug. 7, 2015 (167,356) (153,621)1,000 Microsoft Corporation Put Options $44.00 Aug. 7, 2015 172,356 163,613(650) Oracle Corporation Written Put Options $39.00 Aug. 21, 2015 (43,026) (51,956)(400) QUALCOMM, Inc. Written Put Options $62.50 Aug. 21, 2015 (52,062) (109,409)(525) Visa Inc. Written Put Options $65.00 Aug. 7, 2015 (60,483) (76,389)(400) Visa Inc. Written Put Options $66.00 Jul. 31, 2015 (39,420) (64,196)
(559,038) (736,633)
Exchange-Traded Funds – 0.1%2,000 SPDR S&P 500 ETF Call Options $213.00 Jul. 31, 2015 175,910 167,3602,000 SPDR S&P 500 ETF Call Options $215.00 Jul. 31, 2015 148,657 72,439
324,567 239,799
TOTAL INVESTMENT PORTFOLIO (1,713,165) (2,494,976)
OTHER ASSETS, LESS LIABILITIES – 100.8% 316,782,297
NET ASSETS – 100.0% 314,287,321
The accompanying notes are an integral part of the financial statements.
232

Scotia Private Options Income Pool (Unaudited)
FUND SPECIFIC NOTESFor the periods indicated in Note 1.
1. The Fund (note 1)
The Fund’s investment objective is to seek high income andlong-term capital appreciation primarily by writing putoptions on equity securities to collect premiums, investingdirectly in equity securities and/or writing call options onthese securities.
2. Risks associated with financial instruments (note 4)
i) Interest rate risk
The majority of the Fund’s financial assets and liabilitieswere non-interest bearing as at June 30, 2015. Accordingly,the Fund is not directly subject to significant risk due tofluctuations in the prevailing levels of market interest rates.
ii) Currency risk
The table below indicates the currencies to which the Fundhad significant exposure, net of the impact of currencyforward contracts and currency spot contracts, if any,based on the monetary and non-monetary assets andliabilities of the Fund. The table also illustrates thepotential impact on the Fund if the functional currency ofthe Fund had strengthened or weakened by 10% in relationto each of the other currencies, with all other variables heldconstant.
June 30, 2015
Currency
Net currencyexposure
($)
Percentage ofnet assets
(%)
Impact on theFund($)
Percentage ofnet assets
(%)
European Euro (84,451) 0.0 (8,445) 0.0US Dollar 98,803,130 31.4 9,880,313 3.1
98,718,679 31.4 9,871,868 3.1
iii) Price risk
Price risk is the risk that the carrying value of financialinstruments will fluctuate as a result of changes in marketprices (other than those arising from interest rate risk orcurrency risk) caused by factors specific to a security, itsissuer or all factors affecting a market or a market segment.Exposure to price risk is mainly in equities, derivatives andcommodities, if applicable. As at June 30, 2015,approximately (0.8)% of the Fund’s net assets wereexposed to price risk. If prices of these investments haddecreased or increased by 10%, with all other variables heldconstant, net assets of the Fund would have decreased orincreased, respectively, by approximately $(249,498). Inpractice, actual results may differ from this sensitivityanalysis and the difference could be material.
iv) Credit risk
The Fund had no significant exposure to bonds anddebentures, preferred shares or derivatives as at June 30,2015. In addition, all investment transactions are executedby brokers with an approved credit rating. As such the riskof default on transactions with counterparties and brokersrelated to purchase and sale of securities is consideredminimal. In instances where the credit rating were to fallbelow the approved rating, the Manager would takeappropriate action.
v) Liquidity risk
The table below summarizes the Fund’s financial liabilitiesbased on the remaining period to the contractual maturitydate.
June 30, 2015
On demand($)
Less than3 months
($)
Current liabilities – 177,170Liability for written options – 3,324,231Unrealized loss on derivatives – –Redeemable units 314,287,321 –
314,287,321 3,501,401
Redeemable units are redeemable on demand at theholder’s option. However, the Manager does not expect thatthe contractual maturity disclosed in the table above will berepresentative of the actual cash outflows, as holders ofthese instruments typically retain them for a longer term.
vi) Concentration risk
Concentration risk arises as a result of the concentration ofexposures within the same category, geographical location,asset type or industry sector, as applicable. The table belowis a summary of the Fund’s concentration risk:
Percentage of net assets (%)
June 30, 2015
Energy (0.0)Industrials (0.0)Consumer Discretionary (0.1)Consumer Staples (0.1)Financials (0.1)Health Care (0.2)Index Based ETFs 0.1Information Technology (0.2)
The accompanying notes are an integral part of the financial statements.
233

Scotia Private Options Income Pool (Unaudited – Continued)
FUND SPECIFIC NOTESFor the periods indicated in Note 1.
vii) Fair value classification (note 2)
The table below illustrates the classification of the Fund’sfinancial instruments within the fair value hierarchy.
June 30, 2015Level 1
($)Level 2
($)Level 3
($)Total($)
Warrants, rights and options 589,456 239,799 – 829,255
589,456 239,799 – 829,255
Liability for written options (3,324,231) – – (3,324,231)
(2,734,775) 239,799 – (2,494,976)
Transfers between levels
During the period ended June 30, 2015, there were nosignificant transfers between Level 1 and Level 2.
3. Offsetting of financial assets and liabilities (note 2)
The following table presents offsetting of financial assetsand liabilities and collateral amounts that would occur iffuture events, such as bankruptcy or termination ofcontracts were to arise. No amounts were offset in thefinancial statements.
June 30, 2015
Financial assets – by type
Gross amountof assets
($)
Master nettingoffset
($)
Collateralpledged
($)Net amount
($)
Currency forward contracts – – – –Options contracts - OTC – – – –Swap contracts – – – –
– – – –
June 30, 2015
Financial liabilities – by type
Gross amountof liabilities
($)
Master nettingoffset
($)
Collateralpledged
($)Net amount
($)
Currency forward contracts – – – –Options contracts - OTC 326,694 – – 326,694Swap contracts – – – –
326,694 – – 326,694
4. Interest in Underlying Funds (note 2)
The Fund did not hold any interest in Underlying Funds asat June 30, 2015.
5. Comparison of net asset value per unit and netassets per unit (note 2)
The table below provides a comparison of the net assetvalue per unit and net assets per unit. The primary reasonfor the difference between the net asset value per unit andnet assets per unit, if any, is described in note 2.
June 30, 2015
Net asset valueper unit
($)
Net assetsper unit
($)
Series I 10.02 10.02
The accompanying notes are an integral part of the financial statements.
234

Scotia Canadian Bond Index Fund (Unaudited)
STATEMENTS OF FINANCIAL POSITIONAs at
June 30,2015
December 31,2014
ASSETSCurrent assetsInvestments
Non-derivative financial assets $324,058,313 $336,287,297Cash 449,296 20,738Receivable for securities sold 492,513 210,966Subscriptions receivable 98,595 382,385Accrued investment income and other 1,801,114 1,939,016
326,899,831 338,840,402
LIABILITIESCurrent liabilitiesManagement fee payable 224,162 –Payable for securities purchased 130,093 125,885Redemptions payable 381,544 216,842Accrued expenses 19,269 –Distributions payable 33,768 54
788,836 342,781
Net assets attributable to holders of redeemable units $326,110,995 $338,497,621
NET ASSETS ATTRIBUTABLE TO HOLDERS OF REDEEMABLE UNITSPER SERIES
Series A $326,091,992 $338,493,175Series D $ 16,444 $ –Series F $ 2,559 $ 4,446
NET ASSETS ATTRIBUTABLE TO HOLDERS OF REDEEMABLE UNITSPER UNIT
Series A $ 11.74 $ 11.67Series D $ 9.72 $ –Series F $ 11.78 $ 11.72
STATEMENTS OF COMPREHENSIVE INCOMEFor the six month periods ended June 30,
2015 2014INCOMENet gain (loss) on investments (note 2)
Interest for distribution purposes $ 5,619,801 $ 6,956,878Net realized gain (loss) on non-derivative financial assets 1,371,199 224,833Change in unrealized gain (loss) on non-derivative financial assets 1,097,826 11,594,849
Net gain (loss) on investments 8,088,826 18,776,560Securities lending 25,118 32,865Other income 5,120 4,224
Total income (loss) 8,119,064 18,813,649
EXPENSESManagement fees (note 5) 1,177,344 1,330,875Fixed administration fees (note 6) 100,918 –Independent Review Committee fees 251 569Interest expense and bank overdraft charges 6 24Foreign withholding taxes/tax reclaims 125 –Audit fees – 4,134Custodian fees – 6,843Filing fees – 11,064Legal fees – 1,200Unitholder administration costs – 100,240Unitholder reporting costs – 15,323Harmonized Sales Tax/Goods and Services Tax 149,968 169,807
Total expenses 1,428,612 1,640,079Expenses absorbed by the Manager – (1,495)
Net expenses 1,428,612 1,638,584
Increase (decrease) in net assets attributable to holders of redeemableunits from operations $ 6,690,452 $17,175,065
INCREASE (DECREASE) IN NET ASSETS ATTRIBUTABLE TO HOLDERS OFREDEEMABLE UNITS FROM OPERATIONS PER SERIES
Series A $ 6,690,262 $17,174,134Series D $ 102 $ –Series F $ 88 $ 931
INCREASE (DECREASE) IN NET ASSETS ATTRIBUTABLE TO HOLDERS OFREDEEMABLE UNITS FROM OPERATIONS PER UNIT†
Series A $ 0.23 $ 0.51Series D $ 0.13 $ –Series F $ 0.24 $ 0.82
WEIGHTED AVERAGE NUMBER OF UNITS PER SERIESSeries A 28,492,293 33,775,086Series D 783 –Series F 368 1,136
† The increase (decrease) in net assets attributable to holders of redeemable units fromoperations per unit is calculated by dividing the increase (decrease) in net assetsattributable to holders of redeemable units from operations per series by the weightedaverage number of units per series.
The accompanying notes are an integral part of the financial statements.
235

Scotia Canadian Bond Index Fund (Unaudited – Continued)
STATEMENTS OF CHANGES IN NET ASSETSATTRIBUTABLE TO HOLDERS OF REDEEMABLE UNITSFor the six month periods ended June 30,
2015 2014NET ASSETS ATTRIBUTABLE TO HOLDERS OF REDEEMABLE UNITS,
BEGINNING OF PERIODSeries A $338,493,175 $424,866,929Series F 4,446 28,993
338,497,621 424,895,922
INCREASE (DECREASE) IN NET ASSETS ATTRIBUTABLE TO HOLDERSOF REDEEMABLE UNITS FROM OPERATIONS
Series A 6,690,262 17,174,134Series D 102 –Series F 88 931
6,690,452 17,175,065
DISTRIBUTIONS TO HOLDERS OF REDEEMABLE UNITSFrom net investment income
Series A (4,613,208) (5,888,642)Series D (73) –Series F (68) (244)
(4,613,349) (5,888,886)
REDEEMABLE UNIT TRANSACTIONSProceeds from issue
Series A 22,341,838 11,526,565Series D 16,342 –
Reinvested distributionsSeries A 4,465,024 5,717,276Series D 73 –Series F 68 244
Payments on redemptionSeries A (41,285,099) (99,480,731)Series F (1,975) (25,632)
(14,463,729) (82,262,278)
INCREASE (DECREASE) IN NET ASSETS ATTRIBUTABLE TO HOLDERSOF REDEEMABLE UNITS
Series A (12,401,183) (70,951,398)Series D 16,444 –Series F (1,887) (24,701)
(12,386,626) (70,976,099)
NET ASSETS ATTRIBUTABLE TO HOLDERS OF REDEEMABLE UNITS,END OF PERIOD
Series A 326,091,992 353,915,531Series D 16,444 –Series F 2,559 4,292
$326,110,995 $353,919,823
STATEMENTS OF CASH FLOWSFor the six month periods ended June 30,
2015 2014CASH FLOWS FROM OPERATING ACTIVITIESIncrease (decrease) in net assets attributable to holders of
redeemable units $ 6,690,452 $ 17,175,065Adjustments for:
Net realized (gain) loss on non-derivative financial assets (1,371,199) (224,833)Change in unrealized (gain) loss on non-derivative financial assets (1,097,826) (11,594,849)Purchases of non-derivative financial assets (55,440,377) (82,667,827)Proceeds from sale of non-derivative financial assets 69,861,047 165,303,008Accrued investment income and other 137,902 522,919Accrued expenses 243,431 261,666
Net cash provided by (used in) operating activities 19,023,430 88,775,149CASH FLOWS FROM FINANCING ACTIVITIESProceeds from issue of redeemable units 22,641,970 11,658,318Amounts paid on redemption of redeemable units (41,122,372) (99,436,070)Distributions to unitholders of redeemable units (114,470) (147,507)
Net cash provided by (used in) financing activities (18,594,872) (87,925,259)Net increase (decrease) in cash 428,558 849,890Cash (bank overdraft), beginning of period 20,738 24,795
CASH (BANK OVERDRAFT), END OF PERIOD $ 449,296 $ 874,685
Interest paid(1) 6 –Interest received(1) 5,757,702 7,479,797Dividends received, net of withholding taxes(1) (125) –
(1) Classified as operating items.
The accompanying notes are an integral part of the financial statements.
236

Scotia Canadian Bond Index Fund (Unaudited – Continued)
SCHEDULE OF INVESTMENT PORTFOLIOAs at June 30, 2015
FaceValue ($) Issuer
AverageCost ($)
CarryingValue ($)
BOND AND DEBENTURES INSTRUMENTS – 99.4%Federal Bonds – 33.8%
Business Development Bank of Canada87,000 4.75% due Jul. 26, 2021 105,024 103,34253,000 4.35% due Feb. 28, 2022 55,707 62,157
Canada Housing Trust No. 12,670,000 1.85% due Dec. 15, 2016 2,702,477 2,716,6352,595,000 2.05% due Jun. 15, 2017 2,615,365 2,664,3952,058,000 1.70% due Dec. 15, 2017 2,055,965 2,105,4651,222,000 1.75% due Jun. 15, 2018 1,221,462 1,254,3961,400,000 2.05% due Jun. 15, 2018 1,398,292 1,449,3382,497,000 2.35% due Dec. 15, 2018 2,509,275 2,615,9201,250,000 4.10% due Dec. 15, 2018 1,326,583 1,383,4961,638,000 1.95% due Jun. 15, 2019 1,636,559 1,695,1202,527,000 2.00% due Dec. 15, 2019 2,542,423 2,619,5041,112,000 3.75% due Mar. 15, 2020 1,104,921 1,240,8941,172,000 1.20% due Jun. 15, 2020 1,170,172 1,168,2971,168,000 1.45% due Jun. 15, 2020 1,167,381 1,178,2171,030,000 3.35% due Dec. 15, 2020 1,025,505 1,137,3871,610,000 3.80% due Jun. 15, 2021 1,722,419 1,823,5521,491,000 2.65% due Mar. 15, 2022 1,505,553 1,587,5701,522,000 2.40% due Dec. 15, 2022 1,504,741 1,588,822
870,000 2.35% due Sep. 15, 2023 866,137 898,426443,000 3.15% due Sep. 15, 2023 446,234 484,314
1,372,000 2.90% due Jun. 15, 2024 1,386,683 1,467,725805,000 2.55% due Mar. 15, 2025 824,841 834,260451,000 2.55% due Mar. 15, 2025 463,872 468,871
Canada Mortgage and Housing Corporation35,000 4.25% due Feb. 1, 2016 34,106 35,730
Canada Post Corporation125,000 4.08% due Jul. 16, 2025 132,500 146,605356,000 4.36% due Jul. 16, 2040 414,123 452,245
Export Development Canada50,000 4.30% due Jun. 1, 2016 49,842 51,641
Farm Credit Canada231,000 4.55% due Apr. 12, 2021 266,130 270,032
Farm Credit Corporation303,000 4.60% due Jun. 1, 2021 361,094 355,516
Government of Canada1,000,000 1.00% due Aug. 1, 2016 997,680 1,004,7914,544,000 2.75% due Sep. 1, 2016 4,769,569 4,659,9791,000,000 1.00% due Nov. 1, 2016 1,001,520 1,006,5651,300,000 1.50% due Feb. 1, 2017 1,319,549 1,320,873
59,000 1.50% due Mar. 1, 2017 59,474 60,019800,000 0.25% due May 1, 2017 793,668 796,772
6,926,000 4.00% due Jun. 1, 2017 7,752,617 7,392,893300,000 1.25% due Aug. 1, 2017 303,948 304,743
3,221,000 1.50% due Sep. 1, 2017 3,240,489 3,292,754325,000 1.25% due Feb. 1, 2018 330,584 331,411
2,221,000 1.25% due Mar. 1, 2018 2,240,688 2,267,7271,907,000 4.25% due Jun. 1, 2018 2,134,343 2,114,8561,713,000 1.25% due Sep. 1, 2018 1,680,878 1,754,7661,939,000 1.75% due Mar. 1, 2019 1,957,939 2,023,9903,421,000 3.75% due Jun. 1, 2019 3,880,623 3,833,6441,933,000 1.75% due Sep. 1, 2019 1,970,374 2,019,3682,107,000 1.50% due Mar. 1, 2020 2,161,566 2,172,9432,699,000 3.50% due Jun. 1, 2020 3,034,394 3,035,8881,275,000 0.75% due Sep. 1, 2020 1,258,141 1,261,904
1,000 10.50% due Mar. 15, 2021 1,680 1,5242,372,000 3.25% due Jun. 1, 2021 2,661,044 2,670,784
203,000 9.75% due Jun. 1, 2021 305,701 304,5662,234,000 2.75% due Jun. 1, 2022 2,361,073 2,450,583
111,000 9.25% due Jun. 1, 2022 185,696 169,7882,497,000 1.50% due Jun. 1, 2023 2,292,492 2,501,598
390,000 8.00% due Jun. 1, 2023 544,818 580,6122,294,000 2.50% due Jun. 1, 2024 2,429,222 2,464,919
FaceValue ($) Issuer
AverageCost ($)
CarryingValue ($)
BOND AND DEBENTURES INSTRUMENTS (cont’d)Federal Bonds (cont’d)
2,011,000 2.25% due Jun. 1, 2025 2,130,805 2,114,488577,000 9.00% due Jun. 1, 2025 842,705 963,738965,800 8.00% due Jun. 1, 2027 1,386,879 1,600,639
2,163,000 5.75% due Jun. 1, 2029 3,096,934 3,147,2992,372,000 5.75% due Jun. 1, 2033 3,437,614 3,629,9662,897,000 5.00% due Jun. 1, 2037 4,195,726 4,255,7702,920,000 4.00% due Jun. 1, 2041 3,557,115 3,870,6102,472,000 3.50% due Dec. 1, 2045 3,133,029 3,113,606
749,000 2.75% due Dec. 1, 2048 784,292 823,7921,045,000 2.75% due Dec. 1, 2064 1,055,641 1,188,636
107,905,896 110,368,676
Provincial Bonds – 30.6%Alberta Capital Finance Authority
51,000 4.35% due Jun. 15, 2016 50,648 52,75273,000 4.65% due Jun. 15, 2017 72,768 78,48515,000 4.45% due Dec. 15, 2025 14,953 17,724
Financement-Quebec633,000 3.50% due Dec. 1, 2016 668,226 657,785509,000 3.50% due Dec. 1, 2017 530,303 541,001374,000 2.40% due Dec. 1, 2018 371,725 390,912369,000 2.45% due Dec. 1, 2019 368,667 387,198455,000 5.25% due Jun. 1, 2034 474,201 586,094
Ontario School Boards Financing Corporation25,000 5.70% due Oct. 11, 2017 24,935 27,63023,592 5.90% due Oct. 11, 2027 23,466 28,65736,662 5.48% due Nov. 26, 2029 36,663 43,92414,984 4.79% due Aug. 8, 2030 14,984 16,55420,068 5.07% due Apr. 18, 2031 20,068 23,03831,548 5.38% due Jun. 25, 2032 31,548 37,411
OPB Finance Trust152,000 2.90% due May 24, 2023 151,895 157,642101,000 3.89% due Jul. 4, 2042 100,929 105,780
Province of Alberta164,000 1.85% due Sep. 1, 2016 163,780 166,207303,000 1.75% due Jun. 15, 2017 303,171 309,031399,000 1.70% due Dec. 15, 2017 396,567 407,609285,000 1.60% due Jun. 15, 2018 279,408 290,733128,000 2.00% due Jun. 1, 2019 127,945 132,354300,000 4.00% due Dec. 1, 2019 324,421 335,445218,000 1.25% due Jun. 1, 2020 216,599 216,735464,000 2.55% due Dec. 15, 2022 459,852 482,854195,000 3.40% due Dec. 1, 2023 194,358 213,359163,000 3.10% due Jun. 1, 2024 162,751 173,775226,000 2.35% due Jun. 1, 2025 228,950 224,953431,000 2.90% due Sep. 20, 2029 408,261 438,134308,000 3.50% due Jun. 1, 2031 309,300 332,324223,000 3.90% due Dec. 1, 2033 222,204 251,378150,000 4.50% due Dec. 1, 2040 148,673 185,697576,000 3.45% due Dec. 1, 2043 571,813 608,891
Province of British Columbia90,000 4.70% due Dec. 1, 2017 89,674 98,351
100,000 5.60% due Jun. 1, 2018 108,177 113,413430,000 4.65% due Dec. 18, 2018 448,949 483,079242,000 2.25% due Mar. 1, 2019 242,202 252,48730,000 5.30% due Jun. 17, 2019 30,065 34,842
377,000 4.10% due Dec. 18, 2019 386,784 423,942376,000 3.70% due Dec. 18, 2020 374,719 419,694100,000 9.95% due May 15, 2021 152,708 146,450185,000 4.80% due Jun. 15, 2021 207,134 218,050479,000 3.25% due Dec. 18, 2021 482,324 523,79168,000 9.50% due Jun. 9, 2022 107,740 101,319
360,000 2.70% due Dec. 18, 2022 360,537 378,760236,000 3.30% due Dec. 18, 2023 233,518 256,861
The accompanying notes are an integral part of the financial statements.
237
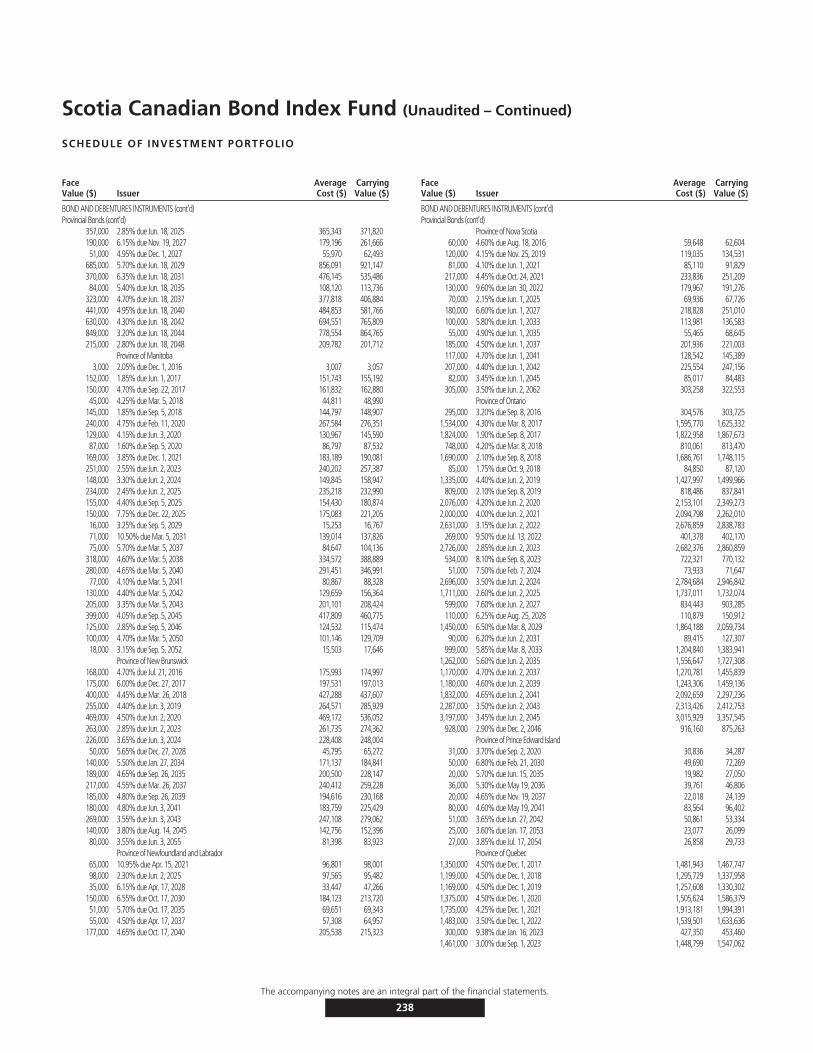
Scotia Canadian Bond Index Fund (Unaudited – Continued)
SCHEDULE OF INVESTMENT PORTFOLIO
FaceValue ($) Issuer
AverageCost ($)
CarryingValue ($)
BOND AND DEBENTURES INSTRUMENTS (cont’d)Provincial Bonds (cont’d)
357,000 2.85% due Jun. 18, 2025 365,343 371,820190,000 6.15% due Nov. 19, 2027 179,196 261,66651,000 4.95% due Dec. 1, 2027 55,970 62,493
685,000 5.70% due Jun. 18, 2029 856,091 921,147370,000 6.35% due Jun. 18, 2031 476,145 535,48684,000 5.40% due Jun. 18, 2035 108,120 113,736
323,000 4.70% due Jun. 18, 2037 377,818 406,884441,000 4.95% due Jun. 18, 2040 484,853 581,766630,000 4.30% due Jun. 18, 2042 694,551 765,809849,000 3.20% due Jun. 18, 2044 778,554 864,765215,000 2.80% due Jun. 18, 2048 209,782 201,712
Province of Manitoba3,000 2.05% due Dec. 1, 2016 3,007 3,057
152,000 1.85% due Jun. 1, 2017 151,743 155,192150,000 4.70% due Sep. 22, 2017 161,832 162,88045,000 4.25% due Mar. 5, 2018 44,811 48,990
145,000 1.85% due Sep. 5, 2018 144,797 148,907240,000 4.75% due Feb. 11, 2020 267,584 276,351129,000 4.15% due Jun. 3, 2020 130,967 145,59087,000 1.60% due Sep. 5, 2020 86,797 87,532
169,000 3.85% due Dec. 1, 2021 183,189 190,081251,000 2.55% due Jun. 2, 2023 240,202 257,387148,000 3.30% due Jun. 2, 2024 149,845 158,947234,000 2.45% due Jun. 2, 2025 235,218 232,990155,000 4.40% due Sep. 5, 2025 154,430 180,874150,000 7.75% due Dec. 22, 2025 175,083 221,20516,000 3.25% due Sep. 5, 2029 15,253 16,76771,000 10.50% due Mar. 5, 2031 139,014 137,82675,000 5.70% due Mar. 5, 2037 84,647 104,136
318,000 4.60% due Mar. 5, 2038 334,572 388,889280,000 4.65% due Mar. 5, 2040 291,451 346,99177,000 4.10% due Mar. 5, 2041 80,867 88,328
130,000 4.40% due Mar. 5, 2042 129,659 156,364205,000 3.35% due Mar. 5, 2043 201,101 208,424399,000 4.05% due Sep. 5, 2045 417,809 460,775125,000 2.85% due Sep. 5, 2046 124,532 115,474100,000 4.70% due Mar. 5, 2050 101,146 129,70918,000 3.15% due Sep. 5, 2052 15,503 17,646
Province of New Brunswick168,000 4.70% due Jul. 21, 2016 175,993 174,997175,000 6.00% due Dec. 27, 2017 197,531 197,013400,000 4.45% due Mar. 26, 2018 427,288 437,607255,000 4.40% due Jun. 3, 2019 264,571 285,929469,000 4.50% due Jun. 2, 2020 469,172 536,052263,000 2.85% due Jun. 2, 2023 261,735 274,362226,000 3.65% due Jun. 3, 2024 228,408 248,00450,000 5.65% due Dec. 27, 2028 45,795 65,272
140,000 5.50% due Jan. 27, 2034 171,137 184,841189,000 4.65% due Sep. 26, 2035 200,500 228,147217,000 4.55% due Mar. 26, 2037 240,412 259,228185,000 4.80% due Sep. 26, 2039 194,616 230,168180,000 4.80% due Jun. 3, 2041 183,759 225,429269,000 3.55% due Jun. 3, 2043 247,108 279,062140,000 3.80% due Aug. 14, 2045 142,756 152,39680,000 3.55% due Jun. 3, 2055 81,398 83,923
Province of Newfoundland and Labrador65,000 10.95% due Apr. 15, 2021 96,801 98,00198,000 2.30% due Jun. 2, 2025 97,565 95,48235,000 6.15% due Apr. 17, 2028 33,447 47,266
150,000 6.55% due Oct. 17, 2030 184,123 213,72051,000 5.70% due Oct. 17, 2035 69,651 69,34355,000 4.50% due Apr. 17, 2037 57,308 64,957
177,000 4.65% due Oct. 17, 2040 205,538 215,323
FaceValue ($) Issuer
AverageCost ($)
CarryingValue ($)
BOND AND DEBENTURES INSTRUMENTS (cont’d)Provincial Bonds (cont’d)
Province of Nova Scotia60,000 4.60% due Aug. 18, 2016 59,648 62,604
120,000 4.15% due Nov. 25, 2019 119,035 134,53181,000 4.10% due Jun. 1, 2021 85,110 91,829
217,000 4.45% due Oct. 24, 2021 233,836 251,209130,000 9.60% due Jan. 30, 2022 179,967 191,27670,000 2.15% due Jun. 1, 2025 69,936 67,726
180,000 6.60% due Jun. 1, 2027 218,828 251,010100,000 5.80% due Jun. 1, 2033 113,981 136,58355,000 4.90% due Jun. 1, 2035 55,465 68,645
185,000 4.50% due Jun. 1, 2037 201,936 221,003117,000 4.70% due Jun. 1, 2041 128,542 145,389207,000 4.40% due Jun. 1, 2042 225,554 247,15682,000 3.45% due Jun. 1, 2045 85,017 84,483
305,000 3.50% due Jun. 2, 2062 303,258 322,553Province of Ontario
295,000 3.20% due Sep. 8, 2016 304,576 303,7251,534,000 4.30% due Mar. 8, 2017 1,595,770 1,625,3321,824,000 1.90% due Sep. 8, 2017 1,822,958 1,867,673
748,000 4.20% due Mar. 8, 2018 810,061 813,4701,690,000 2.10% due Sep. 8, 2018 1,686,761 1,748,115
85,000 1.75% due Oct. 9, 2018 84,850 87,1201,335,000 4.40% due Jun. 2, 2019 1,427,997 1,499,966
809,000 2.10% due Sep. 8, 2019 818,486 837,8412,076,000 4.20% due Jun. 2, 2020 2,153,101 2,349,2732,000,000 4.00% due Jun. 2, 2021 2,094,798 2,262,0102,631,000 3.15% due Jun. 2, 2022 2,676,859 2,838,783
269,000 9.50% due Jul. 13, 2022 401,378 402,1702,726,000 2.85% due Jun. 2, 2023 2,682,376 2,860,859
534,000 8.10% due Sep. 8, 2023 722,321 770,13251,000 7.50% due Feb. 7, 2024 73,933 71,647
2,696,000 3.50% due Jun. 2, 2024 2,784,684 2,946,8421,711,000 2.60% due Jun. 2, 2025 1,737,011 1,732,074
599,000 7.60% due Jun. 2, 2027 834,443 903,285110,000 6.25% due Aug. 25, 2028 110,879 150,912
1,450,000 6.50% due Mar. 8, 2029 1,864,188 2,059,73490,000 6.20% due Jun. 2, 2031 89,415 127,307
999,000 5.85% due Mar. 8, 2033 1,204,840 1,383,9411,262,000 5.60% due Jun. 2, 2035 1,556,647 1,727,3081,170,000 4.70% due Jun. 2, 2037 1,270,781 1,455,8391,180,000 4.60% due Jun. 2, 2039 1,243,306 1,459,1361,832,000 4.65% due Jun. 2, 2041 2,092,659 2,297,2362,287,000 3.50% due Jun. 2, 2043 2,313,426 2,412,7533,197,000 3.45% due Jun. 2, 2045 3,015,929 3,357,545
928,000 2.90% due Dec. 2, 2046 916,160 875,263Province of Prince Edward Island
31,000 3.70% due Sep. 2, 2020 30,836 34,28750,000 6.80% due Feb. 21, 2030 49,690 72,26920,000 5.70% due Jun. 15, 2035 19,982 27,05036,000 5.30% due May 19, 2036 39,761 46,80620,000 4.65% due Nov. 19, 2037 22,018 24,13980,000 4.60% due May 19, 2041 83,564 96,40251,000 3.65% due Jun. 27, 2042 50,861 53,33425,000 3.60% due Jan. 17, 2053 23,077 26,09927,000 3.85% due Jul. 17, 2054 26,858 29,733
Province of Quebec1,350,000 4.50% due Dec. 1, 2017 1,481,943 1,467,7471,199,000 4.50% due Dec. 1, 2018 1,295,729 1,337,9581,169,000 4.50% due Dec. 1, 2019 1,257,608 1,330,3021,375,000 4.50% due Dec. 1, 2020 1,505,624 1,586,3791,735,000 4.25% due Dec. 1, 2021 1,913,181 1,994,3911,483,000 3.50% due Dec. 1, 2022 1,539,501 1,633,636
300,000 9.38% due Jan. 16, 2023 427,350 453,4601,461,000 3.00% due Sep. 1, 2023 1,448,799 1,547,062
The accompanying notes are an integral part of the financial statements.
238

Scotia Canadian Bond Index Fund (Unaudited – Continued)
SCHEDULE OF INVESTMENT PORTFOLIO
FaceValue ($) Issuer
AverageCost ($)
CarryingValue ($)
BOND AND DEBENTURES INSTRUMENTS (cont’d)Provincial Bonds (cont’d)
1,702,000 3.75% due Sep. 1, 2024 1,780,103 1,892,994180,000 5.35% due Jun. 1, 2025 214,686 223,735832,000 2.75% due Sep. 1, 2025 853,883 850,802300,000 8.50% due Apr. 1, 2026 412,725 464,846600,000 6.00% due Oct. 1, 2029 748,009 819,925952,000 6.25% due Jun. 1, 2032 1,162,915 1,358,637762,000 5.75% due Dec. 1, 2036 944,374 1,062,150917,000 5.00% due Dec. 1, 2038 1,020,818 1,183,139
1,720,000 5.00% due Dec. 1, 2041 1,981,809 2,251,6871,492,000 4.25% due Dec. 1, 2043 1,613,585 1,768,3451,999,000 3.50% due Dec. 1, 2045 1,971,502 2,101,488
Province of Saskatchewan60,000 4.50% due Aug. 23, 2016 59,590 62,595
117,000 1.95% due Mar. 1, 2019 117,259 120,754286,000 9.60% due Feb. 1, 2022 452,197 423,63481,000 5.75% due Mar. 5, 2029 105,684 108,677
103,000 6.40% due Sep. 5, 2031 130,355 149,259373,000 5.60% due Sep. 5, 2035 418,407 514,692210,000 4.75% due Jun. 1, 2040 219,826 267,627155,000 3.40% due Feb. 3, 2042 156,100 161,722366,000 3.90% due Jun. 2, 2045 377,294 419,170139,000 2.75% due Dec. 2, 2046 133,097 128,025
South Coast British Columbia Transportation Authority100,000 3.80% due Nov. 2, 2020 99,926 110,636
TransLink65,000 4.65% due Jun. 20, 2041 64,938 78,22254,000 4.45% due Jun. 9, 2044 53,875 63,802
159,000 3.85% due Feb. 9, 2052 158,141 172,085Yukon Development Corporation
31,000 5.00% due Jun. 29, 2040 30,790 38,397
92,595,633 99,629,610
Municipal Bonds – 1.9%City of Edmonton
58,000 8.50% due Sep. 14, 2018 78,153 71,137City of Montreal
185,000 4.50% due Dec. 1, 2021 195,539 211,57599,000 3.50% due Sep. 1, 2024 103,526 105,22720,000 4.25% due Dec. 1, 2032 20,232 22,368
130,000 4.10% due Dec. 1, 2034 133,761 141,373122,000 6.00% due Jun. 1, 2043 148,820 173,859
City of Ottawa31,000 5.05% due Aug. 13, 2030 35,946 37,40641,000 4.40% due Oct. 22, 2033 40,941 47,314
140,000 4.60% due Jul. 14, 2042 149,528 167,63624,000 3.05% due Apr. 23, 2046 23,767 22,17576,000 4.20% due Jul. 30, 2053 75,810 87,570
City of Toronto227,000 4.85% due Jul. 28, 2016 245,553 236,695118,000 5.05% due Jul. 18, 2017 131,744 127,957100,000 4.50% due Dec. 2, 2019 99,691 113,24267,000 6.80% due Jul. 26, 2021 87,322 85,678
136,000 3.50% due Dec. 6, 2021 137,557 148,805126,000 3.90% due Sep. 29, 2023 125,638 140,12356,000 2.45% due Feb. 6, 2025 55,916 55,13413,333 5.34% due Jul. 18, 2027 13,333 15,68045,000 2.95% due Apr. 28, 2035 44,757 42,414
107,000 5.20% due Jun. 1, 2040 122,937 138,371151,000 4.70% due Jun. 10, 2041 153,992 182,89862,000 3.80% due Dec. 13, 2042 61,790 65,841
City of Vancouver25,000 4.70% due Dec. 1, 2017 24,852 27,22254,000 3.45% due Dec. 2, 2021 53,923 59,02946,000 3.75% due Oct. 24, 2023 45,947 50,762
FaceValue ($) Issuer
AverageCost ($)
CarryingValue ($)
BOND AND DEBENTURES INSTRUMENTS (cont’d)Municipal Bonds (cont’d)
24,000 3.05% due Oct. 16, 2024 23,973 25,07640,000 3.70% due Oct. 18, 2052 39,727 42,392
City of Winnipeg40,000 6.25% due Nov. 17, 2017 47,860 44,84830,000 5.90% due Feb. 2, 2029 37,712 39,29281,000 5.20% due Jul. 17, 2036 95,352 102,270
Municipal Finance Authority of British Columbia25,000 4.15% due Oct. 13, 2015 24,968 25,232
410,000 4.80% due Dec. 1, 2017 433,725 448,032213,000 4.60% due Apr. 23, 2018 239,606 234,24999,000 4.88% due Jun. 3, 2019 112,977 112,644
173,000 4.45% due Jun. 1, 2020 179,378 196,948155,000 4.15% due Jun. 1, 2021 162,635 175,64560,000 3.35% due Jun. 1, 2022 59,930 65,076
170,000 3.75% due Sep. 26, 2023 172,280 188,00562,000 2.95% due Oct. 14, 2024 63,502 64,325
Peel Region Municipal of Ontario125,000 3.50% due Dec. 1, 2021 128,015 136,493131,000 4.25% due Dec. 2, 2033 130,479 148,341159,000 3.85% due Oct. 30, 2042 158,103 170,017
Regional Municipality of Halton Canada38,000 4.05% due Oct. 11, 2041 37,817 41,82549,000 3.15% due Apr. 6, 2045 48,830 46,289
Regional Municipality of York30,000 4.50% due Sep. 28, 2016 29,921 31,362
144,000 5.00% due Apr. 29, 2019 163,678 163,96199,000 4.50% due Jun. 30, 2020 102,609 112,740
175,000 4.00% due Jun. 30, 2021 178,550 196,37636,000 2.60% due Dec. 15, 2025 35,846 35,742
142,000 4.00% due May 31, 2032 143,639 156,80183,000 3.65% due May 13, 2033 73,645 87,252
116,000 4.05% due May 1, 2034 119,735 128,152Ville de Montreal
25,000 4.60% due Jun. 1, 2017 24,950 26,693108,000 5.00% due Dec. 1, 2017 108,530 118,08450,000 5.00% due Dec. 1, 2018 49,574 56,149
143,000 5.45% due Dec. 1, 2019 164,472 166,680140,000 3.50% due Sep. 1, 2023 139,161 149,659
5,942,154 6,314,141
Corporate Bonds – 32.9%Caterpillar Financial Services Ltd.
28,000 1.75% due Jun. 3, 2019 27,995 28,284407 East Development Group
61,000 4.47% due Jun. 23, 2045 61,000 64,289407 International Inc.
110,000 3.87% due Nov. 24, 2017 109,967 116,595140,000 4.99% due Jun. 16, 2020 155,818 162,039121,000 4.30% due May 26, 2021 124,634 137,084125,000 6.47% due Jul. 27, 2029 159,194 167,09080,000 5.96% due Dec. 3, 2035 85,414 105,10979,000 5.75% due Feb. 14, 2036 78,899 98,93780,000 3.98% due Sep. 11, 2052 79,611 80,749
407 International Inc. (callable)134,000 4.45% due Nov. 15, 2041-(Aug. 15, 2041) 139,635 147,18853,000 4.19% due Apr. 25, 2042 -(Jan. 25, 2042) 52,928 56,03939,000 3.30% due Mar. 27, 2045-(Sep. 27, 2044) 38,934 35,22033,000 4.68% due Oct. 7, 2053-(Apr. 7, 2053) 32,994 37,81945,000 3.83% due May 11, 2046-(Nov. 11, 2045) 44,927 44,613
55 Ontario School Board Trust135,000 5.90% due Jun. 2, 2033 134,906 181,297
9340572 Canada Inc (callable)130,000 2.70% due Jul. 6, 2020-(Jun. 6, 2020) 130,091 131,441
The accompanying notes are an integral part of the financial statements.
239
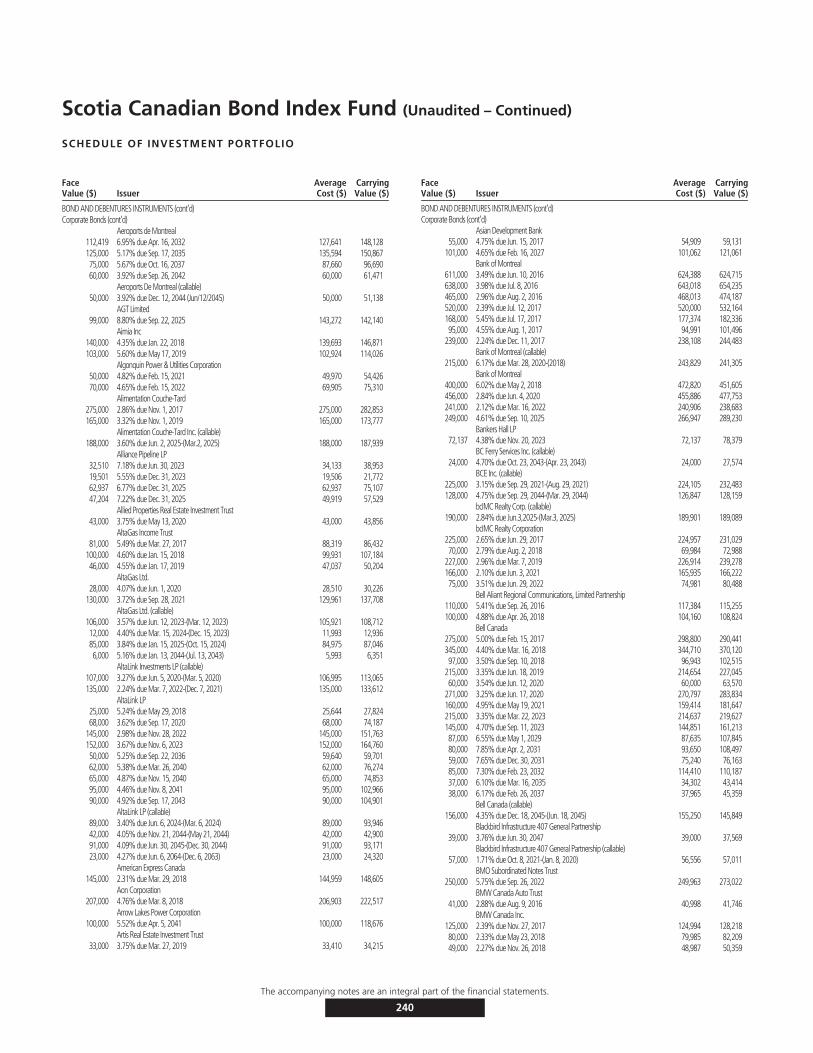
Scotia Canadian Bond Index Fund (Unaudited – Continued)
SCHEDULE OF INVESTMENT PORTFOLIO
FaceValue ($) Issuer
AverageCost ($)
CarryingValue ($)
BOND AND DEBENTURES INSTRUMENTS (cont’d)Corporate Bonds (cont’d)
Aeroports de Montreal112,419 6.95% due Apr. 16, 2032 127,641 148,128125,000 5.17% due Sep. 17, 2035 135,594 150,86775,000 5.67% due Oct. 16, 2037 87,660 96,69060,000 3.92% due Sep. 26, 2042 60,000 61,471
Aeroports De Montreal (callable)50,000 3.92% due Dec. 12, 2044 (Jun/12/2045) 50,000 51,138
AGT Limited99,000 8.80% due Sep. 22, 2025 143,272 142,140
Aimia Inc140,000 4.35% due Jan. 22, 2018 139,693 146,871103,000 5.60% due May 17, 2019 102,924 114,026
Algonquin Power & Utilities Corporation50,000 4.82% due Feb. 15, 2021 49,970 54,42670,000 4.65% due Feb. 15, 2022 69,905 75,310
Alimentation Couche-Tard275,000 2.86% due Nov. 1, 2017 275,000 282,853165,000 3.32% due Nov. 1, 2019 165,000 173,777
Alimentation Couche-Tard Inc. (callable)188,000 3.60% due Jun. 2, 2025-(Mar.2, 2025) 188,000 187,939
Alliance Pipeline LP32,510 7.18% due Jun. 30, 2023 34,133 38,95319,501 5.55% due Dec. 31, 2023 19,506 21,77262,937 6.77% due Dec. 31, 2025 62,937 75,10747,204 7.22% due Dec. 31, 2025 49,919 57,529
Allied Properties Real Estate Investment Trust43,000 3.75% due May 13, 2020 43,000 43,856
AltaGas Income Trust81,000 5.49% due Mar. 27, 2017 88,319 86,432
100,000 4.60% due Jan. 15, 2018 99,931 107,18446,000 4.55% due Jan. 17, 2019 47,037 50,204
AltaGas Ltd.28,000 4.07% due Jun. 1, 2020 28,510 30,226
130,000 3.72% due Sep. 28, 2021 129,961 137,708AltaGas Ltd. (callable)
106,000 3.57% due Jun. 12, 2023-(Mar. 12, 2023) 105,921 108,71212,000 4.40% due Mar. 15, 2024-(Dec. 15, 2023) 11,993 12,93685,000 3.84% due Jan. 15, 2025-(Oct. 15, 2024) 84,975 87,0466,000 5.16% due Jan. 13, 2044-(Jul. 13, 2043) 5,993 6,351
AltaLink Investments LP (callable)107,000 3.27% due Jun. 5, 2020-(Mar. 5, 2020) 106,995 113,065135,000 2.24% due Mar. 7, 2022-(Dec. 7, 2021) 135,000 133,612
AltaLink LP25,000 5.24% due May 29, 2018 25,644 27,82468,000 3.62% due Sep. 17, 2020 68,000 74,187
145,000 2.98% due Nov. 28, 2022 145,000 151,763152,000 3.67% due Nov. 6, 2023 152,000 164,76050,000 5.25% due Sep. 22, 2036 59,640 59,70162,000 5.38% due Mar. 26, 2040 62,000 76,27465,000 4.87% due Nov. 15, 2040 65,000 74,85395,000 4.46% due Nov. 8, 2041 95,000 102,96690,000 4.92% due Sep. 17, 2043 90,000 104,901
AltaLink LP (callable)89,000 3.40% due Jun. 6, 2024-(Mar. 6, 2024) 89,000 93,94642,000 4.05% due Nov. 21, 2044-(May 21, 2044) 42,000 42,90091,000 4.09% due Jun. 30, 2045-(Dec. 30, 2044) 91,000 93,17123,000 4.27% due Jun. 6, 2064-(Dec. 6, 2063) 23,000 24,320
American Express Canada145,000 2.31% due Mar. 29, 2018 144,959 148,605
Aon Corporation207,000 4.76% due Mar. 8, 2018 206,903 222,517
Arrow Lakes Power Corporation100,000 5.52% due Apr. 5, 2041 100,000 118,676
Artis Real Estate Investment Trust33,000 3.75% due Mar. 27, 2019 33,410 34,215
FaceValue ($) Issuer
AverageCost ($)
CarryingValue ($)
BOND AND DEBENTURES INSTRUMENTS (cont’d)Corporate Bonds (cont’d)
Asian Development Bank55,000 4.75% due Jun. 15, 2017 54,909 59,131
101,000 4.65% due Feb. 16, 2027 101,062 121,061Bank of Montreal
611,000 3.49% due Jun. 10, 2016 624,388 624,715638,000 3.98% due Jul. 8, 2016 643,018 654,235465,000 2.96% due Aug. 2, 2016 468,013 474,187520,000 2.39% due Jul. 12, 2017 520,000 532,164168,000 5.45% due Jul. 17, 2017 177,374 182,33695,000 4.55% due Aug. 1, 2017 94,991 101,496
239,000 2.24% due Dec. 11, 2017 238,108 244,483Bank of Montreal (callable)
215,000 6.17% due Mar. 28, 2020-(2018) 243,829 241,305Bank of Montreal
400,000 6.02% due May 2, 2018 472,820 451,605456,000 2.84% due Jun. 4, 2020 455,886 477,753241,000 2.12% due Mar. 16, 2022 240,906 238,683249,000 4.61% due Sep. 10, 2025 266,947 289,230
Bankers Hall LP72,137 4.38% due Nov. 20, 2023 72,137 78,379
BC Ferry Services Inc. (callable)24,000 4.70% due Oct. 23, 2043-(Apr. 23, 2043) 24,000 27,574
BCE Inc. (callable)225,000 3.15% due Sep. 29, 2021-(Aug. 29, 2021) 224,105 232,483128,000 4.75% due Sep. 29, 2044-(Mar. 29, 2044) 126,847 128,159
bcIMC Realty Corp. (callable)190,000 2.84% due Jun.3,2025-(Mar.3, 2025) 189,901 189,089
bcIMC Realty Corporation225,000 2.65% due Jun. 29, 2017 224,957 231,02970,000 2.79% due Aug. 2, 2018 69,984 72,988
227,000 2.96% due Mar. 7, 2019 226,914 239,278166,000 2.10% due Jun. 3, 2021 165,935 166,22275,000 3.51% due Jun. 29, 2022 74,981 80,488
Bell Aliant Regional Communications, Limited Partnership110,000 5.41% due Sep. 26, 2016 117,384 115,255100,000 4.88% due Apr. 26, 2018 104,160 108,824
Bell Canada275,000 5.00% due Feb. 15, 2017 298,800 290,441345,000 4.40% due Mar. 16, 2018 344,710 370,12097,000 3.50% due Sep. 10, 2018 96,943 102,515
215,000 3.35% due Jun. 18, 2019 214,654 227,04560,000 3.54% due Jun. 12, 2020 60,000 63,570
271,000 3.25% due Jun. 17, 2020 270,797 283,834160,000 4.95% due May 19, 2021 159,414 181,647215,000 3.35% due Mar. 22, 2023 214,637 219,627145,000 4.70% due Sep. 11, 2023 144,851 161,21387,000 6.55% due May 1, 2029 87,635 107,84580,000 7.85% due Apr. 2, 2031 93,650 108,49759,000 7.65% due Dec. 30, 2031 75,240 76,16385,000 7.30% due Feb. 23, 2032 114,410 110,18737,000 6.10% due Mar. 16, 2035 34,302 43,41438,000 6.17% due Feb. 26, 2037 37,965 45,359
Bell Canada (callable)156,000 4.35% due Dec. 18, 2045-(Jun. 18, 2045) 155,250 145,849
Blackbird Infrastructure 407 General Partnership39,000 3.76% due Jun. 30, 2047 39,000 37,569
Blackbird Infrastructure 407 General Partnership (callable)57,000 1.71% due Oct. 8, 2021-(Jan. 8, 2020) 56,556 57,011
BMO Subordinated Notes Trust250,000 5.75% due Sep. 26, 2022 249,963 273,022
BMW Canada Auto Trust41,000 2.88% due Aug. 9, 2016 40,998 41,746
BMW Canada Inc.125,000 2.39% due Nov. 27, 2017 124,994 128,21880,000 2.33% due May 23, 2018 79,985 82,20949,000 2.27% due Nov. 26, 2018 48,987 50,359
The accompanying notes are an integral part of the financial statements.
240
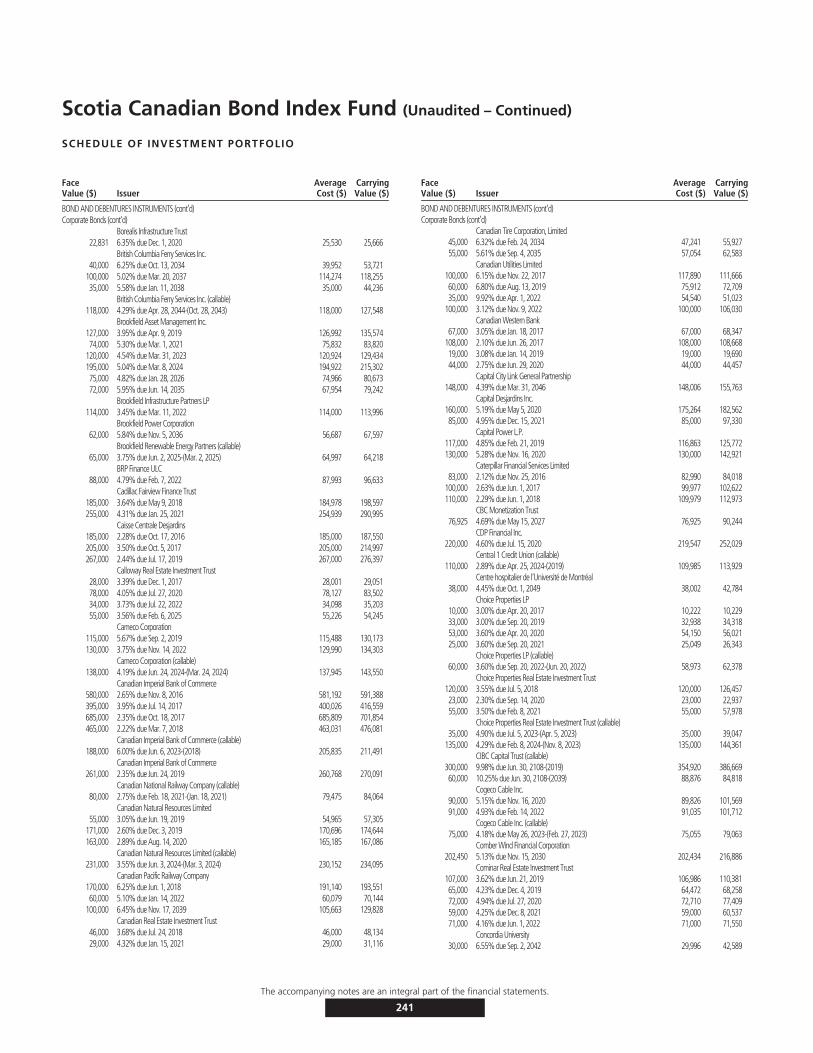
Scotia Canadian Bond Index Fund (Unaudited – Continued)
SCHEDULE OF INVESTMENT PORTFOLIO
FaceValue ($) Issuer
AverageCost ($)
CarryingValue ($)
BOND AND DEBENTURES INSTRUMENTS (cont’d)Corporate Bonds (cont’d)
Borealis Infrastructure Trust22,831 6.35% due Dec. 1, 2020 25,530 25,666
British Columbia Ferry Services Inc.40,000 6.25% due Oct. 13, 2034 39,952 53,721
100,000 5.02% due Mar. 20, 2037 114,274 118,25535,000 5.58% due Jan. 11, 2038 35,000 44,236
British Columbia Ferry Services Inc. (callable)118,000 4.29% due Apr. 28, 2044-(Oct. 28, 2043) 118,000 127,548
Brookfield Asset Management Inc.127,000 3.95% due Apr. 9, 2019 126,992 135,57474,000 5.30% due Mar. 1, 2021 75,832 83,820
120,000 4.54% due Mar. 31, 2023 120,924 129,434195,000 5.04% due Mar. 8, 2024 194,922 215,30275,000 4.82% due Jan. 28, 2026 74,966 80,67372,000 5.95% due Jun. 14, 2035 67,954 79,242
Brookfield Infrastructure Partners LP114,000 3.45% due Mar. 11, 2022 114,000 113,996
Brookfield Power Corporation62,000 5.84% due Nov. 5, 2036 56,687 67,597
Brookfield Renewable Energy Partners (callable)65,000 3.75% due Jun. 2, 2025-(Mar. 2, 2025) 64,997 64,218
BRP Finance ULC88,000 4.79% due Feb. 7, 2022 87,993 96,633
Cadillac Fairview Finance Trust185,000 3.64% due May 9, 2018 184,978 198,597255,000 4.31% due Jan. 25, 2021 254,939 290,995
Caisse Centrale Desjardins185,000 2.28% due Oct. 17, 2016 185,000 187,550205,000 3.50% due Oct. 5, 2017 205,000 214,997267,000 2.44% due Jul. 17, 2019 267,000 276,397
Calloway Real Estate Investment Trust28,000 3.39% due Dec. 1, 2017 28,001 29,05178,000 4.05% due Jul. 27, 2020 78,127 83,50234,000 3.73% due Jul. 22, 2022 34,098 35,20355,000 3.56% due Feb. 6, 2025 55,226 54,245
Cameco Corporation115,000 5.67% due Sep. 2, 2019 115,488 130,173130,000 3.75% due Nov. 14, 2022 129,990 134,303
Cameco Corporation (callable)138,000 4.19% due Jun. 24, 2024-(Mar. 24, 2024) 137,945 143,550
Canadian Imperial Bank of Commerce580,000 2.65% due Nov. 8, 2016 581,192 591,388395,000 3.95% due Jul. 14, 2017 400,026 416,559685,000 2.35% due Oct. 18, 2017 685,809 701,854465,000 2.22% due Mar. 7, 2018 463,031 476,081
Canadian Imperial Bank of Commerce (callable)188,000 6.00% due Jun. 6, 2023-(2018) 205,835 211,491
Canadian Imperial Bank of Commerce261,000 2.35% due Jun. 24, 2019 260,768 270,091
Canadian National Railway Company (callable)80,000 2.75% due Feb. 18, 2021-(Jan. 18, 2021) 79,475 84,064
Canadian Natural Resources Limited55,000 3.05% due Jun. 19, 2019 54,965 57,305
171,000 2.60% due Dec. 3, 2019 170,696 174,644163,000 2.89% due Aug. 14, 2020 165,185 167,086
Canadian Natural Resources Limited (callable)231,000 3.55% due Jun. 3, 2024-(Mar. 3, 2024) 230,152 234,095
Canadian Pacific Railway Company170,000 6.25% due Jun. 1, 2018 191,140 193,55160,000 5.10% due Jan. 14, 2022 60,079 70,144
100,000 6.45% due Nov. 17, 2039 105,663 129,828Canadian Real Estate Investment Trust
46,000 3.68% due Jul. 24, 2018 46,000 48,13429,000 4.32% due Jan. 15, 2021 29,000 31,116
FaceValue ($) Issuer
AverageCost ($)
CarryingValue ($)
BOND AND DEBENTURES INSTRUMENTS (cont’d)Corporate Bonds (cont’d)
Canadian Tire Corporation, Limited45,000 6.32% due Feb. 24, 2034 47,241 55,92755,000 5.61% due Sep. 4, 2035 57,054 62,583
Canadian Utilities Limited100,000 6.15% due Nov. 22, 2017 117,890 111,66660,000 6.80% due Aug. 13, 2019 75,912 72,70935,000 9.92% due Apr. 1, 2022 54,540 51,023
100,000 3.12% due Nov. 9, 2022 100,000 106,030Canadian Western Bank
67,000 3.05% due Jan. 18, 2017 67,000 68,347108,000 2.10% due Jun. 26, 2017 108,000 108,66819,000 3.08% due Jan. 14, 2019 19,000 19,69044,000 2.75% due Jun. 29, 2020 44,000 44,457
Capital City Link General Partnership148,000 4.39% due Mar. 31, 2046 148,006 155,763
Capital Desjardins Inc.160,000 5.19% due May 5, 2020 175,264 182,56285,000 4.95% due Dec. 15, 2021 85,000 97,330
Capital Power L.P.117,000 4.85% due Feb. 21, 2019 116,863 125,772130,000 5.28% due Nov. 16, 2020 130,000 142,921
Caterpillar Financial Services Limited83,000 2.12% due Nov. 25, 2016 82,990 84,018
100,000 2.63% due Jun. 1, 2017 99,977 102,622110,000 2.29% due Jun. 1, 2018 109,979 112,973
CBC Monetization Trust76,925 4.69% due May 15, 2027 76,925 90,244
CDP Financial Inc.220,000 4.60% due Jul. 15, 2020 219,547 252,029
Central 1 Credit Union (callable)110,000 2.89% due Apr. 25, 2024-(2019) 109,985 113,929
Centre hospitalier de l’Université de Montréal38,000 4.45% due Oct. 1, 2049 38,002 42,784
Choice Properties LP10,000 3.00% due Apr. 20, 2017 10,222 10,22933,000 3.00% due Sep. 20, 2019 32,938 34,31853,000 3.60% due Apr. 20, 2020 54,150 56,02125,000 3.60% due Sep. 20, 2021 25,049 26,343
Choice Properties LP (callable)60,000 3.60% due Sep. 20, 2022-(Jun. 20, 2022) 58,973 62,378
Choice Properties Real Estate Investment Trust120,000 3.55% due Jul. 5, 2018 120,000 126,45723,000 2.30% due Sep. 14, 2020 23,000 22,93755,000 3.50% due Feb. 8, 2021 55,000 57,978
Choice Properties Real Estate Investment Trust (callable)35,000 4.90% due Jul. 5, 2023-(Apr. 5, 2023) 35,000 39,047
135,000 4.29% due Feb. 8, 2024-(Nov. 8, 2023) 135,000 144,361CIBC Capital Trust (callable)
300,000 9.98% due Jun. 30, 2108-(2019) 354,920 386,66960,000 10.25% due Jun. 30, 2108-(2039) 88,876 84,818
Cogeco Cable Inc.90,000 5.15% due Nov. 16, 2020 89,826 101,56991,000 4.93% due Feb. 14, 2022 91,035 101,712
Cogeco Cable Inc. (callable)75,000 4.18% due May 26, 2023-(Feb. 27, 2023) 75,055 79,063
Comber Wind Financial Corporation202,450 5.13% due Nov. 15, 2030 202,434 216,886
Cominar Real Estate Investment Trust107,000 3.62% due Jun. 21, 2019 106,986 110,38165,000 4.23% due Dec. 4, 2019 64,472 68,25872,000 4.94% due Jul. 27, 2020 72,710 77,40959,000 4.25% due Dec. 8, 2021 59,000 60,53771,000 4.16% due Jun. 1, 2022 71,000 71,550
Concordia University30,000 6.55% due Sep. 2, 2042 29,996 42,589
The accompanying notes are an integral part of the financial statements.
241
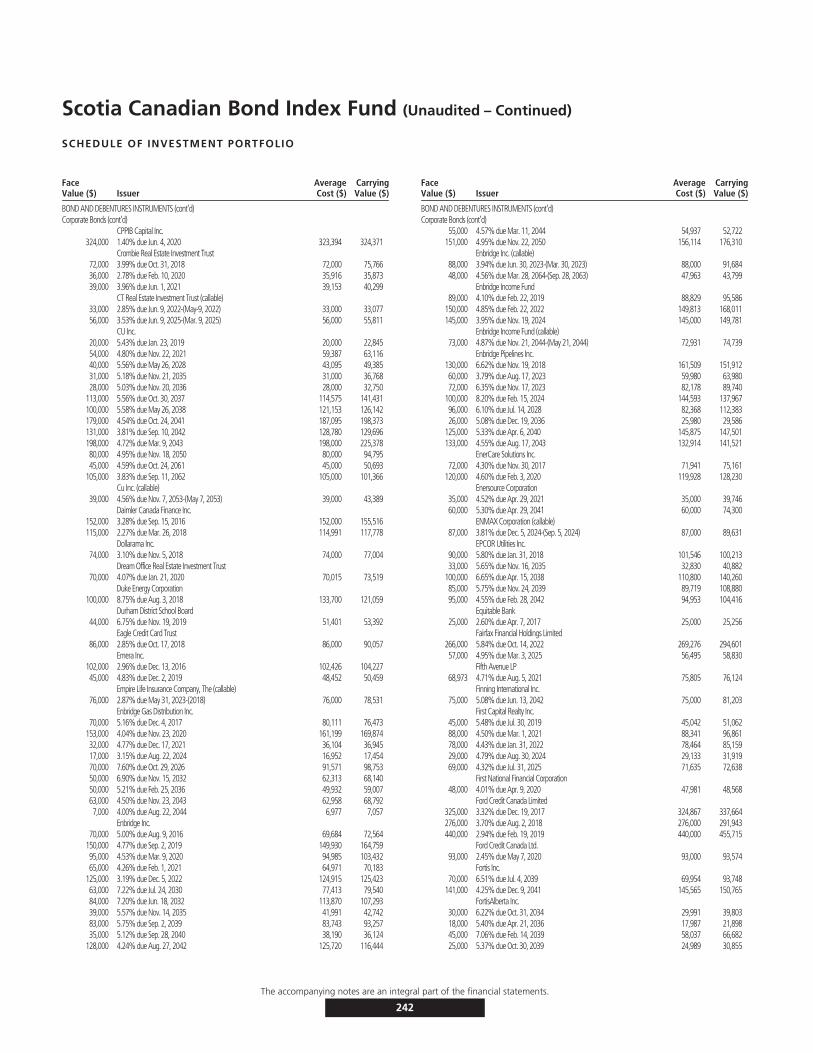
Scotia Canadian Bond Index Fund (Unaudited – Continued)
SCHEDULE OF INVESTMENT PORTFOLIO
FaceValue ($) Issuer
AverageCost ($)
CarryingValue ($)
BOND AND DEBENTURES INSTRUMENTS (cont’d)Corporate Bonds (cont’d)
CPPIB Capital Inc.324,000 1.40% due Jun. 4, 2020 323,394 324,371
Crombie Real Estate Investment Trust72,000 3.99% due Oct. 31, 2018 72,000 75,76636,000 2.78% due Feb. 10, 2020 35,916 35,87339,000 3.96% due Jun. 1, 2021 39,153 40,299
CT Real Estate Investment Trust (callable)33,000 2.85% due Jun. 9, 2022-(May-9, 2022) 33,000 33,07756,000 3.53% due Jun. 9, 2025-(Mar. 9, 2025) 56,000 55,811
CU Inc.20,000 5.43% due Jan. 23, 2019 20,000 22,84554,000 4.80% due Nov. 22, 2021 59,387 63,11640,000 5.56% due May 26, 2028 43,095 49,38531,000 5.18% due Nov. 21, 2035 31,000 36,76828,000 5.03% due Nov. 20, 2036 28,000 32,750
113,000 5.56% due Oct. 30, 2037 114,575 141,431100,000 5.58% due May 26, 2038 121,153 126,142179,000 4.54% due Oct. 24, 2041 187,095 198,373131,000 3.81% due Sep. 10, 2042 128,780 129,696198,000 4.72% due Mar. 9, 2043 198,000 225,37880,000 4.95% due Nov. 18, 2050 80,000 94,79545,000 4.59% due Oct. 24, 2061 45,000 50,693
105,000 3.83% due Sep. 11, 2062 105,000 101,366Cu Inc. (callable)
39,000 4.56% due Nov. 7, 2053-(May 7, 2053) 39,000 43,389Daimler Canada Finance Inc.
152,000 3.28% due Sep. 15, 2016 152,000 155,516115,000 2.27% due Mar. 26, 2018 114,991 117,778
Dollarama Inc.74,000 3.10% due Nov. 5, 2018 74,000 77,004
Dream Office Real Estate Investment Trust70,000 4.07% due Jan. 21, 2020 70,015 73,519
Duke Energy Corporation100,000 8.75% due Aug. 3, 2018 133,700 121,059
Durham District School Board44,000 6.75% due Nov. 19, 2019 51,401 53,392
Eagle Credit Card Trust86,000 2.85% due Oct. 17, 2018 86,000 90,057
Emera Inc.102,000 2.96% due Dec. 13, 2016 102,426 104,22745,000 4.83% due Dec. 2, 2019 48,452 50,459
Empire Life Insurance Company, The (callable)76,000 2.87% due May 31, 2023-(2018) 76,000 78,531
Enbridge Gas Distribution Inc.70,000 5.16% due Dec. 4, 2017 80,111 76,473
153,000 4.04% due Nov. 23, 2020 161,199 169,87432,000 4.77% due Dec. 17, 2021 36,104 36,94517,000 3.15% due Aug. 22, 2024 16,952 17,45470,000 7.60% due Oct. 29, 2026 91,571 98,75350,000 6.90% due Nov. 15, 2032 62,313 68,14050,000 5.21% due Feb. 25, 2036 49,932 59,00763,000 4.50% due Nov. 23, 2043 62,958 68,7927,000 4.00% due Aug. 22, 2044 6,977 7,057
Enbridge Inc.70,000 5.00% due Aug. 9, 2016 69,684 72,564
150,000 4.77% due Sep. 2, 2019 149,930 164,75995,000 4.53% due Mar. 9, 2020 94,985 103,43265,000 4.26% due Feb. 1, 2021 64,971 70,183
125,000 3.19% due Dec. 5, 2022 124,915 125,42363,000 7.22% due Jul. 24, 2030 77,413 79,54084,000 7.20% due Jun. 18, 2032 113,870 107,29339,000 5.57% due Nov. 14, 2035 41,991 42,74283,000 5.75% due Sep. 2, 2039 83,743 93,25735,000 5.12% due Sep. 28, 2040 38,190 36,124
128,000 4.24% due Aug. 27, 2042 125,720 116,444
FaceValue ($) Issuer
AverageCost ($)
CarryingValue ($)
BOND AND DEBENTURES INSTRUMENTS (cont’d)Corporate Bonds (cont’d)
55,000 4.57% due Mar. 11, 2044 54,937 52,722151,000 4.95% due Nov. 22, 2050 156,114 176,310
Enbridge Inc. (callable)88,000 3.94% due Jun. 30, 2023-(Mar. 30, 2023) 88,000 91,68448,000 4.56% due Mar. 28, 2064-(Sep. 28, 2063) 47,963 43,799
Enbridge Income Fund89,000 4.10% due Feb. 22, 2019 88,829 95,586
150,000 4.85% due Feb. 22, 2022 149,813 168,011145,000 3.95% due Nov. 19, 2024 145,000 149,781
Enbridge Income Fund (callable)73,000 4.87% due Nov. 21, 2044-(May 21, 2044) 72,931 74,739
Enbridge Pipelines Inc.130,000 6.62% due Nov. 19, 2018 161,509 151,91260,000 3.79% due Aug. 17, 2023 59,980 63,98072,000 6.35% due Nov. 17, 2023 82,178 89,740
100,000 8.20% due Feb. 15, 2024 144,593 137,96796,000 6.10% due Jul. 14, 2028 82,368 112,38326,000 5.08% due Dec. 19, 2036 25,980 29,586
125,000 5.33% due Apr. 6, 2040 145,875 147,501133,000 4.55% due Aug. 17, 2043 132,914 141,521
EnerCare Solutions Inc.72,000 4.30% due Nov. 30, 2017 71,941 75,161
120,000 4.60% due Feb. 3, 2020 119,928 128,230Enersource Corporation
35,000 4.52% due Apr. 29, 2021 35,000 39,74660,000 5.30% due Apr. 29, 2041 60,000 74,300
ENMAX Corporation (callable)87,000 3.81% due Dec. 5, 2024-(Sep. 5, 2024) 87,000 89,631
EPCOR Utilities Inc.90,000 5.80% due Jan. 31, 2018 101,546 100,21333,000 5.65% due Nov. 16, 2035 32,830 40,882
100,000 6.65% due Apr. 15, 2038 110,800 140,26085,000 5.75% due Nov. 24, 2039 89,719 108,88095,000 4.55% due Feb. 28, 2042 94,953 104,416
Equitable Bank25,000 2.60% due Apr. 7, 2017 25,000 25,256
Fairfax Financial Holdings Limited266,000 5.84% due Oct. 14, 2022 269,276 294,60157,000 4.95% due Mar. 3, 2025 56,495 58,830
Fifth Avenue LP68,973 4.71% due Aug. 5, 2021 75,805 76,124
Finning International Inc.75,000 5.08% due Jun. 13, 2042 75,000 81,203
First Capital Realty Inc.45,000 5.48% due Jul. 30, 2019 45,042 51,06288,000 4.50% due Mar. 1, 2021 88,341 96,86178,000 4.43% due Jan. 31, 2022 78,464 85,15929,000 4.79% due Aug. 30, 2024 29,133 31,91969,000 4.32% due Jul. 31, 2025 71,635 72,638
First National Financial Corporation48,000 4.01% due Apr. 9, 2020 47,981 48,568
Ford Credit Canada Limited325,000 3.32% due Dec. 19, 2017 324,867 337,664276,000 3.70% due Aug. 2, 2018 276,000 291,943440,000 2.94% due Feb. 19, 2019 440,000 455,715
Ford Credit Canada Ltd.93,000 2.45% due May 7, 2020 93,000 93,574
Fortis Inc.70,000 6.51% due Jul. 4, 2039 69,954 93,748
141,000 4.25% due Dec. 9, 2041 145,565 150,765FortisAlberta Inc.
30,000 6.22% due Oct. 31, 2034 29,991 39,80318,000 5.40% due Apr. 21, 2036 17,987 21,89845,000 7.06% due Feb. 14, 2039 58,037 66,68225,000 5.37% due Oct. 30, 2039 24,989 30,855
The accompanying notes are an integral part of the financial statements.
242
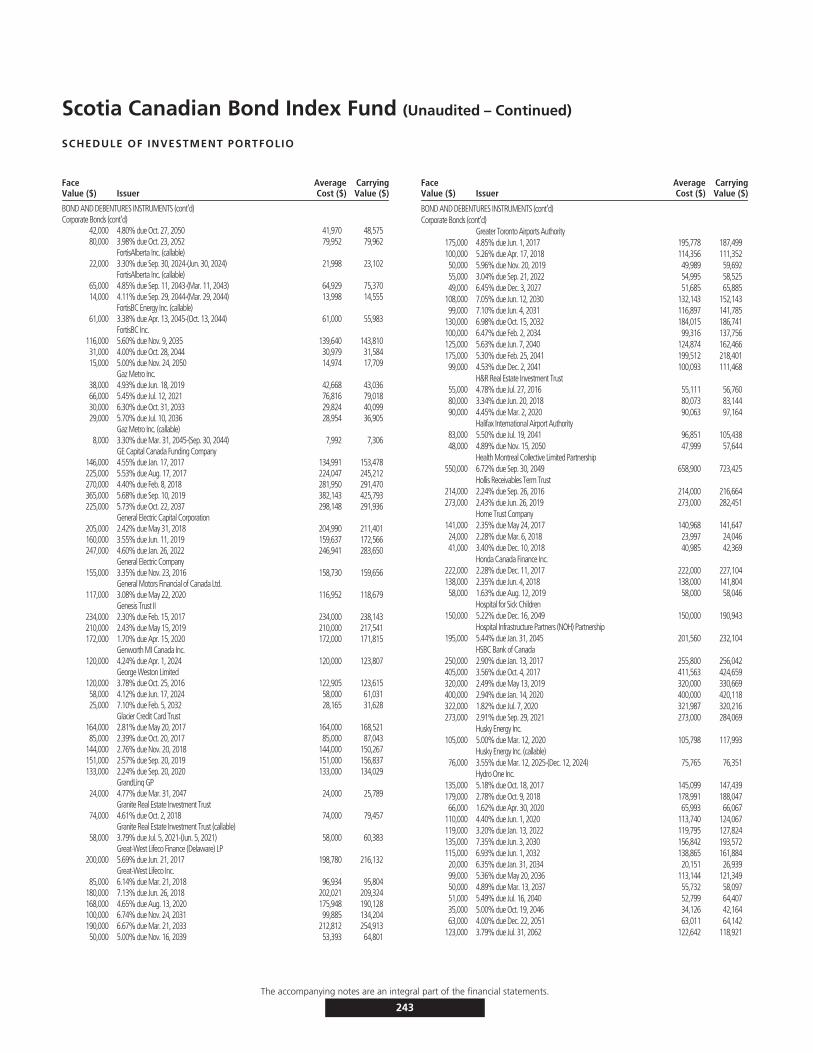
Scotia Canadian Bond Index Fund (Unaudited – Continued)
SCHEDULE OF INVESTMENT PORTFOLIO
FaceValue ($) Issuer
AverageCost ($)
CarryingValue ($)
BOND AND DEBENTURES INSTRUMENTS (cont’d)Corporate Bonds (cont’d)
42,000 4.80% due Oct. 27, 2050 41,970 48,57580,000 3.98% due Oct. 23, 2052 79,952 79,962
FortisAlberta Inc. (callable)22,000 3.30% due Sep. 30, 2024-(Jun. 30, 2024) 21,998 23,102
FortisAlberta Inc. (callable)65,000 4.85% due Sep. 11, 2043-(Mar. 11, 2043) 64,929 75,37014,000 4.11% due Sep. 29, 2044-(Mar. 29, 2044) 13,998 14,555
FortisBC Energy Inc. (callable)61,000 3.38% due Apr. 13, 2045-(Oct. 13, 2044) 61,000 55,983
FortisBC Inc.116,000 5.60% due Nov. 9, 2035 139,640 143,81031,000 4.00% due Oct. 28, 2044 30,979 31,58415,000 5.00% due Nov. 24, 2050 14,974 17,709
Gaz Metro Inc.38,000 4.93% due Jun. 18, 2019 42,668 43,03666,000 5.45% due Jul. 12, 2021 76,816 79,01830,000 6.30% due Oct. 31, 2033 29,824 40,09929,000 5.70% due Jul. 10, 2036 28,954 36,905
Gaz Metro Inc. (callable)8,000 3.30% due Mar. 31, 2045-(Sep. 30, 2044) 7,992 7,306
GE Capital Canada Funding Company146,000 4.55% due Jan. 17, 2017 134,991 153,478225,000 5.53% due Aug. 17, 2017 224,047 245,212270,000 4.40% due Feb. 8, 2018 281,950 291,470365,000 5.68% due Sep. 10, 2019 382,143 425,793225,000 5.73% due Oct. 22, 2037 298,148 291,936
General Electric Capital Corporation205,000 2.42% due May 31, 2018 204,990 211,401160,000 3.55% due Jun. 11, 2019 159,637 172,566247,000 4.60% due Jan. 26, 2022 246,941 283,650
General Electric Company155,000 3.35% due Nov. 23, 2016 158,730 159,656
General Motors Financial of Canada Ltd.117,000 3.08% due May 22, 2020 116,952 118,679
Genesis Trust II234,000 2.30% due Feb. 15, 2017 234,000 238,143210,000 2.43% due May 15, 2019 210,000 217,541172,000 1.70% due Apr. 15, 2020 172,000 171,815
Genworth MI Canada Inc.120,000 4.24% due Apr. 1, 2024 120,000 123,807
George Weston Limited120,000 3.78% due Oct. 25, 2016 122,905 123,61558,000 4.12% due Jun. 17, 2024 58,000 61,03125,000 7.10% due Feb. 5, 2032 28,165 31,628
Glacier Credit Card Trust164,000 2.81% due May 20, 2017 164,000 168,52185,000 2.39% due Oct. 20, 2017 85,000 87,043
144,000 2.76% due Nov. 20, 2018 144,000 150,267151,000 2.57% due Sep. 20, 2019 151,000 156,837133,000 2.24% due Sep. 20, 2020 133,000 134,029
GrandLinq GP24,000 4.77% due Mar. 31, 2047 24,000 25,789
Granite Real Estate Investment Trust74,000 4.61% due Oct. 2, 2018 74,000 79,457
Granite Real Estate Investment Trust (callable)58,000 3.79% due Jul. 5, 2021-(Jun. 5, 2021) 58,000 60,383
Great-West Lifeco Finance (Delaware) LP200,000 5.69% due Jun. 21, 2017 198,780 216,132
Great-West Lifeco Inc.85,000 6.14% due Mar. 21, 2018 96,934 95,804
180,000 7.13% due Jun. 26, 2018 202,021 209,324168,000 4.65% due Aug. 13, 2020 175,948 190,128100,000 6.74% due Nov. 24, 2031 99,885 134,204190,000 6.67% due Mar. 21, 2033 212,812 254,91350,000 5.00% due Nov. 16, 2039 53,393 64,801
FaceValue ($) Issuer
AverageCost ($)
CarryingValue ($)
BOND AND DEBENTURES INSTRUMENTS (cont’d)Corporate Bonds (cont’d)
Greater Toronto Airports Authority175,000 4.85% due Jun. 1, 2017 195,778 187,499100,000 5.26% due Apr. 17, 2018 114,356 111,35250,000 5.96% due Nov. 20, 2019 49,989 59,69255,000 3.04% due Sep. 21, 2022 54,995 58,52549,000 6.45% due Dec. 3, 2027 51,685 65,885
108,000 7.05% due Jun. 12, 2030 132,143 152,14399,000 7.10% due Jun. 4, 2031 116,897 141,785
130,000 6.98% due Oct. 15, 2032 184,015 186,741100,000 6.47% due Feb. 2, 2034 99,316 137,756125,000 5.63% due Jun. 7, 2040 124,874 162,466175,000 5.30% due Feb. 25, 2041 199,512 218,40199,000 4.53% due Dec. 2, 2041 100,093 111,468
H&R Real Estate Investment Trust55,000 4.78% due Jul. 27, 2016 55,111 56,76080,000 3.34% due Jun. 20, 2018 80,073 83,14490,000 4.45% due Mar. 2, 2020 90,063 97,164
Halifax International Airport Authority83,000 5.50% due Jul. 19, 2041 96,851 105,43848,000 4.89% due Nov. 15, 2050 47,999 57,644
Health Montreal Collective Limited Partnership550,000 6.72% due Sep. 30, 2049 658,900 723,425
Hollis Receivables Term Trust214,000 2.24% due Sep. 26, 2016 214,000 216,664273,000 2.43% due Jun. 26, 2019 273,000 282,451
Home Trust Company141,000 2.35% due May 24, 2017 140,968 141,64724,000 2.28% due Mar. 6, 2018 23,997 24,04641,000 3.40% due Dec. 10, 2018 40,985 42,369
Honda Canada Finance Inc.222,000 2.28% due Dec. 11, 2017 222,000 227,104138,000 2.35% due Jun. 4, 2018 138,000 141,80458,000 1.63% due Aug. 12, 2019 58,000 58,046
Hospital for Sick Children150,000 5.22% due Dec. 16, 2049 150,000 190,943
Hospital Infrastructure Partners (NOH) Partnership195,000 5.44% due Jan. 31, 2045 201,560 232,104
HSBC Bank of Canada250,000 2.90% due Jan. 13, 2017 255,800 256,042405,000 3.56% due Oct. 4, 2017 411,563 424,659320,000 2.49% due May 13, 2019 320,000 330,669400,000 2.94% due Jan. 14, 2020 400,000 420,118322,000 1.82% due Jul. 7, 2020 321,987 320,216273,000 2.91% due Sep. 29, 2021 273,000 284,069
Husky Energy Inc.105,000 5.00% due Mar. 12, 2020 105,798 117,993
Husky Energy Inc. (callable)76,000 3.55% due Mar. 12, 2025-(Dec. 12, 2024) 75,765 76,351
Hydro One Inc.135,000 5.18% due Oct. 18, 2017 145,099 147,439179,000 2.78% due Oct. 9, 2018 178,991 188,04766,000 1.62% due Apr. 30, 2020 65,993 66,067
110,000 4.40% due Jun. 1, 2020 113,740 124,067119,000 3.20% due Jan. 13, 2022 119,795 127,824135,000 7.35% due Jun. 3, 2030 156,842 193,572115,000 6.93% due Jun. 1, 2032 138,865 161,88420,000 6.35% due Jan. 31, 2034 20,151 26,93999,000 5.36% due May 20, 2036 113,144 121,34950,000 4.89% due Mar. 13, 2037 55,732 58,09751,000 5.49% due Jul. 16, 2040 52,799 64,40735,000 5.00% due Oct. 19, 2046 34,126 42,16463,000 4.00% due Dec. 22, 2051 63,011 64,142
123,000 3.79% due Jul. 31, 2062 122,642 118,921
The accompanying notes are an integral part of the financial statements.
243
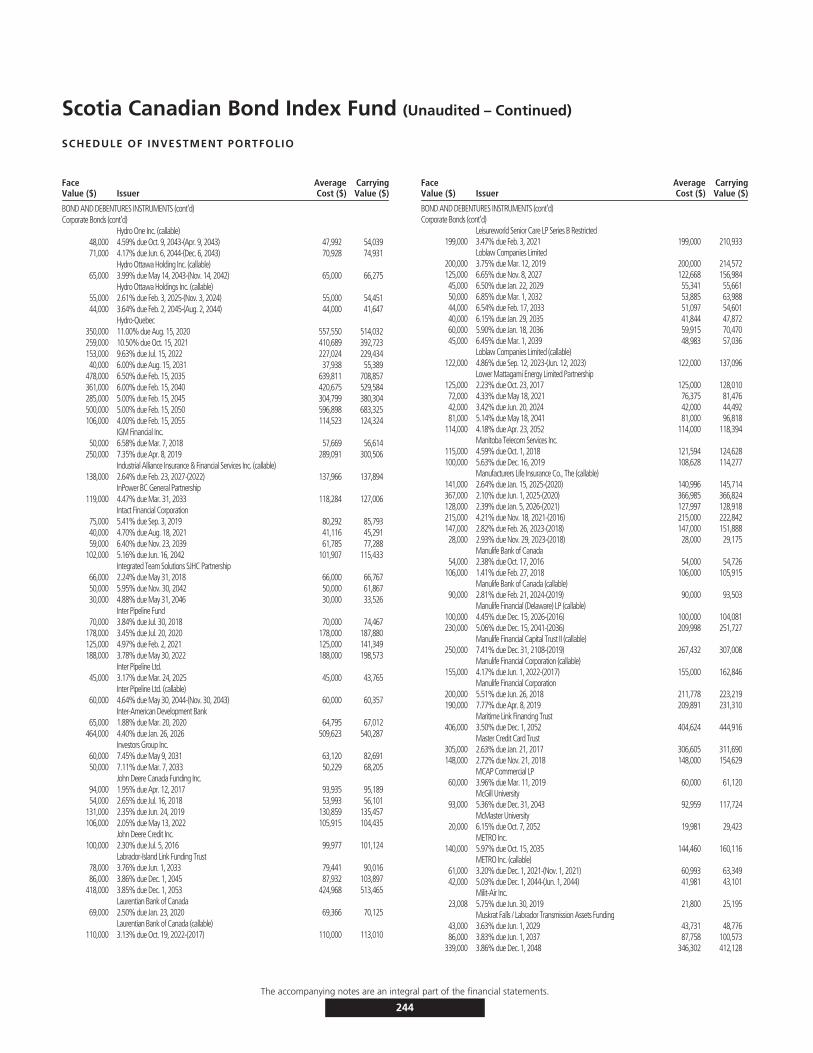
Scotia Canadian Bond Index Fund (Unaudited – Continued)
SCHEDULE OF INVESTMENT PORTFOLIO
FaceValue ($) Issuer
AverageCost ($)
CarryingValue ($)
BOND AND DEBENTURES INSTRUMENTS (cont’d)Corporate Bonds (cont’d)
Hydro One Inc. (callable)48,000 4.59% due Oct. 9, 2043-(Apr. 9, 2043) 47,992 54,03971,000 4.17% due Jun. 6, 2044-(Dec. 6, 2043) 70,928 74,931
Hydro Ottawa Holding Inc. (callable)65,000 3.99% due May 14, 2043-(Nov. 14, 2042) 65,000 66,275
Hydro Ottawa Holdings Inc. (callable)55,000 2.61% due Feb. 3, 2025-(Nov. 3, 2024) 55,000 54,45144,000 3.64% due Feb. 2, 2045-(Aug. 2, 2044) 44,000 41,647
Hydro-Quebec350,000 11.00% due Aug. 15, 2020 557,550 514,032259,000 10.50% due Oct. 15, 2021 410,689 392,723153,000 9.63% due Jul. 15, 2022 227,024 229,43440,000 6.00% due Aug. 15, 2031 37,938 55,389
478,000 6.50% due Feb. 15, 2035 639,811 708,857361,000 6.00% due Feb. 15, 2040 420,675 529,584285,000 5.00% due Feb. 15, 2045 304,799 380,304500,000 5.00% due Feb. 15, 2050 596,898 683,325106,000 4.00% due Feb. 15, 2055 114,523 124,324
IGM Financial Inc.50,000 6.58% due Mar. 7, 2018 57,669 56,614
250,000 7.35% due Apr. 8, 2019 289,091 300,506Industrial Alliance Insurance & Financial Services Inc. (callable)
138,000 2.64% due Feb. 23, 2027-(2022) 137,966 137,894InPower BC General Partnership
119,000 4.47% due Mar. 31, 2033 118,284 127,006Intact Financial Corporation
75,000 5.41% due Sep. 3, 2019 80,292 85,79340,000 4.70% due Aug. 18, 2021 41,116 45,29159,000 6.40% due Nov. 23, 2039 61,785 77,288
102,000 5.16% due Jun. 16, 2042 101,907 115,433Integrated Team Solutions SJHC Partnership
66,000 2.24% due May 31, 2018 66,000 66,76750,000 5.95% due Nov. 30, 2042 50,000 61,86730,000 4.88% due May 31, 2046 30,000 33,526
Inter Pipeline Fund70,000 3.84% due Jul. 30, 2018 70,000 74,467
178,000 3.45% due Jul. 20, 2020 178,000 187,880125,000 4.97% due Feb. 2, 2021 125,000 141,349188,000 3.78% due May 30, 2022 188,000 198,573
Inter Pipeline Ltd.45,000 3.17% due Mar. 24, 2025 45,000 43,765
Inter Pipeline Ltd. (callable)60,000 4.64% due May 30, 2044-(Nov. 30, 2043) 60,000 60,357
Inter-American Development Bank65,000 1.88% due Mar. 20, 2020 64,795 67,012
464,000 4.40% due Jan. 26, 2026 509,623 540,287Investors Group Inc.
60,000 7.45% due May 9, 2031 63,120 82,69150,000 7.11% due Mar. 7, 2033 50,229 68,205
John Deere Canada Funding Inc.94,000 1.95% due Apr. 12, 2017 93,935 95,18954,000 2.65% due Jul. 16, 2018 53,993 56,101
131,000 2.35% due Jun. 24, 2019 130,859 135,457106,000 2.05% due May 13, 2022 105,915 104,435
John Deere Credit Inc.100,000 2.30% due Jul. 5, 2016 99,977 101,124
Labrador-Island Link Funding Trust78,000 3.76% due Jun. 1, 2033 79,441 90,01686,000 3.86% due Dec. 1, 2045 87,932 103,897
418,000 3.85% due Dec. 1, 2053 424,968 513,465Laurentian Bank of Canada
69,000 2.50% due Jan. 23, 2020 69,366 70,125Laurentian Bank of Canada (callable)
110,000 3.13% due Oct. 19, 2022-(2017) 110,000 113,010
FaceValue ($) Issuer
AverageCost ($)
CarryingValue ($)
BOND AND DEBENTURES INSTRUMENTS (cont’d)Corporate Bonds (cont’d)
Leisureworld Senior Care LP Series B Restricted199,000 3.47% due Feb. 3, 2021 199,000 210,933
Loblaw Companies Limited200,000 3.75% due Mar. 12, 2019 200,000 214,572125,000 6.65% due Nov. 8, 2027 122,668 156,98445,000 6.50% due Jan. 22, 2029 55,341 55,66150,000 6.85% due Mar. 1, 2032 53,885 63,98844,000 6.54% due Feb. 17, 2033 51,097 54,60140,000 6.15% due Jan. 29, 2035 41,844 47,87260,000 5.90% due Jan. 18, 2036 59,915 70,47045,000 6.45% due Mar. 1, 2039 48,983 57,036
Loblaw Companies Limited (callable)122,000 4.86% due Sep. 12, 2023-(Jun. 12, 2023) 122,000 137,096
Lower Mattagami Energy Limited Partnership125,000 2.23% due Oct. 23, 2017 125,000 128,01072,000 4.33% due May 18, 2021 76,375 81,47642,000 3.42% due Jun. 20, 2024 42,000 44,49281,000 5.14% due May 18, 2041 81,000 96,818
114,000 4.18% due Apr. 23, 2052 114,000 118,394Manitoba Telecom Services Inc.
115,000 4.59% due Oct. 1, 2018 121,594 124,628100,000 5.63% due Dec. 16, 2019 108,628 114,277
Manufacturers Life Insurance Co., The (callable)141,000 2.64% due Jan. 15, 2025-(2020) 140,996 145,714367,000 2.10% due Jun. 1, 2025-(2020) 366,985 366,824128,000 2.39% due Jan. 5, 2026-(2021) 127,997 128,918215,000 4.21% due Nov. 18, 2021-(2016) 215,000 222,842147,000 2.82% due Feb. 26, 2023-(2018) 147,000 151,88828,000 2.93% due Nov. 29, 2023-(2018) 28,000 29,175
Manulife Bank of Canada54,000 2.38% due Oct. 17, 2016 54,000 54,726
106,000 1.41% due Feb. 27, 2018 106,000 105,915Manulife Bank of Canada (callable)
90,000 2.81% due Feb. 21, 2024-(2019) 90,000 93,503Manulife Financial (Delaware) LP (callable)
100,000 4.45% due Dec. 15, 2026-(2016) 100,000 104,081230,000 5.06% due Dec. 15, 2041-(2036) 209,998 251,727
Manulife Financial Capital Trust II (callable)250,000 7.41% due Dec. 31, 2108-(2019) 267,432 307,008
Manulife Financial Corporation (callable)155,000 4.17% due Jun. 1, 2022-(2017) 155,000 162,846
Manulife Financial Corporation200,000 5.51% due Jun. 26, 2018 211,778 223,219190,000 7.77% due Apr. 8, 2019 209,891 231,310
Maritime Link Financing Trust406,000 3.50% due Dec. 1, 2052 404,624 444,916
Master Credit Card Trust305,000 2.63% due Jan. 21, 2017 306,605 311,690148,000 2.72% due Nov. 21, 2018 148,000 154,629
MCAP Commercial LP60,000 3.96% due Mar. 11, 2019 60,000 61,120
McGill University93,000 5.36% due Dec. 31, 2043 92,959 117,724
McMaster University20,000 6.15% due Oct. 7, 2052 19,981 29,423
METRO Inc.140,000 5.97% due Oct. 15, 2035 144,460 160,116
METRO Inc. (callable)61,000 3.20% due Dec. 1, 2021-(Nov. 1, 2021) 60,993 63,34942,000 5.03% due Dec. 1, 2044-(Jun. 1, 2044) 41,981 43,101
Milit-Air Inc.23,008 5.75% due Jun. 30, 2019 21,800 25,195
Muskrat Falls / Labrador Transmission Assets Funding43,000 3.63% due Jun. 1, 2029 43,731 48,77686,000 3.83% due Jun. 1, 2037 87,758 100,573
339,000 3.86% due Dec. 1, 2048 346,302 412,128
The accompanying notes are an integral part of the financial statements.
244
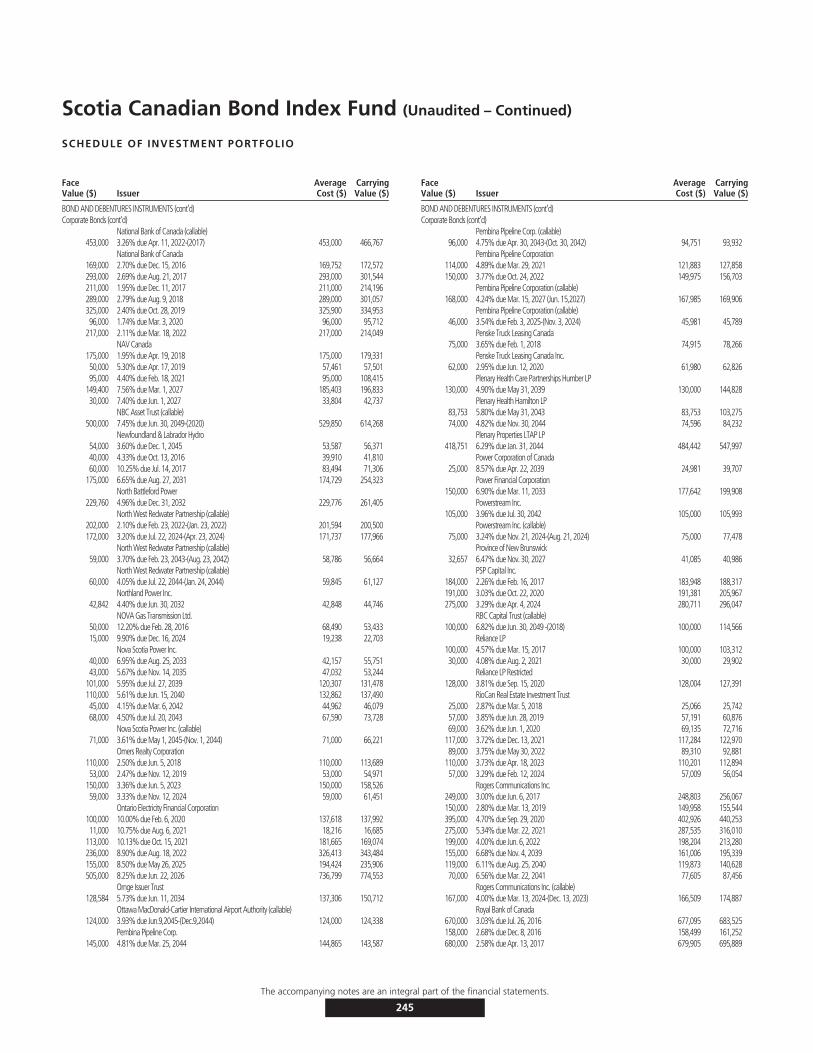
Scotia Canadian Bond Index Fund (Unaudited – Continued)
SCHEDULE OF INVESTMENT PORTFOLIO
FaceValue ($) Issuer
AverageCost ($)
CarryingValue ($)
BOND AND DEBENTURES INSTRUMENTS (cont’d)Corporate Bonds (cont’d)
National Bank of Canada (callable)453,000 3.26% due Apr. 11, 2022-(2017) 453,000 466,767
National Bank of Canada169,000 2.70% due Dec. 15, 2016 169,752 172,572293,000 2.69% due Aug. 21, 2017 293,000 301,544211,000 1.95% due Dec. 11, 2017 211,000 214,196289,000 2.79% due Aug. 9, 2018 289,000 301,057325,000 2.40% due Oct. 28, 2019 325,900 334,95396,000 1.74% due Mar. 3, 2020 96,000 95,712
217,000 2.11% due Mar. 18, 2022 217,000 214,049NAV Canada
175,000 1.95% due Apr. 19, 2018 175,000 179,33150,000 5.30% due Apr. 17, 2019 57,461 57,50195,000 4.40% due Feb. 18, 2021 95,000 108,415
149,400 7.56% due Mar. 1, 2027 185,403 196,83330,000 7.40% due Jun. 1, 2027 33,804 42,737
NBC Asset Trust (callable)500,000 7.45% due Jun. 30, 2049-(2020) 529,850 614,268
Newfoundland & Labrador Hydro54,000 3.60% due Dec. 1, 2045 53,587 56,37140,000 4.33% due Oct. 13, 2016 39,910 41,81060,000 10.25% due Jul. 14, 2017 83,494 71,306
175,000 6.65% due Aug. 27, 2031 174,729 254,323North Battleford Power
229,760 4.96% due Dec. 31, 2032 229,776 261,405North West Redwater Partnership (callable)
202,000 2.10% due Feb. 23, 2022-(Jan. 23, 2022) 201,594 200,500172,000 3.20% due Jul. 22, 2024-(Apr. 23, 2024) 171,737 177,966
North West Redwater Partnership (callable)59,000 3.70% due Feb. 23, 2043-(Aug. 23, 2042) 58,786 56,664
North West Redwater Partnership (callable)60,000 4.05% due Jul. 22, 2044-(Jan. 24, 2044) 59,845 61,127
Northland Power Inc.42,842 4.40% due Jun. 30, 2032 42,848 44,746
NOVA Gas Transmission Ltd.50,000 12.20% due Feb. 28, 2016 68,490 53,43315,000 9.90% due Dec. 16, 2024 19,238 22,703
Nova Scotia Power Inc.40,000 6.95% due Aug. 25, 2033 42,157 55,75143,000 5.67% due Nov. 14, 2035 47,032 53,244
101,000 5.95% due Jul. 27, 2039 120,307 131,478110,000 5.61% due Jun. 15, 2040 132,862 137,49045,000 4.15% due Mar. 6, 2042 44,962 46,07968,000 4.50% due Jul. 20, 2043 67,590 73,728
Nova Scotia Power Inc. (callable)71,000 3.61% due May 1, 2045-(Nov. 1, 2044) 71,000 66,221
Omers Realty Corporation110,000 2.50% due Jun. 5, 2018 110,000 113,68953,000 2.47% due Nov. 12, 2019 53,000 54,971
150,000 3.36% due Jun. 5, 2023 150,000 158,52659,000 3.33% due Nov. 12, 2024 59,000 61,451
Ontario Electricity Financial Corporation100,000 10.00% due Feb. 6, 2020 137,618 137,99211,000 10.75% due Aug. 6, 2021 18,216 16,685
113,000 10.13% due Oct. 15, 2021 181,665 169,074236,000 8.90% due Aug. 18, 2022 326,413 343,484155,000 8.50% due May 26, 2025 194,424 235,906505,000 8.25% due Jun. 22, 2026 736,799 774,553
Ornge Issuer Trust128,584 5.73% due Jun. 11, 2034 137,306 150,712
Ottawa MacDonald-Cartier International Airport Authority (callable)124,000 3.93% due Jun.9,2045-(Dec.9,2044) 124,000 124,338
Pembina Pipeline Corp.145,000 4.81% due Mar. 25, 2044 144,865 143,587
FaceValue ($) Issuer
AverageCost ($)
CarryingValue ($)
BOND AND DEBENTURES INSTRUMENTS (cont’d)Corporate Bonds (cont’d)
Pembina Pipeline Corp. (callable)96,000 4.75% due Apr. 30, 2043-(Oct. 30, 2042) 94,751 93,932
Pembina Pipeline Corporation114,000 4.89% due Mar. 29, 2021 121,883 127,858150,000 3.77% due Oct. 24, 2022 149,975 156,703
Pembina Pipeline Corporation (callable)168,000 4.24% due Mar. 15, 2027 (Jun. 15,2027) 167,985 169,906
Pembina Pipeline Corporation (callable)46,000 3.54% due Feb. 3, 2025-(Nov. 3, 2024) 45,981 45,789
Penske Truck Leasing Canada75,000 3.65% due Feb. 1, 2018 74,915 78,266
Penske Truck Leasing Canada Inc.62,000 2.95% due Jun. 12, 2020 61,980 62,826
Plenary Health Care Partnerships Humber LP130,000 4.90% due May 31, 2039 130,000 144,828
Plenary Health Hamilton LP83,753 5.80% due May 31, 2043 83,753 103,27574,000 4.82% due Nov. 30, 2044 74,596 84,232
Plenary Properties LTAP LP418,751 6.29% due Jan. 31, 2044 484,442 547,997
Power Corporation of Canada25,000 8.57% due Apr. 22, 2039 24,981 39,707
Power Financial Corporation150,000 6.90% due Mar. 11, 2033 177,642 199,908
Powerstream Inc.105,000 3.96% due Jul. 30, 2042 105,000 105,993
Powerstream Inc. (callable)75,000 3.24% due Nov. 21, 2024-(Aug. 21, 2024) 75,000 77,478
Province of New Brunswick32,657 6.47% due Nov. 30, 2027 41,085 40,986
PSP Capital Inc.184,000 2.26% due Feb. 16, 2017 183,948 188,317191,000 3.03% due Oct. 22, 2020 191,381 205,967275,000 3.29% due Apr. 4, 2024 280,711 296,047
RBC Capital Trust (callable)100,000 6.82% due Jun. 30, 2049 -(2018) 100,000 114,566
Reliance LP100,000 4.57% due Mar. 15, 2017 100,000 103,31230,000 4.08% due Aug. 2, 2021 30,000 29,902
Reliance LP Restricted128,000 3.81% due Sep. 15, 2020 128,004 127,391
RioCan Real Estate Investment Trust25,000 2.87% due Mar. 5, 2018 25,066 25,74257,000 3.85% due Jun. 28, 2019 57,191 60,87669,000 3.62% due Jun. 1, 2020 69,135 72,716
117,000 3.72% due Dec. 13, 2021 117,284 122,97089,000 3.75% due May 30, 2022 89,310 92,881
110,000 3.73% due Apr. 18, 2023 110,201 112,89457,000 3.29% due Feb. 12, 2024 57,009 56,054
Rogers Communications Inc.249,000 3.00% due Jun. 6, 2017 248,803 256,067150,000 2.80% due Mar. 13, 2019 149,958 155,544395,000 4.70% due Sep. 29, 2020 402,926 440,253275,000 5.34% due Mar. 22, 2021 287,535 316,010199,000 4.00% due Jun. 6, 2022 198,204 213,280155,000 6.68% due Nov. 4, 2039 161,006 195,339119,000 6.11% due Aug. 25, 2040 119,873 140,62870,000 6.56% due Mar. 22, 2041 77,605 87,456
Rogers Communications Inc. (callable)167,000 4.00% due Mar. 13, 2024-(Dec. 13, 2023) 166,509 174,887
Royal Bank of Canada670,000 3.03% due Jul. 26, 2016 677,095 683,525158,000 2.68% due Dec. 8, 2016 158,499 161,252680,000 2.58% due Apr. 13, 2017 679,905 695,889
The accompanying notes are an integral part of the financial statements.
245
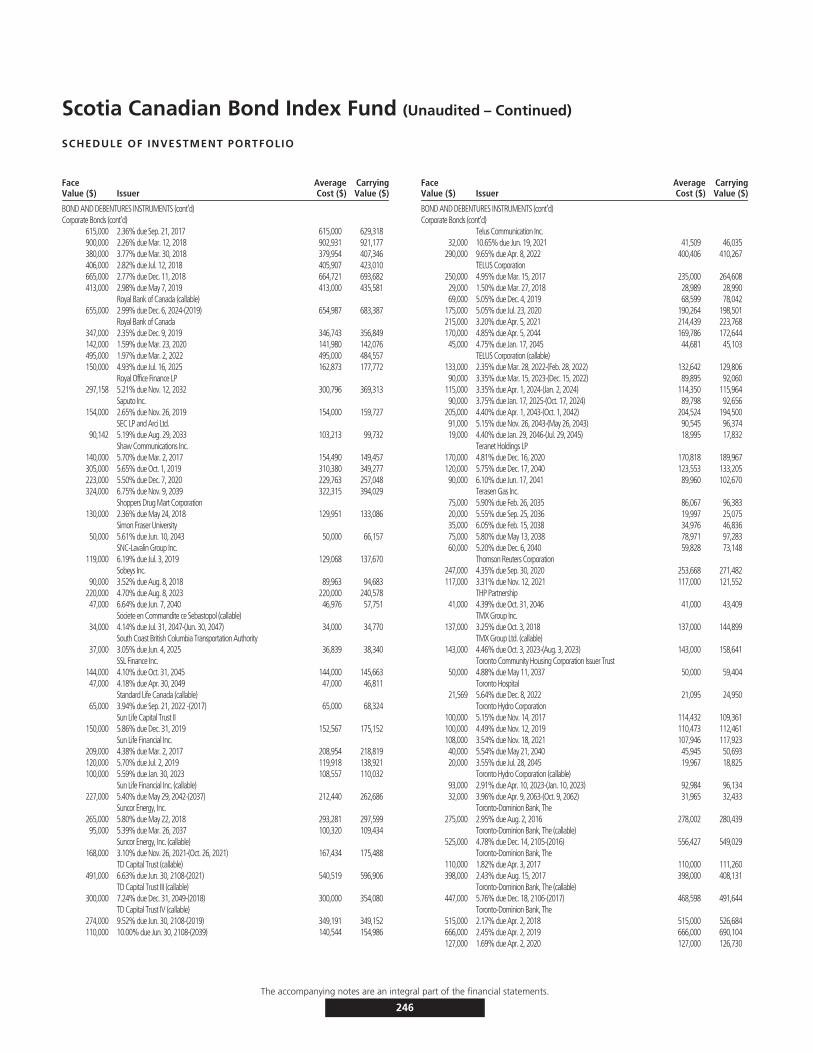
Scotia Canadian Bond Index Fund (Unaudited – Continued)
SCHEDULE OF INVESTMENT PORTFOLIO
FaceValue ($) Issuer
AverageCost ($)
CarryingValue ($)
BOND AND DEBENTURES INSTRUMENTS (cont’d)Corporate Bonds (cont’d)
615,000 2.36% due Sep. 21, 2017 615,000 629,318900,000 2.26% due Mar. 12, 2018 902,931 921,177380,000 3.77% due Mar. 30, 2018 379,954 407,346406,000 2.82% due Jul. 12, 2018 405,907 423,010665,000 2.77% due Dec. 11, 2018 664,721 693,682413,000 2.98% due May 7, 2019 413,000 435,581
Royal Bank of Canada (callable)655,000 2.99% due Dec. 6, 2024-(2019) 654,987 683,387
Royal Bank of Canada347,000 2.35% due Dec. 9, 2019 346,743 356,849142,000 1.59% due Mar. 23, 2020 141,980 142,076495,000 1.97% due Mar. 2, 2022 495,000 484,557150,000 4.93% due Jul. 16, 2025 162,873 177,772
Royal Office Finance LP297,158 5.21% due Nov. 12, 2032 300,796 369,313
Saputo Inc.154,000 2.65% due Nov. 26, 2019 154,000 159,727
SEC LP and Arci Ltd.90,142 5.19% due Aug. 29, 2033 103,213 99,732
Shaw Communications Inc.140,000 5.70% due Mar. 2, 2017 154,490 149,457305,000 5.65% due Oct. 1, 2019 310,380 349,277223,000 5.50% due Dec. 7, 2020 229,763 257,048324,000 6.75% due Nov. 9, 2039 322,315 394,029
Shoppers Drug Mart Corporation130,000 2.36% due May 24, 2018 129,951 133,086
Simon Fraser University50,000 5.61% due Jun. 10, 2043 50,000 66,157
SNC-Lavalin Group Inc.119,000 6.19% due Jul. 3, 2019 129,068 137,670
Sobeys Inc.90,000 3.52% due Aug. 8, 2018 89,963 94,683
220,000 4.70% due Aug. 8, 2023 220,000 240,57847,000 6.64% due Jun. 7, 2040 46,976 57,751
Societe en Commandite ce Sebastopol (callable)34,000 4.14% due Jul. 31, 2047-(Jun. 30, 2047) 34,000 34,770
South Coast British Columbia Transportation Authority37,000 3.05% due Jun. 4, 2025 36,839 38,340
SSL Finance Inc.144,000 4.10% due Oct. 31, 2045 144,000 145,66347,000 4.18% due Apr. 30, 2049 47,000 46,811
Standard Life Canada (callable)65,000 3.94% due Sep. 21, 2022 -(2017) 65,000 68,324
Sun Life Capital Trust II150,000 5.86% due Dec. 31, 2019 152,567 175,152
Sun Life Financial Inc.209,000 4.38% due Mar. 2, 2017 208,954 218,819120,000 5.70% due Jul. 2, 2019 119,918 138,921100,000 5.59% due Jan. 30, 2023 108,557 110,032
Sun Life Financial Inc. (callable)227,000 5.40% due May 29, 2042-(2037) 212,440 262,686
Suncor Energy, Inc.265,000 5.80% due May 22, 2018 293,281 297,59995,000 5.39% due Mar. 26, 2037 100,320 109,434
Suncor Energy, Inc. (callable)168,000 3.10% due Nov. 26, 2021-(Oct. 26, 2021) 167,434 175,488
TD Capital Trust (callable)491,000 6.63% due Jun. 30, 2108-(2021) 540,519 596,906
TD Capital Trust III (callable)300,000 7.24% due Dec. 31, 2049-(2018) 300,000 354,080
TD Capital Trust IV (callable)274,000 9.52% due Jun. 30, 2108-(2019) 349,191 349,152110,000 10.00% due Jun. 30, 2108-(2039) 140,544 154,986
FaceValue ($) Issuer
AverageCost ($)
CarryingValue ($)
BOND AND DEBENTURES INSTRUMENTS (cont’d)Corporate Bonds (cont’d)
Telus Communication Inc.32,000 10.65% due Jun. 19, 2021 41,509 46,035
290,000 9.65% due Apr. 8, 2022 400,406 410,267TELUS Corporation
250,000 4.95% due Mar. 15, 2017 235,000 264,60829,000 1.50% due Mar. 27, 2018 28,989 28,99069,000 5.05% due Dec. 4, 2019 68,599 78,042
175,000 5.05% due Jul. 23, 2020 190,264 198,501215,000 3.20% due Apr. 5, 2021 214,439 223,768170,000 4.85% due Apr. 5, 2044 169,786 172,64445,000 4.75% due Jan. 17, 2045 44,681 45,103
TELUS Corporation (callable)133,000 2.35% due Mar. 28, 2022-(Feb. 28, 2022) 132,642 129,80690,000 3.35% due Mar. 15, 2023-(Dec. 15, 2022) 89,895 92,060
115,000 3.35% due Apr. 1, 2024-(Jan. 2, 2024) 114,350 115,96490,000 3.75% due Jan. 17, 2025-(Oct. 17, 2024) 89,798 92,656
205,000 4.40% due Apr. 1, 2043-(Oct. 1, 2042) 204,524 194,50091,000 5.15% due Nov. 26, 2043-(May 26, 2043) 90,545 96,37419,000 4.40% due Jan. 29, 2046-(Jul. 29, 2045) 18,995 17,832
Teranet Holdings LP170,000 4.81% due Dec. 16, 2020 170,818 189,967120,000 5.75% due Dec. 17, 2040 123,553 133,20590,000 6.10% due Jun. 17, 2041 89,960 102,670
Terasen Gas Inc.75,000 5.90% due Feb. 26, 2035 86,067 96,38320,000 5.55% due Sep. 25, 2036 19,997 25,07535,000 6.05% due Feb. 15, 2038 34,976 46,83675,000 5.80% due May 13, 2038 78,971 97,28360,000 5.20% due Dec. 6, 2040 59,828 73,148
Thomson Reuters Corporation247,000 4.35% due Sep. 30, 2020 253,668 271,482117,000 3.31% due Nov. 12, 2021 117,000 121,552
THP Partnership41,000 4.39% due Oct. 31, 2046 41,000 43,409
TMX Group Inc.137,000 3.25% due Oct. 3, 2018 137,000 144,899
TMX Group Ltd. (callable)143,000 4.46% due Oct. 3, 2023-(Aug. 3, 2023) 143,000 158,641
Toronto Community Housing Corporation Issuer Trust50,000 4.88% due May 11, 2037 50,000 59,404
Toronto Hospital21,569 5.64% due Dec. 8, 2022 21,095 24,950
Toronto Hydro Corporation100,000 5.15% due Nov. 14, 2017 114,432 109,361100,000 4.49% due Nov. 12, 2019 110,473 112,461108,000 3.54% due Nov. 18, 2021 107,946 117,92340,000 5.54% due May 21, 2040 45,945 50,69320,000 3.55% due Jul. 28, 2045 19,967 18,825
Toronto Hydro Corporation (callable)93,000 2.91% due Apr. 10, 2023-(Jan. 10, 2023) 92,984 96,13432,000 3.96% due Apr. 9, 2063-(Oct. 9, 2062) 31,965 32,433
Toronto-Dominion Bank, The275,000 2.95% due Aug. 2, 2016 278,002 280,439
Toronto-Dominion Bank, The (callable)525,000 4.78% due Dec. 14, 2105-(2016) 556,427 549,029
Toronto-Dominion Bank, The110,000 1.82% due Apr. 3, 2017 110,000 111,260398,000 2.43% due Aug. 15, 2017 398,000 408,131
Toronto-Dominion Bank, The (callable)447,000 5.76% due Dec. 18, 2106-(2017) 468,598 491,644
Toronto-Dominion Bank, The515,000 2.17% due Apr. 2, 2018 515,000 526,684666,000 2.45% due Apr. 2, 2019 666,000 690,104127,000 1.69% due Apr. 2, 2020 127,000 126,730
The accompanying notes are an integral part of the financial statements.
246
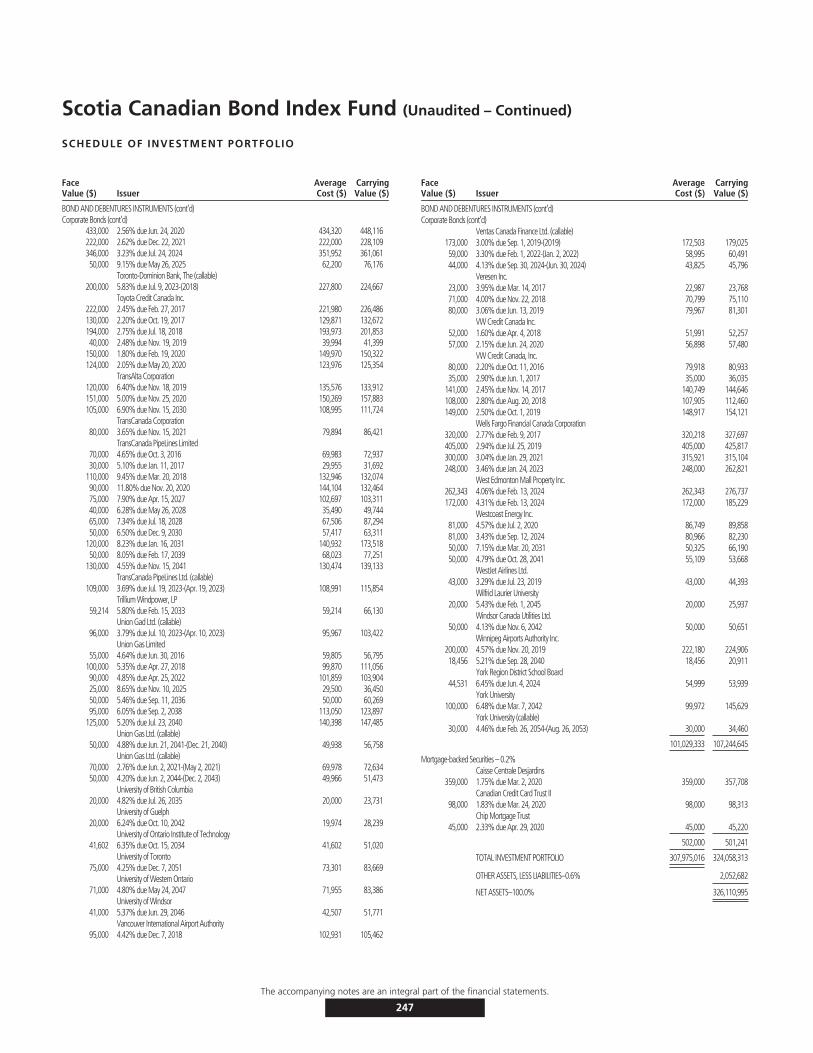
Scotia Canadian Bond Index Fund (Unaudited – Continued)
SCHEDULE OF INVESTMENT PORTFOLIO
FaceValue ($) Issuer
AverageCost ($)
CarryingValue ($)
BOND AND DEBENTURES INSTRUMENTS (cont’d)Corporate Bonds (cont’d)
433,000 2.56% due Jun. 24, 2020 434,320 448,116222,000 2.62% due Dec. 22, 2021 222,000 228,109346,000 3.23% due Jul. 24, 2024 351,952 361,06150,000 9.15% due May 26, 2025 62,200 76,176
Toronto-Dominion Bank, The (callable)200,000 5.83% due Jul. 9, 2023-(2018) 227,800 224,667
Toyota Credit Canada Inc.222,000 2.45% due Feb. 27, 2017 221,980 226,486130,000 2.20% due Oct. 19, 2017 129,871 132,672194,000 2.75% due Jul. 18, 2018 193,973 201,85340,000 2.48% due Nov. 19, 2019 39,994 41,399
150,000 1.80% due Feb. 19, 2020 149,970 150,322124,000 2.05% due May 20, 2020 123,976 125,354
TransAlta Corporation120,000 6.40% due Nov. 18, 2019 135,576 133,912151,000 5.00% due Nov. 25, 2020 150,269 157,883105,000 6.90% due Nov. 15, 2030 108,995 111,724
TransCanada Corporation80,000 3.65% due Nov. 15, 2021 79,894 86,421
TransCanada PipeLines Limited70,000 4.65% due Oct. 3, 2016 69,983 72,93730,000 5.10% due Jan. 11, 2017 29,955 31,692
110,000 9.45% due Mar. 20, 2018 132,946 132,07490,000 11.80% due Nov. 20, 2020 144,104 132,46475,000 7.90% due Apr. 15, 2027 102,697 103,31140,000 6.28% due May 26, 2028 35,490 49,74465,000 7.34% due Jul. 18, 2028 67,506 87,29450,000 6.50% due Dec. 9, 2030 57,417 63,311
120,000 8.23% due Jan. 16, 2031 140,932 173,51850,000 8.05% due Feb. 17, 2039 68,023 77,251
130,000 4.55% due Nov. 15, 2041 130,474 139,133TransCanada PipeLines Ltd. (callable)
109,000 3.69% due Jul. 19, 2023-(Apr. 19, 2023) 108,991 115,854Trillium Windpower, LP
59,214 5.80% due Feb. 15, 2033 59,214 66,130Union Gad Ltd. (callable)
96,000 3.79% due Jul. 10, 2023-(Apr. 10, 2023) 95,967 103,422Union Gas Limited
55,000 4.64% due Jun. 30, 2016 59,805 56,795100,000 5.35% due Apr. 27, 2018 99,870 111,05690,000 4.85% due Apr. 25, 2022 101,859 103,90425,000 8.65% due Nov. 10, 2025 29,500 36,45050,000 5.46% due Sep. 11, 2036 50,000 60,26995,000 6.05% due Sep. 2, 2038 113,050 123,897
125,000 5.20% due Jul. 23, 2040 140,398 147,485Union Gas Ltd. (callable)
50,000 4.88% due Jun. 21, 2041-(Dec. 21, 2040) 49,938 56,758Union Gas Ltd. (callable)
70,000 2.76% due Jun. 2, 2021-(May 2, 2021) 69,978 72,63450,000 4.20% due Jun. 2, 2044-(Dec. 2, 2043) 49,966 51,473
University of British Columbia20,000 4.82% due Jul. 26, 2035 20,000 23,731
University of Guelph20,000 6.24% due Oct. 10, 2042 19,974 28,239
University of Ontario Institute of Technology41,602 6.35% due Oct. 15, 2034 41,602 51,020
University of Toronto75,000 4.25% due Dec. 7, 2051 73,301 83,669
University of Western Ontario71,000 4.80% due May 24, 2047 71,955 83,386
University of Windsor41,000 5.37% due Jun. 29, 2046 42,507 51,771
Vancouver International Airport Authority95,000 4.42% due Dec. 7, 2018 102,931 105,462
FaceValue ($) Issuer
AverageCost ($)
CarryingValue ($)
BOND AND DEBENTURES INSTRUMENTS (cont’d)Corporate Bonds (cont’d)
Ventas Canada Finance Ltd. (callable)173,000 3.00% due Sep. 1, 2019-(2019) 172,503 179,02559,000 3.30% due Feb. 1, 2022-(Jan. 2, 2022) 58,995 60,49144,000 4.13% due Sep. 30, 2024-(Jun. 30, 2024) 43,825 45,796
Veresen Inc.23,000 3.95% due Mar. 14, 2017 22,987 23,76871,000 4.00% due Nov. 22, 2018 70,799 75,11080,000 3.06% due Jun. 13, 2019 79,967 81,301
VW Credit Canada Inc.52,000 1.60% due Apr. 4, 2018 51,991 52,25757,000 2.15% due Jun. 24, 2020 56,898 57,480
VW Credit Canada, Inc.80,000 2.20% due Oct. 11, 2016 79,918 80,93335,000 2.90% due Jun. 1, 2017 35,000 36,035
141,000 2.45% due Nov. 14, 2017 140,749 144,646108,000 2.80% due Aug. 20, 2018 107,905 112,460149,000 2.50% due Oct. 1, 2019 148,917 154,121
Wells Fargo Financial Canada Corporation320,000 2.77% due Feb. 9, 2017 320,218 327,697405,000 2.94% due Jul. 25, 2019 405,000 425,817300,000 3.04% due Jan. 29, 2021 315,921 315,104248,000 3.46% due Jan. 24, 2023 248,000 262,821
West Edmonton Mall Property Inc.262,343 4.06% due Feb. 13, 2024 262,343 276,737172,000 4.31% due Feb. 13, 2024 172,000 185,229
Westcoast Energy Inc.81,000 4.57% due Jul. 2, 2020 86,749 89,85881,000 3.43% due Sep. 12, 2024 80,966 82,23050,000 7.15% due Mar. 20, 2031 50,325 66,19050,000 4.79% due Oct. 28, 2041 55,109 53,668
WestJet Airlines Ltd.43,000 3.29% due Jul. 23, 2019 43,000 44,393
Wilfrid Laurier University20,000 5.43% due Feb. 1, 2045 20,000 25,937
Windsor Canada Utilities Ltd.50,000 4.13% due Nov. 6, 2042 50,000 50,651
Winnipeg Airports Authority Inc.200,000 4.57% due Nov. 20, 2019 222,180 224,90618,456 5.21% due Sep. 28, 2040 18,456 20,911
York Region District School Board44,531 6.45% due Jun. 4, 2024 54,999 53,939
York University100,000 6.48% due Mar. 7, 2042 99,972 145,629
York University (callable)30,000 4.46% due Feb. 26, 2054-(Aug. 26, 2053) 30,000 34,460
101,029,333 107,244,645
Mortgage-backed Securities – 0.2%Caisse Centrale Desjardins
359,000 1.75% due Mar. 2, 2020 359,000 357,708Canadian Credit Card Trust II
98,000 1.83% due Mar. 24, 2020 98,000 98,313Chip Mortgage Trust
45,000 2.33% due Apr. 29, 2020 45,000 45,220
502,000 501,241
TOTAL INVESTMENT PORTFOLIO 307,975,016 324,058,313
OTHER ASSETS, LESS LIABILITIES–0.6% 2,052,682
NET ASSETS–100.0% 326,110,995
The accompanying notes are an integral part of the financial statements.
247
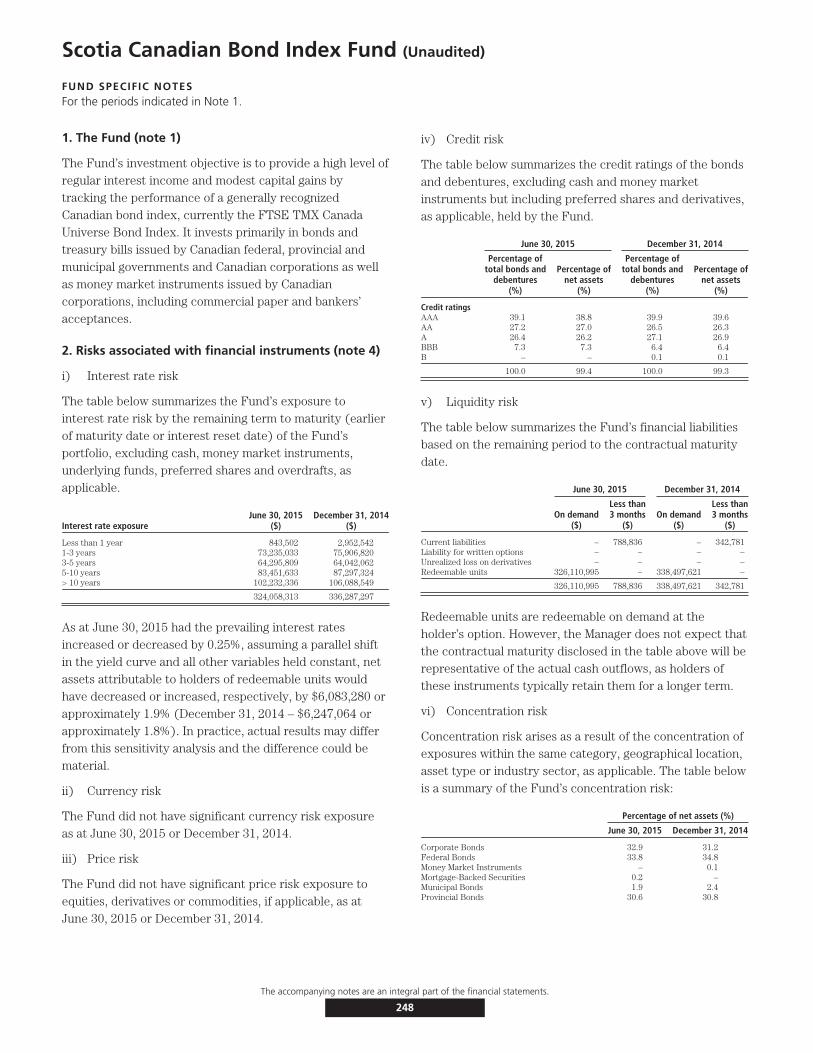
Scotia Canadian Bond Index Fund (Unaudited)
FUND SPECIFIC NOTESFor the periods indicated in Note 1.
1. The Fund (note 1)
The Fund’s investment objective is to provide a high level ofregular interest income and modest capital gains bytracking the performance of a generally recognizedCanadian bond index, currently the FTSE TMX CanadaUniverse Bond Index. It invests primarily in bonds andtreasury bills issued by Canadian federal, provincial andmunicipal governments and Canadian corporations as wellas money market instruments issued by Canadiancorporations, including commercial paper and bankers’acceptances.
2. Risks associated with financial instruments (note 4)
i) Interest rate risk
The table below summarizes the Fund’s exposure tointerest rate risk by the remaining term to maturity (earlierof maturity date or interest reset date) of the Fund’sportfolio, excluding cash, money market instruments,underlying funds, preferred shares and overdrafts, asapplicable.
Interest rate exposureJune 30, 2015
($)December 31, 2014
($)
Less than 1 year 843,502 2,952,5421-3 years 73,235,033 75,906,8203-5 years 64,295,809 64,042,0625-10 years 83,451,633 87,297,324> 10 years 102,232,336 106,088,549
324,058,313 336,287,297
As at June 30, 2015 had the prevailing interest ratesincreased or decreased by 0.25%, assuming a parallel shiftin the yield curve and all other variables held constant, netassets attributable to holders of redeemable units wouldhave decreased or increased, respectively, by $6,083,280 orapproximately 1.9% (December 31, 2014 – $6,247,064 orapproximately 1.8%). In practice, actual results may differfrom this sensitivity analysis and the difference could bematerial.
ii) Currency risk
The Fund did not have significant currency risk exposureas at June 30, 2015 or December 31, 2014.
iii) Price risk
The Fund did not have significant price risk exposure toequities, derivatives or commodities, if applicable, as atJune 30, 2015 or December 31, 2014.
iv) Credit risk
The table below summarizes the credit ratings of the bondsand debentures, excluding cash and money marketinstruments but including preferred shares and derivatives,as applicable, held by the Fund.
June 30, 2015 December 31, 2014
Percentage oftotal bonds and
debentures(%)
Percentage ofnet assets
(%)
Percentage oftotal bonds and
debentures(%)
Percentage ofnet assets
(%)
Credit ratingsAAA 39.1 38.8 39.9 39.6AA 27.2 27.0 26.5 26.3A 26.4 26.2 27.1 26.9BBB 7.3 7.3 6.4 6.4B – – 0.1 0.1
100.0 99.4 100.0 99.3
v) Liquidity risk
The table below summarizes the Fund’s financial liabilitiesbased on the remaining period to the contractual maturitydate.
June 30, 2015 December 31, 2014
On demand($)
Less than3 months
($)On demand
($)
Less than3 months
($)
Current liabilities – 788,836 – 342,781Liability for written options – – – –Unrealized loss on derivatives – – – –Redeemable units 326,110,995 – 338,497,621 –
326,110,995 788,836 338,497,621 342,781
Redeemable units are redeemable on demand at theholder’s option. However, the Manager does not expect thatthe contractual maturity disclosed in the table above will berepresentative of the actual cash outflows, as holders ofthese instruments typically retain them for a longer term.
vi) Concentration risk
Concentration risk arises as a result of the concentration ofexposures within the same category, geographical location,asset type or industry sector, as applicable. The table belowis a summary of the Fund’s concentration risk:
Percentage of net assets (%)
June 30, 2015 December 31, 2014
Corporate Bonds 32.9 31.2Federal Bonds 33.8 34.8Money Market Instruments – 0.1Mortgage-Backed Securities 0.2 –Municipal Bonds 1.9 2.4Provincial Bonds 30.6 30.8
The accompanying notes are an integral part of the financial statements.
248

Scotia Canadian Bond Index Fund (Unaudited – Continued)
FUND SPECIFIC NOTESFor the periods indicated in Note 1.
vii) Fair value classification (note 2)
The tables below illustrate the classification of the Fund’sfinancial instruments within the fair value hierarchy.
June 30, 2015Level 1
($)Level 2
($)Level 3
($)Total($)
Bonds and debentures – 324,058,313 – 324,058,313
– 324,058,313 – 324,058,313
December 31, 2014Level 1
($)Level 2
($)Level 3
($)Total($)
Bonds and debentures – 336,287,297 – 336,287,297
– 336,287,297 – 336,287,297
Transfers between levels
During the periods ended June 30, 2015 and December 31,2014, there were no significant transfers between Level 1and Level 2.
3. Offsetting of financial assets and liabilities (note 2)
As at June 30, 2015 or December 31, 2014, the Fund didnot enter into any agreement whereby the financialinstruments were eligible for offset.
4. Interest in Underlying Funds (note 2)
The Fund did not hold any interest in Underlying Funds asat June 30, 2015 or December 31, 2014.
5. Comparison of net asset value per unit and netassets per unit (note 2)
The table below provides a comparison of the net assetvalue per unit and net assets per unit. The primary reasonfor the difference between the net asset value per unit andnet assets per unit, if any, is described in note 2.
June 30, 2015 December 31, 2014
Net asset valueper unit
($)
Net assetsper unit
($)
Net asset valueper unit
($)
Net assetsper unit
($)
Series A 11.74 11.74 11.67 11.67
Series D 9.72 9.72 – –
Series F 11.78 11.78 11.72 11.72
The accompanying notes are an integral part of the financial statements.
249
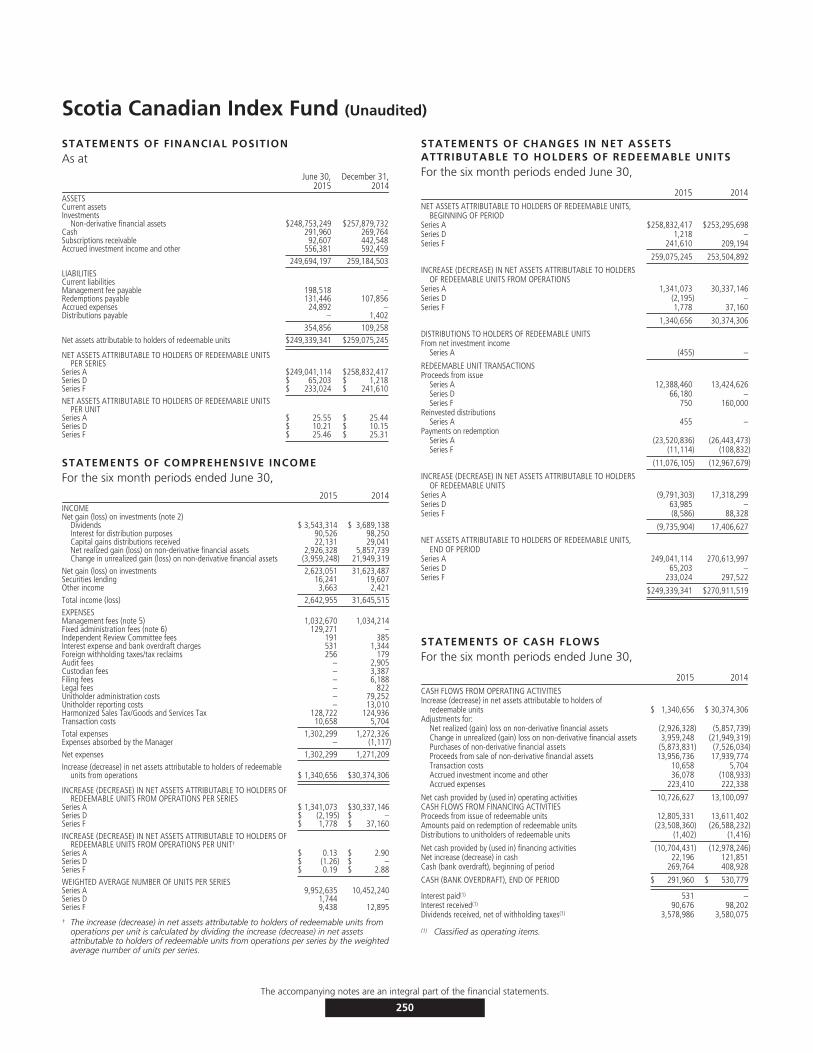
Scotia Canadian Index Fund (Unaudited)
STATEMENTS OF FINANCIAL POSITIONAs at
June 30,2015
December 31,2014
ASSETSCurrent assetsInvestments
Non-derivative financial assets $248,753,249 $257,879,732Cash 291,960 269,764Subscriptions receivable 92,607 442,548Accrued investment income and other 556,381 592,459
249,694,197 259,184,503LIABILITIESCurrent liabilitiesManagement fee payable 198,518 –Redemptions payable 131,446 107,856Accrued expenses 24,892 –Distributions payable – 1,402
354,856 109,258Net assets attributable to holders of redeemable units $249,339,341 $259,075,245
NET ASSETS ATTRIBUTABLE TO HOLDERS OF REDEEMABLE UNITSPER SERIES
Series A $249,041,114 $258,832,417Series D $ 65,203 $ 1,218Series F $ 233,024 $ 241,610NET ASSETS ATTRIBUTABLE TO HOLDERS OF REDEEMABLE UNITS
PER UNITSeries A $ 25.55 $ 25.44Series D $ 10.21 $ 10.15Series F $ 25.46 $ 25.31
STATEMENTS OF COMPREHENSIVE INCOMEFor the six month periods ended June 30,
2015 2014INCOMENet gain (loss) on investments (note 2)
Dividends $ 3,543,314 $ 3,689,138Interest for distribution purposes 90,526 98,250Capital gains distributions received 22,131 29,041Net realized gain (loss) on non-derivative financial assets 2,926,328 5,857,739Change in unrealized gain (loss) on non-derivative financial assets (3,959,248) 21,949,319
Net gain (loss) on investments 2,623,051 31,623,487Securities lending 16,241 19,607Other income 3,663 2,421Total income (loss) 2,642,955 31,645,515EXPENSESManagement fees (note 5) 1,032,670 1,034,214Fixed administration fees (note 6) 129,271 –Independent Review Committee fees 191 385Interest expense and bank overdraft charges 531 1,344Foreign withholding taxes/tax reclaims 256 179Audit fees – 2,905Custodian fees – 3,387Filing fees – 6,188Legal fees – 822Unitholder administration costs – 79,252Unitholder reporting costs – 13,010Harmonized Sales Tax/Goods and Services Tax 128,722 124,936Transaction costs 10,658 5,704Total expenses 1,302,299 1,272,326Expenses absorbed by the Manager – (1,117)Net expenses 1,302,299 1,271,209Increase (decrease) in net assets attributable to holders of redeemable
units from operations $ 1,340,656 $30,374,306
INCREASE (DECREASE) IN NET ASSETS ATTRIBUTABLE TO HOLDERS OFREDEEMABLE UNITS FROM OPERATIONS PER SERIES
Series A $ 1,341,073 $30,337,146Series D $ (2,195) $ –Series F $ 1,778 $ 37,160INCREASE (DECREASE) IN NET ASSETS ATTRIBUTABLE TO HOLDERS OF
REDEEMABLE UNITS FROM OPERATIONS PER UNIT†
Series A $ 0.13 $ 2.90Series D $ (1.26) $ –Series F $ 0.19 $ 2.88WEIGHTED AVERAGE NUMBER OF UNITS PER SERIESSeries A 9,952,635 10,452,240Series D 1,744 –Series F 9,438 12,895
† The increase (decrease) in net assets attributable to holders of redeemable units fromoperations per unit is calculated by dividing the increase (decrease) in net assetsattributable to holders of redeemable units from operations per series by the weightedaverage number of units per series.
STATEMENTS OF CHANGES IN NET ASSETSATTRIBUTABLE TO HOLDERS OF REDEEMABLE UNITSFor the six month periods ended June 30,
2015 2014NET ASSETS ATTRIBUTABLE TO HOLDERS OF REDEEMABLE UNITS,
BEGINNING OF PERIODSeries A $258,832,417 $253,295,698Series D 1,218 –Series F 241,610 209,194
259,075,245 253,504,892
INCREASE (DECREASE) IN NET ASSETS ATTRIBUTABLE TO HOLDERSOF REDEEMABLE UNITS FROM OPERATIONS
Series A 1,341,073 30,337,146Series D (2,195) –Series F 1,778 37,160
1,340,656 30,374,306
DISTRIBUTIONS TO HOLDERS OF REDEEMABLE UNITSFrom net investment income
Series A (455) –
REDEEMABLE UNIT TRANSACTIONSProceeds from issue
Series A 12,388,460 13,424,626Series D 66,180 –Series F 750 160,000
Reinvested distributionsSeries A 455 –
Payments on redemptionSeries A (23,520,836) (26,443,473)Series F (11,114) (108,832)
(11,076,105) (12,967,679)
INCREASE (DECREASE) IN NET ASSETS ATTRIBUTABLE TO HOLDERSOF REDEEMABLE UNITS
Series A (9,791,303) 17,318,299Series D 63,985 –Series F (8,586) 88,328
(9,735,904) 17,406,627
NET ASSETS ATTRIBUTABLE TO HOLDERS OF REDEEMABLE UNITS,END OF PERIOD
Series A 249,041,114 270,613,997Series D 65,203 –Series F 233,024 297,522
$249,339,341 $270,911,519
STATEMENTS OF CASH FLOWSFor the six month periods ended June 30,
2015 2014CASH FLOWS FROM OPERATING ACTIVITIESIncrease (decrease) in net assets attributable to holders of
redeemable units $ 1,340,656 $ 30,374,306Adjustments for:
Net realized (gain) loss on non-derivative financial assets (2,926,328) (5,857,739)Change in unrealized (gain) loss on non-derivative financial assets 3,959,248 (21,949,319)Purchases of non-derivative financial assets (5,873,831) (7,526,034)Proceeds from sale of non-derivative financial assets 13,956,736 17,939,774Transaction costs 10,658 5,704Accrued investment income and other 36,078 (108,933)Accrued expenses 223,410 222,338
Net cash provided by (used in) operating activities 10,726,627 13,100,097CASH FLOWS FROM FINANCING ACTIVITIESProceeds from issue of redeemable units 12,805,331 13,611,402Amounts paid on redemption of redeemable units (23,508,360) (26,588,232)Distributions to unitholders of redeemable units (1,402) (1,416)
Net cash provided by (used in) financing activities (10,704,431) (12,978,246)Net increase (decrease) in cash 22,196 121,851Cash (bank overdraft), beginning of period 269,764 408,928
CASH (BANK OVERDRAFT), END OF PERIOD $ 291,960 $ 530,779
Interest paid(1) 531 –Interest received(1) 90,676 98,202Dividends received, net of withholding taxes(1) 3,578,986 3,580,075
(1) Classified as operating items.
The accompanying notes are an integral part of the financial statements.
250
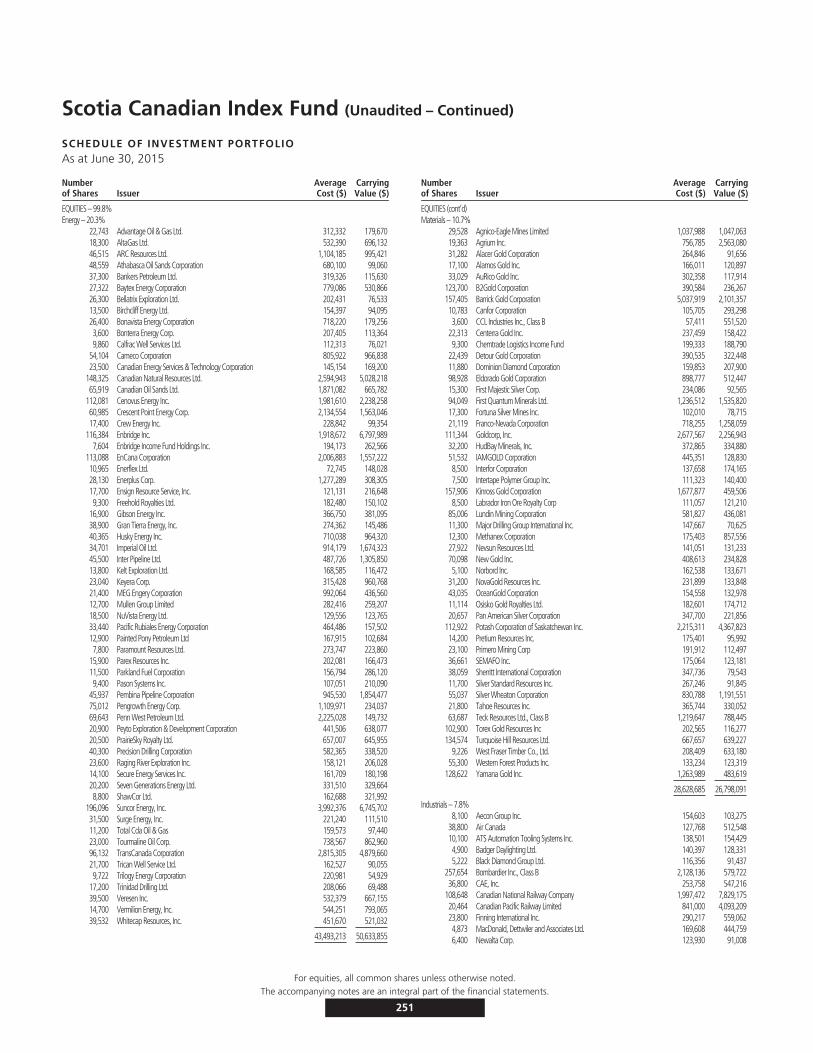
Scotia Canadian Index Fund (Unaudited – Continued)
SCHEDULE OF INVESTMENT PORTFOLIOAs at June 30, 2015
Numberof Shares Issuer
AverageCost ($)
CarryingValue ($)
EQUITIES – 99.8%Energy – 20.3%
22,743 Advantage Oil & Gas Ltd. 312,332 179,67018,300 AltaGas Ltd. 532,390 696,13246,515 ARC Resources Ltd. 1,104,185 995,42148,559 Athabasca Oil Sands Corporation 680,100 99,06037,300 Bankers Petroleum Ltd. 319,326 115,63027,322 Baytex Energy Corporation 779,086 530,86626,300 Bellatrix Exploration Ltd. 202,431 76,53313,500 Birchcliff Energy Ltd. 154,397 94,09526,400 Bonavista Energy Corporation 718,220 179,2563,600 Bonterra Energy Corp. 207,405 113,3649,860 Calfrac Well Services Ltd. 112,313 76,021
54,104 Cameco Corporation 805,922 966,83823,500 Canadian Energy Services & Technology Corporation 145,154 169,200
148,325 Canadian Natural Resources Ltd. 2,594,943 5,028,21865,919 Canadian Oil Sands Ltd. 1,871,082 665,782
112,081 Cenovus Energy Inc. 1,981,610 2,238,25860,985 Crescent Point Energy Corp. 2,134,554 1,563,04617,400 Crew Energy Inc. 228,842 99,354
116,384 Enbridge Inc. 1,918,672 6,797,9897,604 Enbridge Income Fund Holdings Inc. 194,173 262,566
113,088 EnCana Corporation 2,006,883 1,557,22210,965 Enerflex Ltd. 72,745 148,02828,130 Enerplus Corp. 1,277,289 308,30517,700 Ensign Resource Service, Inc. 121,131 216,6489,300 Freehold Royalties Ltd. 182,480 150,102
16,900 Gibson Energy Inc. 366,750 381,09538,900 Gran Tierra Energy, Inc. 274,362 145,48640,365 Husky Energy Inc. 710,038 964,32034,701 Imperial Oil Ltd. 914,179 1,674,32345,500 Inter Pipeline Ltd. 487,726 1,305,85013,800 Kelt Exploration Ltd. 168,585 116,47223,040 Keyera Corp. 315,428 960,76821,400 MEG Engery Corporation 992,064 436,56012,700 Mullen Group Limited 282,416 259,20718,500 NuVista Energy Ltd. 129,556 123,76533,440 Pacific Rubiales Energy Corporation 464,486 157,50212,900 Painted Pony Petroleum Ltd 167,915 102,6847,800 Paramount Resources Ltd. 273,747 223,860
15,900 Parex Resources Inc. 202,081 166,47311,500 Parkland Fuel Corporation 156,794 286,1209,400 Pason Systems Inc. 107,051 210,090
45,937 Pembina Pipeline Corporation 945,530 1,854,47775,012 Pengrowth Energy Corp. 1,109,971 234,03769,643 Penn West Petroleum Ltd. 2,225,028 149,73220,900 Peyto Exploration & Development Corporation 441,506 638,07720,500 PrairieSky Royalty Ltd. 657,007 645,95540,300 Precision Drilling Corporation 582,365 338,52023,600 Raging River Exploration Inc. 158,121 206,02814,100 Secure Energy Services Inc. 161,709 180,19820,200 Seven Generations Energy Ltd. 331,510 329,6648,800 ShawCor Ltd. 162,688 321,992
196,096 Suncor Energy, Inc. 3,992,376 6,745,70231,500 Surge Energy, Inc. 221,240 111,51011,200 Total Cda Oil & Gas 159,573 97,44023,000 Tourmaline Oil Corp. 738,567 862,96096,132 TransCanada Corporation 2,815,305 4,879,66021,700 Trican Well Service Ltd. 162,527 90,0559,722 Trilogy Energy Corporation 220,981 54,929
17,200 Trinidad Drilling Ltd. 208,066 69,48839,500 Veresen Inc. 532,379 667,15514,700 Vermilion Energy, Inc. 544,251 793,06539,532 Whitecap Resources, Inc. 451,670 521,032
43,493,213 50,633,855
Numberof Shares Issuer
AverageCost ($)
CarryingValue ($)
EQUITIES (cont’d)Materials – 10.7%
29,528 Agnico-Eagle Mines Limited 1,037,988 1,047,06319,363 Agrium Inc. 756,785 2,563,08031,282 Alacer Gold Corporation 264,846 91,65617,100 Alamos Gold Inc. 166,011 120,89733,029 AuRico Gold Inc. 302,358 117,914
123,700 B2Gold Corporation 390,584 236,267157,405 Barrick Gold Corporation 5,037,919 2,101,35710,783 Canfor Corporation 105,705 293,2983,600 CCL Industries Inc., Class B 57,411 551,520
22,313 Centerra Gold Inc. 237,459 158,4229,300 Chemtrade Logistics Income Fund 199,333 188,790
22,439 Detour Gold Corporation 390,535 322,44811,880 Dominion Diamond Corporation 159,853 207,90098,928 Eldorado Gold Corporation 898,777 512,44715,300 First Majestic Silver Corp. 234,086 92,56594,049 First Quantum Minerals Ltd. 1,236,512 1,535,82017,300 Fortuna Silver Mines Inc. 102,010 78,71521,119 Franco-Nevada Corporation 718,255 1,258,059
111,344 Goldcorp, Inc. 2,677,567 2,256,94332,200 HudBay Minerals, Inc. 372,865 334,88051,532 IAMGOLD Corporation 445,351 128,8308,500 Interfor Corporation 137,658 174,1657,500 Intertape Polymer Group Inc. 111,323 140,400
157,906 Kinross Gold Corporation 1,677,877 459,5068,500 Labrador Iron Ore Royalty Corp 111,057 121,210
85,006 Lundin Mining Corporation 581,827 436,08111,300 Major Drilling Group International Inc. 147,667 70,62512,300 Methanex Corporation 175,403 857,55627,922 Nevsun Resources Ltd. 141,051 131,23370,098 New Gold Inc. 408,613 234,8285,100 Norbord Inc. 162,538 133,671
31,200 NovaGold Resources Inc. 231,899 133,84843,035 OceanGold Corporation 154,558 132,97811,114 Osisko Gold Royalties Ltd. 182,601 174,71220,657 Pan American Silver Corporation 347,700 221,856
112,922 Potash Corporation of Saskatchewan Inc. 2,215,311 4,367,82314,200 Pretium Resources Inc. 175,401 95,99223,100 Primero Mining Corp 191,912 112,49736,661 SEMAFO Inc. 175,064 123,18138,059 Sherritt International Corporation 347,736 79,54311,700 Silver Standard Resources Inc. 267,246 91,84555,037 Silver Wheaton Corporation 830,788 1,191,55121,800 Tahoe Resources Inc. 365,744 330,05263,687 Teck Resources Ltd., Class B 1,219,647 788,445
102,900 Torex Gold Resources Inc 202,565 116,277134,574 Turquoise Hill Resources Ltd. 667,657 639,227
9,226 West Fraser Timber Co., Ltd. 208,409 633,18055,300 Western Forest Products Inc. 133,234 123,319
128,622 Yamana Gold Inc. 1,263,989 483,619
28,628,685 26,798,091
Industrials – 7.8%8,100 Aecon Group Inc. 154,603 103,275
38,800 Air Canada 127,768 512,54810,100 ATS Automation Tooling Systems Inc. 138,501 154,4294,900 Badger Daylighting Ltd. 140,397 128,3315,222 Black Diamond Group Ltd. 116,356 91,437
257,654 Bombardier Inc., Class B 2,128,136 579,72236,800 CAE, Inc. 253,758 547,216
108,648 Canadian National Railway Company 1,997,472 7,829,17520,464 Canadian Pacific Railway Limited 841,000 4,093,20923,800 Finning International Inc. 290,217 559,0624,873 MacDonald, Dettwiler and Associates Ltd. 169,608 444,7596,400 Newalta Corp. 123,930 91,008
For equities, all common shares unless otherwise noted.The accompanying notes are an integral part of the financial statements.
251
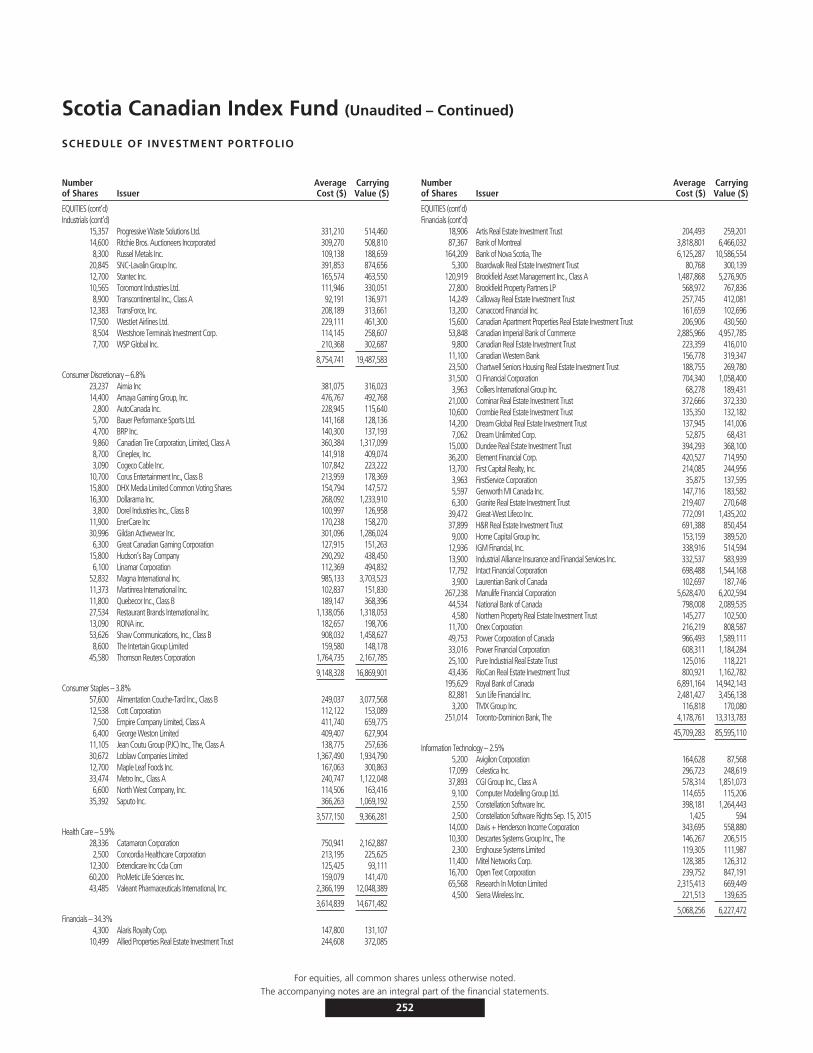
Scotia Canadian Index Fund (Unaudited – Continued)
SCHEDULE OF INVESTMENT PORTFOLIO
Numberof Shares Issuer
AverageCost ($)
CarryingValue ($)
EQUITIES (cont’d)Industrials (cont’d)
15,357 Progressive Waste Solutions Ltd. 331,210 514,46014,600 Ritchie Bros. Auctioneers Incorporated 309,270 508,8108,300 Russel Metals Inc. 109,138 188,659
20,845 SNC-Lavalin Group Inc. 391,853 874,65612,700 Stantec Inc. 165,574 463,55010,565 Toromont Industries Ltd. 111,946 330,0518,900 Transcontinental Inc., Class A 92,191 136,971
12,383 TransForce, Inc. 208,189 313,66117,500 WestJet Airlines Ltd. 229,111 461,3008,504 Westshore Terminals Investment Corp. 114,145 258,6077,700 WSP Global Inc. 210,368 302,687
8,754,741 19,487,583
Consumer Discretionary – 6.8%23,237 Aimia Inc 381,075 316,02314,400 Amaya Gaming Group, Inc. 476,767 492,7682,800 AutoCanada Inc. 228,945 115,6405,700 Bauer Performance Sports Ltd. 141,168 128,1364,700 BRP Inc. 140,300 137,1939,860 Canadian Tire Corporation, Limited, Class A 360,384 1,317,0998,700 Cineplex, Inc. 141,918 409,0743,090 Cogeco Cable Inc. 107,842 223,222
10,700 Corus Entertainment Inc., Class B 213,959 178,36915,800 DHX Media Limited Common Voting Shares 154,794 147,57216,300 Dollarama Inc. 268,092 1,233,9103,800 Dorel Industries Inc., Class B 100,997 126,958
11,900 EnerCare Inc 170,238 158,27030,996 Gildan Activewear Inc. 301,096 1,286,0246,300 Great Canadian Gaming Corporation 127,915 151,263
15,800 Hudson’s Bay Company 290,292 438,4506,100 Linamar Corporation 112,369 494,832
52,832 Magna International Inc. 985,133 3,703,52311,373 Martinrea International Inc. 102,837 151,83011,800 Quebecor Inc., Class B 189,147 368,39627,534 Restaurant Brands International Inc. 1,138,056 1,318,05313,090 RONA inc. 182,657 198,70653,626 Shaw Communications, Inc., Class B 908,032 1,458,6278,600 The Intertain Group Limited 159,580 148,178
45,580 Thomson Reuters Corporation 1,764,735 2,167,785
9,148,328 16,869,901
Consumer Staples – 3.8%57,600 Alimentation Couche-Tard Inc., Class B 249,037 3,077,56812,538 Cott Corporation 112,122 153,0897,500 Empire Company Limited, Class A 411,740 659,7756,400 George Weston Limited 409,407 627,904
11,105 Jean Coutu Group (PJC) Inc., The, Class A 138,775 257,63630,672 Loblaw Companies Limited 1,367,490 1,934,79012,700 Maple Leaf Foods Inc. 167,063 300,86333,474 Metro Inc., Class A 240,747 1,122,0486,600 North West Company, Inc. 114,506 163,416
35,392 Saputo Inc. 366,263 1,069,192
3,577,150 9,366,281
Health Care – 5.9%28,336 Catamaron Corporation 750,941 2,162,8872,500 Concordia Healthcare Corporation 213,195 225,625
12,300 Extendicare Inc Cda Com 125,425 93,11160,200 ProMetic Life Sciences Inc. 159,079 141,47043,485 Valeant Pharmaceuticals International, Inc. 2,366,199 12,048,389
3,614,839 14,671,482
Financials – 34.3%4,300 Alaris Royalty Corp. 147,800 131,107
10,499 Allied Properties Real Estate Investment Trust 244,608 372,085
Numberof Shares Issuer
AverageCost ($)
CarryingValue ($)
EQUITIES (cont’d)Financials (cont’d)
18,906 Artis Real Estate Investment Trust 204,493 259,20187,367 Bank of Montreal 3,818,801 6,466,032
164,209 Bank of Nova Scotia, The 6,125,287 10,586,5545,300 Boardwalk Real Estate Investment Trust 80,768 300,139
120,919 Brookfield Asset Management Inc., Class A 1,487,868 5,276,90527,800 Brookfield Property Partners LP 568,972 767,83614,249 Calloway Real Estate Investment Trust 257,745 412,08113,200 Canaccord Financial Inc. 161,659 102,69615,600 Canadian Apartment Properties Real Estate Investment Trust 206,906 430,56053,848 Canadian Imperial Bank of Commerce 2,885,966 4,957,7859,800 Canadian Real Estate Investment Trust 223,359 416,010
11,100 Canadian Western Bank 156,778 319,34723,500 Chartwell Seniors Housing Real Estate Investment Trust 188,755 269,78031,500 CI Financial Corporation 704,340 1,058,4003,963 Colliers International Group Inc. 68,278 189,431
21,000 Cominar Real Estate Investment Trust 372,666 372,33010,600 Crombie Real Estate Investment Trust 135,350 132,18214,200 Dream Global Real Estate Investment Trust 137,945 141,0067,062 Dream Unlimited Corp. 52,875 68,431
15,000 Dundee Real Estate Investment Trust 394,293 368,10036,200 Element Financial Corp. 420,527 714,95013,700 First Capital Realty, Inc. 214,085 244,9563,963 FirstService Corporation 35,875 137,5955,597 Genworth MI Canada Inc. 147,716 183,5826,300 Granite Real Estate Investment Trust 219,407 270,648
39,472 Great-West Lifeco Inc. 772,091 1,435,20237,899 H&R Real Estate Investment Trust 691,388 850,4549,000 Home Capital Group Inc. 153,159 389,520
12,936 IGM Financial, Inc. 338,916 514,59413,900 Industrial Alliance Insurance and Financial Services Inc. 332,537 583,93917,792 Intact Financial Corporation 698,488 1,544,1683,900 Laurentian Bank of Canada 102,697 187,746
267,238 Manulife Financial Corporation 5,628,470 6,202,59444,534 National Bank of Canada 798,008 2,089,5354,580 Northern Property Real Estate Investment Trust 145,277 102,500
11,700 Onex Corporation 216,219 808,58749,753 Power Corporation of Canada 966,493 1,589,11133,016 Power Financial Corporation 608,311 1,184,28425,100 Pure Industrial Real Estate Trust 125,016 118,22143,436 RioCan Real Estate Investment Trust 800,921 1,162,782
195,629 Royal Bank of Canada 6,891,164 14,942,14382,881 Sun Life Financial Inc. 2,481,427 3,456,1383,200 TMX Group Inc. 116,818 170,080
251,014 Toronto-Dominion Bank, The 4,178,761 13,313,783
45,709,283 85,595,110
Information Technology – 2.5%5,200 Avigilon Corporation 164,628 87,568
17,099 Celestica Inc. 296,723 248,61937,893 CGI Group Inc., Class A 578,314 1,851,0739,100 Computer Modelling Group Ltd. 114,655 115,2062,550 Constellation Software Inc. 398,181 1,264,4432,500 Constellation Software Rights Sep. 15, 2015 1,425 594
14,000 Davis + Henderson Income Corporation 343,695 558,88010,300 Descartes Systems Group Inc., The 146,267 206,5152,300 Enghouse Systems Limited 119,305 111,987
11,400 Mitel Networks Corp. 128,385 126,31216,700 Open Text Corporation 239,752 847,19165,568 Research In Motion Limited 2,315,413 669,4494,500 Sierra Wireless Inc. 221,513 139,635
5,068,256 6,227,472
For equities, all common shares unless otherwise noted.The accompanying notes are an integral part of the financial statements.
252
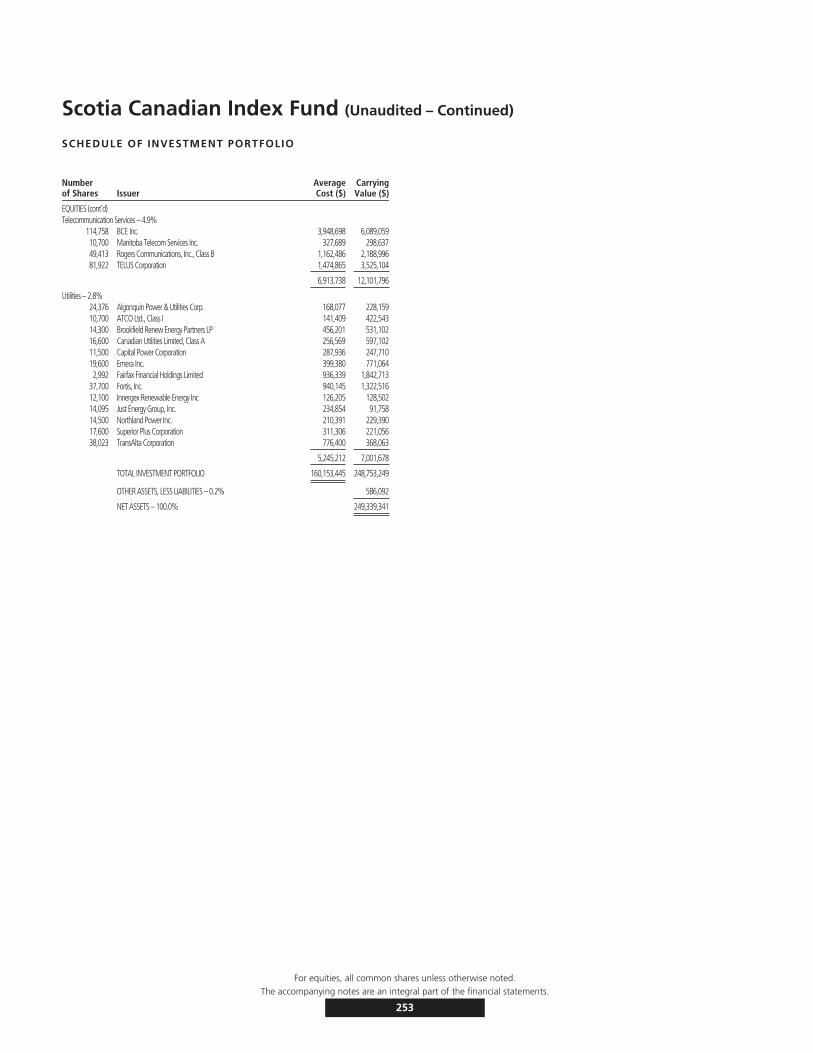
Scotia Canadian Index Fund (Unaudited – Continued)
SCHEDULE OF INVESTMENT PORTFOLIO
Numberof Shares Issuer
AverageCost ($)
CarryingValue ($)
EQUITIES (cont’d)Telecommunication Services – 4.9%
114,758 BCE Inc. 3,948,698 6,089,05910,700 Manitoba Telecom Services Inc. 327,689 298,63749,413 Rogers Communications, Inc., Class B 1,162,486 2,188,99681,922 TELUS Corporation 1,474,865 3,525,104
6,913,738 12,101,796
Utilities – 2.8%24,376 Algonquin Power & Utilities Corp. 168,077 228,15910,700 ATCO Ltd., Class I 141,409 422,54314,300 Brookfield Renew Energy Partners LP 456,201 531,10216,600 Canadian Utilities Limited, Class A 256,569 597,10211,500 Capital Power Corporation 287,936 247,71019,600 Emera Inc. 399,380 771,0642,992 Fairfax Financial Holdings Limited 936,339 1,842,713
37,700 Fortis, Inc. 940,145 1,322,51612,100 Innergex Renewable Energy Inc 126,205 128,50214,095 Just Energy Group, Inc. 234,854 91,75814,500 Northland Power Inc. 210,391 229,39017,600 Superior Plus Corporation 311,306 221,05638,023 TransAlta Corporation 776,400 368,063
5,245,212 7,001,678
TOTAL INVESTMENT PORTFOLIO 160,153,445 248,753,249
OTHER ASSETS, LESS LIABILITIES – 0.2% 586,092
NET ASSETS – 100.0% 249,339,341
For equities, all common shares unless otherwise noted.The accompanying notes are an integral part of the financial statements.
253
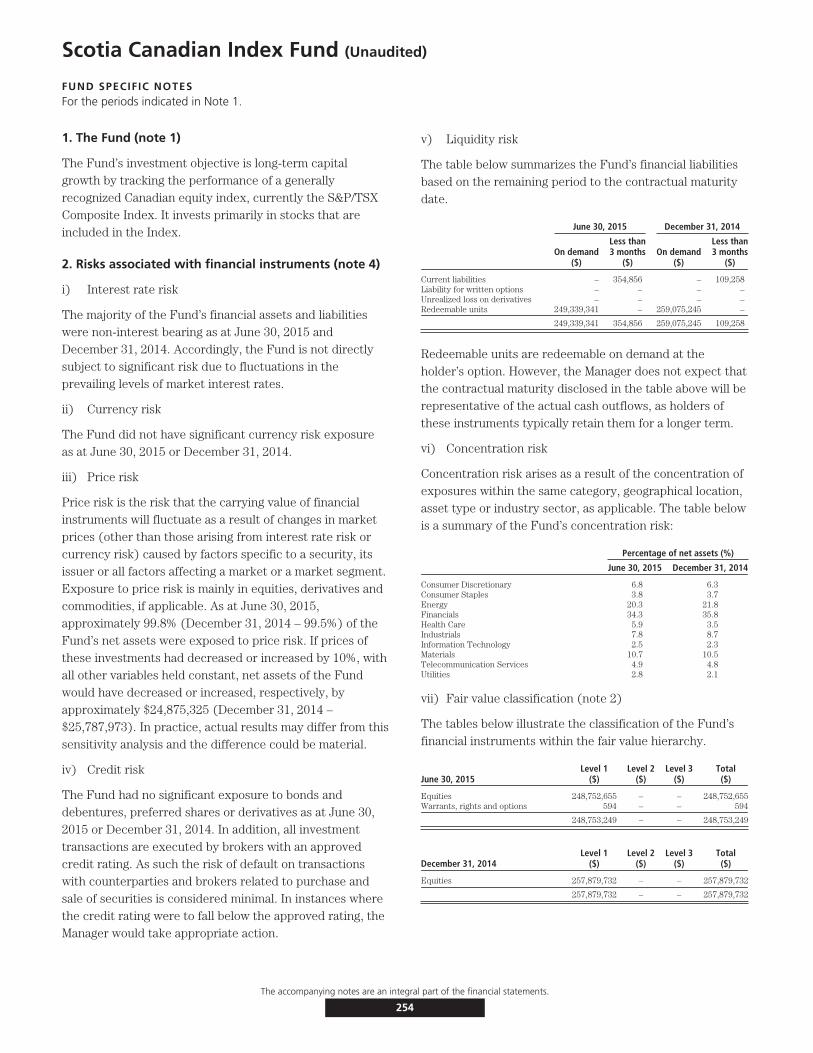
Scotia Canadian Index Fund (Unaudited)
FUND SPECIFIC NOTESFor the periods indicated in Note 1.
1. The Fund (note 1)
The Fund’s investment objective is long-term capitalgrowth by tracking the performance of a generallyrecognized Canadian equity index, currently the S&P/TSXComposite Index. It invests primarily in stocks that areincluded in the Index.
2. Risks associated with financial instruments (note 4)
i) Interest rate risk
The majority of the Fund’s financial assets and liabilitieswere non-interest bearing as at June 30, 2015 andDecember 31, 2014. Accordingly, the Fund is not directlysubject to significant risk due to fluctuations in theprevailing levels of market interest rates.
ii) Currency risk
The Fund did not have significant currency risk exposureas at June 30, 2015 or December 31, 2014.
iii) Price risk
Price risk is the risk that the carrying value of financialinstruments will fluctuate as a result of changes in marketprices (other than those arising from interest rate risk orcurrency risk) caused by factors specific to a security, itsissuer or all factors affecting a market or a market segment.Exposure to price risk is mainly in equities, derivatives andcommodities, if applicable. As at June 30, 2015,approximately 99.8% (December 31, 2014 – 99.5%) of theFund’s net assets were exposed to price risk. If prices ofthese investments had decreased or increased by 10%, withall other variables held constant, net assets of the Fundwould have decreased or increased, respectively, byapproximately $24,875,325 (December 31, 2014 –$25,787,973). In practice, actual results may differ from thissensitivity analysis and the difference could be material.
iv) Credit risk
The Fund had no significant exposure to bonds anddebentures, preferred shares or derivatives as at June 30,2015 or December 31, 2014. In addition, all investmenttransactions are executed by brokers with an approvedcredit rating. As such the risk of default on transactionswith counterparties and brokers related to purchase andsale of securities is considered minimal. In instances wherethe credit rating were to fall below the approved rating, theManager would take appropriate action.
v) Liquidity risk
The table below summarizes the Fund’s financial liabilitiesbased on the remaining period to the contractual maturitydate.
June 30, 2015 December 31, 2014
On demand($)
Less than3 months
($)On demand
($)
Less than3 months
($)
Current liabilities – 354,856 – 109,258Liability for written options – – – –Unrealized loss on derivatives – – – –Redeemable units 249,339,341 – 259,075,245 –
249,339,341 354,856 259,075,245 109,258
Redeemable units are redeemable on demand at theholder’s option. However, the Manager does not expect thatthe contractual maturity disclosed in the table above will berepresentative of the actual cash outflows, as holders ofthese instruments typically retain them for a longer term.
vi) Concentration risk
Concentration risk arises as a result of the concentration ofexposures within the same category, geographical location,asset type or industry sector, as applicable. The table belowis a summary of the Fund’s concentration risk:
Percentage of net assets (%)
June 30, 2015 December 31, 2014
Consumer Discretionary 6.8 6.3Consumer Staples 3.8 3.7Energy 20.3 21.8Financials 34.3 35.8Health Care 5.9 3.5Industrials 7.8 8.7Information Technology 2.5 2.3Materials 10.7 10.5Telecommunication Services 4.9 4.8Utilities 2.8 2.1
vii) Fair value classification (note 2)
The tables below illustrate the classification of the Fund’sfinancial instruments within the fair value hierarchy.
June 30, 2015Level 1
($)Level 2
($)Level 3
($)Total($)
Equities 248,752,655 – – 248,752,655Warrants, rights and options 594 – – 594
248,753,249 – – 248,753,249
December 31, 2014Level 1
($)Level 2
($)Level 3
($)Total($)
Equities 257,879,732 – – 257,879,732
257,879,732 – – 257,879,732
The accompanying notes are an integral part of the financial statements.
254
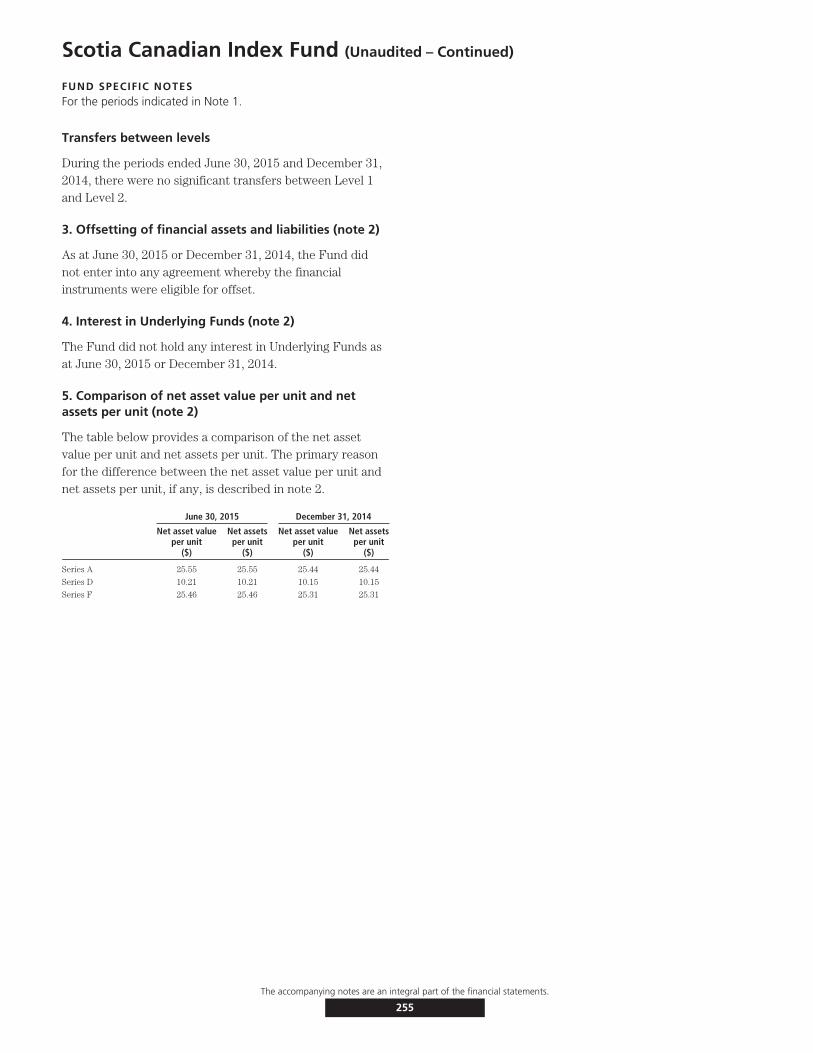
Scotia Canadian Index Fund (Unaudited – Continued)
FUND SPECIFIC NOTESFor the periods indicated in Note 1.
Transfers between levels
During the periods ended June 30, 2015 and December 31,2014, there were no significant transfers between Level 1and Level 2.
3. Offsetting of financial assets and liabilities (note 2)
As at June 30, 2015 or December 31, 2014, the Fund didnot enter into any agreement whereby the financialinstruments were eligible for offset.
4. Interest in Underlying Funds (note 2)
The Fund did not hold any interest in Underlying Funds asat June 30, 2015 or December 31, 2014.
5. Comparison of net asset value per unit and netassets per unit (note 2)
The table below provides a comparison of the net assetvalue per unit and net assets per unit. The primary reasonfor the difference between the net asset value per unit andnet assets per unit, if any, is described in note 2.
June 30, 2015 December 31, 2014
Net asset valueper unit
($)
Net assetsper unit
($)
Net asset valueper unit
($)
Net assetsper unit
($)
Series A 25.55 25.55 25.44 25.44
Series D 10.21 10.21 10.15 10.15
Series F 25.46 25.46 25.31 25.31
The accompanying notes are an integral part of the financial statements.
255

Scotia U.S. Index Fund (Unaudited)
STATEMENTS OF FINANCIAL POSITIONAs at
June 30,2015
December 31,2014
ASSETSCurrent assetsInvestments
Non-derivative financial assets $130,734,571 $108,341,938Cash 346,647 210,555Receivable for securities sold 19,647 29,303Subscriptions receivable 142,530 318,640Accrued investment income and other 129,683 123,602
131,373,078 109,024,038
LIABILITIESCurrent liabilitiesManagement fee payable 102,633 –Payable for securities purchased 83,801 –Redemptions payable 90,152 72,578Accrued expenses 21,836 –Distributions payable – 297Unrealized loss on currency spot contracts – 123
298,422 72,998
Net assets attributable to holders of redeemable units $131,074,656 $108,951,040
NET ASSETS ATTRIBUTABLE TO HOLDERS OF REDEEMABLE UNITSPER SERIES
Series A $131,045,323 $108,929,809Series D $ 3,491 $ –Series F $ 25,842 $ 21,231
NET ASSETS ATTRIBUTABLE TO HOLDERS OF REDEEMABLE UNITSPER UNIT
Series A $ 23.36 $ 21.59Series D $ 9.94 $ –Series F $ 23.29 $ 21.50
STATEMENTS OF COMPREHENSIVE INCOMEFor the six month periods ended June 30,
2015 2014INCOMENet gain (loss) on investments (note 2)
Dividends $1,349,191 $1,006,276Interest for distribution purposes 1,622 1,144Net realized gain (loss) on non-derivative financial assets 986,333 438,948Net realized and change in unrealized gain (loss) on foreign exchange (65,235) 5,838Change in unrealized gain (loss) on non-derivative financial assets 7,467,816 4,859,510Change in unrealized gain (loss) on currency spots contracts 123 5
Net gain (loss) on investments 9,739,850 6,311,721Securities lending 127 226Net realized and change in unrealized gain (loss) on foreign exchange of
cash 57,028 –Other income 2,734 2,998
Total income (loss) 9,799,739 6,314,945
EXPENSESManagement fees (note 5) 500,057 351,181Fixed administration fees (note 6) 106,284 –Independent Review Committee fees 91 131Interest expense and bank overdraft charges 97 146Foreign withholding taxes/tax reclaims 189,209 129,032Audit fees – 1,023Custodian fees – 3,291Filing fees – 5,118Legal fees – 279Unitholder administration costs – 37,014Unitholder reporting costs – 7,630Harmonized Sales Tax/Goods and Services Tax 67,801 44,128Transaction costs 2,487 1,470
Total expenses 866,026 580,443Expenses absorbed by the Manager – (1,489)
Net expenses 866,026 578,954
Increase (decrease) in net assets attributable to holders of redeemable unitsfrom operations $8,933,713 $5,735,991
INCREASE (DECREASE) IN NET ASSETS ATTRIBUTABLE TO HOLDERS OFREDEEMABLE UNITS FROM OPERATIONS PER SERIES
Series A $8,932,118 $5,733,722Series D $ (9) $ –Series F $ 1,604 $ 2,269
INCREASE (DECREASE) IN NET ASSETS ATTRIBUTABLE TO HOLDERS OFREDEEMABLE UNITS FROM OPERATIONS PER UNIT†
Series A $ 1.65 $ 1.20Series D $ (0.04) $ –Series F $ 1.48 $ 1.91
WEIGHTED AVERAGE NUMBER OF UNITS PER SERIESSeries A 5,417,372 4,773,891Series D 254 –Series F 1,084 1,190
† The increase (decrease) in net assets attributable to holders of redeemable units fromoperations per unit is calculated by dividing the increase (decrease) in net assetsattributable to holders of redeemable units from operations per series by theweighted average number of units per series.
The accompanying notes are an integral part of the financial statements.
256
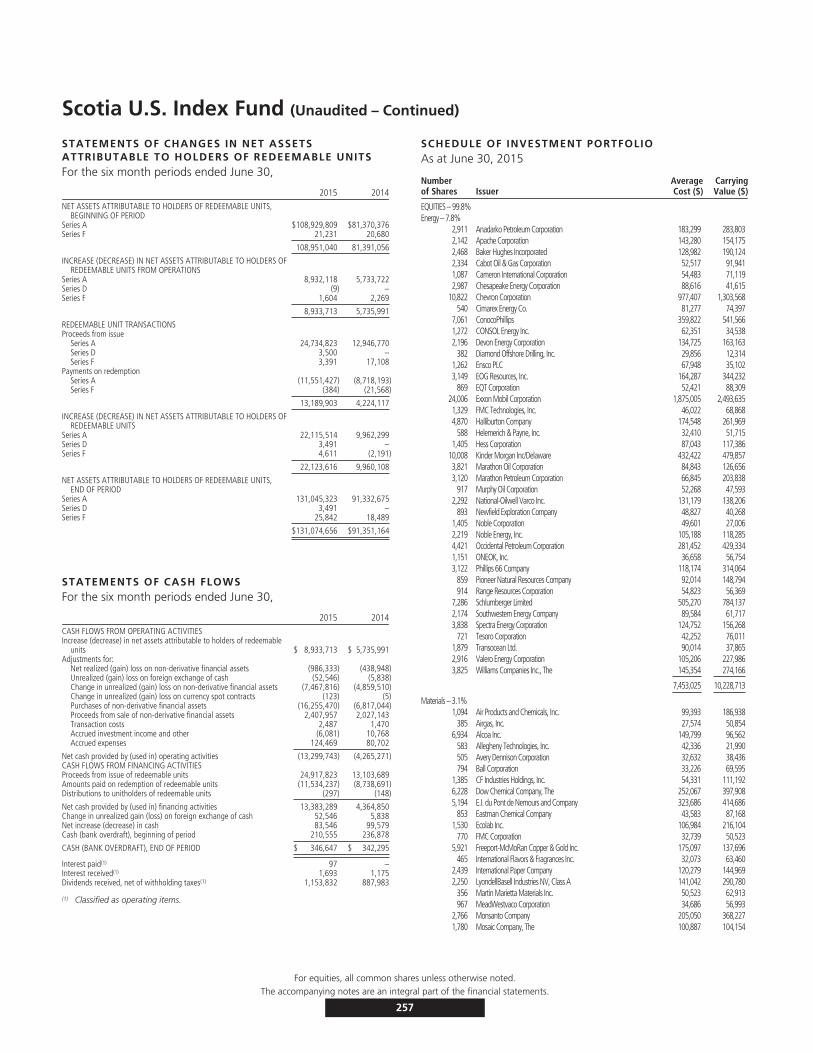
Scotia U.S. Index Fund (Unaudited – Continued)
STATEMENTS OF CHANGES IN NET ASSETSATTRIBUTABLE TO HOLDERS OF REDEEMABLE UNITSFor the six month periods ended June 30,
2015 2014NET ASSETS ATTRIBUTABLE TO HOLDERS OF REDEEMABLE UNITS,
BEGINNING OF PERIODSeries A $108,929,809 $81,370,376Series F 21,231 20,680
108,951,040 81,391,056
INCREASE (DECREASE) IN NET ASSETS ATTRIBUTABLE TO HOLDERS OFREDEEMABLE UNITS FROM OPERATIONS
Series A 8,932,118 5,733,722Series D (9) –Series F 1,604 2,269
8,933,713 5,735,991
REDEEMABLE UNIT TRANSACTIONSProceeds from issue
Series A 24,734,823 12,946,770Series D 3,500 –Series F 3,391 17,108
Payments on redemptionSeries A (11,551,427) (8,718,193)Series F (384) (21,568)
13,189,903 4,224,117
INCREASE (DECREASE) IN NET ASSETS ATTRIBUTABLE TO HOLDERS OFREDEEMABLE UNITS
Series A 22,115,514 9,962,299Series D 3,491 –Series F 4,611 (2,191)
22,123,616 9,960,108
NET ASSETS ATTRIBUTABLE TO HOLDERS OF REDEEMABLE UNITS,END OF PERIOD
Series A 131,045,323 91,332,675Series D 3,491 –Series F 25,842 18,489
$131,074,656 $91,351,164
STATEMENTS OF CASH FLOWSFor the six month periods ended June 30,
2015 2014CASH FLOWS FROM OPERATING ACTIVITIESIncrease (decrease) in net assets attributable to holders of redeemable
units $ 8,933,713 $ 5,735,991Adjustments for:
Net realized (gain) loss on non-derivative financial assets (986,333) (438,948)Unrealized (gain) loss on foreign exchange of cash (52,546) (5,838)Change in unrealized (gain) loss on non-derivative financial assets (7,467,816) (4,859,510)Change in unrealized (gain) loss on currency spot contracts (123) (5)Purchases of non-derivative financial assets (16,255,470) (6,817,044)Proceeds from sale of non-derivative financial assets 2,407,957 2,027,143Transaction costs 2,487 1,470Accrued investment income and other (6,081) 10,768Accrued expenses 124,469 80,702
Net cash provided by (used in) operating activities (13,299,743) (4,265,271)CASH FLOWS FROM FINANCING ACTIVITIESProceeds from issue of redeemable units 24,917,823 13,103,689Amounts paid on redemption of redeemable units (11,534,237) (8,738,691)Distributions to unitholders of redeemable units (297) (148)
Net cash provided by (used in) financing activities 13,383,289 4,364,850Change in unrealized gain (loss) on foreign exchange of cash 52,546 5,838Net increase (decrease) in cash 83,546 99,579Cash (bank overdraft), beginning of period 210,555 236,878
CASH (BANK OVERDRAFT), END OF PERIOD $ 346,647 $ 342,295
Interest paid(1) 97 –Interest received(1) 1,693 1,175Dividends received, net of withholding taxes(1) 1,153,832 887,983
(1) Classified as operating items.
SCHEDULE OF INVESTMENT PORTFOLIOAs at June 30, 2015
Numberof Shares Issuer
AverageCost ($)
CarryingValue ($)
EQUITIES – 99.8%Energy – 7.8%
2,911 Anadarko Petroleum Corporation 183,299 283,8032,142 Apache Corporation 143,280 154,1752,468 Baker Hughes Incorporated 128,982 190,1242,334 Cabot Oil & Gas Corporation 52,517 91,9411,087 Cameron International Corporation 54,483 71,1192,987 Chesapeake Energy Corporation 88,616 41,615
10,822 Chevron Corporation 977,407 1,303,568540 Cimarex Energy Co. 81,277 74,397
7,061 ConocoPhillips 359,822 541,5661,272 CONSOL Energy Inc. 62,351 34,5382,196 Devon Energy Corporation 134,725 163,163
382 Diamond Offshore Drilling, Inc. 29,856 12,3141,262 Ensco PLC 67,948 35,1023,149 EOG Resources, Inc. 164,287 344,232
869 EQT Corporation 52,421 88,30924,006 Exxon Mobil Corporation 1,875,005 2,493,6351,329 FMC Technologies, Inc. 46,022 68,8684,870 Halliburton Company 174,548 261,969
588 Helemerich & Payne, Inc. 32,410 51,7151,405 Hess Corporation 87,043 117,386
10,008 Kinder Morgan Inc/Delaware 432,422 479,8573,821 Marathon Oil Corporation 84,843 126,6563,120 Marathon Petroleum Corporation 66,845 203,838
917 Murphy Oil Corporation 52,268 47,5932,292 National-Oilwell Varco Inc. 131,179 138,206
893 Newfield Exploration Company 48,827 40,2681,405 Noble Corporation 49,601 27,0062,219 Noble Energy, Inc. 105,188 118,2854,421 Occidental Petroleum Corporation 281,452 429,3341,151 ONEOK, Inc. 36,658 56,7543,122 Phillips 66 Company 118,174 314,064
859 Pioneer Natural Resources Company 92,014 148,794914 Range Resources Corporation 54,823 56,369
7,286 Schlumberger Limited 505,270 784,1372,174 Southwestern Energy Company 89,584 61,7173,838 Spectra Energy Corporation 124,752 156,268
721 Tesoro Corporation 42,252 76,0111,879 Transocean Ltd. 90,014 37,8652,916 Valero Energy Corporation 105,206 227,9863,825 Williams Companies Inc., The 145,354 274,166
7,453,025 10,228,713
Materials – 3.1%1,094 Air Products and Chemicals, Inc. 99,393 186,938
385 Airgas, Inc. 27,574 50,8546,934 Alcoa Inc. 149,799 96,562
583 Allegheny Technologies, Inc. 42,336 21,990505 Avery Dennison Corporation 32,632 38,436794 Ball Corporation 33,226 69,595
1,385 CF Industries Holdings, Inc. 54,331 111,1926,228 Dow Chemical Company, The 252,067 397,9085,194 E.I. du Pont de Nemours and Company 323,686 414,686
853 Eastman Chemical Company 43,583 87,1681,530 Ecolab Inc. 106,984 216,104
770 FMC Corporation 32,739 50,5235,921 Freeport-McMoRan Copper & Gold Inc. 175,097 137,696
465 International Flavors & Fragrances Inc. 32,073 63,4602,439 International Paper Company 120,279 144,9692,250 LyondellBasell Industries NV, Class A 141,042 290,780
356 Martin Marietta Materials Inc. 50,523 62,913967 MeadWestvaco Corporation 34,686 56,993
2,766 Monsanto Company 205,050 368,2271,780 Mosaic Company, The 100,887 104,154
For equities, all common shares unless otherwise noted.The accompanying notes are an integral part of the financial statements.
257
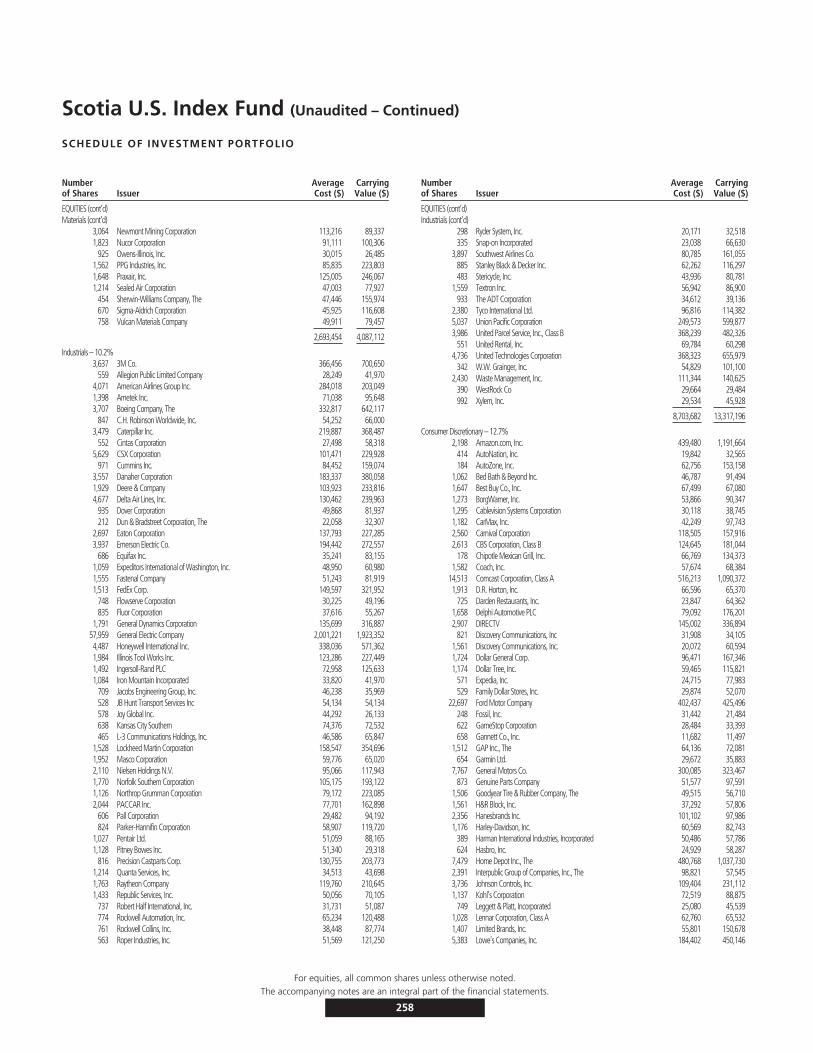
Scotia U.S. Index Fund (Unaudited – Continued)
SCHEDULE OF INVESTMENT PORTFOLIO
Numberof Shares Issuer
AverageCost ($)
CarryingValue ($)
EQUITIES (cont’d)Materials (cont’d)
3,064 Newmont Mining Corporation 113,216 89,3371,823 Nucor Corporation 91,111 100,306
925 Owens-Illinois, Inc. 30,015 26,4851,562 PPG Industries, Inc. 85,835 223,8031,648 Praxair, Inc. 125,005 246,0671,214 Sealed Air Corporation 47,003 77,927
454 Sherwin-Williams Company, The 47,446 155,974670 Sigma-Aldrich Corporation 45,925 116,608758 Vulcan Materials Company 49,911 79,457
2,693,454 4,087,112
Industrials – 10.2%3,637 3M Co. 366,456 700,650
559 Allegion Public Limited Company 28,249 41,9704,071 American Airlines Group Inc. 284,018 203,0491,398 Ametek Inc. 71,038 95,6483,707 Boeing Company, The 332,817 642,117
847 C.H. Robinson Worldwide, Inc. 54,252 66,0003,479 Caterpillar Inc. 219,887 368,487
552 Cintas Corporation 27,498 58,3185,629 CSX Corporation 101,471 229,928
971 Cummins Inc. 84,452 159,0743,557 Danaher Corporation 183,337 380,0581,929 Deere & Company 103,923 233,8164,677 Delta Air Lines, Inc. 130,462 239,963
935 Dover Corporation 49,868 81,937212 Dun & Bradstreet Corporation, The 22,058 32,307
2,697 Eaton Corporation 137,793 227,2853,937 Emerson Electric Co. 194,442 272,557
686 Equifax Inc. 35,241 83,1551,059 Expeditors International of Washington, Inc. 48,950 60,9801,555 Fastenal Company 51,243 81,9191,513 FedEx Corp. 149,597 321,952
748 Flowserve Corporation 30,225 49,196835 Fluor Corporation 37,616 55,267
1,791 General Dynamics Corporation 135,699 316,88757,959 General Electric Company 2,001,221 1,923,3524,487 Honeywell International Inc. 338,036 571,3621,984 Illinois Tool Works Inc. 123,286 227,4491,492 Ingersoll-Rand PLC 72,958 125,6331,084 Iron Mountain Incorporated 33,820 41,970
709 Jacobs Engineering Group, Inc. 46,238 35,969528 JB Hunt Transport Services Inc 54,134 54,134578 Joy Global Inc. 44,292 26,133638 Kansas City Southern 74,376 72,532465 L-3 Communications Holdings, Inc. 46,586 65,847
1,528 Lockheed Martin Corporation 158,547 354,6961,952 Masco Corporation 59,776 65,0202,110 Nielsen Holdings N.V. 95,066 117,9431,770 Norfolk Southern Corporation 105,175 193,1221,126 Northrop Grumman Corporation 79,172 223,0852,044 PACCAR Inc. 77,701 162,898
606 Pall Corporation 29,482 94,192824 Parker-Hannifin Corporation 58,907 119,720
1,027 Pentair Ltd. 51,059 88,1651,128 Pitney Bowes Inc. 51,340 29,318
816 Precision Castparts Corp. 130,755 203,7731,214 Quanta Services, Inc. 34,513 43,6981,763 Raytheon Company 119,760 210,6451,433 Republic Services, Inc. 50,056 70,105
737 Robert Half International, Inc. 31,731 51,087774 Rockwell Automation, Inc. 65,234 120,488761 Rockwell Collins, Inc. 38,448 87,774563 Roper Industries, Inc. 51,569 121,250
Numberof Shares Issuer
AverageCost ($)
CarryingValue ($)
EQUITIES (cont’d)Industrials (cont’d)
298 Ryder System, Inc. 20,171 32,518335 Snap-on Incorporated 23,038 66,630
3,897 Southwest Airlines Co. 80,785 161,055885 Stanley Black & Decker Inc. 62,262 116,297483 Stericycle, Inc. 43,936 80,781
1,559 Textron Inc. 56,942 86,900933 The ADT Corporation 34,612 39,136
2,380 Tyco International Ltd. 96,816 114,3825,037 Union Pacific Corporation 249,573 599,8773,986 United Parcel Service, Inc., Class B 368,239 482,326
551 United Rental, Inc. 69,784 60,2984,736 United Technologies Corporation 368,323 655,979
342 W.W. Grainger, Inc. 54,829 101,1002,430 Waste Management, Inc. 111,344 140,625
390 WestRock Co 29,664 29,484992 Xylem, Inc. 29,534 45,928
8,703,682 13,317,196
Consumer Discretionary – 12.7%2,198 Amazon.com, Inc. 439,480 1,191,664
414 AutoNation, Inc. 19,842 32,565184 AutoZone, Inc. 62,756 153,158
1,062 Bed Bath & Beyond Inc. 46,787 91,4941,647 Best Buy Co., Inc. 67,499 67,0801,273 BorgWarner, Inc. 53,866 90,3471,295 Cablevision Systems Corporation 30,118 38,7451,182 CarMax, Inc. 42,249 97,7432,560 Carnival Corporation 118,505 157,9162,613 CBS Corporation, Class B 124,645 181,044
178 Chipotle Mexican Grill, Inc. 66,769 134,3731,582 Coach, Inc. 57,674 68,384
14,513 Comcast Corporation, Class A 516,213 1,090,3721,913 D.R. Horton, Inc. 66,596 65,370
725 Darden Restaurants, Inc. 23,847 64,3621,658 Delphi Automotive PLC 79,092 176,2012,907 DIRECTV 145,002 336,894
821 Discovery Communications, Inc 31,908 34,1051,561 Discovery Communications, Inc. 20,072 60,5941,724 Dollar General Corp. 96,471 167,3461,174 Dollar Tree, Inc. 59,465 115,821
571 Expedia, Inc. 24,715 77,983529 Family Dollar Stores, Inc. 29,874 52,070
22,697 Ford Motor Company 402,437 425,496248 Fossil, Inc. 31,442 21,484622 GameStop Corporation 28,484 33,393658 Gannett Co., Inc. 11,682 11,497
1,512 GAP Inc., The 64,136 72,081654 Garmin Ltd. 29,672 35,883
7,767 General Motors Co. 300,085 323,467873 Genuine Parts Company 51,577 97,591
1,506 Goodyear Tire & Rubber Company, The 49,515 56,7101,561 H&R Block, Inc. 37,292 57,8062,356 Hanesbrands Inc. 101,102 97,9861,176 Harley-Davidson, Inc. 60,569 82,743
389 Harman International Industries, Incorporated 50,486 57,786624 Hasbro, Inc. 24,929 58,287
7,479 Home Depot Inc., The 480,768 1,037,7302,391 Interpublic Group of Companies, Inc., The 98,821 57,5453,736 Johnson Controls, Inc. 109,404 231,1121,137 Kohl’s Corporation 72,519 88,875
749 Leggett & Platt, Incorporated 25,080 45,5391,028 Lennar Corporation, Class A 62,760 65,5321,407 Limited Brands, Inc. 55,801 150,6785,383 Lowe’s Companies, Inc. 184,402 450,146
For equities, all common shares unless otherwise noted.The accompanying notes are an integral part of the financial statements.
258
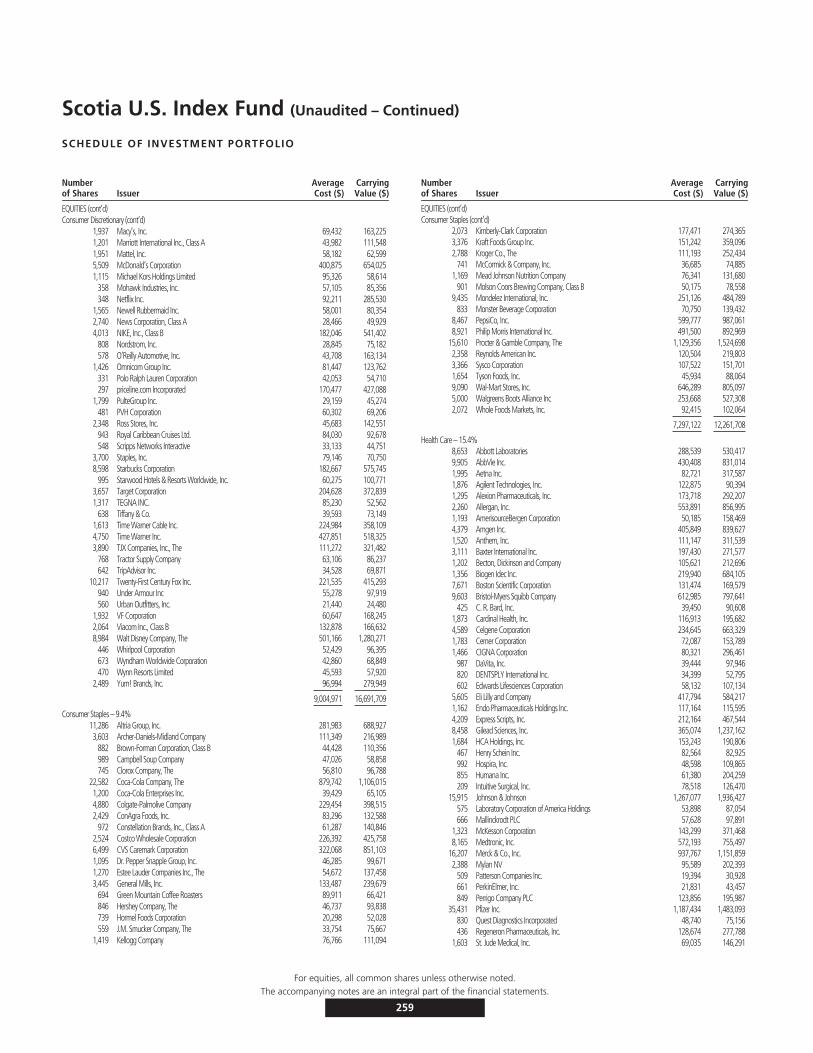
Scotia U.S. Index Fund (Unaudited – Continued)
SCHEDULE OF INVESTMENT PORTFOLIO
Numberof Shares Issuer
AverageCost ($)
CarryingValue ($)
EQUITIES (cont’d)Consumer Discretionary (cont’d)
1,937 Macy’s, Inc. 69,432 163,2251,201 Marriott International Inc., Class A 43,982 111,5481,951 Mattel, Inc. 58,182 62,5995,509 McDonald’s Corporation 400,875 654,0251,115 Michael Kors Holdings Limited 95,326 58,614
358 Mohawk Industries, Inc. 57,105 85,356348 Netflix Inc. 92,211 285,530
1,565 Newell Rubbermaid Inc. 58,001 80,3542,740 News Corporation, Class A 28,466 49,9294,013 NIKE, Inc., Class B 182,046 541,402
808 Nordstrom, Inc. 28,845 75,182578 O’Reilly Automotive, Inc. 43,708 163,134
1,426 Omnicom Group Inc. 81,447 123,762331 Polo Ralph Lauren Corporation 42,053 54,710297 priceline.com Incorporated 170,477 427,088
1,799 PulteGroup Inc. 29,159 45,274481 PVH Corporation 60,302 69,206
2,348 Ross Stores, Inc. 45,683 142,551943 Royal Caribbean Cruises Ltd. 84,030 92,678548 Scripps Networks Interactive 33,133 44,751
3,700 Staples, Inc. 79,146 70,7508,598 Starbucks Corporation 182,667 575,745
995 Starwood Hotels & Resorts Worldwide, Inc. 60,275 100,7713,657 Target Corporation 204,628 372,8391,317 TEGNA INC. 85,230 52,562
638 Tiffany & Co. 39,593 73,1491,613 Time Warner Cable Inc. 224,984 358,1094,750 Time Warner Inc. 427,851 518,3253,890 TJX Companies, Inc., The 111,272 321,482
768 Tractor Supply Company 63,106 86,237642 TripAdvisor Inc. 34,528 69,871
10,217 Twenty-First Century Fox Inc. 221,535 415,293940 Under Armour Inc 55,278 97,919560 Urban Outfitters, Inc. 21,440 24,480
1,932 VF Corporation 60,647 168,2452,064 Viacom Inc., Class B 132,878 166,6328,984 Walt Disney Company, The 501,166 1,280,271
446 Whirlpool Corporation 52,429 96,395673 Wyndham Worldwide Corporation 42,860 68,849470 Wynn Resorts Limited 45,593 57,920
2,489 Yum! Brands, Inc. 96,994 279,949
9,004,971 16,691,709
Consumer Staples – 9.4%11,286 Altria Group, Inc. 281,983 688,9273,603 Archer-Daniels-Midland Company 111,349 216,989
882 Brown-Forman Corporation, Class B 44,428 110,356989 Campbell Soup Company 47,026 58,858745 Clorox Company, The 56,810 96,788
22,582 Coca-Cola Company, The 879,742 1,106,0151,200 Coca-Cola Enterprises Inc. 39,429 65,1054,880 Colgate-Palmolive Company 229,454 398,5152,429 ConAgra Foods, Inc. 83,296 132,588
972 Constellation Brands, Inc., Class A 61,287 140,8462,524 Costco Wholesale Corporation 226,392 425,7586,499 CVS Caremark Corporation 322,068 851,1031,095 Dr. Pepper Snapple Group, Inc. 46,285 99,6711,270 Estee Lauder Companies Inc., The 54,672 137,4583,445 General Mills, Inc. 133,487 239,679
694 Green Mountain Coffee Roasters 89,911 66,421846 Hershey Company, The 46,737 93,838739 Hormel Foods Corporation 20,298 52,028559 J.M. Smucker Company, The 33,754 75,667
1,419 Kellogg Company 76,766 111,094
Numberof Shares Issuer
AverageCost ($)
CarryingValue ($)
EQUITIES (cont’d)Consumer Staples (cont’d)
2,073 Kimberly-Clark Corporation 177,471 274,3653,376 Kraft Foods Group Inc. 151,242 359,0962,788 Kroger Co., The 111,193 252,434
741 McCormick & Company, Inc. 36,685 74,8851,169 Mead Johnson Nutrition Company 76,341 131,680
901 Molson Coors Brewing Company, Class B 50,175 78,5589,435 Mondelez International, Inc. 251,126 484,789
833 Monster Beverage Corporation 70,750 139,4328,467 PepsiCo, Inc. 599,777 987,0618,921 Philip Morris International Inc. 491,500 892,969
15,610 Procter & Gamble Company, The 1,129,356 1,524,6982,358 Reynolds American Inc. 120,504 219,8033,366 Sysco Corporation 107,522 151,7011,654 Tyson Foods, Inc. 45,934 88,0649,090 Wal-Mart Stores, Inc. 646,289 805,0975,000 Walgreens Boots Alliance Inc 253,668 527,3082,072 Whole Foods Markets, Inc. 92,415 102,064
7,297,122 12,261,708
Health Care – 15.4%8,653 Abbott Laboratories 288,539 530,4179,905 AbbVie Inc. 430,408 831,0141,995 Aetna Inc. 82,721 317,5871,876 Agilent Technologies, Inc. 122,875 90,3941,295 Alexion Pharmaceuticals, Inc. 173,718 292,2072,260 Allergan, Inc. 553,891 856,9951,193 AmerisourceBergen Corporation 50,185 158,4694,379 Amgen Inc. 405,849 839,6271,520 Anthem, Inc. 111,147 311,5393,111 Baxter International Inc. 197,430 271,5771,202 Becton, Dickinson and Company 105,621 212,6961,356 Biogen Idec Inc. 219,940 684,1057,671 Boston Scientific Corporation 131,474 169,5799,603 Bristol-Myers Squibb Company 612,985 797,641
425 C. R. Bard, Inc. 39,450 90,6081,873 Cardinal Health, Inc. 116,913 195,6824,589 Celgene Corporation 234,645 663,3291,783 Cerner Corporation 72,087 153,7891,466 CIGNA Corporation 80,321 296,461
987 DaVita, Inc. 39,444 97,946820 DENTSPLY International Inc. 34,399 52,795602 Edwards Lifesciences Corporation 58,132 107,134
5,605 Eli Lilly and Company 417,794 584,2171,162 Endo Pharmaceuticals Holdings Inc. 117,164 115,5954,209 Express Scripts, Inc. 212,164 467,5448,458 Gilead Sciences, Inc. 365,074 1,237,1621,684 HCA Holdings, Inc. 153,243 190,806
467 Henry Schein Inc. 82,564 82,925992 Hospira, Inc. 48,598 109,865855 Humana Inc. 61,380 204,259209 Intuitive Surgical, Inc. 78,518 126,470
15,915 Johnson & Johnson 1,267,077 1,936,427575 Laboratory Corporation of America Holdings 53,898 87,054666 Mallinckrodt PLC 57,628 97,891
1,323 McKesson Corporation 143,299 371,4688,165 Medtronic, Inc. 572,193 755,497
16,207 Merck & Co., Inc. 937,767 1,151,8592,388 Mylan NV 95,589 202,393
509 Patterson Companies Inc. 19,394 30,928661 PerkinElmer, Inc. 21,831 43,457849 Perrigo Company PLC 123,856 195,987
35,431 Pfizer Inc. 1,187,434 1,483,093830 Quest Diagnostics Incorporated 48,740 75,156436 Regeneron Pharmaceuticals, Inc. 128,674 277,788
1,603 St. Jude Medical, Inc. 69,035 146,291
For equities, all common shares unless otherwise noted.The accompanying notes are an integral part of the financial statements.
259
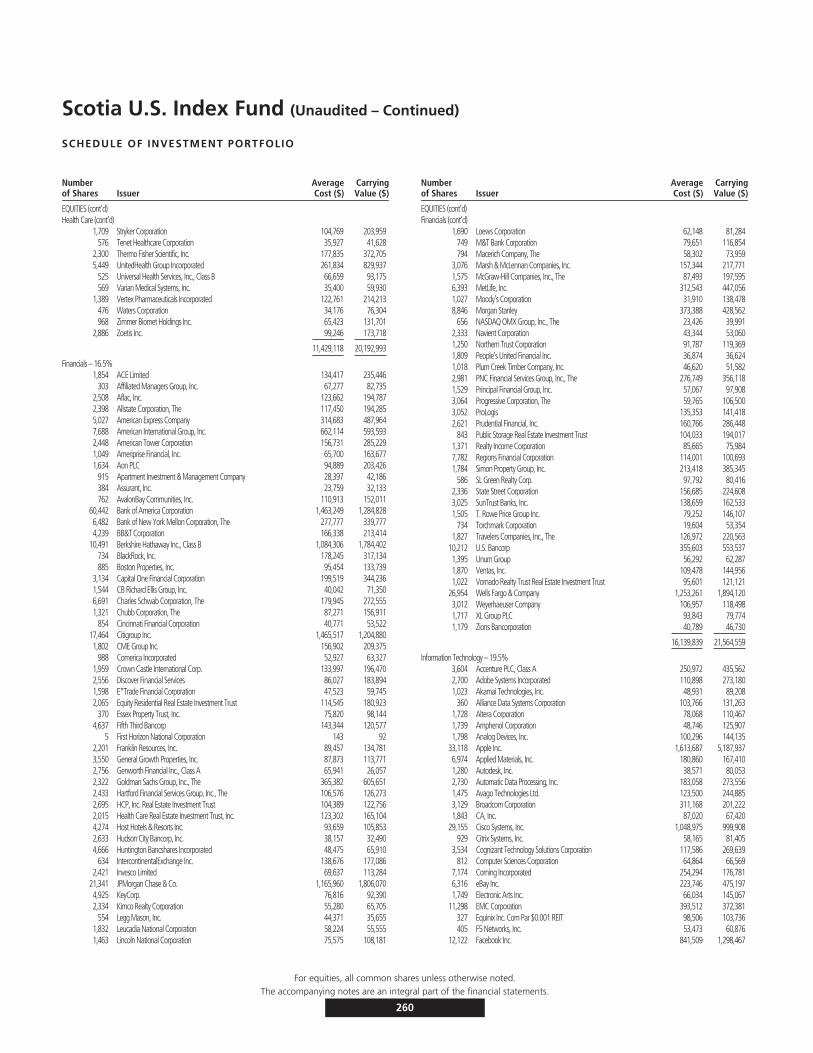
Scotia U.S. Index Fund (Unaudited – Continued)
SCHEDULE OF INVESTMENT PORTFOLIO
Numberof Shares Issuer
AverageCost ($)
CarryingValue ($)
EQUITIES (cont’d)Health Care (cont’d)
1,709 Stryker Corporation 104,769 203,959576 Tenet Healthcare Corporation 35,927 41,628
2,300 Thermo Fisher Scientific, Inc. 177,835 372,7055,449 UnitedHealth Group Incorporated 261,834 829,937
525 Universal Health Services, Inc., Class B 66,659 93,175569 Varian Medical Systems, Inc. 35,400 59,930
1,389 Vertex Pharmaceuticals Incorporated 122,761 214,213476 Waters Corporation 34,176 76,304968 Zimmer Biomet Holdings Inc. 65,423 131,701
2,886 Zoetis Inc. 99,246 173,718
11,429,118 20,192,993
Financials – 16.5%1,854 ACE Limited 134,417 235,446
303 Affiliated Managers Group, Inc. 67,277 82,7352,508 Aflac, Inc. 123,662 194,7872,398 Allstate Corporation, The 117,450 194,2855,027 American Express Company 314,683 487,9647,688 American International Group, Inc. 662,114 593,5932,448 American Tower Corporation 156,731 285,2291,049 Ameriprise Financial, Inc. 65,700 163,6771,634 Aon PLC 94,889 203,426
915 Apartment Investment & Management Company 28,397 42,186384 Assurant, Inc. 23,759 32,133762 AvalonBay Communities, Inc. 110,913 152,011
60,442 Bank of America Corporation 1,463,249 1,284,8286,482 Bank of New York Mellon Corporation, The 277,777 339,7774,239 BB&T Corporation 166,338 213,414
10,491 Berkshire Hathaway Inc., Class B 1,084,306 1,784,402734 BlackRock, Inc. 178,245 317,134885 Boston Properties, Inc. 95,454 133,739
3,134 Capital One Financial Corporation 199,519 344,2361,544 CB Richard Ellis Group, Inc. 40,042 71,3506,691 Charles Schwab Corporation, The 179,945 272,5551,321 Chubb Corporation, The 87,271 156,911
854 Cincinnati Financial Corporation 40,771 53,52217,464 Citigroup Inc. 1,465,517 1,204,8801,802 CME Group Inc. 156,902 209,375
988 Comerica Incorporated 52,927 63,3271,959 Crown Castle International Corp. 133,997 196,4702,556 Discover Financial Services 86,027 183,8941,598 E*Trade Financial Corporation 47,523 59,7452,065 Equity Residential Real Estate Investment Trust 114,545 180,923
370 Essex Property Trust, Inc. 75,820 98,1444,637 Fifth Third Bancorp 143,344 120,577
5 First Horizon National Corporation 143 922,201 Franklin Resources, Inc. 89,457 134,7813,550 General Growth Properties, Inc. 87,873 113,7712,756 Genworth Financial Inc., Class A 65,941 26,0572,322 Goldman Sachs Group, Inc., The 365,382 605,6512,433 Hartford Financial Services Group, Inc., The 106,576 126,2732,695 HCP, Inc. Real Estate Investment Trust 104,389 122,7562,015 Health Care Real Estate Investment Trust, Inc. 123,302 165,1044,274 Host Hotels & Resorts Inc. 93,659 105,8532,633 Hudson City Bancorp, Inc. 38,157 32,4904,666 Huntington Bancshares Incorporated 48,475 65,910
634 IntercontinentalExchange Inc. 138,676 177,0862,421 Invesco Limited 69,637 113,284
21,341 JPMorgan Chase & Co. 1,165,960 1,806,0704,925 KeyCorp. 76,816 92,3902,334 Kimco Realty Corporation 55,280 65,705
554 Legg Mason, Inc. 44,371 35,6551,832 Leucadia National Corporation 58,224 55,5551,463 Lincoln National Corporation 75,575 108,181
Numberof Shares Issuer
AverageCost ($)
CarryingValue ($)
EQUITIES (cont’d)Financials (cont’d)
1,690 Loews Corporation 62,148 81,284749 M&T Bank Corporation 79,651 116,854794 Macerich Company, The 58,302 73,959
3,076 Marsh & McLennan Companies, Inc. 157,344 217,7711,575 McGraw-Hill Companies, Inc., The 87,493 197,5956,393 MetLife, Inc. 312,543 447,0561,027 Moody’s Corporation 31,910 138,4788,846 Morgan Stanley 373,388 428,562
656 NASDAQ OMX Group, Inc., The 23,426 39,9912,333 Navient Corporation 43,344 53,0601,250 Northern Trust Corporation 91,787 119,3691,809 People’s United Financial Inc. 36,874 36,6241,018 Plum Creek Timber Company, Inc. 46,620 51,5822,981 PNC Financial Services Group, Inc., The 276,749 356,1181,529 Principal Financial Group, Inc. 57,067 97,9083,064 Progressive Corporation, The 59,765 106,5003,052 ProLogis 135,353 141,4182,621 Prudential Financial, Inc. 160,766 286,448
843 Public Storage Real Estate Investment Trust 104,033 194,0171,371 Realty Income Corporation 85,665 75,9847,782 Regions Financial Corporation 114,001 100,6931,784 Simon Property Group, Inc. 213,418 385,345
586 SL Green Realty Corp. 97,792 80,4162,336 State Street Corporation 156,685 224,6083,025 SunTrust Banks, Inc. 138,659 162,5331,505 T. Rowe Price Group Inc. 79,252 146,107
734 Torchmark Corporation 19,604 53,3541,827 Travelers Companies, Inc., The 126,972 220,563
10,212 U.S. Bancorp 355,603 553,5371,395 Unum Group 56,292 62,2871,870 Ventas, Inc. 109,478 144,9561,022 Vornado Realty Trust Real Estate Investment Trust 95,601 121,121
26,954 Wells Fargo & Company 1,253,261 1,894,1203,012 Weyerhaeuser Company 106,957 118,4981,717 XL Group PLC 93,843 79,7741,179 Zions Bancorporation 40,789 46,730
16,139,839 21,564,559
Information Technology – 19.5%3,604 Accenture PLC, Class A 250,972 435,5622,700 Adobe Systems Incorporated 110,898 273,1801,023 Akamai Technologies, Inc. 48,931 89,208
360 Alliance Data Systems Corporation 103,766 131,2631,728 Altera Corporation 78,068 110,4671,739 Amphenol Corporation 48,746 125,9071,798 Analog Devices, Inc. 100,296 144,135
33,118 Apple Inc. 1,613,687 5,187,9376,974 Applied Materials, Inc. 180,860 167,4101,280 Autodesk, Inc. 38,571 80,0532,730 Automatic Data Processing, Inc. 183,058 273,5561,475 Avago Technologies Ltd. 123,500 244,8853,129 Broadcom Corporation 311,168 201,2221,843 CA, Inc. 87,020 67,420
29,155 Cisco Systems, Inc. 1,048,975 999,908929 Citrix Systems, Inc. 58,165 81,405
3,534 Cognizant Technology Solutions Corporation 117,586 269,639812 Computer Sciences Corporation 64,864 66,569
7,174 Corning Incorporated 254,294 176,7816,316 eBay Inc. 223,746 475,1971,749 Electronic Arts Inc. 66,034 145,067
11,298 EMC Corporation 393,512 372,381327 Equinix Inc. Com Par $0.001 REIT 98,506 103,736405 F5 Networks, Inc. 53,473 60,876
12,122 Facebook Inc. 841,509 1,298,467
For equities, all common shares unless otherwise noted.The accompanying notes are an integral part of the financial statements.
260
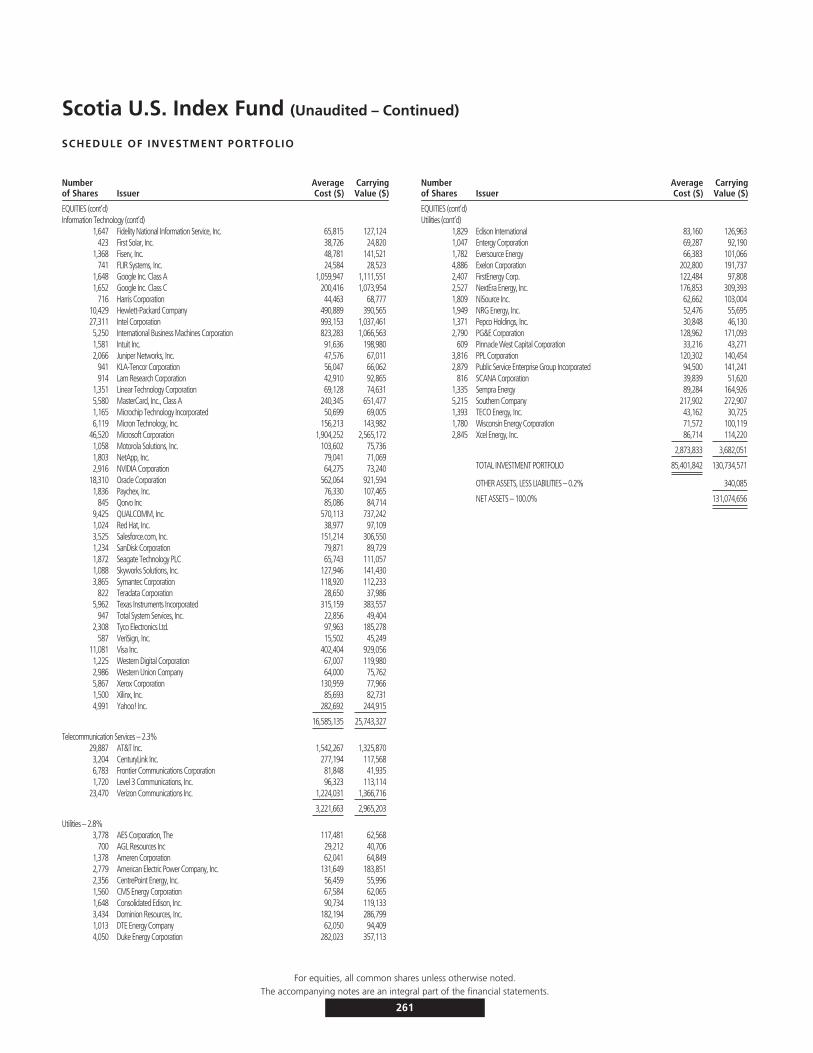
Scotia U.S. Index Fund (Unaudited – Continued)
SCHEDULE OF INVESTMENT PORTFOLIO
Numberof Shares Issuer
AverageCost ($)
CarryingValue ($)
EQUITIES (cont’d)Information Technology (cont’d)
1,647 Fidelity National Information Service, Inc. 65,815 127,124423 First Solar, Inc. 38,726 24,820
1,368 Fiserv, Inc. 48,781 141,521741 FLIR Systems, Inc. 24,584 28,523
1,648 Google Inc. Class A 1,059,947 1,111,5511,652 Google Inc. Class C 200,416 1,073,954
716 Harris Corporation 44,463 68,77710,429 Hewlett-Packard Company 490,889 390,56527,311 Intel Corporation 993,153 1,037,4615,250 International Business Machines Corporation 823,283 1,066,5631,581 Intuit Inc. 91,636 198,9802,066 Juniper Networks, Inc. 47,576 67,011
941 KLA-Tencor Corporation 56,047 66,062914 Lam Research Corporation 42,910 92,865
1,351 Linear Technology Corporation 69,128 74,6315,580 MasterCard, Inc., Class A 240,345 651,4771,165 Microchip Technology Incorporated 50,699 69,0056,119 Micron Technology, Inc. 156,213 143,982
46,520 Microsoft Corporation 1,904,252 2,565,1721,058 Motorola Solutions, Inc. 103,602 75,7361,803 NetApp, Inc. 79,041 71,0692,916 NVIDIA Corporation 64,275 73,240
18,310 Oracle Corporation 562,064 921,5941,836 Paychex, Inc. 76,330 107,465
845 Qorvo Inc 85,086 84,7149,425 QUALCOMM, Inc. 570,113 737,2421,024 Red Hat, Inc. 38,977 97,1093,525 Salesforce.com, Inc. 151,214 306,5501,234 SanDisk Corporation 79,871 89,7291,872 Seagate Technology PLC 65,743 111,0571,088 Skyworks Solutions, Inc. 127,946 141,4303,865 Symantec Corporation 118,920 112,233
822 Teradata Corporation 28,650 37,9865,962 Texas Instruments Incorporated 315,159 383,557
947 Total System Services, Inc. 22,856 49,4042,308 Tyco Electronics Ltd. 97,963 185,278
587 VeriSign, Inc. 15,502 45,24911,081 Visa Inc. 402,404 929,0561,225 Western Digital Corporation 67,007 119,9802,986 Western Union Company 64,000 75,7625,867 Xerox Corporation 130,959 77,9661,500 Xilinx, Inc. 85,693 82,7314,991 Yahoo! Inc. 282,692 244,915
16,585,135 25,743,327
Telecommunication Services – 2.3%29,887 AT&T Inc. 1,542,267 1,325,8703,204 CenturyLink Inc. 277,194 117,5686,783 Frontier Communications Corporation 81,848 41,9351,720 Level 3 Communications, Inc. 96,323 113,114
23,470 Verizon Communications Inc. 1,224,031 1,366,716
3,221,663 2,965,203
Utilities – 2.8%3,778 AES Corporation, The 117,481 62,568
700 AGL Resources Inc 29,212 40,7061,378 Ameren Corporation 62,041 64,8492,779 American Electric Power Company, Inc. 131,649 183,8512,356 CentrePoint Energy, Inc. 56,459 55,9961,560 CMS Energy Corporation 67,584 62,0651,648 Consolidated Edison, Inc. 90,734 119,1333,434 Dominion Resources, Inc. 182,194 286,7991,013 DTE Energy Company 62,050 94,4094,050 Duke Energy Corporation 282,023 357,113
Numberof Shares Issuer
AverageCost ($)
CarryingValue ($)
EQUITIES (cont’d)Utilities (cont’d)
1,829 Edison International 83,160 126,9631,047 Entergy Corporation 69,287 92,1901,782 Eversource Energy 66,383 101,0664,886 Exelon Corporation 202,800 191,7372,407 FirstEnergy Corp. 122,484 97,8082,527 NextEra Energy, Inc. 176,853 309,3931,809 NiSource Inc. 62,662 103,0041,949 NRG Energy, Inc. 52,476 55,6951,371 Pepco Holdings, Inc. 30,848 46,1302,790 PG&E Corporation 128,962 171,093
609 Pinnacle West Capital Corporation 33,216 43,2713,816 PPL Corporation 120,302 140,4542,879 Public Service Enterprise Group Incorporated 94,500 141,241
816 SCANA Corporation 39,839 51,6201,335 Sempra Energy 89,284 164,9265,215 Southern Company 217,902 272,9071,393 TECO Energy, Inc. 43,162 30,7251,780 Wisconsin Energy Corporation 71,572 100,1192,845 Xcel Energy, Inc. 86,714 114,220
2,873,833 3,682,051
TOTAL INVESTMENT PORTFOLIO 85,401,842 130,734,571
OTHER ASSETS, LESS LIABILITIES – 0.2% 340,085
NET ASSETS – 100.0% 131,074,656
For equities, all common shares unless otherwise noted.The accompanying notes are an integral part of the financial statements.
261
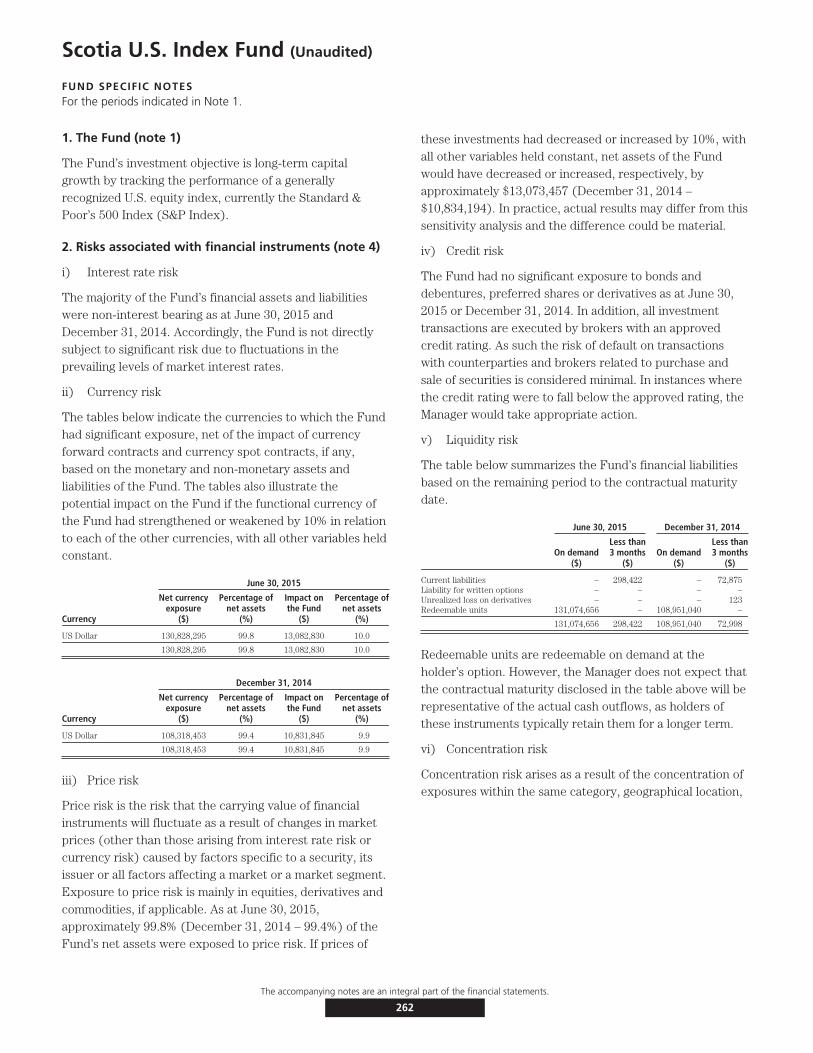
Scotia U.S. Index Fund (Unaudited)
FUND SPECIFIC NOTESFor the periods indicated in Note 1.
1. The Fund (note 1)
The Fund’s investment objective is long-term capitalgrowth by tracking the performance of a generallyrecognized U.S. equity index, currently the Standard &Poor’s 500 Index (S&P Index).
2. Risks associated with financial instruments (note 4)
i) Interest rate risk
The majority of the Fund’s financial assets and liabilitieswere non-interest bearing as at June 30, 2015 andDecember 31, 2014. Accordingly, the Fund is not directlysubject to significant risk due to fluctuations in theprevailing levels of market interest rates.
ii) Currency risk
The tables below indicate the currencies to which the Fundhad significant exposure, net of the impact of currencyforward contracts and currency spot contracts, if any,based on the monetary and non-monetary assets andliabilities of the Fund. The tables also illustrate thepotential impact on the Fund if the functional currency ofthe Fund had strengthened or weakened by 10% in relationto each of the other currencies, with all other variables heldconstant.
June 30, 2015
Currency
Net currencyexposure
($)
Percentage ofnet assets
(%)
Impact onthe Fund
($)
Percentage ofnet assets
(%)
US Dollar 130,828,295 99.8 13,082,830 10.0
130,828,295 99.8 13,082,830 10.0
December 31, 2014
Currency
Net currencyexposure
($)
Percentage ofnet assets
(%)
Impact onthe Fund
($)
Percentage ofnet assets
(%)
US Dollar 108,318,453 99.4 10,831,845 9.9
108,318,453 99.4 10,831,845 9.9
iii) Price risk
Price risk is the risk that the carrying value of financialinstruments will fluctuate as a result of changes in marketprices (other than those arising from interest rate risk orcurrency risk) caused by factors specific to a security, itsissuer or all factors affecting a market or a market segment.Exposure to price risk is mainly in equities, derivatives andcommodities, if applicable. As at June 30, 2015,approximately 99.8% (December 31, 2014 – 99.4%) of theFund’s net assets were exposed to price risk. If prices of
these investments had decreased or increased by 10%, withall other variables held constant, net assets of the Fundwould have decreased or increased, respectively, byapproximately $13,073,457 (December 31, 2014 –$10,834,194). In practice, actual results may differ from thissensitivity analysis and the difference could be material.
iv) Credit risk
The Fund had no significant exposure to bonds anddebentures, preferred shares or derivatives as at June 30,2015 or December 31, 2014. In addition, all investmenttransactions are executed by brokers with an approvedcredit rating. As such the risk of default on transactionswith counterparties and brokers related to purchase andsale of securities is considered minimal. In instances wherethe credit rating were to fall below the approved rating, theManager would take appropriate action.
v) Liquidity risk
The table below summarizes the Fund’s financial liabilitiesbased on the remaining period to the contractual maturitydate.
June 30, 2015 December 31, 2014
On demand($)
Less than3 months
($)On demand
($)
Less than3 months
($)
Current liabilities – 298,422 – 72,875Liability for written options – – – –Unrealized loss on derivatives – – – 123Redeemable units 131,074,656 – 108,951,040 –
131,074,656 298,422 108,951,040 72,998
Redeemable units are redeemable on demand at theholder’s option. However, the Manager does not expect thatthe contractual maturity disclosed in the table above will berepresentative of the actual cash outflows, as holders ofthese instruments typically retain them for a longer term.
vi) Concentration risk
Concentration risk arises as a result of the concentration ofexposures within the same category, geographical location,
The accompanying notes are an integral part of the financial statements.
262
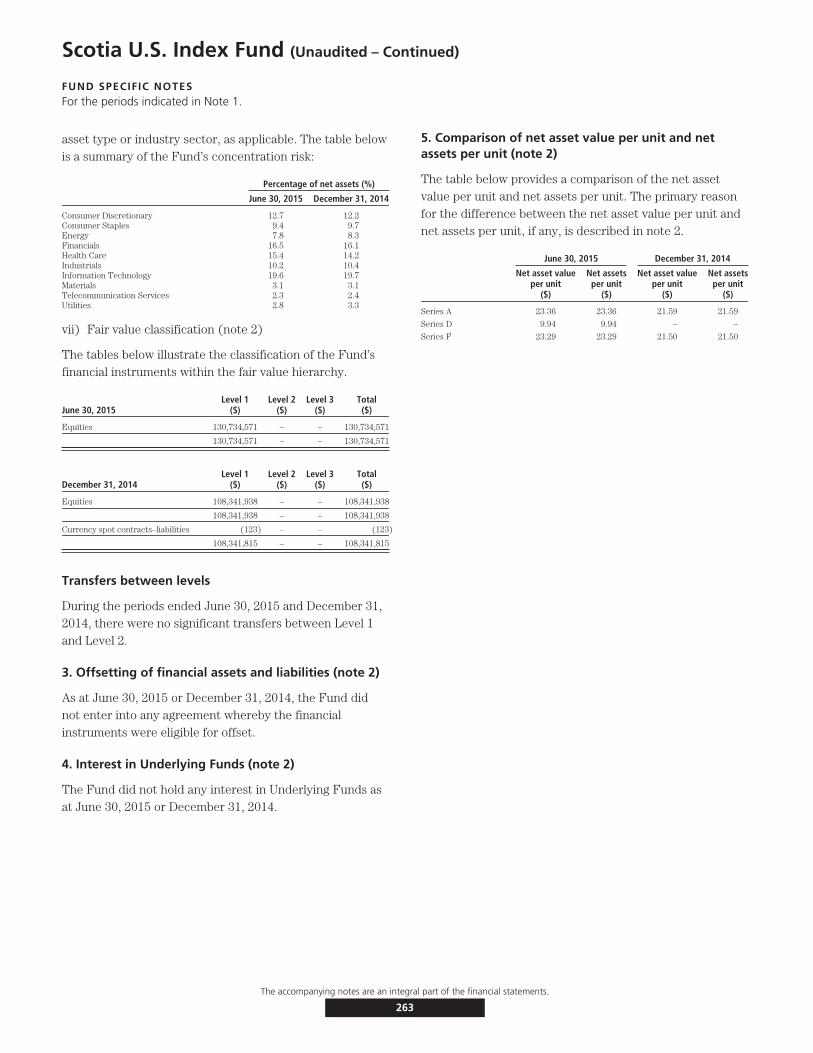
Scotia U.S. Index Fund (Unaudited – Continued)
FUND SPECIFIC NOTESFor the periods indicated in Note 1.
asset type or industry sector, as applicable. The table belowis a summary of the Fund’s concentration risk:
Percentage of net assets (%)
June 30, 2015 December 31, 2014
Consumer Discretionary 12.7 12.2Consumer Staples 9.4 9.7Energy 7.8 8.3Financials 16.5 16.1Health Care 15.4 14.2Industrials 10.2 10.4Information Technology 19.6 19.7Materials 3.1 3.1Telecommunication Services 2.3 2.4Utilities 2.8 3.3
vii) Fair value classification (note 2)
The tables below illustrate the classification of the Fund’sfinancial instruments within the fair value hierarchy.
June 30, 2015Level 1
($)Level 2
($)Level 3
($)Total($)
Equities 130,734,571 – – 130,734,571
130,734,571 – – 130,734,571
December 31, 2014Level 1
($)Level 2
($)Level 3
($)Total($)
Equities 108,341,938 – – 108,341,938
108,341,938 – – 108,341,938
Currency spot contracts–liabilities (123) – – (123)
108,341,815 – – 108,341,815
Transfers between levels
During the periods ended June 30, 2015 and December 31,2014, there were no significant transfers between Level 1and Level 2.
3. Offsetting of financial assets and liabilities (note 2)
As at June 30, 2015 or December 31, 2014, the Fund didnot enter into any agreement whereby the financialinstruments were eligible for offset.
4. Interest in Underlying Funds (note 2)
The Fund did not hold any interest in Underlying Funds asat June 30, 2015 or December 31, 2014.
5. Comparison of net asset value per unit and netassets per unit (note 2)
The table below provides a comparison of the net assetvalue per unit and net assets per unit. The primary reasonfor the difference between the net asset value per unit andnet assets per unit, if any, is described in note 2.
June 30, 2015 December 31, 2014
Net asset valueper unit
($)
Net assetsper unit
($)
Net asset valueper unit
($)
Net assetsper unit
($)
Series A 23.36 23.36 21.59 21.59
Series D 9.94 9.94 – –
Series F 23.29 23.29 21.50 21.50
The accompanying notes are an integral part of the financial statements.
263

Scotia CanAm Index Fund (Unaudited)
STATEMENTS OF FINANCIAL POSITIONAs at
June 30,2015
December 31,2014
ASSETSCurrent assetsInvestments
Non-derivative financial assets $ 99,198,042 $85,415,065Cash 239,026 488,038Margin deposited on futures 4,095,224 1,486,546Subscriptions receivable 29,970 201,514Accrued investment income and other 274 554
103,562,536 87,591,717
LIABILITIESCurrent liabilitiesManagement fee payable 73,473 –Payable for securities purchased 9,984,600 –Redemptions payable 53,346 28,458Accrued expenses 20,225 –Distributions payable – 452
10,131,644 28,910
Net assets attributable to holders of redeemable units $ 93,430,892 $87,562,807
NET ASSETS ATTRIBUTABLE TO HOLDERS OF REDEEMABLE UNITSPER SERIES
Series A $ 93,397,668 $87,532,084Series F $ 33,224 $ 30,723
NET ASSETS ATTRIBUTABLE TO HOLDERS OF REDEEMABLE UNITSPER UNIT
Series A $ 15.76 $ 14.61Series F $ 16.00 $ 14.81
STATEMENTS OF COMPREHENSIVE INCOMEFor the six month periods ended June 30,
2015 2014INCOMENet gain (loss) on investments (note 2)
Interest for distribution purposes $ 304,390 $ 346,216Net realized gain (loss) on futures contracts 7,328,301 6,752,651Change in unrealized gain (loss) on futures contracts 124,823 (1,847,843)
Net gain (loss) on investments 7,757,514 5,251,024Securities lending 7,455 4,188Net realized and change in unrealized gain (loss) on foreign exchange of
cash (309,036) 56,939Other income 2,419 610
Total income (loss) 7,458,352 5,312,761
EXPENSESManagement fees (note 5) 374,005 312,063Fixed administration fees (note 6) 102,865 –Independent Review Committee fees 69 116Interest expense and bank overdraft charges 2,951 1,104Audit fees – 881Custodian fees – 583Filing fees – 10,224Legal fees – 247Unitholder administration costs – 49,997Unitholder reporting costs – 9,753Harmonized Sales Tax/Goods and Services Tax 51,272 39,676Transaction costs 20,810 15,957
Total expenses 551,972 440,601Expenses absorbed by the Manager – (2,907)
Net expenses 551,972 437,694
Increase (decrease) in net assets attributable to holders of redeemableunits from operations $6,906,380 $ 4,875,067
INCREASE (DECREASE) IN NET ASSETS ATTRIBUTABLE TO HOLDERS OFREDEEMABLE UNITS FROM OPERATIONS PER SERIES
Series A $6,903,988 $ 4,869,701Series F $ 2,392 $ 5,366
INCREASE (DECREASE) IN NET ASSETS ATTRIBUTABLE TO HOLDERS OFREDEEMABLE UNITS FROM OPERATIONS PER UNIT†
Series A $ 1.15 $ 0.78Series F $ 2.02 $ 0.32
WEIGHTED AVERAGE NUMBER OF UNITS PER SERIESSeries A 5,997,260 6,238,814Series F 1,187 16,978
† The increase (decrease) in net assets attributable to holders of redeemable units fromoperations per unit is calculated by dividing the increase (decrease) in net assetsattributable to holders of redeemable units from operations per series by the weightedaverage number of units per series.
The accompanying notes are an integral part of the financial statements.
264

Scotia CanAm Index Fund (Unaudited – Continued)
STATEMENTS OF CHANGES IN NET ASSETSATTRIBUTABLE TO HOLDERS OF REDEEMABLE UNITSFor the six month periods ended June 30,
2015 2014NET ASSETS ATTRIBUTABLE TO HOLDERS OF REDEEMABLE UNITS,
BEGINNING OF PERIODSeries A $87,532,084 $76,392,023Series F 30,723 –
87,562,807 76,392,023
INCREASE (DECREASE) IN NET ASSETS ATTRIBUTABLE TO HOLDERS OFREDEEMABLE UNITS FROM OPERATIONS
Series A 6,903,988 4,869,701Series F 2,392 5,366
6,906,380 4,875,067
REDEEMABLE UNIT TRANSACTIONSProceeds from issue
Series A 7,180,754 4,037,199Series F 29,918 227,000
Payments on redemptionSeries A (8,219,158) (6,866,983)Series F (29,809) (125,000)
(1,038,295) (2,727,784)
INCREASE (DECREASE) IN NET ASSETS ATTRIBUTABLE TO HOLDERS OFREDEEMABLE UNITS
Series A 5,865,584 2,039,917Series F 2,501 107,366
5,868,085 2,147,283
NET ASSETS ATTRIBUTABLE TO HOLDERS OF REDEEMABLE UNITS, ENDOF PERIOD
Series A 93,397,668 78,431,940Series F 33,224 107,366
$93,430,892 $78,539,306
STATEMENTS OF CASH FLOWSFor the six month periods ended June 30,
2015 2014CASH FLOWS FROM OPERATING ACTIVITIESIncrease (decrease) in net assets attributable to holders of
redeemable units $ 6,906,380 $ 4,875,067Adjustments for:
Unrealized (gain) loss on foreign exchange of cash (102,394) (56,939)Purchases of non-derivative financial assets (305,547,687) (167,980,303)Proceeds from sale of non-derivative financial assets 301,749,310 163,494,890Margin deposited on futures (2,608,678) 2,149,439Accrued investment income and other 280 (90)Accrued expenses 93,698 72,600
Net cash provided by (used in) operating activities 490,909 2,554,664CASH FLOWS FROM FINANCING ACTIVITIESProceeds from issue of redeemable units 7,382,216 4,306,635Amounts paid on redemption of redeemable units (8,224,079) (6,918,076)Distributions to unitholders of redeemable units (452) –
Net cash provided by (used in) financing activities (842,315) (2,611,441)Change in unrealized gain (loss) on foreign exchange of cash 102,394 56,939Net increase (decrease) in cash (351,406) (56,777)Cash (bank overdraft), beginning of period 488,038 450,850
CASH (BANK OVERDRAFT), END OF PERIOD $ 239,026 $ 451,012
Interest paid(1) 2,951 –Interest received(1) 304,670 346,126
(1) Classified as operating items.
SCHEDULE OF INVESTMENT PORTFOLIOAs at June 30, 2015
FaceValue ($) Issuer
AverageCost ($)
CarryingValue ($)
MONEY MARKET INSTRUMENTS – 106.1%99,250,000 Canada Government T/B October 8, 2015 Treasury Bill
0.53% to 0.67% due fromJul. 2, 2015 to Oct. 8, 2015 99,135,260 99,198,042
TOTAL INVESTMENT PORTFOLIO 99,135,260 99,198,042
Futures Contracts – 4.4% 4,095,224OTHER ASSETS, LESS LIABILITIES – (10.5%) (9,862,374)
NET ASSETS – 100.0% 93,430,892
The accompanying notes are an integral part of the financial statements.
265
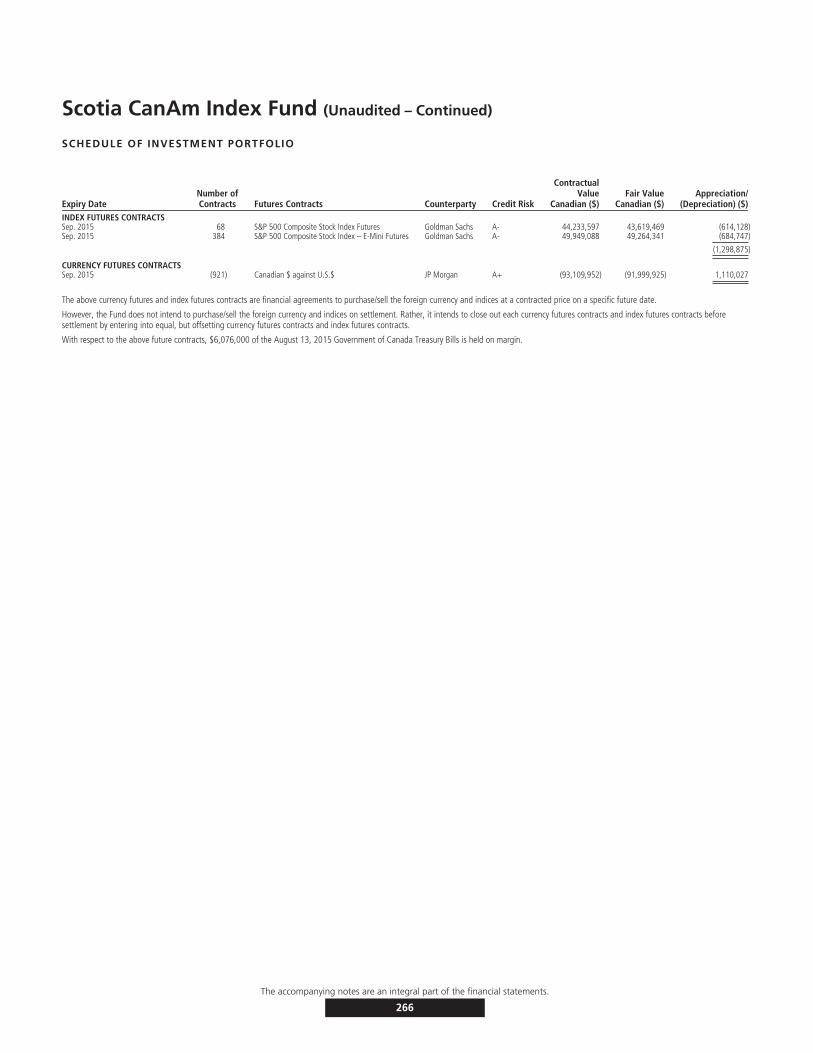
Scotia CanAm Index Fund (Unaudited – Continued)
SCHEDULE OF INVESTMENT PORTFOLIO
Expiry DateNumber ofContracts Futures Contracts Counterparty Credit Risk
ContractualValue
Canadian ($)Fair Value
Canadian ($)Appreciation/
(Depreciation) ($)INDEX FUTURES CONTRACTSSep. 2015 68 S&P 500 Composite Stock Index Futures Goldman Sachs A- 44,233,597 43,619,469 (614,128)Sep. 2015 384 S&P 500 Composite Stock Index – E-Mini Futures Goldman Sachs A- 49,949,088 49,264,341 (684,747)
(1,298,875)
CURRENCY FUTURES CONTRACTSSep. 2015 (921) Canadian $ against U.S.$ JP Morgan A+ (93,109,952) (91,999,925) 1,110,027
The above currency futures and index futures contracts are financial agreements to purchase/sell the foreign currency and indices at a contracted price on a specific future date.
However, the Fund does not intend to purchase/sell the foreign currency and indices on settlement. Rather, it intends to close out each currency futures contracts and index futures contracts beforesettlement by entering into equal, but offsetting currency futures contracts and index futures contracts.
With respect to the above future contracts, $6,076,000 of the August 13, 2015 Government of Canada Treasury Bills is held on margin.
The accompanying notes are an integral part of the financial statements.
266
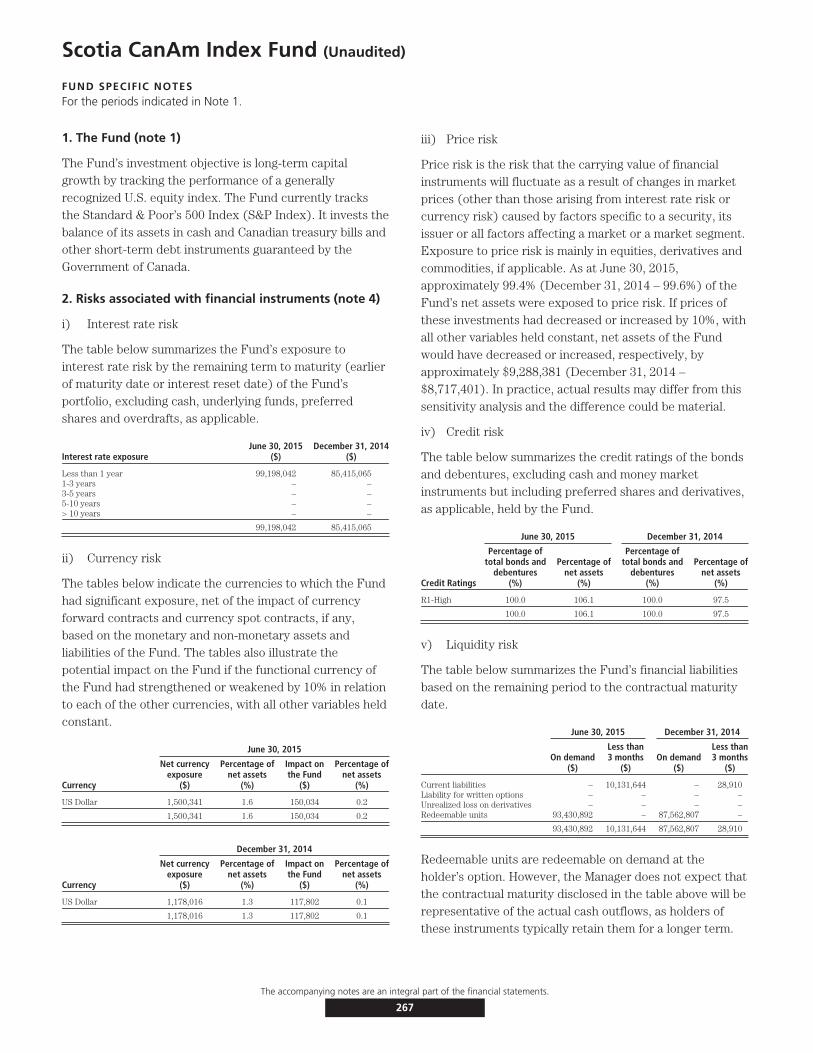
Scotia CanAm Index Fund (Unaudited)
FUND SPECIFIC NOTESFor the periods indicated in Note 1.
1. The Fund (note 1)
The Fund’s investment objective is long-term capitalgrowth by tracking the performance of a generallyrecognized U.S. equity index. The Fund currently tracksthe Standard & Poor’s 500 Index (S&P Index). It invests thebalance of its assets in cash and Canadian treasury bills andother short-term debt instruments guaranteed by theGovernment of Canada.
2. Risks associated with financial instruments (note 4)
i) Interest rate risk
The table below summarizes the Fund’s exposure tointerest rate risk by the remaining term to maturity (earlierof maturity date or interest reset date) of the Fund’sportfolio, excluding cash, underlying funds, preferredshares and overdrafts, as applicable.
Interest rate exposureJune 30, 2015
($)December 31, 2014
($)
Less than 1 year 99,198,042 85,415,0651-3 years – –3-5 years – –5-10 years – –> 10 years – –
99,198,042 85,415,065
ii) Currency risk
The tables below indicate the currencies to which the Fundhad significant exposure, net of the impact of currencyforward contracts and currency spot contracts, if any,based on the monetary and non-monetary assets andliabilities of the Fund. The tables also illustrate thepotential impact on the Fund if the functional currency ofthe Fund had strengthened or weakened by 10% in relationto each of the other currencies, with all other variables heldconstant.
June 30, 2015
Currency
Net currencyexposure
($)
Percentage ofnet assets
(%)
Impact onthe Fund
($)
Percentage ofnet assets
(%)
US Dollar 1,500,341 1.6 150,034 0.2
1,500,341 1.6 150,034 0.2
December 31, 2014
Currency
Net currencyexposure
($)
Percentage ofnet assets
(%)
Impact onthe Fund
($)
Percentage ofnet assets
(%)
US Dollar 1,178,016 1.3 117,802 0.1
1,178,016 1.3 117,802 0.1
iii) Price risk
Price risk is the risk that the carrying value of financialinstruments will fluctuate as a result of changes in marketprices (other than those arising from interest rate risk orcurrency risk) caused by factors specific to a security, itsissuer or all factors affecting a market or a market segment.Exposure to price risk is mainly in equities, derivatives andcommodities, if applicable. As at June 30, 2015,approximately 99.4% (December 31, 2014 – 99.6%) of theFund’s net assets were exposed to price risk. If prices ofthese investments had decreased or increased by 10%, withall other variables held constant, net assets of the Fundwould have decreased or increased, respectively, byapproximately $9,288,381 (December 31, 2014 –$8,717,401). In practice, actual results may differ from thissensitivity analysis and the difference could be material.
iv) Credit risk
The table below summarizes the credit ratings of the bondsand debentures, excluding cash and money marketinstruments but including preferred shares and derivatives,as applicable, held by the Fund.
June 30, 2015 December 31, 2014
Credit Ratings
Percentage oftotal bonds and
debentures(%)
Percentage ofnet assets
(%)
Percentage oftotal bonds and
debentures(%)
Percentage ofnet assets
(%)
R1-High 100.0 106.1 100.0 97.5
100.0 106.1 100.0 97.5
v) Liquidity risk
The table below summarizes the Fund’s financial liabilitiesbased on the remaining period to the contractual maturitydate.
June 30, 2015 December 31, 2014
On demand($)
Less than3 months
($)On demand
($)
Less than3 months
($)
Current liabilities – 10,131,644 – 28,910Liability for written options – – – –Unrealized loss on derivatives – – – –Redeemable units 93,430,892 – 87,562,807 –
93,430,892 10,131,644 87,562,807 28,910
Redeemable units are redeemable on demand at theholder’s option. However, the Manager does not expect thatthe contractual maturity disclosed in the table above will berepresentative of the actual cash outflows, as holders ofthese instruments typically retain them for a longer term.
The accompanying notes are an integral part of the financial statements.
267
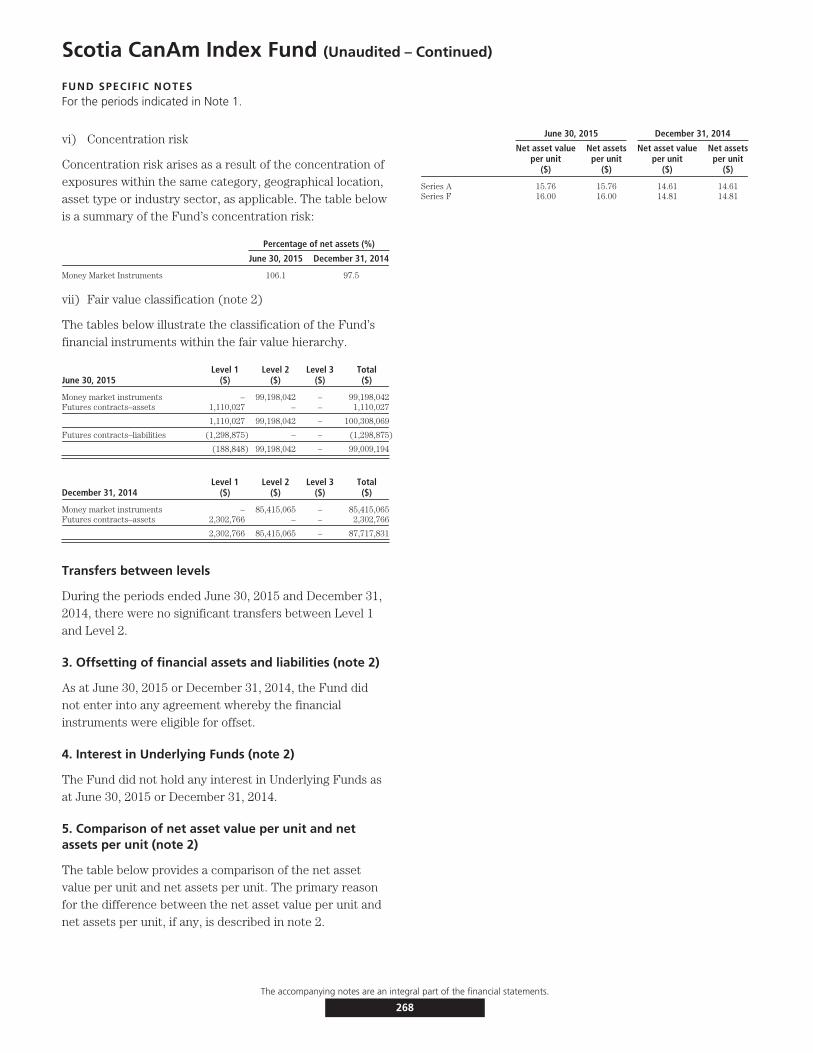
Scotia CanAm Index Fund (Unaudited – Continued)
FUND SPECIFIC NOTESFor the periods indicated in Note 1.
vi) Concentration risk
Concentration risk arises as a result of the concentration ofexposures within the same category, geographical location,asset type or industry sector, as applicable. The table belowis a summary of the Fund’s concentration risk:
Percentage of net assets (%)
June 30, 2015 December 31, 2014
Money Market Instruments 106.1 97.5
vii) Fair value classification (note 2)
The tables below illustrate the classification of the Fund’sfinancial instruments within the fair value hierarchy.
June 30, 2015Level 1
($)Level 2
($)Level 3
($)Total($)
Money market instruments – 99,198,042 – 99,198,042Futures contracts–assets 1,110,027 – – 1,110,027
1,110,027 99,198,042 – 100,308,069
Futures contracts–liabilities (1,298,875) – – (1,298,875)
(188,848) 99,198,042 – 99,009,194
December 31, 2014Level 1
($)Level 2
($)Level 3
($)Total($)
Money market instruments – 85,415,065 – 85,415,065Futures contracts–assets 2,302,766 – – 2,302,766
2,302,766 85,415,065 – 87,717,831
Transfers between levels
During the periods ended June 30, 2015 and December 31,2014, there were no significant transfers between Level 1and Level 2.
3. Offsetting of financial assets and liabilities (note 2)
As at June 30, 2015 or December 31, 2014, the Fund didnot enter into any agreement whereby the financialinstruments were eligible for offset.
4. Interest in Underlying Funds (note 2)
The Fund did not hold any interest in Underlying Funds asat June 30, 2015 or December 31, 2014.
5. Comparison of net asset value per unit and netassets per unit (note 2)
The table below provides a comparison of the net assetvalue per unit and net assets per unit. The primary reasonfor the difference between the net asset value per unit andnet assets per unit, if any, is described in note 2.
June 30, 2015 December 31, 2014
Net asset valueper unit
($)
Net assetsper unit
($)
Net asset valueper unit
($)
Net assetsper unit
($)
Series A 15.76 15.76 14.61 14.61Series F 16.00 16.00 14.81 14.81
The accompanying notes are an integral part of the financial statements.
268

Scotia Nasdaq Index Fund (Unaudited)
STATEMENTS OF FINANCIAL POSITIONAs at
June 30,2015
December 31,2014
ASSETSCurrent assetsInvestments
Non-derivative financial assets $59,324,885 $45,258,879Cash 331,717 1,666,511Margin deposited on futures 1,362,684 431,935Subscriptions receivable 99,014 152,593Accrued investment income and other – 719
61,118,300 47,510,637
LIABILITIESCurrent liabilitiesManagement fee payable 47,415 –Redemptions payable 119,648 155,248Accrued expenses 13,642 –Distributions payable – 6,639
180,705 161,887
Net assets attributable to holders of redeemable units $60,937,595 $47,348,750
NET ASSETS ATTRIBUTABLE TO HOLDERS OF REDEEMABLE UNITSPER SERIES
Series A $60,929,772 $47,346,010Series D $ 4,769 $ –Series F $ 3,054 $ 2,740
NET ASSETS ATTRIBUTABLE TO HOLDERS OF REDEEMABLE UNITSPER UNIT
Series A $ 7.77 $ 6.98Series D $ 10.05 $ –Series F $ 9.18 $ 8.24
STATEMENTS OF COMPREHENSIVE INCOMEFor the six month periods ended June 30,
2015 2014INCOMENet gain (loss) on investments (note 2)
Interest for distribution purposes $ 12,589 $ 61,659Net realized gain (loss) on futures contracts 2,211,361 2,488,400Net realized and change in unrealized gain (loss) on foreign exchange 3,825,097 1,122,280Change in unrealized gain (loss) on non-derivative financial assets (549,752) (1,076,439)
Net gain (loss) on investments 5,499,295 2,595,900Securities lending 11 352Net realized and change in unrealized gain (loss) on foreign exchange of
cash 326,076 –Other income 7,119 2,864
Total income (loss) 5,832,501 2,599,116
EXPENSESManagement fees (note 5) 227,775 138,433Fixed administration fees (note 6) 65,490 –Independent Review Committee fees 41 52Interest expense and bank overdraft charges 2 –Audit fees – 420Custodian fees – 269Filing fees – 10,627Legal fees – 111Unitholder administration costs – 16,171Unitholder reporting costs – 3,756Harmonized Sales Tax/Goods and Services Tax 31,470 16,988Transaction costs 6,314 4,365
Total expenses 331,092 191,192Expenses absorbed by the Manager – (3,797)
Net expenses 331,092 187,395
Increase (decrease) in net assets attributable to holders of redeemableunits from operations $5,501,409 $ 2,411,721
INCREASE (DECREASE) IN NET ASSETS ATTRIBUTABLE TO HOLDERS OFREDEEMABLE UNITS FROM OPERATIONS PER SERIES
Series A $5,501,024 $ 2,398,838Series D $ 71 $ –Series F $ 314 $ 12,883
INCREASE (DECREASE) IN NET ASSETS ATTRIBUTABLE TO HOLDERS OFREDEEMABLE UNITS FROM OPERATIONS PER UNIT†
Series A $ 0.73 $ 0.46Series D $ 0.19 $ –Series F $ 0.94 $ 0.22
WEIGHTED AVERAGE NUMBER OF UNITS PER SERIESSeries A 7,491,574 5,255,986Series D 383 –Series F 333 59,450
† The increase (decrease) in net assets attributable to holders of redeemable units fromoperations per unit is calculated by dividing the increase (decrease) in net assetsattributable to holders of redeemable units from operations per series by the weightedaverage number of units per series.
The accompanying notes are an integral part of the financial statements.
269
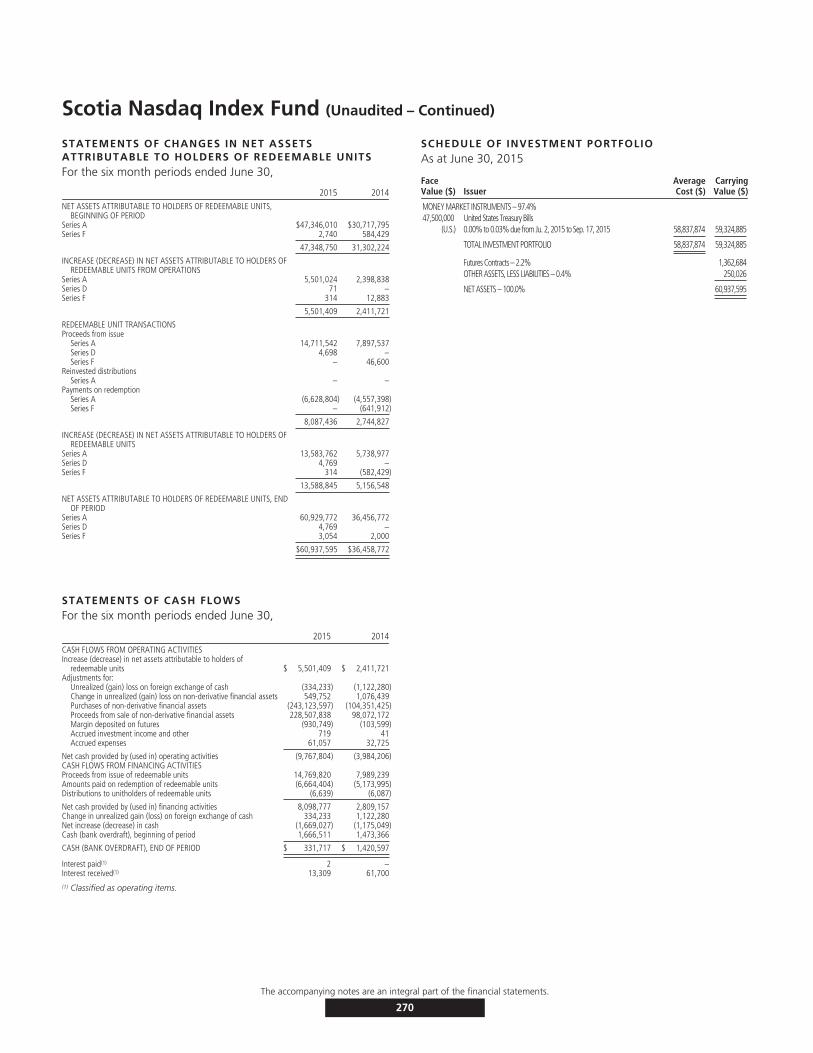
Scotia Nasdaq Index Fund (Unaudited – Continued)
STATEMENTS OF CHANGES IN NET ASSETSATTRIBUTABLE TO HOLDERS OF REDEEMABLE UNITSFor the six month periods ended June 30,
2015 2014NET ASSETS ATTRIBUTABLE TO HOLDERS OF REDEEMABLE UNITS,
BEGINNING OF PERIODSeries A $47,346,010 $30,717,795Series F 2,740 584,429
47,348,750 31,302,224
INCREASE (DECREASE) IN NET ASSETS ATTRIBUTABLE TO HOLDERS OFREDEEMABLE UNITS FROM OPERATIONS
Series A 5,501,024 2,398,838Series D 71 –Series F 314 12,883
5,501,409 2,411,721
REDEEMABLE UNIT TRANSACTIONSProceeds from issue
Series A 14,711,542 7,897,537Series D 4,698 –Series F – 46,600
Reinvested distributionsSeries A – –
Payments on redemptionSeries A (6,628,804) (4,557,398)Series F – (641,912)
8,087,436 2,744,827
INCREASE (DECREASE) IN NET ASSETS ATTRIBUTABLE TO HOLDERS OFREDEEMABLE UNITS
Series A 13,583,762 5,738,977Series D 4,769 –Series F 314 (582,429)
13,588,845 5,156,548
NET ASSETS ATTRIBUTABLE TO HOLDERS OF REDEEMABLE UNITS, ENDOF PERIOD
Series A 60,929,772 36,456,772Series D 4,769 –Series F 3,054 2,000
$60,937,595 $36,458,772
STATEMENTS OF CASH FLOWSFor the six month periods ended June 30,
2015 2014CASH FLOWS FROM OPERATING ACTIVITIESIncrease (decrease) in net assets attributable to holders of
redeemable units $ 5,501,409 $ 2,411,721Adjustments for:
Unrealized (gain) loss on foreign exchange of cash (334,233) (1,122,280)Change in unrealized (gain) loss on non-derivative financial assets 549,752 1,076,439Purchases of non-derivative financial assets (243,123,597) (104,351,425)Proceeds from sale of non-derivative financial assets 228,507,838 98,072,172Margin deposited on futures (930,749) (103,599)Accrued investment income and other 719 41Accrued expenses 61,057 32,725
Net cash provided by (used in) operating activities (9,767,804) (3,984,206)CASH FLOWS FROM FINANCING ACTIVITIESProceeds from issue of redeemable units 14,769,820 7,989,239Amounts paid on redemption of redeemable units (6,664,404) (5,173,995)Distributions to unitholders of redeemable units (6,639) (6,087)
Net cash provided by (used in) financing activities 8,098,777 2,809,157Change in unrealized gain (loss) on foreign exchange of cash 334,233 1,122,280Net increase (decrease) in cash (1,669,027) (1,175,049)Cash (bank overdraft), beginning of period 1,666,511 1,473,366
CASH (BANK OVERDRAFT), END OF PERIOD $ 331,717 $ 1,420,597
Interest paid(1) 2 –Interest received(1) 13,309 61,700(1) Classified as operating items.
SCHEDULE OF INVESTMENT PORTFOLIOAs at June 30, 2015
FaceValue ($) Issuer
AverageCost ($)
CarryingValue ($)
MONEY MARKET INSTRUMENTS – 97.4%47,500,000 United States Treasury Bills
(U.S.) 0.00% to 0.03% due from Ju. 2, 2015 to Sep. 17, 2015 58,837,874 59,324,885
TOTAL INVESTMENT PORTFOLIO 58,837,874 59,324,885
Futures Contracts – 2.2% 1,362,684OTHER ASSETS, LESS LIABILITIES – 0.4% 250,026
NET ASSETS – 100.0% 60,937,595
The accompanying notes are an integral part of the financial statements.
270

Scotia Nasdaq Index Fund (Unaudited – Continued)
SCHEDULE OF INVESTMENT PORTFOLIO
Expiry DateNumber ofContracts Futures Contracts Counterparty Credit Risk
ContractualValue
Canadian ($)Fair Value
Canadian ($)Appreciation/
(Depreciation) ($)INDEX FUTURES CONTRACTSSep. 2015 555 Nasdaq 100 Index E-Mini Futures Goldman Sachs A- 61,524,046 60,863,745 (660,301)
The above index futures contracts are financial agreements to purchase/sell the indices at a contracted price on a specific future date.
However, the Fund does not intend to purchase/sell the indices on settlement. Rather, it intends to close out each index futures contracts before settlement by entering into equal, but offsetting indexfutures contracts.
With respect to the above future contracts, $1,094,000 of the July 2, 2015 United States Treasury Bills is held on margin.
The accompanying notes are an integral part of the financial statements.
271
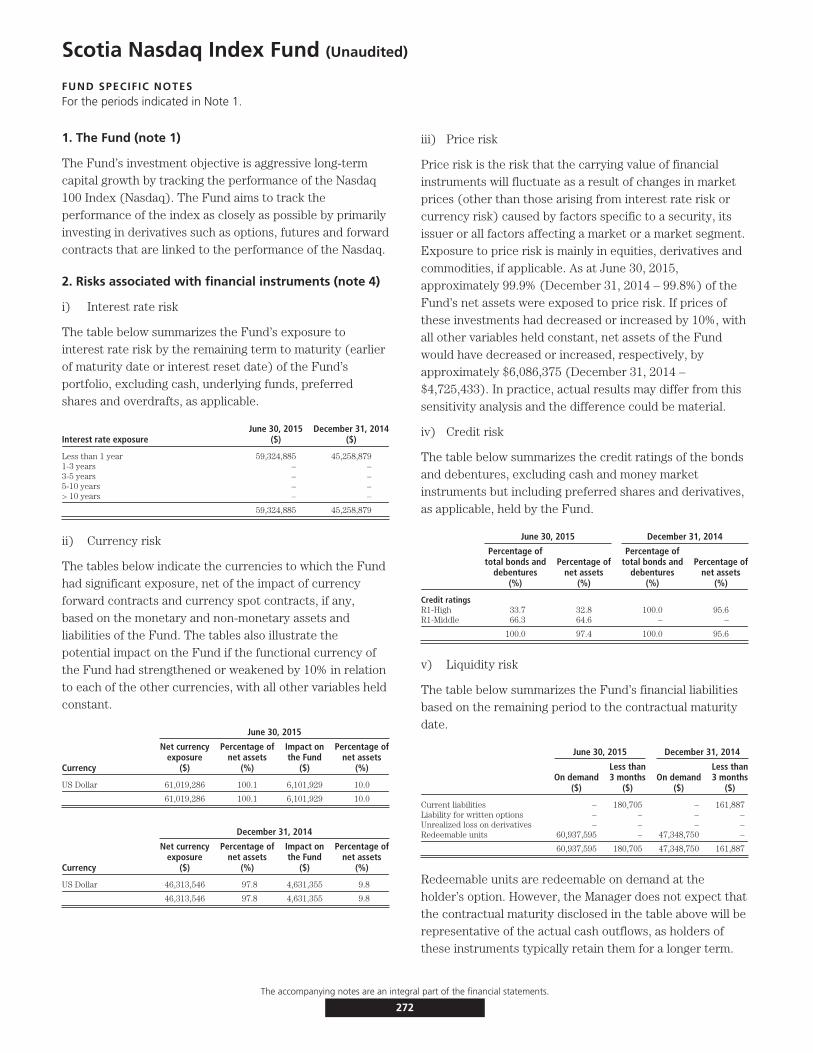
Scotia Nasdaq Index Fund (Unaudited)
FUND SPECIFIC NOTESFor the periods indicated in Note 1.
1. The Fund (note 1)
The Fund’s investment objective is aggressive long-termcapital growth by tracking the performance of the Nasdaq100 Index (Nasdaq). The Fund aims to track theperformance of the index as closely as possible by primarilyinvesting in derivatives such as options, futures and forwardcontracts that are linked to the performance of the Nasdaq.
2. Risks associated with financial instruments (note 4)
i) Interest rate risk
The table below summarizes the Fund’s exposure tointerest rate risk by the remaining term to maturity (earlierof maturity date or interest reset date) of the Fund’sportfolio, excluding cash, underlying funds, preferredshares and overdrafts, as applicable.
Interest rate exposureJune 30, 2015
($)December 31, 2014
($)
Less than 1 year 59,324,885 45,258,8791-3 years – –3-5 years – –5-10 years – –> 10 years – –
59,324,885 45,258,879
ii) Currency risk
The tables below indicate the currencies to which the Fundhad significant exposure, net of the impact of currencyforward contracts and currency spot contracts, if any,based on the monetary and non-monetary assets andliabilities of the Fund. The tables also illustrate thepotential impact on the Fund if the functional currency ofthe Fund had strengthened or weakened by 10% in relationto each of the other currencies, with all other variables heldconstant.
June 30, 2015
Currency
Net currencyexposure
($)
Percentage ofnet assets
(%)
Impact onthe Fund
($)
Percentage ofnet assets
(%)
US Dollar 61,019,286 100.1 6,101,929 10.0
61,019,286 100.1 6,101,929 10.0
December 31, 2014
Currency
Net currencyexposure
($)
Percentage ofnet assets
(%)
Impact onthe Fund
($)
Percentage ofnet assets
(%)
US Dollar 46,313,546 97.8 4,631,355 9.8
46,313,546 97.8 4,631,355 9.8
iii) Price risk
Price risk is the risk that the carrying value of financialinstruments will fluctuate as a result of changes in marketprices (other than those arising from interest rate risk orcurrency risk) caused by factors specific to a security, itsissuer or all factors affecting a market or a market segment.Exposure to price risk is mainly in equities, derivatives andcommodities, if applicable. As at June 30, 2015,approximately 99.9% (December 31, 2014 – 99.8%) of theFund’s net assets were exposed to price risk. If prices ofthese investments had decreased or increased by 10%, withall other variables held constant, net assets of the Fundwould have decreased or increased, respectively, byapproximately $6,086,375 (December 31, 2014 –$4,725,433). In practice, actual results may differ from thissensitivity analysis and the difference could be material.
iv) Credit risk
The table below summarizes the credit ratings of the bondsand debentures, excluding cash and money marketinstruments but including preferred shares and derivatives,as applicable, held by the Fund.
June 30, 2015 December 31, 2014
Percentage oftotal bonds and
debentures(%)
Percentage ofnet assets
(%)
Percentage oftotal bonds and
debentures(%)
Percentage ofnet assets
(%)
Credit ratingsR1-High 33.7 32.8 100.0 95.6R1-Middle 66.3 64.6 – –
100.0 97.4 100.0 95.6
v) Liquidity risk
The table below summarizes the Fund’s financial liabilitiesbased on the remaining period to the contractual maturitydate.
June 30, 2015 December 31, 2014
On demand($)
Less than3 months
($)On demand
($)
Less than3 months
($)
Current liabilities – 180,705 – 161,887Liability for written options – – – –Unrealized loss on derivatives – – – –Redeemable units 60,937,595 – 47,348,750 –
60,937,595 180,705 47,348,750 161,887
Redeemable units are redeemable on demand at theholder’s option. However, the Manager does not expect thatthe contractual maturity disclosed in the table above will berepresentative of the actual cash outflows, as holders ofthese instruments typically retain them for a longer term.
The accompanying notes are an integral part of the financial statements.
272
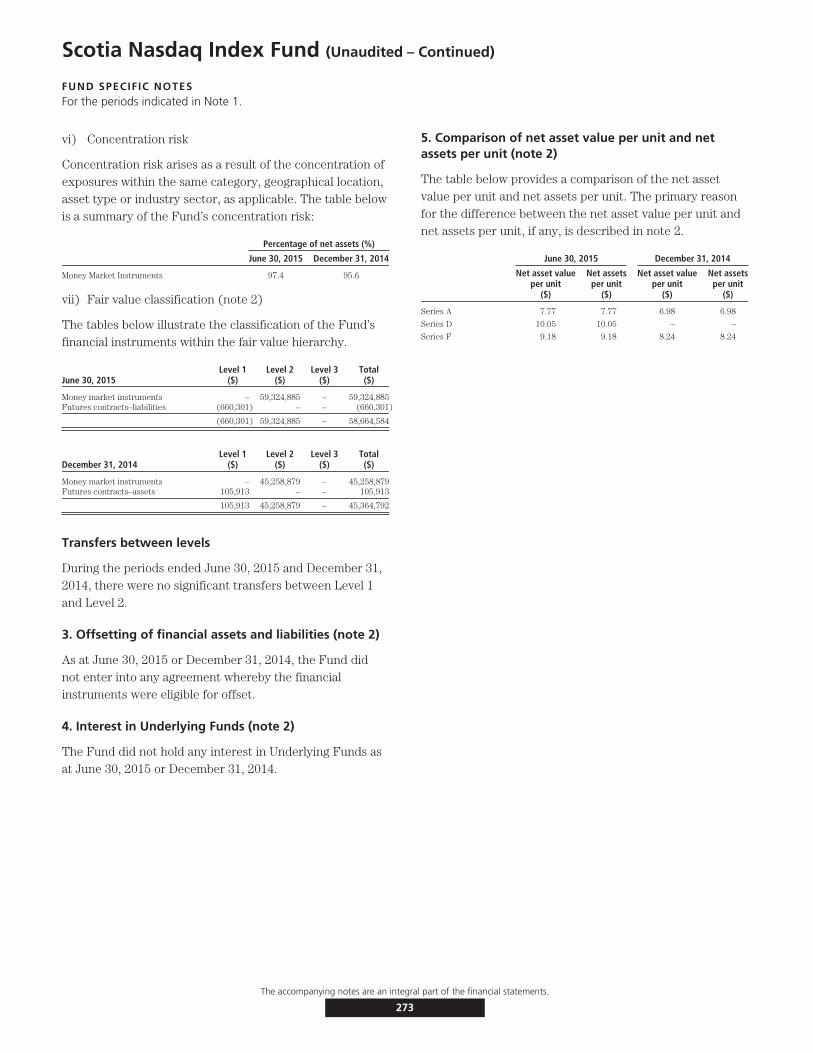
Scotia Nasdaq Index Fund (Unaudited – Continued)
FUND SPECIFIC NOTESFor the periods indicated in Note 1.
vi) Concentration risk
Concentration risk arises as a result of the concentration ofexposures within the same category, geographical location,asset type or industry sector, as applicable. The table belowis a summary of the Fund’s concentration risk:
Percentage of net assets (%)
June 30, 2015 December 31, 2014
Money Market Instruments 97.4 95.6
vii) Fair value classification (note 2)
The tables below illustrate the classification of the Fund’sfinancial instruments within the fair value hierarchy.
June 30, 2015Level 1
($)Level 2
($)Level 3
($)Total($)
Money market instruments – 59,324,885 – 59,324,885Futures contracts–liabilities (660,301) – – (660,301)
(660,301) 59,324,885 – 58,664,584
December 31, 2014Level 1
($)Level 2
($)Level 3
($)Total($)
Money market instruments – 45,258,879 – 45,258,879Futures contracts–assets 105,913 – – 105,913
105,913 45,258,879 – 45,364,792
Transfers between levels
During the periods ended June 30, 2015 and December 31,2014, there were no significant transfers between Level 1and Level 2.
3. Offsetting of financial assets and liabilities (note 2)
As at June 30, 2015 or December 31, 2014, the Fund didnot enter into any agreement whereby the financialinstruments were eligible for offset.
4. Interest in Underlying Funds (note 2)
The Fund did not hold any interest in Underlying Funds asat June 30, 2015 or December 31, 2014.
5. Comparison of net asset value per unit and netassets per unit (note 2)
The table below provides a comparison of the net assetvalue per unit and net assets per unit. The primary reasonfor the difference between the net asset value per unit andnet assets per unit, if any, is described in note 2.
June 30, 2015 December 31, 2014
Net asset valueper unit
($)
Net assetsper unit
($)
Net asset valueper unit
($)
Net assetsper unit
($)
Series A 7.77 7.77 6.98 6.98
Series D 10.05 10.05 – –
Series F 9.18 9.18 8.24 8.24
The accompanying notes are an integral part of the financial statements.
273
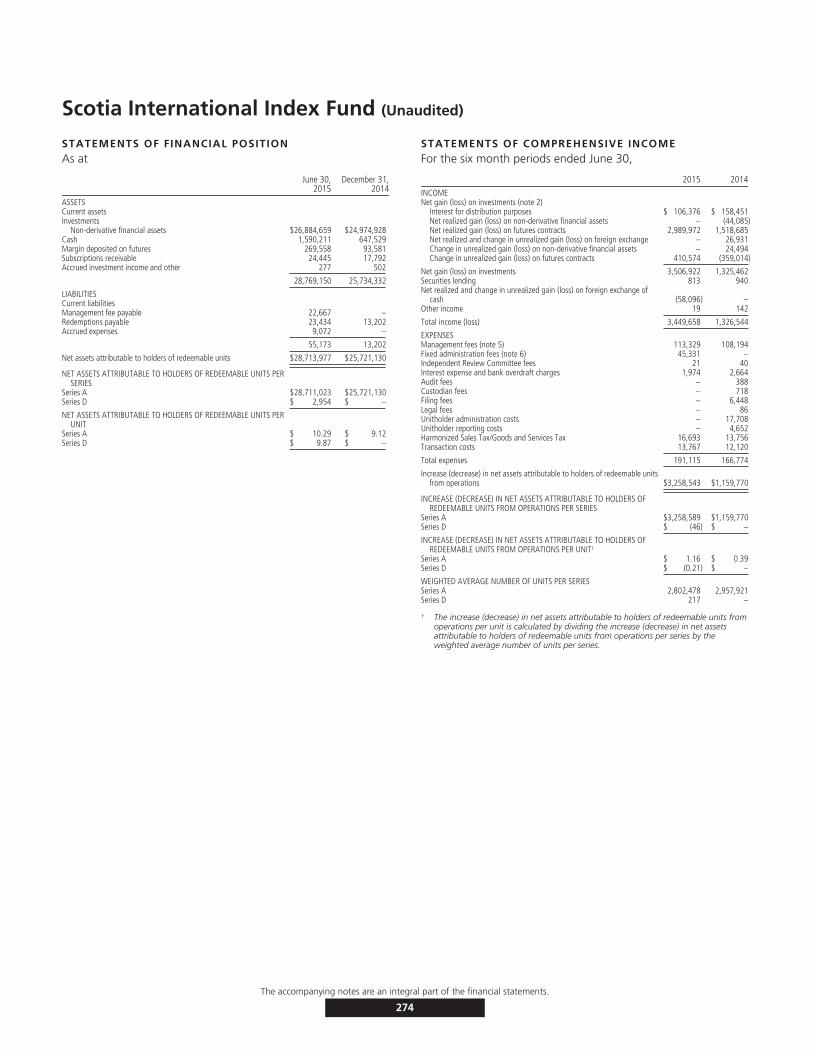
Scotia International Index Fund (Unaudited)
STATEMENTS OF FINANCIAL POSITIONAs at
June 30,2015
December 31,2014
ASSETSCurrent assetsInvestments
Non-derivative financial assets $26,884,659 $24,974,928Cash 1,590,211 647,529Margin deposited on futures 269,558 93,581Subscriptions receivable 24,445 17,792Accrued investment income and other 277 502
28,769,150 25,734,332
LIABILITIESCurrent liabilitiesManagement fee payable 22,667 –Redemptions payable 23,434 13,202Accrued expenses 9,072 –
55,173 13,202
Net assets attributable to holders of redeemable units $28,713,977 $25,721,130
NET ASSETS ATTRIBUTABLE TO HOLDERS OF REDEEMABLE UNITS PERSERIES
Series A $28,711,023 $25,721,130Series D $ 2,954 $ –
NET ASSETS ATTRIBUTABLE TO HOLDERS OF REDEEMABLE UNITS PERUNIT
Series A $ 10.29 $ 9.12Series D $ 9.87 $ –
STATEMENTS OF COMPREHENSIVE INCOMEFor the six month periods ended June 30,
2015 2014INCOMENet gain (loss) on investments (note 2)
Interest for distribution purposes $ 106,376 $ 158,451Net realized gain (loss) on non-derivative financial assets – (44,085)Net realized gain (loss) on futures contracts 2,989,972 1,518,685Net realized and change in unrealized gain (loss) on foreign exchange – 26,931Change in unrealized gain (loss) on non-derivative financial assets – 24,494Change in unrealized gain (loss) on futures contracts 410,574 (359,014)
Net gain (loss) on investments 3,506,922 1,325,462Securities lending 813 940Net realized and change in unrealized gain (loss) on foreign exchange of
cash (58,096) –Other income 19 142
Total income (loss) 3,449,658 1,326,544
EXPENSESManagement fees (note 5) 113,329 108,194Fixed administration fees (note 6) 45,331 –Independent Review Committee fees 21 40Interest expense and bank overdraft charges 1,974 2,664Audit fees – 388Custodian fees – 718Filing fees – 6,448Legal fees – 86Unitholder administration costs – 17,708Unitholder reporting costs – 4,652Harmonized Sales Tax/Goods and Services Tax 16,693 13,756Transaction costs 13,767 12,120
Total expenses 191,115 166,774
Increase (decrease) in net assets attributable to holders of redeemable unitsfrom operations $3,258,543 $1,159,770
INCREASE (DECREASE) IN NET ASSETS ATTRIBUTABLE TO HOLDERS OFREDEEMABLE UNITS FROM OPERATIONS PER SERIES
Series A $3,258,589 $1,159,770Series D $ (46) $ –
INCREASE (DECREASE) IN NET ASSETS ATTRIBUTABLE TO HOLDERS OFREDEEMABLE UNITS FROM OPERATIONS PER UNIT†
Series A $ 1.16 $ 0.39Series D $ (0.21) $ –
WEIGHTED AVERAGE NUMBER OF UNITS PER SERIESSeries A 2,802,478 2,957,921Series D 217 –
† The increase (decrease) in net assets attributable to holders of redeemable units fromoperations per unit is calculated by dividing the increase (decrease) in net assetsattributable to holders of redeemable units from operations per series by theweighted average number of units per series.
The accompanying notes are an integral part of the financial statements.
274
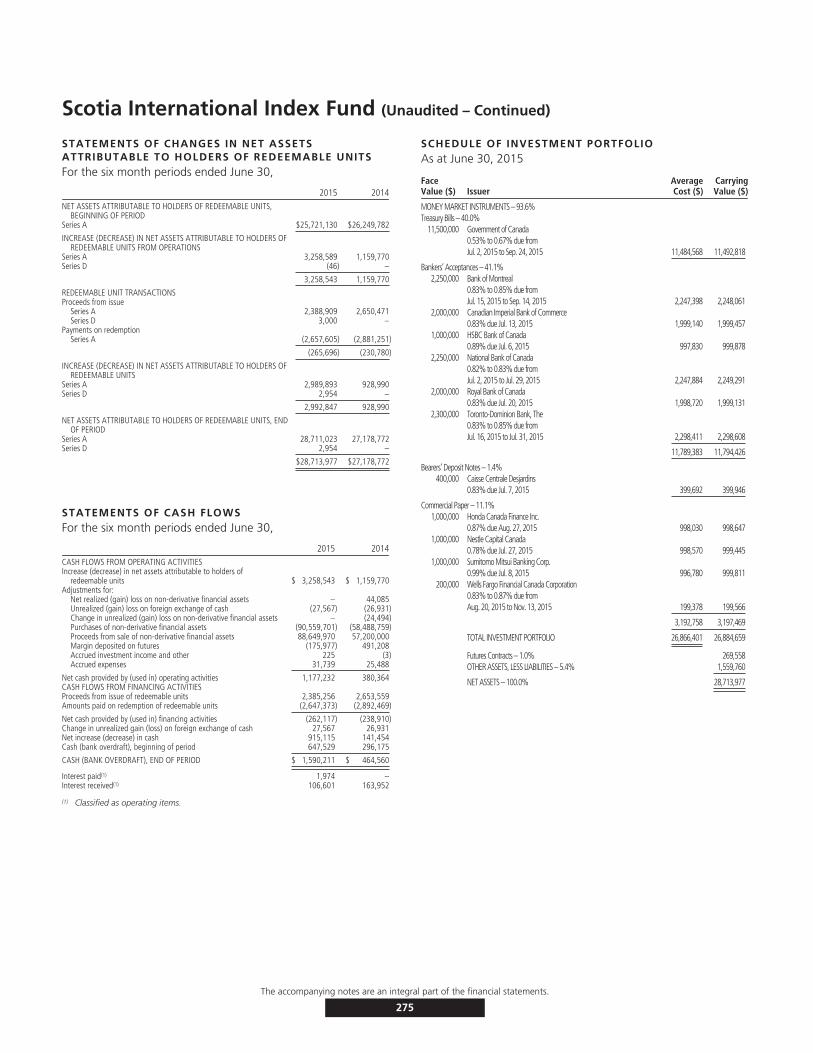
Scotia International Index Fund (Unaudited – Continued)
STATEMENTS OF CHANGES IN NET ASSETSATTRIBUTABLE TO HOLDERS OF REDEEMABLE UNITSFor the six month periods ended June 30,
2015 2014NET ASSETS ATTRIBUTABLE TO HOLDERS OF REDEEMABLE UNITS,
BEGINNING OF PERIODSeries A $25,721,130 $26,249,782
INCREASE (DECREASE) IN NET ASSETS ATTRIBUTABLE TO HOLDERS OFREDEEMABLE UNITS FROM OPERATIONS
Series A 3,258,589 1,159,770Series D (46) –
3,258,543 1,159,770
REDEEMABLE UNIT TRANSACTIONSProceeds from issue
Series A 2,388,909 2,650,471Series D 3,000 –
Payments on redemptionSeries A (2,657,605) (2,881,251)
(265,696) (230,780)
INCREASE (DECREASE) IN NET ASSETS ATTRIBUTABLE TO HOLDERS OFREDEEMABLE UNITS
Series A 2,989,893 928,990Series D 2,954 –
2,992,847 928,990
NET ASSETS ATTRIBUTABLE TO HOLDERS OF REDEEMABLE UNITS, ENDOF PERIOD
Series A 28,711,023 27,178,772Series D 2,954 –
$28,713,977 $27,178,772
STATEMENTS OF CASH FLOWSFor the six month periods ended June 30,
2015 2014CASH FLOWS FROM OPERATING ACTIVITIESIncrease (decrease) in net assets attributable to holders of
redeemable units $ 3,258,543 $ 1,159,770Adjustments for:
Net realized (gain) loss on non-derivative financial assets – 44,085Unrealized (gain) loss on foreign exchange of cash (27,567) (26,931)Change in unrealized (gain) loss on non-derivative financial assets – (24,494)Purchases of non-derivative financial assets (90,559,701) (58,488,759)Proceeds from sale of non-derivative financial assets 88,649,970 57,200,000Margin deposited on futures (175,977) 491,208Accrued investment income and other 225 (3)Accrued expenses 31,739 25,488
Net cash provided by (used in) operating activities 1,177,232 380,364CASH FLOWS FROM FINANCING ACTIVITIESProceeds from issue of redeemable units 2,385,256 2,653,559Amounts paid on redemption of redeemable units (2,647,373) (2,892,469)
Net cash provided by (used in) financing activities (262,117) (238,910)Change in unrealized gain (loss) on foreign exchange of cash 27,567 26,931Net increase (decrease) in cash 915,115 141,454Cash (bank overdraft), beginning of period 647,529 296,175
CASH (BANK OVERDRAFT), END OF PERIOD $ 1,590,211 $ 464,560
Interest paid(1) 1,974 –Interest received(1) 106,601 163,952
(1) Classified as operating items.
SCHEDULE OF INVESTMENT PORTFOLIOAs at June 30, 2015
FaceValue ($) Issuer
AverageCost ($)
CarryingValue ($)
MONEY MARKET INSTRUMENTS – 93.6%Treasury Bills – 40.0%
11,500,000 Government of Canada0.53% to 0.67% due fromJul. 2, 2015 to Sep. 24, 2015 11,484,568 11,492,818
Bankers’ Acceptances – 41.1%2,250,000 Bank of Montreal
0.83% to 0.85% due fromJul. 15, 2015 to Sep. 14, 2015 2,247,398 2,248,061
2,000,000 Canadian Imperial Bank of Commerce0.83% due Jul. 13, 2015 1,999,140 1,999,457
1,000,000 HSBC Bank of Canada0.89% due Jul. 6, 2015 997,830 999,878
2,250,000 National Bank of Canada0.82% to 0.83% due fromJul. 2, 2015 to Jul. 29, 2015 2,247,884 2,249,291
2,000,000 Royal Bank of Canada0.83% due Jul. 20, 2015 1,998,720 1,999,131
2,300,000 Toronto-Dominion Bank, The0.83% to 0.85% due fromJul. 16, 2015 to Jul. 31, 2015 2,298,411 2,298,608
11,789,383 11,794,426
Bearers’ Deposit Notes – 1.4%400,000 Caisse Centrale Desjardins
0.83% due Jul. 7, 2015 399,692 399,946
Commercial Paper – 11.1%1,000,000 Honda Canada Finance Inc.
0.87% due Aug. 27, 2015 998,030 998,6471,000,000 Nestle Capital Canada
0.78% due Jul. 27, 2015 998,570 999,4451,000,000 Sumitomo Mitsui Banking Corp.
0.99% due Jul. 8, 2015 996,780 999,811200,000 Wells Fargo Financial Canada Corporation
0.83% to 0.87% due fromAug. 20, 2015 to Nov. 13, 2015 199,378 199,566
3,192,758 3,197,469
TOTAL INVESTMENT PORTFOLIO 26,866,401 26,884,659
Futures Contracts – 1.0% 269,558OTHER ASSETS, LESS LIABILITIES – 5.4% 1,559,760
NET ASSETS – 100.0% 28,713,977
The accompanying notes are an integral part of the financial statements.
275
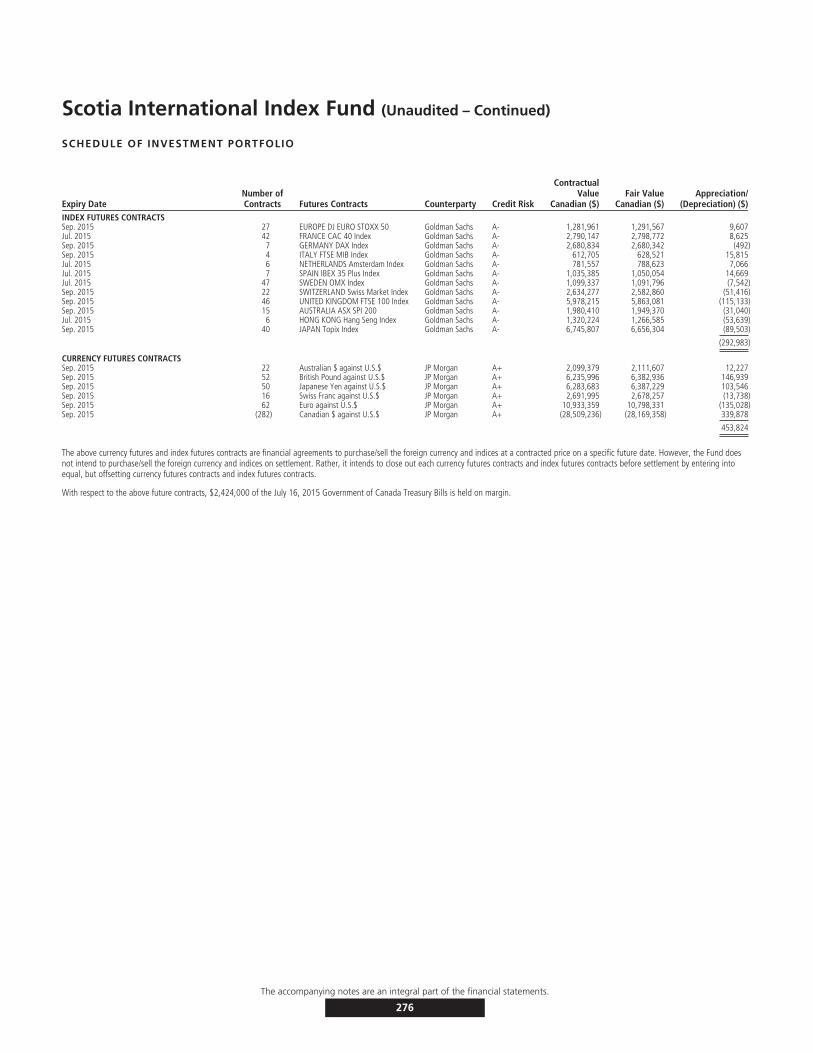
Scotia International Index Fund (Unaudited – Continued)
SCHEDULE OF INVESTMENT PORTFOLIO
Expiry DateNumber ofContracts Futures Contracts Counterparty Credit Risk
ContractualValue
Canadian ($)Fair Value
Canadian ($)Appreciation/
(Depreciation) ($)INDEX FUTURES CONTRACTSSep. 2015 27 EUROPE DJ EURO STOXX 50 Goldman Sachs A- 1,281,961 1,291,567 9,607Jul. 2015 42 FRANCE CAC 40 Index Goldman Sachs A- 2,790,147 2,798,772 8,625Sep. 2015 7 GERMANY DAX Index Goldman Sachs A- 2,680,834 2,680,342 (492)Sep. 2015 4 ITALY FTSE MIB Index Goldman Sachs A- 612,705 628,521 15,815Jul. 2015 6 NETHERLANDS Amsterdam Index Goldman Sachs A- 781,557 788,623 7,066Jul. 2015 7 SPAIN IBEX 35 Plus Index Goldman Sachs A- 1,035,385 1,050,054 14,669Jul. 2015 47 SWEDEN OMX Index Goldman Sachs A- 1,099,337 1,091,796 (7,542)Sep. 2015 22 SWITZERLAND Swiss Market Index Goldman Sachs A- 2,634,277 2,582,860 (51,416)Sep. 2015 46 UNITED KINGDOM FTSE 100 Index Goldman Sachs A- 5,978,215 5,863,081 (115,133)Sep. 2015 15 AUSTRALIA ASX SPI 200 Goldman Sachs A- 1,980,410 1,949,370 (31,040)Jul. 2015 6 HONG KONG Hang Seng Index Goldman Sachs A- 1,320,224 1,266,585 (53,639)Sep. 2015 40 JAPAN Topix Index Goldman Sachs A- 6,745,807 6,656,304 (89,503)
(292,983)
CURRENCY FUTURES CONTRACTSSep. 2015 22 Australian $ against U.S.$ JP Morgan A+ 2,099,379 2,111,607 12,227Sep. 2015 52 British Pound against U.S.$ JP Morgan A+ 6,235,996 6,382,936 146,939Sep. 2015 50 Japanese Yen against U.S.$ JP Morgan A+ 6,283,683 6,387,229 103,546Sep. 2015 16 Swiss Franc against U.S.$ JP Morgan A+ 2,691,995 2,678,257 (13,738)Sep. 2015 62 Euro against U.S.$ JP Morgan A+ 10,933,359 10,798,331 (135,028)Sep. 2015 (282) Canadian $ against U.S.$ JP Morgan A+ (28,509,236) (28,169,358) 339,878
453,824
The above currency futures and index futures contracts are financial agreements to purchase/sell the foreign currency and indices at a contracted price on a specific future date. However, the Fund doesnot intend to purchase/sell the foreign currency and indices on settlement. Rather, it intends to close out each currency futures contracts and index futures contracts before settlement by entering intoequal, but offsetting currency futures contracts and index futures contracts.
With respect to the above future contracts, $2,424,000 of the July 16, 2015 Government of Canada Treasury Bills is held on margin.
The accompanying notes are an integral part of the financial statements.
276

Scotia International Index Fund (Unaudited)
FUND SPECIFIC NOTESFor the periods indicated in Note 1.
1. The Fund (note 1)
The Fund’s investment objective is long-term capitalgrowth by tracking the performance of generally recognizedindexes of established international stock markets. Itcurrently tracks the performance of indexes of establishedmarkets in Europe, Australasia and the Far East.
2. Risks associated with financial instruments (note 4)
i) Interest rate risk
The table below summarizes the Fund’s exposure tointerest rate risk by the remaining term to maturity (earlierof maturity date or interest reset date) of the Fund’sportfolio, excluding cash, underlying funds, preferredshares and overdrafts, as applicable.
Interest rate exposureJune 30, 2015
($)December 31, 2014
($)
Less than 1 year 26,884,659 24,974,9281-3 years – –3-5 years – –5-10 years – –> 10 years – –
26,884,659 24,974,928
ii) Currency risk
The tables below indicate the currencies to which the Fundhad significant exposure, net of the impact of currencyforward contracts and currency spot contracts, if any,based on the monetary and non-monetary assets andliabilities of the Fund. The tables also illustrate thepotential impact on the Fund if the functional currency ofthe Fund had strengthened or weakened by 10% in relationto each of the other currencies, with all other variables heldconstant.
June 30, 2015
Currency
Net currencyexposure
($)
Percentage ofnet assets
(%)
Impact onthe Fund
($)
Percentage ofnet assets
(%)
Australian Dollar (135,091) (0.5) (13,509) (0.0)British Pound (352,572) (1.2) (35,257) (0.1)European Euro (405,600) (1.4) (40,560) (0.1)Hong Kong Dollar 185,822 0.6 18,582 0.1Japanese Yen 196,179 0.7 19,618 0.1Swedish Krona (47,899) (0.2) (4,790) (0.0)Swiss Franc 23,807 0.1 2,381 0.0US Dollar 1,120,031 3.9 112,003 0.4
584,677 2.0 58,468 0.4
December 31, 2014
Currency
Net currencyexposure
($)
Percentage ofnet assets
(%)
Impact onthe Fund
($)
Percentage ofnet assets
(%)
Hong Kong Dollar 1,238,805 4.8 123,881 0.5Swedish Krona 1,004,516 3.9 100,452 0.4Japanese Yen 5,067 0.0 507 0.0Australian Dollar (65,291) (0.3) (6,529) 0.0Swiss Franc (93,296) (0.4) (9,330) 0.0British Pound (106,396) (0.4) (10,640) 0.0European Euro (1,168,856) (4.5) (116,886) (0.5)US Dollar (1,094,511) (4.3) (109,451) (0.4)
(279,962) (1.2) (27,996) 0.0
iii) Price risk
Price risk is the risk that the carrying value of financialinstruments will fluctuate as a result of changes in marketprices (other than those arising from interest rate risk orcurrency risk) caused by factors specific to a security, itsissuer or all factors affecting a market or a market segment.Exposure to price risk is mainly in equities, derivatives andcommodities, if applicable. As at June 30, 2015,approximately 99.8% (December 31, 2014 – 99.4%) of theFund’s net assets were exposed to price risk. If prices ofthese investments had decreased or increased by 10%, withall other variables held constant, net assets of the Fundwould have decreased or increased, respectively, byapproximately $2,864,787 (December 31, 2014 –$2,556,809). In practice, actual results may differ from thissensitivity analysis and the difference could be material.
iv) Credit risk
The table below summarizes the credit ratings of the bondsand debentures, excluding cash and money marketinstruments but including preferred shares and derivatives,as applicable, held by the Fund.
June 30, 2015 December 31, 2014
Percentage oftotal bonds and
debentures(%)
Percentage ofnet assets
(%)
Percentage oftotal bonds and
debentures(%)
Percentage ofnet assets
(%)
Credit ratingsR1-High 76.0 71.1 83.0 80.6R1-Middle 24.0 22.5 13.0 12.6R1-Low – – 4.0 3.9
100.0 93.6 100.0 97.1
v) Liquidity risk
The table below summarizes the Fund’s financial liabilitiesbased on the remaining period to the contractual maturitydate.
The accompanying notes are an integral part of the financial statements.
277

Scotia International Index Fund (Unaudited – Continued)
FUND SPECIFIC NOTESFor the periods indicated in Note 1.
June 30, 2015 December 31, 2014
On demand($)
Less than3 months
($)On demand
($)
Less than3 months
($)
Current liabilities – 55,173 – 13,202Liability for written options – – – –Unrealized loss on derivatives – – – –Redeemable units 28,713,977 – 25,721,130 –
28,713,977 55,173 25,721,130 13,202
Redeemable units are redeemable on demand at theholder’s option. However, the Manager does not expect thatthe contractual maturity disclosed in the table above will berepresentative of the actual cash outflows, as holders ofthese instruments typically retain them for a longer term.
vi) Concentration risk
Concentration risk arises as a result of the concentration ofexposures within the same category, geographical location,asset type or industry sector, as applicable. The table belowis a summary of the Fund’s concentration risk:
Percentage of net assets (%)
June 30, 2015 December 31, 2014
Bankers’ Acceptances 41.1 45.6Bearers’ Deposit Notes 1.4 3.9Commercial Paper 11.1 3.9Treasury Bills 40.0 43.7
vii) Fair value classification (note 2)
The tables below illustrate the classification of the Fund’sfinancial instruments within the fair value hierarchy.
June 30, 2015Level 1
($)Level 2
($)Level 3
($)Total($)
Money market instruments – 26,884,659 – 26,884,659Futures contracts–assets 658,372 – – 658,372
658,372 26,884,659 – 27,543,031
Futures contracts–liabilities (497,531) – – (497,531)
160,841 26,884,659 – 27,045,500
December 31, 2014Level 1
($)Level 2
($)Level 3
($)Total($)
Money market instruments – 24,974,928 – 24,974,928Futures contracts–assets 856,075 – – 856,075
856,075 24,974,928 – 25,831,003
Transfers between levels
During the periods ended June 30, 2015 and December 31,2014, there were no significant transfers between Level 1and Level 2.
3. Offsetting of financial assets and liabilities (note 2)
As at June 30, 2015 or December 31, 2014, the Fund didnot enter into any agreement whereby the financialinstruments were eligible for offset.
4. Interest in Underlying Funds (note 2)
The Fund did not hold any interest in Underlying Funds asat June 30, 2015 or December 31, 2014.
5. Comparison of net asset value per unit and netassets per unit (note 2)
The table below provides a comparison of the net assetvalue per unit and net assets per unit. The primary reasonfor the difference between the net asset value per unit andnet assets per unit, if any, is described in note 2.
June 30, 2015 December 31, 2014
Net asset valueper unit
($)
Net assetsper unit
($)
Net asset valueper unit
($)
Net assetsper unit
($)
Series A 10.29 10.29 9.12 9.12
Series D 9.88 9.87 – –
The accompanying notes are an integral part of the financial statements.
278
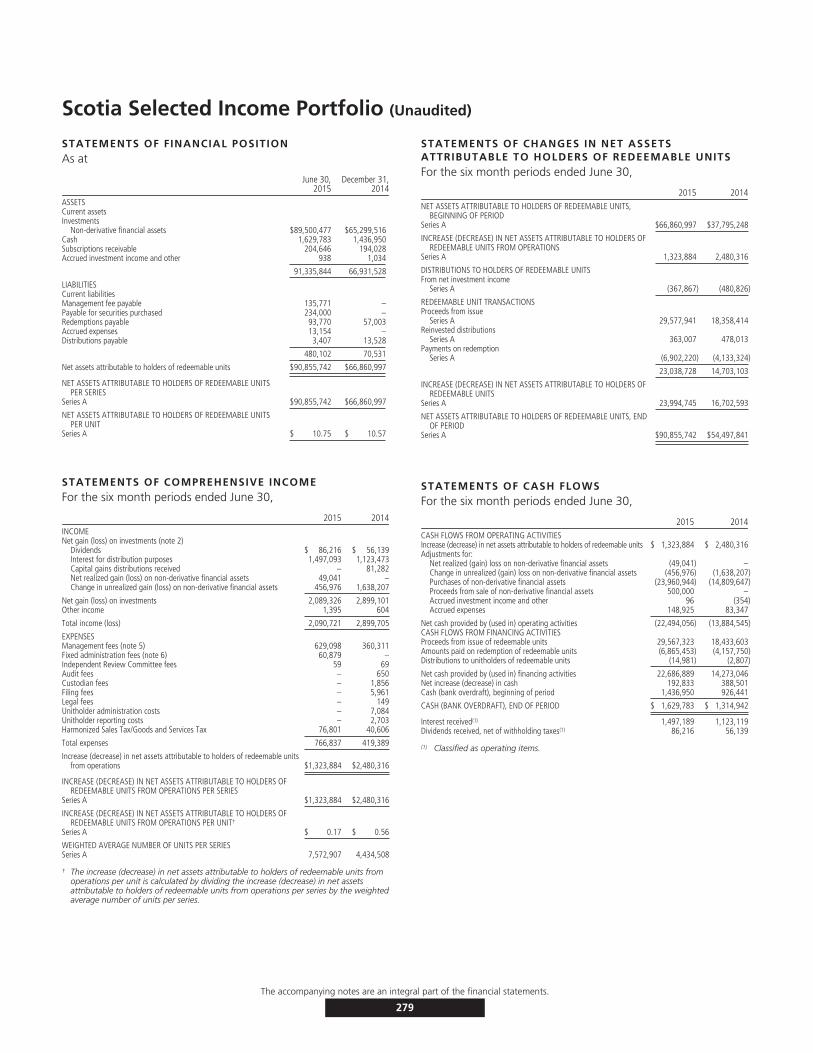
Scotia Selected Income Portfolio (Unaudited)
STATEMENTS OF FINANCIAL POSITIONAs at
June 30,2015
December 31,2014
ASSETSCurrent assetsInvestments
Non-derivative financial assets $89,500,477 $65,299,516Cash 1,629,783 1,436,950Subscriptions receivable 204,646 194,028Accrued investment income and other 938 1,034
91,335,844 66,931,528
LIABILITIESCurrent liabilitiesManagement fee payable 135,771 –Payable for securities purchased 234,000 –Redemptions payable 93,770 57,003Accrued expenses 13,154 –Distributions payable 3,407 13,528
480,102 70,531
Net assets attributable to holders of redeemable units $90,855,742 $66,860,997
NET ASSETS ATTRIBUTABLE TO HOLDERS OF REDEEMABLE UNITSPER SERIES
Series A $90,855,742 $66,860,997
NET ASSETS ATTRIBUTABLE TO HOLDERS OF REDEEMABLE UNITSPER UNIT
Series A $ 10.75 $ 10.57
STATEMENTS OF COMPREHENSIVE INCOMEFor the six month periods ended June 30,
2015 2014INCOMENet gain (loss) on investments (note 2)
Dividends $ 86,216 $ 56,139Interest for distribution purposes 1,497,093 1,123,473Capital gains distributions received – 81,282Net realized gain (loss) on non-derivative financial assets 49,041 –Change in unrealized gain (loss) on non-derivative financial assets 456,976 1,638,207
Net gain (loss) on investments 2,089,326 2,899,101Other income 1,395 604
Total income (loss) 2,090,721 2,899,705
EXPENSESManagement fees (note 5) 629,098 360,311Fixed administration fees (note 6) 60,879 –Independent Review Committee fees 59 69Audit fees – 650Custodian fees – 1,856Filing fees – 5,961Legal fees – 149Unitholder administration costs – 7,084Unitholder reporting costs – 2,703Harmonized Sales Tax/Goods and Services Tax 76,801 40,606
Total expenses 766,837 419,389
Increase (decrease) in net assets attributable to holders of redeemable unitsfrom operations $1,323,884 $2,480,316
INCREASE (DECREASE) IN NET ASSETS ATTRIBUTABLE TO HOLDERS OFREDEEMABLE UNITS FROM OPERATIONS PER SERIES
Series A $1,323,884 $2,480,316
INCREASE (DECREASE) IN NET ASSETS ATTRIBUTABLE TO HOLDERS OFREDEEMABLE UNITS FROM OPERATIONS PER UNIT†
Series A $ 0.17 $ 0.56
WEIGHTED AVERAGE NUMBER OF UNITS PER SERIESSeries A 7,572,907 4,434,508
† The increase (decrease) in net assets attributable to holders of redeemable units fromoperations per unit is calculated by dividing the increase (decrease) in net assetsattributable to holders of redeemable units from operations per series by the weightedaverage number of units per series.
STATEMENTS OF CHANGES IN NET ASSETSATTRIBUTABLE TO HOLDERS OF REDEEMABLE UNITSFor the six month periods ended June 30,
2015 2014NET ASSETS ATTRIBUTABLE TO HOLDERS OF REDEEMABLE UNITS,
BEGINNING OF PERIODSeries A $66,860,997 $37,795,248
INCREASE (DECREASE) IN NET ASSETS ATTRIBUTABLE TO HOLDERS OFREDEEMABLE UNITS FROM OPERATIONS
Series A 1,323,884 2,480,316
DISTRIBUTIONS TO HOLDERS OF REDEEMABLE UNITSFrom net investment income
Series A (367,867) (480,826)
REDEEMABLE UNIT TRANSACTIONSProceeds from issue
Series A 29,577,941 18,358,414Reinvested distributions
Series A 363,007 478,013Payments on redemption
Series A (6,902,220) (4,133,324)
23,038,728 14,703,103
INCREASE (DECREASE) IN NET ASSETS ATTRIBUTABLE TO HOLDERS OFREDEEMABLE UNITS
Series A 23,994,745 16,702,593
NET ASSETS ATTRIBUTABLE TO HOLDERS OF REDEEMABLE UNITS, ENDOF PERIOD
Series A $90,855,742 $54,497,841
STATEMENTS OF CASH FLOWSFor the six month periods ended June 30,
2015 2014CASH FLOWS FROM OPERATING ACTIVITIESIncrease (decrease) in net assets attributable to holders of redeemable units $ 1,323,884 $ 2,480,316Adjustments for:
Net realized (gain) loss on non-derivative financial assets (49,041) –Change in unrealized (gain) loss on non-derivative financial assets (456,976) (1,638,207)Purchases of non-derivative financial assets (23,960,944) (14,809,647)Proceeds from sale of non-derivative financial assets 500,000 –Accrued investment income and other 96 (354)Accrued expenses 148,925 83,347
Net cash provided by (used in) operating activities (22,494,056) (13,884,545)CASH FLOWS FROM FINANCING ACTIVITIESProceeds from issue of redeemable units 29,567,323 18,433,603Amounts paid on redemption of redeemable units (6,865,453) (4,157,750)Distributions to unitholders of redeemable units (14,981) (2,807)
Net cash provided by (used in) financing activities 22,686,889 14,273,046Net increase (decrease) in cash 192,833 388,501Cash (bank overdraft), beginning of period 1,436,950 926,441
CASH (BANK OVERDRAFT), END OF PERIOD $ 1,629,783 $ 1,314,942
Interest received(1) 1,497,189 1,123,119Dividends received, net of withholding taxes(1) 86,216 56,139
(1) Classified as operating items.
The accompanying notes are an integral part of the financial statements.
279
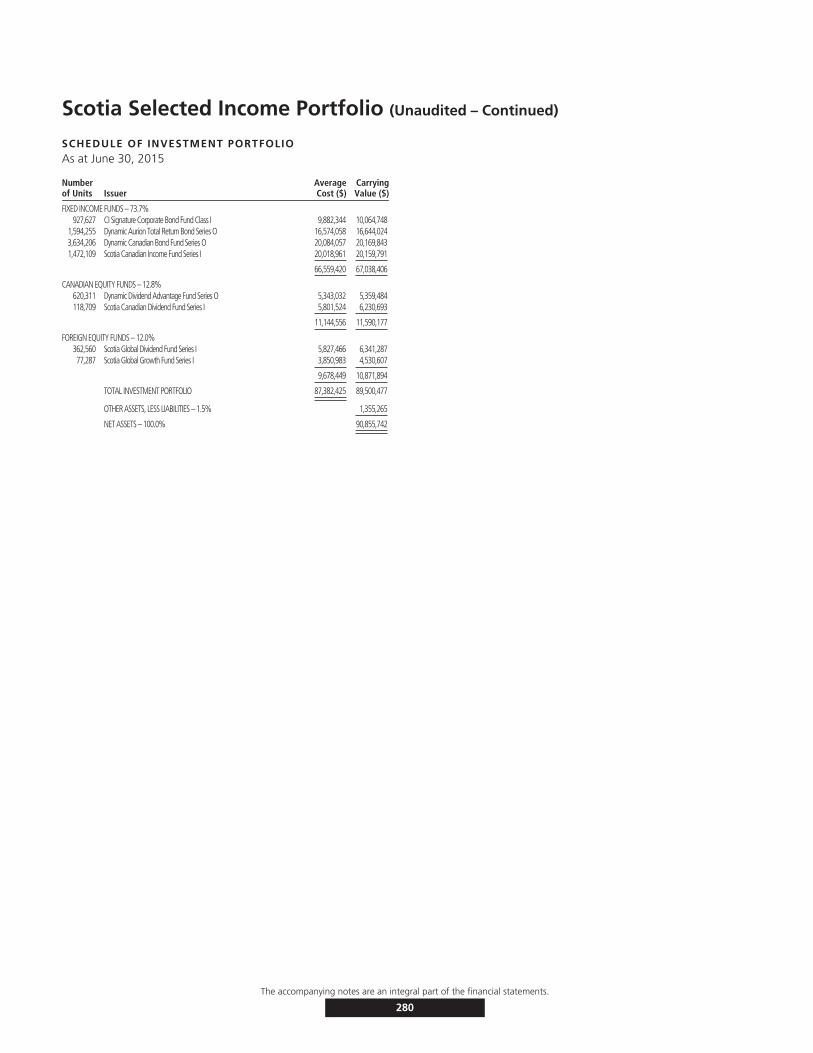
Scotia Selected Income Portfolio (Unaudited – Continued)
SCHEDULE OF INVESTMENT PORTFOLIOAs at June 30, 2015
Numberof Units Issuer
AverageCost ($)
CarryingValue ($)
FIXED INCOME FUNDS – 73.7%927,627 CI Signature Corporate Bond Fund Class I 9,882,344 10,064,748
1,594,255 Dynamic Aurion Total Return Bond Series O 16,574,058 16,644,0243,634,206 Dynamic Canadian Bond Fund Series O 20,084,057 20,169,8431,472,109 Scotia Canadian Income Fund Series I 20,018,961 20,159,791
66,559,420 67,038,406
CANADIAN EQUITY FUNDS – 12.8%620,311 Dynamic Dividend Advantage Fund Series O 5,343,032 5,359,484118,709 Scotia Canadian Dividend Fund Series I 5,801,524 6,230,693
11,144,556 11,590,177
FOREIGN EQUITY FUNDS – 12.0%362,560 Scotia Global Dividend Fund Series I 5,827,466 6,341,28777,287 Scotia Global Growth Fund Series I 3,850,983 4,530,607
9,678,449 10,871,894
TOTAL INVESTMENT PORTFOLIO 87,382,425 89,500,477
OTHER ASSETS, LESS LIABILITIES – 1.5% 1,355,265
NET ASSETS – 100.0% 90,855,742
The accompanying notes are an integral part of the financial statements.
280

Scotia Selected Income Portfolio (Unaudited)
FUND SPECIFIC NOTESFor the periods indicated in Note 1.
1. The Fund (note 1)
The Fund’s investment objective is to achieve acombination of a steady flow of income with the potentialfor capital gains. It invests primarily in a diversified mix ofequity and income mutual funds managed by us or by othermutual fund managers. The portfolio is an asset allocationfund that allocates investment between two asset classes:fixed income and equities.
The Fund invests primarily in mutual funds managed by theManager and/or by the third party investment managers(the ‘‘Underlying Funds’’). To ensure the Fund’scomposition meets the investment objectives of the Fund,the portfolio advisor monitors the Underlying Funds on anongoing basis and rebalances the Fund’s assets among theUnderlying Funds.
2. Risks associated with financial instruments (note 4)
i) Interest rate risk
The Fund invests in Underlying Funds, which are exposedto interest rate risk. As at June 30, 2015, had the prevailinginterest rates increased or decreased by 0.25%, assuming aparallel shift in the yield curve and all other variables heldconstant, net assets attributable to holders of redeemableunits would have decreased or increased, respectively, by$849,267, or approximately 0.9% (December 31, 2014 –$615,729, or approximately 0.9%). In practice, actualresults may differ from this sensitivity analysis and thedifference could be material.
ii) Currency risk
The Fund could be exposed to indirect currency risk to theextent that the Underlying Funds held financialinstruments that were denominated in a currency otherthan its functional currency.
iii) Price risk
Price risk is the risk that the carrying value of financialinstruments will fluctuate as a result of changes in marketprices (other than those arising from interest rate risk orcurrency risk) caused by factors specific to a security, itsissuer or all factors affecting a market or a market segment.Exposure to price risk is mainly in equities, derivatives andcommodities, if applicable. As at June 30, 2015,approximately 24.8% (December 31, 2014 – 25.0%) of theFund’s net assets were invested in Underlying Funds whichwere exposed to price risk. If prices of the Underlying
Funds’ investments had decreased or increased by 10%,with all other variables held constant, net assets of theFund would have decreased or increased, respectively, byapproximately $2,246,207 (December 31, 2014 –$1,669,722). In practice, actual results may differ from thissensitivity analysis and the difference could be material.
iv) Credit risk
The Fund could be exposed to indirect credit risk to theextent that the Underlying Funds invested in bonds anddebentures, preferred shares and derivatives.
v) Liquidity risk
The table below summarizes the Fund’s financial liabilitiesbased on the remaining period to the contractual maturitydate.
June 30, 2015 December 31, 2014
On demand($)
Less than3 months
($)On demand
($)
Less than3 months
($)
Current liabilities – 480,102 – 70,531Liability for written options – – – –Unrealized loss on derivatives – – – –Redeemable units 90,855,742 – 66,860,997 –
90,855,742 480,102 66,860,997 70,531
Redeemable units are redeemable on demand at theholder’s option. However, the Manager does not expect thatthe contractual maturity disclosed in the table above will berepresentative of the actual cash outflows, as holders ofthese instruments typically retain them for a longer term.
vi) Concentration risk
Concentration risk arises as a result of the concentration ofexposures within the same category, geographical location,asset type or industry sector, as applicable. The table belowis a summary of the Fund’s concentration risk:
Percentage of net assets (%)
June 30, 2015 December 31, 2014
Canadian Equity Funds 12.8 13.0Fixed Income Funds 73.7 72.7Foreign Equity Funds 12.0 12.0
vii) Fair value classification (note 2)
The tables below illustrate the classification of the Fund’sfinancial instruments within the fair value hierarchy.
June 30, 2015Level 1
($)Level 2
($)Level 3
($)Total($)
Underlying funds 89,500,477 – – 89,500,477
89,500,477 – – 89,500,477
The accompanying notes are an integral part of the financial statements.
281
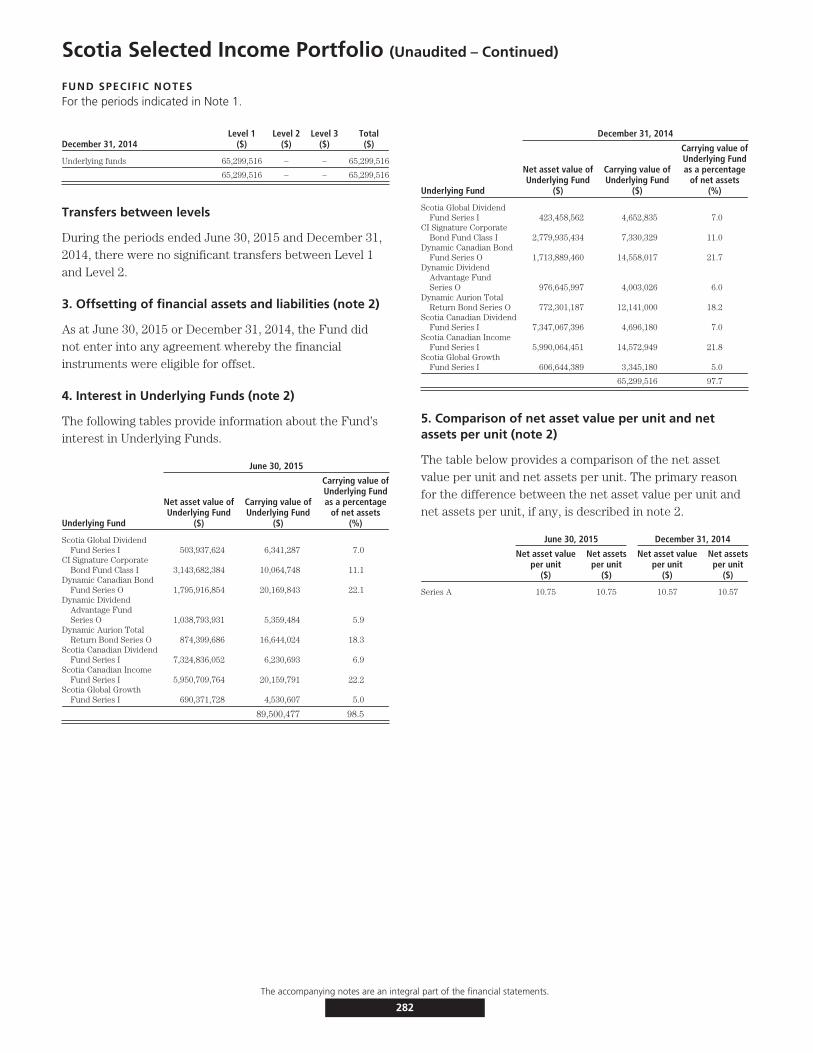
Scotia Selected Income Portfolio (Unaudited – Continued)
FUND SPECIFIC NOTESFor the periods indicated in Note 1.
December 31, 2014Level 1
($)Level 2
($)Level 3
($)Total($)
Underlying funds 65,299,516 – – 65,299,516
65,299,516 – – 65,299,516
Transfers between levels
During the periods ended June 30, 2015 and December 31,2014, there were no significant transfers between Level 1and Level 2.
3. Offsetting of financial assets and liabilities (note 2)
As at June 30, 2015 or December 31, 2014, the Fund didnot enter into any agreement whereby the financialinstruments were eligible for offset.
4. Interest in Underlying Funds (note 2)
The following tables provide information about the Fund’sinterest in Underlying Funds.
June 30, 2015
Underlying Fund
Net asset value ofUnderlying Fund
($)
Carrying value ofUnderlying Fund
($)
Carrying value ofUnderlying Fundas a percentage
of net assets(%)
Scotia Global DividendFund Series I 503,937,624 6,341,287 7.0
CI Signature CorporateBond Fund Class I 3,143,682,384 10,064,748 11.1
Dynamic Canadian BondFund Series O 1,795,916,854 20,169,843 22.1
Dynamic DividendAdvantage FundSeries O 1,038,793,931 5,359,484 5.9
Dynamic Aurion TotalReturn Bond Series O 874,399,686 16,644,024 18.3
Scotia Canadian DividendFund Series I 7,324,836,052 6,230,693 6.9
Scotia Canadian IncomeFund Series I 5,950,709,764 20,159,791 22.2
Scotia Global GrowthFund Series I 690,371,728 4,530,607 5.0
89,500,477 98.5
December 31, 2014
Underlying Fund
Net asset value ofUnderlying Fund
($)
Carrying value ofUnderlying Fund
($)
Carrying value ofUnderlying Fundas a percentage
of net assets(%)
Scotia Global DividendFund Series I 423,458,562 4,652,835 7.0
CI Signature CorporateBond Fund Class I 2,779,935,434 7,330,329 11.0
Dynamic Canadian BondFund Series O 1,713,889,460 14,558,017 21.7
Dynamic DividendAdvantage FundSeries O 976,645,997 4,003,026 6.0
Dynamic Aurion TotalReturn Bond Series O 772,301,187 12,141,000 18.2
Scotia Canadian DividendFund Series I 7,347,067,396 4,696,180 7.0
Scotia Canadian IncomeFund Series I 5,990,064,451 14,572,949 21.8
Scotia Global GrowthFund Series I 606,644,389 3,345,180 5.0
65,299,516 97.7
5. Comparison of net asset value per unit and netassets per unit (note 2)
The table below provides a comparison of the net assetvalue per unit and net assets per unit. The primary reasonfor the difference between the net asset value per unit andnet assets per unit, if any, is described in note 2.
June 30, 2015 December 31, 2014
Net asset valueper unit
($)
Net assetsper unit
($)
Net asset valueper unit
($)
Net assetsper unit
($)
Series A 10.75 10.75 10.57 10.57
The accompanying notes are an integral part of the financial statements.
282

Scotia Selected Balanced Income Portfolio (Unaudited)
STATEMENTS OF FINANCIAL POSITIONAs at
June 30,2015
December 31,2014
ASSETSCurrent assetsInvestments
Non-derivative financial assets $869,149,029 $782,404,299Cash 5,807,404 3,794,006Subscriptions receivable 1,036,051 1,307,469Accrued investment income and other 3,266 3,682
875,995,750 787,509,456
LIABILITIESCurrent liabilitiesManagement fee payable 1,362,728 –Payable for securities purchased 100,000 –Redemptions payable 878,478 275,616Accrued expenses 42,883 –Distributions payable – 76,277
2,384,089 351,893
Net assets attributable to holders of redeemable units $873,611,661 $787,157,563
NET ASSETS ATTRIBUTABLE TO HOLDERS OF REDEEMABLE UNITSPER SERIES
Series A $872,670,212 $786,282,264Advisor Series $ 941,449 $ 875,299
NET ASSETS ATTRIBUTABLE TO HOLDERS OF REDEEMABLE UNITSPER UNIT
Series A $ 13.43 $ 13.05Advisor Series $ 13.30 $ 12.95
STATEMENTS OF COMPREHENSIVE INCOMEFor the six month periods ended June 30,
2015 2014INCOMENet gain (loss) on investments (note 2)
Dividends $ 1,337,323 $ 1,217,121Interest for distribution purposes 12,823,889 10,643,556Capital gains distributions received 2,716,543 –Net realized gain (loss) on non-derivative financial assets 1,789,968 703,255Change in unrealized gain (loss) on non-derivative financial assets 11,995,827 29,676,876
Net gain (loss) on investments 30,663,550 42,240,808Other income 10,588 7,058
Total income (loss) 30,674,138 42,247,866
EXPENSESManagement fees (note 5) 6,742,624 5,617,141Fixed administration fees (note 6) 217,507 –Independent Review Committee fees 618 1,045Audit fees – 7,567Custodian fees – 477Filing fees – 22,150Legal fees – 2,233Unitholder administration costs – 113,351Unitholder reporting costs – 15,858Harmonized Sales Tax/Goods and Services Tax 787,229 648,487
Total expenses 7,747,978 6,428,309Expenses absorbed by the Manager (5,958) (5,935)
Net expenses 7,742,020 6,422,374
Increase (decrease) in net assets attributable to holders of redeemableunits from operations $22,932,118 $35,825,492
INCREASE (DECREASE) IN NET ASSETS ATTRIBUTABLE TO HOLDERS OFREDEEMABLE UNITS FROM OPERATIONS PER SERIES
Series A $22,907,780 $35,785,267Advisor Series $ 24,338 $ 40,225
INCREASE (DECREASE) IN NET ASSETS ATTRIBUTABLE TO HOLDERS OFREDEEMABLE UNITS FROM OPERATIONS PER UNIT†
Series A $ 0.36 $ 0.65Advisor Series $ 0.35 $ 0.61
WEIGHTED AVERAGE NUMBER OF UNITS PER SERIESSeries A 63,027,950 55,402,847Advisor Series 69,552 65,531
† The increase (decrease) in net assets attributable to holders of redeemable units fromoperations per unit is calculated by dividing the increase (decrease) in net assetsattributable to holders of redeemable units from operations per series by the weightedaverage number of units per series.
STATEMENTS OF CHANGES IN NET ASSETSATTRIBUTABLE TO HOLDERS OF REDEEMABLE UNITSFor the six month periods ended June 30,
2015 2014NET ASSETS ATTRIBUTABLE TO HOLDERS OF REDEEMABLE UNITS,
BEGINNING OF PERIODSeries A $786,282,264 $654,740,448Advisor Series 875,299 813,775
787,157,563 655,554,223
INCREASE (DECREASE) IN NET ASSETS ATTRIBUTABLE TO HOLDERSOF REDEEMABLE UNITS FROM OPERATIONS
Series A 22,907,780 35,785,267Advisor Series 24,338 40,225
22,932,118 35,825,492
REDEEMABLE UNIT TRANSACTIONSProceeds from issue
Series A 126,768,488 109,447,582Advisor Series 42,038 100,442
Payments on redemptionSeries A (63,288,320) (57,674,163)Advisor Series (226) (84,045)
63,521,980 51,789,816
INCREASE (DECREASE) IN NET ASSETS ATTRIBUTABLE TO HOLDERSOF REDEEMABLE UNITS
Series A 86,387,948 87,558,686Advisor Series 66,150 56,622
86,454,098 87,615,308
NET ASSETS ATTRIBUTABLE TO HOLDERS OF REDEEMABLE UNITS,END OF PERIOD
Series A 872,670,212 742,299,134Advisor Series 941,449 870,397
$873,611,661 $743,169,531
STATEMENTS OF CASH FLOWSFor the six month periods ended June 30,
2015 2014CASH FLOWS FROM OPERATING ACTIVITIESIncrease (decrease) in net assets attributable to holders of redeemable
units $ 22,932,118 $ 35,825,492Adjustments for:
Net realized (gain) loss on non-derivative financial assets (1,789,968) (703,255)Change in unrealized (gain) loss on non-derivative financial assets (11,995,827) (29,676,876)Purchases of non-derivative financial assets (80,858,936) (59,810,236)Proceeds from sale of non-derivative financial assets 8,000,000 3,310,000Accrued investment income and other 416 (293)Accrued expenses 1,405,611 1,152,896
Net cash provided by (used in) operating activities (62,306,586) (49,902,272)CASH FLOWS FROM FINANCING ACTIVITIESProceeds from issue of redeemable units 127,081,247 109,465,491Amounts paid on redemption of redeemable units (62,685,684) (57,684,909)Distributions to unitholders of redeemable units (75,579) (34,505)
Net cash provided by (used in) financing activities 64,319,984 51,746,077Net increase (decrease) in cash 2,013,398 1,843,805Cash (bank overdraft), beginning of period 3,794,006 3,232,979
CASH (BANK OVERDRAFT), END OF PERIOD $ 5,807,404 $ 5,076,784
Interest received(1) 12,824,304 10,643,263Dividends received, net of withholding taxes(1) 1,337,323 1,217,121
(1) Classified as operating items.
The accompanying notes are an integral part of the financial statements.
283
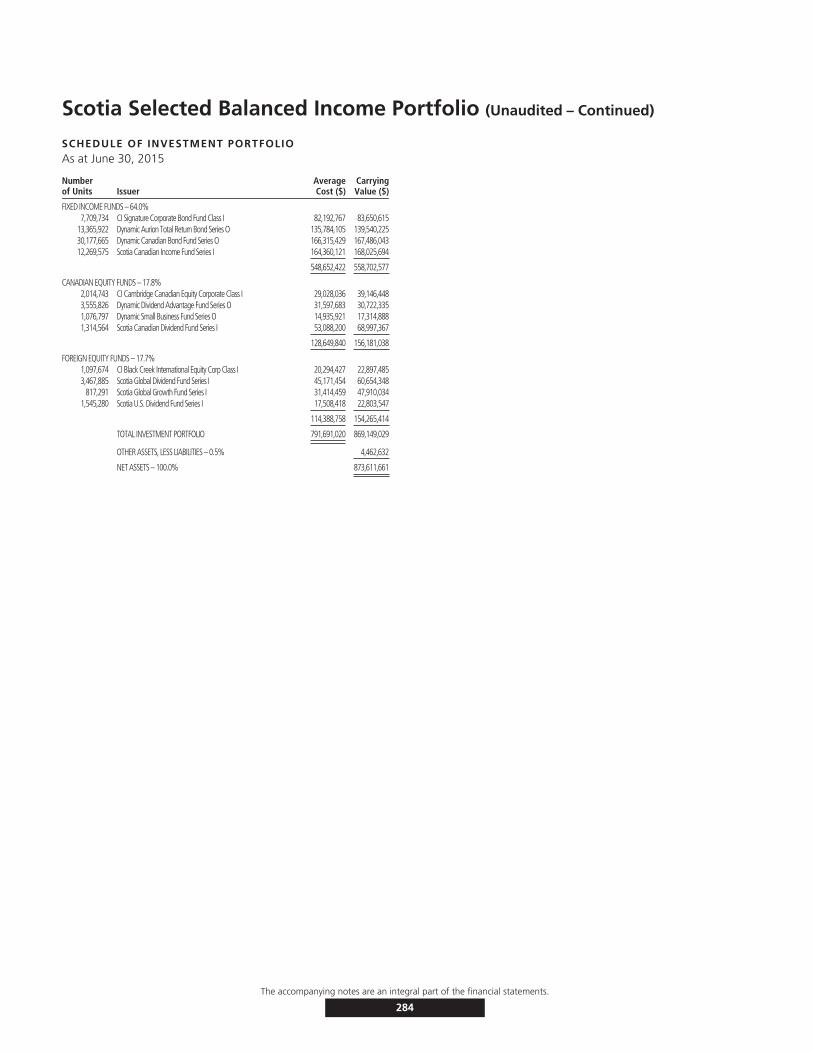
Scotia Selected Balanced Income Portfolio (Unaudited – Continued)
SCHEDULE OF INVESTMENT PORTFOLIOAs at June 30, 2015
Numberof Units Issuer
AverageCost ($)
CarryingValue ($)
FIXED INCOME FUNDS – 64.0%7,709,734 CI Signature Corporate Bond Fund Class I 82,192,767 83,650,615
13,365,922 Dynamic Aurion Total Return Bond Series O 135,784,105 139,540,22530,177,665 Dynamic Canadian Bond Fund Series O 166,315,429 167,486,04312,269,575 Scotia Canadian Income Fund Series I 164,360,121 168,025,694
548,652,422 558,702,577
CANADIAN EQUITY FUNDS – 17.8%2,014,743 CI Cambridge Canadian Equity Corporate Class I 29,028,036 39,146,4483,555,826 Dynamic Dividend Advantage Fund Series O 31,597,683 30,722,3351,076,797 Dynamic Small Business Fund Series O 14,935,921 17,314,8881,314,564 Scotia Canadian Dividend Fund Series I 53,088,200 68,997,367
128,649,840 156,181,038
FOREIGN EQUITY FUNDS – 17.7%1,097,674 CI Black Creek International Equity Corp Class I 20,294,427 22,897,4853,467,885 Scotia Global Dividend Fund Series I 45,171,454 60,654,348
817,291 Scotia Global Growth Fund Series I 31,414,459 47,910,0341,545,280 Scotia U.S. Dividend Fund Series I 17,508,418 22,803,547
114,388,758 154,265,414
TOTAL INVESTMENT PORTFOLIO 791,691,020 869,149,029
OTHER ASSETS, LESS LIABILITIES – 0.5% 4,462,632
NET ASSETS – 100.0% 873,611,661
The accompanying notes are an integral part of the financial statements.
284

Scotia Selected Balanced Income Portfolio (Unaudited)
FUND SPECIFIC NOTESFor the periods indicated in Note 1.
1. The Fund (note 1)
The Fund’s investment objective is to achieve a balance ofcurrent income and long-term capital appreciation, with abias towards income. It invests primarily in a diversified mixof equity and income mutual funds managed by othermutual fund managers and by us. The portfolio is an assetallocation fund that allocates investment between two assetclasses: fixed income and equities.
The Fund invests primarily in mutual funds managed by theManager and/or by the third party investment managers(the ‘‘Underlying Funds’’). To ensure the Fund’scomposition meets the investment objectives of the Fund,the portfolio advisor monitors the Underlying Funds on anongoing basis and rebalances the Fund’s assets among theUnderlying Funds.
2. Risks associated with financial instruments (note 4)
i) Interest rate risk
The Fund invests in Underlying Funds, which are exposedto interest rate risk. As at June 30, 2015, had the prevailinginterest rates increased or decreased by 0.25%, assuming aparallel shift in the yield curve and all other variables heldconstant, net assets attributable to holders of redeemableunits would have decreased or increased, respectively, by$7,081,823, or approximately 0.8% (December 31, 2014 –$6,338,075, or approximately 0.8%). In practice, actualresults may differ from this sensitivity analysis and thedifference could be material.
ii) Currency risk
The Fund could be exposed to indirect currency risk to theextent that the Underlying Funds held financialinstruments that were denominated in a currency otherthan its functional currency.
iii) Price risk
Price risk is the risk that the carrying value of financialinstruments will fluctuate as a result of changes in marketprices (other than those arising from interest rate risk orcurrency risk) caused by factors specific to a security, itsissuer or all factors affecting a market or a market segment.Exposure to price risk is mainly in equities, derivatives andcommodities, if applicable. As at June 30, 2015,approximately 35.5% (December 31, 2014 – 35.8%) of theFund’s net assets were invested in Underlying Funds whichwere exposed to price risk. If prices of the Underlying
Funds’ investments had decreased or increased by 10%,with all other variables held constant, net assets of theFund would have decreased or increased, respectively, byapproximately $31,044,645 (December 31, 2014 –$28,183,637). In practice, actual results may differ from thissensitivity analysis and the difference could be material.
iv) Credit risk
The Fund could be exposed to indirect credit risk to theextent that the Underlying Funds invested in bonds anddebentures, preferred shares and derivatives.
v) Liquidity risk
The table below summarizes the Fund’s financial liabilitiesbased on the remaining period to the contractual maturitydate.
June 30, 2015 December 31, 2014
On demand($)
Less than3 months
($)On demand
($)
Less than3 months
($)
Current liabilities – 2,384,089 – 351,893Liability for written options – – – –Unrealized loss on derivatives – – – –Redeemable units 873,611,661 – 787,157,563 –
873,611,661 2,384,089 787,157,563 351,893
Redeemable units are redeemable on demand at theholder’s option. However, the Manager does not expect thatthe contractual maturity disclosed in the table above will berepresentative of the actual cash outflows, as holders ofthese instruments typically retain them for a longer term.
vi) Concentration risk
Concentration risk arises as a result of the concentration ofexposures within the same category, geographical location,asset type or industry sector, as applicable. The table belowis a summary of the Fund’s concentration risk:
Percentage of net assets (%)
June 30, 2015 December 31, 2014
Canadian Equity Funds 17.8 18.2Fixed Income Funds 64.0 63.6Foreign Equity Funds 17.7 17.6
vii) Fair value classification (note 2)
The tables below illustrate the classification of the Fund’sfinancial instruments within the fair value hierarchy.
June 30, 2015Level 1
($)Level 2
($)Level 3
($)Total($)
Underlying funds 869,149,029 – – 869,149,029
869,149,029 – – 869,149,029
The accompanying notes are an integral part of the financial statements.
285

Scotia Selected Balanced Income Portfolio (Unaudited – Continued)
FUND SPECIFIC NOTESFor the periods indicated in Note 1.
December 31, 2014Level 1
($)Level 2
($)Level 3
($)Total($)
Underlying funds 782,404,299 – – 782,404,299
782,404,299 – – 782,404,299
Transfers between levels
During the periods ended June 30, 2015 and December 31,2014, there were no significant transfers between Level 1and Level 2.
3. Offsetting of financial assets and liabilities (note 2)
As at June 30, 2015 or December 31, 2014, the Fund didnot enter into any agreement whereby the financialinstruments were eligible for offset.
4. Interest in Underlying Funds (note 2)
The following tables provide information about the Fund’sinterest in Underlying Funds.
June 30, 2015
Underlying Fund
Net asset value ofUnderlying Fund
($)
Carrying value ofUnderlying Fund
($)
Carrying value ofUnderlying Fundas a percentage
of net assets(%)
Scotia Global DividendFund Series I 503,937,624 60,654,348 6.9
Scotia U.S. Dividend FundSeries I 208,534,510 22,803,547 2.6
CI Cambridge CanadianEquity Corporate Class I 4,000,996,546 39,146,448 4.5
CI Black CreekInternational EquityCorp Class I 861,204,939 22,897,485 2.6
CI Signature CorporateBond Fund Class I 3,143,682,384 83,650,615 9.6
Dynamic Small BusinessFund Series O 572,121,025 17,314,888 2.0
Dynamic Canadian BondFund Series O 1,795,916,854 167,486,043 19.2
Dynamic DividendAdvantage FundSeries O 1,038,793,931 30,722,335 3.5
Dynamic Aurion TotalReturn Bond Series O 874,399,686 139,540,225 16.0
Scotia Canadian DividendFund Series I 7,324,836,052 68,997,367 7.9
Scotia Canadian IncomeFund Series I 5,950,709,764 168,025,694 19.2
Scotia Global Growth FundSeries I 690,371,728 47,910,034 5.5
869,149,029 99.5
December 31, 2014
Underlying Fund
Net asset value ofUnderlying Fund
($)
Carrying value ofUnderlying Fund
($)
Carrying value ofUnderlying Fundas a percentage
of net assets(%)
Scotia Global DividendFund Series I 423,458,562 55,403,223 7.0
Scotia U.S. Dividend FundSeries I 174,194,892 20,508,437 2.6
CI Cambridge CanadianEquity Corporate Class I 3,722,459,360 36,691,903 4.7
CI Black CreekInternational EquityCorp Class I 685,165,882 19,844,147 2.4
CI Signature CorporateBond Fund Class I 2,779,935,434 75,291,533 9.6
Dynamic Small BusinessFund Series O 559,673,399 15,634,563 2.0
Dynamic Canadian BondFund Series O 1,713,889,460 149,497,526 19.0
Dynamic DividendAdvantage FundSeries O 976,645,997 27,344,087 3.5
Dynamic Aurion TotalReturn Bond Series O 772,301,187 126,046,906 16.0
Scotia Canadian DividendFund Series I 7,347,067,396 63,262,217 8.0
Scotia Canadian IncomeFund Series I 5,990,064,451 149,731,969 19.0
Scotia Global Growth FundSeries I 606,644,389 43,147,788 5.5
782,404,299 99.4
5. Comparison of net asset value per unit and netassets per unit (note 2)
The table below provides a comparison of the net assetvalue per unit and net assets per unit. The primary reasonfor the difference between the net asset value per unit andnet assets per unit, if any, is described in note 2.
June 30, 2015 December 31, 2014
Net asset valueper unit
($)
Net assetsper unit
($)
Net asset valueper unit
($)
Net assetsper unit
($)
Series A 13.43 13.43 13.05 13.05
Advisor Series 13.30 13.30 12.95 12.95
The accompanying notes are an integral part of the financial statements.
286
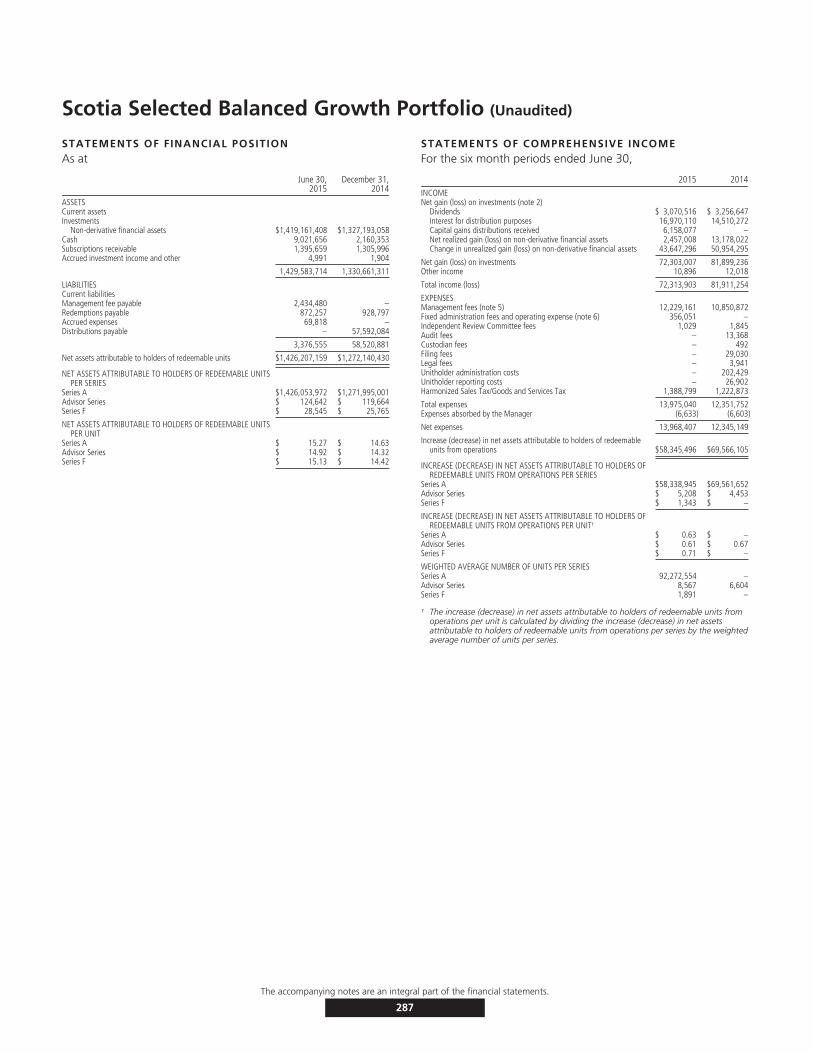
Scotia Selected Balanced Growth Portfolio (Unaudited)
STATEMENTS OF FINANCIAL POSITIONAs at
June 30,2015
December 31,2014
ASSETSCurrent assetsInvestments
Non-derivative financial assets $1,419,161,408 $1,327,193,058Cash 9,021,656 2,160,353Subscriptions receivable 1,395,659 1,305,996Accrued investment income and other 4,991 1,904
1,429,583,714 1,330,661,311
LIABILITIESCurrent liabilitiesManagement fee payable 2,434,480 –Redemptions payable 872,257 928,797Accrued expenses 69,818 –Distributions payable – 57,592,084
3,376,555 58,520,881
Net assets attributable to holders of redeemable units $1,426,207,159 $1,272,140,430
NET ASSETS ATTRIBUTABLE TO HOLDERS OF REDEEMABLE UNITSPER SERIES
Series A $1,426,053,972 $1,271,995,001Advisor Series $ 124,642 $ 119,664Series F $ 28,545 $ 25,765
NET ASSETS ATTRIBUTABLE TO HOLDERS OF REDEEMABLE UNITSPER UNIT
Series A $ 15.27 $ 14.63Advisor Series $ 14.92 $ 14.32Series F $ 15.13 $ 14.42
STATEMENTS OF COMPREHENSIVE INCOMEFor the six month periods ended June 30,
2015 2014INCOMENet gain (loss) on investments (note 2)
Dividends $ 3,070,516 $ 3,256,647Interest for distribution purposes 16,970,110 14,510,272Capital gains distributions received 6,158,077 –Net realized gain (loss) on non-derivative financial assets 2,457,008 13,178,022Change in unrealized gain (loss) on non-derivative financial assets 43,647,296 50,954,295
Net gain (loss) on investments 72,303,007 81,899,236Other income 10,896 12,018
Total income (loss) 72,313,903 81,911,254
EXPENSESManagement fees (note 5) 12,229,161 10,850,872Fixed administration fees and operating expense (note 6) 356,051 –Independent Review Committee fees 1,029 1,845Audit fees – 13,368Custodian fees – 492Filing fees – 29,030Legal fees – 3,941Unitholder administration costs – 202,429Unitholder reporting costs – 26,902Harmonized Sales Tax/Goods and Services Tax 1,388,799 1,222,873
Total expenses 13,975,040 12,351,752Expenses absorbed by the Manager (6,633) (6,603)
Net expenses 13,968,407 12,345,149
Increase (decrease) in net assets attributable to holders of redeemableunits from operations $58,345,496 $69,566,105
INCREASE (DECREASE) IN NET ASSETS ATTRIBUTABLE TO HOLDERS OFREDEEMABLE UNITS FROM OPERATIONS PER SERIES
Series A $58,338,945 $69,561,652Advisor Series $ 5,208 $ 4,453Series F $ 1,343 $ –
INCREASE (DECREASE) IN NET ASSETS ATTRIBUTABLE TO HOLDERS OFREDEEMABLE UNITS FROM OPERATIONS PER UNIT†
Series A $ 0.63 $ –Advisor Series $ 0.61 $ 0.67Series F $ 0.71 $ –
WEIGHTED AVERAGE NUMBER OF UNITS PER SERIESSeries A 92,272,554 –Advisor Series 8,567 6,604Series F 1,891 –
† The increase (decrease) in net assets attributable to holders of redeemable units fromoperations per unit is calculated by dividing the increase (decrease) in net assetsattributable to holders of redeemable units from operations per series by the weightedaverage number of units per series.
The accompanying notes are an integral part of the financial statements.
287
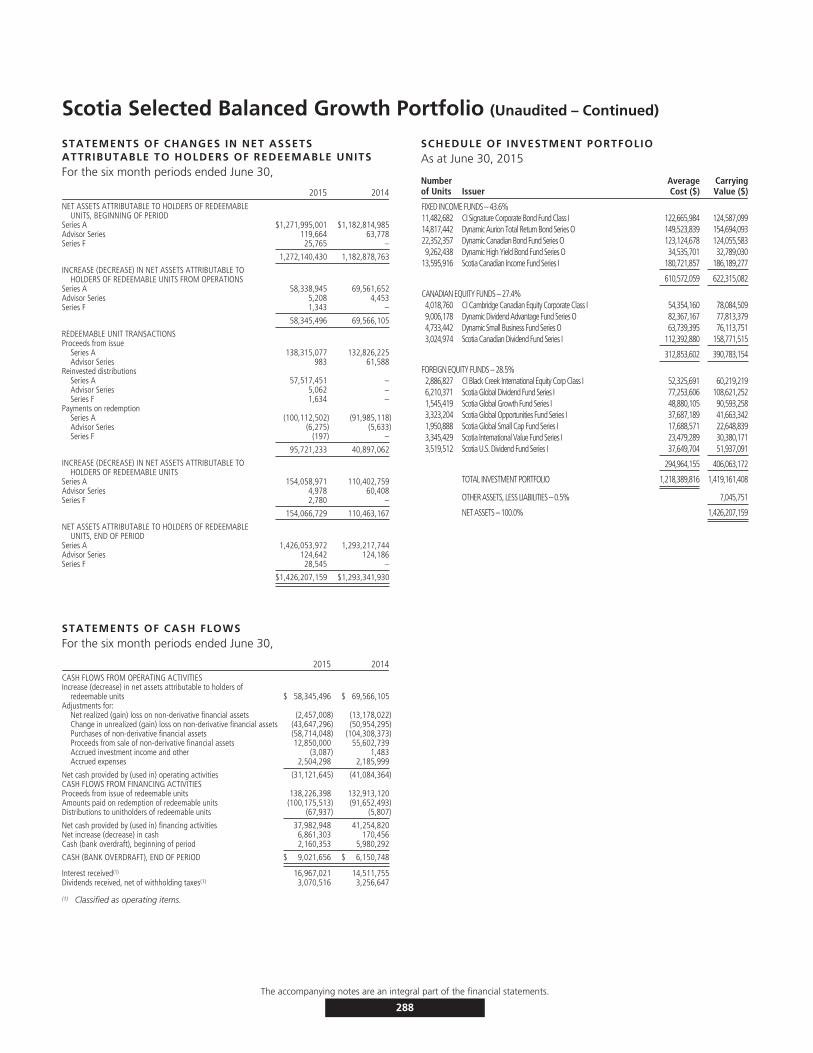
Scotia Selected Balanced Growth Portfolio (Unaudited – Continued)
STATEMENTS OF CHANGES IN NET ASSETSATTRIBUTABLE TO HOLDERS OF REDEEMABLE UNITSFor the six month periods ended June 30,
2015 2014NET ASSETS ATTRIBUTABLE TO HOLDERS OF REDEEMABLE
UNITS, BEGINNING OF PERIODSeries A $1,271,995,001 $1,182,814,985Advisor Series 119,664 63,778Series F 25,765 –
1,272,140,430 1,182,878,763
INCREASE (DECREASE) IN NET ASSETS ATTRIBUTABLE TOHOLDERS OF REDEEMABLE UNITS FROM OPERATIONS
Series A 58,338,945 69,561,652Advisor Series 5,208 4,453Series F 1,343 –
58,345,496 69,566,105
REDEEMABLE UNIT TRANSACTIONSProceeds from issue
Series A 138,315,077 132,826,225Advisor Series 983 61,588
Reinvested distributionsSeries A 57,517,451 –Advisor Series 5,062 –Series F 1,634 –
Payments on redemptionSeries A (100,112,502) (91,985,118)Advisor Series (6,275) (5,633)Series F (197) –
95,721,233 40,897,062
INCREASE (DECREASE) IN NET ASSETS ATTRIBUTABLE TOHOLDERS OF REDEEMABLE UNITS
Series A 154,058,971 110,402,759Advisor Series 4,978 60,408Series F 2,780 –
154,066,729 110,463,167
NET ASSETS ATTRIBUTABLE TO HOLDERS OF REDEEMABLEUNITS, END OF PERIOD
Series A 1,426,053,972 1,293,217,744Advisor Series 124,642 124,186Series F 28,545 –
$1,426,207,159 $1,293,341,930
STATEMENTS OF CASH FLOWSFor the six month periods ended June 30,
2015 2014CASH FLOWS FROM OPERATING ACTIVITIESIncrease (decrease) in net assets attributable to holders of
redeemable units $ 58,345,496 $ 69,566,105Adjustments for:
Net realized (gain) loss on non-derivative financial assets (2,457,008) (13,178,022)Change in unrealized (gain) loss on non-derivative financial assets (43,647,296) (50,954,295)Purchases of non-derivative financial assets (58,714,048) (104,308,373)Proceeds from sale of non-derivative financial assets 12,850,000 55,602,739Accrued investment income and other (3,087) 1,483Accrued expenses 2,504,298 2,185,999
Net cash provided by (used in) operating activities (31,121,645) (41,084,364)CASH FLOWS FROM FINANCING ACTIVITIESProceeds from issue of redeemable units 138,226,398 132,913,120Amounts paid on redemption of redeemable units (100,175,513) (91,652,493)Distributions to unitholders of redeemable units (67,937) (5,807)
Net cash provided by (used in) financing activities 37,982,948 41,254,820Net increase (decrease) in cash 6,861,303 170,456Cash (bank overdraft), beginning of period 2,160,353 5,980,292
CASH (BANK OVERDRAFT), END OF PERIOD $ 9,021,656 $ 6,150,748
Interest received(1) 16,967,021 14,511,755Dividends received, net of withholding taxes(1) 3,070,516 3,256,647
(1) Classified as operating items.
SCHEDULE OF INVESTMENT PORTFOLIOAs at June 30, 2015
Numberof Units Issuer
AverageCost ($)
CarryingValue ($)
FIXED INCOME FUNDS – 43.6%11,482,682 CI Signature Corporate Bond Fund Class I 122,665,984 124,587,09914,817,442 Dynamic Aurion Total Return Bond Series O 149,523,839 154,694,09322,352,357 Dynamic Canadian Bond Fund Series O 123,124,678 124,055,5839,262,438 Dynamic High Yield Bond Fund Series O 34,535,701 32,789,030
13,595,916 Scotia Canadian Income Fund Series I 180,721,857 186,189,277
610,572,059 622,315,082
CANADIAN EQUITY FUNDS – 27.4%4,018,760 CI Cambridge Canadian Equity Corporate Class I 54,354,160 78,084,5099,006,178 Dynamic Dividend Advantage Fund Series O 82,367,167 77,813,3794,733,442 Dynamic Small Business Fund Series O 63,739,395 76,113,7513,024,974 Scotia Canadian Dividend Fund Series I 112,392,880 158,771,515
312,853,602 390,783,154
FOREIGN EQUITY FUNDS – 28.5%2,886,827 CI Black Creek International Equity Corp Class I 52,325,691 60,219,2196,210,371 Scotia Global Dividend Fund Series I 77,253,606 108,621,2521,545,419 Scotia Global Growth Fund Series I 48,880,105 90,593,2583,323,204 Scotia Global Opportunities Fund Series I 37,687,189 41,663,3421,950,888 Scotia Global Small Cap Fund Series I 17,688,571 22,648,8393,345,429 Scotia International Value Fund Series I 23,479,289 30,380,1713,519,512 Scotia U.S. Dividend Fund Series I 37,649,704 51,937,091
294,964,155 406,063,172
TOTAL INVESTMENT PORTFOLIO 1,218,389,816 1,419,161,408
OTHER ASSETS, LESS LIABILITIES – 0.5% 7,045,751
NET ASSETS – 100.0% 1,426,207,159
The accompanying notes are an integral part of the financial statements.
288

Scotia Selected Balanced Growth Portfolio (Unaudited)
FUND SPECIFIC NOTESFor the periods indicated in Note 1.
1. The Fund (note 1)
The Fund’s investment objective is to achieve a balance ofcurrent income and long-term capital appreciation, with asmall bias towards capital appreciation. It invests primarilyin a diversified mix of equity and income mutual fundsmanaged by other mutual fund managers and by us. Theportfolio is an asset allocation fund that allocatesinvestment between two asset classes: fixed income andequities.
The Fund invests primarily in mutual funds managed by theManager and/or by the third party investment managers(the ‘‘Underlying Funds’’). To ensure the Fund’scomposition meets the investment objectives of the Fund,the portfolio advisor monitors the Underlying Funds on anongoing basis and rebalances the Fund’s assets among theUnderlying Funds.
2. Risks associated with financial instruments (note 4)
i) Interest rate risk
The Fund invests in Underlying Funds, which are exposedto interest rate risk. As at June 30, 2015, had the prevailinginterest rates increased or decreased by 0.25%, assuming aparallel shift in the yield curve and all other variables heldconstant, net assets attributable to holders of redeemableunits would have decreased or increased, respectively, by$7,434,937, or approximately 0.5% (December 31, 2014 –$7,042,141, or approximately 0.6%). In practice, actualresults may differ from this sensitivity analysis and thedifference could be material.
ii) Currency risk
The Fund could be exposed to indirect currency risk to theextent that the Underlying Funds held financialinstruments that were denominated in a currency otherthan its functional currency.
iii) Price risk
Price risk is the risk that the carrying value of financialinstruments will fluctuate as a result of changes in marketprices (other than those arising from interest rate risk orcurrency risk) caused by factors specific to a security, itsissuer or all factors affecting a market or a market segment.Exposure to price risk is mainly in equities, derivatives andcommodities, if applicable. As at June 30, 2015,approximately 55.9% (December 31, 2014 – 58.2%) of theFund’s net assets were invested in Underlying Funds which
were exposed to price risk. If prices of the UnderlyingFunds’ investments had decreased or increased by 10%,with all other variables held constant, net assets of theFund would have decreased or increased, respectively, byapproximately $79,684,633 (December 31, 2014 –$73,999,184). In practice, actual results may differ from thissensitivity analysis and the difference could be material.
iv) Credit risk
The Fund could be exposed to indirect credit risk to theextent that the Underlying Funds invested in bonds anddebentures, preferred shares and derivatives.
v) Liquidity risk
The table below summarizes the Fund’s financial liabilitiesbased on the remaining period to the contractual maturitydate.
June 30, 2015 December 31, 2014
On demand($)
Less than3 months
($)On demand
($)
Less than3 months
($)
Current liabilities – 3,376,555 – 58,520,881Liability for written options – – – –Unrealized loss on derivatives – – – –Redeemable units 1,426,207,159 – 1,272,140,430 –
1,426,207,159 3,376,555 1,272,140,430 58,520,881
Redeemable units are redeemable on demand at theholder’s option. However, the Manager does not expect thatthe contractual maturity disclosed in the table above will berepresentative of the actual cash outflows, as holders ofthese instruments typically retain them for a longer term.
vi) Concentration risk
Concentration risk arises as a result of the concentration ofexposures within the same category, geographical location,asset type or industry sector, as applicable. The table belowis a summary of the Fund’s concentration risk:
Percentage of net assets (%)
June 30, 2015 December 31, 2014
Canadian Equity Funds 27.4 29.3Fixed Income Funds 43.6 46.1Foreign Equity Funds 28.5 28.9
vii) Fair value classification (note 2)
The tables below illustrate the classification of the Fund’sfinancial instruments within the fair value hierarchy.
June 30, 2015Level 1
($)Level 2
($)Level 3
($)Total($)
Underlying funds 1,419,161,408 – – 1,419,161,408
1,419,161,408 – – 1,419,161,408
The accompanying notes are an integral part of the financial statements.
289
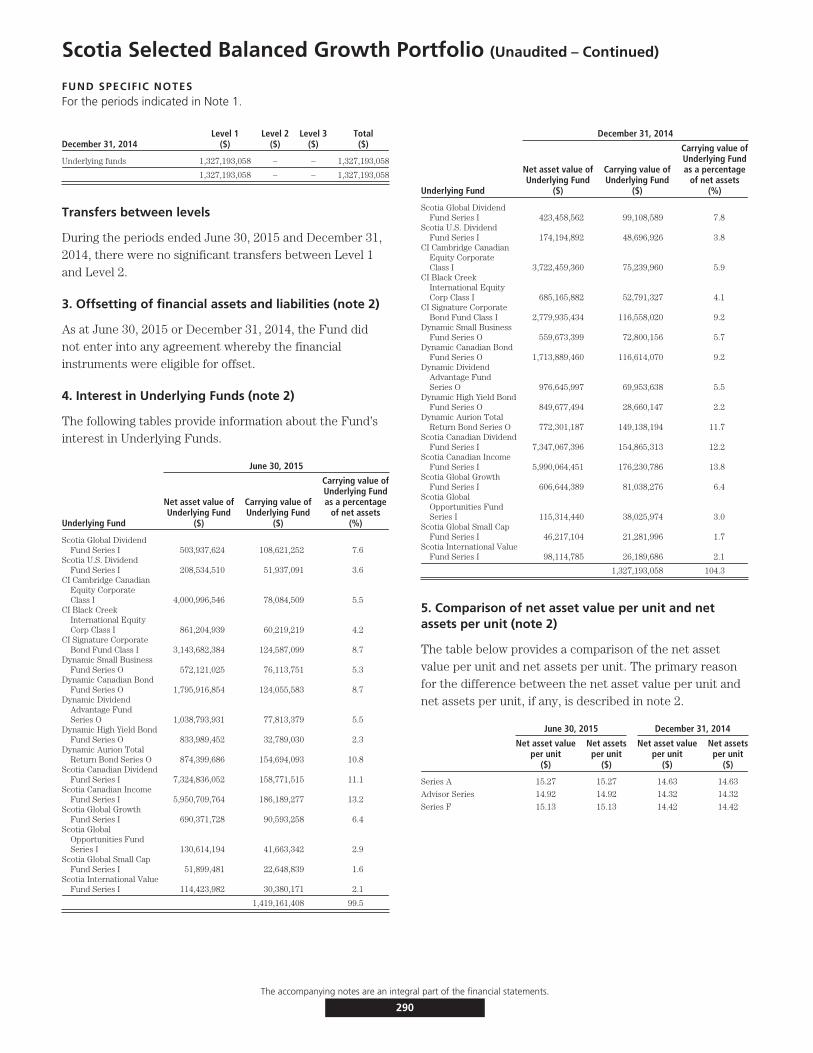
Scotia Selected Balanced Growth Portfolio (Unaudited – Continued)
FUND SPECIFIC NOTESFor the periods indicated in Note 1.
December 31, 2014Level 1
($)Level 2
($)Level 3
($)Total($)
Underlying funds 1,327,193,058 – – 1,327,193,058
1,327,193,058 – – 1,327,193,058
Transfers between levels
During the periods ended June 30, 2015 and December 31,2014, there were no significant transfers between Level 1and Level 2.
3. Offsetting of financial assets and liabilities (note 2)
As at June 30, 2015 or December 31, 2014, the Fund didnot enter into any agreement whereby the financialinstruments were eligible for offset.
4. Interest in Underlying Funds (note 2)
The following tables provide information about the Fund’sinterest in Underlying Funds.
June 30, 2015
Underlying Fund
Net asset value ofUnderlying Fund
($)
Carrying value ofUnderlying Fund
($)
Carrying value ofUnderlying Fundas a percentage
of net assets(%)
Scotia Global DividendFund Series I 503,937,624 108,621,252 7.6
Scotia U.S. DividendFund Series I 208,534,510 51,937,091 3.6
CI Cambridge CanadianEquity CorporateClass I 4,000,996,546 78,084,509 5.5
CI Black CreekInternational EquityCorp Class I 861,204,939 60,219,219 4.2
CI Signature CorporateBond Fund Class I 3,143,682,384 124,587,099 8.7
Dynamic Small BusinessFund Series O 572,121,025 76,113,751 5.3
Dynamic Canadian BondFund Series O 1,795,916,854 124,055,583 8.7
Dynamic DividendAdvantage FundSeries O 1,038,793,931 77,813,379 5.5
Dynamic High Yield BondFund Series O 833,989,452 32,789,030 2.3
Dynamic Aurion TotalReturn Bond Series O 874,399,686 154,694,093 10.8
Scotia Canadian DividendFund Series I 7,324,836,052 158,771,515 11.1
Scotia Canadian IncomeFund Series I 5,950,709,764 186,189,277 13.2
Scotia Global GrowthFund Series I 690,371,728 90,593,258 6.4
Scotia GlobalOpportunities FundSeries I 130,614,194 41,663,342 2.9
Scotia Global Small CapFund Series I 51,899,481 22,648,839 1.6
Scotia International ValueFund Series I 114,423,982 30,380,171 2.1
1,419,161,408 99.5
December 31, 2014
Underlying Fund
Net asset value ofUnderlying Fund
($)
Carrying value ofUnderlying Fund
($)
Carrying value ofUnderlying Fundas a percentage
of net assets(%)
Scotia Global DividendFund Series I 423,458,562 99,108,589 7.8
Scotia U.S. DividendFund Series I 174,194,892 48,696,926 3.8
CI Cambridge CanadianEquity CorporateClass I 3,722,459,360 75,239,960 5.9
CI Black CreekInternational EquityCorp Class I 685,165,882 52,791,327 4.1
CI Signature CorporateBond Fund Class I 2,779,935,434 116,558,020 9.2
Dynamic Small BusinessFund Series O 559,673,399 72,800,156 5.7
Dynamic Canadian BondFund Series O 1,713,889,460 116,614,070 9.2
Dynamic DividendAdvantage FundSeries O 976,645,997 69,953,638 5.5
Dynamic High Yield BondFund Series O 849,677,494 28,660,147 2.2
Dynamic Aurion TotalReturn Bond Series O 772,301,187 149,138,194 11.7
Scotia Canadian DividendFund Series I 7,347,067,396 154,865,313 12.2
Scotia Canadian IncomeFund Series I 5,990,064,451 176,230,786 13.8
Scotia Global GrowthFund Series I 606,644,389 81,038,276 6.4
Scotia GlobalOpportunities FundSeries I 115,314,440 38,025,974 3.0
Scotia Global Small CapFund Series I 46,217,104 21,281,996 1.7
Scotia International ValueFund Series I 98,114,785 26,189,686 2.1
1,327,193,058 104.3
5. Comparison of net asset value per unit and netassets per unit (note 2)
The table below provides a comparison of the net assetvalue per unit and net assets per unit. The primary reasonfor the difference between the net asset value per unit andnet assets per unit, if any, is described in note 2.
June 30, 2015 December 31, 2014
Net asset valueper unit
($)
Net assetsper unit
($)
Net asset valueper unit
($)
Net assetsper unit
($)
Series A 15.27 15.27 14.63 14.63
Advisor Series 14.92 14.92 14.32 14.32
Series F 15.13 15.13 14.42 14.42
The accompanying notes are an integral part of the financial statements.
290

Scotia Selected Growth Portfolio (Unaudited)
STATEMENTS OF FINANCIAL POSITIONAs at
June 30,2015
December 31,2014
ASSETSCurrent assetsInvestments
Non-derivative financial assets $ 993,064,617 $907,758,176Cash 6,431,430 2,574,674Subscriptions receivable 1,199,738 1,151,546Accrued investment income and other 3,269 3,138
1,000,699,054 911,487,534
LIABILITIESCurrent liabilitiesManagement fee payable 1,845,824 –Payable for securities purchased 400,000 –Redemptions payable 708,350 351,441Accrued expenses 48,749 –Distributions payable – 14,839
3,002,923 366,280
Net assets attributable to holders of redeemable units $ 997,696,131 $911,121,254
NET ASSETS ATTRIBUTABLE TO HOLDERS OF REDEEMABLEUNITS PER SERIES
Series A $ 997,433,576 $910,901,941Advisor Series $ 38,629 $ 36,627Series F $ 223,926 $ 182,686
NET ASSETS ATTRIBUTABLE TO HOLDERS OF REDEEMABLEUNITS PER UNIT
Series A $ 17.84 $ 16.88Advisor Series $ 16.83 $ 15.96Series F $ 18.71 $ 17.60
STATEMENTS OF COMPREHENSIVE INCOMEFor the six month periods ended June 30,
2015 2014INCOMENet gain (loss) on investments (note 2)
Dividends $ 1,911,591 $ 1,847,653Interest for distribution purposes 7,219,097 6,809,161Capital gains distributions received 2,424,805 –Net realized gain (loss) on non-derivative financial assets 1,074,409 14,565,194Change in unrealized gain (loss) on non-derivative financial assets 50,095,104 33,624,915
Net gain (loss) on investments 62,725,006 56,846,923Other income 9,733 7,384
Total income (loss) 62,734,739 56,854,307
EXPENSESManagement fees (note 5) 9,242,554 7,841,688Fixed administration fees and operating Expense (note 6) 251,967 –Independent Review Committee fees 715 1,228Audit fees – 8,875Custodian fees – 395Filing fees – 27,738Legal fees – 2,625Unitholder administration costs – 135,572Unitholder reporting costs – 18,739Harmonized Sales Tax/Goods and Services Tax 1,004,818 845,949
Total expenses 10,500,054 8,882,809Expenses absorbed by the Manager (6,739) (10,688)
Net expenses 10,493,315 8,872,121
Increase (decrease) in net assets attributable to holders of redeemableunits from operations before income taxes 52,241,424 47,982,186
INCREASE (DECREASE) IN NET ASSETS ATTRIBUTABLE TO HOLDERS OFREDEEMABLE UNITS FROM OPERATIONS PER SERIES
Series A $52,227,863 $47,976,576Advisor Series $ 2,002 $ 1,962Series F $ 11,559 $ 3,648
INCREASE (DECREASE) IN NET ASSETS ATTRIBUTABLE TO HOLDERS OFREDEEMABLE UNITS FROM OPERATIONS PER UNIT†
Series A $ 0.95 $ 0.94Advisor Series $ 0.87 $ 0.87Series F $ 1.03 $ 0.71
WEIGHTED AVERAGE NUMBER OF UNITS PER SERIESSeries A 55,141,505 50,993,229Advisor Series 2,296 2,246Series F 11,250 5,136
† The increase (decrease) in net assets attributable to holders of redeemable units fromoperations per unit is calculated by dividing the increase (decrease) in net assetsattributable to holders of redeemable units from operations per series by the weightedaverage number of units per series.
The accompanying notes are an integral part of the financial statements.
291
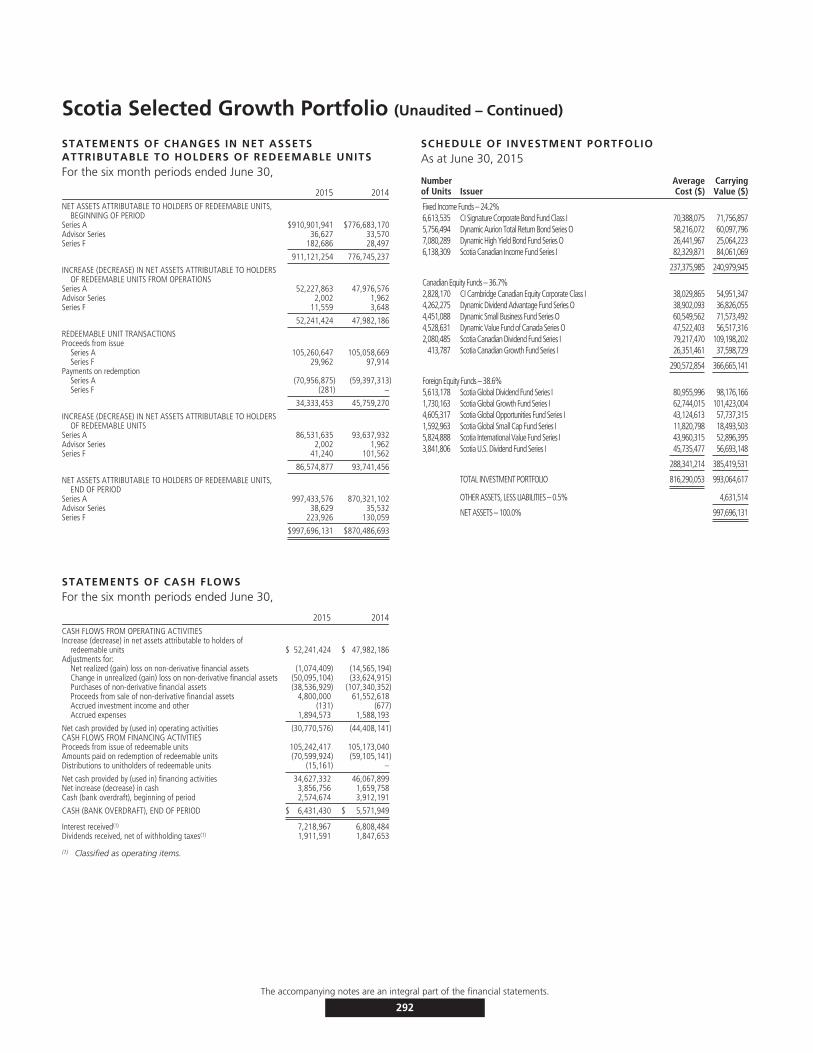
Scotia Selected Growth Portfolio (Unaudited – Continued)
STATEMENTS OF CHANGES IN NET ASSETSATTRIBUTABLE TO HOLDERS OF REDEEMABLE UNITSFor the six month periods ended June 30,
2015 2014NET ASSETS ATTRIBUTABLE TO HOLDERS OF REDEEMABLE UNITS,
BEGINNING OF PERIODSeries A $910,901,941 $776,683,170Advisor Series 36,627 33,570Series F 182,686 28,497
911,121,254 776,745,237
INCREASE (DECREASE) IN NET ASSETS ATTRIBUTABLE TO HOLDERSOF REDEEMABLE UNITS FROM OPERATIONS
Series A 52,227,863 47,976,576Advisor Series 2,002 1,962Series F 11,559 3,648
52,241,424 47,982,186
REDEEMABLE UNIT TRANSACTIONSProceeds from issue
Series A 105,260,647 105,058,669Series F 29,962 97,914
Payments on redemptionSeries A (70,956,875) (59,397,313)Series F (281) –
34,333,453 45,759,270
INCREASE (DECREASE) IN NET ASSETS ATTRIBUTABLE TO HOLDERSOF REDEEMABLE UNITS
Series A 86,531,635 93,637,932Advisor Series 2,002 1,962Series F 41,240 101,562
86,574,877 93,741,456
NET ASSETS ATTRIBUTABLE TO HOLDERS OF REDEEMABLE UNITS,END OF PERIOD
Series A 997,433,576 870,321,102Advisor Series 38,629 35,532Series F 223,926 130,059
$997,696,131 $870,486,693
STATEMENTS OF CASH FLOWSFor the six month periods ended June 30,
2015 2014CASH FLOWS FROM OPERATING ACTIVITIESIncrease (decrease) in net assets attributable to holders of
redeemable units $ 52,241,424 $ 47,982,186Adjustments for:
Net realized (gain) loss on non-derivative financial assets (1,074,409) (14,565,194)Change in unrealized (gain) loss on non-derivative financial assets (50,095,104) (33,624,915)Purchases of non-derivative financial assets (38,536,929) (107,340,352)Proceeds from sale of non-derivative financial assets 4,800,000 61,552,618Accrued investment income and other (131) (677)Accrued expenses 1,894,573 1,588,193
Net cash provided by (used in) operating activities (30,770,576) (44,408,141)CASH FLOWS FROM FINANCING ACTIVITIESProceeds from issue of redeemable units 105,242,417 105,173,040Amounts paid on redemption of redeemable units (70,599,924) (59,105,141)Distributions to unitholders of redeemable units (15,161) –
Net cash provided by (used in) financing activities 34,627,332 46,067,899Net increase (decrease) in cash 3,856,756 1,659,758Cash (bank overdraft), beginning of period 2,574,674 3,912,191
CASH (BANK OVERDRAFT), END OF PERIOD $ 6,431,430 $ 5,571,949
Interest received(1) 7,218,967 6,808,484Dividends received, net of withholding taxes(1) 1,911,591 1,847,653
(1) Classified as operating items.
SCHEDULE OF INVESTMENT PORTFOLIOAs at June 30, 2015
Numberof Units Issuer
AverageCost ($)
CarryingValue ($)
Fixed Income Funds – 24.2%6,613,535 CI Signature Corporate Bond Fund Class I 70,388,075 71,756,8575,756,494 Dynamic Aurion Total Return Bond Series O 58,216,072 60,097,7967,080,289 Dynamic High Yield Bond Fund Series O 26,441,967 25,064,2236,138,309 Scotia Canadian Income Fund Series I 82,329,871 84,061,069
237,375,985 240,979,945
Canadian Equity Funds – 36.7%2,828,170 CI Cambridge Canadian Equity Corporate Class I 38,029,865 54,951,3474,262,275 Dynamic Dividend Advantage Fund Series O 38,902,093 36,826,0554,451,088 Dynamic Small Business Fund Series O 60,549,562 71,573,4924,528,631 Dynamic Value Fund of Canada Series O 47,522,403 56,517,3162,080,485 Scotia Canadian Dividend Fund Series I 79,217,470 109,198,202
413,787 Scotia Canadian Growth Fund Series I 26,351,461 37,598,729
290,572,854 366,665,141
Foreign Equity Funds – 38.6%5,613,178 Scotia Global Dividend Fund Series I 80,955,996 98,176,1661,730,163 Scotia Global Growth Fund Series I 62,744,015 101,423,0044,605,317 Scotia Global Opportunities Fund Series I 43,124,613 57,737,3151,592,963 Scotia Global Small Cap Fund Series I 11,820,798 18,493,5035,824,888 Scotia International Value Fund Series I 43,960,315 52,896,3953,841,806 Scotia U.S. Dividend Fund Series I 45,735,477 56,693,148
288,341,214 385,419,531
TOTAL INVESTMENT PORTFOLIO 816,290,053 993,064,617
OTHER ASSETS, LESS LIABILITIES – 0.5% 4,631,514
NET ASSETS – 100.0% 997,696,131
The accompanying notes are an integral part of the financial statements.
292
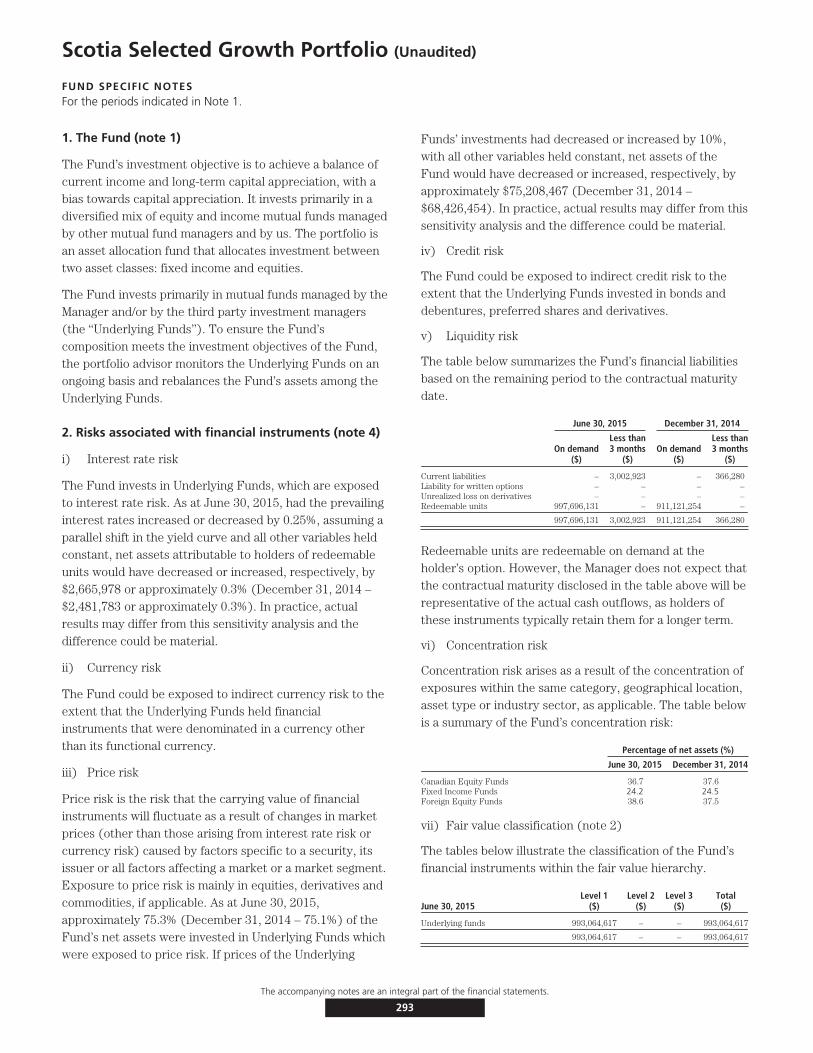
Scotia Selected Growth Portfolio (Unaudited)
FUND SPECIFIC NOTESFor the periods indicated in Note 1.
1. The Fund (note 1)
The Fund’s investment objective is to achieve a balance ofcurrent income and long-term capital appreciation, with abias towards capital appreciation. It invests primarily in adiversified mix of equity and income mutual funds managedby other mutual fund managers and by us. The portfolio isan asset allocation fund that allocates investment betweentwo asset classes: fixed income and equities.
The Fund invests primarily in mutual funds managed by theManager and/or by the third party investment managers(the ‘‘Underlying Funds’’). To ensure the Fund’scomposition meets the investment objectives of the Fund,the portfolio advisor monitors the Underlying Funds on anongoing basis and rebalances the Fund’s assets among theUnderlying Funds.
2. Risks associated with financial instruments (note 4)
i) Interest rate risk
The Fund invests in Underlying Funds, which are exposedto interest rate risk. As at June 30, 2015, had the prevailinginterest rates increased or decreased by 0.25%, assuming aparallel shift in the yield curve and all other variables heldconstant, net assets attributable to holders of redeemableunits would have decreased or increased, respectively, by$2,665,978 or approximately 0.3% (December 31, 2014 –$2,481,783 or approximately 0.3%). In practice, actualresults may differ from this sensitivity analysis and thedifference could be material.
ii) Currency risk
The Fund could be exposed to indirect currency risk to theextent that the Underlying Funds held financialinstruments that were denominated in a currency otherthan its functional currency.
iii) Price risk
Price risk is the risk that the carrying value of financialinstruments will fluctuate as a result of changes in marketprices (other than those arising from interest rate risk orcurrency risk) caused by factors specific to a security, itsissuer or all factors affecting a market or a market segment.Exposure to price risk is mainly in equities, derivatives andcommodities, if applicable. As at June 30, 2015,approximately 75.3% (December 31, 2014 – 75.1%) of theFund’s net assets were invested in Underlying Funds whichwere exposed to price risk. If prices of the Underlying
Funds’ investments had decreased or increased by 10%,with all other variables held constant, net assets of theFund would have decreased or increased, respectively, byapproximately $75,208,467 (December 31, 2014 –$68,426,454). In practice, actual results may differ from thissensitivity analysis and the difference could be material.
iv) Credit risk
The Fund could be exposed to indirect credit risk to theextent that the Underlying Funds invested in bonds anddebentures, preferred shares and derivatives.
v) Liquidity risk
The table below summarizes the Fund’s financial liabilitiesbased on the remaining period to the contractual maturitydate.
June 30, 2015 December 31, 2014
On demand($)
Less than3 months
($)On demand
($)
Less than3 months
($)
Current liabilities – 3,002,923 – 366,280Liability for written options – – – –Unrealized loss on derivatives – – – –Redeemable units 997,696,131 – 911,121,254 –
997,696,131 3,002,923 911,121,254 366,280
Redeemable units are redeemable on demand at theholder’s option. However, the Manager does not expect thatthe contractual maturity disclosed in the table above will berepresentative of the actual cash outflows, as holders ofthese instruments typically retain them for a longer term.
vi) Concentration risk
Concentration risk arises as a result of the concentration ofexposures within the same category, geographical location,asset type or industry sector, as applicable. The table belowis a summary of the Fund’s concentration risk:
Percentage of net assets (%)
June 30, 2015 December 31, 2014
Canadian Equity Funds 36.7 37.6Fixed Income Funds 24.2 24.5Foreign Equity Funds 38.6 37.5
vii) Fair value classification (note 2)
The tables below illustrate the classification of the Fund’sfinancial instruments within the fair value hierarchy.
June 30, 2015Level 1
($)Level 2
($)Level 3
($)Total($)
Underlying funds 993,064,617 – – 993,064,617
993,064,617 – – 993,064,617
The accompanying notes are an integral part of the financial statements.
293

Scotia Selected Growth Portfolio (Unaudited – Continued)
FUND SPECIFIC NOTESFor the periods indicated in Note 1.
December 31. 2014Level 1
($)Level 2
($)Level 3
($)Total($)
Underlying funds 907,758,176 – – 907,758,176
907,758,176 – – 907,758,176
Transfers between levels
During the periods ended June 30, 2015 and December 31,2014, there were no significant transfers between Level 1and Level 2.
3. Offsetting of financial assets and liabilities (note 2)
As at June 30, 2015 or December 31, 2014, the Fund didnot enter into any agreement whereby the financialinstruments were eligible for offset.
4. Interest in Underlying Funds (note 2)
The following tables provide information about the Fund’sinterest in Underlying Funds.
June 30, 2015
Underlying Fund
Net asset value ofUnderlying Fund
($)
Carrying value ofUnderlying Fund
($)
Carrying value ofUnderlying Fundas a percentage
of net assets(%)
Scotia Global DividendFund Series I 503,937,624 98,176,166 9.7
Scotia U.S. Dividend FundSeries I 208,534,510 56,693,148 5.7
CI Cambridge CanadianEquity Corporate Class I 4,000,996,546 54,951,347 5.5
CI Signature CorporateBond Fund Class I 3,143,682,384 71,756,857 7.2
Dynamic Small BusinessFund Series O 572,121,025 71,573,492 7.2
Dynamic DividendAdvantage Fund Series O 1,038,793,931 36,826,055 3.7
Dynamic High Yield BondFund Series O 833,989,452 25,064,223 2.5
Dynamic Aurion TotalReturn Bond Series O 874,399,686 60,097,796 6.0
Dynamic Value Fund ofCanada Series O 2,325,978,646 56,517,316 5.7
Scotia Canadian DividendFund Series I 7,324,836,052 109,198,202 10.9
Scotia Canadian GrowthFund Series I 400,629,635 37,598,729 3.8
Scotia Canadian IncomeFund Series I 5,950,709,764 84,061,069 8.4
Scotia Global Growth FundSeries I 690,371,728 101,423,004 10.2
Scotia Global OpportunitiesFund Series I 130,614,194 57,737,315 5.8
Scotia Global Small CapFund Series I 51,899,481 18,493,503 1.9
Scotia International ValueFund Series I 114,423,982 52,896,395 5.3
993,064,617 99.5
December 31, 2014
Underlying Fund
Net asset value ofUnderlying Fund
($)
Carrying value ofUnderlying Fund
($)
Carrying value ofUnderlying Fundas a percentage
of net assets(%)
Scotia Global DividendFund Series I 423,458,562 87,810,988 9.7
Scotia U.S. Dividend FundSeries I 174,194,892 53,367,593 5.9
CI Cambridge CanadianEquity Corporate Class I 3,722,459,360 52,469,476 5.8
CI Signature CorporateBond Fund Class I 2,779,935,434 66,587,890 7.3
Dynamic Small BusinessFund Series O 559,673,399 66,663,850 7.3
Dynamic DividendAdvantage Fund Series O 976,645,997 33,223,577 3.6
Dynamic High Yield BondFund Series O 849,677,494 22,047,915 2.4
Dynamic Aurion TotalReturn Bond Series O 772,301,187 56,259,795 6.2
Dynamic Value Fund ofCanada Series O 2,253,505,288 51,196,332 5.6
Scotia Canadian DividendFund Series I 7,347,067,396 104,659,199 11.5
Scotia Canadian GrowthFund Series I 382,919,844 34,184,034 3.8
Scotia Canadian IncomeFund Series I 5,990,064,451 78,598,034 8.6
Scotia Global Growth FundSeries I 606,644,389 88,711,966 9.7
Scotia Global OpportunitiesFund Series I 115,314,440 50,294,789 5.5
Scotia Global Small CapFund Series I 46,217,104 16,714,206 1.8
Scotia International ValueFund Series I 98,114,785 44,968,532 4.9
907,758,176 99.6
5. Comparison of net asset value per unit and netassets per unit (note 2)
The table below provides a comparison of the net assetvalue per unit and net assets per unit. The primary reasonfor the difference between the net asset value per unit andnet assets per unit, if any, is described in note 2.
June 30, 2015 December 31, 2014
Net asset valueper unit
($)
Net assetsper unit
($)
Net asset valueper unit
($)
Net assetsper unit
($)
Series A 17.84 17.84 16.88 16.88
Advisor Series 16.83 16.83 15.96 15.96
Series F 18.71 18.71 17.60 17.60
The accompanying notes are an integral part of the financial statements.
294
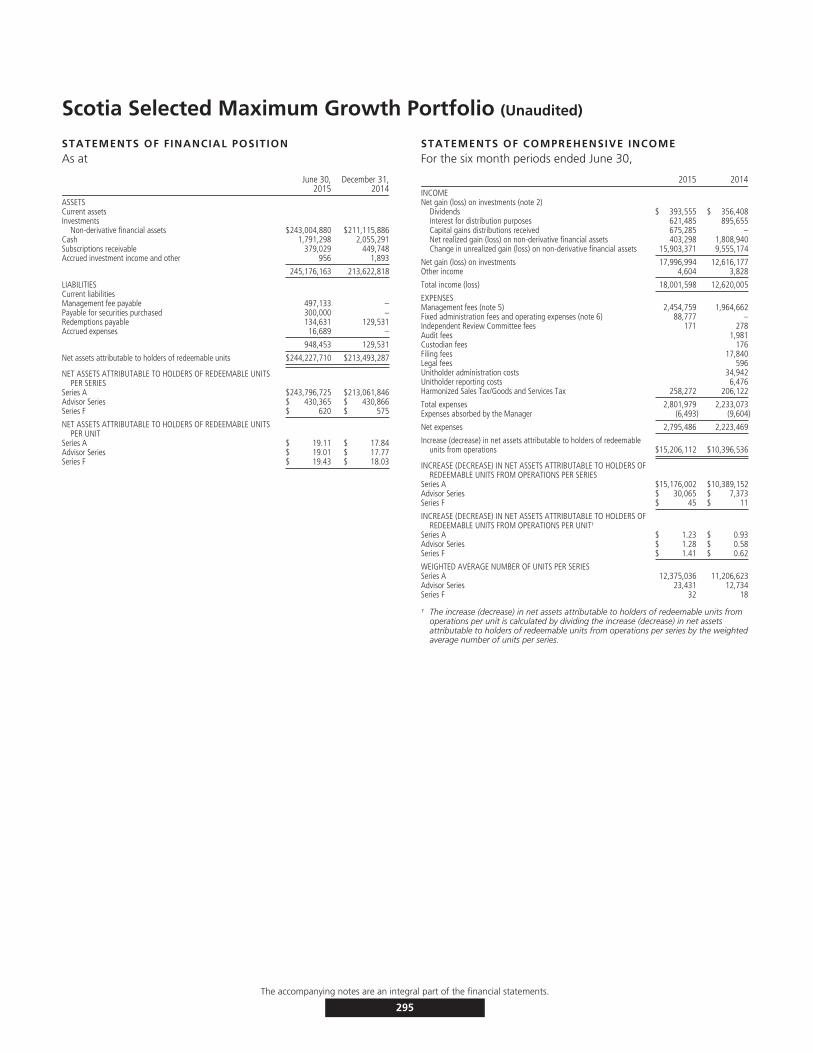
Scotia Selected Maximum Growth Portfolio (Unaudited)
STATEMENTS OF FINANCIAL POSITIONAs at
June 30,2015
December 31,2014
ASSETSCurrent assetsInvestments
Non-derivative financial assets $243,004,880 $211,115,886Cash 1,791,298 2,055,291Subscriptions receivable 379,029 449,748Accrued investment income and other 956 1,893
245,176,163 213,622,818
LIABILITIESCurrent liabilitiesManagement fee payable 497,133 –Payable for securities purchased 300,000 –Redemptions payable 134,631 129,531Accrued expenses 16,689 –
948,453 129,531
Net assets attributable to holders of redeemable units $244,227,710 $213,493,287
NET ASSETS ATTRIBUTABLE TO HOLDERS OF REDEEMABLE UNITSPER SERIES
Series A $243,796,725 $213,061,846Advisor Series $ 430,365 $ 430,866Series F $ 620 $ 575
NET ASSETS ATTRIBUTABLE TO HOLDERS OF REDEEMABLE UNITSPER UNIT
Series A $ 19.11 $ 17.84Advisor Series $ 19.01 $ 17.77Series F $ 19.43 $ 18.03
STATEMENTS OF COMPREHENSIVE INCOMEFor the six month periods ended June 30,
2015 2014INCOMENet gain (loss) on investments (note 2)
Dividends $ 393,555 $ 356,408Interest for distribution purposes 621,485 895,655Capital gains distributions received 675,285 –Net realized gain (loss) on non-derivative financial assets 403,298 1,808,940Change in unrealized gain (loss) on non-derivative financial assets 15,903,371 9,555,174
Net gain (loss) on investments 17,996,994 12,616,177Other income 4,604 3,828
Total income (loss) 18,001,598 12,620,005
EXPENSESManagement fees (note 5) 2,454,759 1,964,662Fixed administration fees and operating expenses (note 6) 88,777 –Independent Review Committee fees 171 278Audit fees 1,981Custodian fees 176Filing fees 17,840Legal fees 596Unitholder administration costs 34,942Unitholder reporting costs 6,476Harmonized Sales Tax/Goods and Services Tax 258,272 206,122
Total expenses 2,801,979 2,233,073Expenses absorbed by the Manager (6,493) (9,604)
Net expenses 2,795,486 2,223,469
Increase (decrease) in net assets attributable to holders of redeemableunits from operations $15,206,112 $10,396,536
INCREASE (DECREASE) IN NET ASSETS ATTRIBUTABLE TO HOLDERS OFREDEEMABLE UNITS FROM OPERATIONS PER SERIES
Series A $15,176,002 $10,389,152Advisor Series $ 30,065 $ 7,373Series F $ 45 $ 11
INCREASE (DECREASE) IN NET ASSETS ATTRIBUTABLE TO HOLDERS OFREDEEMABLE UNITS FROM OPERATIONS PER UNIT†
Series A $ 1.23 $ 0.93Advisor Series $ 1.28 $ 0.58Series F $ 1.41 $ 0.62
WEIGHTED AVERAGE NUMBER OF UNITS PER SERIESSeries A 12,375,036 11,206,623Advisor Series 23,431 12,734Series F 32 18
† The increase (decrease) in net assets attributable to holders of redeemable units fromoperations per unit is calculated by dividing the increase (decrease) in net assetsattributable to holders of redeemable units from operations per series by the weightedaverage number of units per series.
The accompanying notes are an integral part of the financial statements.
295

Scotia Selected Maximum Growth Portfolio (Unaudited – Continued)
STATEMENTS OF CHANGES IN NET ASSETSATTRIBUTABLE TO HOLDERS OF REDEEMABLE UNITSFor the six month periods ended June 30,
2015 2014NET ASSETS ATTRIBUTABLE TO HOLDERS OF REDEEMABLE UNITS,
BEGINNING OF PERIODSeries A $213,061,846 $171,930,470Advisor Series 430,866 3,162Series F 575 –
213,493,287 171,933,632
INCREASE (DECREASE) IN NET ASSETS ATTRIBUTABLE TO HOLDERSOF REDEEMABLE UNITS FROM OPERATIONS
Series A 15,176,002 10,389,152Advisor Series 30,065 7,373Series F 45 11
15,206,112 10,396,536
REDEEMABLE UNIT TRANSACTIONSProceeds from issue
Series A 35,120,749 32,514,548Advisor Series 689 403,414Series F – 540
Payments on redemptionSeries A (19,561,872) (15,458,572)Advisor Series (31,255) (2,450)
15,528,311 17,457,480
INCREASE (DECREASE) IN NET ASSETS ATTRIBUTABLE TO HOLDERSOF REDEEMABLE UNITS
Series A 30,734,879 27,445,128Advisor Series (501) 408,337Series F 45 551
30,734,423 27,854,016
NET ASSETS ATTRIBUTABLE TO HOLDERS OF REDEEMABLE UNITS,END OF PERIOD
Series A 243,796,725 199,375,598Advisor Series 430,365 411,499Series F 620 551
$244,227,710 $199,787,648
STATEMENTS OF CASH FLOWSFor the six month periods ended June 30,
2015 2014CASH FLOWS FROM OPERATING ACTIVITIESIncrease (decrease) in net assets attributable to holders of redeemable
units $ 15,206,112 $ 10,396,536Adjustments for:
Net realized (gain) loss on non-derivative financial assets (403,298) (1,808,940)Change in unrealized (gain) loss on non-derivative financial assets (15,903,371) (9,555,174)Purchases of non-derivative financial assets (17,082,325) (22,934,821)Proceeds from sale of non-derivative financial assets 1,800,000 6,273,258Accrued investment income and other 937 (262)Accrued expenses 513,822 403,437
Net cash provided by (used in) operating activities (15,868,123) (17,225,966)CASH FLOWS FROM FINANCING ACTIVITIESProceeds from issue of redeemable units 35,192,157 32,898,053Amounts paid on redemption of redeemable units (19,588,027) (15,349,057)Distributions to unitholders of redeemable units – 9
Net cash provided by (used in) financing activities 15,604,130 17,549,005Net increase (decrease) in cash (263,993) 323,039Cash (bank overdraft), beginning of period 2,055,291 1,761,806
CASH (BANK OVERDRAFT), END OF PERIOD $ 1,791,298 $ 2,084,845
Interest received(1) 622,422 895,393Dividends received, net of withholding taxes(1) 393,555 356,408
(1) Classified as operating items.
SCHEDULE OF INVESTMENT PORTFOLIOAs at June 30, 2015
Numberof Units Issuer
AverageCost ($)
CarryingValue ($)
Fixed Income Funds – 9.9%664,947 CI Signature Corporate Bond Fund Class I 7,110,253 7,214,671463,335 Dynamic Aurion Total Return Bond Series O 4,704,276 4,837,216
1,063,151 Dynamic High Yield Bond Fund Series O 3,910,479 3,763,556616,323 Scotia Canadian Income Fund Series I 8,364,565 8,440,241
24,089,573 24,255,684
Canadian Equity Funds – 43.5%814,955 CI Cambridge Canadian Equity Corporate Class I 11,625,788 15,834,572
1,329,085 Dynamic Small Business Fund Series O 18,465,829 21,371,6802,555,696 Dynamic Value Fund of Canada Series O 28,238,122 31,895,087
403,424 Scotia Canadian Dividend Fund Series I 16,086,561 21,174,469175,975 Scotia Canadian Growth Fund Series I 11,451,532 15,989,939
85,867,832 106,265,747
Foreign Equity Funds – 46.1%1,401,053 Scotia Global Dividend Fund Series I 20,622,604 24,504,844
421,792 Scotia Global Growth Fund Series I 14,694,215 24,725,6461,585,066 Scotia Global Opportunities Fund Series I 14,562,907 19,872,126
497,595 Scotia Global Small Cap Fund Series I 3,709,956 5,776,8332,234,373 Scotia International Value Fund Series I 17,022,487 20,290,5651,173,243 Scotia U.S. Dividend Fund Series I 14,546,464 17,313,435
85,158,633 112,483,449
TOTAL INVESTMENT PORTFOLIO 195,116,038 243,004,880
OTHER ASSETS, LESS LIABILITIES – 0.5% 1,222,830
NET ASSETS – 100.0% 244,227,710
The accompanying notes are an integral part of the financial statements.
296
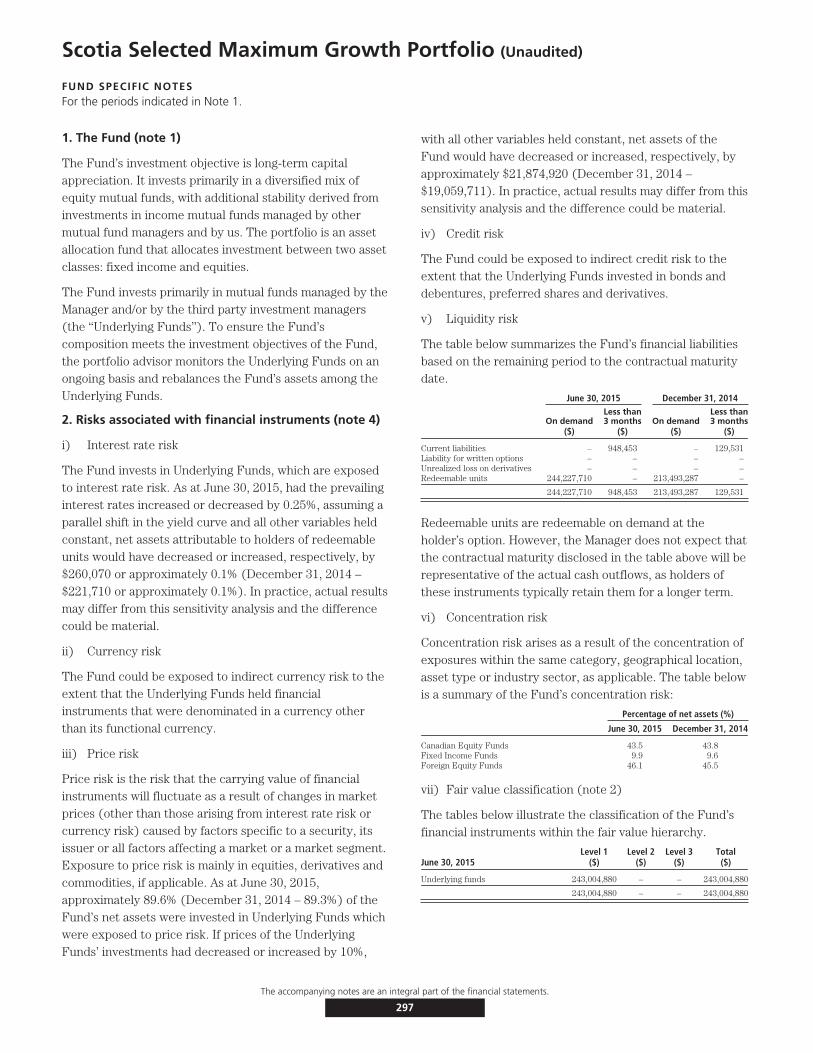
Scotia Selected Maximum Growth Portfolio (Unaudited)
FUND SPECIFIC NOTESFor the periods indicated in Note 1.
1. The Fund (note 1)
The Fund’s investment objective is long-term capitalappreciation. It invests primarily in a diversified mix ofequity mutual funds, with additional stability derived frominvestments in income mutual funds managed by othermutual fund managers and by us. The portfolio is an assetallocation fund that allocates investment between two assetclasses: fixed income and equities.
The Fund invests primarily in mutual funds managed by theManager and/or by the third party investment managers(the ‘‘Underlying Funds’’). To ensure the Fund’scomposition meets the investment objectives of the Fund,the portfolio advisor monitors the Underlying Funds on anongoing basis and rebalances the Fund’s assets among theUnderlying Funds.
2. Risks associated with financial instruments (note 4)
i) Interest rate risk
The Fund invests in Underlying Funds, which are exposedto interest rate risk. As at June 30, 2015, had the prevailinginterest rates increased or decreased by 0.25%, assuming aparallel shift in the yield curve and all other variables heldconstant, net assets attributable to holders of redeemableunits would have decreased or increased, respectively, by$260,070 or approximately 0.1% (December 31, 2014 –$221,710 or approximately 0.1%). In practice, actual resultsmay differ from this sensitivity analysis and the differencecould be material.
ii) Currency risk
The Fund could be exposed to indirect currency risk to theextent that the Underlying Funds held financialinstruments that were denominated in a currency otherthan its functional currency.
iii) Price risk
Price risk is the risk that the carrying value of financialinstruments will fluctuate as a result of changes in marketprices (other than those arising from interest rate risk orcurrency risk) caused by factors specific to a security, itsissuer or all factors affecting a market or a market segment.Exposure to price risk is mainly in equities, derivatives andcommodities, if applicable. As at June 30, 2015,approximately 89.6% (December 31, 2014 – 89.3%) of theFund’s net assets were invested in Underlying Funds whichwere exposed to price risk. If prices of the UnderlyingFunds’ investments had decreased or increased by 10%,
with all other variables held constant, net assets of theFund would have decreased or increased, respectively, byapproximately $21,874,920 (December 31, 2014 –$19,059,711). In practice, actual results may differ from thissensitivity analysis and the difference could be material.
iv) Credit risk
The Fund could be exposed to indirect credit risk to theextent that the Underlying Funds invested in bonds anddebentures, preferred shares and derivatives.
v) Liquidity risk
The table below summarizes the Fund’s financial liabilitiesbased on the remaining period to the contractual maturitydate.
June 30, 2015 December 31, 2014
On demandLess than3 months On demand
Less than3 months
($) ($) ($) ($)
Current liabilities – 948,453 – 129,531Liability for written options – – – –Unrealized loss on derivatives – – – –Redeemable units 244,227,710 – 213,493,287 –
244,227,710 948,453 213,493,287 129,531
Redeemable units are redeemable on demand at theholder’s option. However, the Manager does not expect thatthe contractual maturity disclosed in the table above will berepresentative of the actual cash outflows, as holders ofthese instruments typically retain them for a longer term.
vi) Concentration risk
Concentration risk arises as a result of the concentration ofexposures within the same category, geographical location,asset type or industry sector, as applicable. The table belowis a summary of the Fund’s concentration risk:
Percentage of net assets (%)
June 30, 2015 December 31, 2014
Canadian Equity Funds 43.5 43.8Fixed Income Funds 9.9 9.6Foreign Equity Funds 46.1 45.5
vii) Fair value classification (note 2)
The tables below illustrate the classification of the Fund’sfinancial instruments within the fair value hierarchy.
June 30, 2015Level 1
($)Level 2
($)Level 3
($)Total($)
Underlying funds 243,004,880 – – 243,004,880
243,004,880 – – 243,004,880
The accompanying notes are an integral part of the financial statements.
297

Scotia Selected Maximum Growth Portfolio (Unaudited – Continued)
FUND SPECIFIC NOTESFor the periods indicated in Note 1.
December 31, 2014Level 1
($)Level 2
($)Level 3
($)Total($)
Underlying funds 211,115,886 – – 211,115,886
211,115,886 – – 211,115,886
Transfers between levels
During the periods ended June 30, 2015 and December 31,2014, there were no significant transfers between Level 1and Level 2.
3. Offsetting of financial assets and liabilities (note 2)
As at June 30, 2015 or December 31, 2014, the Fund didnot enter into any agreement whereby the financialinstruments were eligible for offset.
4. Interest in Underlying Funds (note 2)
The following tables provide information about the Fund’sinterest in Underlying Funds.
June 30, 2015
Underlying Fund
Net asset value ofUnderlying Fund
($)
Carrying value ofUnderlying Fund
($)
Carrying value ofUnderlying Fundas a percentage
of net assets(%)
Scotia Global DividendFund Series I 503,937,624 24,504,844 10.0
Scotia U.S. DividendFund Series I 208,534,510 17,313,435 7.1
CI Cambridge CanadianEquity CorporateClass I 4,000,996,546 15,834,572 6.5
CI Signature CorporateBond Fund Class I 3,143,682,384 7,214,671 3.0
Dynamic Small BusinessFund Series O 572,121,025 21,371,680 8.8
Dynamic High Yield BondFund Series O 833,989,452 3,763,556 1.5
Dynamic Aurion TotalReturn Bond Series O 874,399,686 4,837,216 2.0
Dynamic Value Fund ofCanada Series O 2,325,978,646 31,895,087 13.0
Scotia Canadian DividendFund Series I 7,324,836,052 21,174,469 8.7
Scotia Canadian GrowthFund Series I 400,629,635 15,989,939 6.5
Scotia Canadian IncomeFund Series I 5,950,709,764 8,440,241 3.5
Scotia Global GrowthFund Series I 690,371,728 24,725,646 10.1
Scotia GlobalOpportunities FundSeries I 130,614,194 19,872,126 8.1
Scotia Global Small CapFund Series I 51,899,481 5,776,833 2.4
Scotia International ValueFund Series I 114,423,982 20,290,565 8.3
243,004,880 99.5
December 31, 2014
Underlying Fund
Net asset value ofUnderlying Fund
($)
Carrying value ofUnderlying Fund
($)
Carrying value ofUnderlying Fundas a percentage
of net assets(%)
Scotia Global DividendFund Series I 423,458,562 21,695,132 10.2
Scotia U.S. DividendFund Series I 174,194,892 14,891,268 7.0
CI Cambridge CanadianEquity CorporateClass I 3,722,459,360 14,219,459 6.7
CI Signature CorporateBond Fund Class I 2,779,935,434 6,122,528 2.9
Dynamic Small BusinessFund Series O 559,673,399 18,458,337 8.6
Dynamic High Yield BondFund Series O 849,677,494 3,055,318 1.4
Dynamic Aurion TotalReturn Bond Series O 772,301,187 4,144,992 1.9
Dynamic Value Fund ofCanada Series O 2,253,505,288 27,777,256 13.0
Scotia Canadian DividendFund Series I 7,347,067,396 19,042,604 8.9
Scotia Canadian GrowthFund Series I 382,919,844 13,968,206 6.5
Scotia Canadian IncomeFund Series I 5,990,064,451 7,195,935 3.4
Scotia Global GrowthFund Series I 606,644,389 21,483,710 10.1
Scotia GlobalOpportunities FundSeries I 115,314,440 17,406,379 8.1
Scotia Global Small CapFund Series I 46,217,104 5,046,523 2.4
Scotia International ValueFund Series I 98,114,785 16,608,239 7.8
211,115,886 98.9
5. Comparison of net asset value per unit and netassets per unit (note 2)
The table below provides a comparison of the net assetvalue per unit and net assets per unit. The primary reasonfor the difference between the net asset value per unit andnet assets per unit, if any, is described in note 2.
June 30, 2015 December 31, 2014
Net asset valueper unit
($)
Net assetsper unit
($)
Net asset valueper unit
($)
Net assetsper unit
($)
Series A 19.11 19.11 17.84 17.84
Advisor Series 19.01 19.01 17.77 17.77
Series F 19.43 19.43 18.03 18.03
The accompanying notes are an integral part of the financial statements.
298
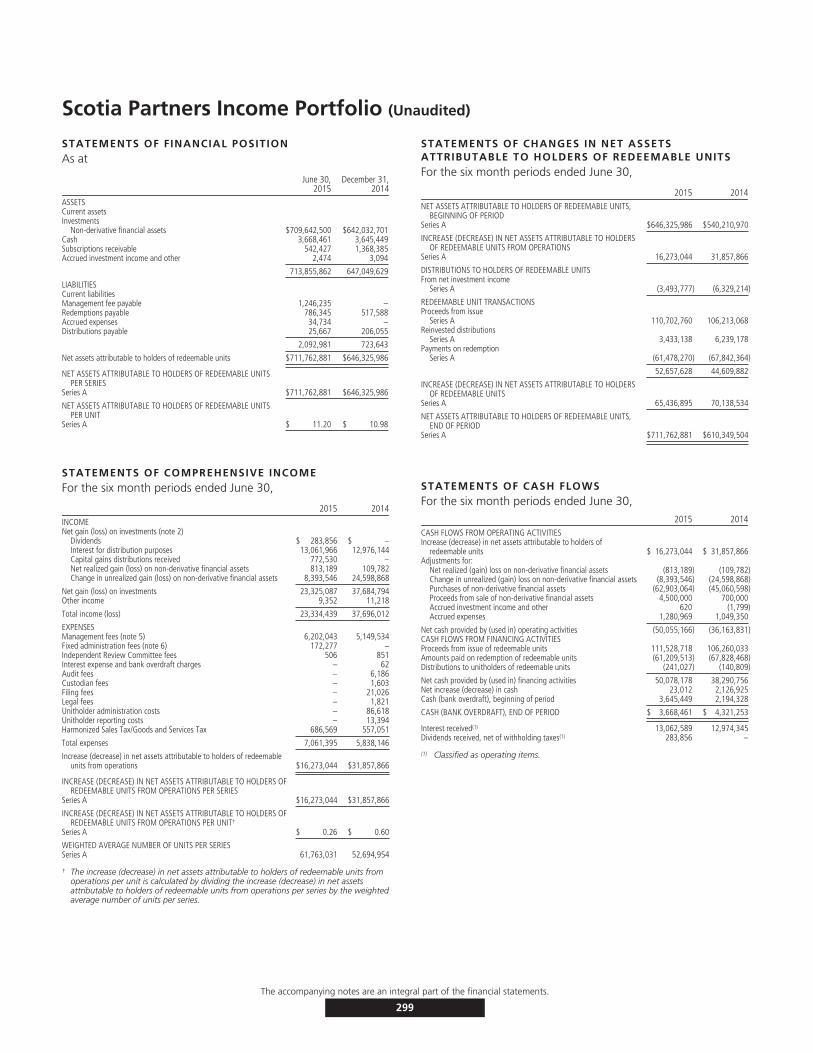
Scotia Partners Income Portfolio (Unaudited)
STATEMENTS OF FINANCIAL POSITIONAs at
June 30,2015
December 31,2014
ASSETSCurrent assetsInvestments
Non-derivative financial assets $709,642,500 $642,032,701Cash 3,668,461 3,645,449Subscriptions receivable 542,427 1,368,385Accrued investment income and other 2,474 3,094
713,855,862 647,049,629
LIABILITIESCurrent liabilitiesManagement fee payable 1,246,235 –Redemptions payable 786,345 517,588Accrued expenses 34,734 –Distributions payable 25,667 206,055
2,092,981 723,643
Net assets attributable to holders of redeemable units $711,762,881 $646,325,986
NET ASSETS ATTRIBUTABLE TO HOLDERS OF REDEEMABLE UNITSPER SERIES
Series A $711,762,881 $646,325,986
NET ASSETS ATTRIBUTABLE TO HOLDERS OF REDEEMABLE UNITSPER UNIT
Series A $ 11.20 $ 10.98
STATEMENTS OF COMPREHENSIVE INCOMEFor the six month periods ended June 30,
2015 2014INCOMENet gain (loss) on investments (note 2)
Dividends $ 283,856 $ –Interest for distribution purposes 13,061,966 12,976,144Capital gains distributions received 772,530 –Net realized gain (loss) on non-derivative financial assets 813,189 109,782Change in unrealized gain (loss) on non-derivative financial assets 8,393,546 24,598,868
Net gain (loss) on investments 23,325,087 37,684,794Other income 9,352 11,218
Total income (loss) 23,334,439 37,696,012
EXPENSESManagement fees (note 5) 6,202,043 5,149,534Fixed administration fees (note 6) 172,277 –Independent Review Committee fees 506 851Interest expense and bank overdraft charges – 62Audit fees – 6,186Custodian fees – 1,603Filing fees – 21,026Legal fees – 1,821Unitholder administration costs – 86,618Unitholder reporting costs – 13,394Harmonized Sales Tax/Goods and Services Tax 686,569 557,051
Total expenses 7,061,395 5,838,146
Increase (decrease) in net assets attributable to holders of redeemableunits from operations $16,273,044 $31,857,866
INCREASE (DECREASE) IN NET ASSETS ATTRIBUTABLE TO HOLDERS OFREDEEMABLE UNITS FROM OPERATIONS PER SERIES
Series A $16,273,044 $31,857,866
INCREASE (DECREASE) IN NET ASSETS ATTRIBUTABLE TO HOLDERS OFREDEEMABLE UNITS FROM OPERATIONS PER UNIT†
Series A $ 0.26 $ 0.60
WEIGHTED AVERAGE NUMBER OF UNITS PER SERIESSeries A 61,763,031 52,694,954
† The increase (decrease) in net assets attributable to holders of redeemable units fromoperations per unit is calculated by dividing the increase (decrease) in net assetsattributable to holders of redeemable units from operations per series by the weightedaverage number of units per series.
STATEMENTS OF CHANGES IN NET ASSETSATTRIBUTABLE TO HOLDERS OF REDEEMABLE UNITSFor the six month periods ended June 30,
2015 2014NET ASSETS ATTRIBUTABLE TO HOLDERS OF REDEEMABLE UNITS,
BEGINNING OF PERIODSeries A $646,325,986 $540,210,970
INCREASE (DECREASE) IN NET ASSETS ATTRIBUTABLE TO HOLDERSOF REDEEMABLE UNITS FROM OPERATIONS
Series A 16,273,044 31,857,866
DISTRIBUTIONS TO HOLDERS OF REDEEMABLE UNITSFrom net investment income
Series A (3,493,777) (6,329,214)
REDEEMABLE UNIT TRANSACTIONSProceeds from issue
Series A 110,702,760 106,213,068Reinvested distributions
Series A 3,433,138 6,239,178Payments on redemption
Series A (61,478,270) (67,842,364)
52,657,628 44,609,882
INCREASE (DECREASE) IN NET ASSETS ATTRIBUTABLE TO HOLDERSOF REDEEMABLE UNITS
Series A 65,436,895 70,138,534
NET ASSETS ATTRIBUTABLE TO HOLDERS OF REDEEMABLE UNITS,END OF PERIOD
Series A $711,762,881 $610,349,504
STATEMENTS OF CASH FLOWSFor the six month periods ended June 30,
2015 2014CASH FLOWS FROM OPERATING ACTIVITIESIncrease (decrease) in net assets attributable to holders of
redeemable units $ 16,273,044 $ 31,857,866Adjustments for:
Net realized (gain) loss on non-derivative financial assets (813,189) (109,782)Change in unrealized (gain) loss on non-derivative financial assets (8,393,546) (24,598,868)Purchases of non-derivative financial assets (62,903,064) (45,060,598)Proceeds from sale of non-derivative financial assets 4,500,000 700,000Accrued investment income and other 620 (1,799)Accrued expenses 1,280,969 1,049,350
Net cash provided by (used in) operating activities (50,055,166) (36,163,831)CASH FLOWS FROM FINANCING ACTIVITIESProceeds from issue of redeemable units 111,528,718 106,260,033Amounts paid on redemption of redeemable units (61,209,513) (67,828,468)Distributions to unitholders of redeemable units (241,027) (140,809)
Net cash provided by (used in) financing activities 50,078,178 38,290,756Net increase (decrease) in cash 23,012 2,126,925Cash (bank overdraft), beginning of period 3,645,449 2,194,328
CASH (BANK OVERDRAFT), END OF PERIOD $ 3,668,461 $ 4,321,253
Interest received(1) 13,062,589 12,974,345Dividends received, net of withholding taxes(1) 283,856 –
(1) Classified as operating items.
The accompanying notes are an integral part of the financial statements.
299
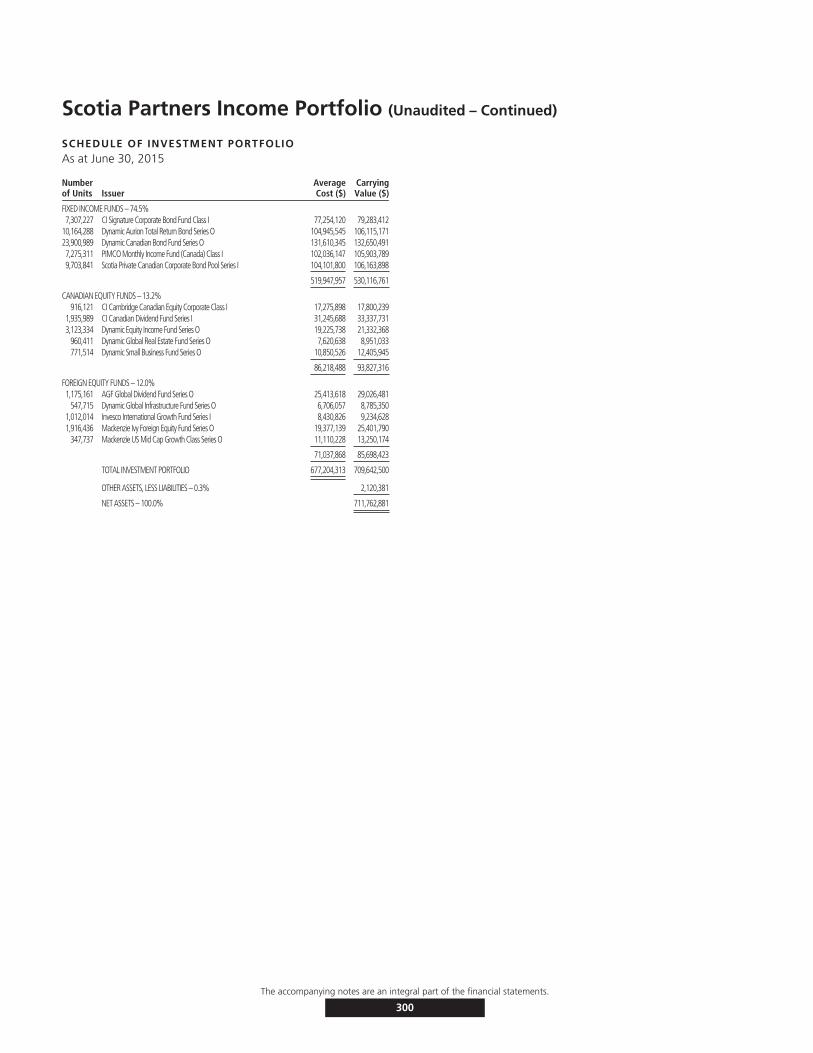
Scotia Partners Income Portfolio (Unaudited – Continued)
SCHEDULE OF INVESTMENT PORTFOLIOAs at June 30, 2015
Numberof Units Issuer
AverageCost ($)
CarryingValue ($)
FIXED INCOME FUNDS – 74.5%7,307,227 CI Signature Corporate Bond Fund Class I 77,254,120 79,283,412
10,164,288 Dynamic Aurion Total Return Bond Series O 104,945,545 106,115,17123,900,989 Dynamic Canadian Bond Fund Series O 131,610,345 132,650,4917,275,311 PIMCO Monthly Income Fund (Canada) Class I 102,036,147 105,903,7899,703,841 Scotia Private Canadian Corporate Bond Pool Series I 104,101,800 106,163,898
519,947,957 530,116,761
CANADIAN EQUITY FUNDS – 13.2%916,121 CI Cambridge Canadian Equity Corporate Class I 17,275,898 17,800,239
1,935,989 CI Canadian Dividend Fund Series I 31,245,688 33,337,7313,123,334 Dynamic Equity Income Fund Series O 19,225,738 21,332,368
960,411 Dynamic Global Real Estate Fund Series O 7,620,638 8,951,033771,514 Dynamic Small Business Fund Series O 10,850,526 12,405,945
86,218,488 93,827,316
FOREIGN EQUITY FUNDS – 12.0%1,175,161 AGF Global Dividend Fund Series O 25,413,618 29,026,481
547,715 Dynamic Global Infrastructure Fund Series O 6,706,057 8,785,3501,012,014 Invesco International Growth Fund Series I 8,430,826 9,234,6281,916,436 Mackenzie Ivy Foreign Equity Fund Series O 19,377,139 25,401,790
347,737 Mackenzie US Mid Cap Growth Class Series O 11,110,228 13,250,174
71,037,868 85,698,423
TOTAL INVESTMENT PORTFOLIO 677,204,313 709,642,500
OTHER ASSETS, LESS LIABILITIES – 0.3% 2,120,381
NET ASSETS – 100.0% 711,762,881
The accompanying notes are an integral part of the financial statements.
300

Scotia Partners Income Portfolio (Unaudited)
FUND SPECIFIC NOTESFor the periods indicated in Note 1.
1. The Fund (note 1)
The Fund’s investment objective is to achieve acombination of a steady flow of income with the potentialfor capital gains. It invests primarily in a diversified mix ofequity and income mutual funds managed by other mutualfund managers and by us. The portfolio is an assetallocation fund that allocates investment between two assetclasses: fixed income and equities.
The Fund invests primarily in mutual funds managed by theManager and/or by the third party investment managers(the ‘‘Underlying Funds’’). To ensure the Fund’scomposition meets the investment objectives of the Fund,the portfolio advisor monitors the Underlying Funds on anongoing basis and rebalances the Fund’s assets among theUnderlying Funds.
2. Risks associated with financial instruments (note 4)
i) Interest rate risk
The Fund invests in Underlying Funds, which are exposedto interest rate risk. As at June 30, 2015, had the prevailinginterest rates increased or decreased by 0.25%, assuming aparallel shift in the yield curve and all other variables heldconstant, net assets attributable to holders of redeemableunits would have decreased or increased, respectively, by$4,870,226 or approximately 0.7% (December 31, 2014 –$4,385,683 or approximately 0.7%). In practice, actualresults may differ from this sensitivity analysis and thedifference could be material.
ii) Currency risk
The Fund could be exposed to indirect currency risk to theextent that the Underlying Funds held financialinstruments that were denominated in a currency otherthan its functional currency.
iii) Price risk
Price risk is the risk that the carrying value of financialinstruments will fluctuate as a result of changes in marketprices (other than those arising from interest rate risk orcurrency risk) caused by factors specific to a security, itsissuer or all factors affecting a market or a market segment.Exposure to price risk is mainly in equities, derivatives andcommodities, if applicable. As at June 30, 2015,approximately 25.2% (December 31, 2014 – 25.3%) of theFund’s net assets were invested in Underlying Funds whichwere exposed to price risk. If prices of the Underlying
Funds’ investments had decreased or increased by 10%,with all other variables held constant, net assets of theFund would have decreased or increased, respectively, byapproximately $17,952,574 (December 31, 2014 –$16,345,124). In practice, actual results may differ from thissensitivity analysis and the difference could be material.
iv) Credit risk
The Fund could be exposed to indirect credit risk to theextent that the Underlying Funds invested in bonds anddebentures, preferred shares and derivatives.
v) Liquidity risk
The table below summarizes the Fund’s financial liabilitiesbased on the remaining period to the contractual maturitydate.
June 30, 2015 December 31, 2014
On demand($)
Less than3 months
($)On demand
($)
Less than3 months
($)
Current liabilities – 2,092,981 – 723,643Liability for written options – – – –Unrealized loss on derivatives – – – –Redeemable units 711,762,881 – 646,325,986 –
711,762,881 2,092,981 646,325,986 723,643
Redeemable units are redeemable on demand at theholder’s option. However, the Manager does not expect thatthe contractual maturity disclosed in the table above will berepresentative of the actual cash outflows, as holders ofthese instruments typically retain them for a longer term.
vi) Concentration risk
Concentration risk arises as a result of the concentration ofexposures within the same category, geographical location,asset type or industry sector, as applicable. The table belowis a summary of the Fund’s concentration risk:
Percentage of net assets (%)
June 30, 2015 December 31, 2014
Canadian Equity Funds 13.2 13.1Fixed Income Funds 74.5 74.0Foreign Equity Funds 12.0 12.2
vii) Fair value classification (note 2)
The tables below illustrate the classification of the Fund’sfinancial instruments within the fair value hierarchy.
June 30, 2015Level 1
($)Level 2
($)Level 3
($)Total($)
Underlying funds 709,642,500 – – 709,642,500
709,642,500 – – 709,642,500
The accompanying notes are an integral part of the financial statements.
301

Scotia Partners Income Portfolio (Unaudited – Continued)
FUND SPECIFIC NOTESFor the periods indicated in Note 1.
December 31. 2014Level 1
($)Level 2
($)Level 3
($)Total($)
Underlying funds 642,032,701 – – 642,032,701
642,032,701 – – 642,032,701
Transfers between levels
During the periods ended June 30, 2015 and December 31,2014, there were no significant transfers between Level 1and Level 2.
3. Offsetting of financial assets and liabilities (note 2)
As at June 30, 2015 or December 31, 2014, the Fund didnot enter into any agreement whereby the financialinstruments were eligible for offset.
4. Interest in Underlying Funds (note 2)
The following tables provide information about the Fund’sinterest in Underlying Funds.
June 30, 2015
Underlying Fund
Net asset value ofUnderlying Fund
($)
Carrying value ofUnderlying Fund
($)
Carrying value ofUnderlying Fundas a percentage
of net assets(%)
AGF Global DividendFund Series O 1,905,828,927 29,026,481 4.1
Invesco InternationalGrowth Fund Series I 363,116,047 9,234,628 1.3
CI Canadian DividendFund Series I 286,312,298 33,337,731 4.7
CI Cambridge CanadianEquity CorporateClass I 4,000,996,546 17,800,239 2.5
CI Signature CorporateBond Fund Class I 3,143,682,384 79,283,412 11.1
Dynamic Global RealEstate Fund Series O 189,655,656 8,951,033 1.3
Dynamic Small BusinessFund Series O 572,121,025 12,405,945 1.7
Dynamic Equity IncomeFund Series O 1,824,134,485 21,332,368 3.0
Dynamic Canadian BondFund Series O 1,795,916,854 132,650,491 18.6
Dynamic GlobalInfrastructure FundSeries O 590,809,397 8,785,350 1.2
Dynamic Aurion TotalReturn Bond Series O 874,399,686 106,115,171 14.9
Mackenzie US Mid CapGrowth Class Series O 399,655,416 13,250,174 1.9
Mackenzie Ivy ForeignEquity Fund Series O 416,071,841 25,401,790 3.6
PIMCO Monthly IncomeFund (Canada) Class I 7,409,175,099 105,903,789 14.9
Scotia Private CanadianCorporate Bond PoolSeries I 4,860,619,761 106,163,898 14.9
709,642,500 99.7
December 31, 2014
Underlying Fund
Net asset value ofUnderlying Fund
($)
Carrying value ofUnderlying Fund
($)
Carrying value ofUnderlying Fundas a percentage
of net assets(%)
AGF Global DividendFund Series O 928,562,391 26,537,920 4.1
Invesco InternationalGrowth Fund Series I 386,346,380 8,333,357 1.3
CI Canadian DividendFund Series I 284,390,723 29,844,932 4.6
CI Cambridge CanadianEquity CorporateClass I 3,722,459,360 16,303,996 2.5
CI Signature CorporateBond Fund Class I 2,779,935,434 71,615,066 11.1
Dynamic Global RealEstate Fund Series O 187,183,394 8,431,125 1.3
Dynamic Small BusinessFund Series O 559,673,399 11,005,171 1.7
Dynamic Equity IncomeFund Series O 1,900,219,456 19,003,107 2.9
Dynamic Canadian BondFund Series O 1,713,889,460 118,710,437 18.4
Dynamic GlobalInfrastructure FundSeries O 564,666,720 8,406,010 1.3
Dynamic Aurion TotalReturn Bond Series O 772,301,187 97,195,127 15.0
Mackenzie US Mid CapGrowth Class Series O 369,797,950 11,871,827 1.8
Mackenzie Ivy ForeignEquity Fund Series O 460,416,750 23,713,798 3.7
PIMCO Monthly IncomeFund (Canada) Class I 6,546,163,575 96,157,489 14.9
Scotia Private CanadianCorporate Bond PoolSeries I 4,143,683,984 94,903,339 14.7
642,032,701 99.3
5. Comparison of net asset value per unit and netassets per unit (note 2)
The table below provides a comparison of the net assetvalue per unit and net assets per unit. The primary reasonfor the difference between the net asset value per unit andnet assets per unit, if any, is described in note 2.
June 30, 2015 December 31, 2014
Net asset valueper unit
($)
Net assetsper unit
($)
Net asset valueper unit
($)
Net assetsper unit
($)
Series A 11.20 11.20 10.98 10.98
The accompanying notes are an integral part of the financial statements.
302
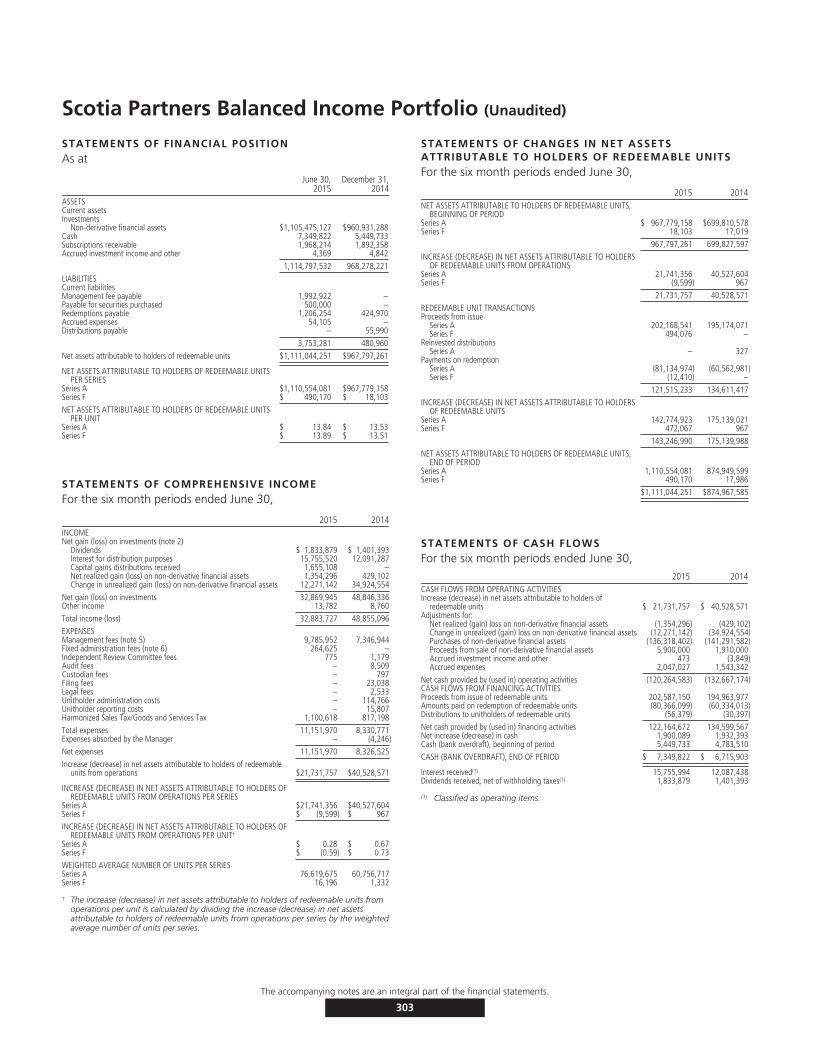
Scotia Partners Balanced Income Portfolio (Unaudited)
STATEMENTS OF FINANCIAL POSITIONAs at
June 30,2015
December 31,2014
ASSETSCurrent assetsInvestments
Non-derivative financial assets $1,105,475,127 $960,931,288Cash 7,349,822 5,449,733Subscriptions receivable 1,968,214 1,892,358Accrued investment income and other 4,369 4,842
1,114,797,532 968,278,221
LIABILITIESCurrent liabilitiesManagement fee payable 1,992,922 –Payable for securities purchased 500,000 –Redemptions payable 1,206,254 424,970Accrued expenses 54,105 –Distributions payable – 55,990
3,753,281 480,960
Net assets attributable to holders of redeemable units $1,111,044,251 $967,797,261
NET ASSETS ATTRIBUTABLE TO HOLDERS OF REDEEMABLE UNITSPER SERIES
Series A $1,110,554,081 $967,779,158Series F $ 490,170 $ 18,103
NET ASSETS ATTRIBUTABLE TO HOLDERS OF REDEEMABLE UNITSPER UNIT
Series A $ 13.84 $ 13.53Series F $ 13.89 $ 13.51
STATEMENTS OF COMPREHENSIVE INCOMEFor the six month periods ended June 30,
2015 2014INCOMENet gain (loss) on investments (note 2)
Dividends $ 1,833,879 $ 1,401,393Interest for distribution purposes 15,755,520 12,091,287Capital gains distributions received 1,655,108 –Net realized gain (loss) on non-derivative financial assets 1,354,296 429,102Change in unrealized gain (loss) on non-derivative financial assets 12,271,142 34,924,554
Net gain (loss) on investments 32,869,945 48,846,336Other income 13,782 8,760
Total income (loss) 32,883,727 48,855,096
EXPENSESManagement fees (note 5) 9,785,952 7,346,944Fixed administration fees (note 6) 264,625 –Independent Review Committee fees 775 1,179Audit fees – 8,509Custodian fees – 797Filing fees – 23,038Legal fees – 2,533Unitholder administration costs – 114,766Unitholder reporting costs – 15,807Harmonized Sales Tax/Goods and Services Tax 1,100,618 817,198
Total expenses 11,151,970 8,330,771Expenses absorbed by the Manager – (4,246)
Net expenses 11,151,970 8,326,525
Increase (decrease) in net assets attributable to holders of redeemableunits from operations $21,731,757 $40,528,571
INCREASE (DECREASE) IN NET ASSETS ATTRIBUTABLE TO HOLDERS OFREDEEMABLE UNITS FROM OPERATIONS PER SERIES
Series A $21,741,356 $40,527,604Series F $ (9,599) $ 967
INCREASE (DECREASE) IN NET ASSETS ATTRIBUTABLE TO HOLDERS OFREDEEMABLE UNITS FROM OPERATIONS PER UNIT†
Series A $ 0.28 $ 0.67Series F $ (0.59) $ 0.73
WEIGHTED AVERAGE NUMBER OF UNITS PER SERIESSeries A 76,619,675 60,756,717Series F 16,196 1,332
† The increase (decrease) in net assets attributable to holders of redeemable units fromoperations per unit is calculated by dividing the increase (decrease) in net assetsattributable to holders of redeemable units from operations per series by the weightedaverage number of units per series.
STATEMENTS OF CHANGES IN NET ASSETSATTRIBUTABLE TO HOLDERS OF REDEEMABLE UNITSFor the six month periods ended June 30,
2015 2014NET ASSETS ATTRIBUTABLE TO HOLDERS OF REDEEMABLE UNITS,
BEGINNING OF PERIODSeries A $ 967,779,158 $699,810,578Series F 18,103 17,019
967,797,261 699,827,597
INCREASE (DECREASE) IN NET ASSETS ATTRIBUTABLE TO HOLDERSOF REDEEMABLE UNITS FROM OPERATIONS
Series A 21,741,356 40,527,604Series F (9,599) 967
21,731,757 40,528,571
REDEEMABLE UNIT TRANSACTIONSProceeds from issue
Series A 202,168,541 195,174,071Series F 494,076 –
Reinvested distributionsSeries A – 327
Payments on redemptionSeries A (81,134,974) (60,562,981)Series F (12,410) –
121,515,233 134,611,417
INCREASE (DECREASE) IN NET ASSETS ATTRIBUTABLE TO HOLDERSOF REDEEMABLE UNITS
Series A 142,774,923 175,139,021Series F 472,067 967
143,246,990 175,139,988
NET ASSETS ATTRIBUTABLE TO HOLDERS OF REDEEMABLE UNITS,END OF PERIOD
Series A 1,110,554,081 874,949,599Series F 490,170 17,986
$1,111,044,251 $874,967,585
STATEMENTS OF CASH FLOWSFor the six month periods ended June 30,
2015 2014CASH FLOWS FROM OPERATING ACTIVITIESIncrease (decrease) in net assets attributable to holders of
redeemable units $ 21,731,757 $ 40,528,571Adjustments for:
Net realized (gain) loss on non-derivative financial assets (1,354,296) (429,102)Change in unrealized (gain) loss on non-derivative financial assets (12,271,142) (34,924,554)Purchases of non-derivative financial assets (136,318,402) (141,291,582)Proceeds from sale of non-derivative financial assets 5,900,000 1,910,000Accrued investment income and other 473 (3,849)Accrued expenses 2,047,027 1,543,342
Net cash provided by (used in) operating activities (120,264,583) (132,667,174)CASH FLOWS FROM FINANCING ACTIVITIESProceeds from issue of redeemable units 202,587,150 194,963,977Amounts paid on redemption of redeemable units (80,366,099) (60,334,013)Distributions to unitholders of redeemable units (56,379) (30,397)
Net cash provided by (used in) financing activities 122,164,672 134,599,567Net increase (decrease) in cash 1,900,089 1,932,393Cash (bank overdraft), beginning of period 5,449,733 4,783,510
CASH (BANK OVERDRAFT), END OF PERIOD $ 7,349,822 $ 6,715,903
Interest received(1) 15,755,994 12,087,438Dividends received, net of withholding taxes(1) 1,833,879 1,401,393
(1) Classified as operating items.
The accompanying notes are an integral part of the financial statements.
303

Scotia Partners Balanced Income Portfolio (Unaudited – Continued)
SCHEDULE OF INVESTMENT PORTFOLIOAs at June 30, 2015
Numberof Units Issuer
AverageCost ($)
CarryingValue ($)
FIXED INCOME FUNDS – 64.2%9,844,402 CI Signature Corporate Bond Fund Class I 104,991,709 106,811,764
10,229,871 Dynamic Aurion Total Return Bond Series O 105,737,987 106,799,85112,846,866 Dynamic Canadian Bond Fund Series O 70,397,609 71,300,1087,343,996 PIMCO Monthly Income Fund (Canada) Class I 104,475,198 106,903,619
13,068,060 Scotia Canadian Income Fund Series I 178,682,185 178,960,55213,066,448 Scotia Private Canadian Corporate Bond Pool Series I 137,747,768 142,952,168
702,032,456 713,728,062
CANADIAN EQUITY FUNDS – 18.1%1,973,158 CI Cambridge Canadian Equity Corporate Class I 32,500,756 38,338,4592,552,665 CI Canadian Dividend Fund Series I 41,888,730 43,956,8911,490,746 Dynamic Global Real Estate Fund Series O 12,769,595 13,893,7521,723,788 Dynamic Small Business Fund Series O 24,564,793 27,718,5151,466,691 Scotia Canadian Dividend Fund Series I 61,805,277 76,982,042
173,529,151 200,889,659
FOREIGN EQUITY FUNDS – 17.2%913,261 AGF Global Dividend Fund Series O 17,235,395 22,557,536857,624 Dynamic Global Infrastructure Fund Series O 13,208,887 13,756,291
1,855,435 Invesco International Growth Fund Series I 12,665,505 16,930,845602,753 Mackenzie Emerging Markets Class Series O 17,492,861 20,095,784
3,844,759 Mackenzie Ivy Foreign Equity Fund Series O 43,044,500 50,961,121696,217 Mackenzie US Mid Cap Growth Class Series O 15,297,304 26,528,666275,787 Mawer International Equity Fund Class O 10,609,448 14,099,664694,603 Mawer U.S. Equity Fund Class O 15,901,006 25,927,499
145,454,906 190,857,406
TOTAL INVESTMENT PORTFOLIO 1,021,016,513 1,105,475,127
OTHER ASSETS, LESS LIABILITIES – 0.5% 5,569,124
NET ASSETS – 100.0% 1,111,044,251
The accompanying notes are an integral part of the financial statements.
304
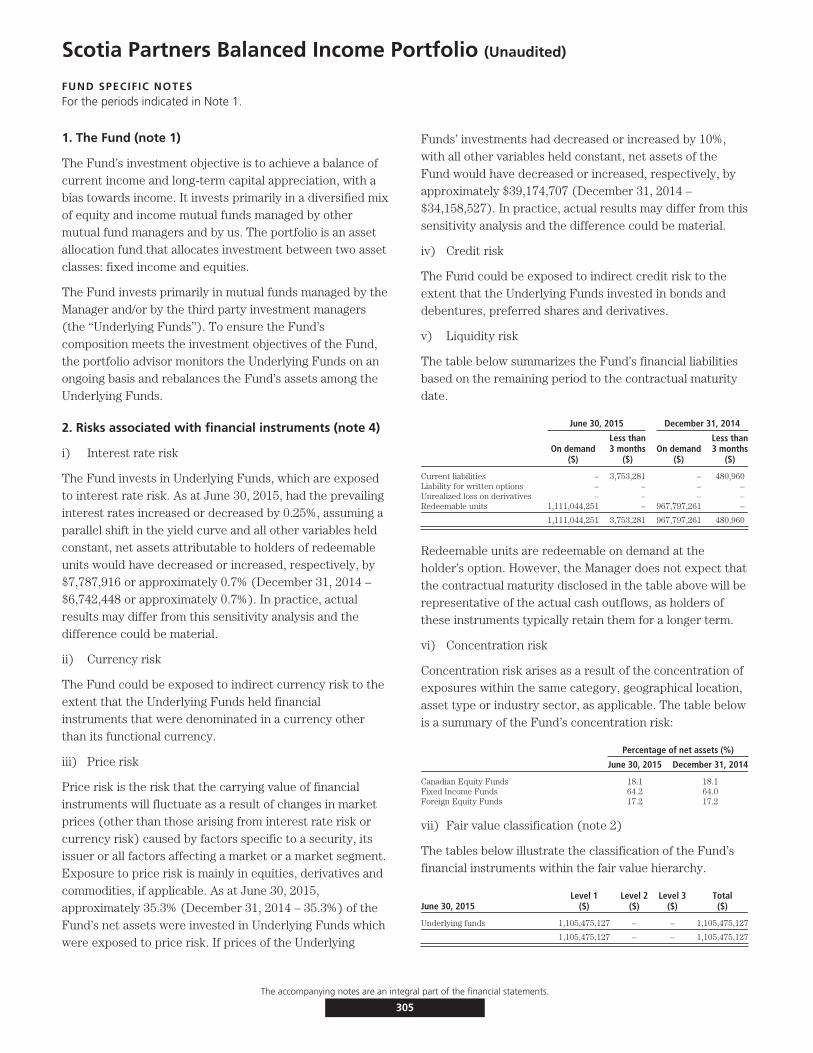
Scotia Partners Balanced Income Portfolio (Unaudited)
FUND SPECIFIC NOTESFor the periods indicated in Note 1.
1. The Fund (note 1)
The Fund’s investment objective is to achieve a balance ofcurrent income and long-term capital appreciation, with abias towards income. It invests primarily in a diversified mixof equity and income mutual funds managed by othermutual fund managers and by us. The portfolio is an assetallocation fund that allocates investment between two assetclasses: fixed income and equities.
The Fund invests primarily in mutual funds managed by theManager and/or by the third party investment managers(the ‘‘Underlying Funds’’). To ensure the Fund’scomposition meets the investment objectives of the Fund,the portfolio advisor monitors the Underlying Funds on anongoing basis and rebalances the Fund’s assets among theUnderlying Funds.
2. Risks associated with financial instruments (note 4)
i) Interest rate risk
The Fund invests in Underlying Funds, which are exposedto interest rate risk. As at June 30, 2015, had the prevailinginterest rates increased or decreased by 0.25%, assuming aparallel shift in the yield curve and all other variables heldconstant, net assets attributable to holders of redeemableunits would have decreased or increased, respectively, by$7,787,916 or approximately 0.7% (December 31, 2014 –$6,742,448 or approximately 0.7%). In practice, actualresults may differ from this sensitivity analysis and thedifference could be material.
ii) Currency risk
The Fund could be exposed to indirect currency risk to theextent that the Underlying Funds held financialinstruments that were denominated in a currency otherthan its functional currency.
iii) Price risk
Price risk is the risk that the carrying value of financialinstruments will fluctuate as a result of changes in marketprices (other than those arising from interest rate risk orcurrency risk) caused by factors specific to a security, itsissuer or all factors affecting a market or a market segment.Exposure to price risk is mainly in equities, derivatives andcommodities, if applicable. As at June 30, 2015,approximately 35.3% (December 31, 2014 – 35.3%) of theFund’s net assets were invested in Underlying Funds whichwere exposed to price risk. If prices of the Underlying
Funds’ investments had decreased or increased by 10%,with all other variables held constant, net assets of theFund would have decreased or increased, respectively, byapproximately $39,174,707 (December 31, 2014 –$34,158,527). In practice, actual results may differ from thissensitivity analysis and the difference could be material.
iv) Credit risk
The Fund could be exposed to indirect credit risk to theextent that the Underlying Funds invested in bonds anddebentures, preferred shares and derivatives.
v) Liquidity risk
The table below summarizes the Fund’s financial liabilitiesbased on the remaining period to the contractual maturitydate.
June 30, 2015 December 31, 2014
On demand($)
Less than3 months
($)On demand
($)
Less than3 months
($)
Current liabilities – 3,753,281 – 480,960Liability for written options – – – –Unrealized loss on derivatives – – – –Redeemable units 1,111,044,251 – 967,797,261 –
1,111,044,251 3,753,281 967,797,261 480,960
Redeemable units are redeemable on demand at theholder’s option. However, the Manager does not expect thatthe contractual maturity disclosed in the table above will berepresentative of the actual cash outflows, as holders ofthese instruments typically retain them for a longer term.
vi) Concentration risk
Concentration risk arises as a result of the concentration ofexposures within the same category, geographical location,asset type or industry sector, as applicable. The table belowis a summary of the Fund’s concentration risk:
Percentage of net assets (%)
June 30, 2015 December 31, 2014
Canadian Equity Funds 18.1 18.1Fixed Income Funds 64.2 64.0Foreign Equity Funds 17.2 17.2
vii) Fair value classification (note 2)
The tables below illustrate the classification of the Fund’sfinancial instruments within the fair value hierarchy.
June 30, 2015Level 1
($)Level 2
($)Level 3
($)Total($)
Underlying funds 1,105,475,127 – – 1,105,475,127
1,105,475,127 – – 1,105,475,127
The accompanying notes are an integral part of the financial statements.
305
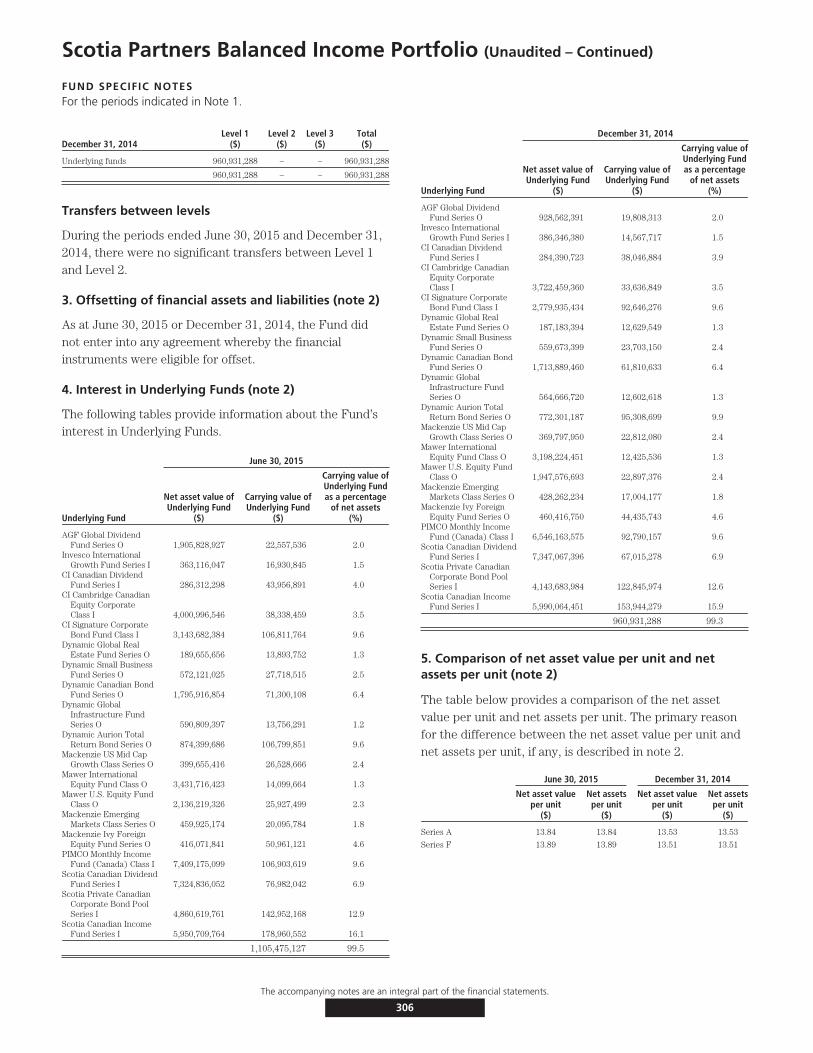
Scotia Partners Balanced Income Portfolio (Unaudited – Continued)
FUND SPECIFIC NOTESFor the periods indicated in Note 1.
December 31, 2014Level 1
($)Level 2
($)Level 3
($)Total($)
Underlying funds 960,931,288 – – 960,931,288
960,931,288 – – 960,931,288
Transfers between levels
During the periods ended June 30, 2015 and December 31,2014, there were no significant transfers between Level 1and Level 2.
3. Offsetting of financial assets and liabilities (note 2)
As at June 30, 2015 or December 31, 2014, the Fund didnot enter into any agreement whereby the financialinstruments were eligible for offset.
4. Interest in Underlying Funds (note 2)
The following tables provide information about the Fund’sinterest in Underlying Funds.
June 30, 2015
Underlying Fund
Net asset value ofUnderlying Fund
($)
Carrying value ofUnderlying Fund
($)
Carrying value ofUnderlying Fundas a percentage
of net assets(%)
AGF Global DividendFund Series O 1,905,828,927 22,557,536 2.0
Invesco InternationalGrowth Fund Series I 363,116,047 16,930,845 1.5
CI Canadian DividendFund Series I 286,312,298 43,956,891 4.0
CI Cambridge CanadianEquity CorporateClass I 4,000,996,546 38,338,459 3.5
CI Signature CorporateBond Fund Class I 3,143,682,384 106,811,764 9.6
Dynamic Global RealEstate Fund Series O 189,655,656 13,893,752 1.3
Dynamic Small BusinessFund Series O 572,121,025 27,718,515 2.5
Dynamic Canadian BondFund Series O 1,795,916,854 71,300,108 6.4
Dynamic GlobalInfrastructure FundSeries O 590,809,397 13,756,291 1.2
Dynamic Aurion TotalReturn Bond Series O 874,399,686 106,799,851 9.6
Mackenzie US Mid CapGrowth Class Series O 399,655,416 26,528,666 2.4
Mawer InternationalEquity Fund Class O 3,431,716,423 14,099,664 1.3
Mawer U.S. Equity FundClass O 2,136,219,326 25,927,499 2.3
Mackenzie EmergingMarkets Class Series O 459,925,174 20,095,784 1.8
Mackenzie Ivy ForeignEquity Fund Series O 416,071,841 50,961,121 4.6
PIMCO Monthly IncomeFund (Canada) Class I 7,409,175,099 106,903,619 9.6
Scotia Canadian DividendFund Series I 7,324,836,052 76,982,042 6.9
Scotia Private CanadianCorporate Bond PoolSeries I 4,860,619,761 142,952,168 12.9
Scotia Canadian IncomeFund Series I 5,950,709,764 178,960,552 16.1
1,105,475,127 99.5
December 31, 2014
Underlying Fund
Net asset value ofUnderlying Fund
($)
Carrying value ofUnderlying Fund
($)
Carrying value ofUnderlying Fundas a percentage
of net assets(%)
AGF Global DividendFund Series O 928,562,391 19,808,313 2.0
Invesco InternationalGrowth Fund Series I 386,346,380 14,567,717 1.5
CI Canadian DividendFund Series I 284,390,723 38,046,884 3.9
CI Cambridge CanadianEquity CorporateClass I 3,722,459,360 33,636,849 3.5
CI Signature CorporateBond Fund Class I 2,779,935,434 92,646,276 9.6
Dynamic Global RealEstate Fund Series O 187,183,394 12,629,549 1.3
Dynamic Small BusinessFund Series O 559,673,399 23,703,150 2.4
Dynamic Canadian BondFund Series O 1,713,889,460 61,810,633 6.4
Dynamic GlobalInfrastructure FundSeries O 564,666,720 12,602,618 1.3
Dynamic Aurion TotalReturn Bond Series O 772,301,187 95,308,699 9.9
Mackenzie US Mid CapGrowth Class Series O 369,797,950 22,812,080 2.4
Mawer InternationalEquity Fund Class O 3,198,224,451 12,425,536 1.3
Mawer U.S. Equity FundClass O 1,947,576,693 22,897,376 2.4
Mackenzie EmergingMarkets Class Series O 428,262,234 17,004,177 1.8
Mackenzie Ivy ForeignEquity Fund Series O 460,416,750 44,435,743 4.6
PIMCO Monthly IncomeFund (Canada) Class I 6,546,163,575 92,790,157 9.6
Scotia Canadian DividendFund Series I 7,347,067,396 67,015,278 6.9
Scotia Private CanadianCorporate Bond PoolSeries I 4,143,683,984 122,845,974 12.6
Scotia Canadian IncomeFund Series I 5,990,064,451 153,944,279 15.9
960,931,288 99.3
5. Comparison of net asset value per unit and netassets per unit (note 2)
The table below provides a comparison of the net assetvalue per unit and net assets per unit. The primary reasonfor the difference between the net asset value per unit andnet assets per unit, if any, is described in note 2.
June 30, 2015 December 31, 2014
Net asset valueper unit
($)
Net assetsper unit
($)
Net asset valueper unit
($)
Net assetsper unit
($)
Series A 13.84 13.84 13.53 13.53
Series F 13.89 13.89 13.51 13.51
The accompanying notes are an integral part of the financial statements.
306

Scotia Partners Balanced Growth Portfolio (Unaudited)
STATEMENTS OF FINANCIAL POSITIONAs at
June 30,2015
December 31,2014
ASSETSCurrent assetsInvestments
Non-derivative financial assets $2,595,229,897 $2,394,969,958Cash 17,841,447 12,537,853Subscriptions receivable 2,255,626 2,460,690Accrued investment income and other 9,712 11,383
2,615,336,682 2,409,979,884
LIABILITIESCurrent liabilitiesManagement fee payable 5,084,561 –Payable for securities purchased 200,000 –Redemptions payable 1,720,202 1,629,947Accrued expenses 102,158 –Distributions payable – 143,346
7,106,921 1,773,293
Net assets attributable to holders of redeemable units $2,608,229,761 $2,408,206,591
NET ASSETS ATTRIBUTABLE TO HOLDERS OF REDEEMABLE UNITSPER SERIES
Series A $2,607,902,194 $2,407,922,168Series F $ 327,567 $ 284,423
NET ASSETS ATTRIBUTABLE TO HOLDERS OF REDEEMABLE UNITSPER UNIT
Series A $ 16.17 $ 15.66Series F $ 17.18 $ 16.55
STATEMENTS OF COMPREHENSIVE INCOMEFor the six month periods ended June 30,
2015 2014INCOMENet gain (loss) on investments (note 2)
Dividends $ 7,266,386 $ 5,064,815Interest for distribution purposes 21,842,952 21,747,668Capital gains distributions received 6,497,384 –Net realized gain (loss) on non-derivative financial assets 6,530,064 352,791Change in unrealized gain (loss) on non-derivative financial assets 64,408,393 121,377,183
Net gain (loss) on investments 106,545,179 148,542,457Other income 15,381 13,572
Total income (loss) 106,560,560 148,556,029
EXPENSESManagement fees (note 5) 25,513,491 21,370,197Fixed administration fees (note 6) 510,472 –Independent Review Committee fees 1,877 3,176Audit fees – 22,864Custodian fees – 752Filing fees – 44,271Legal fees – 6,803Unitholder administration costs – 297,243Unitholder reporting costs – 36,658Harmonized Sales Tax/Goods and Services Tax 2,828,935 2,348,544
Total expenses 28,854,775 24,130,508Expenses absorbed by the Manager – (4,078)
Net expenses 28,854,775 24,126,430
Increase (decrease) in net assets attributable to holders of redeemableunits from operations $ 77,705,785 $124,429,599
INCREASE (DECREASE) IN NET ASSETS ATTRIBUTABLE TO HOLDERSOF REDEEMABLE UNITS FROM OPERATIONS PER SERIES
Series A $ 77,695,480 $124,421,060Series F $ 10,305 $ 8,539
INCREASE (DECREASE) IN NET ASSETS ATTRIBUTABLE TO HOLDERSOF REDEEMABLE UNITS FROM OPERATIONS PER UNIT†
Series A $ 0.49 $ 0.89Series F $ 0.57 $ 1.01
WEIGHTED AVERAGE NUMBER OF UNITS PER SERIESSeries A 158,268,544 139,867,982Series F 18,212 8,428
† The increase (decrease) in net assets attributable to holders of redeemable units fromoperations per unit is calculated by dividing the increase (decrease) in net assetsattributable to holders of redeemable units from operations per series by the weightedaverage number of units per series.
STATEMENTS OF CHANGES IN NET ASSETSATTRIBUTABLE TO HOLDERS OF REDEEMABLE UNITSFor the six month periods ended June 30,
2015 2014NET ASSETS ATTRIBUTABLE TO HOLDERS OF REDEEMABLE
UNITS, BEGINNING OF PERIODSeries A $2,407,922,168 $1,975,156,149Series F 284,423 139,973
2,408,206,591 1,975,296,122
INCREASE (DECREASE) IN NET ASSETS ATTRIBUTABLE TOHOLDERS OF REDEEMABLE UNITS FROM OPERATIONS
Series A 77,695,480 124,421,060Series F 10,305 8,539
77,705,785 124,429,599
REDEEMABLE UNIT TRANSACTIONSProceeds from issue
Series A 296,600,552 324,789,731Series F 32,839 5,400
Payments on redemptionSeries A (174,316,006) (137,918,932)Series F – (13,281)
122,317,385 186,862,918
INCREASE (DECREASE) IN NET ASSETS ATTRIBUTABLE TOHOLDERS OF REDEEMABLE UNITS
Series A 199,980,026 311,291,859Series F 43,144 658
200,023,170 311,292,517
NET ASSETS ATTRIBUTABLE TO HOLDERS OF REDEEMABLEUNITS, END OF PERIOD
Series A 2,607,902,194 2,286,448,008Series F 327,567 140,631
$2,608,229,761 $2,286,588,639
STATEMENTS OF CASH FLOWSFor the six month periods ended June 30,
2015 2014CASH FLOWS FROM OPERATING ACTIVITIESIncrease (decrease) in net assets attributable to holders of
redeemable units $ 77,705,785 $ 124,429,599Adjustments for:
Net realized (gain) loss on non-derivative financial assets (6,530,064) (352,791)Change in unrealized (gain) loss on non-derivative financial assets (64,408,393) (121,377,183)Purchases of non-derivative financial assets (152,121,482) (193,115,086)Proceeds from sale of non-derivative financial assets 23,000,000 2,440,000Accrued investment income and other 1,671 (1,072,733)Accrued expenses 5,186,719 4,364,478
Net cash provided by (used in) operating activities (117,165,764) (184,683,716)CASH FLOWS FROM FINANCING ACTIVITIESProceeds from issue of redeemable units 296,838,445 324,992,283Amounts paid on redemption of redeemable units (174,225,751) (137,028,973)Distributions to unitholders of redeemable units (143,336) (26,139)
Net cash provided by (used in) financing activities 122,469,358 187,937,171Net increase (decrease) in cash 5,303,594 3,253,455Cash (bank overdraft), beginning of period 12,537,853 12,512,796
CASH (BANK OVERDRAFT), END OF PERIOD $ 17,841,447 $ 15,766,251
Interest received(1) 21,844,622 21,745,489Dividends received, net of withholding taxes(1) 7,266,386 5,064,815
(1) Classified as operating items.
The accompanying notes are an integral part of the financial statements.
307
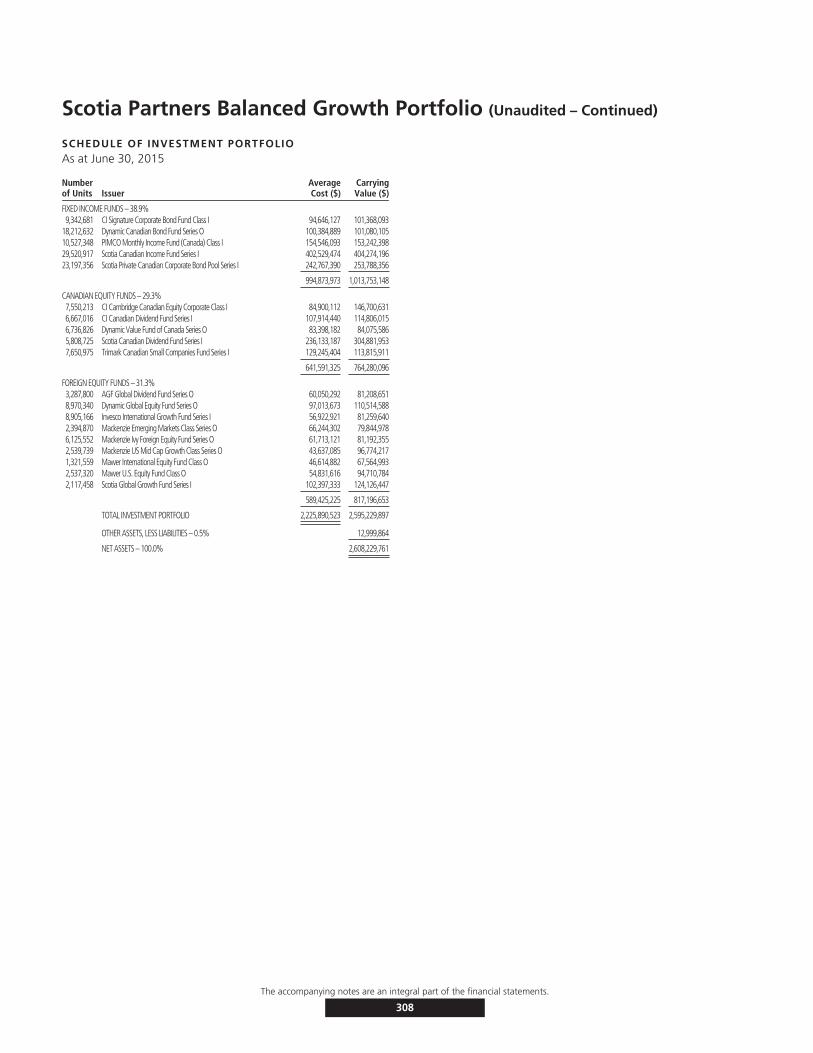
Scotia Partners Balanced Growth Portfolio (Unaudited – Continued)
SCHEDULE OF INVESTMENT PORTFOLIOAs at June 30, 2015
Numberof Units Issuer
AverageCost ($)
CarryingValue ($)
FIXED INCOME FUNDS – 38.9%9,342,681 CI Signature Corporate Bond Fund Class I 94,646,127 101,368,093
18,212,632 Dynamic Canadian Bond Fund Series O 100,384,889 101,080,10510,527,348 PIMCO Monthly Income Fund (Canada) Class I 154,546,093 153,242,39829,520,917 Scotia Canadian Income Fund Series I 402,529,474 404,274,19623,197,356 Scotia Private Canadian Corporate Bond Pool Series I 242,767,390 253,788,356
994,873,973 1,013,753,148
CANADIAN EQUITY FUNDS – 29.3%7,550,213 CI Cambridge Canadian Equity Corporate Class I 84,900,112 146,700,6316,667,016 CI Canadian Dividend Fund Series I 107,914,440 114,806,0156,736,826 Dynamic Value Fund of Canada Series O 83,398,182 84,075,5865,808,725 Scotia Canadian Dividend Fund Series I 236,133,187 304,881,9537,650,975 Trimark Canadian Small Companies Fund Series I 129,245,404 113,815,911
641,591,325 764,280,096
FOREIGN EQUITY FUNDS – 31.3%3,287,800 AGF Global Dividend Fund Series O 60,050,292 81,208,6518,970,340 Dynamic Global Equity Fund Series O 97,013,673 110,514,5888,905,166 Invesco International Growth Fund Series I 56,922,921 81,259,6402,394,870 Mackenzie Emerging Markets Class Series O 66,244,302 79,844,9786,125,552 Mackenzie Ivy Foreign Equity Fund Series O 61,713,121 81,192,3552,539,739 Mackenzie US Mid Cap Growth Class Series O 43,637,085 96,774,2171,321,559 Mawer International Equity Fund Class O 46,614,882 67,564,9932,537,320 Mawer U.S. Equity Fund Class O 54,831,616 94,710,7842,117,458 Scotia Global Growth Fund Series I 102,397,333 124,126,447
589,425,225 817,196,653
TOTAL INVESTMENT PORTFOLIO 2,225,890,523 2,595,229,897
OTHER ASSETS, LESS LIABILITIES – 0.5% 12,999,864
NET ASSETS – 100.0% 2,608,229,761
The accompanying notes are an integral part of the financial statements.
308

Scotia Partners Balanced Growth Portfolio (Unaudited)
FUND SPECIFIC NOTESFor the periods indicated in Note 1.
1. The Fund (note 1)
The Fund’s investment objective is to achieve a balance ofcurrent income and long-term capital appreciation, with asmall bias towards capital appreciation. It invests primarilyin a diversified mix of equity and income mutual fundsmanaged by other mutual fund managers and by us. Theportfolio is an asset allocation fund that allocatesinvestment between two asset classes: fixed income andequities.
The Fund invests primarily in mutual funds managed by theManager and/or by the third party investment managers(the ‘‘Underlying Funds’’). To ensure the Fund’scomposition meets the investment objectives of the Fund,the portfolio advisor monitors the Underlying Funds on anongoing basis and rebalances the Fund’s assets among theUnderlying Funds.
2. Risks associated with financial instruments (note 4)
i) Interest rate risk
The Fund invests in Underlying Funds, which are exposedto interest rate risk. As at June 30, 2015, had the prevailinginterest rates increased or decreased by 0.25%, assuming aparallel shift in the yield curve and all other variables heldconstant, net assets attributable to holders of redeemableunits would have decreased or increased, respectively, by$12,051,067 or approximately 0.5% (December 31, 2014 –$11,144,011 or approximately 0.5%). In practice, actualresults may differ from this sensitivity analysis and thedifference could be material.
ii) Currency risk
The Fund could be exposed to indirect currency risk to theextent that the Underlying Funds held financialinstruments that were denominated in a currency otherthan its functional currency.
iii) Price risk
Price risk is the risk that the carrying value of financialinstruments will fluctuate as a result of changes in marketprices (other than those arising from interest rate risk orcurrency risk) caused by factors specific to a security, itsissuer or all factors affecting a market or a market segment.Exposure to price risk is mainly in equities, derivatives andcommodities, if applicable. As at June 30, 2015,approximately 60.6% (December 31, 2014 – 60.5%) of theFund’s net assets were invested in Underlying Funds whichwere exposed to price risk. If prices of the Underlying
Funds’ investments had decreased or increased by 10%,with all other variables held constant, net assets of theFund would have decreased or increased, respectively, byapproximately $158,147,675 (December 31, 2014 –$145,809,994). In practice, actual results may differ fromthis sensitivity analysis and the difference could bematerial.
iv) Credit risk
The Fund could be exposed to indirect credit risk to theextent that the Underlying Funds invested in bonds anddebentures, preferred shares and derivatives.
v) Liquidity risk
The table below summarizes the Fund’s financial liabilitiesbased on the remaining period to the contractual maturitydate.
June 30, 2015 December 31, 2014
On demand($)
Less than3 months
($)On demand
($)
Less than3 months
($)
Current liabilities – 7,106,921 – 1,773,293Liability for written options – – – –Unrealized loss on derivatives – – – –Redeemable units 2,608,229,761 – 2,408,206,591 –
2,608,229,761 7,106,921 2,408,206,591 1,773,293
Redeemable units are redeemable on demand at theholder’s option. However, the Manager does not expect thatthe contractual maturity disclosed in the table above will berepresentative of the actual cash outflows, as holders ofthese instruments typically retain them for a longer term.
vi) Concentration risk
Concentration risk arises as a result of the concentration ofexposures within the same category, geographical location,asset type or industry sector, as applicable. The table belowis a summary of the Fund’s concentration risk:
Percentage of net assets (%)
June 30, 2015 December 31, 2014
Canadian Equity Funds 29.3 29.9Fixed Income Funds 38.9 38.9Foreign Equity Funds 31.3 30.6
vii) Fair value classification (note 2)
The tables below illustrate the classification of the Fund’sfinancial instruments within the fair value hierarchy.
June 30, 2015Level 1
($)Level 2
($)Level 3
($)Total($)
Underlying funds 2,595,229,897 – – 2,595,229,897
2,595,229,897 – – 2,595,229,897
The accompanying notes are an integral part of the financial statements.
309
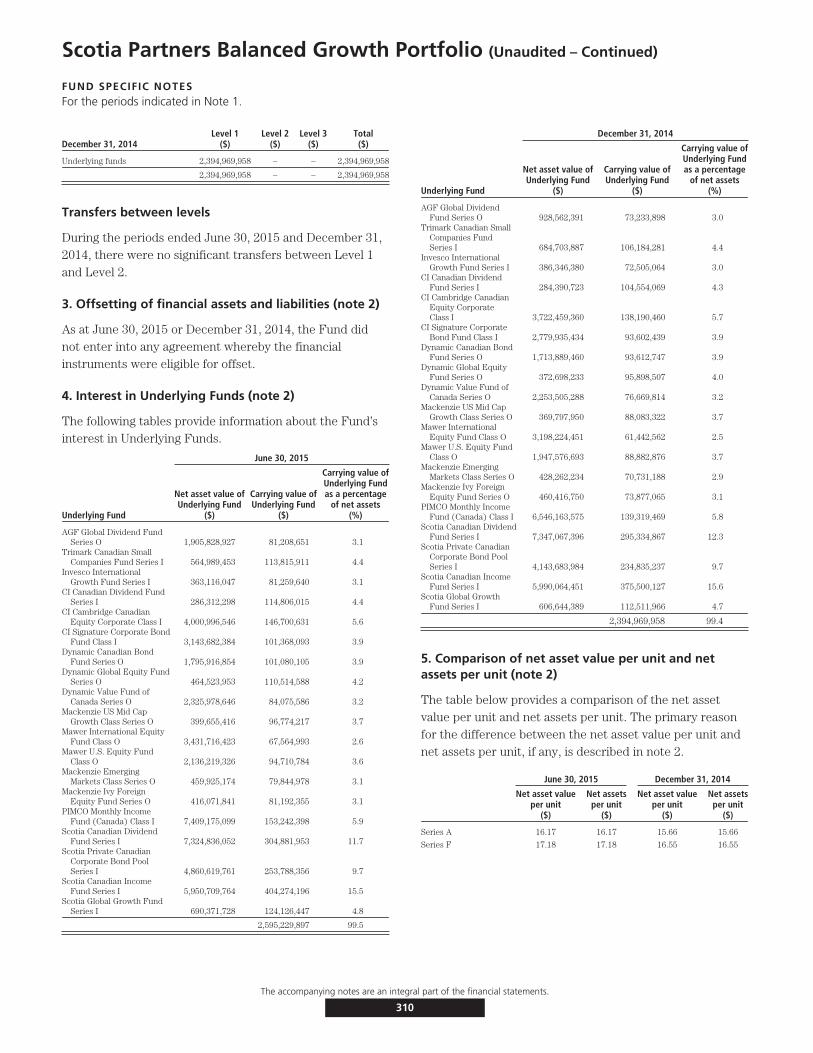
Scotia Partners Balanced Growth Portfolio (Unaudited – Continued)
FUND SPECIFIC NOTESFor the periods indicated in Note 1.
December 31, 2014Level 1
($)Level 2
($)Level 3
($)Total($)
Underlying funds 2,394,969,958 – – 2,394,969,958
2,394,969,958 – – 2,394,969,958
Transfers between levels
During the periods ended June 30, 2015 and December 31,2014, there were no significant transfers between Level 1and Level 2.
3. Offsetting of financial assets and liabilities (note 2)
As at June 30, 2015 or December 31, 2014, the Fund didnot enter into any agreement whereby the financialinstruments were eligible for offset.
4. Interest in Underlying Funds (note 2)
The following tables provide information about the Fund’sinterest in Underlying Funds.
June 30, 2015
Underlying Fund
Net asset value ofUnderlying Fund
($)
Carrying value ofUnderlying Fund
($)
Carrying value ofUnderlying Fundas a percentage
of net assets(%)
AGF Global Dividend FundSeries O 1,905,828,927 81,208,651 3.1
Trimark Canadian SmallCompanies Fund Series I 564,989,453 113,815,911 4.4
Invesco InternationalGrowth Fund Series I 363,116,047 81,259,640 3.1
CI Canadian Dividend FundSeries I 286,312,298 114,806,015 4.4
CI Cambridge CanadianEquity Corporate Class I 4,000,996,546 146,700,631 5.6
CI Signature Corporate BondFund Class I 3,143,682,384 101,368,093 3.9
Dynamic Canadian BondFund Series O 1,795,916,854 101,080,105 3.9
Dynamic Global Equity FundSeries O 464,523,953 110,514,588 4.2
Dynamic Value Fund ofCanada Series O 2,325,978,646 84,075,586 3.2
Mackenzie US Mid CapGrowth Class Series O 399,655,416 96,774,217 3.7
Mawer International EquityFund Class O 3,431,716,423 67,564,993 2.6
Mawer U.S. Equity FundClass O 2,136,219,326 94,710,784 3.6
Mackenzie EmergingMarkets Class Series O 459,925,174 79,844,978 3.1
Mackenzie Ivy ForeignEquity Fund Series O 416,071,841 81,192,355 3.1
PIMCO Monthly IncomeFund (Canada) Class I 7,409,175,099 153,242,398 5.9
Scotia Canadian DividendFund Series I 7,324,836,052 304,881,953 11.7
Scotia Private CanadianCorporate Bond PoolSeries I 4,860,619,761 253,788,356 9.7
Scotia Canadian IncomeFund Series I 5,950,709,764 404,274,196 15.5
Scotia Global Growth FundSeries I 690,371,728 124,126,447 4.8
2,595,229,897 99.5
December 31, 2014
Underlying Fund
Net asset value ofUnderlying Fund
($)
Carrying value ofUnderlying Fund
($)
Carrying value ofUnderlying Fundas a percentage
of net assets(%)
AGF Global DividendFund Series O 928,562,391 73,233,898 3.0
Trimark Canadian SmallCompanies FundSeries I 684,703,887 106,184,281 4.4
Invesco InternationalGrowth Fund Series I 386,346,380 72,505,064 3.0
CI Canadian DividendFund Series I 284,390,723 104,554,069 4.3
CI Cambridge CanadianEquity CorporateClass I 3,722,459,360 138,190,460 5.7
CI Signature CorporateBond Fund Class I 2,779,935,434 93,602,439 3.9
Dynamic Canadian BondFund Series O 1,713,889,460 93,612,747 3.9
Dynamic Global EquityFund Series O 372,698,233 95,898,507 4.0
Dynamic Value Fund ofCanada Series O 2,253,505,288 76,669,814 3.2
Mackenzie US Mid CapGrowth Class Series O 369,797,950 88,083,322 3.7
Mawer InternationalEquity Fund Class O 3,198,224,451 61,442,562 2.5
Mawer U.S. Equity FundClass O 1,947,576,693 88,882,876 3.7
Mackenzie EmergingMarkets Class Series O 428,262,234 70,731,188 2.9
Mackenzie Ivy ForeignEquity Fund Series O 460,416,750 73,877,065 3.1
PIMCO Monthly IncomeFund (Canada) Class I 6,546,163,575 139,319,469 5.8
Scotia Canadian DividendFund Series I 7,347,067,396 295,334,867 12.3
Scotia Private CanadianCorporate Bond PoolSeries I 4,143,683,984 234,835,237 9.7
Scotia Canadian IncomeFund Series I 5,990,064,451 375,500,127 15.6
Scotia Global GrowthFund Series I 606,644,389 112,511,966 4.7
2,394,969,958 99.4
5. Comparison of net asset value per unit and netassets per unit (note 2)
The table below provides a comparison of the net assetvalue per unit and net assets per unit. The primary reasonfor the difference between the net asset value per unit andnet assets per unit, if any, is described in note 2.
June 30, 2015 December 31, 2014
Net asset valueper unit
($)
Net assetsper unit
($)
Net asset valueper unit
($)
Net assetsper unit
($)
Series A 16.17 16.17 15.66 15.66
Series F 17.18 17.18 16.55 16.55
The accompanying notes are an integral part of the financial statements.
310
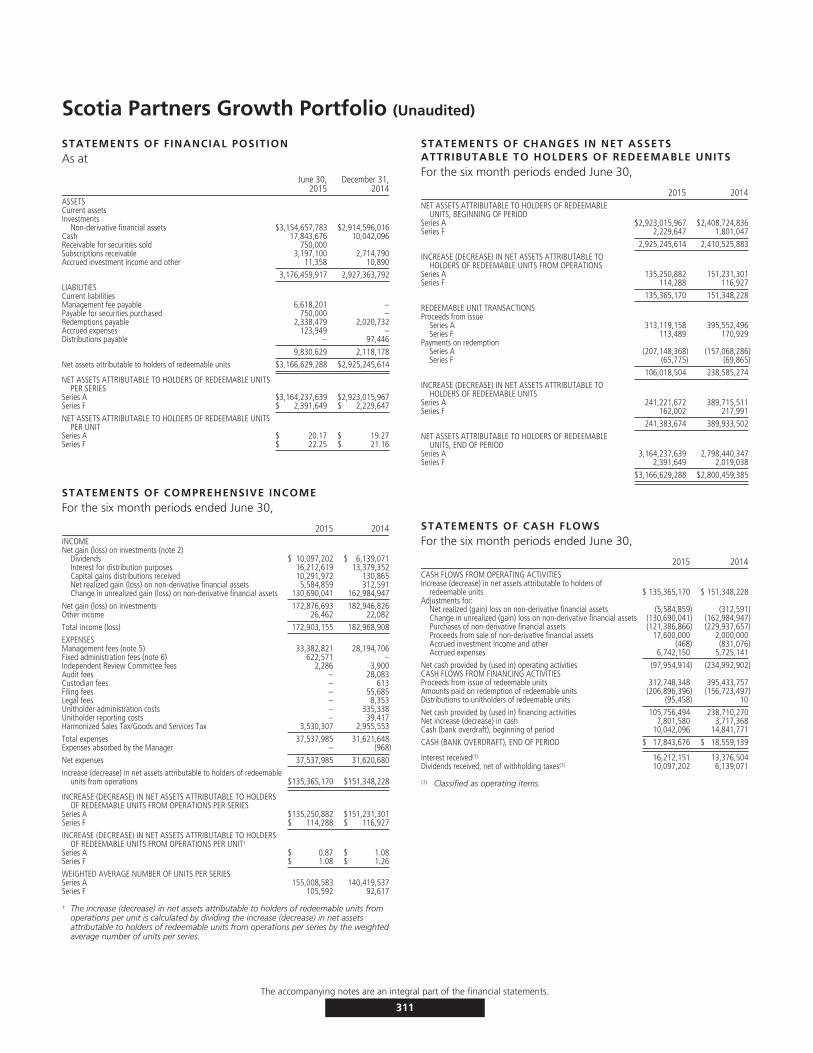
Scotia Partners Growth Portfolio (Unaudited)
STATEMENTS OF FINANCIAL POSITIONAs at
June 30,2015
December 31,2014
ASSETSCurrent assetsInvestments
Non-derivative financial assets $3,154,657,783 $2,914,596,016Cash 17,843,676 10,042,096Receivable for securities sold 750,000Subscriptions receivable 3,197,100 2,714,790Accrued investment income and other 11,358 10,890
3,176,459,917 2,927,363,792
LIABILITIESCurrent liabilitiesManagement fee payable 6,618,201 –Payable for securities purchased 750,000 –Redemptions payable 2,338,479 2,020,732Accrued expenses 123,949 –Distributions payable – 97,446
9,830,629 2,118,178
Net assets attributable to holders of redeemable units $3,166,629,288 $2,925,245,614
NET ASSETS ATTRIBUTABLE TO HOLDERS OF REDEEMABLE UNITSPER SERIES
Series A $3,164,237,639 $2,923,015,967Series F $ 2,391,649 $ 2,229,647
NET ASSETS ATTRIBUTABLE TO HOLDERS OF REDEEMABLE UNITSPER UNIT
Series A $ 20.17 $ 19.27Series F $ 22.25 $ 21.16
STATEMENTS OF COMPREHENSIVE INCOMEFor the six month periods ended June 30,
2015 2014INCOMENet gain (loss) on investments (note 2)
Dividends $ 10,097,202 $ 6,139,071Interest for distribution purposes 16,212,619 13,379,352Capital gains distributions received 10,291,972 130,865Net realized gain (loss) on non-derivative financial assets 5,584,859 312,591Change in unrealized gain (loss) on non-derivative financial assets 130,690,041 162,984,947
Net gain (loss) on investments 172,876,693 182,946,826Other income 26,462 22,082
Total income (loss) 172,903,155 182,968,908
EXPENSESManagement fees (note 5) 33,382,821 28,194,706Fixed administration fees (note 6) 622,571 –Independent Review Committee fees 2,286 3,900Audit fees – 28,083Custodian fees – 613Filing fees – 55,685Legal fees – 8,353Unitholder administration costs – 335,338Unitholder reporting costs – 39,417Harmonized Sales Tax/Goods and Services Tax 3,530,307 2,955,553
Total expenses 37,537,985 31,621,648Expenses absorbed by the Manager – (968)
Net expenses 37,537,985 31,620,680
Increase (decrease) in net assets attributable to holders of redeemableunits from operations $135,365,170 $151,348,228
INCREASE (DECREASE) IN NET ASSETS ATTRIBUTABLE TO HOLDERSOF REDEEMABLE UNITS FROM OPERATIONS PER SERIES
Series A $135,250,882 $151,231,301Series F $ 114,288 $ 116,927
INCREASE (DECREASE) IN NET ASSETS ATTRIBUTABLE TO HOLDERSOF REDEEMABLE UNITS FROM OPERATIONS PER UNIT†
Series A $ 0.87 $ 1.08Series F $ 1.08 $ 1.26
WEIGHTED AVERAGE NUMBER OF UNITS PER SERIESSeries A 155,008,583 140,419,537Series F 105,592 92,617
† The increase (decrease) in net assets attributable to holders of redeemable units fromoperations per unit is calculated by dividing the increase (decrease) in net assetsattributable to holders of redeemable units from operations per series by the weightedaverage number of units per series.
STATEMENTS OF CHANGES IN NET ASSETSATTRIBUTABLE TO HOLDERS OF REDEEMABLE UNITSFor the six month periods ended June 30,
2015 2014NET ASSETS ATTRIBUTABLE TO HOLDERS OF REDEEMABLE
UNITS, BEGINNING OF PERIODSeries A $2,923,015,967 $2,408,724,836Series F 2,229,647 1,801,047
2,925,245,614 2,410,525,883
INCREASE (DECREASE) IN NET ASSETS ATTRIBUTABLE TOHOLDERS OF REDEEMABLE UNITS FROM OPERATIONS
Series A 135,250,882 151,231,301Series F 114,288 116,927
135,365,170 151,348,228
REDEEMABLE UNIT TRANSACTIONSProceeds from issue
Series A 313,119,158 395,552,496Series F 113,489 170,929
Payments on redemptionSeries A (207,148,368) (157,068,286)Series F (65,775) (69,865)
106,018,504 238,585,274
INCREASE (DECREASE) IN NET ASSETS ATTRIBUTABLE TOHOLDERS OF REDEEMABLE UNITS
Series A 241,221,672 389,715,511Series F 162,002 217,991
241,383,674 389,933,502
NET ASSETS ATTRIBUTABLE TO HOLDERS OF REDEEMABLEUNITS, END OF PERIOD
Series A 3,164,237,639 2,798,440,347Series F 2,391,649 2,019,038
$3,166,629,288 $2,800,459,385
STATEMENTS OF CASH FLOWSFor the six month periods ended June 30,
2015 2014CASH FLOWS FROM OPERATING ACTIVITIESIncrease (decrease) in net assets attributable to holders of
redeemable units $ 135,365,170 $ 151,348,228Adjustments for:
Net realized (gain) loss on non-derivative financial assets (5,584,859) (312,591)Change in unrealized (gain) loss on non-derivative financial assets (130,690,041) (162,984,947)Purchases of non-derivative financial assets (121,386,866) (229,937,657)Proceeds from sale of non-derivative financial assets 17,600,000 2,000,000Accrued investment income and other (468) (831,076)Accrued expenses 6,742,150 5,725,141
Net cash provided by (used in) operating activities (97,954,914) (234,992,902)CASH FLOWS FROM FINANCING ACTIVITIESProceeds from issue of redeemable units 312,748,348 395,433,757Amounts paid on redemption of redeemable units (206,896,396) (156,723,497)Distributions to unitholders of redeemable units (95,458) 10
Net cash provided by (used in) financing activities 105,756,494 238,710,270Net increase (decrease) in cash 7,801,580 3,717,368Cash (bank overdraft), beginning of period 10,042,096 14,841,771
CASH (BANK OVERDRAFT), END OF PERIOD $ 17,843,676 $ 18,559,139
Interest received(1) 16,212,151 13,376,504Dividends received, net of withholding taxes(1) 10,097,202 6,139,071
(1) Classified as operating items.
The accompanying notes are an integral part of the financial statements.
311
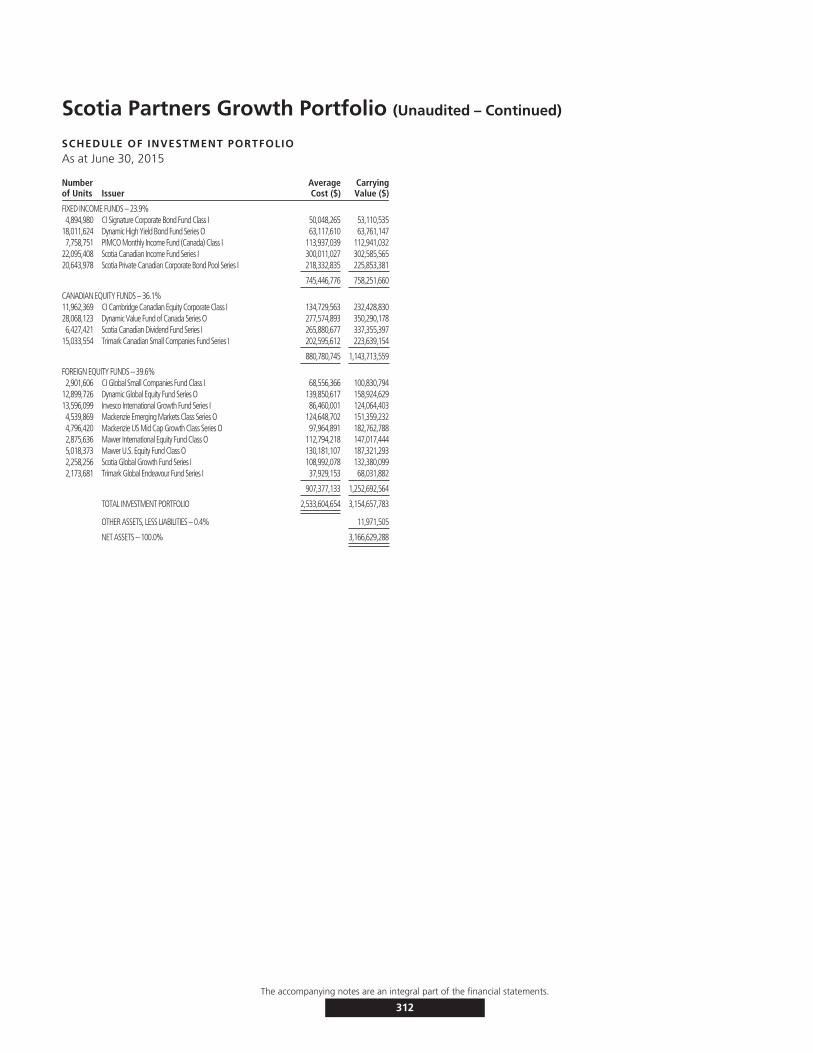
Scotia Partners Growth Portfolio (Unaudited – Continued)
SCHEDULE OF INVESTMENT PORTFOLIOAs at June 30, 2015
Numberof Units Issuer
AverageCost ($)
CarryingValue ($)
FIXED INCOME FUNDS – 23.9%4,894,980 CI Signature Corporate Bond Fund Class I 50,048,265 53,110,535
18,011,624 Dynamic High Yield Bond Fund Series O 63,117,610 63,761,1477,758,751 PIMCO Monthly Income Fund (Canada) Class I 113,937,039 112,941,032
22,095,408 Scotia Canadian Income Fund Series I 300,011,027 302,585,56520,643,978 Scotia Private Canadian Corporate Bond Pool Series I 218,332,835 225,853,381
745,446,776 758,251,660
CANADIAN EQUITY FUNDS – 36.1%11,962,369 CI Cambridge Canadian Equity Corporate Class I 134,729,563 232,428,83028,068,123 Dynamic Value Fund of Canada Series O 277,574,893 350,290,1786,427,421 Scotia Canadian Dividend Fund Series I 265,880,677 337,355,397
15,033,554 Trimark Canadian Small Companies Fund Series I 202,595,612 223,639,154
880,780,745 1,143,713,559
FOREIGN EQUITY FUNDS – 39.6%2,901,606 CI Global Small Companies Fund Class I 68,556,366 100,830,794
12,899,726 Dynamic Global Equity Fund Series O 139,850,617 158,924,62913,596,099 Invesco International Growth Fund Series I 86,460,001 124,064,4034,539,869 Mackenzie Emerging Markets Class Series O 124,648,702 151,359,2324,796,420 Mackenzie US Mid Cap Growth Class Series O 97,964,891 182,762,7882,875,636 Mawer International Equity Fund Class O 112,794,218 147,017,4445,018,373 Mawer U.S. Equity Fund Class O 130,181,107 187,321,2932,258,256 Scotia Global Growth Fund Series I 108,992,078 132,380,0992,173,681 Trimark Global Endeavour Fund Series I 37,929,153 68,031,882
907,377,133 1,252,692,564
TOTAL INVESTMENT PORTFOLIO 2,533,604,654 3,154,657,783
OTHER ASSETS, LESS LIABILITIES – 0.4% 11,971,505
NET ASSETS – 100.0% 3,166,629,288
The accompanying notes are an integral part of the financial statements.
312
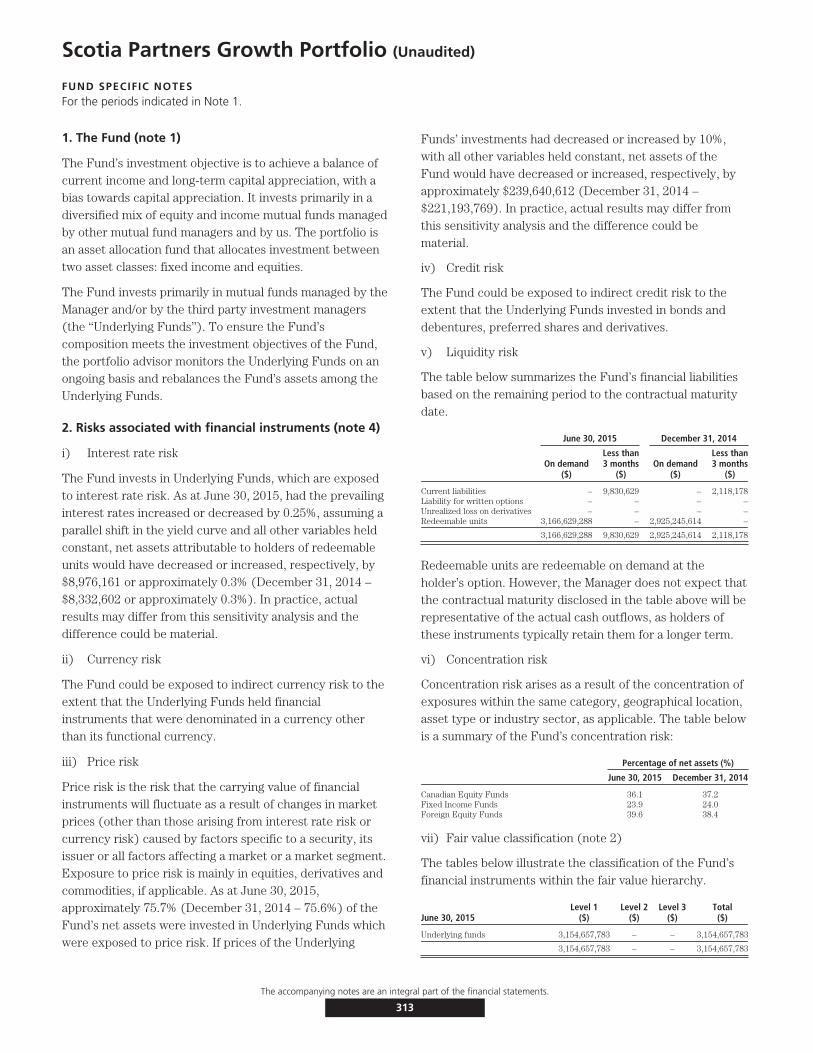
Scotia Partners Growth Portfolio (Unaudited)
FUND SPECIFIC NOTESFor the periods indicated in Note 1.
1. The Fund (note 1)
The Fund’s investment objective is to achieve a balance ofcurrent income and long-term capital appreciation, with abias towards capital appreciation. It invests primarily in adiversified mix of equity and income mutual funds managedby other mutual fund managers and by us. The portfolio isan asset allocation fund that allocates investment betweentwo asset classes: fixed income and equities.
The Fund invests primarily in mutual funds managed by theManager and/or by the third party investment managers(the ‘‘Underlying Funds’’). To ensure the Fund’scomposition meets the investment objectives of the Fund,the portfolio advisor monitors the Underlying Funds on anongoing basis and rebalances the Fund’s assets among theUnderlying Funds.
2. Risks associated with financial instruments (note 4)
i) Interest rate risk
The Fund invests in Underlying Funds, which are exposedto interest rate risk. As at June 30, 2015, had the prevailinginterest rates increased or decreased by 0.25%, assuming aparallel shift in the yield curve and all other variables heldconstant, net assets attributable to holders of redeemableunits would have decreased or increased, respectively, by$8,976,161 or approximately 0.3% (December 31, 2014 –$8,332,602 or approximately 0.3%). In practice, actualresults may differ from this sensitivity analysis and thedifference could be material.
ii) Currency risk
The Fund could be exposed to indirect currency risk to theextent that the Underlying Funds held financialinstruments that were denominated in a currency otherthan its functional currency.
iii) Price risk
Price risk is the risk that the carrying value of financialinstruments will fluctuate as a result of changes in marketprices (other than those arising from interest rate risk orcurrency risk) caused by factors specific to a security, itsissuer or all factors affecting a market or a market segment.Exposure to price risk is mainly in equities, derivatives andcommodities, if applicable. As at June 30, 2015,approximately 75.7% (December 31, 2014 – 75.6%) of theFund’s net assets were invested in Underlying Funds whichwere exposed to price risk. If prices of the Underlying
Funds’ investments had decreased or increased by 10%,with all other variables held constant, net assets of theFund would have decreased or increased, respectively, byapproximately $239,640,612 (December 31, 2014 –$221,193,769). In practice, actual results may differ fromthis sensitivity analysis and the difference could bematerial.
iv) Credit risk
The Fund could be exposed to indirect credit risk to theextent that the Underlying Funds invested in bonds anddebentures, preferred shares and derivatives.
v) Liquidity risk
The table below summarizes the Fund’s financial liabilitiesbased on the remaining period to the contractual maturitydate.
June 30, 2015 December 31, 2014
On demand($)
Less than3 months
($)On demand
($)
Less than3 months
($)
Current liabilities – 9,830,629 – 2,118,178Liability for written options – – – –Unrealized loss on derivatives – – – –Redeemable units 3,166,629,288 – 2,925,245,614 –
3,166,629,288 9,830,629 2,925,245,614 2,118,178
Redeemable units are redeemable on demand at theholder’s option. However, the Manager does not expect thatthe contractual maturity disclosed in the table above will berepresentative of the actual cash outflows, as holders ofthese instruments typically retain them for a longer term.
vi) Concentration risk
Concentration risk arises as a result of the concentration ofexposures within the same category, geographical location,asset type or industry sector, as applicable. The table belowis a summary of the Fund’s concentration risk:
Percentage of net assets (%)
June 30, 2015 December 31, 2014
Canadian Equity Funds 36.1 37.2Fixed Income Funds 23.9 24.0Foreign Equity Funds 39.6 38.4
vii) Fair value classification (note 2)
The tables below illustrate the classification of the Fund’sfinancial instruments within the fair value hierarchy.
June 30, 2015Level 1
($)Level 2
($)Level 3
($)Total($)
Underlying funds 3,154,657,783 – – 3,154,657,783
3,154,657,783 – – 3,154,657,783
The accompanying notes are an integral part of the financial statements.
313

Scotia Partners Growth Portfolio (Unaudited – Continued)
FUND SPECIFIC NOTESFor the periods indicated in Note 1.
December 31, 2014Level 1
($)Level 2
($)Level 3
($)Total($)
Underlying funds 2,914,596,016 – – 2,914,596,016
2,914,596,016 – – 2,914,596,016
Transfers between levels
During the periods ended June 30, 2015 and December 31,2014, there were no significant transfers between Level 1and Level 2.
3. Offsetting of financial assets and liabilities (note 2)
As at June 30, 2015 or December 31, 2014, the Fund didnot enter into any agreement whereby the financialinstruments were eligible for offset.
4. Interest in Underlying Funds (note 2)
The following tables provide information about the Fund’sinterest in Underlying Funds.
June 30, 2015
Underlying Fund
Net asset value ofUnderlying Fund
($)
Carrying value ofUnderlying Fund
($)
Carrying value ofUnderlying Fundas a percentage
of net assets(%)
Trimark Canadian SmallCompanies Fund Series I 564,989,453 223,639,154 7.1
Trimark Global EndeavourFund Series I 1,119,560,674 68,031,882 2.1
Invesco InternationalGrowth Fund Series I 363,116,047 124,064,403 3.9
CI Cambridge CanadianEquity Corporate Class I 4,000,996,546 232,428,830 7.3
CI Global Small CompaniesFund Class I 262,393,192 100,830,794 3.2
CI Signature Corporate BondFund Class I 3,143,682,384 53,110,535 1.7
Dynamic High Yield BondFund Series O 833,989,452 63,761,147 2.0
Dynamic Global Equity FundSeries O 464,523,953 158,924,629 5.0
Dynamic Value Fund ofCanada Series O 2,325,978,646 350,290,178 11.0
Mackenzie US Mid CapGrowth Class Series O 399,655,416 182,762,788 5.8
Mawer International EquityFund Class O 3,431,716,423 147,017,444 4.6
Mawer U.S. Equity FundClass O 2,136,219,326 187,321,293 5.9
Mackenzie EmergingMarkets Class Series O 459,925,174 151,359,232 4.8
PIMCO Monthly IncomeFund (Canada) Class I 7,409,175,099 112,941,032 3.6
Scotia Canadian DividendFund Series I 7,324,836,052 337,355,397 10.7
Scotia Private CanadianCorporate Bond PoolSeries I 4,860,619,761 225,853,381 7.1
Scotia Canadian IncomeFund Series I 5,950,709,764 302,585,565 9.6
Scotia Global Growth FundSeries I 690,371,728 132,380,099 4.2
3,154,657,783 99.6
December 31, 2014
Underlying Fund
Net asset value ofUnderlying Fund
($)
Carrying value ofUnderlying Fund
($)
Carrying value ofUnderlying Fundas a percentage
of net assets(%)
Trimark Canadian SmallCompanies Fund Series I 684,703,887 216,225,454 7.4
Trimark Global EndeavourFund Series I 1,027,076,368 59,042,376 2.0
Invesco InternationalGrowth Fund Series I 386,346,380 109,312,670 3.7
CI Cambridge CanadianEquity Corporate Class I 3,722,459,360 221,821,670 7.6
CI Global Small CompaniesFund Class I 201,801,083 90,106,542 3.1
CI Signature Corporate BondFund Class I 2,779,935,434 49,164,541 1.7
Dynamic High Yield BondFund Series O 849,677,494 55,404,558 1.9
Dynamic Global Equity FundSeries O 372,698,233 136,915,298 4.7
Dynamic Value Fund ofCanada Series O 2,253,505,288 323,344,780 11.1
Mackenzie US Mid CapGrowth Class Series O 369,797,950 167,982,604 5.7
Mawer International EquityFund Class O 3,198,224,451 132,895,190 4.5
Mawer U.S. Equity FundClass O 1,947,576,693 178,108,651 6.1
Mackenzie EmergingMarkets Class Series O 428,262,234 133,043,410 4.5
PIMCO Monthly IncomeFund (Canada) Class I 6,546,163,575 104,114,012 3.6
Scotia Canadian DividendFund Series I 7,347,067,396 328,102,999 11.2
Scotia Private CanadianCorporate Bond PoolSeries I 4,143,683,984 211,058,425 7.2
Scotia Canadian IncomeFund Series I 5,990,064,451 282,916,788 9.7
Scotia Global Growth FundSeries I 606,644,389 115,036,048 3.9
2,914,596,016 99.6
5. Comparison of net asset value per unit and netassets per unit (note 2)
The table below provides a comparison of the net assetvalue per unit and net assets per unit. The primary reasonfor the difference between the net asset value per unit andnet assets per unit, if any, is described in note 2.
June 30, 2015 December 31, 2014
Net asset valueper unit
($)
Net assetsper unit
($)
Net asset valueper unit
($)
Net assetsper unit
($)
Series A 20.17 20.17 19.27 19.27
Series F 22.25 22.25 21.16 21.16
The accompanying notes are an integral part of the financial statements.
314
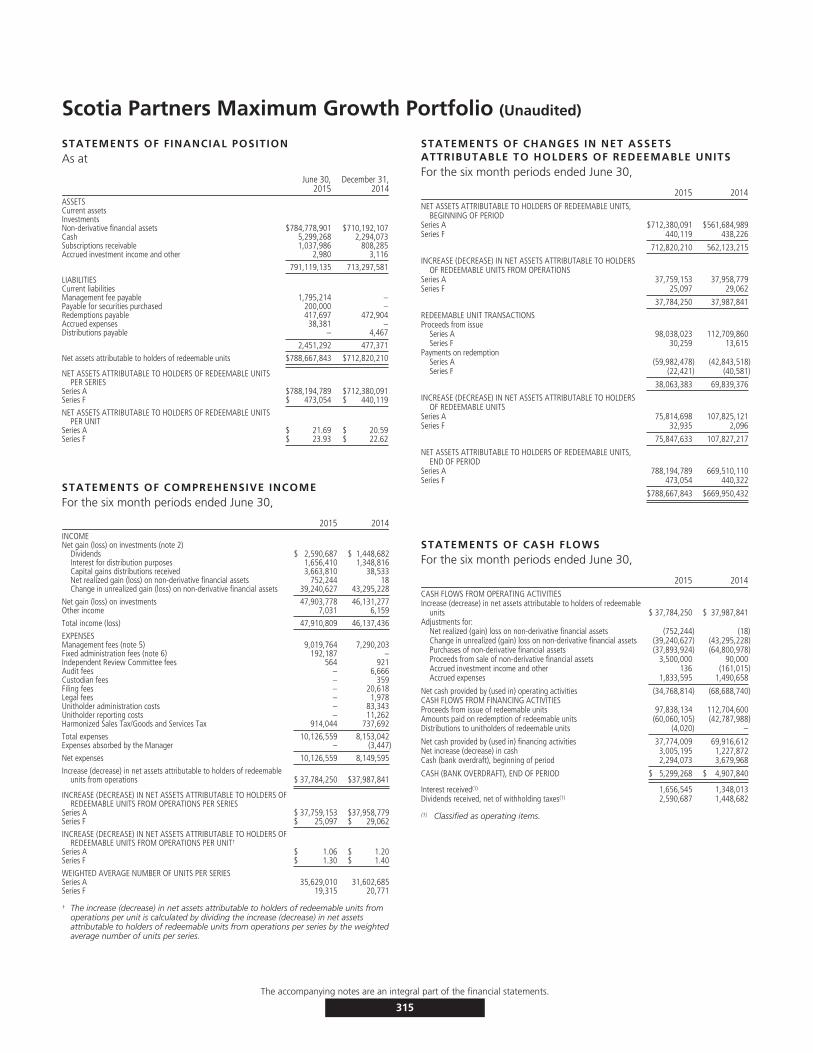
Scotia Partners Maximum Growth Portfolio (Unaudited)
STATEMENTS OF FINANCIAL POSITIONAs at
June 30,2015
December 31,2014
ASSETSCurrent assetsInvestmentsNon-derivative financial assets $784,778,901 $710,192,107Cash 5,299,268 2,294,073Subscriptions receivable 1,037,986 808,285Accrued investment income and other 2,980 3,116
791,119,135 713,297,581
LIABILITIESCurrent liabilitiesManagement fee payable 1,795,214 –Payable for securities purchased 200,000 –Redemptions payable 417,697 472,904Accrued expenses 38,381 –Distributions payable – 4,467
2,451,292 477,371
Net assets attributable to holders of redeemable units $788,667,843 $712,820,210
NET ASSETS ATTRIBUTABLE TO HOLDERS OF REDEEMABLE UNITSPER SERIES
Series A $788,194,789 $712,380,091Series F $ 473,054 $ 440,119
NET ASSETS ATTRIBUTABLE TO HOLDERS OF REDEEMABLE UNITSPER UNIT
Series A $ 21.69 $ 20.59Series F $ 23.93 $ 22.62
STATEMENTS OF COMPREHENSIVE INCOMEFor the six month periods ended June 30,
2015 2014INCOMENet gain (loss) on investments (note 2)
Dividends $ 2,590,687 $ 1,448,682Interest for distribution purposes 1,656,410 1,348,816Capital gains distributions received 3,663,810 38,533Net realized gain (loss) on non-derivative financial assets 752,244 18Change in unrealized gain (loss) on non-derivative financial assets 39,240,627 43,295,228
Net gain (loss) on investments 47,903,778 46,131,277Other income 7,031 6,159
Total income (loss) 47,910,809 46,137,436
EXPENSESManagement fees (note 5) 9,019,764 7,290,203Fixed administration fees (note 6) 192,187 –Independent Review Committee fees 564 921Audit fees – 6,666Custodian fees – 359Filing fees – 20,618Legal fees – 1,978Unitholder administration costs – 83,343Unitholder reporting costs – 11,262Harmonized Sales Tax/Goods and Services Tax 914,044 737,692
Total expenses 10,126,559 8,153,042Expenses absorbed by the Manager – (3,447)
Net expenses 10,126,559 8,149,595
Increase (decrease) in net assets attributable to holders of redeemableunits from operations $ 37,784,250 $37,987,841
INCREASE (DECREASE) IN NET ASSETS ATTRIBUTABLE TO HOLDERS OFREDEEMABLE UNITS FROM OPERATIONS PER SERIES
Series A $ 37,759,153 $37,958,779Series F $ 25,097 $ 29,062
INCREASE (DECREASE) IN NET ASSETS ATTRIBUTABLE TO HOLDERS OFREDEEMABLE UNITS FROM OPERATIONS PER UNIT†
Series A $ 1.06 $ 1.20Series F $ 1.30 $ 1.40
WEIGHTED AVERAGE NUMBER OF UNITS PER SERIESSeries A 35,629,010 31,602,685Series F 19,315 20,771
† The increase (decrease) in net assets attributable to holders of redeemable units fromoperations per unit is calculated by dividing the increase (decrease) in net assetsattributable to holders of redeemable units from operations per series by the weightedaverage number of units per series.
STATEMENTS OF CHANGES IN NET ASSETSATTRIBUTABLE TO HOLDERS OF REDEEMABLE UNITSFor the six month periods ended June 30,
2015 2014NET ASSETS ATTRIBUTABLE TO HOLDERS OF REDEEMABLE UNITS,
BEGINNING OF PERIODSeries A $712,380,091 $561,684,989Series F 440,119 438,226
712,820,210 562,123,215
INCREASE (DECREASE) IN NET ASSETS ATTRIBUTABLE TO HOLDERSOF REDEEMABLE UNITS FROM OPERATIONS
Series A 37,759,153 37,958,779Series F 25,097 29,062
37,784,250 37,987,841
REDEEMABLE UNIT TRANSACTIONSProceeds from issue
Series A 98,038,023 112,709,860Series F 30,259 13,615
Payments on redemptionSeries A (59,982,478) (42,843,518)Series F (22,421) (40,581)
38,063,383 69,839,376
INCREASE (DECREASE) IN NET ASSETS ATTRIBUTABLE TO HOLDERSOF REDEEMABLE UNITS
Series A 75,814,698 107,825,121Series F 32,935 2,096
75,847,633 107,827,217
NET ASSETS ATTRIBUTABLE TO HOLDERS OF REDEEMABLE UNITS,END OF PERIOD
Series A 788,194,789 669,510,110Series F 473,054 440,322
$788,667,843 $669,950,432
STATEMENTS OF CASH FLOWSFor the six month periods ended June 30,
2015 2014CASH FLOWS FROM OPERATING ACTIVITIESIncrease (decrease) in net assets attributable to holders of redeemable
units $ 37,784,250 $ 37,987,841Adjustments for:
Net realized (gain) loss on non-derivative financial assets (752,244) (18)Change in unrealized (gain) loss on non-derivative financial assets (39,240,627) (43,295,228)Purchases of non-derivative financial assets (37,893,924) (64,800,978)Proceeds from sale of non-derivative financial assets 3,500,000 90,000Accrued investment income and other 136 (161,015)Accrued expenses 1,833,595 1,490,658
Net cash provided by (used in) operating activities (34,768,814) (68,688,740)CASH FLOWS FROM FINANCING ACTIVITIESProceeds from issue of redeemable units 97,838,134 112,704,600Amounts paid on redemption of redeemable units (60,060,105) (42,787,988)Distributions to unitholders of redeemable units (4,020) –
Net cash provided by (used in) financing activities 37,774,009 69,916,612Net increase (decrease) in cash 3,005,195 1,227,872Cash (bank overdraft), beginning of period 2,294,073 3,679,968
CASH (BANK OVERDRAFT), END OF PERIOD $ 5,299,268 $ 4,907,840
Interest received(1) 1,656,545 1,348,013Dividends received, net of withholding taxes(1) 2,590,687 1,448,682
(1) Classified as operating items.
The accompanying notes are an integral part of the financial statements.
315
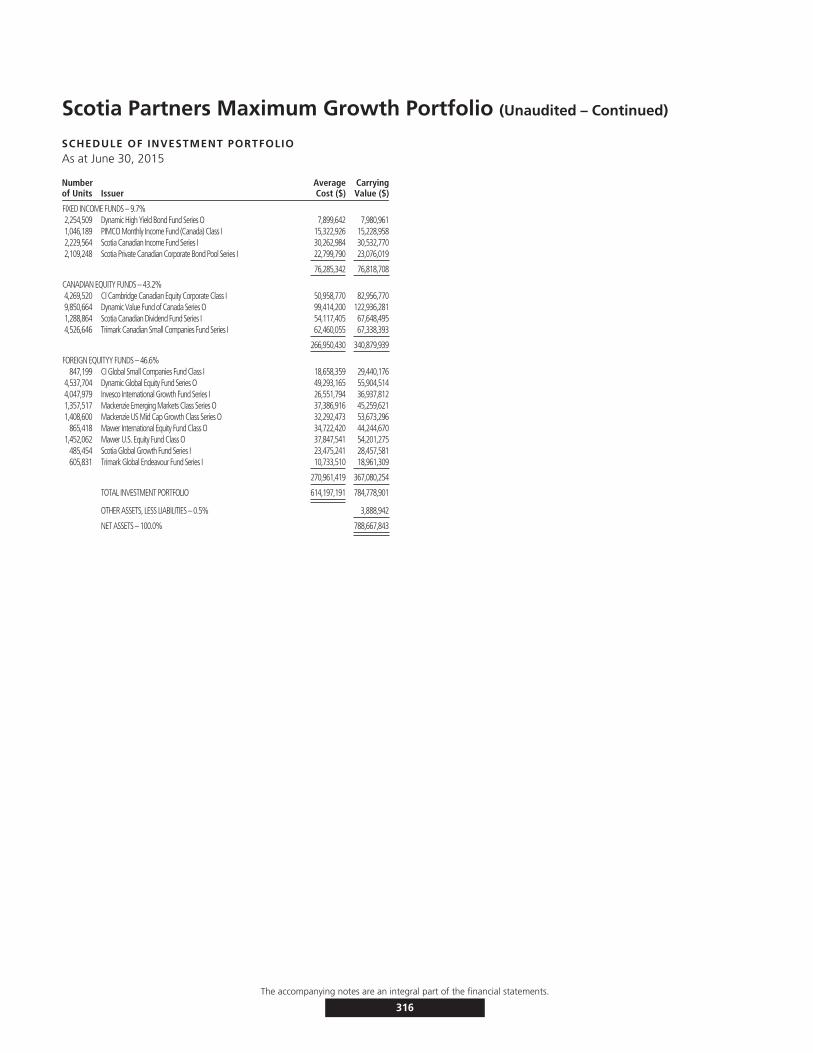
Scotia Partners Maximum Growth Portfolio (Unaudited – Continued)
SCHEDULE OF INVESTMENT PORTFOLIOAs at June 30, 2015
Numberof Units Issuer
AverageCost ($)
CarryingValue ($)
FIXED INCOME FUNDS – 9.7%2,254,509 Dynamic High Yield Bond Fund Series O 7,899,642 7,980,9611,046,189 PIMCO Monthly Income Fund (Canada) Class I 15,322,926 15,228,9582,229,564 Scotia Canadian Income Fund Series I 30,262,984 30,532,7702,109,248 Scotia Private Canadian Corporate Bond Pool Series I 22,799,790 23,076,019
76,285,342 76,818,708
CANADIAN EQUITY FUNDS – 43.2%4,269,520 CI Cambridge Canadian Equity Corporate Class I 50,958,770 82,956,7709,850,664 Dynamic Value Fund of Canada Series O 99,414,200 122,936,2811,288,864 Scotia Canadian Dividend Fund Series I 54,117,405 67,648,4954,526,646 Trimark Canadian Small Companies Fund Series I 62,460,055 67,338,393
266,950,430 340,879,939
FOREIGN EQUITYY FUNDS – 46.6%847,199 CI Global Small Companies Fund Class I 18,658,359 29,440,176
4,537,704 Dynamic Global Equity Fund Series O 49,293,165 55,904,5144,047,979 Invesco International Growth Fund Series I 26,551,794 36,937,8121,357,517 Mackenzie Emerging Markets Class Series O 37,386,916 45,259,6211,408,600 Mackenzie US Mid Cap Growth Class Series O 32,292,473 53,673,296
865,418 Mawer International Equity Fund Class O 34,722,420 44,244,6701,452,062 Mawer U.S. Equity Fund Class O 37,847,541 54,201,275
485,454 Scotia Global Growth Fund Series I 23,475,241 28,457,581605,831 Trimark Global Endeavour Fund Series I 10,733,510 18,961,309
270,961,419 367,080,254
TOTAL INVESTMENT PORTFOLIO 614,197,191 784,778,901
OTHER ASSETS, LESS LIABILITIES – 0.5% 3,888,942
NET ASSETS – 100.0% 788,667,843
The accompanying notes are an integral part of the financial statements.
316
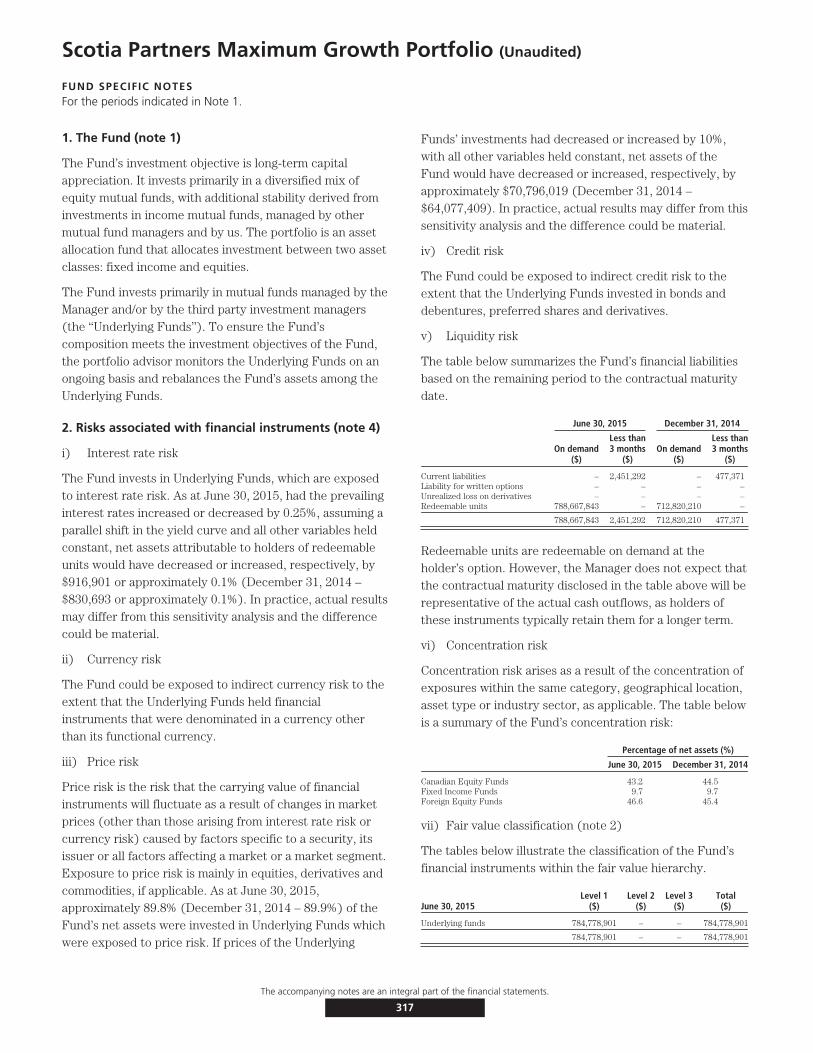
Scotia Partners Maximum Growth Portfolio (Unaudited)
FUND SPECIFIC NOTESFor the periods indicated in Note 1.
1. The Fund (note 1)
The Fund’s investment objective is long-term capitalappreciation. It invests primarily in a diversified mix ofequity mutual funds, with additional stability derived frominvestments in income mutual funds, managed by othermutual fund managers and by us. The portfolio is an assetallocation fund that allocates investment between two assetclasses: fixed income and equities.
The Fund invests primarily in mutual funds managed by theManager and/or by the third party investment managers(the ‘‘Underlying Funds’’). To ensure the Fund’scomposition meets the investment objectives of the Fund,the portfolio advisor monitors the Underlying Funds on anongoing basis and rebalances the Fund’s assets among theUnderlying Funds.
2. Risks associated with financial instruments (note 4)
i) Interest rate risk
The Fund invests in Underlying Funds, which are exposedto interest rate risk. As at June 30, 2015, had the prevailinginterest rates increased or decreased by 0.25%, assuming aparallel shift in the yield curve and all other variables heldconstant, net assets attributable to holders of redeemableunits would have decreased or increased, respectively, by$916,901 or approximately 0.1% (December 31, 2014 –$830,693 or approximately 0.1%). In practice, actual resultsmay differ from this sensitivity analysis and the differencecould be material.
ii) Currency risk
The Fund could be exposed to indirect currency risk to theextent that the Underlying Funds held financialinstruments that were denominated in a currency otherthan its functional currency.
iii) Price risk
Price risk is the risk that the carrying value of financialinstruments will fluctuate as a result of changes in marketprices (other than those arising from interest rate risk orcurrency risk) caused by factors specific to a security, itsissuer or all factors affecting a market or a market segment.Exposure to price risk is mainly in equities, derivatives andcommodities, if applicable. As at June 30, 2015,approximately 89.8% (December 31, 2014 – 89.9%) of theFund’s net assets were invested in Underlying Funds whichwere exposed to price risk. If prices of the Underlying
Funds’ investments had decreased or increased by 10%,with all other variables held constant, net assets of theFund would have decreased or increased, respectively, byapproximately $70,796,019 (December 31, 2014 –$64,077,409). In practice, actual results may differ from thissensitivity analysis and the difference could be material.
iv) Credit risk
The Fund could be exposed to indirect credit risk to theextent that the Underlying Funds invested in bonds anddebentures, preferred shares and derivatives.
v) Liquidity risk
The table below summarizes the Fund’s financial liabilitiesbased on the remaining period to the contractual maturitydate.
June 30, 2015 December 31, 2014
On demand($)
Less than3 months
($)On demand
($)
Less than3 months
($)
Current liabilities – 2,451,292 – 477,371Liability for written options – – – –Unrealized loss on derivatives – – – –Redeemable units 788,667,843 – 712,820,210 –
788,667,843 2,451,292 712,820,210 477,371
Redeemable units are redeemable on demand at theholder’s option. However, the Manager does not expect thatthe contractual maturity disclosed in the table above will berepresentative of the actual cash outflows, as holders ofthese instruments typically retain them for a longer term.
vi) Concentration risk
Concentration risk arises as a result of the concentration ofexposures within the same category, geographical location,asset type or industry sector, as applicable. The table belowis a summary of the Fund’s concentration risk:
Percentage of net assets (%)
June 30, 2015 December 31, 2014
Canadian Equity Funds 43.2 44.5Fixed Income Funds 9.7 9.7Foreign Equity Funds 46.6 45.4
vii) Fair value classification (note 2)
The tables below illustrate the classification of the Fund’sfinancial instruments within the fair value hierarchy.
June 30, 2015Level 1
($)Level 2
($)Level 3
($)Total($)
Underlying funds 784,778,901 – – 784,778,901
784,778,901 – – 784,778,901
The accompanying notes are an integral part of the financial statements.
317
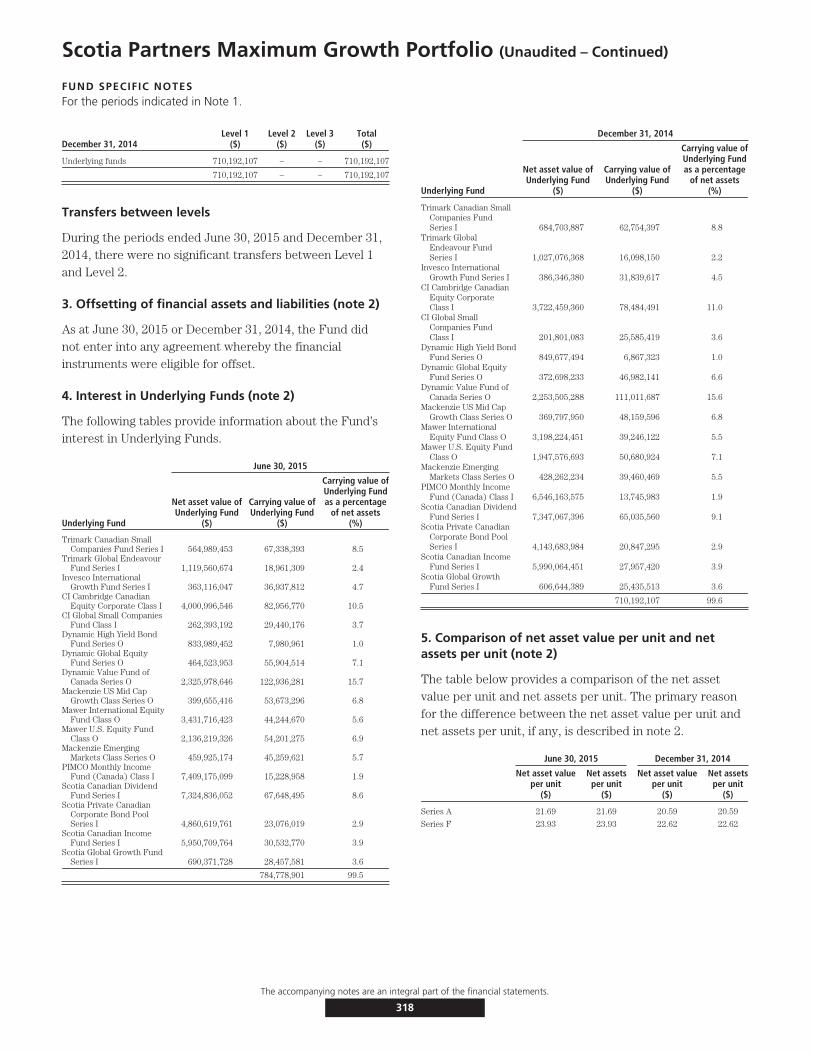
Scotia Partners Maximum Growth Portfolio (Unaudited – Continued)
FUND SPECIFIC NOTESFor the periods indicated in Note 1.
December 31, 2014Level 1
($)Level 2
($)Level 3
($)Total($)
Underlying funds 710,192,107 – – 710,192,107
710,192,107 – – 710,192,107
Transfers between levels
During the periods ended June 30, 2015 and December 31,2014, there were no significant transfers between Level 1and Level 2.
3. Offsetting of financial assets and liabilities (note 2)
As at June 30, 2015 or December 31, 2014, the Fund didnot enter into any agreement whereby the financialinstruments were eligible for offset.
4. Interest in Underlying Funds (note 2)
The following tables provide information about the Fund’sinterest in Underlying Funds.
June 30, 2015
Underlying Fund
Net asset value ofUnderlying Fund
($)
Carrying value ofUnderlying Fund
($)
Carrying value ofUnderlying Fundas a percentage
of net assets(%)
Trimark Canadian SmallCompanies Fund Series I 564,989,453 67,338,393 8.5
Trimark Global EndeavourFund Series I 1,119,560,674 18,961,309 2.4
Invesco InternationalGrowth Fund Series I 363,116,047 36,937,812 4.7
CI Cambridge CanadianEquity Corporate Class I 4,000,996,546 82,956,770 10.5
CI Global Small CompaniesFund Class I 262,393,192 29,440,176 3.7
Dynamic High Yield BondFund Series O 833,989,452 7,980,961 1.0
Dynamic Global EquityFund Series O 464,523,953 55,904,514 7.1
Dynamic Value Fund ofCanada Series O 2,325,978,646 122,936,281 15.7
Mackenzie US Mid CapGrowth Class Series O 399,655,416 53,673,296 6.8
Mawer International EquityFund Class O 3,431,716,423 44,244,670 5.6
Mawer U.S. Equity FundClass O 2,136,219,326 54,201,275 6.9
Mackenzie EmergingMarkets Class Series O 459,925,174 45,259,621 5.7
PIMCO Monthly IncomeFund (Canada) Class I 7,409,175,099 15,228,958 1.9
Scotia Canadian DividendFund Series I 7,324,836,052 67,648,495 8.6
Scotia Private CanadianCorporate Bond PoolSeries I 4,860,619,761 23,076,019 2.9
Scotia Canadian IncomeFund Series I 5,950,709,764 30,532,770 3.9
Scotia Global Growth FundSeries I 690,371,728 28,457,581 3.6
784,778,901 99.5
December 31, 2014
Underlying Fund
Net asset value ofUnderlying Fund
($)
Carrying value ofUnderlying Fund
($)
Carrying value ofUnderlying Fundas a percentage
of net assets(%)
Trimark Canadian SmallCompanies FundSeries I 684,703,887 62,754,397 8.8
Trimark GlobalEndeavour FundSeries I 1,027,076,368 16,098,150 2.2
Invesco InternationalGrowth Fund Series I 386,346,380 31,839,617 4.5
CI Cambridge CanadianEquity CorporateClass I 3,722,459,360 78,484,491 11.0
CI Global SmallCompanies FundClass I 201,801,083 25,585,419 3.6
Dynamic High Yield BondFund Series O 849,677,494 6,867,323 1.0
Dynamic Global EquityFund Series O 372,698,233 46,982,141 6.6
Dynamic Value Fund ofCanada Series O 2,253,505,288 111,011,687 15.6
Mackenzie US Mid CapGrowth Class Series O 369,797,950 48,159,596 6.8
Mawer InternationalEquity Fund Class O 3,198,224,451 39,246,122 5.5
Mawer U.S. Equity FundClass O 1,947,576,693 50,680,924 7.1
Mackenzie EmergingMarkets Class Series O 428,262,234 39,460,469 5.5
PIMCO Monthly IncomeFund (Canada) Class I 6,546,163,575 13,745,983 1.9
Scotia Canadian DividendFund Series I 7,347,067,396 65,035,560 9.1
Scotia Private CanadianCorporate Bond PoolSeries I 4,143,683,984 20,847,295 2.9
Scotia Canadian IncomeFund Series I 5,990,064,451 27,957,420 3.9
Scotia Global GrowthFund Series I 606,644,389 25,435,513 3.6
710,192,107 99.6
5. Comparison of net asset value per unit and netassets per unit (note 2)
The table below provides a comparison of the net assetvalue per unit and net assets per unit. The primary reasonfor the difference between the net asset value per unit andnet assets per unit, if any, is described in note 2.
June 30, 2015 December 31, 2014
Net asset valueper unit
($)
Net assetsper unit
($)
Net asset valueper unit
($)
Net assetsper unit
($)
Series A 21.69 21.69 20.59 20.59
Series F 23.93 23.93 22.62 22.62
The accompanying notes are an integral part of the financial statements.
318
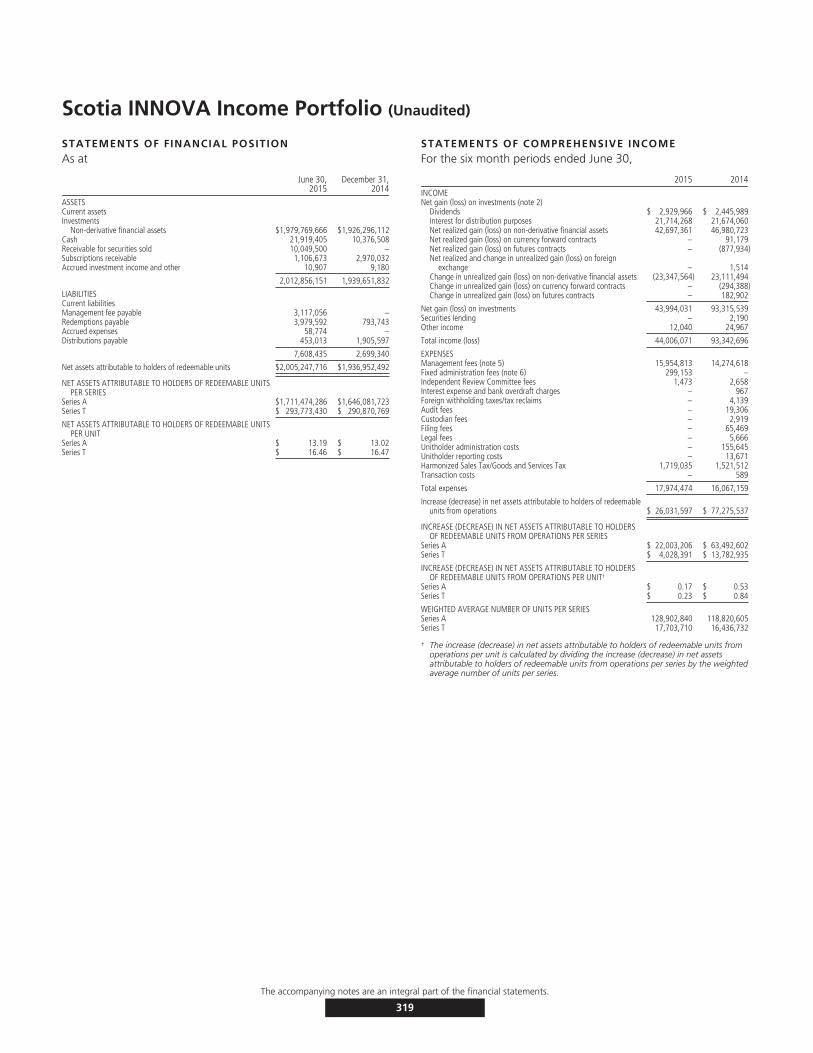
Scotia INNOVA Income Portfolio (Unaudited)
STATEMENTS OF FINANCIAL POSITIONAs at
June 30,2015
December 31,2014
ASSETSCurrent assetsInvestments
Non-derivative financial assets $1,979,769,666 $1,926,296,112Cash 21,919,405 10,376,508Receivable for securities sold 10,049,500 –Subscriptions receivable 1,106,673 2,970,032Accrued investment income and other 10,907 9,180
2,012,856,151 1,939,651,832
LIABILITIESCurrent liabilitiesManagement fee payable 3,117,056 –Redemptions payable 3,979,592 793,743Accrued expenses 58,774 –Distributions payable 453,013 1,905,597
7,608,435 2,699,340
Net assets attributable to holders of redeemable units $2,005,247,716 $1,936,952,492
NET ASSETS ATTRIBUTABLE TO HOLDERS OF REDEEMABLE UNITSPER SERIES
Series A $1,711,474,286 $1,646,081,723Series T $ 293,773,430 $ 290,870,769
NET ASSETS ATTRIBUTABLE TO HOLDERS OF REDEEMABLE UNITSPER UNIT
Series A $ 13.19 $ 13.02Series T $ 16.46 $ 16.47
STATEMENTS OF COMPREHENSIVE INCOMEFor the six month periods ended June 30,
2015 2014INCOMENet gain (loss) on investments (note 2)
Dividends $ 2,929,966 $ 2,445,989Interest for distribution purposes 21,714,268 21,674,060Net realized gain (loss) on non-derivative financial assets 42,697,361 46,980,723Net realized gain (loss) on currency forward contracts – 91,179Net realized gain (loss) on futures contracts – (877,934)Net realized and change in unrealized gain (loss) on foreign
exchange – 1,514Change in unrealized gain (loss) on non-derivative financial assets (23,347,564) 23,111,494Change in unrealized gain (loss) on currency forward contracts – (294,388)Change in unrealized gain (loss) on futures contracts – 182,902
Net gain (loss) on investments 43,994,031 93,315,539Securities lending – 2,190Other income 12,040 24,967
Total income (loss) 44,006,071 93,342,696
EXPENSESManagement fees (note 5) 15,954,813 14,274,618Fixed administration fees (note 6) 299,153 –Independent Review Committee fees 1,473 2,658Interest expense and bank overdraft charges – 967Foreign withholding taxes/tax reclaims – 4,139Audit fees – 19,306Custodian fees – 2,919Filing fees – 65,469Legal fees – 5,666Unitholder administration costs – 155,645Unitholder reporting costs – 13,671Harmonized Sales Tax/Goods and Services Tax 1,719,035 1,521,512Transaction costs – 589
Total expenses 17,974,474 16,067,159
Increase (decrease) in net assets attributable to holders of redeemableunits from operations $ 26,031,597 $ 77,275,537
INCREASE (DECREASE) IN NET ASSETS ATTRIBUTABLE TO HOLDERSOF REDEEMABLE UNITS FROM OPERATIONS PER SERIES
Series A $ 22,003,206 $ 63,492,602Series T $ 4,028,391 $ 13,782,935
INCREASE (DECREASE) IN NET ASSETS ATTRIBUTABLE TO HOLDERSOF REDEEMABLE UNITS FROM OPERATIONS PER UNIT†
Series A $ 0.17 $ 0.53Series T $ 0.23 $ 0.84
WEIGHTED AVERAGE NUMBER OF UNITS PER SERIESSeries A 128,902,840 118,820,605Series T 17,703,710 16,436,732
† The increase (decrease) in net assets attributable to holders of redeemable units fromoperations per unit is calculated by dividing the increase (decrease) in net assetsattributable to holders of redeemable units from operations per series by the weightedaverage number of units per series.
The accompanying notes are an integral part of the financial statements.
319
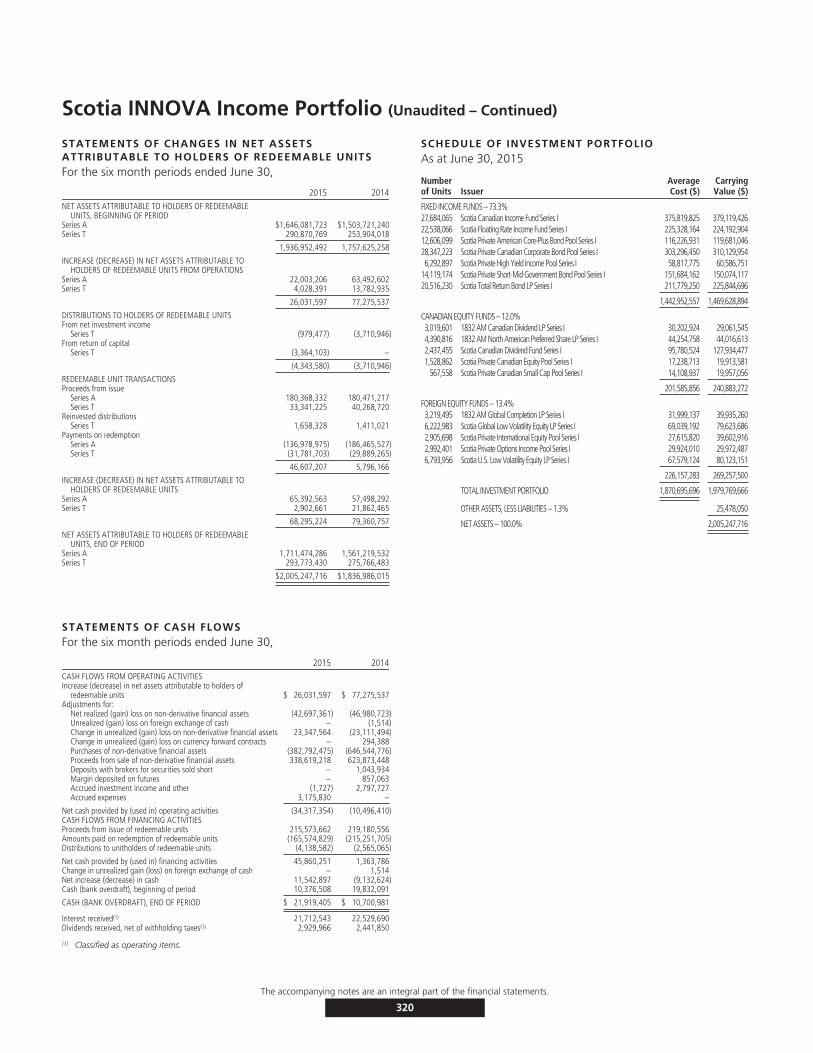
Scotia INNOVA Income Portfolio (Unaudited – Continued)
STATEMENTS OF CHANGES IN NET ASSETSATTRIBUTABLE TO HOLDERS OF REDEEMABLE UNITSFor the six month periods ended June 30,
2015 2014NET ASSETS ATTRIBUTABLE TO HOLDERS OF REDEEMABLE
UNITS, BEGINNING OF PERIODSeries A $1,646,081,723 $1,503,721,240Series T 290,870,769 253,904,018
1,936,952,492 1,757,625,258
INCREASE (DECREASE) IN NET ASSETS ATTRIBUTABLE TOHOLDERS OF REDEEMABLE UNITS FROM OPERATIONS
Series A 22,003,206 63,492,602Series T 4,028,391 13,782,935
26,031,597 77,275,537
DISTRIBUTIONS TO HOLDERS OF REDEEMABLE UNITSFrom net investment income
Series T (979,477) (3,710,946)From return of capital
Series T (3,364,103) –
(4,343,580) (3,710,946)
REDEEMABLE UNIT TRANSACTIONSProceeds from issue
Series A 180,368,332 180,471,217Series T 33,341,225 40,268,720
Reinvested distributionsSeries T 1,658,328 1,411,021
Payments on redemptionSeries A (136,978,975) (186,465,527)Series T (31,781,703) (29,889,265)
46,607,207 5,796,166
INCREASE (DECREASE) IN NET ASSETS ATTRIBUTABLE TOHOLDERS OF REDEEMABLE UNITS
Series A 65,392,563 57,498,292Series T 2,902,661 21,862,465
68,295,224 79,360,757
NET ASSETS ATTRIBUTABLE TO HOLDERS OF REDEEMABLEUNITS, END OF PERIOD
Series A 1,711,474,286 1,561,219,532Series T 293,773,430 275,766,483
$2,005,247,716 $1,836,986,015
STATEMENTS OF CASH FLOWSFor the six month periods ended June 30,
2015 2014CASH FLOWS FROM OPERATING ACTIVITIESIncrease (decrease) in net assets attributable to holders of
redeemable units $ 26,031,597 $ 77,275,537Adjustments for:
Net realized (gain) loss on non-derivative financial assets (42,697,361) (46,980,723)Unrealized (gain) loss on foreign exchange of cash – (1,514)Change in unrealized (gain) loss on non-derivative financial assets 23,347,564 (23,111,494)Change in unrealized (gain) loss on currency forward contracts – 294,388Purchases of non-derivative financial assets (382,792,475) (646,544,776)Proceeds from sale of non-derivative financial assets 338,619,218 623,873,448Deposits with brokers for securities sold short – 1,043,934Margin deposited on futures – 857,063Accrued investment income and other (1,727) 2,797,727Accrued expenses 3,175,830 –
Net cash provided by (used in) operating activities (34,317,354) (10,496,410)CASH FLOWS FROM FINANCING ACTIVITIESProceeds from issue of redeemable units 215,573,662 219,180,556Amounts paid on redemption of redeemable units (165,574,829) (215,251,705)Distributions to unitholders of redeemable units (4,138,582) (2,565,065)
Net cash provided by (used in) financing activities 45,860,251 1,363,786Change in unrealized gain (loss) on foreign exchange of cash – 1,514Net increase (decrease) in cash 11,542,897 (9,132,624)Cash (bank overdraft), beginning of period 10,376,508 19,832,091
CASH (BANK OVERDRAFT), END OF PERIOD $ 21,919,405 $ 10,700,981
Interest received(1) 21,712,543 22,529,690Dividends received, net of withholding taxes(1) 2,929,966 2,441,850
(1) Classified as operating items.
SCHEDULE OF INVESTMENT PORTFOLIOAs at June 30, 2015
Numberof Units Issuer
AverageCost ($)
CarryingValue ($)
FIXED INCOME FUNDS – 73.3%27,684,065 Scotia Canadian Income Fund Series I 375,819,825 379,119,42622,538,066 Scotia Floating Rate Income Fund Series I 225,328,164 224,192,90412,606,099 Scotia Private American Core-Plus Bond Pool Series I 116,226,931 119,681,04628,347,223 Scotia Private Canadian Corporate Bond Pool Series I 303,296,450 310,129,9546,292,897 Scotia Private High Yield Income Pool Series I 58,817,775 60,586,751
14,119,174 Scotia Private Short-Mid Government Bond Pool Series I 151,684,162 150,074,11720,516,230 Scotia Total Return Bond LP Series I 211,779,250 225,844,696
1,442,952,557 1,469,628,894
CANADIAN EQUITY FUNDS – 12.0%3,019,601 1832 AM Canadian Dividend LP Series I 30,202,924 29,061,5454,390,816 1832 AM North American Preferred Share LP Series I 44,254,758 44,016,6132,437,455 Scotia Canadian Dividend Fund Series I 95,780,524 127,934,4771,528,862 Scotia Private Canadian Equity Pool Series I 17,238,713 19,913,581
567,558 Scotia Private Canadian Small Cap Pool Series I 14,108,937 19,957,056
201,585,856 240,883,272
FOREIGN EQUITY FUNDS – 13.4%3,219,495 1832 AM Global Completion LP Series I 31,999,137 39,935,2606,222,983 Scotia Global Low Volatility Equity LP Series I 69,039,192 79,623,6862,905,698 Scotia Private International Equity Pool Series I 27,615,820 39,602,9162,992,401 Scotia Private Options Income Pool Series I 29,924,010 29,972,4876,793,956 Scotia U.S. Low Volatility Equity LP Series I 67,579,124 80,123,151
226,157,283 269,257,500
TOTAL INVESTMENT PORTFOLIO 1,870,695,696 1,979,769,666
OTHER ASSETS, LESS LIABILITIES – 1.3% 25,478,050
NET ASSETS – 100.0% 2,005,247,716
The accompanying notes are an integral part of the financial statements.
320

Scotia INNOVA Income Portfolio (Unaudited)
FUND SPECIFIC NOTESFor the periods indicated in Note 1.
1. The Fund (note 1)
The Fund’s investment objective is to achieve a balance ofcurrent income and long-term capital appreciation, with asignificant bias towards income. It invests primarily in adiversified mix of mutual funds, and/or equity securitiesand/or fixed income securities located anywhere in theworld. The portfolio is an asset allocation fund thatallocates investment between two asset classes: fixedincome and equities.
The Fund invests primarily in mutual funds managed by theManager and/or by the third party investment managers(the ‘‘Underlying Funds’’). To ensure the Fund’scomposition meets the investment objectives of the Fund,the portfolio advisor monitors the Underlying Funds on anongoing basis and rebalances the Fund’s assets among theUnderlying Funds.
2. Risks associated with financial instruments (note 4)
i) Interest rate risk
The Fund invests in Underlying Funds, which are exposedto interest rate risk. As at June 30, 2015, had the prevailinginterest rates increased or decreased by 0.25%, assuming aparallel shift in the yield curve and all other variables heldconstant, net assets attributable to holders of redeemableunits would have decreased or increased, respectively, by$18,263,830 or approximately 0.9% (December 31, 2014 –$19,061,057 or approximately 1.0%). In practice, actualresults may differ from this sensitivity analysis and thedifference could be material.
ii) Currency risk
The Fund could be exposed to indirect currency risk to theextent that the Underlying Funds held financialinstruments that were denominated in a currency otherthan its functional currency.
iii) Price risk
Price risk is the risk that the carrying value of financialinstruments will fluctuate as a result of changes in marketprices (other than those arising from interest rate risk orcurrency risk) caused by factors specific to a security, itsissuer or all factors affecting a market or a market segment.Exposure to price risk is mainly in equities, derivatives andcommodities, if applicable. As at June 30, 2015,approximately 25.4% (December 31, 2014 – 29.4%) of theFund’s net assets were invested in Underlying Funds whichwere exposed to price risk. If prices of the Underlying
Funds’ investments had decreased or increased by 10%,with all other variables held constant, net assets of theFund would have decreased or increased, respectively, byapproximately $51,014,077 (December 31, 2014 –$56,878,296). In practice, actual results may differ from thissensitivity analysis and the difference could be material.
iv) Credit risk
The Fund could be exposed to indirect credit risk to theextent that the Underlying Funds invested in bonds anddebentures, preferred shares and derivatives.
v) Liquidity risk
The table below summarizes the Fund’s financial liabilitiesbased on the remaining period to the contractual maturitydate.
June 30, 2015 December 31, 2014
On demand($)
Less than3 months
($)On demand
($)
Less than3 months
($)
Current liabilities – 7,608,435 – 2,699,340Liability for written options – – – –Unrealized loss on derivatives – – – –Redeemable units 2,005,247,716 – 1,936,952,492 –
2,005,247,716 7,608,435 1,936,952,492 2,699,340
Redeemable units are redeemable on demand at theholder’s option. However, the Manager does not expect thatthe contractual maturity disclosed in the table above will berepresentative of the actual cash outflows, as holders ofthese instruments typically retain them for a longer term.
vi) Concentration risk
Concentration risk arises as a result of the concentration ofexposures within the same category, geographical location,asset type or industry sector, as applicable. The table belowis a summary of the Fund’s concentration risk:
Percentage of net assets (%)
June 30, 2015 December 31, 2014
Canadian Equity Funds 12.0 13.9Fixed Income Funds 73.3 70.1Foreign Equity Funds 13.4 15.5
vii) Fair value classification (note 2)
The tables below illustrate the classification of the Fund’sfinancial instruments within the fair value hierarchy.
June 30, 2015Level 1
($)Level 2
($)Level 3
($)Total($)
Underlying funds 1,979,769,666 – – 1,979,769,666
1,979,769,666 – – 1,979,769,666
The accompanying notes are an integral part of the financial statements.
321

Scotia INNOVA Income Portfolio (Unaudited – Continued)
FUND SPECIFIC NOTESFor the periods indicated in Note 1.
December 31, 2014Level 1
($)Level 2
($)Level 3
($)Total($)
Underlying funds 1,926,296,112 – – 1,926,296,112
1,926,296,112 – – 1,926,296,112
Transfers between levels
During the periods ended June 30, 2015 and December 31,2014, there were no significant transfers between Level 1and Level 2.
3. Offsetting of financial assets and liabilities (note 2)
As at June 30, 2015 or December 31, 2014, the Fund didnot enter into any agreement whereby the financialinstruments were eligible for offset.
4. Interest in Underlying Funds (note 2)
The following tables provide information about the Fund’sinterest in Underlying Funds.
June 30, 2015
Underlying Fund
Net asset value ofUnderlying Fund
($)
Carrying value ofUnderlying Fund
($)
Carrying value ofUnderlying Fundas a percentage
of net assets(%)
Scotia Floating RateIncome Fund Series I 718,598,958 224,192,904 11.2
1832 AM CanadianDividend LP Series I 472,407,514 29,061,545 1.4
Scotia Private OptionsIncome Pool Series I 314,283,677 29,972,487 1.5
1832 AM North AmericanPreferred Share LPSeries I 282,558,754 44,016,613 2.2
Scotia Global LowVolatility Equity LPSeries I 809,239,005 79,623,686 4.0
Scotia U.S. Low VolatilityEquity LP Series I 794,087,591 80,123,151 3.9
1832 AM GlobalCompletion LP Series I 375,441,535 39,935,260 2.0
Scotia Total Return BondLP Series I 800,479,521 225,844,696 11.2
Scotia Private High YieldIncome Pool Series I 941,135,483 60,586,751 3.0
Scotia Private AmericanCore-Plus Bond PoolSeries I 694,441,762 119,681,046 6.0
Scotia Private CanadianSmall Cap Pool Series I 533,016,993 19,957,056 1.0
Scotia PrivateInternational EquityPool Series I 877,790,757 39,602,916 2.0
Scotia Private CanadianEquity Pool Series I 709,724,546 19,913,581 1.0
Scotia Canadian DividendFund Series I 7,324,836,052 127,934,477 6.4
Scotia Private CanadianCorporate Bond PoolSeries I 4,860,619,761 310,129,954 15.5
Scotia Canadian IncomeFund Series I 5,950,709,764 379,119,426 18.9
Scotia Private Short-MidGovernment Bond PoolSeries I 1,498,303,519 150,074,117 7.5
1,979,769,666 98.7
December 31, 2014
Underlying Fund
Net asset value ofUnderlying Fund
($)
Carrying value ofUnderlying Fund
($)
Carrying value ofUnderlying Fundas a percentage
of net assets(%)
Scotia Private U.S.Dividend Pool Series I 1,198,858,466 25,315,596 1.3
Scotia Floating RateIncome Fund Series I 647,072,278 150,099,805 7.8
1832 AM North AmericanPreferred Share LPSeries I 368,540,953 73,105,476 3.8
Scotia Global LowVolatility Equity LPSeries I 604,457,652 51,094,534 2.6
Scotia U.S. Low VolatilityEquity LP Series I 910,655,223 98,668,634 5.1
1832 AM GlobalCompletion LP Series I 289,313,699 40,192,058 2.1
Scotia Total Return BondLP Series I 359,431,823 144,001,276 7.4
Scotia Private High YieldIncome Pool Series I 910,438,382 105,446,071 5.4
Scotia Private AmericanCore-Plus Bond PoolSeries I 628,345,246 114,258,900 5.9
Scotia Private CanadianSmall Cap Pool Series I 538,492,305 19,412,726 1.0
Scotia PrivateInternational EquityPool Series I 600,735,759 44,647,228 2.3
Scotia Private GlobalEquity Pool Series I 459,739,970 40,367,186 2.1
Scotia Private CanadianEquity Pool Series I 1,014,747,384 38,745,253 2.0
Scotia Canadian DividendFund Series I 7,347,067,396 137,234,268 7.1
Scotia Private CanadianCorporate Bond PoolSeries I 4,143,683,984 228,906,387 11.8
Scotia Canadian IncomeFund Series I 5,990,064,451 429,057,767 22.2
Scotia Private Short-MidGovernment Bond PoolSeries I 1,640,083,559 185,742,947 9.6
1,926,296,112 99.5
5. Comparison of net asset value per unit and netassets per unit (note 2)
The table below provides a comparison of the net assetvalue per unit and net assets per unit. The primary reasonfor the difference between the net asset value per unit andnet assets per unit, if any, is described in note 2.
June 30, 2015 December 31, 2014
Net asset valueper unit
($)
Net assetsper unit
($)
Net asset valueper unit
($)
Net assetsper unit
($)
Series A 13.19 13.19 13.02 13.02
Series T 16.46 16.46 16.47 16.47
The accompanying notes are an integral part of the financial statements.
322
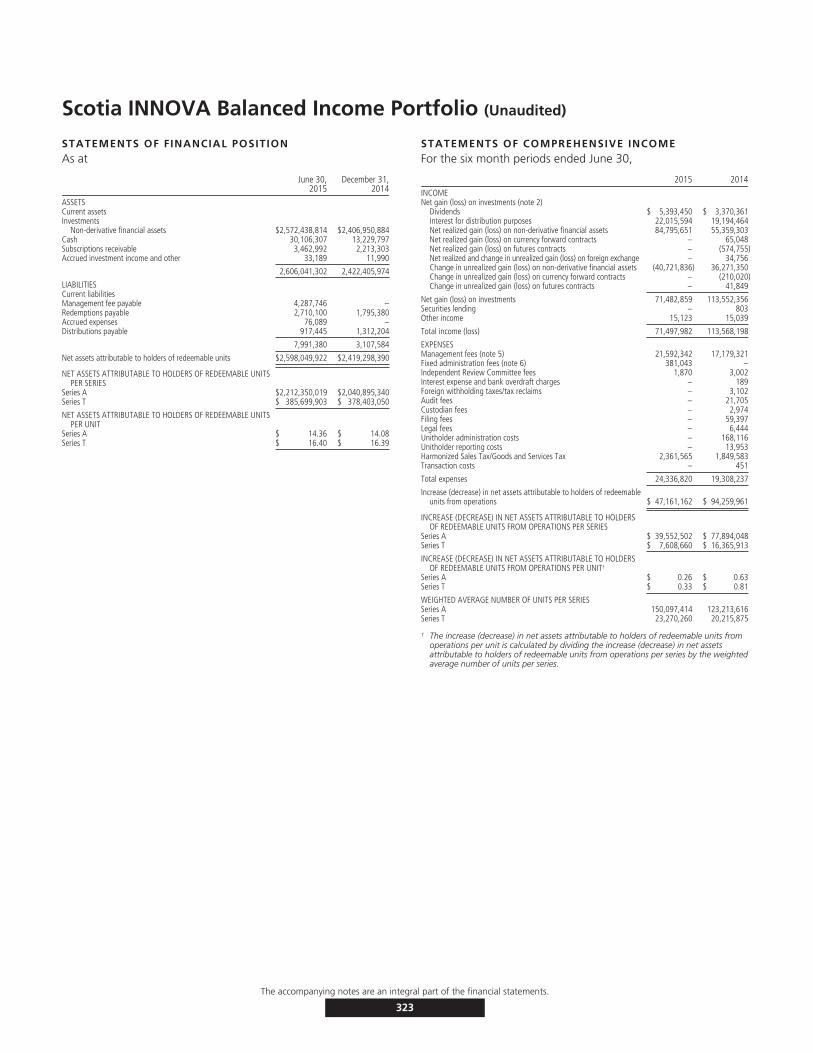
Scotia INNOVA Balanced Income Portfolio (Unaudited)
STATEMENTS OF FINANCIAL POSITIONAs at
June 30,2015
December 31,2014
ASSETSCurrent assetsInvestments
Non-derivative financial assets $2,572,438,814 $2,406,950,884Cash 30,106,307 13,229,797Subscriptions receivable 3,462,992 2,213,303Accrued investment income and other 33,189 11,990
2,606,041,302 2,422,405,974
LIABILITIESCurrent liabilitiesManagement fee payable 4,287,746 –Redemptions payable 2,710,100 1,795,380Accrued expenses 76,089 –Distributions payable 917,445 1,312,204
7,991,380 3,107,584
Net assets attributable to holders of redeemable units $2,598,049,922 $2,419,298,390
NET ASSETS ATTRIBUTABLE TO HOLDERS OF REDEEMABLE UNITSPER SERIES
Series A $2,212,350,019 $2,040,895,340Series T $ 385,699,903 $ 378,403,050
NET ASSETS ATTRIBUTABLE TO HOLDERS OF REDEEMABLE UNITSPER UNIT
Series A $ 14.36 $ 14.08Series T $ 16.40 $ 16.39
STATEMENTS OF COMPREHENSIVE INCOMEFor the six month periods ended June 30,
2015 2014INCOMENet gain (loss) on investments (note 2)
Dividends $ 5,393,450 $ 3,370,361Interest for distribution purposes 22,015,594 19,194,464Net realized gain (loss) on non-derivative financial assets 84,795,651 55,359,303Net realized gain (loss) on currency forward contracts – 65,048Net realized gain (loss) on futures contracts – (574,755)Net realized and change in unrealized gain (loss) on foreign exchange – 34,756Change in unrealized gain (loss) on non-derivative financial assets (40,721,836) 36,271,350Change in unrealized gain (loss) on currency forward contracts – (210,020)Change in unrealized gain (loss) on futures contracts – 41,849
Net gain (loss) on investments 71,482,859 113,552,356Securities lending – 803Other income 15,123 15,039
Total income (loss) 71,497,982 113,568,198
EXPENSESManagement fees (note 5) 21,592,342 17,179,321Fixed administration fees (note 6) 381,043 –Independent Review Committee fees 1,870 3,002Interest expense and bank overdraft charges – 189Foreign withholding taxes/tax reclaims – 3,102Audit fees – 21,705Custodian fees – 2,974Filing fees – 59,397Legal fees – 6,444Unitholder administration costs – 168,116Unitholder reporting costs – 13,953Harmonized Sales Tax/Goods and Services Tax 2,361,565 1,849,583Transaction costs – 451
Total expenses 24,336,820 19,308,237
Increase (decrease) in net assets attributable to holders of redeemableunits from operations $ 47,161,162 $ 94,259,961
INCREASE (DECREASE) IN NET ASSETS ATTRIBUTABLE TO HOLDERSOF REDEEMABLE UNITS FROM OPERATIONS PER SERIES
Series A $ 39,552,502 $ 77,894,048Series T $ 7,608,660 $ 16,365,913
INCREASE (DECREASE) IN NET ASSETS ATTRIBUTABLE TO HOLDERSOF REDEEMABLE UNITS FROM OPERATIONS PER UNIT†
Series A $ 0.26 $ 0.63Series T $ 0.33 $ 0.81
WEIGHTED AVERAGE NUMBER OF UNITS PER SERIESSeries A 150,097,414 123,213,616Series T 23,270,260 20,215,875
† The increase (decrease) in net assets attributable to holders of redeemable units fromoperations per unit is calculated by dividing the increase (decrease) in net assetsattributable to holders of redeemable units from operations per series by the weightedaverage number of units per series.
The accompanying notes are an integral part of the financial statements.
323
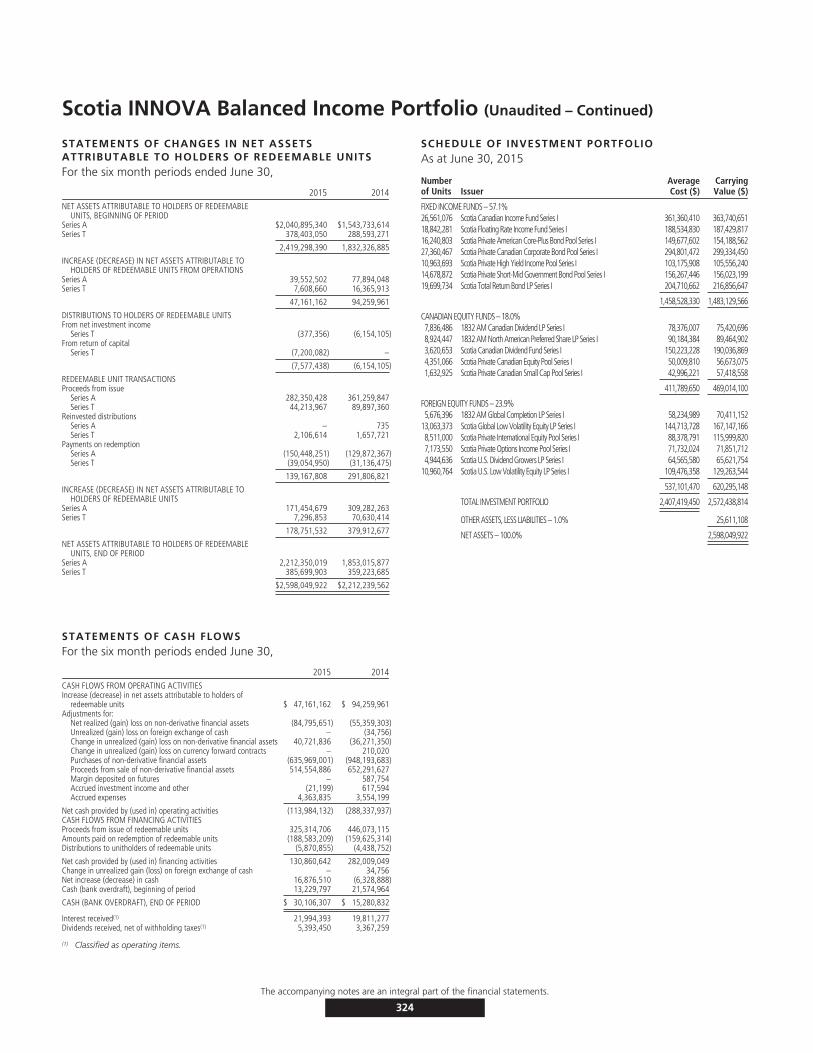
Scotia INNOVA Balanced Income Portfolio (Unaudited – Continued)
STATEMENTS OF CHANGES IN NET ASSETSATTRIBUTABLE TO HOLDERS OF REDEEMABLE UNITSFor the six month periods ended June 30,
2015 2014NET ASSETS ATTRIBUTABLE TO HOLDERS OF REDEEMABLE
UNITS, BEGINNING OF PERIODSeries A $2,040,895,340 $1,543,733,614Series T 378,403,050 288,593,271
2,419,298,390 1,832,326,885
INCREASE (DECREASE) IN NET ASSETS ATTRIBUTABLE TOHOLDERS OF REDEEMABLE UNITS FROM OPERATIONS
Series A 39,552,502 77,894,048Series T 7,608,660 16,365,913
47,161,162 94,259,961
DISTRIBUTIONS TO HOLDERS OF REDEEMABLE UNITSFrom net investment income
Series T (377,356) (6,154,105)From return of capital
Series T (7,200,082) –
(7,577,438) (6,154,105)
REDEEMABLE UNIT TRANSACTIONSProceeds from issue
Series A 282,350,428 361,259,847Series T 44,213,967 89,897,360
Reinvested distributionsSeries A – 735Series T 2,106,614 1,657,721
Payments on redemptionSeries A (150,448,251) (129,872,367)Series T (39,054,950) (31,136,475)
139,167,808 291,806,821
INCREASE (DECREASE) IN NET ASSETS ATTRIBUTABLE TOHOLDERS OF REDEEMABLE UNITS
Series A 171,454,679 309,282,263Series T 7,296,853 70,630,414
178,751,532 379,912,677
NET ASSETS ATTRIBUTABLE TO HOLDERS OF REDEEMABLEUNITS, END OF PERIOD
Series A 2,212,350,019 1,853,015,877Series T 385,699,903 359,223,685
$2,598,049,922 $2,212,239,562
STATEMENTS OF CASH FLOWSFor the six month periods ended June 30,
2015 2014CASH FLOWS FROM OPERATING ACTIVITIESIncrease (decrease) in net assets attributable to holders of
redeemable units $ 47,161,162 $ 94,259,961Adjustments for:
Net realized (gain) loss on non-derivative financial assets (84,795,651) (55,359,303)Unrealized (gain) loss on foreign exchange of cash – (34,756)Change in unrealized (gain) loss on non-derivative financial assets 40,721,836 (36,271,350)Change in unrealized (gain) loss on currency forward contracts – 210,020Purchases of non-derivative financial assets (635,969,001) (948,193,683)Proceeds from sale of non-derivative financial assets 514,554,886 652,291,627Margin deposited on futures – 587,754Accrued investment income and other (21,199) 617,594Accrued expenses 4,363,835 3,554,199
Net cash provided by (used in) operating activities (113,984,132) (288,337,937)CASH FLOWS FROM FINANCING ACTIVITIESProceeds from issue of redeemable units 325,314,706 446,073,115Amounts paid on redemption of redeemable units (188,583,209) (159,625,314)Distributions to unitholders of redeemable units (5,870,855) (4,438,752)
Net cash provided by (used in) financing activities 130,860,642 282,009,049Change in unrealized gain (loss) on foreign exchange of cash – 34,756Net increase (decrease) in cash 16,876,510 (6,328,888)Cash (bank overdraft), beginning of period 13,229,797 21,574,964
CASH (BANK OVERDRAFT), END OF PERIOD $ 30,106,307 $ 15,280,832
Interest received(1) 21,994,393 19,811,277Dividends received, net of withholding taxes(1) 5,393,450 3,367,259
(1) Classified as operating items.
SCHEDULE OF INVESTMENT PORTFOLIOAs at June 30, 2015
Numberof Units Issuer
AverageCost ($)
CarryingValue ($)
FIXED INCOME FUNDS – 57.1%26,561,076 Scotia Canadian Income Fund Series I 361,360,410 363,740,65118,842,281 Scotia Floating Rate Income Fund Series I 188,534,830 187,429,81716,240,803 Scotia Private American Core-Plus Bond Pool Series I 149,677,602 154,188,56227,360,467 Scotia Private Canadian Corporate Bond Pool Series I 294,801,472 299,334,45010,963,693 Scotia Private High Yield Income Pool Series I 103,175,908 105,556,24014,678,872 Scotia Private Short-Mid Government Bond Pool Series I 156,267,446 156,023,19919,699,734 Scotia Total Return Bond LP Series I 204,710,662 216,856,647
1,458,528,330 1,483,129,566
CANADIAN EQUITY FUNDS – 18.0%7,836,486 1832 AM Canadian Dividend LP Series I 78,376,007 75,420,6968,924,447 1832 AM North American Preferred Share LP Series I 90,184,384 89,464,9023,620,653 Scotia Canadian Dividend Fund Series I 150,223,228 190,036,8694,351,066 Scotia Private Canadian Equity Pool Series I 50,009,810 56,673,0751,632,925 Scotia Private Canadian Small Cap Pool Series I 42,996,221 57,418,558
411,789,650 469,014,100
FOREIGN EQUITY FUNDS – 23.9%5,676,396 1832 AM Global Completion LP Series I 58,234,989 70,411,152
13,063,373 Scotia Global Low Volatility Equity LP Series I 144,713,728 167,147,1668,511,000 Scotia Private International Equity Pool Series I 88,378,791 115,999,8207,173,550 Scotia Private Options Income Pool Series I 71,732,024 71,851,7124,944,636 Scotia U.S. Dividend Growers LP Series I 64,565,580 65,621,754
10,960,764 Scotia U.S. Low Volatility Equity LP Series I 109,476,358 129,263,544
537,101,470 620,295,148
TOTAL INVESTMENT PORTFOLIO 2,407,419,450 2,572,438,814
OTHER ASSETS, LESS LIABILITIES – 1.0% 25,611,108
NET ASSETS – 100.0% 2,598,049,922
The accompanying notes are an integral part of the financial statements.
324
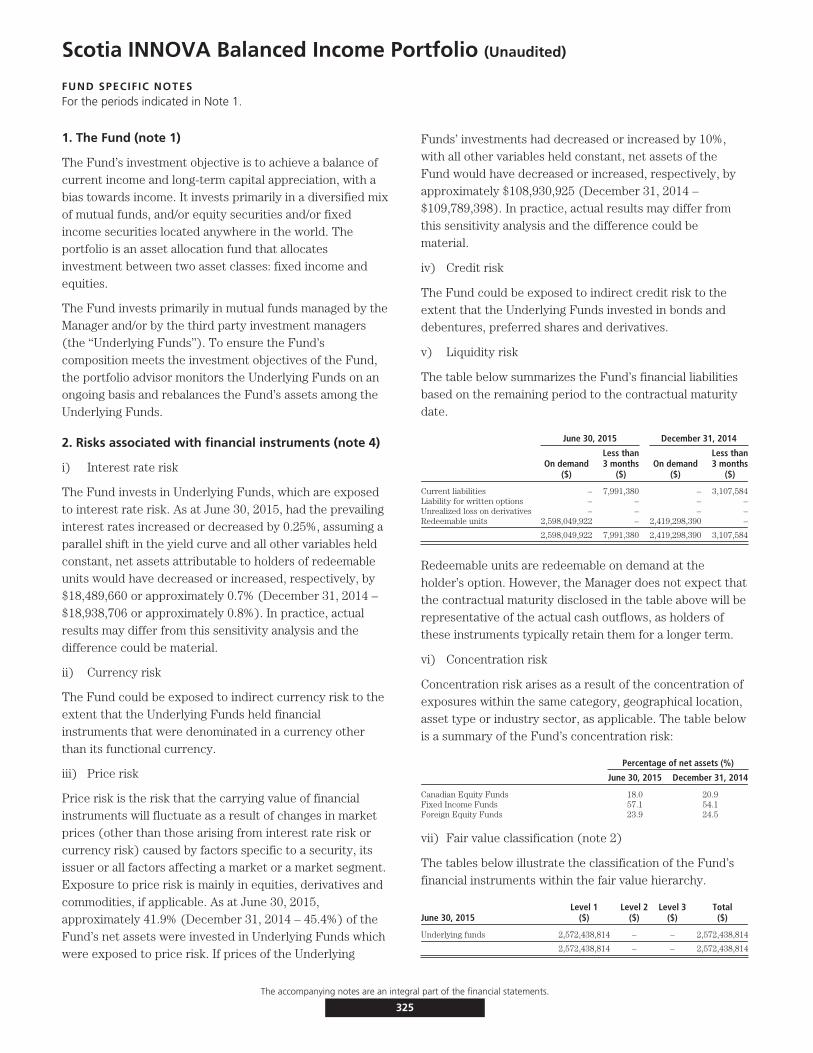
Scotia INNOVA Balanced Income Portfolio (Unaudited)
FUND SPECIFIC NOTESFor the periods indicated in Note 1.
1. The Fund (note 1)
The Fund’s investment objective is to achieve a balance ofcurrent income and long-term capital appreciation, with abias towards income. It invests primarily in a diversified mixof mutual funds, and/or equity securities and/or fixedincome securities located anywhere in the world. Theportfolio is an asset allocation fund that allocatesinvestment between two asset classes: fixed income andequities.
The Fund invests primarily in mutual funds managed by theManager and/or by the third party investment managers(the ‘‘Underlying Funds’’). To ensure the Fund’scomposition meets the investment objectives of the Fund,the portfolio advisor monitors the Underlying Funds on anongoing basis and rebalances the Fund’s assets among theUnderlying Funds.
2. Risks associated with financial instruments (note 4)
i) Interest rate risk
The Fund invests in Underlying Funds, which are exposedto interest rate risk. As at June 30, 2015, had the prevailinginterest rates increased or decreased by 0.25%, assuming aparallel shift in the yield curve and all other variables heldconstant, net assets attributable to holders of redeemableunits would have decreased or increased, respectively, by$18,489,660 or approximately 0.7% (December 31, 2014 –$18,938,706 or approximately 0.8%). In practice, actualresults may differ from this sensitivity analysis and thedifference could be material.
ii) Currency risk
The Fund could be exposed to indirect currency risk to theextent that the Underlying Funds held financialinstruments that were denominated in a currency otherthan its functional currency.
iii) Price risk
Price risk is the risk that the carrying value of financialinstruments will fluctuate as a result of changes in marketprices (other than those arising from interest rate risk orcurrency risk) caused by factors specific to a security, itsissuer or all factors affecting a market or a market segment.Exposure to price risk is mainly in equities, derivatives andcommodities, if applicable. As at June 30, 2015,approximately 41.9% (December 31, 2014 – 45.4%) of theFund’s net assets were invested in Underlying Funds whichwere exposed to price risk. If prices of the Underlying
Funds’ investments had decreased or increased by 10%,with all other variables held constant, net assets of theFund would have decreased or increased, respectively, byapproximately $108,930,925 (December 31, 2014 –$109,789,398). In practice, actual results may differ fromthis sensitivity analysis and the difference could bematerial.
iv) Credit risk
The Fund could be exposed to indirect credit risk to theextent that the Underlying Funds invested in bonds anddebentures, preferred shares and derivatives.
v) Liquidity risk
The table below summarizes the Fund’s financial liabilitiesbased on the remaining period to the contractual maturitydate.
June 30, 2015 December 31, 2014
On demand($)
Less than3 months
($)On demand
($)
Less than3 months
($)
Current liabilities – 7,991,380 – 3,107,584Liability for written options – – – –Unrealized loss on derivatives – – – –Redeemable units 2,598,049,922 – 2,419,298,390 –
2,598,049,922 7,991,380 2,419,298,390 3,107,584
Redeemable units are redeemable on demand at theholder’s option. However, the Manager does not expect thatthe contractual maturity disclosed in the table above will berepresentative of the actual cash outflows, as holders ofthese instruments typically retain them for a longer term.
vi) Concentration risk
Concentration risk arises as a result of the concentration ofexposures within the same category, geographical location,asset type or industry sector, as applicable. The table belowis a summary of the Fund’s concentration risk:
Percentage of net assets (%)
June 30, 2015 December 31, 2014
Canadian Equity Funds 18.0 20.9Fixed Income Funds 57.1 54.1Foreign Equity Funds 23.9 24.5
vii) Fair value classification (note 2)
The tables below illustrate the classification of the Fund’sfinancial instruments within the fair value hierarchy.
June 30, 2015Level 1
($)Level 2
($)Level 3
($)Total($)
Underlying funds 2,572,438,814 – – 2,572,438,814
2,572,438,814 – – 2,572,438,814
The accompanying notes are an integral part of the financial statements.
325
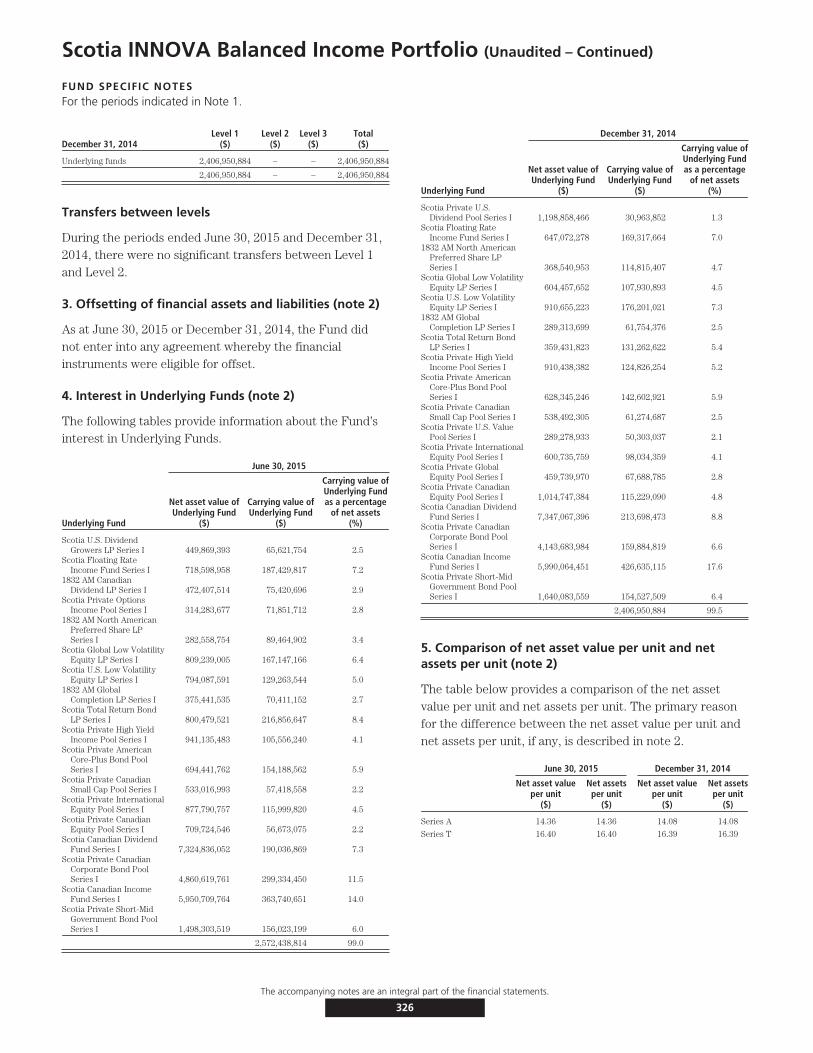
Scotia INNOVA Balanced Income Portfolio (Unaudited – Continued)
FUND SPECIFIC NOTESFor the periods indicated in Note 1.
December 31, 2014Level 1
($)Level 2
($)Level 3
($)Total($)
Underlying funds 2,406,950,884 – – 2,406,950,884
2,406,950,884 – – 2,406,950,884
Transfers between levels
During the periods ended June 30, 2015 and December 31,2014, there were no significant transfers between Level 1and Level 2.
3. Offsetting of financial assets and liabilities (note 2)
As at June 30, 2015 or December 31, 2014, the Fund didnot enter into any agreement whereby the financialinstruments were eligible for offset.
4. Interest in Underlying Funds (note 2)
The following tables provide information about the Fund’sinterest in Underlying Funds.
June 30, 2015
Underlying Fund
Net asset value ofUnderlying Fund
($)
Carrying value ofUnderlying Fund
($)
Carrying value ofUnderlying Fundas a percentage
of net assets(%)
Scotia U.S. DividendGrowers LP Series I 449,869,393 65,621,754 2.5
Scotia Floating RateIncome Fund Series I 718,598,958 187,429,817 7.2
1832 AM CanadianDividend LP Series I 472,407,514 75,420,696 2.9
Scotia Private OptionsIncome Pool Series I 314,283,677 71,851,712 2.8
1832 AM North AmericanPreferred Share LPSeries I 282,558,754 89,464,902 3.4
Scotia Global Low VolatilityEquity LP Series I 809,239,005 167,147,166 6.4
Scotia U.S. Low VolatilityEquity LP Series I 794,087,591 129,263,544 5.0
1832 AM GlobalCompletion LP Series I 375,441,535 70,411,152 2.7
Scotia Total Return BondLP Series I 800,479,521 216,856,647 8.4
Scotia Private High YieldIncome Pool Series I 941,135,483 105,556,240 4.1
Scotia Private AmericanCore-Plus Bond PoolSeries I 694,441,762 154,188,562 5.9
Scotia Private CanadianSmall Cap Pool Series I 533,016,993 57,418,558 2.2
Scotia Private InternationalEquity Pool Series I 877,790,757 115,999,820 4.5
Scotia Private CanadianEquity Pool Series I 709,724,546 56,673,075 2.2
Scotia Canadian DividendFund Series I 7,324,836,052 190,036,869 7.3
Scotia Private CanadianCorporate Bond PoolSeries I 4,860,619,761 299,334,450 11.5
Scotia Canadian IncomeFund Series I 5,950,709,764 363,740,651 14.0
Scotia Private Short-MidGovernment Bond PoolSeries I 1,498,303,519 156,023,199 6.0
2,572,438,814 99.0
December 31, 2014
Underlying Fund
Net asset value ofUnderlying Fund
($)
Carrying value ofUnderlying Fund
($)
Carrying value ofUnderlying Fundas a percentage
of net assets(%)
Scotia Private U.S.Dividend Pool Series I 1,198,858,466 30,963,852 1.3
Scotia Floating RateIncome Fund Series I 647,072,278 169,317,664 7.0
1832 AM North AmericanPreferred Share LPSeries I 368,540,953 114,815,407 4.7
Scotia Global Low VolatilityEquity LP Series I 604,457,652 107,930,893 4.5
Scotia U.S. Low VolatilityEquity LP Series I 910,655,223 176,201,021 7.3
1832 AM GlobalCompletion LP Series I 289,313,699 61,754,376 2.5
Scotia Total Return BondLP Series I 359,431,823 131,262,622 5.4
Scotia Private High YieldIncome Pool Series I 910,438,382 124,826,254 5.2
Scotia Private AmericanCore-Plus Bond PoolSeries I 628,345,246 142,602,921 5.9
Scotia Private CanadianSmall Cap Pool Series I 538,492,305 61,274,687 2.5
Scotia Private U.S. ValuePool Series I 289,278,933 50,303,037 2.1
Scotia Private InternationalEquity Pool Series I 600,735,759 98,034,359 4.1
Scotia Private GlobalEquity Pool Series I 459,739,970 67,688,785 2.8
Scotia Private CanadianEquity Pool Series I 1,014,747,384 115,229,090 4.8
Scotia Canadian DividendFund Series I 7,347,067,396 213,698,473 8.8
Scotia Private CanadianCorporate Bond PoolSeries I 4,143,683,984 159,884,819 6.6
Scotia Canadian IncomeFund Series I 5,990,064,451 426,635,115 17.6
Scotia Private Short-MidGovernment Bond PoolSeries I 1,640,083,559 154,527,509 6.4
2,406,950,884 99.5
5. Comparison of net asset value per unit and netassets per unit (note 2)
The table below provides a comparison of the net assetvalue per unit and net assets per unit. The primary reasonfor the difference between the net asset value per unit andnet assets per unit, if any, is described in note 2.
June 30, 2015 December 31, 2014
Net asset valueper unit
($)
Net assetsper unit
($)
Net asset valueper unit
($)
Net assetsper unit
($)
Series A 14.36 14.36 14.08 14.08
Series T 16.40 16.40 16.39 16.39
The accompanying notes are an integral part of the financial statements.
326
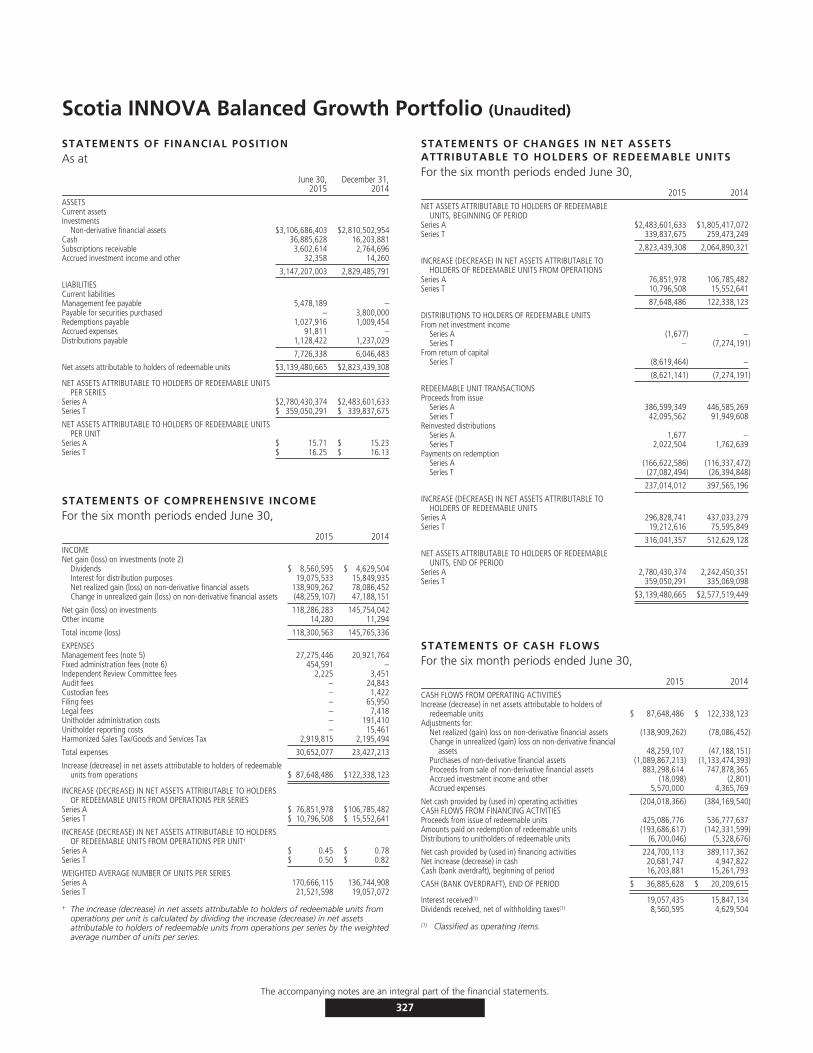
Scotia INNOVA Balanced Growth Portfolio (Unaudited)
STATEMENTS OF FINANCIAL POSITIONAs at
June 30,2015
December 31,2014
ASSETSCurrent assetsInvestments
Non-derivative financial assets $3,106,686,403 $2,810,502,954Cash 36,885,628 16,203,881Subscriptions receivable 3,602,614 2,764,696Accrued investment income and other 32,358 14,260
3,147,207,003 2,829,485,791
LIABILITIESCurrent liabilitiesManagement fee payable 5,478,189 –Payable for securities purchased – 3,800,000Redemptions payable 1,027,916 1,009,454Accrued expenses 91,811 –Distributions payable 1,128,422 1,237,029
7,726,338 6,046,483
Net assets attributable to holders of redeemable units $3,139,480,665 $2,823,439,308
NET ASSETS ATTRIBUTABLE TO HOLDERS OF REDEEMABLE UNITSPER SERIES
Series A $2,780,430,374 $2,483,601,633Series T $ 359,050,291 $ 339,837,675
NET ASSETS ATTRIBUTABLE TO HOLDERS OF REDEEMABLE UNITSPER UNIT
Series A $ 15.71 $ 15.23Series T $ 16.25 $ 16.13
STATEMENTS OF COMPREHENSIVE INCOMEFor the six month periods ended June 30,
2015 2014INCOMENet gain (loss) on investments (note 2)
Dividends $ 8,560,595 $ 4,629,504Interest for distribution purposes 19,075,533 15,849,935Net realized gain (loss) on non-derivative financial assets 138,909,262 78,086,452Change in unrealized gain (loss) on non-derivative financial assets (48,259,107) 47,188,151
Net gain (loss) on investments 118,286,283 145,754,042Other income 14,280 11,294
Total income (loss) 118,300,563 145,765,336
EXPENSESManagement fees (note 5) 27,275,446 20,921,764Fixed administration fees (note 6) 454,591 –Independent Review Committee fees 2,225 3,451Audit fees – 24,843Custodian fees – 1,422Filing fees – 65,950Legal fees – 7,418Unitholder administration costs – 191,410Unitholder reporting costs – 15,461Harmonized Sales Tax/Goods and Services Tax 2,919,815 2,195,494
Total expenses 30,652,077 23,427,213
Increase (decrease) in net assets attributable to holders of redeemableunits from operations $ 87,648,486 $122,338,123
INCREASE (DECREASE) IN NET ASSETS ATTRIBUTABLE TO HOLDERSOF REDEEMABLE UNITS FROM OPERATIONS PER SERIES
Series A $ 76,851,978 $106,785,482Series T $ 10,796,508 $ 15,552,641
INCREASE (DECREASE) IN NET ASSETS ATTRIBUTABLE TO HOLDERSOF REDEEMABLE UNITS FROM OPERATIONS PER UNIT†
Series A $ 0.45 $ 0.78Series T $ 0.50 $ 0.82
WEIGHTED AVERAGE NUMBER OF UNITS PER SERIESSeries A 170,666,115 136,744,908Series T 21,521,598 19,057,072
† The increase (decrease) in net assets attributable to holders of redeemable units fromoperations per unit is calculated by dividing the increase (decrease) in net assetsattributable to holders of redeemable units from operations per series by the weightedaverage number of units per series.
STATEMENTS OF CHANGES IN NET ASSETSATTRIBUTABLE TO HOLDERS OF REDEEMABLE UNITSFor the six month periods ended June 30,
2015 2014NET ASSETS ATTRIBUTABLE TO HOLDERS OF REDEEMABLE
UNITS, BEGINNING OF PERIODSeries A $2,483,601,633 $1,805,417,072Series T 339,837,675 259,473,249
2,823,439,308 2,064,890,321
INCREASE (DECREASE) IN NET ASSETS ATTRIBUTABLE TOHOLDERS OF REDEEMABLE UNITS FROM OPERATIONS
Series A 76,851,978 106,785,482Series T 10,796,508 15,552,641
87,648,486 122,338,123
DISTRIBUTIONS TO HOLDERS OF REDEEMABLE UNITSFrom net investment income
Series A (1,677) –Series T – (7,274,191)
From return of capitalSeries T (8,619,464) –
(8,621,141) (7,274,191)
REDEEMABLE UNIT TRANSACTIONSProceeds from issue
Series A 386,599,349 446,585,269Series T 42,095,562 91,949,608
Reinvested distributionsSeries A 1,677 –Series T 2,022,504 1,762,639
Payments on redemptionSeries A (166,622,586) (116,337,472)Series T (27,082,494) (26,394,848)
237,014,012 397,565,196
INCREASE (DECREASE) IN NET ASSETS ATTRIBUTABLE TOHOLDERS OF REDEEMABLE UNITS
Series A 296,828,741 437,033,279Series T 19,212,616 75,595,849
316,041,357 512,629,128
NET ASSETS ATTRIBUTABLE TO HOLDERS OF REDEEMABLEUNITS, END OF PERIOD
Series A 2,780,430,374 2,242,450,351Series T 359,050,291 335,069,098
$3,139,480,665 $2,577,519,449
STATEMENTS OF CASH FLOWSFor the six month periods ended June 30,
2015 2014CASH FLOWS FROM OPERATING ACTIVITIESIncrease (decrease) in net assets attributable to holders of
redeemable units $ 87,648,486 $ 122,338,123Adjustments for:
Net realized (gain) loss on non-derivative financial assets (138,909,262) (78,086,452)Change in unrealized (gain) loss on non-derivative financial
assets 48,259,107 (47,188,151)Purchases of non-derivative financial assets (1,089,867,213) (1,133,474,393)Proceeds from sale of non-derivative financial assets 883,298,614 747,878,365Accrued investment income and other (18,098) (2,801)Accrued expenses 5,570,000 4,365,769
Net cash provided by (used in) operating activities (204,018,366) (384,169,540)CASH FLOWS FROM FINANCING ACTIVITIESProceeds from issue of redeemable units 425,086,776 536,777,637Amounts paid on redemption of redeemable units (193,686,617) (142,331,599)Distributions to unitholders of redeemable units (6,700,046) (5,328,676)
Net cash provided by (used in) financing activities 224,700,113 389,117,362Net increase (decrease) in cash 20,681,747 4,947,822Cash (bank overdraft), beginning of period 16,203,881 15,261,793
CASH (BANK OVERDRAFT), END OF PERIOD $ 36,885,628 $ 20,209,615
Interest received(1) 19,057,435 15,847,134Dividends received, net of withholding taxes(1) 8,560,595 4,629,504
(1) Classified as operating items.
The accompanying notes are an integral part of the financial statements.
327

Scotia INNOVA Balanced Growth Portfolio (Unaudited – Continued)
SCHEDULE OF INVESTMENT PORTFOLIOAs at June 30, 2015
Numberof Units Issuer
AverageCost ($)
CarryingValue ($)
FIXED INCOME FUNDS – 37.9%25,746,750 Scotia Canadian Income Fund Series I 351,118,436 352,588,8636,232,244 Scotia Floating Rate Income Fund Series I 62,353,786 61,994,002
19,722,431 Scotia Private American Core-Plus Bond Pool Series I 182,631,322 187,242,78925,066,873 Scotia Private Canadian Corporate Bond Pool Series I 271,370,350 274,241,61813,144,628 Scotia Private High Yield Income Pool Series I 123,913,213 126,553,84517,105,477 Scotia Total Return Bond LP Series I 186,374,700 188,298,782
1,177,761,807 1,190,919,899
CANADIAN EQUITY FUNDS – 22.4%11,233,006 1832 AM Canadian Dividend LP Series I 112,210,244 108,109,8196,262,070 1832 AM Canadian Growth LP Series I 62,632,008 62,124,1147,967,444 1832 AM North American Preferred Share LP Series I 80,567,634 79,871,2394,151,826 Scotia Canadian Dividend Fund Series I 175,898,602 217,916,4708,340,945 Scotia Private Canadian Equity Pool Series I 97,651,269 108,641,6453,501,136 Scotia Private Canadian Small Cap Pool Series I 93,507,584 123,110,451
622,467,341 699,773,738
FOREIGN EQUITY FUNDS – 38.7%6,942,550 1832 AM Global Completion LP Series I 71,808,986 86,116,776
15,725,405 Scotia Global Low Volatility Equity LP Series I 162,912,378 201,208,1254,519,237 Scotia Private Emerging Markets Pool Series I 42,431,667 47,318,6704,500,982 Scotia Private Global Equity Pool Series I 64,132,558 102,069,2131,655,009 Scotia Private Global Real Estate Pool Series I 23,326,154 30,914,416
18,176,786 Scotia Private International Equity Pool Series I 206,249,044 247,738,6869,273,953 Scotia Private Options Income Pool Series I 92,735,046 92,889,772
11,877,016 Scotia U.S. Dividend Growers LP Series I 154,131,594 157,623,44821,208,117 Scotia U.S. Low Volatility Equity LP Series I 212,346,052 250,113,660
1,030,073,479 1,215,992,766
TOTAL INVESTMENT PORTFOLIO 2,830,302,627 3,106,686,403
OTHER ASSETS, LESS LIABILITIES – 1.0% 32,794,262
NET ASSETS – 100.0% 3,139,480,665
The accompanying notes are an integral part of the financial statements.
328
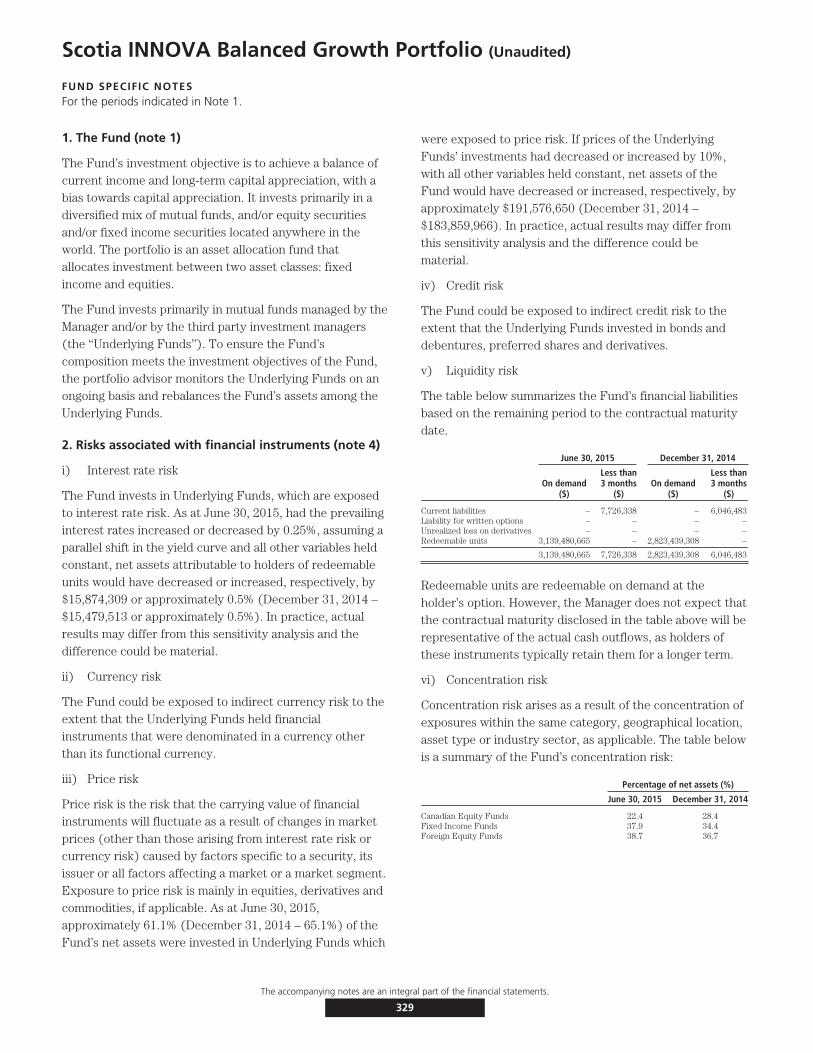
Scotia INNOVA Balanced Growth Portfolio (Unaudited)
FUND SPECIFIC NOTESFor the periods indicated in Note 1.
1. The Fund (note 1)
The Fund’s investment objective is to achieve a balance ofcurrent income and long-term capital appreciation, with abias towards capital appreciation. It invests primarily in adiversified mix of mutual funds, and/or equity securitiesand/or fixed income securities located anywhere in theworld. The portfolio is an asset allocation fund thatallocates investment between two asset classes: fixedincome and equities.
The Fund invests primarily in mutual funds managed by theManager and/or by the third party investment managers(the ‘‘Underlying Funds’’). To ensure the Fund’scomposition meets the investment objectives of the Fund,the portfolio advisor monitors the Underlying Funds on anongoing basis and rebalances the Fund’s assets among theUnderlying Funds.
2. Risks associated with financial instruments (note 4)
i) Interest rate risk
The Fund invests in Underlying Funds, which are exposedto interest rate risk. As at June 30, 2015, had the prevailinginterest rates increased or decreased by 0.25%, assuming aparallel shift in the yield curve and all other variables heldconstant, net assets attributable to holders of redeemableunits would have decreased or increased, respectively, by$15,874,309 or approximately 0.5% (December 31, 2014 –$15,479,513 or approximately 0.5%). In practice, actualresults may differ from this sensitivity analysis and thedifference could be material.
ii) Currency risk
The Fund could be exposed to indirect currency risk to theextent that the Underlying Funds held financialinstruments that were denominated in a currency otherthan its functional currency.
iii) Price risk
Price risk is the risk that the carrying value of financialinstruments will fluctuate as a result of changes in marketprices (other than those arising from interest rate risk orcurrency risk) caused by factors specific to a security, itsissuer or all factors affecting a market or a market segment.Exposure to price risk is mainly in equities, derivatives andcommodities, if applicable. As at June 30, 2015,approximately 61.1% (December 31, 2014 – 65.1%) of theFund’s net assets were invested in Underlying Funds which
were exposed to price risk. If prices of the UnderlyingFunds’ investments had decreased or increased by 10%,with all other variables held constant, net assets of theFund would have decreased or increased, respectively, byapproximately $191,576,650 (December 31, 2014 –$183,859,966). In practice, actual results may differ fromthis sensitivity analysis and the difference could bematerial.
iv) Credit risk
The Fund could be exposed to indirect credit risk to theextent that the Underlying Funds invested in bonds anddebentures, preferred shares and derivatives.
v) Liquidity risk
The table below summarizes the Fund’s financial liabilitiesbased on the remaining period to the contractual maturitydate.
June 30, 2015 December 31, 2014
On demand($)
Less than3 months
($)On demand
($)
Less than3 months
($)
Current liabilities – 7,726,338 – 6,046,483Liability for written options – – – –Unrealized loss on derivatives – – – –Redeemable units 3,139,480,665 – 2,823,439,308 –
3,139,480,665 7,726,338 2,823,439,308 6,046,483
Redeemable units are redeemable on demand at theholder’s option. However, the Manager does not expect thatthe contractual maturity disclosed in the table above will berepresentative of the actual cash outflows, as holders ofthese instruments typically retain them for a longer term.
vi) Concentration risk
Concentration risk arises as a result of the concentration ofexposures within the same category, geographical location,asset type or industry sector, as applicable. The table belowis a summary of the Fund’s concentration risk:
Percentage of net assets (%)
June 30, 2015 December 31, 2014
Canadian Equity Funds 22.4 28.4Fixed Income Funds 37.9 34.4Foreign Equity Funds 38.7 36.7
The accompanying notes are an integral part of the financial statements.
329
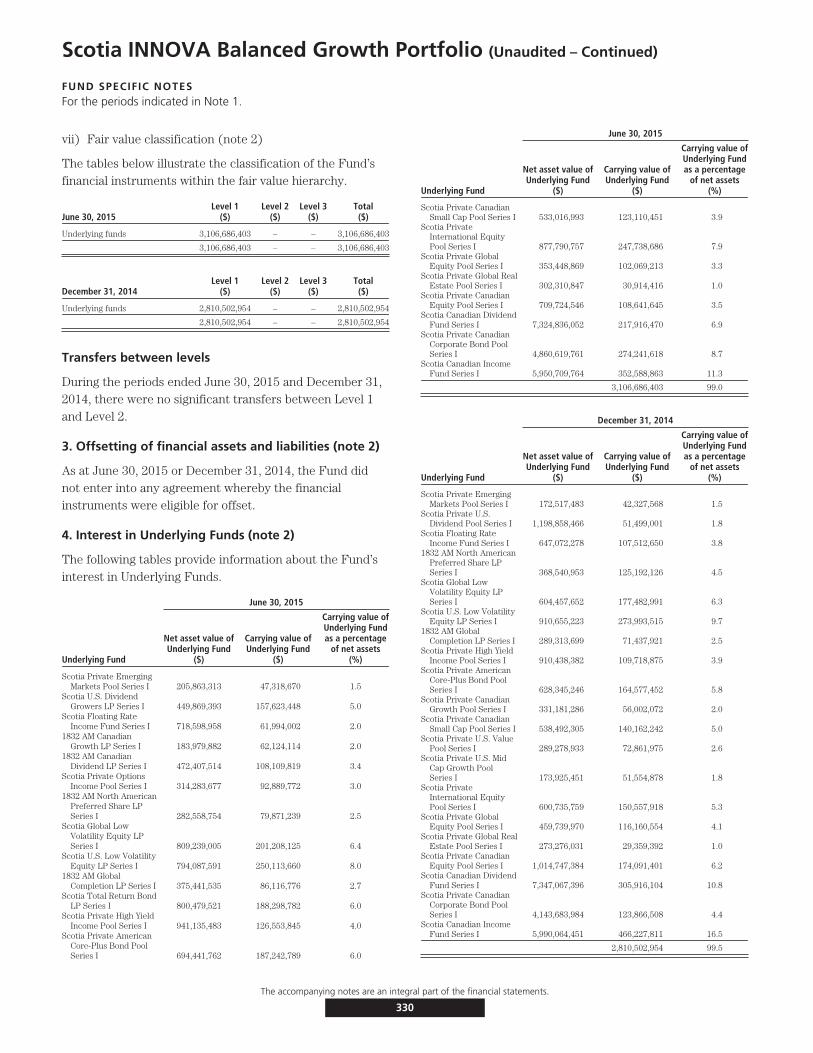
Scotia INNOVA Balanced Growth Portfolio (Unaudited – Continued)
FUND SPECIFIC NOTESFor the periods indicated in Note 1.
vii) Fair value classification (note 2)
The tables below illustrate the classification of the Fund’sfinancial instruments within the fair value hierarchy.
June 30, 2015Level 1
($)Level 2
($)Level 3
($)Total($)
Underlying funds 3,106,686,403 – – 3,106,686,403
3,106,686,403 – – 3,106,686,403
December 31, 2014Level 1
($)Level 2
($)Level 3
($)Total($)
Underlying funds 2,810,502,954 – – 2,810,502,954
2,810,502,954 – – 2,810,502,954
Transfers between levels
During the periods ended June 30, 2015 and December 31,2014, there were no significant transfers between Level 1and Level 2.
3. Offsetting of financial assets and liabilities (note 2)
As at June 30, 2015 or December 31, 2014, the Fund didnot enter into any agreement whereby the financialinstruments were eligible for offset.
4. Interest in Underlying Funds (note 2)
The following tables provide information about the Fund’sinterest in Underlying Funds.
June 30, 2015
Underlying Fund
Net asset value ofUnderlying Fund
($)
Carrying value ofUnderlying Fund
($)
Carrying value ofUnderlying Fundas a percentage
of net assets(%)
Scotia Private EmergingMarkets Pool Series I 205,863,313 47,318,670 1.5
Scotia U.S. DividendGrowers LP Series I 449,869,393 157,623,448 5.0
Scotia Floating RateIncome Fund Series I 718,598,958 61,994,002 2.0
1832 AM CanadianGrowth LP Series I 183,979,882 62,124,114 2.0
1832 AM CanadianDividend LP Series I 472,407,514 108,109,819 3.4
Scotia Private OptionsIncome Pool Series I 314,283,677 92,889,772 3.0
1832 AM North AmericanPreferred Share LPSeries I 282,558,754 79,871,239 2.5
Scotia Global LowVolatility Equity LPSeries I 809,239,005 201,208,125 6.4
Scotia U.S. Low VolatilityEquity LP Series I 794,087,591 250,113,660 8.0
1832 AM GlobalCompletion LP Series I 375,441,535 86,116,776 2.7
Scotia Total Return BondLP Series I 800,479,521 188,298,782 6.0
Scotia Private High YieldIncome Pool Series I 941,135,483 126,553,845 4.0
Scotia Private AmericanCore-Plus Bond PoolSeries I 694,441,762 187,242,789 6.0
June 30, 2015
Underlying Fund
Net asset value ofUnderlying Fund
($)
Carrying value ofUnderlying Fund
($)
Carrying value ofUnderlying Fundas a percentage
of net assets(%)
Scotia Private CanadianSmall Cap Pool Series I 533,016,993 123,110,451 3.9
Scotia PrivateInternational EquityPool Series I 877,790,757 247,738,686 7.9
Scotia Private GlobalEquity Pool Series I 353,448,869 102,069,213 3.3
Scotia Private Global RealEstate Pool Series I 302,310,847 30,914,416 1.0
Scotia Private CanadianEquity Pool Series I 709,724,546 108,641,645 3.5
Scotia Canadian DividendFund Series I 7,324,836,052 217,916,470 6.9
Scotia Private CanadianCorporate Bond PoolSeries I 4,860,619,761 274,241,618 8.7
Scotia Canadian IncomeFund Series I 5,950,709,764 352,588,863 11.3
3,106,686,403 99.0
December 31, 2014
Underlying Fund
Net asset value ofUnderlying Fund
($)
Carrying value ofUnderlying Fund
($)
Carrying value ofUnderlying Fundas a percentage
of net assets(%)
Scotia Private EmergingMarkets Pool Series I 172,517,483 42,327,568 1.5
Scotia Private U.S.Dividend Pool Series I 1,198,858,466 51,499,001 1.8
Scotia Floating RateIncome Fund Series I 647,072,278 107,512,650 3.8
1832 AM North AmericanPreferred Share LPSeries I 368,540,953 125,192,126 4.5
Scotia Global LowVolatility Equity LPSeries I 604,457,652 177,482,991 6.3
Scotia U.S. Low VolatilityEquity LP Series I 910,655,223 273,993,515 9.7
1832 AM GlobalCompletion LP Series I 289,313,699 71,437,921 2.5
Scotia Private High YieldIncome Pool Series I 910,438,382 109,718,875 3.9
Scotia Private AmericanCore-Plus Bond PoolSeries I 628,345,246 164,577,452 5.8
Scotia Private CanadianGrowth Pool Series I 331,181,286 56,002,072 2.0
Scotia Private CanadianSmall Cap Pool Series I 538,492,305 140,162,242 5.0
Scotia Private U.S. ValuePool Series I 289,278,933 72,861,975 2.6
Scotia Private U.S. MidCap Growth PoolSeries I 173,925,451 51,554,878 1.8
Scotia PrivateInternational EquityPool Series I 600,735,759 150,557,918 5.3
Scotia Private GlobalEquity Pool Series I 459,739,970 116,160,554 4.1
Scotia Private Global RealEstate Pool Series I 273,276,031 29,359,392 1.0
Scotia Private CanadianEquity Pool Series I 1,014,747,384 174,091,401 6.2
Scotia Canadian DividendFund Series I 7,347,067,396 305,916,104 10.8
Scotia Private CanadianCorporate Bond PoolSeries I 4,143,683,984 123,866,508 4.4
Scotia Canadian IncomeFund Series I 5,990,064,451 466,227,811 16.5
2,810,502,954 99.5
The accompanying notes are an integral part of the financial statements.
330

Scotia INNOVA Balanced Growth Portfolio (Unaudited – Continued)
FUND SPECIFIC NOTESFor the periods indicated in Note 1.
5. Comparison of net asset value per unit and netassets per unit (note 2)
The table below provides a comparison of the net assetvalue per unit and net assets per unit. The primary reasonfor the difference between the net asset value per unit andnet assets per unit, if any, is described in note 2.
June 30, 2015 December 31, 2014
Net asset valueper unit
($)
Net assetsper unit
($)
Net asset valueper unit
($)
Net assetsper unit
($)
Series A 15.71 15.71 15.23 15.23
Series T 16.25 16.25 16.13 16.13
The accompanying notes are an integral part of the financial statements.
331

Scotia INNOVA Growth Portfolio (Unaudited)
STATEMENTS OF FINANCIAL POSITIONAs at
June 30,2015
December 31,2014
ASSETSCurrent assetsInvestments
Non-derivative financial assets $1,694,526,933 $1,452,928,054Cash 32,218,131 9,381,667Subscriptions receivable 3,289,276 1,768,449Accrued investment income and other 24,190 7,907
1,730,058,530 1,464,086,077
LIABILITIESCurrent liabilitiesManagement fee payable 3,150,282 –Payable for securities purchased – 2,900,000Redemptions payable 1,057,775 960,575Accrued expenses 50,017 –Distributions payable – 65,294
4,258,074 3,925,869
Net assets attributable to holders of redeemable units $1,725,800,456 $1,460,160,208
NET ASSETS ATTRIBUTABLE TO HOLDERS OF REDEEMABLE UNITSPER SERIES
Series A $1,725,800,456 $1,460,160,208
NET ASSETS ATTRIBUTABLE TO HOLDERS OF REDEEMABLE UNITSPER UNIT
Series A $ 17.25 $ 16.58
STATEMENTS OF COMPREHENSIVE INCOMEFor the six month periods ended June 30,
2015 2014INCOMENet gain (loss) on investments (note 2)
Dividends $ 5,419,188 $ 2,030,826Interest for distribution purposes 6,731,719 4,886,300Net realized gain (loss) on non-derivative financial assets 87,075,110 41,199,326Change in unrealized gain (loss) on non-derivative financial assets (25,322,021) 26,909,110
Net gain (loss) on investments 73,903,996 75,025,562Other income 5,874 6,863
Total income (loss) 73,909,870 75,032,425
EXPENSESManagement fees (note 5) 15,501,482 10,627,844Fixed administration fees (note 6) 244,757 –Independent Review Committee fees 1,193 1,658Audit fees – 11,983Custodian fees – 1,357Filing fees – 31,630Legal fees – 3,579Unitholder administration costs – 92,251Unitholder reporting costs – 8,606Harmonized Sales Tax/Goods and Services Tax 1,552,697 1,045,301
Total expenses 17,300,129 11,824,209
Increase (decrease) in net assets attributable to holders of redeemableunits from operations $ 56,609,741 $63,208,216
INCREASE (DECREASE) IN NET ASSETS ATTRIBUTABLE TO HOLDERS OFREDEEMABLE UNITS FROM OPERATIONS PER SERIES
Series A $ 56,609,741 $63,208,216
INCREASE (DECREASE) IN NET ASSETS ATTRIBUTABLE TO HOLDERS OFREDEEMABLE UNITS FROM OPERATIONS PER UNIT†
Series A $ 0.60 $ 0.91
WEIGHTED AVERAGE NUMBER OF UNITS PER SERIESSeries A 94,684,412 69,229,088
† The increase (decrease) in net assets attributable to holders of redeemable units fromoperations per unit is calculated by dividing the increase (decrease) in net assetsattributable to holders of redeemable units from operations per series by the weightedaverage number of units per series.
STATEMENTS OF CHANGES IN NET ASSETSATTRIBUTABLE TO HOLDERS OF REDEEMABLE UNITSFor the six month periods ended June 30,
2015 2014NET ASSETS ATTRIBUTABLE TO HOLDERS OF REDEEMABLE
UNITS, BEGINNING OF PERIODSeries A $1,460,160,208 $ 953,081,184
INCREASE (DECREASE) IN NET ASSETS ATTRIBUTABLE TOHOLDERS OF REDEEMABLE UNITS FROM OPERATIONS
Series A 56,609,741 63,208,216
DISTRIBUTIONS TO HOLDERS OF REDEEMABLE UNITSFrom net investment income
Series A (258) –
REDEEMABLE UNIT TRANSACTIONSProceeds from issue
Series A 297,665,396 325,221,335Reinvested distributions
Series A 258 –Payments on redemption
Series A (88,634,889) (54,943,041)
209,030,765 270,278,294
INCREASE (DECREASE) IN NET ASSETS ATTRIBUTABLE TOHOLDERS OF REDEEMABLE UNITS
Series A 265,640,248 333,486,510
NET ASSETS ATTRIBUTABLE TO HOLDERS OF REDEEMABLEUNITS, END OF PERIOD
Series A $1,725,800,456 $1,286,567,694
STATEMENTS OF CASH FLOWSFor the six month periods ended June 30,
2015 2014CASH FLOWS FROM OPERATING ACTIVITIESIncrease (decrease) in net assets attributable to holders of
redeemable units $ 56,609,741 $ 63,208,216Adjustments for:
Net realized (gain) loss on non-derivative financial assets (87,075,110) (41,199,326)Change in unrealized (gain) loss on non-derivative financial assets 25,322,021 (26,909,110)Purchases of non-derivative financial assets (731,054,571) (544,998,193)Proceeds from sale of non-derivative financial assets 548,308,782 280,266,965Accrued investment income and other (16,283) (2,629)Accrued expenses 3,200,299 2,278,724
Net cash provided by (used in) operating activities (184,705,121) (267,355,353)CASH FLOWS FROM FINANCING ACTIVITIESProceeds from issue of redeemable units 296,141,726 323,742,212Amounts paid on redemption of redeemable units (88,537,689) (54,798,666)Distributions to unitholders of redeemable units (62,452) (5,208)
Net cash provided by (used in) financing activities 207,541,585 268,938,338Net increase (decrease) in cash 22,836,464 1,582,985Cash (bank overdraft), beginning of period 9,381,667 7,988,361
CASH (BANK OVERDRAFT), END OF PERIOD $ 32,218,131 $ 9,571,346
Interest received(1) 6,715,436 4,883,671Dividends received, net of withholding taxes(1) 5,419,188 2,030,826
(1) Classified as operating items.
The accompanying notes are an integral part of the financial statements.
332

Scotia INNOVA Growth Portfolio (Unaudited – Continued)
SCHEDULE OF INVESTMENT PORTFOLIOAs at June 30, 2015
Numberof Units Issuer
AverageCost ($)
CarryingValue ($)
FIXED INCOME FUNDS – 22.4%8,476,197 Scotia Canadian Income Fund Series I 115,772,171 116,077,2862,158,212 Scotia Floating Rate Income Fund Series I 21,591,105 21,468,3836,754,909 Scotia Private American Core-Plus Bond Pool Series I 62,957,379 64,130,4339,015,570 Scotia Private Canadian Corporate Bond Pool Series I 98,494,450 98,633,9456,769,153 Scotia Private High Yield Income Pool Series I 64,640,496 65,172,0471,949,677 Scotia Total Return Bond LP Series I 21,296,688 21,462,243
384,752,289 386,944,337
CANADIAN EQUITY FUNDS – 27.2%12,301,284 1832 AM Canadian Dividend LP Series I 122,312,283 118,391,2456,428,337 1832 AM Canadian Growth LP Series I 64,300,512 63,773,6014,270,792 1832 AM North American Preferred Share LP Series I 43,325,417 42,813,4092,435,453 Scotia Canadian Dividend Fund Series I 106,862,217 127,829,3883,276,970 Scotia Private Canadian Small Cap Pool Series I 92,297,704 115,228,090
429,098,133 468,035,733
FOREIGN EQUITY FUNDS – 48.6%5,528,717 1832 AM Global Completion LP Series I 57,799,843 68,579,316
10,622,387 Scotia Global Low Volatility Equity LP Series I 111,616,568 135,914,5035,814,641 Scotia Private Emerging Markets Pool Series I 55,093,444 60,882,1943,774,202 Scotia Private Global Equity Pool Series I 56,579,050 85,587,9463,171,341 Scotia Private Global Real Estate Pool Series I 50,630,153 59,238,434
12,269,514 Scotia Private International Equity Pool Series I 146,077,053 167,226,1134,785,396 Scotia Private Options Income Pool Series I 47,851,644 47,931,4866,473,541 Scotia U.S. Dividend Growers LP Series I 85,241,572 85,912,307
10,876,902 Scotia U.S. Low Volatility Equity LP Series I 111,058,312 128,274,564
721,947,639 839,546,863
TOTAL INVESTMENT PORTFOLIO 1,535,798,061 1,694,526,933
OTHER ASSETS, LESS LIABILITIES – 1.8% 31,273,523
NET ASSETS – 100.0% 1,725,800,456
The accompanying notes are an integral part of the financial statements.
333
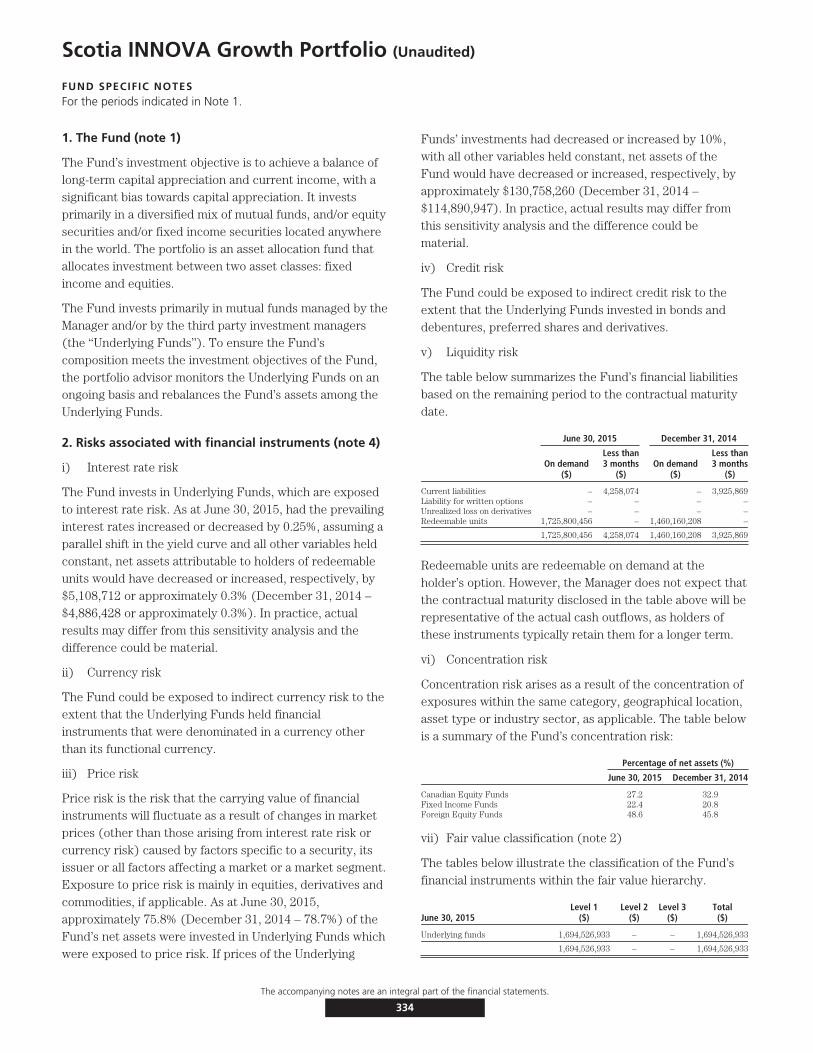
Scotia INNOVA Growth Portfolio (Unaudited)
FUND SPECIFIC NOTESFor the periods indicated in Note 1.
1. The Fund (note 1)
The Fund’s investment objective is to achieve a balance oflong-term capital appreciation and current income, with asignificant bias towards capital appreciation. It investsprimarily in a diversified mix of mutual funds, and/or equitysecurities and/or fixed income securities located anywherein the world. The portfolio is an asset allocation fund thatallocates investment between two asset classes: fixedincome and equities.
The Fund invests primarily in mutual funds managed by theManager and/or by the third party investment managers(the ‘‘Underlying Funds’’). To ensure the Fund’scomposition meets the investment objectives of the Fund,the portfolio advisor monitors the Underlying Funds on anongoing basis and rebalances the Fund’s assets among theUnderlying Funds.
2. Risks associated with financial instruments (note 4)
i) Interest rate risk
The Fund invests in Underlying Funds, which are exposedto interest rate risk. As at June 30, 2015, had the prevailinginterest rates increased or decreased by 0.25%, assuming aparallel shift in the yield curve and all other variables heldconstant, net assets attributable to holders of redeemableunits would have decreased or increased, respectively, by$5,108,712 or approximately 0.3% (December 31, 2014 –$4,886,428 or approximately 0.3%). In practice, actualresults may differ from this sensitivity analysis and thedifference could be material.
ii) Currency risk
The Fund could be exposed to indirect currency risk to theextent that the Underlying Funds held financialinstruments that were denominated in a currency otherthan its functional currency.
iii) Price risk
Price risk is the risk that the carrying value of financialinstruments will fluctuate as a result of changes in marketprices (other than those arising from interest rate risk orcurrency risk) caused by factors specific to a security, itsissuer or all factors affecting a market or a market segment.Exposure to price risk is mainly in equities, derivatives andcommodities, if applicable. As at June 30, 2015,approximately 75.8% (December 31, 2014 – 78.7%) of theFund’s net assets were invested in Underlying Funds whichwere exposed to price risk. If prices of the Underlying
Funds’ investments had decreased or increased by 10%,with all other variables held constant, net assets of theFund would have decreased or increased, respectively, byapproximately $130,758,260 (December 31, 2014 –$114,890,947). In practice, actual results may differ fromthis sensitivity analysis and the difference could bematerial.
iv) Credit risk
The Fund could be exposed to indirect credit risk to theextent that the Underlying Funds invested in bonds anddebentures, preferred shares and derivatives.
v) Liquidity risk
The table below summarizes the Fund’s financial liabilitiesbased on the remaining period to the contractual maturitydate.
June 30, 2015 December 31, 2014
On demand($)
Less than3 months
($)On demand
($)
Less than3 months
($)
Current liabilities – 4,258,074 – 3,925,869Liability for written options – – – –Unrealized loss on derivatives – – – –Redeemable units 1,725,800,456 – 1,460,160,208 –
1,725,800,456 4,258,074 1,460,160,208 3,925,869
Redeemable units are redeemable on demand at theholder’s option. However, the Manager does not expect thatthe contractual maturity disclosed in the table above will berepresentative of the actual cash outflows, as holders ofthese instruments typically retain them for a longer term.
vi) Concentration risk
Concentration risk arises as a result of the concentration ofexposures within the same category, geographical location,asset type or industry sector, as applicable. The table belowis a summary of the Fund’s concentration risk:
Percentage of net assets (%)
June 30, 2015 December 31, 2014
Canadian Equity Funds 27.2 32.9Fixed Income Funds 22.4 20.8Foreign Equity Funds 48.6 45.8
vii) Fair value classification (note 2)
The tables below illustrate the classification of the Fund’sfinancial instruments within the fair value hierarchy.
June 30, 2015Level 1
($)Level 2
($)Level 3
($)Total($)
Underlying funds 1,694,526,933 – – 1,694,526,933
1,694,526,933 – – 1,694,526,933
The accompanying notes are an integral part of the financial statements.
334

Scotia INNOVA Growth Portfolio (Unaudited – Continued)
FUND SPECIFIC NOTESFor the periods indicated in Note 1.
December 31, 2014Level 1
($)Level 2
($)Level 3
($)Total($)
Underlying funds 1,452,928,054 – – 1,452,928,054
1,452,928,054 – – 1,452,928,054
Transfers between levels
During the periods ended June 30, 2015 and December 31,2014, there were no significant transfers between Level 1and Level 2.
3. Offsetting of financial assets and liabilities (note 2)
As at June 30, 2015 or December 31, 2014, the Fund didnot enter into any agreement whereby the financialinstruments were eligible for offset.
4. Interest in Underlying Funds (note 2)
The following tables provide information about the Fund’sinterest in Underlying Funds.
June 30, 2015
Underlying Fund
Net asset value ofUnderlying Fund
($)
Carrying value ofUnderlying Fund
($)
Carrying value ofUnderlying Fundas a percentage
of net assets(%)
Scotia Private EmergingMarkets Pool Series I 205,863,313 60,882,194 3.5
Scotia U.S. DividendGrowers LP Series I 449,869,393 85,912,307 5.0
Scotia Floating RateIncome Fund Series I 718,598,958 21,468,383 1.2
1832 AM CanadianGrowth LP Series I 183,979,882 63,773,601 3.7
1832 AM CanadianDividend LP Series I 472,407,514 118,391,245 6.9
Scotia Private OptionsIncome Pool Series I 314,283,677 47,931,486 2.8
1832 AM North AmericanPreferred Share LPSeries I 282,558,754 42,813,409 2.5
Scotia Global LowVolatility Equity LPSeries I 809,239,005 135,914,503 7.9
Scotia U.S. Low VolatilityEquity LP Series I 794,087,591 128,274,564 7.4
1832 AM GlobalCompletion LP Series I 375,441,535 68,579,316 4.0
Scotia Total Return BondLP Series I 800,479,521 21,462,243 1.2
Scotia Private High YieldIncome Pool Series I 941,135,483 65,172,047 3.8
Scotia Private AmericanCore-Plus Bond PoolSeries I 694,441,762 64,130,433 3.7
Scotia Private CanadianSmall Cap Pool Series I 533,016,993 115,228,090 6.7
Scotia PrivateInternational EquityPool Series I 877,790,757 167,226,113 9.7
Scotia Private GlobalEquity Pool Series I 353,448,869 85,587,946 5.0
Scotia Private Global RealEstate Pool Series I 302,310,847 59,238,434 3.4
Scotia Canadian DividendFund Series I 7,324,836,052 127,829,388 7.4
Scotia Private CanadianCorporate Bond PoolSeries I 4,860,619,761 98,633,945 5.7
June 30, 2015
Underlying Fund
Net asset value ofUnderlying Fund
($)
Carrying value ofUnderlying Fund
($)
Carrying value ofUnderlying Fundas a percentage
of net assets(%)
Scotia Canadian IncomeFund Series I 5,950,709,764 116,077,286 6.7
1,694,526,933 98.2
December 31, 2014
Underlying Fund
Net asset value ofUnderlying Fund
($)
Carrying value ofUnderlying Fund
($)
Carrying value ofUnderlying Fundas a percentage
of net assets(%)
Scotia Private EmergingMarkets Pool Series I 172,517,483 51,188,450 3.5
Scotia Floating RateIncome Fund Series I 647,072,278 34,324,377 2.3
1832 AM North AmericanPreferred Share LPSeries I 368,540,953 46,325,184 3.2
Scotia Global LowVolatility Equity LPSeries I 604,457,652 113,445,869 7.8
Scotia U.S. Low VolatilityEquity LP Series I 910,655,223 145,095,795 9.9
1832 AM GlobalCompletion LP Series I 289,313,699 55,273,588 3.8
Scotia Private High YieldIncome Pool Series I 910,438,382 56,115,986 3.8
Scotia Private AmericanCore-Plus Bond PoolSeries I 628,345,246 66,634,211 4.6
Scotia Private CanadianGrowth Pool Series I 331,181,286 68,899,226 4.7
Scotia Private CanadianSmall Cap Pool Series I 538,492,305 108,561,019 7.4
Scotia Private U.S. ValuePool Series I 289,278,933 60,625,799 4.2
Scotia Private U.S. MidCap Growth PoolSeries I 173,925,451 45,904,310 3.1
Scotia PrivateInternational EquityPool Series I 600,735,759 84,616,360 5.8
Scotia Private GlobalEquity Pool Series I 459,739,970 74,736,325 5.1
Scotia Private Global RealEstate Pool Series I 273,276,031 37,666,384 2.6
Scotia Private CanadianEquity Pool Series I 1,014,747,384 101,745,520 7.0
Scotia Canadian DividendFund Series I 7,347,067,396 154,825,645 10.6
Scotia Canadian IncomeFund Series I 5,990,064,451 146,944,006 10.1
1,452,928,054 99.5
5. Comparison of net asset value per unit and netassets per unit (note 2)
The table below provides a comparison of the net assetvalue per unit and net assets per unit. The primary reasonfor the difference between the net asset value per unit andnet assets per unit, if any, is described in note 2.
June 30, 2015 December 31, 2014
Net asset valueper unit
($)
Net assetsper unit
($)
Net asset valueper unit
($)
Net assetsper unit
($)
Series A 17.25 17.25 16.58 16.58
The accompanying notes are an integral part of the financial statements.
335

Scotia INNOVA Maximum Growth Portfolio (Unaudited)
STATEMENTS OF FINANCIAL POSITIONAs at
June 30,2015
December 31,2014
ASSETSCurrent assetsInvestments
Non-derivative financial assets $490,243,805 $393,534,970Cash 9,871,086 3,553,271Subscriptions receivable 1,867,942 1,341,991Accrued investment income and other 8,219 2,383
501,991,052 398,432,615
LIABILITIESCurrent liabilitiesManagement fee payable 959,254 –Payable for securities purchased – 2,000,000Redemptions payable 703,617 128,454Accrued expenses 19,265 –Distributions payable – 18,480
1,682,136 2,146,934
Net assets attributable to holders of redeemable units $500,308,916 $396,285,681
NET ASSETS ATTRIBUTABLE TO HOLDERS OF REDEEMABLE UNITSPER SERIES
Series A $500,308,916 $396,285,681
NET ASSETS ATTRIBUTABLE TO HOLDERS OF REDEEMABLE UNITSPER UNIT
Series A $ 18.94 $ 17.95
STATEMENTS OF COMPREHENSIVE INCOMEFor the six month periods ended June 30,
2015 2014INCOMENet gain (loss) on investments (note 2)
Dividends $ 1,728,988 $ 573,001Interest for distribution purposes 775,455 453,530Net realized gain (loss) on non-derivative financial assets 27,362,518 13,707,712Change in unrealized gain (loss) on non-derivative financial assets (3,720,917) 4,642,267
Net gain (loss) on investments 26,146,044 19,376,510Other income 3,723 2,816
Total income (loss) 26,149,767 19,379,326
EXPENSESManagement fees (note 5) 4,622,646 2,838,211Fixed administration fees (note 6) 92,453 –Independent Review Committee fees 336 420Audit fees – 3,092Custodian fees – 1,033Filing fees – 11,984Legal fees – 910Unitholder administration costs – 23,554Unitholder reporting costs – 3,653Harmonized Sales Tax/Goods and Services Tax 442,779 266,709
Total expenses 5,158,214 3,149,566
Increase (decrease) in net assets attributable to holders of redeemableunits from operations $20,991,553 $16,229,760
INCREASE (DECREASE) IN NET ASSETS ATTRIBUTABLE TO HOLDERS OFREDEEMABLE UNITS FROM OPERATIONS PER SERIES
Series A $20,991,553 $16,229,760
INCREASE (DECREASE) IN NET ASSETS ATTRIBUTABLE TO HOLDERS OFREDEEMABLE UNITS FROM OPERATIONS PER UNIT†
Series A $ 0.86 $ 1.00
WEIGHTED AVERAGE NUMBER OF UNITS PER SERIESSeries A 24,501,431 16,282,596
† The increase (decrease) in net assets attributable to holders of redeemable units fromoperations per unit is calculated by dividing the increase (decrease) in net assetsattributable to holders of redeemable units from operations per series by the weightedaverage number of units per series.
STATEMENTS OF CHANGES IN NET ASSETSATTRIBUTABLE TO HOLDERS OF REDEEMABLE UNITSFor the six month periods ended June 30,
2015 2014NET ASSETS ATTRIBUTABLE TO HOLDERS OF REDEEMABLE UNITS,
BEGINNING OF PERIODSeries A $396,285,681 $233,548,583
INCREASE (DECREASE) IN NET ASSETS ATTRIBUTABLE TO HOLDERSOF REDEEMABLE UNITS FROM OPERATIONS
Series A 20,991,553 16,229,760
REDEEMABLE UNIT TRANSACTIONSProceeds from issue
Series A 113,600,456 100,990,976Payments on redemption
Series A (30,568,774) (16,075,701)
83,031,682 84,915,275
INCREASE (DECREASE) IN NET ASSETS ATTRIBUTABLE TO HOLDERSOF REDEEMABLE UNITS
Series A 104,023,235 101,145,035
NET ASSETS ATTRIBUTABLE TO HOLDERS OF REDEEMABLE UNITS,END OF PERIOD
Series A $500,308,916 $334,693,618
STATEMENTS OF CASH FLOWSFor the six month periods ended June 30,
2015 2014CASH FLOWS FROM OPERATING ACTIVITIESIncrease (decrease) in net assets attributable to holders of
redeemable units $ 20,991,553 $ 16,229,760Adjustments for:
Net realized (gain) loss on non-derivative financial assets (27,362,518) (13,707,712)Change in unrealized (gain) loss on non-derivative financial assets 3,720,917 (4,642,267)Purchases of non-derivative financial assets (235,675,856) (154,938,277)Proceeds from sale of non-derivative financial assets 160,608,622 72,570,188Accrued investment income and other (5,836) (545)Accrued expenses 978,519 621,050
Net cash provided by (used in) operating activities (76,744,599) (83,867,803)CASH FLOWS FROM FINANCING ACTIVITIESProceeds from issue of redeemable units 113,074,143 100,481,830Amounts paid on redemption of redeemable units (29,993,611) (15,993,016)Distributions to unitholders of redeemable units (18,118) –
Net cash provided by (used in) financing activities 83,062,414 84,488,814Net increase (decrease) in cash 6,317,815 621,011Cash (bank overdraft), beginning of period 3,553,271 2,197,165
CASH (BANK OVERDRAFT), END OF PERIOD $ 9,871,086 $ 2,818,176
Interest received(1) 769,619 452,985Dividends received, net of withholding taxes(1) 1,728,988 573,001
(1) Classified as operating items.
The accompanying notes are an integral part of the financial statements.
336
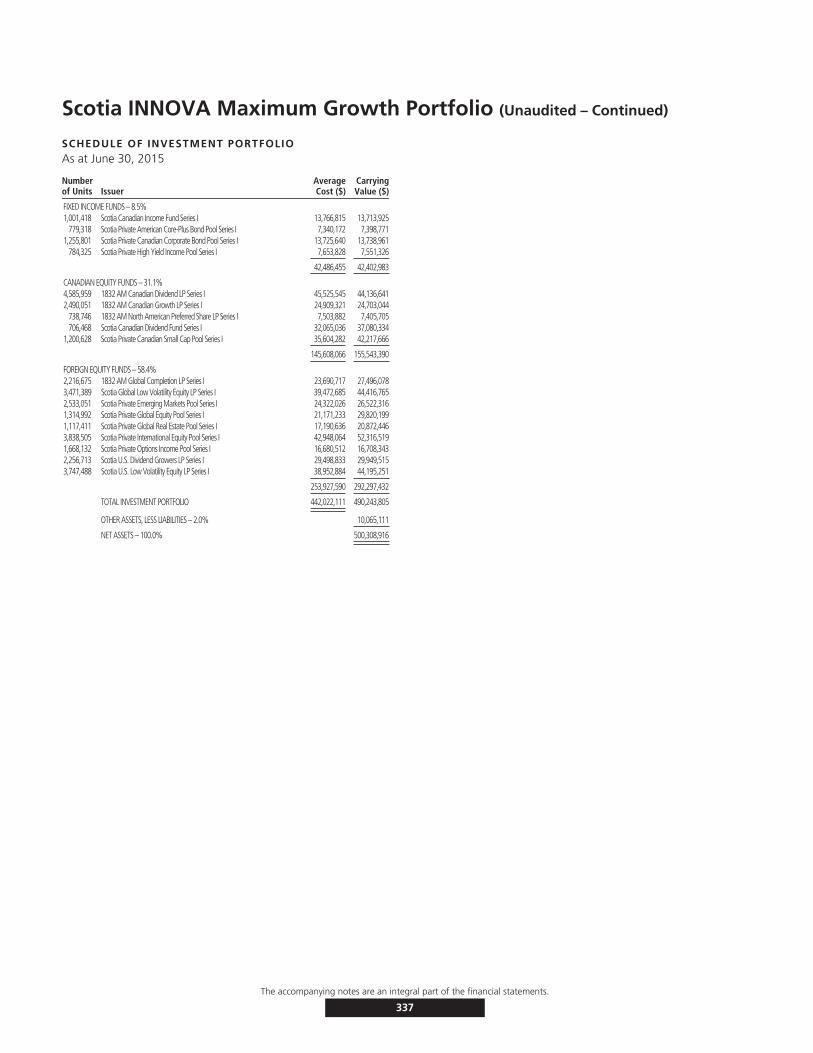
Scotia INNOVA Maximum Growth Portfolio (Unaudited – Continued)
SCHEDULE OF INVESTMENT PORTFOLIOAs at June 30, 2015
Numberof Units Issuer
AverageCost ($)
CarryingValue ($)
FIXED INCOME FUNDS – 8.5%1,001,418 Scotia Canadian Income Fund Series I 13,766,815 13,713,925
779,318 Scotia Private American Core-Plus Bond Pool Series I 7,340,172 7,398,7711,255,801 Scotia Private Canadian Corporate Bond Pool Series I 13,725,640 13,738,961
784,325 Scotia Private High Yield Income Pool Series I 7,653,828 7,551,326
42,486,455 42,402,983
CANADIAN EQUITY FUNDS – 31.1%4,585,959 1832 AM Canadian Dividend LP Series I 45,525,545 44,136,6412,490,051 1832 AM Canadian Growth LP Series I 24,909,321 24,703,044
738,746 1832 AM North American Preferred Share LP Series I 7,503,882 7,405,705706,468 Scotia Canadian Dividend Fund Series I 32,065,036 37,080,334
1,200,628 Scotia Private Canadian Small Cap Pool Series I 35,604,282 42,217,666
145,608,066 155,543,390
FOREIGN EQUITY FUNDS – 58.4%2,216,675 1832 AM Global Completion LP Series I 23,690,717 27,496,0783,471,389 Scotia Global Low Volatility Equity LP Series I 39,472,685 44,416,7652,533,051 Scotia Private Emerging Markets Pool Series I 24,322,026 26,522,3161,314,992 Scotia Private Global Equity Pool Series I 21,171,233 29,820,1991,117,411 Scotia Private Global Real Estate Pool Series I 17,190,636 20,872,4463,838,505 Scotia Private International Equity Pool Series I 42,948,064 52,316,5191,668,132 Scotia Private Options Income Pool Series I 16,680,512 16,708,3432,256,713 Scotia U.S. Dividend Growers LP Series I 29,498,833 29,949,5153,747,488 Scotia U.S. Low Volatility Equity LP Series I 38,952,884 44,195,251
253,927,590 292,297,432
TOTAL INVESTMENT PORTFOLIO 442,022,111 490,243,805
OTHER ASSETS, LESS LIABILITIES – 2.0% 10,065,111
NET ASSETS – 100.0% 500,308,916
The accompanying notes are an integral part of the financial statements.
337
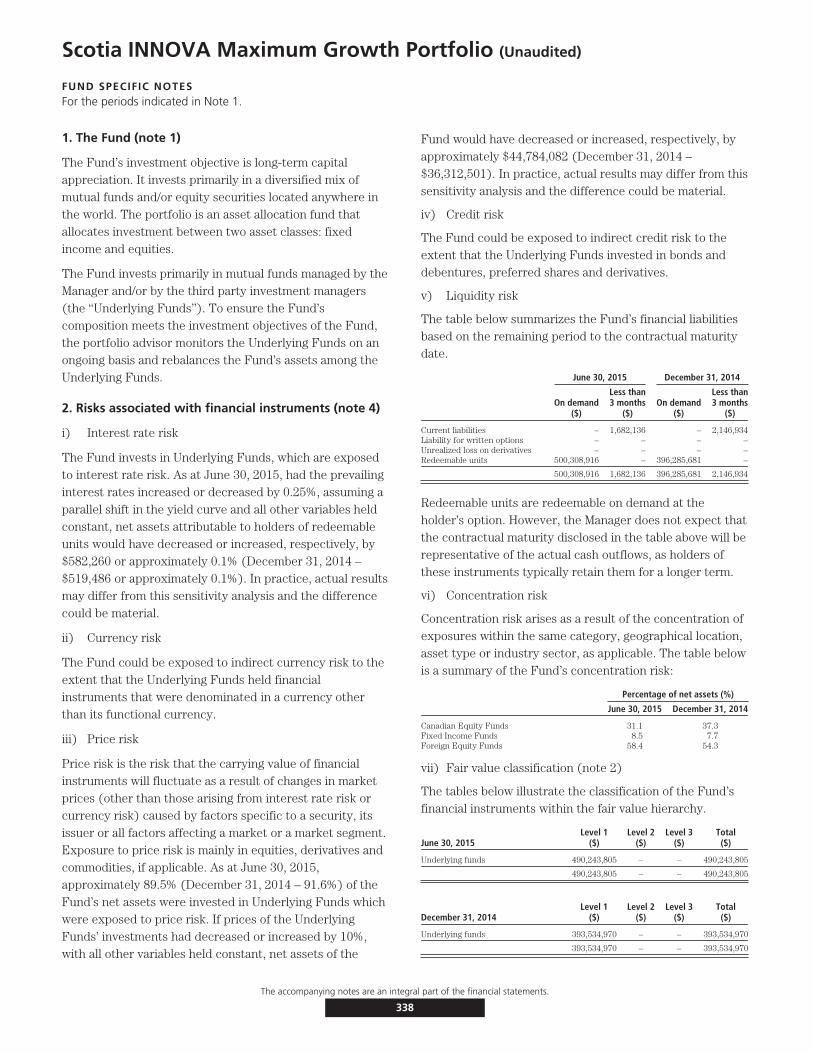
Scotia INNOVA Maximum Growth Portfolio (Unaudited)
FUND SPECIFIC NOTESFor the periods indicated in Note 1.
1. The Fund (note 1)
The Fund’s investment objective is long-term capitalappreciation. It invests primarily in a diversified mix ofmutual funds and/or equity securities located anywhere inthe world. The portfolio is an asset allocation fund thatallocates investment between two asset classes: fixedincome and equities.
The Fund invests primarily in mutual funds managed by theManager and/or by the third party investment managers(the ‘‘Underlying Funds’’). To ensure the Fund’scomposition meets the investment objectives of the Fund,the portfolio advisor monitors the Underlying Funds on anongoing basis and rebalances the Fund’s assets among theUnderlying Funds.
2. Risks associated with financial instruments (note 4)
i) Interest rate risk
The Fund invests in Underlying Funds, which are exposedto interest rate risk. As at June 30, 2015, had the prevailinginterest rates increased or decreased by 0.25%, assuming aparallel shift in the yield curve and all other variables heldconstant, net assets attributable to holders of redeemableunits would have decreased or increased, respectively, by$582,260 or approximately 0.1% (December 31, 2014 –$519,486 or approximately 0.1%). In practice, actual resultsmay differ from this sensitivity analysis and the differencecould be material.
ii) Currency risk
The Fund could be exposed to indirect currency risk to theextent that the Underlying Funds held financialinstruments that were denominated in a currency otherthan its functional currency.
iii) Price risk
Price risk is the risk that the carrying value of financialinstruments will fluctuate as a result of changes in marketprices (other than those arising from interest rate risk orcurrency risk) caused by factors specific to a security, itsissuer or all factors affecting a market or a market segment.Exposure to price risk is mainly in equities, derivatives andcommodities, if applicable. As at June 30, 2015,approximately 89.5% (December 31, 2014 – 91.6%) of theFund’s net assets were invested in Underlying Funds whichwere exposed to price risk. If prices of the UnderlyingFunds’ investments had decreased or increased by 10%,with all other variables held constant, net assets of the
Fund would have decreased or increased, respectively, byapproximately $44,784,082 (December 31, 2014 –$36,312,501). In practice, actual results may differ from thissensitivity analysis and the difference could be material.
iv) Credit risk
The Fund could be exposed to indirect credit risk to theextent that the Underlying Funds invested in bonds anddebentures, preferred shares and derivatives.
v) Liquidity risk
The table below summarizes the Fund’s financial liabilitiesbased on the remaining period to the contractual maturitydate.
June 30, 2015 December 31, 2014
On demand($)
Less than3 months
($)On demand
($)
Less than3 months
($)
Current liabilities – 1,682,136 – 2,146,934Liability for written options – – – –Unrealized loss on derivatives – – – –Redeemable units 500,308,916 – 396,285,681 –
500,308,916 1,682,136 396,285,681 2,146,934
Redeemable units are redeemable on demand at theholder’s option. However, the Manager does not expect thatthe contractual maturity disclosed in the table above will berepresentative of the actual cash outflows, as holders ofthese instruments typically retain them for a longer term.
vi) Concentration risk
Concentration risk arises as a result of the concentration ofexposures within the same category, geographical location,asset type or industry sector, as applicable. The table belowis a summary of the Fund’s concentration risk:
Percentage of net assets (%)
June 30, 2015 December 31, 2014
Canadian Equity Funds 31.1 37.3Fixed Income Funds 8.5 7.7Foreign Equity Funds 58.4 54.3
vii) Fair value classification (note 2)
The tables below illustrate the classification of the Fund’sfinancial instruments within the fair value hierarchy.
June 30, 2015Level 1
($)Level 2
($)Level 3
($)Total($)
Underlying funds 490,243,805 – – 490,243,805
490,243,805 – – 490,243,805
December 31, 2014Level 1
($)Level 2
($)Level 3
($)Total($)
Underlying funds 393,534,970 – – 393,534,970
393,534,970 – – 393,534,970
The accompanying notes are an integral part of the financial statements.
338

Scotia INNOVA Maximum Growth Portfolio (Unaudited – Continued)
FUND SPECIFIC NOTESFor the periods indicated in Note 1.
Transfers between levels
During the periods ended June 30, 2015 and December 31,2014, there were no significant transfers between Level 1and Level 2.
3. Offsetting of financial assets and liabilities (note 2)
As at June 30, 2015 or December 31, 2014, the Fund didnot enter into any agreement whereby the financialinstruments were eligible for offset.
4. Interest in Underlying Funds (note 2)
The following tables provide information about the Fund’sinterest in Underlying Funds.
June 30, 2015
Underlying Fund
Net asset value ofUnderlying Fund
($)
Carrying value ofUnderlying Fund
($)
Carrying value ofUnderlying Fundas a percentage
of net assets(%)
Scotia Private EmergingMarkets Pool Series I 205,863,313 26,522,316 5.3
Scotia U.S. DividendGrowers LP Series I 449,869,393 29,949,515 6.0
1832 AM CanadianGrowth LP Series I 183,979,882 24,703,044 4.9
1832 AM CanadianDividend LP Series I 472,407,514 44,136,641 8.8
Scotia Private OptionsIncome Pool Series I 314,283,677 16,708,343 3.3
1832 AM North AmericanPreferred Share LPSeries I 282,558,754 7,405,705 1.5
Scotia Global LowVolatility Equity LPSeries I 809,239,005 44,416,765 8.9
Scotia U.S. Low VolatilityEquity LP Series I 794,087,591 44,195,251 8.8
1832 AM GlobalCompletion LP Series I 375,441,535 27,496,078 5.5
Scotia Private High YieldIncome Pool Series I 941,135,483 7,551,326 1.5
Scotia Private AmericanCore-Plus Bond PoolSeries I 694,441,762 7,398,771 1.5
Scotia Private CanadianSmall Cap Pool Series I 533,016,993 42,217,666 8.4
Scotia PrivateInternational EquityPool Series I 877,790,757 52,316,519 10.6
Scotia Private GlobalEquity Pool Series I 353,448,869 29,820,199 6.0
Scotia Private Global RealEstate Pool Series I 302,310,847 20,872,446 4.2
Scotia Canadian DividendFund Series I 7,324,836,052 37,080,334 7.4
Scotia Private CanadianCorporate Bond PoolSeries I 4,860,619,761 13,738,961 2.7
Scotia Canadian IncomeFund Series I 5,950,709,764 13,713,925 2.7
490,243,805 98.0
December 31, 2014
Underlying Fund
Net asset value ofUnderlying Fund
($)
Carrying value ofUnderlying Fund
($)
Carrying value ofUnderlying Fundas a percentage
of net assets(%)
Scotia Private EmergingMarkets Pool Series I 172,517,483 19,811,054 5.0
1832 AM North AmericanPreferred Share LPSeries I 368,540,953 7,707,223 1.9
Scotia Global LowVolatility Equity LPSeries I 604,457,652 24,053,775 6.1
Scotia U.S. Low VolatilityEquity LP Series I 910,655,223 35,751,016 9.0
1832 AM GlobalCompletion LP Series I 289,313,699 19,748,340 5.0
Scotia Private HighYield Income PoolSeries I 910,438,382 8,564,243 2.2
Scotia Private AmericanCore-Plus Bond PoolSeries I 628,345,246 10,470,588 2.6
Scotia Private CanadianGrowth Pool Series I 331,181,286 33,795,924 8.5
Scotia Private CanadianSmall Cap Pool Series I 538,492,305 39,072,405 9.9
Scotia Private U.S. ValuePool Series I 289,278,933 22,324,358 5.6
Scotia Private U.S. MidCap Growth PoolSeries I 173,925,451 16,205,264 4.1
Scotia PrivateInternational EquityPool Series I 600,735,759 37,677,575 9.5
Scotia Private GlobalEquity Pool Series I 459,739,970 23,908,987 6.0
Scotia Private Global RealEstate Pool Series I 273,276,031 16,008,949 4.0
Scotia Private CanadianEquity Pool Series I 1,014,747,384 19,623,650 5.0
Scotia Canadian DividendFund Series I 7,347,067,396 47,436,492 12.0
Scotia Canadian IncomeFund Series I 5,990,064,451 11,375,127 2.9
393,534,970 99.3
5. Comparison of net asset value per unit and netassets per unit (note 2)
The table below provides a comparison of the net assetvalue per unit and net assets per unit. The primary reasonfor the difference between the net asset value per unit andnet assets per unit, if any, is described in note 2.
June 30, 2015 December 31, 2014
Net asset valueper unit
($)
Net assetsper unit
($)
Net asset valueper unit
($)
Net assetsper unit
($)
Series A 18.94 18.94 17.95 17.95
The accompanying notes are an integral part of the financial statements.
339

Scotia Aria Conservative Build Portfolio (Unaudited)
STATEMENTS OF FINANCIAL POSITIONAs at
June 30,2015
December 31,2014
ASSETSCurrent assetsInvestments
Non-derivative financial assets $9,483,625 $1,557,957Cash 187,128 26,620Subscriptions receivable 268,712 225,000Accrued investment income and other 152 62
9,939,617 1,809,639
LIABILITIESCurrent liabilitiesManagement fee payable 12,874 –Payable for securities purchased 181,200 219,918Accrued expenses 882 –
194,956 219,918
Net assets attributable to holders of redeemable units $9,744,661 $1,589,721
NET ASSETS ATTRIBUTABLE TO HOLDERS OF REDEEMABLE UNITSPER SERIES
Series A $5,821,973 $ 944,088Premium Series $3,922,688 $ 645,633
NET ASSETS ATTRIBUTABLE TO HOLDERS OF REDEEMABLE UNITSPER UNIT
Series A $ 10.16 $ 9.90Premium Series $ 10.19 $ 9.92
STATEMENT OF COMPREHENSIVE INCOMEFor the six month period ended June 30,
2015*INCOMENet gain (loss) on investments (note 2)
Dividends $ 21,644Interest for distribution purposes 90,155Capital gains distributions received 27,731Net realized gain (loss) on non-derivative financial assets 16,970Change in unrealized gain (loss) on non-derivative financial assets (56,825)
Net gain (loss) on investments 99,675
Total income (loss) 99,675
EXPENSESManagement fees (note 5) 46,075Fixed administration fees (note 6) 3,146Independent Review Committee fees 4Interest expense and bank overdraft charges 6Harmonized Sales Tax/Goods and Services Tax 5,452
Total expenses 54,683
Increase (decrease) in net assets attributable to holders of redeemable units from operations $ 44,992
INCREASE (DECREASE) IN NET ASSETS ATTRIBUTABLE TO HOLDERS OF REDEEMABLE UNITSFROM OPERATIONS PER SERIES
Series A $ 29,998Premium Series $ 14,994
INCREASE (DECREASE) IN NET ASSETS ATTRIBUTABLE TO HOLDERS OF REDEEMABLE UNITSFROM OPERATIONS PER UNIT†
Series A $ 0.08Premium Series $ 0.07
WEIGHTED AVERAGE NUMBER OF UNITS PER SERIESSeries A 398,361Premium Series 226,896
† The increase (decrease) in net assets attributable to holders of redeemable units fromoperations per unit is calculated by dividing the increase (decrease) in net assetsattributable to holders of redeemable units from operations per series by the weightedaverage number of units per series.
STATEMENT OF CHANGES IN NET ASSETSATTRIBUTABLE TO HOLDERS OF REDEEMABLE UNITSFor the six month period ended June 30,
2015*NET ASSETS ATTRIBUTABLE TO HOLDERS OF REDEEMABLE UNITS, BEGINNING OF
PERIODSeries A $ 944,088Premium Series 645,633
1,589,721
INCREASE (DECREASE) IN NET ASSETS ATTRIBUTABLE TO HOLDERS OF REDEEMABLEUNITS FROM OPERATIONS
Series A 29,998Premium Series 14,994
44,992
REDEEMABLE UNIT TRANSACTIONSProceeds from issue
Series A 5,234,344Premium Series 3,292,061
Payments on redemptionSeries A (386,457)Premium Series (30,000)
8,109,948
INCREASE (DECREASE) IN NET ASSETS ATTRIBUTABLE TO HOLDERS OF REDEEMABLE UNITSSeries A 4,877,885Premium Series 3,277,055
8,154,940
NET ASSETS ATTRIBUTABLE TO HOLDERS OF REDEEMABLE UNITS, END OF PERIODSeries A 5,821,973Premium Series 3,922,688
$9,744,661
STATEMENT OF CASH FLOWSFor the six month period ended June 30,
2015*CASH FLOWS FROM OPERATING ACTIVITIESIncrease (decrease) in net assets attributable to holders of redeemable units $ 44,992Adjustments for:
Net realized (gain) loss on non-derivative financial assets (16,970)Change in unrealized (gain) loss on non-derivative financial assets 56,825Purchases of non-derivative financial assets (8,801,861)Proceeds from sale of non-derivative financial assets 797,619Accrued investment income and other (90)Accrued expenses 13,756
Net cash provided by (used in) operating activities (7,905,729)CASH FLOWS FROM FINANCING ACTIVITIESProceeds from issue of redeemable units 8,482,694Amounts paid on redemption of redeemable units (416,457)Net cash provided by (used in) financing activities 8,066,237Net increase (decrease) in cash 160,508Cash (bank overdraft), beginning of period 26,620
CASH (BANK OVERDRAFT), END OF PERIOD $ 187,128
Interest paid(1) 6Interest received(1) 90,065Dividends received, net of withholding taxes(1) 21,644
(1) Classified as operating items.* No comparative figures are shown as the Fund’s inception date was November 19,
2014.
The accompanying notes are an integral part of the financial statements.
340
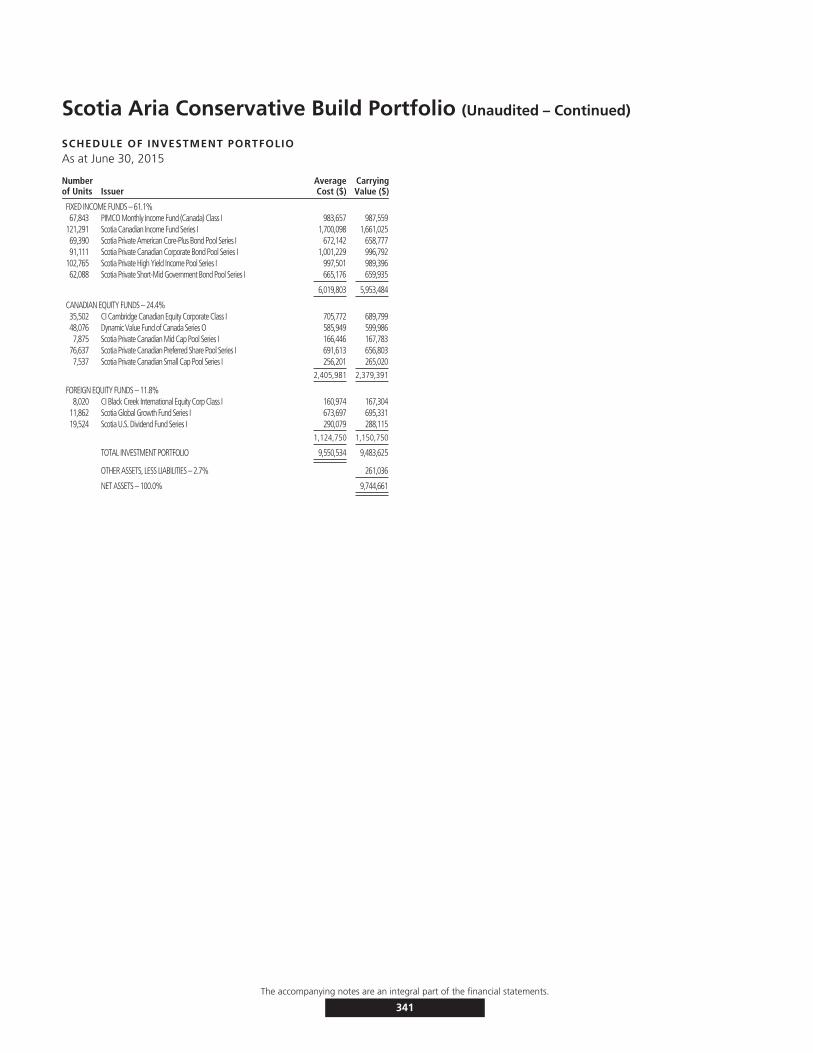
Scotia Aria Conservative Build Portfolio (Unaudited – Continued)
SCHEDULE OF INVESTMENT PORTFOLIOAs at June 30, 2015
Numberof Units Issuer
AverageCost ($)
CarryingValue ($)
FIXED INCOME FUNDS – 61.1%67,843 PIMCO Monthly Income Fund (Canada) Class I 983,657 987,559
121,291 Scotia Canadian Income Fund Series I 1,700,098 1,661,02569,390 Scotia Private American Core-Plus Bond Pool Series I 672,142 658,77791,111 Scotia Private Canadian Corporate Bond Pool Series I 1,001,229 996,792
102,765 Scotia Private High Yield Income Pool Series I 997,501 989,39662,088 Scotia Private Short-Mid Government Bond Pool Series I 665,176 659,935
6,019,803 5,953,484
CANADIAN EQUITY FUNDS – 24.4%35,502 CI Cambridge Canadian Equity Corporate Class I 705,772 689,79948,076 Dynamic Value Fund of Canada Series O 585,949 599,9867,875 Scotia Private Canadian Mid Cap Pool Series I 166,446 167,783
76,637 Scotia Private Canadian Preferred Share Pool Series I 691,613 656,8037,537 Scotia Private Canadian Small Cap Pool Series I 256,201 265,020
2,405,981 2,379,391
FOREIGN EQUITY FUNDS – 11.8%8,020 CI Black Creek International Equity Corp Class I 160,974 167,304
11,862 Scotia Global Growth Fund Series I 673,697 695,33119,524 Scotia U.S. Dividend Fund Series I 290,079 288,115
1,124,750 1,150,750
TOTAL INVESTMENT PORTFOLIO 9,550,534 9,483,625
OTHER ASSETS, LESS LIABILITIES – 2.7% 261,036
NET ASSETS – 100.0% 9,744,661
The accompanying notes are an integral part of the financial statements.
341
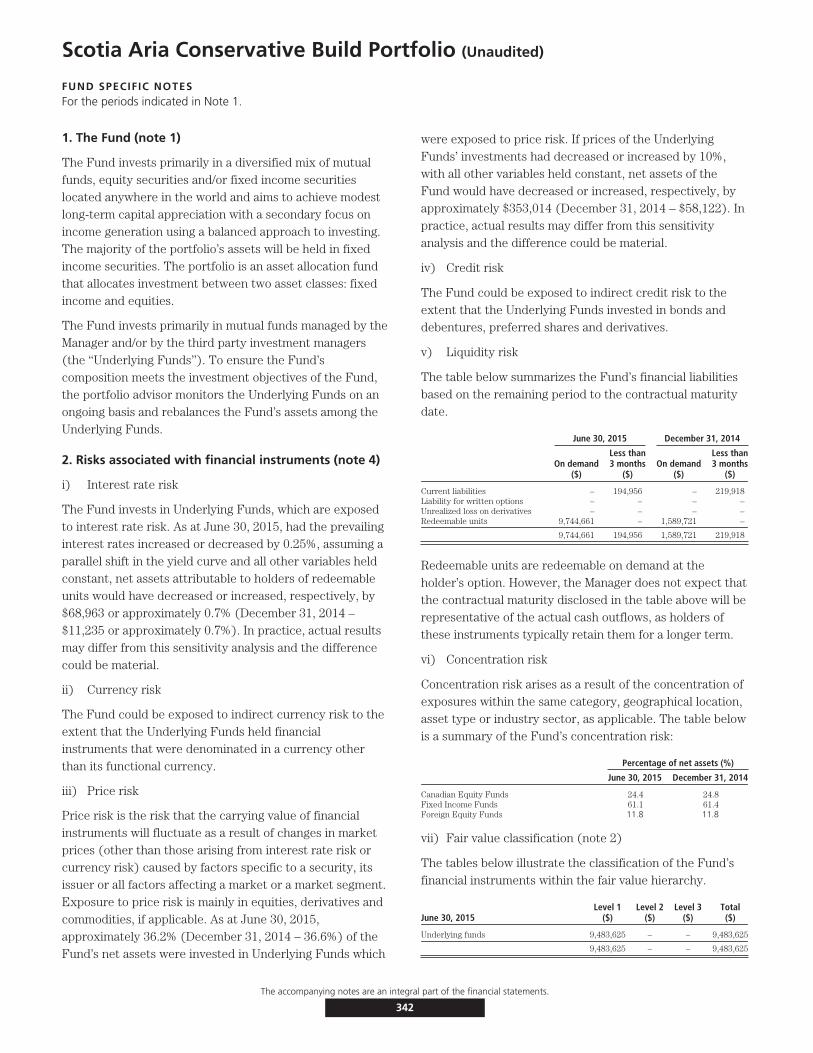
Scotia Aria Conservative Build Portfolio (Unaudited)
FUND SPECIFIC NOTESFor the periods indicated in Note 1.
1. The Fund (note 1)
The Fund invests primarily in a diversified mix of mutualfunds, equity securities and/or fixed income securitieslocated anywhere in the world and aims to achieve modestlong-term capital appreciation with a secondary focus onincome generation using a balanced approach to investing.The majority of the portfolio’s assets will be held in fixedincome securities. The portfolio is an asset allocation fundthat allocates investment between two asset classes: fixedincome and equities.
The Fund invests primarily in mutual funds managed by theManager and/or by the third party investment managers(the ‘‘Underlying Funds’’). To ensure the Fund’scomposition meets the investment objectives of the Fund,the portfolio advisor monitors the Underlying Funds on anongoing basis and rebalances the Fund’s assets among theUnderlying Funds.
2. Risks associated with financial instruments (note 4)
i) Interest rate risk
The Fund invests in Underlying Funds, which are exposedto interest rate risk. As at June 30, 2015, had the prevailinginterest rates increased or decreased by 0.25%, assuming aparallel shift in the yield curve and all other variables heldconstant, net assets attributable to holders of redeemableunits would have decreased or increased, respectively, by$68,963 or approximately 0.7% (December 31, 2014 –$11,235 or approximately 0.7%). In practice, actual resultsmay differ from this sensitivity analysis and the differencecould be material.
ii) Currency risk
The Fund could be exposed to indirect currency risk to theextent that the Underlying Funds held financialinstruments that were denominated in a currency otherthan its functional currency.
iii) Price risk
Price risk is the risk that the carrying value of financialinstruments will fluctuate as a result of changes in marketprices (other than those arising from interest rate risk orcurrency risk) caused by factors specific to a security, itsissuer or all factors affecting a market or a market segment.Exposure to price risk is mainly in equities, derivatives andcommodities, if applicable. As at June 30, 2015,approximately 36.2% (December 31, 2014 – 36.6%) of theFund’s net assets were invested in Underlying Funds which
were exposed to price risk. If prices of the UnderlyingFunds’ investments had decreased or increased by 10%,with all other variables held constant, net assets of theFund would have decreased or increased, respectively, byapproximately $353,014 (December 31, 2014 – $58,122). Inpractice, actual results may differ from this sensitivityanalysis and the difference could be material.
iv) Credit risk
The Fund could be exposed to indirect credit risk to theextent that the Underlying Funds invested in bonds anddebentures, preferred shares and derivatives.
v) Liquidity risk
The table below summarizes the Fund’s financial liabilitiesbased on the remaining period to the contractual maturitydate.
June 30, 2015 December 31, 2014
On demand($)
Less than3 months
($)On demand
($)
Less than3 months
($)
Current liabilities – 194,956 – 219,918Liability for written options – – – –Unrealized loss on derivatives – – – –Redeemable units 9,744,661 – 1,589,721 –
9,744,661 194,956 1,589,721 219,918
Redeemable units are redeemable on demand at theholder’s option. However, the Manager does not expect thatthe contractual maturity disclosed in the table above will berepresentative of the actual cash outflows, as holders ofthese instruments typically retain them for a longer term.
vi) Concentration risk
Concentration risk arises as a result of the concentration ofexposures within the same category, geographical location,asset type or industry sector, as applicable. The table belowis a summary of the Fund’s concentration risk:
Percentage of net assets (%)
June 30, 2015 December 31, 2014
Canadian Equity Funds 24.4 24.8Fixed Income Funds 61.1 61.4Foreign Equity Funds 11.8 11.8
vii) Fair value classification (note 2)
The tables below illustrate the classification of the Fund’sfinancial instruments within the fair value hierarchy.
June 30, 2015Level 1
($)Level 2
($)Level 3
($)Total($)
Underlying funds 9,483,625 – – 9,483,625
9,483,625 – – 9,483,625
The accompanying notes are an integral part of the financial statements.
342
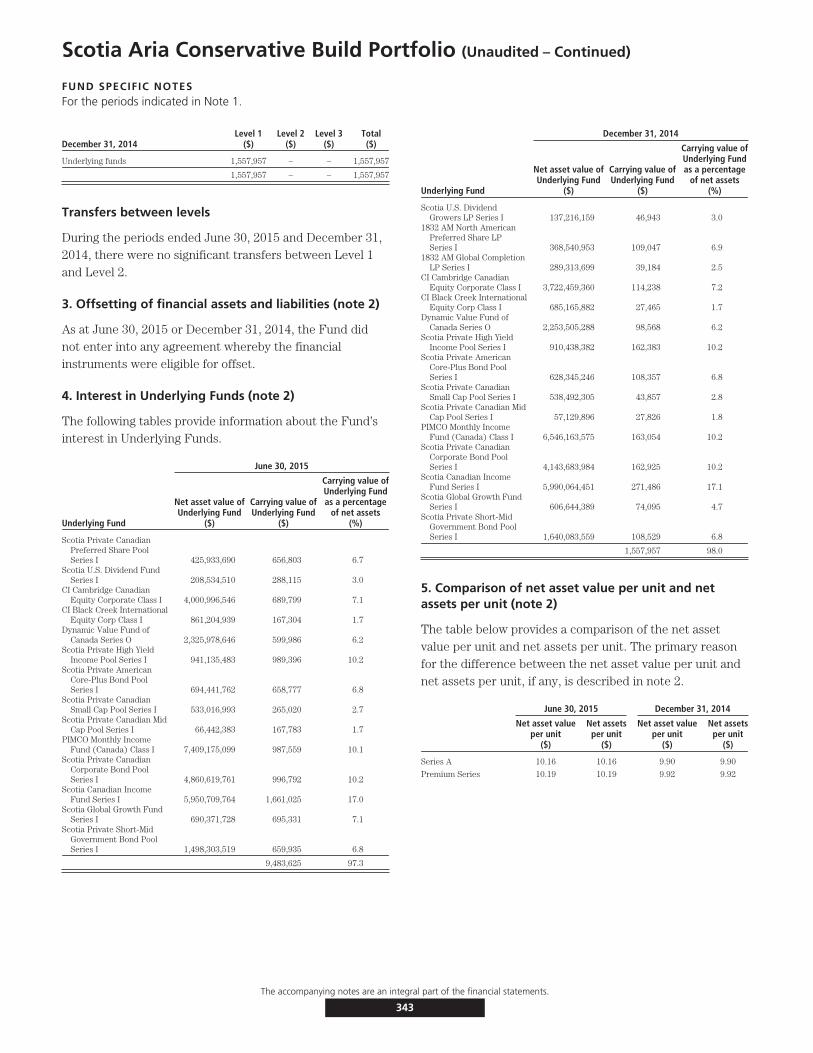
Scotia Aria Conservative Build Portfolio (Unaudited – Continued)
FUND SPECIFIC NOTESFor the periods indicated in Note 1.
December 31, 2014Level 1
($)Level 2
($)Level 3
($)Total($)
Underlying funds 1,557,957 – – 1,557,957
1,557,957 – – 1,557,957
Transfers between levels
During the periods ended June 30, 2015 and December 31,2014, there were no significant transfers between Level 1and Level 2.
3. Offsetting of financial assets and liabilities (note 2)
As at June 30, 2015 or December 31, 2014, the Fund didnot enter into any agreement whereby the financialinstruments were eligible for offset.
4. Interest in Underlying Funds (note 2)
The following tables provide information about the Fund’sinterest in Underlying Funds.
June 30, 2015
Underlying Fund
Net asset value ofUnderlying Fund
($)
Carrying value ofUnderlying Fund
($)
Carrying value ofUnderlying Fundas a percentage
of net assets(%)
Scotia Private CanadianPreferred Share PoolSeries I 425,933,690 656,803 6.7
Scotia U.S. Dividend FundSeries I 208,534,510 288,115 3.0
CI Cambridge CanadianEquity Corporate Class I 4,000,996,546 689,799 7.1
CI Black Creek InternationalEquity Corp Class I 861,204,939 167,304 1.7
Dynamic Value Fund ofCanada Series O 2,325,978,646 599,986 6.2
Scotia Private High YieldIncome Pool Series I 941,135,483 989,396 10.2
Scotia Private AmericanCore-Plus Bond PoolSeries I 694,441,762 658,777 6.8
Scotia Private CanadianSmall Cap Pool Series I 533,016,993 265,020 2.7
Scotia Private Canadian MidCap Pool Series I 66,442,383 167,783 1.7
PIMCO Monthly IncomeFund (Canada) Class I 7,409,175,099 987,559 10.1
Scotia Private CanadianCorporate Bond PoolSeries I 4,860,619,761 996,792 10.2
Scotia Canadian IncomeFund Series I 5,950,709,764 1,661,025 17.0
Scotia Global Growth FundSeries I 690,371,728 695,331 7.1
Scotia Private Short-MidGovernment Bond PoolSeries I 1,498,303,519 659,935 6.8
9,483,625 97.3
December 31, 2014
Underlying Fund
Net asset value ofUnderlying Fund
($)
Carrying value ofUnderlying Fund
($)
Carrying value ofUnderlying Fundas a percentage
of net assets(%)
Scotia U.S. DividendGrowers LP Series I 137,216,159 46,943 3.0
1832 AM North AmericanPreferred Share LPSeries I 368,540,953 109,047 6.9
1832 AM Global CompletionLP Series I 289,313,699 39,184 2.5
CI Cambridge CanadianEquity Corporate Class I 3,722,459,360 114,238 7.2
CI Black Creek InternationalEquity Corp Class I 685,165,882 27,465 1.7
Dynamic Value Fund ofCanada Series O 2,253,505,288 98,568 6.2
Scotia Private High YieldIncome Pool Series I 910,438,382 162,383 10.2
Scotia Private AmericanCore-Plus Bond PoolSeries I 628,345,246 108,357 6.8
Scotia Private CanadianSmall Cap Pool Series I 538,492,305 43,857 2.8
Scotia Private Canadian MidCap Pool Series I 57,129,896 27,826 1.8
PIMCO Monthly IncomeFund (Canada) Class I 6,546,163,575 163,054 10.2
Scotia Private CanadianCorporate Bond PoolSeries I 4,143,683,984 162,925 10.2
Scotia Canadian IncomeFund Series I 5,990,064,451 271,486 17.1
Scotia Global Growth FundSeries I 606,644,389 74,095 4.7
Scotia Private Short-MidGovernment Bond PoolSeries I 1,640,083,559 108,529 6.8
1,557,957 98.0
5. Comparison of net asset value per unit and netassets per unit (note 2)
The table below provides a comparison of the net assetvalue per unit and net assets per unit. The primary reasonfor the difference between the net asset value per unit andnet assets per unit, if any, is described in note 2.
June 30, 2015 December 31, 2014
Net asset valueper unit
($)
Net assetsper unit
($)
Net asset valueper unit
($)
Net assetsper unit
($)
Series A 10.16 10.16 9.90 9.90
Premium Series 10.19 10.19 9.92 9.92
The accompanying notes are an integral part of the financial statements.
343

Scotia Aria Conservative Core Portfolio (Unaudited)
STATEMENTS OF FINANCIAL POSITIONAs at
June 30,2015
December 31,2014
ASSETSCurrent assetsInvestments
Non-derivative financial assets $41,363,468 $5,334,766Cash 864,483 730,230Subscriptions receivable 851,241 515,000Accrued investment income and other 643 245
43,079,835 6,580,241
LIABILITIESCurrent liabilitiesManagement fee payable 55,547 –Payable for securities purchased 811,000 1,136,000Redemptions payable 3,950 –Accrued expenses 3,828 –Distributions payable 13,579 2,969
887,904 1,138,969
Net assets attributable to holders of redeemable units $42,191,931 $5,441,272
NET ASSETS ATTRIBUTABLE TO HOLDERS OF REDEEMABLE UNITS PERSERIES
Series A $19,910,306 $2,598,938Series T $ 888,079 $ 111,079Series TH $ 1,260,912 $ 123,402Series TL $ 50,660 $ 5,020Premium Series $15,803,419 $2,183,062Premium T Series $ 1,847,049 $ 224,748Premium TH Series $ 1,040,872 $ 5,022Premium TL Series $ 1,390,634 $ 190,001
NET ASSETS ATTRIBUTABLE TO HOLDERS OF REDEEMABLE UNITS PERUNIT
Series A $ 10.13 $ 9.96Series T $ 14.93 $ 14.99Series TH $ 14.79 $ 14.96Series TL $ 15.09 $ 14.98Premium Series $ 10.13 $ 9.95Premium T Series $ 14.94 $ 14.99Premium TH Series $ 14.84 $ 14.95Premium TL Series $ 15.06 $ 14.91
STATEMENT OF COMPREHENSIVE INCOMEFor the six month period ended June 30,
2015*INCOMENet gain (loss) on investments (note 2)
Dividends $ 45,697Interest for distribution purposes 430,760Capital gains distributions received 55,202Change in unrealized gain (loss) on non-derivative financial assets (285,247)
Net gain (loss) on investments 246,412Other income 146
Total income (loss) 246,558
EXPENSESManagement fees (note 5) 184,084Fixed administration fees (note 6) 12,658Independent Review Committee fees 15Harmonized Sales Tax/Goods and Services Tax 20,821
Total expenses 217,578
Increase (decrease) in net assets attributable to holders of redeemable units from operations $ 28,980
INCREASE (DECREASE) IN NET ASSETS ATTRIBUTABLE TO HOLDERS OF REDEEMABLEUNITS FROM OPERATIONS PER SERIES
Series A $ 24,440Series T $ (1,376)Series TH $ (2,740)Series TL $ 867Premium Series $ 13,975Premium T Series $ 3,492Premium TH Series $ (4,151)Premium TL Series $ (5,527)
INCREASE (DECREASE) IN NET ASSETS ATTRIBUTABLE TO HOLDERS OF REDEEMABLEUNITS FROM OPERATIONS PER UNIT†
Series A $ 0.02Series T $ (0.04)Series TH $ (0.06)Series TL $ 0.27Premium Series $ 0.02Premium T Series $ 0.05Premium TH Series $ (0.13)Premium TL Series $ (0.12)
WEIGHTED AVERAGE NUMBER OF UNITS PER SERIESSeries A 1,264,154Series T 34,882Series TH 43,452Series TL 3,154Premium Series 922,957Premium T Series 73,185Premium TH Series 31,961Premium TL Series 44,295
† The increase (decrease) in net assets attributable to holders of redeemable units fromoperations per unit is calculated by dividing the increase (decrease) in net assetsattributable to holders of redeemable units from operations per series by the weightedaverage number of units per series.
The accompanying notes are an integral part of the financial statements.
344
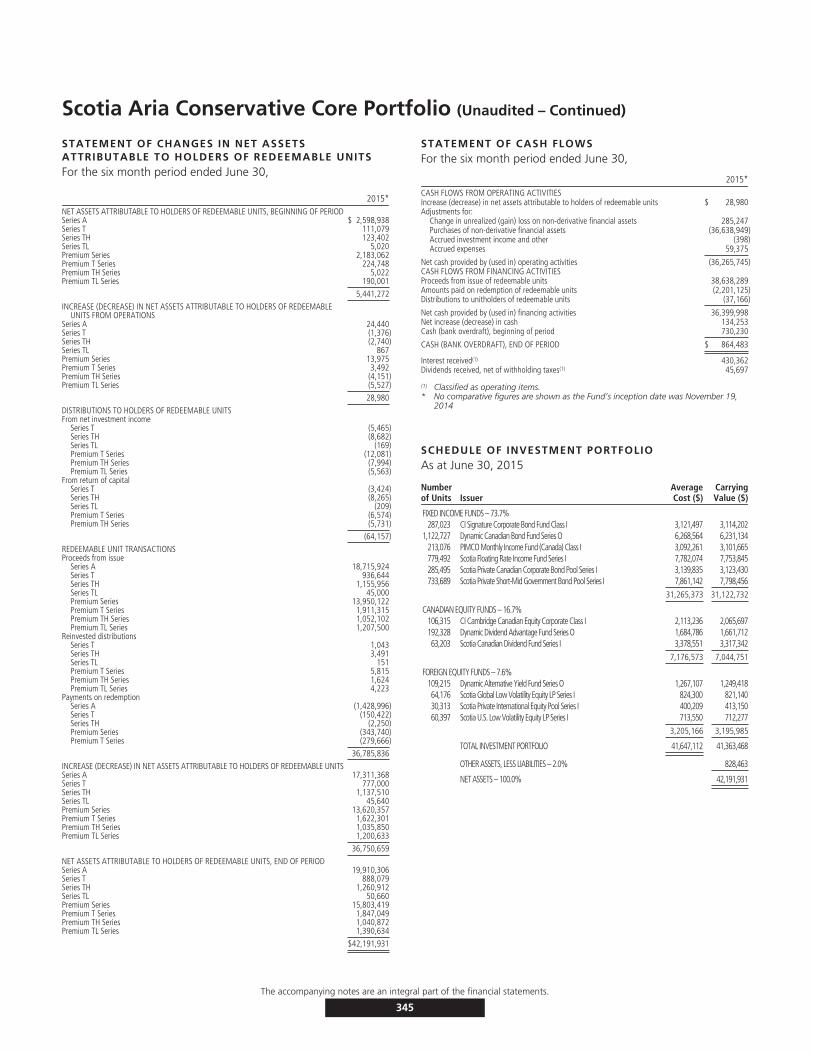
Scotia Aria Conservative Core Portfolio (Unaudited – Continued)
STATEMENT OF CHANGES IN NET ASSETSATTRIBUTABLE TO HOLDERS OF REDEEMABLE UNITSFor the six month period ended June 30,
2015*NET ASSETS ATTRIBUTABLE TO HOLDERS OF REDEEMABLE UNITS, BEGINNING OF PERIODSeries A $ 2,598,938Series T 111,079Series TH 123,402Series TL 5,020Premium Series 2,183,062Premium T Series 224,748Premium TH Series 5,022Premium TL Series 190,001
5,441,272
INCREASE (DECREASE) IN NET ASSETS ATTRIBUTABLE TO HOLDERS OF REDEEMABLEUNITS FROM OPERATIONS
Series A 24,440Series T (1,376)Series TH (2,740)Series TL 867Premium Series 13,975Premium T Series 3,492Premium TH Series (4,151)Premium TL Series (5,527)
28,980
DISTRIBUTIONS TO HOLDERS OF REDEEMABLE UNITSFrom net investment income
Series T (5,465)Series TH (8,682)Series TL (169)Premium T Series (12,081)Premium TH Series (7,994)Premium TL Series (5,563)
From return of capitalSeries T (3,424)Series TH (8,265)Series TL (209)Premium T Series (6,574)Premium TH Series (5,731)
(64,157)
REDEEMABLE UNIT TRANSACTIONSProceeds from issue
Series A 18,715,924Series T 936,644Series TH 1,155,956Series TL 45,000Premium Series 13,950,122Premium T Series 1,911,315Premium TH Series 1,052,102Premium TL Series 1,207,500
Reinvested distributionsSeries T 1,043Series TH 3,491Series TL 151Premium T Series 5,815Premium TH Series 1,624Premium TL Series 4,223
Payments on redemptionSeries A (1,428,996)Series T (150,422)Series TH (2,250)Premium Series (343,740)Premium T Series (279,666)
36,785,836
INCREASE (DECREASE) IN NET ASSETS ATTRIBUTABLE TO HOLDERS OF REDEEMABLE UNITSSeries A 17,311,368Series T 777,000Series TH 1,137,510Series TL 45,640Premium Series 13,620,357Premium T Series 1,622,301Premium TH Series 1,035,850Premium TL Series 1,200,633
36,750,659
NET ASSETS ATTRIBUTABLE TO HOLDERS OF REDEEMABLE UNITS, END OF PERIODSeries A 19,910,306Series T 888,079Series TH 1,260,912Series TL 50,660Premium Series 15,803,419Premium T Series 1,847,049Premium TH Series 1,040,872Premium TL Series 1,390,634
$42,191,931
STATEMENT OF CASH FLOWSFor the six month period ended June 30,
2015*CASH FLOWS FROM OPERATING ACTIVITIESIncrease (decrease) in net assets attributable to holders of redeemable units $ 28,980Adjustments for:
Change in unrealized (gain) loss on non-derivative financial assets 285,247Purchases of non-derivative financial assets (36,638,949)Accrued investment income and other (398)Accrued expenses 59,375
Net cash provided by (used in) operating activities (36,265,745)CASH FLOWS FROM FINANCING ACTIVITIESProceeds from issue of redeemable units 38,638,289Amounts paid on redemption of redeemable units (2,201,125)Distributions to unitholders of redeemable units (37,166)
Net cash provided by (used in) financing activities 36,399,998Net increase (decrease) in cash 134,253Cash (bank overdraft), beginning of period 730,230
CASH (BANK OVERDRAFT), END OF PERIOD $ 864,483
Interest received(1) 430,362Dividends received, net of withholding taxes(1) 45,697
(1) Classified as operating items.* No comparative figures are shown as the Fund’s inception date was November 19,
2014
SCHEDULE OF INVESTMENT PORTFOLIOAs at June 30, 2015
Numberof Units Issuer
AverageCost ($)
CarryingValue ($)
FIXED INCOME FUNDS – 73.7%287,023 CI Signature Corporate Bond Fund Class I 3,121,497 3,114,202
1,122,727 Dynamic Canadian Bond Fund Series O 6,268,564 6,231,134213,076 PIMCO Monthly Income Fund (Canada) Class I 3,092,261 3,101,665779,492 Scotia Floating Rate Income Fund Series I 7,782,074 7,753,845285,495 Scotia Private Canadian Corporate Bond Pool Series I 3,139,835 3,123,430733,689 Scotia Private Short-Mid Government Bond Pool Series I 7,861,142 7,798,456
31,265,373 31,122,732
CANADIAN EQUITY FUNDS – 16.7%106,315 CI Cambridge Canadian Equity Corporate Class I 2,113,236 2,065,697192,328 Dynamic Dividend Advantage Fund Series O 1,684,786 1,661,71263,203 Scotia Canadian Dividend Fund Series I 3,378,551 3,317,342
7,176,573 7,044,751
FOREIGN EQUITY FUNDS – 7.6%109,215 Dynamic Alternative Yield Fund Series O 1,267,107 1,249,41864,176 Scotia Global Low Volatility Equity LP Series I 824,300 821,14030,313 Scotia Private International Equity Pool Series I 400,209 413,15060,397 Scotia U.S. Low Volatility Equity LP Series I 713,550 712,277
3,205,166 3,195,985
TOTAL INVESTMENT PORTFOLIO 41,647,112 41,363,468
OTHER ASSETS, LESS LIABILITIES – 2.0% 828,463
NET ASSETS – 100.0% 42,191,931
The accompanying notes are an integral part of the financial statements.
345

Scotia Aria Conservative Core Portfolio (Unaudited)
FUND SPECIFIC NOTESFor the periods indicated in Note 1.
1. The Fund (note 1)
The Fund invests primarily in a diversified mix of mutualfunds, equity securities and/or fixed income securitieslocated anywhere in the world and aims to achieve modestlong-term capital appreciation using a balanced approach toinvesting through investments that the portfolio advisorassesses to be less volatile than that of broad markets. Themajority of the portfolio’s assets will be held in fixed incomesecurities. The portfolio is an asset allocation fund thatallocates investment between two asset classes: fixedincome and equities.
The Fund invests primarily in mutual funds managed by theManager and/or by the third party investment managers(the ‘‘Underlying Funds’’). To ensure the Fund’scomposition meets the investment objectives of the Fund,the portfolio advisor monitors the Underlying Funds on anongoing basis and rebalances the Fund’s assets among theUnderlying Funds.
2. Risks associated with financial instruments (note 4)
i) Interest rate risk
The Fund invests in Underlying Funds, which are exposedto interest rate risk. As at June 30, 2015, had the prevailinginterest rates increased or decreased by 0.25%, assuming aparallel shift in the yield curve and all other variables heldconstant, net assets attributable to holders of redeemableunits would have decreased or increased, respectively, by$259,850 or approximately 0.6% (December 31, 2014 –$36,053 or approximately 0.7%). In practice, actual resultsmay differ from this sensitivity analysis and the differencecould be material.
ii) Currency risk
The Fund could be exposed to indirect currency risk to theextent that the Underlying Funds held financialinstruments that were denominated in a currency otherthan its functional currency.
iii) Price risk
Price risk is the risk that the carrying value of financialinstruments will fluctuate as a result of changes in marketprices (other than those arising from interest rate risk orcurrency risk) caused by factors specific to a security, itsissuer or all factors affecting a market or a market segment.Exposure to price risk is mainly in equities, derivatives andcommodities, if applicable. As at June 30, 2015,
approximately 24.3% (December 31, 2014 – 24.7%) of theFund’s net assets were invested in Underlying Funds whichwere exposed to price risk. If prices of the UnderlyingFunds’ investments had decreased or increased by 10%,with all other variables held constant, net assets of theFund would have decreased or increased, respectively, byapproximately $1,024,074 (December 31, 2014 – $134,665).In practice, actual results may differ from this sensitivityanalysis and the difference could be material.
iv) Credit risk
The Fund could be exposed to indirect credit risk to theextent that the Underlying Funds invested in bonds anddebentures, preferred shares and derivatives.
v) Liquidity risk
The table below summarizes the Fund’s financial liabilitiesbased on the remaining period to the contractual maturitydate.
June 30, 2015 December 31, 2014
On demand($)
Less than3 months
($)On demand
($)
Less than3 months
($)
Current liabilities – 887,904 – 1,138,969Liability for written options – – – –Unrealized loss on derivatives – – – –Redeemable units 42,191,931 – 5,441,272 –
42,191,931 887,904 5,441,272 1,138,969
Redeemable units are redeemable on demand at theholder’s option. However, the Manager does not expect thatthe contractual maturity disclosed in the table above will berepresentative of the actual cash outflows, as holders ofthese instruments typically retain them for a longer term.
vi) Concentration risk
Concentration risk arises as a result of the concentration ofexposures within the same category, geographical location,asset type or industry sector, as applicable. The table belowis a summary of the Fund’s concentration risk:
Percentage of net assets (%)
June 30, 2015 December 31, 2014
Canadian Equity Funds 16.7 16.8Fixed Income Funds 73.7 73.3Foreign Equity Funds 7.6 7.9
The accompanying notes are an integral part of the financial statements.
346
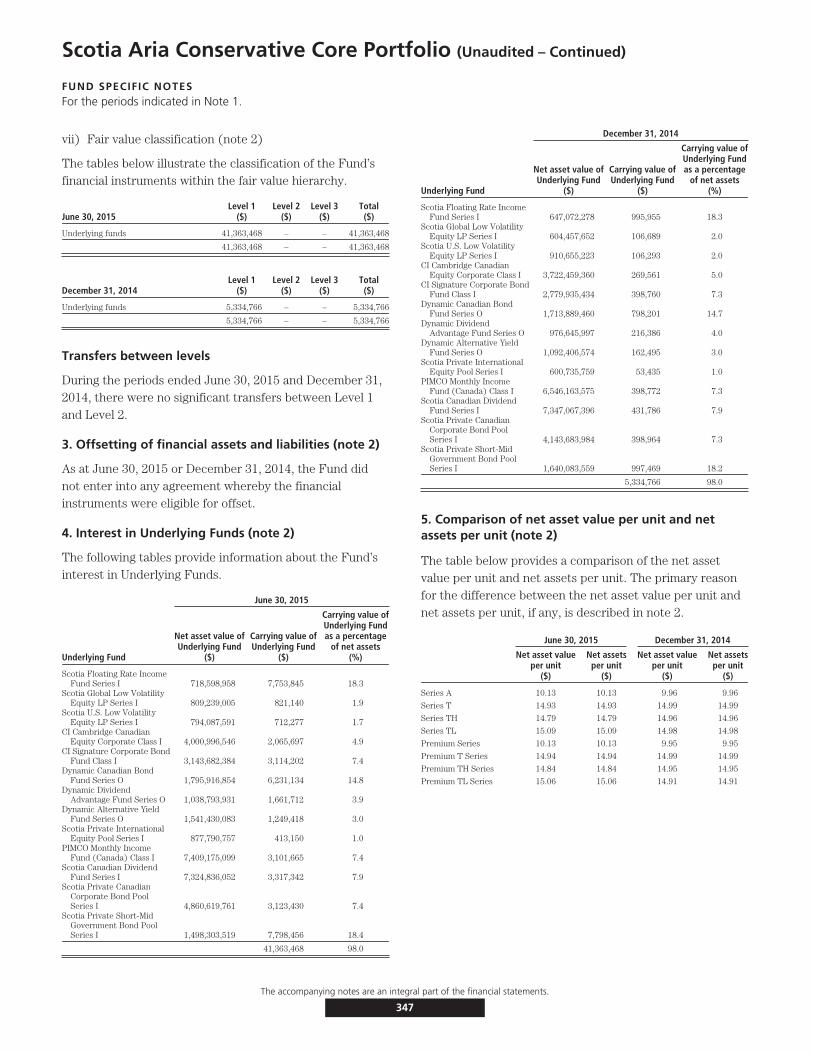
Scotia Aria Conservative Core Portfolio (Unaudited – Continued)
FUND SPECIFIC NOTESFor the periods indicated in Note 1.
vii) Fair value classification (note 2)
The tables below illustrate the classification of the Fund’sfinancial instruments within the fair value hierarchy.
June 30, 2015Level 1
($)Level 2
($)Level 3
($)Total($)
Underlying funds 41,363,468 – – 41,363,468
41,363,468 – – 41,363,468
December 31, 2014Level 1
($)Level 2
($)Level 3
($)Total($)
Underlying funds 5,334,766 – – 5,334,766
5,334,766 – – 5,334,766
Transfers between levels
During the periods ended June 30, 2015 and December 31,2014, there were no significant transfers between Level 1and Level 2.
3. Offsetting of financial assets and liabilities (note 2)
As at June 30, 2015 or December 31, 2014, the Fund didnot enter into any agreement whereby the financialinstruments were eligible for offset.
4. Interest in Underlying Funds (note 2)
The following tables provide information about the Fund’sinterest in Underlying Funds.
June 30, 2015
Underlying Fund
Net asset value ofUnderlying Fund
($)
Carrying value ofUnderlying Fund
($)
Carrying value ofUnderlying Fundas a percentage
of net assets(%)
Scotia Floating Rate IncomeFund Series I 718,598,958 7,753,845 18.3
Scotia Global Low VolatilityEquity LP Series I 809,239,005 821,140 1.9
Scotia U.S. Low VolatilityEquity LP Series I 794,087,591 712,277 1.7
CI Cambridge CanadianEquity Corporate Class I 4,000,996,546 2,065,697 4.9
CI Signature Corporate BondFund Class I 3,143,682,384 3,114,202 7.4
Dynamic Canadian BondFund Series O 1,795,916,854 6,231,134 14.8
Dynamic DividendAdvantage Fund Series O 1,038,793,931 1,661,712 3.9
Dynamic Alternative YieldFund Series O 1,541,430,083 1,249,418 3.0
Scotia Private InternationalEquity Pool Series I 877,790,757 413,150 1.0
PIMCO Monthly IncomeFund (Canada) Class I 7,409,175,099 3,101,665 7.4
Scotia Canadian DividendFund Series I 7,324,836,052 3,317,342 7.9
Scotia Private CanadianCorporate Bond PoolSeries I 4,860,619,761 3,123,430 7.4
Scotia Private Short-MidGovernment Bond PoolSeries I 1,498,303,519 7,798,456 18.4
41,363,468 98.0
December 31, 2014
Underlying Fund
Net asset value ofUnderlying Fund
($)
Carrying value ofUnderlying Fund
($)
Carrying value ofUnderlying Fundas a percentage
of net assets(%)
Scotia Floating Rate IncomeFund Series I 647,072,278 995,955 18.3
Scotia Global Low VolatilityEquity LP Series I 604,457,652 106,689 2.0
Scotia U.S. Low VolatilityEquity LP Series I 910,655,223 106,293 2.0
CI Cambridge CanadianEquity Corporate Class I 3,722,459,360 269,561 5.0
CI Signature Corporate BondFund Class I 2,779,935,434 398,760 7.3
Dynamic Canadian BondFund Series O 1,713,889,460 798,201 14.7
Dynamic DividendAdvantage Fund Series O 976,645,997 216,386 4.0
Dynamic Alternative YieldFund Series O 1,092,406,574 162,495 3.0
Scotia Private InternationalEquity Pool Series I 600,735,759 53,435 1.0
PIMCO Monthly IncomeFund (Canada) Class I 6,546,163,575 398,772 7.3
Scotia Canadian DividendFund Series I 7,347,067,396 431,786 7.9
Scotia Private CanadianCorporate Bond PoolSeries I 4,143,683,984 398,964 7.3
Scotia Private Short-MidGovernment Bond PoolSeries I 1,640,083,559 997,469 18.2
5,334,766 98.0
5. Comparison of net asset value per unit and netassets per unit (note 2)
The table below provides a comparison of the net assetvalue per unit and net assets per unit. The primary reasonfor the difference between the net asset value per unit andnet assets per unit, if any, is described in note 2.
June 30, 2015 December 31, 2014
Net asset valueper unit
($)
Net assetsper unit
($)
Net asset valueper unit
($)
Net assetsper unit
($)
Series A 10.13 10.13 9.96 9.96
Series T 14.93 14.93 14.99 14.99
Series TH 14.79 14.79 14.96 14.96
Series TL 15.09 15.09 14.98 14.98
Premium Series 10.13 10.13 9.95 9.95
Premium T Series 14.94 14.94 14.99 14.99
Premium TH Series 14.84 14.84 14.95 14.95
Premium TL Series 15.06 15.06 14.91 14.91
The accompanying notes are an integral part of the financial statements.
347

Scotia Aria Conservative Pay Portfolio (Unaudited)
STATEMENTS OF FINANCIAL POSITIONAs at
June 30,2015
December 31,2014
ASSETSCurrent assetsInvestments
Non-derivative financial assets $37,210,666 $4,613,694Cash 804,432 136,007Subscriptions receivable 109,237 561,015Accrued investment income and other 525 193
38,124,860 5,310,909
LIABILITIESCurrent liabilitiesManagement fee payable 51,374 –Payable for securities purchased 100,000 401,000Redemptions payable 1,822 660Accrued expenses 3,561 –Distributions payable 30,024 18,620
186,781 420,280
Net assets attributable to holders of redeemable units $37,938,079 $4,890,629
NET ASSETS ATTRIBUTABLE TO HOLDERS OF REDEEMABLE UNITSPER SERIES
Series A $10,888,270 $2,289,296Series T $ 3,025,831 $ 431,908Series TH $ 2,234,466 $ 55,590Series TL $ 395,891 $ 5,023Premium Series $14,359,332 $ 894,508Premium T Series $ 2,236,874 $ 99,506Premium TH Series $ 4,013,831 $ 605,608Premium TL Series $ 783,584 $ 509,190
NET ASSETS ATTRIBUTABLE TO HOLDERS OF REDEEMABLE UNITSPER UNIT
Series A $ 10.04 $ 9.86Series T $ 14.80 $ 14.86Series TH $ 14.66 $ 14.92Series TL $ 15.00 $ 14.89Premium Series $ 10.04 $ 9.83Premium T Series $ 14.81 $ 14.95Premium TH Series $ 14.68 $ 14.94Premium TL Series $ 14.93 $ 14.75
STATEMENT OF COMPREHENSIVE INCOMEFor the six month period ended June 30,
2015*INCOMENet gain (loss) on investments (note 2)
Dividends $ 40,352Interest for distribution purposes 310,204Capital gains distributions received 49,313Change in unrealized gain (loss) on non-derivative financial assets (301,992)
Net gain (loss) on investments 97,877Other income 453
Total income (loss) 98,330
EXPENSESManagement fees (note 5) 165,971Fixed administration fees (note 6) 11,457Independent Review Committee fees 14Harmonized Sales Tax/Goods and Services Tax 19,712
Total expenses 197,154
Increase (decrease) in net assets attributable to holders of redeemable units from operations $ (98,824)
INCREASE (DECREASE) IN NET ASSETS ATTRIBUTABLE TO HOLDERS OF REDEEMABLEUNITS FROM OPERATIONS PER SERIES
Series A $ (6,657)Series T $ (13,842)Series TH $ (13,820)Series TL $ (2,419)Premium Series $ (48,328)Premium T Series $ (10,571)Premium TH Series $ (15,175)Premium TL Series $ 11,988
INCREASE (DECREASE) IN NET ASSETS ATTRIBUTABLE TO HOLDERS OF REDEEMABLEUNITS FROM OPERATIONS PER UNIT†
Series A $ (0.01)Series T $ (0.11)Series TH $ (0.20)Series TL $ (0.12)Premium Series $ (0.07)Premium T Series $ (0.11)Premium TH Series $ (0.10)Premium TL Series $ 0.25
WEIGHTED AVERAGE NUMBER OF UNITS PER SERIESSeries A 792,086Series T 130,019Series TH 68,594Series TL 19,475Premium Series 742,788Premium T Series 94,757Premium TH Series 158,477Premium TL Series 47,746
† The increase (decrease) in net assets attributable to holders of redeemable units fromoperations per unit is calculated by dividing the increase (decrease) in net assetsattributable to holders of redeemable units from operations per series by the weightedaverage number of units per series.
The accompanying notes are an integral part of the financial statements.
348

Scotia Aria Conservative Pay Portfolio (Unaudited – Continued)
STATEMENT OF CHANGES IN NET ASSETSATTRIBUTABLE TO HOLDERS OF REDEEMABLE UNITSFor the six month period ended June 30,
2015*NET ASSETS ATTRIBUTABLE TO HOLDERS OF REDEEMABLE UNITS, BEGINNING OF PERIODSeries A $ 2,289,296Series T 431,908Series TH 55,590Series TL 5,023Premium Series 894,508Premium T Series 99,506Premium TH Series 605,608Premium TL Series 509,190
4,890,629INCREASE (DECREASE) IN NET ASSETS ATTRIBUTABLE TO HOLDERS OF REDEEMABLE
UNITS FROM OPERATIONSSeries A (6,657)Series T (13,842)Series TH (13,820)Series TL (2,419)Premium Series (48,328)Premium T Series (10,571)Premium TH Series (15,175)Premium TL Series 11,988
(98,824)DISTRIBUTIONS TO HOLDERS OF REDEEMABLE UNITSFrom net investment income
Series T (11,063)Series TH (11,784)Series TL (1,102)Premium T Series (9,128)Premium TH Series (17,845)Premium TL Series (1,271)
From return of capitalSeries T (21,021)Series TH (16,016)Series TL (1,098)Premium T Series (13,796)Premium TH Series (42,038)Premium TL Series (4,067)
(150,229)REDEEMABLE UNIT TRANSACTIONSProceeds from issue
Series A 10,014,637Series T 2,843,701Series TH 2,435,520Series TL 394,938Premium Series 13,696,806Premium T Series 2,287,363Premium TH Series 3,773,092Premium TL Series 1,382,983
Reinvested distributionsSeries T 9,695Series TH 7,407Series TL 549Premium T Series 4,123Premium TH Series 8,207Premium TL Series 3,867
Payments on redemptionSeries A (1,409,006)Series T (213,547)Series TH (222,431)Premium Series (183,654)Premium T Series (120,623)Premium TH Series (298,018)Premium TL Series (1,119,106)
33,296,503INCREASE (DECREASE) IN NET ASSETS ATTRIBUTABLE TO HOLDERS OF REDEEMABLE UNITSSeries A 8,598,974Series T 2,593,923Series TH 2,178,876Series TL 390,868Premium Series 13,464,824Premium T Series 2,137,368Premium TH Series 3,408,223Premium TL Series 274,394
33,047,450NET ASSETS ATTRIBUTABLE TO HOLDERS OF REDEEMABLE UNITS, END OF PERIODSeries A 10,888,270Series T 3,025,831Series TH 2,234,466Series TL 395,891Premium Series 14,359,332Premium T Series 2,236,874Premium TH Series 4,013,831Premium TL Series 783,584
$37,938,079
STATEMENT OF CASH FLOWSFor the six month period ended June 30,
2015*CASH FLOWS FROM OPERATING ACTIVITIESIncrease (decrease) in net assets attributable to holders of redeemable units $ (98,824)Adjustments for:
Change in unrealized (gain) loss on non-derivative financial assets 301,992Purchases of non-derivative financial assets (33,199,964)Accrued investment income and other (332)Accrued expenses 54,935
Net cash provided by (used in) operating activities (32,942,193)CASH FLOWS FROM FINANCING ACTIVITIESProceeds from issue of redeemable units 37,280,818Amounts paid on redemption of redeemable units (3,565,224)Distributions to unitholders of redeemable units (104,976)
Net cash provided by (used in) financing activities 33,610,618Net increase (decrease) in cash 668,425Cash (bank overdraft), beginning of period 136,007
CASH (BANK OVERDRAFT), END OF PERIOD $ 804,432
Interest received(1) 309,872Dividends received, net of withholding taxes(1) 40,352
(1) Classified as operating items.* No comparative figures are shown as the Fund’s inception date was November 19,
2014.
SCHEDULE OF INVESTMENT PORTFOLIOAs at June 30, 2015
Numberof Units Issuer
AverageCost ($)
CarryingValue ($)
FIXED INCOME FUNDS – 58.4%266,819 PIMCO Monthly Income Fund (Canada) Class I 3,873,276 3,883,982136,608 Scotia Private American Core-Plus Bond Pool Series I 1,323,386 1,296,946477,318 Scotia Private Canadian Corporate Bond Pool Series I 5,248,102 5,222,055271,239 Scotia Private High Yield Income Pool Series I 2,629,953 2,611,437366,772 Scotia Private Short-Mid Government Bond Pool Series I 3,928,624 3,898,453474,397 Scotia Total Return Bond LP Series I 5,203,969 5,222,209
22,207,310 22,135,082
CANADIAN EQUITY FUNDS – 25.9%385,933 1832 AM North American Preferred Share LP Series I 3,998,483 3,868,85995,576 CI Cambridge Canadian Equity Corporate Class I 1,900,108 1,857,040
173,347 Dynamic Dividend Advantage Fund Series O 1,518,549 1,497,71649,808 Scotia Canadian Dividend Fund Series I 2,663,249 2,614,281
10,080,389 9,837,896
FOREIGN EQUITY FUNDS – 13.8%22,995 Dynamic Global Infrastructure Fund Series O 383,299 368,835
135,430 Dynamic Premium Yield Fund Series O 1,504,791 1,512,75173,316 Pinnacle Emerging Markets Fund Class I 786,851 746,00853,241 Scotia Global Dividend Fund Series I 911,744 931,20954,427 Scotia Private International Equity Pool Series I 717,684 741,80725,323 Scotia U.S. Dividend Fund Series I 369,702 373,69342,451 Scotia U.S. Dividend Growers LP Series I 551,554 563,385
5,225,625 5,237,688
TOTAL INVESTMENT PORTFOLIO 37,513,324 37,210,666
OTHER ASSETS, LESS LIABILITIES – 1.9% 727,413
NET ASSETS – 100.0% 37,938,079
The accompanying notes are an integral part of the financial statements.
349

Scotia Aria Conservative Pay Portfolio (Unaudited)
FUND SPECIFIC NOTESFor the periods indicated in Note 1.
1. The Fund (note 1)
The Fund invests primarily in a diversified mix of mutualfunds, equity securities and/or fixed income securitieslocated anywhere in the world and aims to generate incomeand modest long-term capital appreciation using a balancedapproach to investing through investments in incomeproducing equity and fixed income securities. The majorityof the portfolio’s assets will be held in fixed incomesecurities. The portfolio is an asset allocation fund thatallocates investment between two asset classes: fixedincome and equities.
The Fund invests primarily in mutual funds managed by theManager and/or by the third party investment managers(the ‘‘Underlying Funds’’). To ensure the Fund’scomposition meets the investment objectives of the Fund,the portfolio advisor monitors the Underlying Funds on anongoing basis and rebalances the Fund’s assets among theUnderlying Funds.
2. Risks associated with financial instruments (note 4)
i) Interest rate risk
The Fund invests in Underlying Funds, which are exposedto interest rate risk. As at June 30, 2015, had the prevailinginterest rates increased or decreased by 0.25%, assuming aparallel shift in the yield curve and all other variables heldconstant, net assets attributable to holders of redeemableunits would have decreased or increased, respectively, by$218,261 or approximately 0.6% (December 31, 2014 –$28,495 or approximately 0.6%). In practice, actual resultsmay differ from this sensitivity analysis and the differencecould be material.
ii) Currency risk
The Fund could be exposed to indirect currency risk to theextent that the Underlying Funds held financialinstruments that were denominated in a currency otherthan its functional currency.
iii) Price risk
Price risk is the risk that the carrying value of financialinstruments will fluctuate as a result of changes in marketprices (other than those arising from interest rate risk orcurrency risk) caused by factors specific to a security, itsissuer or all factors affecting a market or a market segment.Exposure to price risk is mainly in equities, derivatives andcommodities, if applicable. As at June 30, 2015,
approximately 39.7% (December 31, 2014 – 36.1%) of theFund’s net assets were invested in Underlying Funds whichwere exposed to price risk. If prices of the UnderlyingFunds’ investments had decreased or increased by 10%,with all other variables held constant, net assets of theFund would have decreased or increased, respectively, byapproximately $1,507,558 (December 31, 2014 – $169,108).In practice, actual results may differ from this sensitivityanalysis and the difference could be material.
iv) Credit risk
The Fund could be exposed to indirect credit risk to theextent that the Underlying Funds invested in bonds anddebentures, preferred shares and derivatives.
v) Liquidity risk
The table below summarizes the Fund’s financial liabilitiesbased on the remaining period to the contractual maturitydate.
June 30, 2015 December 31, 2014
On demand($)
Less than3 months
($)On demand
($)
Less than3 months
($)
Current liabilities – 186,781 – 420,280Liability for written options – – – –Unrealized loss on derivatives – – – –Redeemable units 37,938,079 – 4,890,629 –
37,938,079 186,781 4,890,629 420,280
Redeemable units are redeemable on demand at theholder’s option. However, the Manager does not expect thatthe contractual maturity disclosed in the table above will berepresentative of the actual cash outflows, as holders ofthese instruments typically retain them for a longer term.
vi) Concentration risk
Concentration risk arises as a result of the concentration ofexposures within the same category, geographical location,asset type or industry sector, as applicable. The table belowis a summary of the Fund’s concentration risk:
Percentage of net assets (%)
June 30, 2015 December 31, 2014
Canadian Equity Funds 25.9 25.1Fixed Income Funds 58.4 59.8Foreign Equity Funds 13.8 9.4
The accompanying notes are an integral part of the financial statements.
350
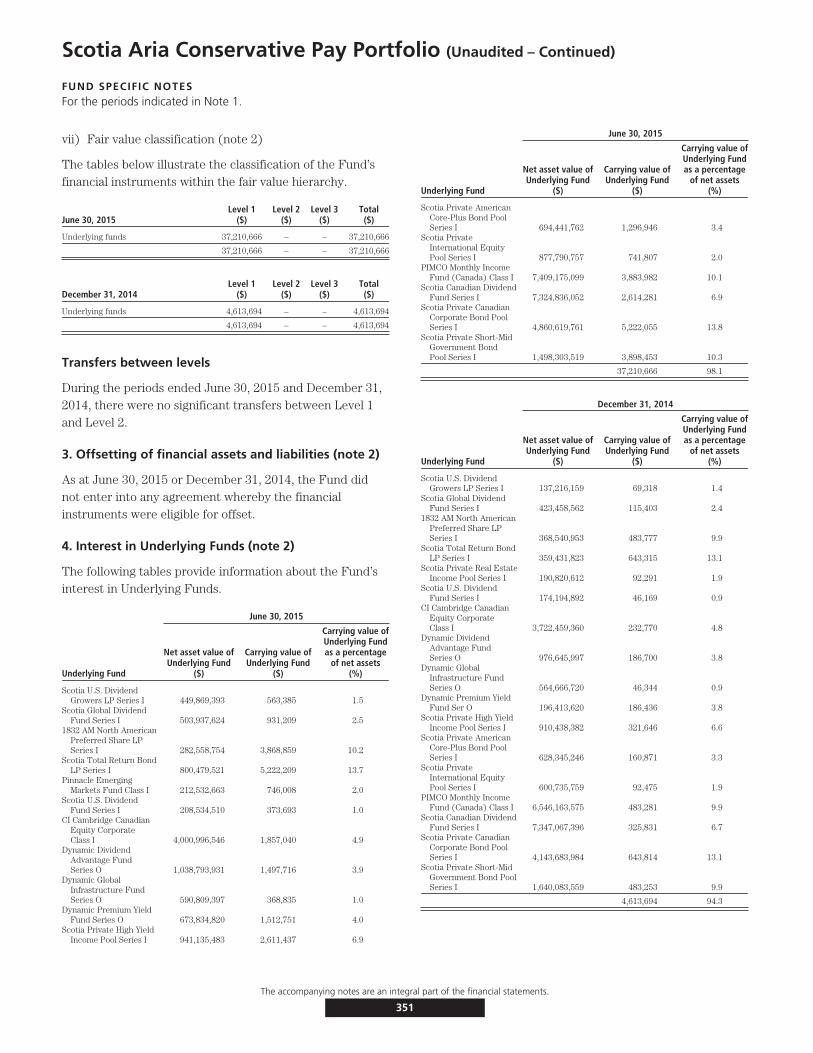
Scotia Aria Conservative Pay Portfolio (Unaudited – Continued)
FUND SPECIFIC NOTESFor the periods indicated in Note 1.
vii) Fair value classification (note 2)
The tables below illustrate the classification of the Fund’sfinancial instruments within the fair value hierarchy.
June 30, 2015Level 1
($)Level 2
($)Level 3
($)Total($)
Underlying funds 37,210,666 – – 37,210,666
37,210,666 – – 37,210,666
December 31, 2014Level 1
($)Level 2
($)Level 3
($)Total($)
Underlying funds 4,613,694 – – 4,613,694
4,613,694 – – 4,613,694
Transfers between levels
During the periods ended June 30, 2015 and December 31,2014, there were no significant transfers between Level 1and Level 2.
3. Offsetting of financial assets and liabilities (note 2)
As at June 30, 2015 or December 31, 2014, the Fund didnot enter into any agreement whereby the financialinstruments were eligible for offset.
4. Interest in Underlying Funds (note 2)
The following tables provide information about the Fund’sinterest in Underlying Funds.
June 30, 2015
Underlying Fund
Net asset value ofUnderlying Fund
($)
Carrying value ofUnderlying Fund
($)
Carrying value ofUnderlying Fundas a percentage
of net assets(%)
Scotia U.S. DividendGrowers LP Series I 449,869,393 563,385 1.5
Scotia Global DividendFund Series I 503,937,624 931,209 2.5
1832 AM North AmericanPreferred Share LPSeries I 282,558,754 3,868,859 10.2
Scotia Total Return BondLP Series I 800,479,521 5,222,209 13.7
Pinnacle EmergingMarkets Fund Class I 212,532,663 746,008 2.0
Scotia U.S. DividendFund Series I 208,534,510 373,693 1.0
CI Cambridge CanadianEquity CorporateClass I 4,000,996,546 1,857,040 4.9
Dynamic DividendAdvantage FundSeries O 1,038,793,931 1,497,716 3.9
Dynamic GlobalInfrastructure FundSeries O 590,809,397 368,835 1.0
Dynamic Premium YieldFund Series O 673,834,820 1,512,751 4.0
Scotia Private High YieldIncome Pool Series I 941,135,483 2,611,437 6.9
June 30, 2015
Underlying Fund
Net asset value ofUnderlying Fund
($)
Carrying value ofUnderlying Fund
($)
Carrying value ofUnderlying Fundas a percentage
of net assets(%)
Scotia Private AmericanCore-Plus Bond PoolSeries I 694,441,762 1,296,946 3.4
Scotia PrivateInternational EquityPool Series I 877,790,757 741,807 2.0
PIMCO Monthly IncomeFund (Canada) Class I 7,409,175,099 3,883,982 10.1
Scotia Canadian DividendFund Series I 7,324,836,052 2,614,281 6.9
Scotia Private CanadianCorporate Bond PoolSeries I 4,860,619,761 5,222,055 13.8
Scotia Private Short-MidGovernment BondPool Series I 1,498,303,519 3,898,453 10.3
37,210,666 98.1
December 31, 2014
Underlying Fund
Net asset value ofUnderlying Fund
($)
Carrying value ofUnderlying Fund
($)
Carrying value ofUnderlying Fundas a percentage
of net assets(%)
Scotia U.S. DividendGrowers LP Series I 137,216,159 69,318 1.4
Scotia Global DividendFund Series I 423,458,562 115,403 2.4
1832 AM North AmericanPreferred Share LPSeries I 368,540,953 483,777 9.9
Scotia Total Return BondLP Series I 359,431,823 643,315 13.1
Scotia Private Real EstateIncome Pool Series I 190,820,612 92,291 1.9
Scotia U.S. DividendFund Series I 174,194,892 46,169 0.9
CI Cambridge CanadianEquity CorporateClass I 3,722,459,360 232,770 4.8
Dynamic DividendAdvantage FundSeries O 976,645,997 186,700 3.8
Dynamic GlobalInfrastructure FundSeries O 564,666,720 46,344 0.9
Dynamic Premium YieldFund Ser O 196,413,620 186,436 3.8
Scotia Private High YieldIncome Pool Series I 910,438,382 321,646 6.6
Scotia Private AmericanCore-Plus Bond PoolSeries I 628,345,246 160,871 3.3
Scotia PrivateInternational EquityPool Series I 600,735,759 92,475 1.9
PIMCO Monthly IncomeFund (Canada) Class I 6,546,163,575 483,281 9.9
Scotia Canadian DividendFund Series I 7,347,067,396 325,831 6.7
Scotia Private CanadianCorporate Bond PoolSeries I 4,143,683,984 643,814 13.1
Scotia Private Short-MidGovernment Bond PoolSeries I 1,640,083,559 483,253 9.9
4,613,694 94.3
The accompanying notes are an integral part of the financial statements.
351
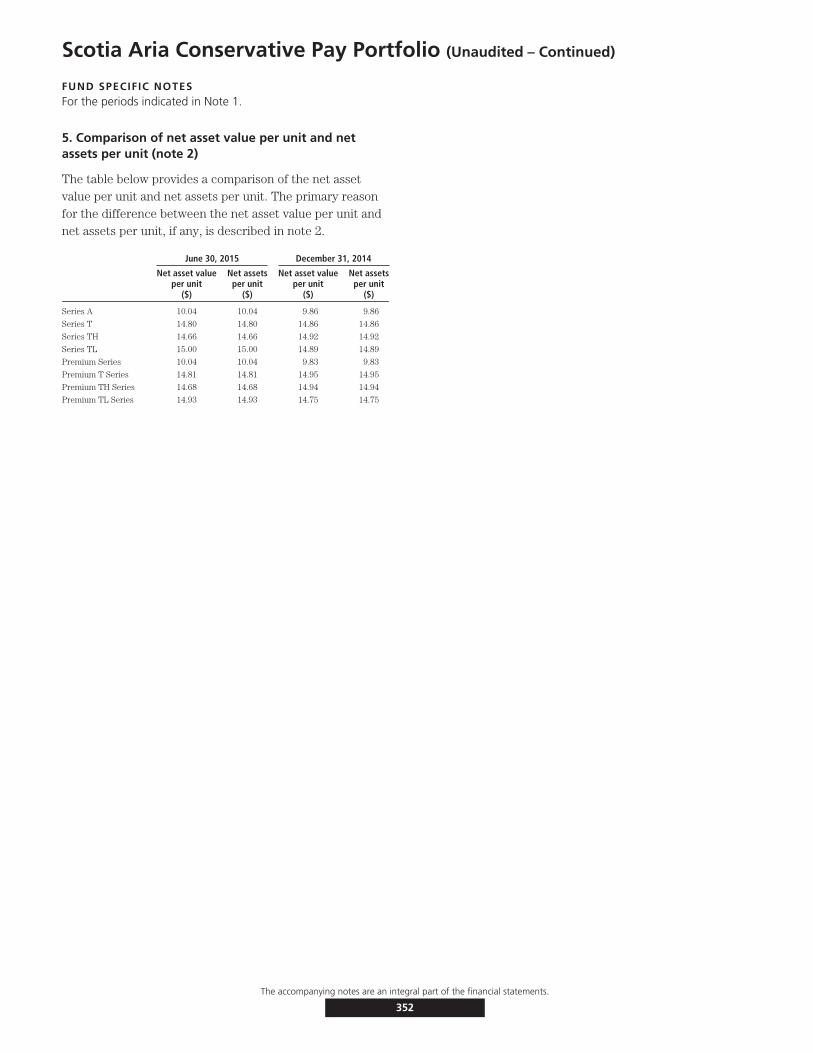
Scotia Aria Conservative Pay Portfolio (Unaudited – Continued)
FUND SPECIFIC NOTESFor the periods indicated in Note 1.
5. Comparison of net asset value per unit and netassets per unit (note 2)
The table below provides a comparison of the net assetvalue per unit and net assets per unit. The primary reasonfor the difference between the net asset value per unit andnet assets per unit, if any, is described in note 2.
June 30, 2015 December 31, 2014
Net asset valueper unit
($)
Net assetsper unit
($)
Net asset valueper unit
($)
Net assetsper unit
($)
Series A 10.04 10.04 9.86 9.86
Series T 14.80 14.80 14.86 14.86
Series TH 14.66 14.66 14.92 14.92
Series TL 15.00 15.00 14.89 14.89
Premium Series 10.04 10.04 9.83 9.83
Premium T Series 14.81 14.81 14.95 14.95
Premium TH Series 14.68 14.68 14.94 14.94
Premium TL Series 14.93 14.93 14.75 14.75
The accompanying notes are an integral part of the financial statements.
352

Scotia Aria Moderate Build Portfolio (Unaudited)
STATEMENTS OF FINANCIAL POSITIONAs at
June 30,2015
December 31,2014
ASSETSCurrent assetsInvestments
Non-derivative financial assets $23,744,847 $2,296,352Cash 586,446 46,318Subscriptions receivable 349,375 128,830Accrued investment income and other 395 101
24,681,063 2,471,601
LIABILITIESCurrent liabilitiesManagement fee payable 34,165 –Payable for securities purchased 417,000 –Accrued expenses 2,185 –
453,350 –
Net assets attributable to holders of redeemable units $24,227,713 $2,471,601
NET ASSETS ATTRIBUTABLE TO HOLDERS OF REDEEMABLE UNITS PER SERIESSeries A $15,637,368 $1,762,323Premium Series $ 8,590,345 $ 709,278
NET ASSETS ATTRIBUTABLE TO HOLDERS OF REDEEMABLE UNITS PER UNITSeries A $ 10.25 $ 9.83Premium Series $ 10.25 $ 9.83
STATEMENT OF COMPREHENSIVE INCOMEFor the six month period ended June 30,
2015*INCOMENet gain (loss) on investments (note 2)
Dividends $ 24,959Interest for distribution purposes 171,488Capital gains distributions received 101,759Change in unrealized gain (loss) on non-derivative financial assets (38,476)
Net gain (loss) on investments 259,730Other income 95
Total income (loss) 259,825
EXPENSESManagement fees (note 5) 117,480Fixed administration fees (note 6) 7,495Independent Review Committee fees 10Harmonized Sales Tax/Goods and Services Tax 12,374
Total expenses 137,359
Increase (decrease) in net assets attributable to holders of redeemable units from operations $122,466
INCREASE (DECREASE) IN NET ASSETS ATTRIBUTABLE TO HOLDERS OF REDEEMABLE UNITSFROM OPERATIONS PER SERIES
Series A $ 74,482Premium Series $ 47,984
INCREASE (DECREASE) IN NET ASSETS ATTRIBUTABLE TO HOLDERS OF REDEEMABLE UNITSFROM OPERATIONS PER UNIT†
Series A $ 0.08Premium Series $ 0.10
WEIGHTED AVERAGE NUMBER OF UNITS PER SERIESSeries A 985,224Premium Series 493,777
† The increase (decrease) in net assets attributable to holders of redeemable units fromoperations per unit is calculated by dividing the increase (decrease) in net assetsattributable to holders of redeemable units from operations per series by the weightedaverage number of units per series.
STATEMENT OF CHANGES IN NET ASSETSATTRIBUTABLE TO HOLDERS OF REDEEMABLE UNITSFor the six month period ended June 30,
2015*NET ASSETS ATTRIBUTABLE TO HOLDERS OF REDEEMABLE UNITS, BEGINNING OF PERIODSeries A $ 1,762,323Premium Series 709,278
2,471,601
INCREASE (DECREASE) IN NET ASSETS ATTRIBUTABLE TO HOLDERS OF REDEEMABLEUNITS FROM OPERATIONS
Series A 74,482Premium Series 47,984
122,466
REDEEMABLE UNIT TRANSACTIONSProceeds from issue
Series A 14,698,280Premium Series 7,861,851
Payments on redemptionSeries A (897,717)Premium Series (28,768)
21,633,646
INCREASE (DECREASE) IN NET ASSETS ATTRIBUTABLE TO HOLDERS OF REDEEMABLE UNITSSeries A 13,875,045Premium Series 7,881,067
21,756,112
NET ASSETS ATTRIBUTABLE TO HOLDERS OF REDEEMABLE UNITS, END OF PERIODSeries A 15,637,368Premium Series 8,590,345
$24,227,713
STATEMENT OF CASH FLOWSFor the six month period ended June 30,
2015*CASH FLOWS FROM OPERATING ACTIVITIESIncrease (decrease) in net assets attributable to holders of redeemable units $ 122,466Adjustments for:
Change in unrealized (gain) loss on non-derivative financial assets 38,476Purchases of non-derivative financial assets (21,069,971)Accrued investment income and other (294)Accrued expenses 36,350
Net cash provided by (used in) operating activities (20,872,973)CASH FLOWS FROM FINANCING ACTIVITIESProceeds from issue of redeemable units 22,339,586Amounts paid on redemption of redeemable units (926,485)
Net cash provided by (used in) financing activities 21,413,101Net increase (decrease) in cash 540,128Cash (bank overdraft), beginning of period 46,318
CASH (BANK OVERDRAFT), END OF PERIOD $ 586,446
Interest received(1) 171,194Dividends received, net of withholding taxes(1) 24,959
(1) Classified as operating items.* No comparative figures are shown as the Fund’s inception date was November 19,
2014.
The accompanying notes are an integral part of the financial statements.
353

Scotia Aria Moderate Build Portfolio (Unaudited – Continued)
SCHEDULE OF INVESTMENT PORTFOLIOAs at June 30, 2015
Numberof Units Issuer
AverageCost ($)
CarryingValue ($)
FIXED INCOME FUNDS – 43.6%120,472 PIMCO Monthly Income Fund (Canada) Class I 1,746,443 1,753,661215,449 Scotia Canadian Income Fund Series I 3,023,478 2,950,471123,437 Scotia Private American Core-Plus Bond Pool Series I 1,196,157 1,171,896161,004 Scotia Private Canadian Corporate Bond Pool Series I 1,771,799 1,761,447305,669 Scotia Private High Yield Income Pool Series I 2,973,118 2,942,919
10,710,995 10,580,394
CANADIAN EQUITY FUNDS – 29.6%116,175 1832 AM North American Preferred Share LP Series I 1,203,785 1,164,617107,665 CI Cambridge Canadian Equity Corporate Class I 2,150,425 2,091,926144,462 Dynamic Value Fund of Canada Series O 1,768,911 1,802,88642,472 Scotia Private Canadian Mid Cap Pool Series I 896,421 904,90234,070 Scotia Private Canadian Small Cap Pool Series I 1,160,556 1,198,021
7,180,098 7,162,352
FOREIGN EQUITY FUNDS – 24.8%48,560 1832 AM Global Completion LP Series I 597,368 602,34957,114 CI Black Creek International Equity Corp Class I 1,156,994 1,191,39925,584 Scotia Global Growth Fund Series I 1,448,880 1,499,76957,853 Scotia Private Emerging Markets Pool Series I 609,963 605,75032,158 Scotia Private Global Real Estate Pool Series I 627,642 600,68919,118 Scotia Private U.S. Mid Cap Value Pool Series I 287,211 299,72390,603 Scotia U.S. Dividend Growers LP Series I 1,186,725 1,202,422
5,914,783 6,002,101
TOTAL INVESTMENT PORTFOLIO 23,805,876 23,744,847
OTHER ASSETS, LESS LIABILITIES – 2.0% 482,866
NET ASSETS – 100.0% 24,227,713
The accompanying notes are an integral part of the financial statements.
354
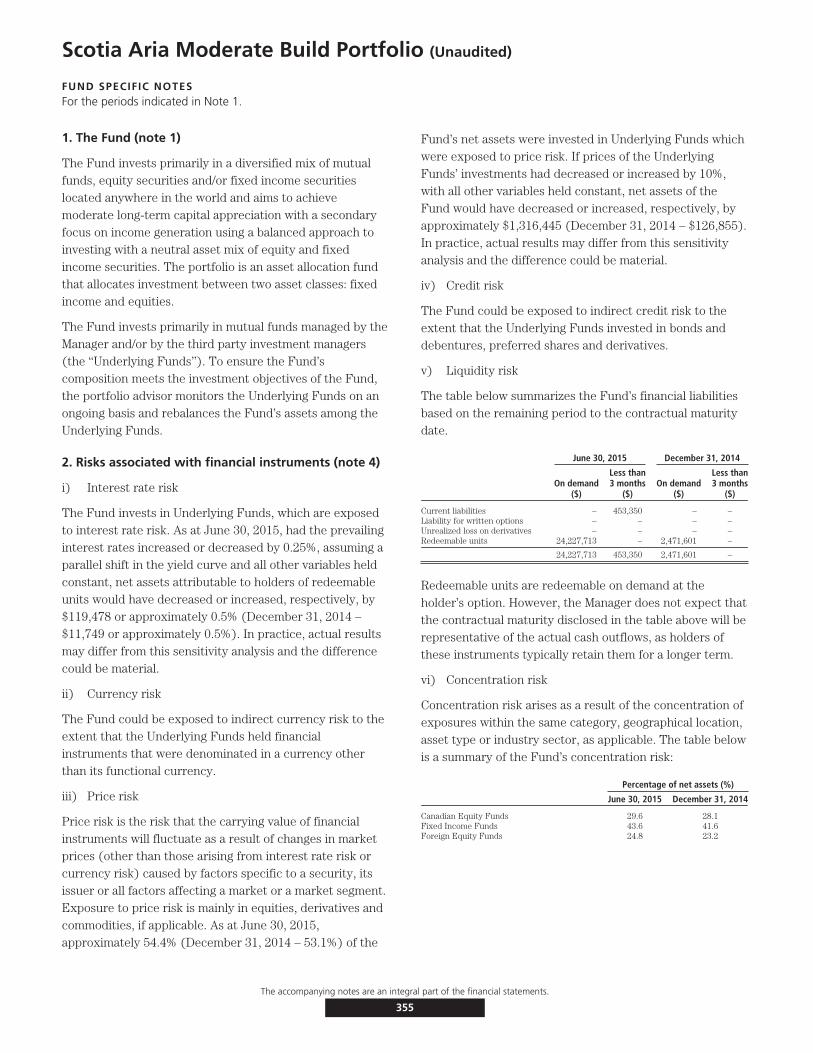
Scotia Aria Moderate Build Portfolio (Unaudited)
FUND SPECIFIC NOTESFor the periods indicated in Note 1.
1. The Fund (note 1)
The Fund invests primarily in a diversified mix of mutualfunds, equity securities and/or fixed income securitieslocated anywhere in the world and aims to achievemoderate long-term capital appreciation with a secondaryfocus on income generation using a balanced approach toinvesting with a neutral asset mix of equity and fixedincome securities. The portfolio is an asset allocation fundthat allocates investment between two asset classes: fixedincome and equities.
The Fund invests primarily in mutual funds managed by theManager and/or by the third party investment managers(the ‘‘Underlying Funds’’). To ensure the Fund’scomposition meets the investment objectives of the Fund,the portfolio advisor monitors the Underlying Funds on anongoing basis and rebalances the Fund’s assets among theUnderlying Funds.
2. Risks associated with financial instruments (note 4)
i) Interest rate risk
The Fund invests in Underlying Funds, which are exposedto interest rate risk. As at June 30, 2015, had the prevailinginterest rates increased or decreased by 0.25%, assuming aparallel shift in the yield curve and all other variables heldconstant, net assets attributable to holders of redeemableunits would have decreased or increased, respectively, by$119,478 or approximately 0.5% (December 31, 2014 –$11,749 or approximately 0.5%). In practice, actual resultsmay differ from this sensitivity analysis and the differencecould be material.
ii) Currency risk
The Fund could be exposed to indirect currency risk to theextent that the Underlying Funds held financialinstruments that were denominated in a currency otherthan its functional currency.
iii) Price risk
Price risk is the risk that the carrying value of financialinstruments will fluctuate as a result of changes in marketprices (other than those arising from interest rate risk orcurrency risk) caused by factors specific to a security, itsissuer or all factors affecting a market or a market segment.Exposure to price risk is mainly in equities, derivatives andcommodities, if applicable. As at June 30, 2015,approximately 54.4% (December 31, 2014 – 53.1%) of the
Fund’s net assets were invested in Underlying Funds whichwere exposed to price risk. If prices of the UnderlyingFunds’ investments had decreased or increased by 10%,with all other variables held constant, net assets of theFund would have decreased or increased, respectively, byapproximately $1,316,445 (December 31, 2014 – $126,855).In practice, actual results may differ from this sensitivityanalysis and the difference could be material.
iv) Credit risk
The Fund could be exposed to indirect credit risk to theextent that the Underlying Funds invested in bonds anddebentures, preferred shares and derivatives.
v) Liquidity risk
The table below summarizes the Fund’s financial liabilitiesbased on the remaining period to the contractual maturitydate.
June 30, 2015 December 31, 2014
On demand($)
Less than3 months
($)On demand
($)
Less than3 months
($)
Current liabilities – 453,350 – –Liability for written options – – – –Unrealized loss on derivatives – – – –Redeemable units 24,227,713 – 2,471,601 –
24,227,713 453,350 2,471,601 –
Redeemable units are redeemable on demand at theholder’s option. However, the Manager does not expect thatthe contractual maturity disclosed in the table above will berepresentative of the actual cash outflows, as holders ofthese instruments typically retain them for a longer term.
vi) Concentration risk
Concentration risk arises as a result of the concentration ofexposures within the same category, geographical location,asset type or industry sector, as applicable. The table belowis a summary of the Fund’s concentration risk:
Percentage of net assets (%)
June 30, 2015 December 31, 2014
Canadian Equity Funds 29.6 28.1Fixed Income Funds 43.6 41.6Foreign Equity Funds 24.8 23.2
The accompanying notes are an integral part of the financial statements.
355
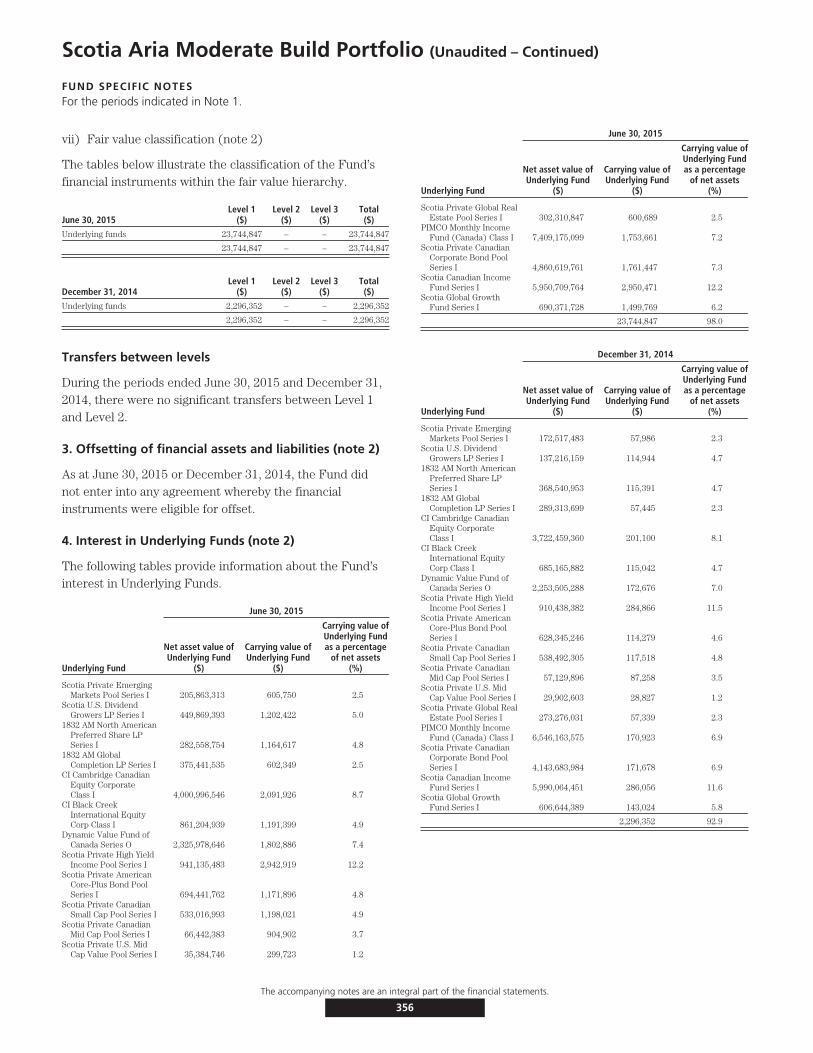
Scotia Aria Moderate Build Portfolio (Unaudited – Continued)
FUND SPECIFIC NOTESFor the periods indicated in Note 1.
vii) Fair value classification (note 2)
The tables below illustrate the classification of the Fund’sfinancial instruments within the fair value hierarchy.
June 30, 2015Level 1
($)Level 2
($)Level 3
($)Total($)
Underlying funds 23,744,847 – – 23,744,847
23,744,847 – – 23,744,847
December 31, 2014Level 1
($)Level 2
($)Level 3
($)Total($)
Underlying funds 2,296,352 – – 2,296,352
2,296,352 – – 2,296,352
Transfers between levels
During the periods ended June 30, 2015 and December 31,2014, there were no significant transfers between Level 1and Level 2.
3. Offsetting of financial assets and liabilities (note 2)
As at June 30, 2015 or December 31, 2014, the Fund didnot enter into any agreement whereby the financialinstruments were eligible for offset.
4. Interest in Underlying Funds (note 2)
The following tables provide information about the Fund’sinterest in Underlying Funds.
June 30, 2015
Underlying Fund
Net asset value ofUnderlying Fund
($)
Carrying value ofUnderlying Fund
($)
Carrying value ofUnderlying Fundas a percentage
of net assets(%)
Scotia Private EmergingMarkets Pool Series I 205,863,313 605,750 2.5
Scotia U.S. DividendGrowers LP Series I 449,869,393 1,202,422 5.0
1832 AM North AmericanPreferred Share LPSeries I 282,558,754 1,164,617 4.8
1832 AM GlobalCompletion LP Series I 375,441,535 602,349 2.5
CI Cambridge CanadianEquity CorporateClass I 4,000,996,546 2,091,926 8.7
CI Black CreekInternational EquityCorp Class I 861,204,939 1,191,399 4.9
Dynamic Value Fund ofCanada Series O 2,325,978,646 1,802,886 7.4
Scotia Private High YieldIncome Pool Series I 941,135,483 2,942,919 12.2
Scotia Private AmericanCore-Plus Bond PoolSeries I 694,441,762 1,171,896 4.8
Scotia Private CanadianSmall Cap Pool Series I 533,016,993 1,198,021 4.9
Scotia Private CanadianMid Cap Pool Series I 66,442,383 904,902 3.7
Scotia Private U.S. MidCap Value Pool Series I 35,384,746 299,723 1.2
June 30, 2015
Underlying Fund
Net asset value ofUnderlying Fund
($)
Carrying value ofUnderlying Fund
($)
Carrying value ofUnderlying Fundas a percentage
of net assets(%)
Scotia Private Global RealEstate Pool Series I 302,310,847 600,689 2.5
PIMCO Monthly IncomeFund (Canada) Class I 7,409,175,099 1,753,661 7.2
Scotia Private CanadianCorporate Bond PoolSeries I 4,860,619,761 1,761,447 7.3
Scotia Canadian IncomeFund Series I 5,950,709,764 2,950,471 12.2
Scotia Global GrowthFund Series I 690,371,728 1,499,769 6.2
23,744,847 98.0
December 31, 2014
Underlying Fund
Net asset value ofUnderlying Fund
($)
Carrying value ofUnderlying Fund
($)
Carrying value ofUnderlying Fundas a percentage
of net assets(%)
Scotia Private EmergingMarkets Pool Series I 172,517,483 57,986 2.3
Scotia U.S. DividendGrowers LP Series I 137,216,159 114,944 4.7
1832 AM North AmericanPreferred Share LPSeries I 368,540,953 115,391 4.7
1832 AM GlobalCompletion LP Series I 289,313,699 57,445 2.3
CI Cambridge CanadianEquity CorporateClass I 3,722,459,360 201,100 8.1
CI Black CreekInternational EquityCorp Class I 685,165,882 115,042 4.7
Dynamic Value Fund ofCanada Series O 2,253,505,288 172,676 7.0
Scotia Private High YieldIncome Pool Series I 910,438,382 284,866 11.5
Scotia Private AmericanCore-Plus Bond PoolSeries I 628,345,246 114,279 4.6
Scotia Private CanadianSmall Cap Pool Series I 538,492,305 117,518 4.8
Scotia Private CanadianMid Cap Pool Series I 57,129,896 87,258 3.5
Scotia Private U.S. MidCap Value Pool Series I 29,902,603 28,827 1.2
Scotia Private Global RealEstate Pool Series I 273,276,031 57,339 2.3
PIMCO Monthly IncomeFund (Canada) Class I 6,546,163,575 170,923 6.9
Scotia Private CanadianCorporate Bond PoolSeries I 4,143,683,984 171,678 6.9
Scotia Canadian IncomeFund Series I 5,990,064,451 286,056 11.6
Scotia Global GrowthFund Series I 606,644,389 143,024 5.8
2,296,352 92.9
The accompanying notes are an integral part of the financial statements.
356

Scotia Aria Moderate Build Portfolio (Unaudited – Continued)
FUND SPECIFIC NOTESFor the periods indicated in Note 1.
5. Comparison of net asset value per unit and netassets per unit (note 2)
The table below provides a comparison of the net assetvalue per unit and net assets per unit. The primary reasonfor the difference between the net asset value per unit andnet assets per unit, if any, is described in note 2.
June 30, 2015 December 31, 2014
Net asset valueper unit
($)
Net assetsper unit
($)
Net asset valueper unit
($)
Net assetsper unit
($)
Series A 10.25 10.25 9.83 9.83
Premium Series 10.25 10.25 9.83 9.83
The accompanying notes are an integral part of the financial statements.
357
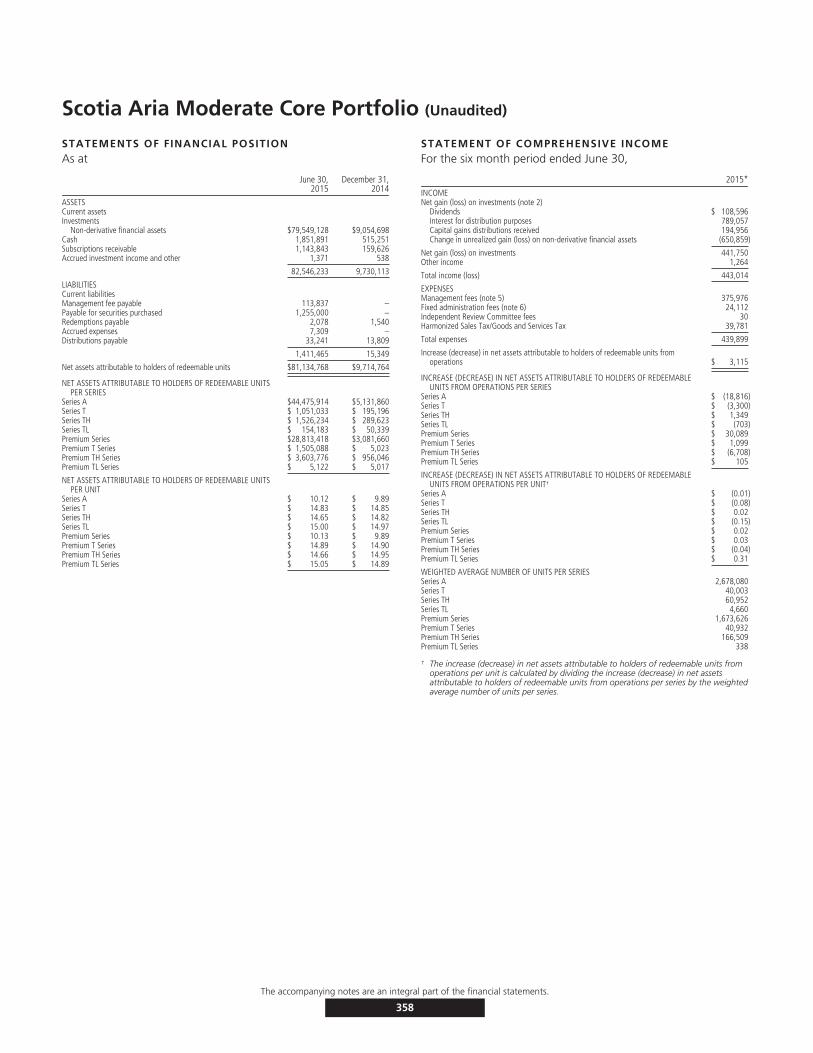
Scotia Aria Moderate Core Portfolio (Unaudited)
STATEMENTS OF FINANCIAL POSITIONAs at
June 30,2015
December 31,2014
ASSETSCurrent assetsInvestments
Non-derivative financial assets $79,549,128 $9,054,698Cash 1,851,891 515,251Subscriptions receivable 1,143,843 159,626Accrued investment income and other 1,371 538
82,546,233 9,730,113
LIABILITIESCurrent liabilitiesManagement fee payable 113,837 –Payable for securities purchased 1,255,000 –Redemptions payable 2,078 1,540Accrued expenses 7,309 –Distributions payable 33,241 13,809
1,411,465 15,349
Net assets attributable to holders of redeemable units $81,134,768 $9,714,764
NET ASSETS ATTRIBUTABLE TO HOLDERS OF REDEEMABLE UNITSPER SERIES
Series A $44,475,914 $5,131,860Series T $ 1,051,033 $ 195,196Series TH $ 1,526,234 $ 289,623Series TL $ 154,183 $ 50,339Premium Series $28,813,418 $3,081,660Premium T Series $ 1,505,088 $ 5,023Premium TH Series $ 3,603,776 $ 956,046Premium TL Series $ 5,122 $ 5,017
NET ASSETS ATTRIBUTABLE TO HOLDERS OF REDEEMABLE UNITSPER UNIT
Series A $ 10.12 $ 9.89Series T $ 14.83 $ 14.85Series TH $ 14.65 $ 14.82Series TL $ 15.00 $ 14.97Premium Series $ 10.13 $ 9.89Premium T Series $ 14.89 $ 14.90Premium TH Series $ 14.66 $ 14.95Premium TL Series $ 15.05 $ 14.89
STATEMENT OF COMPREHENSIVE INCOMEFor the six month period ended June 30,
2015*INCOMENet gain (loss) on investments (note 2)
Dividends $ 108,596Interest for distribution purposes 789,057Capital gains distributions received 194,956Change in unrealized gain (loss) on non-derivative financial assets (650,859)
Net gain (loss) on investments 441,750Other income 1,264
Total income (loss) 443,014
EXPENSESManagement fees (note 5) 375,976Fixed administration fees (note 6) 24,112Independent Review Committee fees 30Harmonized Sales Tax/Goods and Services Tax 39,781
Total expenses 439,899
Increase (decrease) in net assets attributable to holders of redeemable units fromoperations $ 3,115
INCREASE (DECREASE) IN NET ASSETS ATTRIBUTABLE TO HOLDERS OF REDEEMABLEUNITS FROM OPERATIONS PER SERIES
Series A $ (18,816)Series T $ (3,300)Series TH $ 1,349Series TL $ (703)Premium Series $ 30,089Premium T Series $ 1,099Premium TH Series $ (6,708)Premium TL Series $ 105
INCREASE (DECREASE) IN NET ASSETS ATTRIBUTABLE TO HOLDERS OF REDEEMABLEUNITS FROM OPERATIONS PER UNIT†
Series A $ (0.01)Series T $ (0.08)Series TH $ 0.02Series TL $ (0.15)Premium Series $ 0.02Premium T Series $ 0.03Premium TH Series $ (0.04)Premium TL Series $ 0.31
WEIGHTED AVERAGE NUMBER OF UNITS PER SERIESSeries A 2,678,080Series T 40,003Series TH 60,952Series TL 4,660Premium Series 1,673,626Premium T Series 40,932Premium TH Series 166,509Premium TL Series 338
† The increase (decrease) in net assets attributable to holders of redeemable units fromoperations per unit is calculated by dividing the increase (decrease) in net assetsattributable to holders of redeemable units from operations per series by the weightedaverage number of units per series.
The accompanying notes are an integral part of the financial statements.
358
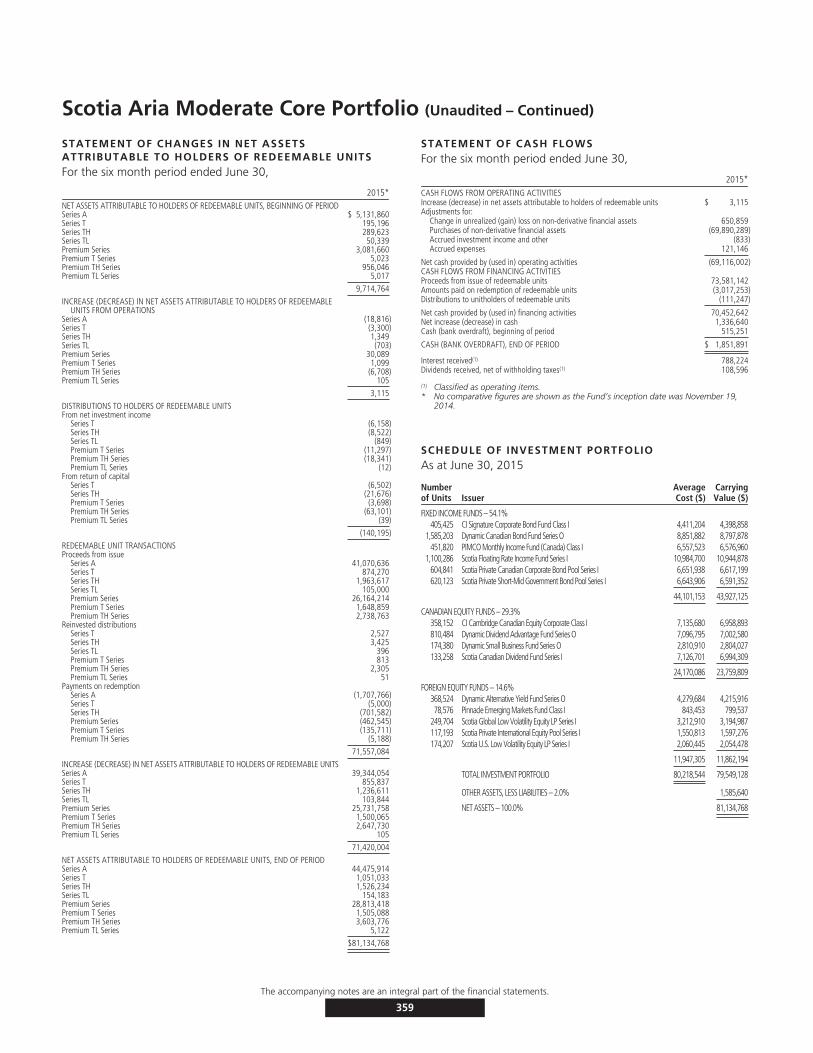
Scotia Aria Moderate Core Portfolio (Unaudited – Continued)
STATEMENT OF CHANGES IN NET ASSETSATTRIBUTABLE TO HOLDERS OF REDEEMABLE UNITSFor the six month period ended June 30,
2015*NET ASSETS ATTRIBUTABLE TO HOLDERS OF REDEEMABLE UNITS, BEGINNING OF PERIODSeries A $ 5,131,860Series T 195,196Series TH 289,623Series TL 50,339Premium Series 3,081,660Premium T Series 5,023Premium TH Series 956,046Premium TL Series 5,017
9,714,764
INCREASE (DECREASE) IN NET ASSETS ATTRIBUTABLE TO HOLDERS OF REDEEMABLEUNITS FROM OPERATIONS
Series A (18,816)Series T (3,300)Series TH 1,349Series TL (703)Premium Series 30,089Premium T Series 1,099Premium TH Series (6,708)Premium TL Series 105
3,115
DISTRIBUTIONS TO HOLDERS OF REDEEMABLE UNITSFrom net investment income
Series T (6,158)Series TH (8,522)Series TL (849)Premium T Series (11,297)Premium TH Series (18,341)Premium TL Series (12)
From return of capitalSeries T (6,502)Series TH (21,676)Premium T Series (3,698)Premium TH Series (63,101)Premium TL Series (39)
(140,195)
REDEEMABLE UNIT TRANSACTIONSProceeds from issue
Series A 41,070,636Series T 874,270Series TH 1,963,617Series TL 105,000Premium Series 26,164,214Premium T Series 1,648,859Premium TH Series 2,738,763
Reinvested distributionsSeries T 2,527Series TH 3,425Series TL 396Premium T Series 813Premium TH Series 2,305Premium TL Series 51
Payments on redemptionSeries A (1,707,766)Series T (5,000)Series TH (701,582)Premium Series (462,545)Premium T Series (135,711)Premium TH Series (5,188)
71,557,084
INCREASE (DECREASE) IN NET ASSETS ATTRIBUTABLE TO HOLDERS OF REDEEMABLE UNITSSeries A 39,344,054Series T 855,837Series TH 1,236,611Series TL 103,844Premium Series 25,731,758Premium T Series 1,500,065Premium TH Series 2,647,730Premium TL Series 105
71,420,004
NET ASSETS ATTRIBUTABLE TO HOLDERS OF REDEEMABLE UNITS, END OF PERIODSeries A 44,475,914Series T 1,051,033Series TH 1,526,234Series TL 154,183Premium Series 28,813,418Premium T Series 1,505,088Premium TH Series 3,603,776Premium TL Series 5,122
$81,134,768
STATEMENT OF CASH FLOWSFor the six month period ended June 30,
2015*CASH FLOWS FROM OPERATING ACTIVITIESIncrease (decrease) in net assets attributable to holders of redeemable units $ 3,115Adjustments for:
Change in unrealized (gain) loss on non-derivative financial assets 650,859Purchases of non-derivative financial assets (69,890,289)Accrued investment income and other (833)Accrued expenses 121,146
Net cash provided by (used in) operating activities (69,116,002)CASH FLOWS FROM FINANCING ACTIVITIESProceeds from issue of redeemable units 73,581,142Amounts paid on redemption of redeemable units (3,017,253)Distributions to unitholders of redeemable units (111,247)
Net cash provided by (used in) financing activities 70,452,642Net increase (decrease) in cash 1,336,640Cash (bank overdraft), beginning of period 515,251
CASH (BANK OVERDRAFT), END OF PERIOD $ 1,851,891
Interest received(1) 788,224Dividends received, net of withholding taxes(1) 108,596
(1) Classified as operating items.* No comparative figures are shown as the Fund’s inception date was November 19,
2014.
SCHEDULE OF INVESTMENT PORTFOLIOAs at June 30, 2015
Numberof Units Issuer
AverageCost ($)
CarryingValue ($)
FIXED INCOME FUNDS – 54.1%405,425 CI Signature Corporate Bond Fund Class I 4,411,204 4,398,858
1,585,203 Dynamic Canadian Bond Fund Series O 8,851,882 8,797,878451,820 PIMCO Monthly Income Fund (Canada) Class I 6,557,523 6,576,960
1,100,286 Scotia Floating Rate Income Fund Series I 10,984,700 10,944,878604,841 Scotia Private Canadian Corporate Bond Pool Series I 6,651,938 6,617,199620,123 Scotia Private Short-Mid Government Bond Pool Series I 6,643,906 6,591,352
44,101,153 43,927,125
CANADIAN EQUITY FUNDS – 29.3%358,152 CI Cambridge Canadian Equity Corporate Class I 7,135,680 6,958,893810,484 Dynamic Dividend Advantage Fund Series O 7,096,795 7,002,580174,380 Dynamic Small Business Fund Series O 2,810,910 2,804,027133,258 Scotia Canadian Dividend Fund Series I 7,126,701 6,994,309
24,170,086 23,759,809
FOREIGN EQUITY FUNDS – 14.6%368,524 Dynamic Alternative Yield Fund Series O 4,279,684 4,215,91678,576 Pinnacle Emerging Markets Fund Class I 843,453 799,537
249,704 Scotia Global Low Volatility Equity LP Series I 3,212,910 3,194,987117,193 Scotia Private International Equity Pool Series I 1,550,813 1,597,276174,207 Scotia U.S. Low Volatility Equity LP Series I 2,060,445 2,054,478
11,947,305 11,862,194
TOTAL INVESTMENT PORTFOLIO 80,218,544 79,549,128
OTHER ASSETS, LESS LIABILITIES – 2.0% 1,585,640
NET ASSETS – 100.0% 81,134,768
The accompanying notes are an integral part of the financial statements.
359
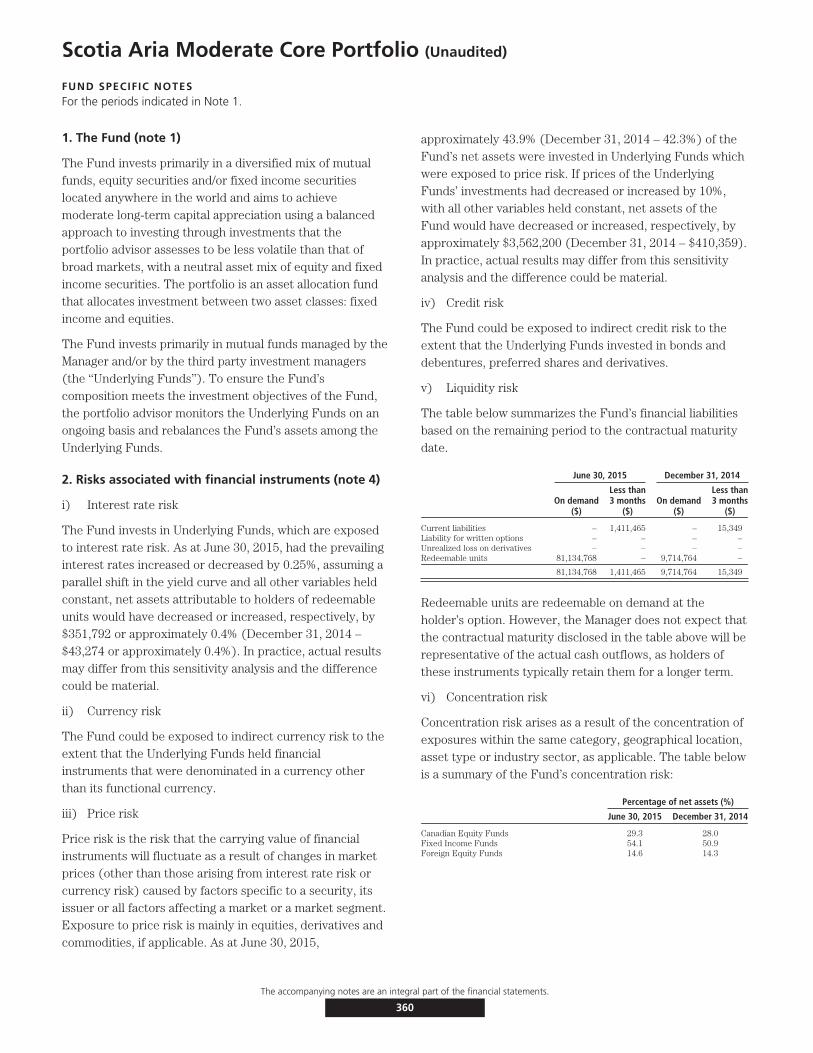
Scotia Aria Moderate Core Portfolio (Unaudited)
FUND SPECIFIC NOTESFor the periods indicated in Note 1.
1. The Fund (note 1)
The Fund invests primarily in a diversified mix of mutualfunds, equity securities and/or fixed income securitieslocated anywhere in the world and aims to achievemoderate long-term capital appreciation using a balancedapproach to investing through investments that theportfolio advisor assesses to be less volatile than that ofbroad markets, with a neutral asset mix of equity and fixedincome securities. The portfolio is an asset allocation fundthat allocates investment between two asset classes: fixedincome and equities.
The Fund invests primarily in mutual funds managed by theManager and/or by the third party investment managers(the ‘‘Underlying Funds’’). To ensure the Fund’scomposition meets the investment objectives of the Fund,the portfolio advisor monitors the Underlying Funds on anongoing basis and rebalances the Fund’s assets among theUnderlying Funds.
2. Risks associated with financial instruments (note 4)
i) Interest rate risk
The Fund invests in Underlying Funds, which are exposedto interest rate risk. As at June 30, 2015, had the prevailinginterest rates increased or decreased by 0.25%, assuming aparallel shift in the yield curve and all other variables heldconstant, net assets attributable to holders of redeemableunits would have decreased or increased, respectively, by$351,792 or approximately 0.4% (December 31, 2014 –$43,274 or approximately 0.4%). In practice, actual resultsmay differ from this sensitivity analysis and the differencecould be material.
ii) Currency risk
The Fund could be exposed to indirect currency risk to theextent that the Underlying Funds held financialinstruments that were denominated in a currency otherthan its functional currency.
iii) Price risk
Price risk is the risk that the carrying value of financialinstruments will fluctuate as a result of changes in marketprices (other than those arising from interest rate risk orcurrency risk) caused by factors specific to a security, itsissuer or all factors affecting a market or a market segment.Exposure to price risk is mainly in equities, derivatives andcommodities, if applicable. As at June 30, 2015,
approximately 43.9% (December 31, 2014 – 42.3%) of theFund’s net assets were invested in Underlying Funds whichwere exposed to price risk. If prices of the UnderlyingFunds’ investments had decreased or increased by 10%,with all other variables held constant, net assets of theFund would have decreased or increased, respectively, byapproximately $3,562,200 (December 31, 2014 – $410,359).In practice, actual results may differ from this sensitivityanalysis and the difference could be material.
iv) Credit risk
The Fund could be exposed to indirect credit risk to theextent that the Underlying Funds invested in bonds anddebentures, preferred shares and derivatives.
v) Liquidity risk
The table below summarizes the Fund’s financial liabilitiesbased on the remaining period to the contractual maturitydate.
June 30, 2015 December 31, 2014
On demand($)
Less than3 months
($)On demand
($)
Less than3 months
($)
Current liabilities – 1,411,465 – 15,349Liability for written options – – – –Unrealized loss on derivatives – – – –Redeemable units 81,134,768 – 9,714,764 –
81,134,768 1,411,465 9,714,764 15,349
Redeemable units are redeemable on demand at theholder’s option. However, the Manager does not expect thatthe contractual maturity disclosed in the table above will berepresentative of the actual cash outflows, as holders ofthese instruments typically retain them for a longer term.
vi) Concentration risk
Concentration risk arises as a result of the concentration ofexposures within the same category, geographical location,asset type or industry sector, as applicable. The table belowis a summary of the Fund’s concentration risk:
Percentage of net assets (%)
June 30, 2015 December 31, 2014
Canadian Equity Funds 29.3 28.0Fixed Income Funds 54.1 50.9Foreign Equity Funds 14.6 14.3
The accompanying notes are an integral part of the financial statements.
360
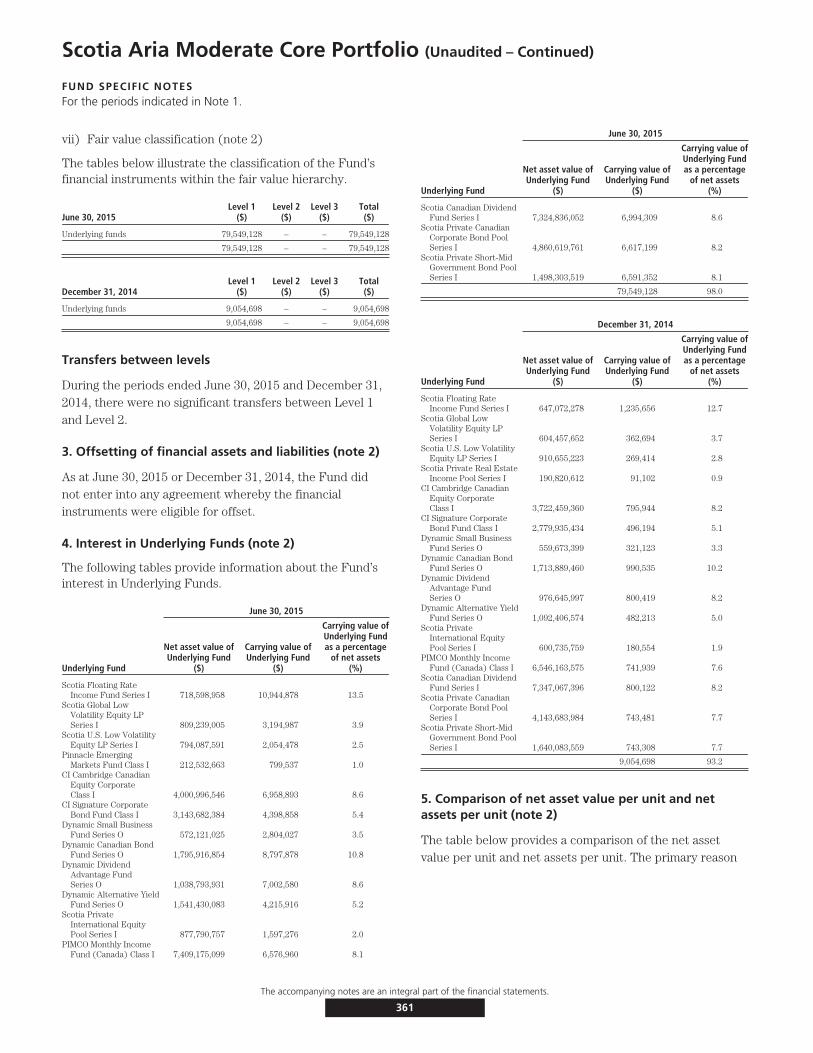
Scotia Aria Moderate Core Portfolio (Unaudited – Continued)
FUND SPECIFIC NOTESFor the periods indicated in Note 1.
vii) Fair value classification (note 2)
The tables below illustrate the classification of the Fund’sfinancial instruments within the fair value hierarchy.
June 30, 2015Level 1
($)Level 2
($)Level 3
($)Total($)
Underlying funds 79,549,128 – – 79,549,128
79,549,128 – – 79,549,128
December 31, 2014Level 1
($)Level 2
($)Level 3
($)Total($)
Underlying funds 9,054,698 – – 9,054,698
9,054,698 – – 9,054,698
Transfers between levels
During the periods ended June 30, 2015 and December 31,2014, there were no significant transfers between Level 1and Level 2.
3. Offsetting of financial assets and liabilities (note 2)
As at June 30, 2015 or December 31, 2014, the Fund didnot enter into any agreement whereby the financialinstruments were eligible for offset.
4. Interest in Underlying Funds (note 2)
The following tables provide information about the Fund’sinterest in Underlying Funds.
June 30, 2015
Underlying Fund
Net asset value ofUnderlying Fund
($)
Carrying value ofUnderlying Fund
($)
Carrying value ofUnderlying Fundas a percentage
of net assets(%)
Scotia Floating RateIncome Fund Series I 718,598,958 10,944,878 13.5
Scotia Global LowVolatility Equity LPSeries I 809,239,005 3,194,987 3.9
Scotia U.S. Low VolatilityEquity LP Series I 794,087,591 2,054,478 2.5
Pinnacle EmergingMarkets Fund Class I 212,532,663 799,537 1.0
CI Cambridge CanadianEquity CorporateClass I 4,000,996,546 6,958,893 8.6
CI Signature CorporateBond Fund Class I 3,143,682,384 4,398,858 5.4
Dynamic Small BusinessFund Series O 572,121,025 2,804,027 3.5
Dynamic Canadian BondFund Series O 1,795,916,854 8,797,878 10.8
Dynamic DividendAdvantage FundSeries O 1,038,793,931 7,002,580 8.6
Dynamic Alternative YieldFund Series O 1,541,430,083 4,215,916 5.2
Scotia PrivateInternational EquityPool Series I 877,790,757 1,597,276 2.0
PIMCO Monthly IncomeFund (Canada) Class I 7,409,175,099 6,576,960 8.1
June 30, 2015
Underlying Fund
Net asset value ofUnderlying Fund
($)
Carrying value ofUnderlying Fund
($)
Carrying value ofUnderlying Fundas a percentage
of net assets(%)
Scotia Canadian DividendFund Series I 7,324,836,052 6,994,309 8.6
Scotia Private CanadianCorporate Bond PoolSeries I 4,860,619,761 6,617,199 8.2
Scotia Private Short-MidGovernment Bond PoolSeries I 1,498,303,519 6,591,352 8.1
79,549,128 98.0
December 31, 2014
Underlying Fund
Net asset value ofUnderlying Fund
($)
Carrying value ofUnderlying Fund
($)
Carrying value ofUnderlying Fundas a percentage
of net assets(%)
Scotia Floating RateIncome Fund Series I 647,072,278 1,235,656 12.7
Scotia Global LowVolatility Equity LPSeries I 604,457,652 362,694 3.7
Scotia U.S. Low VolatilityEquity LP Series I 910,655,223 269,414 2.8
Scotia Private Real EstateIncome Pool Series I 190,820,612 91,102 0.9
CI Cambridge CanadianEquity CorporateClass I 3,722,459,360 795,944 8.2
CI Signature CorporateBond Fund Class I 2,779,935,434 496,194 5.1
Dynamic Small BusinessFund Series O 559,673,399 321,123 3.3
Dynamic Canadian BondFund Series O 1,713,889,460 990,535 10.2
Dynamic DividendAdvantage FundSeries O 976,645,997 800,419 8.2
Dynamic Alternative YieldFund Series O 1,092,406,574 482,213 5.0
Scotia PrivateInternational EquityPool Series I 600,735,759 180,554 1.9
PIMCO Monthly IncomeFund (Canada) Class I 6,546,163,575 741,939 7.6
Scotia Canadian DividendFund Series I 7,347,067,396 800,122 8.2
Scotia Private CanadianCorporate Bond PoolSeries I 4,143,683,984 743,481 7.7
Scotia Private Short-MidGovernment Bond PoolSeries I 1,640,083,559 743,308 7.7
9,054,698 93.2
5. Comparison of net asset value per unit and netassets per unit (note 2)
The table below provides a comparison of the net assetvalue per unit and net assets per unit. The primary reason
The accompanying notes are an integral part of the financial statements.
361
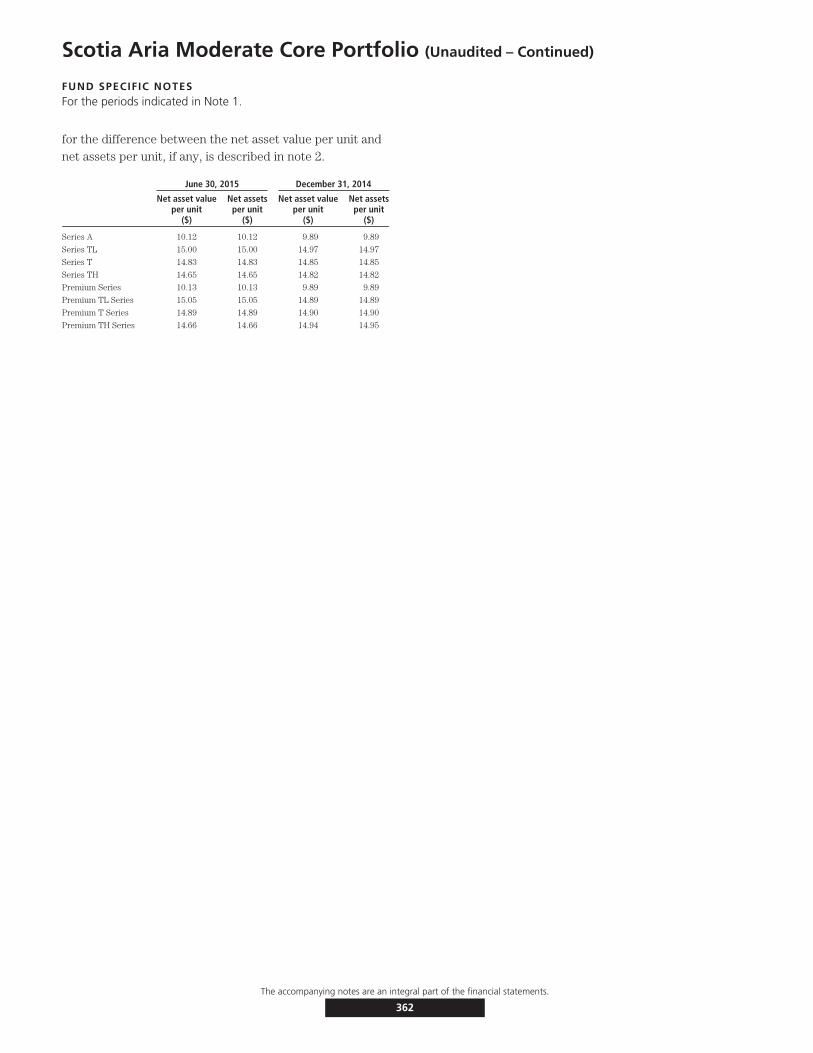
Scotia Aria Moderate Core Portfolio (Unaudited – Continued)
FUND SPECIFIC NOTESFor the periods indicated in Note 1.
for the difference between the net asset value per unit andnet assets per unit, if any, is described in note 2.
June 30, 2015 December 31, 2014
Net asset valueper unit
($)
Net assetsper unit
($)
Net asset valueper unit
($)
Net assetsper unit
($)
Series A 10.12 10.12 9.89 9.89
Series TL 15.00 15.00 14.97 14.97
Series T 14.83 14.83 14.85 14.85
Series TH 14.65 14.65 14.82 14.82
Premium Series 10.13 10.13 9.89 9.89
Premium TL Series 15.05 15.05 14.89 14.89
Premium T Series 14.89 14.89 14.90 14.90
Premium TH Series 14.66 14.66 14.94 14.95
The accompanying notes are an integral part of the financial statements.
362

Scotia Aria Moderate Pay Portfolio (Unaudited)
STATEMENTS OF FINANCIAL POSITIONAs at
June 30,2015
December 31,2014
ASSETSCurrent assetsInvestments
Non-derivative financial assets $36,287,200 $6,771,599Cash 854,240 651,676Subscriptions receivable 229,088 117,497Accrued investment income and other 582 367
37,371,110 7,541,139
LIABILITIESCurrent liabilitiesManagement fee payable 52,729 –Payable for securities purchased 285,000 631,000Redemptions payable 4,899 –Accrued expenses 3,399 –Distributions payable 45,140 49,464
391,167 680,464
Net assets attributable to holders of redeemable units $36,979,943 $6,860,675
NET ASSETS ATTRIBUTABLE TO HOLDERS OF REDEEMABLE UNITS PER SERIESSeries A $15,978,672 $2,783,103Series T $ 1,525,917 $ 365,017Series TH $ 1,687,147 $ 252,688Series TL $ 502,152 $ 110,362Premium Series $ 9,749,242 $1,008,452Premium T Series $ 3,069,867 $ 510,141Premium TH Series $ 3,963,800 $1,825,933Premium TL Series $ 503,146 $ 4,979
NET ASSETS ATTRIBUTABLE TO HOLDERS OF REDEEMABLE UNITSPER UNIT
Series A $ 10.06 $ 9.73Series T $ 14.74 $ 14.71Series TH $ 14.57 $ 14.82Series TL $ 14.91 $ 14.86Premium Series $ 10.07 $ 9.73Premium T Series $ 14.75 $ 14.84Premium TH Series $ 14.58 $ 14.74Premium TL Series $ 14.96 $ 14.64
STATEMENT OF COMPREHENSIVE INCOMEFor the six month period ended June 30,
2015*INCOMENet gain (loss) on investments (note 2)
Dividends $ 40,287Interest for distribution purposes 315,787Capital gains distributions received 77,146Change in unrealized gain (loss) on non-derivative financial assets (108,146)
Net gain (loss) on investments 325,074Other income 662
Total income (loss) 325,736
EXPENSESManagement fees (note 5) 178,223Fixed administration fees (note 6) 11,465Independent Review Committee fees 15Harmonized Sales Tax/Goods and Services Tax 18,857
Total expenses 208,560
Increase (decrease) in net assets attributable to holders of redeemable units fromoperations $ 117,176
INCREASE (DECREASE) IN NET ASSETS ATTRIBUTABLE TO HOLDERS OF REDEEMABLEUNITS FROM OPERATIONS PER SERIES
Series A $ 58,619Series T $ (779)Series TH $ (5,590)Series TL $ (2,830)Premium Series $ 32,298Premium T Series $ 12,593Premium TH Series $ 23,865Premium TL Series $ (1,000)
INCREASE (DECREASE) IN NET ASSETS ATTRIBUTABLE TO HOLDERS OF REDEEMABLEUNITS FROM OPERATIONS PER UNIT†
Series A $ 0.06Series T $ (0.01)Series TH $ (0.08)Series TL $ (0.17)Premium Series $ 0.06Premium T Series $ 0.10Premium TH Series $ 0.12Premium TL Series $ (0.50)
WEIGHTED AVERAGE NUMBER OF UNITS PER SERIESSeries A 1,031,892Series T 61,954Series TH 68,990Series TL 17,095Premium Series 564,040Premium T Series 127,940Premium TH Series 198,707Premium TL Series 1,997
† The increase (decrease) in net assets attributable to holders of redeemable units fromoperations per unit is calculated by dividing the increase (decrease) in net assetsattributable to holders of redeemable units from operations per series by the weightedaverage number of units per series.
The accompanying notes are an integral part of the financial statements.
363
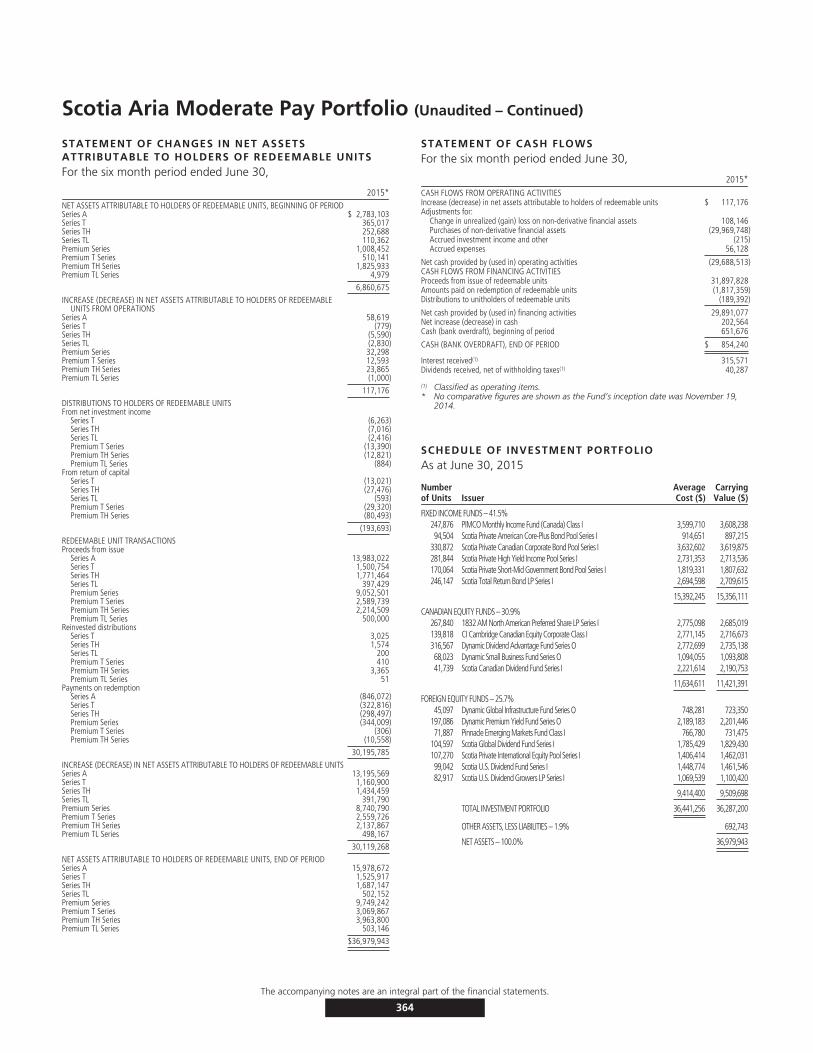
Scotia Aria Moderate Pay Portfolio (Unaudited – Continued)
STATEMENT OF CHANGES IN NET ASSETSATTRIBUTABLE TO HOLDERS OF REDEEMABLE UNITSFor the six month period ended June 30,
2015*NET ASSETS ATTRIBUTABLE TO HOLDERS OF REDEEMABLE UNITS, BEGINNING OF PERIODSeries A $ 2,783,103Series T 365,017Series TH 252,688Series TL 110,362Premium Series 1,008,452Premium T Series 510,141Premium TH Series 1,825,933Premium TL Series 4,979
6,860,675
INCREASE (DECREASE) IN NET ASSETS ATTRIBUTABLE TO HOLDERS OF REDEEMABLEUNITS FROM OPERATIONS
Series A 58,619Series T (779)Series TH (5,590)Series TL (2,830)Premium Series 32,298Premium T Series 12,593Premium TH Series 23,865Premium TL Series (1,000)
117,176
DISTRIBUTIONS TO HOLDERS OF REDEEMABLE UNITSFrom net investment income
Series T (6,263)Series TH (7,016)Series TL (2,416)Premium T Series (13,390)Premium TH Series (12,821)Premium TL Series (884)
From return of capitalSeries T (13,021)Series TH (27,476)Series TL (593)Premium T Series (29,320)Premium TH Series (80,493)
(193,693)
REDEEMABLE UNIT TRANSACTIONSProceeds from issue
Series A 13,983,022Series T 1,500,754Series TH 1,771,464Series TL 397,429Premium Series 9,052,501Premium T Series 2,589,739Premium TH Series 2,214,509Premium TL Series 500,000
Reinvested distributionsSeries T 3,025Series TH 1,574Series TL 200Premium T Series 410Premium TH Series 3,365Premium TL Series 51
Payments on redemptionSeries A (846,072)Series T (322,816)Series TH (298,497)Premium Series (344,009)Premium T Series (306)Premium TH Series (10,558)
30,195,785
INCREASE (DECREASE) IN NET ASSETS ATTRIBUTABLE TO HOLDERS OF REDEEMABLE UNITSSeries A 13,195,569Series T 1,160,900Series TH 1,434,459Series TL 391,790Premium Series 8,740,790Premium T Series 2,559,726Premium TH Series 2,137,867Premium TL Series 498,167
30,119,268
NET ASSETS ATTRIBUTABLE TO HOLDERS OF REDEEMABLE UNITS, END OF PERIODSeries A 15,978,672Series T 1,525,917Series TH 1,687,147Series TL 502,152Premium Series 9,749,242Premium T Series 3,069,867Premium TH Series 3,963,800Premium TL Series 503,146
$36,979,943
STATEMENT OF CASH FLOWSFor the six month period ended June 30,
2015*CASH FLOWS FROM OPERATING ACTIVITIESIncrease (decrease) in net assets attributable to holders of redeemable units $ 117,176Adjustments for:
Change in unrealized (gain) loss on non-derivative financial assets 108,146Purchases of non-derivative financial assets (29,969,748)Accrued investment income and other (215)Accrued expenses 56,128
Net cash provided by (used in) operating activities (29,688,513)CASH FLOWS FROM FINANCING ACTIVITIESProceeds from issue of redeemable units 31,897,828Amounts paid on redemption of redeemable units (1,817,359)Distributions to unitholders of redeemable units (189,392)
Net cash provided by (used in) financing activities 29,891,077Net increase (decrease) in cash 202,564Cash (bank overdraft), beginning of period 651,676
CASH (BANK OVERDRAFT), END OF PERIOD $ 854,240
Interest received(1) 315,571Dividends received, net of withholding taxes(1) 40,287
(1) Classified as operating items.* No comparative figures are shown as the Fund’s inception date was November 19,
2014.
SCHEDULE OF INVESTMENT PORTFOLIOAs at June 30, 2015
Numberof Units Issuer
AverageCost ($)
CarryingValue ($)
FIXED INCOME FUNDS – 41.5%247,876 PIMCO Monthly Income Fund (Canada) Class I 3,599,710 3,608,23894,504 Scotia Private American Core-Plus Bond Pool Series I 914,651 897,215
330,872 Scotia Private Canadian Corporate Bond Pool Series I 3,632,602 3,619,875281,844 Scotia Private High Yield Income Pool Series I 2,731,353 2,713,536170,064 Scotia Private Short-Mid Government Bond Pool Series I 1,819,331 1,807,632246,147 Scotia Total Return Bond LP Series I 2,694,598 2,709,615
15,392,245 15,356,111
CANADIAN EQUITY FUNDS – 30.9%267,840 1832 AM North American Preferred Share LP Series I 2,775,098 2,685,019139,818 CI Cambridge Canadian Equity Corporate Class I 2,771,145 2,716,673316,567 Dynamic Dividend Advantage Fund Series O 2,772,699 2,735,13868,023 Dynamic Small Business Fund Series O 1,094,055 1,093,80841,739 Scotia Canadian Dividend Fund Series I 2,221,614 2,190,753
11,634,611 11,421,391
FOREIGN EQUITY FUNDS – 25.7%45,097 Dynamic Global Infrastructure Fund Series O 748,281 723,350
197,086 Dynamic Premium Yield Fund Series O 2,189,183 2,201,44671,887 Pinnacle Emerging Markets Fund Class I 766,780 731,475
104,597 Scotia Global Dividend Fund Series I 1,785,429 1,829,430107,270 Scotia Private International Equity Pool Series I 1,406,414 1,462,03199,042 Scotia U.S. Dividend Fund Series I 1,448,774 1,461,54682,917 Scotia U.S. Dividend Growers LP Series I 1,069,539 1,100,420
9,414,400 9,509,698
TOTAL INVESTMENT PORTFOLIO 36,441,256 36,287,200
OTHER ASSETS, LESS LIABILITIES – 1.9% 692,743
NET ASSETS – 100.0% 36,979,943
The accompanying notes are an integral part of the financial statements.
364
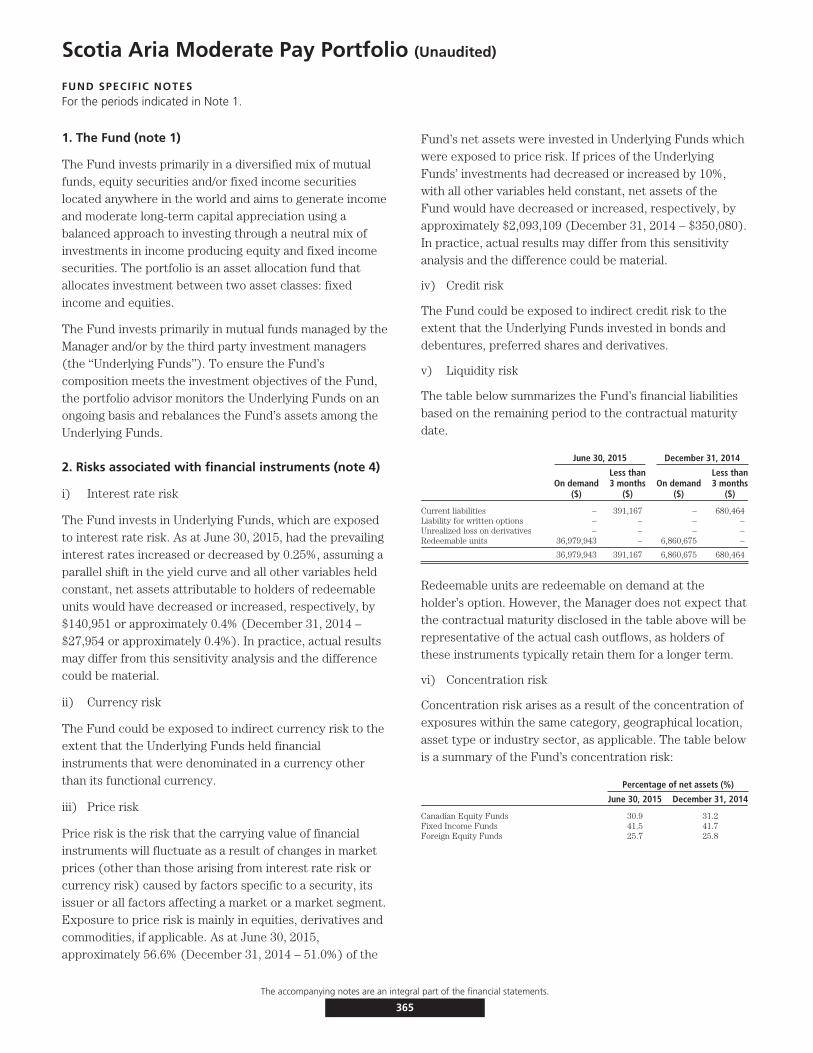
Scotia Aria Moderate Pay Portfolio (Unaudited)
FUND SPECIFIC NOTESFor the periods indicated in Note 1.
1. The Fund (note 1)
The Fund invests primarily in a diversified mix of mutualfunds, equity securities and/or fixed income securitieslocated anywhere in the world and aims to generate incomeand moderate long-term capital appreciation using abalanced approach to investing through a neutral mix ofinvestments in income producing equity and fixed incomesecurities. The portfolio is an asset allocation fund thatallocates investment between two asset classes: fixedincome and equities.
The Fund invests primarily in mutual funds managed by theManager and/or by the third party investment managers(the ‘‘Underlying Funds’’). To ensure the Fund’scomposition meets the investment objectives of the Fund,the portfolio advisor monitors the Underlying Funds on anongoing basis and rebalances the Fund’s assets among theUnderlying Funds.
2. Risks associated with financial instruments (note 4)
i) Interest rate risk
The Fund invests in Underlying Funds, which are exposedto interest rate risk. As at June 30, 2015, had the prevailinginterest rates increased or decreased by 0.25%, assuming aparallel shift in the yield curve and all other variables heldconstant, net assets attributable to holders of redeemableunits would have decreased or increased, respectively, by$140,951 or approximately 0.4% (December 31, 2014 –$27,954 or approximately 0.4%). In practice, actual resultsmay differ from this sensitivity analysis and the differencecould be material.
ii) Currency risk
The Fund could be exposed to indirect currency risk to theextent that the Underlying Funds held financialinstruments that were denominated in a currency otherthan its functional currency.
iii) Price risk
Price risk is the risk that the carrying value of financialinstruments will fluctuate as a result of changes in marketprices (other than those arising from interest rate risk orcurrency risk) caused by factors specific to a security, itsissuer or all factors affecting a market or a market segment.Exposure to price risk is mainly in equities, derivatives andcommodities, if applicable. As at June 30, 2015,approximately 56.6% (December 31, 2014 – 51.0%) of the
Fund’s net assets were invested in Underlying Funds whichwere exposed to price risk. If prices of the UnderlyingFunds’ investments had decreased or increased by 10%,with all other variables held constant, net assets of theFund would have decreased or increased, respectively, byapproximately $2,093,109 (December 31, 2014 – $350,080).In practice, actual results may differ from this sensitivityanalysis and the difference could be material.
iv) Credit risk
The Fund could be exposed to indirect credit risk to theextent that the Underlying Funds invested in bonds anddebentures, preferred shares and derivatives.
v) Liquidity risk
The table below summarizes the Fund’s financial liabilitiesbased on the remaining period to the contractual maturitydate.
June 30, 2015 December 31, 2014
On demand($)
Less than3 months
($)On demand
($)
Less than3 months
($)
Current liabilities – 391,167 – 680,464Liability for written options – – – –Unrealized loss on derivatives – – – –Redeemable units 36,979,943 – 6,860,675 –
36,979,943 391,167 6,860,675 680,464
Redeemable units are redeemable on demand at theholder’s option. However, the Manager does not expect thatthe contractual maturity disclosed in the table above will berepresentative of the actual cash outflows, as holders ofthese instruments typically retain them for a longer term.
vi) Concentration risk
Concentration risk arises as a result of the concentration ofexposures within the same category, geographical location,asset type or industry sector, as applicable. The table belowis a summary of the Fund’s concentration risk:
Percentage of net assets (%)
June 30, 2015 December 31, 2014
Canadian Equity Funds 30.9 31.2Fixed Income Funds 41.5 41.7Foreign Equity Funds 25.7 25.8
The accompanying notes are an integral part of the financial statements.
365
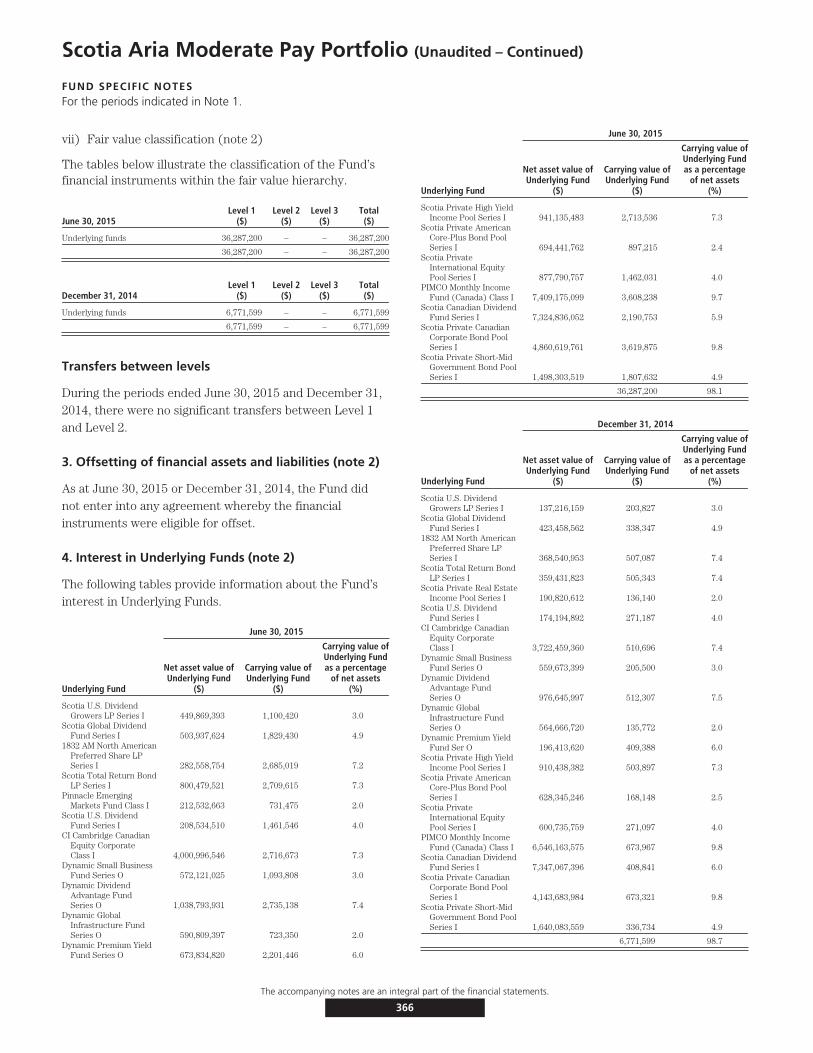
Scotia Aria Moderate Pay Portfolio (Unaudited – Continued)
FUND SPECIFIC NOTESFor the periods indicated in Note 1.
vii) Fair value classification (note 2)
The tables below illustrate the classification of the Fund’sfinancial instruments within the fair value hierarchy.
June 30, 2015Level 1
($)Level 2
($)Level 3
($)Total($)
Underlying funds 36,287,200 – – 36,287,200
36,287,200 – – 36,287,200
December 31, 2014Level 1
($)Level 2
($)Level 3
($)Total($)
Underlying funds 6,771,599 – – 6,771,599
6,771,599 – – 6,771,599
Transfers between levels
During the periods ended June 30, 2015 and December 31,2014, there were no significant transfers between Level 1and Level 2.
3. Offsetting of financial assets and liabilities (note 2)
As at June 30, 2015 or December 31, 2014, the Fund didnot enter into any agreement whereby the financialinstruments were eligible for offset.
4. Interest in Underlying Funds (note 2)
The following tables provide information about the Fund’sinterest in Underlying Funds.
June 30, 2015
Underlying Fund
Net asset value ofUnderlying Fund
($)
Carrying value ofUnderlying Fund
($)
Carrying value ofUnderlying Fundas a percentage
of net assets(%)
Scotia U.S. DividendGrowers LP Series I 449,869,393 1,100,420 3.0
Scotia Global DividendFund Series I 503,937,624 1,829,430 4.9
1832 AM North AmericanPreferred Share LPSeries I 282,558,754 2,685,019 7.2
Scotia Total Return BondLP Series I 800,479,521 2,709,615 7.3
Pinnacle EmergingMarkets Fund Class I 212,532,663 731,475 2.0
Scotia U.S. DividendFund Series I 208,534,510 1,461,546 4.0
CI Cambridge CanadianEquity CorporateClass I 4,000,996,546 2,716,673 7.3
Dynamic Small BusinessFund Series O 572,121,025 1,093,808 3.0
Dynamic DividendAdvantage FundSeries O 1,038,793,931 2,735,138 7.4
Dynamic GlobalInfrastructure FundSeries O 590,809,397 723,350 2.0
Dynamic Premium YieldFund Series O 673,834,820 2,201,446 6.0
June 30, 2015
Underlying Fund
Net asset value ofUnderlying Fund
($)
Carrying value ofUnderlying Fund
($)
Carrying value ofUnderlying Fundas a percentage
of net assets(%)
Scotia Private High YieldIncome Pool Series I 941,135,483 2,713,536 7.3
Scotia Private AmericanCore-Plus Bond PoolSeries I 694,441,762 897,215 2.4
Scotia PrivateInternational EquityPool Series I 877,790,757 1,462,031 4.0
PIMCO Monthly IncomeFund (Canada) Class I 7,409,175,099 3,608,238 9.7
Scotia Canadian DividendFund Series I 7,324,836,052 2,190,753 5.9
Scotia Private CanadianCorporate Bond PoolSeries I 4,860,619,761 3,619,875 9.8
Scotia Private Short-MidGovernment Bond PoolSeries I 1,498,303,519 1,807,632 4.9
36,287,200 98.1
December 31, 2014
Underlying Fund
Net asset value ofUnderlying Fund
($)
Carrying value ofUnderlying Fund
($)
Carrying value ofUnderlying Fundas a percentage
of net assets(%)
Scotia U.S. DividendGrowers LP Series I 137,216,159 203,827 3.0
Scotia Global DividendFund Series I 423,458,562 338,347 4.9
1832 AM North AmericanPreferred Share LPSeries I 368,540,953 507,087 7.4
Scotia Total Return BondLP Series I 359,431,823 505,343 7.4
Scotia Private Real EstateIncome Pool Series I 190,820,612 136,140 2.0
Scotia U.S. DividendFund Series I 174,194,892 271,187 4.0
CI Cambridge CanadianEquity CorporateClass I 3,722,459,360 510,696 7.4
Dynamic Small BusinessFund Series O 559,673,399 205,500 3.0
Dynamic DividendAdvantage FundSeries O 976,645,997 512,307 7.5
Dynamic GlobalInfrastructure FundSeries O 564,666,720 135,772 2.0
Dynamic Premium YieldFund Ser O 196,413,620 409,388 6.0
Scotia Private High YieldIncome Pool Series I 910,438,382 503,897 7.3
Scotia Private AmericanCore-Plus Bond PoolSeries I 628,345,246 168,148 2.5
Scotia PrivateInternational EquityPool Series I 600,735,759 271,097 4.0
PIMCO Monthly IncomeFund (Canada) Class I 6,546,163,575 673,967 9.8
Scotia Canadian DividendFund Series I 7,347,067,396 408,841 6.0
Scotia Private CanadianCorporate Bond PoolSeries I 4,143,683,984 673,321 9.8
Scotia Private Short-MidGovernment Bond PoolSeries I 1,640,083,559 336,734 4.9
6,771,599 98.7
The accompanying notes are an integral part of the financial statements.
366

Scotia Aria Moderate Pay Portfolio (Unaudited – Continued)
FUND SPECIFIC NOTESFor the periods indicated in Note 1.
5. Comparison of net asset value per unit and netassets per unit (note 2)
The table below provides a comparison of the net assetvalue per unit and net assets per unit. The primary reasonfor the difference between the net asset value per unit andnet assets per unit, if any, is described in note 2.
June 30, 2015 December 31, 2014
Net asset valueper unit
($)
Net assetsper unit
($)
Net asset valueper unit
($)
Net assetsper unit
($)
Series A 10.06 10.06 9.73 9.73
Series TL 14.91 14.91 14.86 14.86
Series T 14.74 14.74 14.71 14.71
Series TH 14.57 14.57 14.82 14.82
Premium Series 10.07 10.07 9.73 9.73
Premium TL Series 14.96 14.96 14.64 14.64
Premium T Series 14.75 14.75 14.84 14.84
Premium TH Series 14.58 14.58 14.74 14.74
The accompanying notes are an integral part of the financial statements.
367

Scotia Aria Progressive Build Portfolio (Unaudited)
STATEMENTS OF FINANCIAL POSITIONAs at
June 30,2015
December 31,2014
ASSETSCurrent assetsInvestments
Non-derivative financial assets $34,512,378 $4,054,126Cash 917,038 319,817Subscriptions receivable 93,797 498,927Accrued investment income and other 587 198
35,523,800 4,873,068
LIABILITIESCurrent liabilitiesManagement fee payable 53,840 –Payable for securities purchased 254,200 607,100Redemptions payable 732 –Accrued expenses 3,236 –
312,008 607,100
Net assets attributable to holders of redeemable units $35,211,792 $4,265,968
NET ASSETS ATTRIBUTABLE TO HOLDERS OF REDEEMABLE UNITS PER SERIESSeries A $23,291,744 $2,658,030Premium Series $11,920,048 $1,607,938
NET ASSETS ATTRIBUTABLE TO HOLDERS OF REDEEMABLE UNITS PER UNITSeries A $ 10.41 $ 9.80Premium Series $ 10.42 $ 9.80
STATEMENT OF COMPREHENSIVE INCOMEFor the six month period ended June 30,
2015*INCOMENet gain (loss) on investments (note 2)
Dividends $ 39,970Interest for distribution purposes 118,127Capital gains distributions received 166,910Change in unrealized gain (loss) on non-derivative financial assets 93,249
Net gain (loss) on investments 418,256
Total income (loss) 418,256
EXPENSESManagement fees (note 5) 169,183Fixed administration fees (note 6) 10,155Independent Review Committee fees 13Harmonized Sales Tax/Goods and Services Tax 18,430
Total expenses 197,781
Increase (decrease) in net assets attributable to holders of redeemable units fromoperations $ 220,475
INCREASE (DECREASE) IN NET ASSETS ATTRIBUTABLE TO HOLDERS OF REDEEMABLEUNITS FROM OPERATIONS PER SERIES
Series A $ 155,007Premium Series $ 65,468
INCREASE (DECREASE) IN NET ASSETS ATTRIBUTABLE TO HOLDERS OF REDEEMABLEUNITS FROM OPERATIONS PER UNIT†
Series A $ 0.12Premium Series $ 0.10
WEIGHTED AVERAGE NUMBER OF UNITS PER SERIESSeries A 1,303,703Premium Series 667,320
† The increase (decrease) in net assets attributable to holders of redeemable units fromoperations per unit is calculated by dividing the increase (decrease) in net assetsattributable to holders of redeemable units from operations per series by the weightedaverage number of units per series.
STATEMENT OF CHANGES IN NET ASSETSATTRIBUTABLE TO HOLDERS OF REDEEMABLE UNITSFor the six month period ended June 30,
2015*NET ASSETS ATTRIBUTABLE TO HOLDERS OF REDEEMABLE UNITS, BEGINNING OF
PERIODSeries A $ 2,658,030Premium Series 1,607,938
4,265,968
INCREASE (DECREASE) IN NET ASSETS ATTRIBUTABLE TO HOLDERS OF REDEEMABLEUNITS FROM OPERATIONS
Series A 155,007Premium Series 65,468
220,475
REDEEMABLE UNIT TRANSACTIONSProceeds from issue
Series A 21,380,941Premium Series 10,626,500
Payments on redemptionSeries A (902,234)Premium Series (379,858)
30,725,349
INCREASE (DECREASE) IN NET ASSETS ATTRIBUTABLE TO HOLDERS OF REDEEMABLE UNITSSeries A 20,633,714Premium Series 10,312,110
30,945,824
NET ASSETS ATTRIBUTABLE TO HOLDERS OF REDEEMABLE UNITS, END OF PERIODSeries A 23,291,744Premium Series 11,920,048
$35,211,792
STATEMENT OF CASH FLOWSFor the six month period ended June 30,
2015*CASH FLOWS FROM OPERATING ACTIVITIESIncrease (decrease) in net assets attributable to holders of redeemable units $ 220,475Adjustments for:
Change in unrealized (gain) loss on non-derivative financial assets (93,249)Purchases of non-derivative financial assets (30,717,902)Accrued investment income and other (389)Accrued expenses 57,076
Net cash provided by (used in) operating activities (30,533,989)CASH FLOWS FROM FINANCING ACTIVITIESProceeds from issue of redeemable units 32,412,571Amounts paid on redemption of redeemable units (1,281,361)
Net cash provided by (used in) financing activities 31,131,210Net increase (decrease) in cash 597,221Cash (bank overdraft), beginning of period 319,817
CASH (BANK OVERDRAFT), END OF PERIOD $ 917,038
Interest received(1) 117,737Dividends received, net of withholding taxes(1) 39,970
(1) Classified as operating items.* No comparative figures are shown as the Fund’s inception date was November 19,
2014.
The accompanying notes are an integral part of the financial statements.
368
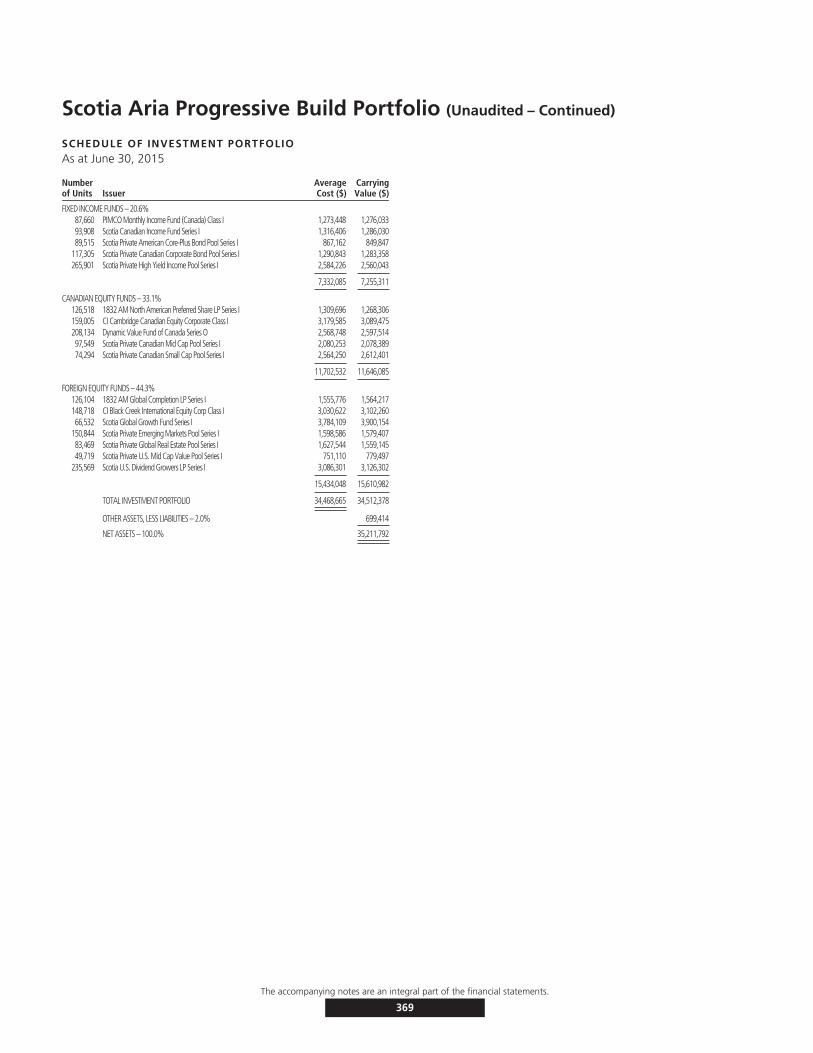
Scotia Aria Progressive Build Portfolio (Unaudited – Continued)
SCHEDULE OF INVESTMENT PORTFOLIOAs at June 30, 2015
Numberof Units Issuer
AverageCost ($)
CarryingValue ($)
FIXED INCOME FUNDS – 20.6%87,660 PIMCO Monthly Income Fund (Canada) Class I 1,273,448 1,276,03393,908 Scotia Canadian Income Fund Series I 1,316,406 1,286,03089,515 Scotia Private American Core-Plus Bond Pool Series I 867,162 849,847
117,305 Scotia Private Canadian Corporate Bond Pool Series I 1,290,843 1,283,358265,901 Scotia Private High Yield Income Pool Series I 2,584,226 2,560,043
7,332,085 7,255,311
CANADIAN EQUITY FUNDS – 33.1%126,518 1832 AM North American Preferred Share LP Series I 1,309,696 1,268,306159,005 CI Cambridge Canadian Equity Corporate Class I 3,179,585 3,089,475208,134 Dynamic Value Fund of Canada Series O 2,568,748 2,597,51497,549 Scotia Private Canadian Mid Cap Pool Series I 2,080,253 2,078,38974,294 Scotia Private Canadian Small Cap Pool Series I 2,564,250 2,612,401
11,702,532 11,646,085
FOREIGN EQUITY FUNDS – 44.3%126,104 1832 AM Global Completion LP Series I 1,555,776 1,564,217148,718 CI Black Creek International Equity Corp Class I 3,030,622 3,102,26066,532 Scotia Global Growth Fund Series I 3,784,109 3,900,154
150,844 Scotia Private Emerging Markets Pool Series I 1,598,586 1,579,40783,469 Scotia Private Global Real Estate Pool Series I 1,627,544 1,559,14549,719 Scotia Private U.S. Mid Cap Value Pool Series I 751,110 779,497
235,569 Scotia U.S. Dividend Growers LP Series I 3,086,301 3,126,302
15,434,048 15,610,982
TOTAL INVESTMENT PORTFOLIO 34,468,665 34,512,378
OTHER ASSETS, LESS LIABILITIES – 2.0% 699,414
NET ASSETS – 100.0% 35,211,792
The accompanying notes are an integral part of the financial statements.
369

Scotia Aria Progressive Build Portfolio (Unaudited)
FUND SPECIFIC NOTESFor the periods indicated in Note 1.
1. The Fund (note 1)
The Fund invests primarily in a diversified mix of mutualfunds, equity securities and/or fixed income securitieslocated anywhere in the world and aims to achieve long-term capital appreciation with a secondary focus on incomegeneration using a balanced approach to investing. Themajority of the portfolio’s assets will be held in equitysecurities. The portfolio is an asset allocation fund thatallocates investment between two asset classes: fixedincome and equities.
The Fund invests primarily in mutual funds managed by theManager and/or by the third party investment managers(the ‘‘Underlying Funds’’). To ensure the Fund’scomposition meets the investment objectives of the Fund,the portfolio advisor monitors the Underlying Funds on anongoing basis and rebalances the Fund’s assets among theUnderlying Funds.
2. Risks associated with financial instruments (note 4)
i) Interest rate risk
The Fund invests in Underlying Funds, which are exposedto interest rate risk. As at June 30, 2015, had the prevailinginterest rates increased or decreased by 0.25%, assuming aparallel shift in the yield curve and all other variables heldconstant, net assets attributable to holders of redeemableunits would have decreased or increased, respectively, by$75,469 or approximately 0.2% (December 31, 2014 –$9,215, or approximately 0.2%). In practice, actual resultsmay differ from this sensitivity analysis and the differencecould be material.
ii) Currency risk
The Fund could be exposed to indirect currency risk to theextent that the Underlying Funds held financialinstruments that were denominated in a currency otherthan its functional currency.
iii) Price risk
Price risk is the risk that the carrying value of financialinstruments will fluctuate as a result of changes in marketprices (other than those arising from interest rate risk orcurrency risk) caused by factors specific to a security, itsissuer or all factors affecting a market or a market segment.Exposure to price risk is mainly in equities, derivatives andcommodities, if applicable. As at June 30, 2015,approximately 77.4% (December 31, 2014 – 75.0%) of theFund’s net assets were invested in Underlying Funds which
were exposed to price risk. If prices of the UnderlyingFunds’ investments had decreased or increased by 10%,with all other variables held constant, net assets of theFund would have decreased or increased, respectively, byapproximately $2,725,707 (December 31, 2014 – $319,839).In practice, actual results may differ from this sensitivityanalysis and the difference could be material.
iv) Credit risk
The Fund could be exposed to indirect credit risk to theextent that the Underlying Funds invested in bonds anddebentures, preferred shares and derivatives.
v) Liquidity risk
The table below summarizes the Fund’s financial liabilitiesbased on the remaining period to the contractual maturitydate.
June 30, 2015 December 31, 2014
On demand($)
Less than3 months
($)On demand
($)
Less than3 months
($)
Current liabilities – 312,008 – 607,100Liability for written options – – – –Unrealized loss on derivatives – – – –Redeemable units 35,211,792 – 4,265,968 –
35,211,792 312,008 4,265,968 607,100
Redeemable units are redeemable on demand at theholder’s option. However, the Manager does not expect thatthe contractual maturity disclosed in the table above will berepresentative of the actual cash outflows, as holders ofthese instruments typically retain them for a longer term.
vi) Concentration risk
Concentration risk arises as a result of the concentration ofexposures within the same category, geographical location,asset type or industry sector, as applicable. The table belowis a summary of the Fund’s concentration risk:
Percentage of net assets (%)
June 30, 2015 December 31, 2014
Canadian Equity Funds 33.1 32.3Fixed Income Funds 20.6 20.0Foreign Equity Funds 44.3 42.7
vii) Fair value classification (note 2)
The tables below illustrate the classification of the Fund’sfinancial instruments within the fair value hierarchy.
June 30, 2015Level 1
($)Level 2
($)Level 3
($)Total($)
Underlying funds 34,512,378 – – 34,512,378
34,512,378 – – 34,512,378
The accompanying notes are an integral part of the financial statements.
370
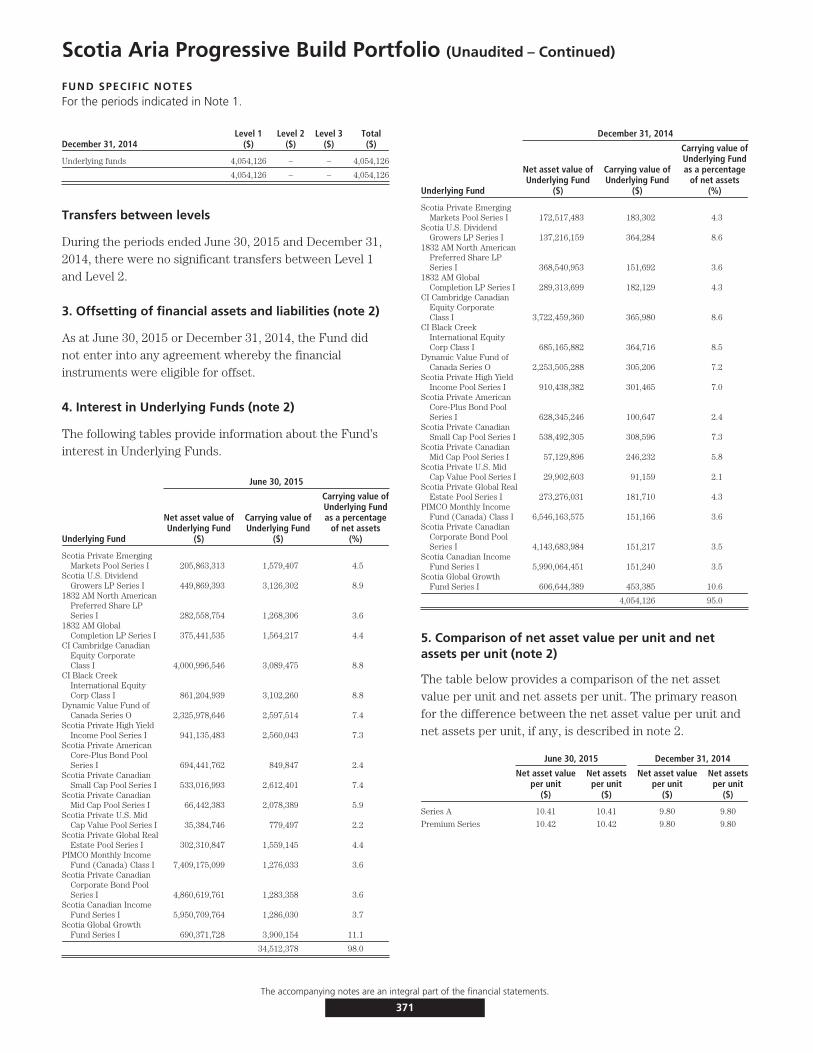
Scotia Aria Progressive Build Portfolio (Unaudited – Continued)
FUND SPECIFIC NOTESFor the periods indicated in Note 1.
December 31, 2014Level 1
($)Level 2
($)Level 3
($)Total($)
Underlying funds 4,054,126 – – 4,054,126
4,054,126 – – 4,054,126
Transfers between levels
During the periods ended June 30, 2015 and December 31,2014, there were no significant transfers between Level 1and Level 2.
3. Offsetting of financial assets and liabilities (note 2)
As at June 30, 2015 or December 31, 2014, the Fund didnot enter into any agreement whereby the financialinstruments were eligible for offset.
4. Interest in Underlying Funds (note 2)
The following tables provide information about the Fund’sinterest in Underlying Funds.
June 30, 2015
Underlying Fund
Net asset value ofUnderlying Fund
($)
Carrying value ofUnderlying Fund
($)
Carrying value ofUnderlying Fundas a percentage
of net assets(%)
Scotia Private EmergingMarkets Pool Series I 205,863,313 1,579,407 4.5
Scotia U.S. DividendGrowers LP Series I 449,869,393 3,126,302 8.9
1832 AM North AmericanPreferred Share LPSeries I 282,558,754 1,268,306 3.6
1832 AM GlobalCompletion LP Series I 375,441,535 1,564,217 4.4
CI Cambridge CanadianEquity CorporateClass I 4,000,996,546 3,089,475 8.8
CI Black CreekInternational EquityCorp Class I 861,204,939 3,102,260 8.8
Dynamic Value Fund ofCanada Series O 2,325,978,646 2,597,514 7.4
Scotia Private High YieldIncome Pool Series I 941,135,483 2,560,043 7.3
Scotia Private AmericanCore-Plus Bond PoolSeries I 694,441,762 849,847 2.4
Scotia Private CanadianSmall Cap Pool Series I 533,016,993 2,612,401 7.4
Scotia Private CanadianMid Cap Pool Series I 66,442,383 2,078,389 5.9
Scotia Private U.S. MidCap Value Pool Series I 35,384,746 779,497 2.2
Scotia Private Global RealEstate Pool Series I 302,310,847 1,559,145 4.4
PIMCO Monthly IncomeFund (Canada) Class I 7,409,175,099 1,276,033 3.6
Scotia Private CanadianCorporate Bond PoolSeries I 4,860,619,761 1,283,358 3.6
Scotia Canadian IncomeFund Series I 5,950,709,764 1,286,030 3.7
Scotia Global GrowthFund Series I 690,371,728 3,900,154 11.1
34,512,378 98.0
December 31, 2014
Underlying Fund
Net asset value ofUnderlying Fund
($)
Carrying value ofUnderlying Fund
($)
Carrying value ofUnderlying Fundas a percentage
of net assets(%)
Scotia Private EmergingMarkets Pool Series I 172,517,483 183,302 4.3
Scotia U.S. DividendGrowers LP Series I 137,216,159 364,284 8.6
1832 AM North AmericanPreferred Share LPSeries I 368,540,953 151,692 3.6
1832 AM GlobalCompletion LP Series I 289,313,699 182,129 4.3
CI Cambridge CanadianEquity CorporateClass I 3,722,459,360 365,980 8.6
CI Black CreekInternational EquityCorp Class I 685,165,882 364,716 8.5
Dynamic Value Fund ofCanada Series O 2,253,505,288 305,206 7.2
Scotia Private High YieldIncome Pool Series I 910,438,382 301,465 7.0
Scotia Private AmericanCore-Plus Bond PoolSeries I 628,345,246 100,647 2.4
Scotia Private CanadianSmall Cap Pool Series I 538,492,305 308,596 7.3
Scotia Private CanadianMid Cap Pool Series I 57,129,896 246,232 5.8
Scotia Private U.S. MidCap Value Pool Series I 29,902,603 91,159 2.1
Scotia Private Global RealEstate Pool Series I 273,276,031 181,710 4.3
PIMCO Monthly IncomeFund (Canada) Class I 6,546,163,575 151,166 3.6
Scotia Private CanadianCorporate Bond PoolSeries I 4,143,683,984 151,217 3.5
Scotia Canadian IncomeFund Series I 5,990,064,451 151,240 3.5
Scotia Global GrowthFund Series I 606,644,389 453,385 10.6
4,054,126 95.0
5. Comparison of net asset value per unit and netassets per unit (note 2)
The table below provides a comparison of the net assetvalue per unit and net assets per unit. The primary reasonfor the difference between the net asset value per unit andnet assets per unit, if any, is described in note 2.
June 30, 2015 December 31, 2014
Net asset valueper unit
($)
Net assetsper unit
($)
Net asset valueper unit
($)
Net assetsper unit
($)
Series A 10.41 10.41 9.80 9.80
Premium Series 10.42 10.42 9.80 9.80
The accompanying notes are an integral part of the financial statements.
371
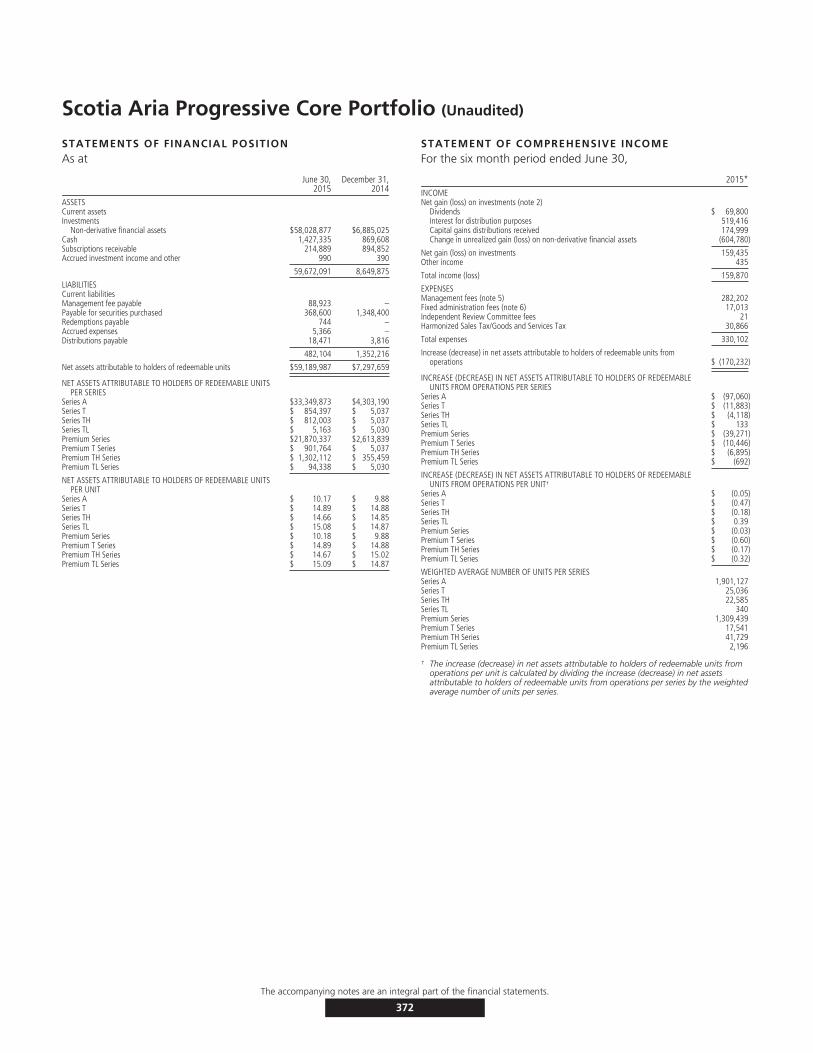
Scotia Aria Progressive Core Portfolio (Unaudited)
STATEMENTS OF FINANCIAL POSITIONAs at
June 30,2015
December 31,2014
ASSETSCurrent assetsInvestments
Non-derivative financial assets $58,028,877 $6,885,025Cash 1,427,335 869,608Subscriptions receivable 214,889 894,852Accrued investment income and other 990 390
59,672,091 8,649,875
LIABILITIESCurrent liabilitiesManagement fee payable 88,923 –Payable for securities purchased 368,600 1,348,400Redemptions payable 744 –Accrued expenses 5,366 –Distributions payable 18,471 3,816
482,104 1,352,216
Net assets attributable to holders of redeemable units $59,189,987 $7,297,659
NET ASSETS ATTRIBUTABLE TO HOLDERS OF REDEEMABLE UNITSPER SERIES
Series A $33,349,873 $4,303,190Series T $ 854,397 $ 5,037Series TH $ 812,003 $ 5,037Series TL $ 5,163 $ 5,030Premium Series $21,870,337 $2,613,839Premium T Series $ 901,764 $ 5,037Premium TH Series $ 1,302,112 $ 355,459Premium TL Series $ 94,338 $ 5,030
NET ASSETS ATTRIBUTABLE TO HOLDERS OF REDEEMABLE UNITSPER UNIT
Series A $ 10.17 $ 9.88Series T $ 14.89 $ 14.88Series TH $ 14.66 $ 14.85Series TL $ 15.08 $ 14.87Premium Series $ 10.18 $ 9.88Premium T Series $ 14.89 $ 14.88Premium TH Series $ 14.67 $ 15.02Premium TL Series $ 15.09 $ 14.87
STATEMENT OF COMPREHENSIVE INCOMEFor the six month period ended June 30,
2015*INCOMENet gain (loss) on investments (note 2)
Dividends $ 69,800Interest for distribution purposes 519,416Capital gains distributions received 174,999Change in unrealized gain (loss) on non-derivative financial assets (604,780)
Net gain (loss) on investments 159,435Other income 435
Total income (loss) 159,870
EXPENSESManagement fees (note 5) 282,202Fixed administration fees (note 6) 17,013Independent Review Committee fees 21Harmonized Sales Tax/Goods and Services Tax 30,866
Total expenses 330,102
Increase (decrease) in net assets attributable to holders of redeemable units fromoperations $ (170,232)
INCREASE (DECREASE) IN NET ASSETS ATTRIBUTABLE TO HOLDERS OF REDEEMABLEUNITS FROM OPERATIONS PER SERIES
Series A $ (97,060)Series T $ (11,883)Series TH $ (4,118)Series TL $ 133Premium Series $ (39,271)Premium T Series $ (10,446)Premium TH Series $ (6,895)Premium TL Series $ (692)
INCREASE (DECREASE) IN NET ASSETS ATTRIBUTABLE TO HOLDERS OF REDEEMABLEUNITS FROM OPERATIONS PER UNIT†
Series A $ (0.05)Series T $ (0.47)Series TH $ (0.18)Series TL $ 0.39Premium Series $ (0.03)Premium T Series $ (0.60)Premium TH Series $ (0.17)Premium TL Series $ (0.32)
WEIGHTED AVERAGE NUMBER OF UNITS PER SERIESSeries A 1,901,127Series T 25,036Series TH 22,585Series TL 340Premium Series 1,309,439Premium T Series 17,541Premium TH Series 41,729Premium TL Series 2,196
† The increase (decrease) in net assets attributable to holders of redeemable units fromoperations per unit is calculated by dividing the increase (decrease) in net assetsattributable to holders of redeemable units from operations per series by the weightedaverage number of units per series.
The accompanying notes are an integral part of the financial statements.
372

Scotia Aria Progressive Core Portfolio (Unaudited – Continued)
STATEMENT OF CHANGES IN NET ASSETSATTRIBUTABLE TO HOLDERS OF REDEEMABLE UNITSFor the six month period ended June 30,
2015*NET ASSETS ATTRIBUTABLE TO HOLDERS OF REDEEMABLE UNITS, BEGINNING
OF PERIODSeries A $ 4,303,190Series T 5,037Series TH 5,037Series TL 5,030Premium Series 2,613,839Premium T Series 5,037Premium TH Series 355,459Premium TL Series 5,030
7,297,659
INCREASE (DECREASE) IN NET ASSETS ATTRIBUTABLE TO HOLDERS OF REDEEMABLEUNITS FROM OPERATIONS
Series A (97,060)Series T (11,883)Series TH (4,118)Series TL 133Premium Series (39,271)Premium T Series (10,446)Premium TH Series (6,895)Premium TL Series (692)
(170,232)
DISTRIBUTIONS TO HOLDERS OF REDEEMABLE UNITSFrom net investment income
Series T (4,931)Series TH (4,750)Series TL (1)Premium T Series (6,553)Premium TH Series (7,170)Premium TL Series (433)
From return of capitalSeries T (5,722)Series TH (10,894)Series TL (63)Premium T Series (1,402)Premium TH Series (19,076)
(60,995)
REDEEMABLE UNIT TRANSACTIONSProceeds from issue
Series A 30,875,322Series T 871,151Series TH 824,854Premium Series 19,599,155Premium T Series 915,000Premium TH Series 979,600Premium TL Series 90,000
Reinvested distributionsSeries T 745Series TH 1,874Series TL 64Premium T Series 128Premium TH Series 194Premium TL Series 433
Payments on redemptionSeries A (1,731,579)Premium Series (303,386)
52,123,555
INCREASE (DECREASE) IN NET ASSETS ATTRIBUTABLE TO HOLDERS OFREDEEMABLE UNITS
Series A 29,046,683Series T 849,360Series TH 806,966Series TL 133Premium Series 19,256,498Premium T Series 896,727Premium TH Series 946,653Premium TL Series 89,308
51,892,328
NET ASSETS ATTRIBUTABLE TO HOLDERS OF REDEEMABLE UNITS, END OF PERIODSeries A 33,349,873Series T 854,397Series TH 812,003Series TL 5,163Premium Series 21,870,337Premium T Series 901,764Premium TH Series 1,302,112Premium TL Series 94,338
$59,189,987
STATEMENT OF CASH FLOWSFor the six month period ended June 30,
2015*CASH FLOWS FROM OPERATING ACTIVITIESIncrease (decrease) in net assets attributable to holders of redeemable units $ (170,232)Adjustments for:
Change in unrealized (gain) loss on non-derivative financial assets 604,780Purchases of non-derivative financial assets (52,728,432)Accrued investment income and other (600)Accrued expenses 94,289
Net cash provided by (used in) operating activities (52,200,195)CASH FLOWS FROM FINANCING ACTIVITIESProceeds from issue of redeemable units 54,835,044Amounts paid on redemption of redeemable units (2,034,220)Distributions to unitholders of redeemable units (42,902)
Net cash provided by (used in) financing activities 52,757,922Net increase (decrease) in cash 557,727Cash (bank overdraft), beginning of period 869,608
CASH (BANK OVERDRAFT), END OF PERIOD $ 1,427,335
Interest received(1) 518,817Dividends received, net of withholding taxes(1) 69,800
(1) Classified as operating items.* No comparative figures are shown as the Fund’s inception date was November 19,
2014.
SCHEDULE OF INVESTMENT PORTFOLIOAs at June 30, 2015
Numberof Units Issuer
AverageCost ($)
CarryingValue ($)
FIXED INCOME FUNDS – 34.7%283,674 CI Signature Corporate Bond Fund Class I 3,089,542 3,077,860741,747 Dynamic Canadian Bond Fund Series O 4,143,516 4,116,696210,769 PIMCO Monthly Income Fund (Canada) Class I 3,061,396 3,068,078513,538 Scotia Floating Rate Income Fund Series I 5,126,327 5,108,315282,368 Scotia Private Canadian Corporate Bond Pool Series I 3,106,269 3,089,219193,586 Scotia Private Short-Mid Government Bond Pool Series I 2,074,204 2,057,646
20,601,254 20,517,814
CANADIAN EQUITY FUNDS – 37.7%335,575 CI Cambridge Canadian Equity Corporate Class I 6,708,278 6,520,226914,646 Dynamic Dividend Advantage Fund Series O 8,036,388 7,902,539245,865 Dynamic Small Business Fund Series O 3,979,821 3,953,50775,412 Scotia Canadian Dividend Fund Series I 4,046,567 3,958,128
22,771,054 22,334,400
FOREIGN EQUITY FUNDS – 25.6%347,854 Dynamic Alternative Yield Fund Series O 4,042,461 3,979,446115,880 Pinnacle Emerging Markets Fund Class I 1,244,029 1,179,111367,956 Scotia Global Low Volatility Equity LP Series I 4,745,564 4,708,030171,792 Scotia Private International Equity Pool Series I 2,284,150 2,341,426251,723 Scotia U.S. Low Volatility Equity LP Series I 2,976,378 2,968,650
15,292,582 15,176,663
TOTAL INVESTMENT PORTFOLIO 58,664,890 58,028,877
OTHER ASSETS, LESS LIABILITIES – 2.0% 1,161,110
NET ASSETS – 100.0% 59,189,987
The accompanying notes are an integral part of the financial statements.
373

Scotia Aria Progressive Core Portfolio (Unaudited)
FUND SPECIFIC NOTESFor the periods indicated in Note 1.
1. The Fund (note 1)
The Fund invests primarily in a diversified mix of mutualfunds, equity securities and/or fixed income securitieslocated anywhere in the world and aims to achieve long-term capital appreciation using a balanced approach toinvesting through investments that the portfolio advisorassesses to be less volatile than that of broad markets. Themajority of the portfolio’s assets will be held in equitysecurities. The portfolio is an asset allocation fund thatallocates investment between two asset classes: fixedincome and equities.
The Fund invests primarily in mutual funds managed by theManager and/or by the third party investment managers(the ‘‘Underlying Funds’’). To ensure the Fund’scomposition meets the investment objectives of the Fund,the portfolio advisor monitors the Underlying Funds on anongoing basis and rebalances the Fund’s assets among theUnderlying Funds.
2. Risks associated with financial instruments (note 4)
i) Interest rate risk
The Fund invests in Underlying Funds, which are exposedto interest rate risk. As at June 30, 2015, had the prevailinginterest rates increased or decreased by 0.25%, assuming aparallel shift in the yield curve and all other variables heldconstant, net assets attributable to holders of redeemableunits would have decreased or increased, respectively, by$155,742 or approximately 0.3% (December 31, 2014 –$20,369, or approximately 0.3%). In practice, actual resultsmay differ from this sensitivity analysis and the differencecould be material.
ii) Currency risk
The Fund could be exposed to indirect currency risk to theextent that the Underlying Funds held financialinstruments that were denominated in a currency otherthan its functional currency.
iii) Price risk
Price risk is the risk that the carrying value of financialinstruments will fluctuate as a result of changes in marketprices (other than those arising from interest rate risk orcurrency risk) caused by factors specific to a security, itsissuer or all factors affecting a market or a market segment.Exposure to price risk is mainly in equities, derivatives andcommodities, if applicable. As at June 30, 2015,
approximately 63.3% (December 31, 2014 – 61.5%) of theFund’s net assets were invested in Underlying Funds whichwere exposed to price risk. If prices of the UnderlyingFunds’ investments had decreased or increased by 10%,with all other variables held constant, net assets of theFund would have decreased or increased, respectively, byapproximately $3,751,106 (December 31, 2014 – $448,658).In practice, actual results may differ from this sensitivityanalysis and the difference could be material.
iv) Credit risk
The Fund could be exposed to indirect credit risk to theextent that the Underlying Funds invested in bonds anddebentures, preferred shares and derivatives.
v) Liquidity risk
The table below summarizes the Fund’s financial liabilitiesbased on the remaining period to the contractual maturitydate.
June 30, 2015 December 31, 2014
On demand($)
Less than3 months
($)On demand
($)
Less than3 months
($)
Current liabilities – 482,104 – 1,352,216Liability for written options – – – –Unrealized loss on derivatives – – – –Redeemable units 59,189,987 – 7,297,659 –
59,189,987 482,104 7,297,659 1,352,216
Redeemable units are redeemable on demand at theholder’s option. However, the Manager does not expect thatthe contractual maturity disclosed in the table above will berepresentative of the actual cash outflows, as holders ofthese instruments typically retain them for a longer term.
vi) Concentration risk
Concentration risk arises as a result of the concentration ofexposures within the same category, geographical location,asset type or industry sector, as applicable. The table belowis a summary of the Fund’s concentration risk:
Percentage of net assets (%)
June 30, 2015 December 31, 2014
Canadian Equity Funds 37.7 36.2Fixed Income Funds 34.7 32.9Foreign Equity Funds 25.6 25.2
The accompanying notes are an integral part of the financial statements.
374
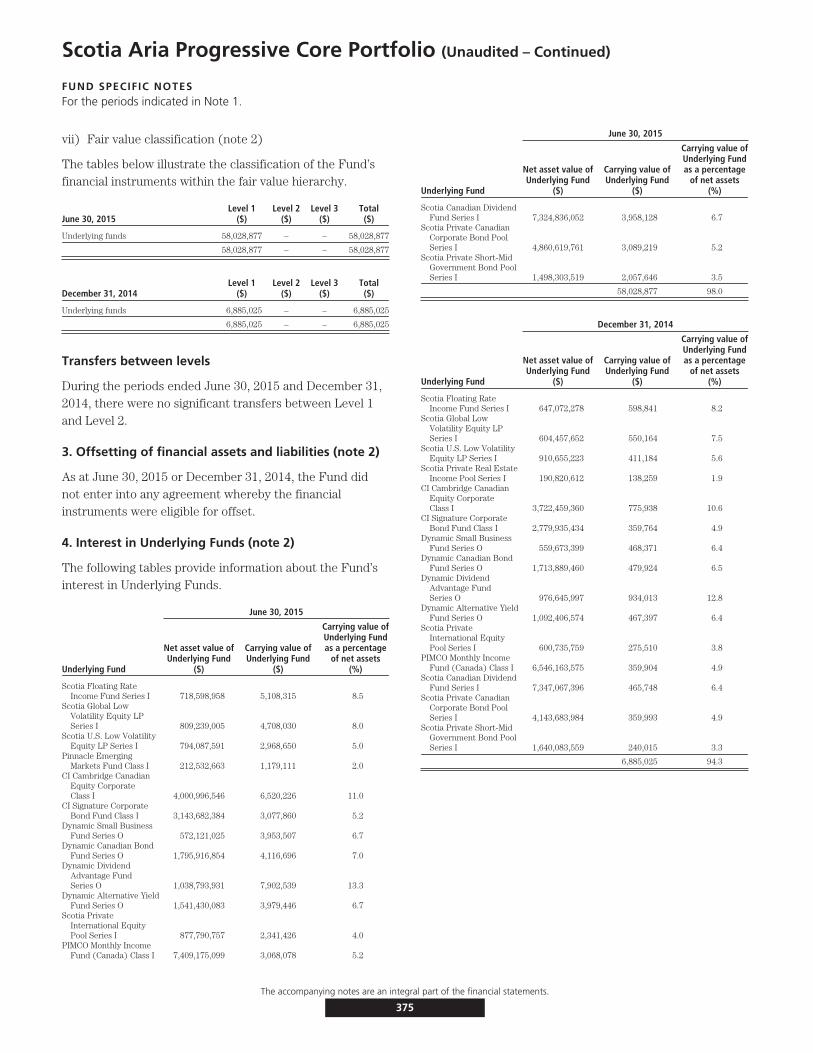
Scotia Aria Progressive Core Portfolio (Unaudited – Continued)
FUND SPECIFIC NOTESFor the periods indicated in Note 1.
vii) Fair value classification (note 2)
The tables below illustrate the classification of the Fund’sfinancial instruments within the fair value hierarchy.
June 30, 2015Level 1
($)Level 2
($)Level 3
($)Total($)
Underlying funds 58,028,877 – – 58,028,877
58,028,877 – – 58,028,877
December 31, 2014Level 1
($)Level 2
($)Level 3
($)Total($)
Underlying funds 6,885,025 – – 6,885,025
6,885,025 – – 6,885,025
Transfers between levels
During the periods ended June 30, 2015 and December 31,2014, there were no significant transfers between Level 1and Level 2.
3. Offsetting of financial assets and liabilities (note 2)
As at June 30, 2015 or December 31, 2014, the Fund didnot enter into any agreement whereby the financialinstruments were eligible for offset.
4. Interest in Underlying Funds (note 2)
The following tables provide information about the Fund’sinterest in Underlying Funds.
June 30, 2015
Underlying Fund
Net asset value ofUnderlying Fund
($)
Carrying value ofUnderlying Fund
($)
Carrying value ofUnderlying Fundas a percentage
of net assets(%)
Scotia Floating RateIncome Fund Series I 718,598,958 5,108,315 8.5
Scotia Global LowVolatility Equity LPSeries I 809,239,005 4,708,030 8.0
Scotia U.S. Low VolatilityEquity LP Series I 794,087,591 2,968,650 5.0
Pinnacle EmergingMarkets Fund Class I 212,532,663 1,179,111 2.0
CI Cambridge CanadianEquity CorporateClass I 4,000,996,546 6,520,226 11.0
CI Signature CorporateBond Fund Class I 3,143,682,384 3,077,860 5.2
Dynamic Small BusinessFund Series O 572,121,025 3,953,507 6.7
Dynamic Canadian BondFund Series O 1,795,916,854 4,116,696 7.0
Dynamic DividendAdvantage FundSeries O 1,038,793,931 7,902,539 13.3
Dynamic Alternative YieldFund Series O 1,541,430,083 3,979,446 6.7
Scotia PrivateInternational EquityPool Series I 877,790,757 2,341,426 4.0
PIMCO Monthly IncomeFund (Canada) Class I 7,409,175,099 3,068,078 5.2
June 30, 2015
Underlying Fund
Net asset value ofUnderlying Fund
($)
Carrying value ofUnderlying Fund
($)
Carrying value ofUnderlying Fundas a percentage
of net assets(%)
Scotia Canadian DividendFund Series I 7,324,836,052 3,958,128 6.7
Scotia Private CanadianCorporate Bond PoolSeries I 4,860,619,761 3,089,219 5.2
Scotia Private Short-MidGovernment Bond PoolSeries I 1,498,303,519 2,057,646 3.5
58,028,877 98.0
December 31, 2014
Underlying Fund
Net asset value ofUnderlying Fund
($)
Carrying value ofUnderlying Fund
($)
Carrying value ofUnderlying Fundas a percentage
of net assets(%)
Scotia Floating RateIncome Fund Series I 647,072,278 598,841 8.2
Scotia Global LowVolatility Equity LPSeries I 604,457,652 550,164 7.5
Scotia U.S. Low VolatilityEquity LP Series I 910,655,223 411,184 5.6
Scotia Private Real EstateIncome Pool Series I 190,820,612 138,259 1.9
CI Cambridge CanadianEquity CorporateClass I 3,722,459,360 775,938 10.6
CI Signature CorporateBond Fund Class I 2,779,935,434 359,764 4.9
Dynamic Small BusinessFund Series O 559,673,399 468,371 6.4
Dynamic Canadian BondFund Series O 1,713,889,460 479,924 6.5
Dynamic DividendAdvantage FundSeries O 976,645,997 934,013 12.8
Dynamic Alternative YieldFund Series O 1,092,406,574 467,397 6.4
Scotia PrivateInternational EquityPool Series I 600,735,759 275,510 3.8
PIMCO Monthly IncomeFund (Canada) Class I 6,546,163,575 359,904 4.9
Scotia Canadian DividendFund Series I 7,347,067,396 465,748 6.4
Scotia Private CanadianCorporate Bond PoolSeries I 4,143,683,984 359,993 4.9
Scotia Private Short-MidGovernment Bond PoolSeries I 1,640,083,559 240,015 3.3
6,885,025 94.3
The accompanying notes are an integral part of the financial statements.
375
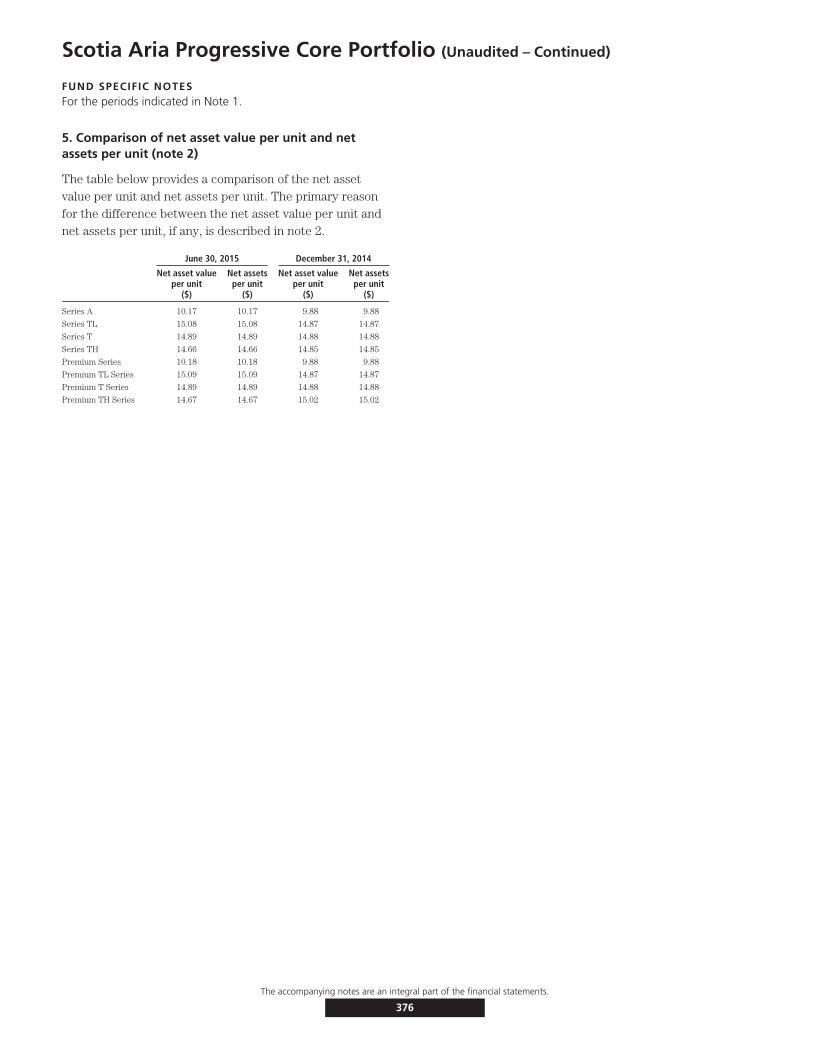
Scotia Aria Progressive Core Portfolio (Unaudited – Continued)
FUND SPECIFIC NOTESFor the periods indicated in Note 1.
5. Comparison of net asset value per unit and netassets per unit (note 2)
The table below provides a comparison of the net assetvalue per unit and net assets per unit. The primary reasonfor the difference between the net asset value per unit andnet assets per unit, if any, is described in note 2.
June 30, 2015 December 31, 2014
Net asset valueper unit
($)
Net assetsper unit
($)
Net asset valueper unit
($)
Net assetsper unit
($)
Series A 10.17 10.17 9.88 9.88
Series TL 15.08 15.08 14.87 14.87
Series T 14.89 14.89 14.88 14.88
Series TH 14.66 14.66 14.85 14.85
Premium Series 10.18 10.18 9.88 9.88
Premium TL Series 15.09 15.09 14.87 14.87
Premium T Series 14.89 14.89 14.88 14.88
Premium TH Series 14.67 14.67 15.02 15.02
The accompanying notes are an integral part of the financial statements.
376

Scotia Aria Progressive Pay Portfolio (Unaudited)
STATEMENTS OF FINANCIAL POSITIONAs at
June 30,2015
December 31,2014
ASSETSCurrent assetsInvestments
Non-derivative financial assets $13,438,082 $1,088,051Cash 366,340 21,159Accrued investment income and other 298 66
13,804,720 1,109,276
LIABILITIESCurrent liabilitiesManagement fee payable 20,867 –Accrued expenses 1,271 –Distributions payable 24,632 6,823
46,770 6,823
Net assets attributable to holders of redeemable units $13,757,950 $1,102,453
NET ASSETS ATTRIBUTABLE TO HOLDERS OF REDEEMABLE UNITS PER SERIESSeries A $ 4,302,174 $ 516,550Series T $ 1,333,126 $ 5,038Series TH $ 390,368 $ 155,379Series TL $ 152,764 $ 5,529Premium Series $ 3,393,441 $ 254,334Premium T Series $ 2,531,175 $ 5,038Premium TH Series $ 1,649,665 $ 155,558Premium TL Series $ 5,237 $ 5,027
NET ASSETS ATTRIBUTABLE TO HOLDERS OF REDEEMABLE UNITS PER UNITSeries A $ 10.19 $ 9.77Series T $ 14.93 $ 14.73Series TH $ 14.63 $ 14.94Series TL $ 15.11 $ 14.70Premium Series $ 10.20 $ 9.76Premium T Series $ 14.93 $ 14.73Premium TH Series $ 14.75 $ 15.04Premium TL Series $ 15.12 $ 14.70
STATEMENT OF COMPREHENSIVE INCOMEFor the six month period ended June 30,
2015*INCOMENet gain (loss) on investments (note 2)
Dividends $ 28,163Interest for distribution purposes 100,186Capital gains distributions received 27,006Net realized gain (loss) on non-derivative financial assets 20,197Change in unrealized gain (loss) on non-derivative financial assets (146,850)
Net gain (loss) on investments 28,702Other income 100
Total income (loss) 28,802
EXPENSESManagement fees (note 5) 61,550Fixed administration fees (note 6) 3,728Independent Review Committee fees 4Harmonized Sales Tax/Goods and Services Tax 7,384
Total expenses 72,666
Increase (decrease) in net assets attributable to holders of redeemable units from operations $ (43,864)
INCREASE (DECREASE) IN NET ASSETS ATTRIBUTABLE TO HOLDERS OF REDEEMABLEUNITS FROM OPERATIONS PER SERIES
Series A $ 27,293Series T $ (18,370)Series TH $ 2,126Series TL $ (2,156)Premium Series $ (8,878)Premium T Series $ (27,901)Premium TH Series $ (16,040)Premium TL Series $ 62
INCREASE (DECREASE) IN NET ASSETS ATTRIBUTABLE TO HOLDERS OF REDEEMABLEUNITS FROM OPERATIONS PER UNIT†
Series A $ 0.10Series T $ (0.36)Series TH $ 0.12Series TL $ (0.91)Premium Series $ (0.04)Premium T Series $ (0.39)Premium TH Series $ (0.50)Premium TL Series $ 0.12
WEIGHTED AVERAGE NUMBER OF UNITS PER SERIESSeries A 269,621Series T 51,613Series TH 17,838Series TL 2,367Premium Series 208,813Premium T Series 71,698Premium TH Series 32,017Premium TL Series 530
† The increase (decrease) in net assets attributable to holders of redeemable units fromoperations per unit is calculated by dividing the increase (decrease) in net assetsattributable to holders of redeemable units from operations per series by the weightedaverage number of units per series.
The accompanying notes are an integral part of the financial statements.
377

Scotia Aria Progressive Pay Portfolio (Unaudited – Continued)
STATEMENT OF CHANGES IN NET ASSETSATTRIBUTABLE TO HOLDERS OF REDEEMABLE UNITSFor the six month period ended June 30,
2015*NET ASSETS ATTRIBUTABLE TO HOLDERS OF REDEEMABLE UNITS, BEGINNING OF PERIODSeries A $ 516,550Series T 5,038Series TH 155,379Series TL 5,529Premium Series 254,334Premium T Series 5,038Premium TH Series 155,558Premium TL Series 5,027
1,102,453
INCREASE (DECREASE) IN NET ASSETS ATTRIBUTABLE TO HOLDERS OF REDEEMABLEUNITS FROM OPERATIONS
Series A 27,293Series T (18,370)Series TH 2,126Series TL (2,156)Premium Series (8,878)Premium T Series (27,901)Premium TH Series (16,040)Premium TL Series 62
(43,864)
DISTRIBUTIONS TO HOLDERS OF REDEEMABLE UNITSFrom net investment income
Series T (4,663)Series TH (966)Series TL (680)Premium T Series (13,480)Premium TH Series (10,979)
From return of capitalSeries T (16,032)Series TH (9,962)Premium T Series (18,066)Premium TH Series (9,736)Premium TL Series (65)
(84,629)
REDEEMABLE UNIT TRANSACTIONSProceeds from issue
Series A 3,989,219Series T 1,449,239Series TH 242,651Series TL 150,000Premium Series 3,259,551Premium T Series 2,585,454Premium TH Series 1,527,682Premium TL Series 148
Reinvested distributionsSeries T 3,238Series TH 1,140Series TL 71Premium T Series 130Premium TH Series 3,180Premium TL Series 65
Payments on redemptionSeries A (230,888)Series T (85,324)Premium Series (111,566)
12,783,990
INCREASE (DECREASE) IN NET ASSETS ATTRIBUTABLE TO HOLDERS OF REDEEMABLEUNITS
Series A 3,785,624Series T 1,328,088Series TH 234,989Series TL 147,235Premium Series 3,139,107Premium T Series 2,526,137Premium TH Series 1,494,107Premium TL Series 210
12,655,497
NET ASSETS ATTRIBUTABLE TO HOLDERS OF REDEEMABLE UNITS, END OF PERIODSeries A 4,302,174Series T 1,333,126Series TH 390,368Series TL 152,764Premium Series 3,393,441Premium T Series 2,531,175Premium TH Series 1,649,665Premium TL Series 5,237
$13,757,950
STATEMENT OF CASH FLOWSFor the six month period ended June 30,
2015*CASH FLOWS FROM OPERATING ACTIVITIESIncrease (decrease) in net assets attributable to holders of redeemable units $ (43,864)Adjustments for:
Net realized (gain) loss on non-derivative financial assets (20,197)Change in unrealized (gain) loss on non-derivative financial assets 146,850Purchases of non-derivative financial assets (13,194,579)Proceeds from sale of non-derivative financial assets 717,895Accrued investment income and other (232)Accrued expenses 22,138
Net cash provided by (used in) operating activities (12,371,989)CASH FLOWS FROM FINANCING ACTIVITIESProceeds from issue of redeemable units 13,203,944Amounts paid on redemption of redeemable units (427,777)Distributions to unitholders of redeemable units (58,997)
Net cash provided by (used in) financing activities 12,717,170Net increase (decrease) in cash 345,181Cash (bank overdraft), beginning of period 21,159
CASH (BANK OVERDRAFT), END OF PERIOD $ 366,340
Interest received(1) 99,954Dividends received, net of withholding taxes(1) 28,163
(1) Classified as operating items.* No comparative figures are shown as the Fund’s inception date was November 19,
2014.
SCHEDULE OF INVESTMENT PORTFOLIOAs at June 30, 2015
Numberof Units Issuer
AverageCost ($)
CarryingValue ($)
Fixed Income Funds – 23.4%54,996 PIMCO Monthly Income Fund (Canada) Class I 799,574 800,55029,423 Scotia Canadian Income Fund Series I 413,569 402,93742,270 Scotia Private American Core-Plus Bond Pool Series I 409,416 401,30973,356 Scotia Private Canadian Corporate Bond Pool Series I 807,034 802,54883,866 Scotia Private High Yield Income Pool Series I 815,697 807,442
3,245,290 3,214,786
Canadian Equity Funds – 33.1%59,940 CI Cambridge Canadian Equity Corporate Class I 1,195,214 1,164,635
163,329 Dynamic Dividend Advantage Fund Series O 1,436,543 1,411,16029,381 Dynamic Small Business Fund Series O 476,460 472,44813,522 Scotia Canadian Dividend Fund Series I 725,855 709,72093,230 Scotia Private Canadian Preferred Share Pool Series I 835,872 799,005
4,669,944 4,556,968
Foreign Equity Funds – 41.2%28,992 Dynamic Global Infrastructure Fund Series O 483,459 465,02885,454 Dynamic Premium Yield Fund Series O 953,386 954,51646,256 Pinnacle Emerging Markets Fund Class I 496,643 470,66553,950 Scotia Global Dividend Fund Series I 933,599 943,60369,097 Scotia Private International Equity Pool Series I 923,223 941,746
128,128 Scotia U.S. Dividend Fund Series I 1,890,056 1,890,770
5,680,366 5,666,328
TOTAL INVESTMENT PORTFOLIO 13,595,600 13,438,082
OTHER ASSETS, LESS LIABILITIES – 2.3% 319,868
NET ASSETS – 100.0% 13,757,950
The accompanying notes are an integral part of the financial statements.
378

Scotia Aria Progressive Pay Portfolio (Unaudited)
FUND SPECIFIC NOTESFor the periods indicated in Note 1.
1. The Fund (note 1)
The Fund invests primarily in a diversified mix of mutualfunds, equity securities and/or fixed income securitieslocated anywhere in the world and aims to generate incomeand long-term capital appreciation using a balancedapproach to investing through investments in incomeproducing equity and fixed income securities. The majorityof the portfolio’s assets will be held in equity securities. Theportfolio is an asset allocation fund that allocatesinvestment between two asset classes: fixed income andequities.
The Fund invests primarily in mutual funds managed by theManager and/or by the third party investment managers(the ‘‘Underlying Funds’’). To ensure the Fund’scomposition meets the investment objectives of the Fund,the portfolio advisor monitors the Underlying Funds on anongoing basis and rebalances the Fund’s assets among theUnderlying Funds.
2. Risks associated with financial instruments (note 4)
i) Interest rate risk
The Fund invests in Underlying Funds, which are exposedto interest rate risk. As at June 30, 2015, had the prevailinginterest rates increased or decreased by 0.25%, assuming aparallel shift in the yield curve and all other variables heldconstant, net assets attributable to holders of redeemableunits would have decreased or increased, respectively, by$31,708 or approximately 0.2% (December 31, 2014 –$2,464, or approximately 0.2%). In practice, actual resultsmay differ from this sensitivity analysis and the differencecould be material.
ii) Currency risk
The Fund could be exposed to indirect currency risk to theextent that the Underlying Funds held financialinstruments that were denominated in a currency otherthan its functional currency.
iii) Price risk
Price risk is the risk that the carrying value of financialinstruments will fluctuate as a result of changes in marketprices (other than those arising from interest rate risk orcurrency risk) caused by factors specific to a security, itsissuer or all factors affecting a market or a market segment.Exposure to price risk is mainly in equities, derivatives andcommodities, if applicable. As at June 30, 2015,
approximately 74.3% (December 31, 2014 – 68.4%) of theFund’s net assets were invested in Underlying Funds whichwere exposed to price risk. If prices of the UnderlyingFunds’ investments had decreased or increased by 10%,with all other variables held constant, net assets of theFund would have decreased or increased, respectively, byapproximately $1,022,330 (December 31, 2014 – $75,435).In practice, actual results may differ from this sensitivityanalysis and the difference could be material.
iv) Credit risk
The Fund could be exposed to indirect credit risk to theextent that the Underlying Funds invested in bonds anddebentures, preferred shares and derivatives.
v) Liquidity risk
The table below summarizes the Fund’s financial liabilitiesbased on the remaining period to the contractual maturitydate.
June 30, 2015 December 31, 2014
On demand($)
Less than3 months
($)On demand
($)
Less than3 months
($)
Current liabilities – 46,770 – 6,823Liability for written options – – – –Unrealized loss on derivatives – – – –Redeemable units 13,757,950 – 1,102,453 –
13,757,950 46,770 1,102,453 6,823
Redeemable units are redeemable on demand at theholder’s option. However, the Manager does not expect thatthe contractual maturity disclosed in the table above will berepresentative of the actual cash outflows, as holders ofthese instruments typically retain them for a longer term.
vi) Concentration risk
Concentration risk arises as a result of the concentration ofexposures within the same category, geographical location,asset type or industry sector, as applicable. The table belowis a summary of the Fund’s concentration risk:
Percentage of net assets (%)
June 30, 2015 December 31, 2014
Canadian Equity Funds 33.1 33.7Fixed Income Funds 23.4 23.3Foreign Equity Funds 41.2 41.7
The accompanying notes are an integral part of the financial statements.
379

Scotia Aria Progressive Pay Portfolio (Unaudited – Continued)
FUND SPECIFIC NOTESFor the periods indicated in Note 1.
vii) Fair value classification (note 2)
The tables below illustrate the classification of the Fund’sfinancial instruments within the fair value hierarchy.
June 30, 2015Level 1
($)Level 2
($)Level 3
($)Total($)
Underlying funds 13,438,082 – – 13,438,082
13,438,082 – – 13,438,082
December 31, 2014Level 1
($)Level 2
($)Level 3
($)Total($)
Underlying funds 1,088,051 – – 1,088,051
1,088,051 – – 1,088,051
Transfers between levels
During the periods ended June 30, 2015 and December 31,2014, there were no significant transfers between Level 1and Level 2.
3. Offsetting of financial assets and liabilities (note 2)
As at June 30, 2015 or December 31, 2014, the Fund didnot enter into any agreement whereby the financialinstruments were eligible for offset.
4. Interest in Underlying Funds (note 2)
The following tables provide information about the Fund’sinterest in Underlying Funds.
June 30, 2015
Underlying Fund
Net asset value ofUnderlying Fund
($)
Carrying value ofUnderlying Fund
($)
Carrying value ofUnderlying Fundas a percentage
of net assets(%)
Scotia Private CanadianPreferred Share PoolSeries I 425,933,690 799,005 5.8
Scotia Global DividendFund Series I 503,937,624 943,603 6.9
Pinnacle EmergingMarkets Fund Class I 212,532,663 470,665 3.4
Scotia U.S. DividendFund Series I 208,534,510 1,890,770 13.7
CI Cambridge CanadianEquity CorporateClass I 4,000,996,546 1,164,635 8.5
Dynamic Small BusinessFund Series O 572,121,025 472,448 3.4
Dynamic DividendAdvantage FundSeries O 1,038,793,931 1,411,160 10.3
Dynamic GlobalInfrastructure FundSeries O 590,809,397 465,028 3.4
Dynamic Premium YieldFund Series O 673,834,820 954,516 6.9
Scotia Private High YieldIncome Pool Series I 941,135,483 807,442 5.9
Scotia Private AmericanCore-Plus Bond PoolSeries I 694,441,762 401,309 2.9
June 30, 2015
Underlying Fund
Net asset value ofUnderlying Fund
($)
Carrying value ofUnderlying Fund
($)
Carrying value ofUnderlying Fundas a percentage
of net assets(%)
Scotia PrivateInternational EquityPool Series I 877,790,757 941,746 6.9
PIMCO Monthly IncomeFund (Canada) Class I 7,409,175,099 800,550 5.8
Scotia Canadian DividendFund Series I 7,324,836,052 709,720 5.2
Scotia Private CanadianCorporate Bond PoolSeries I 4,860,619,761 802,548 5.8
Scotia Canadian IncomeFund Series I 5,950,709,764 402,937 2.9
13,438,082 97.7
December 31, 2014
Underlying Fund
Net asset value ofUnderlying Fund
($)
Carrying value ofUnderlying Fund
($)
Carrying value ofUnderlying Fundas a percentage
of net assets(%)
Scotia U.S. DividendGrowers LP Series I 137,216,159 77,002 7.0
Scotia Global DividendFund Series I 423,458,562 76,232 6.9
1832 AM North AmericanPreferred Share LPSeries I 368,540,953 65,122 5.9
Scotia Total Return BondLP Series I 359,431,823 32,143 2.9
Scotia Private Real EstateIncome Pool Series I 190,820,612 38,336 3.5
Scotia U.S. DividendFund Series I 174,194,892 76,404 6.9
CI Cambridge CanadianEquity CorporateClass I 3,722,459,360 95,436 8.7
Dynamic Small BusinessFund Series O 559,673,399 38,037 3.5
Dynamic DividendAdvantage FundSeries O 976,645,997 114,992 10.4
Dynamic GlobalInfrastructure FundSeries O 564,666,720 38,864 3.5
Dynamic Premium YieldFund Series O 196,413,620 76,393 6.9
Scotia Private High YieldIncome Pool Series I 910,438,382 64,234 5.8
Scotia Private AmericanCore-Plus Bond PoolSeries I 628,345,246 32,110 2.9
Scotia PrivateInternational EquityPool Series I 600,735,759 75,802 6.9
PIMCO Monthly IncomeFund (Canada) Class I 6,546,163,575 64,505 5.9
Scotia Canadian DividendFund Series I 7,347,067,396 58,126 5.3
Scotia Private CanadianCorporate Bond PoolSeries I 4,143,683,984 64,313 5.8
1,088,051 98.7
The accompanying notes are an integral part of the financial statements.
380

Scotia Aria Progressive Pay Portfolio (Unaudited – Continued)
FUND SPECIFIC NOTESFor the periods indicated in Note 1.
5. Comparison of net asset value per unit and netassets per unit (note 2)
The table below provides a comparison of the net assetvalue per unit and net assets per unit. The primary reasonfor the difference between the net asset value per unit andnet assets per unit, if any, is described in note 2.
June 30, 2015 December 31, 2014
Net asset valueper unit
($)
Net assetsper unit
($)
Net asset valueper unit
($)
Net assetsper unit
($)
Series A 10.19 10.19 9.77 9.77
Series TL 15.11 15.11 14.70 14.70
Series T 14.93 14.93 14.73 14.73
Series TH 14.63 14.63 14.94 14.94
Premium Series 10.20 10.20 9.76 9.76
Premium TL Series 15.12 15.12 14.70 14.70
Premium T Series 14.93 14.93 14.73 14.73
Premium TH Series 14.75 14.75 15.04 15.04
The accompanying notes are an integral part of the financial statements.
381

Scotia Short Term Yield Class (Unaudited)
STATEMENTS OF FINANCIAL POSITIONAs at
June 30,2015
December 31,2014
ASSETSCurrent assetsInvestments
Non-derivative financial assets $153,730 $153,803Cash 1,755 805Accrued investment income and other 145 170
155,630 154,778
LIABILITIESCurrent liabilitiesManagement fee payable 4 –Accrued expenses 7 –
11 –
Net assets attributable to holders of redeemable shares $155,619 $154,778
NET ASSETS ATTRIBUTABLE TO HOLDERS OF REDEEMABLE SHARESPER SERIES
Series M $155,619 $154,778
NET ASSETS ATTRIBUTABLE TO HOLDERS OF REDEEMABLE SHARESPER SHARE
Series M $ 10.07 $ 10.27
STATEMENTS OF COMPREHENSIVE INCOMEFor the six month periods ended June 30,
2015 2014INCOMENet gain (loss) on investments (note 2)
Interest for distribution purposes $ 907 $ 988
Net gain (loss) on investments 907 988
Total income (loss) 907 988
EXPENSESManagement fees (note 5) 24 24Fixed administration fees (note 6) 37 37Harmonized Sales Tax/Goods and Services Tax 5 9
Total expenses 66 70
Increase (decrease) in net assets attributable to holders of redeemable shares fromoperations $ 841 $ 918
INCREASE (DECREASE) IN NET ASSETS ATTRIBUTABLE TO HOLDERS OFREDEEMABLE SHARES FROM OPERATIONS PER SERIES
Series M $ 841 $ 918
INCREASE (DECREASE) IN NET ASSETS ATTRIBUTABLE TO HOLDERS OFREDEEMABLE SHARES FROM OPERATIONS PER SHARE†
Series M $ 0.05 $ 0.06
WEIGHTED AVERAGE NUMBER OF SHARES PER SERIESSeries M 15,386 15,068
† The increase (decrease) in net assets attributable to holders of redeemable shares fromoperations per share is calculated by dividing the increase (decrease) in net assetsattributable to holders of redeemable shares from operations per series by theweighted average number of shares per series.
STATEMENTS OF CHANGES IN NET ASSETSATTRIBUTABLE TO HOLDERS OF REDEEMABLE UNITSFor the six month periods ended June 30,
2015 2014NET ASSETS ATTRIBUTABLE TO HOLDERS OF REDEEMABLE SHARES,
BEGINNING OF PERIODSeries M $154,778 $152,907
INCREASE (DECREASE) IN NET ASSETS ATTRIBUTABLE TO HOLDERS OFREDEEMABLE SHARES FROM OPERATIONS
Series M 841 918
DISTRIBUTIONS TO HOLDERS OF REDEEMABLE SHARESFrom net realized gains on investments
Series M (3,873) –
REDEEMABLE SHARE TRANSACTIONSReinvested distributions
Series M 3,873 –
INCREASE (DECREASE) IN NET ASSETS ATTRIBUTABLE TO HOLDERS OFREDEEMABLE SHARES
Series M 841 918
NET ASSETS ATTRIBUTABLE TO HOLDERS OF REDEEMABLE SHARES, END OFPERIOD
Series M $155,619 $153,825
STATEMENTS OF CASH FLOWSFor the six month periods ended June 30,
2015 2014CASH FLOWS FROM OPERATING ACTIVITIESIncrease (decrease) in net assets attributable to holders of redeemable shares $ 841 $ 918Adjustments for:
Purchases of non-derivative financial assets (1,927) (1,181)Proceeds from sale of non-derivative financial assets 2,000 –Accrued investment income and other 25 197Accrued expenses 11 12
Net cash provided by (used in) operating activities 950 (54)Net increase (decrease) in cash 950 (54)Cash (bank overdraft), beginning of period 805 929
CASH (BANK OVERDRAFT), END OF PERIOD $ 1,755 $ 875
Interest received(1) 907 988
(1) Classified as operating items.
SCHEDULE OF INVESTMENT PORTFOLIOAs at June 30, 2015
Numberof Units Issuer
AverageCost ($)
CarryingValue ($)
MONEY MARKET FUND – 98.8%15,373 Scotia Money Market Fund Series I 153,730 153,730
TOTAL INVESTMENT PORTFOLIO 153,730 153,730
OTHER ASSETS, LESS LIABILITIES – 1.2% 1,889
NET ASSETS – 100.0% 155,619
The accompanying notes are an integral part of the financial statements.
382
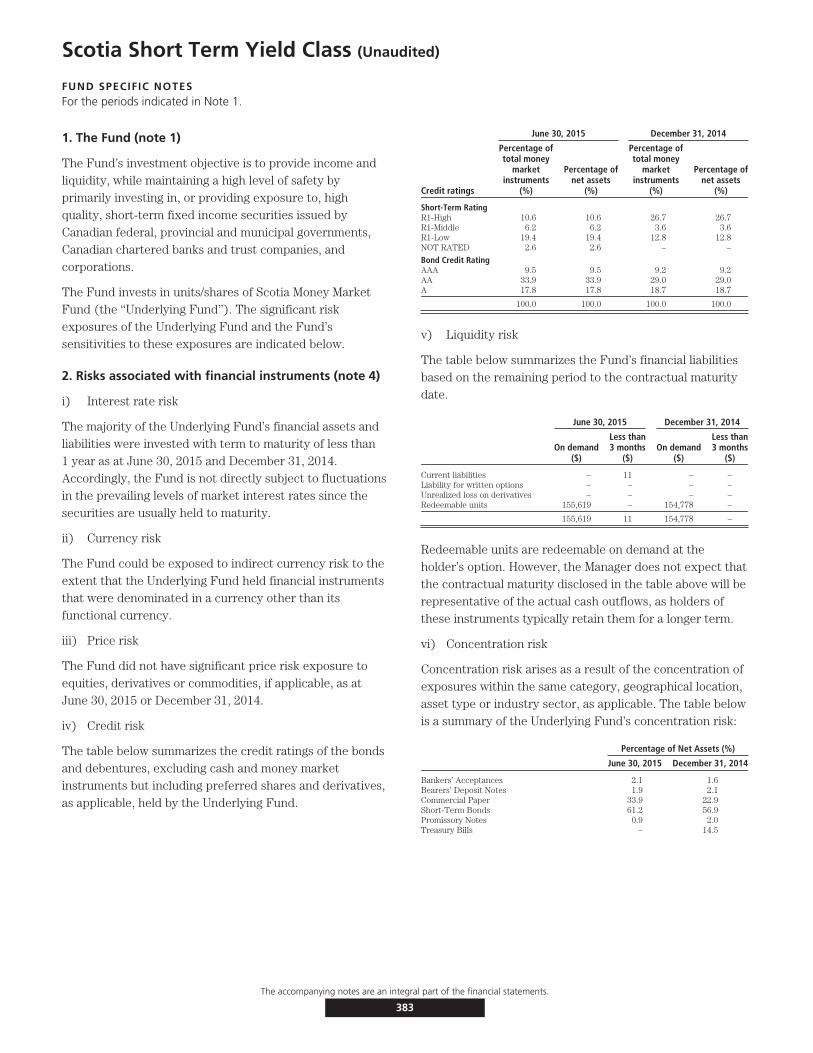
Scotia Short Term Yield Class (Unaudited)
FUND SPECIFIC NOTESFor the periods indicated in Note 1.
1. The Fund (note 1)
The Fund’s investment objective is to provide income andliquidity, while maintaining a high level of safety byprimarily investing in, or providing exposure to, highquality, short-term fixed income securities issued byCanadian federal, provincial and municipal governments,Canadian chartered banks and trust companies, andcorporations.
The Fund invests in units/shares of Scotia Money MarketFund (the ‘‘Underlying Fund’’). The significant riskexposures of the Underlying Fund and the Fund’ssensitivities to these exposures are indicated below.
2. Risks associated with financial instruments (note 4)
i) Interest rate risk
The majority of the Underlying Fund’s financial assets andliabilities were invested with term to maturity of less than1 year as at June 30, 2015 and December 31, 2014.Accordingly, the Fund is not directly subject to fluctuationsin the prevailing levels of market interest rates since thesecurities are usually held to maturity.
ii) Currency risk
The Fund could be exposed to indirect currency risk to theextent that the Underlying Fund held financial instrumentsthat were denominated in a currency other than itsfunctional currency.
iii) Price risk
The Fund did not have significant price risk exposure toequities, derivatives or commodities, if applicable, as atJune 30, 2015 or December 31, 2014.
iv) Credit risk
The table below summarizes the credit ratings of the bondsand debentures, excluding cash and money marketinstruments but including preferred shares and derivatives,as applicable, held by the Underlying Fund.
June 30, 2015 December 31, 2014
Credit ratings
Percentage oftotal money
marketinstruments
(%)
Percentage ofnet assets
(%)
Percentage oftotal money
marketinstruments
(%)
Percentage ofnet assets
(%)
Short-Term RatingR1-High 10.6 10.6 26.7 26.7R1-Middle 6.2 6.2 3.6 3.6R1-Low 19.4 19.4 12.8 12.8NOT RATED 2.6 2.6 – –
Bond Credit RatingAAA 9.5 9.5 9.2 9.2AA 33.9 33.9 29.0 29.0A 17.8 17.8 18.7 18.7
100.0 100.0 100.0 100.0
v) Liquidity risk
The table below summarizes the Fund’s financial liabilitiesbased on the remaining period to the contractual maturitydate.
June 30, 2015 December 31, 2014
On demand($)
Less than3 months
($)On demand
($)
Less than3 months
($)
Current liabilities – 11 – –Liability for written options – – – –Unrealized loss on derivatives – – – –Redeemable units 155,619 – 154,778 –
155,619 11 154,778 –
Redeemable units are redeemable on demand at theholder’s option. However, the Manager does not expect thatthe contractual maturity disclosed in the table above will berepresentative of the actual cash outflows, as holders ofthese instruments typically retain them for a longer term.
vi) Concentration risk
Concentration risk arises as a result of the concentration ofexposures within the same category, geographical location,asset type or industry sector, as applicable. The table belowis a summary of the Underlying Fund’s concentration risk:
Percentage of Net Assets (%)
June 30, 2015 December 31, 2014
Bankers’ Acceptances 2.1 1.6Bearers’ Deposit Notes 1.9 2.1Commercial Paper 33.9 22.9Short-Term Bonds 61.2 56.9Promissory Notes 0.9 2.0Treasury Bills – 14.5
The accompanying notes are an integral part of the financial statements.
383
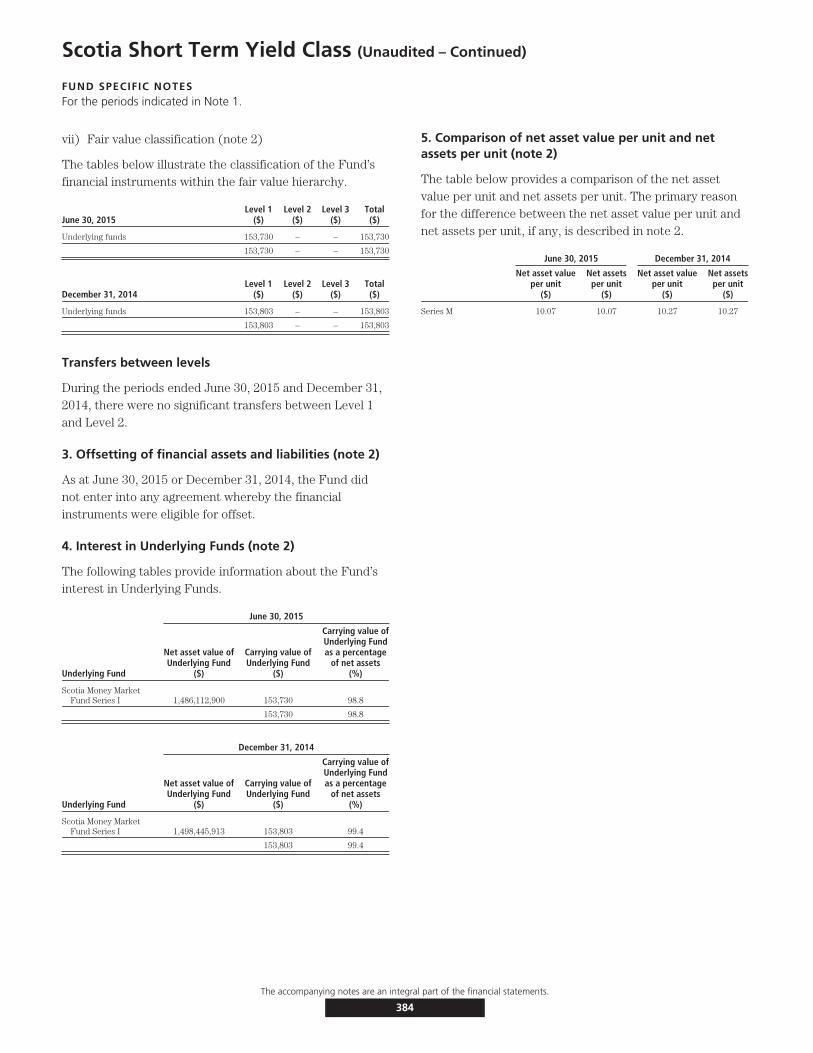
Scotia Short Term Yield Class (Unaudited – Continued)
FUND SPECIFIC NOTESFor the periods indicated in Note 1.
vii) Fair value classification (note 2)
The tables below illustrate the classification of the Fund’sfinancial instruments within the fair value hierarchy.
June 30, 2015Level 1
($)Level 2
($)Level 3
($)Total($)
Underlying funds 153,730 – – 153,730
153,730 – – 153,730
December 31, 2014Level 1
($)Level 2
($)Level 3
($)Total($)
Underlying funds 153,803 – – 153,803
153,803 – – 153,803
Transfers between levels
During the periods ended June 30, 2015 and December 31,2014, there were no significant transfers between Level 1and Level 2.
3. Offsetting of financial assets and liabilities (note 2)
As at June 30, 2015 or December 31, 2014, the Fund didnot enter into any agreement whereby the financialinstruments were eligible for offset.
4. Interest in Underlying Funds (note 2)
The following tables provide information about the Fund’sinterest in Underlying Funds.
June 30, 2015
Underlying Fund
Net asset value ofUnderlying Fund
($)
Carrying value ofUnderlying Fund
($)
Carrying value ofUnderlying Fundas a percentage
of net assets(%)
Scotia Money MarketFund Series I 1,486,112,900 153,730 98.8
153,730 98.8
December 31, 2014
Underlying Fund
Net asset value ofUnderlying Fund
($)
Carrying value ofUnderlying Fund
($)
Carrying value ofUnderlying Fundas a percentage
of net assets(%)
Scotia Money MarketFund Series I 1,498,445,913 153,803 99.4
153,803 99.4
5. Comparison of net asset value per unit and netassets per unit (note 2)
The table below provides a comparison of the net assetvalue per unit and net assets per unit. The primary reasonfor the difference between the net asset value per unit andnet assets per unit, if any, is described in note 2.
June 30, 2015 December 31, 2014
Net asset valueper unit
($)
Net assetsper unit
($)
Net asset valueper unit
($)
Net assetsper unit
($)
Series M 10.07 10.07 10.27 10.27
The accompanying notes are an integral part of the financial statements.
384

Scotia Conservative Government Bond Capital Yield Class (Unaudited)
STATEMENTS OF FINANCIAL POSITIONAs at
June 30,2015
December 31,2014
ASSETSCurrent assetsInvestments
Non-derivative financial assets $27,748,936 $33,757,188Cash 14,512 –Receivable for securities sold 40,000 –Accrued investment income and other 1 2
27,803,449 33,757,190
LIABILITIESCurrent liabilitiesBank overdraft – 72,104Management fee payable 13,091 –Redemptions payable 37,849 2,379Accrued expenses 1,946 –
52,886 74,483
Net assets attributable to holders of redeemable shares $27,750,563 $33,682,707
NET ASSETS ATTRIBUTABLE TO HOLDERS OF REDEEMABLE SHARESPER SERIES
Series A $10,912,761 $13,327,301Series M $16,837,802 $20,355,406
NET ASSETS ATTRIBUTABLE TO HOLDERS OF REDEEMABLE SHARESPER SHARE
Series A $ 10.08 $ 10.23Series M $ 10.35 $ 10.44
STATEMENTS OF COMPREHENSIVE INCOMEFor the six month periods ended June 30,
2015 2014INCOMENet gain (loss) on investments (note 2)
Interest for distribution purposes $ 460,065 $ 182Net realized gain (loss) on non-derivative financial assets 77,483 293,214Change in unrealized gain (loss) on non-derivative financial assets 42,234 1,024,291
Net gain (loss) on investments 579,782 1,317,687
Total income (loss) 579,782 1,317,687
EXPENSESManagement fees (note 5) 72,340 117,580Fixed administration fees (note 6) 10,676 16,065Independent Review Committee fees 23 67Interest expense and bank overdraft charges 1,252 6,523Harmonized Sales Tax/Goods and Services Tax 9,847 15,875
Total expenses 94,138 156,110
Increase (decrease) in net assets attributable to holders of redeemableshares from operations $ 485,644 $1,161,577
INCREASE (DECREASE) IN NET ASSETS ATTRIBUTABLE TO HOLDERS OFREDEEMABLE SHARES FROM OPERATIONS PER SERIES
Series A $ 148,799 $ 470,500Series M $ 336,845 $ 691,077
INCREASE (DECREASE) IN NET ASSETS ATTRIBUTABLE TO HOLDERS OFREDEEMABLE SHARES FROM OPERATIONS PER SHARE†
Series A $ 0.13 $ 0.24Series M $ 0.19 $ 0.28
WEIGHTED AVERAGE NUMBER OF SHARES PER SERIESSeries A 1,184,505 1,978,543Series M 1,820,272 2,436,423
† The increase (decrease) in net assets attributable to holders of redeemable shares fromoperations per share is calculated by dividing the increase (decrease) in net assetsattributable to holders of redeemable shares from operations per series by theweighted average number of shares per series.
STATEMENTS OF CHANGES IN NET ASSETSATTRIBUTABLE TO HOLDERS OF REDEEMABLE UNITSFor the six month periods ended June 30,
2015 2014NET ASSETS ATTRIBUTABLE TO HOLDERS OF REDEEMABLE SHARES,
BEGINNING OF PERIODSeries A $13,327,301 $ 27,200,789Series M 20,355,406 29,671,413
33,682,707 56,872,202
INCREASE (DECREASE) IN NET ASSETS ATTRIBUTABLE TO HOLDERS OFREDEEMABLE SHARES FROM OPERATIONS
Series A 148,799 470,500Series M 336,845 691,077
485,644 1,161,577
DISTRIBUTIONS TO HOLDERS OF REDEEMABLE SHARESFrom net realized gains on investments
Series A (333,509) –Series M (509,385) –
(842,894) –
REDEEMABLE UNIT TRANSACTIONSProceeds from issue
Series M – 114,854Reinvested distributions
Series A 324,961 –Series M 509,386 –
Payments on redemptionSeries A (2,554,791) (11,535,972)Series M (3,854,450) (7,150,992)
(5,574,894) (18,572,110)
INCREASE (DECREASE) IN NET ASSETS ATTRIBUTABLE TO HOLDERS OFREDEEMABLE SHARES
Series A (2,414,540) (11,065,472)Series M (3,517,604) (6,345,061)
(5,932,144) (17,410,533)
NET ASSETS ATTRIBUTABLE TO HOLDERS OF REDEEMABLE SHARES,END OF PERIOD
Series A 10,912,761 16,135,317Series M 16,837,802 23,326,352
$27,750,563 $ 39,461,669
STATEMENTS OF CASH FLOWSFor the six month periods ended June 30,
2015 2014CASH FLOWS FROM OPERATING ACTIVITIESIncrease (decrease) in net assets attributable to holders of redeemable
shares $ 485,644 $ 1,161,578Adjustments for:
Net realized (gain) loss on non-derivative financial assets (77,483) (293,214)Change in unrealized (gain) loss on non-derivative financial assets (42,234) (1,024,291)Purchases of non-derivative financial assets (520,053) –Proceeds from sale of non-derivative financial assets 6,608,022 17,805,000Accrued investment income and other 1 23Accrued expenses 15,037 21,519
Net cash provided by (used in) operating activities 6,468,934 17,670,615CASH FLOWS FROM FINANCING ACTIVITIESProceeds from issue of redeemable shares – 114,854Amounts paid on redemption of redeemable shares (6,373,771) (18,701,061)Distributions to unitholders of redeemable shares (8,547) –
Net cash provided by (used in) financing activities (6,382,318) (18,586,207)Net increase (decrease) in cash 86,616 (915,592)Cash (bank overdraft), beginning of period (72,104) 879,010
CASH (BANK OVERDRAFT), END OF PERIOD $ 14,512 $ (36,582)
Interest paid(1) 1,252 –Interest received(1) 460,066 205
(1) Classified as operating items.
The accompanying notes are an integral part of the financial statements.
385

Scotia Conservative Government Bond Capital Yield Class (Unaudited – Continued)
SCHEDULE OF INVESTMENT PORTFOLIOAs at June 30, 2015
Numberof Units Issuer
AverageCost ($)
CarryingValue ($)
FIXED INCOME FUND – 100.0%2,610,657 Scotia Private Short-Mid Government Bond Pool Series I 27,683,077 27,748,936
TOTAL INVESTMENT PORTFOLIO 27,683,077 27,748,936
OTHER ASSETS, LESS LIABILITIES – 0.0% 1,627
NET ASSETS – 100.0% 27,750,563
The accompanying notes are an integral part of the financial statements.
386

Scotia Conservative Government Bond Capital Yield Class (Unaudited)
FUND SPECIFIC NOTESFor the periods indicated in Note 1.
1. The Fund (note 1)
The Fund’s investment objective is to The Fund’sinvestment objective is to provide income and modestcapital gains by primarily providing exposure to bonds andtreasury bills issued or guaranteed by Canadian federal,provincial and municipal governments or agency of suchgovernments, and money market instruments of Canadianissuers, including commercial paper, bankers’ acceptances,asset-backed or mortgage-backed securities and guaranteedinvestment certificates.
The Fund invests in units/shares of Scotia Private Short-Mid Government Bond Pool (the ‘‘Underlying Fund’’). Thesignificant risk exposures of the Underlying Fund and theFund’s sensitivities to these exposures are indicated below.
2. Risks associated with financial instruments (note 4)
i) Interest rate risk
The table below summarizes the Underlying Fund’sexposure to interest rate risk by the remaining term tomaturity. The Fund is indirectly exposed to its proportionalshare of the interest rate risk of the Underlying Fund.
Interest rate exposureJune 30, 2015
($)December 31, 2014
($)
Less than 1 year 4,123,640 –1-3 years 4,688,736 13,331,3113-5 years 7,036,738 9,836,4525-10 years 11,799,822 10,589,425> 10 years – –
27,748,936 33,757,188
The Fund invests in Scotia Private Short-Mid GovernmentBond Pool Series I, which is exposed to interest rate risk.As at June 30, 2015, had the prevailing interest ratesincreased or decreased by 0.25%, assuming a parallel shiftin the yield curve and all other variables held constant, netassets attributable to holders of redeemable units wouldhave decreased or increased, respectively, by $303,519 orapproximately 1.1% (December 31, 2014 – $340,226 orapproximately 1.0%). In practice, actual results may differfrom this sensitivity analysis and the difference could bematerial.
ii) Currency risk
The Fund could be exposed to indirect currency risk to theextent that the Underlying Fund held financial instrumentsthat were denominated in a currency other than itsfunctional currency.
iii) Price risk
The Fund did not have significant price risk exposure toequities, derivatives or commodities, if applicable, as atJune 30, 2015 or December 31, 2014.
iv) Credit risk
The table below summarizes the credit ratings of the bondsand debentures, excluding cash and money marketinstruments but including preferred shares and derivatives,as applicable, held by the Underlying Fund.
June 30, 2015 December 31, 2014
Percentage oftotal bonds and
debentures(%)
Percentage ofnet assets
(%)
Percentage oftotal bonds and
debentures(%)
Percentage ofnet assets
(%)
Credit ratingsAAA 46.0 44.3 53.0 50.7AA 29.1 28.0 27.2 26.0A 24.9 23.9 19.8 19.0
100.0 96.2 100.0 95.7
v) Liquidity risk
The table below summarizes the Fund’s financial liabilitiesbased on the remaining period to the contractual maturitydate.
June 30, 2015 December 31, 2014
On demand($)
Less than3 months
($)On demand
($)
Less than3 months
($)
Current liabilities – 52,886 – 74,483Liability for written options – – – –Unrealized loss on derivatives – – – –Redeemable units 27,750,563 – 33,682,707 –
27,750,563 52,886 33,682,707 74,483
Redeemable units are redeemable on demand at theholder’s option. However, the Manager does not expect thatthe contractual maturity disclosed in the table above will berepresentative of the actual cash outflows, as holders ofthese instruments typically retain them for a longer term.
vi) Concentration risk
Concentration risk arises as a result of the concentration ofexposures within the same category, geographical location,asset type or industry sector, as applicable. The table belowis a summary of the Underlying Fund’s concentration risk:
Percentage of net assets (%)
June 30, 2015 December 31, 2014
Corporate Bonds 2.8 –Federal Bonds 40.2 44.5Provincial Bonds 53.2 51.2
The accompanying notes are an integral part of the financial statements.
387
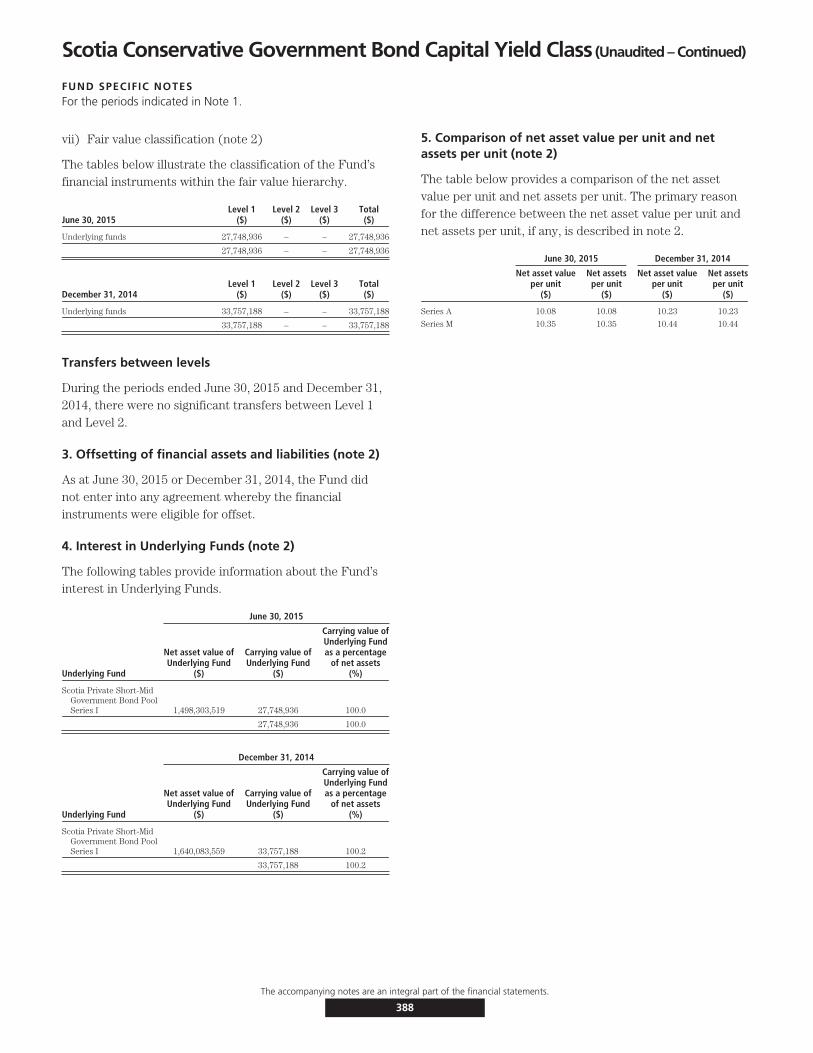
Scotia Conservative Government Bond Capital Yield Class (Unaudited – Continued)
FUND SPECIFIC NOTESFor the periods indicated in Note 1.
vii) Fair value classification (note 2)
The tables below illustrate the classification of the Fund’sfinancial instruments within the fair value hierarchy.
June 30, 2015Level 1
($)Level 2
($)Level 3
($)Total($)
Underlying funds 27,748,936 – – 27,748,936
27,748,936 – – 27,748,936
December 31, 2014Level 1
($)Level 2
($)Level 3
($)Total($)
Underlying funds 33,757,188 – – 33,757,188
33,757,188 – – 33,757,188
Transfers between levels
During the periods ended June 30, 2015 and December 31,2014, there were no significant transfers between Level 1and Level 2.
3. Offsetting of financial assets and liabilities (note 2)
As at June 30, 2015 or December 31, 2014, the Fund didnot enter into any agreement whereby the financialinstruments were eligible for offset.
4. Interest in Underlying Funds (note 2)
The following tables provide information about the Fund’sinterest in Underlying Funds.
June 30, 2015
Underlying Fund
Net asset value ofUnderlying Fund
($)
Carrying value ofUnderlying Fund
($)
Carrying value ofUnderlying Fundas a percentage
of net assets(%)
Scotia Private Short-MidGovernment Bond PoolSeries I 1,498,303,519 27,748,936 100.0
27,748,936 100.0
December 31, 2014
Underlying Fund
Net asset value ofUnderlying Fund
($)
Carrying value ofUnderlying Fund
($)
Carrying value ofUnderlying Fundas a percentage
of net assets(%)
Scotia Private Short-MidGovernment Bond PoolSeries I 1,640,083,559 33,757,188 100.2
33,757,188 100.2
5. Comparison of net asset value per unit and netassets per unit (note 2)
The table below provides a comparison of the net assetvalue per unit and net assets per unit. The primary reasonfor the difference between the net asset value per unit andnet assets per unit, if any, is described in note 2.
June 30, 2015 December 31, 2014
Net asset valueper unit
($)
Net assetsper unit
($)
Net asset valueper unit
($)
Net assetsper unit
($)
Series A 10.08 10.08 10.23 10.23
Series M 10.35 10.35 10.44 10.44
The accompanying notes are an integral part of the financial statements.
388
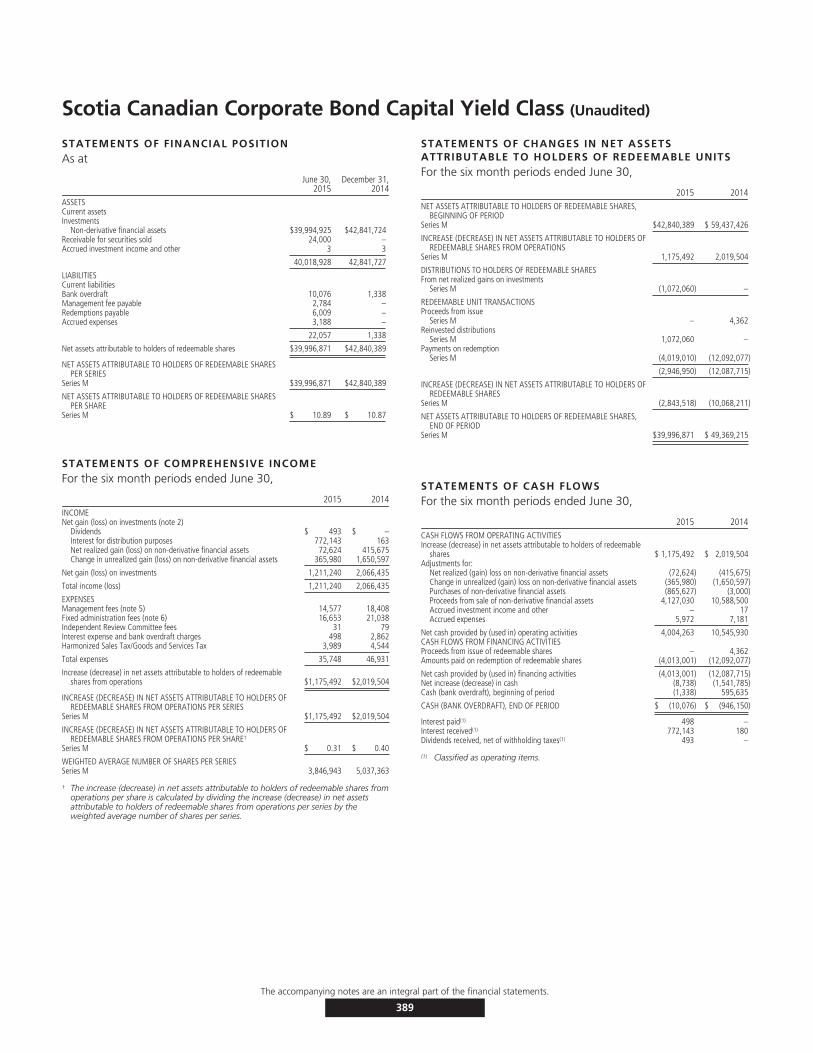
Scotia Canadian Corporate Bond Capital Yield Class (Unaudited)
STATEMENTS OF FINANCIAL POSITIONAs at
June 30,2015
December 31,2014
ASSETSCurrent assetsInvestments
Non-derivative financial assets $39,994,925 $42,841,724Receivable for securities sold 24,000 –Accrued investment income and other 3 3
40,018,928 42,841,727
LIABILITIESCurrent liabilitiesBank overdraft 10,076 1,338Management fee payable 2,784 –Redemptions payable 6,009 –Accrued expenses 3,188 –
22,057 1,338
Net assets attributable to holders of redeemable shares $39,996,871 $42,840,389
NET ASSETS ATTRIBUTABLE TO HOLDERS OF REDEEMABLE SHARESPER SERIES
Series M $39,996,871 $42,840,389
NET ASSETS ATTRIBUTABLE TO HOLDERS OF REDEEMABLE SHARESPER SHARE
Series M $ 10.89 $ 10.87
STATEMENTS OF COMPREHENSIVE INCOMEFor the six month periods ended June 30,
2015 2014INCOMENet gain (loss) on investments (note 2)
Dividends $ 493 $ –Interest for distribution purposes 772,143 163Net realized gain (loss) on non-derivative financial assets 72,624 415,675Change in unrealized gain (loss) on non-derivative financial assets 365,980 1,650,597
Net gain (loss) on investments 1,211,240 2,066,435
Total income (loss) 1,211,240 2,066,435
EXPENSESManagement fees (note 5) 14,577 18,408Fixed administration fees (note 6) 16,653 21,038Independent Review Committee fees 31 79Interest expense and bank overdraft charges 498 2,862Harmonized Sales Tax/Goods and Services Tax 3,989 4,544
Total expenses 35,748 46,931
Increase (decrease) in net assets attributable to holders of redeemableshares from operations $1,175,492 $2,019,504
INCREASE (DECREASE) IN NET ASSETS ATTRIBUTABLE TO HOLDERS OFREDEEMABLE SHARES FROM OPERATIONS PER SERIES
Series M $1,175,492 $2,019,504
INCREASE (DECREASE) IN NET ASSETS ATTRIBUTABLE TO HOLDERS OFREDEEMABLE SHARES FROM OPERATIONS PER SHARE†
Series M $ 0.31 $ 0.40
WEIGHTED AVERAGE NUMBER OF SHARES PER SERIESSeries M 3,846,943 5,037,363
† The increase (decrease) in net assets attributable to holders of redeemable shares fromoperations per share is calculated by dividing the increase (decrease) in net assetsattributable to holders of redeemable shares from operations per series by theweighted average number of shares per series.
STATEMENTS OF CHANGES IN NET ASSETSATTRIBUTABLE TO HOLDERS OF REDEEMABLE UNITSFor the six month periods ended June 30,
2015 2014NET ASSETS ATTRIBUTABLE TO HOLDERS OF REDEEMABLE SHARES,
BEGINNING OF PERIODSeries M $42,840,389 $ 59,437,426
INCREASE (DECREASE) IN NET ASSETS ATTRIBUTABLE TO HOLDERS OFREDEEMABLE SHARES FROM OPERATIONS
Series M 1,175,492 2,019,504
DISTRIBUTIONS TO HOLDERS OF REDEEMABLE SHARESFrom net realized gains on investments
Series M (1,072,060) –
REDEEMABLE UNIT TRANSACTIONSProceeds from issue
Series M – 4,362Reinvested distributions
Series M 1,072,060 –Payments on redemption
Series M (4,019,010) (12,092,077)
(2,946,950) (12,087,715)
INCREASE (DECREASE) IN NET ASSETS ATTRIBUTABLE TO HOLDERS OFREDEEMABLE SHARES
Series M (2,843,518) (10,068,211)
NET ASSETS ATTRIBUTABLE TO HOLDERS OF REDEEMABLE SHARES,END OF PERIOD
Series M $39,996,871 $ 49,369,215
STATEMENTS OF CASH FLOWSFor the six month periods ended June 30,
2015 2014CASH FLOWS FROM OPERATING ACTIVITIESIncrease (decrease) in net assets attributable to holders of redeemable
shares $ 1,175,492 $ 2,019,504Adjustments for:
Net realized (gain) loss on non-derivative financial assets (72,624) (415,675)Change in unrealized (gain) loss on non-derivative financial assets (365,980) (1,650,597)Purchases of non-derivative financial assets (865,627) (3,000)Proceeds from sale of non-derivative financial assets 4,127,030 10,588,500Accrued investment income and other – 17Accrued expenses 5,972 7,181
Net cash provided by (used in) operating activities 4,004,263 10,545,930CASH FLOWS FROM FINANCING ACTIVITIESProceeds from issue of redeemable shares – 4,362Amounts paid on redemption of redeemable shares (4,013,001) (12,092,077)
Net cash provided by (used in) financing activities (4,013,001) (12,087,715)Net increase (decrease) in cash (8,738) (1,541,785)Cash (bank overdraft), beginning of period (1,338) 595,635
CASH (BANK OVERDRAFT), END OF PERIOD $ (10,076) $ (946,150)
Interest paid(1) 498 –Interest received(1) 772,143 180Dividends received, net of withholding taxes(1) 493 –
(1) Classified as operating items.
The accompanying notes are an integral part of the financial statements.
389

Scotia Canadian Corporate Bond Capital Yield Class (Unaudited – Continued)
SCHEDULE OF INVESTMENT PORTFOLIOAs at June 30, 2015
Numberof Units Issuer
AverageCost ($)
CarryingValue ($)
FIXED INCOME FUND – 100.0%3,655,710 Scotia Private Canadian Corporate Bond Pool Series I 39,617,273 39,994,925
TOTAL INVESTMENT PORTFOLIO 39,617,273 39,994,925
OTHER ASSETS, LESS LIABILITIES – 0.0% 1,946
NET ASSETS – 100.0% 39,996,871
The accompanying notes are an integral part of the financial statements.
390
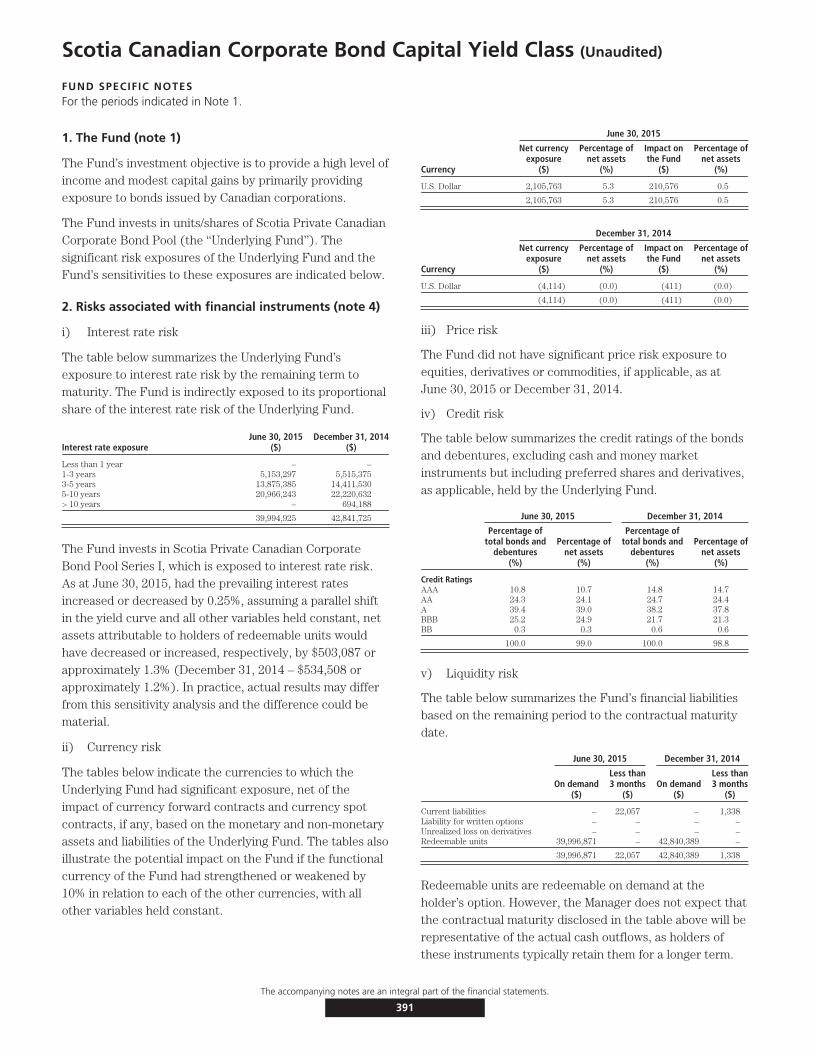
Scotia Canadian Corporate Bond Capital Yield Class (Unaudited)
FUND SPECIFIC NOTESFor the periods indicated in Note 1.
1. The Fund (note 1)
The Fund’s investment objective is to provide a high level ofincome and modest capital gains by primarily providingexposure to bonds issued by Canadian corporations.
The Fund invests in units/shares of Scotia Private CanadianCorporate Bond Pool (the ‘‘Underlying Fund’’). Thesignificant risk exposures of the Underlying Fund and theFund’s sensitivities to these exposures are indicated below.
2. Risks associated with financial instruments (note 4)
i) Interest rate risk
The table below summarizes the Underlying Fund’sexposure to interest rate risk by the remaining term tomaturity. The Fund is indirectly exposed to its proportionalshare of the interest rate risk of the Underlying Fund.
Interest rate exposureJune 30, 2015
($)December 31, 2014
($)
Less than 1 year – –1-3 years 5,153,297 5,515,3753-5 years 13,875,385 14,411,5305-10 years 20,966,243 22,220,632> 10 years – 694,188
39,994,925 42,841,725
The Fund invests in Scotia Private Canadian CorporateBond Pool Series I, which is exposed to interest rate risk.As at June 30, 2015, had the prevailing interest ratesincreased or decreased by 0.25%, assuming a parallel shiftin the yield curve and all other variables held constant, netassets attributable to holders of redeemable units wouldhave decreased or increased, respectively, by $503,087 orapproximately 1.3% (December 31, 2014 – $534,508 orapproximately 1.2%). In practice, actual results may differfrom this sensitivity analysis and the difference could bematerial.
ii) Currency risk
The tables below indicate the currencies to which theUnderlying Fund had significant exposure, net of theimpact of currency forward contracts and currency spotcontracts, if any, based on the monetary and non-monetaryassets and liabilities of the Underlying Fund. The tables alsoillustrate the potential impact on the Fund if the functionalcurrency of the Fund had strengthened or weakened by10% in relation to each of the other currencies, with allother variables held constant.
June 30, 2015
Currency
Net currencyexposure
($)
Percentage ofnet assets
(%)
Impact onthe Fund
($)
Percentage ofnet assets
(%)
U.S. Dollar 2,105,763 5.3 210,576 0.5
2,105,763 5.3 210,576 0.5
December 31, 2014
Currency
Net currencyexposure
($)
Percentage ofnet assets
(%)
Impact onthe Fund
($)
Percentage ofnet assets
(%)
U.S. Dollar (4,114) (0.0) (411) (0.0)
(4,114) (0.0) (411) (0.0)
iii) Price risk
The Fund did not have significant price risk exposure toequities, derivatives or commodities, if applicable, as atJune 30, 2015 or December 31, 2014.
iv) Credit risk
The table below summarizes the credit ratings of the bondsand debentures, excluding cash and money marketinstruments but including preferred shares and derivatives,as applicable, held by the Underlying Fund.
June 30, 2015 December 31, 2014
Percentage oftotal bonds and
debentures(%)
Percentage ofnet assets
(%)
Percentage oftotal bonds and
debentures(%)
Percentage ofnet assets
(%)
Credit RatingsAAA 10.8 10.7 14.8 14.7AA 24.3 24.1 24.7 24.4A 39.4 39.0 38.2 37.8BBB 25.2 24.9 21.7 21.3BB 0.3 0.3 0.6 0.6
100.0 99.0 100.0 98.8
v) Liquidity risk
The table below summarizes the Fund’s financial liabilitiesbased on the remaining period to the contractual maturitydate.
June 30, 2015 December 31, 2014
On demand($)
Less than3 months
($)On demand
($)
Less than3 months
($)
Current liabilities – 22,057 – 1,338Liability for written options – – – –Unrealized loss on derivatives – – – –Redeemable units 39,996,871 – 42,840,389 –
39,996,871 22,057 42,840,389 1,338
Redeemable units are redeemable on demand at theholder’s option. However, the Manager does not expect thatthe contractual maturity disclosed in the table above will berepresentative of the actual cash outflows, as holders ofthese instruments typically retain them for a longer term.
The accompanying notes are an integral part of the financial statements.
391

Scotia Canadian Corporate Bond Capital Yield Class (Unaudited – Continued)
FUND SPECIFIC NOTESFor the periods indicated in Note 1.
vi) Concentration risk
Concentration risk arises as a result of the concentration ofexposures within the same category, geographical location,asset type or industry sector, as applicable. The table belowis a summary of the Underlying Fund’s concentration risk:
Percentage of net assets (%)
June 30, 2015 December 31, 2014
Corporate Bonds 90.3 87.4Federal Bonds 5.6 8.8Financials 0.9 0.0Mortgage-Backed Securities 2.2 2.6
vii) Fair value classification (note 2)
The tables below illustrate the classification of the Fund’sfinancial instruments within the fair value hierarchy.
June 30, 2015Level 1
($)Level 2
($)Level 3
($)Total($)
Underlying funds 39,994,925 – – 39,994,925
39,994,925 – – 39,994,925
December 31, 2014Level 1
($)Level 2
($)Level 3
($)Total($)
Underlying funds 42,841,724 – – 42,841,724
42,841,724 – – 42,841,724
Transfers between levels
During the periods ended June 30, 2015 and December 31,2014, there were no significant transfers between Level 1and Level 2.
3. Offsetting of financial assets and liabilities (note 2)
As at June 30, 2015 or December 31, 2014, the Fund didnot enter into any agreement whereby the financialinstruments were eligible for offset.
4. Interest in Underlying Funds (note 2)
The following tables provide information about the Fund’sinterest in Underlying Funds.
June 30, 2015
Underlying Fund
Net asset value ofUnderlying Fund
($)
Carrying value ofUnderlying Fund
($)
Carrying value ofUnderlying Fundas a percentage
of net assets(%)
Scotia Private CanadianCorporate Bond PoolSeries I 4,860,619,761 39,994,925 100.0
39,994,925 100.0
December 31, 2014
Underlying Fund
Net asset value ofUnderlying Fund
($)
Carrying value ofUnderlying Fund
($)
Carrying value ofUnderlying Fundas a percentage
of net assets(%)
Scotia Private CanadianCorporate Bond PoolSeries I 4,143,683,984 42,841,724 100.0
42,841,724 100.0
5. Comparison of net asset value per unit and netassets per unit (note 2)
The table below provides a comparison of the net assetvalue per unit and net assets per unit. The primary reasonfor the difference between the net asset value per unit andnet assets per unit, if any, is described in note 2.
June 30, 2015 December 31, 2014
Net asset valueper unit
($)
Net assetsper unit
($)
Net asset valueper unit
($)
Net assetsper unit
($)
Series M 10.89 10.89 10.88 10.87
The accompanying notes are an integral part of the financial statements.
392
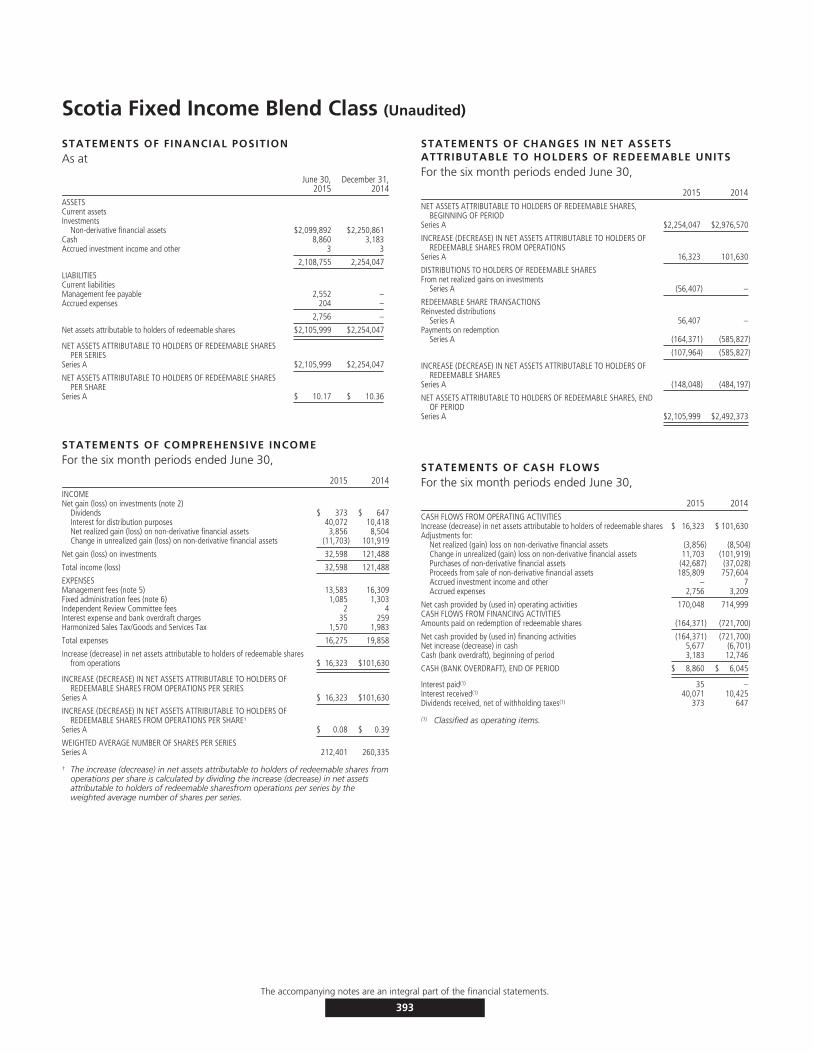
Scotia Fixed Income Blend Class (Unaudited)
STATEMENTS OF FINANCIAL POSITIONAs at
June 30,2015
December 31,2014
ASSETSCurrent assetsInvestments
Non-derivative financial assets $2,099,892 $2,250,861Cash 8,860 3,183Accrued investment income and other 3 3
2,108,755 2,254,047
LIABILITIESCurrent liabilitiesManagement fee payable 2,552 –Accrued expenses 204 –
2,756 –
Net assets attributable to holders of redeemable shares $2,105,999 $2,254,047
NET ASSETS ATTRIBUTABLE TO HOLDERS OF REDEEMABLE SHARESPER SERIES
Series A $2,105,999 $2,254,047
NET ASSETS ATTRIBUTABLE TO HOLDERS OF REDEEMABLE SHARESPER SHARE
Series A $ 10.17 $ 10.36
STATEMENTS OF COMPREHENSIVE INCOMEFor the six month periods ended June 30,
2015 2014INCOMENet gain (loss) on investments (note 2)
Dividends $ 373 $ 647Interest for distribution purposes 40,072 10,418Net realized gain (loss) on non-derivative financial assets 3,856 8,504Change in unrealized gain (loss) on non-derivative financial assets (11,703) 101,919
Net gain (loss) on investments 32,598 121,488
Total income (loss) 32,598 121,488
EXPENSESManagement fees (note 5) 13,583 16,309Fixed administration fees (note 6) 1,085 1,303Independent Review Committee fees 2 4Interest expense and bank overdraft charges 35 259Harmonized Sales Tax/Goods and Services Tax 1,570 1,983
Total expenses 16,275 19,858
Increase (decrease) in net assets attributable to holders of redeemable sharesfrom operations $ 16,323 $101,630
INCREASE (DECREASE) IN NET ASSETS ATTRIBUTABLE TO HOLDERS OFREDEEMABLE SHARES FROM OPERATIONS PER SERIES
Series A $ 16,323 $101,630
INCREASE (DECREASE) IN NET ASSETS ATTRIBUTABLE TO HOLDERS OFREDEEMABLE SHARES FROM OPERATIONS PER SHARE†
Series A $ 0.08 $ 0.39
WEIGHTED AVERAGE NUMBER OF SHARES PER SERIESSeries A 212,401 260,335
† The increase (decrease) in net assets attributable to holders of redeemable shares fromoperations per share is calculated by dividing the increase (decrease) in net assetsattributable to holders of redeemable sharesfrom operations per series by theweighted average number of shares per series.
STATEMENTS OF CHANGES IN NET ASSETSATTRIBUTABLE TO HOLDERS OF REDEEMABLE UNITSFor the six month periods ended June 30,
2015 2014NET ASSETS ATTRIBUTABLE TO HOLDERS OF REDEEMABLE SHARES,
BEGINNING OF PERIODSeries A $2,254,047 $2,976,570
INCREASE (DECREASE) IN NET ASSETS ATTRIBUTABLE TO HOLDERS OFREDEEMABLE SHARES FROM OPERATIONS
Series A 16,323 101,630
DISTRIBUTIONS TO HOLDERS OF REDEEMABLE SHARESFrom net realized gains on investments
Series A (56,407) –
REDEEMABLE SHARE TRANSACTIONSReinvested distributions
Series A 56,407 –Payments on redemption
Series A (164,371) (585,827)
(107,964) (585,827)
INCREASE (DECREASE) IN NET ASSETS ATTRIBUTABLE TO HOLDERS OFREDEEMABLE SHARES
Series A (148,048) (484,197)
NET ASSETS ATTRIBUTABLE TO HOLDERS OF REDEEMABLE SHARES, ENDOF PERIOD
Series A $2,105,999 $2,492,373
STATEMENTS OF CASH FLOWSFor the six month periods ended June 30,
2015 2014CASH FLOWS FROM OPERATING ACTIVITIESIncrease (decrease) in net assets attributable to holders of redeemable shares $ 16,323 $ 101,630Adjustments for:
Net realized (gain) loss on non-derivative financial assets (3,856) (8,504)Change in unrealized (gain) loss on non-derivative financial assets 11,703 (101,919)Purchases of non-derivative financial assets (42,687) (37,028)Proceeds from sale of non-derivative financial assets 185,809 757,604Accrued investment income and other – 7Accrued expenses 2,756 3,209
Net cash provided by (used in) operating activities 170,048 714,999CASH FLOWS FROM FINANCING ACTIVITIESAmounts paid on redemption of redeemable shares (164,371) (721,700)
Net cash provided by (used in) financing activities (164,371) (721,700)Net increase (decrease) in cash 5,677 (6,701)Cash (bank overdraft), beginning of period 3,183 12,746
CASH (BANK OVERDRAFT), END OF PERIOD $ 8,860 $ 6,045
Interest paid(1) 35 –Interest received(1) 40,071 10,425Dividends received, net of withholding taxes(1) 373 647
(1) Classified as operating items.
The accompanying notes are an integral part of the financial statements.
393

Scotia Fixed Income Blend Class (Unaudited – Continued)
SCHEDULE OF INVESTMENT PORTFOLIOAs at June 30, 2015
Numberof Units Issuer
AverageCost ($)
CarryingValue ($)
FIXED INCOME FUNDS – 99.7%76,606 Scotia Canadian Income Fund Series I 1,065,368 1,049,08421,991 Scotia Private American Core-Plus Bond Pool Series I 207,405 208,78428,691 Scotia Private Canadian Corporate Bond Pool Series I 310,967 313,89322,199 Scotia Private High Yield Income Pool Series I 211,664 213,73129,579 Scotia Private Short-Mid Government Bond Pool Series I 313,641 314,400
TOTAL INVESTMENT PORTFOLIO 2,109,045 2,099,892
OTHER ASSETS, LESS LIABILITIES – 0.3% 6,107
NET ASSETS – 100.0% 2,105,999
The accompanying notes are an integral part of the financial statements.
394
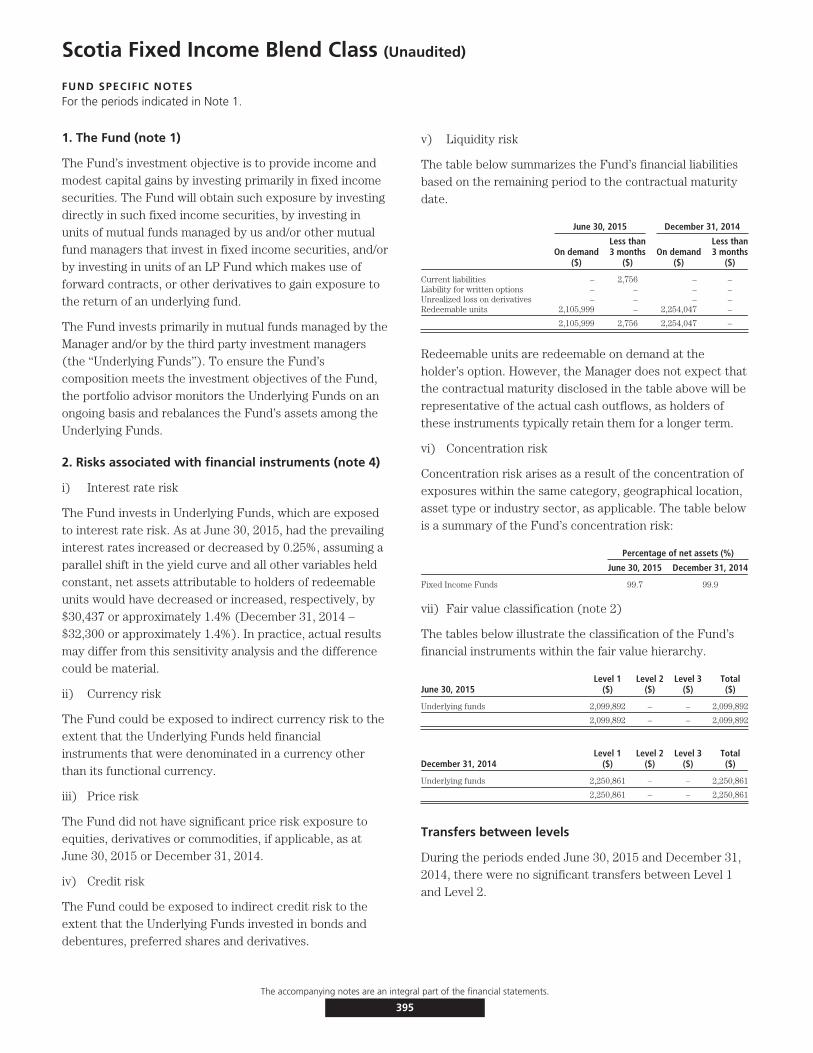
Scotia Fixed Income Blend Class (Unaudited)
FUND SPECIFIC NOTESFor the periods indicated in Note 1.
1. The Fund (note 1)
The Fund’s investment objective is to provide income andmodest capital gains by investing primarily in fixed incomesecurities. The Fund will obtain such exposure by investingdirectly in such fixed income securities, by investing inunits of mutual funds managed by us and/or other mutualfund managers that invest in fixed income securities, and/orby investing in units of an LP Fund which makes use offorward contracts, or other derivatives to gain exposure tothe return of an underlying fund.
The Fund invests primarily in mutual funds managed by theManager and/or by the third party investment managers(the ‘‘Underlying Funds’’). To ensure the Fund’scomposition meets the investment objectives of the Fund,the portfolio advisor monitors the Underlying Funds on anongoing basis and rebalances the Fund’s assets among theUnderlying Funds.
2. Risks associated with financial instruments (note 4)
i) Interest rate risk
The Fund invests in Underlying Funds, which are exposedto interest rate risk. As at June 30, 2015, had the prevailinginterest rates increased or decreased by 0.25%, assuming aparallel shift in the yield curve and all other variables heldconstant, net assets attributable to holders of redeemableunits would have decreased or increased, respectively, by$30,437 or approximately 1.4% (December 31, 2014 –$32,300 or approximately 1.4%). In practice, actual resultsmay differ from this sensitivity analysis and the differencecould be material.
ii) Currency risk
The Fund could be exposed to indirect currency risk to theextent that the Underlying Funds held financialinstruments that were denominated in a currency otherthan its functional currency.
iii) Price risk
The Fund did not have significant price risk exposure toequities, derivatives or commodities, if applicable, as atJune 30, 2015 or December 31, 2014.
iv) Credit risk
The Fund could be exposed to indirect credit risk to theextent that the Underlying Funds invested in bonds anddebentures, preferred shares and derivatives.
v) Liquidity risk
The table below summarizes the Fund’s financial liabilitiesbased on the remaining period to the contractual maturitydate.
June 30, 2015 December 31, 2014
On demand($)
Less than3 months
($)On demand
($)
Less than3 months
($)
Current liabilities – 2,756 – –Liability for written options – – – –Unrealized loss on derivatives – – – –Redeemable units 2,105,999 – 2,254,047 –
2,105,999 2,756 2,254,047 –
Redeemable units are redeemable on demand at theholder’s option. However, the Manager does not expect thatthe contractual maturity disclosed in the table above will berepresentative of the actual cash outflows, as holders ofthese instruments typically retain them for a longer term.
vi) Concentration risk
Concentration risk arises as a result of the concentration ofexposures within the same category, geographical location,asset type or industry sector, as applicable. The table belowis a summary of the Fund’s concentration risk:
Percentage of net assets (%)
June 30, 2015 December 31, 2014
Fixed Income Funds 99.7 99.9
vii) Fair value classification (note 2)
The tables below illustrate the classification of the Fund’sfinancial instruments within the fair value hierarchy.
June 30, 2015Level 1
($)Level 2
($)Level 3
($)Total($)
Underlying funds 2,099,892 – – 2,099,892
2,099,892 – – 2,099,892
December 31, 2014Level 1
($)Level 2
($)Level 3
($)Total($)
Underlying funds 2,250,861 – – 2,250,861
2,250,861 – – 2,250,861
Transfers between levels
During the periods ended June 30, 2015 and December 31,2014, there were no significant transfers between Level 1and Level 2.
The accompanying notes are an integral part of the financial statements.
395

Scotia Fixed Income Blend Class (Unaudited – Continued)
FUND SPECIFIC NOTESFor the periods indicated in Note 1.
3. Offsetting of financial assets and liabilities (note 2)
As at June 30, 2015 or December 31, 2014, the Fund didnot enter into any agreement whereby the financialinstruments were eligible for offset.
4. Interest in Underlying Funds (note 2)
The following tables provide information about the Fund’sinterest in Underlying Funds.
June 30, 2015
Underlying Fund
Net asset value ofUnderlying Fund
($)
Carrying value ofUnderlying Fund
($)
Carrying value ofUnderlying Fundas a percentage
of net assets(%)
Scotia Private High YieldIncome Pool Series I 941,135,483 213,731 10.2
Scotia Private AmericanCore-Plus Bond PoolSeries I 694,441,762 208,784 9.9
Scotia Private CanadianCorporate Bond PoolSeries I 4,860,619,761 313,893 14.9
Scotia Canadian IncomeFund Series I 5,950,709,764 1,049,084 49.8
Scotia Private Short-MidGovernment Bond PoolSeries I 1,498,303,519 314,400 14.9
2,099,892 99.7
December 31, 2014
Underlying Fund
Net asset value ofUnderlying Fund
($)
Carrying value ofUnderlying Fund
($)
Carrying value ofUnderlying Fundas a percentage
of net assets(%)
Scotia Private High YieldIncome Pool Series I 910,438,382 220,335 9.8
Scotia Private AmericanCore-Plus Bond PoolSeries I 628,345,246 226,294 10.0
Scotia Private CanadianCorporate Bond PoolSeries I 4,143,683,984 341,847 15.2
Scotia Canadian IncomeFund Series I 5,990,064,451 1,126,051 50.0
Scotia Private Short-MidGovernment Bond PoolSeries I 1,640,083,559 336,334 14.9
2,250,861 99.9
5. Comparison of net asset value per unit and netassets per unit (note 2)
The table below provides a comparison of the net assetvalue per unit and net assets per unit. The primary reasonfor the difference between the net asset value per unit andnet assets per unit, if any, is described in note 2.
June 30, 2015 December 31, 2014
Net asset valueper unit
($)
Net assetsper unit
($)
Net asset valueper unit
($)
Net assetsper unit
($)
Series A 10.17 10.17 10.36 10.36
The accompanying notes are an integral part of the financial statements.
396

Scotia Canadian Dividend Class (Unaudited)
STATEMENTS OF FINANCIAL POSITIONAs at
June 30,2015
December 31,2014
ASSETSCurrent assetsInvestments
Non-derivative financial assets $146,788,938 $135,758,725Cash 89,343 266,236Receivable for securities sold 90,000 –Subscriptions receivable 150,771 141,788Accrued investment income and other 96 133
147,119,148 136,166,882
LIABILITIESCurrent liabilitiesManagement fee payable 142,963 –Payable for securities purchased 151,000 –Redemptions payable 20,705 427,315Accrued expenses 13,427 –Distributions payable – 47,946
328,095 475,261
Net assets attributable to holders of redeemable shares $146,791,053 $135,691,621
NET ASSETS ATTRIBUTABLE TO HOLDERS OF REDEEMABLE SHARESPER SERIES
Series A $ 94,053,901 $ 83,881,635Series M $ 52,737,152 $ 51,809,986
NET ASSETS ATTRIBUTABLE TO HOLDERS OF REDEEMABLE SHARESPER SHARE
Series A $ 13.36 $ 13.58Series M $ 13.75 $ 13.87
STATEMENTS OF COMPREHENSIVE INCOMEFor the six month periods ended June 30,
2015 2014INCOMENet gain (loss) on investments (note 2)
Dividends $ 2,101,488 $1,505,075Interest for distribution purposes 625 1,480Net realized gain (loss) on non-derivative financial assets 1,165,986 344,919Change in unrealized gain (loss) on non-derivative financial assets (1,075,261) 7,307,801
Net gain (loss) on investments 2,192,838 9,159,275Other income 963 151
Total income (loss) 2,193,801 9,159,426
EXPENSESManagement fees (note 5) 712,328 432,773Fixed administration fees (note 6) 67,061 43,398Independent Review Committee fees 107 140Interest expense and bank overdraft charges 1,188 459Harmonized Sales Tax/Goods and Services Tax 79,994 48,679
Total expenses 860,678 525,449
Increase (decrease) in net assets attributable to holders of redeemableshares from operations $ 1,333,123 $8,633,977
INCREASE (DECREASE) IN NET ASSETS ATTRIBUTABLE TO HOLDERS OFREDEEMABLE SHARES FROM OPERATIONS PER SERIES
Series A $ 540,728 $4,855,677Series M $ 792,395 $3,778,300
INCREASE (DECREASE) IN NET ASSETS ATTRIBUTABLE TO HOLDERS OFREDEEMABLE SHARES FROM OPERATIONS PER SHARE†
Series A $ 0.08 $ 1.10Series M $ 0.21 $ 1.20
WEIGHTED AVERAGE NUMBER OF SHARES PER SERIESSeries A 6,759,543 4,411,386Series M 3,855,887 3,147,743
† The increase (decrease) in net assets attributable to holders of redeemable shares fromoperations per share is calculated by dividing the increase (decrease) in net assetsattributable to holders of redeemable shares from operations per series by theweighted average number of shares per series.
STATEMENTS OF CHANGES IN NET ASSETSATTRIBUTABLE TO HOLDERS OF REDEEMABLE UNITSFor the six month periods ended June 30,
2015 2014NET ASSETS ATTRIBUTABLE TO HOLDERS OF REDEEMABLE SHARES,
BEGINNING OF PERIODSeries A $ 83,881,635 $ 46,843,274Series M 51,809,986 33,649,145
135,691,621 80,492,419
INCREASE (DECREASE) IN NET ASSETS ATTRIBUTABLE TO HOLDERSOF REDEEMABLE SHARES FROM OPERATIONS
Series A 540,728 4,855,677Series M 792,395 3,778,300
1,333,123 8,633,977
DISTRIBUTIONS TO HOLDERS OF REDEEMABLE SHARESFrom net realized gains on investments
Series A (2,099,099) –Series M (1,296,520) –
(3,395,619) –
REDEEMABLE SHARE TRANSACTIONSProceeds from issue
Series A 18,151,160 19,806,213Series M 8,956,335 12,091,578
Reinvested distributionsSeries A 2,091,594 –Series M 1,296,520 –
Payments on redemptionSeries A (8,512,117) (4,534,400)Series M (8,821,564) (4,903,152)
13,161,928 22,460,239
INCREASE (DECREASE) IN NET ASSETS ATTRIBUTABLE TO HOLDERSOF REDEEMABLE SHARES
Series A 10,172,266 20,127,490Series M 927,166 10,966,726
11,099,432 31,094,216
NET ASSETS ATTRIBUTABLE TO HOLDERS OF REDEEMABLE SHARES,END OF PERIOD
Series A 94,053,901 66,970,764Series M 52,737,152 44,615,871
$146,791,053 $111,586,635
STATEMENTS OF CASH FLOWSFor the six month periods ended June 30,
2015 2014CASH FLOWS FROM OPERATING ACTIVITIESIncrease (decrease) in net assets attributable to holders of redeemable
shares $ 1,333,123 $ 8,633,977Adjustments for:
Net realized (gain) loss on non-derivative financial assets (1,165,986) (344,919)Change in unrealized (gain) loss on non-derivative financial assets 1,075,261 (7,307,801)Purchases of non-derivative financial assets (18,097,488) (27,216,972)Proceeds from sale of non-derivative financial assets 7,219,000 2,818,600Accrued investment income and other 37 (13)Accrued expenses 156,390 104,559
Net cash provided by (used in) operating activities (9,479,663) (23,312,569)CASH FLOWS FROM FINANCING ACTIVITIESProceeds from issue of redeemable shares 27,098,512 32,115,288Amounts paid on redemption of redeemable shares (17,740,291) (9,384,358)Distributions to shareholders of redeemable shares (55,451) (38,751)
Net cash provided by (used in) financing activities 9,302,770 22,692,179Net increase (decrease) in cash (176,893) (620,390)Cash (bank overdraft), beginning of period 266,236 735,238
CASH (BANK OVERDRAFT), END OF PERIOD $ 89,343 $ 114,848
Interest paid(1) 1,188 –Interest received(1) 661 1,467Dividends received, net of withholding taxes(1) 2,101,488 1,505,075
(1) Classified as operating items.
The accompanying notes are an integral part of the financial statements.
397

Scotia Canadian Dividend Class (Unaudited – Continued)
SCHEDULE OF INVESTMENT PORTFOLIOAs at June 30, 2015
Numberof Units Issuer
AverageCost ($)
CarryingValue ($)
CANDIAN EQUITY FUND – 100.0%2,796,678 Scotia Canadian Dividend Fund Series I 127,657,148 146,788,938
TOTAL INVESTMENT PORTFOLIO 127,657,148 146,788,938
OTHER ASSETS, LESS LIABILITIES – 0.0% 2,115
NET ASSETS – 100.0% 146,791,053
The accompanying notes are an integral part of the financial statements.
398
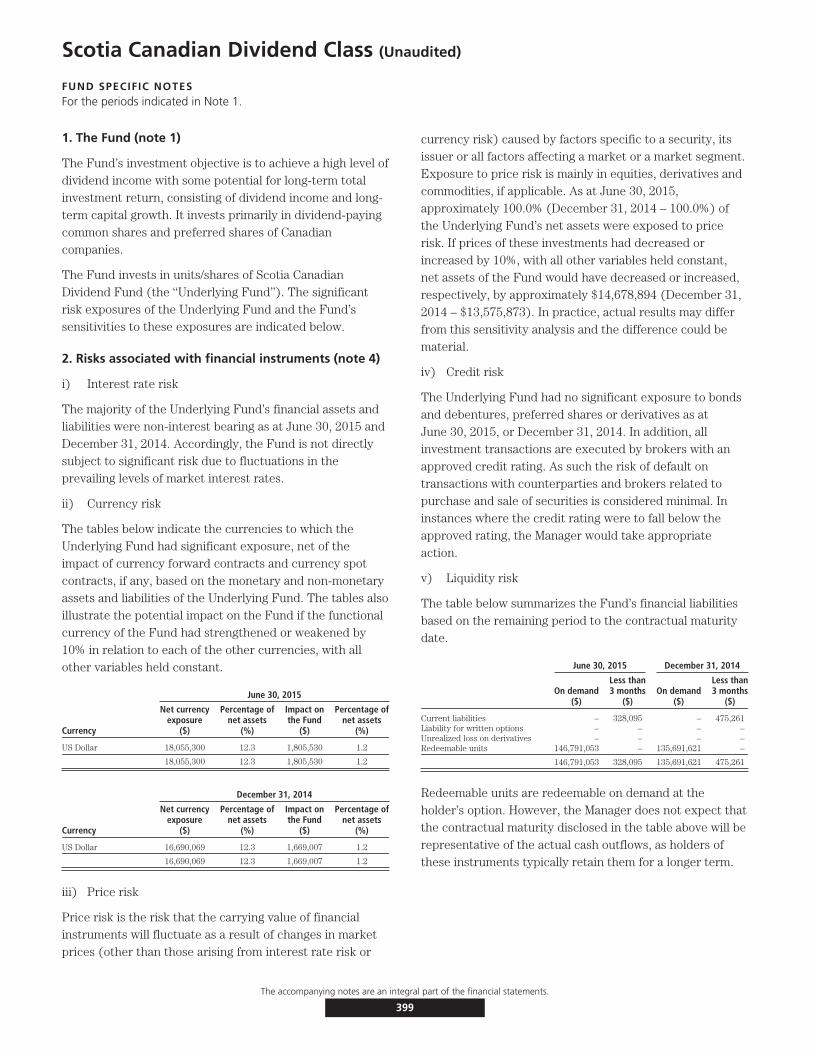
Scotia Canadian Dividend Class (Unaudited)
FUND SPECIFIC NOTESFor the periods indicated in Note 1.
1. The Fund (note 1)
The Fund’s investment objective is to achieve a high level ofdividend income with some potential for long-term totalinvestment return, consisting of dividend income and long-term capital growth. It invests primarily in dividend-payingcommon shares and preferred shares of Canadiancompanies.
The Fund invests in units/shares of Scotia CanadianDividend Fund (the ‘‘Underlying Fund’’). The significantrisk exposures of the Underlying Fund and the Fund’ssensitivities to these exposures are indicated below.
2. Risks associated with financial instruments (note 4)
i) Interest rate risk
The majority of the Underlying Fund’s financial assets andliabilities were non-interest bearing as at June 30, 2015 andDecember 31, 2014. Accordingly, the Fund is not directlysubject to significant risk due to fluctuations in theprevailing levels of market interest rates.
ii) Currency risk
The tables below indicate the currencies to which theUnderlying Fund had significant exposure, net of theimpact of currency forward contracts and currency spotcontracts, if any, based on the monetary and non-monetaryassets and liabilities of the Underlying Fund. The tables alsoillustrate the potential impact on the Fund if the functionalcurrency of the Fund had strengthened or weakened by10% in relation to each of the other currencies, with allother variables held constant.
June 30, 2015
Currency
Net currencyexposure
($)
Percentage ofnet assets
(%)
Impact onthe Fund
($)
Percentage ofnet assets
(%)
US Dollar 18,055,300 12.3 1,805,530 1.2
18,055,300 12.3 1,805,530 1.2
December 31, 2014
Currency
Net currencyexposure
($)
Percentage ofnet assets
(%)
Impact onthe Fund
($)
Percentage ofnet assets
(%)
US Dollar 16,690,069 12.3 1,669,007 1.2
16,690,069 12.3 1,669,007 1.2
iii) Price risk
Price risk is the risk that the carrying value of financialinstruments will fluctuate as a result of changes in marketprices (other than those arising from interest rate risk or
currency risk) caused by factors specific to a security, itsissuer or all factors affecting a market or a market segment.Exposure to price risk is mainly in equities, derivatives andcommodities, if applicable. As at June 30, 2015,approximately 100.0% (December 31, 2014 – 100.0%) ofthe Underlying Fund’s net assets were exposed to pricerisk. If prices of these investments had decreased orincreased by 10%, with all other variables held constant,net assets of the Fund would have decreased or increased,respectively, by approximately $14,678,894 (December 31,2014 – $13,575,873). In practice, actual results may differfrom this sensitivity analysis and the difference could bematerial.
iv) Credit risk
The Underlying Fund had no significant exposure to bondsand debentures, preferred shares or derivatives as atJune 30, 2015, or December 31, 2014. In addition, allinvestment transactions are executed by brokers with anapproved credit rating. As such the risk of default ontransactions with counterparties and brokers related topurchase and sale of securities is considered minimal. Ininstances where the credit rating were to fall below theapproved rating, the Manager would take appropriateaction.
v) Liquidity risk
The table below summarizes the Fund’s financial liabilitiesbased on the remaining period to the contractual maturitydate.
June 30, 2015 December 31, 2014
On demand($)
Less than3 months
($)On demand
($)
Less than3 months
($)
Current liabilities – 328,095 – 475,261Liability for written options – – – –Unrealized loss on derivatives – – – –Redeemable units 146,791,053 – 135,691,621 –
146,791,053 328,095 135,691,621 475,261
Redeemable units are redeemable on demand at theholder’s option. However, the Manager does not expect thatthe contractual maturity disclosed in the table above will berepresentative of the actual cash outflows, as holders ofthese instruments typically retain them for a longer term.
The accompanying notes are an integral part of the financial statements.
399
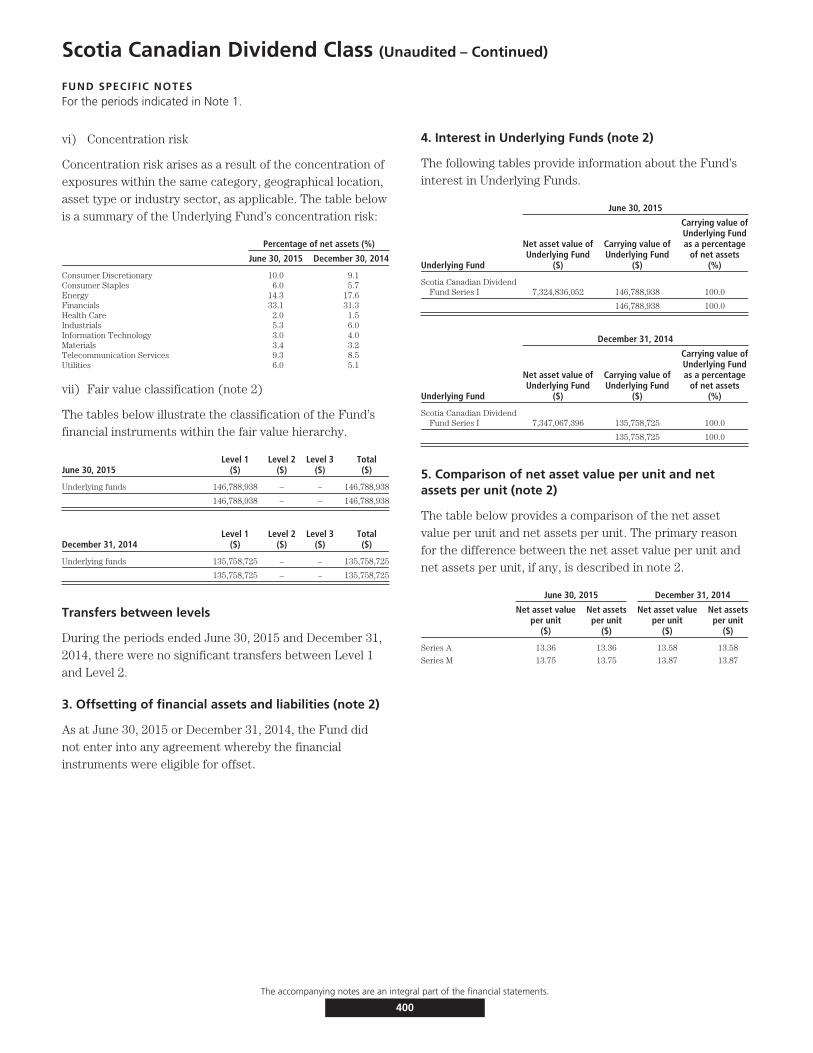
Scotia Canadian Dividend Class (Unaudited – Continued)
FUND SPECIFIC NOTESFor the periods indicated in Note 1.
vi) Concentration risk
Concentration risk arises as a result of the concentration ofexposures within the same category, geographical location,asset type or industry sector, as applicable. The table belowis a summary of the Underlying Fund’s concentration risk:
Percentage of net assets (%)
June 30, 2015 December 30, 2014
Consumer Discretionary 10.0 9.1Consumer Staples 6.0 5.7Energy 14.3 17.6Financials 33.1 31.3Health Care 2.0 1.5Industrials 5.3 6.0Information Technology 3.0 4.0Materials 3.4 3.2Telecommunication Services 9.3 8.5Utilities 6.0 5.1
vii) Fair value classification (note 2)
The tables below illustrate the classification of the Fund’sfinancial instruments within the fair value hierarchy.
June 30, 2015Level 1
($)Level 2
($)Level 3
($)Total($)
Underlying funds 146,788,938 – – 146,788,938
146,788,938 – – 146,788,938
December 31, 2014Level 1
($)Level 2
($)Level 3
($)Total($)
Underlying funds 135,758,725 – – 135,758,725
135,758,725 – – 135,758,725
Transfers between levels
During the periods ended June 30, 2015 and December 31,2014, there were no significant transfers between Level 1and Level 2.
3. Offsetting of financial assets and liabilities (note 2)
As at June 30, 2015 or December 31, 2014, the Fund didnot enter into any agreement whereby the financialinstruments were eligible for offset.
4. Interest in Underlying Funds (note 2)
The following tables provide information about the Fund’sinterest in Underlying Funds.
June 30, 2015
Underlying Fund
Net asset value ofUnderlying Fund
($)
Carrying value ofUnderlying Fund
($)
Carrying value ofUnderlying Fundas a percentage
of net assets(%)
Scotia Canadian DividendFund Series I 7,324,836,052 146,788,938 100.0
146,788,938 100.0
December 31, 2014
Underlying Fund
Net asset value ofUnderlying Fund
($)
Carrying value ofUnderlying Fund
($)
Carrying value ofUnderlying Fundas a percentage
of net assets(%)
Scotia Canadian DividendFund Series I 7,347,067,396 135,758,725 100.0
135,758,725 100.0
5. Comparison of net asset value per unit and netassets per unit (note 2)
The table below provides a comparison of the net assetvalue per unit and net assets per unit. The primary reasonfor the difference between the net asset value per unit andnet assets per unit, if any, is described in note 2.
June 30, 2015 December 31, 2014
Net asset valueper unit
($)
Net assetsper unit
($)
Net asset valueper unit
($)
Net assetsper unit
($)
Series A 13.36 13.36 13.58 13.58
Series M 13.75 13.75 13.87 13.87
The accompanying notes are an integral part of the financial statements.
400

Scotia Canadian Equity Blend Class (Unaudited)
STATEMENTS OF FINANCIAL POSITIONAs at
June 30,2015
December 31,2014
ASSETSCurrent assetsInvestments
Non-derivative financial assets $1,563,385 $1,317,317Cash 19,823 13,734Subscriptions receivable 6,028 1,278Accrued investment income and other 12 11
1,589,248 1,332,340
LIABILITIESCurrent liabilitiesManagement fee payable 2,826 –Payable for securities purchased 6,593 –Redemptions payable 500 –Accrued expenses 229 –Distributions payable – 194
10,148 194
Net assets attributable to holders of redeemable shares $1,579,100 $1,332,146
NET ASSETS ATTRIBUTABLE TO HOLDERS OF REDEEMABLE SHARESPER SERIES
Series A $1,579,100 $1,332,146
NET ASSETS ATTRIBUTABLE TO HOLDERS OF REDEEMABLE SHARESPER SHARE
Series A $ 13.44 $ 13.20
STATEMENTS OF COMPREHENSIVE INCOMEFor the six month periods ended June 30,
2015 2014INCOMENet gain (loss) on investments (note 2)
Dividends $ 3,912 $ 2,140Interest for distribution purposes 9,900 8,514Capital gains distributions received 19,356 –Net realized gain (loss) on non-derivative financial assets 9,236 31,392Change in unrealized gain (loss) on non-derivative financial assets 32,118 57,699
Net gain (loss) on investments 74,522 99,745Other income 1,067 –
Total income (loss) 75,589 99,745
EXPENSESManagement fees (note 5) 13,564 8,376Fixed administration fees (note 6) 1,099 679Independent Review Committee fees 2 2Interest expense and bank overdraft charges 125 7Harmonized Sales Tax/Goods and Services Tax 1,644 1,069
Total expenses 16,434 10,133
Increase (decrease) in net assets attributable to holders of redeemable sharesfrom operations $ 59,155 $89,612
INCREASE (DECREASE) IN NET ASSETS ATTRIBUTABLE TO HOLDERS OFREDEEMABLE SHARES FROM OPERATIONS PER SERIES
Series A $ 59,155 $89,612
INCREASE (DECREASE) IN NET ASSETS ATTRIBUTABLE TO HOLDERS OFREDEEMABLE SHARES FROM OPERATIONS PER SHARE†
Series A $ 0.54 $ 1.25
WEIGHTED AVERAGE NUMBER OF SHARES PER SERIESSeries A 109,860 71,725
† The increase (decrease) in net assets attributable to holders of redeemable shares fromoperations per share is calculated by dividing the increase (decrease) in net assetsattributable to holders of redeemable shares from operations per series by theweighted average number of shares per series.
STATEMENTS OF CHANGES IN NET ASSETSATTRIBUTABLE TO HOLDERS OF REDEEMABLE UNITSFor the six month periods ended June 30,
2015 2014NET ASSETS ATTRIBUTABLE TO HOLDERS OF REDEEMABLE SHARES,
BEGINNING OF PERIODSeries A $1,332,146 $ 682,253
INCREASE (DECREASE) IN NET ASSETS ATTRIBUTABLE TO HOLDERS OFREDEEMABLE SHARES FROM OPERATIONS
Series A 59,155 89,612
DISTRIBUTIONS TO HOLDERS OF REDEEMABLE SHARESFrom net realized gains on investments
Series A (33,336) –
REDEEMABLE SHARE TRANSACTIONSProceeds from issue
Series A 401,573 698,467Reinvested distributions
Series A 33,088 –Payments on redemption
Series A (213,526) (262,074)
221,135 436,393
INCREASE (DECREASE) IN NET ASSETS ATTRIBUTABLE TO HOLDERS OFREDEEMABLE SHARES
Series A 246,954 526,005
NET ASSETS ATTRIBUTABLE TO HOLDERS OF REDEEMABLE SHARES, ENDOF PERIOD
Series A $1,579,100 $1,208,258
STATEMENTS OF CASH FLOWSFor the six month periods ended June 30,
2015 2014CASH FLOWS FROM OPERATING ACTIVITIESIncrease (decrease) in net assets attributable to holders of redeemable shares $ 59,155 $ 89,612Adjustments for:
Net realized (gain) loss on non-derivative financial assets (9,236) (31,392)Change in unrealized (gain) loss on non-derivative financial assets (32,118) (57,699)Purchases of non-derivative financial assets (317,121) (676,173)Proceeds from sale of non-derivative financial assets 119,000 234,539Margin deposited on futures – (13)Accrued investment income and other (1) 2,174Accrued expenses 3,055 –
Net cash provided by (used in) operating activities (177,266) (438,952)CASH FLOWS FROM FINANCING ACTIVITIESProceeds from issue of redeemable shares 396,823 698,267Amounts paid on redemption of redeemable shares (213,026) (262,074)Distributions to shareholders of redeemable shares (442) –
Net cash provided by (used in) financing activities 183,355 436,193Net increase (decrease) in cash 6,089 (2,759)Cash (bank overdraft), beginning of period 13,734 16,472
CASH (BANK OVERDRAFT), END OF PERIOD $ 19,823 $ 13,713
Interest paid(1) 125 –Interest received(1) 9,898 8,501Dividends received, net of withholding taxes(1) 3,912 2,140
(1) Classified as operating items.
The accompanying notes are an integral part of the financial statements.
401
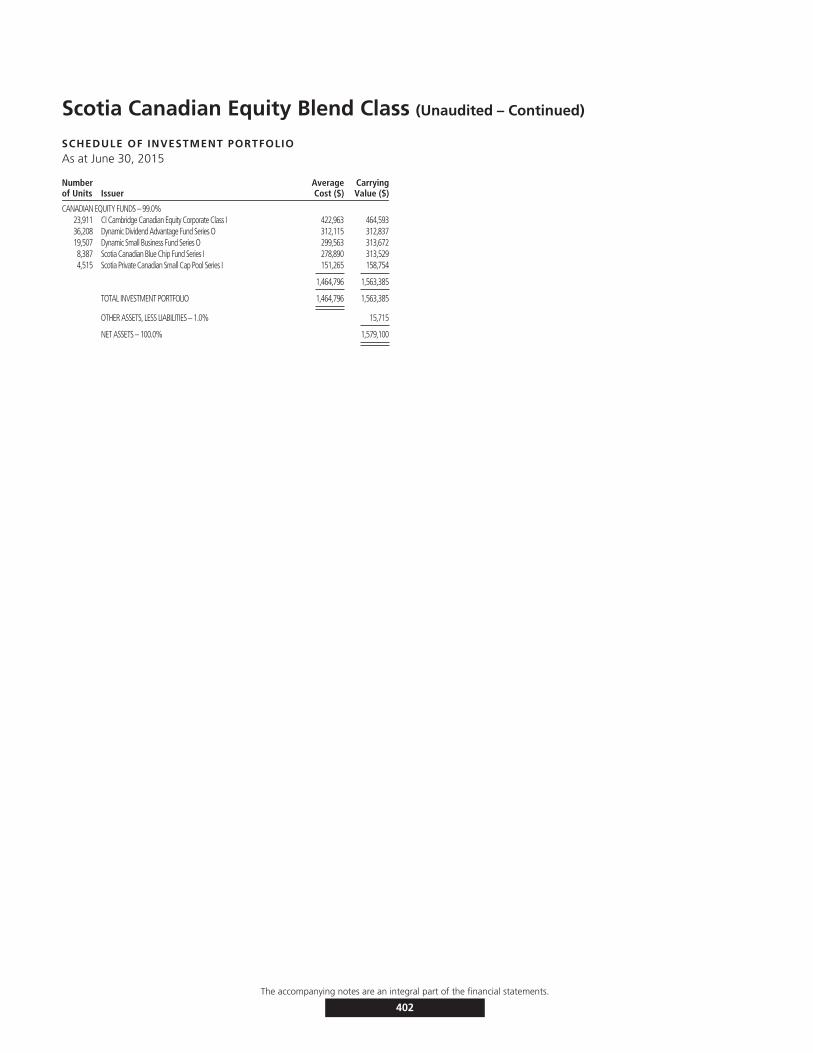
Scotia Canadian Equity Blend Class (Unaudited – Continued)
SCHEDULE OF INVESTMENT PORTFOLIOAs at June 30, 2015
Numberof Units Issuer
AverageCost ($)
CarryingValue ($)
CANADIAN EQUITY FUNDS – 99.0%23,911 CI Cambridge Canadian Equity Corporate Class I 422,963 464,59336,208 Dynamic Dividend Advantage Fund Series O 312,115 312,83719,507 Dynamic Small Business Fund Series O 299,563 313,6728,387 Scotia Canadian Blue Chip Fund Series I 278,890 313,5294,515 Scotia Private Canadian Small Cap Pool Series I 151,265 158,754
1,464,796 1,563,385
TOTAL INVESTMENT PORTFOLIO 1,464,796 1,563,385
OTHER ASSETS, LESS LIABILITIES – 1.0% 15,715
NET ASSETS – 100.0% 1,579,100
The accompanying notes are an integral part of the financial statements.
402
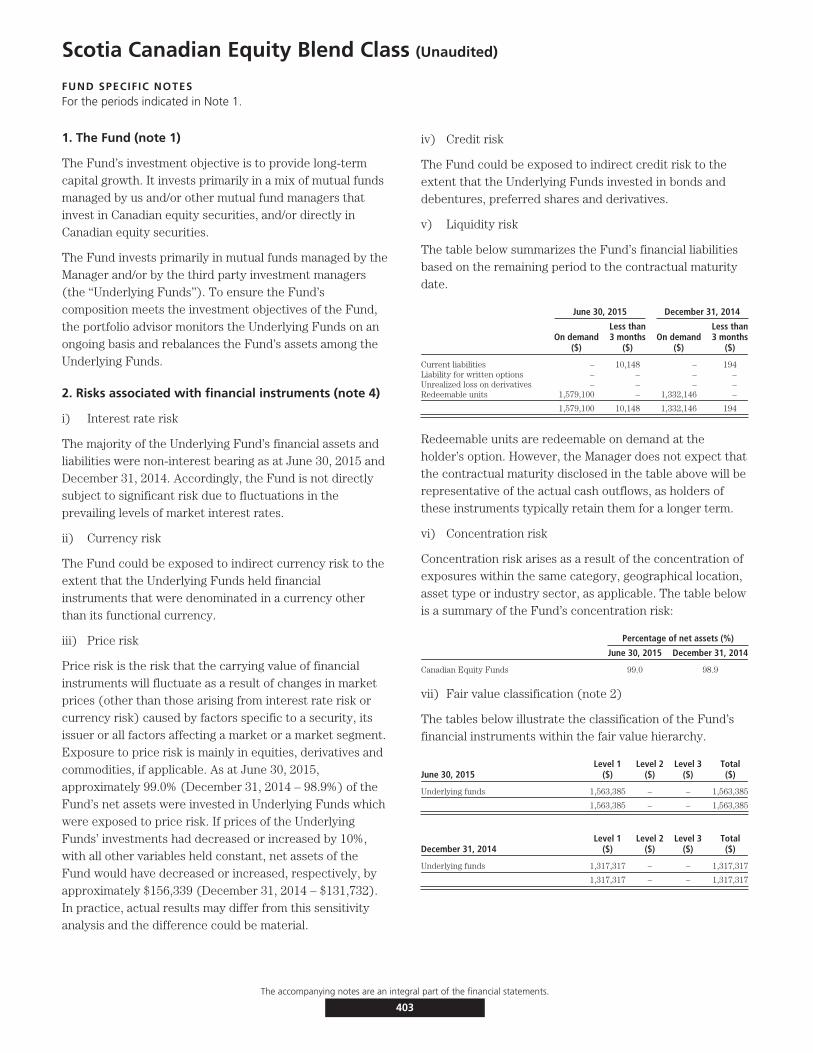
Scotia Canadian Equity Blend Class (Unaudited)
FUND SPECIFIC NOTESFor the periods indicated in Note 1.
1. The Fund (note 1)
The Fund’s investment objective is to provide long-termcapital growth. It invests primarily in a mix of mutual fundsmanaged by us and/or other mutual fund managers thatinvest in Canadian equity securities, and/or directly inCanadian equity securities.
The Fund invests primarily in mutual funds managed by theManager and/or by the third party investment managers(the ‘‘Underlying Funds’’). To ensure the Fund’scomposition meets the investment objectives of the Fund,the portfolio advisor monitors the Underlying Funds on anongoing basis and rebalances the Fund’s assets among theUnderlying Funds.
2. Risks associated with financial instruments (note 4)
i) Interest rate risk
The majority of the Underlying Fund’s financial assets andliabilities were non-interest bearing as at June 30, 2015 andDecember 31, 2014. Accordingly, the Fund is not directlysubject to significant risk due to fluctuations in theprevailing levels of market interest rates.
ii) Currency risk
The Fund could be exposed to indirect currency risk to theextent that the Underlying Funds held financialinstruments that were denominated in a currency otherthan its functional currency.
iii) Price risk
Price risk is the risk that the carrying value of financialinstruments will fluctuate as a result of changes in marketprices (other than those arising from interest rate risk orcurrency risk) caused by factors specific to a security, itsissuer or all factors affecting a market or a market segment.Exposure to price risk is mainly in equities, derivatives andcommodities, if applicable. As at June 30, 2015,approximately 99.0% (December 31, 2014 – 98.9%) of theFund’s net assets were invested in Underlying Funds whichwere exposed to price risk. If prices of the UnderlyingFunds’ investments had decreased or increased by 10%,with all other variables held constant, net assets of theFund would have decreased or increased, respectively, byapproximately $156,339 (December 31, 2014 – $131,732).In practice, actual results may differ from this sensitivityanalysis and the difference could be material.
iv) Credit risk
The Fund could be exposed to indirect credit risk to theextent that the Underlying Funds invested in bonds anddebentures, preferred shares and derivatives.
v) Liquidity risk
The table below summarizes the Fund’s financial liabilitiesbased on the remaining period to the contractual maturitydate.
June 30, 2015 December 31, 2014
On demand($)
Less than3 months
($)On demand
($)
Less than3 months
($)
Current liabilities – 10,148 – 194Liability for written options – – – –Unrealized loss on derivatives – – – –Redeemable units 1,579,100 – 1,332,146 –
1,579,100 10,148 1,332,146 194
Redeemable units are redeemable on demand at theholder’s option. However, the Manager does not expect thatthe contractual maturity disclosed in the table above will berepresentative of the actual cash outflows, as holders ofthese instruments typically retain them for a longer term.
vi) Concentration risk
Concentration risk arises as a result of the concentration ofexposures within the same category, geographical location,asset type or industry sector, as applicable. The table belowis a summary of the Fund’s concentration risk:
Percentage of net assets (%)
June 30, 2015 December 31, 2014
Canadian Equity Funds 99.0 98.9
vii) Fair value classification (note 2)
The tables below illustrate the classification of the Fund’sfinancial instruments within the fair value hierarchy.
June 30, 2015Level 1
($)Level 2
($)Level 3
($)Total($)
Underlying funds 1,563,385 – – 1,563,385
1,563,385 – – 1,563,385
December 31, 2014Level 1
($)Level 2
($)Level 3
($)Total($)
Underlying funds 1,317,317 – – 1,317,317
1,317,317 – – 1,317,317
The accompanying notes are an integral part of the financial statements.
403

Scotia Canadian Equity Blend Class (Unaudited – Continued)
FUND SPECIFIC NOTESFor the periods indicated in Note 1.
Transfers between levels
During the periods ended June 30, 2015 and December 31,2014, there were no significant transfers between Level 1and Level 2.
3. Offsetting of financial assets and liabilities (note 2)
As at June 30, 2015 or December 31, 2014, the Fund didnot enter into any agreement whereby the financialinstruments were eligible for offset.
4. Interest in Underlying Funds (note 2)
The following tables provide information about the Fund’sinterest in Underlying Funds.
June 30, 2015
Underlying Fund
Net asset value ofUnderlying Fund
($)
Carrying value ofUnderlying Fund
($)
Carrying value ofUnderlying Fundas a percentage
of net assets(%)
CI Cambridge CanadianEquity CorporateClass I 4,000,996,546 464,593 29.4
Dynamic Small BusinessFund Series O 572,121,025 313,672 19.9
Dynamic DividendAdvantage FundSeries O 1,038,793,931 312,837 19.8
Scotia Private CanadianSmall Cap Pool Series I 533,016,993 158,754 10.0
Scotia Canadian BlueChip Fund Series I 264,068,851 313,529 19.9
1,563,385 99.0
December 31, 2014
Underlying Fund
Net asset value ofUnderlying Fund
($)
Carrying value ofUnderlying Fund
($)
Carrying value ofUnderlying Fundas a percentage
of net assets(%)
CI Cambridge CanadianEquity CorporateClass I 3,722,459,360 395,028 29.7
Dynamic Small BusinessFund Series O 559,673,399 261,381 19.6
Dynamic DividendAdvantage FundSeries O 976,645,997 263,855 19.8
Scotia Private CanadianSmall Cap Pool Series I 538,492,305 132,714 10.0
Scotia Canadian BlueChip Fund Series I 255,460,144 264,339 19.8
1,317,317 98.9
5. Comparison of net asset value per unit and netassets per unit (note 2)
The table below provides a comparison of the net assetvalue per unit and net assets per unit. The primary reasonfor the difference between the net asset value per unit andnet assets per unit, if any, is described in note 2.
June 30, 2015 December 31, 2014
Net asset valueper unit
($)
Net assetsper unit
($)
Net asset valueper unit
($)
Net assetsper unit
($)
Series A 13.44 13.44 13.20 13.20
The accompanying notes are an integral part of the financial statements.
404
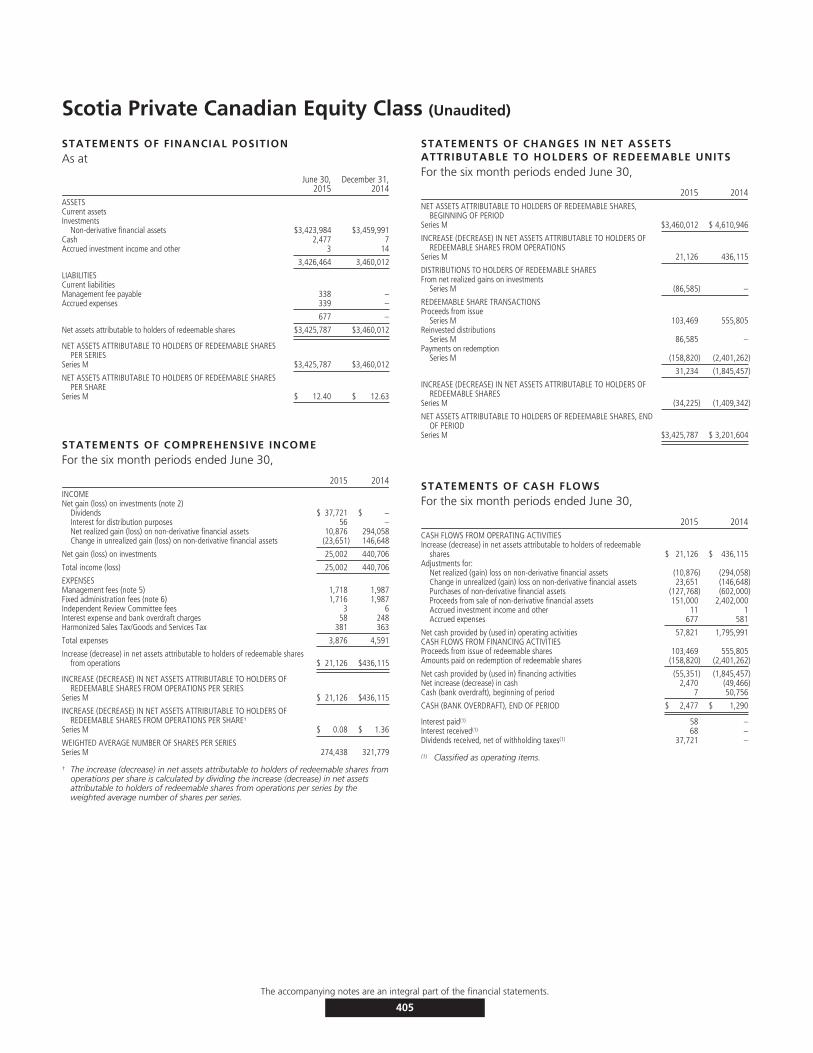
Scotia Private Canadian Equity Class (Unaudited)
STATEMENTS OF FINANCIAL POSITIONAs at
June 30,2015
December 31,2014
ASSETSCurrent assetsInvestments
Non-derivative financial assets $3,423,984 $3,459,991Cash 2,477 7Accrued investment income and other 3 14
3,426,464 3,460,012
LIABILITIESCurrent liabilitiesManagement fee payable 338 –Accrued expenses 339 –
677 –
Net assets attributable to holders of redeemable shares $3,425,787 $3,460,012
NET ASSETS ATTRIBUTABLE TO HOLDERS OF REDEEMABLE SHARESPER SERIES
Series M $3,425,787 $3,460,012
NET ASSETS ATTRIBUTABLE TO HOLDERS OF REDEEMABLE SHARESPER SHARE
Series M $ 12.40 $ 12.63
STATEMENTS OF COMPREHENSIVE INCOMEFor the six month periods ended June 30,
2015 2014INCOMENet gain (loss) on investments (note 2)
Dividends $ 37,721 $ –Interest for distribution purposes 56 –Net realized gain (loss) on non-derivative financial assets 10,876 294,058Change in unrealized gain (loss) on non-derivative financial assets (23,651) 146,648
Net gain (loss) on investments 25,002 440,706
Total income (loss) 25,002 440,706
EXPENSESManagement fees (note 5) 1,718 1,987Fixed administration fees (note 6) 1,716 1,987Independent Review Committee fees 3 6Interest expense and bank overdraft charges 58 248Harmonized Sales Tax/Goods and Services Tax 381 363
Total expenses 3,876 4,591
Increase (decrease) in net assets attributable to holders of redeemable sharesfrom operations $ 21,126 $436,115
INCREASE (DECREASE) IN NET ASSETS ATTRIBUTABLE TO HOLDERS OFREDEEMABLE SHARES FROM OPERATIONS PER SERIES
Series M $ 21,126 $436,115
INCREASE (DECREASE) IN NET ASSETS ATTRIBUTABLE TO HOLDERS OFREDEEMABLE SHARES FROM OPERATIONS PER SHARE†
Series M $ 0.08 $ 1.36
WEIGHTED AVERAGE NUMBER OF SHARES PER SERIESSeries M 274,438 321,779
† The increase (decrease) in net assets attributable to holders of redeemable shares fromoperations per share is calculated by dividing the increase (decrease) in net assetsattributable to holders of redeemable shares from operations per series by theweighted average number of shares per series.
STATEMENTS OF CHANGES IN NET ASSETSATTRIBUTABLE TO HOLDERS OF REDEEMABLE UNITSFor the six month periods ended June 30,
2015 2014NET ASSETS ATTRIBUTABLE TO HOLDERS OF REDEEMABLE SHARES,
BEGINNING OF PERIODSeries M $3,460,012 $ 4,610,946
INCREASE (DECREASE) IN NET ASSETS ATTRIBUTABLE TO HOLDERS OFREDEEMABLE SHARES FROM OPERATIONS
Series M 21,126 436,115
DISTRIBUTIONS TO HOLDERS OF REDEEMABLE SHARESFrom net realized gains on investments
Series M (86,585) –
REDEEMABLE SHARE TRANSACTIONSProceeds from issue
Series M 103,469 555,805Reinvested distributions
Series M 86,585 –Payments on redemption
Series M (158,820) (2,401,262)
31,234 (1,845,457)
INCREASE (DECREASE) IN NET ASSETS ATTRIBUTABLE TO HOLDERS OFREDEEMABLE SHARES
Series M (34,225) (1,409,342)
NET ASSETS ATTRIBUTABLE TO HOLDERS OF REDEEMABLE SHARES, ENDOF PERIOD
Series M $3,425,787 $ 3,201,604
STATEMENTS OF CASH FLOWSFor the six month periods ended June 30,
2015 2014CASH FLOWS FROM OPERATING ACTIVITIESIncrease (decrease) in net assets attributable to holders of redeemable
shares $ 21,126 $ 436,115Adjustments for:
Net realized (gain) loss on non-derivative financial assets (10,876) (294,058)Change in unrealized (gain) loss on non-derivative financial assets 23,651 (146,648)Purchases of non-derivative financial assets (127,768) (602,000)Proceeds from sale of non-derivative financial assets 151,000 2,402,000Accrued investment income and other 11 1Accrued expenses 677 581
Net cash provided by (used in) operating activities 57,821 1,795,991CASH FLOWS FROM FINANCING ACTIVITIESProceeds from issue of redeemable shares 103,469 555,805Amounts paid on redemption of redeemable shares (158,820) (2,401,262)
Net cash provided by (used in) financing activities (55,351) (1,845,457)Net increase (decrease) in cash 2,470 (49,466)Cash (bank overdraft), beginning of period 7 50,756
CASH (BANK OVERDRAFT), END OF PERIOD $ 2,477 $ 1,290
Interest paid(1) 58 –Interest received(1) 68 –Dividends received, net of withholding taxes(1) 37,721 –
(1) Classified as operating items.
The accompanying notes are an integral part of the financial statements.
405

Scotia Private Canadian Equity Class (Unaudited – Continued)
SCHEDULE OF INVESTMENT PORTFOLIOAs at June 30, 2015
Numberof Units Issuer
AverageCost ($)
CarryingValue ($)
CANADIAN EQUITY FUND – 99.9%262,876 Scotia Private Canadian Equity Pool Series I 3,164,532 3,423,984
TOTAL INVESTMENT PORTFOLIO 3,164,532 3,423,984
OTHER ASSETS, LESS LIABILITIES – 0.1% 1,803
NET ASSETS – 100.0% 3,425,787
The accompanying notes are an integral part of the financial statements.
406
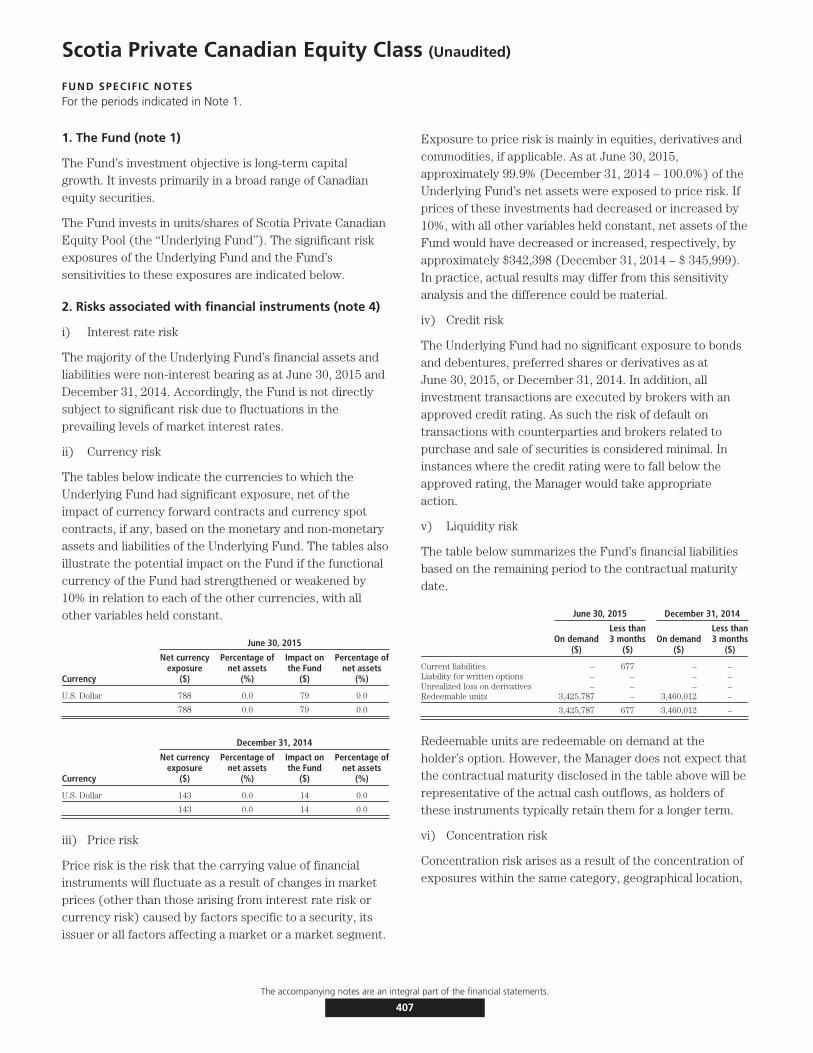
Scotia Private Canadian Equity Class (Unaudited)
FUND SPECIFIC NOTESFor the periods indicated in Note 1.
1. The Fund (note 1)
The Fund’s investment objective is long-term capitalgrowth. It invests primarily in a broad range of Canadianequity securities.
The Fund invests in units/shares of Scotia Private CanadianEquity Pool (the ‘‘Underlying Fund’’). The significant riskexposures of the Underlying Fund and the Fund’ssensitivities to these exposures are indicated below.
2. Risks associated with financial instruments (note 4)
i) Interest rate risk
The majority of the Underlying Fund’s financial assets andliabilities were non-interest bearing as at June 30, 2015 andDecember 31, 2014. Accordingly, the Fund is not directlysubject to significant risk due to fluctuations in theprevailing levels of market interest rates.
ii) Currency risk
The tables below indicate the currencies to which theUnderlying Fund had significant exposure, net of theimpact of currency forward contracts and currency spotcontracts, if any, based on the monetary and non-monetaryassets and liabilities of the Underlying Fund. The tables alsoillustrate the potential impact on the Fund if the functionalcurrency of the Fund had strengthened or weakened by10% in relation to each of the other currencies, with allother variables held constant.
June 30, 2015
Currency
Net currencyexposure
($)
Percentage ofnet assets
(%)
Impact onthe Fund
($)
Percentage ofnet assets
(%)
U.S. Dollar 788 0.0 79 0.0
788 0.0 79 0.0
December 31, 2014
Currency
Net currencyexposure
($)
Percentage ofnet assets
(%)
Impact onthe Fund
($)
Percentage ofnet assets
(%)
U.S. Dollar 143 0.0 14 0.0
143 0.0 14 0.0
iii) Price risk
Price risk is the risk that the carrying value of financialinstruments will fluctuate as a result of changes in marketprices (other than those arising from interest rate risk orcurrency risk) caused by factors specific to a security, itsissuer or all factors affecting a market or a market segment.
Exposure to price risk is mainly in equities, derivatives andcommodities, if applicable. As at June 30, 2015,approximately 99.9% (December 31, 2014 – 100.0%) of theUnderlying Fund’s net assets were exposed to price risk. Ifprices of these investments had decreased or increased by10%, with all other variables held constant, net assets of theFund would have decreased or increased, respectively, byapproximately $342,398 (December 31, 2014 – $ 345,999).In practice, actual results may differ from this sensitivityanalysis and the difference could be material.
iv) Credit risk
The Underlying Fund had no significant exposure to bondsand debentures, preferred shares or derivatives as atJune 30, 2015, or December 31, 2014. In addition, allinvestment transactions are executed by brokers with anapproved credit rating. As such the risk of default ontransactions with counterparties and brokers related topurchase and sale of securities is considered minimal. Ininstances where the credit rating were to fall below theapproved rating, the Manager would take appropriateaction.
v) Liquidity risk
The table below summarizes the Fund’s financial liabilitiesbased on the remaining period to the contractual maturitydate.
June 30, 2015 December 31, 2014
On demand($)
Less than3 months
($)On demand
($)
Less than3 months
($)
Current liabilities – 677 – –Liability for written options – – – –Unrealized loss on derivatives – – – –Redeemable units 3,425,787 – 3,460,012 –
3,425,787 677 3,460,012 –
Redeemable units are redeemable on demand at theholder’s option. However, the Manager does not expect thatthe contractual maturity disclosed in the table above will berepresentative of the actual cash outflows, as holders ofthese instruments typically retain them for a longer term.
vi) Concentration risk
Concentration risk arises as a result of the concentration ofexposures within the same category, geographical location,
The accompanying notes are an integral part of the financial statements.
407
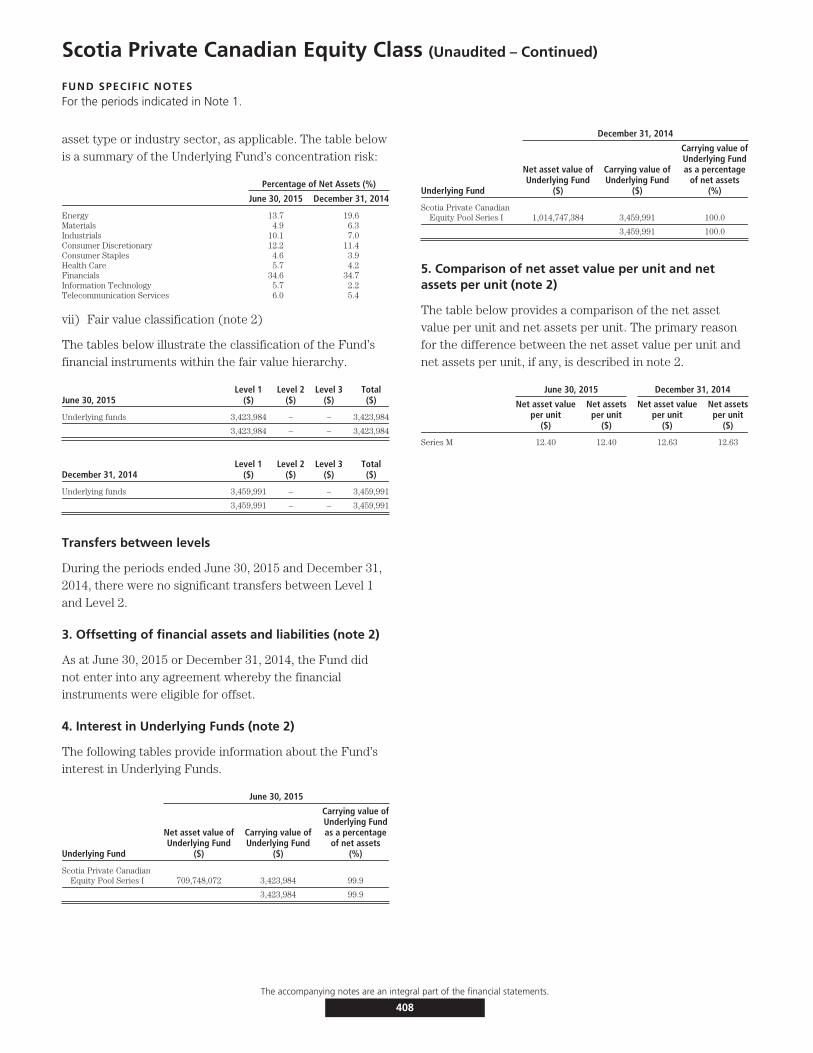
Scotia Private Canadian Equity Class (Unaudited – Continued)
FUND SPECIFIC NOTESFor the periods indicated in Note 1.
asset type or industry sector, as applicable. The table belowis a summary of the Underlying Fund’s concentration risk:
Percentage of Net Assets (%)
June 30, 2015 December 31, 2014
Energy 13.7 19.6Materials 4.9 6.3Industrials 10.1 7.0Consumer Discretionary 12.2 11.4Consumer Staples 4.6 3.9Health Care 5.7 4.2Financials 34.6 34.7Information Technology 5.7 2.2Telecommunication Services 6.0 5.4
vii) Fair value classification (note 2)
The tables below illustrate the classification of the Fund’sfinancial instruments within the fair value hierarchy.
June 30, 2015Level 1
($)Level 2
($)Level 3
($)Total($)
Underlying funds 3,423,984 – – 3,423,984
3,423,984 – – 3,423,984
December 31, 2014Level 1
($)Level 2
($)Level 3
($)Total($)
Underlying funds 3,459,991 – – 3,459,991
3,459,991 – – 3,459,991
Transfers between levels
During the periods ended June 30, 2015 and December 31,2014, there were no significant transfers between Level 1and Level 2.
3. Offsetting of financial assets and liabilities (note 2)
As at June 30, 2015 or December 31, 2014, the Fund didnot enter into any agreement whereby the financialinstruments were eligible for offset.
4. Interest in Underlying Funds (note 2)
The following tables provide information about the Fund’sinterest in Underlying Funds.
June 30, 2015
Underlying Fund
Net asset value ofUnderlying Fund
($)
Carrying value ofUnderlying Fund
($)
Carrying value ofUnderlying Fundas a percentage
of net assets(%)
Scotia Private CanadianEquity Pool Series I 709,748,072 3,423,984 99.9
3,423,984 99.9
December 31, 2014
Underlying Fund
Net asset value ofUnderlying Fund
($)
Carrying value ofUnderlying Fund
($)
Carrying value ofUnderlying Fundas a percentage
of net assets(%)
Scotia Private CanadianEquity Pool Series I 1,014,747,384 3,459,991 100.0
3,459,991 100.0
5. Comparison of net asset value per unit and netassets per unit (note 2)
The table below provides a comparison of the net assetvalue per unit and net assets per unit. The primary reasonfor the difference between the net asset value per unit andnet assets per unit, if any, is described in note 2.
June 30, 2015 December 31, 2014
Net asset valueper unit
($)
Net assetsper unit
($)
Net asset valueper unit
($)
Net assetsper unit
($)
Series M 12.40 12.40 12.63 12.63
The accompanying notes are an integral part of the financial statements.
408

Scotia Private U.S. Dividend Class (Unaudited)
STATEMENTS OF FINANCIAL POSITIONAs at
June 30,2015
December 31,2014
ASSETSCurrent assetsInvestments
Non-derivative financial assets $43,586,605 $34,353,354Cash 11,644 71,083Receivable for securities sold 3,000 19,853Accrued investment income and other 2 33
43,601,251 34,444,323
LIABILITIESCurrent liabilitiesManagement fee payable 4,328 –Redemptions payable 1,885 –Accrued expenses 6,500 –
12,713 –
Net assets attributable to holders of redeemable shares $43,588,538 $34,444,323
NET ASSETS ATTRIBUTABLE TO HOLDERS OF REDEEMABLE SHARESPER SERIES
Series M $43,588,538 $34,444,323
NET ASSETS ATTRIBUTABLE TO HOLDERS OF REDEEMABLE SHARESPER SHARE
Series M $ 17.60 $ 17.01
STATEMENTS OF COMPREHENSIVE INCOMEFor the six month periods ended June 30,
2015 2014INCOMENet gain (loss) on investments (note 2)
Dividends $ 355,193 $ 316,316Interest for distribution purposes 245 162Net realized gain (loss) on non-derivative financial assets 655,787 509,845Change in unrealized gain (loss) on non-derivative financial assets 1,131,267 105,393
Net gain (loss) on investments 2,142,492 931,716
Total income (loss) 2,142,492 931,716
EXPENSESManagement fees (note 5) 20,942 14,318Fixed administration fees (note 6) 31,398 21,477Independent Review Committee fees 31 43Interest expense and bank overdraft charges 345 441Harmonized Sales Tax/Goods and Services Tax 6,191 3,712
Total expenses 58,907 39,991
Increase (decrease) in net assets attributable to holders of redeemableshares from operations $2,083,585 $ 891,725
INCREASE (DECREASE) IN NET ASSETS ATTRIBUTABLE TO HOLDERS OFREDEEMABLE SHARES FROM OPERATIONS PER SERIES
Series M $2,083,585 $ 891,725
INCREASE (DECREASE) IN NET ASSETS ATTRIBUTABLE TO HOLDERS OFREDEEMABLE SHARES FROM OPERATIONS PER SHARE†
Series M $ 0.87 $ 0.46
WEIGHTED AVERAGE NUMBER OF SHARES PER SERIESSeries M 2,397,285 1,938,968
† The increase (decrease) in net assets attributable to holders of redeemable shares fromoperations per share is calculated by dividing the increase (decrease) in net assetsattributable to holders of redeemable shares from operations per series by theweighted average number of shares per series.
STATEMENTS OF CHANGES IN NET ASSETSATTRIBUTABLE TO HOLDERS OF REDEEMABLE UNITSFor the six month periods ended June 30,
2015 2014NET ASSETS ATTRIBUTABLE TO HOLDERS OF REDEEMABLE SHARES,
BEGINNING OF PERIODSeries M $34,444,323 $28,875,006
INCREASE (DECREASE) IN NET ASSETS ATTRIBUTABLE TO HOLDERS OFREDEEMABLE SHARES FROM OPERATIONS
Series M 2,083,585 891,725
DISTRIBUTIONS TO HOLDERS OF REDEEMABLE SHARESFrom net realized gains on investments
Series M (861,953) –
REDEEMABLE SHARE TRANSACTIONSProceeds from issue
Series M 10,517,922 3,762,316Reinvested distributions
Series M 861,953 –Payments on redemption
Series M (3,457,292) (4,156,614)
7,922,583 (394,298)
INCREASE (DECREASE) IN NET ASSETS ATTRIBUTABLE TO HOLDERS OFREDEEMABLE SHARES
Series M 9,144,215 497,427
NET ASSETS ATTRIBUTABLE TO HOLDERS OF REDEEMABLE SHARES,END OF PERIOD
Series M $43,588,538 $29,372,433
STATEMENTS OF CASH FLOWSFor the six month periods ended June 30,
2015 2014CASH FLOWS FROM OPERATING ACTIVITIESIncrease (decrease) in net assets attributable to holders of
redeemable shares $ 2,083,585 $ 891,725Adjustments for:
Net realized (gain) loss on non-derivative financial assets (655,787) (509,845)Change in unrealized (gain) loss on non-derivative financial assets (1,131,267) (105,393)Purchases of non-derivative financial assets (10,441,197) (3,366,316)Proceeds from sale of non-derivative financial assets 3,011,853 3,308,000Accrued investment income and other 31 10Accrued expenses 10,828 6,960
Net cash provided by (used in) operating activities (7,121,954) 225,141CASH FLOWS FROM FINANCING ACTIVITIESProceeds from issue of redeemable shares 10,517,922 3,808,481Amounts paid on redemption of redeemable shares (3,455,407) (4,156,614)
Net cash provided by (used in) financing activities 7,062,515 (348,133)Net increase (decrease) in cash (59,439) (122,992)Cash (bank overdraft), beginning of period 71,083 134,069
CASH (BANK OVERDRAFT), END OF PERIOD $ 11,644 $ 11,077
Interest paid(1) 345 –Interest received(1) 275 172Dividends received, net of withholding taxes(1) 355,193 316,316
(1) Classified as operating items.
The accompanying notes are an integral part of the financial statements.
409
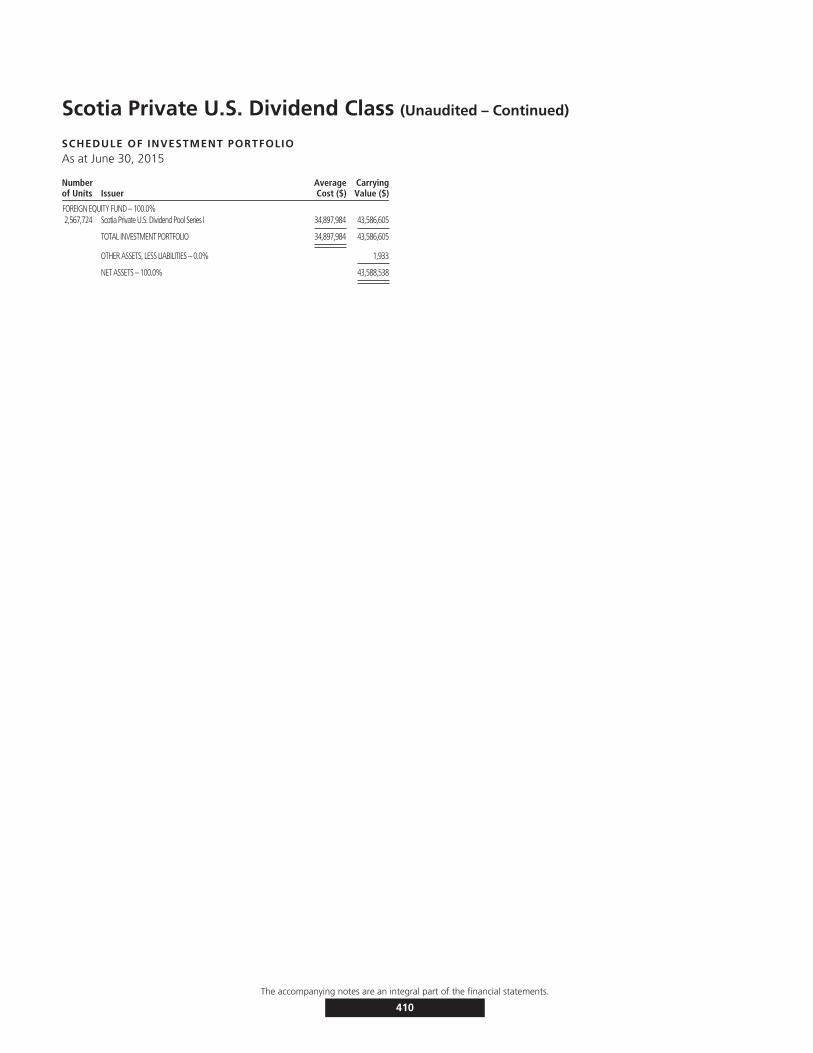
Scotia Private U.S. Dividend Class (Unaudited – Continued)
SCHEDULE OF INVESTMENT PORTFOLIOAs at June 30, 2015
Numberof Units Issuer
AverageCost ($)
CarryingValue ($)
FOREIGN EQUITY FUND – 100.0%2,567,724 Scotia Private U.S. Dividend Pool Series I 34,897,984 43,586,605
TOTAL INVESTMENT PORTFOLIO 34,897,984 43,586,605
OTHER ASSETS, LESS LIABILITIES – 0.0% 1,933
NET ASSETS – 100.0% 43,588,538
The accompanying notes are an integral part of the financial statements.
410

Scotia Private U.S. Dividend Class (Unaudited)
FUND SPECIFIC NOTESFor the periods indicated in Note 1.
1. The Fund (note 1)
The Fund’s objective is to achieve a high level of totalinvestment return, including dividend income and long-term capital growth. It invests primarily in equity securitiesof U.S. companies that pay, or may be expected to pay,dividends.
The Fund invests in units/shares of Scotia Private U.S.Dividend Pool (the ‘‘Underlying Fund’’). The significant riskexposures of the Underlying Fund and the Fund’ssensitivities to these exposures are indicated below.
2. Risks associated with financial instruments (note 4)
i) Interest rate risk
The majority of the Underlying Fund’s financial assets andliabilities were non-interest bearing as at June 30, 2015 andDecember 31, 2014. Accordingly, the Fund is not directlysubject to significant risk due to fluctuations in theprevailing levels of market interest rates.
ii) Currency risk
The tables below indicate the currencies to which theUnderlying Fund had significant exposure, net of theimpact of currency forward contracts and currency spotcontracts, if any, based on the monetary and non-monetaryassets and liabilities of the Underlying Fund. The tables alsoillustrate the potential impact on the Fund if the functionalcurrency of the Fund had strengthened or weakened by10% in relation to each of the other currencies, with allother variables held constant.
June 30, 2015
Currency
Net currencyexposure
($)
Percentage ofnet assets
(%)
Impact onthe Fund
($)
Percentage ofnet assets
(%)
European Euro 2,362,450 5.4 236,245 0.5Swiss Franc 1,478,881 3.4 147,888 0.3US Dollar 31,981,319 73.4 3,198,132 7.3
35,822,650 82.2 3,582,265 8.1
December 31, 2014
Currency
Net currencyexposure
($)
Percentage ofnet assets
(%)
Impact onthe Fund
($)
Percentage ofnet assets
(%)
U.S. Dollar 27,073,238 78.6 2,707,324 7.9
27,073,238 78.6 2,707,324 7.9
iii) Price risk
Price risk is the risk that the carrying value of financialinstruments will fluctuate as a result of changes in marketprices (other than those arising from interest rate risk or
currency risk) caused by factors specific to a security, itsissuer or all factors affecting a market or a market segment.Exposure to price risk is mainly in equities, derivatives andcommodities, if applicable. As at June 30, 2015,approximately 100.0% (December 31, 2014 – 99.7%) of theUnderlying Fund’s net assets were exposed to price risk. Ifprices of these investments had decreased or increased by10%, with all other variables held constant, net assets of theFund would have decreased or increased, respectively, byapproximately $4,358,661 (December 31, 2014 –$3,435,335). In practice, actual results may differ from thissensitivity analysis and the difference could be material.
iv) Credit risk
The Underlying Fund had no significant exposure to bondsand debentures, preferred shares or derivatives as atJune 30, 2015, or December 31, 2014. In addition, allinvestment transactions are executed by brokers with anapproved credit rating. As such the risk of default ontransactions with counterparties and brokers related topurchase and sale of securities is considered minimal. Ininstances where the credit rating were to fall below theapproved rating, the Manager would take appropriateaction.
v) Liquidity risk
The table below summarizes the Fund’s financial liabilitiesbased on the remaining period to the contractual maturitydate.
June 30, 2015 December 31, 2014
On demand($)
Less than3 months
($)On demand
($)
Less than3 months
($)
Current liabilities – 12,713 – –Liability for written options – – – –Unrealized loss on derivatives – – – –Redeemable units 43,588,538 – 34,444,323 –
43,588,538 12,713 34,444,323 –
Redeemable units are redeemable on demand at theholder’s option. However, the Manager does not expect thatthe contractual maturity disclosed in the table above will berepresentative of the actual cash outflows, as holders ofthese instruments typically retain them for a longer term.
vi) Concentration risk
Concentration risk arises as a result of the concentration ofexposures within the same category, geographical location,asset type or industry sector, as applicable. The table belowis a summary of the Underlying Fund’s concentration risk:
The accompanying notes are an integral part of the financial statements.
411

Scotia Private U.S. Dividend Class (Unaudited – Continued)
FUND SPECIFIC NOTESFor the periods indicated in Note 1.
Percentage of net assets (%)
June 30, 2015 December 31, 2014
Consumer Discretionary 15.5 13.7Consumer Staples 8.5 6.9Energy 4.6 9.1Financials 12.8 13.1Health Care 8.4 16.4Industrials 20.3 11.5Information Technology 23.1 16.5Materials 2.3 5.1Telecommunication Services – 1.1
vii) Fair value classification (note 2)
The tables below illustrate the classification of the Fund’sfinancial instruments within the fair value hierarchy.
June 30, 2015Level 1
($)Level 2
($)Level 3
($)Total($)
Underlying funds 43,586,605 – – 43,586,605
43,586,605 – – 43,586,605
December 31, 2014Level 1
($)Level 2
($)Level 3
($)Total($)
Underlying funds 34,353,354 – – 34,353,354
34,353,354 – – 34,353,354
Transfers between levels
During the periods ended June 30, 2015 and December 31,2014, there were no significant transfers between Level 1and Level 2.
3. Offsetting of financial assets and liabilities (note 2)
As at June 30, 2015 or December 31, 2014, the Fund didnot enter into any agreement whereby the financialinstruments were eligible for offset.
4. Interest in Underlying Funds (note 2)
The following tables provide information about the Fund’sinterest in Underlying Funds.
June 30, 2015
Underlying Fund
Net asset value ofUnderlying Fund
($)
Carrying value ofUnderlying Fund
($)
Carrying value ofUnderlying Fundas a percentage
of net assets(%)
Scotia Private U.S.Dividend Pool Series I 1,542,306,293 43,586,605 100.0
43,586,605 100.0
December 31, 2014
Underlying Fund
Net asset value ofUnderlying Fund
($)
Carrying value ofUnderlying Fund
($)
Carrying value ofUnderlying Fundas a percentage
of net assets(%)
Scotia Private U.S.Dividend Pool Series I 1,198,858,466 34,353,354 99.7
34,353,354 99.7
5. Comparison of net asset value per unit and netassets per unit (note 2)
The table below provides a comparison of the net assetvalue per unit and net assets per unit. The primary reasonfor the difference between the net asset value per unit andnet assets per unit, if any, is described in note 2.
June 30, 2015 December 31, 2014
Net asset valueper unit
($)
Net assetsper unit
($)
Net asset valueper unit
($)
Net assetsper unit
($)
Series M 17.60 17.60 17.01 17.01
The accompanying notes are an integral part of the financial statements.
412
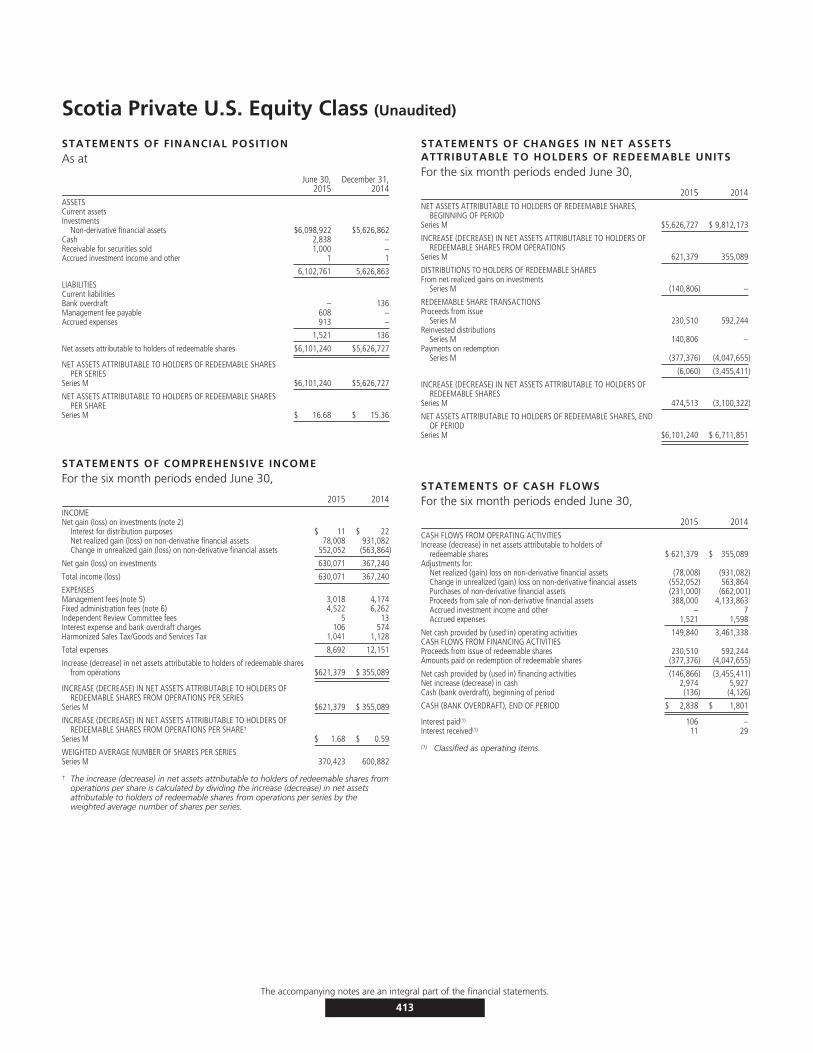
Scotia Private U.S. Equity Class (Unaudited)
STATEMENTS OF FINANCIAL POSITIONAs at
June 30,2015
December 31,2014
ASSETSCurrent assetsInvestments
Non-derivative financial assets $6,098,922 $5,626,862Cash 2,838 –Receivable for securities sold 1,000 –Accrued investment income and other 1 1
6,102,761 5,626,863
LIABILITIESCurrent liabilitiesBank overdraft – 136Management fee payable 608 –Accrued expenses 913 –
1,521 136
Net assets attributable to holders of redeemable shares $6,101,240 $5,626,727
NET ASSETS ATTRIBUTABLE TO HOLDERS OF REDEEMABLE SHARESPER SERIES
Series M $6,101,240 $5,626,727
NET ASSETS ATTRIBUTABLE TO HOLDERS OF REDEEMABLE SHARESPER SHARE
Series M $ 16.68 $ 15.36
STATEMENTS OF COMPREHENSIVE INCOMEFor the six month periods ended June 30,
2015 2014INCOMENet gain (loss) on investments (note 2)
Interest for distribution purposes $ 11 $ 22Net realized gain (loss) on non-derivative financial assets 78,008 931,082Change in unrealized gain (loss) on non-derivative financial assets 552,052 (563,864)
Net gain (loss) on investments 630,071 367,240
Total income (loss) 630,071 367,240
EXPENSESManagement fees (note 5) 3,018 4,174Fixed administration fees (note 6) 4,522 6,262Independent Review Committee fees 5 13Interest expense and bank overdraft charges 106 574Harmonized Sales Tax/Goods and Services Tax 1,041 1,128
Total expenses 8,692 12,151
Increase (decrease) in net assets attributable to holders of redeemable sharesfrom operations $621,379 $ 355,089
INCREASE (DECREASE) IN NET ASSETS ATTRIBUTABLE TO HOLDERS OFREDEEMABLE SHARES FROM OPERATIONS PER SERIES
Series M $621,379 $ 355,089
INCREASE (DECREASE) IN NET ASSETS ATTRIBUTABLE TO HOLDERS OFREDEEMABLE SHARES FROM OPERATIONS PER SHARE†
Series M $ 1.68 $ 0.59
WEIGHTED AVERAGE NUMBER OF SHARES PER SERIESSeries M 370,423 600,882
† The increase (decrease) in net assets attributable to holders of redeemable shares fromoperations per share is calculated by dividing the increase (decrease) in net assetsattributable to holders of redeemable shares from operations per series by theweighted average number of shares per series.
STATEMENTS OF CHANGES IN NET ASSETSATTRIBUTABLE TO HOLDERS OF REDEEMABLE UNITSFor the six month periods ended June 30,
2015 2014NET ASSETS ATTRIBUTABLE TO HOLDERS OF REDEEMABLE SHARES,
BEGINNING OF PERIODSeries M $5,626,727 $ 9,812,173
INCREASE (DECREASE) IN NET ASSETS ATTRIBUTABLE TO HOLDERS OFREDEEMABLE SHARES FROM OPERATIONS
Series M 621,379 355,089
DISTRIBUTIONS TO HOLDERS OF REDEEMABLE SHARESFrom net realized gains on investments
Series M (140,806) –
REDEEMABLE SHARE TRANSACTIONSProceeds from issue
Series M 230,510 592,244Reinvested distributions
Series M 140,806 –Payments on redemption
Series M (377,376) (4,047,655)
(6,060) (3,455,411)
INCREASE (DECREASE) IN NET ASSETS ATTRIBUTABLE TO HOLDERS OFREDEEMABLE SHARES
Series M 474,513 (3,100,322)
NET ASSETS ATTRIBUTABLE TO HOLDERS OF REDEEMABLE SHARES, ENDOF PERIOD
Series M $6,101,240 $ 6,711,851
STATEMENTS OF CASH FLOWSFor the six month periods ended June 30,
2015 2014CASH FLOWS FROM OPERATING ACTIVITIESIncrease (decrease) in net assets attributable to holders of
redeemable shares $ 621,379 $ 355,089Adjustments for:
Net realized (gain) loss on non-derivative financial assets (78,008) (931,082)Change in unrealized (gain) loss on non-derivative financial assets (552,052) 563,864Purchases of non-derivative financial assets (231,000) (662,001)Proceeds from sale of non-derivative financial assets 388,000 4,133,863Accrued investment income and other – 7Accrued expenses 1,521 1,598
Net cash provided by (used in) operating activities 149,840 3,461,338CASH FLOWS FROM FINANCING ACTIVITIESProceeds from issue of redeemable shares 230,510 592,244Amounts paid on redemption of redeemable shares (377,376) (4,047,655)
Net cash provided by (used in) financing activities (146,866) (3,455,411)Net increase (decrease) in cash 2,974 5,927Cash (bank overdraft), beginning of period (136) (4,126)
CASH (BANK OVERDRAFT), END OF PERIOD $ 2,838 $ 1,801
Interest paid(1) 106 –Interest received(1) 11 29
(1) Classified as operating items.
The accompanying notes are an integral part of the financial statements.
413

Scotia Private U.S. Equity Class (Unaudited – Continued)
SCHEDULE OF INVESTMENT PORTFOLIOAs at June 30, 2015
Numberof Units Issuer
AverageCost ($)
CarryingValue ($)
FOREIGN EQUITY FUND – 100.0%526,609 Scotia Private U.S. Equity Pool Series I 4,826,433 6,098,922
TOTAL INVESTMENT PORTFOLIO 4,826,433 6,098,922
OTHER ASSETS, LESS LIABILITIES – 0.0% 2,318
NET ASSETS – 100.0% 6,101,240
The accompanying notes are an integral part of the financial statements.
414

Scotia Private U.S. Equity Class (Unaudited)
FUND SPECIFIC NOTESFor the periods indicated in Note 1.
1. The Fund (note 1)
The Fund’s investment objective is long-term capitalgrowth. It invests primarily in a broad range of U.S. equitysecurities listed on major U.S. stock exchanges.
The Fund invests in units/shares of Scotia Private U.S.Equity Pool (the ‘‘Underlying Fund’’). The significant riskexposures of the Underlying Fund and the Fund’ssensitivities to these exposures are indicated below.
2. Risks associated with financial instruments (note 4)
i) Interest rate risk
The majority of the Underlying Fund’s financial assets andliabilities were non-interest bearing as at June 30, 2015 andDecember 31, 2014. Accordingly, the Fund is not directlysubject to significant risk due to fluctuations in theprevailing levels of market interest rates.
ii) Currency risk
The tables below indicate the currencies to which theUnderlying Fund had significant exposure, net of theimpact of currency forward contracts and currency spotcontracts, if any, based on the monetary and non-monetaryassets and liabilities of the Underlying Fund. The tables alsoillustrate the potential impact on the Fund if the functionalcurrency of the Fund had strengthened or weakened by10% in relation to each of the other currencies, with allother variables held constant.
June 30, 2015
Currency
Net currencyexposure
($)
Percentage ofnet assets
(%)
Impact onthe Fund
($)
Percentage ofnet assets
(%)
US Dollar 5,956,941 97.6 595,694 9.8
5,956,941 97.6 595,694 9.8
December 31, 2014
Currency
Net currencyexposure
($)
Percentage ofnet assets
(%)
Impact onthe Fund
($)
Percentage ofnet assets
(%)
US Dollar 5,598,593 100.0 559,859 10.0
5,598,593 100.0 559,859 10.0
iii) Price risk
Price risk is the risk that the carrying value of financialinstruments will fluctuate as a result of changes in marketprices (other than those arising from interest rate risk orcurrency risk) caused by factors specific to a security, itsissuer or all factors affecting a market or a market segment.Exposure to price risk is mainly in equities, derivatives and
commodities, if applicable. As at June 30, 2015,approximately 100.0% (December 31, 2014 – 100.0%) ofthe Underlying Fund’s net assets were exposed to pricerisk. If prices of these investments had decreased orincreased by 10%, with all other variables held constant,net assets of the Fund would have decreased or increased,respectively, by approximately $609,892 (December 31,2014 – $ 562,686). In practice, actual results may differfrom this sensitivity analysis and the difference could bematerial.
iv) Credit risk
The Underlying Fund had no significant exposure to bondsand debentures, preferred shares or derivatives as atJune 30, 2015, or December 31, 2014. In addition, allinvestment transactions are executed by brokers with anapproved credit rating. As such the risk of default ontransactions with counterparties and brokers related topurchase and sale of securities is considered minimal. Ininstances where the credit rating were to fall below theapproved rating, the Manager would take appropriateaction.
v) Liquidity risk
The table below summarizes the Fund’s financial liabilitiesbased on the remaining period to the contractual maturitydate.
June 30, 2015 December 31, 2014
On demand($)
Less than3 months
($)On demand
($)
Less than3 months
($)
Current liabilities – 1,521 – 136Liability for written options – – – –Unrealized loss on derivatives – – – –Redeemable units 6,101,240 – 5,626,727 –
6,101,240 1,521 5,626,727 136
Redeemable units are redeemable on demand at theholder’s option. However, the Manager does not expect thatthe contractual maturity disclosed in the table above will berepresentative of the actual cash outflows, as holders ofthese instruments typically retain them for a longer term.
vi) Concentration risk
Concentration risk arises as a result of the concentration ofexposures within the same category, geographical location,asset type or industry sector, as applicable. The table belowis a summary of the Underlying Fund’s concentration risk:
The accompanying notes are an integral part of the financial statements.
415
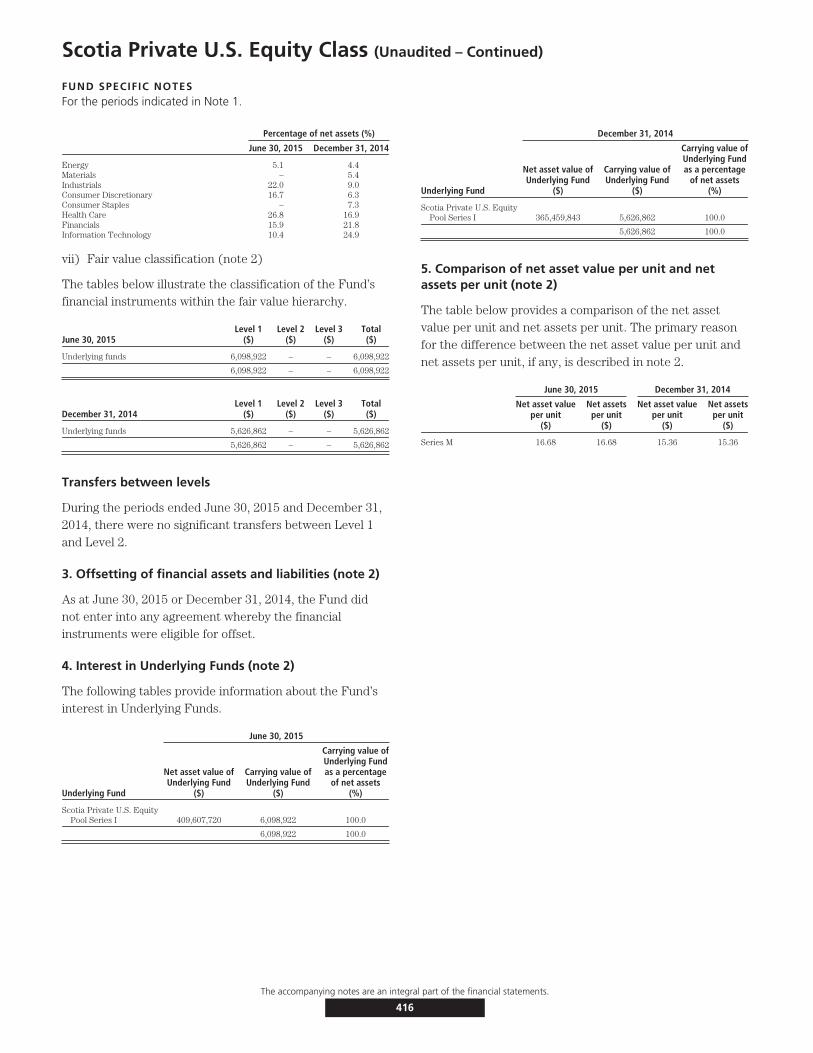
Scotia Private U.S. Equity Class (Unaudited – Continued)
FUND SPECIFIC NOTESFor the periods indicated in Note 1.
Percentage of net assets (%)
June 30, 2015 December 31, 2014
Energy 5.1 4.4Materials – 5.4Industrials 22.0 9.0Consumer Discretionary 16.7 6.3Consumer Staples – 7.3Health Care 26.8 16.9Financials 15.9 21.8Information Technology 10.4 24.9
vii) Fair value classification (note 2)
The tables below illustrate the classification of the Fund’sfinancial instruments within the fair value hierarchy.
June 30, 2015Level 1
($)Level 2
($)Level 3
($)Total($)
Underlying funds 6,098,922 – – 6,098,922
6,098,922 – – 6,098,922
December 31, 2014Level 1
($)Level 2
($)Level 3
($)Total($)
Underlying funds 5,626,862 – – 5,626,862
5,626,862 – – 5,626,862
Transfers between levels
During the periods ended June 30, 2015 and December 31,2014, there were no significant transfers between Level 1and Level 2.
3. Offsetting of financial assets and liabilities (note 2)
As at June 30, 2015 or December 31, 2014, the Fund didnot enter into any agreement whereby the financialinstruments were eligible for offset.
4. Interest in Underlying Funds (note 2)
The following tables provide information about the Fund’sinterest in Underlying Funds.
June 30, 2015
Underlying Fund
Net asset value ofUnderlying Fund
($)
Carrying value ofUnderlying Fund
($)
Carrying value ofUnderlying Fundas a percentage
of net assets(%)
Scotia Private U.S. EquityPool Series I 409,607,720 6,098,922 100.0
6,098,922 100.0
December 31, 2014
Underlying Fund
Net asset value ofUnderlying Fund
($)
Carrying value ofUnderlying Fund
($)
Carrying value ofUnderlying Fundas a percentage
of net assets(%)
Scotia Private U.S. EquityPool Series I 365,459,843 5,626,862 100.0
5,626,862 100.0
5. Comparison of net asset value per unit and netassets per unit (note 2)
The table below provides a comparison of the net assetvalue per unit and net assets per unit. The primary reasonfor the difference between the net asset value per unit andnet assets per unit, if any, is described in note 2.
June 30, 2015 December 31, 2014
Net asset valueper unit
($)
Net assetsper unit
($)
Net asset valueper unit
($)
Net assetsper unit
($)
Series M 16.68 16.68 15.36 15.36
The accompanying notes are an integral part of the financial statements.
416

Scotia U.S. Equity Blend Class (Unaudited)
STATEMENTS OF FINANCIAL POSITIONAs at
June 30,2015
December 31,2014
ASSETSCurrent assetsInvestments
Non-derivative financial assets $5,179,910 $2,815,390Cash 76,432 72,057Receivable for securities sold 26,500 –Subscriptions receivable 59,550 1,100Accrued investment income and other 13 43
5,342,405 2,888,590
LIABILITIESCurrent liabilitiesManagement fee payable 9,770 –Payable for securities purchased 72,363 –Redemptions payable 71,330 57,488Accrued expenses 1,003 –
154,466 57,488
Net assets attributable to holders of redeemable shares $5,187,939 $2,831,102
NET ASSETS ATTRIBUTABLE TO HOLDERS OF REDEEMABLE SHARESPER SERIES
Series A $5,187,939 $2,831,102
NET ASSETS ATTRIBUTABLE TO HOLDERS OF REDEEMABLE SHARESPER SHARE
Series A $ 17.15 $ 15.84
STATEMENTS OF COMPREHENSIVE INCOMEFor the six month periods ended June 30,
2015 2014INCOME
Net gain (loss) on investments (note 2)Interest for distribution purposes $ 222 $ 121Net realized gain (loss) on non-derivative financial assets 50,939 57,042Change in unrealized gain (loss) on non-derivative financial assets 334,544 6,627
Net gain (loss) on investments 385,705 63,790Other income 95 11
Total income (loss) 385,800 63,801
EXPENSESManagement fees (note 5) 43,858 14,910Fixed administration fees (note 6) 4,500 1,528Independent Review Committee fees 3 2Interest expense and bank overdraft charges 50 19Harmonized Sales Tax/Goods and Services Tax 5,039 1,766
Total expenses 53,450 18,225
Increase (decrease) in net assets attributable to holders of redeemable sharesfrom operations $332,350 $ 45,576
INCREASE (DECREASE) IN NET ASSETS ATTRIBUTABLE TO HOLDERS OFREDEEMABLE SHARES FROM OPERATIONS PER SERIES
Series A $332,350 $ 45,576
INCREASE (DECREASE) IN NET ASSETS ATTRIBUTABLE TO HOLDERS OFREDEEMABLE SHARES FROM OPERATIONS PER SHARE†
Series A $ 1.24 $ 0.42
WEIGHTED AVERAGE NUMBER OF SHARES PER SERIESSeries A 267,060 108,793
† The increase (decrease) in net assets attributable to holders of redeemable shares fromoperations per share is calculated by dividing the increase (decrease) in net assetsattributable to holders of redeemable shares from operations per series by theweighted average number of shares per series.
STATEMENTS OF CHANGES IN NET ASSETSATTRIBUTABLE TO HOLDERS OF REDEEMABLE UNITSFor the six month periods ended June 30,
2015 2014NET ASSETS ATTRIBUTABLE TO HOLDERS OF REDEEMABLE SHARES,
BEGINNING OF PERIODSeries A $2,831,102 $1,054,186
INCREASE (DECREASE) IN NET ASSETS ATTRIBUTABLE TO HOLDERS OFREDEEMABLE SHARES FROM OPERATIONS
Series A 332,350 45,576
DISTRIBUTIONS TO HOLDERS OF REDEEMABLE SHARESFrom net realized gains on investments
Series A (70,847) –
REDEEMABLE SHARE TRANSACTIONSProceeds from issue
Series A 2,740,546 917,127Reinvested distributions
Series A 70,847 –Payments on redemption
Series A (716,059) (520,544)
2,095,334 396,583
INCREASE (DECREASE) IN NET ASSETS ATTRIBUTABLE TO HOLDERS OFREDEEMABLE SHARES
Series A 2,356,837 442,159
NET ASSETS ATTRIBUTABLE TO HOLDERS OF REDEEMABLE SHARES, ENDOF PERIOD
Series A $5,187,939 $1,496,345
STATEMENTS OF CASH FLOWSFor the six month periods ended June 30,
2015 2014CASH FLOWS FROM OPERATING ACTIVITIESIncrease (decrease) in net assets attributable to holders of redeemable
shares $ 332,350 $ 45,576Adjustments for:
Net realized (gain) loss on non-derivative financial assets (50,939) (57,042)Change in unrealized (gain) loss on non-derivative financial assets (334,544) (6,627)Purchases of non-derivative financial assets (2,280,674) (780,306)Proceeds from sale of non-derivative financial assets 347,500 293,749Accrued investment income and other 30 2Accrued expenses 10,773 3,327
Net cash provided by (used in) operating activities (1,975,504) (501,321)CASH FLOWS FROM FINANCING ACTIVITIESProceeds from issue of redeemable shares 2,682,096 916,893Amounts paid on redemption of redeemable shares (702,217) (415,263)
Net cash provided by (used in) financing activities 1,979,879 501,630Net increase (decrease) in cash 4,375 309Cash (bank overdraft), beginning of period 72,057 19,395
CASH (BANK OVERDRAFT), END OF PERIOD $ 76,432 $ 19,704
Interest paid(1) 50 –Interest received(1) 251 123
(1) Classified as operating items.
The accompanying notes are an integral part of the financial statements.
417
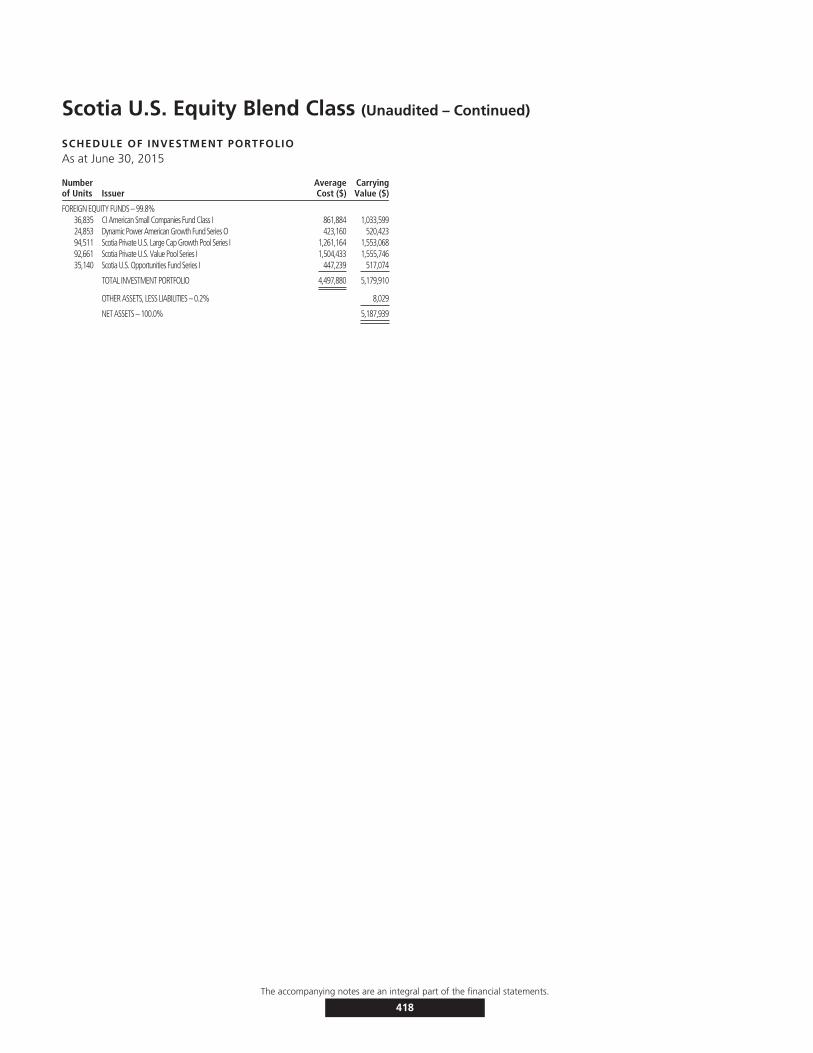
Scotia U.S. Equity Blend Class (Unaudited – Continued)
SCHEDULE OF INVESTMENT PORTFOLIOAs at June 30, 2015
Numberof Units Issuer
AverageCost ($)
CarryingValue ($)
FOREIGN EQUITY FUNDS – 99.8%36,835 CI American Small Companies Fund Class I 861,884 1,033,59924,853 Dynamic Power American Growth Fund Series O 423,160 520,42394,511 Scotia Private U.S. Large Cap Growth Pool Series I 1,261,164 1,553,06892,661 Scotia Private U.S. Value Pool Series I 1,504,433 1,555,74635,140 Scotia U.S. Opportunities Fund Series I 447,239 517,074
TOTAL INVESTMENT PORTFOLIO 4,497,880 5,179,910
OTHER ASSETS, LESS LIABILITIES – 0.2% 8,029
NET ASSETS – 100.0% 5,187,939
The accompanying notes are an integral part of the financial statements.
418

Scotia U.S. Equity Blend Class (Unaudited)
FUND SPECIFIC NOTESFor the periods indicated in Note 1.
1. The Fund (note 1)
The Fund’s investment objective is to provide long-termcapital growth. It invests primarily in a mix of mutual fundsmanaged by us and/or other mutual fund managers thatinvest in U.S. equity securities, and/or directly in U.S.equity securities.
The Fund invests primarily in mutual funds managed by theManager and/or by the third party investment managers(the ‘‘Underlying Funds’’). To ensure the Fund’scomposition meets the investment objectives of the Fund,the portfolio advisor monitors the Underlying Funds on anongoing basis and rebalances the Fund’s assets among theUnderlying Funds.
2. Risks associated with financial instruments (note 4)
i) Interest rate risk
The majority of the Underlying Fund’s financial assets andliabilities were non-interest bearing as at June 30, 2015 andDecember 31, 2014. Accordingly, the Fund is not directlysubject to significant risk due to fluctuations in theprevailing levels of market interest rates.
ii) Currency risk
The Fund could be exposed to indirect currency risk to theextent that the Underlying Funds held financialinstruments that were denominated in a currency otherthan its functional currency.
iii) Price risk
Price risk is the risk that the carrying value of financialinstruments will fluctuate as a result of changes in marketprices (other than those arising from interest rate risk orcurrency risk) caused by factors specific to a security, itsissuer or all factors affecting a market or a market segment.Exposure to price risk is mainly in equities, derivatives andcommodities, if applicable. As at June 30, 2015,approximately 99.8% (December 31, 2014 – 99.4%) of theFund’s net assets were invested in Underlying Funds whichwere exposed to price risk. If prices of the UnderlyingFunds’ investments had decreased or increased by 10%,with all other variables held constant, net assets of theFund would have decreased or increased, respectively, byapproximately $517,991 (December 31, 2014 – $281,539).In practice, actual results may differ from this sensitivityanalysis and the difference could be material.
iv) Credit risk
The Fund could be exposed to indirect credit risk to theextent that the Underlying Funds invested in bonds anddebentures, preferred shares and derivatives.
v) Liquidity risk
The table below summarizes the Fund’s financial liabilitiesbased on the remaining period to the contractual maturitydate.
June 30, 2015 December 31, 2014
On demand($)
Less than3 months
($)On demand
($)
Less than3 months
($)
Current liabilities – 154,466 – 57,488Liability for written options – – – –Unrealized loss on derivatives – – – –Redeemable units 5,187,939 – 2,831,102 –
5,187,939 154,466 2,831,102 57,488
Redeemable units are redeemable on demand at theholder’s option. However, the Manager does not expect thatthe contractual maturity disclosed in the table above will berepresentative of the actual cash outflows, as holders ofthese instruments typically retain them for a longer term.
vi) Concentration risk
Concentration risk arises as a result of the concentration ofexposures within the same category, geographical location,asset type or industry sector, as applicable. The table belowis a summary of the Fund’s concentration risk:
Percentage of net assets (%)
June 30, 2015 December 31, 2014
Foreign Equity Funds 99.8 99.4
vii) Fair value classification (note 2)
The tables below illustrate the classification of the Fund’sfinancial instruments within the fair value hierarchy.
June 30, 2015Level 1
($)Level 2
($)Level 3
($)Total($)
Underlying funds 5,179,910 – – 5,179,910
5,179,910 – – 5,179,910
December 31, 2014Level 1
($)Level 2
($)Level 3
($)Total($)
Underlying funds 2,815,390 – – 2,815,390
2,815,390 – – 2,815,390
The accompanying notes are an integral part of the financial statements.
419

Scotia U.S. Equity Blend Class (Unaudited – Continued)
FUND SPECIFIC NOTESFor the periods indicated in Note 1.
Transfers between levels
During the periods ended June 30, 2015 and December 31,2014, there were no significant transfers between Level 1and Level 2.
3. Offsetting of financial assets and liabilities (note 2)
As at June 30, 2015 or December 31, 2014, the Fund didnot enter into any agreement whereby the financialinstruments were eligible for offset.
4. Interest in Underlying Funds (note 2)
The following tables provide information about the Fund’sinterest in Underlying Funds.
June 30, 2015
Underlying Fund
Net asset value ofUnderlying Fund
($)
Carrying value ofUnderlying Fund
($)
Carrying value ofUnderlying Fundas a percentage
of net assets(%)
CI American SmallCompanies Fund Class I 443,209,199 1,033,599 19.9
Dynamic Power AmericanGrowth Fund Series O 1,013,908,095 520,423 10.0
Scotia Private U.S. ValuePool Series I 94,900,707 1,555,746 30.0
Scotia Private U.S. LargeCap Growth Pool Series I 81,421,249 1,553,068 29.9
Scotia U.S. OpportunitiesFund Series I 29,073,658 517,074 10.0
5,179,910 99.8
December 31, 2014
Underlying Fund
Net asset value ofUnderlying Fund
($)
Carrying value ofUnderlying Fund
($)
Carrying value ofUnderlying Fundas a percentage
of net assets(%)
CI American SmallCompanies Fund Class I 91,777,569 569,647 20.1
Dynamic Power AmericanGrowth Fund Series O 912,605,587 276,294 9.8
Scotia Private U.S. ValuePool Series I 289,278,933 841,718 29.7
Scotia Private U.S. LargeCap Growth Pool Series I 70,405,342 847,648 29.9
Scotia U.S. OpportunitiesFund Series I 25,134,322 280,083 9.9
2,815,390 99.4
5. Comparison of net asset value per unit and netassets per unit (note 2)
The table below provides a comparison of the net assetvalue per unit and net assets per unit. The primary reasonfor the difference between the net asset value per unit andnet assets per unit, if any, is described in note 2.
June 30, 2015 December 31, 2014
Net asset valueper unit
($)
Net assetsper unit
($)
Net asset valueper unit
($)
Net assetsper unit
($)
Series A 17.15 17.15 15.84 15.84
The accompanying notes are an integral part of the financial statements.
420
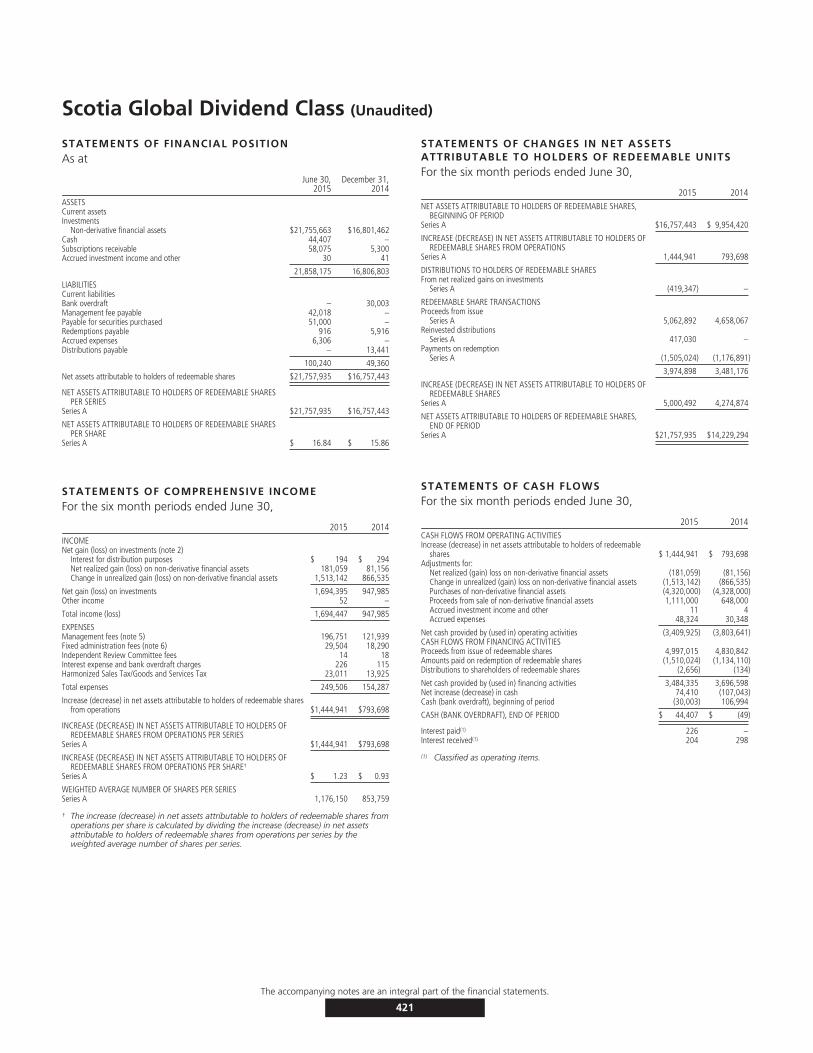
Scotia Global Dividend Class (Unaudited)
STATEMENTS OF FINANCIAL POSITIONAs at
June 30,2015
December 31,2014
ASSETSCurrent assetsInvestments
Non-derivative financial assets $21,755,663 $16,801,462Cash 44,407 –Subscriptions receivable 58,075 5,300Accrued investment income and other 30 41
21,858,175 16,806,803
LIABILITIESCurrent liabilitiesBank overdraft – 30,003Management fee payable 42,018 –Payable for securities purchased 51,000 –Redemptions payable 916 5,916Accrued expenses 6,306 –Distributions payable – 13,441
100,240 49,360
Net assets attributable to holders of redeemable shares $21,757,935 $16,757,443
NET ASSETS ATTRIBUTABLE TO HOLDERS OF REDEEMABLE SHARESPER SERIES
Series A $21,757,935 $16,757,443
NET ASSETS ATTRIBUTABLE TO HOLDERS OF REDEEMABLE SHARESPER SHARE
Series A $ 16.84 $ 15.86
STATEMENTS OF COMPREHENSIVE INCOMEFor the six month periods ended June 30,
2015 2014INCOMENet gain (loss) on investments (note 2)
Interest for distribution purposes $ 194 $ 294Net realized gain (loss) on non-derivative financial assets 181,059 81,156Change in unrealized gain (loss) on non-derivative financial assets 1,513,142 866,535
Net gain (loss) on investments 1,694,395 947,985Other income 52 –
Total income (loss) 1,694,447 947,985
EXPENSESManagement fees (note 5) 196,751 121,939Fixed administration fees (note 6) 29,504 18,290Independent Review Committee fees 14 18Interest expense and bank overdraft charges 226 115Harmonized Sales Tax/Goods and Services Tax 23,011 13,925
Total expenses 249,506 154,287
Increase (decrease) in net assets attributable to holders of redeemable sharesfrom operations $1,444,941 $793,698
INCREASE (DECREASE) IN NET ASSETS ATTRIBUTABLE TO HOLDERS OFREDEEMABLE SHARES FROM OPERATIONS PER SERIES
Series A $1,444,941 $793,698
INCREASE (DECREASE) IN NET ASSETS ATTRIBUTABLE TO HOLDERS OFREDEEMABLE SHARES FROM OPERATIONS PER SHARE†
Series A $ 1.23 $ 0.93
WEIGHTED AVERAGE NUMBER OF SHARES PER SERIESSeries A 1,176,150 853,759
† The increase (decrease) in net assets attributable to holders of redeemable shares fromoperations per share is calculated by dividing the increase (decrease) in net assetsattributable to holders of redeemable shares from operations per series by theweighted average number of shares per series.
STATEMENTS OF CHANGES IN NET ASSETSATTRIBUTABLE TO HOLDERS OF REDEEMABLE UNITSFor the six month periods ended June 30,
2015 2014NET ASSETS ATTRIBUTABLE TO HOLDERS OF REDEEMABLE SHARES,
BEGINNING OF PERIODSeries A $16,757,443 $ 9,954,420
INCREASE (DECREASE) IN NET ASSETS ATTRIBUTABLE TO HOLDERS OFREDEEMABLE SHARES FROM OPERATIONS
Series A 1,444,941 793,698
DISTRIBUTIONS TO HOLDERS OF REDEEMABLE SHARESFrom net realized gains on investments
Series A (419,347) –
REDEEMABLE SHARE TRANSACTIONSProceeds from issue
Series A 5,062,892 4,658,067Reinvested distributions
Series A 417,030 –Payments on redemption
Series A (1,505,024) (1,176,891)
3,974,898 3,481,176
INCREASE (DECREASE) IN NET ASSETS ATTRIBUTABLE TO HOLDERS OFREDEEMABLE SHARES
Series A 5,000,492 4,274,874
NET ASSETS ATTRIBUTABLE TO HOLDERS OF REDEEMABLE SHARES,END OF PERIOD
Series A $21,757,935 $14,229,294
STATEMENTS OF CASH FLOWSFor the six month periods ended June 30,
2015 2014CASH FLOWS FROM OPERATING ACTIVITIESIncrease (decrease) in net assets attributable to holders of redeemable
shares $ 1,444,941 $ 793,698Adjustments for:
Net realized (gain) loss on non-derivative financial assets (181,059) (81,156)Change in unrealized (gain) loss on non-derivative financial assets (1,513,142) (866,535)Purchases of non-derivative financial assets (4,320,000) (4,328,000)Proceeds from sale of non-derivative financial assets 1,111,000 648,000Accrued investment income and other 11 4Accrued expenses 48,324 30,348
Net cash provided by (used in) operating activities (3,409,925) (3,803,641)CASH FLOWS FROM FINANCING ACTIVITIESProceeds from issue of redeemable shares 4,997,015 4,830,842Amounts paid on redemption of redeemable shares (1,510,024) (1,134,110)Distributions to shareholders of redeemable shares (2,656) (134)
Net cash provided by (used in) financing activities 3,484,335 3,696,598Net increase (decrease) in cash 74,410 (107,043)Cash (bank overdraft), beginning of period (30,003) 106,994
CASH (BANK OVERDRAFT), END OF PERIOD $ 44,407 $ (49)
Interest paid(1) 226 –Interest received(1) 204 298
(1) Classified as operating items.
The accompanying notes are an integral part of the financial statements.
421

Scotia Global Dividend Class (Unaudited – Continued)
SCHEDULE OF INVESTMENT PORTFOLIOAs at June 30, 2015
Numberof Units Issuer
AverageCost ($)
CarryingValue ($)
FOREIGN EQUITY FUND – 100.0%1,243,870 Scotia Global Dividend Fund Series I 18,187,951 21,755,663
TOTAL INVESTMENT PORTFOLIO 18,187,951 21,755,663
OTHER ASSETS, LESS LIABILITIES – 0.0% 2,272
NET ASSETS – 100.0% 21,757,935
The accompanying notes are an integral part of the financial statements.
422
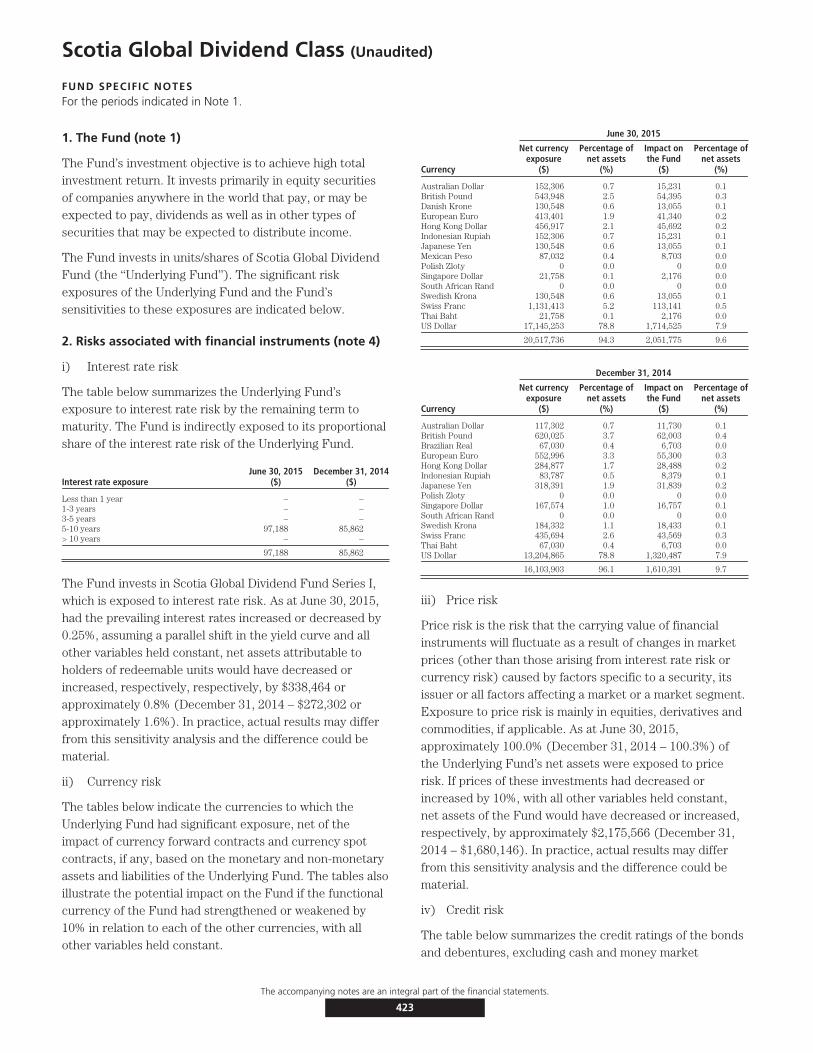
Scotia Global Dividend Class (Unaudited)
FUND SPECIFIC NOTESFor the periods indicated in Note 1.
1. The Fund (note 1)
The Fund’s investment objective is to achieve high totalinvestment return. It invests primarily in equity securitiesof companies anywhere in the world that pay, or may beexpected to pay, dividends as well as in other types ofsecurities that may be expected to distribute income.
The Fund invests in units/shares of Scotia Global DividendFund (the ‘‘Underlying Fund’’). The significant riskexposures of the Underlying Fund and the Fund’ssensitivities to these exposures are indicated below.
2. Risks associated with financial instruments (note 4)
i) Interest rate risk
The table below summarizes the Underlying Fund’sexposure to interest rate risk by the remaining term tomaturity. The Fund is indirectly exposed to its proportionalshare of the interest rate risk of the Underlying Fund.
Interest rate exposureJune 30, 2015
($)December 31, 2014
($)
Less than 1 year – –1-3 years – –3-5 years – –5-10 years 97,188 85,862> 10 years – –
97,188 85,862
The Fund invests in Scotia Global Dividend Fund Series I,which is exposed to interest rate risk. As at June 30, 2015,had the prevailing interest rates increased or decreased by0.25%, assuming a parallel shift in the yield curve and allother variables held constant, net assets attributable toholders of redeemable units would have decreased orincreased, respectively, respectively, by $338,464 orapproximately 0.8% (December 31, 2014 – $272,302 orapproximately 1.6%). In practice, actual results may differfrom this sensitivity analysis and the difference could bematerial.
ii) Currency risk
The tables below indicate the currencies to which theUnderlying Fund had significant exposure, net of theimpact of currency forward contracts and currency spotcontracts, if any, based on the monetary and non-monetaryassets and liabilities of the Underlying Fund. The tables alsoillustrate the potential impact on the Fund if the functionalcurrency of the Fund had strengthened or weakened by10% in relation to each of the other currencies, with allother variables held constant.
June 30, 2015
Currency
Net currencyexposure
($)
Percentage ofnet assets
(%)
Impact onthe Fund
($)
Percentage ofnet assets
(%)
Australian Dollar 152,306 0.7 15,231 0.1British Pound 543,948 2.5 54,395 0.3Danish Krone 130,548 0.6 13,055 0.1European Euro 413,401 1.9 41,340 0.2Hong Kong Dollar 456,917 2.1 45,692 0.2Indonesian Rupiah 152,306 0.7 15,231 0.1Japanese Yen 130,548 0.6 13,055 0.1Mexican Peso 87,032 0.4 8,703 0.0Polish Zloty 0 0.0 0 0.0Singapore Dollar 21,758 0.1 2,176 0.0South African Rand 0 0.0 0 0.0Swedish Krona 130,548 0.6 13,055 0.1Swiss Franc 1,131,413 5.2 113,141 0.5Thai Baht 21,758 0.1 2,176 0.0US Dollar 17,145,253 78.8 1,714,525 7.9
20,517,736 94.3 2,051,775 9.6
December 31, 2014
Currency
Net currencyexposure
($)
Percentage ofnet assets
(%)
Impact onthe Fund
($)
Percentage ofnet assets
(%)
Australian Dollar 117,302 0.7 11,730 0.1British Pound 620,025 3.7 62,003 0.4Brazilian Real 67,030 0.4 6,703 0.0European Euro 552,996 3.3 55,300 0.3Hong Kong Dollar 284,877 1.7 28,488 0.2Indonesian Rupiah 83,787 0.5 8,379 0.1Japanese Yen 318,391 1.9 31,839 0.2Polish Zloty 0 0.0 0 0.0Singapore Dollar 167,574 1.0 16,757 0.1South African Rand 0 0.0 0 0.0Swedish Krona 184,332 1.1 18,433 0.1Swiss Franc 435,694 2.6 43,569 0.3Thai Baht 67,030 0.4 6,703 0.0US Dollar 13,204,865 78.8 1,320,487 7.9
16,103,903 96.1 1,610,391 9.7
iii) Price risk
Price risk is the risk that the carrying value of financialinstruments will fluctuate as a result of changes in marketprices (other than those arising from interest rate risk orcurrency risk) caused by factors specific to a security, itsissuer or all factors affecting a market or a market segment.Exposure to price risk is mainly in equities, derivatives andcommodities, if applicable. As at June 30, 2015,approximately 100.0% (December 31, 2014 – 100.3%) ofthe Underlying Fund’s net assets were exposed to pricerisk. If prices of these investments had decreased orincreased by 10%, with all other variables held constant,net assets of the Fund would have decreased or increased,respectively, by approximately $2,175,566 (December 31,2014 – $1,680,146). In practice, actual results may differfrom this sensitivity analysis and the difference could bematerial.
iv) Credit risk
The table below summarizes the credit ratings of the bondsand debentures, excluding cash and money market
The accompanying notes are an integral part of the financial statements.
423
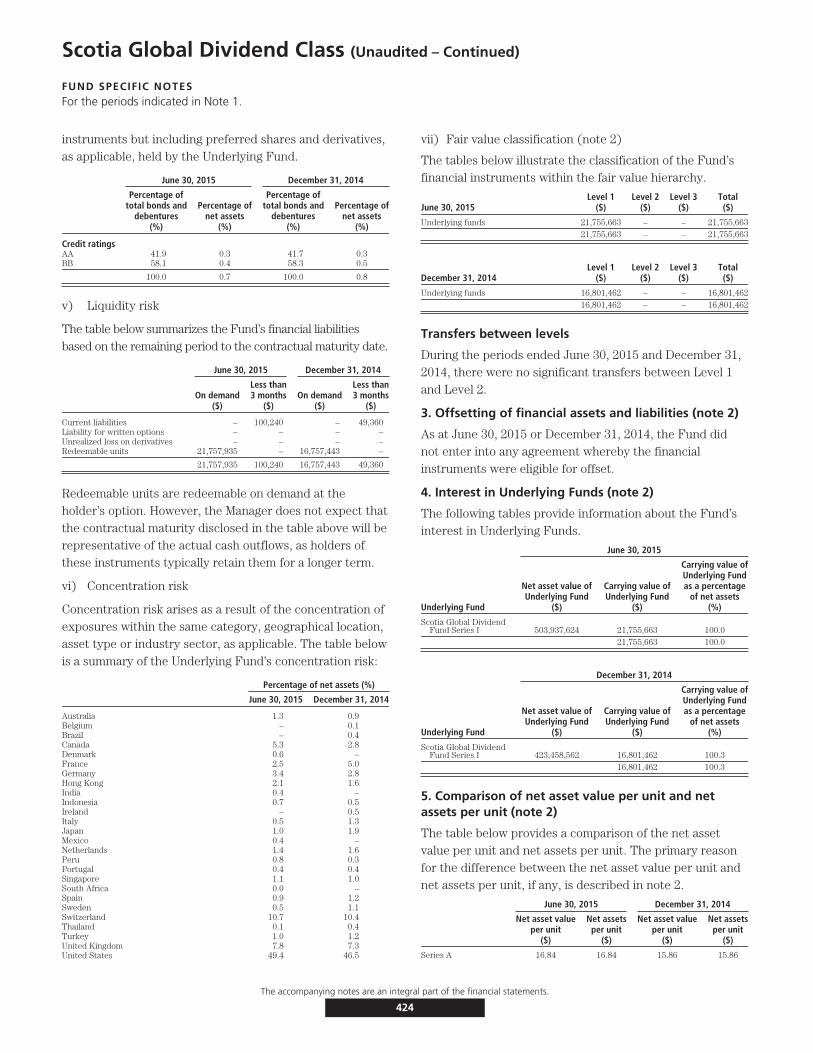
Scotia Global Dividend Class (Unaudited – Continued)
FUND SPECIFIC NOTESFor the periods indicated in Note 1.
instruments but including preferred shares and derivatives,as applicable, held by the Underlying Fund.
June 30, 2015 December 31, 2014
Percentage oftotal bonds and
debentures(%)
Percentage ofnet assets
(%)
Percentage oftotal bonds and
debentures(%)
Percentage ofnet assets
(%)
Credit ratingsAA 41.9 0.3 41.7 0.3BB 58.1 0.4 58.3 0.5
100.0 0.7 100.0 0.8
v) Liquidity risk
The table below summarizes the Fund’s financial liabilitiesbased on the remaining period to the contractual maturity date.
June 30, 2015 December 31, 2014
On demand($)
Less than3 months
($)On demand
($)
Less than3 months
($)
Current liabilities – 100,240 – 49,360Liability for written options – – – –Unrealized loss on derivatives – – – –Redeemable units 21,757,935 – 16,757,443 –
21,757,935 100,240 16,757,443 49,360
Redeemable units are redeemable on demand at theholder’s option. However, the Manager does not expect thatthe contractual maturity disclosed in the table above will berepresentative of the actual cash outflows, as holders ofthese instruments typically retain them for a longer term.
vi) Concentration risk
Concentration risk arises as a result of the concentration ofexposures within the same category, geographical location,asset type or industry sector, as applicable. The table belowis a summary of the Underlying Fund’s concentration risk:
Percentage of net assets (%)
June 30, 2015 December 31, 2014
Australia 1.3 0.9Belgium – 0.1Brazil – 0.4Canada 5.3 2.8Denmark 0.6 –France 2.5 5.0Germany 3.4 2.8Hong Kong 2.1 1.6India 0.4 –Indonesia 0.7 0.5Ireland – 0.5Italy 0.5 1.3Japan 1.0 1.9Mexico 0.4 –Netherlands 1.4 1.6Peru 0.8 0.3Portugal 0.4 0.4Singapore 1.1 1.0South Africa 0.0 –Spain 0.9 1.2Sweden 0.5 1.1Switzerland 10.7 10.4Thailand 0.1 0.4Turkey 1.0 1.2United Kingdom 7.8 7.3United States 49.4 46.5
vii) Fair value classification (note 2)
The tables below illustrate the classification of the Fund’sfinancial instruments within the fair value hierarchy.
June 30, 2015Level 1
($)Level 2
($)Level 3
($)Total($)
Underlying funds 21,755,663 – – 21,755,66321,755,663 – – 21,755,663
December 31, 2014Level 1
($)Level 2
($)Level 3
($)Total($)
Underlying funds 16,801,462 – – 16,801,46216,801,462 – – 16,801,462
Transfers between levels
During the periods ended June 30, 2015 and December 31,2014, there were no significant transfers between Level 1and Level 2.
3. Offsetting of financial assets and liabilities (note 2)
As at June 30, 2015 or December 31, 2014, the Fund didnot enter into any agreement whereby the financialinstruments were eligible for offset.
4. Interest in Underlying Funds (note 2)
The following tables provide information about the Fund’sinterest in Underlying Funds.
June 30, 2015
Underlying Fund
Net asset value ofUnderlying Fund
($)
Carrying value ofUnderlying Fund
($)
Carrying value ofUnderlying Fundas a percentage
of net assets(%)
Scotia Global DividendFund Series I 503,937,624 21,755,663 100.0
21,755,663 100.0
December 31, 2014
Underlying Fund
Net asset value ofUnderlying Fund
($)
Carrying value ofUnderlying Fund
($)
Carrying value ofUnderlying Fundas a percentage
of net assets(%)
Scotia Global DividendFund Series I 423,458,562 16,801,462 100.3
16,801,462 100.3
5. Comparison of net asset value per unit and netassets per unit (note 2)
The table below provides a comparison of the net assetvalue per unit and net assets per unit. The primary reasonfor the difference between the net asset value per unit andnet assets per unit, if any, is described in note 2.
June 30, 2015 December 31, 2014
Net asset valueper unit
($)
Net assetsper unit
($)
Net asset valueper unit
($)
Net assetsper unit
($)
Series A 16.84 16.84 15.86 15.86
The accompanying notes are an integral part of the financial statements.
424
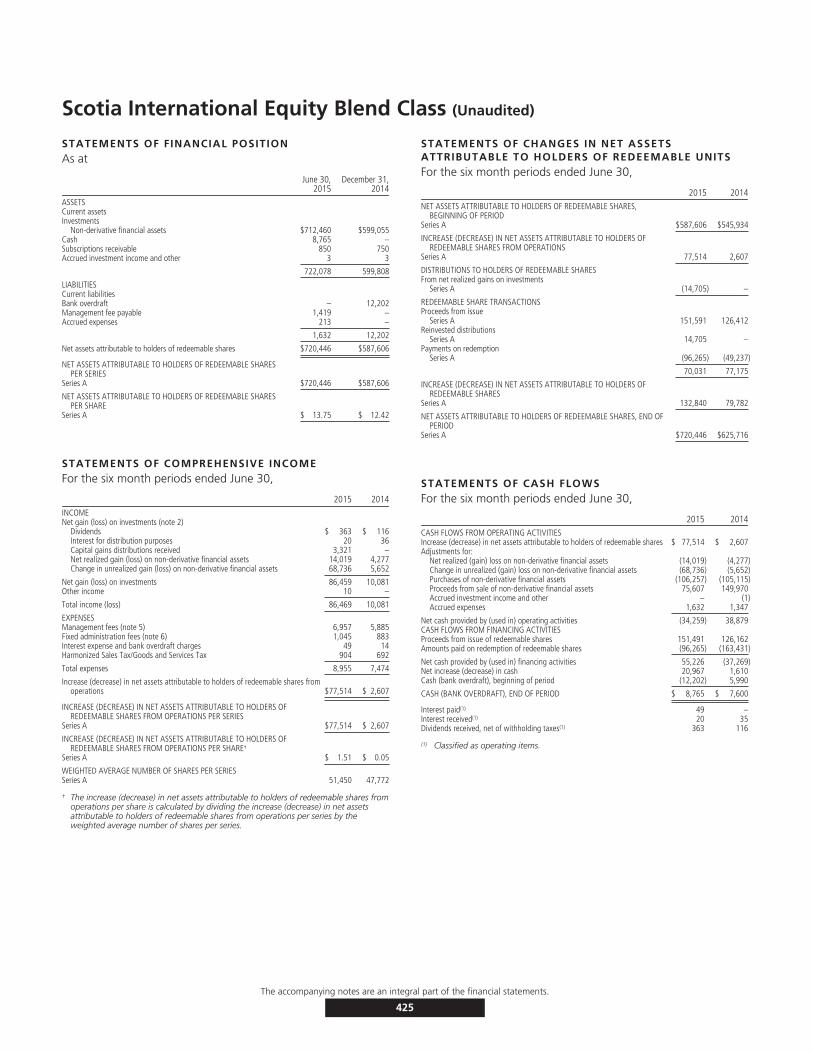
Scotia International Equity Blend Class (Unaudited)
STATEMENTS OF FINANCIAL POSITIONAs at
June 30,2015
December 31,2014
ASSETSCurrent assetsInvestments
Non-derivative financial assets $712,460 $599,055Cash 8,765 –Subscriptions receivable 850 750Accrued investment income and other 3 3
722,078 599,808
LIABILITIESCurrent liabilitiesBank overdraft – 12,202Management fee payable 1,419 –Accrued expenses 213 –
1,632 12,202
Net assets attributable to holders of redeemable shares $720,446 $587,606
NET ASSETS ATTRIBUTABLE TO HOLDERS OF REDEEMABLE SHARESPER SERIES
Series A $720,446 $587,606
NET ASSETS ATTRIBUTABLE TO HOLDERS OF REDEEMABLE SHARESPER SHARE
Series A $ 13.75 $ 12.42
STATEMENTS OF COMPREHENSIVE INCOMEFor the six month periods ended June 30,
2015 2014INCOMENet gain (loss) on investments (note 2)
Dividends $ 363 $ 116Interest for distribution purposes 20 36Capital gains distributions received 3,321 –Net realized gain (loss) on non-derivative financial assets 14,019 4,277Change in unrealized gain (loss) on non-derivative financial assets 68,736 5,652
Net gain (loss) on investments 86,459 10,081Other income 10 –
Total income (loss) 86,469 10,081
EXPENSESManagement fees (note 5) 6,957 5,885Fixed administration fees (note 6) 1,045 883Interest expense and bank overdraft charges 49 14Harmonized Sales Tax/Goods and Services Tax 904 692
Total expenses 8,955 7,474
Increase (decrease) in net assets attributable to holders of redeemable shares fromoperations $77,514 $ 2,607
INCREASE (DECREASE) IN NET ASSETS ATTRIBUTABLE TO HOLDERS OFREDEEMABLE SHARES FROM OPERATIONS PER SERIES
Series A $77,514 $ 2,607
INCREASE (DECREASE) IN NET ASSETS ATTRIBUTABLE TO HOLDERS OFREDEEMABLE SHARES FROM OPERATIONS PER SHARE†
Series A $ 1.51 $ 0.05
WEIGHTED AVERAGE NUMBER OF SHARES PER SERIESSeries A 51,450 47,772
† The increase (decrease) in net assets attributable to holders of redeemable shares fromoperations per share is calculated by dividing the increase (decrease) in net assetsattributable to holders of redeemable shares from operations per series by theweighted average number of shares per series.
STATEMENTS OF CHANGES IN NET ASSETSATTRIBUTABLE TO HOLDERS OF REDEEMABLE UNITSFor the six month periods ended June 30,
2015 2014NET ASSETS ATTRIBUTABLE TO HOLDERS OF REDEEMABLE SHARES,
BEGINNING OF PERIODSeries A $587,606 $545,934
INCREASE (DECREASE) IN NET ASSETS ATTRIBUTABLE TO HOLDERS OFREDEEMABLE SHARES FROM OPERATIONS
Series A 77,514 2,607
DISTRIBUTIONS TO HOLDERS OF REDEEMABLE SHARESFrom net realized gains on investments
Series A (14,705) –
REDEEMABLE SHARE TRANSACTIONSProceeds from issue
Series A 151,591 126,412Reinvested distributions
Series A 14,705 –Payments on redemption
Series A (96,265) (49,237)
70,031 77,175
INCREASE (DECREASE) IN NET ASSETS ATTRIBUTABLE TO HOLDERS OFREDEEMABLE SHARES
Series A 132,840 79,782
NET ASSETS ATTRIBUTABLE TO HOLDERS OF REDEEMABLE SHARES, END OFPERIOD
Series A $720,446 $625,716
STATEMENTS OF CASH FLOWSFor the six month periods ended June 30,
2015 2014CASH FLOWS FROM OPERATING ACTIVITIESIncrease (decrease) in net assets attributable to holders of redeemable shares $ 77,514 $ 2,607Adjustments for:
Net realized (gain) loss on non-derivative financial assets (14,019) (4,277)Change in unrealized (gain) loss on non-derivative financial assets (68,736) (5,652)Purchases of non-derivative financial assets (106,257) (105,115)Proceeds from sale of non-derivative financial assets 75,607 149,970Accrued investment income and other – (1)Accrued expenses 1,632 1,347
Net cash provided by (used in) operating activities (34,259) 38,879CASH FLOWS FROM FINANCING ACTIVITIESProceeds from issue of redeemable shares 151,491 126,162Amounts paid on redemption of redeemable shares (96,265) (163,431)
Net cash provided by (used in) financing activities 55,226 (37,269)Net increase (decrease) in cash 20,967 1,610Cash (bank overdraft), beginning of period (12,202) 5,990
CASH (BANK OVERDRAFT), END OF PERIOD $ 8,765 $ 7,600
Interest paid(1) 49 –Interest received(1) 20 35Dividends received, net of withholding taxes(1) 363 116
(1) Classified as operating items.
The accompanying notes are an integral part of the financial statements.
425
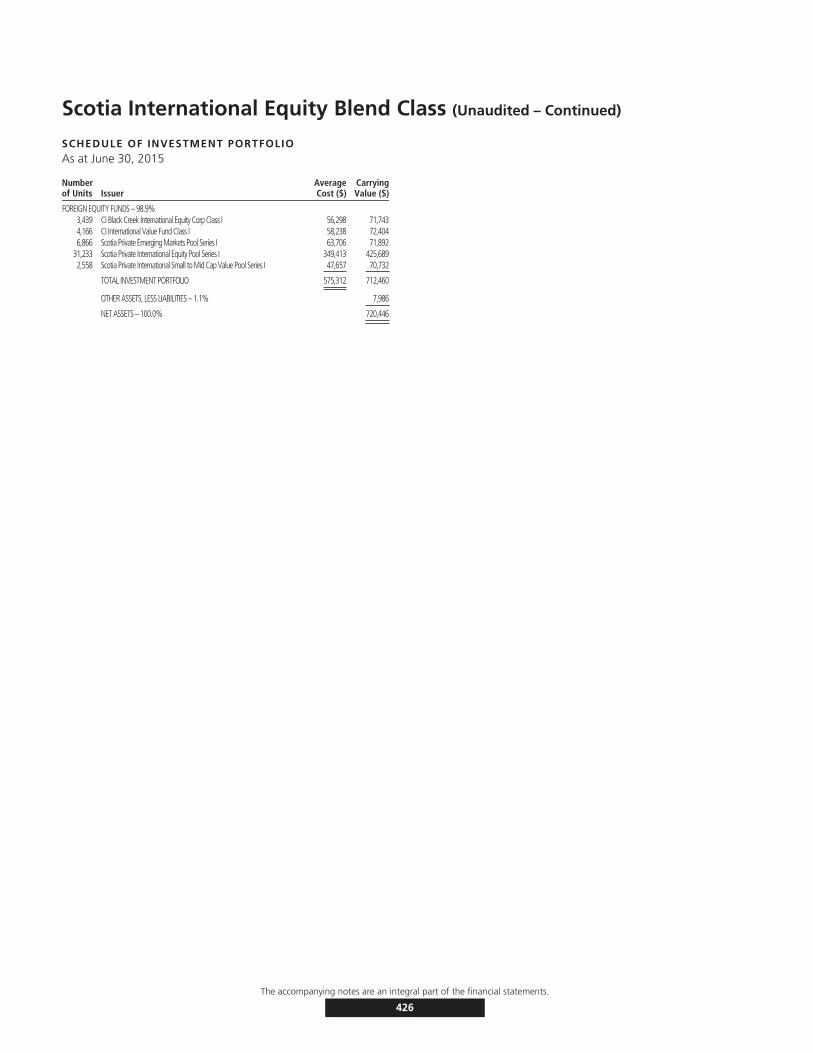
Scotia International Equity Blend Class (Unaudited – Continued)
SCHEDULE OF INVESTMENT PORTFOLIOAs at June 30, 2015
Numberof Units Issuer
AverageCost ($)
CarryingValue ($)
FOREIGN EQUITY FUNDS – 98.9%3,439 CI Black Creek International Equity Corp Class I 56,298 71,7434,166 CI International Value Fund Class I 58,238 72,4046,866 Scotia Private Emerging Markets Pool Series I 63,706 71,892
31,233 Scotia Private International Equity Pool Series I 349,413 425,6892,558 Scotia Private International Small to Mid Cap Value Pool Series I 47,657 70,732
TOTAL INVESTMENT PORTFOLIO 575,312 712,460
OTHER ASSETS, LESS LIABILITIES – 1.1% 7,986
NET ASSETS – 100.0% 720,446
The accompanying notes are an integral part of the financial statements.
426
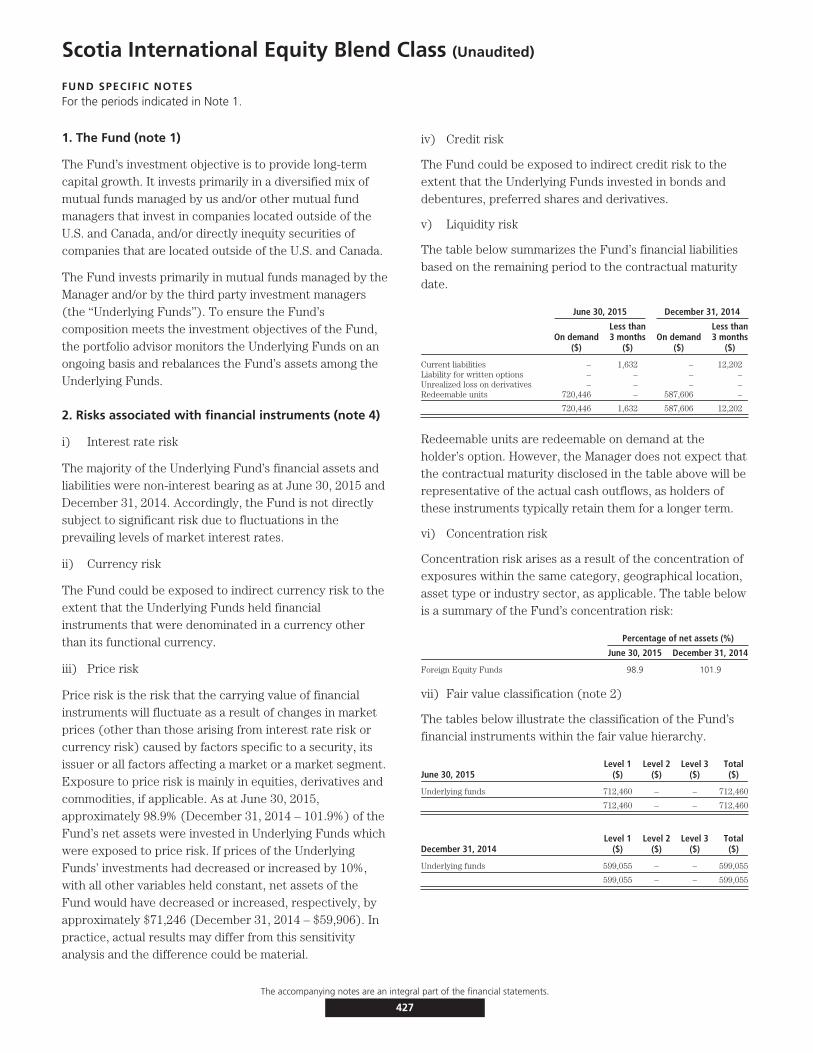
Scotia International Equity Blend Class (Unaudited)
FUND SPECIFIC NOTESFor the periods indicated in Note 1.
1. The Fund (note 1)
The Fund’s investment objective is to provide long-termcapital growth. It invests primarily in a diversified mix ofmutual funds managed by us and/or other mutual fundmanagers that invest in companies located outside of theU.S. and Canada, and/or directly inequity securities ofcompanies that are located outside of the U.S. and Canada.
The Fund invests primarily in mutual funds managed by theManager and/or by the third party investment managers(the ‘‘Underlying Funds’’). To ensure the Fund’scomposition meets the investment objectives of the Fund,the portfolio advisor monitors the Underlying Funds on anongoing basis and rebalances the Fund’s assets among theUnderlying Funds.
2. Risks associated with financial instruments (note 4)
i) Interest rate risk
The majority of the Underlying Fund’s financial assets andliabilities were non-interest bearing as at June 30, 2015 andDecember 31, 2014. Accordingly, the Fund is not directlysubject to significant risk due to fluctuations in theprevailing levels of market interest rates.
ii) Currency risk
The Fund could be exposed to indirect currency risk to theextent that the Underlying Funds held financialinstruments that were denominated in a currency otherthan its functional currency.
iii) Price risk
Price risk is the risk that the carrying value of financialinstruments will fluctuate as a result of changes in marketprices (other than those arising from interest rate risk orcurrency risk) caused by factors specific to a security, itsissuer or all factors affecting a market or a market segment.Exposure to price risk is mainly in equities, derivatives andcommodities, if applicable. As at June 30, 2015,approximately 98.9% (December 31, 2014 – 101.9%) of theFund’s net assets were invested in Underlying Funds whichwere exposed to price risk. If prices of the UnderlyingFunds’ investments had decreased or increased by 10%,with all other variables held constant, net assets of theFund would have decreased or increased, respectively, byapproximately $71,246 (December 31, 2014 – $59,906). Inpractice, actual results may differ from this sensitivityanalysis and the difference could be material.
iv) Credit risk
The Fund could be exposed to indirect credit risk to theextent that the Underlying Funds invested in bonds anddebentures, preferred shares and derivatives.
v) Liquidity risk
The table below summarizes the Fund’s financial liabilitiesbased on the remaining period to the contractual maturitydate.
June 30, 2015 December 31, 2014
On demand($)
Less than3 months
($)On demand
($)
Less than3 months
($)
Current liabilities – 1,632 – 12,202Liability for written options – – – –Unrealized loss on derivatives – – – –Redeemable units 720,446 – 587,606 –
720,446 1,632 587,606 12,202
Redeemable units are redeemable on demand at theholder’s option. However, the Manager does not expect thatthe contractual maturity disclosed in the table above will berepresentative of the actual cash outflows, as holders ofthese instruments typically retain them for a longer term.
vi) Concentration risk
Concentration risk arises as a result of the concentration ofexposures within the same category, geographical location,asset type or industry sector, as applicable. The table belowis a summary of the Fund’s concentration risk:
Percentage of net assets (%)
June 30, 2015 December 31, 2014
Foreign Equity Funds 98.9 101.9
vii) Fair value classification (note 2)
The tables below illustrate the classification of the Fund’sfinancial instruments within the fair value hierarchy.
June 30, 2015Level 1
($)Level 2
($)Level 3
($)Total($)
Underlying funds 712,460 – – 712,460
712,460 – – 712,460
December 31, 2014Level 1
($)Level 2
($)Level 3
($)Total($)
Underlying funds 599,055 – – 599,055
599,055 – – 599,055
The accompanying notes are an integral part of the financial statements.
427
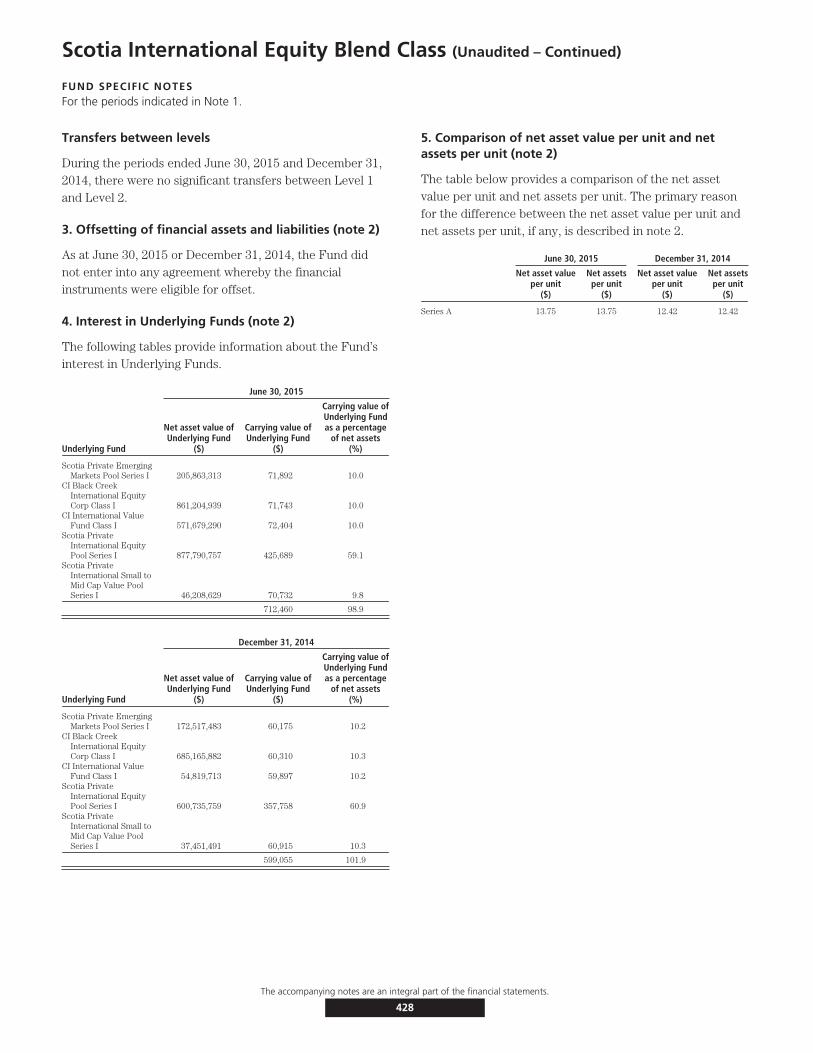
Scotia International Equity Blend Class (Unaudited – Continued)
FUND SPECIFIC NOTESFor the periods indicated in Note 1.
Transfers between levels
During the periods ended June 30, 2015 and December 31,2014, there were no significant transfers between Level 1and Level 2.
3. Offsetting of financial assets and liabilities (note 2)
As at June 30, 2015 or December 31, 2014, the Fund didnot enter into any agreement whereby the financialinstruments were eligible for offset.
4. Interest in Underlying Funds (note 2)
The following tables provide information about the Fund’sinterest in Underlying Funds.
June 30, 2015
Underlying Fund
Net asset value ofUnderlying Fund
($)
Carrying value ofUnderlying Fund
($)
Carrying value ofUnderlying Fundas a percentage
of net assets(%)
Scotia Private EmergingMarkets Pool Series I 205,863,313 71,892 10.0
CI Black CreekInternational EquityCorp Class I 861,204,939 71,743 10.0
CI International ValueFund Class I 571,679,290 72,404 10.0
Scotia PrivateInternational EquityPool Series I 877,790,757 425,689 59.1
Scotia PrivateInternational Small toMid Cap Value PoolSeries I 46,208,629 70,732 9.8
712,460 98.9
December 31, 2014
Underlying Fund
Net asset value ofUnderlying Fund
($)
Carrying value ofUnderlying Fund
($)
Carrying value ofUnderlying Fundas a percentage
of net assets(%)
Scotia Private EmergingMarkets Pool Series I 172,517,483 60,175 10.2
CI Black CreekInternational EquityCorp Class I 685,165,882 60,310 10.3
CI International ValueFund Class I 54,819,713 59,897 10.2
Scotia PrivateInternational EquityPool Series I 600,735,759 357,758 60.9
Scotia PrivateInternational Small toMid Cap Value PoolSeries I 37,451,491 60,915 10.3
599,055 101.9
5. Comparison of net asset value per unit and netassets per unit (note 2)
The table below provides a comparison of the net assetvalue per unit and net assets per unit. The primary reasonfor the difference between the net asset value per unit andnet assets per unit, if any, is described in note 2.
June 30, 2015 December 31, 2014
Net asset valueper unit
($)
Net assetsper unit
($)
Net asset valueper unit
($)
Net assetsper unit
($)
Series A 13.75 13.75 12.42 12.42
The accompanying notes are an integral part of the financial statements.
428

Scotia INNOVA Income Portfolio Class (Unaudited)
STATEMENTS OF FINANCIAL POSITIONAs at
June 30,2015
December 31,2014
ASSETSCurrent assetsInvestments
Non-derivative financial assets $221,594,853 $239,089,914Cash 2,140,002 2,577,046Receivable for securities sold 240,050 –Accrued investment income and other 973 308
223,975,878 241,667,268
LIABILITIESCurrent liabilitiesManagement fee payable 350,367 –Redemptions payable 145,928 81,040Accrued expenses 21,936 –Distributions payable – 17,225
518,231 98,265
Net assets attributable to holders of redeemable shares $223,457,647 $241,569,003
NET ASSETS ATTRIBUTABLE TO HOLDERS OF REDEEMABLE SHARESPER SERIES
Series A $223,457,647 $241,569,003
NET ASSETS ATTRIBUTABLE TO HOLDERS OF REDEEMABLE SHARESPER SHARE
Series A $ 11.25 $ 11.37
STATEMENTS OF COMPREHENSIVE INCOMEFor the six month periods ended June 30,
2015 2014INCOMENet gain (loss) on investments (note 2)
Dividends $ 384,567 $ 373,157Interest for distribution purposes 1,693,922 572,528Net realized gain (loss) on non-derivative financial assets 9,513,744 13,386,010Net realized gain (loss) on currency forward contracts – 17,235Net realized gain (loss) on futures contracts – (112,126)Net realized and change in unrealized gain (loss) on foreign exchange – 263Change in unrealized gain (loss) on non-derivative financial assets (5,830,295) 269,575Change in unrealized gain (loss) on currency forward contracts – (55,646)Change in unrealized gain (loss) on futures contracts – 3,228
Net gain (loss) on investments 5,761,938 14,454,224Securities lending – 77
Total income (loss) 5,761,938 14,454,301
EXPENSESManagement fees (note 5) 1,873,624 2,145,668Fixed administration fees (note 6) 117,044 134,100Independent Review Committee fees 175 400Interest expense and bank overdraft charges 353 3,447Foreign withholding taxes/tax reclaims – 730Harmonized Sales Tax/Goods and Services Tax 208,441 239,147Transaction costs – 65
Total expenses 2,199,637 2,523,557
Net expenses 2,199,637 2,523,557
INCREASE (DECREASE) IN NET ASSETS ATTRIBUTABLE TO HOLDERS OFREDEEMABLE SHARES FROM OPERATIONS PER SERIES
Series A $ 3,562,301 $11,930,744
INCREASE (DECREASE) IN NET ASSETS ATTRIBUTABLE TO HOLDERS OFREDEEMABLE SHARES FROM OPERATIONS PER SHARE†
Series A $ 0.17 $ 0.48
WEIGHTED AVERAGE NUMBER OF SHARES PER SERIESSeries A 20,704,381 24,829,527
† The increase (decrease) in net assets attributable to holders of redeemable shares fromoperations per share is calculated by dividing the increase (decrease) in net assetsattributable to holders of redeemable shares from operations per series by theweighted average number of shares per series.
STATEMENTS OF CHANGES IN NET ASSETSATTRIBUTABLE TO HOLDERS OF REDEEMABLE UNITSFor the six month periods ended June 30,
2015 2014NET ASSETS ATTRIBUTABLE TO HOLDERS OF REDEEMABLE SHARES,
BEGINNING OF PERIODSeries A $241,569,003 $284,664,883
INCREASE (DECREASE) IN NET ASSETS ATTRIBUTABLE TO HOLDERSOF REDEEMABLE SHARES FROM OPERATIONS
Series A 3,562,301 11,930,744
DISTRIBUTIONS TO HOLDERS OF REDEEMABLE SHARESFrom net realized gains on investments
Series A (6,045,150) –
REDEEMABLE SHARE TRANSACTIONSProceeds from issue
Series A 1,120 10,040Reinvested distributions
Series A 5,965,677 –Payments on redemption
Series A (21,595,304) (36,411,013)
(15,628,507) (36,400,973)
INCREASE (DECREASE) IN NET ASSETS ATTRIBUTABLE TO HOLDERSOF REDEEMABLE SHARES
Series A (18,111,356) (24,470,229)
NET ASSETS ATTRIBUTABLE TO HOLDERS OF REDEEMABLE SHARES,END OF PERIOD
Series A $223,457,647 $260,194,654
STATEMENTS OF CASH FLOWSFor the six month periods ended June 30,
2015 2014CASH FLOWS FROM OPERATING ACTIVITIESIncrease (decrease) in net assets attributable to holders of
redeemable shares $ 3,562,301 $ 11,930,744Adjustments for:
Net realized (gain) loss on non-derivative financial assets (9,513,744) (13,386,010)Unrealized (gain) loss on foreign exchange of cash – (263)Change in unrealized (gain) loss on non-derivative financial assets 5,830,295 (269,575)Change in unrealized (gain) loss on currency forward contracts – 55,646Change in unrealized (gain) loss on futures contracts – 95,694Purchases of non-derivative financial assets (67,932,197) (161,238,044)Proceeds from sale of non-derivative financial assets 88,870,657 197,766,058Accrued investment income and other (665) 152,119Accrued expenses 372,303 418,227
Net cash provided by (used in) operating activities 21,188,950 35,524,596CASH FLOWS FROM FINANCING ACTIVITIESProceeds from issue of redeemable shares 1,120 10,040Amounts paid on redemption of redeemable shares (21,530,416) (36,527,633)Distributions to shareholders of redeemable shares (96,698) (14,418)
Net cash provided by (used in) financing activities (21,625,994) (36,532,011)Change in unrealized gain (loss) on foreign exchange of cash – 263Net increase (decrease) in cash (437,044) (1,007,415)Cash (bank overdraft), beginning of period 2,577,046 1,536,985
CASH (BANK OVERDRAFT), END OF PERIOD $ 2,140,002 $ 529,833
Interest paid(1) 353 –Interest received(1) 1,693,258 724,387Dividends received, net of withholding taxes(1) 384,567 372,427
(1) Classified as operating items.
The accompanying notes are an integral part of the financial statements.
429

Scotia INNOVA Income Portfolio Class (Unaudited – Continued)
SCHEDULE OF INVESTMENT PORTFOLIOAs at June 30, 2015
Numberof Units Issuer
AverageCost ($)
CarryingValue ($)
FIXED INCOME FUNDS – 59.6%1,226,176 Scotia Canadian Income Fund Series I 16,959,195 16,791,8683,147,796 Scotia Floating Rate Income Fund Series I 31,599,558 31,312,073
723,671 Scotia Private American Core-Plus Bond Pool Series I 6,909,316 6,870,4633,394,475 Scotia Private Canadian Corporate Bond Pool Series I 36,792,489 37,136,9071,526,473 Scotia Private Short-Mid Government Bond Pool Series I 16,185,872 16,225,0322,251,636 Scotia Total Return Bond LP Series I 23,445,709 24,786,237
131,892,139 133,122,580
CANADIAN EQUITY FUNDS – 26.2%346,691 1832 AM Canadian Dividend LP Series I 3,467,711 3,336,662
1,389,321 1832 AM Canadian Preferred Share LP Series I 14,567,724 13,506,4212,218,754 1832 AM Tactical Asset Allocation LP Series I 22,192,640 22,396,321
279,984 Scotia Canadian Dividend Fund Series I 11,612,317 14,695,479174,095 Scotia Private Canadian Equity Pool Series I 2,017,470 2,267,61064,911 Scotia Private Canadian Small Cap Pool Series I 2,068,242 2,282,465
55,926,104 58,484,958
FOREIGN EQUITY FUNDS – 13.4%508,801 1832 AM Global Completion LP Series I 5,423,816 6,311,267
1,046,758 Scotia Global Low Volatility Equity LP Series I 11,031,364 13,393,373326,121 Scotia Private International Equity Pool Series I 3,137,834 4,444,838250,823 Scotia Private Options Income Pool Series I 2,508,229 2,512,292281,986 Scotia U.S. Low Volatility Equity LP Series I 2,910,739 3,325,545
25,011,982 29,987,315
TOTAL INVESTMENT PORTFOLIO 212,830,225 221,594,853
OTHER ASSETS, LESS LIABILITIES – 0.8% 1,862,794
NET ASSETS – 100.0% 223,457,647
The accompanying notes are an integral part of the financial statements.
430
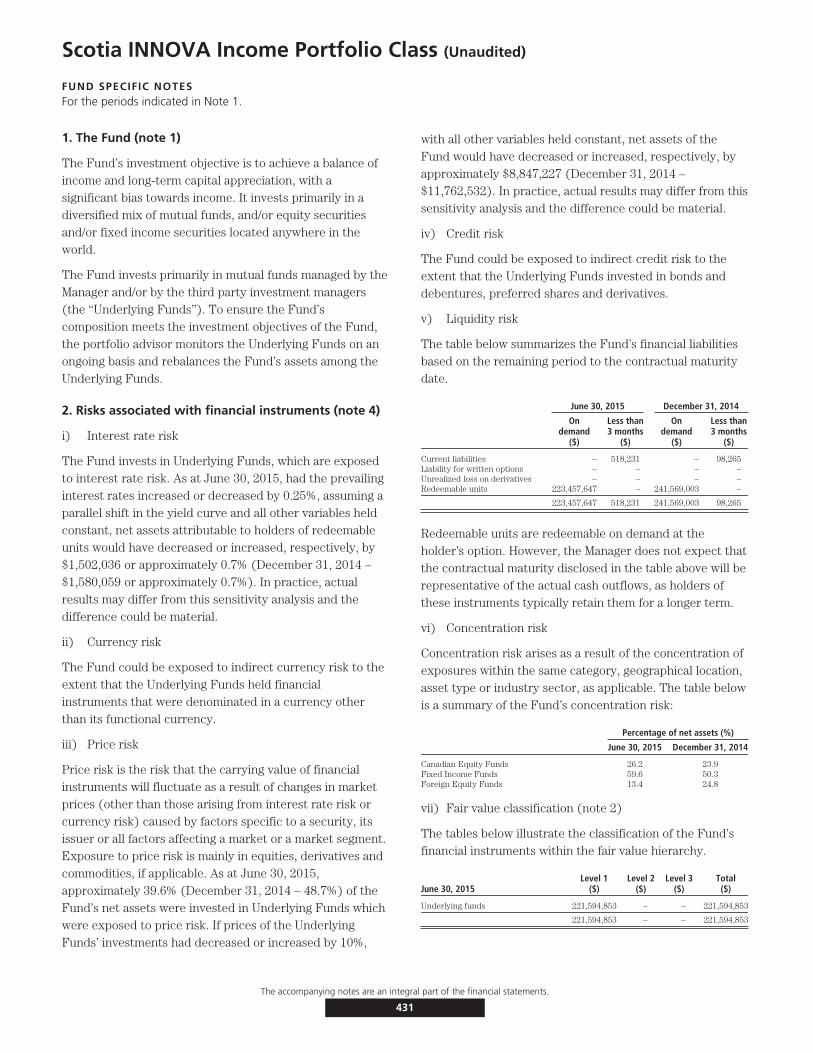
Scotia INNOVA Income Portfolio Class (Unaudited)
FUND SPECIFIC NOTESFor the periods indicated in Note 1.
1. The Fund (note 1)
The Fund’s investment objective is to achieve a balance ofincome and long-term capital appreciation, with asignificant bias towards income. It invests primarily in adiversified mix of mutual funds, and/or equity securitiesand/or fixed income securities located anywhere in theworld.
The Fund invests primarily in mutual funds managed by theManager and/or by the third party investment managers(the ‘‘Underlying Funds’’). To ensure the Fund’scomposition meets the investment objectives of the Fund,the portfolio advisor monitors the Underlying Funds on anongoing basis and rebalances the Fund’s assets among theUnderlying Funds.
2. Risks associated with financial instruments (note 4)
i) Interest rate risk
The Fund invests in Underlying Funds, which are exposedto interest rate risk. As at June 30, 2015, had the prevailinginterest rates increased or decreased by 0.25%, assuming aparallel shift in the yield curve and all other variables heldconstant, net assets attributable to holders of redeemableunits would have decreased or increased, respectively, by$1,502,036 or approximately 0.7% (December 31, 2014 –$1,580,059 or approximately 0.7%). In practice, actualresults may differ from this sensitivity analysis and thedifference could be material.
ii) Currency risk
The Fund could be exposed to indirect currency risk to theextent that the Underlying Funds held financialinstruments that were denominated in a currency otherthan its functional currency.
iii) Price risk
Price risk is the risk that the carrying value of financialinstruments will fluctuate as a result of changes in marketprices (other than those arising from interest rate risk orcurrency risk) caused by factors specific to a security, itsissuer or all factors affecting a market or a market segment.Exposure to price risk is mainly in equities, derivatives andcommodities, if applicable. As at June 30, 2015,approximately 39.6% (December 31, 2014 – 48.7%) of theFund’s net assets were invested in Underlying Funds whichwere exposed to price risk. If prices of the UnderlyingFunds’ investments had decreased or increased by 10%,
with all other variables held constant, net assets of theFund would have decreased or increased, respectively, byapproximately $8,847,227 (December 31, 2014 –$11,762,532). In practice, actual results may differ from thissensitivity analysis and the difference could be material.
iv) Credit risk
The Fund could be exposed to indirect credit risk to theextent that the Underlying Funds invested in bonds anddebentures, preferred shares and derivatives.
v) Liquidity risk
The table below summarizes the Fund’s financial liabilitiesbased on the remaining period to the contractual maturitydate.
June 30, 2015 December 31, 2014
Ondemand
($)
Less than3 months
($)
Ondemand
($)
Less than3 months
($)
Current liabilities – 518,231 – 98,265Liability for written options – – – –Unrealized loss on derivatives – – – –Redeemable units 223,457,647 – 241,569,003 –
223,457,647 518,231 241,569,003 98,265
Redeemable units are redeemable on demand at theholder’s option. However, the Manager does not expect thatthe contractual maturity disclosed in the table above will berepresentative of the actual cash outflows, as holders ofthese instruments typically retain them for a longer term.
vi) Concentration risk
Concentration risk arises as a result of the concentration ofexposures within the same category, geographical location,asset type or industry sector, as applicable. The table belowis a summary of the Fund’s concentration risk:
Percentage of net assets (%)
June 30, 2015 December 31, 2014
Canadian Equity Funds 26.2 23.9Fixed Income Funds 59.6 50.3Foreign Equity Funds 13.4 24.8
vii) Fair value classification (note 2)
The tables below illustrate the classification of the Fund’sfinancial instruments within the fair value hierarchy.
June 30, 2015Level 1
($)Level 2
($)Level 3
($)Total($)
Underlying funds 221,594,853 – – 221,594,853
221,594,853 – – 221,594,853
The accompanying notes are an integral part of the financial statements.
431
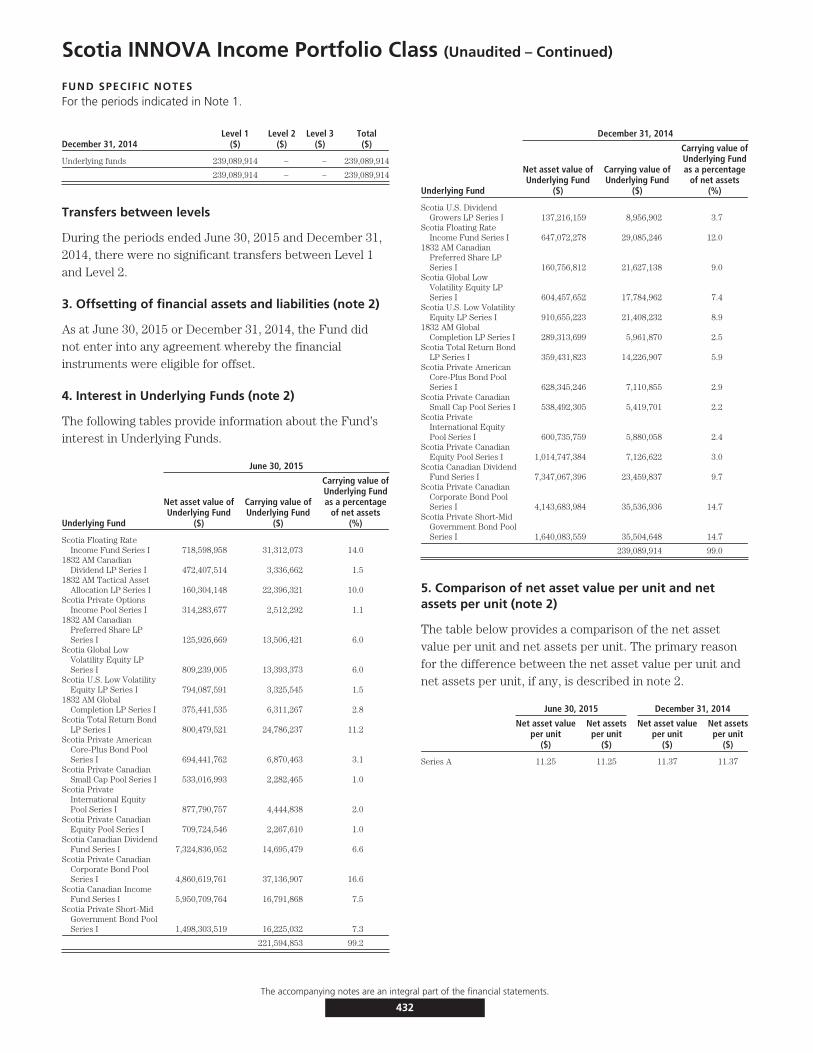
Scotia INNOVA Income Portfolio Class (Unaudited – Continued)
FUND SPECIFIC NOTESFor the periods indicated in Note 1.
December 31, 2014Level 1
($)Level 2
($)Level 3
($)Total($)
Underlying funds 239,089,914 – – 239,089,914
239,089,914 – – 239,089,914
Transfers between levels
During the periods ended June 30, 2015 and December 31,2014, there were no significant transfers between Level 1and Level 2.
3. Offsetting of financial assets and liabilities (note 2)
As at June 30, 2015 or December 31, 2014, the Fund didnot enter into any agreement whereby the financialinstruments were eligible for offset.
4. Interest in Underlying Funds (note 2)
The following tables provide information about the Fund’sinterest in Underlying Funds.
June 30, 2015
Underlying Fund
Net asset value ofUnderlying Fund
($)
Carrying value ofUnderlying Fund
($)
Carrying value ofUnderlying Fundas a percentage
of net assets(%)
Scotia Floating RateIncome Fund Series I 718,598,958 31,312,073 14.0
1832 AM CanadianDividend LP Series I 472,407,514 3,336,662 1.5
1832 AM Tactical AssetAllocation LP Series I 160,304,148 22,396,321 10.0
Scotia Private OptionsIncome Pool Series I 314,283,677 2,512,292 1.1
1832 AM CanadianPreferred Share LPSeries I 125,926,669 13,506,421 6.0
Scotia Global LowVolatility Equity LPSeries I 809,239,005 13,393,373 6.0
Scotia U.S. Low VolatilityEquity LP Series I 794,087,591 3,325,545 1.5
1832 AM GlobalCompletion LP Series I 375,441,535 6,311,267 2.8
Scotia Total Return BondLP Series I 800,479,521 24,786,237 11.2
Scotia Private AmericanCore-Plus Bond PoolSeries I 694,441,762 6,870,463 3.1
Scotia Private CanadianSmall Cap Pool Series I 533,016,993 2,282,465 1.0
Scotia PrivateInternational EquityPool Series I 877,790,757 4,444,838 2.0
Scotia Private CanadianEquity Pool Series I 709,724,546 2,267,610 1.0
Scotia Canadian DividendFund Series I 7,324,836,052 14,695,479 6.6
Scotia Private CanadianCorporate Bond PoolSeries I 4,860,619,761 37,136,907 16.6
Scotia Canadian IncomeFund Series I 5,950,709,764 16,791,868 7.5
Scotia Private Short-MidGovernment Bond PoolSeries I 1,498,303,519 16,225,032 7.3
221,594,853 99.2
December 31, 2014
Underlying Fund
Net asset value ofUnderlying Fund
($)
Carrying value ofUnderlying Fund
($)
Carrying value ofUnderlying Fundas a percentage
of net assets(%)
Scotia U.S. DividendGrowers LP Series I 137,216,159 8,956,902 3.7
Scotia Floating RateIncome Fund Series I 647,072,278 29,085,246 12.0
1832 AM CanadianPreferred Share LPSeries I 160,756,812 21,627,138 9.0
Scotia Global LowVolatility Equity LPSeries I 604,457,652 17,784,962 7.4
Scotia U.S. Low VolatilityEquity LP Series I 910,655,223 21,408,232 8.9
1832 AM GlobalCompletion LP Series I 289,313,699 5,961,870 2.5
Scotia Total Return BondLP Series I 359,431,823 14,226,907 5.9
Scotia Private AmericanCore-Plus Bond PoolSeries I 628,345,246 7,110,855 2.9
Scotia Private CanadianSmall Cap Pool Series I 538,492,305 5,419,701 2.2
Scotia PrivateInternational EquityPool Series I 600,735,759 5,880,058 2.4
Scotia Private CanadianEquity Pool Series I 1,014,747,384 7,126,622 3.0
Scotia Canadian DividendFund Series I 7,347,067,396 23,459,837 9.7
Scotia Private CanadianCorporate Bond PoolSeries I 4,143,683,984 35,536,936 14.7
Scotia Private Short-MidGovernment Bond PoolSeries I 1,640,083,559 35,504,648 14.7
239,089,914 99.0
5. Comparison of net asset value per unit and netassets per unit (note 2)
The table below provides a comparison of the net assetvalue per unit and net assets per unit. The primary reasonfor the difference between the net asset value per unit andnet assets per unit, if any, is described in note 2.
June 30, 2015 December 31, 2014
Net asset valueper unit
($)
Net assetsper unit
($)
Net asset valueper unit
($)
Net assetsper unit
($)
Series A 11.25 11.25 11.37 11.37
The accompanying notes are an integral part of the financial statements.
432

Scotia INNOVA Balanced Income Portfolio Class (Unaudited)
STATEMENTS OF FINANCIAL POSITIONAs at
June 30,2015
December 31,2014
ASSETSCurrent assetsInvestments
Non-derivative financial assets $1,145,046,847 $921,550,912Cash 16,751,672 12,922,722Subscriptions receivable 3,010,644 2,751,653Accrued investment income and other 14,319 10,008
1,164,823,482 937,235,295
LIABILITIESCurrent liabilitiesManagement fee payable 1,869,260 –Payable for securities purchased 10,562,044 1,620,000Redemptions payable 1,417,010 300,437Accrued expenses 110,137 –Distributions payable 306,268 232,777
14,264,719 2,153,214
Net assets attributable to holders of redeemable shares $1,150,558,763 $935,082,081
NET ASSETS ATTRIBUTABLE TO HOLDERS OF REDEEMABLESHARES PER SERIES
Series A $1,025,972,895 $857,214,190Series T $ 124,585,868 $ 77,867,891
NET ASSETS ATTRIBUTABLE TO HOLDERS OF REDEEMABLESHARES PER SHARE
Series A $ 11.80 $ 11.86Series T $ 14.93 $ 15.23
STATEMENTS OF COMPREHENSIVE INCOMEFor the six month periods ended June 30,
2015 2014INCOMENet gain (loss) on investments (note 2)
Dividends $ 2,572,237 $ 939,322Interest for distribution purposes 6,191,979 3,334,300Net realized gain (loss) on non-derivative financial assets 26,092,141 13,157,098Change in unrealized gain (loss) on non-derivative financial assets (8,732,936) 11,726,017
Net gain (loss) on investments 26,123,421 29,156,737Other income 9,734 5,602
Total income (loss) 26,133,155 29,162,339
EXPENSESManagement fees (note 5) 8,964,281 4,395,430Fixed administration fees (note 6) 527,105 258,547Independent Review Committee fees 767 765Harmonized Sales Tax/Goods and Services Tax 980,447 478,819
Total expenses 10,472,600 5,133,561
Increase (decrease) in net assets attributable to holders of redeemableshares from operations $15,660,555 $24,028,778
INCREASE (DECREASE) IN NET ASSETS ATTRIBUTABLE TO HOLDERS OFREDEEMABLE SHARES FROM OPERATIONS PER SERIES
Series A $14,612,176 $24,010,750Series T $ 1,048,379 $ 18,028
INCREASE (DECREASE) IN NET ASSETS ATTRIBUTABLE TO HOLDERS OFREDEEMABLE SHARES FROM OPERATIONS PER SHARE†
Series A $ 0.18 $ 0.52Series T $ 0.15 $ 0.03
WEIGHTED AVERAGE NUMBER OF SHARES PER SERIESSeries A 80,281,983 46,001,243Series T 6,809,097 579,142
† The increase (decrease) in net assets attributable to holders of redeemable shares fromoperations per share is calculated by dividing the increase (decrease) in net assetsattributable to holders of redeemable shares from operations per series by theweighted average number of shares per series.
STATEMENTS OF CHANGES IN NET ASSETSATTRIBUTABLE TO HOLDERS OF REDEEMABLE UNITSFor the six month periods ended June 30,
2015 2014NET ASSETS ATTRIBUTABLE TO HOLDERS OF REDEEMABLE
SHARES, BEGINNING OF PERIODSeries A $ 857,214,190 $412,442,501Series T 77,867,891 –
935,082,081 412,442,501
INCREASE (DECREASE) IN NET ASSETS ATTRIBUTABLE TO HOLDERSOF REDEEMABLE SHARES FROM OPERATIONS
Series A 14,612,176 24,010,750Series T 1,048,379 18,028
15,660,555 24,028,778
DISTRIBUTIONS TO HOLDERS OF REDEEMABLE SHARESFrom net investment income
Series A (1,032) –Series T – (62,263)
From net realized gains on investmentsSeries A (21,451,384) –Series T (1,948,609) –
From return of capitalSeries T (1,836,505) –
(25,237,530) (62,263)
REDEEMABLE SHARE TRANSACTIONSProceeds from issue
Series A 243,155,975 234,677,233Series T 57,806,353 14,598,232
Reinvested distributionsSeries A 21,292,107 –Series T 956,927 27,732
Payments on redemptionSeries A (88,849,137) (45,743,458)Series T (9,308,568) (1,300)
225,053,657 203,558,439
INCREASE (DECREASE) IN NET ASSETS ATTRIBUTABLE TO HOLDERSOF REDEEMABLE SHARES
Series A 168,758,705 212,944,525Series T 46,717,977 14,580,429
215,476,682 227,524,954
NET ASSETS ATTRIBUTABLE TO HOLDERS OF REDEEMABLESHARES, END OF PERIOD
Series A 1,025,972,895 625,387,026Series T 124,585,868 14,580,429
$1,150,558,763 $639,967,455
STATEMENTS OF CASH FLOWSFor the six month periods ended June 30,
2015 2014CASH FLOWS FROM OPERATING ACTIVITIESIncrease (decrease) in net assets attributable to holders of
redeemable shares $ 15,660,555 $ 24,028,778Adjustments for:
Net realized (gain) loss on non-derivative financial assets (26,092,141) (13,157,098)Change in unrealized (gain) loss on non-derivative financial assets 8,732,936 (11,726,017)Purchases of non-derivative financial assets (472,618,654) (489,316,130)Proceeds from sale of non-derivative financial assets 275,423,968 293,494,793Accrued investment income and other (4,311) (2,956)Accrued expenses 1,979,397 1,036,957
Net cash provided by (used in) operating activities (196,918,250) (195,641,673)CASH FLOWS FROM FINANCING ACTIVITIESProceeds from issue of redeemable shares 300,703,337 245,477,919Amounts paid on redemption of redeemable shares (97,041,132) (45,471,141)Distributions to shareholders of redeemable shares (2,915,005) (20,352)
Net cash provided by (used in) financing activities 200,747,200 199,986,426Net increase (decrease) in cash 3,828,950 4,344,753Cash (bank overdraft), beginning of period 12,922,722 6,712,858
CASH (BANK OVERDRAFT), END OF PERIOD $ 16,751,672 $ 11,057,611
Interest received(1) 6,187,668 3,331,344Dividends received, net of withholding taxes(1) 2,572,237 939,322
(1) Classified as operating items.
The accompanying notes are an integral part of the financial statements.
433
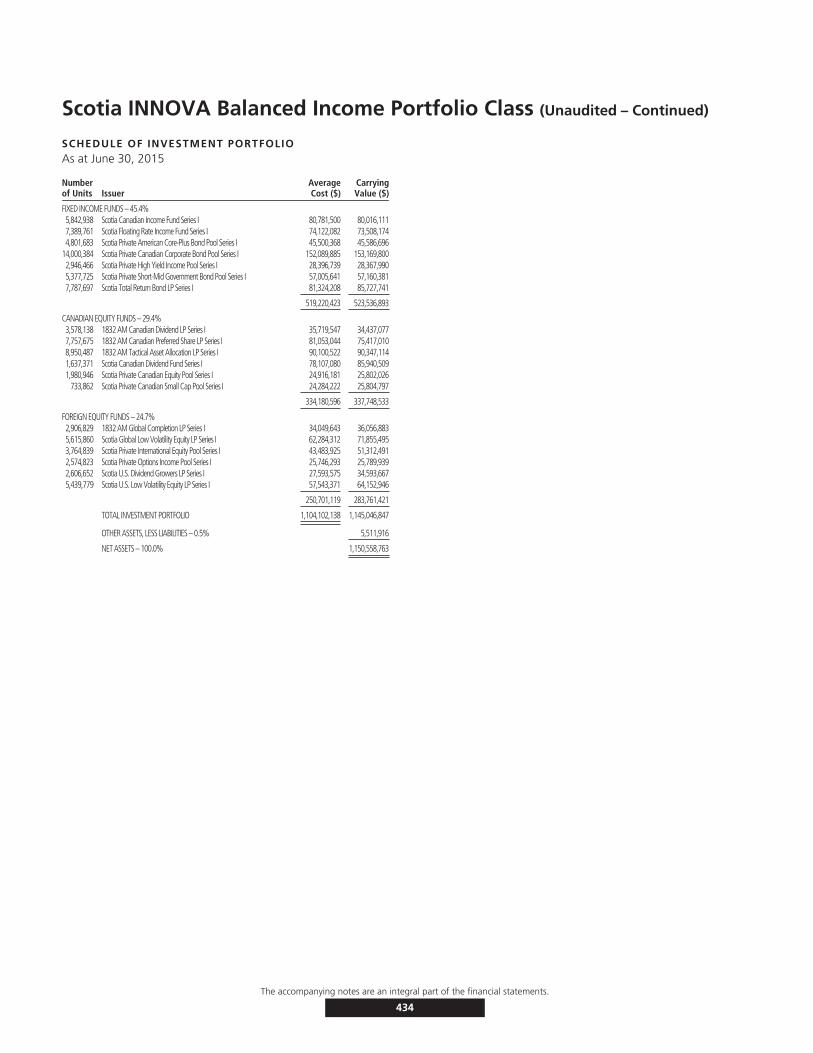
Scotia INNOVA Balanced Income Portfolio Class (Unaudited – Continued)
SCHEDULE OF INVESTMENT PORTFOLIOAs at June 30, 2015
Numberof Units Issuer
AverageCost ($)
CarryingValue ($)
FIXED INCOME FUNDS – 45.4%5,842,938 Scotia Canadian Income Fund Series I 80,781,500 80,016,1117,389,761 Scotia Floating Rate Income Fund Series I 74,122,082 73,508,1744,801,683 Scotia Private American Core-Plus Bond Pool Series I 45,500,368 45,586,696
14,000,384 Scotia Private Canadian Corporate Bond Pool Series I 152,089,885 153,169,8002,946,466 Scotia Private High Yield Income Pool Series I 28,396,739 28,367,9905,377,725 Scotia Private Short-Mid Government Bond Pool Series I 57,005,641 57,160,3817,787,697 Scotia Total Return Bond LP Series I 81,324,208 85,727,741
519,220,423 523,536,893
CANADIAN EQUITY FUNDS – 29.4%3,578,138 1832 AM Canadian Dividend LP Series I 35,719,547 34,437,0777,757,675 1832 AM Canadian Preferred Share LP Series I 81,053,044 75,417,0108,950,487 1832 AM Tactical Asset Allocation LP Series I 90,100,522 90,347,1141,637,371 Scotia Canadian Dividend Fund Series I 78,107,080 85,940,5091,980,946 Scotia Private Canadian Equity Pool Series I 24,916,181 25,802,026
733,862 Scotia Private Canadian Small Cap Pool Series I 24,284,222 25,804,797
334,180,596 337,748,533
FOREIGN EQUITY FUNDS – 24.7%2,906,829 1832 AM Global Completion LP Series I 34,049,643 36,056,8835,615,860 Scotia Global Low Volatility Equity LP Series I 62,284,312 71,855,4953,764,839 Scotia Private International Equity Pool Series I 43,483,925 51,312,4912,574,823 Scotia Private Options Income Pool Series I 25,746,293 25,789,9392,606,652 Scotia U.S. Dividend Growers LP Series I 27,593,575 34,593,6675,439,779 Scotia U.S. Low Volatility Equity LP Series I 57,543,371 64,152,946
250,701,119 283,761,421
TOTAL INVESTMENT PORTFOLIO 1,104,102,138 1,145,046,847
OTHER ASSETS, LESS LIABILITIES – 0.5% 5,511,916
NET ASSETS – 100.0% 1,150,558,763
The accompanying notes are an integral part of the financial statements.
434
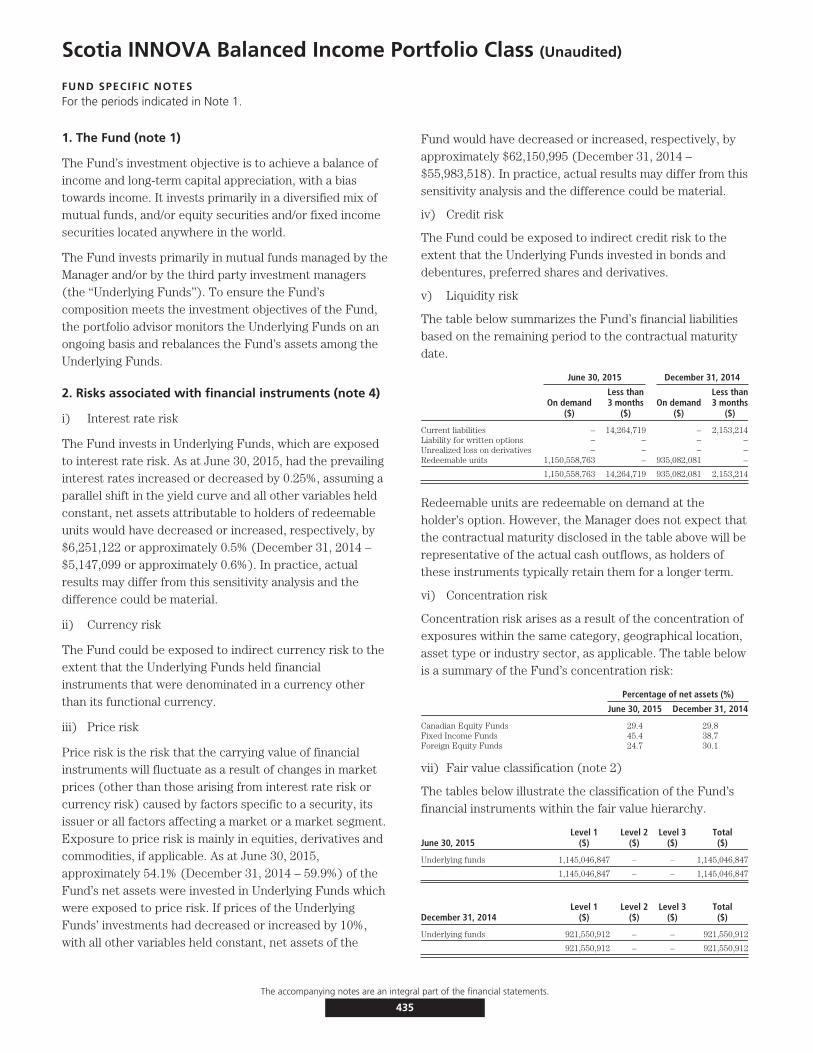
Scotia INNOVA Balanced Income Portfolio Class (Unaudited)
FUND SPECIFIC NOTESFor the periods indicated in Note 1.
1. The Fund (note 1)
The Fund’s investment objective is to achieve a balance ofincome and long-term capital appreciation, with a biastowards income. It invests primarily in a diversified mix ofmutual funds, and/or equity securities and/or fixed incomesecurities located anywhere in the world.
The Fund invests primarily in mutual funds managed by theManager and/or by the third party investment managers(the ‘‘Underlying Funds’’). To ensure the Fund’scomposition meets the investment objectives of the Fund,the portfolio advisor monitors the Underlying Funds on anongoing basis and rebalances the Fund’s assets among theUnderlying Funds.
2. Risks associated with financial instruments (note 4)
i) Interest rate risk
The Fund invests in Underlying Funds, which are exposedto interest rate risk. As at June 30, 2015, had the prevailinginterest rates increased or decreased by 0.25%, assuming aparallel shift in the yield curve and all other variables heldconstant, net assets attributable to holders of redeemableunits would have decreased or increased, respectively, by$6,251,122 or approximately 0.5% (December 31, 2014 –$5,147,099 or approximately 0.6%). In practice, actualresults may differ from this sensitivity analysis and thedifference could be material.
ii) Currency risk
The Fund could be exposed to indirect currency risk to theextent that the Underlying Funds held financialinstruments that were denominated in a currency otherthan its functional currency.
iii) Price risk
Price risk is the risk that the carrying value of financialinstruments will fluctuate as a result of changes in marketprices (other than those arising from interest rate risk orcurrency risk) caused by factors specific to a security, itsissuer or all factors affecting a market or a market segment.Exposure to price risk is mainly in equities, derivatives andcommodities, if applicable. As at June 30, 2015,approximately 54.1% (December 31, 2014 – 59.9%) of theFund’s net assets were invested in Underlying Funds whichwere exposed to price risk. If prices of the UnderlyingFunds’ investments had decreased or increased by 10%,with all other variables held constant, net assets of the
Fund would have decreased or increased, respectively, byapproximately $62,150,995 (December 31, 2014 –$55,983,518). In practice, actual results may differ from thissensitivity analysis and the difference could be material.
iv) Credit risk
The Fund could be exposed to indirect credit risk to theextent that the Underlying Funds invested in bonds anddebentures, preferred shares and derivatives.
v) Liquidity risk
The table below summarizes the Fund’s financial liabilitiesbased on the remaining period to the contractual maturitydate.
June 30, 2015 December 31, 2014
On demand($)
Less than3 months
($)On demand
($)
Less than3 months
($)
Current liabilities – 14,264,719 – 2,153,214Liability for written options – – – –Unrealized loss on derivatives – – – –Redeemable units 1,150,558,763 – 935,082,081 –
1,150,558,763 14,264,719 935,082,081 2,153,214
Redeemable units are redeemable on demand at theholder’s option. However, the Manager does not expect thatthe contractual maturity disclosed in the table above will berepresentative of the actual cash outflows, as holders ofthese instruments typically retain them for a longer term.
vi) Concentration risk
Concentration risk arises as a result of the concentration ofexposures within the same category, geographical location,asset type or industry sector, as applicable. The table belowis a summary of the Fund’s concentration risk:
Percentage of net assets (%)
June 30, 2015 December 31, 2014
Canadian Equity Funds 29.4 29.8Fixed Income Funds 45.4 38.7Foreign Equity Funds 24.7 30.1
vii) Fair value classification (note 2)
The tables below illustrate the classification of the Fund’sfinancial instruments within the fair value hierarchy.
June 30, 2015Level 1
($)Level 2
($)Level 3
($)Total($)
Underlying funds 1,145,046,847 – – 1,145,046,847
1,145,046,847 – – 1,145,046,847
December 31, 2014Level 1
($)Level 2
($)Level 3
($)Total($)
Underlying funds 921,550,912 – – 921,550,912
921,550,912 – – 921,550,912
The accompanying notes are an integral part of the financial statements.
435
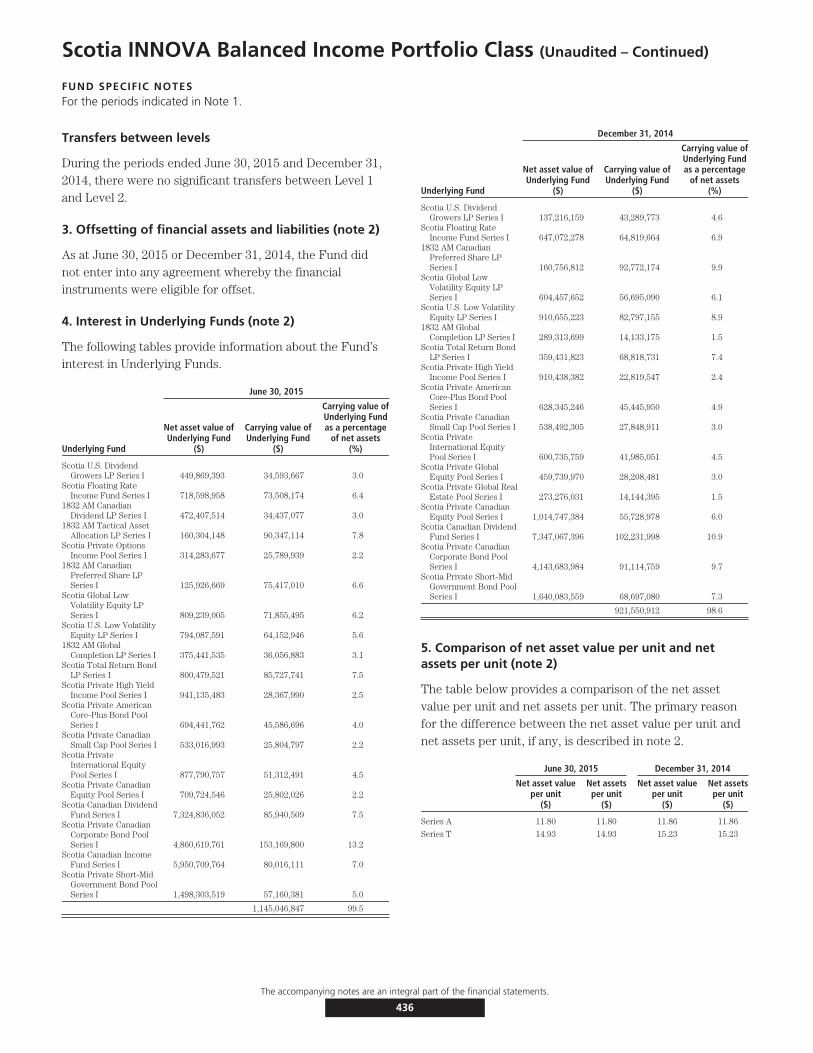
Scotia INNOVA Balanced Income Portfolio Class (Unaudited – Continued)
FUND SPECIFIC NOTESFor the periods indicated in Note 1.
Transfers between levels
During the periods ended June 30, 2015 and December 31,2014, there were no significant transfers between Level 1and Level 2.
3. Offsetting of financial assets and liabilities (note 2)
As at June 30, 2015 or December 31, 2014, the Fund didnot enter into any agreement whereby the financialinstruments were eligible for offset.
4. Interest in Underlying Funds (note 2)
The following tables provide information about the Fund’sinterest in Underlying Funds.
June 30, 2015
Underlying Fund
Net asset value ofUnderlying Fund
($)
Carrying value ofUnderlying Fund
($)
Carrying value ofUnderlying Fundas a percentage
of net assets(%)
Scotia U.S. DividendGrowers LP Series I 449,869,393 34,593,667 3.0
Scotia Floating RateIncome Fund Series I 718,598,958 73,508,174 6.4
1832 AM CanadianDividend LP Series I 472,407,514 34,437,077 3.0
1832 AM Tactical AssetAllocation LP Series I 160,304,148 90,347,114 7.8
Scotia Private OptionsIncome Pool Series I 314,283,677 25,789,939 2.2
1832 AM CanadianPreferred Share LPSeries I 125,926,669 75,417,010 6.6
Scotia Global LowVolatility Equity LPSeries I 809,239,005 71,855,495 6.2
Scotia U.S. Low VolatilityEquity LP Series I 794,087,591 64,152,946 5.6
1832 AM GlobalCompletion LP Series I 375,441,535 36,056,883 3.1
Scotia Total Return BondLP Series I 800,479,521 85,727,741 7.5
Scotia Private High YieldIncome Pool Series I 941,135,483 28,367,990 2.5
Scotia Private AmericanCore-Plus Bond PoolSeries I 694,441,762 45,586,696 4.0
Scotia Private CanadianSmall Cap Pool Series I 533,016,993 25,804,797 2.2
Scotia PrivateInternational EquityPool Series I 877,790,757 51,312,491 4.5
Scotia Private CanadianEquity Pool Series I 709,724,546 25,802,026 2.2
Scotia Canadian DividendFund Series I 7,324,836,052 85,940,509 7.5
Scotia Private CanadianCorporate Bond PoolSeries I 4,860,619,761 153,169,800 13.2
Scotia Canadian IncomeFund Series I 5,950,709,764 80,016,111 7.0
Scotia Private Short-MidGovernment Bond PoolSeries I 1,498,303,519 57,160,381 5.0
1,145,046,847 99.5
December 31, 2014
Underlying Fund
Net asset value ofUnderlying Fund
($)
Carrying value ofUnderlying Fund
($)
Carrying value ofUnderlying Fundas a percentage
of net assets(%)
Scotia U.S. DividendGrowers LP Series I 137,216,159 43,289,773 4.6
Scotia Floating RateIncome Fund Series I 647,072,278 64,819,664 6.9
1832 AM CanadianPreferred Share LPSeries I 160,756,812 92,772,174 9.9
Scotia Global LowVolatility Equity LPSeries I 604,457,652 56,695,090 6.1
Scotia U.S. Low VolatilityEquity LP Series I 910,655,223 82,797,155 8.9
1832 AM GlobalCompletion LP Series I 289,313,699 14,133,175 1.5
Scotia Total Return BondLP Series I 359,431,823 68,818,731 7.4
Scotia Private High YieldIncome Pool Series I 910,438,382 22,819,547 2.4
Scotia Private AmericanCore-Plus Bond PoolSeries I 628,345,246 45,445,950 4.9
Scotia Private CanadianSmall Cap Pool Series I 538,492,305 27,848,911 3.0
Scotia PrivateInternational EquityPool Series I 600,735,759 41,985,051 4.5
Scotia Private GlobalEquity Pool Series I 459,739,970 28,208,481 3.0
Scotia Private Global RealEstate Pool Series I 273,276,031 14,144,395 1.5
Scotia Private CanadianEquity Pool Series I 1,014,747,384 55,728,978 6.0
Scotia Canadian DividendFund Series I 7,347,067,396 102,231,998 10.9
Scotia Private CanadianCorporate Bond PoolSeries I 4,143,683,984 91,114,759 9.7
Scotia Private Short-MidGovernment Bond PoolSeries I 1,640,083,559 68,697,080 7.3
921,550,912 98.6
5. Comparison of net asset value per unit and netassets per unit (note 2)
The table below provides a comparison of the net assetvalue per unit and net assets per unit. The primary reasonfor the difference between the net asset value per unit andnet assets per unit, if any, is described in note 2.
June 30, 2015 December 31, 2014
Net asset valueper unit
($)
Net assetsper unit
($)
Net asset valueper unit
($)
Net assetsper unit
($)
Series A 11.80 11.80 11.86 11.86
Series T 14.93 14.93 15.23 15.23
The accompanying notes are an integral part of the financial statements.
436
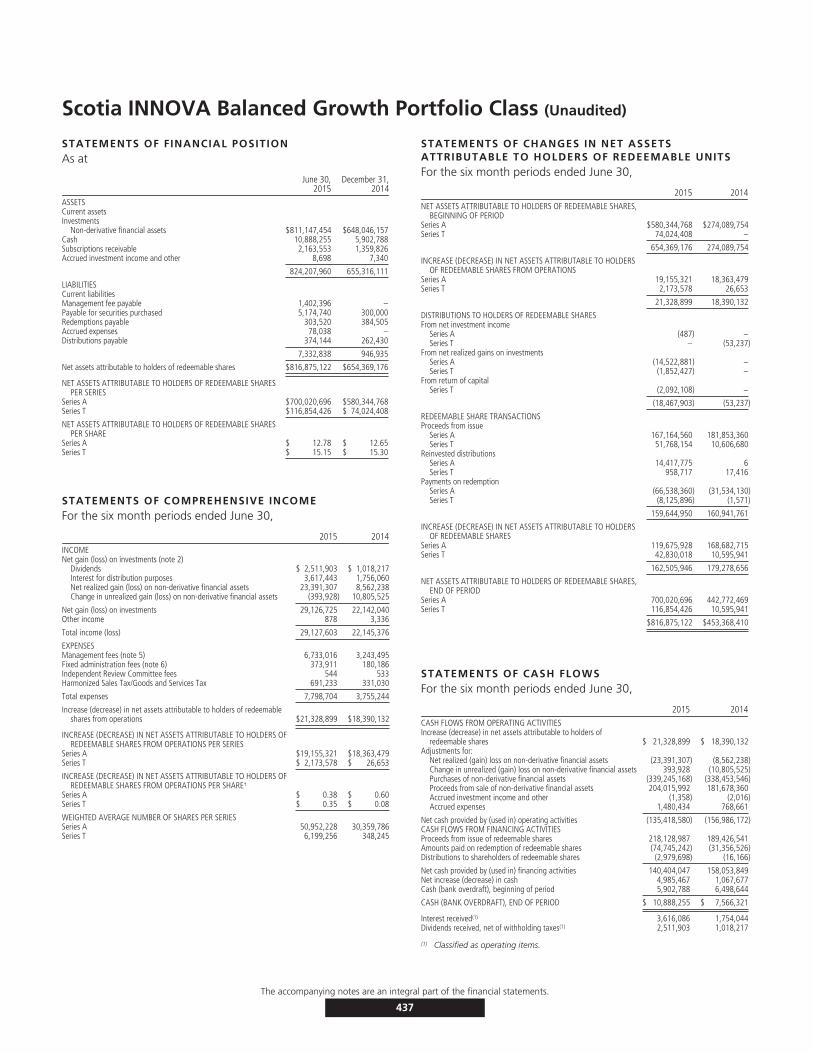
Scotia INNOVA Balanced Growth Portfolio Class (Unaudited)
STATEMENTS OF FINANCIAL POSITIONAs at
June 30,2015
December 31,2014
ASSETSCurrent assetsInvestments
Non-derivative financial assets $811,147,454 $648,046,157Cash 10,888,255 5,902,788Subscriptions receivable 2,163,553 1,359,826Accrued investment income and other 8,698 7,340
824,207,960 655,316,111
LIABILITIESCurrent liabilitiesManagement fee payable 1,402,396 –Payable for securities purchased 5,174,740 300,000Redemptions payable 303,520 384,505Accrued expenses 78,038 –Distributions payable 374,144 262,430
7,332,838 946,935
Net assets attributable to holders of redeemable shares $816,875,122 $654,369,176
NET ASSETS ATTRIBUTABLE TO HOLDERS OF REDEEMABLE SHARESPER SERIES
Series A $700,020,696 $580,344,768Series T $116,854,426 $ 74,024,408
NET ASSETS ATTRIBUTABLE TO HOLDERS OF REDEEMABLE SHARESPER SHARE
Series A $ 12.78 $ 12.65Series T $ 15.15 $ 15.30
STATEMENTS OF COMPREHENSIVE INCOMEFor the six month periods ended June 30,
2015 2014INCOMENet gain (loss) on investments (note 2)
Dividends $ 2,511,903 $ 1,018,217Interest for distribution purposes 3,617,443 1,756,060Net realized gain (loss) on non-derivative financial assets 23,391,307 8,562,238Change in unrealized gain (loss) on non-derivative financial assets (393,928) 10,805,525
Net gain (loss) on investments 29,126,725 22,142,040Other income 878 3,336
Total income (loss) 29,127,603 22,145,376
EXPENSESManagement fees (note 5) 6,733,016 3,243,495Fixed administration fees (note 6) 373,911 180,186Independent Review Committee fees 544 533Harmonized Sales Tax/Goods and Services Tax 691,233 331,030
Total expenses 7,798,704 3,755,244
Increase (decrease) in net assets attributable to holders of redeemableshares from operations $21,328,899 $18,390,132
INCREASE (DECREASE) IN NET ASSETS ATTRIBUTABLE TO HOLDERS OFREDEEMABLE SHARES FROM OPERATIONS PER SERIES
Series A $19,155,321 $18,363,479Series T $ 2,173,578 $ 26,653
INCREASE (DECREASE) IN NET ASSETS ATTRIBUTABLE TO HOLDERS OFREDEEMABLE SHARES FROM OPERATIONS PER SHARE†
Series A $ 0.38 $ 0.60Series T $ 0.35 $ 0.08
WEIGHTED AVERAGE NUMBER OF SHARES PER SERIESSeries A 50,952,228 30,359,786Series T 6,199,256 348,245
STATEMENTS OF CHANGES IN NET ASSETSATTRIBUTABLE TO HOLDERS OF REDEEMABLE UNITSFor the six month periods ended June 30,
2015 2014NET ASSETS ATTRIBUTABLE TO HOLDERS OF REDEEMABLE SHARES,
BEGINNING OF PERIODSeries A $580,344,768 $274,089,754Series T 74,024,408 –
654,369,176 274,089,754
INCREASE (DECREASE) IN NET ASSETS ATTRIBUTABLE TO HOLDERSOF REDEEMABLE SHARES FROM OPERATIONS
Series A 19,155,321 18,363,479Series T 2,173,578 26,653
21,328,899 18,390,132
DISTRIBUTIONS TO HOLDERS OF REDEEMABLE SHARESFrom net investment income
Series A (487) –Series T – (53,237)
From net realized gains on investmentsSeries A (14,522,881) –Series T (1,852,427) –
From return of capitalSeries T (2,092,108) –
(18,467,903) (53,237)
REDEEMABLE SHARE TRANSACTIONSProceeds from issue
Series A 167,164,560 181,853,360Series T 51,768,154 10,606,680
Reinvested distributionsSeries A 14,417,775 6Series T 958,717 17,416
Payments on redemptionSeries A (66,538,360) (31,534,130)Series T (8,125,896) (1,571)
159,644,950 160,941,761
INCREASE (DECREASE) IN NET ASSETS ATTRIBUTABLE TO HOLDERSOF REDEEMABLE SHARES
Series A 119,675,928 168,682,715Series T 42,830,018 10,595,941
162,505,946 179,278,656
NET ASSETS ATTRIBUTABLE TO HOLDERS OF REDEEMABLE SHARES,END OF PERIOD
Series A 700,020,696 442,772,469Series T 116,854,426 10,595,941
$816,875,122 $453,368,410
STATEMENTS OF CASH FLOWSFor the six month periods ended June 30,
2015 2014CASH FLOWS FROM OPERATING ACTIVITIESIncrease (decrease) in net assets attributable to holders of
redeemable shares $ 21,328,899 $ 18,390,132Adjustments for:
Net realized (gain) loss on non-derivative financial assets (23,391,307) (8,562,238)Change in unrealized (gain) loss on non-derivative financial assets 393,928 (10,805,525)Purchases of non-derivative financial assets (339,245,168) (338,453,546)Proceeds from sale of non-derivative financial assets 204,015,992 181,678,360Accrued investment income and other (1,358) (2,016)Accrued expenses 1,480,434 768,661
Net cash provided by (used in) operating activities (135,418,580) (156,986,172)CASH FLOWS FROM FINANCING ACTIVITIESProceeds from issue of redeemable shares 218,128,987 189,426,541Amounts paid on redemption of redeemable shares (74,745,242) (31,356,526)Distributions to shareholders of redeemable shares (2,979,698) (16,166)
Net cash provided by (used in) financing activities 140,404,047 158,053,849Net increase (decrease) in cash 4,985,467 1,067,677Cash (bank overdraft), beginning of period 5,902,788 6,498,644
CASH (BANK OVERDRAFT), END OF PERIOD $ 10,888,255 $ 7,566,321
Interest received(1) 3,616,086 1,754,044Dividends received, net of withholding taxes(1) 2,511,903 1,018,217
(1) Classified as operating items.
The accompanying notes are an integral part of the financial statements.
437

Scotia INNOVA Balanced Growth Portfolio Class (Unaudited – Continued)
SCHEDULE OF INVESTMENT PORTFOLIOAs at June 30, 2015
Numberof Units Issuer
AverageCost ($)
CarryingValue ($)
FIXED INCOME FUNDS – 31.0%4,298,624 Scotia Canadian Income Fund Series I 59,615,623 58,867,5111,614,706 Scotia Floating Rate Income Fund Series I 16,195,000 16,061,9634,256,736 Scotia Private American Core-Plus Bond Pool Series I 40,343,550 40,413,0307,043,588 Scotia Private Canadian Corporate Bond Pool Series I 76,498,831 77,059,6713,196,161 Scotia Private High Yield Income Pool Series I 30,877,312 30,771,9972,763,420 Scotia Total Return Bond LP Series I 30,364,839 30,420,005
253,895,155 253,594,177
CANDIAN EQUITY FUNDS – 31.1%3,384,022 1832 AM Canadian Dividend LP Series I 33,788,173 32,568,8481,851,605 1832 AM Canadian Growth LP Series I 18,518,435 18,369,2193,116,853 1832 AM Canadian Preferred Share LP Series I 32,432,292 30,300,7954,027,436 1832 AM Tactical Asset Allocation LP Series I 40,563,235 40,653,3421,238,701 Scotia Canadian Dividend Fund Series I 59,605,918 65,015,5712,341,779 Scotia Private Canadian Equity Pool Series I 29,585,564 30,501,9071,041,121 Scotia Private Canadian Small Cap Pool Series I 34,827,870 36,608,953
249,321,487 254,018,635
FOREIGN EQUITY FUNDS – 37.2%1,816,127 1832 AM Global Completion LP Series I 20,515,233 22,527,6014,779,832 Scotia Global Low Volatility Equity LP Series I 54,303,337 61,158,4241,171,781 Scotia Private Global Equity Pool Series I 20,851,178 26,572,602
437,281 Scotia Private Global Real Estate Pool Series I 7,165,374 8,168,0984,770,364 Scotia Private International Equity Pool Series I 57,474,793 65,017,2001,628,503 Scotia Private Options Income Pool Series I 16,283,814 16,311,4163,081,760 Scotia U.S. Dividend Growers LP Series I 32,533,691 40,898,9605,331,870 Scotia U.S. Low Volatility Equity LP Series I 56,766,576 62,880,341
265,893,996 303,534,642
TOTAL INVESTMENT PORTFOLIO 769,110,638 811,147,454
OTHER ASSETS, LESS LIABILITIES – 0.7% 5,727,668
NET ASSETS – 100.0% 816,875,122
The accompanying notes are an integral part of the financial statements.
438
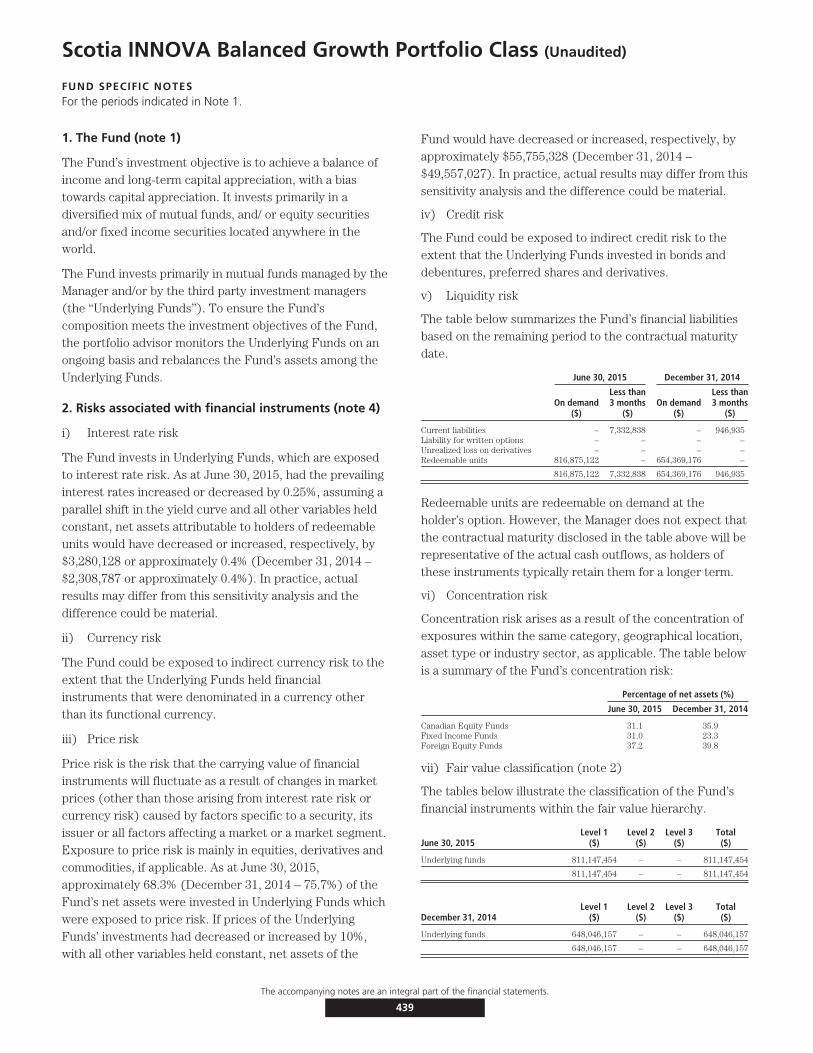
Scotia INNOVA Balanced Growth Portfolio Class (Unaudited)
FUND SPECIFIC NOTESFor the periods indicated in Note 1.
1. The Fund (note 1)
The Fund’s investment objective is to achieve a balance ofincome and long-term capital appreciation, with a biastowards capital appreciation. It invests primarily in adiversified mix of mutual funds, and/ or equity securitiesand/or fixed income securities located anywhere in theworld.
The Fund invests primarily in mutual funds managed by theManager and/or by the third party investment managers(the ‘‘Underlying Funds’’). To ensure the Fund’scomposition meets the investment objectives of the Fund,the portfolio advisor monitors the Underlying Funds on anongoing basis and rebalances the Fund’s assets among theUnderlying Funds.
2. Risks associated with financial instruments (note 4)
i) Interest rate risk
The Fund invests in Underlying Funds, which are exposedto interest rate risk. As at June 30, 2015, had the prevailinginterest rates increased or decreased by 0.25%, assuming aparallel shift in the yield curve and all other variables heldconstant, net assets attributable to holders of redeemableunits would have decreased or increased, respectively, by$3,280,128 or approximately 0.4% (December 31, 2014 –$2,308,787 or approximately 0.4%). In practice, actualresults may differ from this sensitivity analysis and thedifference could be material.
ii) Currency risk
The Fund could be exposed to indirect currency risk to theextent that the Underlying Funds held financialinstruments that were denominated in a currency otherthan its functional currency.
iii) Price risk
Price risk is the risk that the carrying value of financialinstruments will fluctuate as a result of changes in marketprices (other than those arising from interest rate risk orcurrency risk) caused by factors specific to a security, itsissuer or all factors affecting a market or a market segment.Exposure to price risk is mainly in equities, derivatives andcommodities, if applicable. As at June 30, 2015,approximately 68.3% (December 31, 2014 – 75.7%) of theFund’s net assets were invested in Underlying Funds whichwere exposed to price risk. If prices of the UnderlyingFunds’ investments had decreased or increased by 10%,with all other variables held constant, net assets of the
Fund would have decreased or increased, respectively, byapproximately $55,755,328 (December 31, 2014 –$49,557,027). In practice, actual results may differ from thissensitivity analysis and the difference could be material.
iv) Credit risk
The Fund could be exposed to indirect credit risk to theextent that the Underlying Funds invested in bonds anddebentures, preferred shares and derivatives.
v) Liquidity risk
The table below summarizes the Fund’s financial liabilitiesbased on the remaining period to the contractual maturitydate.
June 30, 2015 December 31, 2014
On demand($)
Less than3 months
($)On demand
($)
Less than3 months
($)
Current liabilities – 7,332,838 – 946,935Liability for written options – – – –Unrealized loss on derivatives – – – –Redeemable units 816,875,122 – 654,369,176 –
816,875,122 7,332,838 654,369,176 946,935
Redeemable units are redeemable on demand at theholder’s option. However, the Manager does not expect thatthe contractual maturity disclosed in the table above will berepresentative of the actual cash outflows, as holders ofthese instruments typically retain them for a longer term.
vi) Concentration risk
Concentration risk arises as a result of the concentration ofexposures within the same category, geographical location,asset type or industry sector, as applicable. The table belowis a summary of the Fund’s concentration risk:
Percentage of net assets (%)
June 30, 2015 December 31, 2014
Canadian Equity Funds 31.1 35.9Fixed Income Funds 31.0 23.3Foreign Equity Funds 37.2 39.8
vii) Fair value classification (note 2)
The tables below illustrate the classification of the Fund’sfinancial instruments within the fair value hierarchy.
June 30, 2015Level 1
($)Level 2
($)Level 3
($)Total($)
Underlying funds 811,147,454 – – 811,147,454
811,147,454 – – 811,147,454
December 31, 2014Level 1
($)Level 2
($)Level 3
($)Total($)
Underlying funds 648,046,157 – – 648,046,157
648,046,157 – – 648,046,157
The accompanying notes are an integral part of the financial statements.
439

Scotia INNOVA Balanced Growth Portfolio Class (Unaudited – Continued)
FUND SPECIFIC NOTESFor the periods indicated in Note 1.
Transfers between levels
During the periods ended June 30, 2015 and December 31,2014, there were no significant transfers between Level 1and Level 2.
3. Offsetting of financial assets and liabilities (note 2)
As at June 30, 2015 or December 31, 2014, the Fund didnot enter into any agreement whereby the financialinstruments were eligible for offset.
4. Interest in Underlying Funds (note 2)
The following tables provide information about the Fund’sinterest in Underlying Funds.
June 30, 2015
Underlying Fund
Net asset value ofUnderlying Fund
($)
Carrying value ofUnderlying Fund
($)
Carrying value ofUnderlying Fundas a percentage
of net assets(%)
Scotia U.S. DividendGrowers LP Series I 449,869,393 40,898,960 5.0
Scotia Floating RateIncome Fund Series I 718,598,958 16,061,963 2.0
1832 AM CanadianGrowth LP Series I 183,979,882 18,369,219 2.2
1832 AM CanadianDividend LP Series I 472,407,514 32,568,848 4.0
1832 AM Tactical AssetAllocation LP Series I 160,304,148 40,653,342 5.0
Scotia Private OptionsIncome Pool Series I 314,283,677 16,311,416 2.0
1832 AM CanadianPreferred Share LPSeries I 125,926,669 30,300,795 3.7
Scotia Global LowVolatility Equity LPSeries I 809,239,005 61,158,424 7.5
Scotia U.S. Low VolatilityEquity LP Series I 794,087,591 62,880,341 7.6
1832 AM GlobalCompletion LP Series I 375,441,535 22,527,601 2.8
Scotia Total Return BondLP Series I 800,479,521 30,420,005 3.7
Scotia Private High YieldIncome Pool Series I 941,135,483 30,771,997 3.8
Scotia Private AmericanCore-Plus Bond PoolSeries I 694,441,762 40,413,030 4.9
Scotia Private CanadianSmall Cap Pool Series I 533,016,993 36,608,953 4.5
Scotia PrivateInternational EquityPool Series I 877,790,757 65,017,200 8.0
Scotia Private GlobalEquity Pool Series I 353,448,869 26,572,602 3.3
Scotia Private Global RealEstate Pool Series I 302,310,847 8,168,098 1.0
Scotia Private CanadianEquity Pool Series I 709,724,546 30,501,907 3.7
Scotia Canadian DividendFund Series I 7,324,836,052 65,015,571 8.0
Scotia Private CanadianCorporate Bond PoolSeries I 4,860,619,761 77,059,671 9.4
Scotia Canadian IncomeFund Series I 5,950,709,764 58,867,511 7.2
811,147,454 99.3
December 31, 2014
Underlying Fund
Net asset value ofUnderlying Fund
($)
Carrying value ofUnderlying Fund
($)
Carrying value ofUnderlying Fundas a percentage
of net assets(%)
Scotia U.S. DividendGrowers LP Series I 137,216,159 53,841,354 8.2
Scotia Floating RateIncome Fund Series I 647,072,278 18,267,728 2.8
1832 AM CanadianPreferred Share LPSeries I 160,756,812 38,923,981 5.9
Scotia Global LowVolatility Equity LPSeries I 604,457,652 39,982,394 6.1
Scotia U.S. Low VolatilityEquity LP Series I 910,655,223 61,068,968 9.3
1832 AM GlobalCompletion LP Series I 289,313,699 13,257,274 2.0
Scotia Private High YieldIncome Pool Series I 910,438,382 28,611,625 4.4
Scotia Private AmericanCore-Plus Bond PoolSeries I 628,345,246 28,578,460 4.4
Scotia Private CanadianGrowth Pool Series I 331,181,286 19,604,696 3.0
Scotia Private CanadianSmall Cap Pool Series I 538,492,305 39,503,418 6.0
Scotia Private U.S. MidCap Growth PoolSeries I 173,925,451 13,283,764 2.0
Scotia PrivateInternational EquityPool Series I 600,735,759 39,556,261 6.0
Scotia Private GlobalEquity Pool Series I 459,739,970 26,444,441 4.0
Scotia Private Global RealEstate Pool Series I 273,276,031 13,330,017 2.0
Scotia Private CanadianEquity Pool Series I 1,014,747,384 48,940,328 7.5
Scotia Canadian DividendFund Series I 7,347,067,396 87,833,377 13.4
Scotia Private CanadianCorporate Bond PoolSeries I 4,143,683,984 47,856,823 7.3
Scotia Canadian IncomeFund Series I 5,990,064,451 29,161,248 4.5
648,046,157 99.0
5. Comparison of net asset value per unit and netassets per unit (note 2)
The table below provides a comparison of the net assetvalue per unit and net assets per unit. The primary reasonfor the difference between the net asset value per unit andnet assets per unit, if any, is described in note 2.
June 30, 2015 December 31, 2014
Net asset valueper unit
($)
Net assetsper unit
($)
Net asset valueper unit
($)
Net assetsper unit
($)
Series A 12.78 12.78 12.65 12.65
Series T 15.15 15.15 15.30 15.30
The accompanying notes are an integral part of the financial statements.
440
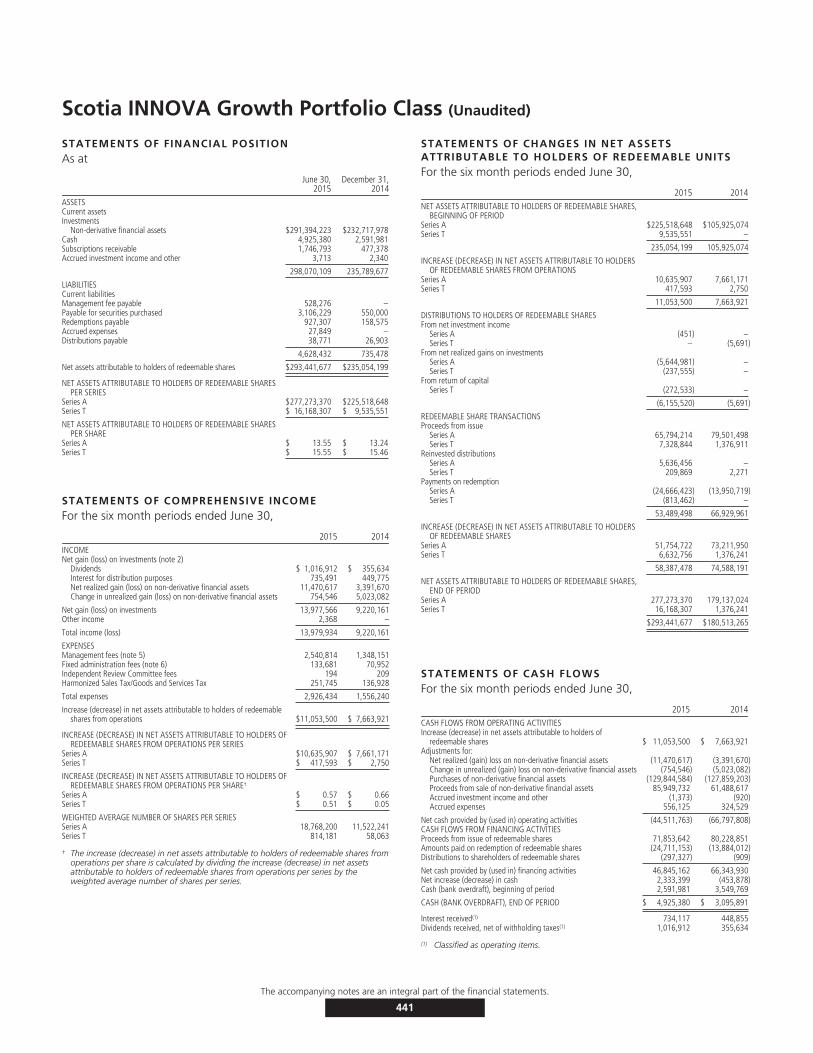
Scotia INNOVA Growth Portfolio Class (Unaudited)
STATEMENTS OF FINANCIAL POSITIONAs at
June 30,2015
December 31,2014
ASSETSCurrent assetsInvestments
Non-derivative financial assets $291,394,223 $232,717,978Cash 4,925,380 2,591,981Subscriptions receivable 1,746,793 477,378Accrued investment income and other 3,713 2,340
298,070,109 235,789,677
LIABILITIESCurrent liabilitiesManagement fee payable 528,276 –Payable for securities purchased 3,106,229 550,000Redemptions payable 927,307 158,575Accrued expenses 27,849 –Distributions payable 38,771 26,903
4,628,432 735,478
Net assets attributable to holders of redeemable shares $293,441,677 $235,054,199
NET ASSETS ATTRIBUTABLE TO HOLDERS OF REDEEMABLE SHARESPER SERIES
Series A $277,273,370 $225,518,648Series T $ 16,168,307 $ 9,535,551
NET ASSETS ATTRIBUTABLE TO HOLDERS OF REDEEMABLE SHARESPER SHARE
Series A $ 13.55 $ 13.24Series T $ 15.55 $ 15.46
STATEMENTS OF COMPREHENSIVE INCOMEFor the six month periods ended June 30,
2015 2014INCOMENet gain (loss) on investments (note 2)
Dividends $ 1,016,912 $ 355,634Interest for distribution purposes 735,491 449,775Net realized gain (loss) on non-derivative financial assets 11,470,617 3,391,670Change in unrealized gain (loss) on non-derivative financial assets 754,546 5,023,082
Net gain (loss) on investments 13,977,566 9,220,161Other income 2,368 –
Total income (loss) 13,979,934 9,220,161
EXPENSESManagement fees (note 5) 2,540,814 1,348,151Fixed administration fees (note 6) 133,681 70,952Independent Review Committee fees 194 209Harmonized Sales Tax/Goods and Services Tax 251,745 136,928
Total expenses 2,926,434 1,556,240
Increase (decrease) in net assets attributable to holders of redeemableshares from operations $11,053,500 $ 7,663,921
INCREASE (DECREASE) IN NET ASSETS ATTRIBUTABLE TO HOLDERS OFREDEEMABLE SHARES FROM OPERATIONS PER SERIES
Series A $10,635,907 $ 7,661,171Series T $ 417,593 $ 2,750
INCREASE (DECREASE) IN NET ASSETS ATTRIBUTABLE TO HOLDERS OFREDEEMABLE SHARES FROM OPERATIONS PER SHARE†
Series A $ 0.57 $ 0.66Series T $ 0.51 $ 0.05
WEIGHTED AVERAGE NUMBER OF SHARES PER SERIESSeries A 18,768,200 11,522,241Series T 814,181 58,063
† The increase (decrease) in net assets attributable to holders of redeemable shares fromoperations per share is calculated by dividing the increase (decrease) in net assetsattributable to holders of redeemable shares from operations per series by theweighted average number of shares per series.
STATEMENTS OF CHANGES IN NET ASSETSATTRIBUTABLE TO HOLDERS OF REDEEMABLE UNITSFor the six month periods ended June 30,
2015 2014NET ASSETS ATTRIBUTABLE TO HOLDERS OF REDEEMABLE SHARES,
BEGINNING OF PERIODSeries A $225,518,648 $105,925,074Series T 9,535,551 –
235,054,199 105,925,074
INCREASE (DECREASE) IN NET ASSETS ATTRIBUTABLE TO HOLDERSOF REDEEMABLE SHARES FROM OPERATIONS
Series A 10,635,907 7,661,171Series T 417,593 2,750
11,053,500 7,663,921
DISTRIBUTIONS TO HOLDERS OF REDEEMABLE SHARESFrom net investment income
Series A (451) –Series T – (5,691)
From net realized gains on investmentsSeries A (5,644,981) –Series T (237,555) –
From return of capitalSeries T (272,533) –
(6,155,520) (5,691)
REDEEMABLE SHARE TRANSACTIONSProceeds from issue
Series A 65,794,214 79,501,498Series T 7,328,844 1,376,911
Reinvested distributionsSeries A 5,636,456 –Series T 209,869 2,271
Payments on redemptionSeries A (24,666,423) (13,950,719)Series T (813,462) –
53,489,498 66,929,961
INCREASE (DECREASE) IN NET ASSETS ATTRIBUTABLE TO HOLDERSOF REDEEMABLE SHARES
Series A 51,754,722 73,211,950Series T 6,632,756 1,376,241
58,387,478 74,588,191
NET ASSETS ATTRIBUTABLE TO HOLDERS OF REDEEMABLE SHARES,END OF PERIOD
Series A 277,273,370 179,137,024Series T 16,168,307 1,376,241
$293,441,677 $180,513,265
STATEMENTS OF CASH FLOWSFor the six month periods ended June 30,
2015 2014CASH FLOWS FROM OPERATING ACTIVITIESIncrease (decrease) in net assets attributable to holders of
redeemable shares $ 11,053,500 $ 7,663,921Adjustments for:
Net realized (gain) loss on non-derivative financial assets (11,470,617) (3,391,670)Change in unrealized (gain) loss on non-derivative financial assets (754,546) (5,023,082)Purchases of non-derivative financial assets (129,844,584) (127,859,203)Proceeds from sale of non-derivative financial assets 85,949,732 61,488,617Accrued investment income and other (1,373) (920)Accrued expenses 556,125 324,529
Net cash provided by (used in) operating activities (44,511,763) (66,797,808)CASH FLOWS FROM FINANCING ACTIVITIESProceeds from issue of redeemable shares 71,853,642 80,228,851Amounts paid on redemption of redeemable shares (24,711,153) (13,884,012)Distributions to shareholders of redeemable shares (297,327) (909)
Net cash provided by (used in) financing activities 46,845,162 66,343,930Net increase (decrease) in cash 2,333,399 (453,878)Cash (bank overdraft), beginning of period 2,591,981 3,549,769
CASH (BANK OVERDRAFT), END OF PERIOD $ 4,925,380 $ 3,095,891
Interest received(1) 734,117 448,855Dividends received, net of withholding taxes(1) 1,016,912 355,634
(1) Classified as operating items.
The accompanying notes are an integral part of the financial statements.
441
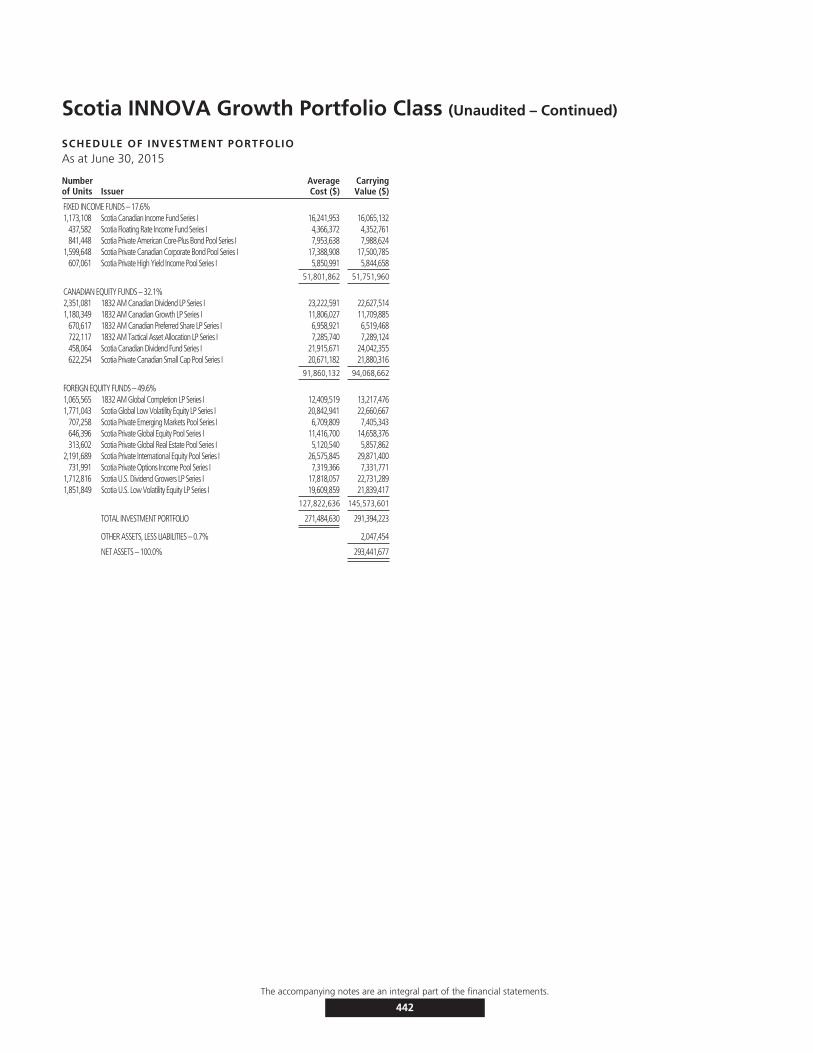
Scotia INNOVA Growth Portfolio Class (Unaudited – Continued)
SCHEDULE OF INVESTMENT PORTFOLIOAs at June 30, 2015
Numberof Units Issuer
AverageCost ($)
CarryingValue ($)
FIXED INCOME FUNDS – 17.6%1,173,108 Scotia Canadian Income Fund Series I 16,241,953 16,065,132
437,582 Scotia Floating Rate Income Fund Series I 4,366,372 4,352,761841,448 Scotia Private American Core-Plus Bond Pool Series I 7,953,638 7,988,624
1,599,648 Scotia Private Canadian Corporate Bond Pool Series I 17,388,908 17,500,785607,061 Scotia Private High Yield Income Pool Series I 5,850,991 5,844,658
51,801,862 51,751,960
CANADIAN EQUITY FUNDS – 32.1%2,351,081 1832 AM Canadian Dividend LP Series I 23,222,591 22,627,5141,180,349 1832 AM Canadian Growth LP Series I 11,806,027 11,709,885
670,617 1832 AM Canadian Preferred Share LP Series I 6,958,921 6,519,468722,117 1832 AM Tactical Asset Allocation LP Series I 7,285,740 7,289,124458,064 Scotia Canadian Dividend Fund Series I 21,915,671 24,042,355622,254 Scotia Private Canadian Small Cap Pool Series I 20,671,182 21,880,316
91,860,132 94,068,662
FOREIGN EQUITY FUNDS – 49.6%1,065,565 1832 AM Global Completion LP Series I 12,409,519 13,217,4761,771,043 Scotia Global Low Volatility Equity LP Series I 20,842,941 22,660,667
707,258 Scotia Private Emerging Markets Pool Series I 6,709,809 7,405,343646,396 Scotia Private Global Equity Pool Series I 11,416,700 14,658,376313,602 Scotia Private Global Real Estate Pool Series I 5,120,540 5,857,862
2,191,689 Scotia Private International Equity Pool Series I 26,575,845 29,871,400731,991 Scotia Private Options Income Pool Series I 7,319,366 7,331,771
1,712,816 Scotia U.S. Dividend Growers LP Series I 17,818,057 22,731,2891,851,849 Scotia U.S. Low Volatility Equity LP Series I 19,609,859 21,839,417
127,822,636 145,573,601
TOTAL INVESTMENT PORTFOLIO 271,484,630 291,394,223
OTHER ASSETS, LESS LIABILITIES – 0.7% 2,047,454
NET ASSETS – 100.0% 293,441,677
The accompanying notes are an integral part of the financial statements.
442
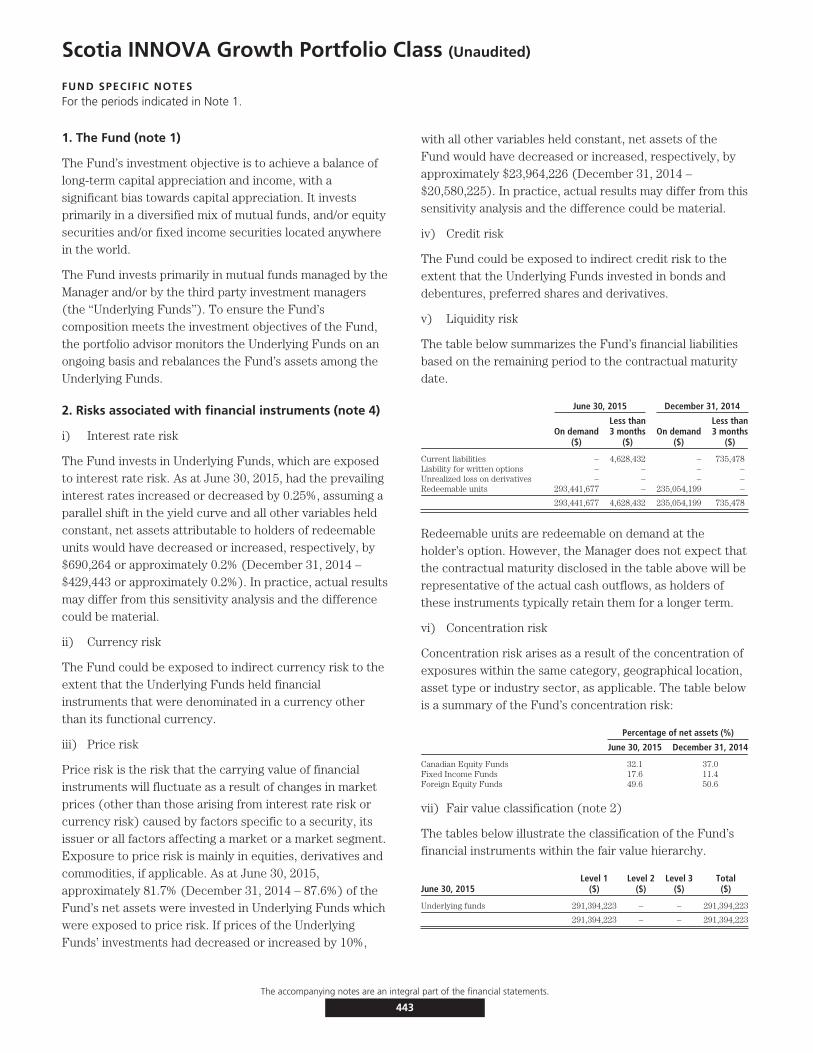
Scotia INNOVA Growth Portfolio Class (Unaudited)
FUND SPECIFIC NOTESFor the periods indicated in Note 1.
1. The Fund (note 1)
The Fund’s investment objective is to achieve a balance oflong-term capital appreciation and income, with asignificant bias towards capital appreciation. It investsprimarily in a diversified mix of mutual funds, and/or equitysecurities and/or fixed income securities located anywherein the world.
The Fund invests primarily in mutual funds managed by theManager and/or by the third party investment managers(the ‘‘Underlying Funds’’). To ensure the Fund’scomposition meets the investment objectives of the Fund,the portfolio advisor monitors the Underlying Funds on anongoing basis and rebalances the Fund’s assets among theUnderlying Funds.
2. Risks associated with financial instruments (note 4)
i) Interest rate risk
The Fund invests in Underlying Funds, which are exposedto interest rate risk. As at June 30, 2015, had the prevailinginterest rates increased or decreased by 0.25%, assuming aparallel shift in the yield curve and all other variables heldconstant, net assets attributable to holders of redeemableunits would have decreased or increased, respectively, by$690,264 or approximately 0.2% (December 31, 2014 –$429,443 or approximately 0.2%). In practice, actual resultsmay differ from this sensitivity analysis and the differencecould be material.
ii) Currency risk
The Fund could be exposed to indirect currency risk to theextent that the Underlying Funds held financialinstruments that were denominated in a currency otherthan its functional currency.
iii) Price risk
Price risk is the risk that the carrying value of financialinstruments will fluctuate as a result of changes in marketprices (other than those arising from interest rate risk orcurrency risk) caused by factors specific to a security, itsissuer or all factors affecting a market or a market segment.Exposure to price risk is mainly in equities, derivatives andcommodities, if applicable. As at June 30, 2015,approximately 81.7% (December 31, 2014 – 87.6%) of theFund’s net assets were invested in Underlying Funds whichwere exposed to price risk. If prices of the UnderlyingFunds’ investments had decreased or increased by 10%,
with all other variables held constant, net assets of theFund would have decreased or increased, respectively, byapproximately $23,964,226 (December 31, 2014 –$20,580,225). In practice, actual results may differ from thissensitivity analysis and the difference could be material.
iv) Credit risk
The Fund could be exposed to indirect credit risk to theextent that the Underlying Funds invested in bonds anddebentures, preferred shares and derivatives.
v) Liquidity risk
The table below summarizes the Fund’s financial liabilitiesbased on the remaining period to the contractual maturitydate.
June 30, 2015 December 31, 2014
On demand($)
Less than3 months
($)On demand
($)
Less than3 months
($)
Current liabilities – 4,628,432 – 735,478Liability for written options – – – –Unrealized loss on derivatives – – – –Redeemable units 293,441,677 – 235,054,199 –
293,441,677 4,628,432 235,054,199 735,478
Redeemable units are redeemable on demand at theholder’s option. However, the Manager does not expect thatthe contractual maturity disclosed in the table above will berepresentative of the actual cash outflows, as holders ofthese instruments typically retain them for a longer term.
vi) Concentration risk
Concentration risk arises as a result of the concentration ofexposures within the same category, geographical location,asset type or industry sector, as applicable. The table belowis a summary of the Fund’s concentration risk:
Percentage of net assets (%)
June 30, 2015 December 31, 2014
Canadian Equity Funds 32.1 37.0Fixed Income Funds 17.6 11.4Foreign Equity Funds 49.6 50.6
vii) Fair value classification (note 2)
The tables below illustrate the classification of the Fund’sfinancial instruments within the fair value hierarchy.
June 30, 2015Level 1
($)Level 2
($)Level 3
($)Total($)
Underlying funds 291,394,223 – – 291,394,223
291,394,223 – – 291,394,223
The accompanying notes are an integral part of the financial statements.
443

Scotia INNOVA Growth Portfolio Class (Unaudited – Continued)
FUND SPECIFIC NOTESFor the periods indicated in Note 1.
December 31, 2014Level 1
($)Level 2
($)Level 3
($)Total($)
Underlying funds 232,717,978 – – 232,717,978
232,717,978 – – 232,717,978
Transfers between levels
During the periods ended June 30, 2015 and December 31,2014, there were no significant transfers between Level 1and Level 2.
3. Offsetting of financial assets and liabilities (note 2)
As at June 30, 2015 or December 31, 2014, the Fund didnot enter into any agreement whereby the financialinstruments were eligible for offset.
4. Interest in Underlying Funds (note 2)
The following tables provide information about the Fund’sinterest in Underlying Funds.
June 30, 2015
Underlying Fund
Net asset value ofUnderlying Fund
($)
Carrying value ofUnderlying Fund
($)
Carrying value ofUnderlying Fundas a percentage
of net assets(%)
Scotia Private EmergingMarkets Pool Series I 205,863,313 7,405,343 2.5
Scotia U.S. DividendGrowers LP Series I 449,869,393 22,731,289 7.7
Scotia Floating RateIncome Fund Series I 718,598,958 4,352,761 1.5
1832 AM CanadianGrowth LP Series I 183,979,882 11,709,885 4.0
1832 AM CanadianDividend LP Series I 472,407,514 22,627,514 7.7
1832 AM Tactical AssetAllocation LP Series I 160,304,148 7,289,124 2.5
Scotia Private OptionsIncome Pool Series I 314,283,677 7,331,771 2.5
1832 AM CanadianPreferred Share LPSeries I 125,926,669 6,519,468 2.2
Scotia Global LowVolatility Equity LPSeries I 809,239,005 22,660,667 7.7
Scotia U.S. Low VolatilityEquity LP Series I 794,087,591 21,839,417 7.4
1832 AM GlobalCompletion LP Series I 375,441,535 13,217,476 4.5
Scotia Private High YieldIncome Pool Series I 941,135,483 5,844,658 2.0
Scotia Private AmericanCore-Plus Bond PoolSeries I 694,441,762 7,988,624 2.7
Scotia Private CanadianSmall Cap Pool Series I 533,016,993 21,880,316 7.5
Scotia PrivateInternational EquityPool Series I 877,790,757 29,871,400 10.2
Scotia Private GlobalEquity Pool Series I 353,448,869 14,658,376 5.0
Scotia Private Global RealEstate Pool Series I 302,310,847 5,857,862 2.0
Scotia Canadian DividendFund Series I 7,324,836,052 24,042,355 8.2
June 30, 2015
Underlying Fund
Net asset value ofUnderlying Fund
($)
Carrying value ofUnderlying Fund
($)
Carrying value ofUnderlying Fundas a percentage
of net assets(%)
Scotia Private CanadianCorporate Bond PoolSeries I 4,860,619,761 17,500,785 6.0
Scotia Canadian IncomeFund Series I 5,950,709,764 16,065,132 5.5
291,394,223 99.3
December 31, 2014
Underlying Fund
Net asset value ofUnderlying Fund
($)
Carrying value ofUnderlying Fund
($)
Carrying value ofUnderlying Fundas a percentage
of net assets(%)
Scotia Private EmergingMarkets Pool Series I 172,517,483 7,002,860 3.0
Scotia U.S. DividendGrowers LP Series I 137,216,159 24,380,845 10.4
1832 AM CanadianPreferred Share LPSeries I 160,756,812 6,899,296 2.9
Scotia Global LowVolatility Equity LPSeries I 604,457,652 12,066,543 5.1
Scotia U.S. Low VolatilityEquity LP Series I 910,655,223 23,355,892 9.9
1832 AM GlobalCompletion LP Series I 289,313,699 5,840,093 2.5
Scotia Private High YieldIncome Pool Series I 910,438,382 4,501,289 1.9
Scotia Private AmericanCore-Plus Bond PoolSeries I 628,345,246 5,587,127 2.4
Scotia Private CanadianGrowth Pool Series I 331,181,286 11,907,049 5.1
Scotia Private CanadianSmall Cap Pool Series I 538,492,305 20,061,950 8.5
Scotia Private U.S. MidCap Growth PoolSeries I 173,925,451 11,955,148 5.1
Scotia PrivateInternational EquityPool Series I 600,735,759 17,692,463 7.5
Scotia Private GlobalEquity Pool Series I 459,739,970 11,844,092 5.0
Scotia Private Global RealEstate Pool Series I 273,276,031 4,726,331 2.0
Scotia Private CanadianEquity Pool Series I 1,014,747,384 20,210,519 8.6
Scotia Canadian DividendFund Series I 7,347,067,396 27,859,169 11.9
Scotia Private CanadianCorporate Bond PoolSeries I 4,143,683,984 10,078,027 4.3
Scotia Canadian IncomeFund Series I 5,990,064,451 6,749,285 2.9
232,717,978 99.0
The accompanying notes are an integral part of the financial statements.
444
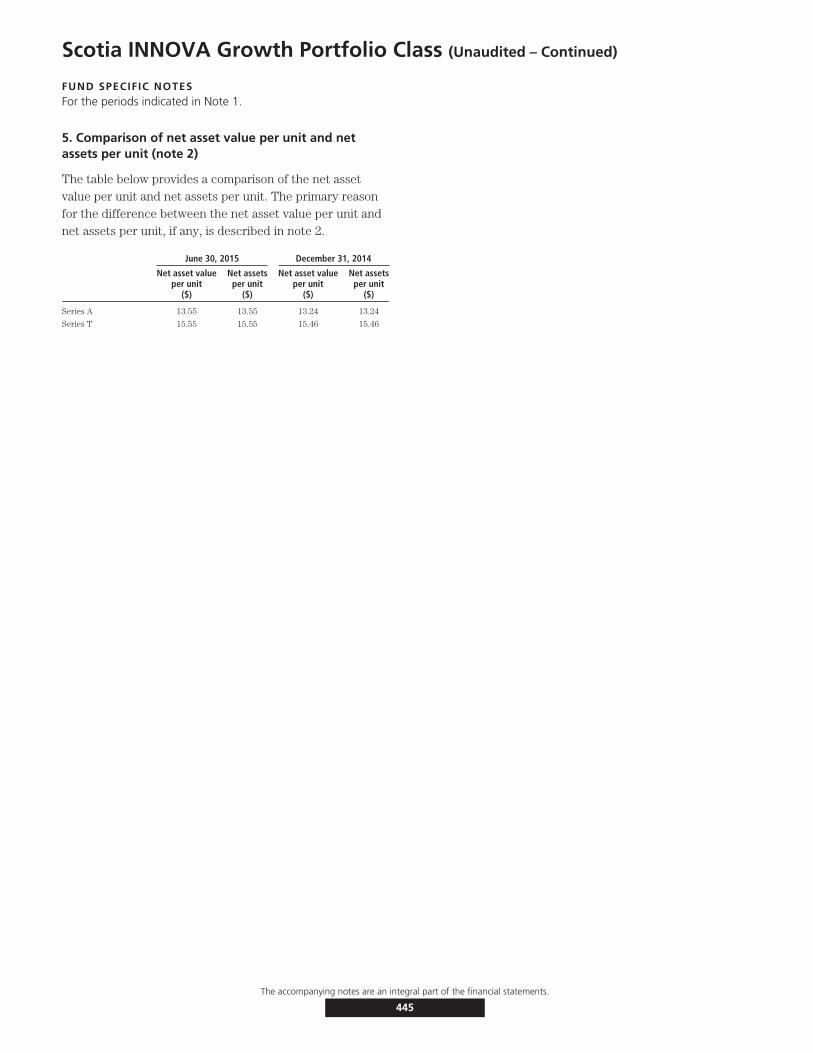
Scotia INNOVA Growth Portfolio Class (Unaudited – Continued)
FUND SPECIFIC NOTESFor the periods indicated in Note 1.
5. Comparison of net asset value per unit and netassets per unit (note 2)
The table below provides a comparison of the net assetvalue per unit and net assets per unit. The primary reasonfor the difference between the net asset value per unit andnet assets per unit, if any, is described in note 2.
June 30, 2015 December 31, 2014
Net asset valueper unit
($)
Net assetsper unit
($)
Net asset valueper unit
($)
Net assetsper unit
($)
Series A 13.55 13.55 13.24 13.24
Series T 15.55 15.55 15.46 15.46
The accompanying notes are an integral part of the financial statements.
445
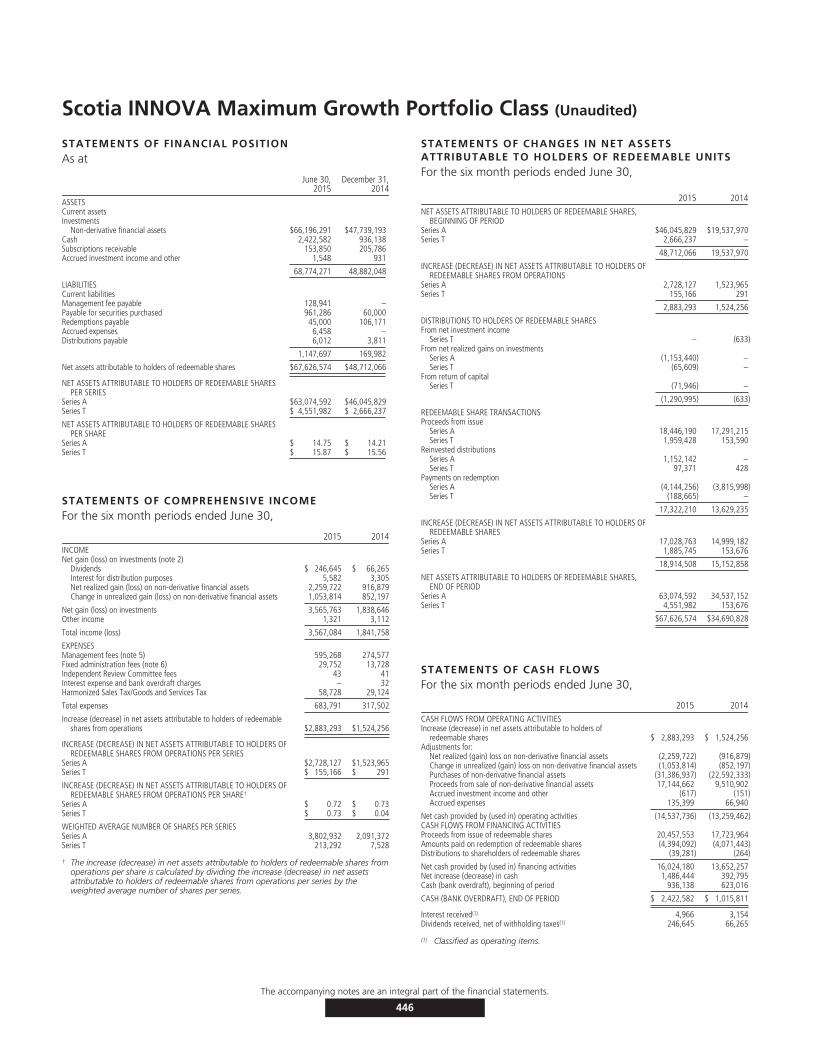
Scotia INNOVA Maximum Growth Portfolio Class (Unaudited)
STATEMENTS OF FINANCIAL POSITIONAs at
June 30,2015
December 31,2014
ASSETSCurrent assetsInvestments
Non-derivative financial assets $66,196,291 $47,739,193Cash 2,422,582 936,138Subscriptions receivable 153,850 205,786Accrued investment income and other 1,548 931
68,774,271 48,882,048
LIABILITIESCurrent liabilitiesManagement fee payable 128,941 –Payable for securities purchased 961,286 60,000Redemptions payable 45,000 106,171Accrued expenses 6,458 –Distributions payable 6,012 3,811
1,147,697 169,982
Net assets attributable to holders of redeemable shares $67,626,574 $48,712,066
NET ASSETS ATTRIBUTABLE TO HOLDERS OF REDEEMABLE SHARESPER SERIES
Series A $63,074,592 $46,045,829Series T $ 4,551,982 $ 2,666,237
NET ASSETS ATTRIBUTABLE TO HOLDERS OF REDEEMABLE SHARESPER SHARE
Series A $ 14.75 $ 14.21Series T $ 15.87 $ 15.56
STATEMENTS OF COMPREHENSIVE INCOMEFor the six month periods ended June 30,
2015 2014INCOMENet gain (loss) on investments (note 2)
Dividends $ 246,645 $ 66,265Interest for distribution purposes 5,582 3,305Net realized gain (loss) on non-derivative financial assets 2,259,722 916,879Change in unrealized gain (loss) on non-derivative financial assets 1,053,814 852,197
Net gain (loss) on investments 3,565,763 1,838,646Other income 1,321 3,112
Total income (loss) 3,567,084 1,841,758
EXPENSESManagement fees (note 5) 595,268 274,577Fixed administration fees (note 6) 29,752 13,728Independent Review Committee fees 43 41Interest expense and bank overdraft charges – 32Harmonized Sales Tax/Goods and Services Tax 58,728 29,124
Total expenses 683,791 317,502
Increase (decrease) in net assets attributable to holders of redeemableshares from operations $2,883,293 $1,524,256
INCREASE (DECREASE) IN NET ASSETS ATTRIBUTABLE TO HOLDERS OFREDEEMABLE SHARES FROM OPERATIONS PER SERIES
Series A $2,728,127 $1,523,965Series T $ 155,166 $ 291
INCREASE (DECREASE) IN NET ASSETS ATTRIBUTABLE TO HOLDERS OFREDEEMABLE SHARES FROM OPERATIONS PER SHARE†
Series A $ 0.72 $ 0.73Series T $ 0.73 $ 0.04
WEIGHTED AVERAGE NUMBER OF SHARES PER SERIESSeries A 3,802,932 2,091,372Series T 213,292 7,528
† The increase (decrease) in net assets attributable to holders of redeemable shares fromoperations per share is calculated by dividing the increase (decrease) in net assetsattributable to holders of redeemable shares from operations per series by theweighted average number of shares per series.
STATEMENTS OF CHANGES IN NET ASSETSATTRIBUTABLE TO HOLDERS OF REDEEMABLE UNITSFor the six month periods ended June 30,
2015 2014NET ASSETS ATTRIBUTABLE TO HOLDERS OF REDEEMABLE SHARES,
BEGINNING OF PERIODSeries A $46,045,829 $19,537,970Series T 2,666,237 –
48,712,066 19,537,970
INCREASE (DECREASE) IN NET ASSETS ATTRIBUTABLE TO HOLDERS OFREDEEMABLE SHARES FROM OPERATIONS
Series A 2,728,127 1,523,965Series T 155,166 291
2,883,293 1,524,256
DISTRIBUTIONS TO HOLDERS OF REDEEMABLE SHARESFrom net investment income
Series T – (633)From net realized gains on investments
Series A (1,153,440) –Series T (65,609) –
From return of capitalSeries T (71,946) –
(1,290,995) (633)
REDEEMABLE SHARE TRANSACTIONSProceeds from issue
Series A 18,446,190 17,291,215Series T 1,959,428 153,590
Reinvested distributionsSeries A 1,152,142 –Series T 97,371 428
Payments on redemptionSeries A (4,144,256) (3,815,998)Series T (188,665) –
17,322,210 13,629,235
INCREASE (DECREASE) IN NET ASSETS ATTRIBUTABLE TO HOLDERS OFREDEEMABLE SHARES
Series A 17,028,763 14,999,182Series T 1,885,745 153,676
18,914,508 15,152,858
NET ASSETS ATTRIBUTABLE TO HOLDERS OF REDEEMABLE SHARES,END OF PERIOD
Series A 63,074,592 34,537,152Series T 4,551,982 153,676
$67,626,574 $34,690,828
STATEMENTS OF CASH FLOWSFor the six month periods ended June 30,
2015 2014CASH FLOWS FROM OPERATING ACTIVITIESIncrease (decrease) in net assets attributable to holders of
redeemable shares $ 2,883,293 $ 1,524,256Adjustments for:
Net realized (gain) loss on non-derivative financial assets (2,259,722) (916,879)Change in unrealized (gain) loss on non-derivative financial assets (1,053,814) (852,197)Purchases of non-derivative financial assets (31,386,937) (22,592,333)Proceeds from sale of non-derivative financial assets 17,144,662 9,510,902Accrued investment income and other (617) (151)Accrued expenses 135,399 66,940
Net cash provided by (used in) operating activities (14,537,736) (13,259,462)CASH FLOWS FROM FINANCING ACTIVITIESProceeds from issue of redeemable shares 20,457,553 17,723,964Amounts paid on redemption of redeemable shares (4,394,092) (4,071,443)Distributions to shareholders of redeemable shares (39,281) (264)
Net cash provided by (used in) financing activities 16,024,180 13,652,257Net increase (decrease) in cash 1,486,444 392,795Cash (bank overdraft), beginning of period 936,138 623,016
CASH (BANK OVERDRAFT), END OF PERIOD $ 2,422,582 $ 1,015,811
Interest received(1) 4,966 3,154Dividends received, net of withholding taxes(1) 246,645 66,265
(1) Classified as operating items.
The accompanying notes are an integral part of the financial statements.
446
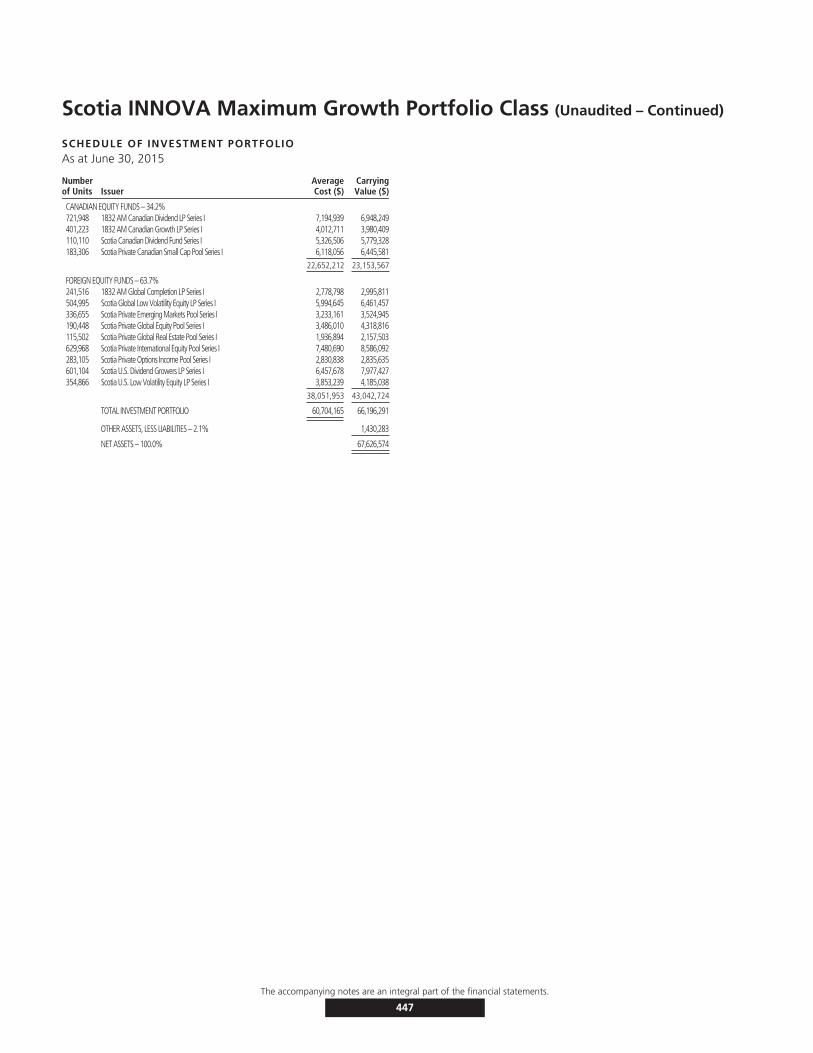
Scotia INNOVA Maximum Growth Portfolio Class (Unaudited – Continued)
SCHEDULE OF INVESTMENT PORTFOLIOAs at June 30, 2015
Numberof Units Issuer
AverageCost ($)
CarryingValue ($)
CANADIAN EQUITY FUNDS – 34.2%721,948 1832 AM Canadian Dividend LP Series I 7,194,939 6,948,249401,223 1832 AM Canadian Growth LP Series I 4,012,711 3,980,409110,110 Scotia Canadian Dividend Fund Series I 5,326,506 5,779,328183,306 Scotia Private Canadian Small Cap Pool Series I 6,118,056 6,445,581
22,652,212 23,153,567
FOREIGN EQUITY FUNDS – 63.7%241,516 1832 AM Global Completion LP Series I 2,778,798 2,995,811504,995 Scotia Global Low Volatility Equity LP Series I 5,994,645 6,461,457336,655 Scotia Private Emerging Markets Pool Series I 3,233,161 3,524,945190,448 Scotia Private Global Equity Pool Series I 3,486,010 4,318,816115,502 Scotia Private Global Real Estate Pool Series I 1,936,894 2,157,503629,968 Scotia Private International Equity Pool Series I 7,480,690 8,586,092283,105 Scotia Private Options Income Pool Series I 2,830,838 2,835,635601,104 Scotia U.S. Dividend Growers LP Series I 6,457,678 7,977,427354,866 Scotia U.S. Low Volatility Equity LP Series I 3,853,239 4,185,038
38,051,953 43,042,724
TOTAL INVESTMENT PORTFOLIO 60,704,165 66,196,291
OTHER ASSETS, LESS LIABILITIES – 2.1% 1,430,283
NET ASSETS – 100.0% 67,626,574
The accompanying notes are an integral part of the financial statements.
447

Scotia INNOVA Maximum Growth Portfolio Class (Unaudited)
FUND SPECIFIC NOTESFor the periods indicated in Note 1.
1. The Fund (note 1)
The Fund’s investment objective is long-term capitalappreciation. It invests primarily in a diversified mix ofmutual funds and/or equity securities located anywhere inthe world.
The Fund invests primarily in mutual funds managed by theManager and/or by the third party investment managers(the ‘‘Underlying Funds’’). To ensure the Fund’scomposition meets the investment objectives of the Fund,the portfolio advisor monitors the Underlying Funds on anongoing basis and rebalances the Fund’s assets among theUnderlying Funds.
2. Risks associated with financial instruments (note 4)
i) Interest rate risk
The majority of the Underlying Fund’s financial assets andliabilities were non-interest bearing as at June 30, 2015 andDecember 31, 2014. Accordingly, the Fund is not directlysubject to significant risk due to fluctuations in theprevailing levels of market interest rates.
ii) Currency risk
The Fund could be exposed to indirect currency risk to theextent that the Underlying Funds held financialinstruments that were denominated in a currency otherthan its functional currency.
iii) Price risk
Price risk is the risk that the carrying value of financialinstruments will fluctuate as a result of changes in marketprices (other than those arising from interest rate risk orcurrency risk) caused by factors specific to a security, itsissuer or all factors affecting a market or a market segment.Exposure to price risk is mainly in equities, derivatives andcommodities, if applicable. As at June 30, 2015,approximately 97.9% (December 31, 2014 – 98.0%) of theFund’s net assets were invested in Underlying Funds whichwere exposed to price risk. If prices of the UnderlyingFunds’ investments had decreased or increased by 10%,with all other variables held constant, net assets of theFund would have decreased or increased, respectively, byapproximately $6,619,629 (December 31, 2014 –$4,773,919). In practice, actual results may differ from thissensitivity analysis and the difference could be material.
iv) Credit risk
The Fund could be exposed to indirect credit risk to theextent that the Underlying Funds invested in bonds anddebentures, preferred shares and derivatives.
v) Liquidity risk
The table below summarizes the Fund’s financial liabilitiesbased on the remaining period to the contractual maturitydate.
June 30, 2015 December 31, 2014
On demand($)
Less than3 months
($)On demand
($)
Less than3 months
($)
Current liabilities – 1,147,697 – 169,982Liability for written options – – – –Unrealized loss on derivatives – – – –Redeemable units 67,626,574 – 48,712,066 –
67,626,574 1,147,697 48,712,066 169,982
Redeemable units are redeemable on demand at theholder’s option. However, the Manager does not expect thatthe contractual maturity disclosed in the table above will berepresentative of the actual cash outflows, as holders ofthese instruments typically retain them for a longer term.
vi) Concentration risk
Concentration risk arises as a result of the concentration ofexposures within the same category, geographical location,asset type or industry sector, as applicable. The table belowis a summary of the Fund’s concentration risk:
Percentage of net assets (%)
June 30, 2015 December 31, 2014
Canadian Equity Funds 34.2 38.8Foreign Equity Funds 63.7 59.2
vii) Fair value classification (note 2)
The tables below illustrate the classification of the Fund’sfinancial instruments within the fair value hierarchy.
June 30, 2015Level 1
($)Level 2
($)Level 3
($)Total($)
Underlying funds 66,196,291 – – 66,196,291
66,196,291 – – 66,196,291
December 31, 2014Level 1
($)Level 2
($)Level 3
($)Total($)
Underlying funds 47,739,193 – – 47,739,193
47,739,193 – – 47,739,193
The accompanying notes are an integral part of the financial statements.
448
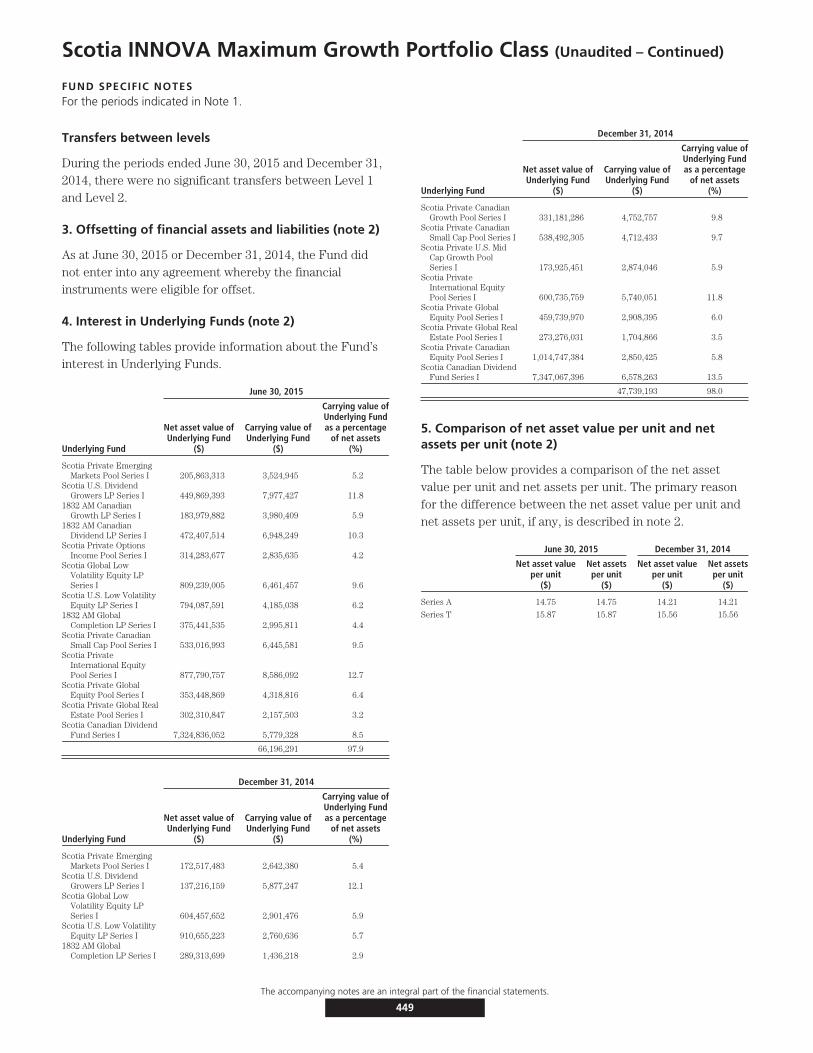
Scotia INNOVA Maximum Growth Portfolio Class (Unaudited – Continued)
FUND SPECIFIC NOTESFor the periods indicated in Note 1.
Transfers between levels
During the periods ended June 30, 2015 and December 31,2014, there were no significant transfers between Level 1and Level 2.
3. Offsetting of financial assets and liabilities (note 2)
As at June 30, 2015 or December 31, 2014, the Fund didnot enter into any agreement whereby the financialinstruments were eligible for offset.
4. Interest in Underlying Funds (note 2)
The following tables provide information about the Fund’sinterest in Underlying Funds.
June 30, 2015
Underlying Fund
Net asset value ofUnderlying Fund
($)
Carrying value ofUnderlying Fund
($)
Carrying value ofUnderlying Fundas a percentage
of net assets(%)
Scotia Private EmergingMarkets Pool Series I 205,863,313 3,524,945 5.2
Scotia U.S. DividendGrowers LP Series I 449,869,393 7,977,427 11.8
1832 AM CanadianGrowth LP Series I 183,979,882 3,980,409 5.9
1832 AM CanadianDividend LP Series I 472,407,514 6,948,249 10.3
Scotia Private OptionsIncome Pool Series I 314,283,677 2,835,635 4.2
Scotia Global LowVolatility Equity LPSeries I 809,239,005 6,461,457 9.6
Scotia U.S. Low VolatilityEquity LP Series I 794,087,591 4,185,038 6.2
1832 AM GlobalCompletion LP Series I 375,441,535 2,995,811 4.4
Scotia Private CanadianSmall Cap Pool Series I 533,016,993 6,445,581 9.5
Scotia PrivateInternational EquityPool Series I 877,790,757 8,586,092 12.7
Scotia Private GlobalEquity Pool Series I 353,448,869 4,318,816 6.4
Scotia Private Global RealEstate Pool Series I 302,310,847 2,157,503 3.2
Scotia Canadian DividendFund Series I 7,324,836,052 5,779,328 8.5
66,196,291 97.9
December 31, 2014
Underlying Fund
Net asset value ofUnderlying Fund
($)
Carrying value ofUnderlying Fund
($)
Carrying value ofUnderlying Fundas a percentage
of net assets(%)
Scotia Private EmergingMarkets Pool Series I 172,517,483 2,642,380 5.4
Scotia U.S. DividendGrowers LP Series I 137,216,159 5,877,247 12.1
Scotia Global LowVolatility Equity LPSeries I 604,457,652 2,901,476 5.9
Scotia U.S. Low VolatilityEquity LP Series I 910,655,223 2,760,636 5.7
1832 AM GlobalCompletion LP Series I 289,313,699 1,436,218 2.9
December 31, 2014
Underlying Fund
Net asset value ofUnderlying Fund
($)
Carrying value ofUnderlying Fund
($)
Carrying value ofUnderlying Fundas a percentage
of net assets(%)
Scotia Private CanadianGrowth Pool Series I 331,181,286 4,752,757 9.8
Scotia Private CanadianSmall Cap Pool Series I 538,492,305 4,712,433 9.7
Scotia Private U.S. MidCap Growth PoolSeries I 173,925,451 2,874,046 5.9
Scotia PrivateInternational EquityPool Series I 600,735,759 5,740,051 11.8
Scotia Private GlobalEquity Pool Series I 459,739,970 2,908,395 6.0
Scotia Private Global RealEstate Pool Series I 273,276,031 1,704,866 3.5
Scotia Private CanadianEquity Pool Series I 1,014,747,384 2,850,425 5.8
Scotia Canadian DividendFund Series I 7,347,067,396 6,578,263 13.5
47,739,193 98.0
5. Comparison of net asset value per unit and netassets per unit (note 2)
The table below provides a comparison of the net assetvalue per unit and net assets per unit. The primary reasonfor the difference between the net asset value per unit andnet assets per unit, if any, is described in note 2.
June 30, 2015 December 31, 2014
Net asset valueper unit
($)
Net assetsper unit
($)
Net asset valueper unit
($)
Net assetsper unit
($)
Series A 14.75 14.75 14.21 14.21
Series T 15.87 15.87 15.56 15.56
The accompanying notes are an integral part of the financial statements.
449
Notes to the Financial Statements
For the periods indicated in Note 1
1. The Funds
1832 Asset Management L.P., a wholly owned subsidiary ofthe Bank of Nova Scotia (“Scotiabank”), is the manager andtrustee (where applicable) of the funds. In this document,“we”, “us”, “our”, the “Manager”, the “Trustee”, and “1832Asset Management” refer to 1832 Asset Management L.P.The registered office of the Funds is 1 Adelaide St. E, 28thFloor, Toronto, Ontario, M5C 2V9.
The funds presented in these financial statements areeither open-ended mutual fund trusts (“Trust Funds”) orclasses of a mutual fund corporation (“Corporate ClassFunds”). The Trust Funds issue units and Corporate ClassFunds issue shares. Throughout this document, whereapplicable, reference to units and unitholders also refers toshares and shareholders. We also refer to a Trust Fund anda Corporate Class Funds individually, as a “Fund” andcollectively, as the “Funds”.
The Trust Funds are established under the laws of theProvince of Ontario pursuant to an Amended and RestatedMaster Declaration of Trust dated March 2, 2015, asamended from time to time. Scotia Corporate Class Inc. is amulti-class open-ended mutual fund corporation formed byarticles of incorporation under the laws of Canada onApril 17, 2012, as amended from time to time. EachCorporate Class Fund is a class of shares of theCorporation. These financial statements only present thefinancial information of each of the Corporate Class Funds,as its own reporting entity. As the Corporation as a whole isliable for the expenses and obligations of all classes, thereexists the possibility that if a Corporate Class Fund cannotsatisfy its own obligations, they may be satisfied usingassets attributable to other Corporate Class Funds withinthe Corporation. The Manager, however, believes that therisk of cross-class liability is remote and is diligent tominimize such liability.
The Statements of Financial Position are as at June 30,2015 and December 31, 2014, and the Statements ofComprehensive Income, Changes in Net Assets Attributableto Holders of Redeemable Units and Cash Flows are for thesix-month periods ended June 30, 2015 and 2014. ForFunds that started during either period, the informationpresented is for the period from the Fund’s commencementdate to June 30, 2015 and 2014, respectively. The Scheduleof Investment Portfolio for each of the Funds is as atJune 30, 2015. Throughout this document, reference to theperiods refers to the reporting periods described above.
These financial statements were approved and authorizedfor issue on August 18, 2015 by the Board of Directors ofthe Corporation, with respect to the Corporate Class Fundsand by the Board of Directors of 1832 Asset ManagementG.P. Inc., as general partner for and on behalf of 1832 AssetManagement L.P., in its capacity as Trustee of the TrustFunds.
The investment objectives for each of the Funds areprovided in the respective Fund’s “Fund Specific Notes”.The commencement date for each Fund is as follows:
Trust Funds Inception Date
Scotia Aria Conservative Build Portfolio November 19, 2014
Scotia Aria Conservative Core Portfolio November 19, 2014
Scotia Aria Conservative Pay Portfolio November 19, 2014
Scotia Aria Moderate Build Portfolio November 19, 2014
Scotia Aria Moderate Core Portfolio November 19, 2014
Scotia Aria Moderate Pay Portfolio November 19, 2014
Scotia Aria Progressive Build Portfolio November 19, 2014
Scotia Aria Progressive Core Portfolio November 19, 2014
Scotia Aria Progressive Pay Portfolio November 19, 2014
Scotia Balanced Opportunities Fund February 20, 1961
Scotia Bond Fund August 17, 2009
Scotia Canadian Balanced Fund May 7, 1990
Scotia Canadian Blue Chip Fund December 31, 1986
Scotia Canadian Bond Index Fund September 20, 1999
Scotia Canadian Dividend Fund October 28, 1992
Scotia Canadian Growth Fund February 20, 1961
Scotia Canadian Income Fund November 1, 1957
Scotia Canadian Index Fund December 13, 1996
Scotia Canadian Small Cap Fund October 28, 1992
Scotia CanAm Index Fund July 9, 1993
Scotia Conservative Income Fund January 27, 2014
Scotia Diversified Monthly Income Fund June 10, 2005
Scotia Dividend Balanced Fund August 26, 2010
Scotia European Fund September 3, 1996
Scotia Floating Rate Income Fund January 27, 2014
Scotia Global Balanced Fund August 26, 2010
Scotia Global Bond Fund July 4, 1994
Scotia Global Dividend Fund August 26, 2010
Scotia Global Growth Fund February 20, 1961
Scotia Global Opportunities Fund November 30, 2000
Scotia Global Small Cap Fund November 30, 2000
Scotia Income Advantage Fund July 6, 2011
Scotia INNOVA Balanced Growth Portfolio January 13, 2009
Scotia INNOVA Balanced Income Portfolio January 13, 2009
Scotia INNOVA Growth Portfolio January 13, 2009
Scotia INNOVA Income Portfolio January 13, 2009
Scotia INNOVA Maximum Growth Portfolio January 13, 2009
Scotia International Index Fund September 20, 1999
Scotia International Value Fund November 30, 2000
Scotia Latin American Fund August 18, 1994
Scotia Money Market Fund August 30, 1990
Scotia Mortgage Income Fund September 22, 1992
Scotia Nasdaq Index Fund November 30, 2000
Scotia Pacific Rim Fund August 18, 1994
Scotia Partners Balanced Growth Portfolio November 29, 2002
Scotia Partners Balanced Income Portfolio November 29, 2002
450
Trust Funds Inception Date
Scotia Partners Growth Portfolio November 29, 2002
Scotia Partners Income Portfolio August 26, 2010
Scotia Partners Maximum Growth Portfolio November 29, 2002
Scotia Premium T-Bill Fund July 10, 1992
Scotia Private Canadian Corporate Bond Pool October 30, 2003
Scotia Private Canadian Equity Pool June 10, 2005
Scotia Private Canadian Preferred Share Pool November 25, 2011
Scotia Private International Core Equity Pool June 10, 2005
Scotia Private North American Dividend Pool June 10, 2005
Scotia Private Options Income Pool June 1, 2015
Scotia Private Real Estate Income Pool November 20, 2012
Scotia Private Short-Mid Government Bond Pool September 30, 2007
Scotia Private U.S. Dividend Pool November 25, 2011
Scotia Private U.S. Equity Pool June 10, 2005
Scotia Resource Fund July 6, 1993
Scotia Selected Balanced Growth Portfolio April 22, 2003
Scotia Selected Balanced Income Portfolio April 22, 2003
Scotia Selected Growth Portfolio April 22, 2003
Scotia Selected Income Portfolio November 20, 2012
Scotia Selected Maximum Growth Portfolio April 22, 2003
Scotia Short Term Bond Fund August 26, 2010
Scotia T-Bill Fund October 3, 1991
Scotia U.S. $ Balanced Fund July 6, 2011
Scotia U.S. $ Bond Fund November 27, 1991
Scotia U.S. $ Money Market Fund September 3, 1996
Scotia U.S. Blue Chip Fund December 31, 1986
Scotia U.S. Dividend Fund November 20, 2012
Scotia U.S. Index Fund December 13, 1996
Scotia U.S. Opportunities Fund November 30, 2000
Corporate Class
Scotia Canadian Corporate Bond Capital Yield Class May 18, 2012
Scotia Canadian Dividend Class May 18, 2012
Scotia Canadian Equity Blend Class November 19, 2012
Scotia Conservative Government Bond Capital Yield Class May 18, 2012
Scotia Fixed Income Blend Class November 19, 2012
Scotia Global Dividend Class May 18, 2012
Scotia INNOVA Balanced Growth Portfolio Class May 18, 2012
Scotia INNOVA Balanced Income Portfolio Class May 18, 2012
Scotia INNOVA Growth Portfolio Class May 18, 2012
Scotia INNOVA Income Portfolio Class May 18, 2012
Scotia INNOVA Maximum Growth Portfolio Class May 18, 2012
Scotia International Equity Blend Class November 19, 2012
Scotia Private Canadian Equity Class May 18, 2012
Scotia Private U.S. Dividend Class May 18, 2012
Scotia Private U.S. Equity Class May 18, 2012
Scotia Short Term Yield Class May 18, 2012
Scotia U.S. Equity Blend Class November 19, 2012
The Funds may offer an unlimited number of units of someor all of the following series: Series A, Advisor Series,Premium Series, Premium T Series, Premium TL Series,Premium TH Series, Series D, Series F, Series I, Series M,Series T, Series TL and Series TH.
Each series of units of a Fund is intended for differentinvestors. A description of each series of units is providedbelow:
Series A: Series A units are available to all investors. Series A units of any Scotia
Aria Portfolios may only be purchased by investors who meet the
required minimum, as determined by the Manager from time to time.
Advisor Series: Advisor Series units are available through authorized dealers and
brokers.
Series D: Series D units are generally only available to investors who have
accounts with discount brokers.
Series F: Series F units are available for purchase into a fee-based account with
authorized brokers or dealers.
Series I: Series I units may only be purchased by eligible institutional investors
and other qualified investors as determined by the Manager.
Series M: Series M units may only be purchased by clients of the Manager or
Scotiatrust that have entered into a discretionary management
agreement.
Series T, Series TL
and Series TH:
Series T units, Series TL and Series TH units are intended for investors
seeking stable monthly distributions. Series T units are available to all
investors whereas Series TL and Series TH of any Scotia Aria Portfolios
may only be purchased by investors who meet the required minimum,
as determined by the Manager from time to time.
Premium Series: Premium Series units may only be purchased by eligible institutional
investors and other qualified investors as determined by the Manager.
Premium T Series,
Premium TL Series
and Premium TH
Series:
Premium T, Premium TL and Premium TH Series units are intended for
investors seeking stable monthly distributions. Premium T Series,
Premium TL Series and Premium TH Series of Scotia Aria Portfolios may
only be purchased by investors who meet the required minimum, as
determined by the Manager from time to time.
2. Summary of Significant Accounting Policies
The significant accounting policies applied in thepreparation of these financial statements are set out below.These policies have been consistently applied to all theperiods presented, unless otherwise stated.
I. Basis of preparation
These interim financial statements have been preparedin compliance with International Financial ReportingStandards (“IFRS”) applicable to the preparation ofinterim financial statements, including InternationalAccounting Standards (“IAS”) 34, “Interim FinancialReporting.
The preparation of these financial statements inaccordance with IFRS requires the use of judgment inapplying its accounting policies and to make estimatesand assumptions concerning the future. Significantaccounting judgements and estimates made by theManagement are disclosed in Note 3.
II. Financial instruments
Classification
The Fund classifies all its investments includingderivatives as financial assets or financial liabilities atfair value through profit and loss (FVTPL). Thiscategory has two sub categories: financial assets and
451
financial liabilities are either held for trading ordesignated at fair value through profit or loss atinception.
Financial assets or financial liabilities held for tradingare those acquired principally for the purpose of sellingor repurchasing in the near future or on initialrecognition as part of an identical portfolio of financialinstruments that are managed together for which thereis evidence of actual short-term profit taking.Derivatives and any short positions are also included inthis category.
Financial assets and financial liabilities designated atfair value through profit or loss at inception are thosethat are managed and their performance evaluated ona fair value basis in accordance with the respectiveFunds’ investment strategy as documented in theSimplified Prospectus.
The Funds’ obligations for net assets attributable toholders of redeemable units are presented at theredemption amount.
Non-financial assets such as Gold bullion held asinvestments in certain Funds are treated identically tofinancial assets designated at FVTPL in these financialstatements.
Recognition and measurement
Regular purchases and sales of investments arerecognized on the date on which the Fund commits topurchase or sell its investments at fair value.Transaction costs are expensed as incurred in theStatements of Comprehensive Income. Subsequent toinitial recognition, financial assets and liabilities atFVTPL are measured at fair value as presented below.Gains and losses arising from changes in their fair valueare included in the Statements of ComprehensiveIncome for the periods in which they arise.
III. Fair value measurement and hierarchy of financialinstruments
Fair value of a financial instrument is the price thatwould be received to sell an asset or paid to transfer aliability in an orderly transaction between marketparticipants at the measurement date (i.e. an exitprice). The fair value of financial assets and liabilitiestraded in active markets (such as publicly tradedderivatives and marketable securities) are based onquoted market prices at the close of trading on thereporting date. The Funds use the last traded marketprice for both financial assets and financial liabilitieswhere the last traded price falls within that day’s bid-ask spread. In circumstances where the last traded
price is not within the bid-ask spread, the Managerdetermines the point within the bid-ask spread that ismost representative of fair value based on the specificfacts and circumstances.
The fair value of financial assets and liabilities that arenot traded in an active market, including over the-counter derivatives, is determined using valuationtechniques. The Funds use a variety of methods andmake assumptions that are based on market conditionsexisting at each reporting date. Valuation techniquesinclude the use of comparable recent arm’s lengthtransactions, reference to other instruments that aresubstantially the same, discounted cash flow analysis,option pricing models and others commonly used bymarket participants and which make the maximum useof observable inputs.
IFRS 13, Fair value measurement, requires the useand disclosure of a fair value hierarchy that categorisesinto three levels the inputs to valuation techniquesused to measure fair value of financial instruments.The fair value hierarchy gives the highest priority toquoted prices (unadjusted) in active markets and thelowest priority to unobservable inputs. The three levelhierarchy based on inputs levels are defined as follows:
• Level 1: Fair value is based on unadjusted quotedprices in active markets for identical assets orliabilities;
• Level 2: Fair value is based on inputs other thanunadjusted quoted prices included in Level 1 thatare observable for the assets or liabilities, eitherdirectly or indirectly.
• Level 3: Fair value is based on at least one significantnon-observable input that is not supported bymarket data for the financial assets or liabilities.
Changes in valuation methodology may results in transfer inand out of a level. The Funds’ policy is to recognize thesetransfers as of the date of the event or circumstance givingrise to the transfer. The three level fair value hierarchy,transfers between levels and a reconciliation of level 3financial instruments are disclosed in the respective Fund’s“Fund Specific Notes”.
The Manager is responsible for performing the fair valuemeasurements included in the financial statements of theFunds, including level 3 measurements. The Managerobtains pricing from a third party pricing vendor, which ismonitored and reviewed by the valuation team daily. Ateach financial reporting date, the Manager reviews andapproves all level 3 fair value measurements. The Fundsalso have a Valuation Committee which includes the ChiefFinancial Officer, members of the finance team, as well as
452

members of the investment council and compliance teams.The committee meets quarterly to perform detailed reviewsof the valuations of investments held by the Funds.
Financial instruments are valued at their fair value assummarized below:
(i) North American equities are valued at the closingmarket price recorded by the security exchangeon which the security is principally traded. Non-North American equities are valued at fair valuebased on information provided by anindependent pricing source.
(ii) Fixed income securities, including bonds andmortgage-backed securities, are valued usingquotations received from independent pricingsources.
(iii) Short-term debt instruments are carried atamortized cost, which approximates fair value.
(iv) Investments in underlying funds are valuedbased on the Net Asset Value per unit providedby the Underlying Fund’s manager at the end ofeach valuation date.
(v) Unlisted warrants are valued using the Black-Scholes option valuation model. The modelfactors in the time value of money and thevolatility inputs significant to such valuation.
(vi) Mortgages held by Scotia Mortgage Income Fundare valued at their fair value using the prevailingrate of return on new mortgages of similar typeand term.
(vii) Commodities held in Funds are valued based onthe quoted price provided by independentpricing source.
(viii) Options contracts are valued at their mid-price asreported by the principal exchange or the over-the-counter market on which the contract istraded.
(ix) Futures contracts are valued at their close priceson each valuation date.
(x) Open forward currency contracts are valued atthe gain or loss that would arise as a result ofclosing the position on the valuation date.
(xi) Swap contracts are valued at the amount that theFund would receive or pay to terminate theswap, based on the current value of theunderlying interest on the valuation date.
(xii) Accumulator contracts are valued at the amountthat the Fund would receive or pay to terminatethe accumulator contract as reported by theover-the-counter market on which the contract istraded.
IV. Net Assets versus Net Asset Value
The Funds’ accounting policies for measuring the fairvalue of their investments and derivatives are identicalto those used in measuring their net asset value fortransactions with unitholders in accordance with Part14 of National Instrument 81-106 Investment Funds forContinuous Disclosure (“NI 81-106”), except wherethe last traded market price for financial assets andliabilities are not within the bid-ask spread asdescribed above. A comparison of the net assets perunit in accordance to IFRS (“Net Assets per unit”) andthe net assets per unit calculated in accordance to NI81-106 (“Net Asset Value per unit”) are presented inthe “Fund Specific Notes” for each Fund.
V. Income recognition
Gains and losses arising from changes in fair value offinancial instruments, other than derivatives, areshown in the Statements of Comprehensive Income as“Change in unrealized gain (loss) on non-derivativefinancial assets” and as “Net realized gain (loss) onnon-derivative financial assets” when the positions areclosed out.
The premium received or paid on options purchased orwritten are included in the cost of the options. Anydifference resulting from revaluation at the reportingdate is treated as “Change in unrealized gain (loss) onnon-derivative financial assets.”
Gains and losses arising from changes in fair value ofspots, forwards, futures, swaps and accumulatorcontracts are shown in the Statements ofComprehensive Income as “Change in unrealized gain(loss)” of the respective derivative contract and in theStatements of Financial Position as “Unrealized Gain”or “Unrealized Loss” of the derivative contract until thecontracts are closed out or expire. Once the contractsare closed out or expired, the resulting realized gainsand losses, of forwards, futures, and swaps contractsare shown in the Statements of Comprehensive Incomeas “Net Realized gain (loss)” of the respectivederivative contract.
Dividend income and distributions from underlyingfunds are recognized on the ex-dividend date.Distributions received from income trusts arerecognized based on the nature of the underlyingcomponents such as dividend income, interest income,capital gains, and return of capital by applying previousyear characterizations reported by the trust as currentyear characterizations are not available until thefollowing year.
453
Interest for distribution purposes represents thecoupon interest received by the Fund, recognized onan accrual basis. The Fund does not amortizepremiums paid or discounts received on the purchaseof fixed income securities except for zero couponbonds which are amortized on a straight line basis.Realized gain or loss on the sale of short-term debtinstruments are recorded as an adjustment to interestincome.
For the Scotia Mortgage Income Fund, amortizedguarantee fees are included in “Interest for distributionpurposes” as well.
VI. Functional and presentation currency and foreignexchange translation
The functional and presentation currency of the Fundsis the Canadian dollar, except for Funds offered in U.S.dollars, where applicable. Canadian dollars is thecurrency of primary economic environment in whichthe Funds operate or where mixed indicators exist inthe primary environment, the Canadian dollar is thecurrency in which they raise capital, except for selectFunds offered in U.S. dollars. Any other currency otherthan functional currency represents foreign currencyto the Funds. Amounts denominated in foreigncurrencies are converted into the functional currencyas follows:
(i) Fair value of investments, derivative contractsand monetary and non-monetary assets andliabilities at the rates of exchange prevailing as atthe valuation date; and
(ii) Purchase or sale of investments and investmentincome at the rates of exchange prevailing on therespective dates of such transactions, whilepurchase or sale of monetary assets at the spotrate agreed upon with the counterparty.
Realized and unrealized gain (loss) incurred in theFunds from monetary assets and liabilities are shownin the Statements of Comprehensive Income as “Netrealized and change in unrealized gain on foreignexchange of cash” while all other sources of foreignexchange gains and losses shown in “Net realized andchange in unrealized gain (loss) on foreign exchange”.
VII. Investments in unconsolidated structured entities
Certain Funds invest in mutual funds and/or exchange-traded funds managed by the Manager or by thirdparty investment managers. The relevant Fundsconsider all investments in such funds (“UnderlyingFunds”) to be investments in unconsolidatedstructured entities based on the fact that the decisionsmade by these Underlying Funds are not governed by
voting rights or any other similar rights held by theFunds. Consequently, the Funds, as InvestmentEntities accounts for these unconsolidated structuredentities at fair value.
The Underlying Funds’ objectives assist the Funds inachieving their primary objectives and whoseinvestment strategies do not include the use ofleverage. The Underlying Funds finance theiroperations by issuing redeemable units or shares whichare puttable at the holder’s option, and entitle theholder to a proportional stake in the respective fund’snet assets. The Funds hold redeemable shares or unitsin each of their Underlying Funds. These investmentsare included in “Non-derivative financial assets” in theStatements of Financial Position. The change in fairvalue of each Underlying Fund is included in theStatements of Comprehensive Income in ‘Change inunrealized gain (loss) of non-derivative financialassets’. The exposure to investments in UnderlyingFunds at fair value is disclosed in the Fund’s “FundSpecific Notes”. The Funds’ maximum exposure to lossfrom their interests in Underlying Funds is equal to thetotal carrying value of its investments in UnderlyingFunds.
Mortgage-backed securities or asset-backed securitiesare also considered to be unconsolidated structuredentities. Mortgage-backed securities are formed bypooling various types of mortgages while asset-backedsecurities are formed by pooling assets such as autoloans, credit card receivables or student loans. Aninterest or claim to this future cash flow (interest andprincipal) is then sold in the form of debt or equitysecurities, which could be held by the Funds. Asunconsolidated structured entities, the Funds accountfor these investments at fair value as well. As atJune 30, 2015 and December 31, 2014, the maximumexposure to these securities was less than 5% of thenet assets of the respective Funds.
VIII. Redeemable Units Issued by the Funds
The Funds’ outstanding redeemable units qualify as“puttable instruments” as required by InternationalAccounting Standard 32: Financial Instruments:Presentation (“IAS 32”) which states that units orshares of an entity that include a contractual obligationfor the issuer to repurchase or redeem them for cashor another financial asset should be classified asfinancial liability.
In accordance with IAS 32, the Funds’ redeemableunits’ entitlements include a contraction obligation todistribute any net income and net realized capital gainsat least annually in cash (at the request of the
454
unitholder) and therefore meet the contractualobligation requirement.
In addition, certain Funds issue different Series ofunits that are equally subordinated but have differentfeatures as outlined in these notes. These featuresviolate criteria that are required in order for theredeemable units to be presented as equity underIAS 32. Consequently, the Funds’ outstandingredeemable units are classified as financial liabilities inthese financial statements.
IX. Offsetting of financial instruments
Financial assets and liabilities are offset and the netamount is presented in the Statements of FinancialPosition only if there is a legal right to offset theamounts and there is an intention either to settle on anet basis or to realize the asset and settle the liabilitysimultaneously. Income and expenses are presented ona net basis only when permitted under IFRS, for gainsand losses arising from a group of similar transactions,such as gains and losses from financial instruments atfair value through profit or loss. Financial assets andliabilities that are subject to master netting orcomparable agreements and the related potentialeffect of offsetting are disclosed in the respectiveFund’s “Fund Specific Notes”.
X. Other financial assets and liabilities
Other financial assets and liabilities other thaninvestment securities are valued at cost or amortizedcost. These balances are short-term in nature;therefore, their carrying values approximate fair values.
XI. Increase (decrease) in net assets attributable toholders of redeemable units per unit
“Increase (decrease) in net assets attributable toholders of redeemable units per unit” is disclosed inthe Statements of Comprehensive Income andrepresents, for each Series of units, the increase ordecrease in net assets attributable to holders ofredeemable units from operations for the periodattributable to each Series divided by the weightedaverage number of units outstanding for thecorresponding Series during the period.
XII. Accounting standards issued but not yet effective
The final version of IFRS 9, Financial Instruments, wasissued by the IASB in July 2014 and will replace IAS 39Financial Instruments: Recognition and Measurement.IFRS 9 introduces a model for classification andmeasurement, a single, forward-looking ‘expected loss’impairment model and a substantially reformedapproach to hedge accounting. The new single,
principle based approach for determining theclassification of financial assets is driven by cash flowcharacteristics and the business model in which anasset is held. The new model also results in a singleimpairment model being applied to all financialinstruments, which will require more timelyrecognition of expected credit losses. It also includeschanges in respect of own credit risk in measuringliabilities elected to be measured at fair value, so thatgains caused by the deterioration of an entity’s owncredit risk on such liabilities are no longer recognizedin profit or loss. IFRS 9 is effective for annual periodsbeginning on or after January 1, 2018, however isavailable for early adoption. In addition, the own creditchanges can be early applied in isolation withoutotherwise changing the accounting for financialinstruments. The Funds are in the process of assessingthe impact of IFRS 9 and have not yet determinedwhen they will adopt the new standard.
3. Significant accounting judgments and estimates
The preparation of financial statements requiresmanagement to use judgment in applying its accountingpolicies and to make estimates and assumptions about thefuture. These estimates are made based on informationavailable as at the date of issuance of the financialstatements. Actual results could materially differ fromthose estimates. The following discusses the mostsignificant accounting judgments and estimates that theFunds have made in preparing the financial statements:
Investment Entities
In accordance with IFRS 10: Consolidated Financial
Statements, the Manager has determined that the Fundsmeet the definition of an Investment Entity which requiresthat the Funds obtain funds from one or more investors forthe purpose of providing investment management services,commits to its investors that its business purpose is toinvest funds solely for returns from capital appreciation,investment income, or both; and measures and evaluatesthe performance of its investments on a fair value basis.Consequently, the Funds do not consolidate theirinvestment in underlying funds, but instead measure theseat FVTPL, as required by the accounting standard.
Classification and measurement of investments andapplication of the fair value option
In classifying and measuring financial instruments held bythe Funds, the Manager is required to make significantjudgments about whether or not the business of the Fundsis to invest on a total return basis for the purpose ofapplying the fair value option for financial assets underIAS 39: “Financial Instruments – Recognition and
455
Measurement”. The most significant judgments madeinclude the determination that certain financial instrumentsare held-for-trading and that the fair value option can beapplied to those which are not.
Fair value measurement of derivatives and securities notquoted in an active market
Key areas of estimation, where the Manager has madecomplex or subjective judgments, include thedetermination of fair values of financial instruments andderivatives that are not quoted in an active market. The useof valuation techniques for financial instruments andderivatives that are not quoted in an active market requiresthe Manager to make assumptions that are based on marketconditions existing as at the date of the financialstatements. Changes in these assumptions as a result ofchanges in market conditions could affect the reported fairvalue of financial instruments and derivatives.
4. Discussion of Financial Instrument Risk
Each Fund’s investment activities expose it to a variety offinancial risks: market risk (including interest rate risk,currency risk, and other price risk), credit risk and liquidityrisk. Each Fund’s investment practices include portfoliomonitoring to ensure compliance with stated investmentguidelines. The Manager seeks to minimize potentialadverse effects of risks on each Fund’s performance byemploying and overseeing professional and experiencedportfolio advisors that regularly monitor each Fund’ssecurities and financial market developments. The risks aremeasured using a method that reflects the expected impacton the results and net assets attributable to unitholders ofthe Funds from reasonably possible changes in the relevantrisk variables.
The Manager maintains a risk management practice thatincludes monitoring compliance with investmentrestrictions to ensure that the Funds are being managed inaccordance with the Funds’ stated investment objectives,strategies and securities regulations.
Some Funds invest in underlying funds. These Funds areindirectly exposed to market risk, credit risk, and liquidityrisk in the event that the underlying funds invest infinancial instruments that are subject to those risks.
A Fund’s exposure to market risk, credit risk and liquidityrisk, where applicable, is disclosed in the respective Fund’s“Fund Specific Notes”.
(a) Market risk
(i) Interest rate risk
Interest rate risk arises from the possibility that changes ininterest rates will affect the future cash flows or the fair
values of interest-bearing financial instruments. Each Fund’sexposure to interest rate risk is concentrated in itsinvestments in debt securities (such as bonds anddebentures) and interest rate derivative instruments, if any.Short-term investments and other assets and liabilities areshort-term in nature and/or non-interest bearing and are notsubject to a significant amount of interest rate risk due tofluctuations in the prevailing levels of market interest rates.
(ii) Currency risk
The Funds may invest in monetary and non-monetaryassets denominated in currencies other than theirfunctional currency. Currency risk is the risk that the valueof foreign investments will fluctuate due to changes in theforeign exchange rates of those currencies in relation to theFund’s functional currency. Other financial assets(including dividends and interest receivable and receivablefor investments sold) and financial liabilities that aredenominated in foreign currencies do not expose the Fundsto significant currency risk. Funds may enter into foreignexchange forward contracts or currency futures contractsfor hedging purposes to reduce their foreign currency riskexposure.
(iii) Price risk
Price risk is the risk that the fair value of a Fund’s financialinstruments will fluctuate as a result of changes in marketprices (other than those arising from interest rate risk orcurrency risk) caused by factors specific to a security, itsissuer or all factors affecting a market or a market segment.Exposure to other price risk is mainly in equities,derivatives and commodities. The maximum risk resultingfrom these financial instruments is equivalent to their fairvalue, except for written options, short sales and futurescontracts sold, where possible losses can be unlimited.
(b) Credit risk
Credit risk is the risk that the counterparty to a financialinstrument will fail to discharge an obligation orcommitment that it has entered into with the Funds. AFund’s investment in debt instruments represents the mainconcentration of credit risk. The fair value of debtinstruments includes consideration of the creditworthinessof the issuer, and accordingly, represents the maximumcredit risk exposure to the Funds. Credit risk may also existin relation to counterparties to derivatives. All thetransactions in listed securities are settled or paid upondelivery using approved brokers. The risk of default withthe counterparty is considered minimal, as delivery ofsecurities sold is only made once the broker has receivedpayment. Payment is only made on a purchase once thesecurities have been received by the broker.
456
Custody and derivative transactions are carried out bycounterparties that have a Standard & Poor’s credit ratingof A or higher. In instances where the credit rating were tofall below the approved rating, the Manager would takeappropriate action.
The Funds can also be exposed to credit risk to the extentthat the Funds’ custodian may not be able to settle tradesfor cash. Canadian securities regulations require that theFunds employ a custodian that meets certain capitalrequirements. These regulations state that, among otherthings, a fund’s custodian be either a bank listed inSchedule I, II, or III of the Bank Act (Canada), or acompany incorporated in Canada affiliated with a bank withshareholders’ equity of not less than $10,000,000. The Bankof Nova Scotia and State Street Trust Company Canadameet all Canadian Securities Administrators’ requirementsto act as custodians for the Funds.
A Fund may enter into securities lending transactions withcounterparties whereby the Fund temporarily exchangessecurities for collateral with a commitment by thecounterparty to deliver the same securities on a futuredate. Credit risk associated with these transactions isconsidered minimal as all counterparties have approvedcredit rating and the market value of cash or securities heldas collateral must be at least 104% of the fair value of thesecurities loaned as at the end of each trading day.
(c) Liquidity risk
The Funds’ exposure to liquidity risk arises primarily fromthe daily cash redemption of units. The Funds primarilyinvest in securities that are traded in active markets andcan be readily disposed of. In addition, each Fund aims toretain sufficient cash and cash equivalent positions tomaintain liquidity. The Funds may, from time to time, enterinto over-the-counter derivative contracts or invest insecurities that are not traded in an active market and maybe illiquid. Illiquid securities are identified in the respectiveFund’s Schedule of Investment Portfolio.
(d) Concentration risk
Concentrations of risk arise from financial instruments thathave similar characteristics and are affected similarly by
changes in economic or other conditions. The identificationand disclosure of risks concentration is provided in therespective Fund’s “Fund Specific Notes”.
5. Management Fees
The Funds pay the Manager a management fee inconsideration for all making decision relating to the Funds.This includes making or arranging for investment advice,portfolio management services, fund administrationservices, distribution of the Funds, and any other day-to-day operational needs for the Funds.
The management fee for Series A, Series D, Series F, SeriesM, Series, T, Series TH, Series, TL, Advisor Series, PremiumSeries, Premium T Series, Premium TL Series and PremiumTH Series is an annualized rate based on the net asset valueof each series of the Funds. The management fee for SeriesI, are negotiated and paid directly by these unitholders andnot by the Funds. The Funds’ management fees arecalculated daily and payable monthly on the first businessday of the following calendar month
Scotia Premium T-Bill Fund pays a rebate, called amanagement fee distribution, of 0.20% when the value ofthe Fund held within an investor’s account is $250,000 to$1,000,000. It pays a management fee distribution of 0.35%when the value of the Fund held within an account isgreater than $1,000,000.
As the money market yields have remained low during theperiod, the Manager has opted to temporarily waive aportion of the management fees for Scotia T-Bill Fund,Scotia Premium T-Bill Fund, Scotia Money Market Fundand Scotia U.S. $ Money Market Fund that otherwise wouldhave been charged. Waived fees are included in absorbedexpenses. The Manager may discontinue waiving fees andexpenses at any time, without notice.
There is no duplication of management fees, sales chargesor redemption fees between the Funds and the UnderlyingFunds held directly by them. The Manager is entitled to amaximum annual management fee, exclusive of sales taxes,as follows:
% of Net Asset Value
Trust Funds Series AAdvisor
Series Series D Series F Series M Series T Series TL Series THPremium
SeriesPremiumT Series
PremiumTL Series
PremiumTH Series
Scotia Aria Conservative Build Portfolio 1.50 – – – – – – – 1.40 – – –Scotia Aria Conservative Core Portfolio 1.50 – – – – 1.50 1.50 1.50 1.40 1.40 1.40 1.40Scotia Aria Conservative Pay Portfolio 1.50 – – – – 1.50 1.50 1.50 1.40 1.40 1.40 1.40Scotia Aria Moderate Build Portfolio 1.60 – – – – – – – 1.50 – – –Scotia Aria Moderate Core Portfolio 1.60 – – – – 1.60 1.60 1.60 1.50 1.50 1.50 1.50Scotia Aria Moderate Pay Portfolio 1.60 – – – – 1.60 1.60 1.60 1.50 1.50 1.50 1.50Scotia Aria Progressive Build Portfolio 1.70 – – – – – – – 1.60 – – –Scotia Aria Progressive Core Portfolio 1.70 – – – – 1.70 1.70 1.70 1.60 1.60 1.60 1.60Scotia Aria Progressive Pay Portfolio 1.70 – – – – 1.70 1.70 1.70 1.60 1.60 1.60 1.60Scotia Balanced Opportunities Fund 1.75 1.95 1.25 0.88 – – – – – – – –Scotia Bond Fund 1.10 – – – – – – – – – – –
457
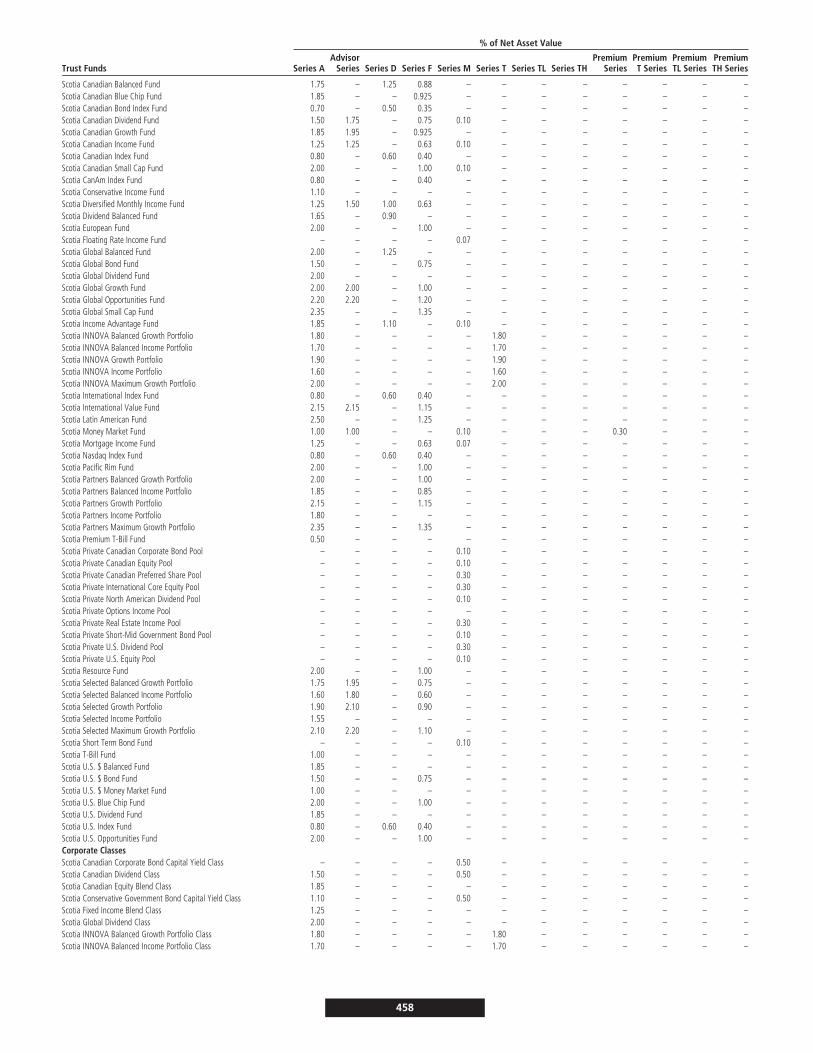
% of Net Asset Value
Trust Funds Series AAdvisor
Series Series D Series F Series M Series T Series TL Series THPremium
SeriesPremiumT Series
PremiumTL Series
PremiumTH Series
Scotia Canadian Balanced Fund 1.75 – 1.25 0.88 – – – – – – – –Scotia Canadian Blue Chip Fund 1.85 – – 0.925 – – – – – – – –Scotia Canadian Bond Index Fund 0.70 – 0.50 0.35 – – – – – – – –Scotia Canadian Dividend Fund 1.50 1.75 – 0.75 0.10 – – – – – – –Scotia Canadian Growth Fund 1.85 1.95 – 0.925 – – – – – – – –Scotia Canadian Income Fund 1.25 1.25 – 0.63 0.10 – – – – – – –Scotia Canadian Index Fund 0.80 – 0.60 0.40 – – – – – – – –Scotia Canadian Small Cap Fund 2.00 – – 1.00 0.10 – – – – – – –Scotia CanAm Index Fund 0.80 – – 0.40 – – – – – – – –Scotia Conservative Income Fund 1.10 – – – – – – – – – – –Scotia Diversified Monthly Income Fund 1.25 1.50 1.00 0.63 – – – – – – – –Scotia Dividend Balanced Fund 1.65 – 0.90 – – – – – – – – –Scotia European Fund 2.00 – – 1.00 – – – – – – – –Scotia Floating Rate Income Fund – – – – 0.07 – – – – – – –Scotia Global Balanced Fund 2.00 – 1.25 – – – – – – – – –Scotia Global Bond Fund 1.50 – – 0.75 – – – – – – – –Scotia Global Dividend Fund 2.00 – – – – – – – – – – –Scotia Global Growth Fund 2.00 2.00 – 1.00 – – – – – – – –Scotia Global Opportunities Fund 2.20 2.20 – 1.20 – – – – – – – –Scotia Global Small Cap Fund 2.35 – – 1.35 – – – – – – – –Scotia Income Advantage Fund 1.85 – 1.10 – 0.10 – – – – – – –Scotia INNOVA Balanced Growth Portfolio 1.80 – – – – 1.80 – – – – – –Scotia INNOVA Balanced Income Portfolio 1.70 – – – – 1.70 – – – – – –Scotia INNOVA Growth Portfolio 1.90 – – – – 1.90 – – – – – –Scotia INNOVA Income Portfolio 1.60 – – – – 1.60 – – – – – –Scotia INNOVA Maximum Growth Portfolio 2.00 – – – – 2.00 – – – – – –Scotia International Index Fund 0.80 – 0.60 0.40 – – – – – – – –Scotia International Value Fund 2.15 2.15 – 1.15 – – – – – – – –Scotia Latin American Fund 2.50 – – 1.25 – – – – – – – –Scotia Money Market Fund 1.00 1.00 – – 0.10 – – – 0.30 – – –Scotia Mortgage Income Fund 1.25 – – 0.63 0.07 – – – – – – –Scotia Nasdaq Index Fund 0.80 – 0.60 0.40 – – – – – – – –Scotia Pacific Rim Fund 2.00 – – 1.00 – – – – – – – –Scotia Partners Balanced Growth Portfolio 2.00 – – 1.00 – – – – – – – –Scotia Partners Balanced Income Portfolio 1.85 – – 0.85 – – – – – – – –Scotia Partners Growth Portfolio 2.15 – – 1.15 – – – – – – – –Scotia Partners Income Portfolio 1.80 – – – – – – – – – – –Scotia Partners Maximum Growth Portfolio 2.35 – – 1.35 – – – – – – – –Scotia Premium T-Bill Fund 0.50 – – – – – – – – – – –Scotia Private Canadian Corporate Bond Pool – – – – 0.10 – – – – – – –Scotia Private Canadian Equity Pool – – – – 0.10 – – – – – – –Scotia Private Canadian Preferred Share Pool – – – – 0.30 – – – – – – –Scotia Private International Core Equity Pool – – – – 0.30 – – – – – – –Scotia Private North American Dividend Pool – – – – 0.10 – – – – – – –Scotia Private Options Income Pool – – – – – – – – – – – –Scotia Private Real Estate Income Pool – – – – 0.30 – – – – – – –Scotia Private Short-Mid Government Bond Pool – – – – 0.10 – – – – – – –Scotia Private U.S. Dividend Pool – – – – 0.30 – – – – – – –Scotia Private U.S. Equity Pool – – – – 0.10 – – – – – – –Scotia Resource Fund 2.00 – – 1.00 – – – – – – – –Scotia Selected Balanced Growth Portfolio 1.75 1.95 – 0.75 – – – – – – – –Scotia Selected Balanced Income Portfolio 1.60 1.80 – 0.60 – – – – – – – –Scotia Selected Growth Portfolio 1.90 2.10 – 0.90 – – – – – – – –Scotia Selected Income Portfolio 1.55 – – – – – – – – – – –Scotia Selected Maximum Growth Portfolio 2.10 2.20 – 1.10 – – – – – – – –Scotia Short Term Bond Fund – – – – 0.10 – – – – – – –Scotia T-Bill Fund 1.00 – – – – – – – – – – –Scotia U.S. $ Balanced Fund 1.85 – – – – – – – – – – –Scotia U.S. $ Bond Fund 1.50 – – 0.75 – – – – – – – –Scotia U.S. $ Money Market Fund 1.00 – – – – – – – – – – –Scotia U.S. Blue Chip Fund 2.00 – – 1.00 – – – – – – – –Scotia U.S. Dividend Fund 1.85 – – – – – – – – – – –Scotia U.S. Index Fund 0.80 – 0.60 0.40 – – – – – – – –Scotia U.S. Opportunities Fund 2.00 – – 1.00 – – – – – – – –Corporate ClassesScotia Canadian Corporate Bond Capital Yield Class – – – – 0.50 – – – – – – –Scotia Canadian Dividend Class 1.50 – – – 0.50 – – – – – – –Scotia Canadian Equity Blend Class 1.85 – – – – – – – – – – –Scotia Conservative Government Bond Capital Yield Class 1.10 – – – 0.50 – – – – – – –Scotia Fixed Income Blend Class 1.25 – – – – – – – – – – –Scotia Global Dividend Class 2.00 – – – – – – – – – – –Scotia INNOVA Balanced Growth Portfolio Class 1.80 – – – – 1.80 – – – – – –Scotia INNOVA Balanced Income Portfolio Class 1.70 – – – – 1.70 – – – – – –
458
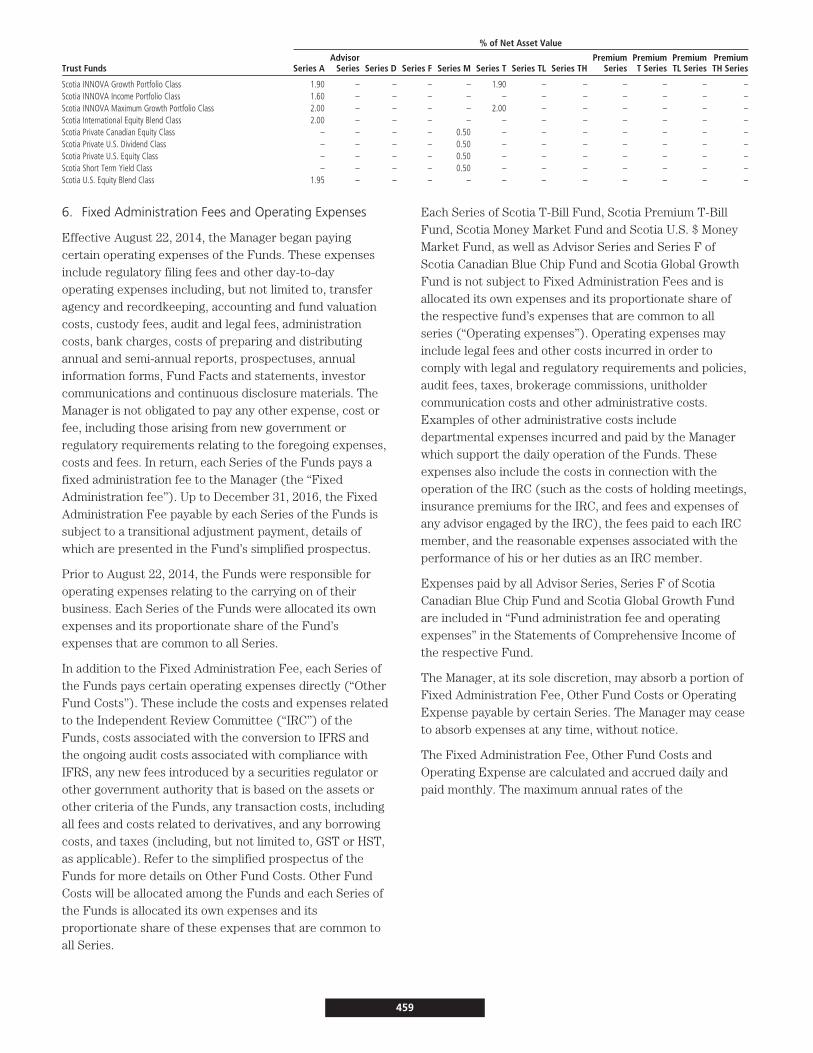
% of Net Asset Value
Trust Funds Series AAdvisor
Series Series D Series F Series M Series T Series TL Series THPremium
SeriesPremiumT Series
PremiumTL Series
PremiumTH Series
Scotia INNOVA Growth Portfolio Class 1.90 – – – – 1.90 – – – – – –Scotia INNOVA Income Portfolio Class 1.60 – – – – – – – – – – –Scotia INNOVA Maximum Growth Portfolio Class 2.00 – – – – 2.00 – – – – – –Scotia International Equity Blend Class 2.00 – – – – – – – – – – –Scotia Private Canadian Equity Class – – – – 0.50 – – – – – – –Scotia Private U.S. Dividend Class – – – – 0.50 – – – – – – –Scotia Private U.S. Equity Class – – – – 0.50 – – – – – – –Scotia Short Term Yield Class – – – – 0.50 – – – – – – –Scotia U.S. Equity Blend Class 1.95 – – – – – – – – – – –
6. Fixed Administration Fees and Operating Expenses
Effective August 22, 2014, the Manager began payingcertain operating expenses of the Funds. These expensesinclude regulatory filing fees and other day-to-dayoperating expenses including, but not limited to, transferagency and recordkeeping, accounting and fund valuationcosts, custody fees, audit and legal fees, administrationcosts, bank charges, costs of preparing and distributingannual and semi-annual reports, prospectuses, annualinformation forms, Fund Facts and statements, investorcommunications and continuous disclosure materials. TheManager is not obligated to pay any other expense, cost orfee, including those arising from new government orregulatory requirements relating to the foregoing expenses,costs and fees. In return, each Series of the Funds pays afixed administration fee to the Manager (the “FixedAdministration fee”). Up to December 31, 2016, the FixedAdministration Fee payable by each Series of the Funds issubject to a transitional adjustment payment, details ofwhich are presented in the Fund’s simplified prospectus.
Prior to August 22, 2014, the Funds were responsible foroperating expenses relating to the carrying on of theirbusiness. Each Series of the Funds were allocated its ownexpenses and its proportionate share of the Fund’sexpenses that are common to all Series.
In addition to the Fixed Administration Fee, each Series ofthe Funds pays certain operating expenses directly (“OtherFund Costs”). These include the costs and expenses relatedto the Independent Review Committee (“IRC”) of theFunds, costs associated with the conversion to IFRS andthe ongoing audit costs associated with compliance withIFRS, any new fees introduced by a securities regulator orother government authority that is based on the assets orother criteria of the Funds, any transaction costs, includingall fees and costs related to derivatives, and any borrowingcosts, and taxes (including, but not limited to, GST or HST,as applicable). Refer to the simplified prospectus of theFunds for more details on Other Fund Costs. Other FundCosts will be allocated among the Funds and each Series ofthe Funds is allocated its own expenses and itsproportionate share of these expenses that are common toall Series.
Each Series of Scotia T-Bill Fund, Scotia Premium T-BillFund, Scotia Money Market Fund and Scotia U.S. $ MoneyMarket Fund, as well as Advisor Series and Series F ofScotia Canadian Blue Chip Fund and Scotia Global GrowthFund is not subject to Fixed Administration Fees and isallocated its own expenses and its proportionate share ofthe respective fund’s expenses that are common to allseries (“Operating expenses”). Operating expenses mayinclude legal fees and other costs incurred in order tocomply with legal and regulatory requirements and policies,audit fees, taxes, brokerage commissions, unitholdercommunication costs and other administrative costs.Examples of other administrative costs includedepartmental expenses incurred and paid by the Managerwhich support the daily operation of the Funds. Theseexpenses also include the costs in connection with theoperation of the IRC (such as the costs of holding meetings,insurance premiums for the IRC, and fees and expenses ofany advisor engaged by the IRC), the fees paid to each IRCmember, and the reasonable expenses associated with theperformance of his or her duties as an IRC member.
Expenses paid by all Advisor Series, Series F of ScotiaCanadian Blue Chip Fund and Scotia Global Growth Fundare included in “Fund administration fee and operatingexpenses” in the Statements of Comprehensive Income ofthe respective Fund.
The Manager, at its sole discretion, may absorb a portion ofFixed Administration Fee, Other Fund Costs or OperatingExpense payable by certain Series. The Manager may ceaseto absorb expenses at any time, without notice.
The Fixed Administration Fee, Other Fund Costs andOperating Expense are calculated and accrued daily andpaid monthly. The maximum annual rates of the
459
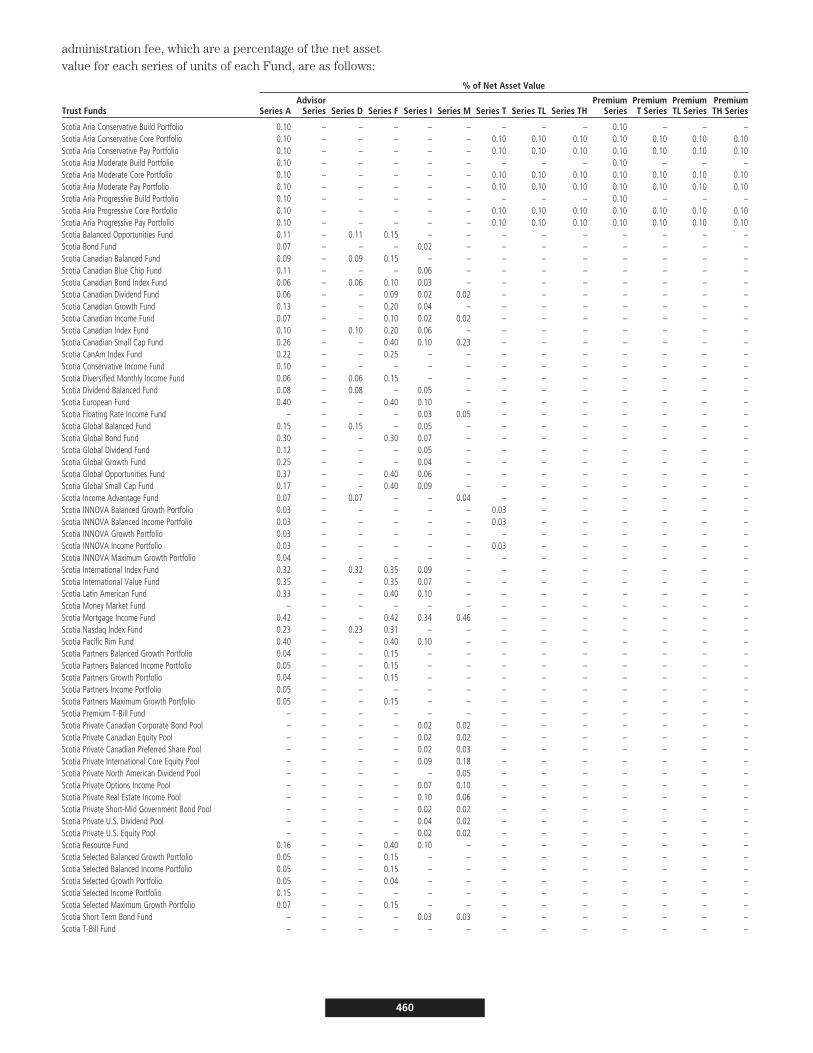
administration fee, which are a percentage of the net assetvalue for each series of units of each Fund, are as follows:
% of Net Asset Value
Trust Funds Series AAdvisor
Series Series D Series F Series I Series M Series T Series TL Series THPremium
SeriesPremiumT Series
PremiumTL Series
PremiumTH Series
Scotia Aria Conservative Build Portfolio 0.10 – – – – – – – – 0.10 – – –Scotia Aria Conservative Core Portfolio 0.10 – – – – – 0.10 0.10 0.10 0.10 0.10 0.10 0.10Scotia Aria Conservative Pay Portfolio 0.10 – – – – – 0.10 0.10 0.10 0.10 0.10 0.10 0.10Scotia Aria Moderate Build Portfolio 0.10 – – – – – – – – 0.10 – – –Scotia Aria Moderate Core Portfolio 0.10 – – – – – 0.10 0.10 0.10 0.10 0.10 0.10 0.10Scotia Aria Moderate Pay Portfolio 0.10 – – – – – 0.10 0.10 0.10 0.10 0.10 0.10 0.10Scotia Aria Progressive Build Portfolio 0.10 – – – – – – – – 0.10 – – –Scotia Aria Progressive Core Portfolio 0.10 – – – – – 0.10 0.10 0.10 0.10 0.10 0.10 0.10Scotia Aria Progressive Pay Portfolio 0.10 – – – – – 0.10 0.10 0.10 0.10 0.10 0.10 0.10Scotia Balanced Opportunities Fund 0.11 – 0.11 0.15 – – – – – – – – –Scotia Bond Fund 0.07 – – – 0.02 – – – – – – – –Scotia Canadian Balanced Fund 0.09 – 0.09 0.15 – – – – – – – – –Scotia Canadian Blue Chip Fund 0.11 – – – 0.06 – – – – – – – –Scotia Canadian Bond Index Fund 0.06 – 0.06 0.10 0.03 – – – – – – – –Scotia Canadian Dividend Fund 0.06 – – 0.09 0.02 0.02 – – – – – – –Scotia Canadian Growth Fund 0.13 – – 0.20 0.04 – – – – – – – –Scotia Canadian Income Fund 0.07 – – 0.10 0.02 0.02 – – – – – – –Scotia Canadian Index Fund 0.10 – 0.10 0.20 0.06 – – – – – – – –Scotia Canadian Small Cap Fund 0.26 – – 0.40 0.10 0.23 – – – – – – –Scotia CanAm Index Fund 0.22 – – 0.25 – – – – – – – – –Scotia Conservative Income Fund 0.10 – – – – – – – – – – – –Scotia Diversified Monthly Income Fund 0.06 – 0.06 0.15 – – – – – – – – –Scotia Dividend Balanced Fund 0.08 – 0.08 – 0.05 – – – – – – – –Scotia European Fund 0.40 – – 0.40 0.10 – – – – – – – –Scotia Floating Rate Income Fund – – – – 0.03 0.05 – – – – – – –Scotia Global Balanced Fund 0.15 – 0.15 – 0.05 – – – – – – – –Scotia Global Bond Fund 0.30 – – 0.30 0.07 – – – – – – – –Scotia Global Dividend Fund 0.12 – – – 0.05 – – – – – – – –Scotia Global Growth Fund 0.25 – – – 0.04 – – – – – – – –Scotia Global Opportunities Fund 0.37 – – 0.40 0.06 – – – – – – – –Scotia Global Small Cap Fund 0.17 – – 0.40 0.09 – – – – – – – –Scotia Income Advantage Fund 0.07 – 0.07 – – 0.04 – – – – – – –Scotia INNOVA Balanced Growth Portfolio 0.03 – – – – – 0.03 – – – – – –Scotia INNOVA Balanced Income Portfolio 0.03 – – – – – 0.03 – – – – – –Scotia INNOVA Growth Portfolio 0.03 – – – – – – – – – – – –Scotia INNOVA Income Portfolio 0.03 – – – – – 0.03 – – – – – –Scotia INNOVA Maximum Growth Portfolio 0.04 – – – – – – – – – – – –Scotia International Index Fund 0.32 – 0.32 0.35 0.09 – – – – – – – –Scotia International Value Fund 0.35 – – 0.35 0.07 – – – – – – – –Scotia Latin American Fund 0.33 – – 0.40 0.10 – – – – – – – –Scotia Money Market Fund – – – – – – – – – – – – –Scotia Mortgage Income Fund 0.42 – – 0.42 0.34 0.46 – – – – – – –Scotia Nasdaq Index Fund 0.23 – 0.23 0.31 – – – – – – – – –Scotia Pacific Rim Fund 0.40 – – 0.40 0.10 – – – – – – – –Scotia Partners Balanced Growth Portfolio 0.04 – – 0.15 – – – – – – – – –Scotia Partners Balanced Income Portfolio 0.05 – – 0.15 – – – – – – – – –Scotia Partners Growth Portfolio 0.04 – – 0.15 – – – – – – – – –Scotia Partners Income Portfolio 0.05 – – – – – – – – – – – –Scotia Partners Maximum Growth Portfolio 0.05 – – 0.15 – – – – – – – – –Scotia Premium T-Bill Fund – – – – – – – – – – – – –Scotia Private Canadian Corporate Bond Pool – – – – 0.02 0.02 – – – – – – –Scotia Private Canadian Equity Pool – – – – 0.02 0.02 – – – – – – –Scotia Private Canadian Preferred Share Pool – – – – 0.02 0.03 – – – – – – –Scotia Private International Core Equity Pool – – – – 0.09 0.18 – – – – – – –Scotia Private North American Dividend Pool – – – – – 0.05 – – – – – – –Scotia Private Options Income Pool – – – – 0.07 0.10 – – – – – – –Scotia Private Real Estate Income Pool – – – – 0.10 0.06 – – – – – – –Scotia Private Short-Mid Government Bond Pool – – – – 0.02 0.02 – – – – – – –Scotia Private U.S. Dividend Pool – – – – 0.04 0.02 – – – – – – –Scotia Private U.S. Equity Pool – – – – 0.02 0.02 – – – – – – –Scotia Resource Fund 0.16 – – 0.40 0.10 – – – – – – – –Scotia Selected Balanced Growth Portfolio 0.05 – – 0.15 – – – – – – – – –Scotia Selected Balanced Income Portfolio 0.05 – – 0.15 – – – – – – – – –Scotia Selected Growth Portfolio 0.05 – – 0.04 – – – – – – – – –Scotia Selected Income Portfolio 0.15 – – – – – – – – – – – –Scotia Selected Maximum Growth Portfolio 0.07 – – 0.15 – – – – – – – – –Scotia Short Term Bond Fund – – – – 0.03 0.03 – – – – – – –Scotia T-Bill Fund – – – – – – – – – – – – –
460
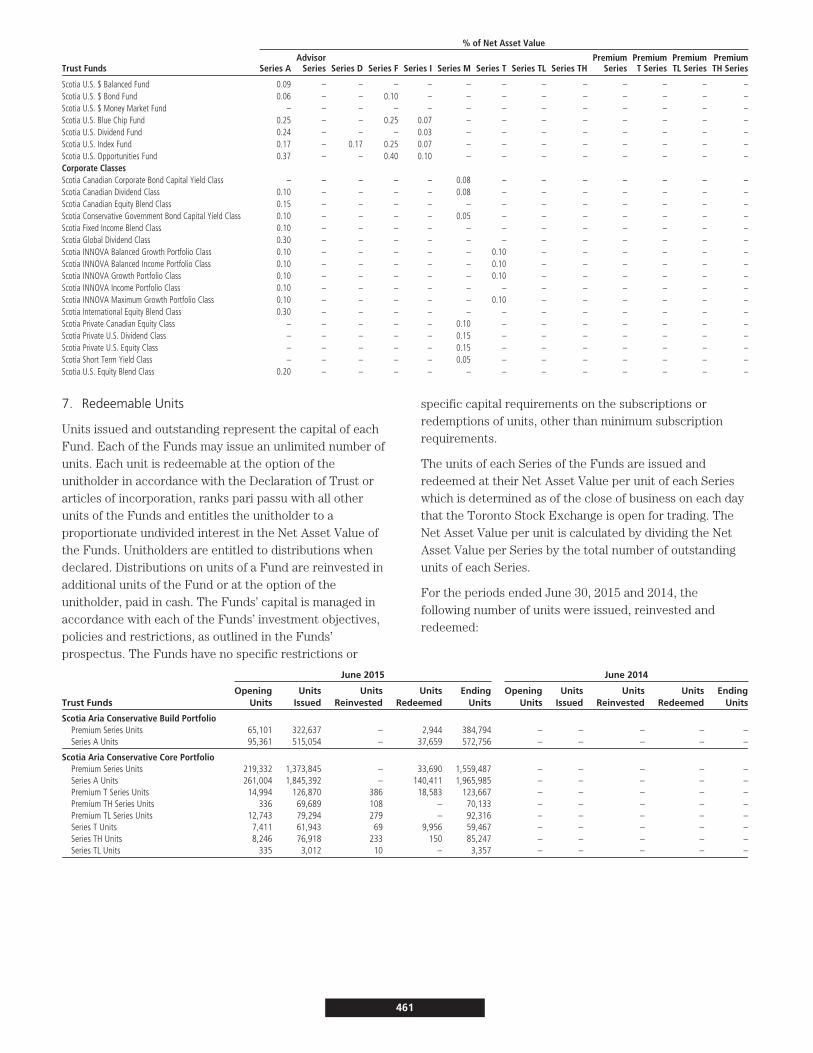
% of Net Asset Value
Trust Funds Series AAdvisor
Series Series D Series F Series I Series M Series T Series TL Series THPremium
SeriesPremiumT Series
PremiumTL Series
PremiumTH Series
Scotia U.S. $ Balanced Fund 0.09 – – – – – – – – – – – –Scotia U.S. $ Bond Fund 0.06 – – 0.10 – – – – – – – – –Scotia U.S. $ Money Market Fund – – – – – – – – – – – – –Scotia U.S. Blue Chip Fund 0.25 – – 0.25 0.07 – – – – – – – –Scotia U.S. Dividend Fund 0.24 – – – 0.03 – – – – – – – –Scotia U.S. Index Fund 0.17 – 0.17 0.25 0.07 – – – – – – – –Scotia U.S. Opportunities Fund 0.37 – – 0.40 0.10 – – – – – – – –Corporate ClassesScotia Canadian Corporate Bond Capital Yield Class – – – – – 0.08 – – – – – – –Scotia Canadian Dividend Class 0.10 – – – – 0.08 – – – – – – –Scotia Canadian Equity Blend Class 0.15 – – – – – – – – – – – –Scotia Conservative Government Bond Capital Yield Class 0.10 – – – – 0.05 – – – – – – –Scotia Fixed Income Blend Class 0.10 – – – – – – – – – – – –Scotia Global Dividend Class 0.30 – – – – – – – – – – – –Scotia INNOVA Balanced Growth Portfolio Class 0.10 – – – – – 0.10 – – – – – –Scotia INNOVA Balanced Income Portfolio Class 0.10 – – – – – 0.10 – – – – – –Scotia INNOVA Growth Portfolio Class 0.10 – – – – – 0.10 – – – – – –Scotia INNOVA Income Portfolio Class 0.10 – – – – – – – – – – – –Scotia INNOVA Maximum Growth Portfolio Class 0.10 – – – – – 0.10 – – – – – –Scotia International Equity Blend Class 0.30 – – – – – – – – – – – –Scotia Private Canadian Equity Class – – – – – 0.10 – – – – – – –Scotia Private U.S. Dividend Class – – – – – 0.15 – – – – – – –Scotia Private U.S. Equity Class – – – – – 0.15 – – – – – – –Scotia Short Term Yield Class – – – – – 0.05 – – – – – – –Scotia U.S. Equity Blend Class 0.20 – – – – – – – – – – – –
7. Redeemable Units
Units issued and outstanding represent the capital of eachFund. Each of the Funds may issue an unlimited number ofunits. Each unit is redeemable at the option of theunitholder in accordance with the Declaration of Trust orarticles of incorporation, ranks pari passu with all otherunits of the Funds and entitles the unitholder to aproportionate undivided interest in the Net Asset Value ofthe Funds. Unitholders are entitled to distributions whendeclared. Distributions on units of a Fund are reinvested inadditional units of the Fund or at the option of theunitholder, paid in cash. The Funds’ capital is managed inaccordance with each of the Funds’ investment objectives,policies and restrictions, as outlined in the Funds’prospectus. The Funds have no specific restrictions or
specific capital requirements on the subscriptions orredemptions of units, other than minimum subscriptionrequirements.
The units of each Series of the Funds are issued andredeemed at their Net Asset Value per unit of each Serieswhich is determined as of the close of business on each daythat the Toronto Stock Exchange is open for trading. TheNet Asset Value per unit is calculated by dividing the NetAsset Value per Series by the total number of outstandingunits of each Series.
For the periods ended June 30, 2015 and 2014, thefollowing number of units were issued, reinvested andredeemed:
June 2015 June 2014
Trust FundsOpening
UnitsUnits
IssuedUnits
ReinvestedUnits
RedeemedEnding
UnitsOpening
UnitsUnits
IssuedUnits
ReinvestedUnits
RedeemedEnding
Units
Scotia Aria Conservative Build PortfolioPremium Series Units 65,101 322,637 – 2,944 384,794 – – – – –Series A Units 95,361 515,054 – 37,659 572,756 – – – – –
Scotia Aria Conservative Core PortfolioPremium Series Units 219,332 1,373,845 – 33,690 1,559,487 – – – – –Series A Units 261,004 1,845,392 – 140,411 1,965,985 – – – – –Premium T Series Units 14,994 126,870 386 18,583 123,667 – – – – –Premium TH Series Units 336 69,689 108 – 70,133 – – – – –Premium TL Series Units 12,743 79,294 279 – 92,316 – – – – –Series T Units 7,411 61,943 69 9,956 59,467 – – – – –Series TH Units 8,246 76,918 233 150 85,247 – – – – –Series TL Units 335 3,012 10 – 3,357 – – – – –
461
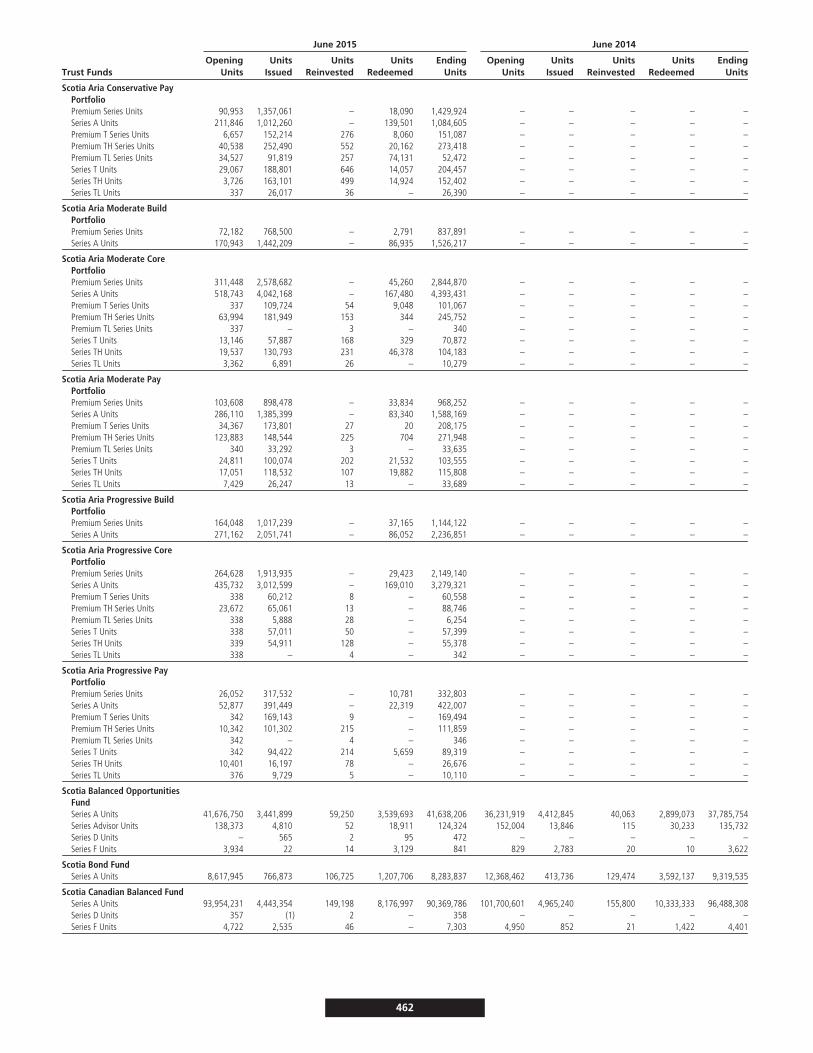
June 2015 June 2014
Trust FundsOpening
UnitsUnits
IssuedUnits
ReinvestedUnits
RedeemedEnding
UnitsOpening
UnitsUnits
IssuedUnits
ReinvestedUnits
RedeemedEnding
Units
Scotia Aria Conservative PayPortfolioPremium Series Units 90,953 1,357,061 – 18,090 1,429,924 – – – – –Series A Units 211,846 1,012,260 – 139,501 1,084,605 – – – – –Premium T Series Units 6,657 152,214 276 8,060 151,087 – – – – –Premium TH Series Units 40,538 252,490 552 20,162 273,418 – – – – –Premium TL Series Units 34,527 91,819 257 74,131 52,472 – – – – –Series T Units 29,067 188,801 646 14,057 204,457 – – – – –Series TH Units 3,726 163,101 499 14,924 152,402 – – – – –Series TL Units 337 26,017 36 – 26,390 – – – – –
Scotia Aria Moderate BuildPortfolioPremium Series Units 72,182 768,500 – 2,791 837,891 – – – – –Series A Units 170,943 1,442,209 – 86,935 1,526,217 – – – – –
Scotia Aria Moderate CorePortfolioPremium Series Units 311,448 2,578,682 – 45,260 2,844,870 – – – – –Series A Units 518,743 4,042,168 – 167,480 4,393,431 – – – – –Premium T Series Units 337 109,724 54 9,048 101,067 – – – – –Premium TH Series Units 63,994 181,949 153 344 245,752 – – – – –Premium TL Series Units 337 – 3 – 340 – – – – –Series T Units 13,146 57,887 168 329 70,872 – – – – –Series TH Units 19,537 130,793 231 46,378 104,183 – – – – –Series TL Units 3,362 6,891 26 – 10,279 – – – – –
Scotia Aria Moderate PayPortfolioPremium Series Units 103,608 898,478 – 33,834 968,252 – – – – –Series A Units 286,110 1,385,399 – 83,340 1,588,169 – – – – –Premium T Series Units 34,367 173,801 27 20 208,175 – – – – –Premium TH Series Units 123,883 148,544 225 704 271,948 – – – – –Premium TL Series Units 340 33,292 3 – 33,635 – – – – –Series T Units 24,811 100,074 202 21,532 103,555 – – – – –Series TH Units 17,051 118,532 107 19,882 115,808 – – – – –Series TL Units 7,429 26,247 13 – 33,689 – – – – –
Scotia Aria Progressive BuildPortfolioPremium Series Units 164,048 1,017,239 – 37,165 1,144,122 – – – – –Series A Units 271,162 2,051,741 – 86,052 2,236,851 – – – – –
Scotia Aria Progressive CorePortfolioPremium Series Units 264,628 1,913,935 – 29,423 2,149,140 – – – – –Series A Units 435,732 3,012,599 – 169,010 3,279,321 – – – – –Premium T Series Units 338 60,212 8 – 60,558 – – – – –Premium TH Series Units 23,672 65,061 13 – 88,746 – – – – –Premium TL Series Units 338 5,888 28 – 6,254 – – – – –Series T Units 338 57,011 50 – 57,399 – – – – –Series TH Units 339 54,911 128 – 55,378 – – – – –Series TL Units 338 – 4 – 342 – – – – –
Scotia Aria Progressive PayPortfolioPremium Series Units 26,052 317,532 – 10,781 332,803 – – – – –Series A Units 52,877 391,449 – 22,319 422,007 – – – – –Premium T Series Units 342 169,143 9 – 169,494 – – – – –Premium TH Series Units 10,342 101,302 215 – 111,859 – – – – –Premium TL Series Units 342 – 4 – 346 – – – – –Series T Units 342 94,422 214 5,659 89,319 – – – – –Series TH Units 10,401 16,197 78 – 26,676 – – – – –Series TL Units 376 9,729 5 – 10,110 – – – – –
Scotia Balanced OpportunitiesFundSeries A Units 41,676,750 3,441,899 59,250 3,539,693 41,638,206 36,231,919 4,412,845 40,063 2,899,073 37,785,754Series Advisor Units 138,373 4,810 52 18,911 124,324 152,004 13,846 115 30,233 135,732Series D Units – 565 2 95 472 – – – – –Series F Units 3,934 22 14 3,129 841 829 2,783 20 10 3,622
Scotia Bond FundSeries A Units 8,617,945 766,873 106,725 1,207,706 8,283,837 12,368,462 413,736 129,474 3,592,137 9,319,535
Scotia Canadian Balanced FundSeries A Units 93,954,231 4,443,354 149,198 8,176,997 90,369,786 101,700,601 4,965,240 155,800 10,333,333 96,488,308Series D Units 357 (1) 2 – 358 – – – – –Series F Units 4,722 2,535 46 – 7,303 4,950 852 21 1,422 4,401
462
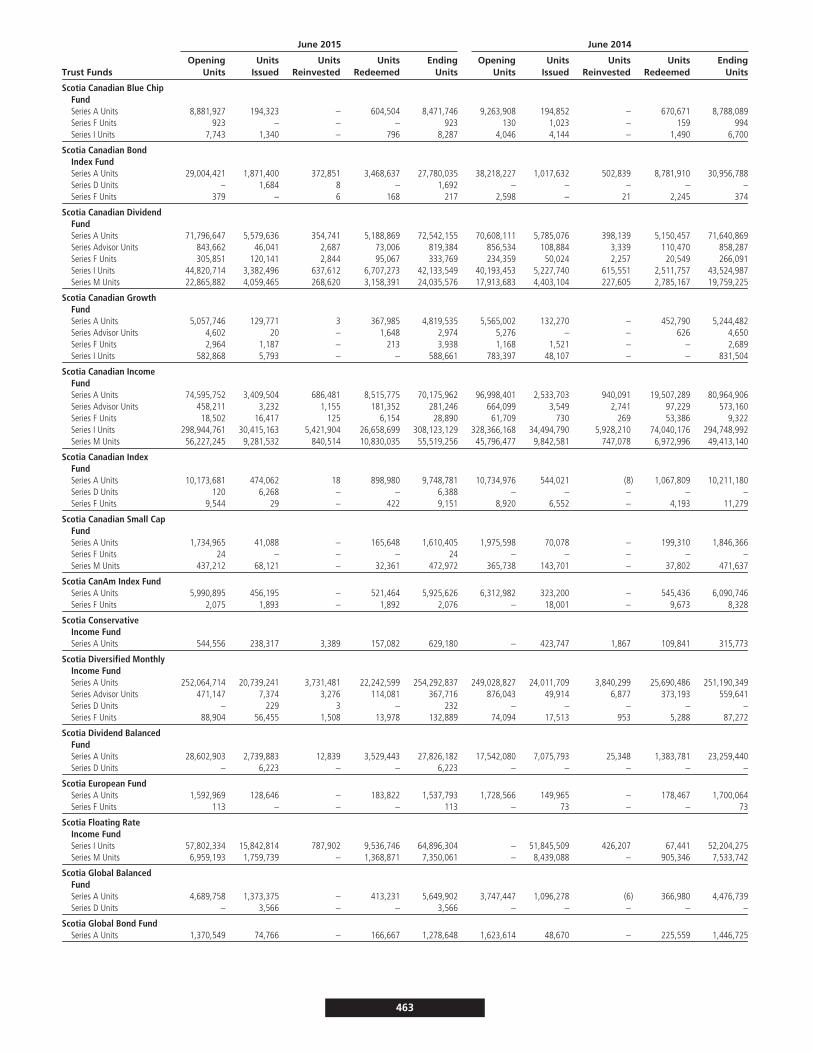
June 2015 June 2014
Trust FundsOpening
UnitsUnits
IssuedUnits
ReinvestedUnits
RedeemedEnding
UnitsOpening
UnitsUnits
IssuedUnits
ReinvestedUnits
RedeemedEnding
Units
Scotia Canadian Blue ChipFundSeries A Units 8,881,927 194,323 – 604,504 8,471,746 9,263,908 194,852 – 670,671 8,788,089Series F Units 923 – – – 923 130 1,023 – 159 994Series I Units 7,743 1,340 – 796 8,287 4,046 4,144 – 1,490 6,700
Scotia Canadian BondIndex FundSeries A Units 29,004,421 1,871,400 372,851 3,468,637 27,780,035 38,218,227 1,017,632 502,839 8,781,910 30,956,788Series D Units – 1,684 8 – 1,692 – – – – –Series F Units 379 – 6 168 217 2,598 – 21 2,245 374
Scotia Canadian DividendFundSeries A Units 71,796,647 5,579,636 354,741 5,188,869 72,542,155 70,608,111 5,785,076 398,139 5,150,457 71,640,869Series Advisor Units 843,662 46,041 2,687 73,006 819,384 856,534 108,884 3,339 110,470 858,287Series F Units 305,851 120,141 2,844 95,067 333,769 234,359 50,024 2,257 20,549 266,091Series I Units 44,820,714 3,382,496 637,612 6,707,273 42,133,549 40,193,453 5,227,740 615,551 2,511,757 43,524,987Series M Units 22,865,882 4,059,465 268,620 3,158,391 24,035,576 17,913,683 4,403,104 227,605 2,785,167 19,759,225
Scotia Canadian GrowthFundSeries A Units 5,057,746 129,771 3 367,985 4,819,535 5,565,002 132,270 – 452,790 5,244,482Series Advisor Units 4,602 20 – 1,648 2,974 5,276 – – 626 4,650Series F Units 2,964 1,187 – 213 3,938 1,168 1,521 – – 2,689Series I Units 582,868 5,793 – – 588,661 783,397 48,107 – – 831,504
Scotia Canadian IncomeFundSeries A Units 74,595,752 3,409,504 686,481 8,515,775 70,175,962 96,998,401 2,533,703 940,091 19,507,289 80,964,906Series Advisor Units 458,211 3,232 1,155 181,352 281,246 664,099 3,549 2,741 97,229 573,160Series F Units 18,502 16,417 125 6,154 28,890 61,709 730 269 53,386 9,322Series I Units 298,944,761 30,415,163 5,421,904 26,658,699 308,123,129 328,366,168 34,494,790 5,928,210 74,040,176 294,748,992Series M Units 56,227,245 9,281,532 840,514 10,830,035 55,519,256 45,796,477 9,842,581 747,078 6,972,996 49,413,140
Scotia Canadian IndexFundSeries A Units 10,173,681 474,062 18 898,980 9,748,781 10,734,976 544,021 (8) 1,067,809 10,211,180Series D Units 120 6,268 – – 6,388 – – – – –Series F Units 9,544 29 – 422 9,151 8,920 6,552 – 4,193 11,279
Scotia Canadian Small CapFundSeries A Units 1,734,965 41,088 – 165,648 1,610,405 1,975,598 70,078 – 199,310 1,846,366Series F Units 24 – – – 24 – – – – –Series M Units 437,212 68,121 – 32,361 472,972 365,738 143,701 – 37,802 471,637
Scotia CanAm Index FundSeries A Units 5,990,895 456,195 – 521,464 5,925,626 6,312,982 323,200 – 545,436 6,090,746Series F Units 2,075 1,893 – 1,892 2,076 – 18,001 – 9,673 8,328
Scotia ConservativeIncome FundSeries A Units 544,556 238,317 3,389 157,082 629,180 – 423,747 1,867 109,841 315,773
Scotia Diversified MonthlyIncome FundSeries A Units 252,064,714 20,739,241 3,731,481 22,242,599 254,292,837 249,028,827 24,011,709 3,840,299 25,690,486 251,190,349Series Advisor Units 471,147 7,374 3,276 114,081 367,716 876,043 49,914 6,877 373,193 559,641Series D Units – 229 3 – 232 – – – – –Series F Units 88,904 56,455 1,508 13,978 132,889 74,094 17,513 953 5,288 87,272
Scotia Dividend BalancedFundSeries A Units 28,602,903 2,739,883 12,839 3,529,443 27,826,182 17,542,080 7,075,793 25,348 1,383,781 23,259,440Series D Units – 6,223 – – 6,223 – – – – –
Scotia European FundSeries A Units 1,592,969 128,646 – 183,822 1,537,793 1,728,566 149,965 – 178,467 1,700,064Series F Units 113 – – – 113 – 73 – – 73
Scotia Floating RateIncome FundSeries I Units 57,802,334 15,842,814 787,902 9,536,746 64,896,304 – 51,845,509 426,207 67,441 52,204,275Series M Units 6,959,193 1,759,739 – 1,368,871 7,350,061 – 8,439,088 – 905,346 7,533,742
Scotia Global BalancedFundSeries A Units 4,689,758 1,373,375 – 413,231 5,649,902 3,747,447 1,096,278 (6) 366,980 4,476,739Series D Units – 3,566 – – 3,566 – – – – –
Scotia Global Bond FundSeries A Units 1,370,549 74,766 – 166,667 1,278,648 1,623,614 48,670 – 225,559 1,446,725
463

June 2015 June 2014
Trust FundsOpening
UnitsUnits
IssuedUnits
ReinvestedUnits
RedeemedEnding
UnitsOpening
UnitsUnits
IssuedUnits
ReinvestedUnits
RedeemedEnding
Units
Scotia Global DividendFundSeries A Units 8,628,845 2,456,719 – 695,978 10,389,586 6,445,086 2,015,232 7 538,347 7,921,978Series I Units 18,003,008 745,765 – 239,064 18,509,709 16,654,751 985,611 – 481,648 17,158,714
Scotia Global GrowthFundSeries A Units 2,392,819 223,244 – 193,996 2,422,067 2,440,202 247,723 – 210,340 2,477,585Series Advisor Units 13,772 916 – 1,272 13,416 11,137 3,580 – 666 14,051Series F Units 195 – – – 195 149 21 – 2 168Series I Units 9,466,947 221,103 – 131,417 9,556,633 5,693,672 604,304 – 403,399 5,894,577
Scotia GlobalOpportunities FundSeries A Units 886,293 166,855 – 98,961 954,187 787,715 195,673 – 137,782 845,606Series Advisor Units 27,329 – – 128 27,201 21,233 4,620 – 143 25,710Series F Units – 345 – – 345 – 225 – – 225Series I Units 9,410,767 270,825 – 168,006 9,513,586 6,955,312 2,846,002 – 2,648,781 7,152,533
Scotia Global Small CapFundSeries A Units 357,434 171,426 – 57,438 471,422 374,421 126,350 – 96,419 404,352Series I Units 4,468,443 40,151 – 467,147 4,041,447 6,791,362 3,254,423 – 3,500,991 6,544,794
Scotia IncomeAdvantage FundSeries A Units 18,704,942 1,898,486 308,780 2,025,976 18,886,232 16,812,965 2,688,136 295,233 1,976,316 17,820,018Series M Units 2,201,180 48,103 – 202,865 2,046,418 2,067,589 262,239 – 177,135 2,152,693
Scotia INNOVA BalancedGrowth PortfolioSeries A Units 163,090,461 24,377,256 473 10,527,978 176,940,212 124,483,772 29,937,593 (114) 7,791,839 146,629,412Series T Units 21,070,742 2,541,146 121,966 1,634,619 22,099,235 16,705,124 5,811,690 111,124 1,662,977 20,964,961
Scotia INNOVA BalancedIncome PortfolioSeries A Units 144,969,063 19,467,936 (375) 10,395,381 154,041,243 114,126,315 26,020,856 54 9,353,231 130,793,994Series T Units 23,082,213 2,641,316 125,961 2,333,611 23,515,879 18,352,816 5,572,247 102,561 1,929,841 22,097,783
Scotia INNOVA GrowthPortfolioSeries A Units 88,066,798 17,065,799 187 5,094,796 100,037,988 60,551,196 20,076,430 23 3,390,407 77,237,242
Scotia INNOVA IncomePortfolioSeries A Units 126,475,675 13,530,500 (57) 10,294,163 129,711,955 119,580,326 13,999,494 26 14,489,246 119,090,600Series T Units 17,656,144 1,991,094 98,975 1,897,262 17,848,951 16,121,848 2,476,581 86,653 1,839,071 16,846,011
Scotia INNOVAMaximum GrowthPortfolioSeries A Units 22,079,291 5,950,455 20 1,608,635 26,421,131 13,673,793 5,752,836 – 914,326 18,512,303
Scotia InternationalIndex FundSeries A Units 2,819,952 233,309 – 262,109 2,791,152 2,945,295 288,015 – 312,372 2,920,938Series D Units – 299 – – 299 – – – – –
Scotia InternationalValue FundSeries A Units 1,369,799 73,460 – 197,483 1,245,776 1,532,853 128,335 – 189,916 1,471,272Series Advisor Units 1,239 – – 790 449 4,195 – – – 4,195Series F Units 42 2,418 – – 2,460 – – – – –Series I Units 11,282,196 532,891 – 410,397 11,404,690 11,187,295 1,903,580 – 1,513,718 11,577,157
Scotia Latin AmericanFundSeries A Units 1,642,056 53,157 – 192,510 1,502,703 1,939,152 71,235 – 258,199 1,752,188
Scotia Money MarketFundPremium Series Units 18,567,984 8,847,777 82,584 7,355,449 20,142,896 18,239,943 9,072,093 88,355 8,921,885 18,478,506Series A Units 37,292,874 11,983,332 61,957 14,667,808 34,670,355 45,621,347 13,579,406 74,418 18,050,234 41,224,937Series Advisor Units 127,783 28,257 197 50,578 105,659 127,854 197,318 420 57,900 267,692Series I Units 15,397 100 90 200 15,387 15,198 – 98 – 15,296Series M Units 93,840,553 234,926,795 609,110 235,699,462 93,676,996 111,170,691 120,783,382 729,584 112,225,679 120,457,978
Scotia Mortgage IncomeFundSeries A Units 11,421,396 171,291 45,730 1,367,424 10,270,993 14,152,913 608,325 122,500 1,969,630 12,914,108Series F Units 35,365 376 250 4,935 31,056 86,127 1,332 888 42,889 45,458Series I Units 125,654 33,246 1,637 16,650 143,887 13,652,839 885,383 206,450 5,029,454 9,715,218Series M Units 3,419,231 2,518,198 – 591,726 5,345,703 – 2,521,368 – 202,943 2,318,425
464
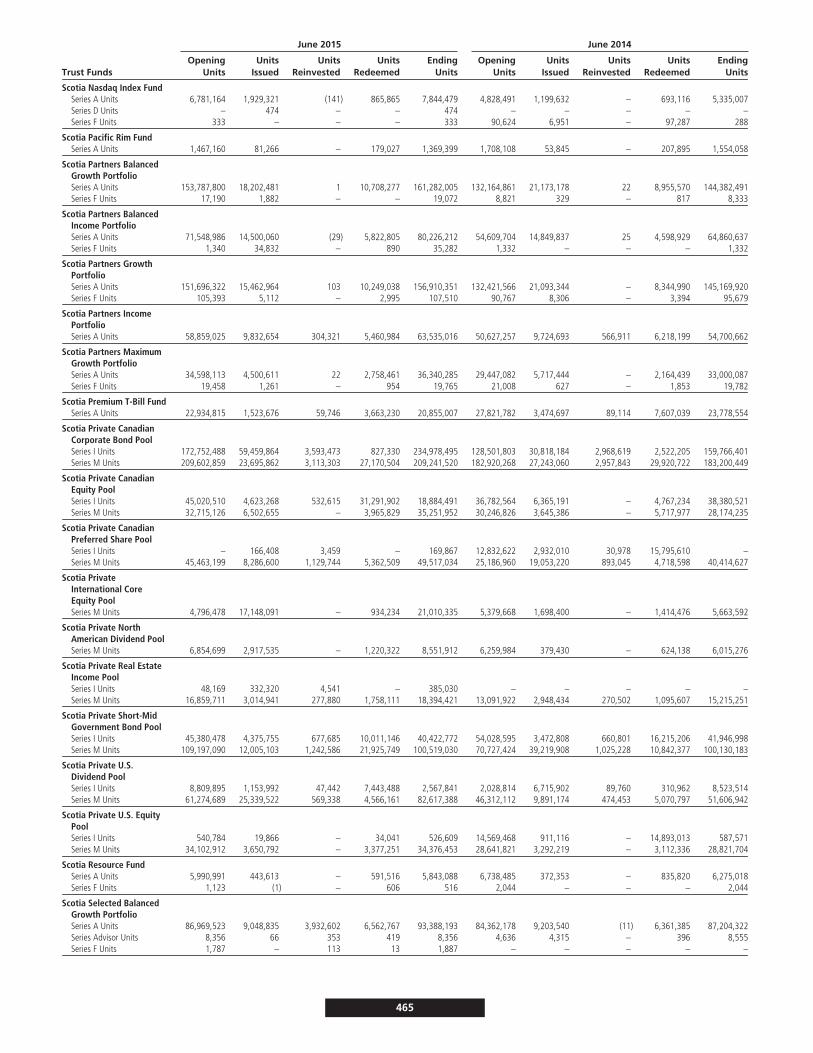
June 2015 June 2014
Trust FundsOpening
UnitsUnits
IssuedUnits
ReinvestedUnits
RedeemedEnding
UnitsOpening
UnitsUnits
IssuedUnits
ReinvestedUnits
RedeemedEnding
Units
Scotia Nasdaq Index FundSeries A Units 6,781,164 1,929,321 (141) 865,865 7,844,479 4,828,491 1,199,632 – 693,116 5,335,007Series D Units – 474 – – 474 – – – – –Series F Units 333 – – – 333 90,624 6,951 – 97,287 288
Scotia Pacific Rim FundSeries A Units 1,467,160 81,266 – 179,027 1,369,399 1,708,108 53,845 – 207,895 1,554,058
Scotia Partners BalancedGrowth PortfolioSeries A Units 153,787,800 18,202,481 1 10,708,277 161,282,005 132,164,861 21,173,178 22 8,955,570 144,382,491Series F Units 17,190 1,882 – – 19,072 8,821 329 – 817 8,333
Scotia Partners BalancedIncome PortfolioSeries A Units 71,548,986 14,500,060 (29) 5,822,805 80,226,212 54,609,704 14,849,837 25 4,598,929 64,860,637Series F Units 1,340 34,832 – 890 35,282 1,332 – – – 1,332
Scotia Partners GrowthPortfolioSeries A Units 151,696,322 15,462,964 103 10,249,038 156,910,351 132,421,566 21,093,344 – 8,344,990 145,169,920Series F Units 105,393 5,112 – 2,995 107,510 90,767 8,306 – 3,394 95,679
Scotia Partners IncomePortfolioSeries A Units 58,859,025 9,832,654 304,321 5,460,984 63,535,016 50,627,257 9,724,693 566,911 6,218,199 54,700,662
Scotia Partners MaximumGrowth PortfolioSeries A Units 34,598,113 4,500,611 22 2,758,461 36,340,285 29,447,082 5,717,444 – 2,164,439 33,000,087Series F Units 19,458 1,261 – 954 19,765 21,008 627 – 1,853 19,782
Scotia Premium T-Bill FundSeries A Units 22,934,815 1,523,676 59,746 3,663,230 20,855,007 27,821,782 3,474,697 89,114 7,607,039 23,778,554
Scotia Private CanadianCorporate Bond PoolSeries I Units 172,752,488 59,459,864 3,593,473 827,330 234,978,495 128,501,803 30,818,184 2,968,619 2,522,205 159,766,401Series M Units 209,602,859 23,695,862 3,113,303 27,170,504 209,241,520 182,920,268 27,243,060 2,957,843 29,920,722 183,200,449
Scotia Private CanadianEquity PoolSeries I Units 45,020,510 4,623,268 532,615 31,291,902 18,884,491 36,782,564 6,365,191 – 4,767,234 38,380,521Series M Units 32,715,126 6,502,655 – 3,965,829 35,251,952 30,246,826 3,645,386 – 5,717,977 28,174,235
Scotia Private CanadianPreferred Share PoolSeries I Units – 166,408 3,459 – 169,867 12,832,622 2,932,010 30,978 15,795,610 –Series M Units 45,463,199 8,286,600 1,129,744 5,362,509 49,517,034 25,186,960 19,053,220 893,045 4,718,598 40,414,627
Scotia PrivateInternational CoreEquity PoolSeries M Units 4,796,478 17,148,091 – 934,234 21,010,335 5,379,668 1,698,400 – 1,414,476 5,663,592
Scotia Private NorthAmerican Dividend PoolSeries M Units 6,854,699 2,917,535 – 1,220,322 8,551,912 6,259,984 379,430 – 624,138 6,015,276
Scotia Private Real EstateIncome PoolSeries I Units 48,169 332,320 4,541 – 385,030 – – – – –Series M Units 16,859,711 3,014,941 277,880 1,758,111 18,394,421 13,091,922 2,948,434 270,502 1,095,607 15,215,251
Scotia Private Short-MidGovernment Bond PoolSeries I Units 45,380,478 4,375,755 677,685 10,011,146 40,422,772 54,028,595 3,472,808 660,801 16,215,206 41,946,998Series M Units 109,197,090 12,005,103 1,242,586 21,925,749 100,519,030 70,727,424 39,219,908 1,025,228 10,842,377 100,130,183
Scotia Private U.S.Dividend PoolSeries I Units 8,809,895 1,153,992 47,442 7,443,488 2,567,841 2,028,814 6,715,902 89,760 310,962 8,523,514Series M Units 61,274,689 25,339,522 569,338 4,566,161 82,617,388 46,312,112 9,891,174 474,453 5,070,797 51,606,942
Scotia Private U.S. EquityPoolSeries I Units 540,784 19,866 – 34,041 526,609 14,569,468 911,116 – 14,893,013 587,571Series M Units 34,102,912 3,650,792 – 3,377,251 34,376,453 28,641,821 3,292,219 – 3,112,336 28,821,704
Scotia Resource FundSeries A Units 5,990,991 443,613 – 591,516 5,843,088 6,738,485 372,353 – 835,820 6,275,018Series F Units 1,123 (1) – 606 516 2,044 – – – 2,044
Scotia Selected BalancedGrowth PortfolioSeries A Units 86,969,523 9,048,835 3,932,602 6,562,767 93,388,193 84,362,178 9,203,540 (11) 6,361,385 87,204,322Series Advisor Units 8,356 66 353 419 8,356 4,636 4,315 – 396 8,555Series F Units 1,787 – 113 13 1,887 – – – – –
465

June 2015 June 2014
Trust FundsOpening
UnitsUnits
IssuedUnits
ReinvestedUnits
RedeemedEnding
UnitsOpening
UnitsUnits
IssuedUnits
ReinvestedUnits
RedeemedEnding
Units
Scotia Selected BalancedIncome PortfolioSeries A Units 60,273,954 9,399,202 53 4,697,140 64,976,069 52,919,505 8,603,668 37 4,529,153 56,994,057Series Advisor Units 67,606 3,193 – 17 70,782 66,327 7,947 – 6,748 67,526
Scotia Selected Growth PortfolioSeries A Units 53,974,408 5,905,228 (19) 3,983,317 55,896,300 49,285,608 6,454,412 – 3,646,255 52,093,765Series Advisor Units 2,295 – – – 2,295 2,246 – – – 2,246Series F Units 10,380 1,601 – 15 11,966 1,756 5,760 – – 7,516
Scotia Selected Income PortfolioSeries A Units 6,328,521 2,726,566 33,418 638,383 8,450,122 3,684,214 1,738,319 45,027 391,512 5,076,048
Scotia Selected MaximumGrowth PortfolioSeries A Units 11,939,619 1,843,470 – 1,028,874 12,754,215 10,573,774 1,937,018 – 919,231 11,591,561Series Advisor Units 24,247 37 – 1,649 22,635 195 23,935 – 147 23,983Series F Units 32 – – – 32 – 32 – – 32
Scotia Short Term Bond FundSeries I Units 161,805 43,321 2,359 23,017 184,468 – 119,292 1,045 24,271 96,066Series M Units 6,479,892 1,558,426 83,190 1,554,722 6,566,786 25,623,512 5,800,531 224,924 23,819,598 7,829,369
Scotia T-Bill FundSeries A Units 6,146,467 513,231 8,573 1,146,403 5,521,868 7,610,182 762,093 10,577 1,608,500 6,774,352
Scotia U.S. $ Balanced FundSeries A Units 9,535,726 1,922,670 – 1,484,866 9,973,530 6,026,921 2,911,732 – 735,303 8,203,350
Scotia U.S. $ Bond FundSeries A Units 7,261,291 344,830 18,463 1,166,338 6,458,246 9,955,943 154,185 13,874 2,389,682 7,734,320Series F Units 25,844 14,447 151 431 40,011 55,570 5,111 163 2,858 57,986
Scotia U.S. $ Money MarketFundSeries A Units 6,497,690 2,285,435 1,618 2,213,042 6,571,701 6,951,695 1,917,072 1,658 2,472,976 6,397,449
Scotia U.S. Blue Chip FundSeries A Units 3,757,635 676,139 – 359,279 4,074,495 3,887,064 389,325 – 331,060 3,945,329Series F Units 31 674 – – 705 – – – – –
Scotia U.S. Dividend FundSeries A Units 2,679,876 1,458,659 – 269,205 3,869,330 1,402,081 947,709 – 179,462 2,170,328Series I Units 10,041,724 656,764 – 346,941 10,351,547 9,237,322 2,079,674 – 1,623,092 9,693,904
Scotia U.S. Index FundSeries A Units 5,045,573 1,063,119 – 497,724 5,610,968 4,581,295 703,592 (5) 471,901 4,812,981Series D Units – 351 – – 351 – – – – –Series F Units 988 137 – 16 1,109 1,171 979 – 1,171 979
Scotia U.S. Opportunities FundSeries A Units 2,263,985 292,785 – 189,017 2,367,753 2,156,888 430,903 – 251,355 2,336,436Series F Units 56 – – – 56 – – – – –Series I Units 21,173 16,214 – 2,247 35,140 8,947 6,186 – 2,903 12,230
Scotia Private Options IncomePoolSeries I Units – 31,377,678 – – 31,377,678 – – – – –Series M Units – – – – – – – – – –
Corporate ClassScotia Canadian Corporate Bond
Capital Yield ClassSeries M Units 3,942,028 (1) 98,266 368,730 3,671,563 5,781,957 412 – 1,153,868 4,628,501
Scotia Canadian Dividend ClassSeries A Units 6,178,415 1,332,010 156,386 625,696 7,041,115 3,855,157 1,569,966 1,210 359,388 5,066,945Series M Units 3,734,440 638,519 94,807 631,229 3,836,537 2,752,947 961,236 – 384,861 3,329,322
Scotia Canadian Equity BlendClassSeries A Units 100,944 29,945 2,564 15,998 117,455 56,165 54,035 – 19,892 90,308
Scotia Conservative GovernmentBond Capital Yield ClassSeries A Units 1,302,674 (1) 31,765 251,603 1,082,835 2,740,875 – – 1,147,009 1,593,866Series M Units 1,949,310 – 48,733 370,977 1,627,066 2,964,930 11,290 – 704,743 2,271,477
Scotia Fixed Income Blend ClassSeries A Units 217,563 – 5,427 15,865 207,125 302,512 – – 58,308 244,204
Scotia Global Dividend ClassSeries A Units 1,056,643 299,669 26,253 90,750 1,291,815 721,444 324,067 – 81,343 964,168
466
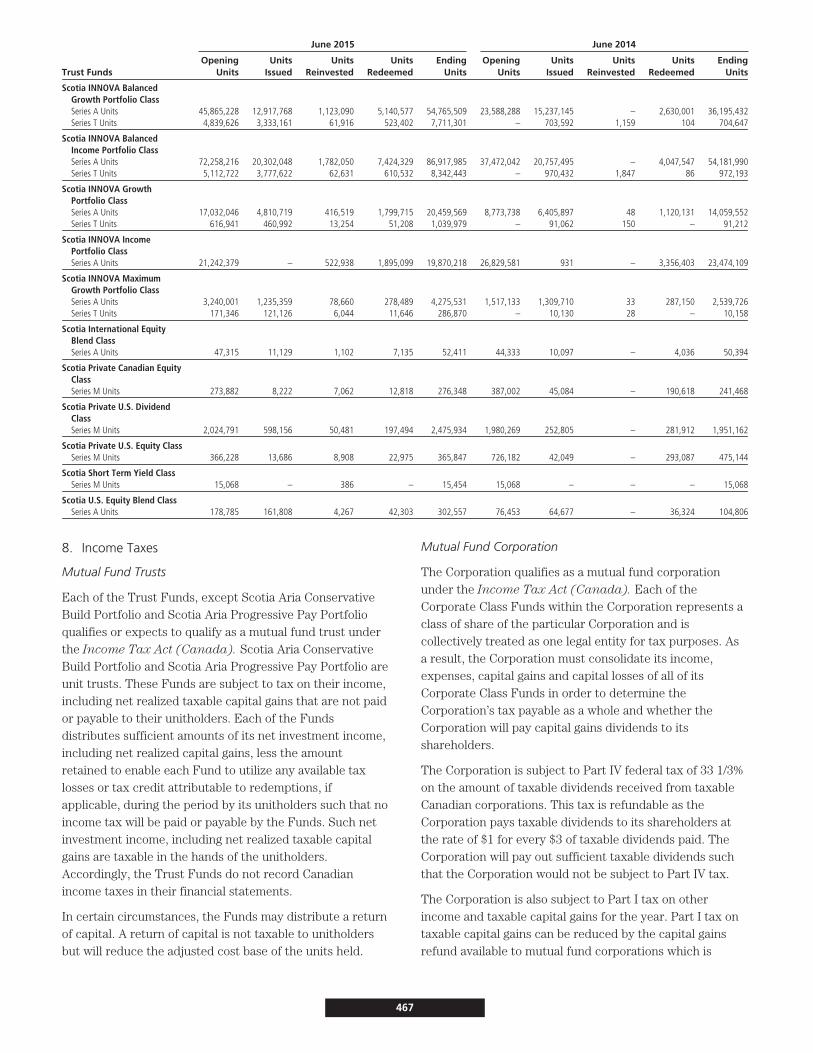
June 2015 June 2014
Trust FundsOpening
UnitsUnits
IssuedUnits
ReinvestedUnits
RedeemedEnding
UnitsOpening
UnitsUnits
IssuedUnits
ReinvestedUnits
RedeemedEnding
Units
Scotia INNOVA BalancedGrowth Portfolio ClassSeries A Units 45,865,228 12,917,768 1,123,090 5,140,577 54,765,509 23,588,288 15,237,145 – 2,630,001 36,195,432Series T Units 4,839,626 3,333,161 61,916 523,402 7,711,301 – 703,592 1,159 104 704,647
Scotia INNOVA BalancedIncome Portfolio ClassSeries A Units 72,258,216 20,302,048 1,782,050 7,424,329 86,917,985 37,472,042 20,757,495 – 4,047,547 54,181,990Series T Units 5,112,722 3,777,622 62,631 610,532 8,342,443 – 970,432 1,847 86 972,193
Scotia INNOVA GrowthPortfolio ClassSeries A Units 17,032,046 4,810,719 416,519 1,799,715 20,459,569 8,773,738 6,405,897 48 1,120,131 14,059,552Series T Units 616,941 460,992 13,254 51,208 1,039,979 – 91,062 150 – 91,212
Scotia INNOVA IncomePortfolio ClassSeries A Units 21,242,379 – 522,938 1,895,099 19,870,218 26,829,581 931 – 3,356,403 23,474,109
Scotia INNOVA MaximumGrowth Portfolio ClassSeries A Units 3,240,001 1,235,359 78,660 278,489 4,275,531 1,517,133 1,309,710 33 287,150 2,539,726Series T Units 171,346 121,126 6,044 11,646 286,870 – 10,130 28 – 10,158
Scotia International EquityBlend ClassSeries A Units 47,315 11,129 1,102 7,135 52,411 44,333 10,097 – 4,036 50,394
Scotia Private Canadian EquityClassSeries M Units 273,882 8,222 7,062 12,818 276,348 387,002 45,084 – 190,618 241,468
Scotia Private U.S. DividendClassSeries M Units 2,024,791 598,156 50,481 197,494 2,475,934 1,980,269 252,805 – 281,912 1,951,162
Scotia Private U.S. Equity ClassSeries M Units 366,228 13,686 8,908 22,975 365,847 726,182 42,049 – 293,087 475,144
Scotia Short Term Yield ClassSeries M Units 15,068 – 386 – 15,454 15,068 – – – 15,068
Scotia U.S. Equity Blend ClassSeries A Units 178,785 161,808 4,267 42,303 302,557 76,453 64,677 – 36,324 104,806
8. Income Taxes
Mutual Fund Trusts
Each of the Trust Funds, except Scotia Aria ConservativeBuild Portfolio and Scotia Aria Progressive Pay Portfolioqualifies or expects to qualify as a mutual fund trust underthe Income Tax Act (Canada). Scotia Aria ConservativeBuild Portfolio and Scotia Aria Progressive Pay Portfolio areunit trusts. These Funds are subject to tax on their income,including net realized taxable capital gains that are not paidor payable to their unitholders. Each of the Fundsdistributes sufficient amounts of its net investment income,including net realized capital gains, less the amountretained to enable each Fund to utilize any available taxlosses or tax credit attributable to redemptions, ifapplicable, during the period by its unitholders such that noincome tax will be paid or payable by the Funds. Such netinvestment income, including net realized taxable capitalgains are taxable in the hands of the unitholders.Accordingly, the Trust Funds do not record Canadianincome taxes in their financial statements.
In certain circumstances, the Funds may distribute a returnof capital. A return of capital is not taxable to unitholdersbut will reduce the adjusted cost base of the units held.
Mutual Fund Corporation
The Corporation qualifies as a mutual fund corporationunder the Income Tax Act (Canada). Each of theCorporate Class Funds within the Corporation represents aclass of share of the particular Corporation and iscollectively treated as one legal entity for tax purposes. Asa result, the Corporation must consolidate its income,expenses, capital gains and capital losses of all of itsCorporate Class Funds in order to determine theCorporation’s tax payable as a whole and whether theCorporation will pay capital gains dividends to itsshareholders.
The Corporation is subject to Part IV federal tax of 33 1/3%on the amount of taxable dividends received from taxableCanadian corporations. This tax is refundable as theCorporation pays taxable dividends to its shareholders atthe rate of $1 for every $3 of taxable dividends paid. TheCorporation will pay out sufficient taxable dividends suchthat the Corporation would not be subject to Part IV tax.
The Corporation is also subject to Part I tax on otherincome and taxable capital gains for the year. Part I tax ontaxable capital gains can be reduced by the capital gainsrefund available to mutual fund corporations which is
467

calculated based on the level of redemptions byshareholders and capital gains dividends distributed toshareholders. The Corporation will pay out sufficient capitalgains dividends such that the Corporation would not besubject to Part I tax.
As a result of the capital gains refund and Part IV taxrefund, the Corporation can recovers any Canadian incometaxes paid with respect to taxable capital gains and taxabledividends received from taxable Canadian Corporationsrespectively. At this time, the Corporation is expected tohave sufficient expenses to offset other income such thatthe Corporation would not be subject to Part I tax on otherincome. As a result, the Corporation has not recorded anyprovision for such income taxes.
Losses Carried Forward
Certain of the Funds can accumulate capital and non-capital losses. Capital losses can be carried forwardindefinitely to reduce future net realized capital gains. Non-capital losses for income tax purposes may be carriedforward up to twenty years and applied against all sourcesof income. Since the Funds do not record income taxes, thetax benefit of capital and non-capital losses have not beenreflected in the Statements of Financial Position as adeferred income tax asset.
The following Funds has losses available to carry forward asindicated in the table below:
Trust Funds
Yearof
expiry
Non-Capital
Loss$
CapitalLoss
$
Scotia Aria Defensive Build Portfolio – – –Scotia Aria Defensive Core Portfolio – – –Scotia Aria Defensive Pay Portfolio – – –Scotia Aria Moderate Build Portfolio – – –Scotia Aria Moderate Core Porfolio – – –Scotia Aria Moderate Pay Portfolio – – –Scotia Aria Progressive Build Portfolio – – –Scotia Aria Progressive Core Portfolio – – –Scotia Aria Progressive Pay Portfolio – – –Scotia Balanced Opportunities Fund – – –Scotia Bond Fund – – –Scotia Canadian Balanced Fund – – 59,627,750Scotia Canadian Blue Chip Fund – – –Scotia Canadian Bond Index Fund – – 1,857,688Scotia Canadian Dividend Fund – – 1,318,027Scotia Canadian Growth Fund – – –Scotia Canadian Income Fund – – 84,932,743Scotia Canadian Index Fund – – 33,741,869Scotia Canadian Small Cap Fund 2032 142,967 14,345,852Scotia CanAm Index Fund – – 87,581,614Scotia Conservative Income Fund – – –Scotia Diversified Monthly Income Fund – – 11,512Scotia Dividend Balanced Fund – – 27,843Scotia European Fund – – 50,780,288Scotia Floating Rate Income Fund – – 1,437,987Scotia Global Balanced Fund – – 585,570Scotia Global Bond Fund 2033 1,251,522 29,077,335Scotia Global Dividend Fund – – –Scotia Global Growth Fund – – 121,464,078Scotia Global Opportunities Fund – – –Scotia Global Small Cap Fund – – 46,047,278
Trust Funds
Yearof
expiry
Non-Capital
Loss$
CapitalLoss
$
Scotia Income Advantage Fund – – –Scotia INNOVA Balanced Growth Portfolio – – –Scotia INNOVA Balanced Income Portfolio – – –Scotia INNOVA Growth Portfolio – – –Scotia INNOVA Income Portfolio – – –Scotia INNOVA Maximum Growth Portfolio – – –Scotia International Index Fund 2031 3,587,728 13,729,402Scotia International Value Fund – – 45,143,659Scotia Latin American Fund – – 17,719,611Scotia Money Market Fund – – –Scotia Mortgage Income Fund – – 7,053,999Scotia Nasdaq Index Fund – – 4,091,590Scotia Partners Balanced Growth Portfolio – – –Scotia Partners Balanced Income Portfolio – – –Scotia Partners Growth Portfolio – – 935Scotia Partners Income Portfolio – – –Scotia Partners Maximum Growth Portfolio 2026 95,614 –
2029 758,991 –2030 3,341,158 –2031 906,769 –
Scotia Premium T-Bill Fund – – –Scotia Private Canadian Corporate Bond Pool – – 17,284,943Scotia Private Canadian Equity Pool – – 18,424,683Scotia Private Canadian Preferred Share Pool – – 19,876,173Scotia Private International Core Equity Pool – – 171,239,170Scotia Private North American Dividend Pool – – 60,329,120Scotia Private Real Estate Income Pool – – –Scotia Private Short-Mid Government Bond Pool – – 7,495,470Scotia Private U.S. Dividend Pool – – –Scotia Private U.S. Equity Pool – – –Scotia Resource Fund 2029 432,698 27,821Scotia Selected Balanced Growth Portfolio – – 8,674,464Scotia Selected Balanced Income Portfolio – – –Scotia Selected Growth Portfolio – – 547,338Scotia Selected Income Portfolio – – –Scotia Selected Maximum Growth Portfolio 2028 89,173 769,053
2029 115,033 –2030 20,770 –
Scotia Short Term Bond Fund – – 2,238,977Scotia T-Bill Fund – – –Scotia U.S. $ Balanced Fund 2031 21,765 –
2032 71,019 –Scotia U.S. $ Bond Fund – – 8,488,821Scotia U.S. $ Money Market Fund – – 59,165,913Scotia U.S. Blue Chip Fund 2015 449,146 129,977,213
2028 367,040 –2029 232,487 –2030 83,350 –2031 201,686 –2032 404,417 –
Scotia U.S. Dividend Fund – – –Scotia U.S. Index Fund – – 34,710,441Scotia U.S. Opportunities Fund 2015 1,658,776 37,250,503
2026 489,880 –
Withholding Taxes
The Funds currently incur withholding taxes imposed bycertain countries on investment income and in some cases,capital gains. Such income and capital gains are recordedon a gross basis and the related withholding taxes areshown as a separate expense in the Statements ofComprehensive Income.
Uncertain Income Taxes
The Funds invest in securities issued by entities which aredomiciled in countries other than Canada. These foreign
468
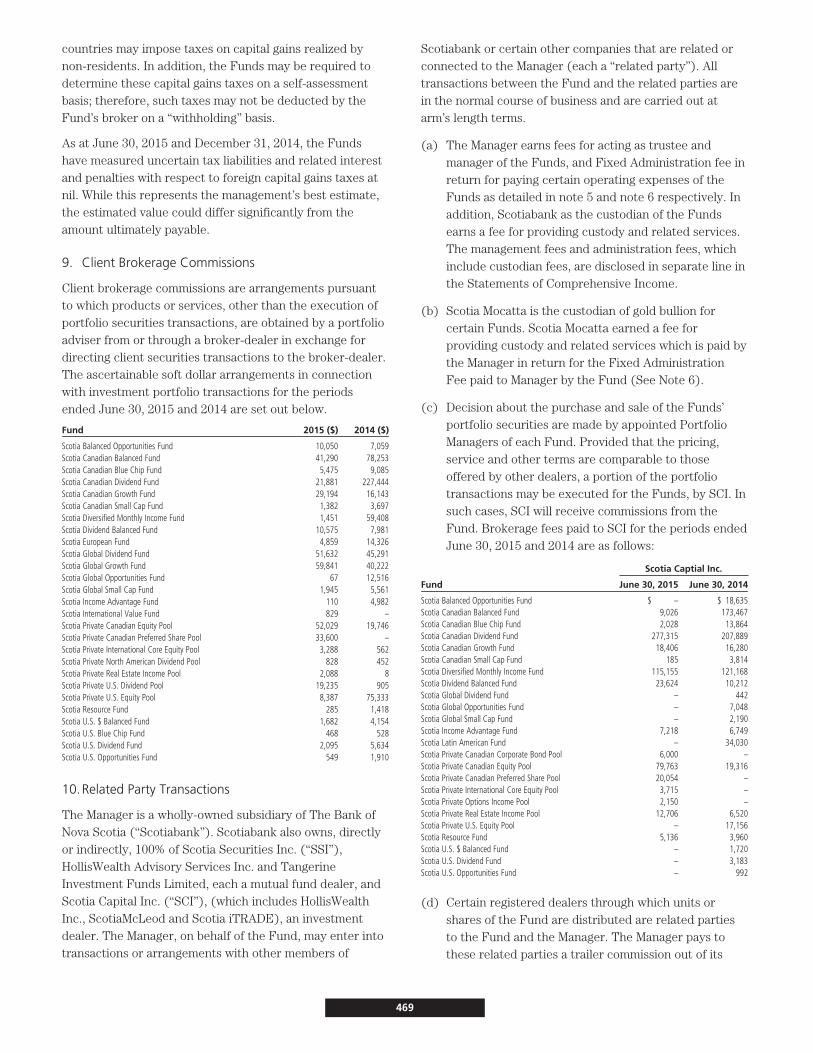
countries may impose taxes on capital gains realized bynon-residents. In addition, the Funds may be required todetermine these capital gains taxes on a self-assessmentbasis; therefore, such taxes may not be deducted by theFund’s broker on a “withholding” basis.
As at June 30, 2015 and December 31, 2014, the Fundshave measured uncertain tax liabilities and related interestand penalties with respect to foreign capital gains taxes atnil. While this represents the management’s best estimate,the estimated value could differ significantly from theamount ultimately payable.
9. Client Brokerage Commissions
Client brokerage commissions are arrangements pursuantto which products or services, other than the execution ofportfolio securities transactions, are obtained by a portfolioadviser from or through a broker-dealer in exchange fordirecting client securities transactions to the broker-dealer.The ascertainable soft dollar arrangements in connectionwith investment portfolio transactions for the periodsended June 30, 2015 and 2014 are set out below.
Fund 2015 ($) 2014 ($)
Scotia Balanced Opportunities Fund 10,050 7,059Scotia Canadian Balanced Fund 41,290 78,253Scotia Canadian Blue Chip Fund 5,475 9,085Scotia Canadian Dividend Fund 21,881 227,444Scotia Canadian Growth Fund 29,194 16,143Scotia Canadian Small Cap Fund 1,382 3,697Scotia Diversified Monthly Income Fund 1,451 59,408Scotia Dividend Balanced Fund 10,575 7,981Scotia European Fund 4,859 14,326Scotia Global Dividend Fund 51,632 45,291Scotia Global Growth Fund 59,841 40,222Scotia Global Opportunities Fund 67 12,516Scotia Global Small Cap Fund 1,945 5,561Scotia Income Advantage Fund 110 4,982Scotia International Value Fund 829 –Scotia Private Canadian Equity Pool 52,029 19,746Scotia Private Canadian Preferred Share Pool 33,600 –Scotia Private International Core Equity Pool 3,288 562Scotia Private North American Dividend Pool 828 452Scotia Private Real Estate Income Pool 2,088 8Scotia Private U.S. Dividend Pool 19,235 905Scotia Private U.S. Equity Pool 8,387 75,333Scotia Resource Fund 285 1,418Scotia U.S. $ Balanced Fund 1,682 4,154Scotia U.S. Blue Chip Fund 468 528Scotia U.S. Dividend Fund 2,095 5,634Scotia U.S. Opportunities Fund 549 1,910
10.Related Party Transactions
The Manager is a wholly-owned subsidiary of The Bank ofNova Scotia (“Scotiabank”). Scotiabank also owns, directlyor indirectly, 100% of Scotia Securities Inc. (“SSI”),HollisWealth Advisory Services Inc. and TangerineInvestment Funds Limited, each a mutual fund dealer, andScotia Capital Inc. (“SCI”), (which includes HollisWealthInc., ScotiaMcLeod and Scotia iTRADE), an investmentdealer. The Manager, on behalf of the Fund, may enter intotransactions or arrangements with other members of
Scotiabank or certain other companies that are related orconnected to the Manager (each a “related party”). Alltransactions between the Fund and the related parties arein the normal course of business and are carried out atarm’s length terms.
(a) The Manager earns fees for acting as trustee andmanager of the Funds, and Fixed Administration fee inreturn for paying certain operating expenses of theFunds as detailed in note 5 and note 6 respectively. Inaddition, Scotiabank as the custodian of the Fundsearns a fee for providing custody and related services.The management fees and administration fees, whichinclude custodian fees, are disclosed in separate line inthe Statements of Comprehensive Income.
(b) Scotia Mocatta is the custodian of gold bullion forcertain Funds. Scotia Mocatta earned a fee forproviding custody and related services which is paid bythe Manager in return for the Fixed AdministrationFee paid to Manager by the Fund (See Note 6).
(c) Decision about the purchase and sale of the Funds’portfolio securities are made by appointed PortfolioManagers of each Fund. Provided that the pricing,service and other terms are comparable to thoseoffered by other dealers, a portion of the portfoliotransactions may be executed for the Funds, by SCI. Insuch cases, SCI will receive commissions from theFund. Brokerage fees paid to SCI for the periods endedJune 30, 2015 and 2014 are as follows:
Scotia Captial Inc.
Fund June 30, 2015 June 30, 2014
Scotia Balanced Opportunities Fund $ – $ 18,635Scotia Canadian Balanced Fund 9,026 173,467Scotia Canadian Blue Chip Fund 2,028 13,864Scotia Canadian Dividend Fund 277,315 207,889Scotia Canadian Growth Fund 18,406 16,280Scotia Canadian Small Cap Fund 185 3,814Scotia Diversified Monthly Income Fund 115,155 121,168Scotia Dividend Balanced Fund 23,624 10,212Scotia Global Dividend Fund – 442Scotia Global Opportunities Fund – 7,048Scotia Global Small Cap Fund – 2,190Scotia Income Advantage Fund 7,218 6,749Scotia Latin American Fund – 34,030Scotia Private Canadian Corporate Bond Pool 6,000 –Scotia Private Canadian Equity Pool 79,763 19,316Scotia Private Canadian Preferred Share Pool 20,054 –Scotia Private International Core Equity Pool 3,715 –Scotia Private Options Income Pool 2,150 –Scotia Private Real Estate Income Pool 12,706 6,520Scotia Private U.S. Equity Pool – 17,156Scotia Resource Fund 5,136 3,960Scotia U.S. $ Balanced Fund – 1,720Scotia U.S. Dividend Fund – 3,183Scotia U.S. Opportunities Fund – 992
(d) Certain registered dealers through which units orshares of the Fund are distributed are related partiesto the Fund and the Manager. The Manager pays tothese related parties a trailer commission out of its
469
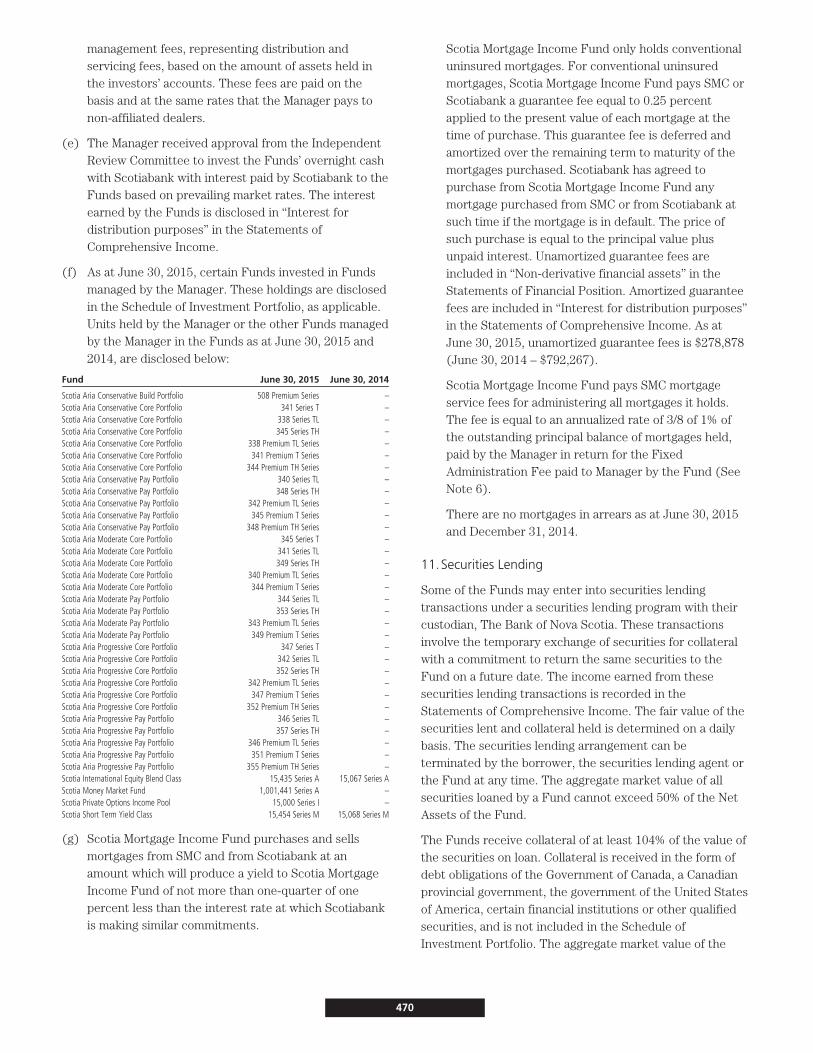
management fees, representing distribution andservicing fees, based on the amount of assets held inthe investors’ accounts. These fees are paid on thebasis and at the same rates that the Manager pays tonon-affiliated dealers.
(e) The Manager received approval from the IndependentReview Committee to invest the Funds’ overnight cashwith Scotiabank with interest paid by Scotiabank to theFunds based on prevailing market rates. The interestearned by the Funds is disclosed in “Interest fordistribution purposes” in the Statements ofComprehensive Income.
(f) As at June 30, 2015, certain Funds invested in Fundsmanaged by the Manager. These holdings are disclosedin the Schedule of Investment Portfolio, as applicable.Units held by the Manager or the other Funds managedby the Manager in the Funds as at June 30, 2015 and2014, are disclosed below:
Fund June 30, 2015 June 30, 2014
Scotia Aria Conservative Build Portfolio 508 Premium Series –Scotia Aria Conservative Core Portfolio 341 Series T –Scotia Aria Conservative Core Portfolio 338 Series TL –Scotia Aria Conservative Core Portfolio 345 Series TH –Scotia Aria Conservative Core Portfolio 338 Premium TL Series –Scotia Aria Conservative Core Portfolio 341 Premium T Series –Scotia Aria Conservative Core Portfolio 344 Premium TH Series –Scotia Aria Conservative Pay Portfolio 340 Series TL –Scotia Aria Conservative Pay Portfolio 348 Series TH –Scotia Aria Conservative Pay Portfolio 342 Premium TL Series –Scotia Aria Conservative Pay Portfolio 345 Premium T Series –Scotia Aria Conservative Pay Portfolio 348 Premium TH Series –Scotia Aria Moderate Core Portfolio 345 Series T –Scotia Aria Moderate Core Portfolio 341 Series TL –Scotia Aria Moderate Core Portfolio 349 Series TH –Scotia Aria Moderate Core Portfolio 340 Premium TL Series –Scotia Aria Moderate Core Portfolio 344 Premium T Series –Scotia Aria Moderate Pay Portfolio 344 Series TL –Scotia Aria Moderate Pay Portfolio 353 Series TH –Scotia Aria Moderate Pay Portfolio 343 Premium TL Series –Scotia Aria Moderate Pay Portfolio 349 Premium T Series –Scotia Aria Progressive Core Portfolio 347 Series T –Scotia Aria Progressive Core Portfolio 342 Series TL –Scotia Aria Progressive Core Portfolio 352 Series TH –Scotia Aria Progressive Core Portfolio 342 Premium TL Series –Scotia Aria Progressive Core Portfolio 347 Premium T Series –Scotia Aria Progressive Core Portfolio 352 Premium TH Series –Scotia Aria Progressive Pay Portfolio 346 Series TL –Scotia Aria Progressive Pay Portfolio 357 Series TH –Scotia Aria Progressive Pay Portfolio 346 Premium TL Series –Scotia Aria Progressive Pay Portfolio 351 Premium T Series –Scotia Aria Progressive Pay Portfolio 355 Premium TH Series –Scotia International Equity Blend Class 15,435 Series A 15,067 Series AScotia Money Market Fund 1,001,441 Series A –Scotia Private Options Income Pool 15,000 Series I –Scotia Short Term Yield Class 15,454 Series M 15,068 Series M
(g) Scotia Mortgage Income Fund purchases and sellsmortgages from SMC and from Scotiabank at anamount which will produce a yield to Scotia MortgageIncome Fund of not more than one-quarter of onepercent less than the interest rate at which Scotiabankis making similar commitments.
Scotia Mortgage Income Fund only holds conventionaluninsured mortgages. For conventional uninsuredmortgages, Scotia Mortgage Income Fund pays SMC orScotiabank a guarantee fee equal to 0.25 percentapplied to the present value of each mortgage at thetime of purchase. This guarantee fee is deferred andamortized over the remaining term to maturity of themortgages purchased. Scotiabank has agreed topurchase from Scotia Mortgage Income Fund anymortgage purchased from SMC or from Scotiabank atsuch time if the mortgage is in default. The price ofsuch purchase is equal to the principal value plusunpaid interest. Unamortized guarantee fees areincluded in “Non-derivative financial assets” in theStatements of Financial Position. Amortized guaranteefees are included in “Interest for distribution purposes”in the Statements of Comprehensive Income. As atJune 30, 2015, unamortized guarantee fees is $278,878(June 30, 2014 – $792,267).
Scotia Mortgage Income Fund pays SMC mortgageservice fees for administering all mortgages it holds.The fee is equal to an annualized rate of 3/8 of 1% ofthe outstanding principal balance of mortgages held,paid by the Manager in return for the FixedAdministration Fee paid to Manager by the Fund (SeeNote 6).
There are no mortgages in arrears as at June 30, 2015and December 31, 2014.
11.Securities Lending
Some of the Funds may enter into securities lendingtransactions under a securities lending program with theircustodian, The Bank of Nova Scotia. These transactionsinvolve the temporary exchange of securities for collateralwith a commitment to return the same securities to theFund on a future date. The income earned from thesesecurities lending transactions is recorded in theStatements of Comprehensive Income. The fair value of thesecurities lent and collateral held is determined on a dailybasis. The securities lending arrangement can beterminated by the borrower, the securities lending agent orthe Fund at any time. The aggregate market value of allsecurities loaned by a Fund cannot exceed 50% of the NetAssets of the Fund.
The Funds receive collateral of at least 104% of the value ofthe securities on loan. Collateral is received in the form ofdebt obligations of the Government of Canada, a Canadianprovincial government, the government of the United Statesof America, certain financial institutions or other qualifiedsecurities, and is not included in the Schedule ofInvestment Portfolio. The aggregate market value of the
470
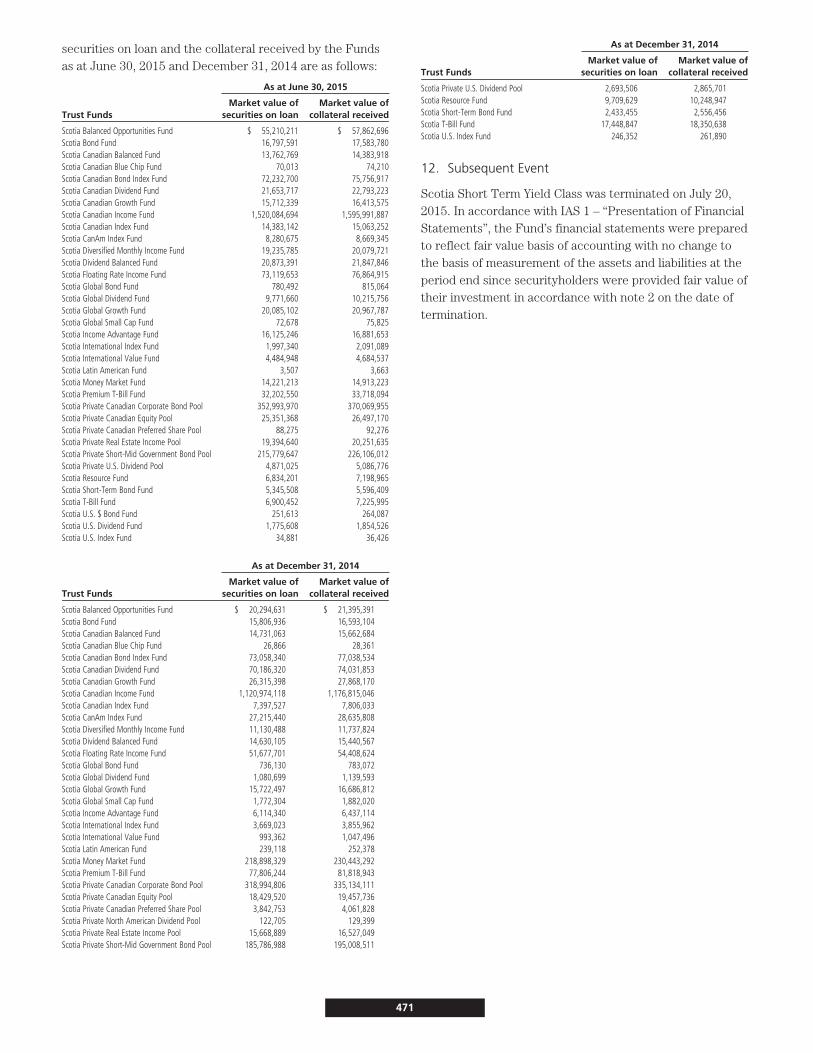
securities on loan and the collateral received by the Fundsas at June 30, 2015 and December 31, 2014 are as follows:
As at June 30, 2015
Trust FundsMarket value of
securities on loanMarket value of
collateral received
Scotia Balanced Opportunities Fund $ 55,210,211 $ 57,862,696Scotia Bond Fund 16,797,591 17,583,780Scotia Canadian Balanced Fund 13,762,769 14,383,918Scotia Canadian Blue Chip Fund 70,013 74,210Scotia Canadian Bond Index Fund 72,232,700 75,756,917Scotia Canadian Dividend Fund 21,653,717 22,793,223Scotia Canadian Growth Fund 15,712,339 16,413,575Scotia Canadian Income Fund 1,520,084,694 1,595,991,887Scotia Canadian Index Fund 14,383,142 15,063,252Scotia CanAm Index Fund 8,280,675 8,669,345Scotia Diversified Monthly Income Fund 19,235,785 20,079,721Scotia Dividend Balanced Fund 20,873,391 21,847,846Scotia Floating Rate Income Fund 73,119,653 76,864,915Scotia Global Bond Fund 780,492 815,064Scotia Global Dividend Fund 9,771,660 10,215,756Scotia Global Growth Fund 20,085,102 20,967,787Scotia Global Small Cap Fund 72,678 75,825Scotia Income Advantage Fund 16,125,246 16,881,653Scotia International Index Fund 1,997,340 2,091,089Scotia International Value Fund 4,484,948 4,684,537Scotia Latin American Fund 3,507 3,663Scotia Money Market Fund 14,221,213 14,913,223Scotia Premium T-Bill Fund 32,202,550 33,718,094Scotia Private Canadian Corporate Bond Pool 352,993,970 370,069,955Scotia Private Canadian Equity Pool 25,351,368 26,497,170Scotia Private Canadian Preferred Share Pool 88,275 92,276Scotia Private Real Estate Income Pool 19,394,640 20,251,635Scotia Private Short-Mid Government Bond Pool 215,779,647 226,106,012Scotia Private U.S. Dividend Pool 4,871,025 5,086,776Scotia Resource Fund 6,834,201 7,198,965Scotia Short-Term Bond Fund 5,345,508 5,596,409Scotia T-Bill Fund 6,900,452 7,225,995Scotia U.S. $ Bond Fund 251,613 264,087Scotia U.S. Dividend Fund 1,775,608 1,854,526Scotia U.S. Index Fund 34,881 36,426
As at December 31, 2014
Trust FundsMarket value of
securities on loanMarket value of
collateral received
Scotia Balanced Opportunities Fund $ 20,294,631 $ 21,395,391Scotia Bond Fund 15,806,936 16,593,104Scotia Canadian Balanced Fund 14,731,063 15,662,684Scotia Canadian Blue Chip Fund 26,866 28,361Scotia Canadian Bond Index Fund 73,058,340 77,038,534Scotia Canadian Dividend Fund 70,186,320 74,031,853Scotia Canadian Growth Fund 26,315,398 27,868,170Scotia Canadian Income Fund 1,120,974,118 1,176,815,046Scotia Canadian Index Fund 7,397,527 7,806,033Scotia CanAm Index Fund 27,215,440 28,635,808Scotia Diversified Monthly Income Fund 11,130,488 11,737,824Scotia Dividend Balanced Fund 14,630,105 15,440,567Scotia Floating Rate Income Fund 51,677,701 54,408,624Scotia Global Bond Fund 736,130 783,072Scotia Global Dividend Fund 1,080,699 1,139,593Scotia Global Growth Fund 15,722,497 16,686,812Scotia Global Small Cap Fund 1,772,304 1,882,020Scotia Income Advantage Fund 6,114,340 6,437,114Scotia International Index Fund 3,669,023 3,855,962Scotia International Value Fund 993,362 1,047,496Scotia Latin American Fund 239,118 252,378Scotia Money Market Fund 218,898,329 230,443,292Scotia Premium T-Bill Fund 77,806,244 81,818,943Scotia Private Canadian Corporate Bond Pool 318,994,806 335,134,111Scotia Private Canadian Equity Pool 18,429,520 19,457,736Scotia Private Canadian Preferred Share Pool 3,842,753 4,061,828Scotia Private North American Dividend Pool 122,705 129,399Scotia Private Real Estate Income Pool 15,668,889 16,527,049Scotia Private Short-Mid Government Bond Pool 185,786,988 195,008,511
As at December 31, 2014
Trust FundsMarket value of
securities on loanMarket value of
collateral received
Scotia Private U.S. Dividend Pool 2,693,506 2,865,701Scotia Resource Fund 9,709,629 10,248,947Scotia Short-Term Bond Fund 2,433,455 2,556,456Scotia T-Bill Fund 17,448,847 18,350,638Scotia U.S. Index Fund 246,352 261,890
12. Subsequent Event
Scotia Short Term Yield Class was terminated on July 20,2015. In accordance with IAS 1 – “Presentation of FinancialStatements”, the Fund’s financial statements were preparedto reflect fair value basis of accounting with no change tothe basis of measurement of the assets and liabilities at theperiod end since securityholders were provided fair value oftheir investment in accordance with note 2 on the date oftermination.
471

ManagementResponsibilityForFinancialReporting
The accompanying financial statements of the Funds (as defined in Note 1)have been prepared by 1832 Asset Management L.P. , in its capacity as manager(the “Manager”) of the Funds and have been approved by the Board of Directorsof Scotia Corporate Class Inc. (“SCCI”), with respect to the Funds that arecorporate funds (the “Corporate Funds”), and by the Board of Directors of 1832Asset Management G.P. Inc., as general partner for and on behalf of 1832 AssetManagement L.P. , in its capacity as trustee (the “Trustee”) of the Funds, withrespect to the Funds that are trust funds (the “Trust Funds”). The Board ofDirectors of SCCI, with respect to the Corporate Funds, and the Board of Direc-tors of 1832 Asset Management G.P. Inc., as general partner for and on behalf of1832 Asset Management L.P., with respect to the Trust Funds, are responsiblefor the information and representations contained in these financial statementsand the management report of fund performance.
The Manager maintains appropriate processes to ensure that relevant and reli-able financial information is produced. The financial statements have beenprepared in accordance with International Financial Reporting Standards(“IFRS”) and include certain amounts that are based on estimates and judg-ments made by the Manager. The significant accounting policies which theManager believes are appropriate for the Funds are described in Note 2 to thefinancial statements.
The Finance Committee of the Board of Directors of 1832 Asset ManagementG.P. Inc. is responsible for reviewing the financial statements and the manage-ment report of fund performance and recommending them to the Boards ofDirectors of SCCI and 1832 Asset Management G.P. Inc. for approval, in additionto meeting with management, internal auditors and external auditors to discussinternal controls over the financial reporting process, auditing matters andfinancial reporting issues.
Jordy Chilcott
Co-President
1832 Asset Management L.P.
Michel Martil
Chief Financial Officer
1832 Asset Management L.P.
August 18, 2015
472
1
F O R M O R E I N F O R M A T I O N A B O U T
ScotiaFunds®
visit :
www.scotiafunds.com
call :
1-800-268-9269 (English)1-800-387-5004 (French)
write:
1832 Asset Management L.P.1 Adelaide Street East
28th FloorToronto, Ontario
M5C 2V9
® Registered trademarks of The Bank of Nova Scotia, used under licence.
9471219 (08/15)