Semi Annual Report 2008.12.31
160
A no-load mutual fund family of domestic funds Semi-Annual Report December 31, 2008 (Unaudited) AGGRESSIVE INVESTORS 1 BRAGX (Closed to New Investors) AGGRESSIVE INVESTORS 2 BRAIX ULTRA-SMALL COMPANY BRUSX (Open to Existing Investors—Direct Only) ULTRA-SMALL COMPANY MARKET BRSIX MICRO-CAP LIMITED BRMCX SMALL-CAP GROWTH BRSGX SMALL-CAP VALUE BRSVX LARGE-CAP GROWTH BRLGX LARGE-CAP VALUE BRLVX BLUE CHIP 35 INDEX BRLIX BALANCED BRBPX www.bridgeway.com
-
Upload
fwallstreet -
Category
Documents
-
view
118 -
download
4
Transcript of Semi Annual Report 2008.12.31
A no-load mutual fund family of domestic funds
Semi-Annual Report
December 31, 2008 (Unaudited)
AGGRESSIVE INVESTORS 1 BRAGX(Closed to New Investors)
AGGRESSIVE INVESTORS 2 BRAIX
ULTRA-SMALL COMPANY BRUSX(Open to Existing Investors—Direct Only)
ULTRA-SMALL COMPANY MARKET BRSIX
MICRO-CAP LIMITED BRMCX
SMALL-CAP GROWTH BRSGX
SMALL-CAP VALUE BRSVX
LARGE-CAP GROWTH BRLGX
LARGE-CAP VALUE BRLVX
BLUE CHIP 35 INDEX BRLIX
BALANCED BRBPX
www.bridgeway.com

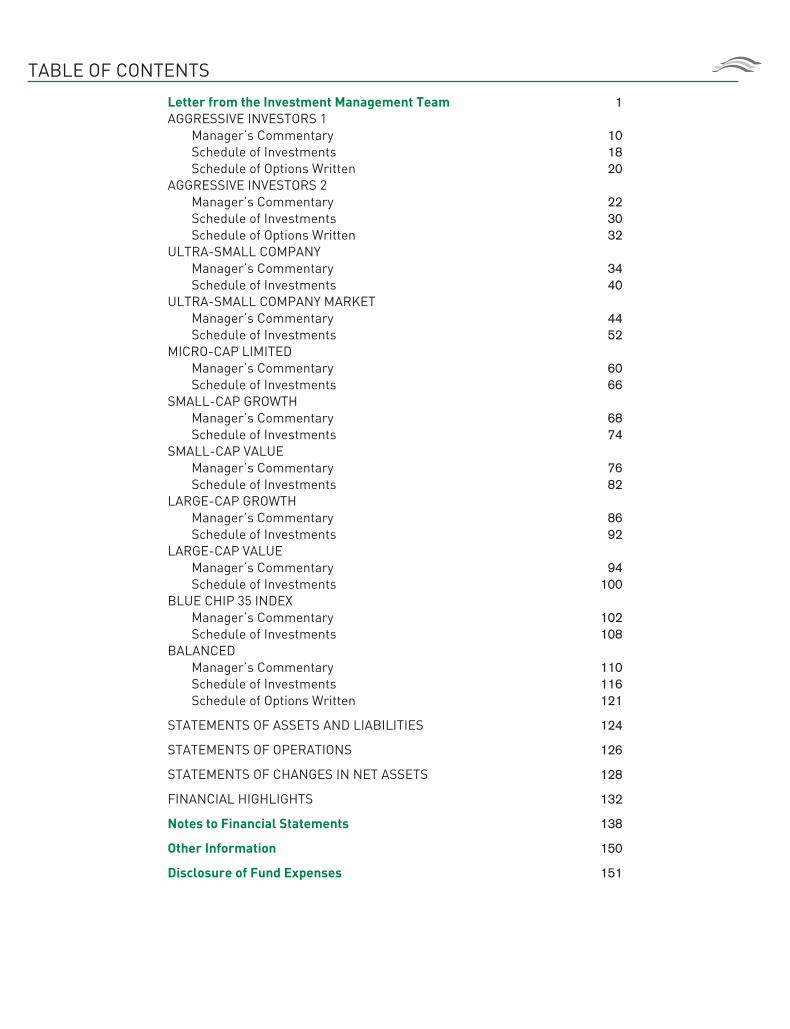
TABLE OF CONTENTS
Letter from the Investment Management Team 1AGGRESSIVE INVESTORS 1
Manager’s Commentary 10Schedule of Investments 18Schedule of Options Written 20
AGGRESSIVE INVESTORS 2Manager’s Commentary 22Schedule of Investments 30Schedule of Options Written 32
ULTRA-SMALL COMPANYManager’s Commentary 34Schedule of Investments 40
ULTRA-SMALL COMPANY MARKETManager’s Commentary 44Schedule of Investments 52
MICRO-CAP LIMITEDManager’s Commentary 60Schedule of Investments 66
SMALL-CAP GROWTHManager’s Commentary 68Schedule of Investments 74
SMALL-CAP VALUEManager’s Commentary 76Schedule of Investments 82
LARGE-CAP GROWTHManager’s Commentary 86Schedule of Investments 92
LARGE-CAP VALUEManager’s Commentary 94Schedule of Investments 100
BLUE CHIP 35 INDEXManager’s Commentary 102Schedule of Investments 108
BALANCEDManager’s Commentary 110Schedule of Investments 116Schedule of Options Written 121
STATEMENTS OF ASSETS AND LIABILITIES 124
STATEMENTS OF OPERATIONS 126
STATEMENTS OF CHANGES IN NET ASSETS 128
FINANCIAL HIGHLIGHTS 132
Notes to Financial Statements 138
Other Information 150
Disclosure of Fund Expenses 151
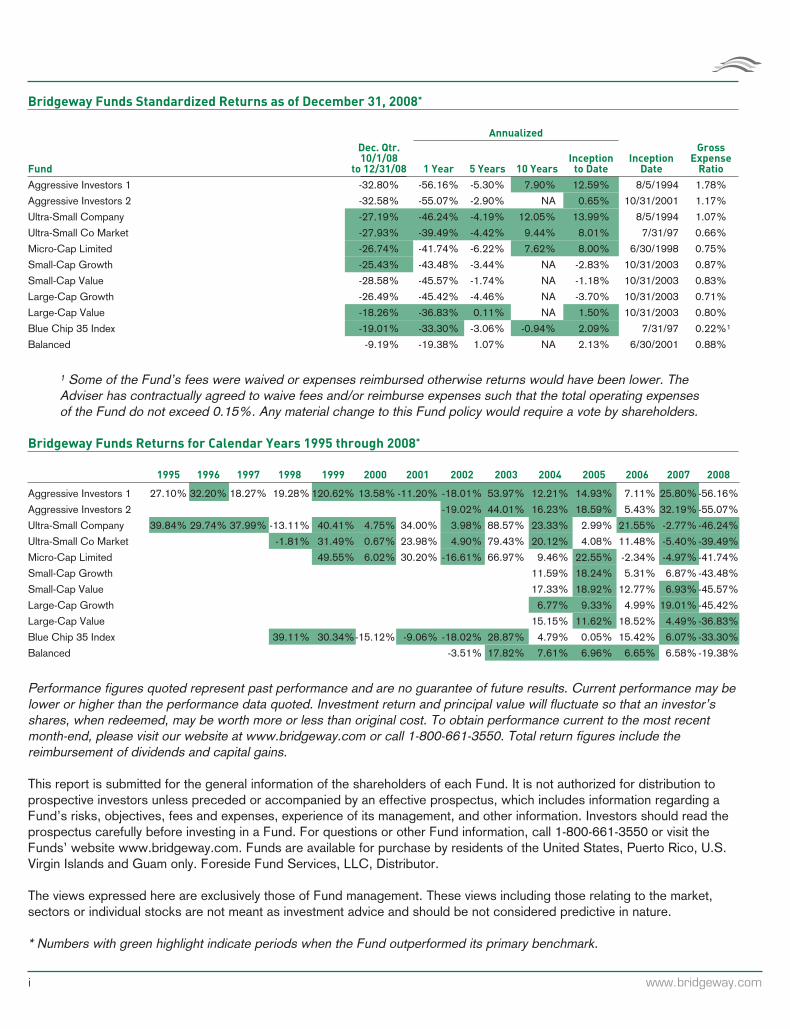
Bridgeway Funds Standardized Returns as of December 31, 2008*
Annualized
Fund
Dec. Qtr.10/1/08
to 12/31/08 1 Year 5 Years 10 YearsInception
to DateInception
Date
GrossExpense
Ratio
Aggressive Investors 1 -32.80% -56.16% -5.30% 7.90% 12.59% 8/5/1994 1.78%
Aggressive Investors 2 -32.58% -55.07% -2.90% NA 0.65% 10/31/2001 1.17%
Ultra-Small Company -27.19% -46.24% -4.19% 12.05% 13.99% 8/5/1994 1.07%
Ultra-Small Co Market -27.93% -39.49% -4.42% 9.44% 8.01% 7/31/97 0.66%
Micro-Cap Limited -26.74% -41.74% -6.22% 7.62% 8.00% 6/30/1998 0.75%
Small-Cap Growth -25.43% -43.48% -3.44% NA -2.83% 10/31/2003 0.87%
Small-Cap Value -28.58% -45.57% -1.74% NA -1.18% 10/31/2003 0.83%
Large-Cap Growth -26.49% -45.42% -4.46% NA -3.70% 10/31/2003 0.71%
Large-Cap Value -18.26% -36.83% 0.11% NA 1.50% 10/31/2003 0.80%
Blue Chip 35 Index -19.01% -33.30% -3.06% -0.94% 2.09% 7/31/97 0.22%1
Balanced -9.19% -19.38% 1.07% NA 2.13% 6/30/2001 0.88%
1 Some of the Fund’s fees were waived or expenses reimbursed otherwise returns would have been lower. TheAdviser has contractually agreed to waive fees and/or reimburse expenses such that the total operating expensesof the Fund do not exceed 0.15%. Any material change to this Fund policy would require a vote by shareholders.
Bridgeway Funds Returns for Calendar Years 1995 through 2008*
1995 1996 1997 1998 1999 2000 2001 2002 2003 2004 2005 2006 2007 2008
Aggressive Investors 1 27.10% 32.20% 18.27% 19.28% 120.62% 13.58% -11.20% -18.01% 53.97% 12.21% 14.93% 7.11% 25.80%-56.16%
Aggressive Investors 2 -19.02% 44.01% 16.23% 18.59% 5.43% 32.19%-55.07%
Ultra-Small Company 39.84% 29.74% 37.99% -13.11% 40.41% 4.75% 34.00% 3.98% 88.57% 23.33% 2.99% 21.55% -2.77%-46.24%
Ultra-Small Co Market -1.81% 31.49% 0.67% 23.98% 4.90% 79.43% 20.12% 4.08% 11.48% -5.40%-39.49%
Micro-Cap Limited 49.55% 6.02% 30.20% -16.61% 66.97% 9.46% 22.55% -2.34% -4.97%-41.74%
Small-Cap Growth 11.59% 18.24% 5.31% 6.87%-43.48%
Small-Cap Value 17.33% 18.92% 12.77% 6.93%-45.57%
Large-Cap Growth 6.77% 9.33% 4.99% 19.01%-45.42%
Large-Cap Value 15.15% 11.62% 18.52% 4.49%-36.83%
Blue Chip 35 Index 39.11% 30.34%-15.12% -9.06% -18.02% 28.87% 4.79% 0.05% 15.42% 6.07%-33.30%
Balanced -3.51% 17.82% 7.61% 6.96% 6.65% 6.58%-19.38%
Performance figures quoted represent past performance and are no guarantee of future results. Current performance may belower or higher than the performance data quoted. Investment return and principal value will fluctuate so that an investor’sshares, when redeemed, may be worth more or less than original cost. To obtain performance current to the most recentmonth-end, please visit our website at www.bridgeway.com or call 1-800-661-3550. Total return figures include thereimbursement of dividends and capital gains.
This report is submitted for the general information of the shareholders of each Fund. It is not authorized for distribution toprospective investors unless preceded or accompanied by an effective prospectus, which includes information regarding aFund’s risks, objectives, fees and expenses, experience of its management, and other information. Investors should read theprospectus carefully before investing in a Fund. For questions or other Fund information, call 1-800-661-3550 or visit theFunds’ website www.bridgeway.com. Funds are available for purchase by residents of the United States, Puerto Rico, U.S.Virgin Islands and Guam only. Foreside Fund Services, LLC, Distributor.
The views expressed here are exclusively those of Fund management. These views including those relating to the market,sectors or individual stocks are not meant as investment advice and should be not considered predictive in nature.
* Numbers with green highlight indicate periods when the Fund outperformed its primary benchmark.
i www.bridgeway.com
LETTER FROM THE INVESTMENT MANAGEMENT TEAM
December 31, 2008
Dear Fellow Shareholders,
In the midst of the worst quarterly stock market decline since 1987, as well as what has now become the worst overall bearmarket since the 1930’s, each of our Funds also set new “worst quarter” performance records. On a relative basis, six ofeleven funds provided some cushion against the decline of their primary market benchmarks. Our full-year performance wasworse, with only four of eleven Funds outperforming their primary market benchmarks. With the exception of one fund (Ultra-Small Company Fund) in 1998, 2008 is the only year in Bridgeway’s 15+ year history that we have underperformed a primarymarket benchmark in a down year. 2008 was thus a very poor overall record of relative performance by Bridgeway standards.Disappointed is not a strong enough word. Our most aggressive Funds, Aggressive Investors 1 and 2 Funds, lagged theirbenchmarks the most in the quarter. At the other end of the spectrum, Large-Cap Value, Small-Cap Growth, Blue Chip 35Index, Ultra-Small Company and Micro-Cap Limited Funds provided some cushion against the fall of their market and peerbenchmarks, while Balanced Fund beat its peer benchmark.
An overview of market factors that negatively impacted our returns is described in the “Market Review” section on page 3.Beyond the overall steep market decline, these factors contributed to our poorer-than-benchmark returns:
• A number of Funds were positioned toward the growth stock spectrum, i.e. companies that have experienced fasterrates of growth. Across all size stocks, growth-stocks performed more poorly in the quarter (and year), despite whatwe measured as strong relative valuations in this market segment. For example, the style box “home” of AggressiveInvestors, mid-cap growth stocks (down 43.9%), significantly underperformed small-cap value stocks (down “only”32.4%) according to data from Morningstar.
• Unlike the bear market of 2000-2002, some of the hardest hit stocks had solid balance sheets, strong earnings, andhistorically favorable valuations. Simiarly, one of our normally diversifying models picked up some “deep-value” stocks,including a financial stock, which were hit late in the downturn.
• A number of our models had identified strong picks among chemical and energy stocks. While these stocks sig-nificantly helped our strong performance of the June quarter, the models didn’t know that commodity prices, and thusthe revenues of these companies, would be falling precipitously, as crude oil prices declined from a peak of$146/barrel in July to a December low of less than $31/barrel.
• One of Bridgeway’s risk management “safety nets” is intended to guard against too high an overconcentration in onesector or industry. While this part of our risk process did “kick in,” reducing the amount of chemical and energy stockwe would have held otherwise, it didn’t recommend trimming stocks at a rate that would have been as helpful as it didfor technology stocks in 1999/2000. More details appear on pages 6 to 7.
We had such a strong response from our October paper, “How to Survive and Succeed Through a Bear Market,” that weupdated it with more current numbers and put it on our website. One of our major conclusions is to focus on “time to returnto the previous peak.” You can get our “take” on when the market might recover on pages 3 to 4.
Discussing 2008 and our Funds’ performance feels quite a bit like “Monday morning quarterbacking.” We dissect the resultsof our worst performers on pages 5 to 6 in a section by the same name. We’re glad to be leaving 2008 behind. And lookingforward to climbing back up the performance ladder—though we can’t guarantee and don’t want to guess exactly how longthat will take. We do provide two data points of how our Funds have performed during some short-term “bounce back”periods on pages 7 to 8.
After a year like 2008, it’s fair to question the appropriateness of quantitative investing. Our position is presented on page 7.Finally, each calendar year we have a friendly competition against Morningstar’s “Fund picks.” After a pretty good year forBridgeway in 2007, 2008 goes to Morningstar. The “score” was Bridgeway 3, Morningstar 8.
www.bridgeway.com 1
LETTER FROM THE INVESTMENT MANAGEMENT TEAM (continued)
As always, we appreciate your feedback. We take your comments very seriously and regularly discuss them internally to helpin managing our Funds and this company. Please keep your ideas coming—both favorable and critical. They provide us with avital tool helping us serve you better.
Sincerely,
John Montgomery Richard P. Cancelmo
Elena Khoziaeva Michael Whipple
Rasool Shaik
Your Investment Team
2 Semi-Annual Report | December 31, 2008 (Unaudited)
LETTER FROM THE INVESTMENT MANAGEMENT TEAM (continued)
Market Review
The Short Version: Any way you slice it or dice it, it was a very very ugly year.
The depth of the 2008 bear market trumps every other year since 1931. The sub-prime lending fiasco early in the year spreadto the broader credit market, hurting companies dependent on debt for their operating cycle (e.g. funding purchases forinventory) and fixed asset needs (e.g. major equipment). As some people lost their jobs (unemployment rose from under 5%at the beginning of the year to over 7% by the end of the year) and as housing values declined and foreclosures climbed,consumer and corporations alike “pulled in their reins” in the uncertain environment. By the end of the September quarter,declining forecasts and plummeting stock prices had affected the vast majority of businesses. These in turn also fed a “fearmentality,” reinforcing the recession’s progress. Official numbers became available that a recession began in December2007. Most of this negative news accelerated in the December 2008 quarter, even as the Federal Reserve and Congressstruggled to stabilize the economy with rock bottom Federal Funds rates and bailout packages. Assuming it lasts until May2009, which we think is quite possible, this will become the longest recession since the 1930’s.
How did all of these factors affect the stocks of various industries and sectors? No sector of the economy was left unscathed.Among the components of the S&P 500 Index, financial companies (banks, insurance companies, and real estate companies)led the decline at 55%. Typically, non-cylical companies (food and healthcare) and utilities are the ones that hold up best in arecession since people continue to eat and to heat and cool their homes. However, even these stock prices were hard hit asnon-cyclicals declined 20% for the year and utilities declined 29%.
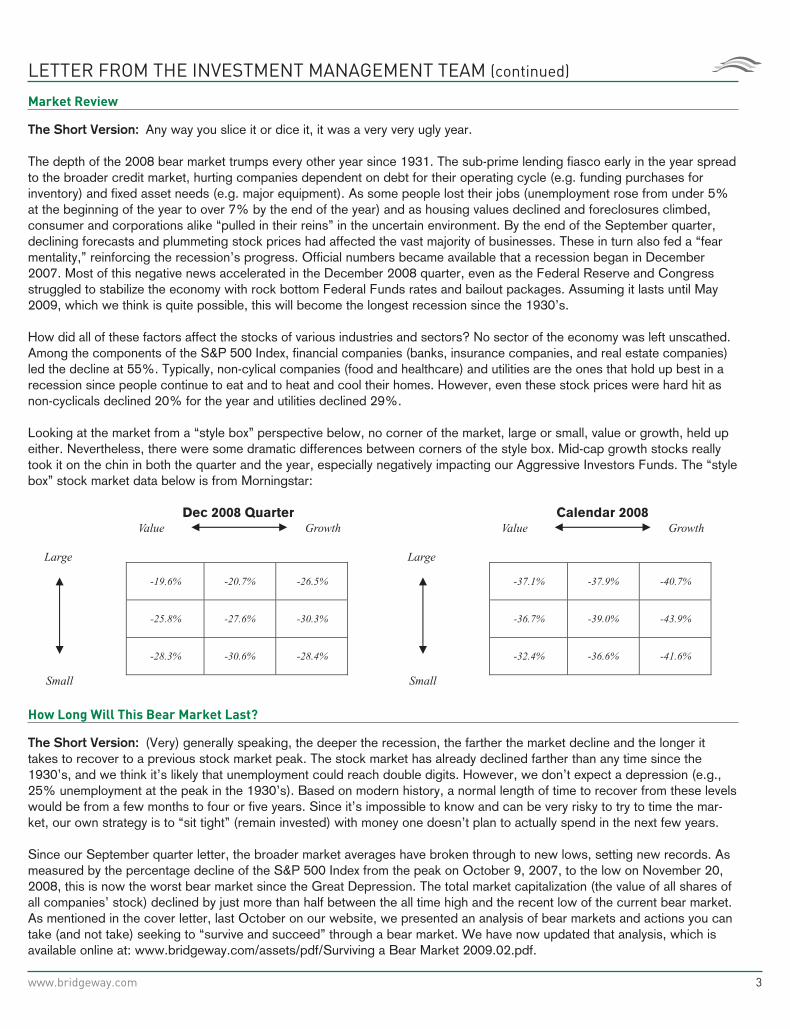
Looking at the market from a “style box” perspective below, no corner of the market, large or small, value or growth, held upeither. Nevertheless, there were some dramatic differences between corners of the style box. Mid-cap growth stocks reallytook it on the chin in both the quarter and the year, especially negatively impacting our Aggressive Investors Funds. The “stylebox” stock market data below is from Morningstar:
Dec 2008 Quarter Calendar 2008Value Growth
Large
Small
-19.6% -20.7% -26.5%
-25.8% -27.6% -30.3%
-28.3% -30.6% -28.4%
Value Growth
Large
Small
-37.1% -37.9% -40.7%
-36.7% -39.0% -43.9%
-32.4% -36.6% -41.6%
How Long Will This Bear Market Last?
The Short Version: (Very) generally speaking, the deeper the recession, the farther the market decline and the longer ittakes to recover to a previous stock market peak. The stock market has already declined farther than any time since the1930’s, and we think it’s likely that unemployment could reach double digits. However, we don’t expect a depression (e.g.,25% unemployment at the peak in the 1930’s). Based on modern history, a normal length of time to recover from these levelswould be from a few months to four or five years. Since it’s impossible to know and can be very risky to try to time the mar-ket, our own strategy is to “sit tight” (remain invested) with money one doesn’t plan to actually spend in the next few years.
Since our September quarter letter, the broader market averages have broken through to new lows, setting new records. Asmeasured by the percentage decline of the S&P 500 Index from the peak on October 9, 2007, to the low on November 20,2008, this is now the worst bear market since the Great Depression. The total market capitalization (the value of all shares ofall companies’ stock) declined by just more than half between the all time high and the recent low of the current bear market.As mentioned in the cover letter, last October on our website, we presented an analysis of bear markets and actions you cantake (and not take) seeking to “survive and succeed” through a bear market. We have now updated that analysis, which isavailable online at: www.bridgeway.com/assets/pdf/Surviving a Bear Market 2009.02.pdf.
www.bridgeway.com 3

LETTER FROM THE INVESTMENT MANAGEMENT TEAM (continued)
One question frequently asked by shareholders is, “How long will this bear market last?” Bridgeway is not a proponent ofmacroeconomic analysis to provide insights to stock market movements. However, our investment management team doesbelieve that history can provide good insights into risks. Along these lines, we believe the updated data in the table belowgives some relevant insights, which were outlined in the bear market piece referenced above. The conclusion we’d like tohighlight is that while most people focus on the magnitude of decline, we think a better place to focus—assuming that it reallyis long-term money you are investing in the stock market—is length of time to recovery. Thus, the relevance of the question,“How long will this bear market last?”
The data below which includes the Great Depression (first line), shows some correlation between the magnitude of arecession, the magnitude of a stock market decline, and the time it takes for the stock market to recover. One way to look atthis is that the stock market, as a leading indicator, is currently “signaling” that this recession will be one of the deeper andlonger ones since the 1930’s. We feel it is more likely that the unemployment rate will continue to climb in early 2009. The bigquestions are, “Has the recent market decline already incorporated the severity of this recession?” and “How long will therecovery take?” If you believe as we do, that the eventual peak of unemployment is on the order of magnitude of 10%, ratherthan the 25% of the Great Depression, it is reasonable to believe that the time to recovery will look more like recent history,rather than the longer timeframe of the Great Depression. If this is true, a “longer” time to recovery might be four or five moreyears. But keep in mind that it can also be very quick. In the bear market of 1980-1982, the unemployment rate hit the worstlevel since the Great Depression, over 10%. However the time to recovery from the trough was a remarkably fast 2 months.Our conclusion is three-fold: a) a reasonable timeframe to recovery is probably two months to four or five years, b) this likelyrange is quite variable (we translate: impossible to predict with accuracy), and c) it is thus a very bad idea to try to time it.From this we conclude again our philosophy that we have held since Bridgeway’s founding: don’t time the market and don’tput money in the market that you might need in the near term.
One other note to highlight from the table: with reference to the last line, based on recent market activity, we are not sure ifwe have reached the low for the current bear market.
Analysis of Bear Markets Since the Great Depression
Date of
Peak
Date of
Low
Date Back
to Previous
Peak
Magnitude
of Decline
Peak
Unemployment
Rate
# of Months
From Peak
to Low
# of Months
From Low to
Prev. Peak
Sep 16, 1929 Jun 1, 1932 Jan 3, 1945 -84.7% 24.9% 33 151*May 31, 1946 Oct 9, 1946 Oct 11, 1949 -25.5% 7.9% 5 36Dec 12, 1961 Jun 26, 1962 Apr 24, 1963 -26.9% 6.0% 6 10Feb 9, 1966 Oct 7, 1966 Mar 23, 1967 -20.4% 3.9% 8 5
Nov 29, 1968 May 26, 1970 Mar 15, 1971 -33.1% 6.1% 18 10Jan 11, 1973 Oct 4, 1974 July 9, 1976 -44.8% 9.0% 21 21Nov 28, 1980 Aug 12, 1982 Oct 7, 1982 -20.2% 10.4% 21 2Aug 25, 1987 Oct 19, 1987 May 17, 1989 -32.9% 6.0% 2 19Sep 1, 2000 Oct 9, 2002 Oct 23, 2006 -47.5% 6.3% 25 48Oct 9, 2007 Nov 20, 2008 NA -50.7% 7.2% 13
Avg. excluding Great Depression & current -31.4% 7.0% 13 19
Information for the current bear market is through December 31, 2008
* While the S&P Composite Index took twelve and a half years to return to the previous peak in the Great Depression, some market benchmarks touchedthe level of the previous high in seven years, before dipping down again.
Underperforming in a Down Market Year—A major dent in Bridgeway’s armor
The Short Version: With the exception of one Fund in one year, Bridgeway has never underperformed a primary marketbenchmark in a down year. Unfortunately, 2008 shattered that record.
Before 2008, Bridgeway had 15 (overlapping) data points about how the active funds we manage performed against marketbenchmarks in the same style. The down years were 1998 (ultra-small stocks only), 2000 (all stock categories), 2001 (largestocks), 2002 (all stock categories), and 2007 (ultra-small, micro-cap, small-cap value, and large-cap value stocks). In 14 ofthe 15 cases, we outperformed in these down market years. The only other periods of underperformance were in up market
4 Semi-Annual Report | December 31, 2008 (Unaudited)
LETTER FROM THE INVESTMENT MANAGEMENT TEAM (continued)
years. This was not surprising to us, since our stock picking model design, investment process, and risk process are alldesigned with an objective of not “adding to the pain” by underperforming in a down market. That record was reasonablyshattered in 2008—the worst stock market calendar year since 1931—as seven of nine actively managed Bridgeway Fundsunderperformed their market benchmarks and only five of all eleven Bridgeway Funds outperformed their peer benchmarks.The following several sections attempt to answer the questions “How were our Funds positioned with respect to the bearmarket?” and “What contributed to the dismal performance? ”and “Do we think quantitative investing will work again in thefuture?”
Monday Morning Quarterbacking for 2008
The Short Version: At the beginning of 2008, if you knew this was going to be a bad year led by the financial sector, knewwe were positioned light on financial stocks and light on companies with debt, you might think that at least this would be agood year on a relative basis. Not so for a majority of our Funds.
In a calendar year in which only four of our eleven funds beat their market benchmarks and five beat their peer benchmarks,it’s appropriate to look back and reflect, to understand the reasons for lagging returns where they occurred. Each Fund sec-tion below will address this by individual Fund, but since some of the reasons are common across a number of Funds, we’dlike to address these in summary fashion, concentrating on our actively managed Funds, and specifically our highest octaneFunds (Aggressive Investors 1 and 2)—which performed the most poorly.
If all we knew at the beginning of the calendar year was that a) we were entering a recession and the worst bear market ofthe last 75 years, b) Bridgeway has outperformed our market benchmarks in down years the vast majority of the time, c) thisbear market would be led by a financial crisis and financial stocks would fall the farthest of any sector, d) our models weresignificantly underweighted in financial stocks, e) the stocks we did own had, in aggregate, less debt versus their peers, andwere thus more conservatively positioned with respect to the negative effects of financial leverage in a recession, and f) wewere significantly overweighted in the stocks that historically have correlated least well with the overall market (i.e., in stocksthat provided the most diversification historically), we would conclude that chances were strong that it would be a rough yearon an absolute basis, but that we would likely provide some nice “cushion” against the fall, as we have in most previous downmarket years. Unfortunately, this was not so across most of our Funds, and two, Aggressive Investors 1 and 2, under-performed their market benchmarks by double digit amounts. What happened?
Dissecting the 2008 Underperformance of Aggressive Investors 1 and 2
The Short Version: As with the September quarter, the precipitous decline of commodity prices took a strong bite out ofsome of our Funds.
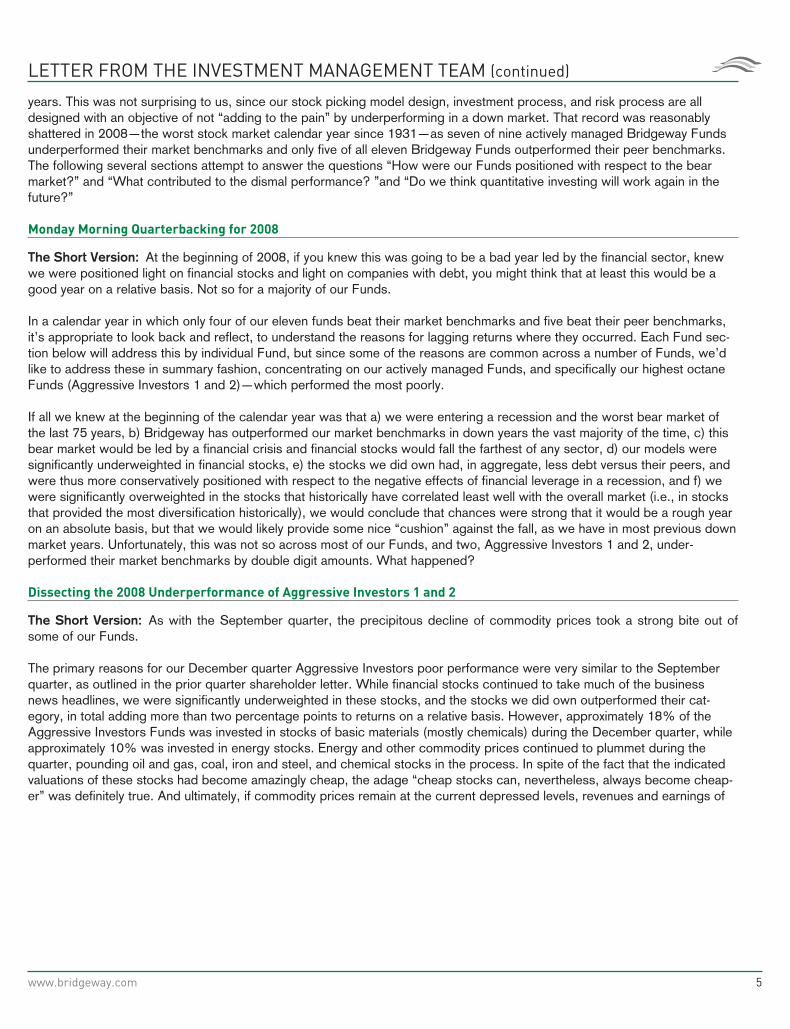
The primary reasons for our December quarter Aggressive Investors poor performance were very similar to the Septemberquarter, as outlined in the prior quarter shareholder letter. While financial stocks continued to take much of the businessnews headlines, we were significantly underweighted in these stocks, and the stocks we did own outperformed their cat-egory, in total adding more than two percentage points to returns on a relative basis. However, approximately 18% of theAggressive Investors Funds was invested in stocks of basic materials (mostly chemicals) during the December quarter, whileapproximately 10% was invested in energy stocks. Energy and other commodity prices continued to plummet during thequarter, pounding oil and gas, coal, iron and steel, and chemical stocks in the process. In spite of the fact that the indicatedvaluations of these stocks had become amazingly cheap, the adage “cheap stocks can, nevertheless, always become cheap-er” was definitely true. And ultimately, if commodity prices remain at the current depressed levels, revenues and earnings of
www.bridgeway.com 5
LETTER FROM THE INVESTMENT MANAGEMENT TEAM (continued)
these companies dry up, along with the stellar cash flows and strong balance sheets. The graph below presents the prices ofcrude oil, just one example of commodity prices, which nevertheless tells the story.
West Texas Crude Oil June 30, 2008 to December 31, 2008
6/3
0/0
8
7/7
/08
7/1
4/0
8
7/2
1/0
8
7/2
8/0
8
8/4
/08
8/1
1/0
8
8/1
8/0
8
8/2
5/0
8
9/1
/08
9/8
/08
9/1
5/0
8
9/2
2/0
8
9/2
9/0
8
10/6
/08
10/1
3/0
8
10/2
0/0
8
10/2
7/0
8
11/3
/08
11/1
0/0
8
11/1
7/0
8
11/2
4/0
8
12/1
/08
12/8
/08
12/2
2/0
8
12/1
5/0
8
12/2
9/0
8
$30
$40
$50
$60
$70
$80
$90
$100
$110
$120
$130
$140
$150
$ P
er B
arre
l
Cash is King or The Effects of Cash on Relative Performance
The Short Version: The average mutual fund maintains about 5% cash. This provides some cushion in a severe bear market,but is a significant drag on performance over the long haul. Since our strategy is based on long-term performance, we seek“full investment” or close to zero cash.
In a bear market and recession, it’s great to be sitting on a bunch of cash. In fact, coming into the December quarter, theaverage domestic equity fund held more than 5% of net assets in cash. Two advantages of this are that you can theoreticallydeploy this cash to invest in stocks that are much cheaper than at the market peak, and mathematically, it shields a Fund fromsome of the free fall of a bear market. For example, if a Fund held 5% cash from the market peak in October 2007 throughthe 50% decline in November 2008, the cash would add roughly 21⁄2 percent return relative to the broader market. That’s notchump change. So why did Aggressive Investors 1 and 2 hold almost no cash during this period?
One concept in engineering and economics is “opportunity cost,” or the cost of an opportunity that must be forgone in order topursue a certain action. The benefit of a fund holding cash is improved relative performance in a downturn, and potentially put-ting that cash to work at a favorable price. The disadvantage or opportunity cost is “cash drag” in an up market. Thus, if theaverage interest on cash is about three and a half percent per year and the average return of stocks is ten percent per year (theaverage over the last eight decades including the Great Depression and current bear market), you will come out ahead owningstocks over the long haul. This begs the question of whether a Fund manager could hold little or no cash on the way up andmore on the way down. However, previous studies indicate that the reverse is true; managers tend to move into cash closer to amarket bottom than a market top. Since we think trying to time the market is a very bad idea, we think holding cash is a doublybad idea.
Top-Down Risk Control
The Short Version: Our process in managing the risk of industry and sector concentration did not work as well in 2008 inour Aggressive Investors’ styles as in some previous years.
Part of Bridgeway’s risk management process is to review sector and industry concentrations (how much we own of chem-ical stocks or technology stocks, for example) to ensure that related stocks don’t all decline at the same time. For example,late in 1999, technology stocks comprised too large a percentage of Aggressive Investors 1 Fund’s net assets and we bothput a hold on new buys and looked for early opportunities to trim back on these stocks, even though our stock picking modelscontinued to identify new technology buys. Our trimming helped cushion the stock market decline in 2000, as these stockswere particularly hard hit. Similarly, this risk “hold/trim” process kicked in with respect to internet stocks in Micro-Cap LimitedFund in 2003 as these stocks came roaring back. Energy stocks received the same treatment in Aggressive Investors 1 and2 in 2005, as energy comprised a concentrated 35% of our Fund in September of that year. A natural question, then, is “Whydidn’t this process ‘kick in’ with respect to Aggressive Investors’ concentration in basic materials and energy stocks?
6 Semi-Annual Report | December 31, 2008 (Unaudited)
LETTER FROM THE INVESTMENT MANAGEMENT TEAM (continued)
The short answer is, “they did, just not as early and as dramatically as would have been really helpful.” In fact, by late summerboth basic materials and energy stocks were on our “watch list” with respect to risk. We noticed that these two groups hadbecome unusually strongly correlated with each other and we put a “hold” on the sum of these two groups. Thus, we did, infact, buy fewer of these stocks than we would have otherwise. However, the risk was not appraised to be so dramatic thatwe aggressively sold these stocks. Thus, we bore significantly more damage from a concentrated part of our Fund than atany time in Bridgeway’s history, or John’s experience before Bridgeway.
Does Bridgeway Think Quantitative Investing Will Work in the Future?
The Short Version: Not all of our Funds underperformed in 2008, but our highest octane ones certainly did. The statisticalconcept of “reversion to the mean” would indicate that the “pendulum” may swing back the other direction toward positiverelative performance, but we advise people against trying to time this. Overall, we have faith in our process, and actual historyover 14 years gives us both experience and confidence.
Focusing on Aggressive Investors 1 as one of our longest running actively managed funds, our quantitative models havehelped us beat our primary market benchmark in nine of fourteen years since inception and by an average of 5.8% per yearas presented on page 10. One to two-year periods of underperformance have been followed by periods of outperformance.We can’t make any representations about future performance, but we can state definitively what we think are the advantagesof quantitative investing:
• taking emotion out of the process. Emotions tend to push investors in the direction of selling when stocks are low andbuying after a runup. This is a formula for financial disaster, and quantitative models are extremely helpful in keeping usdisciplined and unemotional.
• lack of dependence on a single person (a four-person team runs the models, and this team is supported by experi-enced staff in trading, accounting, compliance, information technology, etc.)
• a historical framework to assess risk.• an efficient structure which feeds a low cost structure.• the ability to back-test, learn and refine with real, historic data.
Why Did Bridgeway’s More Actively Managed Funds Perform So Much Better in the Bear Market of 2000-2002?
The Short Version: The 2000-2002 bear market was driven more by company economics and our models did very well on arelative basis. Event driven markets, or ones where there is not a strong relationship between stock prices and company leveleconomic results are not as favorable to our models overall.
Each bear market—and bull market, for the matter—has its own unique characteristics. The bear market of 2000-2002 wasdriven by fundamental economic factors that were measurable based on company level financial data. Relative valuations alsoplayed a big role. Our quantitative models did a good job of picking up on these valuations and trends. For example, Internetstocks, many of which had little in the way of actual revenues, earnings, and cash flows were among those hardest hit. Since,in aggregate (this is not true across the board), our models look for these financial fundamentals and rank their attractiveness,we were “light” on those stocks which were hardest hit. By contrast, the bear market of 2008 was very fast moving and someof the companies hardest hit started out the bear market with very strong valuations based on historical standards. Never-theless, company fundamentals were eventually affected, either by plummeting commodity prices, as highlighted above, orwith deteriorating financial performance as various real aspects of the recession kicked into high gear. Examples of the latterare a decline in capital spending and shrinking inventories, as companies scaled back in anticipation of lean times and as itbecame very difficult or impossible to plan for future demand for a company’s goods or services. Some of this is fear drivenwhich feeds on itself. Event driven markets, or ones where there is a delinking of company level economic results and stockprice movements tend to be a poorer environment for our models.
“Bounce-Back” Data
The Short Version: When the markets do eventually turn around, will our Funds bounce back with them? Only time will tell,but we can look at two smaller data points on this topic. With respect to our higher octane actively managed Funds—thosethat dropped the most in the downturn—both of these data points are positive.
One of our biggest concerns in a precipitous bear market is that we might do more poorly than the market on the way down,as we have—our first market-lagging returns in a down market year—only to have our models then rotate into moreconservative stocks, which do more poorly on the way back up, if the latter also happened precipitously. There are somesafeguards in Bridgeway’s process to protect against this, but we’ve been looking for some periods where the marketbounces back off a low point to measure our Funds’ reaction. Now we have a couple of confirming data points in the currentbear market. On October 13, 2008, for example, the S&P 500 Index popped back up 11.58% after a horrible prior week.Bridgeway Aggressive Investors 1 and 2 popped back up 14.99% and 15.20%, respectively. More importantly—but still just
www.bridgeway.com 7
LETTER FROM THE INVESTMENT MANAGEMENT TEAM (continued)
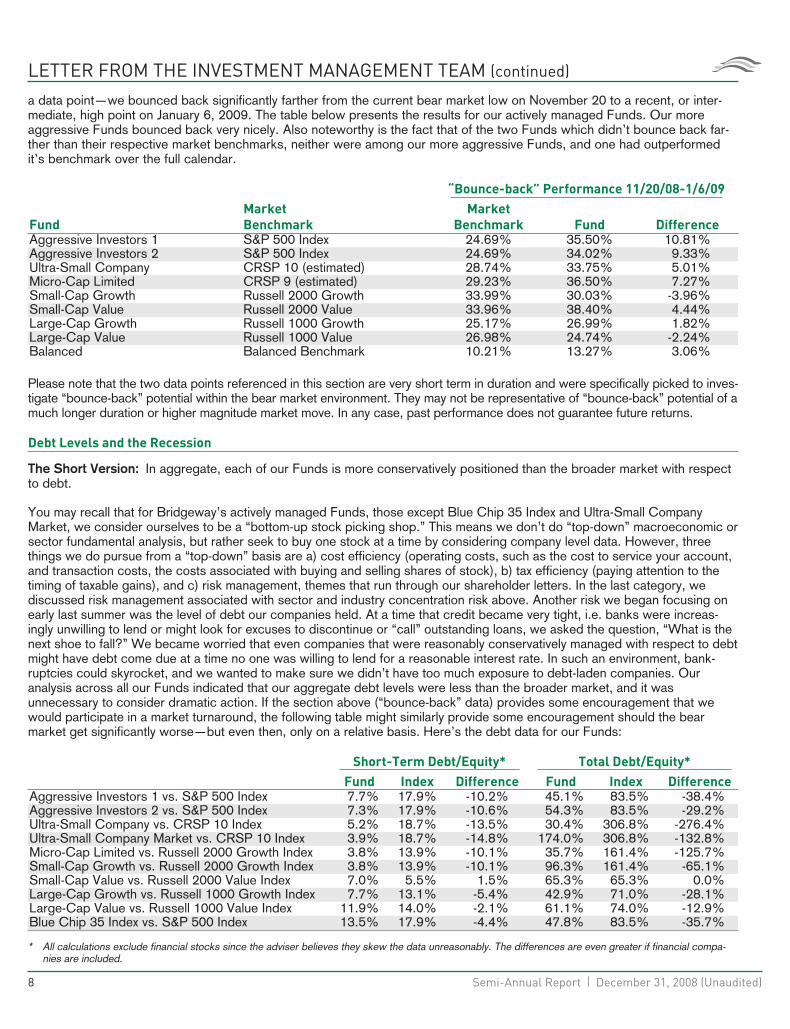
a data point—we bounced back significantly farther from the current bear market low on November 20 to a recent, or inter-mediate, high point on January 6, 2009. The table below presents the results for our actively managed Funds. Our moreaggressive Funds bounced back very nicely. Also noteworthy is the fact that of the two Funds which didn’t bounce back far-ther than their respective market benchmarks, neither were among our more aggressive Funds, and one had outperformedit’s benchmark over the full calendar.
“Bounce-back” Performance 11/20/08-1/6/09
Fund
Market
Benchmark
Market
Benchmark Fund DifferenceAggressive Investors 1 S&P 500 Index 24.69% 35.50% 10.81%Aggressive Investors 2 S&P 500 Index 24.69% 34.02% 9.33%Ultra-Small Company CRSP 10 (estimated) 28.74% 33.75% 5.01%Micro-Cap Limited CRSP 9 (estimated) 29.23% 36.50% 7.27%Small-Cap Growth Russell 2000 Growth 33.99% 30.03% -3.96%Small-Cap Value Russell 2000 Value 33.96% 38.40% 4.44%Large-Cap Growth Russell 1000 Growth 25.17% 26.99% 1.82%Large-Cap Value Russell 1000 Value 26.98% 24.74% -2.24%Balanced Balanced Benchmark 10.21% 13.27% 3.06%
Please note that the two data points referenced in this section are very short term in duration and were specifically picked to inves-tigate “bounce-back” potential within the bear market environment. They may not be representative of “bounce-back” potential of amuch longer duration or higher magnitude market move. In any case, past performance does not guarantee future returns.
Debt Levels and the Recession
The Short Version: In aggregate, each of our Funds is more conservatively positioned than the broader market with respectto debt.
You may recall that for Bridgeway’s actively managed Funds, those except Blue Chip 35 Index and Ultra-Small CompanyMarket, we consider ourselves to be a “bottom-up stock picking shop.” This means we don’t do “top-down” macroeconomic orsector fundamental analysis, but rather seek to buy one stock at a time by considering company level data. However, threethings we do pursue from a “top-down” basis are a) cost efficiency (operating costs, such as the cost to service your account,and transaction costs, the costs associated with buying and selling shares of stock), b) tax efficiency (paying attention to thetiming of taxable gains), and c) risk management, themes that run through our shareholder letters. In the last category, wediscussed risk management associated with sector and industry concentration risk above. Another risk we began focusing onearly last summer was the level of debt our companies held. At a time that credit became very tight, i.e. banks were increas-ingly unwilling to lend or might look for excuses to discontinue or “call” outstanding loans, we asked the question, “What is thenext shoe to fall?” We became worried that even companies that were reasonably conservatively managed with respect to debtmight have debt come due at a time no one was willing to lend for a reasonable interest rate. In such an environment, bank-ruptcies could skyrocket, and we wanted to make sure we didn’t have too much exposure to debt-laden companies. Ouranalysis across all our Funds indicated that our aggregate debt levels were less than the broader market, and it wasunnecessary to consider dramatic action. If the section above (“bounce-back” data) provides some encouragement that wewould participate in a market turnaround, the following table might similarly provide some encouragement should the bearmarket get significantly worse—but even then, only on a relative basis. Here’s the debt data for our Funds:
Short-Term Debt/Equity* Total Debt/Equity*
Fund Index Difference Fund Index DifferenceAggressive Investors 1 vs. S&P 500 Index 7.7% 17.9% -10.2% 45.1% 83.5% -38.4%Aggressive Investors 2 vs. S&P 500 Index 7.3% 17.9% -10.6% 54.3% 83.5% -29.2%Ultra-Small Company vs. CRSP 10 Index 5.2% 18.7% -13.5% 30.4% 306.8% -276.4%Ultra-Small Company Market vs. CRSP 10 Index 3.9% 18.7% -14.8% 174.0% 306.8% -132.8%Micro-Cap Limited vs. Russell 2000 Growth Index 3.8% 13.9% -10.1% 35.7% 161.4% -125.7%Small-Cap Growth vs. Russell 2000 Growth Index 3.8% 13.9% -10.1% 96.3% 161.4% -65.1%Small-Cap Value vs. Russell 2000 Value Index 7.0% 5.5% 1.5% 65.3% 65.3% 0.0%Large-Cap Growth vs. Russell 1000 Growth Index 7.7% 13.1% -5.4% 42.9% 71.0% -28.1%Large-Cap Value vs. Russell 1000 Value Index 11.9% 14.0% -2.1% 61.1% 74.0% -12.9%Blue Chip 35 Index vs. S&P 500 Index 13.5% 17.9% -4.4% 47.8% 83.5% -35.7%
* All calculations exclude financial stocks since the adviser believes they skew the data unreasonably. The differences are even greater if financial compa-nies are included.
8 Semi-Annual Report | December 31, 2008 (Unaudited)
LETTER FROM THE INVESTMENT MANAGEMENT TEAM (continued)
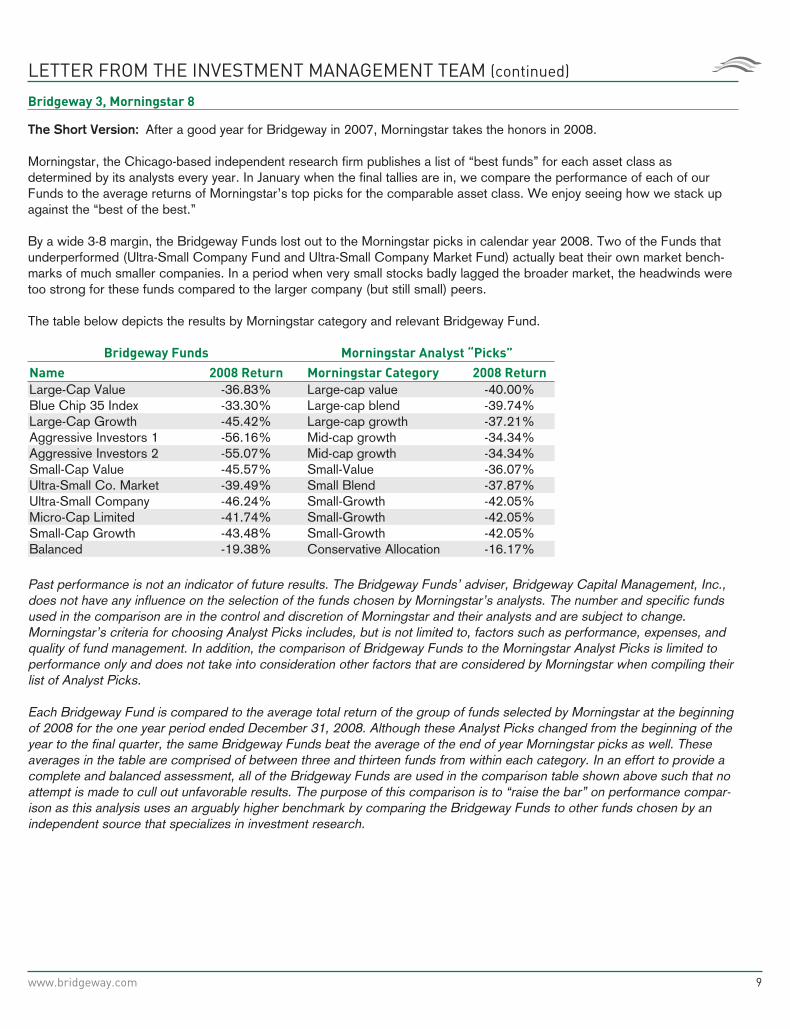
Bridgeway 3, Morningstar 8
The Short Version: After a good year for Bridgeway in 2007, Morningstar takes the honors in 2008.
Morningstar, the Chicago-based independent research firm publishes a list of “best funds” for each asset class asdetermined by its analysts every year. In January when the final tallies are in, we compare the performance of each of ourFunds to the average returns of Morningstar’s top picks for the comparable asset class. We enjoy seeing how we stack upagainst the “best of the best.”
By a wide 3-8 margin, the Bridgeway Funds lost out to the Morningstar picks in calendar year 2008. Two of the Funds thatunderperformed (Ultra-Small Company Fund and Ultra-Small Company Market Fund) actually beat their own market bench-marks of much smaller companies. In a period when very small stocks badly lagged the broader market, the headwinds weretoo strong for these funds compared to the larger company (but still small) peers.
The table below depicts the results by Morningstar category and relevant Bridgeway Fund.
Bridgeway Funds Morningstar Analyst “Picks”
Name 2008 Return Morningstar Category 2008 Return
Large-Cap Value -36.83% Large-cap value -40.00%Blue Chip 35 Index -33.30% Large-cap blend -39.74%Large-Cap Growth -45.42% Large-cap growth -37.21%Aggressive Investors 1 -56.16% Mid-cap growth -34.34%Aggressive Investors 2 -55.07% Mid-cap growth -34.34%Small-Cap Value -45.57% Small-Value -36.07%Ultra-Small Co. Market -39.49% Small Blend -37.87%Ultra-Small Company -46.24% Small-Growth -42.05%Micro-Cap Limited -41.74% Small-Growth -42.05%Small-Cap Growth -43.48% Small-Growth -42.05%Balanced -19.38% Conservative Allocation -16.17%
Past performance is not an indicator of future results. The Bridgeway Funds’ adviser, Bridgeway Capital Management, Inc.,does not have any influence on the selection of the funds chosen by Morningstar’s analysts. The number and specific fundsused in the comparison are in the control and discretion of Morningstar and their analysts and are subject to change.Morningstar’s criteria for choosing Analyst Picks includes, but is not limited to, factors such as performance, expenses, andquality of fund management. In addition, the comparison of Bridgeway Funds to the Morningstar Analyst Picks is limited toperformance only and does not take into consideration other factors that are considered by Morningstar when compiling theirlist of Analyst Picks.
Each Bridgeway Fund is compared to the average total return of the group of funds selected by Morningstar at the beginningof 2008 for the one year period ended December 31, 2008. Although these Analyst Picks changed from the beginning of theyear to the final quarter, the same Bridgeway Funds beat the average of the end of year Morningstar picks as well. Theseaverages in the table are comprised of between three and thirteen funds from within each category. In an effort to provide acomplete and balanced assessment, all of the Bridgeway Funds are used in the comparison table shown above such that noattempt is made to cull out unfavorable results. The purpose of this comparison is to “raise the bar” on performance compar-ison as this analysis uses an arguably higher benchmark by comparing the Bridgeway Funds to other funds chosen by anindependent source that specializes in investment research.
www.bridgeway.com 9
Aggressive Investors 1 FundMANAGER’S COMMENTARY(Unaudited)
December 31, 2008
Dear Fellow Aggressive Investors 1 Fund Shareholder,
Our Fund’s performance for the December 31, 2008 quarter was the worst quarterly performance for both our Fund and ourperformance benchmarks during our Fund’s fourteen year history. It was our fifth worst quarter on the basis of returns relativeto our primary market benchmark. Aggressive Investors 1 declined 32.80%, compared to declines of 21.94% for the S&P500 Index (our primary market benchmark), 22.59% for the Lipper Capital Appreciation Funds Index (our peer benchmark),and 26.12% for the Russell 2000 Index of small companies. It was an awful quarter.
For the six-month “semi-annual” period ending December 31, 2008, our Fund declined 53.13%, versus declines of 28.48%for the S&P 500 Index, 35.71% for the Lipper Capital Appreciation Funds Index , and 26.94% for the Russell 2000 Index ofsmall companies. This period was a “perfect storm” of poor positioning: a) a large number of more “growth leaning” compa-nies (those with historical faster growing earnings, for example), b) good, but not strong enough representation among thelargest “blue chip” companies that held up best, c) none of our different stock picking models “picked up the slack” in thisparticular downturn, and d) especially damaging exposure to energy and chemical companies during a period when commod-ity prices fell off a cliff.
In some other periods of quarterly underperformance, our preceding and/or following quarters were strong enough to makeup for the poor quarter. For example, our second worst quarter of underperformance, September 2006, was followed by fivemarket-beating quarters and preceded by two. Our third worst, December 1997, was preceded by two and followed by one.And our fourth worst quarter, September 1998, was followed by the longest running outperformance in our history (eightquarters). With the back to back September and December quarters, however, we have a very significant “hole” from whichto work our way back.
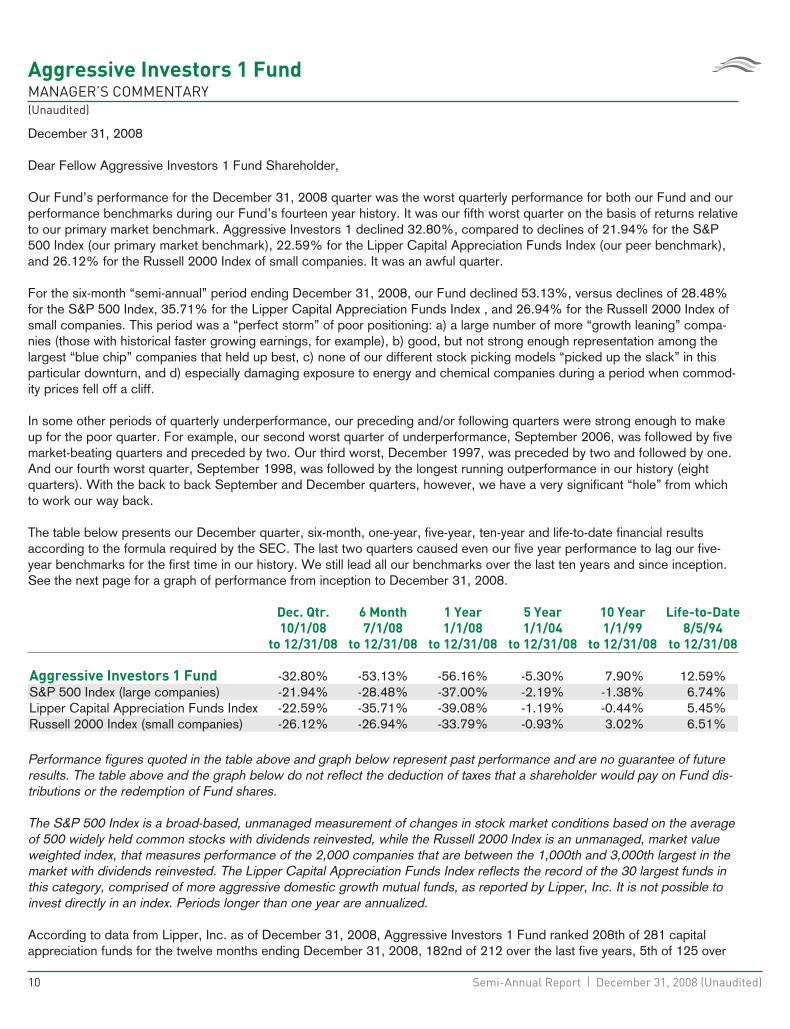
The table below presents our December quarter, six-month, one-year, five-year, ten-year and life-to-date financial resultsaccording to the formula required by the SEC. The last two quarters caused even our five year performance to lag our five-year benchmarks for the first time in our history. We still lead all our benchmarks over the last ten years and since inception.See the next page for a graph of performance from inception to December 31, 2008.
Dec. Qtr.
10/1/08
to 12/31/08
6 Month
7/1/08
to 12/31/08
1 Year
1/1/08
to 12/31/08
5 Year
1/1/04
to 12/31/08
10 Year
1/1/99
to 12/31/08
Life-to-Date
8/5/94
to 12/31/08
Aggressive Investors 1 Fund -32.80% -53.13% -56.16% -5.30% 7.90% 12.59%S&P 500 Index (large companies) -21.94% -28.48% -37.00% -2.19% -1.38% 6.74%Lipper Capital Appreciation Funds Index -22.59% -35.71% -39.08% -1.19% -0.44% 5.45%Russell 2000 Index (small companies) -26.12% -26.94% -33.79% -0.93% 3.02% 6.51%
Performance figures quoted in the table above and graph below represent past performance and are no guarantee of futureresults. The table above and the graph below do not reflect the deduction of taxes that a shareholder would pay on Fund dis-tributions or the redemption of Fund shares.
The S&P 500 Index is a broad-based, unmanaged measurement of changes in stock market conditions based on the averageof 500 widely held common stocks with dividends reinvested, while the Russell 2000 Index is an unmanaged, market valueweighted index, that measures performance of the 2,000 companies that are between the 1,000th and 3,000th largest in themarket with dividends reinvested. The Lipper Capital Appreciation Funds Index reflects the record of the 30 largest funds inthis category, comprised of more aggressive domestic growth mutual funds, as reported by Lipper, Inc. It is not possible toinvest directly in an index. Periods longer than one year are annualized.
According to data from Lipper, Inc. as of December 31, 2008, Aggressive Investors 1 Fund ranked 208th of 281 capitalappreciation funds for the twelve months ending December 31, 2008, 182nd of 212 over the last five years, 5th of 125 over
10 Semi-Annual Report | December 31, 2008 (Unaudited)
Aggressive Investors 1 FundMANAGER’S COMMENTARY (continued)(Unaudited)
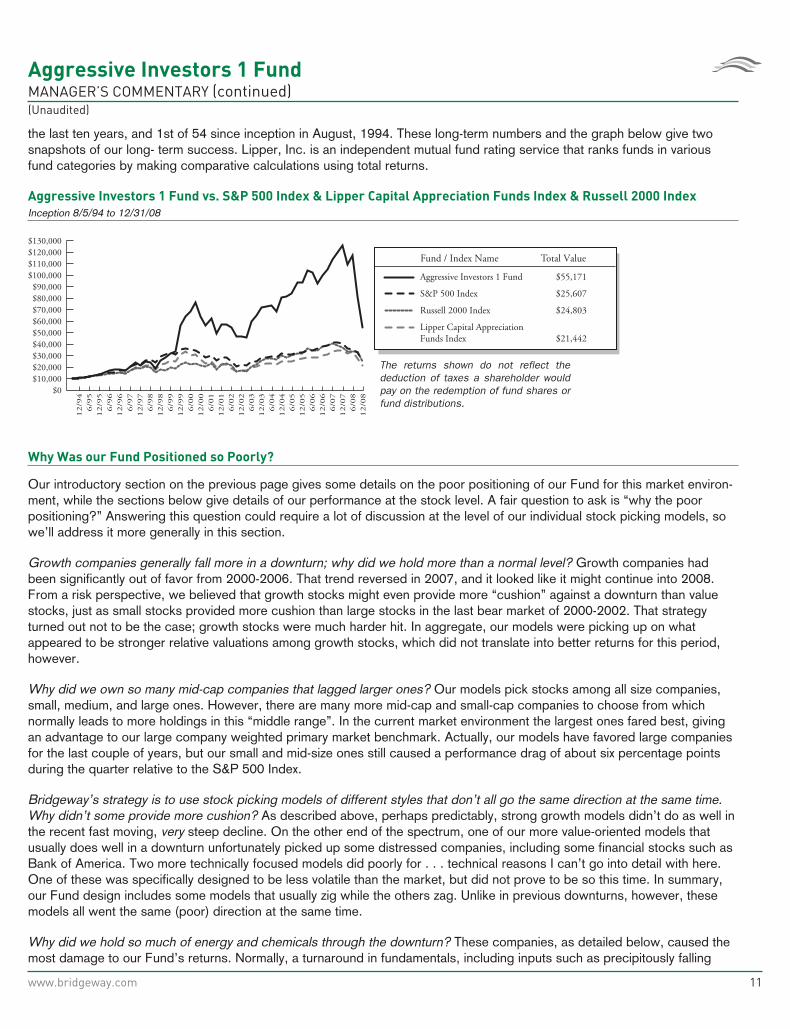
the last ten years, and 1st of 54 since inception in August, 1994. These long-term numbers and the graph below give twosnapshots of our long- term success. Lipper, Inc. is an independent mutual fund rating service that ranks funds in variousfund categories by making comparative calculations using total returns.
Aggressive Investors 1 Fund vs. S&P 500 Index & Lipper Capital Appreciation Funds Index & Russell 2000 Index
Inception 8/5/94 to 12/31/08
6/0
412/0
36/0
312/0
2
12/0
86/0
812/0
76/0
712/0
66/0
612/0
56/0
512/0
4
6/0
212/0
16/0
112/0
06/0
012/9
96/9
912/9
86/9
812/9
76/9
712/9
66/9
612/9
56/9
512/9
4
Fund / Index Name Total Value
S&P 500 Index
Russell 2000 Index
Lipper Capital AppreciationFunds Index
Aggressive Investors 1 Fund
The returns shown do not reflect the deduction of taxes a shareholder would pay on the redemption of fund shares or fund distributions.
$55,171
$25,607
$24,803
$21,442
$0$10,000$20,000$30,000$40,000$50,000$60,000$70,000$80,000$90,000
$100,000$110,000$120,000$130,000
Why Was our Fund Positioned so Poorly?
Our introductory section on the previous page gives some details on the poor positioning of our Fund for this market environ-ment, while the sections below give details of our performance at the stock level. A fair question to ask is “why the poorpositioning?” Answering this question could require a lot of discussion at the level of our individual stock picking models, sowe’ll address it more generally in this section.
Growth companies generally fall more in a downturn; why did we hold more than a normal level? Growth companies hadbeen significantly out of favor from 2000-2006. That trend reversed in 2007, and it looked like it might continue into 2008.From a risk perspective, we believed that growth stocks might even provide more “cushion” against a downturn than valuestocks, just as small stocks provided more cushion than large stocks in the last bear market of 2000-2002. That strategyturned out not to be the case; growth stocks were much harder hit. In aggregate, our models were picking up on whatappeared to be stronger relative valuations among growth stocks, which did not translate into better returns for this period,however.
Why did we own so many mid-cap companies that lagged larger ones? Our models pick stocks among all size companies,small, medium, and large ones. However, there are many more mid-cap and small-cap companies to choose from whichnormally leads to more holdings in this “middle range”. In the current market environment the largest ones fared best, givingan advantage to our large company weighted primary market benchmark. Actually, our models have favored large companiesfor the last couple of years, but our small and mid-size ones still caused a performance drag of about six percentage pointsduring the quarter relative to the S&P 500 Index.
Bridgeway’s strategy is to use stock picking models of different styles that don’t all go the same direction at the same time.Why didn’t some provide more cushion? As described above, perhaps predictably, strong growth models didn’t do as well inthe recent fast moving, very steep decline. On the other end of the spectrum, one of our more value-oriented models thatusually does well in a downturn unfortunately picked up some distressed companies, including some financial stocks such asBank of America. Two more technically focused models did poorly for . . . technical reasons I can’t go into detail with here.One of these was specifically designed to be less volatile than the market, but did not prove to be so this time. In summary,our Fund design includes some models that usually zig while the others zag. Unlike in previous downturns, however, thesemodels all went the same (poor) direction at the same time.
Why did we hold so much of energy and chemicals through the downturn? These companies, as detailed below, caused themost damage to our Fund’s returns. Normally, a turnaround in fundamentals, including inputs such as precipitously falling
www.bridgeway.com 11
Aggressive Investors 1 FundMANAGER’S COMMENTARY (continued)(Unaudited)
commodity prices would result in a sell signal. However, for some models, if the stock price declines at a rate much fasterthan the fundamentals (e.g. net income) of a company, it may not create a sell signal in anticipation of a “bounce back.” Whilethis has worked in some previous market environments, and contributed to the positive “bounce back” phenomenon onpage 7, it added to the pain of the downturn in October and most of November.
Detailed Explanation of Quarterly Performance—Some stocks (slightly) cushioned the blow
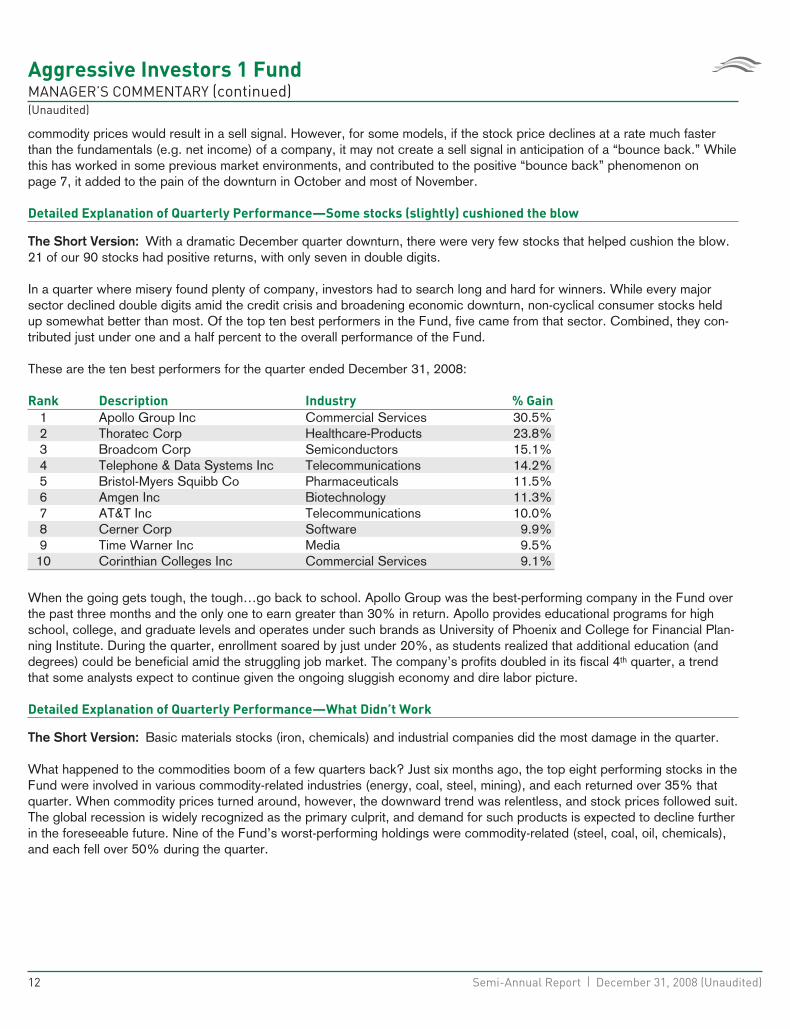
The Short Version: With a dramatic December quarter downturn, there were very few stocks that helped cushion the blow.21 of our 90 stocks had positive returns, with only seven in double digits.
In a quarter where misery found plenty of company, investors had to search long and hard for winners. While every majorsector declined double digits amid the credit crisis and broadening economic downturn, non-cyclical consumer stocks heldup somewhat better than most. Of the top ten best performers in the Fund, five came from that sector. Combined, they con-tributed just under one and a half percent to the overall performance of the Fund.
These are the ten best performers for the quarter ended December 31, 2008:
Rank Description Industry % Gain
1 Apollo Group Inc Commercial Services 30.5%2 Thoratec Corp Healthcare-Products 23.8%3 Broadcom Corp Semiconductors 15.1%4 Telephone & Data Systems Inc Telecommunications 14.2%5 Bristol-Myers Squibb Co Pharmaceuticals 11.5%6 Amgen Inc Biotechnology 11.3%7 AT&T Inc Telecommunications 10.0%8 Cerner Corp Software 9.9%9 Time Warner Inc Media 9.5%
10 Corinthian Colleges Inc Commercial Services 9.1%
When the going gets tough, the tough…go back to school. Apollo Group was the best-performing company in the Fund overthe past three months and the only one to earn greater than 30% in return. Apollo provides educational programs for highschool, college, and graduate levels and operates under such brands as University of Phoenix and College for Financial Plan-ning Institute. During the quarter, enrollment soared by just under 20%, as students realized that additional education (anddegrees) could be beneficial amid the struggling job market. The company’s profits doubled in its fiscal 4th quarter, a trendthat some analysts expect to continue given the ongoing sluggish economy and dire labor picture.
Detailed Explanation of Quarterly Performance—What Didn’t Work
The Short Version: Basic materials stocks (iron, chemicals) and industrial companies did the most damage in the quarter.
What happened to the commodities boom of a few quarters back? Just six months ago, the top eight performing stocks in theFund were involved in various commodity-related industries (energy, coal, steel, mining), and each returned over 35% thatquarter. When commodity prices turned around, however, the downward trend was relentless, and stock prices followed suit.The global recession is widely recognized as the primary culprit, and demand for such products is expected to decline furtherin the foreseeable future. Nine of the Fund’s worst-performing holdings were commodity-related (steel, coal, oil, chemicals),and each fell over 50% during the quarter.
12 Semi-Annual Report | December 31, 2008 (Unaudited)
Aggressive Investors 1 FundMANAGER’S COMMENTARY (continued)(Unaudited)
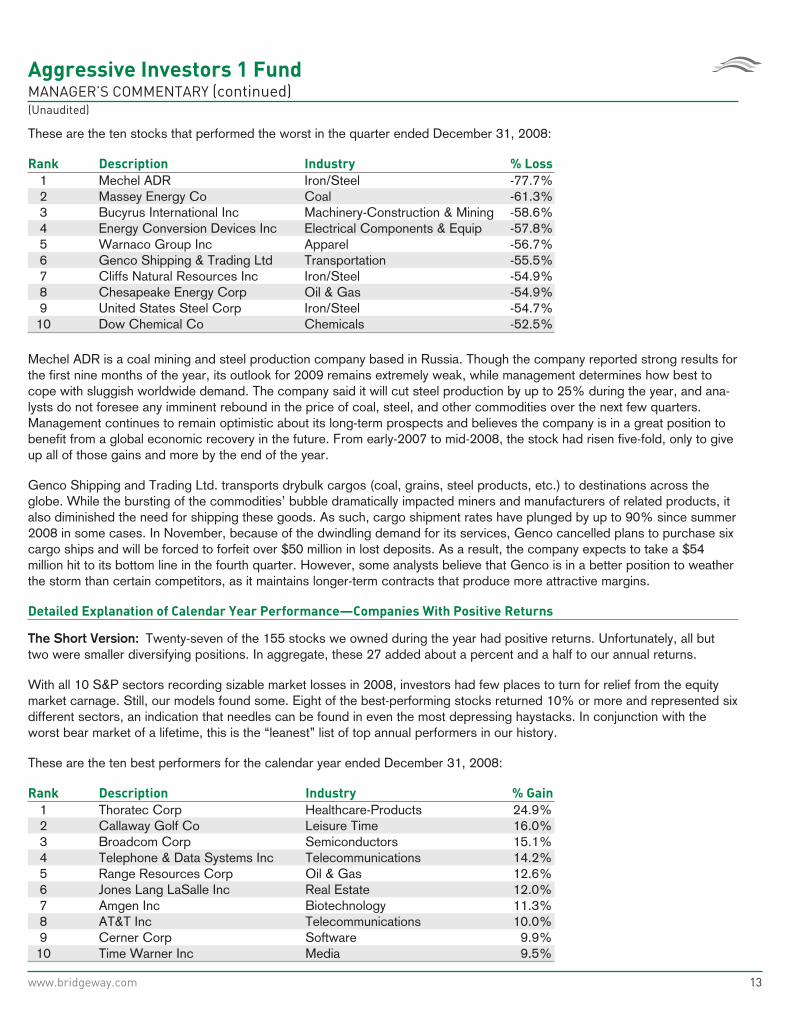
These are the ten stocks that performed the worst in the quarter ended December 31, 2008:
Rank Description Industry % Loss
1 Mechel ADR Iron/Steel -77.7%2 Massey Energy Co Coal -61.3%3 Bucyrus International Inc Machinery-Construction & Mining -58.6%4 Energy Conversion Devices Inc Electrical Components & Equip -57.8%5 Warnaco Group Inc Apparel -56.7%6 Genco Shipping & Trading Ltd Transportation -55.5%7 Cliffs Natural Resources Inc Iron/Steel -54.9%8 Chesapeake Energy Corp Oil & Gas -54.9%9 United States Steel Corp Iron/Steel -54.7%
10 Dow Chemical Co Chemicals -52.5%
Mechel ADR is a coal mining and steel production company based in Russia. Though the company reported strong results forthe first nine months of the year, its outlook for 2009 remains extremely weak, while management determines how best tocope with sluggish worldwide demand. The company said it will cut steel production by up to 25% during the year, and ana-lysts do not foresee any imminent rebound in the price of coal, steel, and other commodities over the next few quarters.Management continues to remain optimistic about its long-term prospects and believes the company is in a great position tobenefit from a global economic recovery in the future. From early-2007 to mid-2008, the stock had risen five-fold, only to giveup all of those gains and more by the end of the year.
Genco Shipping and Trading Ltd. transports drybulk cargos (coal, grains, steel products, etc.) to destinations across theglobe. While the bursting of the commodities’ bubble dramatically impacted miners and manufacturers of related products, italso diminished the need for shipping these goods. As such, cargo shipment rates have plunged by up to 90% since summer2008 in some cases. In November, because of the dwindling demand for its services, Genco cancelled plans to purchase sixcargo ships and will be forced to forfeit over $50 million in lost deposits. As a result, the company expects to take a $54million hit to its bottom line in the fourth quarter. However, some analysts believe that Genco is in a better position to weatherthe storm than certain competitors, as it maintains longer-term contracts that produce more attractive margins.
Detailed Explanation of Calendar Year Performance—Companies With Positive Returns
The Short Version: Twenty-seven of the 155 stocks we owned during the year had positive returns. Unfortunately, all buttwo were smaller diversifying positions. In aggregate, these 27 added about a percent and a half to our annual returns.
With all 10 S&P sectors recording sizable market losses in 2008, investors had few places to turn for relief from the equitymarket carnage. Still, our models found some. Eight of the best-performing stocks returned 10% or more and represented sixdifferent sectors, an indication that needles can be found in even the most depressing haystacks. In conjunction with theworst bear market of a lifetime, this is the “leanest” list of top annual performers in our history.
These are the ten best performers for the calendar year ended December 31, 2008:
Rank Description Industry % Gain
1 Thoratec Corp Healthcare-Products 24.9%2 Callaway Golf Co Leisure Time 16.0%3 Broadcom Corp Semiconductors 15.1%4 Telephone & Data Systems Inc Telecommunications 14.2%5 Range Resources Corp Oil & Gas 12.6%6 Jones Lang LaSalle Inc Real Estate 12.0%7 Amgen Inc Biotechnology 11.3%8 AT&T Inc Telecommunications 10.0%9 Cerner Corp Software 9.9%
10 Time Warner Inc Media 9.5%
www.bridgeway.com 13
Aggressive Investors 1 FundMANAGER’S COMMENTARY (continued)(Unaudited)
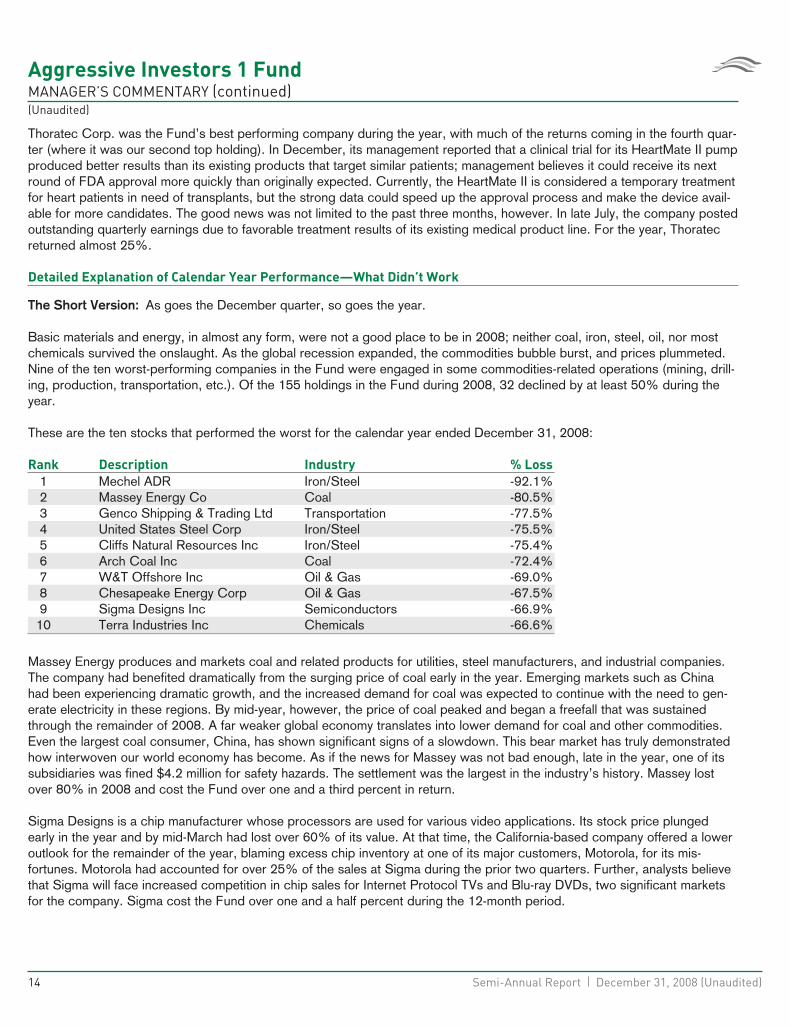
Thoratec Corp. was the Fund’s best performing company during the year, with much of the returns coming in the fourth quar-ter (where it was our second top holding). In December, its management reported that a clinical trial for its HeartMate II pumpproduced better results than its existing products that target similar patients; management believes it could receive its nextround of FDA approval more quickly than originally expected. Currently, the HeartMate II is considered a temporary treatmentfor heart patients in need of transplants, but the strong data could speed up the approval process and make the device avail-able for more candidates. The good news was not limited to the past three months, however. In late July, the company postedoutstanding quarterly earnings due to favorable treatment results of its existing medical product line. For the year, Thoratecreturned almost 25%.
Detailed Explanation of Calendar Year Performance—What Didn’t Work
The Short Version: As goes the December quarter, so goes the year.
Basic materials and energy, in almost any form, were not a good place to be in 2008; neither coal, iron, steel, oil, nor mostchemicals survived the onslaught. As the global recession expanded, the commodities bubble burst, and prices plummeted.Nine of the ten worst-performing companies in the Fund were engaged in some commodities-related operations (mining, drill-ing, production, transportation, etc.). Of the 155 holdings in the Fund during 2008, 32 declined by at least 50% during theyear.
These are the ten stocks that performed the worst for the calendar year ended December 31, 2008:
Rank Description Industry % Loss
1 Mechel ADR Iron/Steel -92.1%2 Massey Energy Co Coal -80.5%3 Genco Shipping & Trading Ltd Transportation -77.5%4 United States Steel Corp Iron/Steel -75.5%5 Cliffs Natural Resources Inc Iron/Steel -75.4%6 Arch Coal Inc Coal -72.4%7 W&T Offshore Inc Oil & Gas -69.0%8 Chesapeake Energy Corp Oil & Gas -67.5%9 Sigma Designs Inc Semiconductors -66.9%
10 Terra Industries Inc Chemicals -66.6%
Massey Energy produces and markets coal and related products for utilities, steel manufacturers, and industrial companies.The company had benefited dramatically from the surging price of coal early in the year. Emerging markets such as Chinahad been experiencing dramatic growth, and the increased demand for coal was expected to continue with the need to gen-erate electricity in these regions. By mid-year, however, the price of coal peaked and began a freefall that was sustainedthrough the remainder of 2008. A far weaker global economy translates into lower demand for coal and other commodities.Even the largest coal consumer, China, has shown significant signs of a slowdown. This bear market has truly demonstratedhow interwoven our world economy has become. As if the news for Massey was not bad enough, late in the year, one of itssubsidiaries was fined $4.2 million for safety hazards. The settlement was the largest in the industry’s history. Massey lostover 80% in 2008 and cost the Fund over one and a third percent in return.
Sigma Designs is a chip manufacturer whose processors are used for various video applications. Its stock price plungedearly in the year and by mid-March had lost over 60% of its value. At that time, the California-based company offered a loweroutlook for the remainder of the year, blaming excess chip inventory at one of its major customers, Motorola, for its mis-fortunes. Motorola had accounted for over 25% of the sales at Sigma during the prior two quarters. Further, analysts believethat Sigma will face increased competition in chip sales for Internet Protocol TVs and Blu-ray DVDs, two significant marketsfor the company. Sigma cost the Fund over one and a half percent during the 12-month period.
14 Semi-Annual Report | December 31, 2008 (Unaudited)
Aggressive Investors 1 FundMANAGER’S COMMENTARY (continued)(Unaudited)
Top Ten Holdings as of December 31, 2008
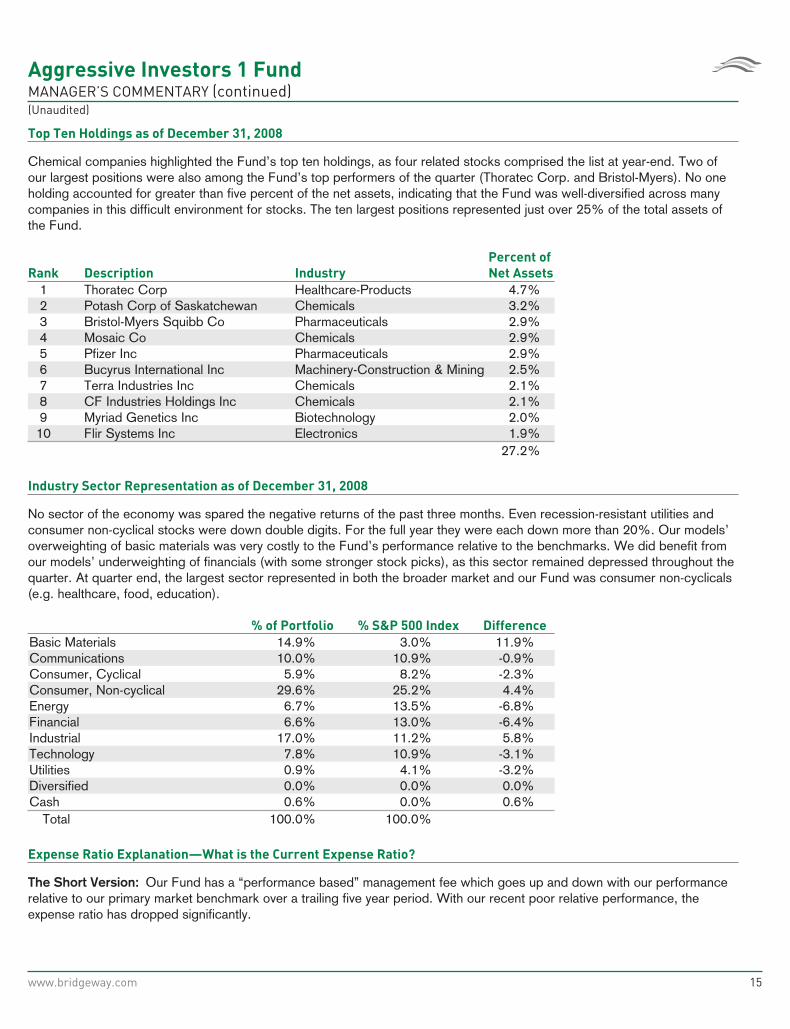
Chemical companies highlighted the Fund’s top ten holdings, as four related stocks comprised the list at year-end. Two ofour largest positions were also among the Fund’s top performers of the quarter (Thoratec Corp. and Bristol-Myers). No oneholding accounted for greater than five percent of the net assets, indicating that the Fund was well-diversified across manycompanies in this difficult environment for stocks. The ten largest positions represented just over 25% of the total assets ofthe Fund.
Rank Description Industry
Percent of
Net Assets
1 Thoratec Corp Healthcare-Products 4.7%2 Potash Corp of Saskatchewan Chemicals 3.2%3 Bristol-Myers Squibb Co Pharmaceuticals 2.9%4 Mosaic Co Chemicals 2.9%5 Pfizer Inc Pharmaceuticals 2.9%6 Bucyrus International Inc Machinery-Construction & Mining 2.5%7 Terra Industries Inc Chemicals 2.1%8 CF Industries Holdings Inc Chemicals 2.1%9 Myriad Genetics Inc Biotechnology 2.0%
10 Flir Systems Inc Electronics 1.9%27.2%
Industry Sector Representation as of December 31, 2008
No sector of the economy was spared the negative returns of the past three months. Even recession-resistant utilities andconsumer non-cyclical stocks were down double digits. For the full year they were each down more than 20%. Our models’overweighting of basic materials was very costly to the Fund’s performance relative to the benchmarks. We did benefit fromour models’ underweighting of financials (with some stronger stock picks), as this sector remained depressed throughout thequarter. At quarter end, the largest sector represented in both the broader market and our Fund was consumer non-cyclicals(e.g. healthcare, food, education).
% of Portfolio % S&P 500 Index Difference
Basic Materials 14.9% 3.0% 11.9%Communications 10.0% 10.9% -0.9%Consumer, Cyclical 5.9% 8.2% -2.3%Consumer, Non-cyclical 29.6% 25.2% 4.4%Energy 6.7% 13.5% -6.8%Financial 6.6% 13.0% -6.4%Industrial 17.0% 11.2% 5.8%Technology 7.8% 10.9% -3.1%Utilities 0.9% 4.1% -3.2%Diversified 0.0% 0.0% 0.0%Cash 0.6% 0.0% 0.6%
Total 100.0% 100.0%
Expense Ratio Explanation—What is the Current Expense Ratio?
The Short Version: Our Fund has a “performance based” management fee which goes up and down with our performancerelative to our primary market benchmark over a trailing five year period. With our recent poor relative performance, theexpense ratio has dropped significantly.
www.bridgeway.com 15
Aggressive Investors 1 FundMANAGER’S COMMENTARY (continued)(Unaudited)
One risk Bridgeway identified and communicated to shareholders in 2004 was that should the fund experience decliningassets and underperformance against the benchmark, it might create a situation where the total management fee (base fee+/- performance fee) to the adviser is actually negative. This situation may be approaching us. In our current prospectus, theexpense ratio is listed as 1.78%, of which 1.61% is the management fee. Through December 31, 2008, as presented in thefinancial statements later in this report, the unaudited total management fee for the fund was 0.30%, reflecting both the dropin net assets and our relative performance. However, should the fund not close the gap in performance versus the S&P 500benchmark, the management fee could drop to 0.0% or even go negative for a period of time. This is the reason our expenseratio has dropped significantly in the recent two quarters.
Disclaimer
The views expressed here are exclusively those of Fund management. These views, including those of market sectors orindividual stocks, are not meant as investment advice and should not be considered predictive in nature. Any favorable (orunfavorable) description of a holding applies only as of the quarter end, December 31, 2008, unless otherwise stated. Secu-rity positions can and do change thereafter. Discussions of historical performance do not guarantee and may not be indicativeof future performance.
Market volatility can significantly affect short-term performance. The Fund is not an appropriate investment for short-terminvestors. Investments in the small companies within this multi-cap fund generally carry greater risk than is customarily asso-ciated with larger companies. This additional risk is attributable to a number of factors, including the relatively limited financialresources that are typically available to small companies, and the fact that small companies often have comparatively limitedproduct lines. In addition, the stock of small companies tends to be more volatile than the stock of large companies, partic-ularly in the short term and particularly in the early stages of an economic or market downturn. The Fund’s use of options,futures, and leverage can magnify the risk of loss in an unfavorable market, and the Fund’s use of short-sale positions can, intheory, expose shareholders to unlimited loss. Finally, the Fund exposes shareholders to “focus risk” which may add to Fundvolatility through the possibility that a single company could significantly affect total return. Shareholders of the Fund, there-fore, are taking on more risk than they would if they invested in the stock market as a whole.
Conclusion
Thank you for your continued investment in Aggressive Investors 1 Fund. We encourage your feedback; your reactions andconcerns are extremely important to us.
Sincerely,
Your Investment Management Team
16 Semi-Annual Report | December 31, 2008 (Unaudited)

THIS PAGE INTENTIONALLY LEFT BLANK
www.bridgeway.com 17
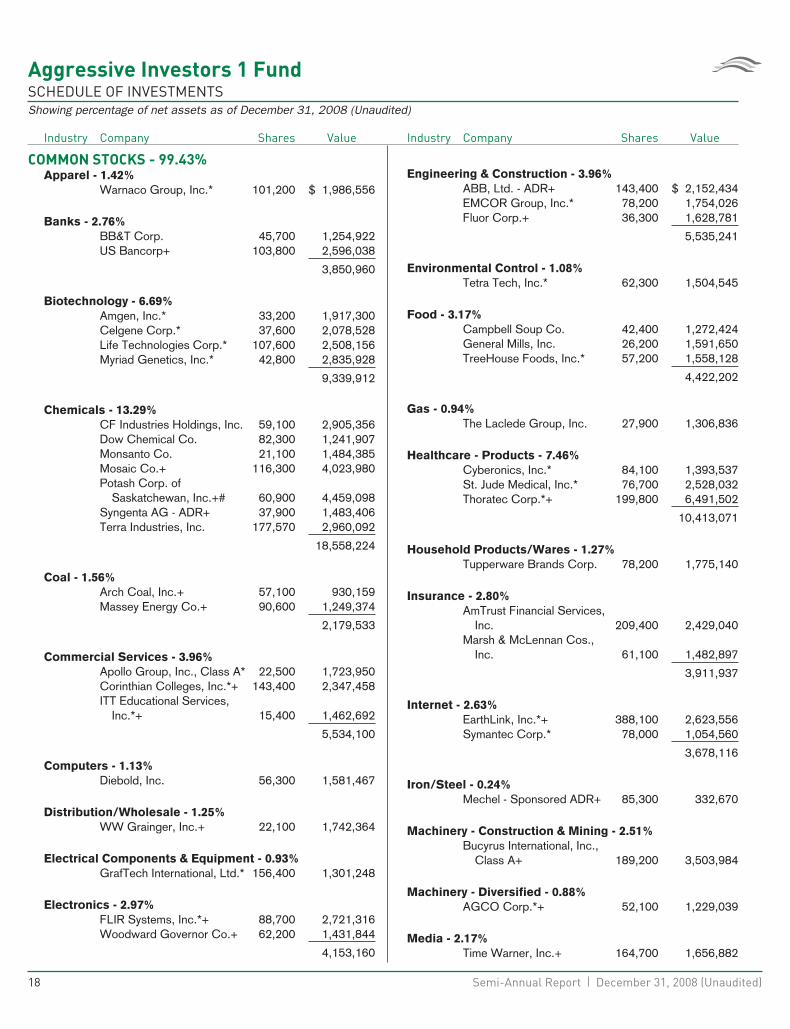
Aggressive Investors 1 FundSCHEDULE OF INVESTMENTSShowing percentage of net assets as of December 31, 2008 (Unaudited)
Industry Company Shares Value
COMMON STOCKS - 99.43%Apparel - 1.42%
Warnaco Group, Inc.* 101,200 $ 1,986,556
Banks - 2.76%BB&T Corp. 45,700 1,254,922US Bancorp+ 103,800 2,596,038
3,850,960
Biotechnology - 6.69%Amgen, Inc.* 33,200 1,917,300Celgene Corp.* 37,600 2,078,528Life Technologies Corp.* 107,600 2,508,156Myriad Genetics, Inc.* 42,800 2,835,928
9,339,912
Chemicals - 13.29%CF Industries Holdings, Inc. 59,100 2,905,356Dow Chemical Co. 82,300 1,241,907Monsanto Co. 21,100 1,484,385Mosaic Co.+ 116,300 4,023,980Potash Corp. of
Saskatchewan, Inc.+# 60,900 4,459,098Syngenta AG - ADR+ 37,900 1,483,406Terra Industries, Inc. 177,570 2,960,092
18,558,224
Coal - 1.56%Arch Coal, Inc.+ 57,100 930,159Massey Energy Co.+ 90,600 1,249,374
2,179,533
Commercial Services - 3.96%Apollo Group, Inc., Class A* 22,500 1,723,950Corinthian Colleges, Inc.*+ 143,400 2,347,458ITT Educational Services,
Inc.*+ 15,400 1,462,692
5,534,100
Computers - 1.13%Diebold, Inc. 56,300 1,581,467
Distribution/Wholesale - 1.25%WW Grainger, Inc.+ 22,100 1,742,364
Electrical Components & Equipment - 0.93%GrafTech International, Ltd.* 156,400 1,301,248
Electronics - 2.97%FLIR Systems, Inc.*+ 88,700 2,721,316Woodward Governor Co.+ 62,200 1,431,844
4,153,160
Industry Company Shares Value
Engineering & Construction - 3.96%ABB, Ltd. - ADR+ 143,400 $ 2,152,434EMCOR Group, Inc.* 78,200 1,754,026Fluor Corp.+ 36,300 1,628,781
5,535,241
Environmental Control - 1.08%Tetra Tech, Inc.* 62,300 1,504,545
Food - 3.17%Campbell Soup Co. 42,400 1,272,424General Mills, Inc. 26,200 1,591,650TreeHouse Foods, Inc.* 57,200 1,558,128
4,422,202
Gas - 0.94%The Laclede Group, Inc. 27,900 1,306,836
Healthcare - Products - 7.46%Cyberonics, Inc.* 84,100 1,393,537St. Jude Medical, Inc.* 76,700 2,528,032Thoratec Corp.*+ 199,800 6,491,502
10,413,071
Household Products/Wares - 1.27%Tupperware Brands Corp. 78,200 1,775,140
Insurance - 2.80%AmTrust Financial Services,
Inc. 209,400 2,429,040Marsh & McLennan Cos.,
Inc. 61,100 1,482,897
3,911,937
Internet - 2.63%EarthLink, Inc.*+ 388,100 2,623,556Symantec Corp.* 78,000 1,054,560
3,678,116
Iron/Steel - 0.24%Mechel - Sponsored ADR+ 85,300 332,670
Machinery - Construction & Mining - 2.51%Bucyrus International, Inc.,
Class A+ 189,200 3,503,984
Machinery - Diversified - 0.88%AGCO Corp.*+ 52,100 1,229,039
Media - 2.17%Time Warner, Inc.+ 164,700 1,656,882
18 Semi-Annual Report | December 31, 2008 (Unaudited)
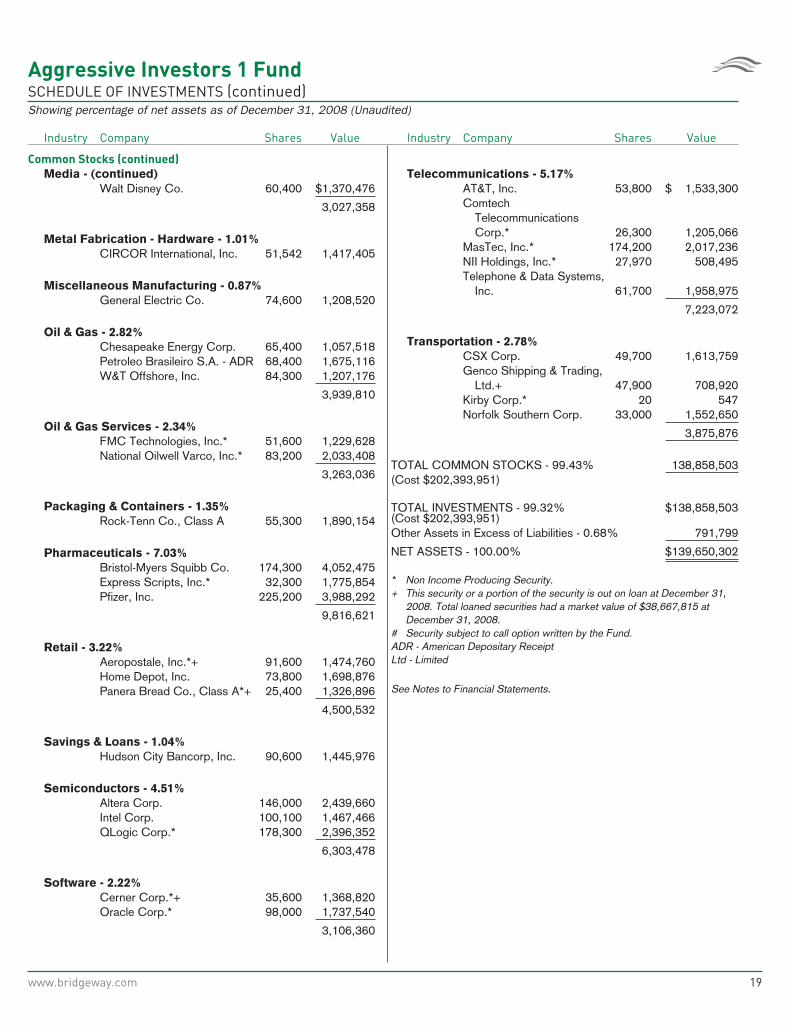
Aggressive Investors 1 FundSCHEDULE OF INVESTMENTS (continued)Showing percentage of net assets as of December 31, 2008 (Unaudited)
Industry Company Shares Value
Common Stocks (continued)
Media - (continued)Walt Disney Co. 60,400 $1,370,476
3,027,358
Metal Fabrication - Hardware - 1.01%CIRCOR International, Inc. 51,542 1,417,405
Miscellaneous Manufacturing - 0.87%General Electric Co. 74,600 1,208,520
Oil & Gas - 2.82%Chesapeake Energy Corp. 65,400 1,057,518Petroleo Brasileiro S.A. - ADR 68,400 1,675,116W&T Offshore, Inc. 84,300 1,207,176
3,939,810
Oil & Gas Services - 2.34%FMC Technologies, Inc.* 51,600 1,229,628National Oilwell Varco, Inc.* 83,200 2,033,408
3,263,036
Packaging & Containers - 1.35%Rock-Tenn Co., Class A 55,300 1,890,154
Pharmaceuticals - 7.03%Bristol-Myers Squibb Co. 174,300 4,052,475Express Scripts, Inc.* 32,300 1,775,854Pfizer, Inc. 225,200 3,988,292
9,816,621
Retail - 3.22%Aeropostale, Inc.*+ 91,600 1,474,760Home Depot, Inc. 73,800 1,698,876Panera Bread Co., Class A*+ 25,400 1,326,896
4,500,532
Savings & Loans - 1.04%Hudson City Bancorp, Inc. 90,600 1,445,976
Semiconductors - 4.51%Altera Corp. 146,000 2,439,660Intel Corp. 100,100 1,467,466QLogic Corp.* 178,300 2,396,352
6,303,478
Software - 2.22%Cerner Corp.*+ 35,600 1,368,820Oracle Corp.* 98,000 1,737,540
3,106,360
Industry Company Shares Value
Telecommunications - 5.17%AT&T, Inc. 53,800 $ 1,533,300Comtech
TelecommunicationsCorp.* 26,300 1,205,066
MasTec, Inc.* 174,200 2,017,236NII Holdings, Inc.* 27,970 508,495Telephone & Data Systems,
Inc. 61,700 1,958,975
7,223,072
Transportation - 2.78%CSX Corp. 49,700 1,613,759Genco Shipping & Trading,
Ltd.+ 47,900 708,920Kirby Corp.* 20 547Norfolk Southern Corp. 33,000 1,552,650
3,875,876
TOTAL COMMON STOCKS - 99.43% 138,858,503(Cost $202,393,951)
TOTAL INVESTMENTS - 99.32% $138,858,503(Cost $202,393,951)Other Assets in Excess of Liabilities - 0.68% 791,799
NET ASSETS - 100.00% $139,650,302
* Non Income Producing Security.+ This security or a portion of the security is out on loan at December 31,
2008. Total loaned securities had a market value of $38,667,815 atDecember 31, 2008.
# Security subject to call option written by the Fund.ADR - American Depositary ReceiptLtd - Limited
See Notes to Financial Statements.
www.bridgeway.com 19
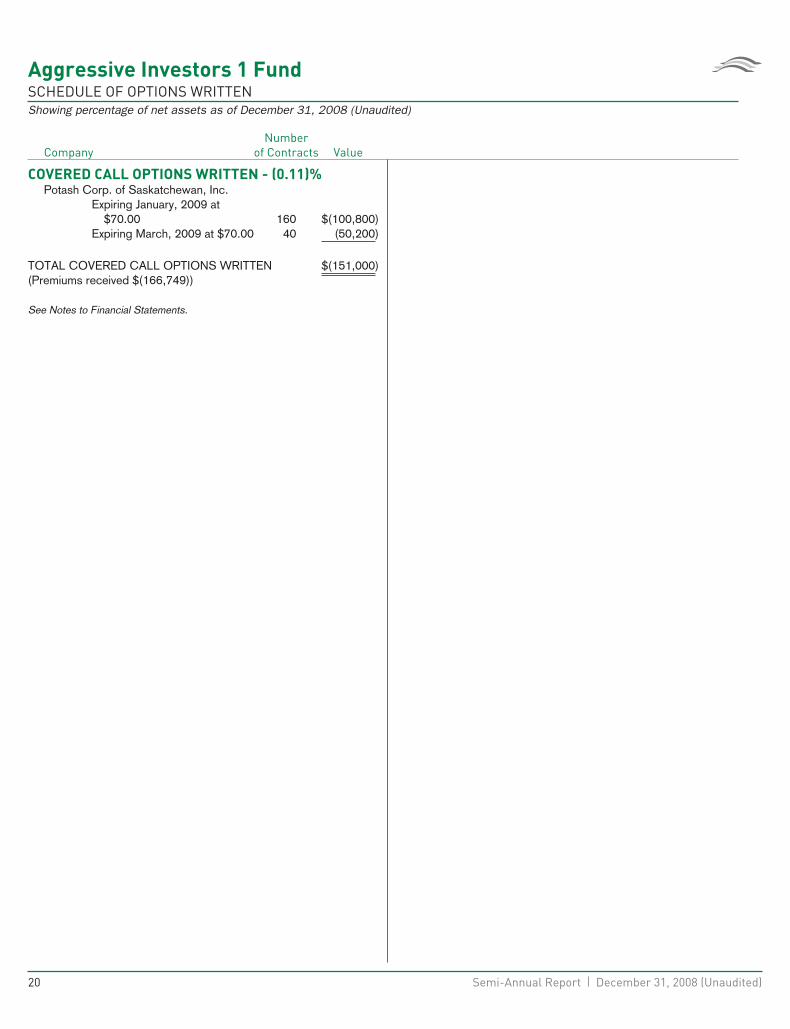
Aggressive Investors 1 FundSCHEDULE OF OPTIONS WRITTENShowing percentage of net assets as of December 31, 2008 (Unaudited)
CompanyNumber
of Contracts Value
COVERED CALL OPTIONS WRITTEN - (0.11)%Potash Corp. of Saskatchewan, Inc.
Expiring January, 2009 at$70.00 160 $(100,800)
Expiring March, 2009 at $70.00 40 (50,200)
TOTAL COVERED CALL OPTIONS WRITTEN $(151,000)(Premiums received $(166,749))
See Notes to Financial Statements.
20 Semi-Annual Report | December 31, 2008 (Unaudited)

THIS PAGE INTENTIONALLY LEFT BLANK
www.bridgeway.com 21
Aggressive Investors 2 FundMANAGER’S COMMENTARY(Unaudited)
December 31, 2008
Dear Fellow Aggressive Investors 2 Fund Shareholder,
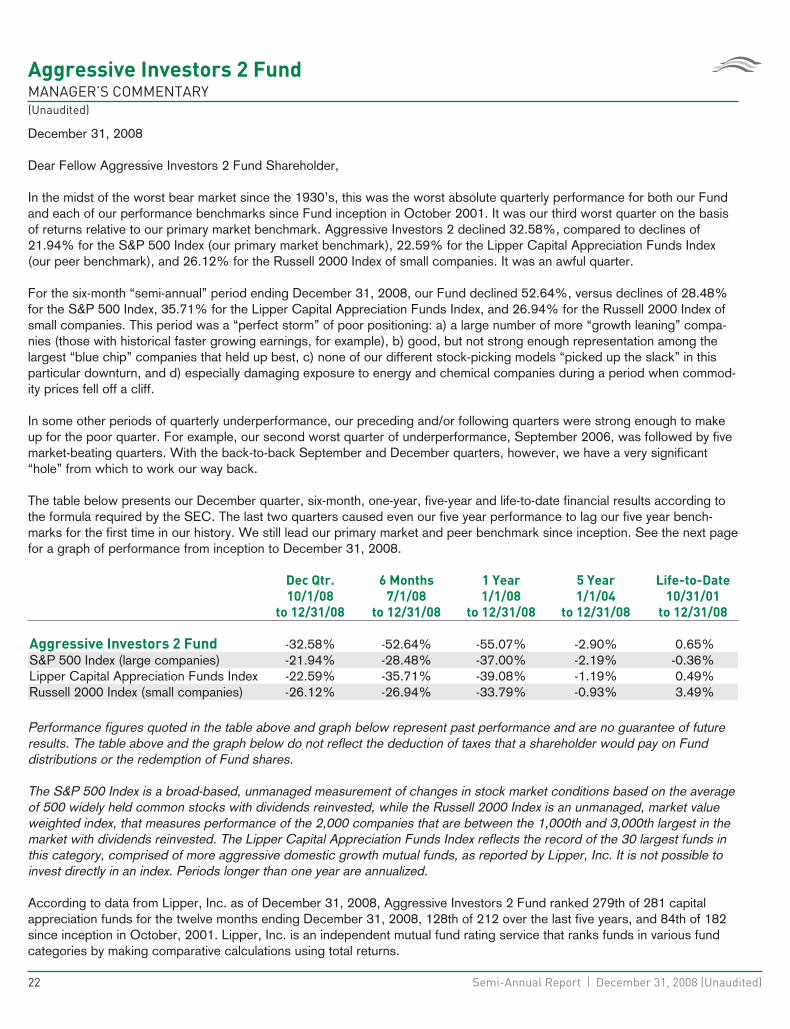
In the midst of the worst bear market since the 1930’s, this was the worst absolute quarterly performance for both our Fundand each of our performance benchmarks since Fund inception in October 2001. It was our third worst quarter on the basisof returns relative to our primary market benchmark. Aggressive Investors 2 declined 32.58%, compared to declines of21.94% for the S&P 500 Index (our primary market benchmark), 22.59% for the Lipper Capital Appreciation Funds Index(our peer benchmark), and 26.12% for the Russell 2000 Index of small companies. It was an awful quarter.
For the six-month “semi-annual” period ending December 31, 2008, our Fund declined 52.64%, versus declines of 28.48%for the S&P 500 Index, 35.71% for the Lipper Capital Appreciation Funds Index, and 26.94% for the Russell 2000 Index ofsmall companies. This period was a “perfect storm” of poor positioning: a) a large number of more “growth leaning” compa-nies (those with historical faster growing earnings, for example), b) good, but not strong enough representation among thelargest “blue chip” companies that held up best, c) none of our different stock-picking models “picked up the slack” in thisparticular downturn, and d) especially damaging exposure to energy and chemical companies during a period when commod-ity prices fell off a cliff.
In some other periods of quarterly underperformance, our preceding and/or following quarters were strong enough to makeup for the poor quarter. For example, our second worst quarter of underperformance, September 2006, was followed by fivemarket-beating quarters. With the back-to-back September and December quarters, however, we have a very significant“hole” from which to work our way back.
The table below presents our December quarter, six-month, one-year, five-year and life-to-date financial results according tothe formula required by the SEC. The last two quarters caused even our five year performance to lag our five year bench-marks for the first time in our history. We still lead our primary market and peer benchmark since inception. See the next pagefor a graph of performance from inception to December 31, 2008.
Dec Qtr.
10/1/08
to 12/31/08
6 Months
7/1/08
to 12/31/08
1 Year
1/1/08
to 12/31/08
5 Year
1/1/04
to 12/31/08
Life-to-Date
10/31/01
to 12/31/08
Aggressive Investors 2 Fund -32.58% -52.64% -55.07% -2.90% 0.65%S&P 500 Index (large companies) -21.94% -28.48% -37.00% -2.19% -0.36%Lipper Capital Appreciation Funds Index -22.59% -35.71% -39.08% -1.19% 0.49%Russell 2000 Index (small companies) -26.12% -26.94% -33.79% -0.93% 3.49%
Performance figures quoted in the table above and graph below represent past performance and are no guarantee of futureresults. The table above and the graph below do not reflect the deduction of taxes that a shareholder would pay on Funddistributions or the redemption of Fund shares.
The S&P 500 Index is a broad-based, unmanaged measurement of changes in stock market conditions based on the averageof 500 widely held common stocks with dividends reinvested, while the Russell 2000 Index is an unmanaged, market valueweighted index, that measures performance of the 2,000 companies that are between the 1,000th and 3,000th largest in themarket with dividends reinvested. The Lipper Capital Appreciation Funds Index reflects the record of the 30 largest funds inthis category, comprised of more aggressive domestic growth mutual funds, as reported by Lipper, Inc. It is not possible toinvest directly in an index. Periods longer than one year are annualized.
According to data from Lipper, Inc. as of December 31, 2008, Aggressive Investors 2 Fund ranked 279th of 281 capitalappreciation funds for the twelve months ending December 31, 2008, 128th of 212 over the last five years, and 84th of 182since inception in October, 2001. Lipper, Inc. is an independent mutual fund rating service that ranks funds in various fundcategories by making comparative calculations using total returns.
22 Semi-Annual Report | December 31, 2008 (Unaudited)
Aggressive Investors 2 FundMANAGER’S COMMENTARY (continued)(Unaudited)
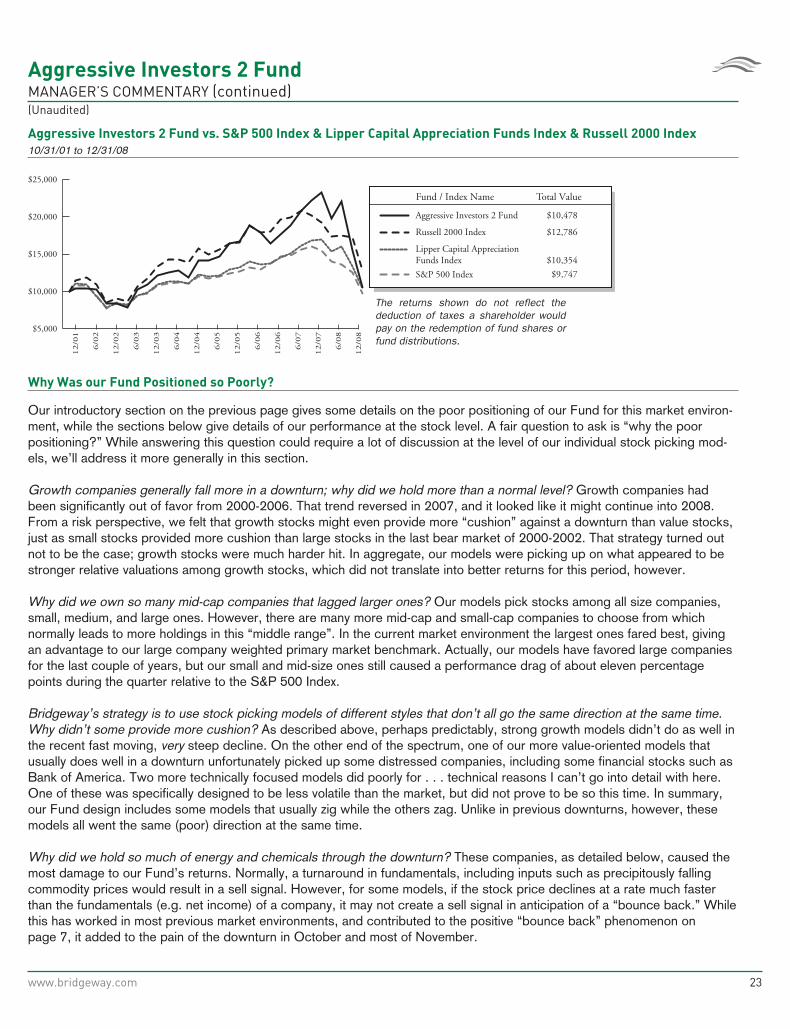
Aggressive Investors 2 Fund vs. S&P 500 Index & Lipper Capital Appreciation Funds Index & Russell 2000 Index
10/31/01 to 12/31/08
Fund / Index Name Total Value
Russell 2000 Index
S&P 500 Index
Lipper Capital Appreciation Funds Index
Aggressive Investors 2 Fund
The returns shown do not reflect the deduction of taxes a shareholder would pay on the redemption of fund shares or fund distributions.
$10,478
$12,786
$10,354
$9,747
$5,000
$15,000
$25,000
$10,000
$20,000
6/0
7
12/0
7
12/0
8
6/0
8
12/0
6
6/0
6
12/0
5
6/0
5
12/0
4
6/0
4
12/0
3
6/0
3
12/0
2
6/0
2
12/0
1
Why Was our Fund Positioned so Poorly?
Our introductory section on the previous page gives some details on the poor positioning of our Fund for this market environ-ment, while the sections below give details of our performance at the stock level. A fair question to ask is “why the poorpositioning?” While answering this question could require a lot of discussion at the level of our individual stock picking mod-els, we’ll address it more generally in this section.
Growth companies generally fall more in a downturn; why did we hold more than a normal level? Growth companies hadbeen significantly out of favor from 2000-2006. That trend reversed in 2007, and it looked like it might continue into 2008.From a risk perspective, we felt that growth stocks might even provide more “cushion” against a downturn than value stocks,just as small stocks provided more cushion than large stocks in the last bear market of 2000-2002. That strategy turned outnot to be the case; growth stocks were much harder hit. In aggregate, our models were picking up on what appeared to bestronger relative valuations among growth stocks, which did not translate into better returns for this period, however.
Why did we own so many mid-cap companies that lagged larger ones? Our models pick stocks among all size companies,small, medium, and large ones. However, there are many more mid-cap and small-cap companies to choose from whichnormally leads to more holdings in this “middle range”. In the current market environment the largest ones fared best, givingan advantage to our large company weighted primary market benchmark. Actually, our models have favored large companiesfor the last couple of years, but our small and mid-size ones still caused a performance drag of about eleven percentagepoints during the quarter relative to the S&P 500 Index.
Bridgeway’s strategy is to use stock picking models of different styles that don’t all go the same direction at the same time.Why didn’t some provide more cushion? As described above, perhaps predictably, strong growth models didn’t do as well inthe recent fast moving, very steep decline. On the other end of the spectrum, one of our more value-oriented models thatusually does well in a downturn unfortunately picked up some distressed companies, including some financial stocks such asBank of America. Two more technically focused models did poorly for . . . technical reasons I can’t go into detail with here.One of these was specifically designed to be less volatile than the market, but did not prove to be so this time. In summary,our Fund design includes some models that usually zig while the others zag. Unlike in previous downturns, however, thesemodels all went the same (poor) direction at the same time.
Why did we hold so much of energy and chemicals through the downturn? These companies, as detailed below, caused themost damage to our Fund’s returns. Normally, a turnaround in fundamentals, including inputs such as precipitously fallingcommodity prices would result in a sell signal. However, for some models, if the stock price declines at a rate much fasterthan the fundamentals (e.g. net income) of a company, it may not create a sell signal in anticipation of a “bounce back.” Whilethis has worked in most previous market environments, and contributed to the positive “bounce back” phenomenon onpage 7, it added to the pain of the downturn in October and most of November.
www.bridgeway.com 23
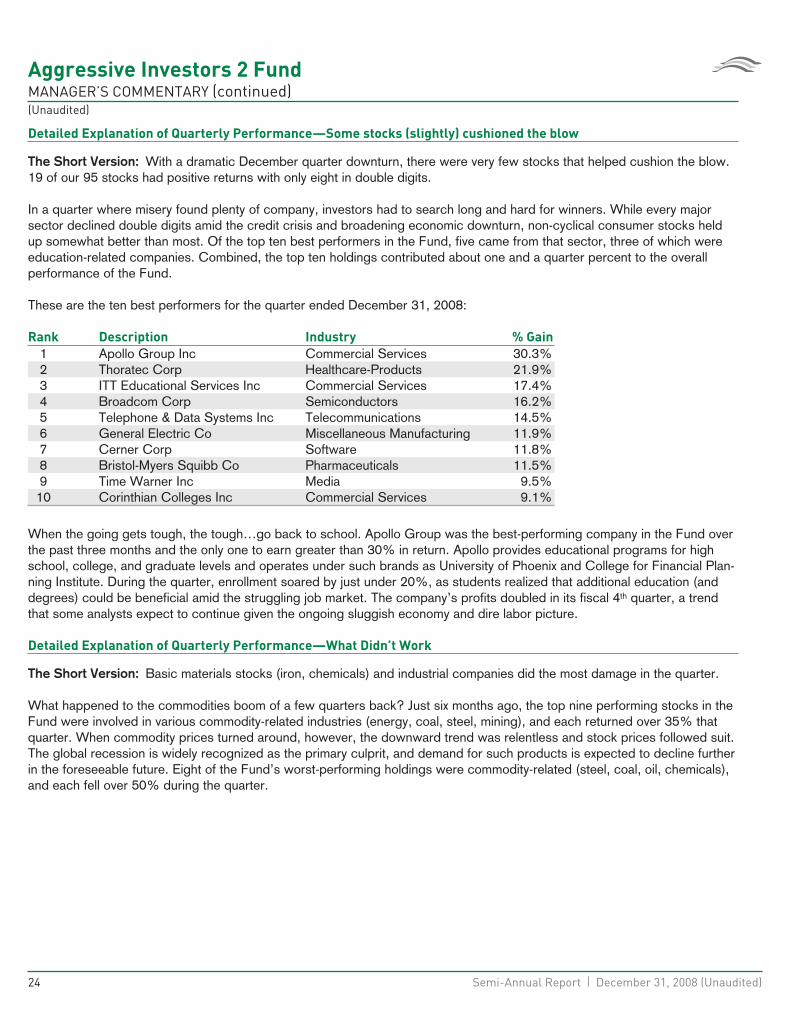
Aggressive Investors 2 FundMANAGER’S COMMENTARY (continued)(Unaudited)
Detailed Explanation of Quarterly Performance—Some stocks (slightly) cushioned the blow
The Short Version: With a dramatic December quarter downturn, there were very few stocks that helped cushion the blow.19 of our 95 stocks had positive returns with only eight in double digits.
In a quarter where misery found plenty of company, investors had to search long and hard for winners. While every majorsector declined double digits amid the credit crisis and broadening economic downturn, non-cyclical consumer stocks heldup somewhat better than most. Of the top ten best performers in the Fund, five came from that sector, three of which wereeducation-related companies. Combined, the top ten holdings contributed about one and a quarter percent to the overallperformance of the Fund.
These are the ten best performers for the quarter ended December 31, 2008:
Rank Description Industry % Gain
1 Apollo Group Inc Commercial Services 30.3%2 Thoratec Corp Healthcare-Products 21.9%3 ITT Educational Services Inc Commercial Services 17.4%4 Broadcom Corp Semiconductors 16.2%5 Telephone & Data Systems Inc Telecommunications 14.5%6 General Electric Co Miscellaneous Manufacturing 11.9%7 Cerner Corp Software 11.8%8 Bristol-Myers Squibb Co Pharmaceuticals 11.5%9 Time Warner Inc Media 9.5%
10 Corinthian Colleges Inc Commercial Services 9.1%
When the going gets tough, the tough…go back to school. Apollo Group was the best-performing company in the Fund overthe past three months and the only one to earn greater than 30% in return. Apollo provides educational programs for highschool, college, and graduate levels and operates under such brands as University of Phoenix and College for Financial Plan-ning Institute. During the quarter, enrollment soared by just under 20%, as students realized that additional education (anddegrees) could be beneficial amid the struggling job market. The company’s profits doubled in its fiscal 4th quarter, a trendthat some analysts expect to continue given the ongoing sluggish economy and dire labor picture.
Detailed Explanation of Quarterly Performance—What Didn’t Work
The Short Version: Basic materials stocks (iron, chemicals) and industrial companies did the most damage in the quarter.
What happened to the commodities boom of a few quarters back? Just six months ago, the top nine performing stocks in theFund were involved in various commodity-related industries (energy, coal, steel, mining), and each returned over 35% thatquarter. When commodity prices turned around, however, the downward trend was relentless and stock prices followed suit.The global recession is widely recognized as the primary culprit, and demand for such products is expected to decline furtherin the foreseeable future. Eight of the Fund’s worst-performing holdings were commodity-related (steel, coal, oil, chemicals),and each fell over 50% during the quarter.
24 Semi-Annual Report | December 31, 2008 (Unaudited)
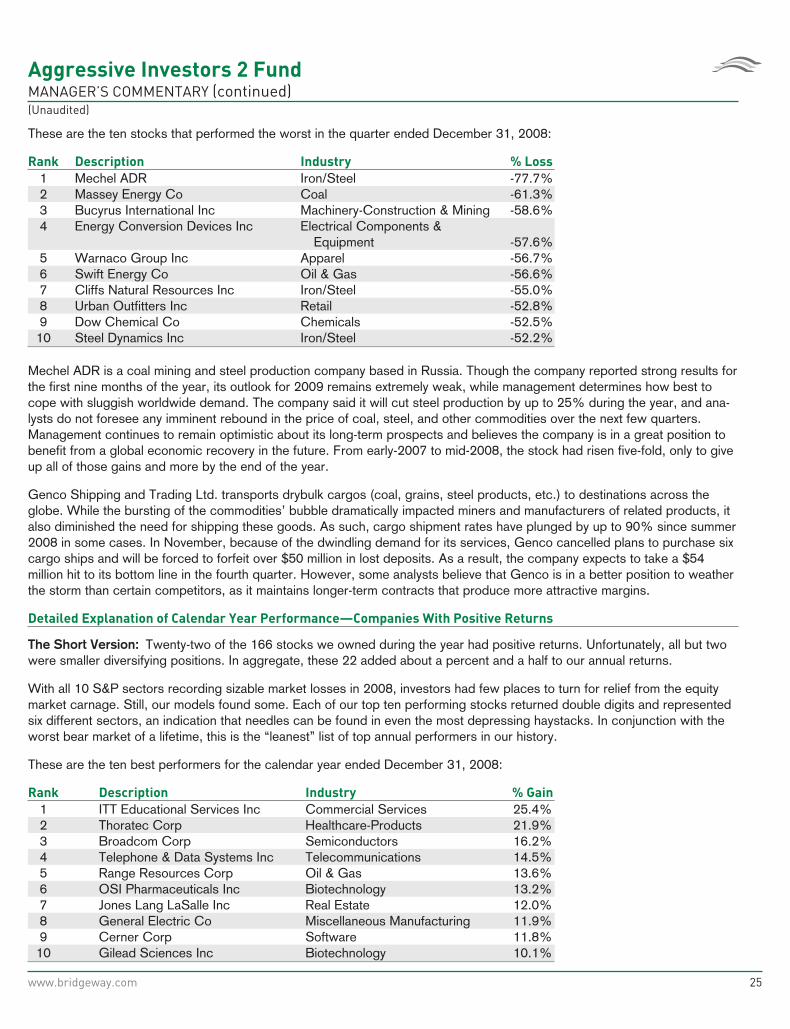
Aggressive Investors 2 FundMANAGER’S COMMENTARY (continued)(Unaudited)
These are the ten stocks that performed the worst in the quarter ended December 31, 2008:
Rank Description Industry % Loss
1 Mechel ADR Iron/Steel -77.7%2 Massey Energy Co Coal -61.3%3 Bucyrus International Inc Machinery-Construction & Mining -58.6%4 Energy Conversion Devices Inc Electrical Components &
Equipment -57.6%5 Warnaco Group Inc Apparel -56.7%6 Swift Energy Co Oil & Gas -56.6%7 Cliffs Natural Resources Inc Iron/Steel -55.0%8 Urban Outfitters Inc Retail -52.8%9 Dow Chemical Co Chemicals -52.5%
10 Steel Dynamics Inc Iron/Steel -52.2%
Mechel ADR is a coal mining and steel production company based in Russia. Though the company reported strong results forthe first nine months of the year, its outlook for 2009 remains extremely weak, while management determines how best tocope with sluggish worldwide demand. The company said it will cut steel production by up to 25% during the year, and ana-lysts do not foresee any imminent rebound in the price of coal, steel, and other commodities over the next few quarters.Management continues to remain optimistic about its long-term prospects and believes the company is in a great position tobenefit from a global economic recovery in the future. From early-2007 to mid-2008, the stock had risen five-fold, only to giveup all of those gains and more by the end of the year.
Genco Shipping and Trading Ltd. transports drybulk cargos (coal, grains, steel products, etc.) to destinations across theglobe. While the bursting of the commodities’ bubble dramatically impacted miners and manufacturers of related products, italso diminished the need for shipping these goods. As such, cargo shipment rates have plunged by up to 90% since summer2008 in some cases. In November, because of the dwindling demand for its services, Genco cancelled plans to purchase sixcargo ships and will be forced to forfeit over $50 million in lost deposits. As a result, the company expects to take a $54million hit to its bottom line in the fourth quarter. However, some analysts believe that Genco is in a better position to weatherthe storm than certain competitors, as it maintains longer-term contracts that produce more attractive margins.
Detailed Explanation of Calendar Year Performance—Companies With Positive Returns
The Short Version: Twenty-two of the 166 stocks we owned during the year had positive returns. Unfortunately, all but twowere smaller diversifying positions. In aggregate, these 22 added about a percent and a half to our annual returns.
With all 10 S&P sectors recording sizable market losses in 2008, investors had few places to turn for relief from the equitymarket carnage. Still, our models found some. Each of our top ten performing stocks returned double digits and representedsix different sectors, an indication that needles can be found in even the most depressing haystacks. In conjunction with theworst bear market of a lifetime, this is the “leanest” list of top annual performers in our history.
These are the ten best performers for the calendar year ended December 31, 2008:
Rank Description Industry % Gain
1 ITT Educational Services Inc Commercial Services 25.4%2 Thoratec Corp Healthcare-Products 21.9%3 Broadcom Corp Semiconductors 16.2%4 Telephone & Data Systems Inc Telecommunications 14.5%5 Range Resources Corp Oil & Gas 13.6%6 OSI Pharmaceuticals Inc Biotechnology 13.2%7 Jones Lang LaSalle Inc Real Estate 12.0%8 General Electric Co Miscellaneous Manufacturing 11.9%9 Cerner Corp Software 11.8%
10 Gilead Sciences Inc Biotechnology 10.1%
www.bridgeway.com 25
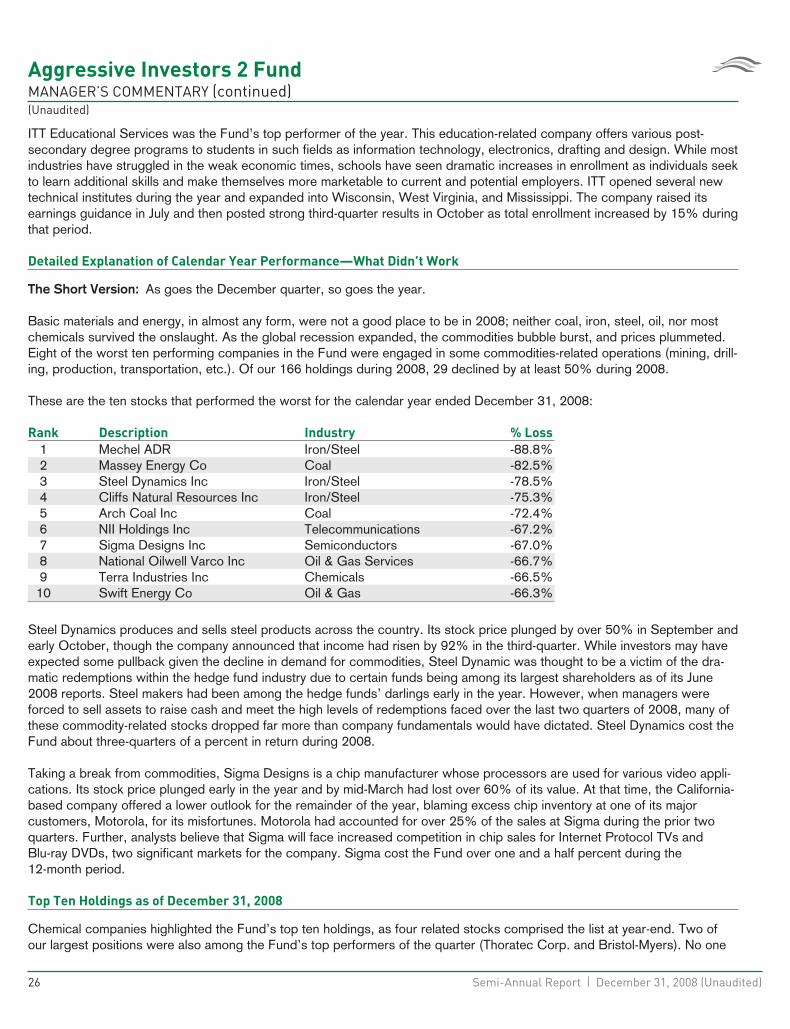
Aggressive Investors 2 FundMANAGER’S COMMENTARY (continued)(Unaudited)
ITT Educational Services was the Fund’s top performer of the year. This education-related company offers various post-secondary degree programs to students in such fields as information technology, electronics, drafting and design. While mostindustries have struggled in the weak economic times, schools have seen dramatic increases in enrollment as individuals seekto learn additional skills and make themselves more marketable to current and potential employers. ITT opened several newtechnical institutes during the year and expanded into Wisconsin, West Virginia, and Mississippi. The company raised itsearnings guidance in July and then posted strong third-quarter results in October as total enrollment increased by 15% duringthat period.
Detailed Explanation of Calendar Year Performance—What Didn’t Work
The Short Version: As goes the December quarter, so goes the year.
Basic materials and energy, in almost any form, were not a good place to be in 2008; neither coal, iron, steel, oil, nor mostchemicals survived the onslaught. As the global recession expanded, the commodities bubble burst, and prices plummeted.Eight of the worst ten performing companies in the Fund were engaged in some commodities-related operations (mining, drill-ing, production, transportation, etc.). Of our 166 holdings during 2008, 29 declined by at least 50% during 2008.
These are the ten stocks that performed the worst for the calendar year ended December 31, 2008:
Rank Description Industry % Loss
1 Mechel ADR Iron/Steel -88.8%2 Massey Energy Co Coal -82.5%3 Steel Dynamics Inc Iron/Steel -78.5%4 Cliffs Natural Resources Inc Iron/Steel -75.3%5 Arch Coal Inc Coal -72.4%6 NII Holdings Inc Telecommunications -67.2%7 Sigma Designs Inc Semiconductors -67.0%8 National Oilwell Varco Inc Oil & Gas Services -66.7%9 Terra Industries Inc Chemicals -66.5%
10 Swift Energy Co Oil & Gas -66.3%
Steel Dynamics produces and sells steel products across the country. Its stock price plunged by over 50% in September andearly October, though the company announced that income had risen by 92% in the third-quarter. While investors may haveexpected some pullback given the decline in demand for commodities, Steel Dynamic was thought to be a victim of the dra-matic redemptions within the hedge fund industry due to certain funds being among its largest shareholders as of its June2008 reports. Steel makers had been among the hedge funds’ darlings early in the year. However, when managers wereforced to sell assets to raise cash and meet the high levels of redemptions faced over the last two quarters of 2008, many ofthese commodity-related stocks dropped far more than company fundamentals would have dictated. Steel Dynamics cost theFund about three-quarters of a percent in return during 2008.
Taking a break from commodities, Sigma Designs is a chip manufacturer whose processors are used for various video appli-cations. Its stock price plunged early in the year and by mid-March had lost over 60% of its value. At that time, the California-based company offered a lower outlook for the remainder of the year, blaming excess chip inventory at one of its majorcustomers, Motorola, for its misfortunes. Motorola had accounted for over 25% of the sales at Sigma during the prior twoquarters. Further, analysts believe that Sigma will face increased competition in chip sales for Internet Protocol TVs andBlu-ray DVDs, two significant markets for the company. Sigma cost the Fund over one and a half percent during the12-month period.
Top Ten Holdings as of December 31, 2008
Chemical companies highlighted the Fund’s top ten holdings, as four related stocks comprised the list at year-end. Two ofour largest positions were also among the Fund’s top performers of the quarter (Thoratec Corp. and Bristol-Myers). No one
26 Semi-Annual Report | December 31, 2008 (Unaudited)
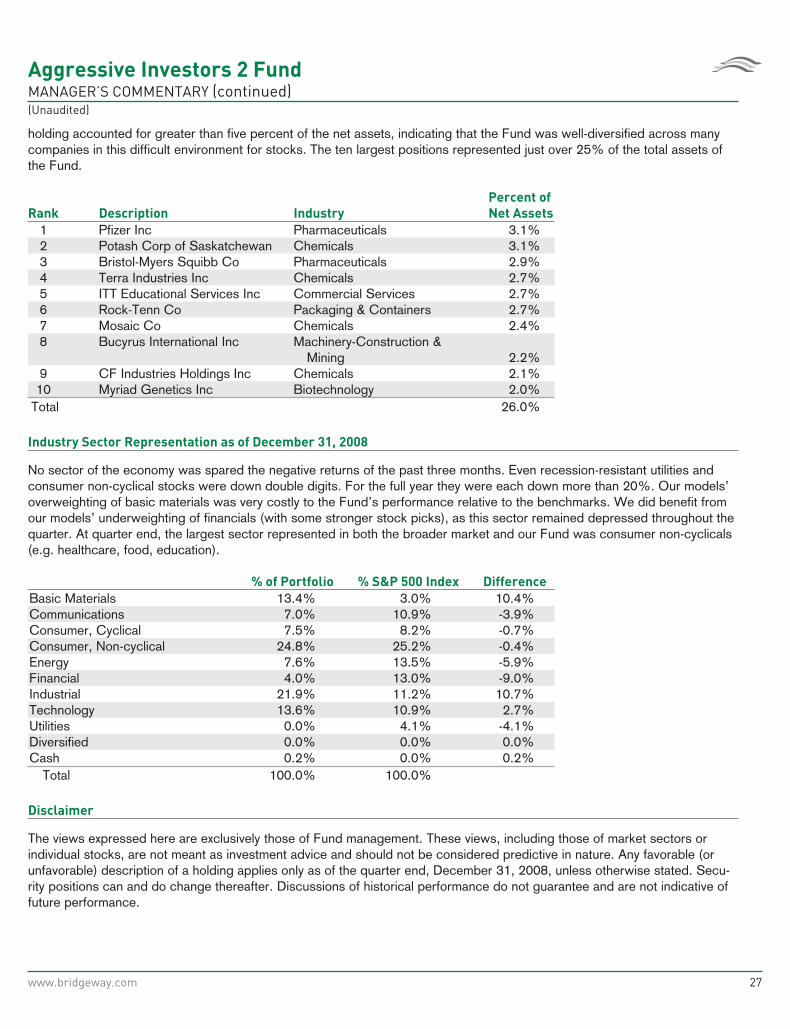
Aggressive Investors 2 FundMANAGER’S COMMENTARY (continued)(Unaudited)
holding accounted for greater than five percent of the net assets, indicating that the Fund was well-diversified across manycompanies in this difficult environment for stocks. The ten largest positions represented just over 25% of the total assets ofthe Fund.
Rank Description Industry
Percent of
Net Assets
1 Pfizer Inc Pharmaceuticals 3.1%2 Potash Corp of Saskatchewan Chemicals 3.1%3 Bristol-Myers Squibb Co Pharmaceuticals 2.9%4 Terra Industries Inc Chemicals 2.7%5 ITT Educational Services Inc Commercial Services 2.7%6 Rock-Tenn Co Packaging & Containers 2.7%7 Mosaic Co Chemicals 2.4%8 Bucyrus International Inc Machinery-Construction &
Mining 2.2%9 CF Industries Holdings Inc Chemicals 2.1%
10 Myriad Genetics Inc Biotechnology 2.0%Total 26.0%
Industry Sector Representation as of December 31, 2008
No sector of the economy was spared the negative returns of the past three months. Even recession-resistant utilities andconsumer non-cyclical stocks were down double digits. For the full year they were each down more than 20%. Our models’overweighting of basic materials was very costly to the Fund’s performance relative to the benchmarks. We did benefit fromour models’ underweighting of financials (with some stronger stock picks), as this sector remained depressed throughout thequarter. At quarter end, the largest sector represented in both the broader market and our Fund was consumer non-cyclicals(e.g. healthcare, food, education).
% of Portfolio % S&P 500 Index Difference
Basic Materials 13.4% 3.0% 10.4%Communications 7.0% 10.9% -3.9%Consumer, Cyclical 7.5% 8.2% -0.7%Consumer, Non-cyclical 24.8% 25.2% -0.4%Energy 7.6% 13.5% -5.9%Financial 4.0% 13.0% -9.0%Industrial 21.9% 11.2% 10.7%Technology 13.6% 10.9% 2.7%Utilities 0.0% 4.1% -4.1%Diversified 0.0% 0.0% 0.0%Cash 0.2% 0.0% 0.2%
Total 100.0% 100.0%
Disclaimer
The views expressed here are exclusively those of Fund management. These views, including those of market sectors orindividual stocks, are not meant as investment advice and should not be considered predictive in nature. Any favorable (orunfavorable) description of a holding applies only as of the quarter end, December 31, 2008, unless otherwise stated. Secu-rity positions can and do change thereafter. Discussions of historical performance do not guarantee and are not indicative offuture performance.
www.bridgeway.com 27

Aggressive Investors 2 FundMANAGER’S COMMENTARY (continued)(Unaudited)
Market volatility can significantly affect short-term performance. The Fund is not an appropriate investment for short-terminvestors. Investments in the small companies within this multi-cap fund generally carry greater risk than is customarily asso-ciated with larger companies. This additional risk is attributable to a number of factors, including the relatively limited financialresources that are typically available to small companies, and the fact that small companies often have comparatively limitedproduct lines. In addition, the stock of small companies tends to be more volatile than the stock of large companies, partic-ularly in the short term and particularly in the early stages of an economic or market downturn. The Fund’s use of options,futures, and leverage can magnify the risk of loss in an unfavorable market, and the Fund’s use of short-sale positions can, intheory, expose shareholders to unlimited loss. Finally, the Fund exposes shareholders to “focus risk” which may add to Fundvolatility through the possibility that a single company could significantly affect total return. Shareholders of the Fund, there-fore, are taking on more risk than they would if they invested in the stock market as a whole.
Conclusion
Thank you for your continued investment in Aggressive Investors 2 Fund. We encourage your feedback; your reactions andconcerns are important to us.
Sincerely,
Your Investment Management Team
28 Semi-Annual Report | December 31, 2008 (Unaudited)

THIS PAGE INTENTIONALLY LEFT BLANK
www.bridgeway.com 29
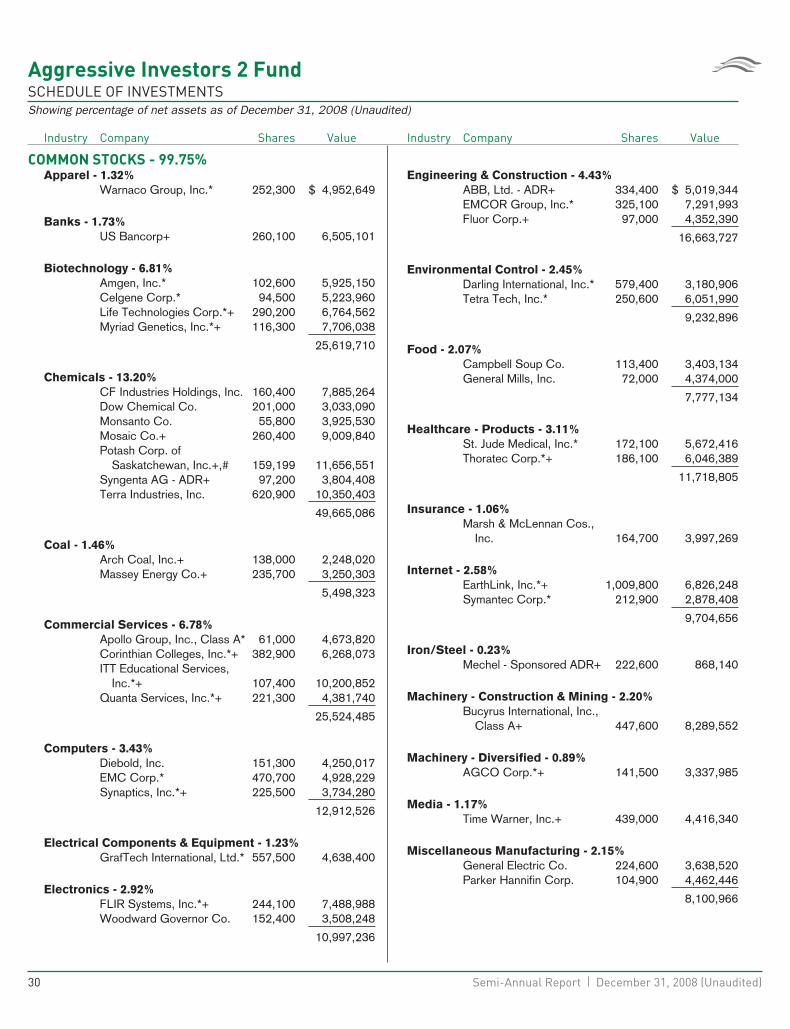
Aggressive Investors 2 FundSCHEDULE OF INVESTMENTSShowing percentage of net assets as of December 31, 2008 (Unaudited)
Industry Company Shares Value
COMMON STOCKS - 99.75%Apparel - 1.32%
Warnaco Group, Inc.* 252,300 $ 4,952,649
Banks - 1.73%US Bancorp+ 260,100 6,505,101
Biotechnology - 6.81%Amgen, Inc.* 102,600 5,925,150Celgene Corp.* 94,500 5,223,960Life Technologies Corp.*+ 290,200 6,764,562Myriad Genetics, Inc.*+ 116,300 7,706,038
25,619,710
Chemicals - 13.20%CF Industries Holdings, Inc. 160,400 7,885,264Dow Chemical Co. 201,000 3,033,090Monsanto Co. 55,800 3,925,530Mosaic Co.+ 260,400 9,009,840Potash Corp. of
Saskatchewan, Inc.+,# 159,199 11,656,551Syngenta AG - ADR+ 97,200 3,804,408Terra Industries, Inc. 620,900 10,350,403
49,665,086
Coal - 1.46%Arch Coal, Inc.+ 138,000 2,248,020Massey Energy Co.+ 235,700 3,250,303
5,498,323
Commercial Services - 6.78%Apollo Group, Inc., Class A* 61,000 4,673,820Corinthian Colleges, Inc.*+ 382,900 6,268,073ITT Educational Services,
Inc.*+ 107,400 10,200,852Quanta Services, Inc.*+ 221,300 4,381,740
25,524,485
Computers - 3.43%Diebold, Inc. 151,300 4,250,017EMC Corp.* 470,700 4,928,229Synaptics, Inc.*+ 225,500 3,734,280
12,912,526
Electrical Components & Equipment - 1.23%GrafTech International, Ltd.* 557,500 4,638,400
Electronics - 2.92%FLIR Systems, Inc.*+ 244,100 7,488,988Woodward Governor Co. 152,400 3,508,248
10,997,236
Industry Company Shares Value
Engineering & Construction - 4.43%ABB, Ltd. - ADR+ 334,400 $ 5,019,344EMCOR Group, Inc.* 325,100 7,291,993Fluor Corp.+ 97,000 4,352,390
16,663,727
Environmental Control - 2.45%Darling International, Inc.* 579,400 3,180,906Tetra Tech, Inc.* 250,600 6,051,990
9,232,896
Food - 2.07%Campbell Soup Co. 113,400 3,403,134General Mills, Inc. 72,000 4,374,000
7,777,134
Healthcare - Products - 3.11%St. Jude Medical, Inc.* 172,100 5,672,416Thoratec Corp.*+ 186,100 6,046,389
11,718,805
Insurance - 1.06%Marsh & McLennan Cos.,
Inc. 164,700 3,997,269
Internet - 2.58%EarthLink, Inc.*+ 1,009,800 6,826,248Symantec Corp.* 212,900 2,878,408
9,704,656
Iron/Steel - 0.23%Mechel - Sponsored ADR+ 222,600 868,140
Machinery - Construction & Mining - 2.20%Bucyrus International, Inc.,
Class A+ 447,600 8,289,552
Machinery - Diversified - 0.89%AGCO Corp.*+ 141,500 3,337,985
Media - 1.17%Time Warner, Inc.+ 439,000 4,416,340
Miscellaneous Manufacturing - 2.15%General Electric Co. 224,600 3,638,520Parker Hannifin Corp. 104,900 4,462,446
8,100,966
30 Semi-Annual Report | December 31, 2008 (Unaudited)
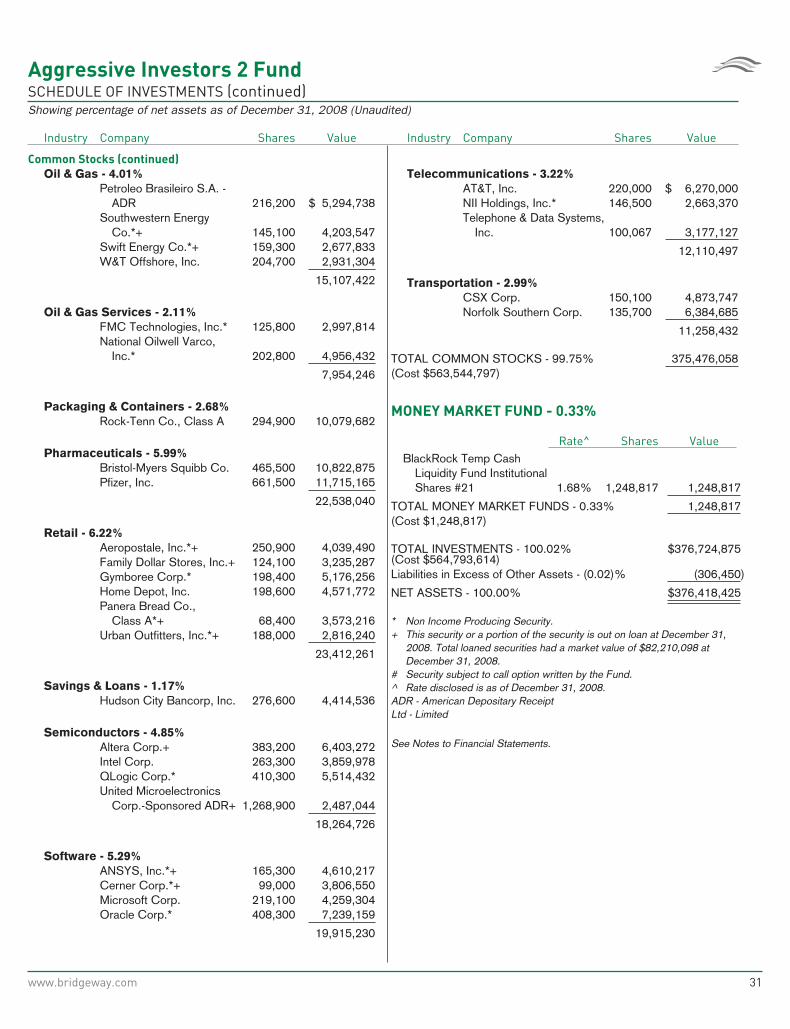
Aggressive Investors 2 FundSCHEDULE OF INVESTMENTS (continued)Showing percentage of net assets as of December 31, 2008 (Unaudited)
Industry Company Shares Value
Common Stocks (continued)
Oil & Gas - 4.01%Petroleo Brasileiro S.A. -
ADR 216,200 $ 5,294,738Southwestern Energy
Co.*+ 145,100 4,203,547Swift Energy Co.*+ 159,300 2,677,833W&T Offshore, Inc. 204,700 2,931,304
15,107,422
Oil & Gas Services - 2.11%FMC Technologies, Inc.* 125,800 2,997,814National Oilwell Varco,
Inc.* 202,800 4,956,432
7,954,246
Packaging & Containers - 2.68%Rock-Tenn Co., Class A 294,900 10,079,682
Pharmaceuticals - 5.99%Bristol-Myers Squibb Co. 465,500 10,822,875Pfizer, Inc. 661,500 11,715,165
22,538,040
Retail - 6.22%Aeropostale, Inc.*+ 250,900 4,039,490Family Dollar Stores, Inc.+ 124,100 3,235,287Gymboree Corp.* 198,400 5,176,256Home Depot, Inc. 198,600 4,571,772Panera Bread Co.,
Class A*+ 68,400 3,573,216Urban Outfitters, Inc.*+ 188,000 2,816,240
23,412,261
Savings & Loans - 1.17%Hudson City Bancorp, Inc. 276,600 4,414,536
Semiconductors - 4.85%Altera Corp.+ 383,200 6,403,272Intel Corp. 263,300 3,859,978QLogic Corp.* 410,300 5,514,432United Microelectronics
Corp.-Sponsored ADR+ 1,268,900 2,487,044
18,264,726
Software - 5.29%ANSYS, Inc.*+ 165,300 4,610,217Cerner Corp.*+ 99,000 3,806,550Microsoft Corp. 219,100 4,259,304Oracle Corp.* 408,300 7,239,159
19,915,230
Industry Company Shares Value
Telecommunications - 3.22%AT&T, Inc. 220,000 $ 6,270,000NII Holdings, Inc.* 146,500 2,663,370Telephone & Data Systems,
Inc. 100,067 3,177,127
12,110,497
Transportation - 2.99%CSX Corp. 150,100 4,873,747Norfolk Southern Corp. 135,700 6,384,685
11,258,432
TOTAL COMMON STOCKS - 99.75% 375,476,058(Cost $563,544,797)
MONEY MARKET FUND - 0.33%
Rate^ Shares ValueBlackRock Temp Cash
Liquidity Fund InstitutionalShares #21 1.68% 1,248,817 1,248,817
TOTAL MONEY MARKET FUNDS - 0.33% 1,248,817(Cost $1,248,817)
TOTAL INVESTMENTS - 100.02% $376,724,875(Cost $564,793,614)Liabilities in Excess of Other Assets - (0.02)% (306,450)
NET ASSETS - 100.00% $376,418,425
* Non Income Producing Security.+ This security or a portion of the security is out on loan at December 31,
2008. Total loaned securities had a market value of $82,210,098 atDecember 31, 2008.
# Security subject to call option written by the Fund.^ Rate disclosed is as of December 31, 2008.ADR - American Depositary ReceiptLtd - Limited
See Notes to Financial Statements.
www.bridgeway.com 31
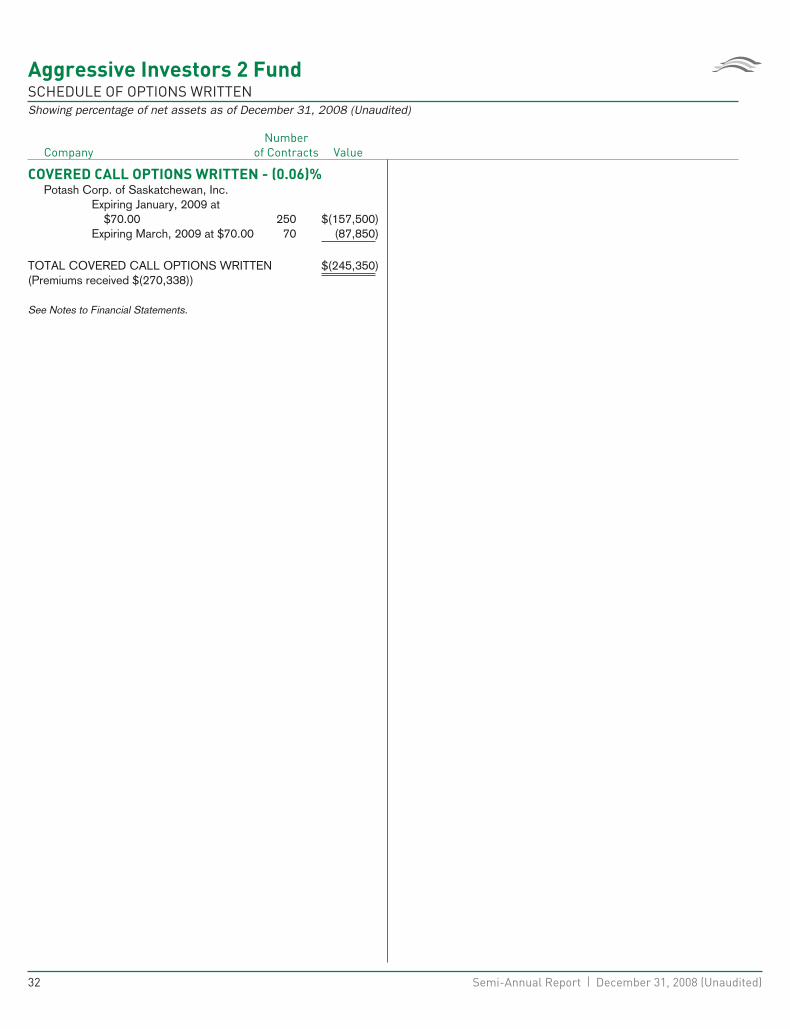
Aggressive Investors 2 FundSCHEDULE OF OPTIONS WRITTENShowing percentage of net assets as of December 31, 2008 (Unaudited)
CompanyNumber
of Contracts Value
COVERED CALL OPTIONS WRITTEN - (0.06)%Potash Corp. of Saskatchewan, Inc.
Expiring January, 2009 at$70.00 250 $(157,500)
Expiring March, 2009 at $70.00 70 (87,850)
TOTAL COVERED CALL OPTIONS WRITTEN $(245,350)(Premiums received $(270,338))
See Notes to Financial Statements.
32 Semi-Annual Report | December 31, 2008 (Unaudited)

THIS PAGE INTENTIONALLY LEFT BLANK
www.bridgeway.com 33
Ultra-Small Company FundMANAGER’S COMMENTARY(Unaudited)
December 31, 2008
Dear Fellow Ultra-Small Company Fund Shareholder,
In the midst of what has now become the worst bear market since the 1930’s, our Fund declined 27.19% for the Decemberquarter. Although this was the second steepest quarterly decline in the Fund’s history, it was significantly better than the34.77% decline of our primary market benchmark, the CRSP Cap-Based Portfolio 10 Index, and a bit better than the27.69% decline of our peer benchmark, the Lipper Micro-Cap Stock Funds Index. We lagged the Russell 2000 Index, whichis comprised of companies quite a bit larger than our tiny ones. While it’s hard to take a 27% decline any time, we arepleased with providing this much cushion against our market benchmark
For the six month semi-annual period, our Fund declined 34.56%, also providing some cushion against the 37.90% declinefor CRSP Cap-Based Portfolio 10 Index. However, we lagged both of our other benchmarks: the Lipper Micro-Cap StockFunds Index (down 33.37%) and the Russell 2000 Index of small companies (down 26.94%). The economic and marketfactors detailed on page 3 are the primary reasons for the Fund’s decline. Relative to our primary market benchmark, twofactors helped our relative performance: superior stock picks among financial companies, and a 1.7% performance boostfrom holding some cash awaiting investment. Our lagging performance relative to the Russell 2000 Index was due to the factthat ultra-small companies fell farther in the downturn than those of “small” companies comprising the Russell Index. Asdetailed in the table on page 35, in this quarter (and in many downturns), ultra-small stocks fell the most of any size group.
For the full calendar year, our Fund declined 46.24%, compared to the 47.33% decline of the CRSP Cap-Based Portfolio 10Index, the 42.71% decline of the Lipper Micro-Cap Stock Funds Index, and the 33.79% decline of the Russell 2000 Index.Factors contributing to this performance were very similar to the semi-annual period discussed above. This is the fourth ultra-small bear market year (2000, 2002, 2007, and 2008) that we have beaten our primary market index. We have lagged it onlyonce in a bear market (by 1.56% in 1998).
The table below presents our December quarter, six-month, one-year, five-year, ten-year, and life-to-date financial results accord-ing to the formula required by the SEC. See the next page for a graph of performance from inception to December 31, 2008.
Dec. Qtr.
10/1/08
to 12/31/08
6 Month
7/1/08
to 12/31/08
1 Year
1/1/08
to 12/31/08
5 Year
1/1/04
to 12/31/08
10 Year
1/1/99
to 12/31/08
Life-to-Date
8/5/94
to 12/31/08
Ultra-Small Company Fund -27.19% -34.56% -46.24% -4.19% 12.05% 13.99%CRSP Cap-Based Port. 10 Index -34.77% -37.90% -47.33% -6.57% 7.04% 8.46%Lipper Micro-Cap Stock Funds Index -27.69% -33.37% -42.71% -4.59% 3.00% NARussell 2000 Index (small companies) -26.12% -26.94% -33.79% -0.93% 3.02% 6.51%
Performance figures quoted in the table above and graph below represent past performance and are no guarantee of futureresults. The table above and the graph below do not reflect the deduction of taxes that a shareholder would pay on Funddistributions or the redemption of Fund shares.
The Lipper Micro-Cap Stock Funds Index is an index of micro-cap funds compiled by Lipper, Inc. The Russell 2000 Index isan unmanaged, market value weighted index, which measures performance of the 2,000 companies that are between the1,000th and 3,000th largest in the market with dividends reinvested. The CRSP Cap-Based Portfolio 10 Index is anunmanaged index of 1,780 of the smallest publicly traded U.S. stocks (with dividends reinvested), as reported by the Centerfor Research on Security Prices. It is not possible to invest directly in an index. Periods longer than one year are annualized.
According to data from Lipper, Inc. as of December 31, 2008, Ultra-Small Company Fund ranked 69th of 94 micro-cap fundsfor the twelve months ending December 31, 2008, 35th of 70 over the last five years, 2nd of 40 over the last ten years, and1st of 9 since inception in August, 1994. These long-term numbers and the graph below give two snapshots of our long-termsuccess. Lipper, Inc. is an independent mutual fund rating service that ranks funds in various fund categories by makingcomparative calculations using total returns.
34 Semi-Annual Report | December 31, 2008 (Unaudited)
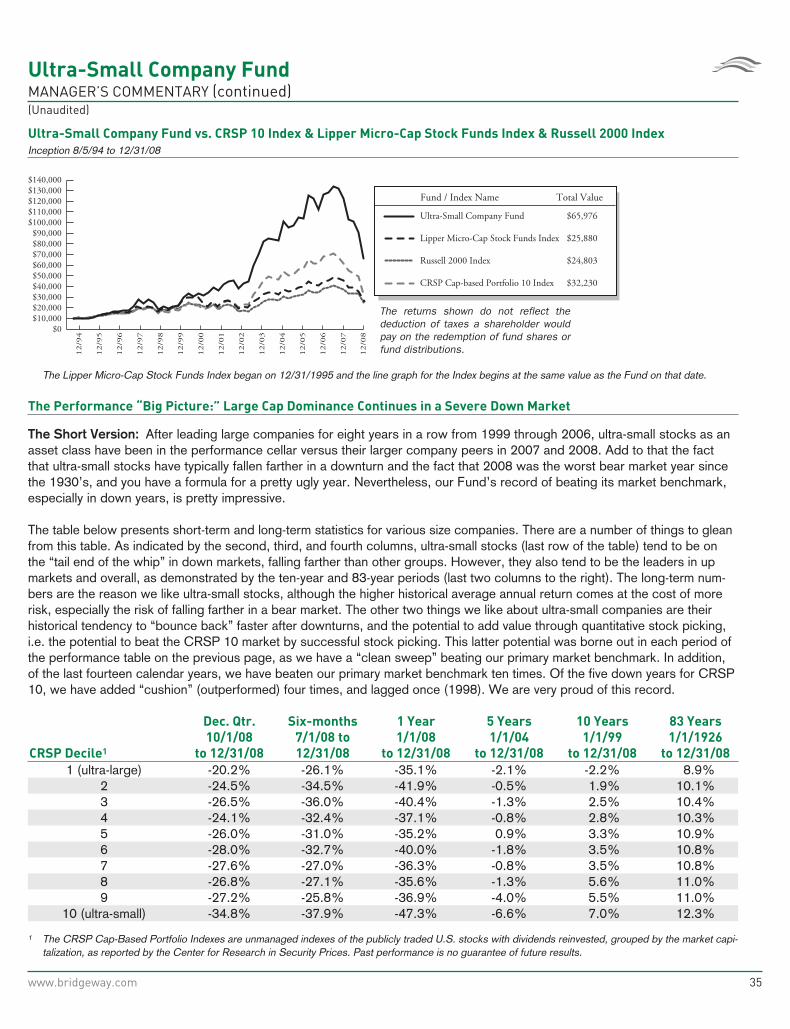
Ultra-Small Company FundMANAGER’S COMMENTARY (continued)(Unaudited)
Ultra-Small Company Fund vs. CRSP 10 Index & Lipper Micro-Cap Stock Funds Index & Russell 2000 Index
Inception 8/5/94 to 12/31/08
Fund / Index Name Total Value
Lipper Micro-Cap Stock Funds Index
CRSP Cap-based Portfolio 10 Index
Russell 2000 Index
Ultra-Small Company Fund
The returns shown do not reflect the deduction of taxes a shareholder would pay on the redemption of fund shares or fund distributions.
$65,976
$25,880
$24,803
$32,230
12/9
5
12/9
4
12/9
6
12/9
7
12/9
8
12/9
9
12/0
0
12/0
1
12/0
2
12/0
3
12/0
4
12/0
5
12/0
6
12/0
7
12/0
8
$0
$50,000
$70,000
$90,000
$110,000
$130,000$140,000
$30,000
$10,000$20,000
$40,000
$60,000
$80,000
$100,000
$120,000
The Lipper Micro-Cap Stock Funds Index began on 12/31/1995 and the line graph for the Index begins at the same value as the Fund on that date.
The Performance “Big Picture:” Large Cap Dominance Continues in a Severe Down Market
The Short Version: After leading large companies for eight years in a row from 1999 through 2006, ultra-small stocks as anasset class have been in the performance cellar versus their larger company peers in 2007 and 2008. Add to that the factthat ultra-small stocks have typically fallen farther in a downturn and the fact that 2008 was the worst bear market year sincethe 1930’s, and you have a formula for a pretty ugly year. Nevertheless, our Fund’s record of beating its market benchmark,especially in down years, is pretty impressive.
The table below presents short-term and long-term statistics for various size companies. There are a number of things to gleanfrom this table. As indicated by the second, third, and fourth columns, ultra-small stocks (last row of the table) tend to be onthe “tail end of the whip” in down markets, falling farther than other groups. However, they also tend to be the leaders in upmarkets and overall, as demonstrated by the ten-year and 83-year periods (last two columns to the right). The long-term num-bers are the reason we like ultra-small stocks, although the higher historical average annual return comes at the cost of morerisk, especially the risk of falling farther in a bear market. The other two things we like about ultra-small companies are theirhistorical tendency to “bounce back” faster after downturns, and the potential to add value through quantitative stock picking,i.e. the potential to beat the CRSP 10 market by successful stock picking. This latter potential was borne out in each period ofthe performance table on the previous page, as we have a “clean sweep” beating our primary market benchmark. In addition,of the last fourteen calendar years, we have beaten our primary market benchmark ten times. Of the five down years for CRSP10, we have added “cushion” (outperformed) four times, and lagged once (1998). We are very proud of this record.
CRSP Decile1
Dec. Qtr.
10/1/08
to 12/31/08
Six-months
7/1/08 to
12/31/08
1 Year
1/1/08
to 12/31/08
5 Years
1/1/04
to 12/31/08
10 Years
1/1/99
to 12/31/08
83 Years
1/1/1926
to 12/31/08
1 (ultra-large) -20.2% -26.1% -35.1% -2.1% -2.2% 8.9%2 -24.5% -34.5% -41.9% -0.5% 1.9% 10.1%3 -26.5% -36.0% -40.4% -1.3% 2.5% 10.4%4 -24.1% -32.4% -37.1% -0.8% 2.8% 10.3%5 -26.0% -31.0% -35.2% 0.9% 3.3% 10.9%6 -28.0% -32.7% -40.0% -1.8% 3.5% 10.8%7 -27.6% -27.0% -36.3% -0.8% 3.5% 10.8%8 -26.8% -27.1% -35.6% -1.3% 5.6% 11.0%9 -27.2% -25.8% -36.9% -4.0% 5.5% 11.0%
10 (ultra-small) -34.8% -37.9% -47.3% -6.6% 7.0% 12.3%
1 The CRSP Cap-Based Portfolio Indexes are unmanaged indexes of the publicly traded U.S. stocks with dividends reinvested, grouped by the market capi-talization, as reported by the Center for Research in Security Prices. Past performance is no guarantee of future results.
www.bridgeway.com 35
Ultra-Small Company FundMANAGER’S COMMENTARY (continued)(Unaudited)
Detailed Explanation of Quarterly Performance—Some stocks (slightly?) cushioned the blow
The Short Version: With a dramatic December quarter downturn, we did have a few stocks that helped cushion the blow. Allof our top ten stocks had significant positive returns.
In a quarter where misery found plenty of company, investors had to search long and hard for winners in their portfolios.While all economic sectors suffered negative ramifications of the credit crisis and severe downturn, non-cyclical consumerstocks held up better than most. Of the top ten best performers in the Fund, four came from that sector. These are the tenbest-performing stocks for the quarter ended December 31, 2008:
Rank Description Industry % Gain
1 Spherion Corp Commercial Services 36.5%2 Spartan Motors Inc Auto Parts & Equipment 28.4%3 Kirkland’s Inc Retail 27.9%4 TeleCommunication Systems Inc Internet 24.3%5 RadNet Inc Healthcare-Services 23.5%6 Callon Petroleum Co Oil & Gas 23.4%7 Fibernet Telecom Group Inc Telecommunications 16.7%8 VSE Corp Engineering & Construction 16.3%9 Maui Land & Pineapple Co Inc Agriculture 14.3%
10 Almost Family Inc Healthcare-Services 13.7%
In the midst of stunningly awful headlines about auto manufacturers and their suppliers, it seems inconceivable that our sec-ond best performer could be an auto parts supplier. Read on. This manufacturing company designs and produces chassis forfire trucks and military vehicles and includes major defense contractors like BAE Systems and General Dynamics among itscustomers. In December, one of its subsidiary companies settled a legal matter with the Department of Justice over terms ofa military contract and agreed to pay fines and penalties totaling $6 million. During the review period in advance of theagreement, Spartan revised its code of conduct and compliance, named a new chief compliance officer, and hired a newgeneral counsel. Because of these measures and the resolution of all civil and criminal matters, Spartan expects to remain amajor supplier to its defense customers. Its stock rose 20% after the announcement and investors were again able to focuson the strong annual revenue and earnings growth of the past three years.
Detailed Explanation of Quarterly Performance—What Didn’t Work
The Short Version: While plummeting energy prices took a bite out of our returns in the December quarter, industrialcompanies (manufacturing, electronics, and transportation) did even more damage.
In mid-summer, oil prices surged to $146/barrel, and many analysts were calling for $200 and beyond. What a difference a fewquarters makes. Over the past six months, the commodities bubbles burst, and crude prices plummeted to a low in December of$31/barrel, a 79% drop. Virtually every company with ties to the energy sector plunged in value. Still, the carnage among smallcompanies was wide spread as demonstrated by the table below. During the quarter, 21 holdings lost over 50% in value.
These are the ten stocks that performed the worst in the quarter ended December 31, 2008:
Rank Description Industry % Loss
1 Conexant Systems Inc Semiconductors -78.0%2 BMB Munai Inc Oil & Gas -66.5%3 China Direct Inc Commercial Services -65.6%4 NN Inc Metal Fabricate/Hardware -64.9%5 Chyron International Corp Electronics -63.4%6 LIN TV Corp Media -62.0%7 Dawson Geophysical Co Oil & Gas Services -61.9%8 Mitcham Industries Inc Oil & Gas Services -60.7%9 CombiMatrix Corp Biotechnology -59.0%
10 CTI Industries Corp Miscellaneous Manufacturing -58.9%
36 Semi-Annual Report | December 31, 2008 (Unaudited)
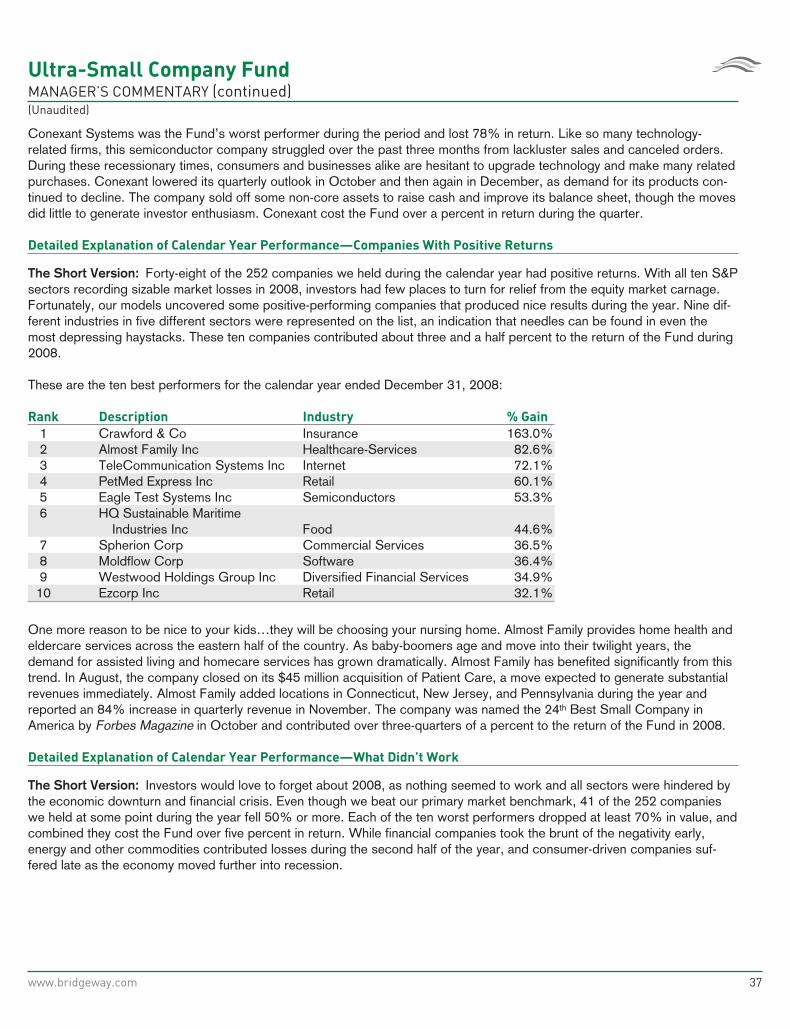
Ultra-Small Company FundMANAGER’S COMMENTARY (continued)(Unaudited)
Conexant Systems was the Fund’s worst performer during the period and lost 78% in return. Like so many technology-related firms, this semiconductor company struggled over the past three months from lackluster sales and canceled orders.During these recessionary times, consumers and businesses alike are hesitant to upgrade technology and make many relatedpurchases. Conexant lowered its quarterly outlook in October and then again in December, as demand for its products con-tinued to decline. The company sold off some non-core assets to raise cash and improve its balance sheet, though the movesdid little to generate investor enthusiasm. Conexant cost the Fund over a percent in return during the quarter.
Detailed Explanation of Calendar Year Performance—Companies With Positive Returns
The Short Version: Forty-eight of the 252 companies we held during the calendar year had positive returns. With all ten S&Psectors recording sizable market losses in 2008, investors had few places to turn for relief from the equity market carnage.Fortunately, our models uncovered some positive-performing companies that produced nice results during the year. Nine dif-ferent industries in five different sectors were represented on the list, an indication that needles can be found in even themost depressing haystacks. These ten companies contributed about three and a half percent to the return of the Fund during2008.
These are the ten best performers for the calendar year ended December 31, 2008:
Rank Description Industry % Gain
1 Crawford & Co Insurance 163.0%2 Almost Family Inc Healthcare-Services 82.6%3 TeleCommunication Systems Inc Internet 72.1%4 PetMed Express Inc Retail 60.1%5 Eagle Test Systems Inc Semiconductors 53.3%6 HQ Sustainable Maritime
Industries Inc Food 44.6%7 Spherion Corp Commercial Services 36.5%8 Moldflow Corp Software 36.4%9 Westwood Holdings Group Inc Diversified Financial Services 34.9%
10 Ezcorp Inc Retail 32.1%
One more reason to be nice to your kids…they will be choosing your nursing home. Almost Family provides home health andeldercare services across the eastern half of the country. As baby-boomers age and move into their twilight years, thedemand for assisted living and homecare services has grown dramatically. Almost Family has benefited significantly from thistrend. In August, the company closed on its $45 million acquisition of Patient Care, a move expected to generate substantialrevenues immediately. Almost Family added locations in Connecticut, New Jersey, and Pennsylvania during the year andreported an 84% increase in quarterly revenue in November. The company was named the 24th Best Small Company inAmerica by Forbes Magazine in October and contributed over three-quarters of a percent to the return of the Fund in 2008.
Detailed Explanation of Calendar Year Performance—What Didn’t Work
The Short Version: Investors would love to forget about 2008, as nothing seemed to work and all sectors were hindered bythe economic downturn and financial crisis. Even though we beat our primary market benchmark, 41 of the 252 companieswe held at some point during the year fell 50% or more. Each of the ten worst performers dropped at least 70% in value, andcombined they cost the Fund over five percent in return. While financial companies took the brunt of the negativity early,energy and other commodities contributed losses during the second half of the year, and consumer-driven companies suf-fered late as the economy moved further into recession.
www.bridgeway.com 37
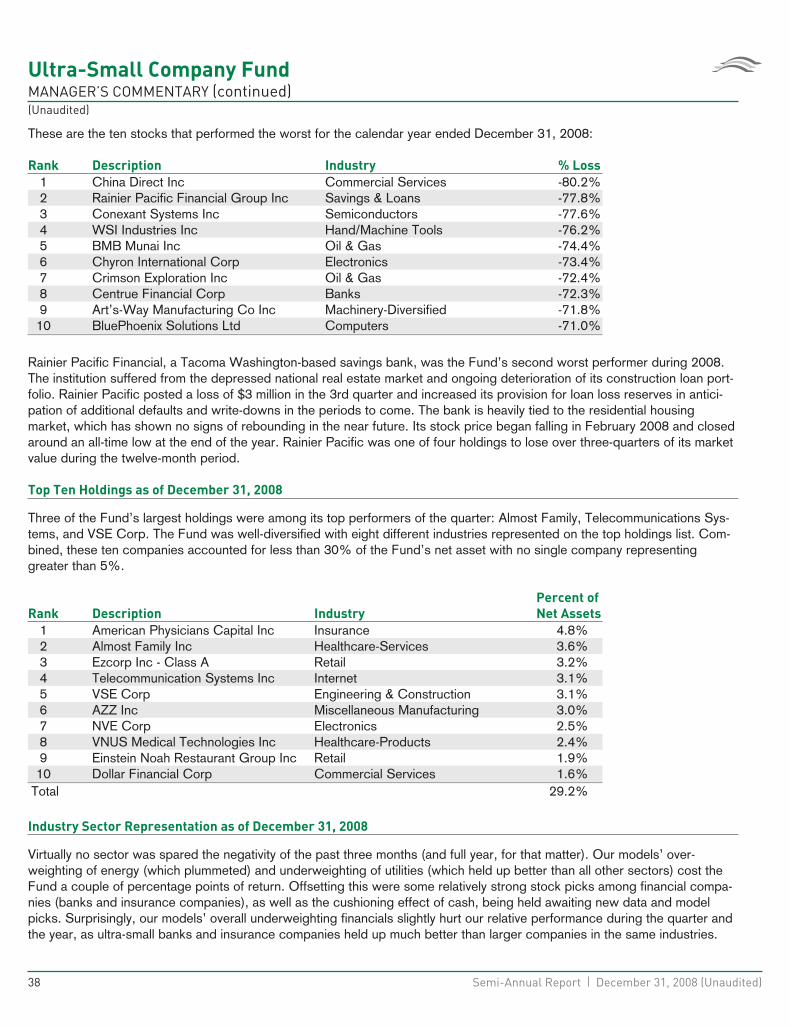
Ultra-Small Company FundMANAGER’S COMMENTARY (continued)(Unaudited)
These are the ten stocks that performed the worst for the calendar year ended December 31, 2008:
Rank Description Industry % Loss
1 China Direct Inc Commercial Services -80.2%2 Rainier Pacific Financial Group Inc Savings & Loans -77.8%3 Conexant Systems Inc Semiconductors -77.6%4 WSI Industries Inc Hand/Machine Tools -76.2%5 BMB Munai Inc Oil & Gas -74.4%6 Chyron International Corp Electronics -73.4%7 Crimson Exploration Inc Oil & Gas -72.4%8 Centrue Financial Corp Banks -72.3%9 Art’s-Way Manufacturing Co Inc Machinery-Diversified -71.8%
10 BluePhoenix Solutions Ltd Computers -71.0%
Rainier Pacific Financial, a Tacoma Washington-based savings bank, was the Fund’s second worst performer during 2008.The institution suffered from the depressed national real estate market and ongoing deterioration of its construction loan port-folio. Rainier Pacific posted a loss of $3 million in the 3rd quarter and increased its provision for loan loss reserves in antici-pation of additional defaults and write-downs in the periods to come. The bank is heavily tied to the residential housingmarket, which has shown no signs of rebounding in the near future. Its stock price began falling in February 2008 and closedaround an all-time low at the end of the year. Rainier Pacific was one of four holdings to lose over three-quarters of its marketvalue during the twelve-month period.
Top Ten Holdings as of December 31, 2008
Three of the Fund’s largest holdings were among its top performers of the quarter: Almost Family, Telecommunications Sys-tems, and VSE Corp. The Fund was well-diversified with eight different industries represented on the top holdings list. Com-bined, these ten companies accounted for less than 30% of the Fund’s net asset with no single company representinggreater than 5%.
Rank Description Industry
Percent of
Net Assets
1 American Physicians Capital Inc Insurance 4.8%2 Almost Family Inc Healthcare-Services 3.6%3 Ezcorp Inc - Class A Retail 3.2%4 Telecommunication Systems Inc Internet 3.1%5 VSE Corp Engineering & Construction 3.1%6 AZZ Inc Miscellaneous Manufacturing 3.0%7 NVE Corp Electronics 2.5%8 VNUS Medical Technologies Inc Healthcare-Products 2.4%9 Einstein Noah Restaurant Group Inc Retail 1.9%
10 Dollar Financial Corp Commercial Services 1.6%Total 29.2%
Industry Sector Representation as of December 31, 2008
Virtually no sector was spared the negativity of the past three months (and full year, for that matter). Our models’ over-weighting of energy (which plummeted) and underweighting of utilities (which held up better than all other sectors) cost theFund a couple of percentage points of return. Offsetting this were some relatively strong stock picks among financial compa-nies (banks and insurance companies), as well as the cushioning effect of cash, being held awaiting new data and modelpicks. Surprisingly, our models’ overall underweighting financials slightly hurt our relative performance during the quarter andthe year, as ultra-small banks and insurance companies held up much better than larger companies in the same industries.
38 Semi-Annual Report | December 31, 2008 (Unaudited)
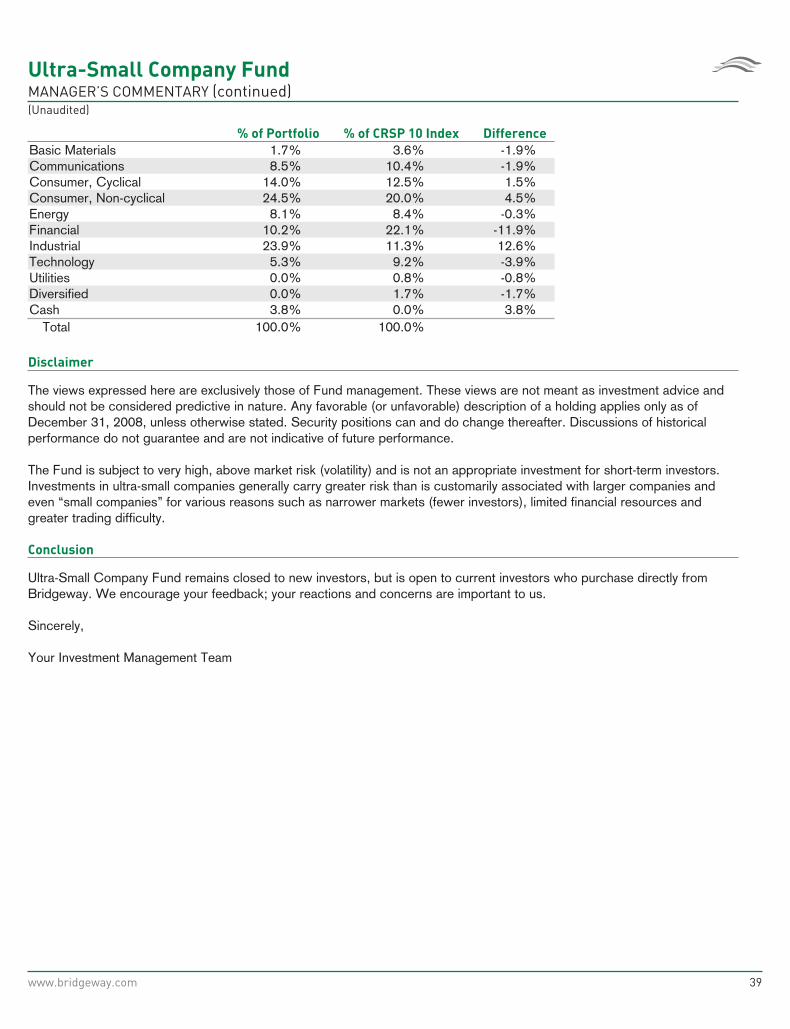
Ultra-Small Company FundMANAGER’S COMMENTARY (continued)(Unaudited)
% of Portfolio % of CRSP 10 Index Difference
Basic Materials 1.7% 3.6% -1.9%Communications 8.5% 10.4% -1.9%Consumer, Cyclical 14.0% 12.5% 1.5%Consumer, Non-cyclical 24.5% 20.0% 4.5%Energy 8.1% 8.4% -0.3%Financial 10.2% 22.1% -11.9%Industrial 23.9% 11.3% 12.6%Technology 5.3% 9.2% -3.9%Utilities 0.0% 0.8% -0.8%Diversified 0.0% 1.7% -1.7%Cash 3.8% 0.0% 3.8%
Total 100.0% 100.0%
Disclaimer
The views expressed here are exclusively those of Fund management. These views are not meant as investment advice andshould not be considered predictive in nature. Any favorable (or unfavorable) description of a holding applies only as ofDecember 31, 2008, unless otherwise stated. Security positions can and do change thereafter. Discussions of historicalperformance do not guarantee and are not indicative of future performance.
The Fund is subject to very high, above market risk (volatility) and is not an appropriate investment for short-term investors.Investments in ultra-small companies generally carry greater risk than is customarily associated with larger companies andeven “small companies” for various reasons such as narrower markets (fewer investors), limited financial resources andgreater trading difficulty.
Conclusion
Ultra-Small Company Fund remains closed to new investors, but is open to current investors who purchase directly fromBridgeway. We encourage your feedback; your reactions and concerns are important to us.
Sincerely,
Your Investment Management Team
www.bridgeway.com 39
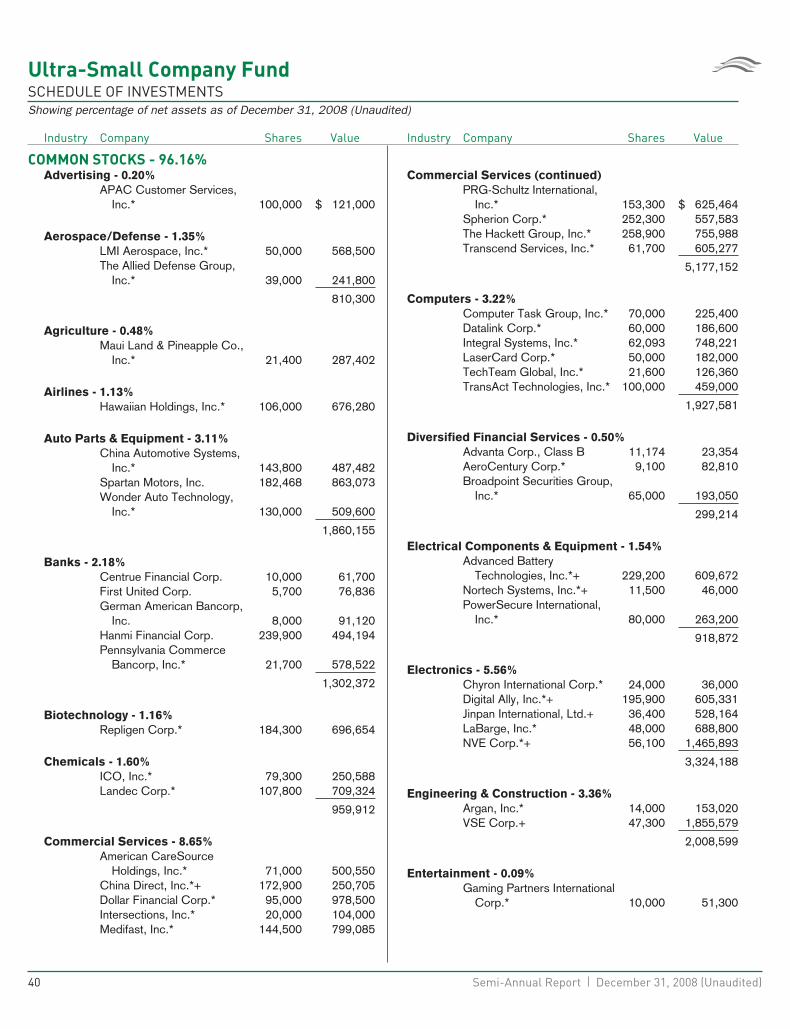
Ultra-Small Company FundSCHEDULE OF INVESTMENTSShowing percentage of net assets as of December 31, 2008 (Unaudited)
Industry Company Shares Value
COMMON STOCKS - 96.16%Advertising - 0.20%
APAC Customer Services,Inc.* 100,000 $ 121,000
Aerospace/Defense - 1.35%LMI Aerospace, Inc.* 50,000 568,500The Allied Defense Group,
Inc.* 39,000 241,800
810,300
Agriculture - 0.48%Maui Land & Pineapple Co.,
Inc.* 21,400 287,402
Airlines - 1.13%Hawaiian Holdings, Inc.* 106,000 676,280
Auto Parts & Equipment - 3.11%China Automotive Systems,
Inc.* 143,800 487,482Spartan Motors, Inc. 182,468 863,073Wonder Auto Technology,
Inc.* 130,000 509,600
1,860,155
Banks - 2.18%Centrue Financial Corp. 10,000 61,700First United Corp. 5,700 76,836German American Bancorp,
Inc. 8,000 91,120Hanmi Financial Corp. 239,900 494,194Pennsylvania Commerce
Bancorp, Inc.* 21,700 578,522
1,302,372
Biotechnology - 1.16%Repligen Corp.* 184,300 696,654
Chemicals - 1.60%ICO, Inc.* 79,300 250,588Landec Corp.* 107,800 709,324
959,912
Commercial Services - 8.65%American CareSource
Holdings, Inc.* 71,000 500,550China Direct, Inc.*+ 172,900 250,705Dollar Financial Corp.* 95,000 978,500Intersections, Inc.* 20,000 104,000Medifast, Inc.* 144,500 799,085
Industry Company Shares Value
Commercial Services (continued)PRG-Schultz International,
Inc.* 153,300 $ 625,464Spherion Corp.* 252,300 557,583The Hackett Group, Inc.* 258,900 755,988Transcend Services, Inc.* 61,700 605,277
5,177,152
Computers - 3.22%Computer Task Group, Inc.* 70,000 225,400Datalink Corp.* 60,000 186,600Integral Systems, Inc.* 62,093 748,221LaserCard Corp.* 50,000 182,000TechTeam Global, Inc.* 21,600 126,360TransAct Technologies, Inc.* 100,000 459,000
1,927,581
Diversified Financial Services - 0.50%Advanta Corp., Class B 11,174 23,354AeroCentury Corp.* 9,100 82,810Broadpoint Securities Group,
Inc.* 65,000 193,050
299,214
Electrical Components & Equipment - 1.54%Advanced Battery
Technologies, Inc.*+ 229,200 609,672Nortech Systems, Inc.*+ 11,500 46,000PowerSecure International,
Inc.* 80,000 263,200
918,872
Electronics - 5.56%Chyron International Corp.* 24,000 36,000Digital Ally, Inc.*+ 195,900 605,331Jinpan International, Ltd.+ 36,400 528,164LaBarge, Inc.* 48,000 688,800NVE Corp.*+ 56,100 1,465,893
3,324,188
Engineering & Construction - 3.36%Argan, Inc.* 14,000 153,020VSE Corp.+ 47,300 1,855,579
2,008,599
Entertainment - 0.09%Gaming Partners International
Corp.* 10,000 51,300
40 Semi-Annual Report | December 31, 2008 (Unaudited)
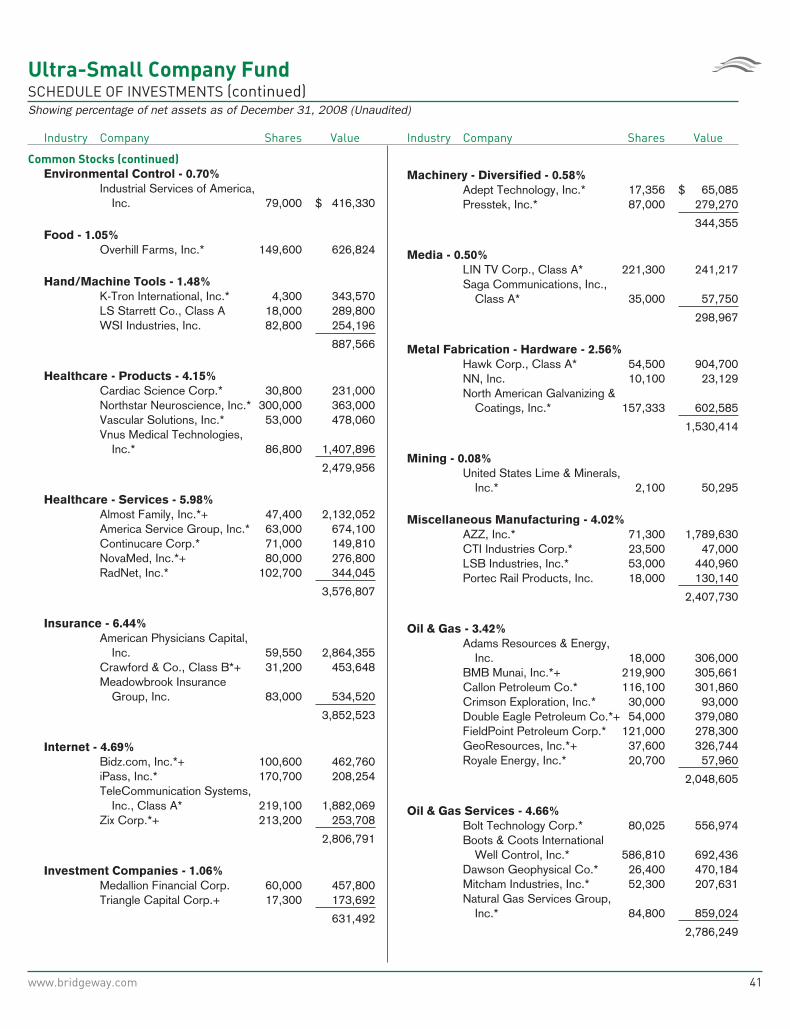
Ultra-Small Company FundSCHEDULE OF INVESTMENTS (continued)Showing percentage of net assets as of December 31, 2008 (Unaudited)
Industry Company Shares Value
Common Stocks (continued)
Environmental Control - 0.70%Industrial Services of America,
Inc. 79,000 $ 416,330
Food - 1.05%Overhill Farms, Inc.* 149,600 626,824
Hand/Machine Tools - 1.48%K-Tron International, Inc.* 4,300 343,570LS Starrett Co., Class A 18,000 289,800WSI Industries, Inc. 82,800 254,196
887,566
Healthcare - Products - 4.15%Cardiac Science Corp.* 30,800 231,000Northstar Neuroscience, Inc.* 300,000 363,000Vascular Solutions, Inc.* 53,000 478,060Vnus Medical Technologies,
Inc.* 86,800 1,407,896
2,479,956
Healthcare - Services - 5.98%Almost Family, Inc.*+ 47,400 2,132,052America Service Group, Inc.* 63,000 674,100Continucare Corp.* 71,000 149,810NovaMed, Inc.*+ 80,000 276,800RadNet, Inc.* 102,700 344,045
3,576,807
Insurance - 6.44%American Physicians Capital,
Inc. 59,550 2,864,355Crawford & Co., Class B*+ 31,200 453,648Meadowbrook Insurance
Group, Inc. 83,000 534,520
3,852,523
Internet - 4.69%Bidz.com, Inc.*+ 100,600 462,760iPass, Inc.* 170,700 208,254TeleCommunication Systems,
Inc., Class A* 219,100 1,882,069Zix Corp.*+ 213,200 253,708
2,806,791
Investment Companies - 1.06%Medallion Financial Corp. 60,000 457,800Triangle Capital Corp.+ 17,300 173,692
631,492
Industry Company Shares Value
Machinery - Diversified - 0.58%Adept Technology, Inc.* 17,356 $ 65,085Presstek, Inc.* 87,000 279,270
344,355
Media - 0.50%LIN TV Corp., Class A* 221,300 241,217Saga Communications, Inc.,
Class A* 35,000 57,750
298,967
Metal Fabrication - Hardware - 2.56%Hawk Corp., Class A* 54,500 904,700NN, Inc. 10,100 23,129North American Galvanizing &
Coatings, Inc.* 157,333 602,585
1,530,414
Mining - 0.08%United States Lime & Minerals,
Inc.* 2,100 50,295
Miscellaneous Manufacturing - 4.02%AZZ, Inc.* 71,300 1,789,630CTI Industries Corp.* 23,500 47,000LSB Industries, Inc.* 53,000 440,960Portec Rail Products, Inc. 18,000 130,140
2,407,730
Oil & Gas - 3.42%Adams Resources & Energy,
Inc. 18,000 306,000BMB Munai, Inc.*+ 219,900 305,661Callon Petroleum Co.* 116,100 301,860Crimson Exploration, Inc.* 30,000 93,000Double Eagle Petroleum Co.*+ 54,000 379,080FieldPoint Petroleum Corp.* 121,000 278,300GeoResources, Inc.*+ 37,600 326,744Royale Energy, Inc.* 20,700 57,960
2,048,605
Oil & Gas Services - 4.66%Bolt Technology Corp.* 80,025 556,974Boots & Coots International
Well Control, Inc.* 586,810 692,436Dawson Geophysical Co.* 26,400 470,184Mitcham Industries, Inc.* 52,300 207,631Natural Gas Services Group,
Inc.* 84,800 859,024
2,786,249
www.bridgeway.com 41
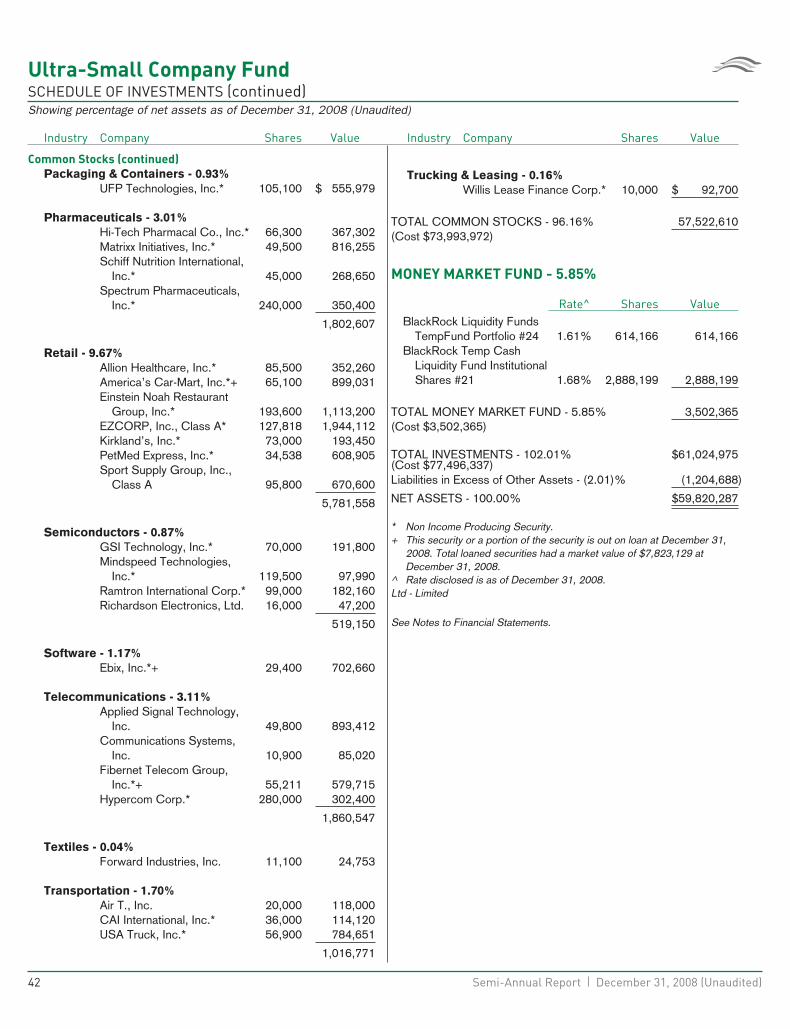
Ultra-Small Company FundSCHEDULE OF INVESTMENTS (continued)Showing percentage of net assets as of December 31, 2008 (Unaudited)
Industry Company Shares Value
Common Stocks (continued)
Packaging & Containers - 0.93%UFP Technologies, Inc.* 105,100 $ 555,979
Pharmaceuticals - 3.01%Hi-Tech Pharmacal Co., Inc.* 66,300 367,302Matrixx Initiatives, Inc.* 49,500 816,255Schiff Nutrition International,
Inc.* 45,000 268,650Spectrum Pharmaceuticals,
Inc.* 240,000 350,400
1,802,607
Retail - 9.67%Allion Healthcare, Inc.* 85,500 352,260America’s Car-Mart, Inc.*+ 65,100 899,031Einstein Noah Restaurant
Group, Inc.* 193,600 1,113,200EZCORP, Inc., Class A* 127,818 1,944,112Kirkland’s, Inc.* 73,000 193,450PetMed Express, Inc.* 34,538 608,905Sport Supply Group, Inc.,
Class A 95,800 670,600
5,781,558
Semiconductors - 0.87%GSI Technology, Inc.* 70,000 191,800Mindspeed Technologies,
Inc.* 119,500 97,990Ramtron International Corp.* 99,000 182,160Richardson Electronics, Ltd. 16,000 47,200
519,150
Software - 1.17%Ebix, Inc.*+ 29,400 702,660
Telecommunications - 3.11%Applied Signal Technology,
Inc. 49,800 893,412Communications Systems,
Inc. 10,900 85,020Fibernet Telecom Group,
Inc.*+ 55,211 579,715Hypercom Corp.* 280,000 302,400
1,860,547
Textiles - 0.04%Forward Industries, Inc. 11,100 24,753
Transportation - 1.70%Air T., Inc. 20,000 118,000CAI International, Inc.* 36,000 114,120USA Truck, Inc.* 56,900 784,651
1,016,771
Industry Company Shares Value
Trucking & Leasing - 0.16%Willis Lease Finance Corp.* 10,000 $ 92,700
TOTAL COMMON STOCKS - 96.16% 57,522,610(Cost $73,993,972)
MONEY MARKET FUND - 5.85%
Rate^ Shares ValueBlackRock Liquidity Funds
TempFund Portfolio #24 1.61% 614,166 614,166BlackRock Temp Cash
Liquidity Fund InstitutionalShares #21 1.68% 2,888,199 2,888,199
TOTAL MONEY MARKET FUND - 5.85% 3,502,365(Cost $3,502,365)
TOTAL INVESTMENTS - 102.01% $61,024,975(Cost $77,496,337)Liabilities in Excess of Other Assets - (2.01)% (1,204,688)
NET ASSETS - 100.00% $59,820,287
* Non Income Producing Security.+ This security or a portion of the security is out on loan at December 31,
2008. Total loaned securities had a market value of $7,823,129 atDecember 31, 2008.
^ Rate disclosed is as of December 31, 2008.Ltd - Limited
See Notes to Financial Statements.
42 Semi-Annual Report | December 31, 2008 (Unaudited)

THIS PAGE INTENTIONALLY LEFT BLANK
www.bridgeway.com 43
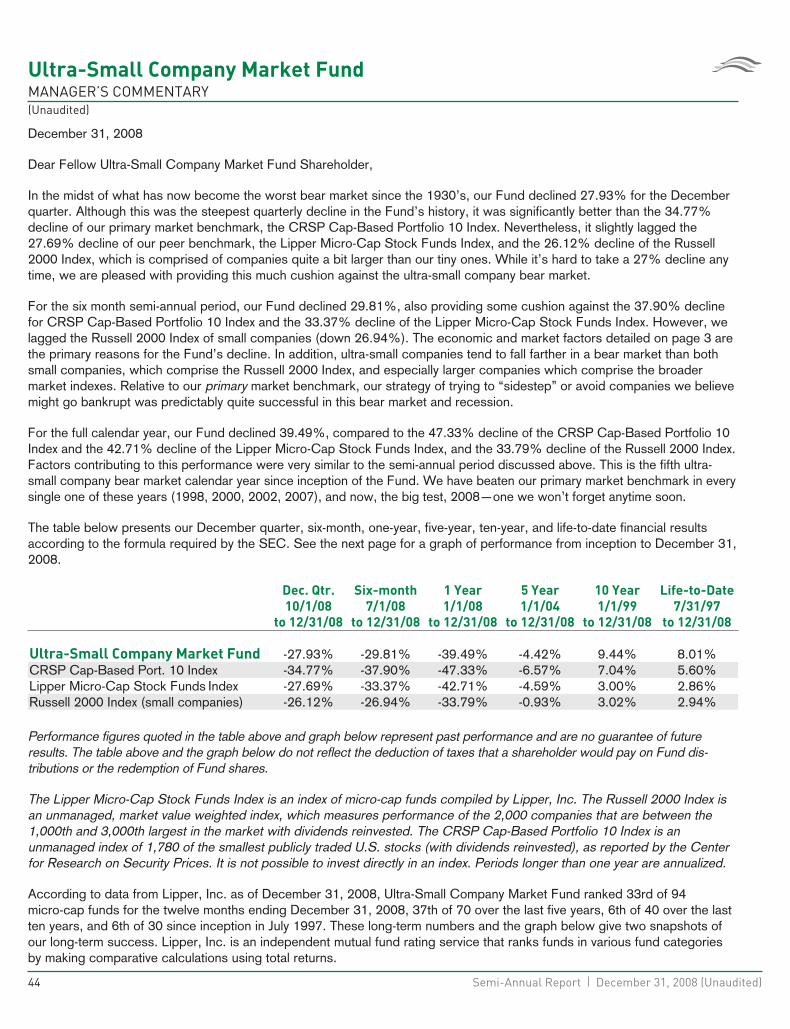
Ultra-Small Company Market FundMANAGER’S COMMENTARY(Unaudited)
December 31, 2008
Dear Fellow Ultra-Small Company Market Fund Shareholder,
In the midst of what has now become the worst bear market since the 1930’s, our Fund declined 27.93% for the Decemberquarter. Although this was the steepest quarterly decline in the Fund’s history, it was significantly better than the 34.77%decline of our primary market benchmark, the CRSP Cap-Based Portfolio 10 Index. Nevertheless, it slightly lagged the27.69% decline of our peer benchmark, the Lipper Micro-Cap Stock Funds Index, and the 26.12% decline of the Russell2000 Index, which is comprised of companies quite a bit larger than our tiny ones. While it’s hard to take a 27% decline anytime, we are pleased with providing this much cushion against the ultra-small company bear market.
For the six month semi-annual period, our Fund declined 29.81%, also providing some cushion against the 37.90% declinefor CRSP Cap-Based Portfolio 10 Index and the 33.37% decline of the Lipper Micro-Cap Stock Funds Index. However, welagged the Russell 2000 Index of small companies (down 26.94%). The economic and market factors detailed on page 3 arethe primary reasons for the Fund’s decline. In addition, ultra-small companies tend to fall farther in a bear market than bothsmall companies, which comprise the Russell 2000 Index, and especially larger companies which comprise the broadermarket indexes. Relative to our primary market benchmark, our strategy of trying to “sidestep” or avoid companies we believemight go bankrupt was predictably quite successful in this bear market and recession.
For the full calendar year, our Fund declined 39.49%, compared to the 47.33% decline of the CRSP Cap-Based Portfolio 10Index and the 42.71% decline of the Lipper Micro-Cap Stock Funds Index, and the 33.79% decline of the Russell 2000 Index.Factors contributing to this performance were very similar to the semi-annual period discussed above. This is the fifth ultra-small company bear market calendar year since inception of the Fund. We have beaten our primary market benchmark in everysingle one of these years (1998, 2000, 2002, 2007), and now, the big test, 2008—one we won’t forget anytime soon.
The table below presents our December quarter, six-month, one-year, five-year, ten-year, and life-to-date financial resultsaccording to the formula required by the SEC. See the next page for a graph of performance from inception to December 31,2008.
Dec. Qtr.
10/1/08
to 12/31/08
Six-month
7/1/08
to 12/31/08
1 Year
1/1/08
to 12/31/08
5 Year
1/1/04
to 12/31/08
10 Year
1/1/99
to 12/31/08
Life-to-Date
7/31/97
to 12/31/08
Ultra-Small Company Market Fund -27.93% -29.81% -39.49% -4.42% 9.44% 8.01%CRSP Cap-Based Port. 10 Index -34.77% -37.90% -47.33% -6.57% 7.04% 5.60%Lipper Micro-Cap Stock Funds Index -27.69% -33.37% -42.71% -4.59% 3.00% 2.86%Russell 2000 Index (small companies) -26.12% -26.94% -33.79% -0.93% 3.02% 2.94%
Performance figures quoted in the table above and graph below represent past performance and are no guarantee of futureresults. The table above and the graph below do not reflect the deduction of taxes that a shareholder would pay on Fund dis-tributions or the redemption of Fund shares.
The Lipper Micro-Cap Stock Funds Index is an index of micro-cap funds compiled by Lipper, Inc. The Russell 2000 Index isan unmanaged, market value weighted index, which measures performance of the 2,000 companies that are between the1,000th and 3,000th largest in the market with dividends reinvested. The CRSP Cap-Based Portfolio 10 Index is anunmanaged index of 1,780 of the smallest publicly traded U.S. stocks (with dividends reinvested), as reported by the Centerfor Research on Security Prices. It is not possible to invest directly in an index. Periods longer than one year are annualized.
According to data from Lipper, Inc. as of December 31, 2008, Ultra-Small Company Market Fund ranked 33rd of 94micro-cap funds for the twelve months ending December 31, 2008, 37th of 70 over the last five years, 6th of 40 over the lastten years, and 6th of 30 since inception in July 1997. These long-term numbers and the graph below give two snapshots ofour long-term success. Lipper, Inc. is an independent mutual fund rating service that ranks funds in various fund categoriesby making comparative calculations using total returns.
44 Semi-Annual Report | December 31, 2008 (Unaudited)
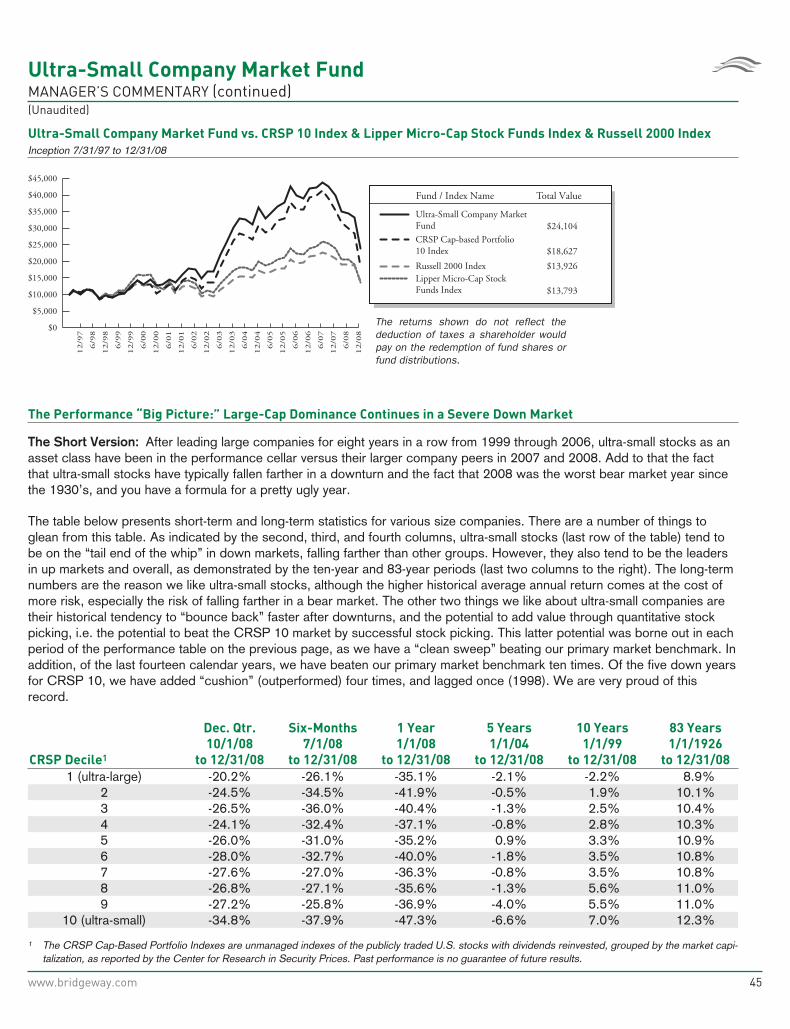
Ultra-Small Company Market FundMANAGER’S COMMENTARY (continued)(Unaudited)
Ultra-Small Company Market Fund vs. CRSP 10 Index & Lipper Micro-Cap Stock Funds Index & Russell 2000 Index
Inception 7/31/97 to 12/31/08
$0
$20,000
$25,000
$30,000
$35,000
$40,000
$15,000
$10,000
$5,000
$45,000
12/0
6
6/0
6
12/0
5
6/0
5
6/0
7
12/0
8
6/0
8
12/0
7
12/0
4
6/0
3
12/0
3
6/0
4
12/0
2
6/0
2
12/0
1
6/0
1
12/0
0
12/9
9
6/9
9
6/0
0
12/9
8
6/9
8
12/9
7
Fund / Index Name
Ultra-Small Company MarketFund
The returns shown do not reflect the deduction of taxes a shareholder would pay on the redemption of fund shares or fund distributions.
CRSP Cap-based Portfolio10 Index
Total Value
$24,104
Lipper Micro-Cap StockFunds Index $13,793
Russell 2000 Index $13,926
$18,627
The Performance “Big Picture:” Large-Cap Dominance Continues in a Severe Down Market
The Short Version: After leading large companies for eight years in a row from 1999 through 2006, ultra-small stocks as anasset class have been in the performance cellar versus their larger company peers in 2007 and 2008. Add to that the factthat ultra-small stocks have typically fallen farther in a downturn and the fact that 2008 was the worst bear market year sincethe 1930’s, and you have a formula for a pretty ugly year.
The table below presents short-term and long-term statistics for various size companies. There are a number of things toglean from this table. As indicated by the second, third, and fourth columns, ultra-small stocks (last row of the table) tend tobe on the “tail end of the whip” in down markets, falling farther than other groups. However, they also tend to be the leadersin up markets and overall, as demonstrated by the ten-year and 83-year periods (last two columns to the right). The long-termnumbers are the reason we like ultra-small stocks, although the higher historical average annual return comes at the cost ofmore risk, especially the risk of falling farther in a bear market. The other two things we like about ultra-small companies aretheir historical tendency to “bounce back” faster after downturns, and the potential to add value through quantitative stockpicking, i.e. the potential to beat the CRSP 10 market by successful stock picking. This latter potential was borne out in eachperiod of the performance table on the previous page, as we have a “clean sweep” beating our primary market benchmark. Inaddition, of the last fourteen calendar years, we have beaten our primary market benchmark ten times. Of the five down yearsfor CRSP 10, we have added “cushion” (outperformed) four times, and lagged once (1998). We are very proud of thisrecord.
CRSP Decile1
Dec. Qtr.
10/1/08
to 12/31/08
Six-Months
7/1/08
to 12/31/08
1 Year
1/1/08
to 12/31/08
5 Years
1/1/04
to 12/31/08
10 Years
1/1/99
to 12/31/08
83 Years
1/1/1926
to 12/31/08
1 (ultra-large) -20.2% -26.1% -35.1% -2.1% -2.2% 8.9%2 -24.5% -34.5% -41.9% -0.5% 1.9% 10.1%3 -26.5% -36.0% -40.4% -1.3% 2.5% 10.4%4 -24.1% -32.4% -37.1% -0.8% 2.8% 10.3%5 -26.0% -31.0% -35.2% 0.9% 3.3% 10.9%6 -28.0% -32.7% -40.0% -1.8% 3.5% 10.8%7 -27.6% -27.0% -36.3% -0.8% 3.5% 10.8%8 -26.8% -27.1% -35.6% -1.3% 5.6% 11.0%9 -27.2% -25.8% -36.9% -4.0% 5.5% 11.0%
10 (ultra-small) -34.8% -37.9% -47.3% -6.6% 7.0% 12.3%
1 The CRSP Cap-Based Portfolio Indexes are unmanaged indexes of the publicly traded U.S. stocks with dividends reinvested, grouped by the market capi-talization, as reported by the Center for Research in Security Prices. Past performance is no guarantee of future results.
www.bridgeway.com 45
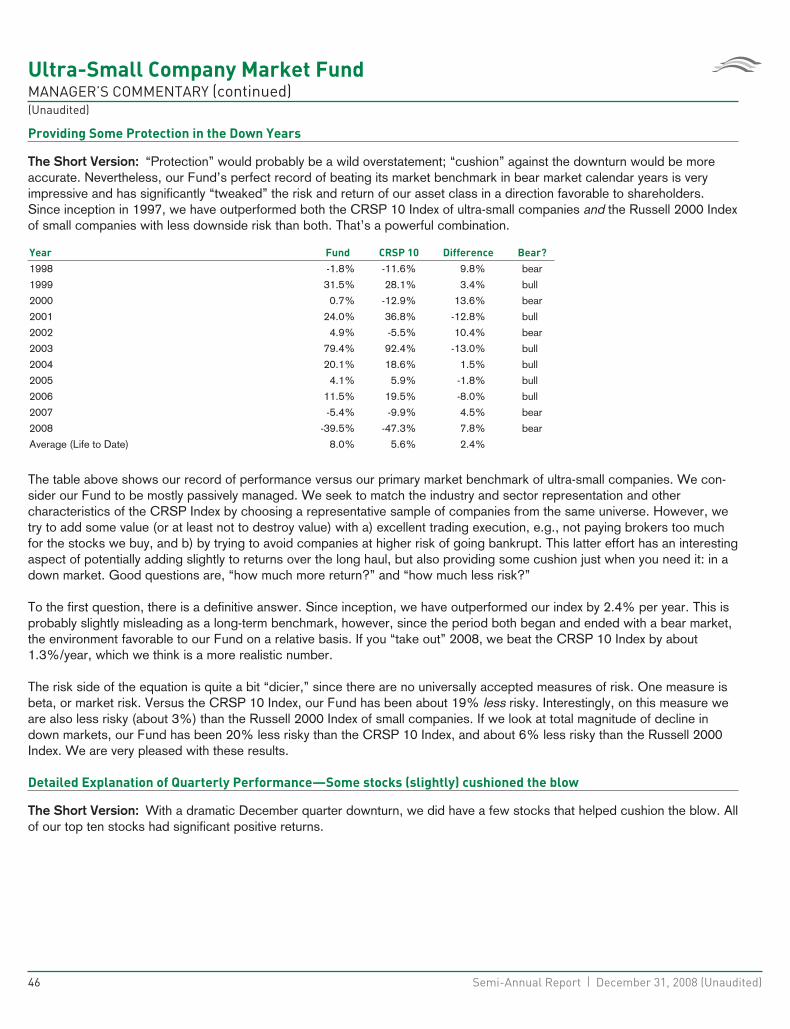
Ultra-Small Company Market FundMANAGER’S COMMENTARY (continued)(Unaudited)
Providing Some Protection in the Down Years
The Short Version: “Protection” would probably be a wild overstatement; “cushion” against the downturn would be moreaccurate. Nevertheless, our Fund’s perfect record of beating its market benchmark in bear market calendar years is veryimpressive and has significantly “tweaked” the risk and return of our asset class in a direction favorable to shareholders.Since inception in 1997, we have outperformed both the CRSP 10 Index of ultra-small companies and the Russell 2000 Indexof small companies with less downside risk than both. That’s a powerful combination.
Year Fund CRSP 10 Difference Bear?
1998 -1.8% -11.6% 9.8% bear
1999 31.5% 28.1% 3.4% bull
2000 0.7% -12.9% 13.6% bear
2001 24.0% 36.8% -12.8% bull
2002 4.9% -5.5% 10.4% bear
2003 79.4% 92.4% -13.0% bull
2004 20.1% 18.6% 1.5% bull
2005 4.1% 5.9% -1.8% bull
2006 11.5% 19.5% -8.0% bull
2007 -5.4% -9.9% 4.5% bear
2008 -39.5% -47.3% 7.8% bear
Average (Life to Date) 8.0% 5.6% 2.4%
The table above shows our record of performance versus our primary market benchmark of ultra-small companies. We con-sider our Fund to be mostly passively managed. We seek to match the industry and sector representation and othercharacteristics of the CRSP Index by choosing a representative sample of companies from the same universe. However, wetry to add some value (or at least not to destroy value) with a) excellent trading execution, e.g., not paying brokers too muchfor the stocks we buy, and b) by trying to avoid companies at higher risk of going bankrupt. This latter effort has an interestingaspect of potentially adding slightly to returns over the long haul, but also providing some cushion just when you need it: in adown market. Good questions are, “how much more return?” and “how much less risk?”
To the first question, there is a definitive answer. Since inception, we have outperformed our index by 2.4% per year. This isprobably slightly misleading as a long-term benchmark, however, since the period both began and ended with a bear market,the environment favorable to our Fund on a relative basis. If you “take out” 2008, we beat the CRSP 10 Index by about1.3%/year, which we think is a more realistic number.
The risk side of the equation is quite a bit “dicier,” since there are no universally accepted measures of risk. One measure isbeta, or market risk. Versus the CRSP 10 Index, our Fund has been about 19% less risky. Interestingly, on this measure weare also less risky (about 3%) than the Russell 2000 Index of small companies. If we look at total magnitude of decline indown markets, our Fund has been 20% less risky than the CRSP 10 Index, and about 6% less risky than the Russell 2000Index. We are very pleased with these results.
Detailed Explanation of Quarterly Performance—Some stocks (slightly) cushioned the blow
The Short Version: With a dramatic December quarter downturn, we did have a few stocks that helped cushion the blow. Allof our top ten stocks had significant positive returns.
46 Semi-Annual Report | December 31, 2008 (Unaudited)
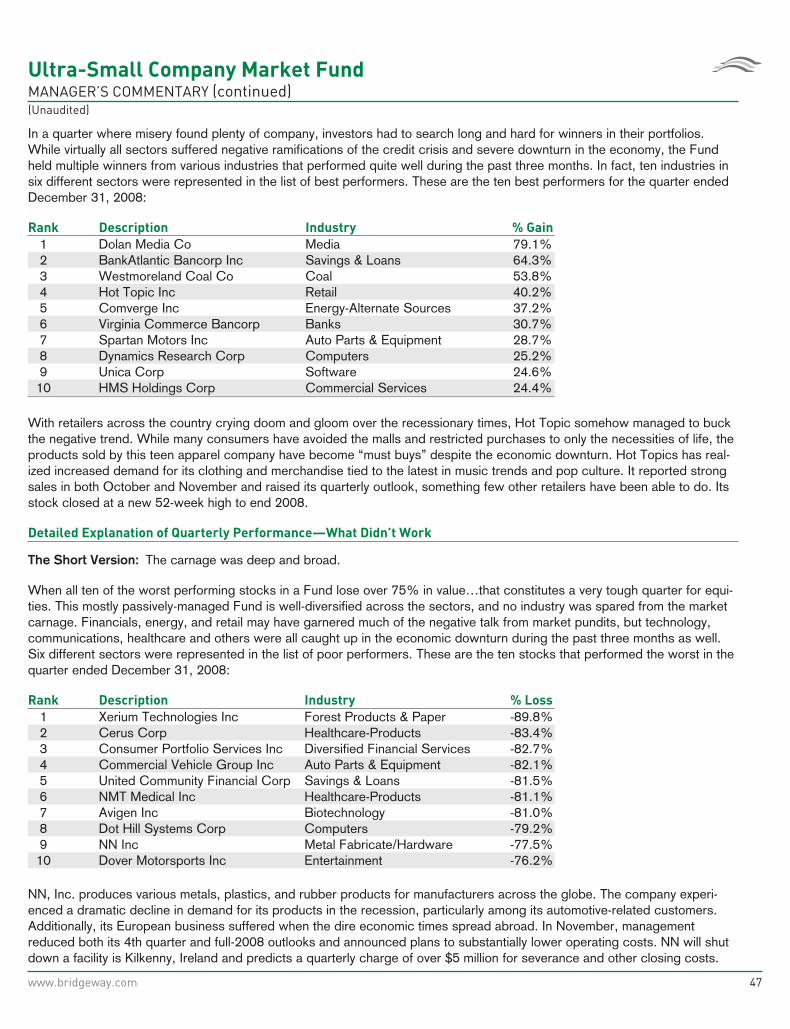
Ultra-Small Company Market FundMANAGER’S COMMENTARY (continued)(Unaudited)
In a quarter where misery found plenty of company, investors had to search long and hard for winners in their portfolios.While virtually all sectors suffered negative ramifications of the credit crisis and severe downturn in the economy, the Fundheld multiple winners from various industries that performed quite well during the past three months. In fact, ten industries insix different sectors were represented in the list of best performers. These are the ten best performers for the quarter endedDecember 31, 2008:
Rank Description Industry % Gain
1 Dolan Media Co Media 79.1%2 BankAtlantic Bancorp Inc Savings & Loans 64.3%3 Westmoreland Coal Co Coal 53.8%4 Hot Topic Inc Retail 40.2%5 Comverge Inc Energy-Alternate Sources 37.2%6 Virginia Commerce Bancorp Banks 30.7%7 Spartan Motors Inc Auto Parts & Equipment 28.7%8 Dynamics Research Corp Computers 25.2%9 Unica Corp Software 24.6%
10 HMS Holdings Corp Commercial Services 24.4%
With retailers across the country crying doom and gloom over the recessionary times, Hot Topic somehow managed to buckthe negative trend. While many consumers have avoided the malls and restricted purchases to only the necessities of life, theproducts sold by this teen apparel company have become “must buys” despite the economic downturn. Hot Topics has real-ized increased demand for its clothing and merchandise tied to the latest in music trends and pop culture. It reported strongsales in both October and November and raised its quarterly outlook, something few other retailers have been able to do. Itsstock closed at a new 52-week high to end 2008.
Detailed Explanation of Quarterly Performance—What Didn’t Work
The Short Version: The carnage was deep and broad.
When all ten of the worst performing stocks in a Fund lose over 75% in value…that constitutes a very tough quarter for equi-ties. This mostly passively-managed Fund is well-diversified across the sectors, and no industry was spared from the marketcarnage. Financials, energy, and retail may have garnered much of the negative talk from market pundits, but technology,communications, healthcare and others were all caught up in the economic downturn during the past three months as well.Six different sectors were represented in the list of poor performers. These are the ten stocks that performed the worst in thequarter ended December 31, 2008:
Rank Description Industry % Loss
1 Xerium Technologies Inc Forest Products & Paper -89.8%2 Cerus Corp Healthcare-Products -83.4%3 Consumer Portfolio Services Inc Diversified Financial Services -82.7%4 Commercial Vehicle Group Inc Auto Parts & Equipment -82.1%5 United Community Financial Corp Savings & Loans -81.5%6 NMT Medical Inc Healthcare-Products -81.1%7 Avigen Inc Biotechnology -81.0%8 Dot Hill Systems Corp Computers -79.2%9 NN Inc Metal Fabricate/Hardware -77.5%
10 Dover Motorsports Inc Entertainment -76.2%
NN, Inc. produces various metals, plastics, and rubber products for manufacturers across the globe. The company experi-enced a dramatic decline in demand for its products in the recession, particularly among its automotive-related customers.Additionally, its European business suffered when the dire economic times spread abroad. In November, managementreduced both its 4th quarter and full-2008 outlooks and announced plans to substantially lower operating costs. NN will shutdown a facility is Kilkenny, Ireland and predicts a quarterly charge of over $5 million for severance and other closing costs.
www.bridgeway.com 47
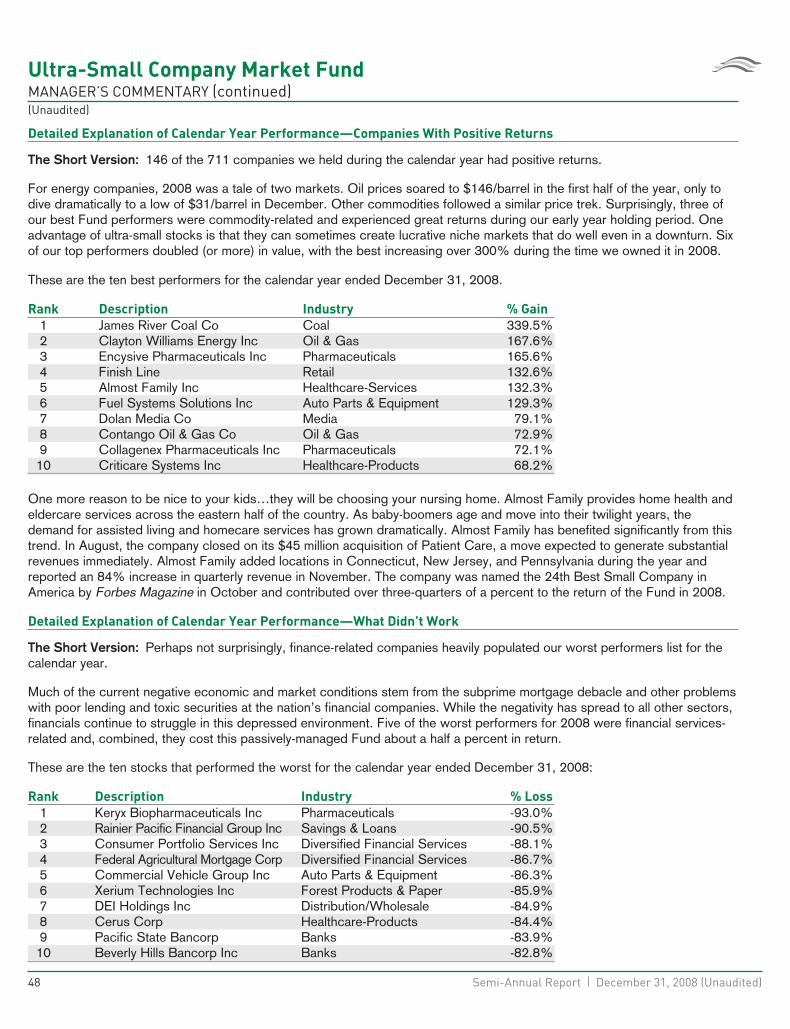
Ultra-Small Company Market FundMANAGER’S COMMENTARY (continued)(Unaudited)
Detailed Explanation of Calendar Year Performance—Companies With Positive Returns
The Short Version: 146 of the 711 companies we held during the calendar year had positive returns.
For energy companies, 2008 was a tale of two markets. Oil prices soared to $146/barrel in the first half of the year, only todive dramatically to a low of $31/barrel in December. Other commodities followed a similar price trek. Surprisingly, three ofour best Fund performers were commodity-related and experienced great returns during our early year holding period. Oneadvantage of ultra-small stocks is that they can sometimes create lucrative niche markets that do well even in a downturn. Sixof our top performers doubled (or more) in value, with the best increasing over 300% during the time we owned it in 2008.
These are the ten best performers for the calendar year ended December 31, 2008.
Rank Description Industry % Gain
1 James River Coal Co Coal 339.5%2 Clayton Williams Energy Inc Oil & Gas 167.6%3 Encysive Pharmaceuticals Inc Pharmaceuticals 165.6%4 Finish Line Retail 132.6%5 Almost Family Inc Healthcare-Services 132.3%6 Fuel Systems Solutions Inc Auto Parts & Equipment 129.3%7 Dolan Media Co Media 79.1%8 Contango Oil & Gas Co Oil & Gas 72.9%9 Collagenex Pharmaceuticals Inc Pharmaceuticals 72.1%
10 Criticare Systems Inc Healthcare-Products 68.2%
One more reason to be nice to your kids…they will be choosing your nursing home. Almost Family provides home health andeldercare services across the eastern half of the country. As baby-boomers age and move into their twilight years, thedemand for assisted living and homecare services has grown dramatically. Almost Family has benefited significantly from thistrend. In August, the company closed on its $45 million acquisition of Patient Care, a move expected to generate substantialrevenues immediately. Almost Family added locations in Connecticut, New Jersey, and Pennsylvania during the year andreported an 84% increase in quarterly revenue in November. The company was named the 24th Best Small Company inAmerica by Forbes Magazine in October and contributed over three-quarters of a percent to the return of the Fund in 2008.
Detailed Explanation of Calendar Year Performance—What Didn’t Work
The Short Version: Perhaps not surprisingly, finance-related companies heavily populated our worst performers list for thecalendar year.
Much of the current negative economic and market conditions stem from the subprime mortgage debacle and other problemswith poor lending and toxic securities at the nation’s financial companies. While the negativity has spread to all other sectors,financials continue to struggle in this depressed environment. Five of the worst performers for 2008 were financial services-related and, combined, they cost this passively-managed Fund about a half a percent in return.
These are the ten stocks that performed the worst for the calendar year ended December 31, 2008:
Rank Description Industry % Loss
1 Keryx Biopharmaceuticals Inc Pharmaceuticals -93.0%2 Rainier Pacific Financial Group Inc Savings & Loans -90.5%3 Consumer Portfolio Services Inc Diversified Financial Services -88.1%4 Federal Agricultural Mortgage Corp Diversified Financial Services -86.7%5 Commercial Vehicle Group Inc Auto Parts & Equipment -86.3%6 Xerium Technologies Inc Forest Products & Paper -85.9%7 DEI Holdings Inc Distribution/Wholesale -84.9%8 Cerus Corp Healthcare-Products -84.4%9 Pacific State Bancorp Banks -83.9%
10 Beverly Hills Bancorp Inc Banks -82.8%
48 Semi-Annual Report | December 31, 2008 (Unaudited)
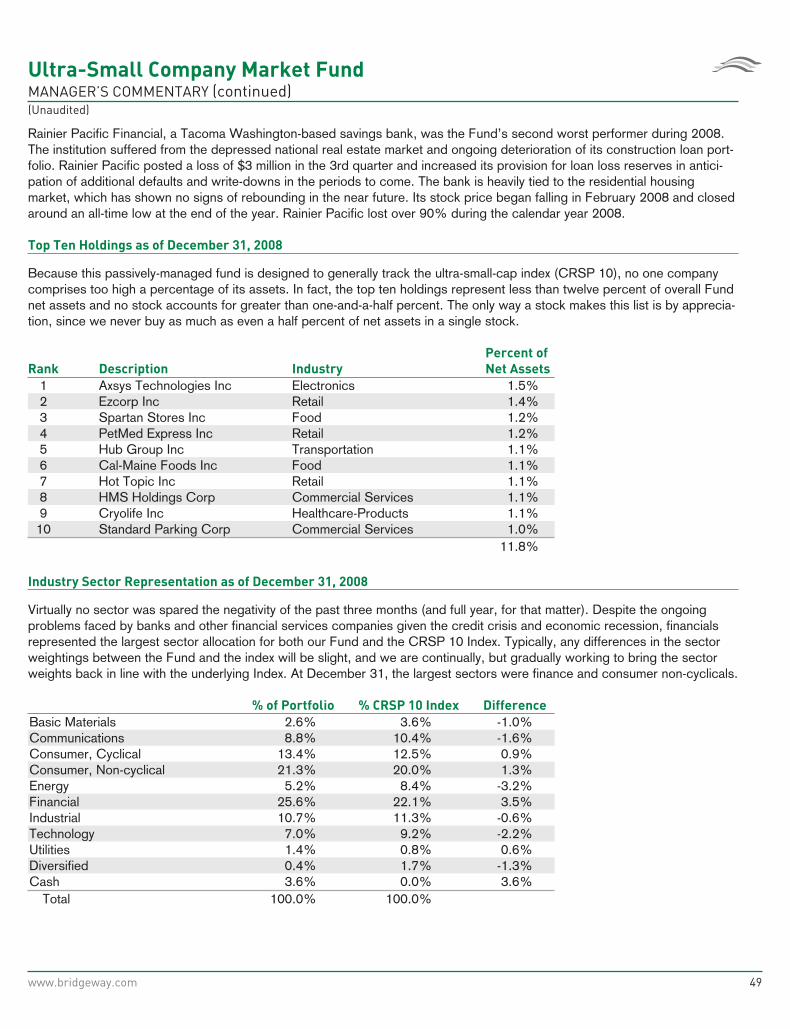
Ultra-Small Company Market FundMANAGER’S COMMENTARY (continued)(Unaudited)
Rainier Pacific Financial, a Tacoma Washington-based savings bank, was the Fund’s second worst performer during 2008.The institution suffered from the depressed national real estate market and ongoing deterioration of its construction loan port-folio. Rainier Pacific posted a loss of $3 million in the 3rd quarter and increased its provision for loan loss reserves in antici-pation of additional defaults and write-downs in the periods to come. The bank is heavily tied to the residential housingmarket, which has shown no signs of rebounding in the near future. Its stock price began falling in February 2008 and closedaround an all-time low at the end of the year. Rainier Pacific lost over 90% during the calendar year 2008.
Top Ten Holdings as of December 31, 2008
Because this passively-managed fund is designed to generally track the ultra-small-cap index (CRSP 10), no one companycomprises too high a percentage of its assets. In fact, the top ten holdings represent less than twelve percent of overall Fundnet assets and no stock accounts for greater than one-and-a-half percent. The only way a stock makes this list is by apprecia-tion, since we never buy as much as even a half percent of net assets in a single stock.
Rank Description Industry
Percent of
Net Assets
1 Axsys Technologies Inc Electronics 1.5%2 Ezcorp Inc Retail 1.4%3 Spartan Stores Inc Food 1.2%4 PetMed Express Inc Retail 1.2%5 Hub Group Inc Transportation 1.1%6 Cal-Maine Foods Inc Food 1.1%7 Hot Topic Inc Retail 1.1%8 HMS Holdings Corp Commercial Services 1.1%9 Cryolife Inc Healthcare-Products 1.1%
10 Standard Parking Corp Commercial Services 1.0%11.8%
Industry Sector Representation as of December 31, 2008
Virtually no sector was spared the negativity of the past three months (and full year, for that matter). Despite the ongoingproblems faced by banks and other financial services companies given the credit crisis and economic recession, financialsrepresented the largest sector allocation for both our Fund and the CRSP 10 Index. Typically, any differences in the sectorweightings between the Fund and the index will be slight, and we are continually, but gradually working to bring the sectorweights back in line with the underlying Index. At December 31, the largest sectors were finance and consumer non-cyclicals.
% of Portfolio % CRSP 10 Index Difference
Basic Materials 2.6% 3.6% -1.0%Communications 8.8% 10.4% -1.6%Consumer, Cyclical 13.4% 12.5% 0.9%Consumer, Non-cyclical 21.3% 20.0% 1.3%Energy 5.2% 8.4% -3.2%Financial 25.6% 22.1% 3.5%Industrial 10.7% 11.3% -0.6%Technology 7.0% 9.2% -2.2%Utilities 1.4% 0.8% 0.6%Diversified 0.4% 1.7% -1.3%Cash 3.6% 0.0% 3.6%
Total 100.0% 100.0%
www.bridgeway.com 49
Ultra-Small Company Market FundMANAGER’S COMMENTARY (continued)(Unaudited)
Disclaimer
The views expressed here are exclusively those of Fund management. These views are not meant as investment advice andshould not be considered predictive in nature. Any favorable (or unfavorable) description of a holding applies only as ofDecember 31, 2008, unless otherwise stated. Security positions can and do change thereafter. Discussions of historicalperformance do not guarantee and are not indicative of future performance.
The Fund is subject to very high, above market risk (volatility) and is not an appropriate investment for short-term investors.Investments in ultra-small companies generally carry greater risk than is customarily associated with larger companies andeven “small companies” for various reasons such as narrower markets (fewer investors), limited financial resources andgreater trading difficulty.
Conclusion
Thank you for your continued investment in Ultra-Small Company Market Fund. We encourage your feedback; your reactionsand concerns are important to us.
Sincerely,
Your Investment Management Team
50 Semi-Annual Report | December 31, 2008 (Unaudited)

THIS PAGE INTENTIONALLY LEFT BLANK
www.bridgeway.com 51
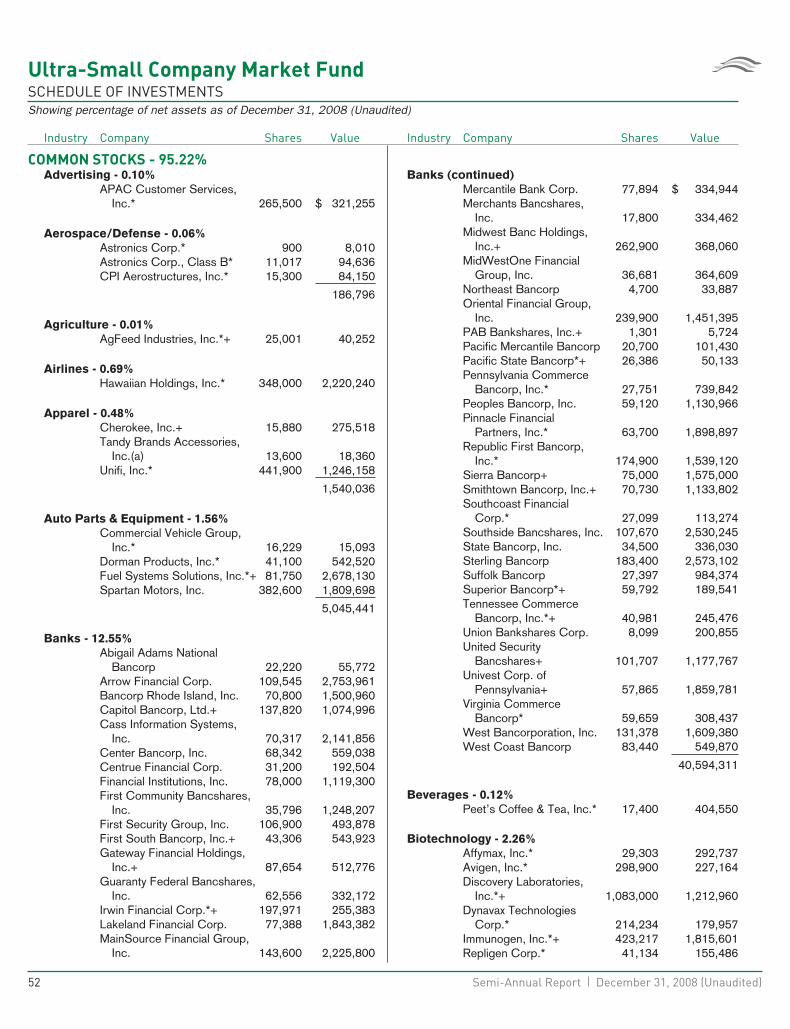
Ultra-Small Company Market FundSCHEDULE OF INVESTMENTSShowing percentage of net assets as of December 31, 2008 (Unaudited)
Industry Company Shares Value
COMMON STOCKS - 95.22%Advertising - 0.10%
APAC Customer Services,Inc.* 265,500 $ 321,255
Aerospace/Defense - 0.06%Astronics Corp.* 900 8,010Astronics Corp., Class B* 11,017 94,636CPI Aerostructures, Inc.* 15,300 84,150
186,796
Agriculture - 0.01%AgFeed Industries, Inc.*+ 25,001 40,252
Airlines - 0.69%Hawaiian Holdings, Inc.* 348,000 2,220,240
Apparel - 0.48%Cherokee, Inc.+ 15,880 275,518Tandy Brands Accessories,
Inc.(a) 13,600 18,360Unifi, Inc.* 441,900 1,246,158
1,540,036
Auto Parts & Equipment - 1.56%Commercial Vehicle Group,
Inc.* 16,229 15,093Dorman Products, Inc.* 41,100 542,520Fuel Systems Solutions, Inc.*+ 81,750 2,678,130Spartan Motors, Inc. 382,600 1,809,698
5,045,441
Banks - 12.55%Abigail Adams National
Bancorp 22,220 55,772Arrow Financial Corp. 109,545 2,753,961Bancorp Rhode Island, Inc. 70,800 1,500,960Capitol Bancorp, Ltd.+ 137,820 1,074,996Cass Information Systems,
Inc. 70,317 2,141,856Center Bancorp, Inc. 68,342 559,038Centrue Financial Corp. 31,200 192,504Financial Institutions, Inc. 78,000 1,119,300First Community Bancshares,
Inc. 35,796 1,248,207First Security Group, Inc. 106,900 493,878First South Bancorp, Inc.+ 43,306 543,923Gateway Financial Holdings,
Inc.+ 87,654 512,776Guaranty Federal Bancshares,
Inc. 62,556 332,172Irwin Financial Corp.*+ 197,971 255,383Lakeland Financial Corp. 77,388 1,843,382MainSource Financial Group,
Inc. 143,600 2,225,800
Industry Company Shares Value
Banks (continued)Mercantile Bank Corp. 77,894 $ 334,944Merchants Bancshares,
Inc. 17,800 334,462Midwest Banc Holdings,
Inc.+ 262,900 368,060MidWestOne Financial
Group, Inc. 36,681 364,609Northeast Bancorp 4,700 33,887Oriental Financial Group,
Inc. 239,900 1,451,395PAB Bankshares, Inc.+ 1,301 5,724Pacific Mercantile Bancorp 20,700 101,430Pacific State Bancorp*+ 26,386 50,133Pennsylvania Commerce
Bancorp, Inc.* 27,751 739,842Peoples Bancorp, Inc. 59,120 1,130,966Pinnacle Financial
Partners, Inc.* 63,700 1,898,897Republic First Bancorp,
Inc.* 174,900 1,539,120Sierra Bancorp+ 75,000 1,575,000Smithtown Bancorp, Inc.+ 70,730 1,133,802Southcoast Financial
Corp.* 27,099 113,274Southside Bancshares, Inc. 107,670 2,530,245State Bancorp, Inc. 34,500 336,030Sterling Bancorp 183,400 2,573,102Suffolk Bancorp 27,397 984,374Superior Bancorp*+ 59,792 189,541Tennessee Commerce
Bancorp, Inc.*+ 40,981 245,476Union Bankshares Corp. 8,099 200,855United Security
Bancshares+ 101,707 1,177,767Univest Corp. of
Pennsylvania+ 57,865 1,859,781Virginia Commerce
Bancorp* 59,659 308,437West Bancorporation, Inc. 131,378 1,609,380West Coast Bancorp 83,440 549,870
40,594,311
Beverages - 0.12%Peet’s Coffee & Tea, Inc.* 17,400 404,550
Biotechnology - 2.26%Affymax, Inc.* 29,303 292,737Avigen, Inc.* 298,900 227,164Discovery Laboratories,
Inc.*+ 1,083,000 1,212,960Dynavax Technologies
Corp.* 214,234 179,957Immunogen, Inc.*+ 423,217 1,815,601Repligen Corp.* 41,134 155,486
52 Semi-Annual Report | December 31, 2008 (Unaudited)
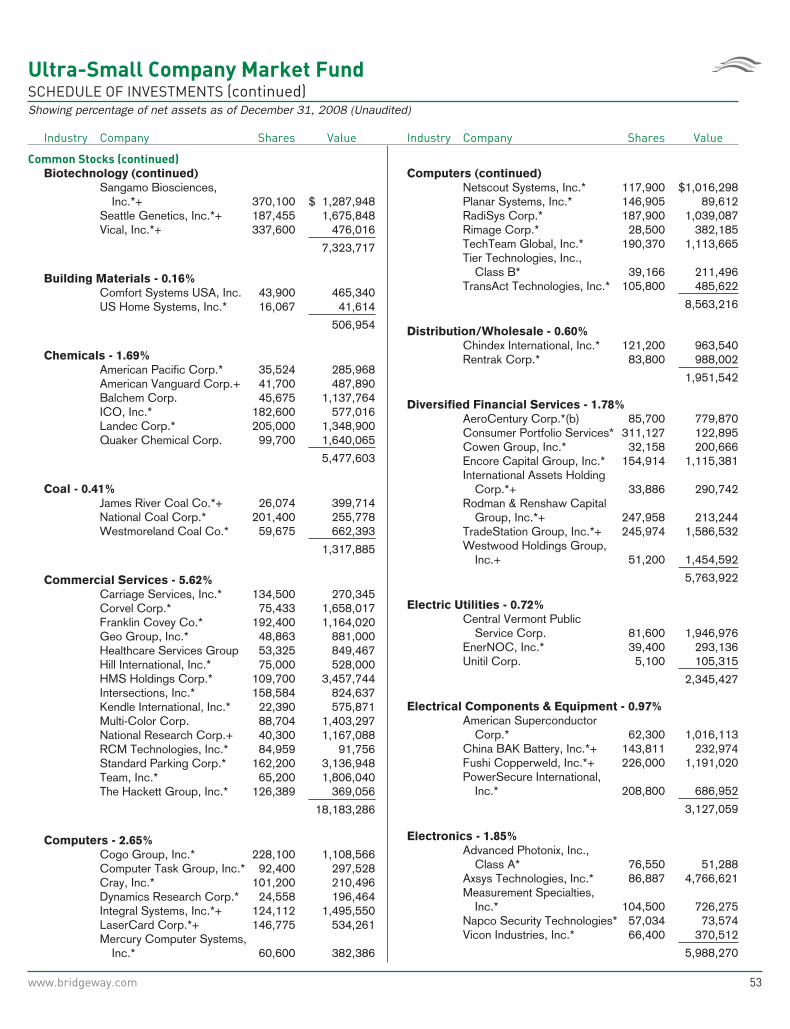
Ultra-Small Company Market FundSCHEDULE OF INVESTMENTS (continued)Showing percentage of net assets as of December 31, 2008 (Unaudited)
Industry Company Shares Value
Common Stocks (continued)
Biotechnology (continued)Sangamo Biosciences,
Inc.*+ 370,100 $ 1,287,948Seattle Genetics, Inc.*+ 187,455 1,675,848Vical, Inc.*+ 337,600 476,016
7,323,717
Building Materials - 0.16%Comfort Systems USA, Inc. 43,900 465,340US Home Systems, Inc.* 16,067 41,614
506,954
Chemicals - 1.69%American Pacific Corp.* 35,524 285,968American Vanguard Corp.+ 41,700 487,890Balchem Corp. 45,675 1,137,764ICO, Inc.* 182,600 577,016Landec Corp.* 205,000 1,348,900Quaker Chemical Corp. 99,700 1,640,065
5,477,603
Coal - 0.41%James River Coal Co.*+ 26,074 399,714National Coal Corp.* 201,400 255,778Westmoreland Coal Co.* 59,675 662,393
1,317,885
Commercial Services - 5.62%Carriage Services, Inc.* 134,500 270,345Corvel Corp.* 75,433 1,658,017Franklin Covey Co.* 192,400 1,164,020Geo Group, Inc.* 48,863 881,000Healthcare Services Group 53,325 849,467Hill International, Inc.* 75,000 528,000HMS Holdings Corp.* 109,700 3,457,744Intersections, Inc.* 158,584 824,637Kendle International, Inc.* 22,390 575,871Multi-Color Corp. 88,704 1,403,297National Research Corp.+ 40,300 1,167,088RCM Technologies, Inc.* 84,959 91,756Standard Parking Corp.* 162,200 3,136,948Team, Inc.* 65,200 1,806,040The Hackett Group, Inc.* 126,389 369,056
18,183,286
Computers - 2.65%Cogo Group, Inc.* 228,100 1,108,566Computer Task Group, Inc.* 92,400 297,528Cray, Inc.* 101,200 210,496Dynamics Research Corp.* 24,558 196,464Integral Systems, Inc.*+ 124,112 1,495,550LaserCard Corp.*+ 146,775 534,261Mercury Computer Systems,
Inc.* 60,600 382,386
Industry Company Shares Value
Computers (continued)Netscout Systems, Inc.* 117,900 $1,016,298Planar Systems, Inc.* 146,905 89,612RadiSys Corp.* 187,900 1,039,087Rimage Corp.* 28,500 382,185TechTeam Global, Inc.* 190,370 1,113,665Tier Technologies, Inc.,
Class B* 39,166 211,496TransAct Technologies, Inc.* 105,800 485,622
8,563,216
Distribution/Wholesale - 0.60%Chindex International, Inc.* 121,200 963,540Rentrak Corp.* 83,800 988,002
1,951,542
Diversified Financial Services - 1.78%AeroCentury Corp.*(b) 85,700 779,870Consumer Portfolio Services* 311,127 122,895Cowen Group, Inc.* 32,158 200,666Encore Capital Group, Inc.* 154,914 1,115,381International Assets Holding
Corp.*+ 33,886 290,742Rodman & Renshaw Capital
Group, Inc.*+ 247,958 213,244TradeStation Group, Inc.*+ 245,974 1,586,532Westwood Holdings Group,
Inc.+ 51,200 1,454,592
5,763,922
Electric Utilities - 0.72%Central Vermont Public
Service Corp. 81,600 1,946,976EnerNOC, Inc.* 39,400 293,136Unitil Corp. 5,100 105,315
2,345,427
Electrical Components & Equipment - 0.97%American Superconductor
Corp.* 62,300 1,016,113China BAK Battery, Inc.*+ 143,811 232,974Fushi Copperweld, Inc.*+ 226,000 1,191,020PowerSecure International,
Inc.* 208,800 686,952
3,127,059
Electronics - 1.85%Advanced Photonix, Inc.,
Class A* 76,550 51,288Axsys Technologies, Inc.* 86,887 4,766,621Measurement Specialties,
Inc.* 104,500 726,275Napco Security Technologies* 57,034 73,574Vicon Industries, Inc.* 66,400 370,512
5,988,270
www.bridgeway.com 53
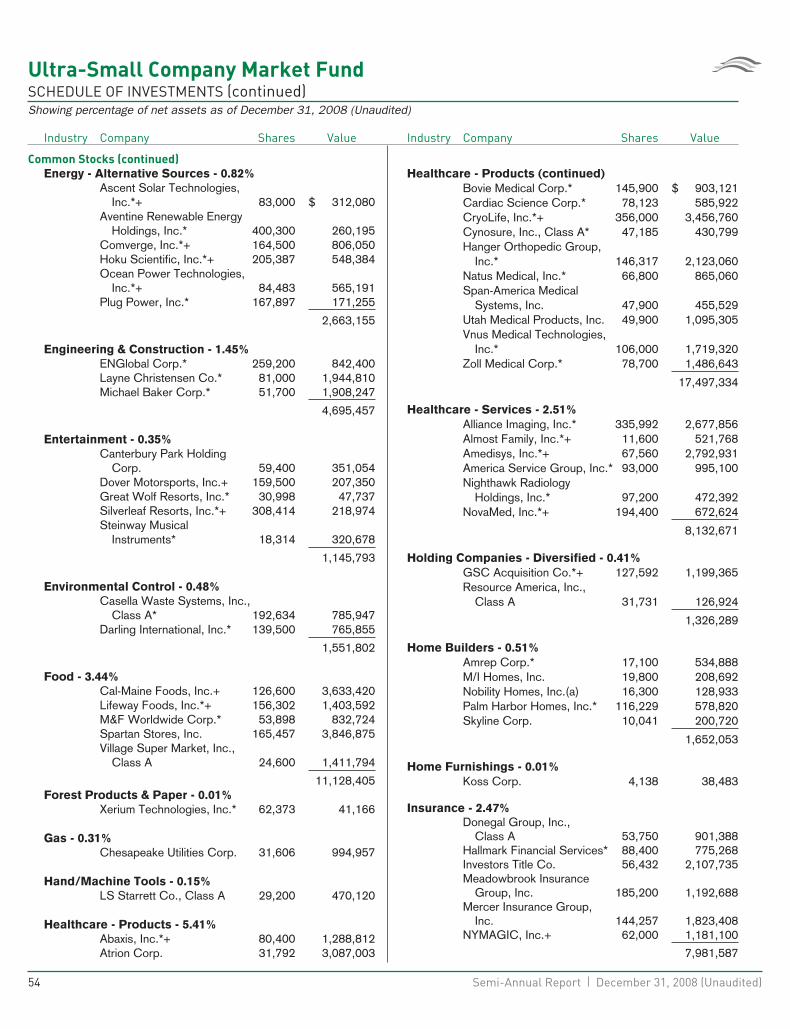
Ultra-Small Company Market FundSCHEDULE OF INVESTMENTS (continued)Showing percentage of net assets as of December 31, 2008 (Unaudited)
Industry Company Shares Value
Common Stocks (continued)
Energy - Alternative Sources - 0.82%Ascent Solar Technologies,
Inc.*+ 83,000 $ 312,080Aventine Renewable Energy
Holdings, Inc.* 400,300 260,195Comverge, Inc.*+ 164,500 806,050Hoku Scientific, Inc.*+ 205,387 548,384Ocean Power Technologies,
Inc.*+ 84,483 565,191Plug Power, Inc.* 167,897 171,255
2,663,155
Engineering & Construction - 1.45%ENGlobal Corp.* 259,200 842,400Layne Christensen Co.* 81,000 1,944,810Michael Baker Corp.* 51,700 1,908,247
4,695,457
Entertainment - 0.35%Canterbury Park Holding
Corp. 59,400 351,054Dover Motorsports, Inc.+ 159,500 207,350Great Wolf Resorts, Inc.* 30,998 47,737Silverleaf Resorts, Inc.*+ 308,414 218,974Steinway Musical
Instruments* 18,314 320,678
1,145,793
Environmental Control - 0.48%Casella Waste Systems, Inc.,
Class A* 192,634 785,947Darling International, Inc.* 139,500 765,855
1,551,802
Food - 3.44%Cal-Maine Foods, Inc.+ 126,600 3,633,420Lifeway Foods, Inc.*+ 156,302 1,403,592M&F Worldwide Corp.* 53,898 832,724Spartan Stores, Inc. 165,457 3,846,875Village Super Market, Inc.,
Class A 24,600 1,411,794
11,128,405Forest Products & Paper - 0.01%
Xerium Technologies, Inc.* 62,373 41,166
Gas - 0.31%Chesapeake Utilities Corp. 31,606 994,957
Hand/Machine Tools - 0.15%LS Starrett Co., Class A 29,200 470,120
Healthcare - Products - 5.41%Abaxis, Inc.*+ 80,400 1,288,812Atrion Corp. 31,792 3,087,003
Industry Company Shares Value
Healthcare - Products (continued)Bovie Medical Corp.* 145,900 $ 903,121Cardiac Science Corp.* 78,123 585,922CryoLife, Inc.*+ 356,000 3,456,760Cynosure, Inc., Class A* 47,185 430,799Hanger Orthopedic Group,
Inc.* 146,317 2,123,060Natus Medical, Inc.* 66,800 865,060Span-America Medical
Systems, Inc. 47,900 455,529Utah Medical Products, Inc. 49,900 1,095,305Vnus Medical Technologies,
Inc.* 106,000 1,719,320Zoll Medical Corp.* 78,700 1,486,643
17,497,334
Healthcare - Services - 2.51%Alliance Imaging, Inc.* 335,992 2,677,856Almost Family, Inc.*+ 11,600 521,768Amedisys, Inc.*+ 67,560 2,792,931America Service Group, Inc.* 93,000 995,100Nighthawk Radiology
Holdings, Inc.* 97,200 472,392NovaMed, Inc.*+ 194,400 672,624
8,132,671
Holding Companies - Diversified - 0.41%GSC Acquisition Co.*+ 127,592 1,199,365Resource America, Inc.,
Class A 31,731 126,924
1,326,289
Home Builders - 0.51%Amrep Corp.* 17,100 534,888M/I Homes, Inc. 19,800 208,692Nobility Homes, Inc.(a) 16,300 128,933Palm Harbor Homes, Inc.* 116,229 578,820Skyline Corp. 10,041 200,720
1,652,053
Home Furnishings - 0.01%Koss Corp. 4,138 38,483
Insurance - 2.47%Donegal Group, Inc.,
Class A 53,750 901,388Hallmark Financial Services* 88,400 775,268Investors Title Co. 56,432 2,107,735Meadowbrook Insurance
Group, Inc. 185,200 1,192,688Mercer Insurance Group,
Inc. 144,257 1,823,408NYMAGIC, Inc.+ 62,000 1,181,100
7,981,587
54 Semi-Annual Report | December 31, 2008 (Unaudited)
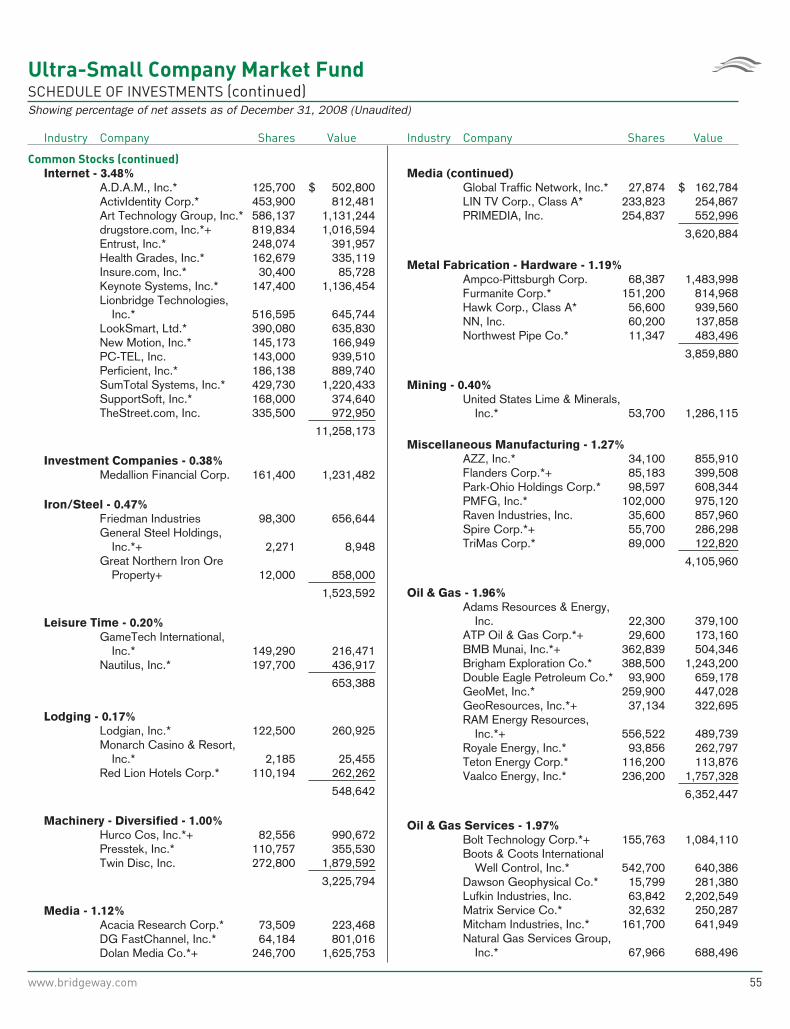
Ultra-Small Company Market FundSCHEDULE OF INVESTMENTS (continued)Showing percentage of net assets as of December 31, 2008 (Unaudited)
Industry Company Shares Value
Common Stocks (continued)
Internet - 3.48%A.D.A.M., Inc.* 125,700 $ 502,800ActivIdentity Corp.* 453,900 812,481Art Technology Group, Inc.* 586,137 1,131,244drugstore.com, Inc.*+ 819,834 1,016,594Entrust, Inc.* 248,074 391,957Health Grades, Inc.* 162,679 335,119Insure.com, Inc.* 30,400 85,728Keynote Systems, Inc.* 147,400 1,136,454Lionbridge Technologies,
Inc.* 516,595 645,744LookSmart, Ltd.* 390,080 635,830New Motion, Inc.* 145,173 166,949PC-TEL, Inc. 143,000 939,510Perficient, Inc.* 186,138 889,740SumTotal Systems, Inc.* 429,730 1,220,433SupportSoft, Inc.* 168,000 374,640TheStreet.com, Inc. 335,500 972,950
11,258,173
Investment Companies - 0.38%Medallion Financial Corp. 161,400 1,231,482
Iron/Steel - 0.47%Friedman Industries 98,300 656,644General Steel Holdings,
Inc.*+ 2,271 8,948Great Northern Iron Ore
Property+ 12,000 858,000
1,523,592
Leisure Time - 0.20%GameTech International,
Inc.* 149,290 216,471Nautilus, Inc.* 197,700 436,917
653,388
Lodging - 0.17%Lodgian, Inc.* 122,500 260,925Monarch Casino & Resort,
Inc.* 2,185 25,455Red Lion Hotels Corp.* 110,194 262,262
548,642
Machinery - Diversified - 1.00%Hurco Cos, Inc.*+ 82,556 990,672Presstek, Inc.* 110,757 355,530Twin Disc, Inc. 272,800 1,879,592
3,225,794
Media - 1.12%Acacia Research Corp.* 73,509 223,468DG FastChannel, Inc.* 64,184 801,016Dolan Media Co.*+ 246,700 1,625,753
Industry Company Shares Value
Media (continued)Global Traffic Network, Inc.* 27,874 $ 162,784LIN TV Corp., Class A* 233,823 254,867PRIMEDIA, Inc. 254,837 552,996
3,620,884
Metal Fabrication - Hardware - 1.19%Ampco-Pittsburgh Corp. 68,387 1,483,998Furmanite Corp.* 151,200 814,968Hawk Corp., Class A* 56,600 939,560NN, Inc. 60,200 137,858Northwest Pipe Co.* 11,347 483,496
3,859,880
Mining - 0.40%United States Lime & Minerals,
Inc.* 53,700 1,286,115
Miscellaneous Manufacturing - 1.27%AZZ, Inc.* 34,100 855,910Flanders Corp.*+ 85,183 399,508Park-Ohio Holdings Corp.* 98,597 608,344PMFG, Inc.* 102,000 975,120Raven Industries, Inc. 35,600 857,960Spire Corp.*+ 55,700 286,298TriMas Corp.* 89,000 122,820
4,105,960
Oil & Gas - 1.96%Adams Resources & Energy,
Inc. 22,300 379,100ATP Oil & Gas Corp.*+ 29,600 173,160BMB Munai, Inc.*+ 362,839 504,346Brigham Exploration Co.* 388,500 1,243,200Double Eagle Petroleum Co.* 93,900 659,178GeoMet, Inc.* 259,900 447,028GeoResources, Inc.*+ 37,134 322,695RAM Energy Resources,
Inc.*+ 556,522 489,739Royale Energy, Inc.* 93,856 262,797Teton Energy Corp.* 116,200 113,876Vaalco Energy, Inc.* 236,200 1,757,328
6,352,447
Oil & Gas Services - 1.97%Bolt Technology Corp.*+ 155,763 1,084,110Boots & Coots International
Well Control, Inc.* 542,700 640,386Dawson Geophysical Co.* 15,799 281,380Lufkin Industries, Inc. 63,842 2,202,549Matrix Service Co.* 32,632 250,287Mitcham Industries, Inc.* 161,700 641,949Natural Gas Services Group,
Inc.* 67,966 688,496
www.bridgeway.com 55
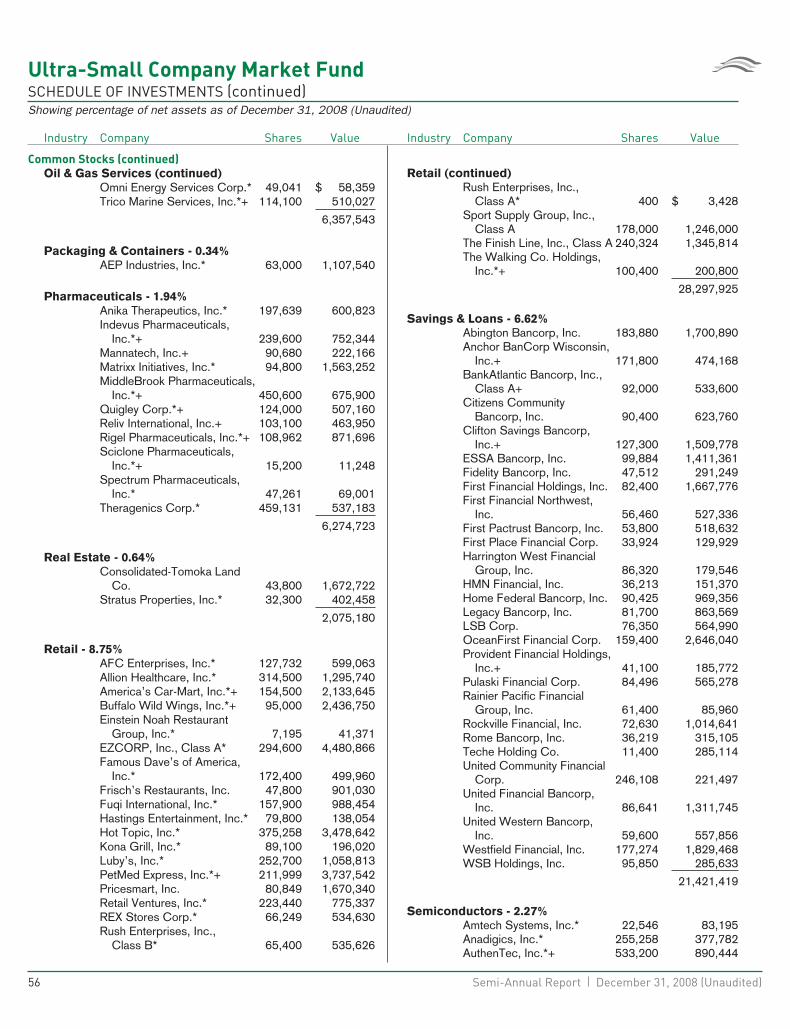
Ultra-Small Company Market FundSCHEDULE OF INVESTMENTS (continued)Showing percentage of net assets as of December 31, 2008 (Unaudited)
Industry Company Shares Value
Common Stocks (continued)
Oil & Gas Services (continued)Omni Energy Services Corp.* 49,041 $ 58,359Trico Marine Services, Inc.*+ 114,100 510,027
6,357,543
Packaging & Containers - 0.34%AEP Industries, Inc.* 63,000 1,107,540
Pharmaceuticals - 1.94%Anika Therapeutics, Inc.* 197,639 600,823Indevus Pharmaceuticals,
Inc.*+ 239,600 752,344Mannatech, Inc.+ 90,680 222,166Matrixx Initiatives, Inc.* 94,800 1,563,252MiddleBrook Pharmaceuticals,
Inc.*+ 450,600 675,900Quigley Corp.*+ 124,000 507,160Reliv International, Inc.+ 103,100 463,950Rigel Pharmaceuticals, Inc.*+ 108,962 871,696Sciclone Pharmaceuticals,
Inc.*+ 15,200 11,248Spectrum Pharmaceuticals,
Inc.* 47,261 69,001Theragenics Corp.* 459,131 537,183
6,274,723
Real Estate - 0.64%Consolidated-Tomoka Land
Co. 43,800 1,672,722Stratus Properties, Inc.* 32,300 402,458
2,075,180
Retail - 8.75%AFC Enterprises, Inc.* 127,732 599,063Allion Healthcare, Inc.* 314,500 1,295,740America’s Car-Mart, Inc.*+ 154,500 2,133,645Buffalo Wild Wings, Inc.*+ 95,000 2,436,750Einstein Noah Restaurant
Group, Inc.* 7,195 41,371EZCORP, Inc., Class A* 294,600 4,480,866Famous Dave’s of America,
Inc.* 172,400 499,960Frisch’s Restaurants, Inc. 47,800 901,030Fuqi International, Inc.* 157,900 988,454Hastings Entertainment, Inc.* 79,800 138,054Hot Topic, Inc.* 375,258 3,478,642Kona Grill, Inc.* 89,100 196,020Luby’s, Inc.* 252,700 1,058,813PetMed Express, Inc.*+ 211,999 3,737,542Pricesmart, Inc. 80,849 1,670,340Retail Ventures, Inc.* 223,440 775,337REX Stores Corp.* 66,249 534,630Rush Enterprises, Inc.,
Class B* 65,400 535,626
Industry Company Shares Value
Retail (continued)Rush Enterprises, Inc.,
Class A* 400 $ 3,428Sport Supply Group, Inc.,
Class A 178,000 1,246,000The Finish Line, Inc., Class A 240,324 1,345,814The Walking Co. Holdings,
Inc.*+ 100,400 200,800
28,297,925
Savings & Loans - 6.62%Abington Bancorp, Inc. 183,880 1,700,890Anchor BanCorp Wisconsin,
Inc.+ 171,800 474,168BankAtlantic Bancorp, Inc.,
Class A+ 92,000 533,600Citizens Community
Bancorp, Inc. 90,400 623,760Clifton Savings Bancorp,
Inc.+ 127,300 1,509,778ESSA Bancorp, Inc. 99,884 1,411,361Fidelity Bancorp, Inc. 47,512 291,249First Financial Holdings, Inc. 82,400 1,667,776First Financial Northwest,
Inc. 56,460 527,336First Pactrust Bancorp, Inc. 53,800 518,632First Place Financial Corp. 33,924 129,929Harrington West Financial
Group, Inc. 86,320 179,546HMN Financial, Inc. 36,213 151,370Home Federal Bancorp, Inc. 90,425 969,356Legacy Bancorp, Inc. 81,700 863,569LSB Corp. 76,350 564,990OceanFirst Financial Corp. 159,400 2,646,040Provident Financial Holdings,
Inc.+ 41,100 185,772Pulaski Financial Corp. 84,496 565,278Rainier Pacific Financial
Group, Inc. 61,400 85,960Rockville Financial, Inc. 72,630 1,014,641Rome Bancorp, Inc. 36,219 315,105Teche Holding Co. 11,400 285,114United Community Financial
Corp. 246,108 221,497United Financial Bancorp,
Inc. 86,641 1,311,745United Western Bancorp,
Inc. 59,600 557,856Westfield Financial, Inc. 177,274 1,829,468WSB Holdings, Inc. 95,850 285,633
21,421,419
Semiconductors - 2.27%Amtech Systems, Inc.* 22,546 83,195Anadigics, Inc.* 255,258 377,782AuthenTec, Inc.*+ 533,200 890,444
56 Semi-Annual Report | December 31, 2008 (Unaudited)
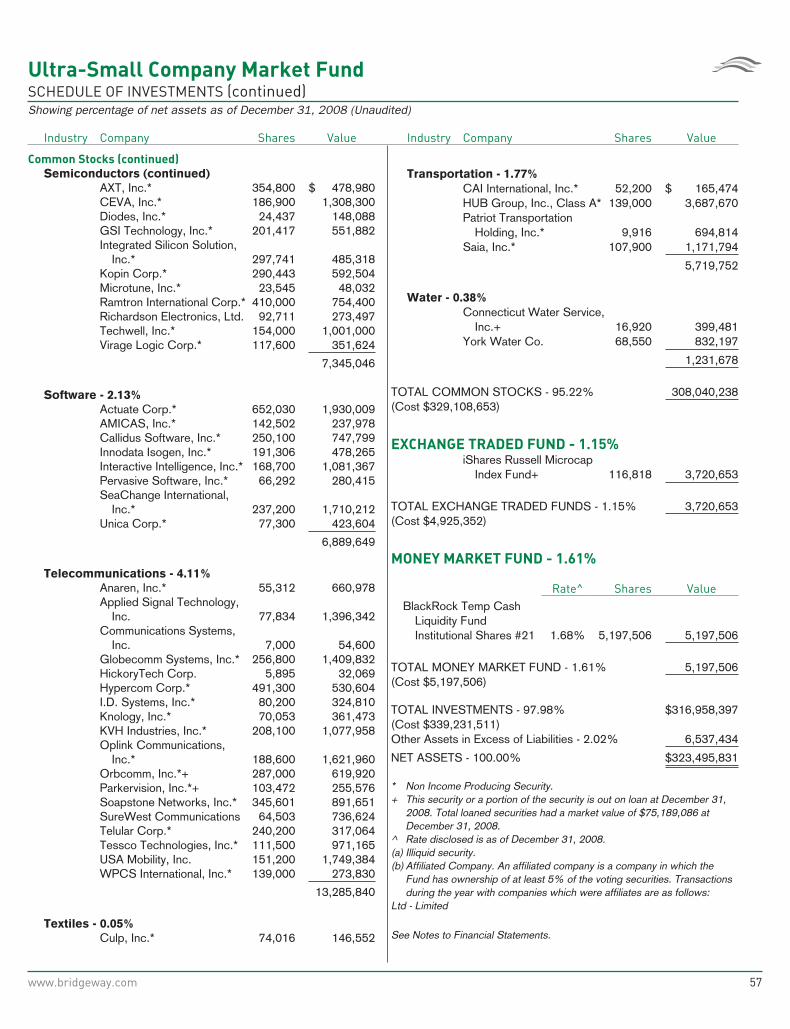
Ultra-Small Company Market FundSCHEDULE OF INVESTMENTS (continued)Showing percentage of net assets as of December 31, 2008 (Unaudited)
Industry Company Shares Value
Common Stocks (continued)
Semiconductors (continued)AXT, Inc.* 354,800 $ 478,980CEVA, Inc.* 186,900 1,308,300Diodes, Inc.* 24,437 148,088GSI Technology, Inc.* 201,417 551,882Integrated Silicon Solution,
Inc.* 297,741 485,318Kopin Corp.* 290,443 592,504Microtune, Inc.* 23,545 48,032Ramtron International Corp.* 410,000 754,400Richardson Electronics, Ltd. 92,711 273,497Techwell, Inc.* 154,000 1,001,000Virage Logic Corp.* 117,600 351,624
7,345,046
Software - 2.13%Actuate Corp.* 652,030 1,930,009AMICAS, Inc.* 142,502 237,978Callidus Software, Inc.* 250,100 747,799Innodata Isogen, Inc.* 191,306 478,265Interactive Intelligence, Inc.* 168,700 1,081,367Pervasive Software, Inc.* 66,292 280,415SeaChange International,
Inc.* 237,200 1,710,212Unica Corp.* 77,300 423,604
6,889,649
Telecommunications - 4.11%Anaren, Inc.* 55,312 660,978Applied Signal Technology,
Inc. 77,834 1,396,342Communications Systems,
Inc. 7,000 54,600Globecomm Systems, Inc.* 256,800 1,409,832HickoryTech Corp. 5,895 32,069Hypercom Corp.* 491,300 530,604I.D. Systems, Inc.* 80,200 324,810Knology, Inc.* 70,053 361,473KVH Industries, Inc.* 208,100 1,077,958Oplink Communications,
Inc.* 188,600 1,621,960Orbcomm, Inc.*+ 287,000 619,920Parkervision, Inc.*+ 103,472 255,576Soapstone Networks, Inc.* 345,601 891,651SureWest Communications 64,503 736,624Telular Corp.* 240,200 317,064Tessco Technologies, Inc.* 111,500 971,165USA Mobility, Inc. 151,200 1,749,384WPCS International, Inc.* 139,000 273,830
13,285,840
Textiles - 0.05%Culp, Inc.* 74,016 146,552
Industry Company Shares Value
Transportation - 1.77%CAI International, Inc.* 52,200 $ 165,474HUB Group, Inc., Class A* 139,000 3,687,670Patriot Transportation
Holding, Inc.* 9,916 694,814Saia, Inc.* 107,900 1,171,794
5,719,752
Water - 0.38%Connecticut Water Service,
Inc.+ 16,920 399,481York Water Co. 68,550 832,197
1,231,678
TOTAL COMMON STOCKS - 95.22% 308,040,238(Cost $329,108,653)
EXCHANGE TRADED FUND - 1.15%iShares Russell Microcap
Index Fund+ 116,818 3,720,653
TOTAL EXCHANGE TRADED FUNDS - 1.15% 3,720,653(Cost $4,925,352)
MONEY MARKET FUND - 1.61%
Rate^ Shares ValueBlackRock Temp Cash
Liquidity FundInstitutional Shares #21 1.68% 5,197,506 5,197,506
TOTAL MONEY MARKET FUND - 1.61% 5,197,506(Cost $5,197,506)
TOTAL INVESTMENTS - 97.98% $316,958,397(Cost $339,231,511)Other Assets in Excess of Liabilities - 2.02% 6,537,434
NET ASSETS - 100.00% $323,495,831
* Non Income Producing Security.+ This security or a portion of the security is out on loan at December 31,
2008. Total loaned securities had a market value of $75,189,086 atDecember 31, 2008.
^ Rate disclosed is as of December 31, 2008.(a) Illiquid security.(b) Affiliated Company. An affiliated company is a company in which the
Fund has ownership of at least 5% of the voting securities. Transactionsduring the year with companies which were affiliates are as follows:
Ltd - Limited
See Notes to Financial Statements.
www.bridgeway.com 57
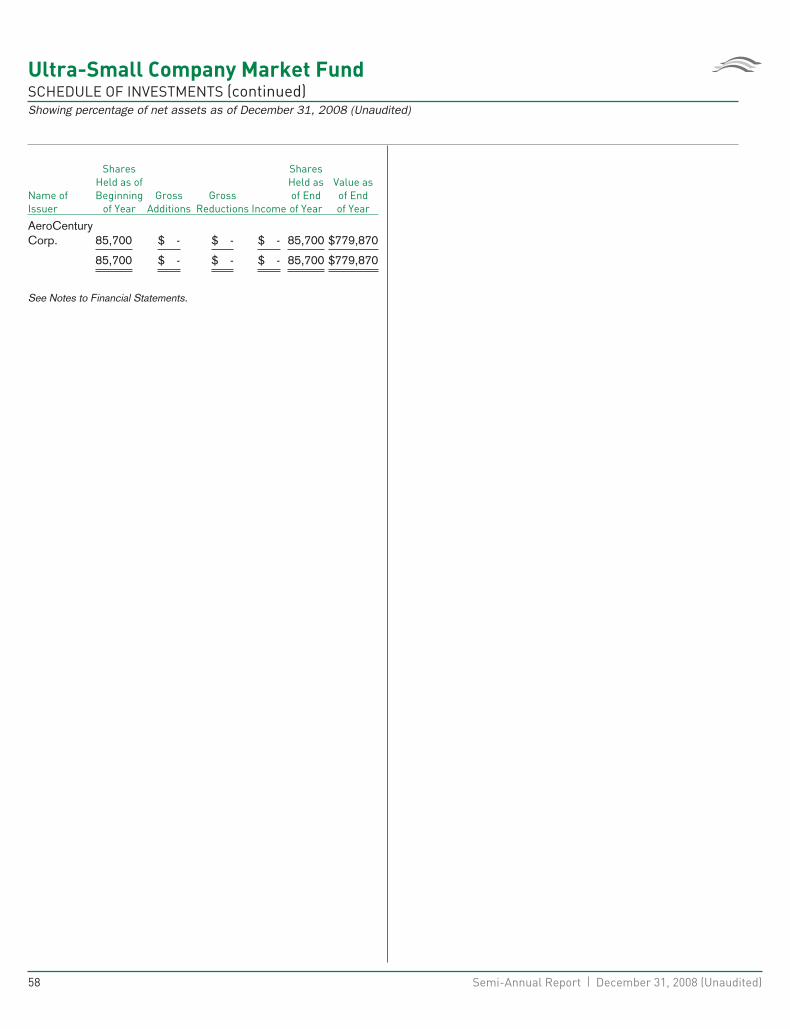
Ultra-Small Company Market FundSCHEDULE OF INVESTMENTS (continued)Showing percentage of net assets as of December 31, 2008 (Unaudited)
Name ofIssuer
SharesHeld as ofBeginning
of YearGross
AdditionsGross
Reductions Income
SharesHeld asof Endof Year
Value asof Endof Year
AeroCenturyCorp. 85,700 $ - $ - $ - 85,700 $779,870
85,700 $ - $ - $ - 85,700 $779,870
See Notes to Financial Statements.
58 Semi-Annual Report | December 31, 2008 (Unaudited)

THIS PAGE INTENTIONALLY LEFT BLANK
www.bridgeway.com 59
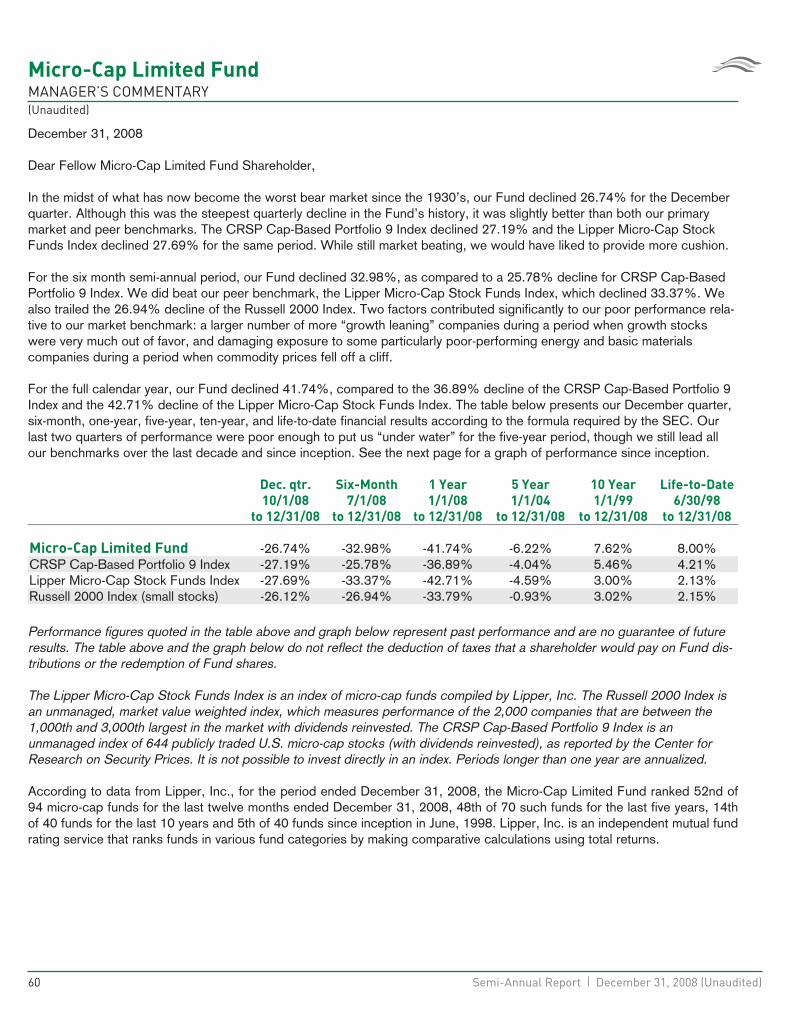
Micro-Cap Limited FundMANAGER’S COMMENTARY(Unaudited)
December 31, 2008
Dear Fellow Micro-Cap Limited Fund Shareholder,
In the midst of what has now become the worst bear market since the 1930’s, our Fund declined 26.74% for the Decemberquarter. Although this was the steepest quarterly decline in the Fund’s history, it was slightly better than both our primarymarket and peer benchmarks. The CRSP Cap-Based Portfolio 9 Index declined 27.19% and the Lipper Micro-Cap StockFunds Index declined 27.69% for the same period. While still market beating, we would have liked to provide more cushion.
For the six month semi-annual period, our Fund declined 32.98%, as compared to a 25.78% decline for CRSP Cap-BasedPortfolio 9 Index. We did beat our peer benchmark, the Lipper Micro-Cap Stock Funds Index, which declined 33.37%. Wealso trailed the 26.94% decline of the Russell 2000 Index. Two factors contributed significantly to our poor performance rela-tive to our market benchmark: a larger number of more “growth leaning” companies during a period when growth stockswere very much out of favor, and damaging exposure to some particularly poor-performing energy and basic materialscompanies during a period when commodity prices fell off a cliff.
For the full calendar year, our Fund declined 41.74%, compared to the 36.89% decline of the CRSP Cap-Based Portfolio 9Index and the 42.71% decline of the Lipper Micro-Cap Stock Funds Index. The table below presents our December quarter,six-month, one-year, five-year, ten-year, and life-to-date financial results according to the formula required by the SEC. Ourlast two quarters of performance were poor enough to put us “under water” for the five-year period, though we still lead allour benchmarks over the last decade and since inception. See the next page for a graph of performance since inception.
Dec. qtr.
10/1/08
to 12/31/08
Six-Month
7/1/08
to 12/31/08
1 Year
1/1/08
to 12/31/08
5 Year
1/1/04
to 12/31/08
10 Year
1/1/99
to 12/31/08
Life-to-Date
6/30/98
to 12/31/08
Micro-Cap Limited Fund -26.74% -32.98% -41.74% -6.22% 7.62% 8.00%CRSP Cap-Based Portfolio 9 Index -27.19% -25.78% -36.89% -4.04% 5.46% 4.21%Lipper Micro-Cap Stock Funds Index -27.69% -33.37% -42.71% -4.59% 3.00% 2.13%Russell 2000 Index (small stocks) -26.12% -26.94% -33.79% -0.93% 3.02% 2.15%
Performance figures quoted in the table above and graph below represent past performance and are no guarantee of futureresults. The table above and the graph below do not reflect the deduction of taxes that a shareholder would pay on Fund dis-tributions or the redemption of Fund shares.
The Lipper Micro-Cap Stock Funds Index is an index of micro-cap funds compiled by Lipper, Inc. The Russell 2000 Index isan unmanaged, market value weighted index, which measures performance of the 2,000 companies that are between the1,000th and 3,000th largest in the market with dividends reinvested. The CRSP Cap-Based Portfolio 9 Index is anunmanaged index of 644 publicly traded U.S. micro-cap stocks (with dividends reinvested), as reported by the Center forResearch on Security Prices. It is not possible to invest directly in an index. Periods longer than one year are annualized.
According to data from Lipper, Inc., for the period ended December 31, 2008, the Micro-Cap Limited Fund ranked 52nd of94 micro-cap funds for the last twelve months ended December 31, 2008, 48th of 70 such funds for the last five years, 14thof 40 funds for the last 10 years and 5th of 40 funds since inception in June, 1998. Lipper, Inc. is an independent mutual fundrating service that ranks funds in various fund categories by making comparative calculations using total returns.
60 Semi-Annual Report | December 31, 2008 (Unaudited)
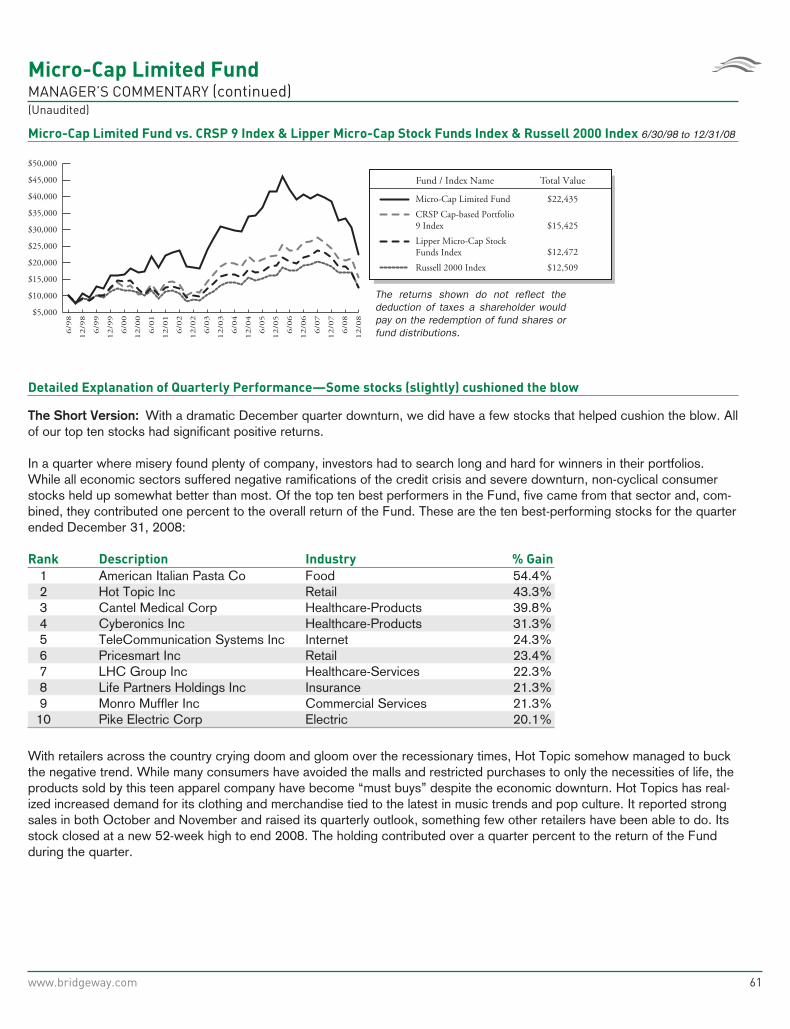
Micro-Cap Limited FundMANAGER’S COMMENTARY (continued)(Unaudited)
Micro-Cap Limited Fund vs. CRSP 9 Index & Lipper Micro-Cap Stock Funds Index & Russell 2000 Index 6/30/98 to 12/31/08
12/0
8
6/0
8
12/0
7
6/0
7
12/0
6
6/0
6
12/0
5
6/0
5
12/0
4
6/0
4
12/0
3
6/0
3
12/0
2
6/0
2
12/0
1
6/0
1
12/0
0
6/0
0
12/9
9
6/9
9
12/9
8
6/9
8
Fund / Index Name Total Value
The returns shown do not reflect the deduction of taxes a shareholder would pay on the redemption of fund shares or fund distributions.
Micro-Cap Limited Fund $22,435
Lipper Micro-Cap StockFunds Index $12,472
Russell 2000 Index $12,509
$5,000
$10,000
$15,000
$20,000
$25,000
$30,000
$35,000
$40,000
$45,000
$50,000
CRSP Cap-based Portfolio9 Index $15,425
Detailed Explanation of Quarterly Performance—Some stocks (slightly) cushioned the blow
The Short Version: With a dramatic December quarter downturn, we did have a few stocks that helped cushion the blow. Allof our top ten stocks had significant positive returns.
In a quarter where misery found plenty of company, investors had to search long and hard for winners in their portfolios.While all economic sectors suffered negative ramifications of the credit crisis and severe downturn, non-cyclical consumerstocks held up somewhat better than most. Of the top ten best performers in the Fund, five came from that sector and, com-bined, they contributed one percent to the overall return of the Fund. These are the ten best-performing stocks for the quarterended December 31, 2008:
Rank Description Industry % Gain
1 American Italian Pasta Co Food 54.4%2 Hot Topic Inc Retail 43.3%3 Cantel Medical Corp Healthcare-Products 39.8%4 Cyberonics Inc Healthcare-Products 31.3%5 TeleCommunication Systems Inc Internet 24.3%6 Pricesmart Inc Retail 23.4%7 LHC Group Inc Healthcare-Services 22.3%8 Life Partners Holdings Inc Insurance 21.3%9 Monro Muffler Inc Commercial Services 21.3%
10 Pike Electric Corp Electric 20.1%
With retailers across the country crying doom and gloom over the recessionary times, Hot Topic somehow managed to buckthe negative trend. While many consumers have avoided the malls and restricted purchases to only the necessities of life, theproducts sold by this teen apparel company have become “must buys” despite the economic downturn. Hot Topics has real-ized increased demand for its clothing and merchandise tied to the latest in music trends and pop culture. It reported strongsales in both October and November and raised its quarterly outlook, something few other retailers have been able to do. Itsstock closed at a new 52-week high to end 2008. The holding contributed over a quarter percent to the return of the Fundduring the quarter.
www.bridgeway.com 61
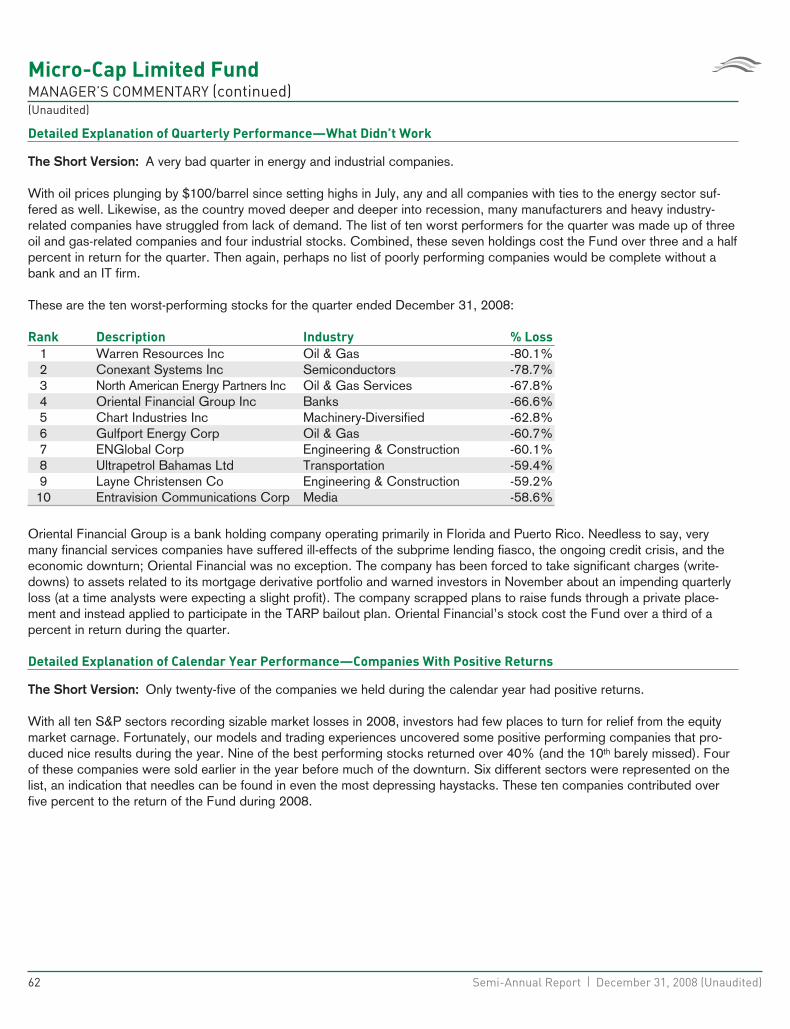
Micro-Cap Limited FundMANAGER’S COMMENTARY (continued)(Unaudited)
Detailed Explanation of Quarterly Performance—What Didn’t Work
The Short Version: A very bad quarter in energy and industrial companies.
With oil prices plunging by $100/barrel since setting highs in July, any and all companies with ties to the energy sector suf-fered as well. Likewise, as the country moved deeper and deeper into recession, many manufacturers and heavy industry-related companies have struggled from lack of demand. The list of ten worst performers for the quarter was made up of threeoil and gas-related companies and four industrial stocks. Combined, these seven holdings cost the Fund over three and a halfpercent in return for the quarter. Then again, perhaps no list of poorly performing companies would be complete without abank and an IT firm.
These are the ten worst-performing stocks for the quarter ended December 31, 2008:
Rank Description Industry % Loss
1 Warren Resources Inc Oil & Gas -80.1%2 Conexant Systems Inc Semiconductors -78.7%3 North American Energy Partners Inc Oil & Gas Services -67.8%4 Oriental Financial Group Inc Banks -66.6%5 Chart Industries Inc Machinery-Diversified -62.8%6 Gulfport Energy Corp Oil & Gas -60.7%7 ENGlobal Corp Engineering & Construction -60.1%8 Ultrapetrol Bahamas Ltd Transportation -59.4%9 Layne Christensen Co Engineering & Construction -59.2%
10 Entravision Communications Corp Media -58.6%
Oriental Financial Group is a bank holding company operating primarily in Florida and Puerto Rico. Needless to say, verymany financial services companies have suffered ill-effects of the subprime lending fiasco, the ongoing credit crisis, and theeconomic downturn; Oriental Financial was no exception. The company has been forced to take significant charges (write-downs) to assets related to its mortgage derivative portfolio and warned investors in November about an impending quarterlyloss (at a time analysts were expecting a slight profit). The company scrapped plans to raise funds through a private place-ment and instead applied to participate in the TARP bailout plan. Oriental Financial’s stock cost the Fund over a third of apercent in return during the quarter.
Detailed Explanation of Calendar Year Performance—Companies With Positive Returns
The Short Version: Only twenty-five of the companies we held during the calendar year had positive returns.
With all ten S&P sectors recording sizable market losses in 2008, investors had few places to turn for relief from the equitymarket carnage. Fortunately, our models and trading experiences uncovered some positive performing companies that pro-duced nice results during the year. Nine of the best performing stocks returned over 40% (and the 10th barely missed). Fourof these companies were sold earlier in the year before much of the downturn. Six different sectors were represented on thelist, an indication that needles can be found in even the most depressing haystacks. These ten companies contributed overfive percent to the return of the Fund during 2008.
62 Semi-Annual Report | December 31, 2008 (Unaudited)
Micro-Cap Limited FundMANAGER’S COMMENTARY (continued)(Unaudited)
These are the ten best performers for the calendar year ended December 31, 2008:
Rank Description Industry % Gain
1 Superior Essex Inc Electrical Components & Equipment 82.0%2 Questcor Pharmaceuticals Inc Pharmaceuticals 74.8%3 CSG Systems International Inc Software 55.8%4 American Italian Pasta Co Food 54.4%5 Hill International Inc Commercial Services 47.4%6 Life Partners Holdings Inc Insurance 45.7%7 Hot Topic Inc Retail 43.3%8 General Steel Holdings Inc Iron/Steel 42.3%9 Axsys Technologies Inc Electronics 40.2%
10 Cantel Medical Corp Healthcare-Products 39.8%
Life Partners helps maintain an active secondary market for life insurance by purchasing policies from individuals andre-offering them as packaged investment vehicles. Institutions and high net worth individuals have found these “life settle-ments” to be attractive non-correlated, alternative investments, particularly in this environment. These life settlements may beconsidered recession-proof as mortality (death) occurs regardless of the state of the economy. Investors also reap the taxadvantages associated with life insurance once the policies are paid. Life Partners posted record earnings in December,which marked the third straight quarter management had upwardly revised its outlook. The holding contributed about a half apercent to the Fund’s return in 2008.
Detailed Explanation of Calendar Year Performance—What Didn’t Work
The Short Version: As goes the quarter, so goes the year.
No industry was immune from the economic downturn and market negativity. Six different sectors were represented on thelist of worst performers for 2008, with three coming from the depressed oil and gas industry. Combined, these ten holdingscost the Fund over five percent in return. 27 holdings fell 50% or more during the year.
These are the ten stocks that performed the worst in the calendar year ended December 31, 2008:
Rank Description Industry % Loss
1 Conexant Systems Inc Semiconductors -84.2%2 Warren Resources Inc Oil & Gas -83.7%3 North American Energy Partners Inc Oil & Gas Services -81.9%4 Ultrapetrol Bahamas Ltd Transportation -76.3%5 BioScrip Inc Pharmaceuticals -72.2%6 Gulfport Energy Corp Oil & Gas -71.9%7 China Fire & Security Group Inc Miscellaneous Manufacturing -69.5%8 Oriental Financial Group Inc Banks -67.1%9 Bidz.com Inc Internet -65.2%
10 ENGlobal Corp Engineering & Construction -64.0%
Conexant Systems was the Fund’s worst performer during 2008 and lost over 80% in return. Like so many technology-related firms, this semiconductor company struggled during the year from lackluster sales and canceled orders. During theserecessionary times, consumers and businesses alike are hesitant to upgrade technology and make many related purchases.Conexant lowered its quarterly outlook in October and then again in December, as demand for its products continued todecline. The company sold off some non-core assets to raise cash and improve its balance sheet, though the moves did littleto generate investor enthusiasm. Conexant cost the Fund over half a percent in return during the year.
www.bridgeway.com 63
Micro-Cap Limited FundMANAGER’S COMMENTARY (continued)(Unaudited)
Top Ten Holdings as of December 31, 2008
Insurance companies highlighted the Fund’s top ten holdings, as three related stocks comprised the list at year-end. Two ofour largest positions were also among the Fund’s top performers of the quarter (Life Partners Holdings and PriceSmart).While one holding accounted for greater than five percent of the net assets, the Fund was well-diversified across manycompanies in this difficult environment for stocks. The ten largest positions represented under 30% of the total assets of theFund.
Rank Description Industry
% of
Net Assets
1 Crawford & Co - Class B Insurance 5.9%2 Axsys Technologies Inc Electronics 4.0%3 Questcor Pharmaceuticals Inc Pharmaceuticals 3.6%4 Life Partners Holdings Inc Insurance 2.8%5 Tyler Technologies Inc Software 2.2%6 Calgon Carbon Corp Environmental Control 2.1%7 Kendle International Inc Commercial Services 2.1%8 Tower Group Inc Insurance 2.1%9 PriceSmart Inc Retail 2.0%
10 CryoLife Inc Healthcare-Products 2.0%28.8%
Industry Sector Representation as of December 31, 2008
While virtually no sector was spared the negativity of the past three months (and full year, for that matter), our models’ over-weighting industrials and, earlier in the year, in basic materials (chemicals, steel, iron, lumber) was costly to the Fund’s per-formance relative to the benchmarks. Many of these companies had been solid performers in the June quarter, but plunged invalue as the weak global economy hindered demand for such products. Surprisingly, our models’ underweighting financialsalso hurt our relative performance during the quarter and the year, as micro-cap banks held up much better than the largeones.
% of Net Assets
% S&P
Small-Cap Index Difference
Basic Materials 3.0% 2.9% 0.1%Communications 10.1% 4.5% 5.6%Consumer, Cyclical 12.5% 14.2% -1.7%Consumer, Non-cyclical 19.0% 20.9% -1.9%Energy 4.1% 3.8% 0.3%Financial 13.6% 20.3% -6.7%Industrial 23.4% 19.3% 4.1%Technology 10.5% 8.5% 2.0%Utilities 1.7% 5.6% -3.9%Cash 2.1% 0.0% 2.1%
Total 100.0% 100.0%
64 Semi-Annual Report | December 31, 2008 (Unaudited)
Micro-Cap Limited FundMANAGER’S COMMENTARY (continued)(Unaudited)
Disclaimer
The views expressed here are exclusively those of Fund management. These views are not meant as investment advice andshould not be considered predictive in nature. Any favorable (or unfavorable) description of a holding applies only as ofDecember 31, 2008, unless otherwise stated. Security positions can and do change thereafter. Discussions of historicalperformance do not guarantee and are not indicative of future performance.
The Fund is subject to very high, above market risk (volatility) and is not an appropriate investment for short-term investors.Investments in micro-cap companies generally carry greater risk than is customarily associated with larger companies andeven “small companies” for various reasons such as narrower markets (fewer investors), limited financial resources andgreater trading difficulty.
Conclusion
Thank you for your continued investment in Micro-Cap Limited Fund. We encourage your feedback; your reactions and con-cerns are important to us.
Sincerely,
Your Investment Management Team
www.bridgeway.com 65
Micro-Cap Limited FundSCHEDULE OF INVESTMENTSShowing percentage of net assets as of December 31, 2008 (Unaudited)
Industry Company Shares Value
COMMON STOCKS - 97.97%Airlines - 0.55%
Hawaiian Holdings, Inc.* 21,600 $ 137,808
Apparel - 0.67%True Religion Apparel, Inc.* 13,700 170,428
Banks - 1.43%Southside Bancshares, Inc. 15,400 361,900
Beverages - 1.03%Peet’s Coffee & Tea, Inc.* 11,200 260,400
Building Materials - 1.89%Comfort Systems USA, Inc. 14,000 148,400NCI Building Systems, Inc.* 10,700 174,410Trex Co., Inc.* 9,400 154,724
477,534
Chemicals - 1.99%Aceto Corp. 11,500 115,115Innophos Holdings, Inc. 19,600 388,276
503,391
Commercial Services - 4.31%Kendle International, Inc.* 20,700 532,404Landauer, Inc. 4,600 337,180Monro Muffler Brake, Inc. 5,700 145,350TNS, Inc.* 8,000 75,120
1,090,054
Computers - 2.83%Manhattan Associates, Inc.* 16,200 256,122MTS Systems Corp. 7,800 207,792NCI, Inc., Class A* 8,300 250,079
713,993
Electric Utilities - 1.23%Pike Electric Corp.* 25,200 309,960
Electrical Components & Equipment - 0.93%Powell Industries, Inc.* 8,100 235,062
Electronics - 5.30%Axsys Technologies, Inc.* 18,600 1,020,396Multi-Fineline Electronix, Inc.* 6,900 80,661NVE Corp.* 9,095 237,652
1,338,709
Engineering & Construction - 1.13%Stanley, Inc.* 7,900 286,138
Industry Company Shares Value
Environmental Control - 3.16%Calgon Carbon Corp.* 34,900 $ 536,064Darling International, Inc.* 47,600 261,324
797,388
Food - 1.28%American Italian Pasta Co.,
Class A* 6,400 142,976Diamond Foods, Inc. 8,900 179,335
322,311
Forest Products & Paper - 0.98%Glatfelter 26,500 246,450
Gas - 0.46%Chesapeake Utilities Corp. 3,700 116,476
Hand/Machine Tools - 1.17%K-Tron International, Inc.* 3,700 295,630
Healthcare - Products - 6.95%Cantel Medical Corp.* 21,600 316,872CryoLife, Inc.* 51,300 498,123Cyberonics, Inc.* 28,800 477,216Hanger Orthopedic Group,
Inc.* 12,600 182,826Somanetics Corp.* 9,700 160,147Vascular Solutions, Inc.* 13,500 121,770
1,756,954
Healthcare - Services - 1.85%Almost Family, Inc.* 2,600 116,948LHC Group, Inc.*+ 9,700 349,200
466,148
Insurance - 12.21%Crawford & Co., Class B*+ 102,800 1,494,712Life Partners Holdings, Inc. 16,000 698,240Meadowbrook Insurance
Group, Inc. 57,800 372,232Tower Group, Inc. 18,400 519,064
3,084,248
Internet - 5.73%Bidz.com, Inc.*+ 31,400 144,440EarthLink, Inc.*+ 48,600 328,536eResearchTechnology, Inc.* 29,900 198,237TeleCommunication Systems,
Inc., Class A* 57,500 493,925VASCO Data Security
International, Inc.*+ 27,400 283,042
1,448,180
66 Semi-Annual Report | December 31, 2008 (Unaudited)
Micro-Cap Limited FundSCHEDULE OF INVESTMENTS (continued)Showing percentage of net assets as of December 31, 2008 (Unaudited)
Industry Company Shares Value
Common Stocks (continued)
Machinery - Diversified - 0.96%Chart Industries, Inc.* 14,000 $ 148,820Columbus McKinnon Corp.* 6,900 94,185
243,005
Metal Fabrication - Hardware - 2.75%Ampco-Pittsburgh Corp. 10,400 225,680CIRCOR International, Inc. 3,700 101,750Northwest Pipe Co.* 8,600 366,446
693,876
Miscellaneous Manufacturing - 3.33%AZZ, Inc.* 10,200 256,020Blount International, Inc.* 26,100 247,428EnPro Industries, Inc.* 4,900 105,546PMFG, Inc.* 14,200 135,752Standex International Corp. 4,900 97,216
841,962
Oil & Gas - 1.79%Arena Resources, Inc.*+ 9,600 269,664Gulfport Energy Corp.* 28,500 112,575Warren Resources, Inc.* 35,200 70,048
452,287
Oil & Gas Services - 2.34%Dawson Geophysical Co.* 11,400 203,034Natural Gas Services Group,
Inc.* 17,400 176,262Newpark Resources, Inc.* 45,200 167,240North American Energy
Partners, Inc.* 13,700 45,758
592,294
Pharmaceuticals - 3.62%Questcor Pharmaceuticals,
Inc.*+ 98,200 914,242
Retail - 11.28%America’s Car-Mart, Inc.* 9,200 127,052Buffalo Wild Wings, Inc.* 9,300 238,545EZCORP, Inc., Class A* 21,482 326,741Hot Topic, Inc.* 38,800 359,676JOS A Bank Clothiers, Inc.*+ 9,800 256,270PetMed Express, Inc.* 27,900 491,877Pricesmart, Inc. 24,700 510,302The Finish Line, Inc., Class A 36,800 206,080The Wet Seal, Inc., Class A* 112,500 334,125
2,850,668
Semiconductors - 1.81%Silicon Image, Inc.* 67,600 283,920
Industry Company Shares Value
Semiconductors (continued)Volterra Semiconductor
Corp.* 24,400 $ 174,460
458,380
Software - 5.86%Ebix, Inc.* 18,000 430,200SYNNEX Corp.* 16,000 181,280Tyler Technologies, Inc.* 46,800 560,664Wind River Systems, Inc.* 34,300 309,729
1,481,873
Telecommunications - 4.33%Adaptec, Inc.* 38,900 128,370Applied Signal Technology,
Inc. 20,300 364,182Atlantic Tele-Network, Inc. 8,400 223,020Preformed Line Products Co. 5,800 267,032SureWest Communications 9,800 111,916
1,094,520
Transportation - 1.94%American Commercial Lines,
Inc.* 39,900 195,510Gulfmark Offshore, Inc.* 8,373 199,194Ultrapetrol (Bahamas), Ltd.*+ 30,200 96,338
491,042
Trucking & Leasing - 0.88%TAL International Group, Inc. 15,800 222,780
TOTAL COMMON STOCKS - 97.97% 24,756,091(Cost $29,146,155)
MONEY MARKET FUND - 0.78%
Rate^ Shares ValueBlackRock Temp Cash
Liquidity Fund InstitutionalShares #21 1.68% 196,522 196,522
TOTAL MONEY MARKET FUNDS - 0.78% 196,522(Cost $196,522)
TOTAL INVESTMENTS - 98.75% $24,952,613(Cost $29,342,677)Other Assets in Excess of Liabilities - 1.25% 315,977
NET ASSETS - 100.00% $25,268,590
* Non Income Producing Security.+ This security or a portion of the security is out on loan at
December 31, 2008. Total loaned securities had a market value of$3,031,379 at December 31, 2008.
^ Rate disclosed is as of December 31, 2008.Ltd - Limited
See Notes to Financial Statements.
www.bridgeway.com 67
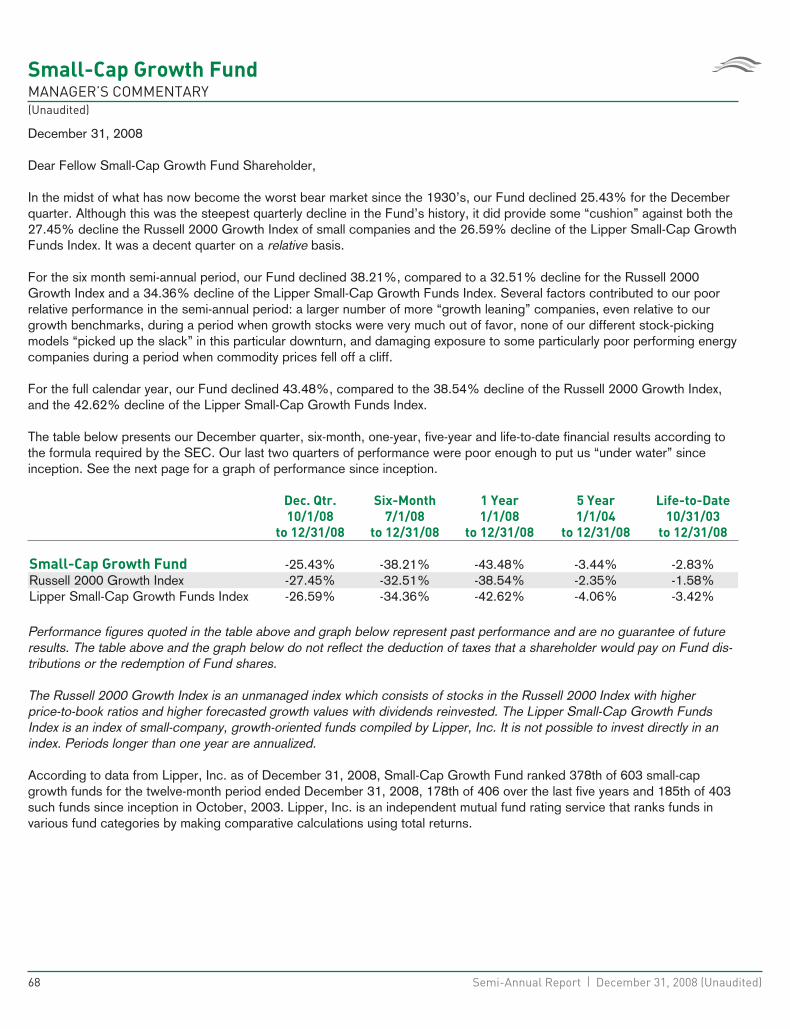
Small-Cap Growth FundMANAGER’S COMMENTARY(Unaudited)
December 31, 2008
Dear Fellow Small-Cap Growth Fund Shareholder,
In the midst of what has now become the worst bear market since the 1930’s, our Fund declined 25.43% for the Decemberquarter. Although this was the steepest quarterly decline in the Fund’s history, it did provide some “cushion” against both the27.45% decline the Russell 2000 Growth Index of small companies and the 26.59% decline of the Lipper Small-Cap GrowthFunds Index. It was a decent quarter on a relative basis.
For the six month semi-annual period, our Fund declined 38.21%, compared to a 32.51% decline for the Russell 2000Growth Index and a 34.36% decline of the Lipper Small-Cap Growth Funds Index. Several factors contributed to our poorrelative performance in the semi-annual period: a larger number of more “growth leaning” companies, even relative to ourgrowth benchmarks, during a period when growth stocks were very much out of favor, none of our different stock-pickingmodels “picked up the slack” in this particular downturn, and damaging exposure to some particularly poor performing energycompanies during a period when commodity prices fell off a cliff.
For the full calendar year, our Fund declined 43.48%, compared to the 38.54% decline of the Russell 2000 Growth Index,and the 42.62% decline of the Lipper Small-Cap Growth Funds Index.
The table below presents our December quarter, six-month, one-year, five-year and life-to-date financial results according tothe formula required by the SEC. Our last two quarters of performance were poor enough to put us “under water” sinceinception. See the next page for a graph of performance since inception.
Dec. Qtr.
10/1/08
to 12/31/08
Six-Month
7/1/08
to 12/31/08
1 Year
1/1/08
to 12/31/08
5 Year
1/1/04
to 12/31/08
Life-to-Date
10/31/03
to 12/31/08
Small-Cap Growth Fund -25.43% -38.21% -43.48% -3.44% -2.83%Russell 2000 Growth Index -27.45% -32.51% -38.54% -2.35% -1.58%Lipper Small-Cap Growth Funds Index -26.59% -34.36% -42.62% -4.06% -3.42%
Performance figures quoted in the table above and graph below represent past performance and are no guarantee of futureresults. The table above and the graph below do not reflect the deduction of taxes that a shareholder would pay on Fund dis-tributions or the redemption of Fund shares.
The Russell 2000 Growth Index is an unmanaged index which consists of stocks in the Russell 2000 Index with higherprice-to-book ratios and higher forecasted growth values with dividends reinvested. The Lipper Small-Cap Growth FundsIndex is an index of small-company, growth-oriented funds compiled by Lipper, Inc. It is not possible to invest directly in anindex. Periods longer than one year are annualized.
According to data from Lipper, Inc. as of December 31, 2008, Small-Cap Growth Fund ranked 378th of 603 small-capgrowth funds for the twelve-month period ended December 31, 2008, 178th of 406 over the last five years and 185th of 403such funds since inception in October, 2003. Lipper, Inc. is an independent mutual fund rating service that ranks funds invarious fund categories by making comparative calculations using total returns.
68 Semi-Annual Report | December 31, 2008 (Unaudited)
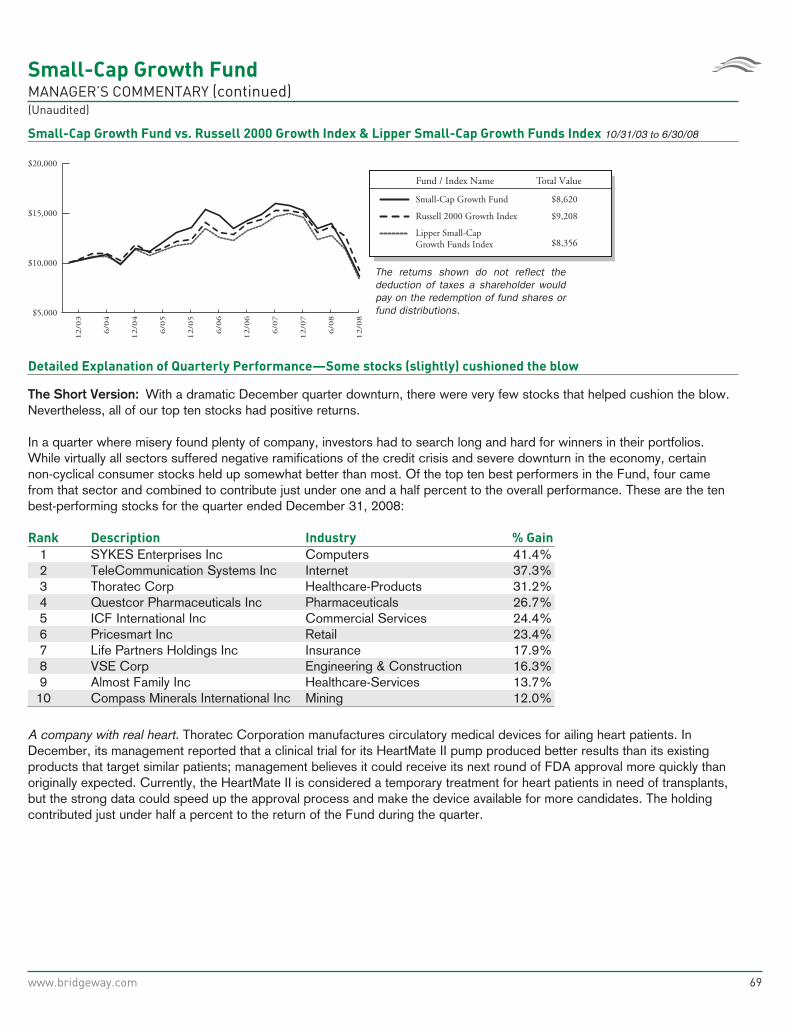
Small-Cap Growth FundMANAGER’S COMMENTARY (continued)(Unaudited)
Small-Cap Growth Fund vs. Russell 2000 Growth Index & Lipper Small-Cap Growth Funds Index 10/31/03 to 6/30/08
$5,000
$10,000
$20,000
$15,000
12/0
8
6/0
8
12/0
7
6/0
7
12/0
6
6/0
6
12/0
5
6/0
5
12/0
4
6/0
4
12/0
3
Fund / Index Name Total Value
Russell 2000 Growth Index
Lipper Small-Cap Growth Funds Index
Small-Cap Growth Fund
The returns shown do not reflect the deduction of taxes a shareholder would pay on the redemption of fund shares or fund distributions.
$8,620
$9,208
$8,356
Detailed Explanation of Quarterly Performance—Some stocks (slightly) cushioned the blow
The Short Version: With a dramatic December quarter downturn, there were very few stocks that helped cushion the blow.Nevertheless, all of our top ten stocks had positive returns.
In a quarter where misery found plenty of company, investors had to search long and hard for winners in their portfolios.While virtually all sectors suffered negative ramifications of the credit crisis and severe downturn in the economy, certainnon-cyclical consumer stocks held up somewhat better than most. Of the top ten best performers in the Fund, four camefrom that sector and combined to contribute just under one and a half percent to the overall performance. These are the tenbest-performing stocks for the quarter ended December 31, 2008:
Rank Description Industry % Gain
1 SYKES Enterprises Inc Computers 41.4%2 TeleCommunication Systems Inc Internet 37.3%3 Thoratec Corp Healthcare-Products 31.2%4 Questcor Pharmaceuticals Inc Pharmaceuticals 26.7%5 ICF International Inc Commercial Services 24.4%6 Pricesmart Inc Retail 23.4%7 Life Partners Holdings Inc Insurance 17.9%8 VSE Corp Engineering & Construction 16.3%9 Almost Family Inc Healthcare-Services 13.7%
10 Compass Minerals International Inc Mining 12.0%
A company with real heart. Thoratec Corporation manufactures circulatory medical devices for ailing heart patients. InDecember, its management reported that a clinical trial for its HeartMate II pump produced better results than its existingproducts that target similar patients; management believes it could receive its next round of FDA approval more quickly thanoriginally expected. Currently, the HeartMate II is considered a temporary treatment for heart patients in need of transplants,but the strong data could speed up the approval process and make the device available for more candidates. The holdingcontributed just under half a percent to the return of the Fund during the quarter.
www.bridgeway.com 69
Small-Cap Growth FundMANAGER’S COMMENTARY (continued)(Unaudited)
Detailed Explanation of Quarterly Performance—What Didn’t Work
The Short Version: A very bad quarter in energy.
In mid-summer, oil prices had surged to $146/barrel, and many analysts were calling for $200 and beyond. What a differencea few quarters make. Over the past six months, crude prices plummeted over $100/barrel, with much of the losses comingduring the 4th quarter. Virtually every company with ties to the energy sector plunged in value. Five of the worst performers inthe Fund were oil and gas-related and, combined, they cost shareholders over two percent in return. During the quarter, allten of the Fund’s worst performers dropped by over 50%; in fact, seventeen of our 104 holdings lost half of their value overthe past three months.
These are the ten worst-performing stocks for the quarter ended December 31, 2008:
Rank Description Industry % Loss
1 Life Sciences Research Inc Healthcare-Services -73.1%2 Parexel International Corp Commercial Services -66.1%3 Graham Corp Electrical Components & Equipment -65.9%4 Dawson Geophysical Co Oil & Gas Services -61.9%5 Rosetta Resources Inc Oil & Gas -61.4%6 Gulfport Energy Corp Oil & Gas -60.7%7 Mitcham Industries Inc Oil & Gas Services -60.7%8 Bucyrus International Inc Machinery-Construction & Mining -58.6%9 Gulf Island Fabrication Inc Oil & Gas Services -58.2%
10 JDS Uniphase Corp Telecommunications -56.9%
While many healthcare related companies have held up better than those in other sectors, research firms suffered from theeconomic downturn, as pharmaceuticals and bio-techs delayed or canceled certain drug trials. Parexel International providesclinical research and medical consulting services for the pharmaceutical industry. The company reported lower than expectedearnings and revenue last quarter and downwardly revised its outlook for the next period as well. Many of its customers havebegun conserving cash to shore up their balance sheets, and research-related programs have been put on hold for the timebeing. Parexel also faced considerable growing pains as it tried to incorporate a 2007 acquisition, ClinPhone, into its oper-ations during these weaker times. The holding declined 66% during the quarter and cost the Fund over three-quarters of apercent in return.
70 Semi-Annual Report | December 31, 2008 (Unaudited)
Small-Cap Growth FundMANAGER’S COMMENTARY (continued)(Unaudited)
Detailed Explanation of Calendar Year Performance—What Worked Well
The Short Version: Only 27 of the 163 companies we held during the calendar year had positive returns.
With all ten sectors recording sizable market losses in 2008, investors had few places to turn for relief from the equity marketcarnage. As was the case for the quarter, however, certain non-cyclical stocks saved the day, or at least limited the damage.Five related companies were included in the list of the best performers for the calendar year. Combined, they contributedabout two and a half percent to the overall return. These are the ten best performers for the calendar year endedDecember 31, 2008:
Rank Description Industry % Gain
1 Questcor Pharmaceuticals Inc Pharmaceuticals 102.4%2 Almost Family Inc Healthcare-Services 86.8%3 SYKES Enterprises Inc Computers 41.4%4 Mfri Inc Miscellaneous Manufacturing 40.8%5 TeleCommunication Systems Inc Internet 37.3%6 Bright Horizons Family Solutions Inc Commercial Services 36.5%7 Ezcorp Inc Retail 34.7%8 Thoratec Corp Healthcare-Products 26.9%9 Strayer Education Inc Commercial Services 25.7%
10 Fuel Systems Solutions Inc Auto Parts & Equipment 25.5%
One more reason to be nice to your kids…they may be choosing your nursing home. Almost Family provides home health andeldercare services across the eastern half of the country. As baby-boomers age and move into their twilight years, thedemand for assisted living and homecare services has grown dramatically. Almost Family has benefited significantly from thistrend. In August, the company closed on its $45 million acquisition of Patient Care, a move expected to generate substantialrevenues immediately. Almost Family added locations in Connecticut, New Jersey, and Pennsylvania during the year andreported an 84% increase in quarterly revenue in November. The company was named the 24th Best Small Company inAmerica by Forbes Magazine in October and contributed over three-quarters of a percent to the return of the Fund in 2008.
Detailed Explanation of Calendar Year Performance—What Didn’t Work
The Short Version: As goes the quarter, so goes the year.
Investors would love to forget about 2008, as nothing seemed to work and all sectors were hindered by the economic down-turn and financial crisis. 38 Fund holdings fell 50% or more during the year. Each of the ten worst performers dropped atleast 70% in value. While financial stocks took the brunt of the negativity early, energy contributed losses during the secondhalf of the year, and consumer-driven companies like retail suffered late as the economy moved further into recession. Five ofthe lowest performers were oil and gas-related; combined they cost the Fund over three and a half percent in return.
www.bridgeway.com 71
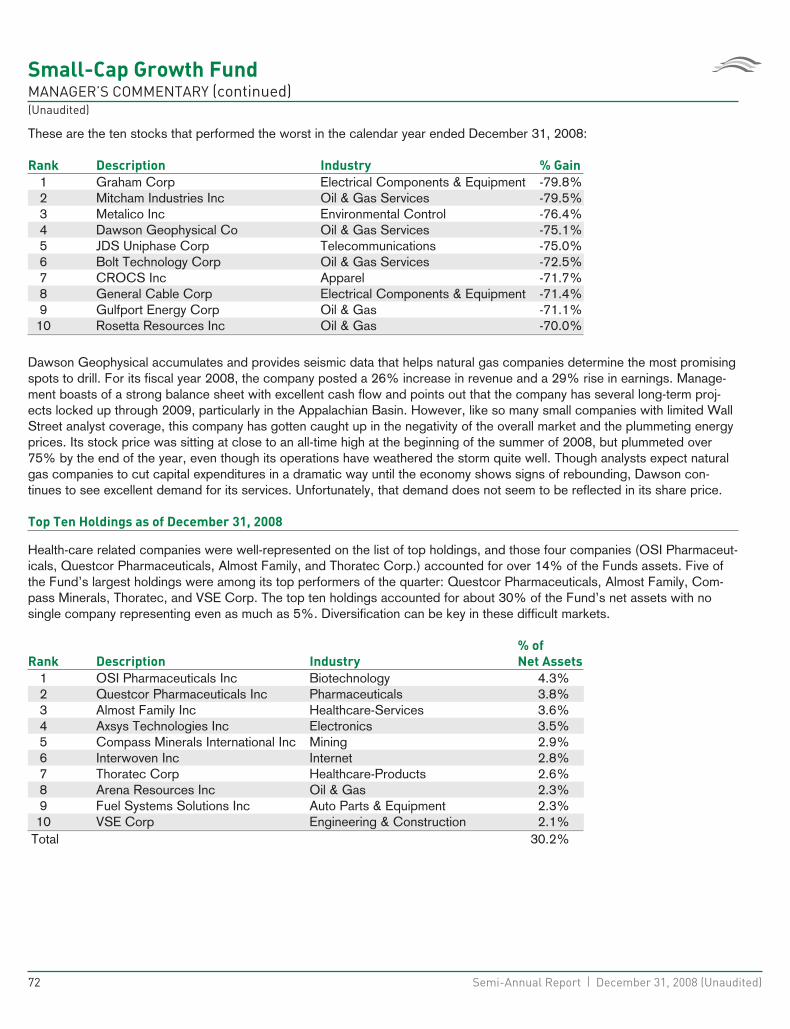
Small-Cap Growth FundMANAGER’S COMMENTARY (continued)(Unaudited)
These are the ten stocks that performed the worst in the calendar year ended December 31, 2008:
Rank Description Industry % Gain
1 Graham Corp Electrical Components & Equipment -79.8%2 Mitcham Industries Inc Oil & Gas Services -79.5%3 Metalico Inc Environmental Control -76.4%4 Dawson Geophysical Co Oil & Gas Services -75.1%5 JDS Uniphase Corp Telecommunications -75.0%6 Bolt Technology Corp Oil & Gas Services -72.5%7 CROCS Inc Apparel -71.7%8 General Cable Corp Electrical Components & Equipment -71.4%9 Gulfport Energy Corp Oil & Gas -71.1%
10 Rosetta Resources Inc Oil & Gas -70.0%
Dawson Geophysical accumulates and provides seismic data that helps natural gas companies determine the most promisingspots to drill. For its fiscal year 2008, the company posted a 26% increase in revenue and a 29% rise in earnings. Manage-ment boasts of a strong balance sheet with excellent cash flow and points out that the company has several long-term proj-ects locked up through 2009, particularly in the Appalachian Basin. However, like so many small companies with limited WallStreet analyst coverage, this company has gotten caught up in the negativity of the overall market and the plummeting energyprices. Its stock price was sitting at close to an all-time high at the beginning of the summer of 2008, but plummeted over75% by the end of the year, even though its operations have weathered the storm quite well. Though analysts expect naturalgas companies to cut capital expenditures in a dramatic way until the economy shows signs of rebounding, Dawson con-tinues to see excellent demand for its services. Unfortunately, that demand does not seem to be reflected in its share price.
Top Ten Holdings as of December 31, 2008
Health-care related companies were well-represented on the list of top holdings, and those four companies (OSI Pharmaceut-icals, Questcor Pharmaceuticals, Almost Family, and Thoratec Corp.) accounted for over 14% of the Funds assets. Five ofthe Fund’s largest holdings were among its top performers of the quarter: Questcor Pharmaceuticals, Almost Family, Com-pass Minerals, Thoratec, and VSE Corp. The top ten holdings accounted for about 30% of the Fund’s net assets with nosingle company representing even as much as 5%. Diversification can be key in these difficult markets.
Rank Description Industry
% of
Net Assets
1 OSI Pharmaceuticals Inc Biotechnology 4.3%2 Questcor Pharmaceuticals Inc Pharmaceuticals 3.8%3 Almost Family Inc Healthcare-Services 3.6%4 Axsys Technologies Inc Electronics 3.5%5 Compass Minerals International Inc Mining 2.9%6 Interwoven Inc Internet 2.8%7 Thoratec Corp Healthcare-Products 2.6%8 Arena Resources Inc Oil & Gas 2.3%9 Fuel Systems Solutions Inc Auto Parts & Equipment 2.3%
10 VSE Corp Engineering & Construction 2.1%Total 30.2%
72 Semi-Annual Report | December 31, 2008 (Unaudited)
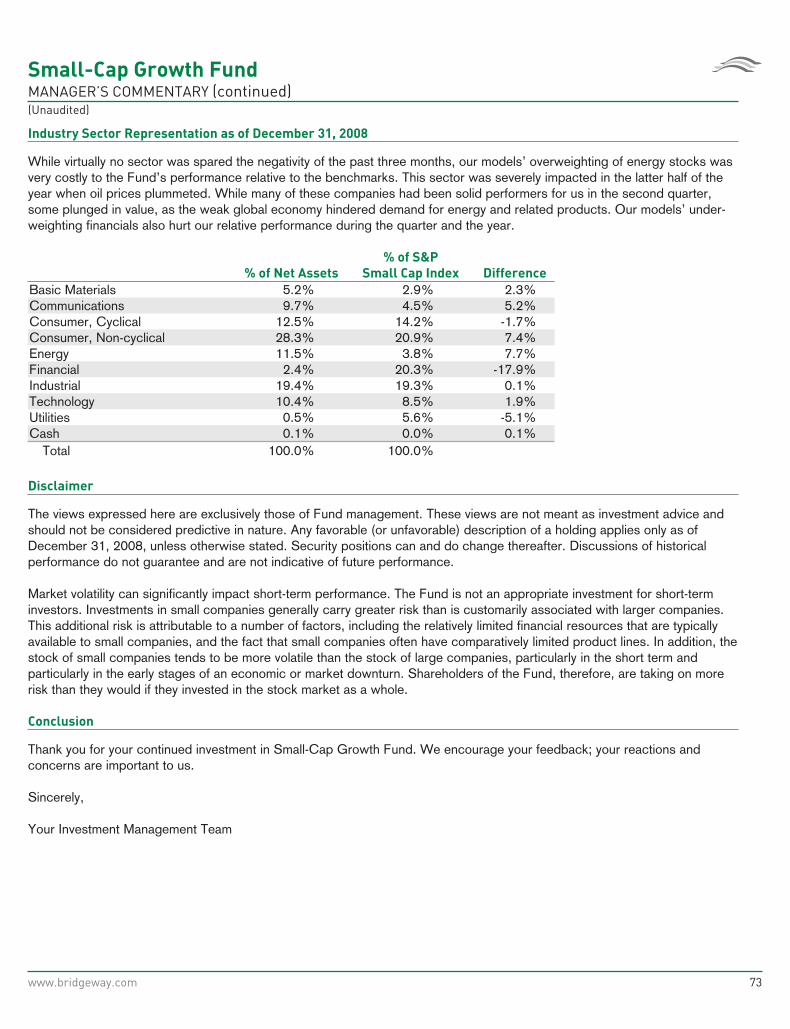
Small-Cap Growth FundMANAGER’S COMMENTARY (continued)(Unaudited)
Industry Sector Representation as of December 31, 2008
While virtually no sector was spared the negativity of the past three months, our models’ overweighting of energy stocks wasvery costly to the Fund’s performance relative to the benchmarks. This sector was severely impacted in the latter half of theyear when oil prices plummeted. While many of these companies had been solid performers for us in the second quarter,some plunged in value, as the weak global economy hindered demand for energy and related products. Our models’ under-weighting financials also hurt our relative performance during the quarter and the year.
% of Net Assets
% of S&P
Small Cap Index Difference
Basic Materials 5.2% 2.9% 2.3%Communications 9.7% 4.5% 5.2%Consumer, Cyclical 12.5% 14.2% -1.7%Consumer, Non-cyclical 28.3% 20.9% 7.4%Energy 11.5% 3.8% 7.7%Financial 2.4% 20.3% -17.9%Industrial 19.4% 19.3% 0.1%Technology 10.4% 8.5% 1.9%Utilities 0.5% 5.6% -5.1%Cash 0.1% 0.0% 0.1%
Total 100.0% 100.0%
Disclaimer
The views expressed here are exclusively those of Fund management. These views are not meant as investment advice andshould not be considered predictive in nature. Any favorable (or unfavorable) description of a holding applies only as ofDecember 31, 2008, unless otherwise stated. Security positions can and do change thereafter. Discussions of historicalperformance do not guarantee and are not indicative of future performance.
Market volatility can significantly impact short-term performance. The Fund is not an appropriate investment for short-terminvestors. Investments in small companies generally carry greater risk than is customarily associated with larger companies.This additional risk is attributable to a number of factors, including the relatively limited financial resources that are typicallyavailable to small companies, and the fact that small companies often have comparatively limited product lines. In addition, thestock of small companies tends to be more volatile than the stock of large companies, particularly in the short term andparticularly in the early stages of an economic or market downturn. Shareholders of the Fund, therefore, are taking on morerisk than they would if they invested in the stock market as a whole.
Conclusion
Thank you for your continued investment in Small-Cap Growth Fund. We encourage your feedback; your reactions andconcerns are important to us.
Sincerely,
Your Investment Management Team
www.bridgeway.com 73
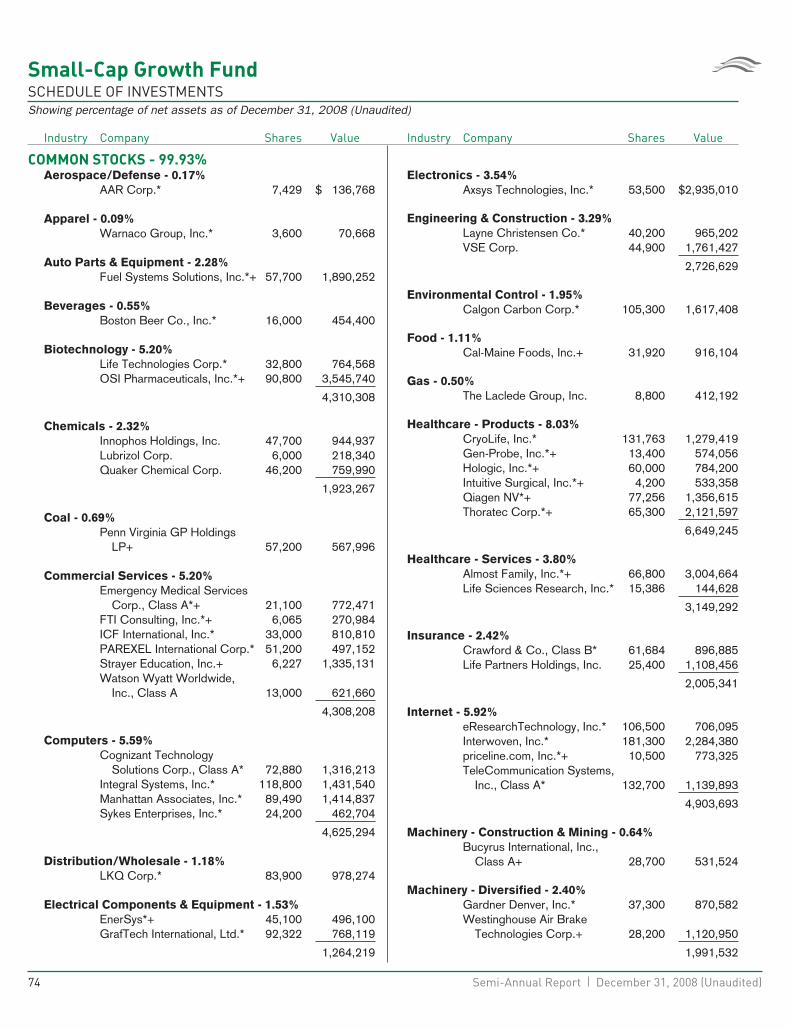
Small-Cap Growth FundSCHEDULE OF INVESTMENTSShowing percentage of net assets as of December 31, 2008 (Unaudited)
Industry Company Shares Value
COMMON STOCKS - 99.93%Aerospace/Defense - 0.17%
AAR Corp.* 7,429 $ 136,768
Apparel - 0.09%Warnaco Group, Inc.* 3,600 70,668
Auto Parts & Equipment - 2.28%Fuel Systems Solutions, Inc.*+ 57,700 1,890,252
Beverages - 0.55%Boston Beer Co., Inc.* 16,000 454,400
Biotechnology - 5.20%Life Technologies Corp.* 32,800 764,568OSI Pharmaceuticals, Inc.*+ 90,800 3,545,740
4,310,308
Chemicals - 2.32%Innophos Holdings, Inc. 47,700 944,937Lubrizol Corp. 6,000 218,340Quaker Chemical Corp. 46,200 759,990
1,923,267
Coal - 0.69%Penn Virginia GP Holdings
LP+ 57,200 567,996
Commercial Services - 5.20%Emergency Medical Services
Corp., Class A*+ 21,100 772,471FTI Consulting, Inc.*+ 6,065 270,984ICF International, Inc.* 33,000 810,810PAREXEL International Corp.* 51,200 497,152Strayer Education, Inc.+ 6,227 1,335,131Watson Wyatt Worldwide,
Inc., Class A 13,000 621,660
4,308,208
Computers - 5.59%Cognizant Technology
Solutions Corp., Class A* 72,880 1,316,213Integral Systems, Inc.* 118,800 1,431,540Manhattan Associates, Inc.* 89,490 1,414,837Sykes Enterprises, Inc.* 24,200 462,704
4,625,294
Distribution/Wholesale - 1.18%LKQ Corp.* 83,900 978,274
Electrical Components & Equipment - 1.53%EnerSys*+ 45,100 496,100GrafTech International, Ltd.* 92,322 768,119
1,264,219
Industry Company Shares Value
Electronics - 3.54%Axsys Technologies, Inc.* 53,500 $2,935,010
Engineering & Construction - 3.29%Layne Christensen Co.* 40,200 965,202VSE Corp. 44,900 1,761,427
2,726,629
Environmental Control - 1.95%Calgon Carbon Corp.* 105,300 1,617,408
Food - 1.11%Cal-Maine Foods, Inc.+ 31,920 916,104
Gas - 0.50%The Laclede Group, Inc. 8,800 412,192
Healthcare - Products - 8.03%CryoLife, Inc.* 131,763 1,279,419Gen-Probe, Inc.*+ 13,400 574,056Hologic, Inc.*+ 60,000 784,200Intuitive Surgical, Inc.*+ 4,200 533,358Qiagen NV*+ 77,256 1,356,615Thoratec Corp.*+ 65,300 2,121,597
6,649,245
Healthcare - Services - 3.80%Almost Family, Inc.*+ 66,800 3,004,664Life Sciences Research, Inc.* 15,386 144,628
3,149,292
Insurance - 2.42%Crawford & Co., Class B* 61,684 896,885Life Partners Holdings, Inc. 25,400 1,108,456
2,005,341
Internet - 5.92%eResearchTechnology, Inc.* 106,500 706,095Interwoven, Inc.* 181,300 2,284,380priceline.com, Inc.*+ 10,500 773,325TeleCommunication Systems,
Inc., Class A* 132,700 1,139,893
4,903,693
Machinery - Construction & Mining - 0.64%Bucyrus International, Inc.,
Class A+ 28,700 531,524
Machinery - Diversified - 2.40%Gardner Denver, Inc.* 37,300 870,582Westinghouse Air Brake
Technologies Corp.+ 28,200 1,120,950
1,991,532
74 Semi-Annual Report | December 31, 2008 (Unaudited)
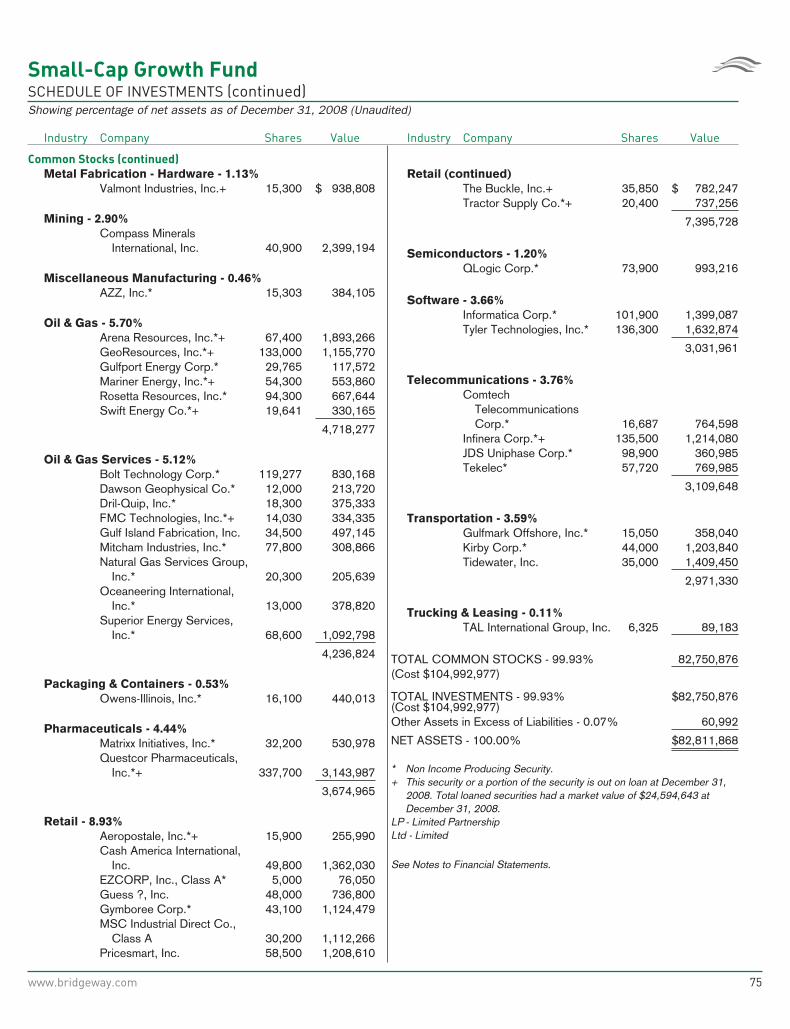
Small-Cap Growth FundSCHEDULE OF INVESTMENTS (continued)Showing percentage of net assets as of December 31, 2008 (Unaudited)
Industry Company Shares Value
Common Stocks (continued)
Metal Fabrication - Hardware - 1.13%Valmont Industries, Inc.+ 15,300 $ 938,808
Mining - 2.90%Compass Minerals
International, Inc. 40,900 2,399,194
Miscellaneous Manufacturing - 0.46%AZZ, Inc.* 15,303 384,105
Oil & Gas - 5.70%Arena Resources, Inc.*+ 67,400 1,893,266GeoResources, Inc.*+ 133,000 1,155,770Gulfport Energy Corp.* 29,765 117,572Mariner Energy, Inc.*+ 54,300 553,860Rosetta Resources, Inc.* 94,300 667,644Swift Energy Co.*+ 19,641 330,165
4,718,277
Oil & Gas Services - 5.12%Bolt Technology Corp.* 119,277 830,168Dawson Geophysical Co.* 12,000 213,720Dril-Quip, Inc.* 18,300 375,333FMC Technologies, Inc.*+ 14,030 334,335Gulf Island Fabrication, Inc. 34,500 497,145Mitcham Industries, Inc.* 77,800 308,866Natural Gas Services Group,
Inc.* 20,300 205,639Oceaneering International,
Inc.* 13,000 378,820Superior Energy Services,
Inc.* 68,600 1,092,798
4,236,824
Packaging & Containers - 0.53%Owens-Illinois, Inc.* 16,100 440,013
Pharmaceuticals - 4.44%Matrixx Initiatives, Inc.* 32,200 530,978Questcor Pharmaceuticals,
Inc.*+ 337,700 3,143,987
3,674,965
Retail - 8.93%Aeropostale, Inc.*+ 15,900 255,990Cash America International,
Inc. 49,800 1,362,030EZCORP, Inc., Class A* 5,000 76,050Guess ?, Inc. 48,000 736,800Gymboree Corp.* 43,100 1,124,479MSC Industrial Direct Co.,
Class A 30,200 1,112,266Pricesmart, Inc. 58,500 1,208,610
Industry Company Shares Value
Retail (continued)The Buckle, Inc.+ 35,850 $ 782,247Tractor Supply Co.*+ 20,400 737,256
7,395,728
Semiconductors - 1.20%QLogic Corp.* 73,900 993,216
Software - 3.66%Informatica Corp.* 101,900 1,399,087Tyler Technologies, Inc.* 136,300 1,632,874
3,031,961
Telecommunications - 3.76%Comtech
TelecommunicationsCorp.* 16,687 764,598
Infinera Corp.*+ 135,500 1,214,080JDS Uniphase Corp.* 98,900 360,985Tekelec* 57,720 769,985
3,109,648
Transportation - 3.59%Gulfmark Offshore, Inc.* 15,050 358,040Kirby Corp.* 44,000 1,203,840Tidewater, Inc. 35,000 1,409,450
2,971,330
Trucking & Leasing - 0.11%TAL International Group, Inc. 6,325 89,183
TOTAL COMMON STOCKS - 99.93% 82,750,876(Cost $104,992,977)
TOTAL INVESTMENTS - 99.93% $82,750,876(Cost $104,992,977)Other Assets in Excess of Liabilities - 0.07% 60,992
NET ASSETS - 100.00% $82,811,868
* Non Income Producing Security.+ This security or a portion of the security is out on loan at December 31,
2008. Total loaned securities had a market value of $24,594,643 atDecember 31, 2008.
LP - Limited PartnershipLtd - Limited
See Notes to Financial Statements.
www.bridgeway.com 75
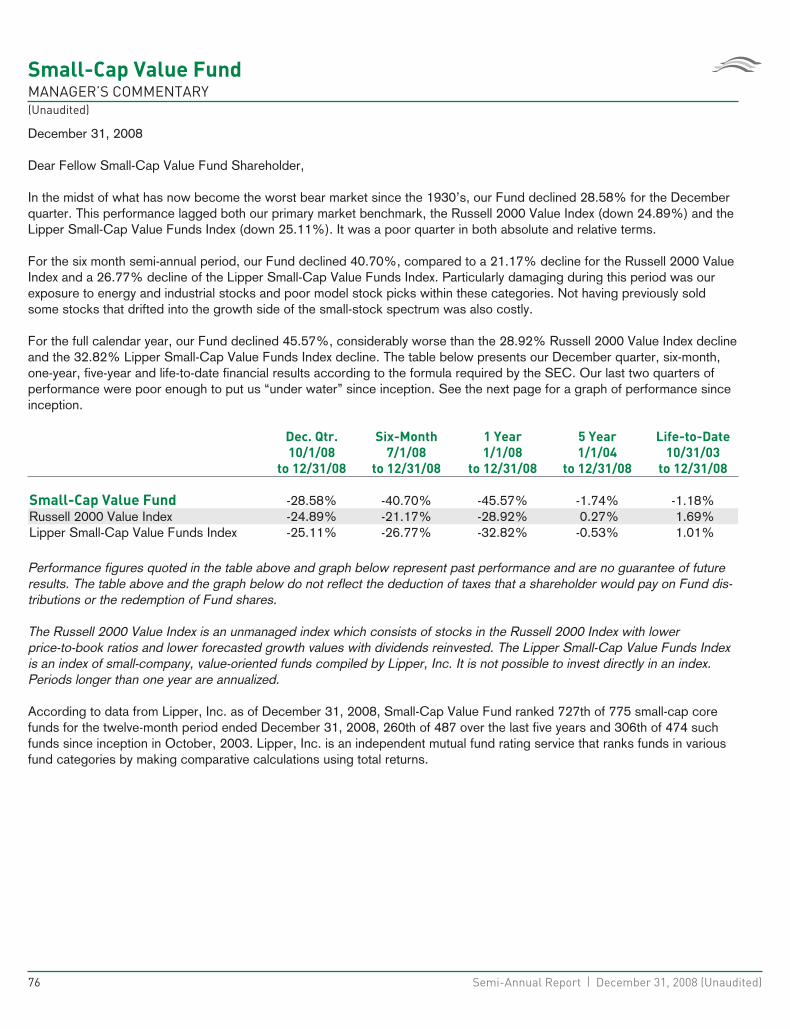
Small-Cap Value FundMANAGER’S COMMENTARY(Unaudited)
December 31, 2008
Dear Fellow Small-Cap Value Fund Shareholder,
In the midst of what has now become the worst bear market since the 1930’s, our Fund declined 28.58% for the Decemberquarter. This performance lagged both our primary market benchmark, the Russell 2000 Value Index (down 24.89%) and theLipper Small-Cap Value Funds Index (down 25.11%). It was a poor quarter in both absolute and relative terms.
For the six month semi-annual period, our Fund declined 40.70%, compared to a 21.17% decline for the Russell 2000 ValueIndex and a 26.77% decline of the Lipper Small-Cap Value Funds Index. Particularly damaging during this period was ourexposure to energy and industrial stocks and poor model stock picks within these categories. Not having previously soldsome stocks that drifted into the growth side of the small-stock spectrum was also costly.
For the full calendar year, our Fund declined 45.57%, considerably worse than the 28.92% Russell 2000 Value Index declineand the 32.82% Lipper Small-Cap Value Funds Index decline. The table below presents our December quarter, six-month,one-year, five-year and life-to-date financial results according to the formula required by the SEC. Our last two quarters ofperformance were poor enough to put us “under water” since inception. See the next page for a graph of performance sinceinception.
Dec. Qtr.
10/1/08
to 12/31/08
Six-Month
7/1/08
to 12/31/08
1 Year
1/1/08
to 12/31/08
5 Year
1/1/04
to 12/31/08
Life-to-Date
10/31/03
to 12/31/08
Small-Cap Value Fund -28.58% -40.70% -45.57% -1.74% -1.18%Russell 2000 Value Index -24.89% -21.17% -28.92% 0.27% 1.69%Lipper Small-Cap Value Funds Index -25.11% -26.77% -32.82% -0.53% 1.01%
Performance figures quoted in the table above and graph below represent past performance and are no guarantee of futureresults. The table above and the graph below do not reflect the deduction of taxes that a shareholder would pay on Fund dis-tributions or the redemption of Fund shares.
The Russell 2000 Value Index is an unmanaged index which consists of stocks in the Russell 2000 Index with lowerprice-to-book ratios and lower forecasted growth values with dividends reinvested. The Lipper Small-Cap Value Funds Indexis an index of small-company, value-oriented funds compiled by Lipper, Inc. It is not possible to invest directly in an index.Periods longer than one year are annualized.
According to data from Lipper, Inc. as of December 31, 2008, Small-Cap Value Fund ranked 727th of 775 small-cap corefunds for the twelve-month period ended December 31, 2008, 260th of 487 over the last five years and 306th of 474 suchfunds since inception in October, 2003. Lipper, Inc. is an independent mutual fund rating service that ranks funds in variousfund categories by making comparative calculations using total returns.
76 Semi-Annual Report | December 31, 2008 (Unaudited)
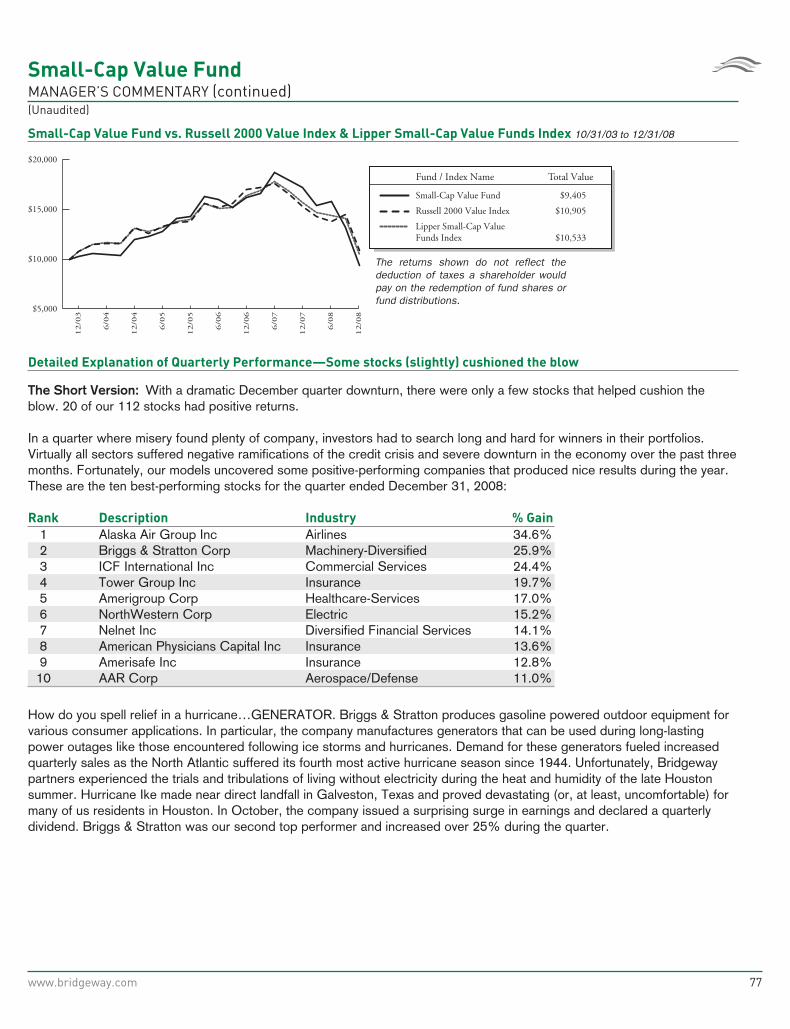
Small-Cap Value FundMANAGER’S COMMENTARY (continued)(Unaudited)
Small-Cap Value Fund vs. Russell 2000 Value Index & Lipper Small-Cap Value Funds Index 10/31/03 to 12/31/08
$5,000
$10,000
$20,000
$15,000
12/0
8
6/0
8
12/0
7
6/0
7
12/0
6
6/0
6
12/0
5
6/0
5
12/0
4
6/0
4
12/0
3
Fund / Index Name Total Value
The returns shown do not reflect the deduction of taxes a shareholder would pay on the redemption of fund shares or fund distributions.
Small-Cap Value Fund $9,405
Lipper Small-Cap ValueFunds Index $10,533
Russell 2000 Value Index $10,905
Detailed Explanation of Quarterly Performance—Some stocks (slightly) cushioned the blow
The Short Version: With a dramatic December quarter downturn, there were only a few stocks that helped cushion theblow. 20 of our 112 stocks had positive returns.
In a quarter where misery found plenty of company, investors had to search long and hard for winners in their portfolios.Virtually all sectors suffered negative ramifications of the credit crisis and severe downturn in the economy over the past threemonths. Fortunately, our models uncovered some positive-performing companies that produced nice results during the year.These are the ten best-performing stocks for the quarter ended December 31, 2008:
Rank Description Industry % Gain
1 Alaska Air Group Inc Airlines 34.6%2 Briggs & Stratton Corp Machinery-Diversified 25.9%3 ICF International Inc Commercial Services 24.4%4 Tower Group Inc Insurance 19.7%5 Amerigroup Corp Healthcare-Services 17.0%6 NorthWestern Corp Electric 15.2%7 Nelnet Inc Diversified Financial Services 14.1%8 American Physicians Capital Inc Insurance 13.6%9 Amerisafe Inc Insurance 12.8%
10 AAR Corp Aerospace/Defense 11.0%
How do you spell relief in a hurricane…GENERATOR. Briggs & Stratton produces gasoline powered outdoor equipment forvarious consumer applications. In particular, the company manufactures generators that can be used during long-lastingpower outages like those encountered following ice storms and hurricanes. Demand for these generators fueled increasedquarterly sales as the North Atlantic suffered its fourth most active hurricane season since 1944. Unfortunately, Bridgewaypartners experienced the trials and tribulations of living without electricity during the heat and humidity of the late Houstonsummer. Hurricane Ike made near direct landfall in Galveston, Texas and proved devastating (or, at least, uncomfortable) formany of us residents in Houston. In October, the company issued a surprising surge in earnings and declared a quarterlydividend. Briggs & Stratton was our second top performer and increased over 25% during the quarter.
www.bridgeway.com 77
Small-Cap Value FundMANAGER’S COMMENTARY (continued)(Unaudited)
Detailed Explanation of Quarterly Performance—What Didn’t Work
The Short Version: A very bad quarter in energy.
With oil prices plunging by $100/barrel since setting highs in July, any and all companies with ties to the energy sector suf-fered as well. Likewise, as the country moved deeper and deeper into recession, many consumers went into hibernation andfocused their budgets only on the absolute necessities of life. The list of ten worst performers for the quarter was made up ofsix oil and gas-related companies and four consumer cyclical stocks. Combined, these ten holdings cost the Fund over sevenpercent in return for the quarter.
These are the ten worst-performing stocks for the quarter ended December 31, 2008:
Rank Description Industry % Loss
1 Callon Petroleum Co Oil & Gas -85.6%2 Energy Partners Ltd Oil & Gas -84.4%3 Quiksilver Inc Apparel -67.9%4 ATP Oil & Gas Corp Oil & Gas -67.2%5 Federal Mogul Corp Auto Parts & Equipment -63.1%6 Rosetta Resources Inc Oil & Gas -61.4%7 Genesco Inc Retail -60.2%8 McMoRan Exploration Co Oil & Gas -58.5%9 Hornbeck Offshore Services Inc Oil & Gas Services -57.7%
10 Warnaco Group Inc Apparel -56.7%
The current recessionary times truly hindered sales and ongoing operations at virtually all of the nation’s (non-discount) retailstores. Quiksilver produces and markets outdoor apparel and equipment. Like most of its retail counterparts, it suffered fromthe downturn in the economy and resorted to significant price markdowns simply to move inventory. In November, the com-pany sold its Rossignol unit, a business that had been losing money and bleeding cash for most of the year. While the trans-action was initially considered good news for shareholders, the sales price had been reduced and the company was unableto retire certain debt as anticipated. Moody’s Investors Services downgraded Quiksilver following the deal, citing liquidityconcerns. This holding cost the Fund a half percent in return for the three-month period.
Detailed Explanation of Calendar Year Performance—Companies With Positive Returns
The Short Version: Only twenty-eight of the 185 companies we held during the calendar year had positive returns.
With all ten S&P sectors recording sizable market losses in 2008, investors had few places to turn for relief from the equitymarket carnage. Diversification turned out to be the key for what limited success the Fund experienced, as six differentsectors were represented in the best performer list for the calendar year. The top six performers each returned greater than25% in 2008 and combined to contribute just under two percent to Fund return. These are the ten best performers for thecalendar year ended December 31, 2008:
Rank Description Industry % Gain
1 Superior Essex Inc Electrical Components &Equipment 59.7%
2 Ezcorp Inc Retail 34.7%3 Alaska Air Group Inc Airlines 34.6%4 Rock-Tenn Co Packaging & Containers 34.5%5 Amerisafe Inc Insurance 28.2%6 Briggs & Stratton Corp Machinery-Diversified 25.9%7 Zep Inc Chemicals 19.8%8 Healthspring Inc Healthcare-Services 18.6%9 American Physicians Capital Inc Insurance 16.0%
10 Laclede Group Inc Gas 15.6%
78 Semi-Annual Report | December 31, 2008 (Unaudited)
Small-Cap Value FundMANAGER’S COMMENTARY (continued)(Unaudited)
While most retailers struggled through a horrid holiday season, pawn shops like Ezcorp actually reaped the benefits of thedownturn in the economy. During the summer months, many consumers took those government stimulus checks straight totheir local pawn shops for deals on jewelry, sporting goods, electronics, and other products. In July, the company reportedthat operating income surged almost 50%, and it also experienced a nice increase in its highly profitable lending activity. InSeptember, Ezcorp entered into an agreement to acquire Value Financial Services, a deal which had practically fallen apart inthe previous month. The company continued its growth mode late in the year by buying the assets of eleven pawn shopsthroughout Nevada. The holding contributed about a half a percent to the return of the Fund during 2008.
Detailed Explanation of Calendar Year Performance—What Didn’t Work
The Short Version: As goes the December quarter, so goes the year.
During the last six months of the year, oil prices plunged from $146 to a low of $31/barrel in December. Needless to say,most energy companies experienced significant setbacks during this timeframe. Five oil and gas-related holdings made ourlist of worst performers for the year and combined to cost the Fund about three and a half percent in return in 2008.32 holdings fell 50% or more during the year. These are the ten stocks that performed the worst in the calendar year endedDecember 31, 2008:
Rank Description Industry % Gain
1 Callon Petroleum Co Oil & Gas -90.4%2 Energy Partners Ltd Oil & Gas -88.7%3 Quiksilver Inc Apparel -81.7%4 ATP Oil & Gas Corp Oil & Gas -79.3%5 Capstone Turbine Corp Electrical Components &
Equipment -77.6%6 Rosetta Resources Inc Oil & Gas -74.0%7 Swift Energy Co Oil & Gas -72.4%8 General Cable Corp Electrical Components &
Equipment -72.0%9 Federal Mogul Corp Auto Parts & Equipment -70.7%
10 Steel Dynamics Inc Iron/Steel -69.1%
Callon Petroleum is an exploration and development company, primarily operating along the Louisiana Gulf Coast. WithHurricanes Gustav and Ike wreaking havoc on oil and gas platforms in September, Callon suffered from production slow-downs and work stoppages. By November, the company decided to cease development of its Entrada deepwater field whileplunging energy prices severely dampened any positive economic reasons for continuation of this project. Jefferies and Co.slashed its ratings on Callon to “underperform,” stating that the company had “few growth prospects apart from Entrada.”The stock price fell to a 14-year low, and the position cost the Fund just under a percent in return for the twelve-monthperiod.
www.bridgeway.com 79
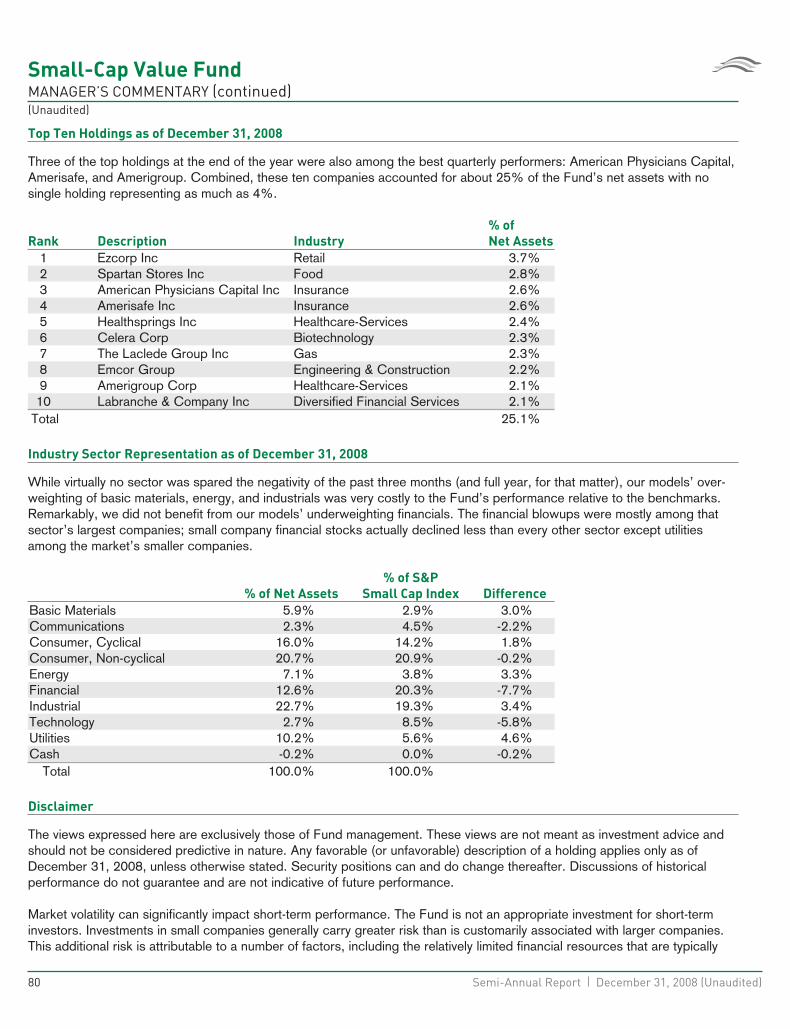
Small-Cap Value FundMANAGER’S COMMENTARY (continued)(Unaudited)
Top Ten Holdings as of December 31, 2008
Three of the top holdings at the end of the year were also among the best quarterly performers: American Physicians Capital,Amerisafe, and Amerigroup. Combined, these ten companies accounted for about 25% of the Fund’s net assets with nosingle holding representing as much as 4%.
Rank Description Industry
% of
Net Assets
1 Ezcorp Inc Retail 3.7%2 Spartan Stores Inc Food 2.8%3 American Physicians Capital Inc Insurance 2.6%4 Amerisafe Inc Insurance 2.6%5 Healthsprings Inc Healthcare-Services 2.4%6 Celera Corp Biotechnology 2.3%7 The Laclede Group Inc Gas 2.3%8 Emcor Group Engineering & Construction 2.2%9 Amerigroup Corp Healthcare-Services 2.1%
10 Labranche & Company Inc Diversified Financial Services 2.1%Total 25.1%
Industry Sector Representation as of December 31, 2008
While virtually no sector was spared the negativity of the past three months (and full year, for that matter), our models’ over-weighting of basic materials, energy, and industrials was very costly to the Fund’s performance relative to the benchmarks.Remarkably, we did not benefit from our models’ underweighting financials. The financial blowups were mostly among thatsector’s largest companies; small company financial stocks actually declined less than every other sector except utilitiesamong the market’s smaller companies.
% of Net Assets
% of S&P
Small Cap Index Difference
Basic Materials 5.9% 2.9% 3.0%Communications 2.3% 4.5% -2.2%Consumer, Cyclical 16.0% 14.2% 1.8%Consumer, Non-cyclical 20.7% 20.9% -0.2%Energy 7.1% 3.8% 3.3%Financial 12.6% 20.3% -7.7%Industrial 22.7% 19.3% 3.4%Technology 2.7% 8.5% -5.8%Utilities 10.2% 5.6% 4.6%Cash -0.2% 0.0% -0.2%
Total 100.0% 100.0%
Disclaimer
The views expressed here are exclusively those of Fund management. These views are not meant as investment advice andshould not be considered predictive in nature. Any favorable (or unfavorable) description of a holding applies only as ofDecember 31, 2008, unless otherwise stated. Security positions can and do change thereafter. Discussions of historicalperformance do not guarantee and are not indicative of future performance.
Market volatility can significantly impact short-term performance. The Fund is not an appropriate investment for short-terminvestors. Investments in small companies generally carry greater risk than is customarily associated with larger companies.This additional risk is attributable to a number of factors, including the relatively limited financial resources that are typically
80 Semi-Annual Report | December 31, 2008 (Unaudited)
Small-Cap Value FundMANAGER’S COMMENTARY (continued)(Unaudited)
available to small companies, and the fact that small companies often have comparatively limited product lines. In addition, thestock of small companies tends to be more volatile than the stock of large companies, particularly in the short term andparticularly in the early stages of an economic or market downturn. Shareholders of the Fund, therefore, are taking on morerisk than they would if they invested in the stock market as a whole.
Conclusion
Thank you for your continued investment in Small-Cap Value Fund. We encourage your feedback; your reactions andconcerns are important to us.
Sincerely,
Your Investment Management Team
www.bridgeway.com 81
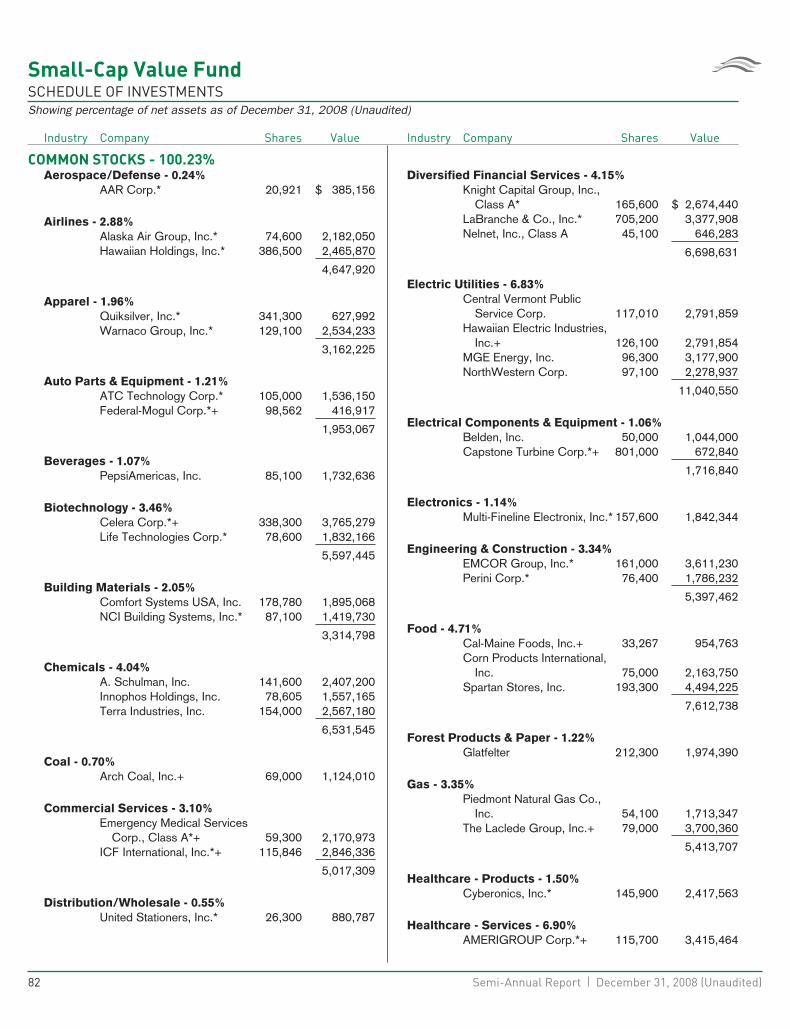
Small-Cap Value FundSCHEDULE OF INVESTMENTSShowing percentage of net assets as of December 31, 2008 (Unaudited)
Industry Company Shares Value
COMMON STOCKS - 100.23%Aerospace/Defense - 0.24%
AAR Corp.* 20,921 $ 385,156
Airlines - 2.88%Alaska Air Group, Inc.* 74,600 2,182,050Hawaiian Holdings, Inc.* 386,500 2,465,870
4,647,920
Apparel - 1.96%Quiksilver, Inc.* 341,300 627,992Warnaco Group, Inc.* 129,100 2,534,233
3,162,225
Auto Parts & Equipment - 1.21%ATC Technology Corp.* 105,000 1,536,150Federal-Mogul Corp.*+ 98,562 416,917
1,953,067
Beverages - 1.07%PepsiAmericas, Inc. 85,100 1,732,636
Biotechnology - 3.46%Celera Corp.*+ 338,300 3,765,279Life Technologies Corp.* 78,600 1,832,166
5,597,445
Building Materials - 2.05%Comfort Systems USA, Inc. 178,780 1,895,068NCI Building Systems, Inc.* 87,100 1,419,730
3,314,798
Chemicals - 4.04%A. Schulman, Inc. 141,600 2,407,200Innophos Holdings, Inc. 78,605 1,557,165Terra Industries, Inc. 154,000 2,567,180
6,531,545
Coal - 0.70%Arch Coal, Inc.+ 69,000 1,124,010
Commercial Services - 3.10%Emergency Medical Services
Corp., Class A*+ 59,300 2,170,973ICF International, Inc.*+ 115,846 2,846,336
5,017,309
Distribution/Wholesale - 0.55%United Stationers, Inc.* 26,300 880,787
Industry Company Shares Value
Diversified Financial Services - 4.15%Knight Capital Group, Inc.,
Class A* 165,600 $ 2,674,440LaBranche & Co., Inc.* 705,200 3,377,908Nelnet, Inc., Class A 45,100 646,283
6,698,631
Electric Utilities - 6.83%Central Vermont Public
Service Corp. 117,010 2,791,859Hawaiian Electric Industries,
Inc.+ 126,100 2,791,854MGE Energy, Inc. 96,300 3,177,900NorthWestern Corp. 97,100 2,278,937
11,040,550
Electrical Components & Equipment - 1.06%Belden, Inc. 50,000 1,044,000Capstone Turbine Corp.*+ 801,000 672,840
1,716,840
Electronics - 1.14%Multi-Fineline Electronix, Inc.* 157,600 1,842,344
Engineering & Construction - 3.34%EMCOR Group, Inc.* 161,000 3,611,230Perini Corp.* 76,400 1,786,232
5,397,462
Food - 4.71%Cal-Maine Foods, Inc.+ 33,267 954,763Corn Products International,
Inc. 75,000 2,163,750Spartan Stores, Inc. 193,300 4,494,225
7,612,738
Forest Products & Paper - 1.22%Glatfelter 212,300 1,974,390
Gas - 3.35%Piedmont Natural Gas Co.,
Inc. 54,100 1,713,347The Laclede Group, Inc.+ 79,000 3,700,360
5,413,707
Healthcare - Products - 1.50%Cyberonics, Inc.* 145,900 2,417,563
Healthcare - Services - 6.90%AMERIGROUP Corp.*+ 115,700 3,415,464
82 Semi-Annual Report | December 31, 2008 (Unaudited)
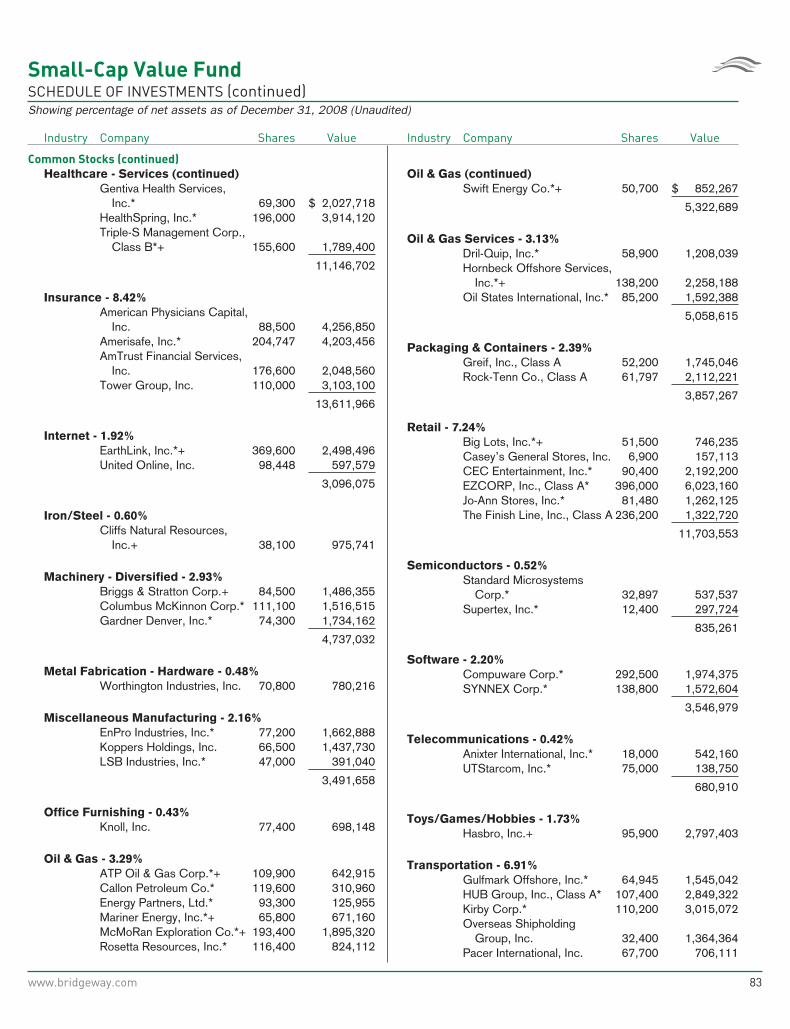
Small-Cap Value FundSCHEDULE OF INVESTMENTS (continued)Showing percentage of net assets as of December 31, 2008 (Unaudited)
Industry Company Shares Value
Common Stocks (continued)
Healthcare - Services (continued)Gentiva Health Services,
Inc.* 69,300 $ 2,027,718HealthSpring, Inc.* 196,000 3,914,120Triple-S Management Corp.,
Class B*+ 155,600 1,789,400
11,146,702
Insurance - 8.42%American Physicians Capital,
Inc. 88,500 4,256,850Amerisafe, Inc.* 204,747 4,203,456AmTrust Financial Services,
Inc. 176,600 2,048,560Tower Group, Inc. 110,000 3,103,100
13,611,966
Internet - 1.92%EarthLink, Inc.*+ 369,600 2,498,496United Online, Inc. 98,448 597,579
3,096,075
Iron/Steel - 0.60%Cliffs Natural Resources,
Inc.+ 38,100 975,741
Machinery - Diversified - 2.93%Briggs & Stratton Corp.+ 84,500 1,486,355Columbus McKinnon Corp.* 111,100 1,516,515Gardner Denver, Inc.* 74,300 1,734,162
4,737,032
Metal Fabrication - Hardware - 0.48%Worthington Industries, Inc. 70,800 780,216
Miscellaneous Manufacturing - 2.16%EnPro Industries, Inc.* 77,200 1,662,888Koppers Holdings, Inc. 66,500 1,437,730LSB Industries, Inc.* 47,000 391,040
3,491,658
Office Furnishing - 0.43%Knoll, Inc. 77,400 698,148
Oil & Gas - 3.29%ATP Oil & Gas Corp.*+ 109,900 642,915Callon Petroleum Co.* 119,600 310,960Energy Partners, Ltd.* 93,300 125,955Mariner Energy, Inc.*+ 65,800 671,160McMoRan Exploration Co.*+ 193,400 1,895,320Rosetta Resources, Inc.* 116,400 824,112
Industry Company Shares Value
Oil & Gas (continued)Swift Energy Co.*+ 50,700 $ 852,267
5,322,689
Oil & Gas Services - 3.13%Dril-Quip, Inc.* 58,900 1,208,039Hornbeck Offshore Services,
Inc.*+ 138,200 2,258,188Oil States International, Inc.* 85,200 1,592,388
5,058,615
Packaging & Containers - 2.39%Greif, Inc., Class A 52,200 1,745,046Rock-Tenn Co., Class A 61,797 2,112,221
3,857,267
Retail - 7.24%Big Lots, Inc.*+ 51,500 746,235Casey’s General Stores, Inc. 6,900 157,113CEC Entertainment, Inc.* 90,400 2,192,200EZCORP, Inc., Class A* 396,000 6,023,160Jo-Ann Stores, Inc.* 81,480 1,262,125The Finish Line, Inc., Class A 236,200 1,322,720
11,703,553
Semiconductors - 0.52%Standard Microsystems
Corp.* 32,897 537,537Supertex, Inc.* 12,400 297,724
835,261
Software - 2.20%Compuware Corp.* 292,500 1,974,375SYNNEX Corp.* 138,800 1,572,604
3,546,979
Telecommunications - 0.42%Anixter International, Inc.* 18,000 542,160UTStarcom, Inc.* 75,000 138,750
680,910
Toys/Games/Hobbies - 1.73%Hasbro, Inc.+ 95,900 2,797,403
Transportation - 6.91%Gulfmark Offshore, Inc.* 64,945 1,545,042HUB Group, Inc., Class A* 107,400 2,849,322Kirby Corp.* 110,200 3,015,072Overseas Shipholding
Group, Inc. 32,400 1,364,364Pacer International, Inc. 67,700 706,111
www.bridgeway.com 83
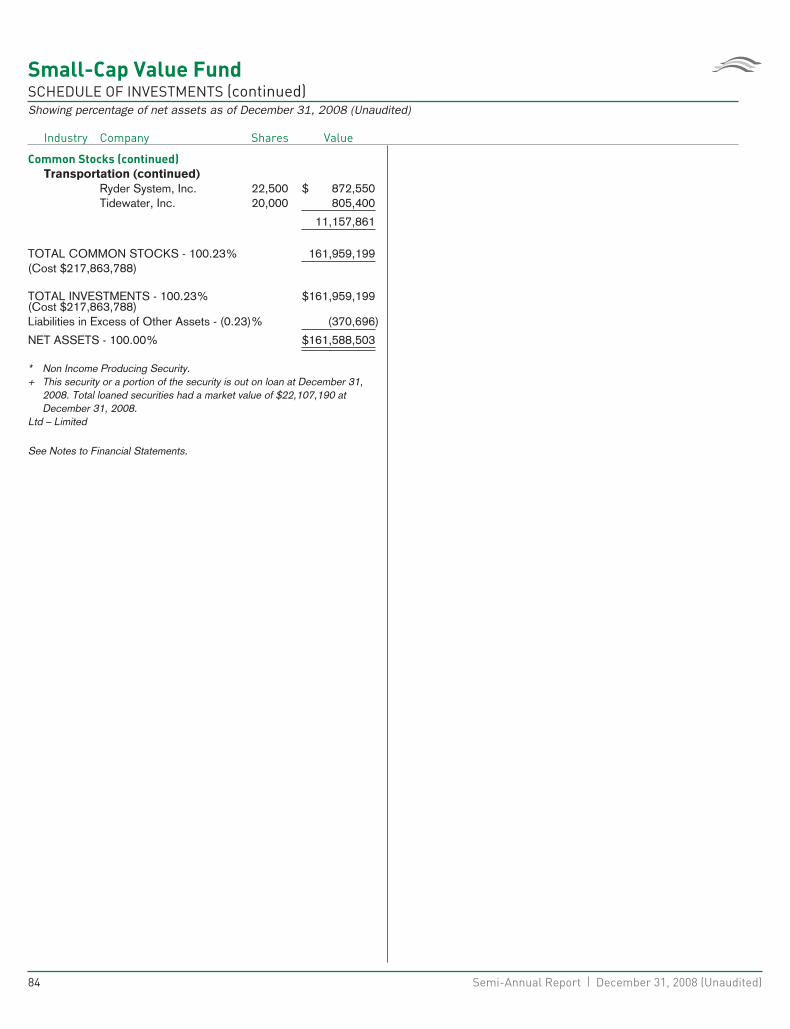
Small-Cap Value FundSCHEDULE OF INVESTMENTS (continued)Showing percentage of net assets as of December 31, 2008 (Unaudited)
Industry Company Shares Value
Common Stocks (continued)
Transportation (continued)Ryder System, Inc. 22,500 $ 872,550Tidewater, Inc. 20,000 805,400
11,157,861
TOTAL COMMON STOCKS - 100.23% 161,959,199(Cost $217,863,788)
TOTAL INVESTMENTS - 100.23% $161,959,199(Cost $217,863,788)Liabilities in Excess of Other Assets - (0.23)% (370,696)
NET ASSETS - 100.00% $161,588,503
* Non Income Producing Security.+ This security or a portion of the security is out on loan at December 31,
2008. Total loaned securities had a market value of $22,107,190 atDecember 31, 2008.
Ltd – Limited
See Notes to Financial Statements.
84 Semi-Annual Report | December 31, 2008 (Unaudited)

THIS PAGE INTENTIONALLY LEFT BLANK
www.bridgeway.com 85
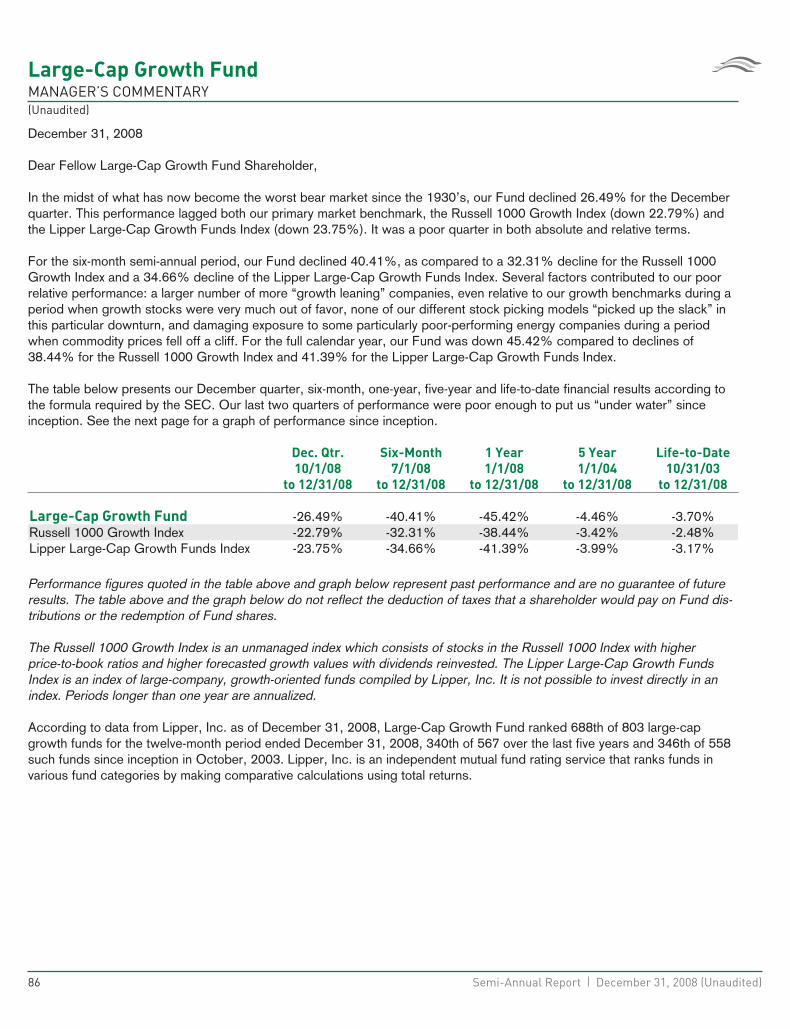
Large-Cap Growth FundMANAGER’S COMMENTARY(Unaudited)
December 31, 2008
Dear Fellow Large-Cap Growth Fund Shareholder,
In the midst of what has now become the worst bear market since the 1930’s, our Fund declined 26.49% for the Decemberquarter. This performance lagged both our primary market benchmark, the Russell 1000 Growth Index (down 22.79%) andthe Lipper Large-Cap Growth Funds Index (down 23.75%). It was a poor quarter in both absolute and relative terms.
For the six-month semi-annual period, our Fund declined 40.41%, as compared to a 32.31% decline for the Russell 1000Growth Index and a 34.66% decline of the Lipper Large-Cap Growth Funds Index. Several factors contributed to our poorrelative performance: a larger number of more “growth leaning” companies, even relative to our growth benchmarks during aperiod when growth stocks were very much out of favor, none of our different stock picking models “picked up the slack” inthis particular downturn, and damaging exposure to some particularly poor-performing energy companies during a periodwhen commodity prices fell off a cliff. For the full calendar year, our Fund was down 45.42% compared to declines of38.44% for the Russell 1000 Growth Index and 41.39% for the Lipper Large-Cap Growth Funds Index.
The table below presents our December quarter, six-month, one-year, five-year and life-to-date financial results according tothe formula required by the SEC. Our last two quarters of performance were poor enough to put us “under water” sinceinception. See the next page for a graph of performance since inception.
Dec. Qtr.
10/1/08
to 12/31/08
Six-Month
7/1/08
to 12/31/08
1 Year
1/1/08
to 12/31/08
5 Year
1/1/04
to 12/31/08
Life-to-Date
10/31/03
to 12/31/08
Large-Cap Growth Fund -26.49% -40.41% -45.42% -4.46% -3.70%Russell 1000 Growth Index -22.79% -32.31% -38.44% -3.42% -2.48%Lipper Large-Cap Growth Funds Index -23.75% -34.66% -41.39% -3.99% -3.17%
Performance figures quoted in the table above and graph below represent past performance and are no guarantee of futureresults. The table above and the graph below do not reflect the deduction of taxes that a shareholder would pay on Fund dis-tributions or the redemption of Fund shares.
The Russell 1000 Growth Index is an unmanaged index which consists of stocks in the Russell 1000 Index with higherprice-to-book ratios and higher forecasted growth values with dividends reinvested. The Lipper Large-Cap Growth FundsIndex is an index of large-company, growth-oriented funds compiled by Lipper, Inc. It is not possible to invest directly in anindex. Periods longer than one year are annualized.
According to data from Lipper, Inc. as of December 31, 2008, Large-Cap Growth Fund ranked 688th of 803 large-capgrowth funds for the twelve-month period ended December 31, 2008, 340th of 567 over the last five years and 346th of 558such funds since inception in October, 2003. Lipper, Inc. is an independent mutual fund rating service that ranks funds invarious fund categories by making comparative calculations using total returns.
86 Semi-Annual Report | December 31, 2008 (Unaudited)
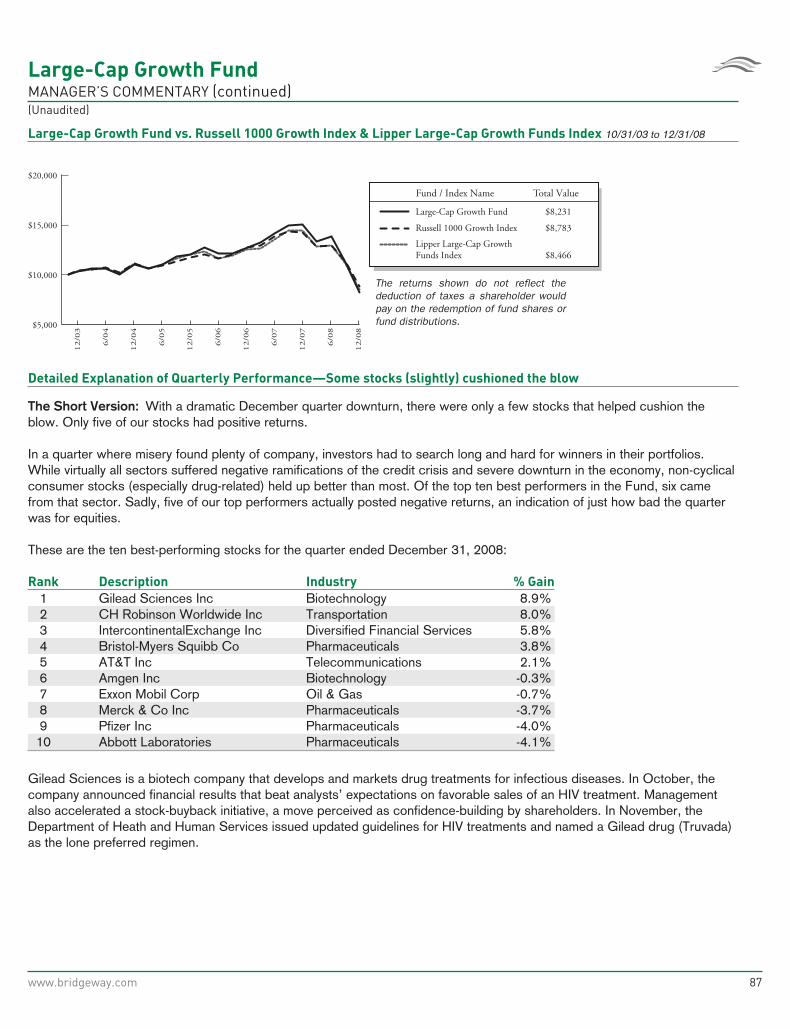
Large-Cap Growth FundMANAGER’S COMMENTARY (continued)(Unaudited)
Large-Cap Growth Fund vs. Russell 1000 Growth Index & Lipper Large-Cap Growth Funds Index 10/31/03 to 12/31/08
Fund / Index Name
The returns shown do not reflect the deduction of taxes a shareholder would pay on the redemption of fund shares or fund distributions.
Large-Cap Growth Fund
Lipper Large-Cap GrowthFunds Index
Russell 1000 Growth Index
Total Value
$8,231
$8,783
$8,466
12
/03
6/0
4
12
/04
6/0
5
12
/05
6/0
6
12
/06
6/0
7
12
/07
12
/08
6/0
8$5,000
$10,000
$15,000
$20,000
Detailed Explanation of Quarterly Performance—Some stocks (slightly) cushioned the blow
The Short Version: With a dramatic December quarter downturn, there were only a few stocks that helped cushion theblow. Only five of our stocks had positive returns.
In a quarter where misery found plenty of company, investors had to search long and hard for winners in their portfolios.While virtually all sectors suffered negative ramifications of the credit crisis and severe downturn in the economy, non-cyclicalconsumer stocks (especially drug-related) held up better than most. Of the top ten best performers in the Fund, six camefrom that sector. Sadly, five of our top performers actually posted negative returns, an indication of just how bad the quarterwas for equities.
These are the ten best-performing stocks for the quarter ended December 31, 2008:
Rank Description Industry % Gain
1 Gilead Sciences Inc Biotechnology 8.9%2 CH Robinson Worldwide Inc Transportation 8.0%3 IntercontinentalExchange Inc Diversified Financial Services 5.8%4 Bristol-Myers Squibb Co Pharmaceuticals 3.8%5 AT&T Inc Telecommunications 2.1%6 Amgen Inc Biotechnology -0.3%7 Exxon Mobil Corp Oil & Gas -0.7%8 Merck & Co Inc Pharmaceuticals -3.7%9 Pfizer Inc Pharmaceuticals -4.0%
10 Abbott Laboratories Pharmaceuticals -4.1%
Gilead Sciences is a biotech company that develops and markets drug treatments for infectious diseases. In October, thecompany announced financial results that beat analysts’ expectations on favorable sales of an HIV treatment. Managementalso accelerated a stock-buyback initiative, a move perceived as confidence-building by shareholders. In November, theDepartment of Heath and Human Services issued updated guidelines for HIV treatments and named a Gilead drug (Truvada)as the lone preferred regimen.
www.bridgeway.com 87
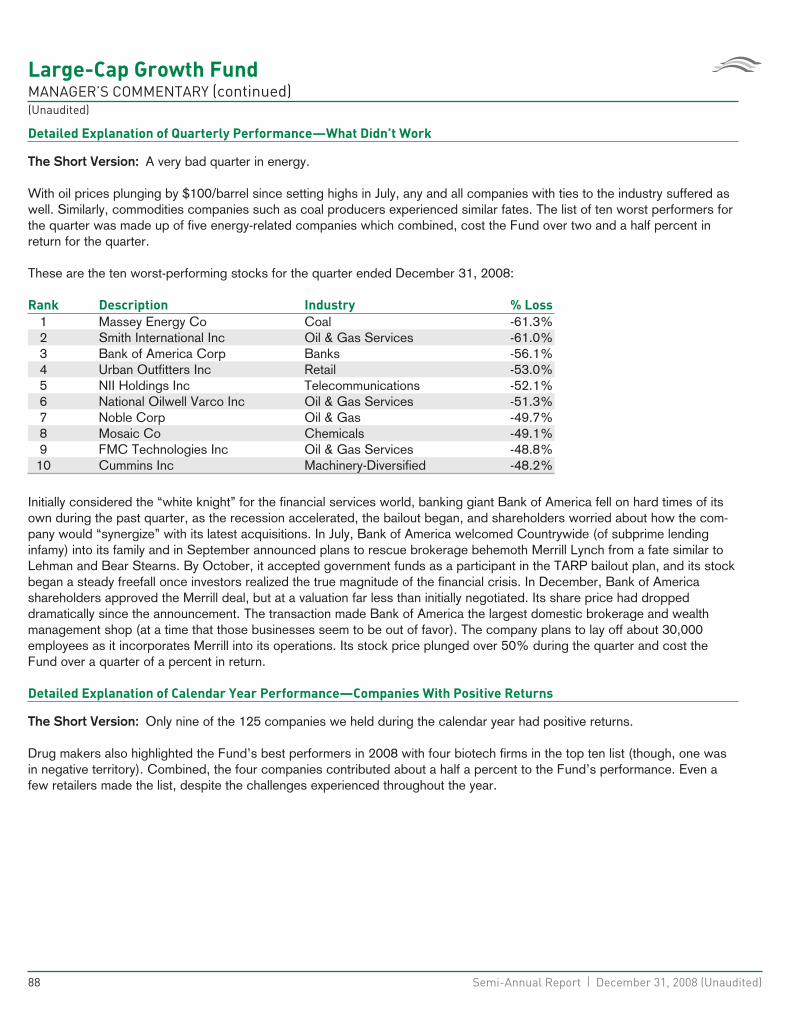
Large-Cap Growth FundMANAGER’S COMMENTARY (continued)(Unaudited)
Detailed Explanation of Quarterly Performance—What Didn’t Work
The Short Version: A very bad quarter in energy.
With oil prices plunging by $100/barrel since setting highs in July, any and all companies with ties to the industry suffered aswell. Similarly, commodities companies such as coal producers experienced similar fates. The list of ten worst performers forthe quarter was made up of five energy-related companies which combined, cost the Fund over two and a half percent inreturn for the quarter.
These are the ten worst-performing stocks for the quarter ended December 31, 2008:
Rank Description Industry % Loss
1 Massey Energy Co Coal -61.3%2 Smith International Inc Oil & Gas Services -61.0%3 Bank of America Corp Banks -56.1%4 Urban Outfitters Inc Retail -53.0%5 NII Holdings Inc Telecommunications -52.1%6 National Oilwell Varco Inc Oil & Gas Services -51.3%7 Noble Corp Oil & Gas -49.7%8 Mosaic Co Chemicals -49.1%9 FMC Technologies Inc Oil & Gas Services -48.8%
10 Cummins Inc Machinery-Diversified -48.2%
Initially considered the “white knight” for the financial services world, banking giant Bank of America fell on hard times of itsown during the past quarter, as the recession accelerated, the bailout began, and shareholders worried about how the com-pany would “synergize” with its latest acquisitions. In July, Bank of America welcomed Countrywide (of subprime lendinginfamy) into its family and in September announced plans to rescue brokerage behemoth Merrill Lynch from a fate similar toLehman and Bear Stearns. By October, it accepted government funds as a participant in the TARP bailout plan, and its stockbegan a steady freefall once investors realized the true magnitude of the financial crisis. In December, Bank of Americashareholders approved the Merrill deal, but at a valuation far less than initially negotiated. Its share price had droppeddramatically since the announcement. The transaction made Bank of America the largest domestic brokerage and wealthmanagement shop (at a time that those businesses seem to be out of favor). The company plans to lay off about 30,000employees as it incorporates Merrill into its operations. Its stock price plunged over 50% during the quarter and cost theFund over a quarter of a percent in return.
Detailed Explanation of Calendar Year Performance—Companies With Positive Returns
The Short Version: Only nine of the 125 companies we held during the calendar year had positive returns.
Drug makers also highlighted the Fund’s best performers in 2008 with four biotech firms in the top ten list (though, one wasin negative territory). Combined, the four companies contributed about a half a percent to the Fund’s performance. Even afew retailers made the list, despite the challenges experienced throughout the year.
88 Semi-Annual Report | December 31, 2008 (Unaudited)
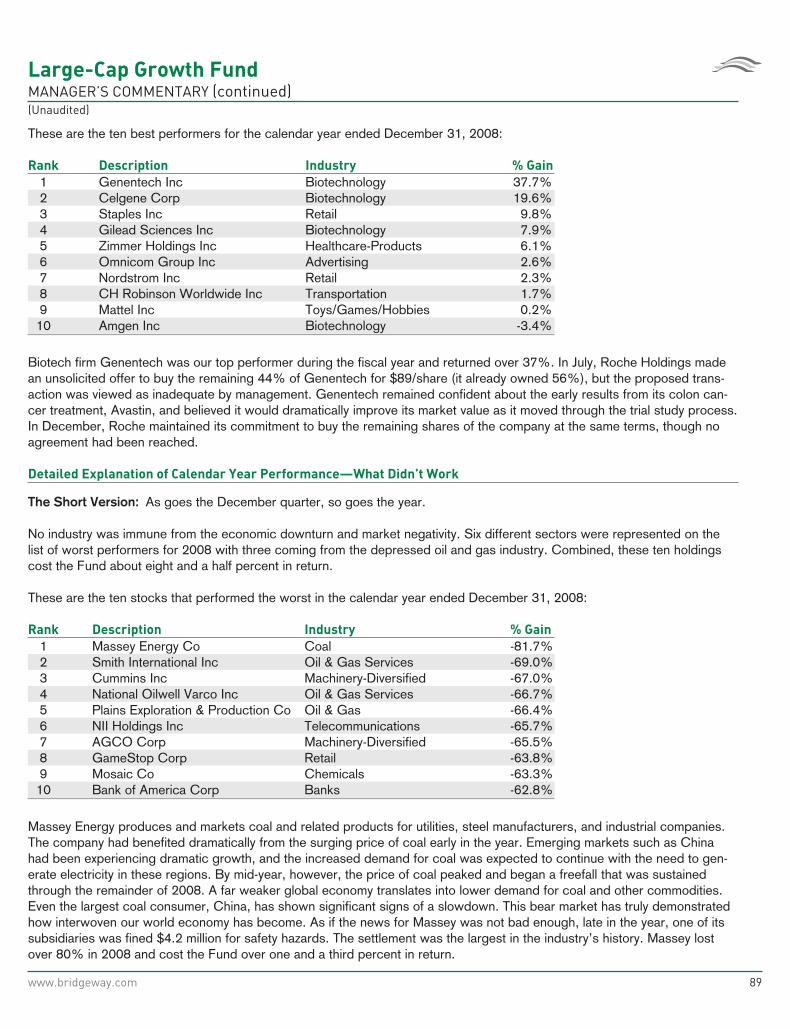
Large-Cap Growth FundMANAGER’S COMMENTARY (continued)(Unaudited)
These are the ten best performers for the calendar year ended December 31, 2008:
Rank Description Industry % Gain
1 Genentech Inc Biotechnology 37.7%2 Celgene Corp Biotechnology 19.6%3 Staples Inc Retail 9.8%4 Gilead Sciences Inc Biotechnology 7.9%5 Zimmer Holdings Inc Healthcare-Products 6.1%6 Omnicom Group Inc Advertising 2.6%7 Nordstrom Inc Retail 2.3%8 CH Robinson Worldwide Inc Transportation 1.7%9 Mattel Inc Toys/Games/Hobbies 0.2%
10 Amgen Inc Biotechnology -3.4%
Biotech firm Genentech was our top performer during the fiscal year and returned over 37%. In July, Roche Holdings madean unsolicited offer to buy the remaining 44% of Genentech for $89/share (it already owned 56%), but the proposed trans-action was viewed as inadequate by management. Genentech remained confident about the early results from its colon can-cer treatment, Avastin, and believed it would dramatically improve its market value as it moved through the trial study process.In December, Roche maintained its commitment to buy the remaining shares of the company at the same terms, though noagreement had been reached.
Detailed Explanation of Calendar Year Performance—What Didn’t Work
The Short Version: As goes the December quarter, so goes the year.
No industry was immune from the economic downturn and market negativity. Six different sectors were represented on thelist of worst performers for 2008 with three coming from the depressed oil and gas industry. Combined, these ten holdingscost the Fund about eight and a half percent in return.
These are the ten stocks that performed the worst in the calendar year ended December 31, 2008:
Rank Description Industry % Gain
1 Massey Energy Co Coal -81.7%2 Smith International Inc Oil & Gas Services -69.0%3 Cummins Inc Machinery-Diversified -67.0%4 National Oilwell Varco Inc Oil & Gas Services -66.7%5 Plains Exploration & Production Co Oil & Gas -66.4%6 NII Holdings Inc Telecommunications -65.7%7 AGCO Corp Machinery-Diversified -65.5%8 GameStop Corp Retail -63.8%9 Mosaic Co Chemicals -63.3%
10 Bank of America Corp Banks -62.8%
Massey Energy produces and markets coal and related products for utilities, steel manufacturers, and industrial companies.The company had benefited dramatically from the surging price of coal early in the year. Emerging markets such as Chinahad been experiencing dramatic growth, and the increased demand for coal was expected to continue with the need to gen-erate electricity in these regions. By mid-year, however, the price of coal peaked and began a freefall that was sustainedthrough the remainder of 2008. A far weaker global economy translates into lower demand for coal and other commodities.Even the largest coal consumer, China, has shown significant signs of a slowdown. This bear market has truly demonstratedhow interwoven our world economy has become. As if the news for Massey was not bad enough, late in the year, one of itssubsidiaries was fined $4.2 million for safety hazards. The settlement was the largest in the industry’s history. Massey lostover 80% in 2008 and cost the Fund over one and a third percent in return.
www.bridgeway.com 89

Large-Cap Growth FundMANAGER’S COMMENTARY (continued)(Unaudited)
Top Ten Holdings as of December 31, 2008
Drug-related companies were well represented among our top ten holdings with two biotech and two pharmaceutical compa-nies making the list. Two of the Fund’s best performers of the quarter were also among its top holdings (AT&T and GileadSciences). No one holding accounted for greater than 3.1% of the net assets, indicating that the Fund was well-diversifiedacross many companies in this difficult environment for stocks. Similarly, the ten largest positions represented under 30% ofthe total assets of the Fund.
Rank Description Industry
Percent of
Net Assets
1 AT&T Inc Telecommunications 3.1%2 Oracle Corp Software 3.1%3 Gilead Sciences Inc Biotechnology 2.9%4 Biogen Idec Inc Biotechnology 2.7%5 Hewlett-Packard Co Computers 2.7%6 International Business
Machines Corp Computers 2.6%7 Schering Plough Corp Pharmaceuticals 2.6%8 Express Scripts Inc Pharmaceuticals 2.5%9 Apple Inc Computers 2.5%
10 Cisco Systems Inc Telecommunications 2.5%Total 27.2%
Industry Sector Representation as of December 31, 2008
While virtually no sector was spared the negativity of the past three months (and full year), our models’ overweighting of basicmaterials was very costly to the Fund’s performance relative to the benchmarks. This sector included commodities-relatedstocks, many of which had been solid performers in the past, but plunged in value as the weak global economy hindereddemand for such products. We did benefit from our significant underweighting of financials, the sector that initiated thedownturn and remained depressed throughout the year.
% of Net Assets % of S&P 500 Index Difference
Basic Materials 8.9% 3.0% 5.9%Communications 14.0% 10.9% 3.1%Consumer, Cyclical 2.4% 8.2% -5.8%Consumer, Non-cyclical 32.3% 25.2% 7.1%Energy 14.7% 13.5% 1.2%Financial 2.0% 13.0% -11.0%Industrial 8.6% 11.2% -2.6%Technology 16.1% 10.9% 5.2%Utilities 1.0% 4.1% -3.1%Diversified 0.0% 0.0% 0.0%Cash 0.0% 0.0% 0.0%
Total 100.0% 100.0%
Disclaimer
The views expressed here are exclusively those of Fund management. These views are not meant as investment advice andshould not be considered predictive in nature. Any favorable (or unfavorable) description of a holding applies only as ofDecember 31, 2008, unless otherwise stated. Security positions can and do change thereafter. Discussions of historicalperformance do not guarantee and may not be indicative of future performance.
90 Semi-Annual Report | December 31, 2008 (Unaudited)
Large-Cap Growth FundMANAGER’S COMMENTARY (continued)(Unaudited)
The Fund is subject to market risk (volatility) and is not an appropriate investment for short-term investors.
Conclusion
Thank you for your continued investment in Large-Cap Growth Fund. We encourage your feedback; your reactions andconcerns are important to us.
Sincerely,
Your Investment Management Team
www.bridgeway.com 91
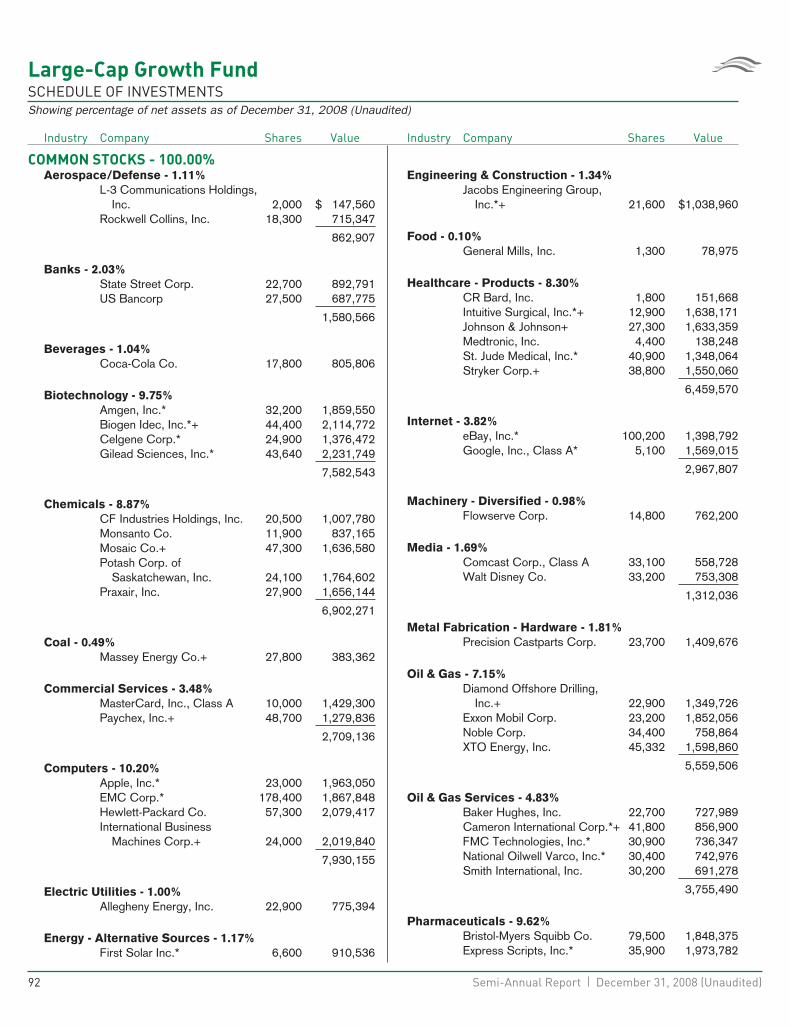
Large-Cap Growth FundSCHEDULE OF INVESTMENTSShowing percentage of net assets as of December 31, 2008 (Unaudited)
Industry Company Shares Value
COMMON STOCKS - 100.00%Aerospace/Defense - 1.11%
L-3 Communications Holdings,Inc. 2,000 $ 147,560
Rockwell Collins, Inc. 18,300 715,347
862,907
Banks - 2.03%State Street Corp. 22,700 892,791US Bancorp 27,500 687,775
1,580,566
Beverages - 1.04%Coca-Cola Co. 17,800 805,806
Biotechnology - 9.75%Amgen, Inc.* 32,200 1,859,550Biogen Idec, Inc.*+ 44,400 2,114,772Celgene Corp.* 24,900 1,376,472Gilead Sciences, Inc.* 43,640 2,231,749
7,582,543
Chemicals - 8.87%CF Industries Holdings, Inc. 20,500 1,007,780Monsanto Co. 11,900 837,165Mosaic Co.+ 47,300 1,636,580Potash Corp. of
Saskatchewan, Inc. 24,100 1,764,602Praxair, Inc. 27,900 1,656,144
6,902,271
Coal - 0.49%Massey Energy Co.+ 27,800 383,362
Commercial Services - 3.48%MasterCard, Inc., Class A 10,000 1,429,300Paychex, Inc.+ 48,700 1,279,836
2,709,136
Computers - 10.20%Apple, Inc.* 23,000 1,963,050EMC Corp.* 178,400 1,867,848Hewlett-Packard Co. 57,300 2,079,417International Business
Machines Corp.+ 24,000 2,019,840
7,930,155
Electric Utilities - 1.00%Allegheny Energy, Inc. 22,900 775,394
Energy - Alternative Sources - 1.17%First Solar Inc.* 6,600 910,536
Industry Company Shares Value
Engineering & Construction - 1.34%Jacobs Engineering Group,
Inc.*+ 21,600 $1,038,960
Food - 0.10%General Mills, Inc. 1,300 78,975
Healthcare - Products - 8.30%CR Bard, Inc. 1,800 151,668Intuitive Surgical, Inc.*+ 12,900 1,638,171Johnson & Johnson+ 27,300 1,633,359Medtronic, Inc. 4,400 138,248St. Jude Medical, Inc.* 40,900 1,348,064Stryker Corp.+ 38,800 1,550,060
6,459,570
Internet - 3.82%eBay, Inc.* 100,200 1,398,792Google, Inc., Class A* 5,100 1,569,015
2,967,807
Machinery - Diversified - 0.98%Flowserve Corp. 14,800 762,200
Media - 1.69%Comcast Corp., Class A 33,100 558,728Walt Disney Co. 33,200 753,308
1,312,036
Metal Fabrication - Hardware - 1.81%Precision Castparts Corp. 23,700 1,409,676
Oil & Gas - 7.15%Diamond Offshore Drilling,
Inc.+ 22,900 1,349,726Exxon Mobil Corp. 23,200 1,852,056Noble Corp. 34,400 758,864XTO Energy, Inc. 45,332 1,598,860
5,559,506
Oil & Gas Services - 4.83%Baker Hughes, Inc. 22,700 727,989Cameron International Corp.*+ 41,800 856,900FMC Technologies, Inc.* 30,900 736,347National Oilwell Varco, Inc.* 30,400 742,976Smith International, Inc. 30,200 691,278
3,755,490
Pharmaceuticals - 9.62%Bristol-Myers Squibb Co. 79,500 1,848,375Express Scripts, Inc.* 35,900 1,973,782
92 Semi-Annual Report | December 31, 2008 (Unaudited)
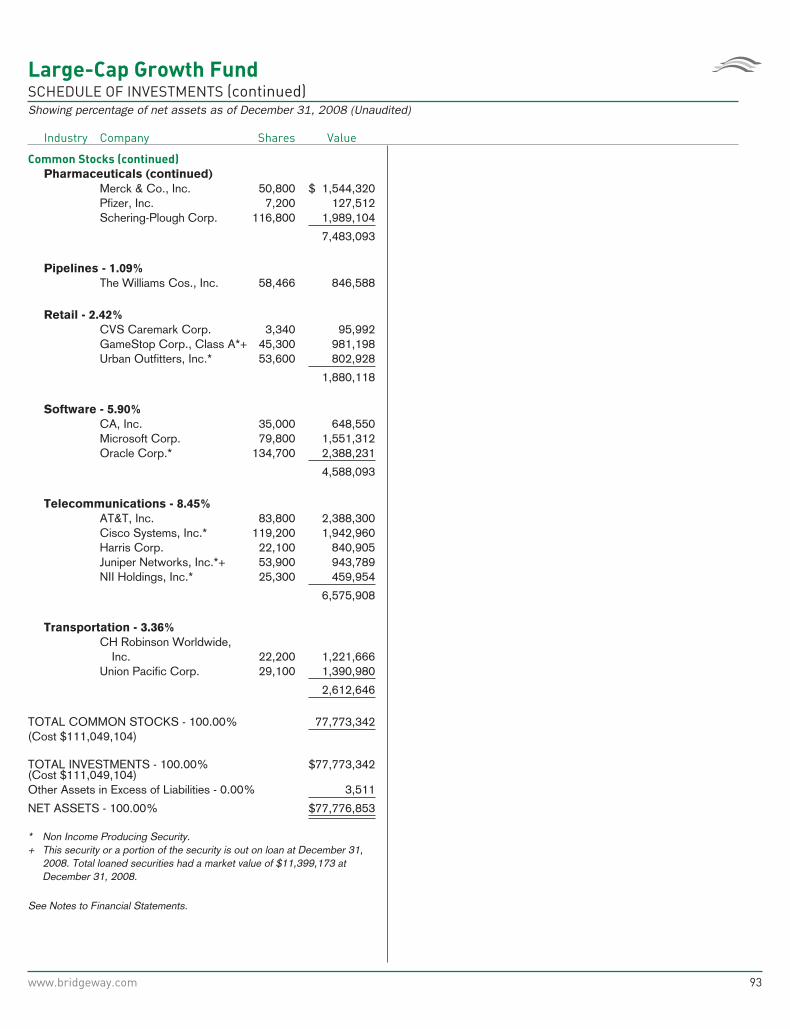
Large-Cap Growth FundSCHEDULE OF INVESTMENTS (continued)Showing percentage of net assets as of December 31, 2008 (Unaudited)
Industry Company Shares Value
Common Stocks (continued)
Pharmaceuticals (continued)Merck & Co., Inc. 50,800 $ 1,544,320Pfizer, Inc. 7,200 127,512Schering-Plough Corp. 116,800 1,989,104
7,483,093
Pipelines - 1.09%The Williams Cos., Inc. 58,466 846,588
Retail - 2.42%CVS Caremark Corp. 3,340 95,992GameStop Corp., Class A*+ 45,300 981,198Urban Outfitters, Inc.* 53,600 802,928
1,880,118
Software - 5.90%CA, Inc. 35,000 648,550Microsoft Corp. 79,800 1,551,312Oracle Corp.* 134,700 2,388,231
4,588,093
Telecommunications - 8.45%AT&T, Inc. 83,800 2,388,300Cisco Systems, Inc.* 119,200 1,942,960Harris Corp. 22,100 840,905Juniper Networks, Inc.*+ 53,900 943,789NII Holdings, Inc.* 25,300 459,954
6,575,908
Transportation - 3.36%CH Robinson Worldwide,
Inc. 22,200 1,221,666Union Pacific Corp. 29,100 1,390,980
2,612,646
TOTAL COMMON STOCKS - 100.00% 77,773,342(Cost $111,049,104)
TOTAL INVESTMENTS - 100.00% $77,773,342(Cost $111,049,104)Other Assets in Excess of Liabilities - 0.00% 3,511
NET ASSETS - 100.00% $77,776,853
* Non Income Producing Security.+ This security or a portion of the security is out on loan at December 31,
2008. Total loaned securities had a market value of $11,399,173 atDecember 31, 2008.
See Notes to Financial Statements.
www.bridgeway.com 93

Large-Cap Value FundMANAGER’S COMMENTARY(Unaudited)
December 31, 2008
Dear Fellow Large-Cap Value Fund Shareholder,
In the midst of what has now become the worst bear market since the 1930’s, our Fund declined 18.26% for theDecember quarter. As bad as this is in absolute terms, we outperformed each of our performance benchmarks, providingsome “cushion” in the downturn. Our primary market benchmark, the Russell 1000 Value Index was down 22.18%, and ourpeer benchmark, the Lipper Large-Cap Value Funds Index was down 21.09%. It was a good quarter on a relative basis.
For the six month semi-annual period, our Fund declined 26.36%, relative to declines of 26.93% for Russell 1000 ValueIndex and 27.90% for the Lipper Large Cap Value Funds Index. Overall, the Fund was helped some by an overweighting inthe communications sector, which held up better than most sectors, and especially by good picking among these stocks.
For the full calendar year, Large-Cap Value Fund declined 36.83%, a “hair” better than the Russell 1000 Value Index (down36.85%) and the Lipper Large-Cap Value Funds Index (down 37.00%). We were able to add a slight cushion against ourbenchmarks for the year and we are pleased with that.
The table below presents our December quarter, six-month, one-year, five-year and life-to-date financial results according tothe formula required by the SEC. Although there is a lot of “red ink” in the table, our record is a perfect “clean sweep” withrespect to our market benchmarks across all these time periods. See the next page for a graph of performance sinceinception.
Dec. Qtr.
10/1/08
to 12/31/08
Six-Month
7/1/08
to 12/31/08
1 Year
1/1/08
to 12/31/08
5 Year
1/1/04
to 12/31/08
Life-to-Date
10/31/03
to 12/31/08
Large-Cap Value Fund -18.26% -26.36% -36.83% 0.11% 1.50%Russell 1000 Value Index -22.18% -26.93% -36.85% -0.79% 0.65%Lipper Large-Cap Value Funds Index -21.09% -27.90% -37.00% -1.90% -0.46%
Performance figures quoted in the table above and graph below represent past performance and are no guarantee of futureresults. The table above and the graph below do not reflect the deduction of taxes that a shareholder would pay on Fund dis-tributions or the redemption of Fund shares.
The Russell 1000 Value Index is an unmanaged index which consists of stocks in the Russell 1000 Index with lowerprice-to-book ratios and lower forecasted growth values with dividends reinvested. The Lipper Large-Cap Value Funds Indexis an index of large-company, value-oriented funds compiled by Lipper, Inc. It is not possible to invest directly in an index.Periods longer than one year are annualized.
According to data from Lipper, Inc. as of December 31, 2008, Large-Cap Value Fund ranked 297th of 596 large-cap valuefunds for the twelve-month period ended December 31, 2008, 60th of 429 over the last five years and 67th of 423 suchfunds since inception in October, 2003. Lipper, Inc. is an independent mutual fund rating service that ranks funds in variousfund categories by making comparative calculations using total returns.
94 Semi-Annual Report | December 31, 2008 (Unaudited)
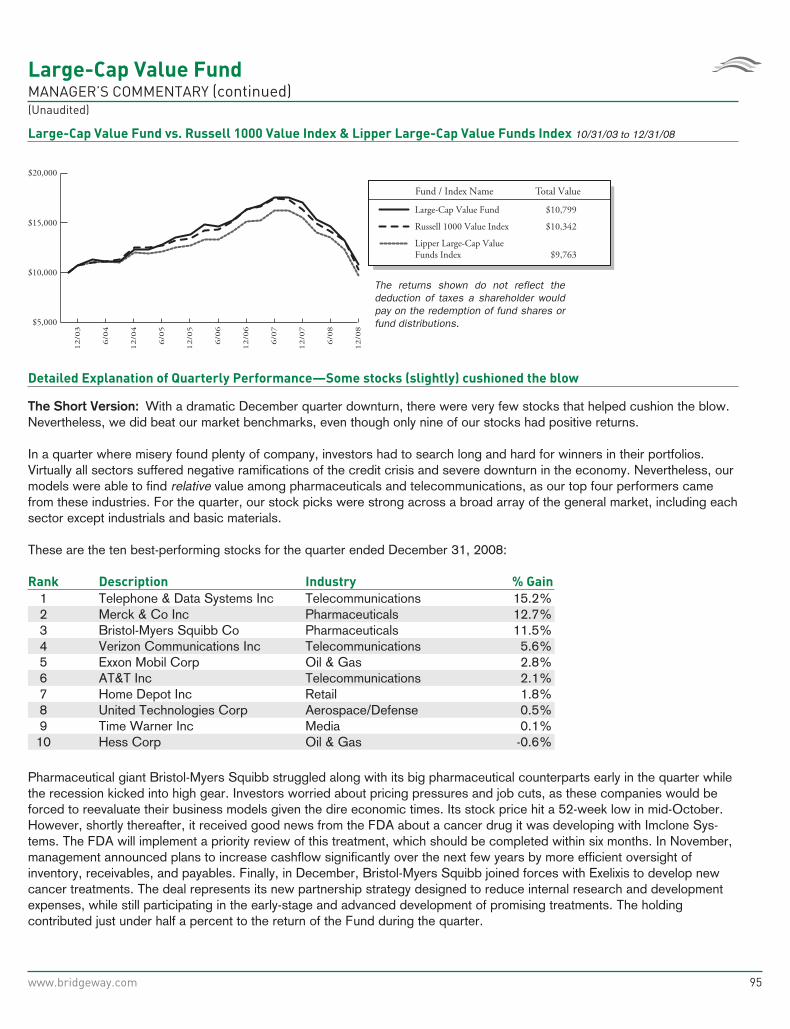
Large-Cap Value FundMANAGER’S COMMENTARY (continued)(Unaudited)
Large-Cap Value Fund vs. Russell 1000 Value Index & Lipper Large-Cap Value Funds Index 10/31/03 to 12/31/08
Fund / Index Name Total Value
Russell 1000 Value Index
Lipper Large-Cap ValueFunds Index
Large-Cap Value Fund
The returns shown do not reflect the deduction of taxes a shareholder would pay on the redemption of fund shares or fund distributions.
$10,799
$10,342
$9,763
12/0
3
6/0
4
12/0
4
6/0
5
12/0
5
6/0
6
12/0
6
6/0
7
12/0
7
12/0
8
6/0
8$5,000
$10,000
$15,000
$20,000
Detailed Explanation of Quarterly Performance—Some stocks (slightly) cushioned the blow
The Short Version: With a dramatic December quarter downturn, there were very few stocks that helped cushion the blow.Nevertheless, we did beat our market benchmarks, even though only nine of our stocks had positive returns.
In a quarter where misery found plenty of company, investors had to search long and hard for winners in their portfolios.Virtually all sectors suffered negative ramifications of the credit crisis and severe downturn in the economy. Nevertheless, ourmodels were able to find relative value among pharmaceuticals and telecommunications, as our top four performers camefrom these industries. For the quarter, our stock picks were strong across a broad array of the general market, including eachsector except industrials and basic materials.
These are the ten best-performing stocks for the quarter ended December 31, 2008:
Rank Description Industry % Gain
1 Telephone & Data Systems Inc Telecommunications 15.2%2 Merck & Co Inc Pharmaceuticals 12.7%3 Bristol-Myers Squibb Co Pharmaceuticals 11.5%4 Verizon Communications Inc Telecommunications 5.6%5 Exxon Mobil Corp Oil & Gas 2.8%6 AT&T Inc Telecommunications 2.1%7 Home Depot Inc Retail 1.8%8 United Technologies Corp Aerospace/Defense 0.5%9 Time Warner Inc Media 0.1%
10 Hess Corp Oil & Gas -0.6%
Pharmaceutical giant Bristol-Myers Squibb struggled along with its big pharmaceutical counterparts early in the quarter whilethe recession kicked into high gear. Investors worried about pricing pressures and job cuts, as these companies would beforced to reevaluate their business models given the dire economic times. Its stock price hit a 52-week low in mid-October.However, shortly thereafter, it received good news from the FDA about a cancer drug it was developing with Imclone Sys-tems. The FDA will implement a priority review of this treatment, which should be completed within six months. In November,management announced plans to increase cashflow significantly over the next few years by more efficient oversight ofinventory, receivables, and payables. Finally, in December, Bristol-Myers Squibb joined forces with Exelixis to develop newcancer treatments. The deal represents its new partnership strategy designed to reduce internal research and developmentexpenses, while still participating in the early-stage and advanced development of promising treatments. The holdingcontributed just under half a percent to the return of the Fund during the quarter.
www.bridgeway.com 95
Large-Cap Value FundMANAGER’S COMMENTARY (continued)(Unaudited)
Detailed Explanation of Quarterly Performance—What Didn’t Work
The Short Version: Energy, chemicals, and . . . finance. A bad combination in the December quarter.
So much for diversification. No industry was immune from the economic downturn and market negativity. Six different sectorswere represented on the list of worst performers for the quarter with three coming from non-cyclical consumer industries.Combined, these ten holdings cost the Fund over seven percent in return. Four of the worst performers lost over 50% invalue. These are the ten worst-performing stocks for the quarter ended December 31, 2008:
Rank Description Industry % Loss
1 Textron Inc Miscellaneous Manufacturing -55.1%2 Chesapeake Energy Corp Oil & Gas -54.9%3 Bank of America Corp Banks -52.0%4 Cigna Corp Healthcare-Services -50.4%5 Dow Chemical Co Chemicals -46.8%6 Expedia Inc Internet -45.5%7 RR Donnelley & Sons Co Commercial Services -44.6%8 AGCO Corp Machinery-Diversified -44.6%9 MetLife Inc Insurance -37.1%
10 Bunge Ltd Agriculture -31.9%
Initially considered the “white knight” for the financial services world, banking giant Bank of America fell on hard times of itsown during the past quarter, as the recession accelerated, the bailout began, and shareholders worried about how the com-pany would “synergize” with its latest acquisitions. In July, Bank of America welcomed Countrywide (of subprime lendinginfamy) into its family and in September announced plans to rescue brokerage behemoth Merrill Lynch from a fate similar toLehman and Bear Stearns. By October, it accepted government funds as a participant in the TARP bailout plan, and its stockbegan a steady freefall once investors realized the true magnitude of the financial crisis. In December, Bank of Americashareholders approved the Merrill deal, but at a valuation far less than initially negotiated. Its share price had droppeddramatically since the announcement. The transaction made Bank of America the largest domestic brokerage and wealthmanagement shop (at a time that those businesses seem to be out of favor). The company plans to lay off about 30,000employees as it incorporates Merrill into its operations. Its stock price plunged over 50% during the quarter and cost theFund over a quarter of a percent in return.
Detailed Explanation of Calendar Year Performance—A handful of companies with positive returns
The Short Version: Only five of the 83 companies we held during the calendar year had positive returns.
A sign of the times…half of the year’s best-performing stocks in the Fund actually lost market value. Seven different sectorswere represented in the list. Only two of the top performers increased more than 10%. Say no more…2008 was a tough yearfor stock picking, no matter how many different ways you analyze it.
96 Semi-Annual Report | December 31, 2008 (Unaudited)
Large-Cap Value FundMANAGER’S COMMENTARY (continued)(Unaudited)
These are the ten best performers for the calendar year ended December 31, 2008:
Rank Description Industry % Gain
1 Telephone & Data Systems Inc Telecommunications 15.2%2 Merck & Co Inc Pharmaceuticals 12.7%3 Mattel Inc Toys/Games/Hobbies 5.0%4 Home Depot Inc Retail 1.8%5 United Technologies Corp Aerospace/Defense 0.5%6 Freeport-McMoRan Copper &
Gold Inc Mining -0.1%7 Allstate Corp Insurance -3.5%8 Time Warner Inc Media -4.5%9 Southern Co Electric -4.5%
10 Union Pacific Corp Transportation -5.2%
Move over Barbie…here come the Bratz. In July, toymaker Mattel won a legal battle against MGA Entertainment over theownership rights of Bratz dolls. The Court found that much of the design had occurred when the doll’s creator was underMattel’s employment and MGA intentionally interfered with an exclusivity arrangement. Since good news often follows moregood news (just not enough these days), a day later, Mattel posted better than expected earnings on surprisingly strong salesof merchandise related to movie hits The Dark Knight, Speed Racer, and Kung Fu Panda. Perhaps toys are the boomindustry in the bear market. Mattel returned five percent for the year.
Detailed Explanation of Calendar Year Performance—What Didn’t Work
The Short Version: This was definitely the worst year since 1931. Thirteen of our 83 companies lost more than half theirvalue.
While financials, energy, and retailers may have garnered much of the negative press in 2008, the carnage made no dis-tinction of industry. Six different sectors were represented on the list of the year’s worst performers. All 10 of the holdingslost over 50% in value, and combined they cost the Fund over eight and a half percent.
These are the ten stocks that performed the worst in the calendar year ended December 31, 2008:
Rank Description Industry % Gain
1 Textron Inc Miscellaneous Manufacturing -81.5%2 Expedia Inc Internet -73.9%3 AGCO Corp Machinery-Diversified -64.0%4 RR Donnelley & Sons Co Commercial Services -64.0%5 Wachovia Corp Banks -61.0%6 Cigna Corp Healthcare-Services -60.1%7 Bank of America Corp Banks -59.2%8 Chesapeake Energy Corp Oil & Gas -58.8%9 Bunge Ltd Agriculture -56.4%
10 Southern Copper Corp Mining -52.8%
While large companies often benefit from diversification of business segments, some major conglomerates have struggled asof late, with many of their diverse units suffering from the dire economy at exactly the same time. Textron operates aircraft(Bell, Cessna), industrial, and financial divisions. In July, the company announced higher profits, but missed analysts’ expect-ations because rising energy costs resulted in larger than expected expenses. By October, the company’s financial arm washurting, as its asset-based lending business and other product lines were devastated in the credit crunch. Following a worsethan expected earnings announcement, some analysts went so far as to call for Textron to exit those financial businessesaltogether. In December, the company reduced its outlook for the fourth quarter, eliminated five percent of its workforce, and
www.bridgeway.com 97
Large-Cap Value FundMANAGER’S COMMENTARY (continued)(Unaudited)
announced plans to shut down most of its commercial finance arm to raise much needed liquidity. The stock plunged over80% and cost the Fund over one-and-a-half percent in return in 2008. This stock demonstrates that the financial crisis hasdefinitely spread beyond Wall Street and the financial sector.
Top Ten Holdings as of December 31, 2008
Four of our largest positions were also among the Fund’s top performers of the quarter: Verizon Communications, Bristol-Myers Squibb, Exxon Mobil, AT&T. Five different industries were represented on the list of top holdings, revealing strongdiversification across sectors. The ten largest positions represented 45.7% of the total assets of the Fund.
Rank Description Industry
Percent of
Net Assets
1 Hewlett-Packard Co Computers 5.3%2 Verizon Communications Inc Telecommunications 5.1%3 Bristol-Myers Squibb Co Pharmaceuticals 5.0%4 Exxon Mobil Corp Oil & Gas 4.9%5 Medco Health Solutions Inc Pharmaceuticals 4.8%6 AT&T Inc Telecommunications 4.8%7 Lockheed Martin Corp Aerospace/Defense 4.4%8 ChevronTexaco Corp Oil & Gas 3.9%9 Pfizer Inc Pharmaceuticals 3.9%
10 International BusinessMachines Corp Computers 3.6%
Total 45.7%
Industry Sector Representation as of December 31, 2008
While virtually no sector was spared the negativity of the past three months (and full year, for that matter), our models’ over-weighting of industrial companies was costly to the Fund’s performance relative to the benchmarks. The sector includedmanufacturing and commodities-related stocks, many of which had been solid performers in the past, but plunged in value, asthe weak global economy hindered demand for such products. Fortunately, our overweighting of communications companiesmore than made up the difference. Even though the sector declined during the quarter, it outperformed many others andhelped limit some of the Fund’s overall losses.
% of Net Assets % of S&P 500 Index Difference
Basic Materials 2.0% 3.0% -1.0%Communications 17.4% 10.9% 6.5%Consumer, Cyclical 3.2% 8.2% -5.0%Consumer, Non-cyclical 25.7% 25.2% 0.5%Energy 9.9% 13.5% -3.6%Financial 11.5% 13.0% -1.5%Industrial 15.4% 11.2% 4.2%Technology 9.8% 10.9% -1.1%Utilities 5.0% 4.1% 0.9%Cash 0.1% 0.0% 0.1%
Total 100.0% 100.0%
Disclaimer
The following is a reminder from the friendly folks at your Fund who worry about liability. The views expressed here areexclusively those of Fund management. These views are not meant as investment advice and should not be considered
98 Semi-Annual Report | December 31, 2008 (Unaudited)

Large-Cap Value FundMANAGER’S COMMENTARY (continued)(Unaudited)
predictive in nature. Any favorable (or unfavorable) description of a holding applies only as of December 31, 2008, unlessotherwise stated. Security positions can and do change thereafter. Discussions of historical performance do not guaranteeand are not indicative of future performance.
The Fund is subject to market risk (volatility) and is not an appropriate investment for short-term investors.
Conclusion
Thank you for your continued investment in Large-Cap Value Fund. We encourage your feedback; your reactions and con-cerns are important to us.
Sincerely,
Your Investment Management Team
www.bridgeway.com 99
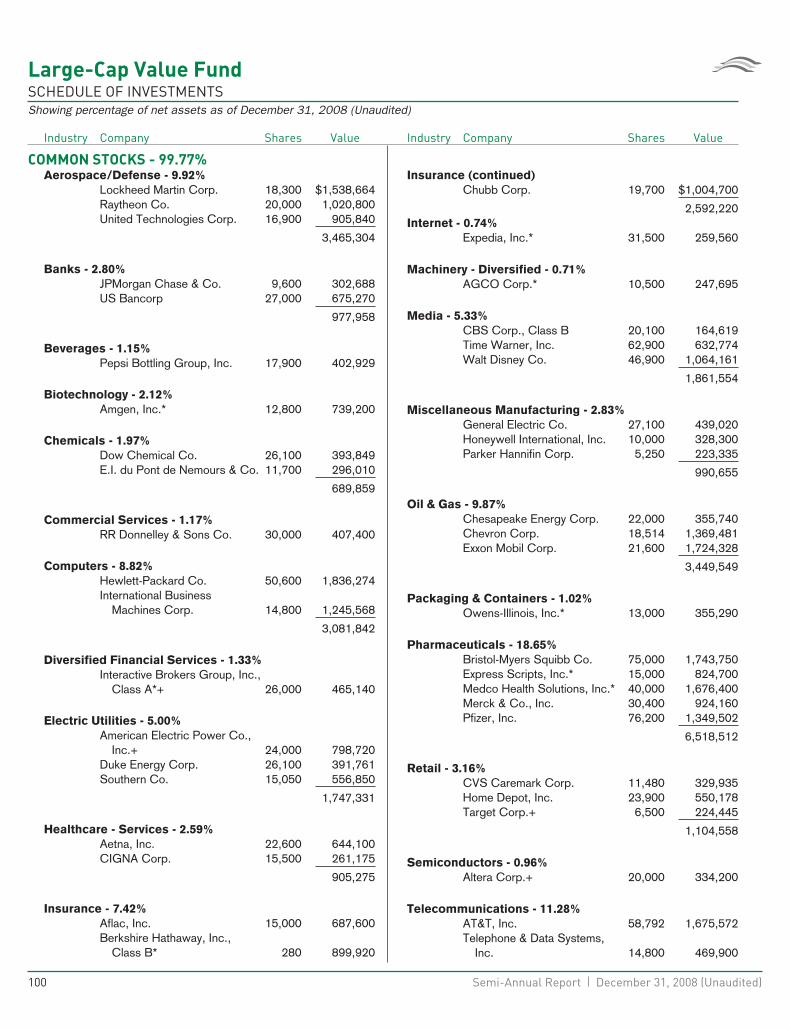
Large-Cap Value FundSCHEDULE OF INVESTMENTSShowing percentage of net assets as of December 31, 2008 (Unaudited)
Industry Company Shares Value
COMMON STOCKS - 99.77%Aerospace/Defense - 9.92%
Lockheed Martin Corp. 18,300 $1,538,664Raytheon Co. 20,000 1,020,800United Technologies Corp. 16,900 905,840
3,465,304
Banks - 2.80%JPMorgan Chase & Co. 9,600 302,688US Bancorp 27,000 675,270
977,958
Beverages - 1.15%Pepsi Bottling Group, Inc. 17,900 402,929
Biotechnology - 2.12%Amgen, Inc.* 12,800 739,200
Chemicals - 1.97%Dow Chemical Co. 26,100 393,849E.I. du Pont de Nemours & Co. 11,700 296,010
689,859
Commercial Services - 1.17%RR Donnelley & Sons Co. 30,000 407,400
Computers - 8.82%Hewlett-Packard Co. 50,600 1,836,274International Business
Machines Corp. 14,800 1,245,568
3,081,842
Diversified Financial Services - 1.33%Interactive Brokers Group, Inc.,
Class A*+ 26,000 465,140
Electric Utilities - 5.00%American Electric Power Co.,
Inc.+ 24,000 798,720Duke Energy Corp. 26,100 391,761Southern Co. 15,050 556,850
1,747,331
Healthcare - Services - 2.59%Aetna, Inc. 22,600 644,100CIGNA Corp. 15,500 261,175
905,275
Insurance - 7.42%Aflac, Inc. 15,000 687,600Berkshire Hathaway, Inc.,
Class B* 280 899,920
Industry Company Shares Value
Insurance (continued)Chubb Corp. 19,700 $1,004,700
2,592,220Internet - 0.74%
Expedia, Inc.* 31,500 259,560
Machinery - Diversified - 0.71%AGCO Corp.* 10,500 247,695
Media - 5.33%CBS Corp., Class B 20,100 164,619Time Warner, Inc. 62,900 632,774Walt Disney Co. 46,900 1,064,161
1,861,554
Miscellaneous Manufacturing - 2.83%General Electric Co. 27,100 439,020Honeywell International, Inc. 10,000 328,300Parker Hannifin Corp. 5,250 223,335
990,655
Oil & Gas - 9.87%Chesapeake Energy Corp. 22,000 355,740Chevron Corp. 18,514 1,369,481Exxon Mobil Corp. 21,600 1,724,328
3,449,549
Packaging & Containers - 1.02%Owens-Illinois, Inc.* 13,000 355,290
Pharmaceuticals - 18.65%Bristol-Myers Squibb Co. 75,000 1,743,750Express Scripts, Inc.* 15,000 824,700Medco Health Solutions, Inc.* 40,000 1,676,400Merck & Co., Inc. 30,400 924,160Pfizer, Inc. 76,200 1,349,502
6,518,512
Retail - 3.16%CVS Caremark Corp. 11,480 329,935Home Depot, Inc. 23,900 550,178Target Corp.+ 6,500 224,445
1,104,558
Semiconductors - 0.96%Altera Corp.+ 20,000 334,200
Telecommunications - 11.28%AT&T, Inc. 58,792 1,675,572Telephone & Data Systems,
Inc. 14,800 469,900
100 Semi-Annual Report | December 31, 2008 (Unaudited)
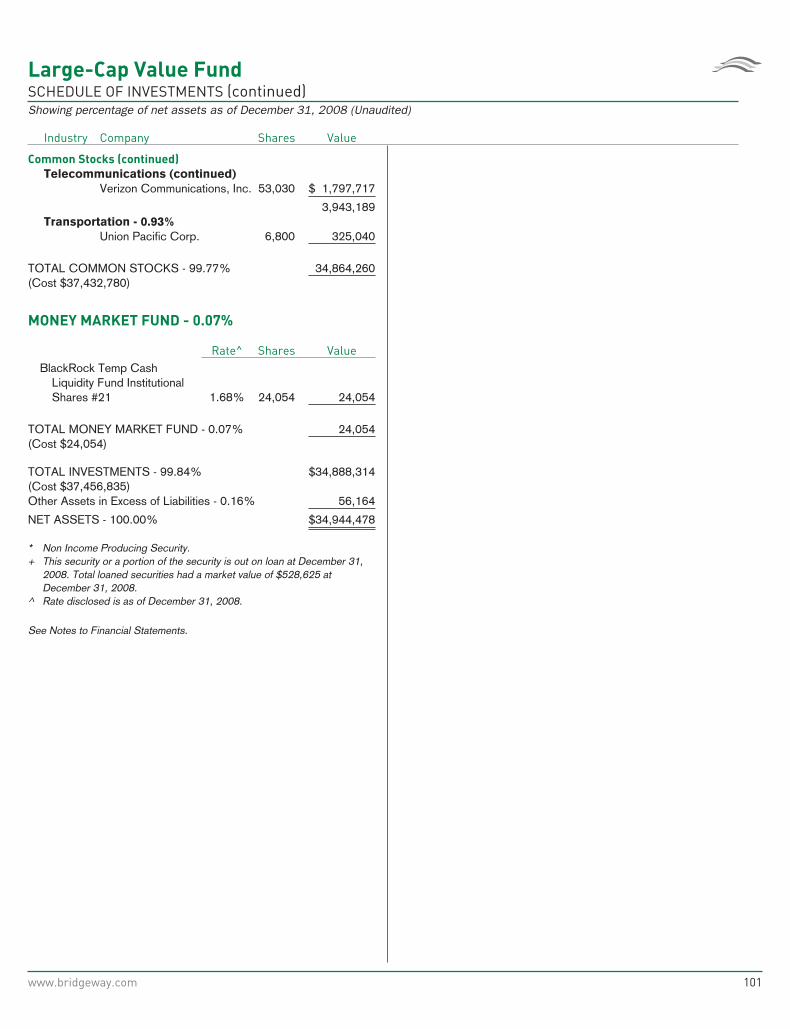
Large-Cap Value FundSCHEDULE OF INVESTMENTS (continued)Showing percentage of net assets as of December 31, 2008 (Unaudited)
Industry Company Shares Value
Common Stocks (continued)
Telecommunications (continued)Verizon Communications, Inc. 53,030 $ 1,797,717
3,943,189Transportation - 0.93%
Union Pacific Corp. 6,800 325,040
TOTAL COMMON STOCKS - 99.77% 34,864,260(Cost $37,432,780)
MONEY MARKET FUND - 0.07%
Rate^ Shares ValueBlackRock Temp Cash
Liquidity Fund InstitutionalShares #21 1.68% 24,054 24,054
TOTAL MONEY MARKET FUND - 0.07% 24,054(Cost $24,054)
TOTAL INVESTMENTS - 99.84% $34,888,314(Cost $37,456,835)Other Assets in Excess of Liabilities - 0.16% 56,164
NET ASSETS - 100.00% $34,944,478
* Non Income Producing Security.+ This security or a portion of the security is out on loan at December 31,
2008. Total loaned securities had a market value of $528,625 atDecember 31, 2008.
^ Rate disclosed is as of December 31, 2008.
See Notes to Financial Statements.
www.bridgeway.com 101
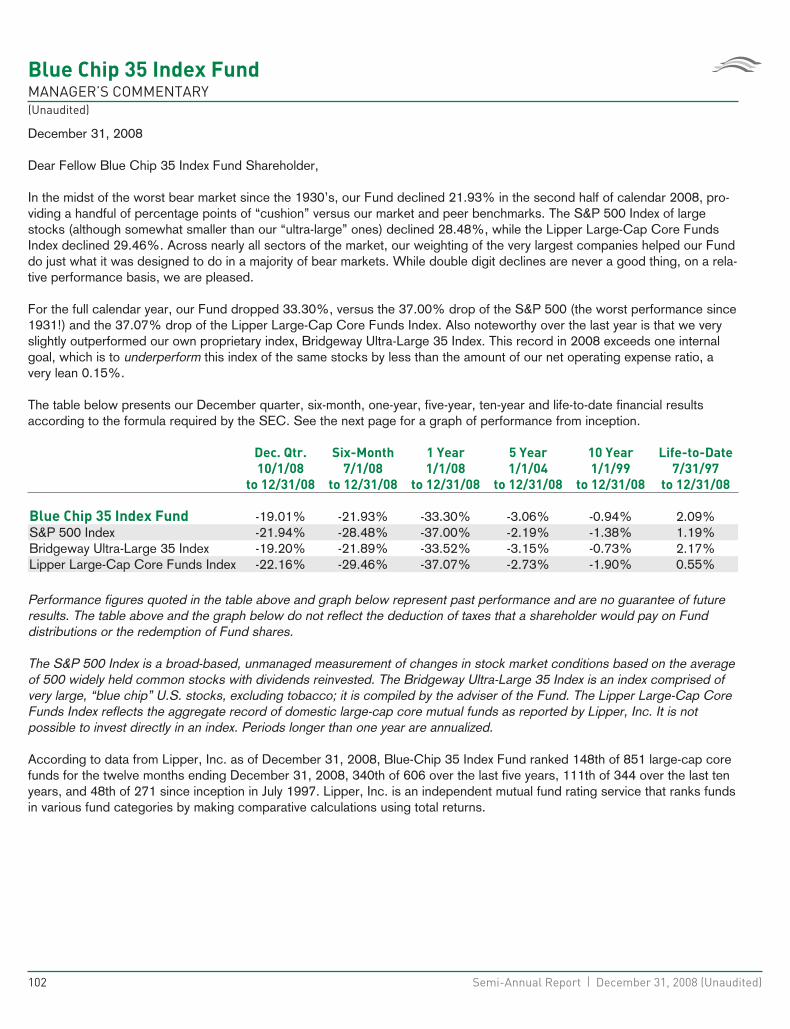
Blue Chip 35 Index FundMANAGER’S COMMENTARY(Unaudited)
December 31, 2008
Dear Fellow Blue Chip 35 Index Fund Shareholder,
In the midst of the worst bear market since the 1930’s, our Fund declined 21.93% in the second half of calendar 2008, pro-viding a handful of percentage points of “cushion” versus our market and peer benchmarks. The S&P 500 Index of largestocks (although somewhat smaller than our “ultra-large” ones) declined 28.48%, while the Lipper Large-Cap Core FundsIndex declined 29.46%. Across nearly all sectors of the market, our weighting of the very largest companies helped our Funddo just what it was designed to do in a majority of bear markets. While double digit declines are never a good thing, on a rela-tive performance basis, we are pleased.
For the full calendar year, our Fund dropped 33.30%, versus the 37.00% drop of the S&P 500 (the worst performance since1931!) and the 37.07% drop of the Lipper Large-Cap Core Funds Index. Also noteworthy over the last year is that we veryslightly outperformed our own proprietary index, Bridgeway Ultra-Large 35 Index. This record in 2008 exceeds one internalgoal, which is to underperform this index of the same stocks by less than the amount of our net operating expense ratio, avery lean 0.15%.
The table below presents our December quarter, six-month, one-year, five-year, ten-year and life-to-date financial resultsaccording to the formula required by the SEC. See the next page for a graph of performance from inception.
Dec. Qtr.
10/1/08
to 12/31/08
Six-Month
7/1/08
to 12/31/08
1 Year
1/1/08
to 12/31/08
5 Year
1/1/04
to 12/31/08
10 Year
1/1/99
to 12/31/08
Life-to-Date
7/31/97
to 12/31/08
Blue Chip 35 Index Fund -19.01% -21.93% -33.30% -3.06% -0.94% 2.09%S&P 500 Index -21.94% -28.48% -37.00% -2.19% -1.38% 1.19%Bridgeway Ultra-Large 35 Index -19.20% -21.89% -33.52% -3.15% -0.73% 2.17%Lipper Large-Cap Core Funds Index -22.16% -29.46% -37.07% -2.73% -1.90% 0.55%
Performance figures quoted in the table above and graph below represent past performance and are no guarantee of futureresults. The table above and the graph below do not reflect the deduction of taxes that a shareholder would pay on Funddistributions or the redemption of Fund shares.
The S&P 500 Index is a broad-based, unmanaged measurement of changes in stock market conditions based on the averageof 500 widely held common stocks with dividends reinvested. The Bridgeway Ultra-Large 35 Index is an index comprised ofvery large, “blue chip” U.S. stocks, excluding tobacco; it is compiled by the adviser of the Fund. The Lipper Large-Cap CoreFunds Index reflects the aggregate record of domestic large-cap core mutual funds as reported by Lipper, Inc. It is notpossible to invest directly in an index. Periods longer than one year are annualized.
According to data from Lipper, Inc. as of December 31, 2008, Blue-Chip 35 Index Fund ranked 148th of 851 large-cap corefunds for the twelve months ending December 31, 2008, 340th of 606 over the last five years, 111th of 344 over the last tenyears, and 48th of 271 since inception in July 1997. Lipper, Inc. is an independent mutual fund rating service that ranks fundsin various fund categories by making comparative calculations using total returns.
102 Semi-Annual Report | December 31, 2008 (Unaudited)
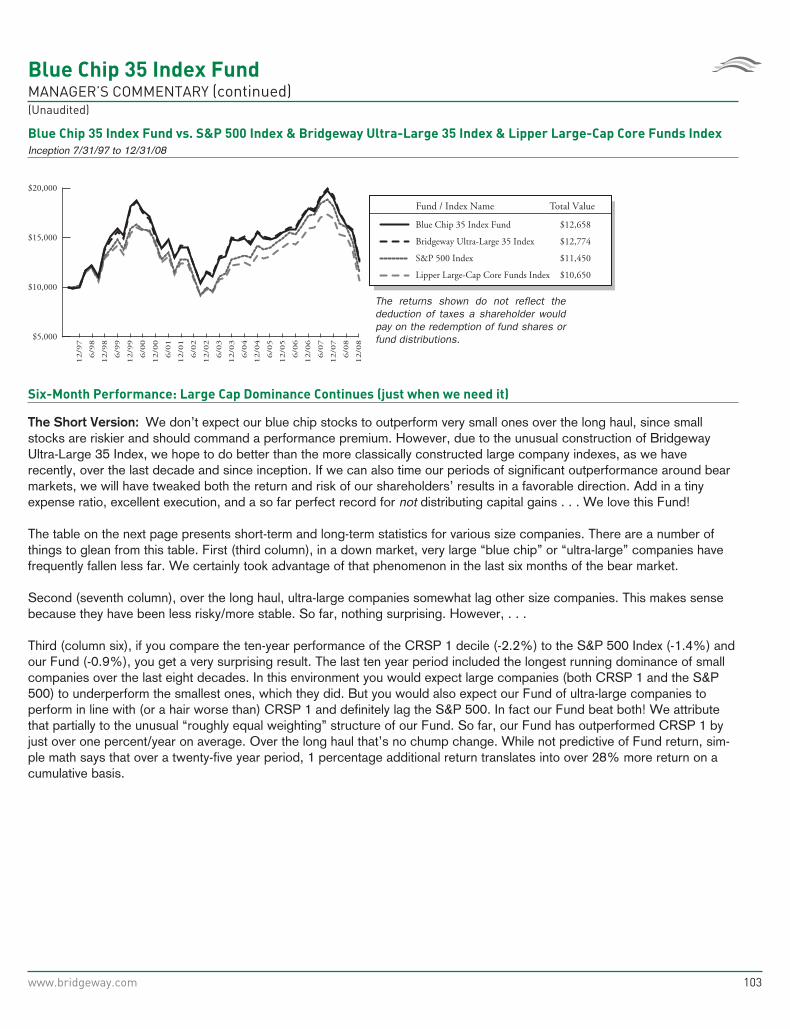
Blue Chip 35 Index FundMANAGER’S COMMENTARY (continued)(Unaudited)
Blue Chip 35 Index Fund vs. S&P 500 Index & Bridgeway Ultra-Large 35 Index & Lipper Large-Cap Core Funds Index
Inception 7/31/97 to 12/31/08
Fund / Index Name Total Value
S&P 500 Index
Lipper Large-Cap Core Funds Index
The returns shown do not reflect the deduction of taxes a shareholder would pay on the redemption of fund shares or fund distributions.
Bridgeway Ultra-Large 35 Index $12,774
Blue Chip 35 Index Fund $12,658
$11,450
$10,650
$5,000
$10,000
$20,000
$15,000
12/0
6
6/0
6
12/0
5
6/0
5
12/0
7
6/0
7
12/0
8
6/0
8
12/0
4
6/0
4
12/0
3
6/0
3
12/0
2
6/0
2
12/0
1
6/0
1
12/0
0
6/0
0
6/9
9
12/9
8
6/9
8
12/9
7
12/9
9
Six-Month Performance: Large Cap Dominance Continues (just when we need it)
The Short Version: We don’t expect our blue chip stocks to outperform very small ones over the long haul, since smallstocks are riskier and should command a performance premium. However, due to the unusual construction of BridgewayUltra-Large 35 Index, we hope to do better than the more classically constructed large company indexes, as we haverecently, over the last decade and since inception. If we can also time our periods of significant outperformance around bearmarkets, we will have tweaked both the return and risk of our shareholders’ results in a favorable direction. Add in a tinyexpense ratio, excellent execution, and a so far perfect record for not distributing capital gains . . . We love this Fund!
The table on the next page presents short-term and long-term statistics for various size companies. There are a number ofthings to glean from this table. First (third column), in a down market, very large “blue chip” or “ultra-large” companies havefrequently fallen less far. We certainly took advantage of that phenomenon in the last six months of the bear market.
Second (seventh column), over the long haul, ultra-large companies somewhat lag other size companies. This makes sensebecause they have been less risky/more stable. So far, nothing surprising. However, . . .
Third (column six), if you compare the ten-year performance of the CRSP 1 decile (-2.2%) to the S&P 500 Index (-1.4%) andour Fund (-0.9%), you get a very surprising result. The last ten year period included the longest running dominance of smallcompanies over the last eight decades. In this environment you would expect large companies (both CRSP 1 and the S&P500) to underperform the smallest ones, which they did. But you would also expect our Fund of ultra-large companies toperform in line with (or a hair worse than) CRSP 1 and definitely lag the S&P 500. In fact our Fund beat both! We attributethat partially to the unusual “roughly equal weighting” structure of our Fund. So far, our Fund has outperformed CRSP 1 byjust over one percent/year on average. Over the long haul that’s no chump change. While not predictive of Fund return, sim-ple math says that over a twenty-five year period, 1 percentage additional return translates into over 28% more return on acumulative basis.
www.bridgeway.com 103
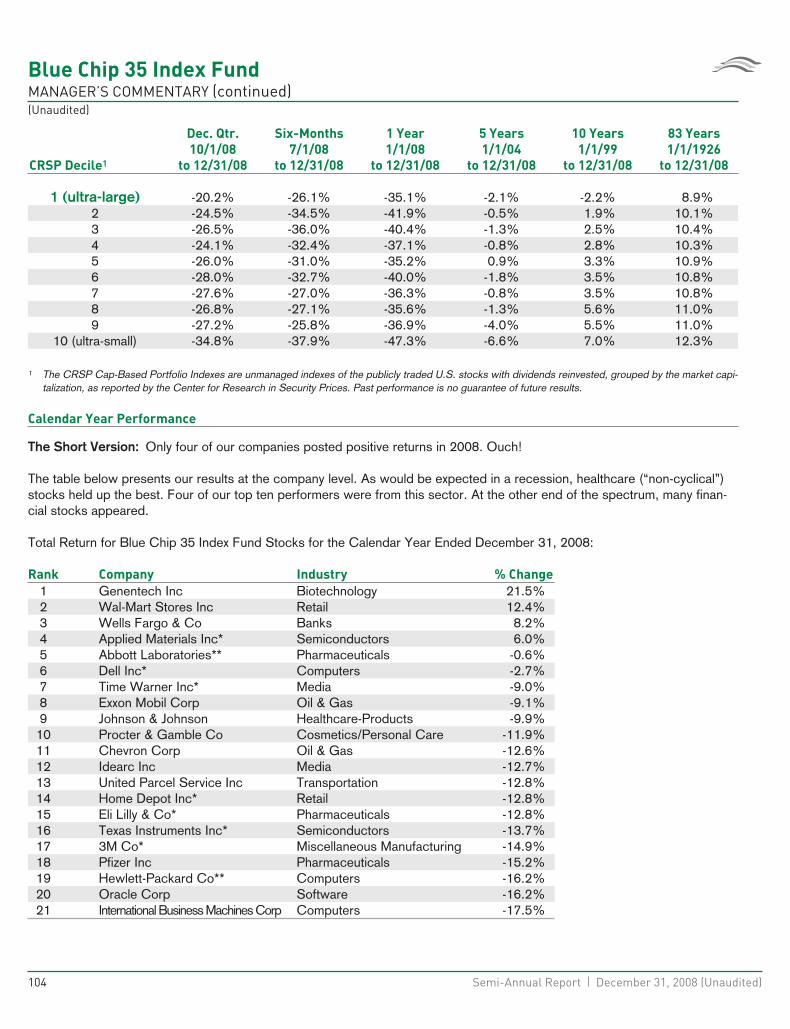
Blue Chip 35 Index FundMANAGER’S COMMENTARY (continued)(Unaudited)
CRSP Decile1
Dec. Qtr.
10/1/08
to 12/31/08
Six-Months
7/1/08
to 12/31/08
1 Year
1/1/08
to 12/31/08
5 Years
1/1/04
to 12/31/08
10 Years
1/1/99
to 12/31/08
83 Years
1/1/1926
to 12/31/08
1 (ultra-large) -20.2% -26.1% -35.1% -2.1% -2.2% 8.9%2 -24.5% -34.5% -41.9% -0.5% 1.9% 10.1%3 -26.5% -36.0% -40.4% -1.3% 2.5% 10.4%4 -24.1% -32.4% -37.1% -0.8% 2.8% 10.3%5 -26.0% -31.0% -35.2% 0.9% 3.3% 10.9%6 -28.0% -32.7% -40.0% -1.8% 3.5% 10.8%7 -27.6% -27.0% -36.3% -0.8% 3.5% 10.8%8 -26.8% -27.1% -35.6% -1.3% 5.6% 11.0%9 -27.2% -25.8% -36.9% -4.0% 5.5% 11.0%
10 (ultra-small) -34.8% -37.9% -47.3% -6.6% 7.0% 12.3%
1 The CRSP Cap-Based Portfolio Indexes are unmanaged indexes of the publicly traded U.S. stocks with dividends reinvested, grouped by the market capi-talization, as reported by the Center for Research in Security Prices. Past performance is no guarantee of future results.
Calendar Year Performance
The Short Version: Only four of our companies posted positive returns in 2008. Ouch!
The table below presents our results at the company level. As would be expected in a recession, healthcare (“non-cyclical”)stocks held up the best. Four of our top ten performers were from this sector. At the other end of the spectrum, many finan-cial stocks appeared.
Total Return for Blue Chip 35 Index Fund Stocks for the Calendar Year Ended December 31, 2008:
Rank Company Industry % Change
1 Genentech Inc Biotechnology 21.5%2 Wal-Mart Stores Inc Retail 12.4%3 Wells Fargo & Co Banks 8.2%4 Applied Materials Inc* Semiconductors 6.0%5 Abbott Laboratories** Pharmaceuticals -0.6%6 Dell Inc* Computers -2.7%7 Time Warner Inc* Media -9.0%8 Exxon Mobil Corp Oil & Gas -9.1%9 Johnson & Johnson Healthcare-Products -9.9%
10 Procter & Gamble Co Cosmetics/Personal Care -11.9%11 Chevron Corp Oil & Gas -12.6%12 Idearc Inc Media -12.7%13 United Parcel Service Inc Transportation -12.8%14 Home Depot Inc* Retail -12.8%15 Eli Lilly & Co* Pharmaceuticals -12.8%16 Texas Instruments Inc* Semiconductors -13.7%17 3M Co* Miscellaneous Manufacturing -14.9%18 Pfizer Inc Pharmaceuticals -15.2%19 Hewlett-Packard Co** Computers -16.2%20 Oracle Corp Software -16.2%21 International Business Machines Corp Computers -17.5%
104 Semi-Annual Report | December 31, 2008 (Unaudited)
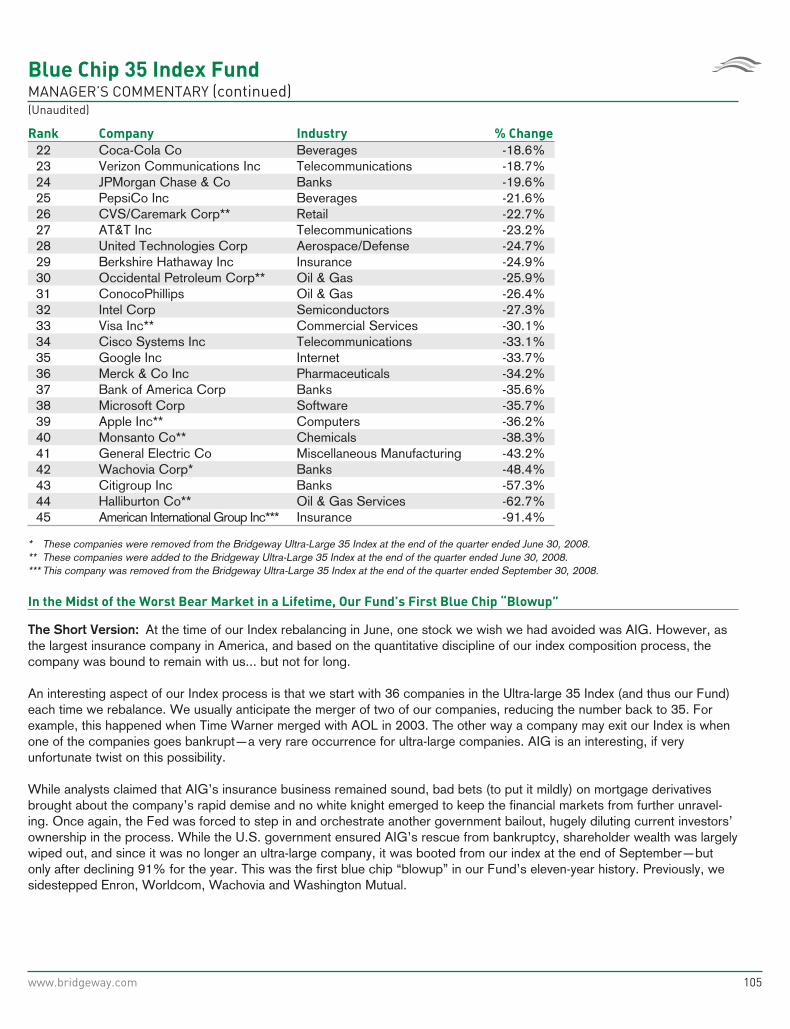
Blue Chip 35 Index FundMANAGER’S COMMENTARY (continued)(Unaudited)
Rank Company Industry % Change
22 Coca-Cola Co Beverages -18.6%23 Verizon Communications Inc Telecommunications -18.7%24 JPMorgan Chase & Co Banks -19.6%25 PepsiCo Inc Beverages -21.6%26 CVS/Caremark Corp** Retail -22.7%27 AT&T Inc Telecommunications -23.2%28 United Technologies Corp Aerospace/Defense -24.7%29 Berkshire Hathaway Inc Insurance -24.9%30 Occidental Petroleum Corp** Oil & Gas -25.9%31 ConocoPhillips Oil & Gas -26.4%32 Intel Corp Semiconductors -27.3%33 Visa Inc** Commercial Services -30.1%34 Cisco Systems Inc Telecommunications -33.1%35 Google Inc Internet -33.7%36 Merck & Co Inc Pharmaceuticals -34.2%37 Bank of America Corp Banks -35.6%38 Microsoft Corp Software -35.7%39 Apple Inc** Computers -36.2%40 Monsanto Co** Chemicals -38.3%41 General Electric Co Miscellaneous Manufacturing -43.2%42 Wachovia Corp* Banks -48.4%43 Citigroup Inc Banks -57.3%44 Halliburton Co** Oil & Gas Services -62.7%45 American International Group Inc*** Insurance -91.4%
* These companies were removed from the Bridgeway Ultra-Large 35 Index at the end of the quarter ended June 30, 2008.** These companies were added to the Bridgeway Ultra-Large 35 Index at the end of the quarter ended June 30, 2008.*** This company was removed from the Bridgeway Ultra-Large 35 Index at the end of the quarter ended September 30, 2008.
In the Midst of the Worst Bear Market in a Lifetime, Our Fund’s First Blue Chip “Blowup”
The Short Version: At the time of our Index rebalancing in June, one stock we wish we had avoided was AIG. However, asthe largest insurance company in America, and based on the quantitative discipline of our index composition process, thecompany was bound to remain with us... but not for long.
An interesting aspect of our Index process is that we start with 36 companies in the Ultra-large 35 Index (and thus our Fund)each time we rebalance. We usually anticipate the merger of two of our companies, reducing the number back to 35. Forexample, this happened when Time Warner merged with AOL in 2003. The other way a company may exit our Index is whenone of the companies goes bankrupt—a very rare occurrence for ultra-large companies. AIG is an interesting, if veryunfortunate twist on this possibility.
While analysts claimed that AIG’s insurance business remained sound, bad bets (to put it mildly) on mortgage derivativesbrought about the company’s rapid demise and no white knight emerged to keep the financial markets from further unravel-ing. Once again, the Fed was forced to step in and orchestrate another government bailout, hugely diluting current investors’ownership in the process. While the U.S. government ensured AIG’s rescue from bankruptcy, shareholder wealth was largelywiped out, and since it was no longer an ultra-large company, it was booted from our index at the end of September—butonly after declining 91% for the year. This was the first blue chip “blowup” in our Fund’s eleven-year history. Previously, wesidestepped Enron, Worldcom, Wachovia and Washington Mutual.
www.bridgeway.com 105
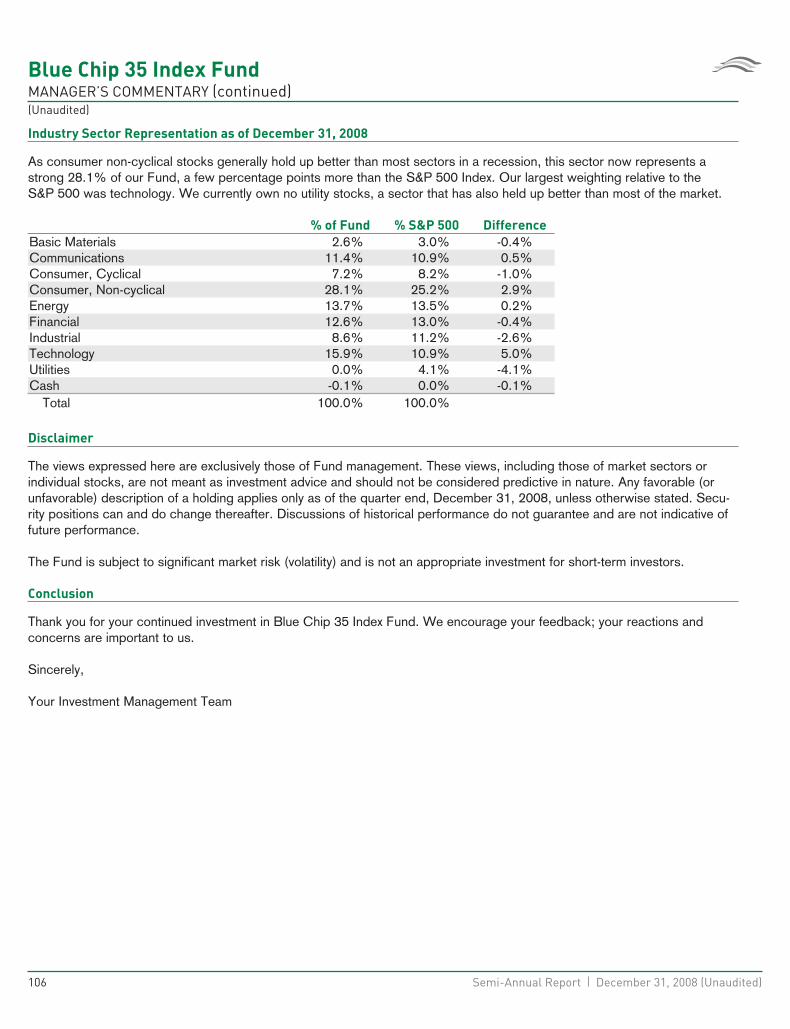
Blue Chip 35 Index FundMANAGER’S COMMENTARY (continued)(Unaudited)
Industry Sector Representation as of December 31, 2008
As consumer non-cyclical stocks generally hold up better than most sectors in a recession, this sector now represents astrong 28.1% of our Fund, a few percentage points more than the S&P 500 Index. Our largest weighting relative to theS&P 500 was technology. We currently own no utility stocks, a sector that has also held up better than most of the market.
% of Fund % S&P 500 Difference
Basic Materials 2.6% 3.0% -0.4%Communications 11.4% 10.9% 0.5%Consumer, Cyclical 7.2% 8.2% -1.0%Consumer, Non-cyclical 28.1% 25.2% 2.9%Energy 13.7% 13.5% 0.2%Financial 12.6% 13.0% -0.4%Industrial 8.6% 11.2% -2.6%Technology 15.9% 10.9% 5.0%Utilities 0.0% 4.1% -4.1%Cash -0.1% 0.0% -0.1%
Total 100.0% 100.0%
Disclaimer
The views expressed here are exclusively those of Fund management. These views, including those of market sectors orindividual stocks, are not meant as investment advice and should not be considered predictive in nature. Any favorable (orunfavorable) description of a holding applies only as of the quarter end, December 31, 2008, unless otherwise stated. Secu-rity positions can and do change thereafter. Discussions of historical performance do not guarantee and are not indicative offuture performance.
The Fund is subject to significant market risk (volatility) and is not an appropriate investment for short-term investors.
Conclusion
Thank you for your continued investment in Blue Chip 35 Index Fund. We encourage your feedback; your reactions andconcerns are important to us.
Sincerely,
Your Investment Management Team
106 Semi-Annual Report | December 31, 2008 (Unaudited)

THIS PAGE INTENTIONALLY LEFT BLANK
www.bridgeway.com 107
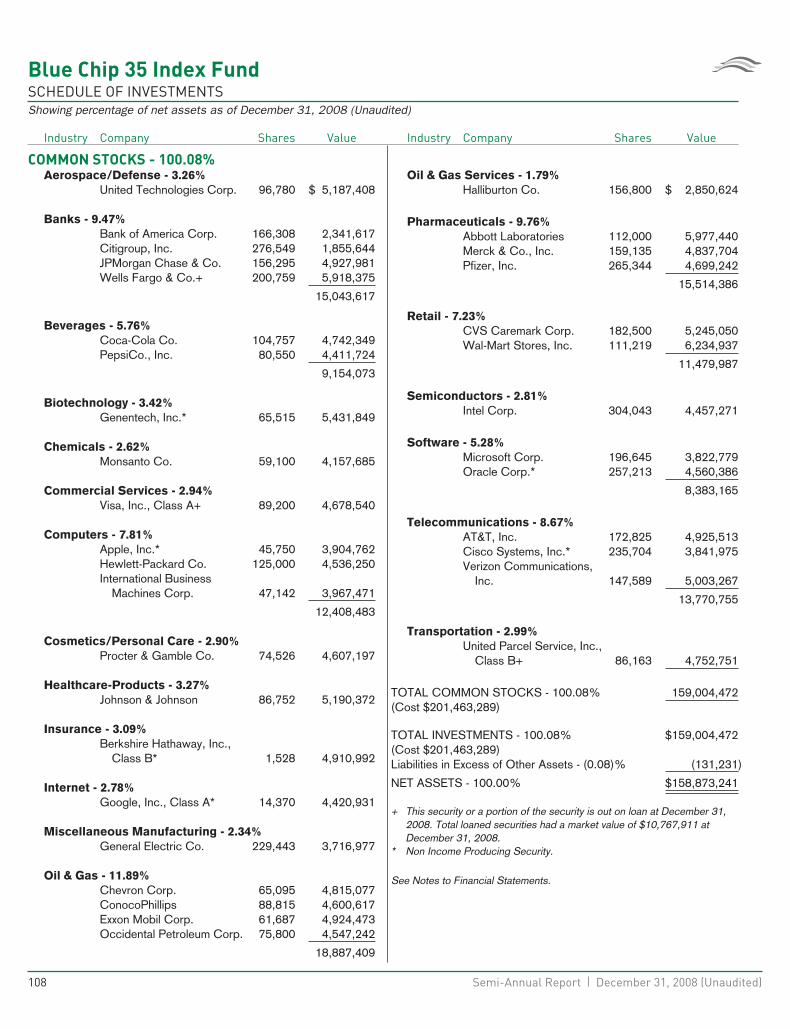
Blue Chip 35 Index FundSCHEDULE OF INVESTMENTSShowing percentage of net assets as of December 31, 2008 (Unaudited)
Industry Company Shares Value
COMMON STOCKS - 100.08%Aerospace/Defense - 3.26%
United Technologies Corp. 96,780 $ 5,187,408
Banks - 9.47%Bank of America Corp. 166,308 2,341,617Citigroup, Inc. 276,549 1,855,644JPMorgan Chase & Co. 156,295 4,927,981Wells Fargo & Co.+ 200,759 5,918,375
15,043,617
Beverages - 5.76%Coca-Cola Co. 104,757 4,742,349PepsiCo., Inc. 80,550 4,411,724
9,154,073
Biotechnology - 3.42%Genentech, Inc.* 65,515 5,431,849
Chemicals - 2.62%Monsanto Co. 59,100 4,157,685
Commercial Services - 2.94%Visa, Inc., Class A+ 89,200 4,678,540
Computers - 7.81%Apple, Inc.* 45,750 3,904,762Hewlett-Packard Co. 125,000 4,536,250International Business
Machines Corp. 47,142 3,967,471
12,408,483
Cosmetics/Personal Care - 2.90%Procter & Gamble Co. 74,526 4,607,197
Healthcare-Products - 3.27%Johnson & Johnson 86,752 5,190,372
Insurance - 3.09%Berkshire Hathaway, Inc.,
Class B* 1,528 4,910,992
Internet - 2.78%Google, Inc., Class A* 14,370 4,420,931
Miscellaneous Manufacturing - 2.34%General Electric Co. 229,443 3,716,977
Oil & Gas - 11.89%Chevron Corp. 65,095 4,815,077ConocoPhillips 88,815 4,600,617Exxon Mobil Corp. 61,687 4,924,473Occidental Petroleum Corp. 75,800 4,547,242
18,887,409
Industry Company Shares Value
Oil & Gas Services - 1.79%Halliburton Co. 156,800 $ 2,850,624
Pharmaceuticals - 9.76%Abbott Laboratories 112,000 5,977,440Merck & Co., Inc. 159,135 4,837,704Pfizer, Inc. 265,344 4,699,242
15,514,386
Retail - 7.23%CVS Caremark Corp. 182,500 5,245,050Wal-Mart Stores, Inc. 111,219 6,234,937
11,479,987
Semiconductors - 2.81%Intel Corp. 304,043 4,457,271
Software - 5.28%Microsoft Corp. 196,645 3,822,779Oracle Corp.* 257,213 4,560,386
8,383,165
Telecommunications - 8.67%AT&T, Inc. 172,825 4,925,513Cisco Systems, Inc.* 235,704 3,841,975Verizon Communications,
Inc. 147,589 5,003,267
13,770,755
Transportation - 2.99%United Parcel Service, Inc.,
Class B+ 86,163 4,752,751
TOTAL COMMON STOCKS - 100.08% 159,004,472(Cost $201,463,289)
TOTAL INVESTMENTS - 100.08% $159,004,472(Cost $201,463,289)Liabilities in Excess of Other Assets - (0.08)% (131,231)
NET ASSETS - 100.00% $158,873,241
+ This security or a portion of the security is out on loan at December 31,2008. Total loaned securities had a market value of $10,767,911 atDecember 31, 2008.
* Non Income Producing Security.
See Notes to Financial Statements.
108 Semi-Annual Report | December 31, 2008 (Unaudited)

THIS PAGE INTENTIONALLY LEFT BLANK
www.bridgeway.com 109
Balanced FundMANAGER’S COMMENTARY(Unaudited)
December 31, 2008
Dear Fellow Balanced Fund Shareholder:
For the quarter ending December 31, 2008, Balanced Fund fell by 9.19%, beating the 21.94% decline of the equity-onlyS&P 500 Index and the 13.49% loss experienced by its peer index, the Lipper Balanced Funds Index. Our Fund trailed theBalanced Benchmark which fell 7.16% and the fixed income-only Bloomberg/EFFAS US Government 1-3 Year Total ReturnBond Index, our primary market benchmark, which was up 2.69% for the quarter. As always, our investment objective is tomanage a conservative, balanced portfolio with volatility less than or equal to 40% of the of the S&P Index (i.e. 60% lessrisk). For the quarter, however, we slightly missed this objective, as our losses accounted for 41.9% of those of the S&P500. While we received attractive premiums throughout the quarter on written options that expired worthless, the strategyfailed to serve as much of a hedge with many of the underlying stocks declining in the value along with the rest of the equitymarkets.
For the six-month period ending December 31, 2008, the Balanced Fund declined 15.47%, beating the 28.48% decline ofthe S&P 500 Index and the peer benchmark, the Lipper Balanced Funds Index, which lost 20.74%. The Fund lost by a con-siderable margin to the 8.66% decline of the Balanced Benchmark and the Bloomberg/EFFAS US Government 1-3 YearTotal Return Bond Index, which was up 4.55% for the six-month period. While many of our losses could be traced to theoverall equity market downturn, we also had poor performances from some of our growth picks during the six-month period.Our strategies stay constant and consistent in both good times and bad, and long-term results always will remain the keyobjective of our firm. We are pleased that our Fund has outperformed each of the benchmarks other than the fixed income-only index since inception in 2001, and that our use of options and derivatives has been successful over the long term.However, we realize that such longer-term results offer little consolation for the more recent returns. We assure our investors(ourselves included) that we will continue to work hard for them to overcome the difficulties brought about by this dire eco-nomic and financial environment.
The results for the full year 2008 look even less favorable. Balanced Fund dropped by 19.38%, trailing the Balanced Bench-mark, which declined 10.78% and the fixed income-only Bloomberg/EFFAS US Government 1-3 Year Total Return BondIndex, up 6.70, while outperforming the peer index Lipper Balanced Funds Index which lost 25.73%. Our loss represented52.4% of the decline of the S&P 500 (-37%), so we again failed to meet our objective of only experiencing 40% of the vola-tility of the equity-only index.
Our hybrid total-return Fund invests in both equity and fixed income securities, while incorporating an options strategydesigned to produce a conservative, lower volatility balanced portfolio. During very favorable equity market conditions, theFund often under-performs many of the more aggressive benchmarks. On the other hand, when stocks struggle and investorsseek the safe haven of more conservative bonds, Balanced Fund tends to perform better than the equity-only indexes.
The table below presents our December quarter, six-month, one-year, five-year and life-to-date financial results according tothe formula required by the SEC. A graph of quarterly performance since inception appears on the following page.
Dec, Qtr.
10/1/08
to 12/31/08
Six-Month
7/1/08
to 12/31/08
1 Year
1/1/08
to 12/31/08
5 Year
1/1/04
to 12/31/08
Life-to-Date
6/30/01
to 12/31/08
Balanced Fund -9.19% -15.47% -19.38% 1.07% 2.13%Balanced Benchmark -7.16% -8.66% -10.78% 1.71% 2.01%S&P 500 Index -21.94% -28.48% -37.00% -2.19% -2.18%Bloomberg/EFFAS U.S. Government
1-3 Year Total Return Bond Index 2.69% 4.55% 6.70% 4.01% 4.29%Lipper Balanced Funds Index -13.49% -20.74% -25.73% 0.24% 0.87%
Performance figures quoted in the table above and graph on the next page represent past performance and are no guaranteeof future results. The table above and graph below do not reflect the deduction of taxes that a shareholder would pay on Funddistributions or the redemption of Fund shares.
110 Semi-Annual Report | December 31, 2008 (Unaudited)
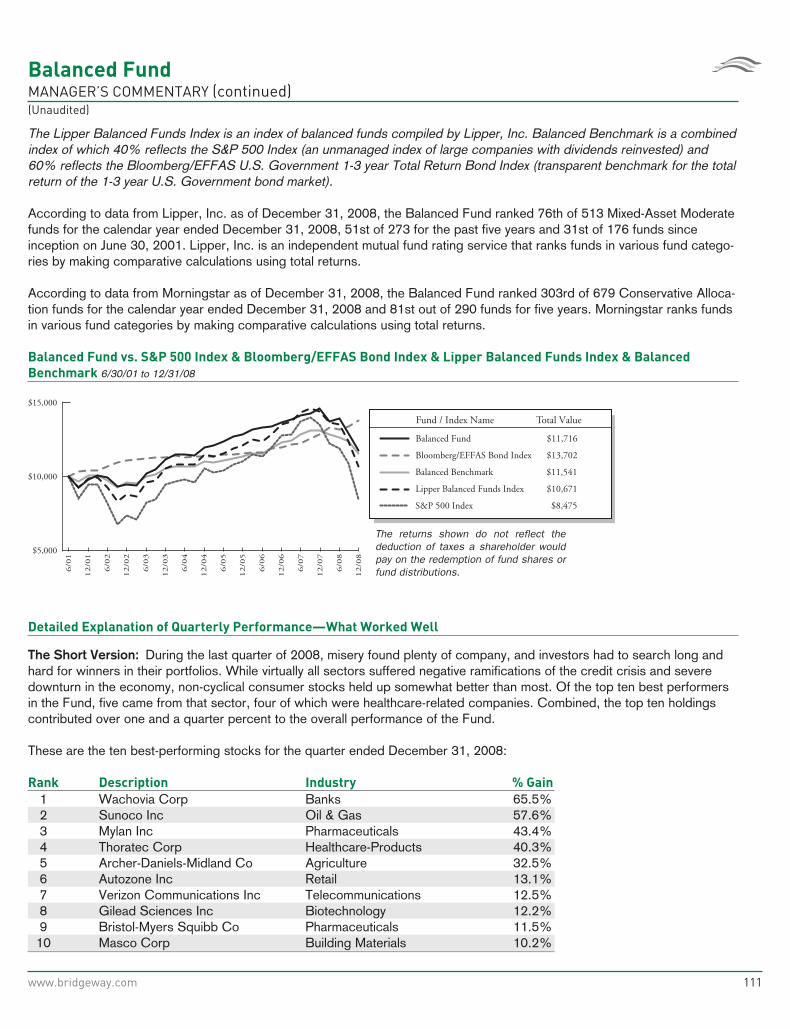
Balanced FundMANAGER’S COMMENTARY (continued)(Unaudited)
The Lipper Balanced Funds Index is an index of balanced funds compiled by Lipper, Inc. Balanced Benchmark is a combinedindex of which 40% reflects the S&P 500 Index (an unmanaged index of large companies with dividends reinvested) and60% reflects the Bloomberg/EFFAS U.S. Government 1-3 year Total Return Bond Index (transparent benchmark for the totalreturn of the 1-3 year U.S. Government bond market).
According to data from Lipper, Inc. as of December 31, 2008, the Balanced Fund ranked 76th of 513 Mixed-Asset Moderatefunds for the calendar year ended December 31, 2008, 51st of 273 for the past five years and 31st of 176 funds sinceinception on June 30, 2001. Lipper, Inc. is an independent mutual fund rating service that ranks funds in various fund catego-ries by making comparative calculations using total returns.
According to data from Morningstar as of December 31, 2008, the Balanced Fund ranked 303rd of 679 Conservative Alloca-tion funds for the calendar year ended December 31, 2008 and 81st out of 290 funds for five years. Morningstar ranks fundsin various fund categories by making comparative calculations using total returns.
Balanced Fund vs. S&P 500 Index & Bloomberg/EFFAS Bond Index & Lipper Balanced Funds Index & Balanced
Benchmark 6/30/01 to 12/31/08
Fund / Index Name Total Value
The returns shown do not reflect the deduction of taxes a shareholder would pay on the redemption of fund shares or fund distributions.
Balanced Fund $11,716
Lipper Balanced Funds Index $10,671
Bloomberg/EFFAS Bond Index $13,702
Balanced Benchmark $11,541
S&P 500 Index $8,475
$5,000
$10,000
$15,000
12/0
5
6/0
5
12/0
7
6/0
7
12/0
8
6/0
8
12/0
6
6/0
6
12/0
4
6/0
4
12/0
3
6/0
3
12/0
2
6/0
2
12/0
1
6/0
1
Detailed Explanation of Quarterly Performance—What Worked Well
The Short Version: During the last quarter of 2008, misery found plenty of company, and investors had to search long andhard for winners in their portfolios. While virtually all sectors suffered negative ramifications of the credit crisis and severedownturn in the economy, non-cyclical consumer stocks held up somewhat better than most. Of the top ten best performersin the Fund, five came from that sector, four of which were healthcare-related companies. Combined, the top ten holdingscontributed over one and a quarter percent to the overall performance of the Fund.
These are the ten best-performing stocks for the quarter ended December 31, 2008:
Rank Description Industry % Gain
1 Wachovia Corp Banks 65.5%2 Sunoco Inc Oil & Gas 57.6%3 Mylan Inc Pharmaceuticals 43.4%4 Thoratec Corp Healthcare-Products 40.3%5 Archer-Daniels-Midland Co Agriculture 32.5%6 Autozone Inc Retail 13.1%7 Verizon Communications Inc Telecommunications 12.5%8 Gilead Sciences Inc Biotechnology 12.2%9 Bristol-Myers Squibb Co Pharmaceuticals 11.5%
10 Masco Corp Building Materials 10.2%
www.bridgeway.com 111
Balanced FundMANAGER’S COMMENTARY (continued)(Unaudited)
Mylan Inc. is one of the world’s leading generic and specialty pharmaceutical companies that distributes products in morethan 140 countries across the globe. In October, the company announced much better than expected earnings as sales tri-pled in the third quarter. Mylan has started to reap nice benefits from its purchase of Merck’s generics business (cheaperdrugs during a recession) and also recognized some deferred revenues during the past three months from its sale of a bloodpressure medication, Bystolic. Late in the year, the company got FDA approval to begin selling a generic version of an HIVdrug produced by Bristol-Myers Squibb. The holding increased over 40% in the quarter and was the third best performer inthe Fund.
Detailed Explanation of Quarterly Performance—What Didn’t Work
The Short Version: Much of the current negative economic and market conditions stem from the subprime mortgagedebacle and other problems with poor lending and toxic securities at the nation’s financial companies. While the negativityhas spread to all other sectors, financials continue to struggle in this depressed environment. Five of the worst performersover the past three months were financial services-related and, combined, they cost the Fund over two percent in return.
These are the ten worst-performing stocks for the quarter ended December 31, 2008:
Rank Description Industry % Loss
1 Cliffs Natural Resources Inc Iron/Steel -70.3%2 Sprint Nextel Corp Telecommunications -70.0%3 Citigroup Inc Banks -68.6%4 Genworth Financial Inc Insurance -67.1%5 Dillard’s Inc Retail -66.4%6 Bank of America Corp Banks -61.8%7 Massey Energy Co Coal -61.3%8 E*Trade Financial Corp Diversified Financial Services -58.9%9 Prudential Financial Inc Insurance -58.7%
10 Kansas City Southern Transportation -58.6%
Initially considered the “white knight” for the financial services world, banking giant Bank of America fell on hard times of itsown during the past quarter, as the recession accelerated, the bailout began, and shareholders worried about how the com-pany would “synergize” with its latest acquisitions. In July, Bank of America welcomed Countrywide (of subprime lendinginfamy) into its family and in September announced plans to rescue brokerage behemoth Merrill Lynch from a fate similar asLehman and Bear Stearns. By October, it accepted government funds as a participant in the TARP bailout plan, and its stockbegan a steady freefall once investors realized the true magnitude of the financial crisis. In December, Bank of Americashareholders approved the Merrill deal, but at a valuation far less than initially negotiated. Its share price had droppeddramatically since the announcement. The transaction made Bank of America the largest domestic brokerage and wealthmanagement shop (at a time that those businesses seem to be out of favor). The company plans to lay off about 30,000employees as it incorporates Merrill into its operations. Its stock price plunged over 60% during the quarter and cost theFund over a one and a quarter percent in return.
Detailed Explanation of Calendar Year Performance—What Worked Well
The Short Version: Healthcare highlighted the Fund’s best performers in 2008 with three related firms (biotech, pharmaceut-ical and medical devices) in the top ten list. Combined, the three companies contributed over a third of a percent to theFund’s performance. Somehow a few retailers even snuck onto the list despite the gloom and doom experienced throughoutthe year. This is further proof that the models often reveal some positive needles in a negative haystack.
112 Semi-Annual Report | December 31, 2008 (Unaudited)
Balanced FundMANAGER’S COMMENTARY (continued)(Unaudited)
Here are the ten best-performing companies for the calendar year ended December 31, 2008:
Rank Description Industry % Gain
1 Mylan Inc Pharmaceuticals 43.4%2 Thoratec Corp Healthcare-Products 40.3%3 Anheuser-Busch Cos Inc Beverages 28.9%4 Safeco Corp Insurance 22.6%5 Rowan Cos Inc Oil & Gas 16.9%6 Autozone Inc Retail 16.3%7 Wal-Mart Stores Inc Retail 14.5%8 Potash Corp of Saskatchewan Chemicals 12.1%9 Gilead Sciences Inc Biotechnology 11.2%
10 Masco Corp Building Materials 10.2%
Thoratec Corporation manufactures circulatory medical devices for heart patients. In December, the company reported that aclinical trial for its HeartMate II pump produced excellent results, and management believes it could receive its next round ofFDA approval more quickly than originally expected. Currently, the HeartMate II is considered a temporary treatment forpatients in need of heart transplants, but the strong data could speed up the approval process and make the device availablefor more candidates. The good news was not limited to the past three months, however. In late July, the company postedquarterly earnings that far exceeded analysts’ expectations based on the favorable treatment results of its existing medicalproduct line. For the year, Thoratec returned over 40% and contributed almost a quarter of a percent to the performance ofthe Fund.
Detailed Explanation of Calendar Year Performance—What Didn’t Work
The Short Version: Managers and investors alike would love to forget 2008, as 58 companies within the Fund lost over 50%in value. While no sector was immune, financials again highlighted the list of poor performers. Each of the ten worst perform-ers plunged by over 70% and, combined they cost the Fund over two and three quarters percent in return.
These are the ten worst-performing stocks for the calendar year ended December 31, 2008:
Rank Description Industry % Loss
1 Genworth Financial Inc Insurance -88.9%2 Bear Stearns Cos Inc Equity Fund -87.8%3 Sprint Nextel Corp Telecommunications -86.1%4 Ciena Corp Telecommunications -80.4%5 Hartford Financial Services
Group Inc Insurance -78.9%6 Office Depot Inc Retail -78.6%7 Cliffs Natural Resources Inc Iron/Steel -75.8%8 International Game Technology Entertainment -72.9%9 Wachovia Corp Banks -71.6%
10 Citigroup Inc Banks -71.6%
In March, Bear Stearns became the first bailout “beneficiary”. The one-time investment giant was sold to JPMorgan Chase ina deal arranged by the Federal Reserve. More than many of its competitors, Bear Stearns had ridden the mortgage derivativegame to great profitability before crashing in its wake as the market dramatically deteriorated. With other banks, investmenthouses, and hedge funds financially interconnected to the eight-decade old firm, Fed Chair Bernanke believed that its outrightfailure was not an option and a “bailout” was in order. Bear Stearns was one of four holdings to lose more than 80% during2008.
www.bridgeway.com 113
Balanced FundMANAGER’S COMMENTARY (continued)(Unaudited)
Background on Fixed Income Securities Strategy
While many investors sought the safe-haven of US Treasuries during the quarter (and calendar year), other fixed incomesecurities (even the highest quality corporate notes) suffered from the frozen credit markets. Of our bond holdings, the vastmajority were short-duration Treasuries with only a small percentage (less than 10%) representing corporate notes. It hasalways been our mandate to take minimal interest rate and duration risk. In this environment, however, investors may begin tofind some seemingly attractive yields in the high quality corporate and municipal markets. Spreads on these securities havewidened significantly, as investors continue their flight-to-quality into the sheer (perceived) safety of government securities.
Top Ten Equity Holdings as of December 31, 2008
Healthcare companies highlighted the Fund’s top ten holdings with four related stocks in the list at year-end. Four of our larg-est positions were also among the Fund’s top performers of the quarter: Bristol-Myers Squibb, Verizon, Archer Daniels Mid-land, and Thoratec. No one holding accounted for greater than 2.3% of the net assets, indicating that the Fund was well-diversified across many companies in this difficult environment for stocks. The ten largest positions represented just under15% of the total assets of the Fund.
Rank Description Industry
% of
Net Assets
1 Bristol-Myers Squibb Co Pharmaceuticals 2.3%2 Verizon Communications Inc Telecommunications 2.2%3 AT&T Inc Telecommunications 1.8%4 Archer Daniels Midland Co Agriculture 1.4%5 Thoratec Corp Healthcare-Products 1.2%6 US Bancorp Banks 1.2%7 Union Pacific Corp Transportation 1.1%8 St Jude Medical Inc Healthcare-Products 1.1%9 Celgene Corp Biotechnology 1.0%
10 Exxon Mobil Corp Oil & Gas 1.0%14.3%
Industry Sector Representation as of December 31, 2008
As of December 31, 2008, equities comprised about 65% of the Fund’s allocation, while U.S. government obligations madeup just over 30% of its net assets. The Fund also maintained a relatively small allocation to corporate notes, as spreads oncertain high quality securities have started to look quite attractive. Consumer non-cyclicals represented the largest equityallocation within the Fund by far and healthcare-related companies were among our best performers. Virtually no sector wasspared the negativity of the past three months (and full year, for that matter), and our positions within financials, energy, andindustrials, in particular, dramatically hindered the overall performance of the Fund.
114 Semi-Annual Report | December 31, 2008 (Unaudited)
Balanced FundMANAGER’S COMMENTARY (continued)(Unaudited)
Common Stock 65.3%Basic Materials 3.7%Communications 8.7%Consumer, Cyclical 3.9%Consumer, Non-cyclical 19.4%Energy 6.8%Financial 8.4%Industrial 7.3%Technology 5.1%Utilities 2.0%
U.S. Government Obligations 31.4%Corporate Notes 3.1%Covered Call Options Written -1.6%Put Options Written -0.3%Money Market Funds 0.0%Other Assets in Excess of Liabilities 2.1%
Total 100.0%
Disclaimer
The views expressed here are exclusively those of Fund management. These views, including those of market sectors orindividual stocks, are not meant as investment advice and should not be considered predictive in nature. Any favorable (orunfavorable) description of a holding applies only as of the quarter end, December 31, 2008, unless otherwise stated. Secu-rity positions can and do change thereafter. Discussions of historical performance do not guarantee and are not indicative offuture performance.
Market volatility can significantly affect short-term performance. The Fund is not an appropriate investment for short-terminvestors. Investments in the small companies within this multi-cap fund generally carry greater risk than is customarily asso-ciated with larger companies. This additional risk is attributable to a number of factors, including the relatively limited financialresources that are typically available to small companies, and the fact that small companies often have comparatively limitedproduct lines. In addition, the stock of small companies tends to be more volatile than the stock of large companies, partic-ularly in the short term and particularly in the early stages of an economic or market downturn. The Fund’s use of options,futures, and leverage can magnify the risk of loss in an unfavorable market, and the Fund’s use of short-sale positions can, intheory, expose shareholders to unlimited loss. Shareholders of the Fund, therefore, are taking on more risk than they would ifthey invested in the stock market as a whole. The Fund uses an option writing strategy in which the Fund may sell coveredcalls or secured put options. Up to 75% of Fund assets may be invested in options. Options are subject to special risks andmay not fully protect the Fund against declines in the value of its stocks. In addition, an option writing strategy limits theupside profit potential normally associated with stocks. Finally, the Fund’s fixed-income holdings are subject to three types ofrisk. Interest rate risk is the chance that bond prices overall will decline as interest rates rise. Credit risk is the chance a bondissuer will fail to pay interest and principal. Prepayment risk is the chance a mortgage-backed bond issuer will repay a higheryielding bond, resulting in a lower paying yield.
Conclusion
Thank you for your continued investment in Balanced Fund. We encourage your feedback; your reactions and concerns areimportant to us.
Sincerely,
Your Investment Management Team
www.bridgeway.com 115
Balanced FundSCHEDULE OF INVESTMENTSShowing percentage of net assets as of December 31, 2008 (Unaudited)
Industry Company Shares Value
COMMON STOCKS - 65.28%Advertising - 0.10%
Omnicom Group, Inc. 2,000 $ 53,840
Aerospace/Defense - 1.19%General Dynamics Corp. 1,400 80,626Goodrich Corp. 1,800 66,636Lockheed Martin Corp. 3,470 291,758Northrop Grumman Corp. 2,200 99,088United Technologies Corp. 1,740 93,264
631,372
Agriculture - 1.39%Archer-Daniels-Midland Co. 25,600 738,048
Apparel - 0.33%Coach, Inc.* 4,600 95,542NIKE, Inc., Class B 1,600 81,600
177,142
Banks - 4.99%Bank of America Corp.# 17,100 240,768Bank of New York Mellon Corp. 11,332 321,036BB&T Corp.# 5,800 159,268Citigroup, Inc. 5,100 34,221Comerica, Inc. 3,600 71,460Goldman Sachs Group, Inc.# 1,100 92,829JPMorgan Chase & Co. 4,300 135,579KeyCorp. 9,900 84,348Marshall & Ilsley Corp.+ 8,200 111,848Morgan Stanley+ 3,000 48,120State Street Corp. 5,800 228,114SunTrust Banks, Inc. 5,800 171,332US Bancorp#+ 25,300 632,753Wachovia Corp. 7,389 40,935Wells Fargo & Co.+ 9,600 283,008
2,655,619
Beverages - 1.37%Brown-Forman Corp., Class B 2,950 151,895Coca-Cola Co. 3,900 176,553Dr Pepper Snapple Group,
Inc.* 5,700 92,625Pepsi Bottling Group, Inc. 4,400 99,044PepsiCo., Inc. 3,800 208,126
728,243
Biotechnology - 3.02%Biogen Idec, Inc.*+ 2,200 104,786Celgene Corp.*# 10,000 552,800Genzyme Corp.* 1,800 119,466Gilead Sciences, Inc.* 9,800 501,172Myriad Genetics, Inc.*# 5,000 331,300
1,609,524
Industry Company Shares Value
Building Materials - 0.15%Masco Corp.# 7,100 $ 79,023
Chemicals - 3.44%CF Industries Holdings, Inc.# 7,200 353,952Dow Chemical Co.# 16,600 250,494Monsanto Co.# 4,700 330,645Mosaic Co. 7,100 245,660Sherwin-Williams Co. 3,500 209,125Sigma-Aldrich Corp. 2,900 122,496Terra Industries, Inc.# 19,100 318,397
1,830,769
Coal - 0.30%Massey Energy Co.# 8,900 122,731Peabody Energy Corp. 1,700 38,675
161,406
Commercial Services - 0.62%Automatic Data Processing,
Inc.+ 3,700 145,558Equifax, Inc. 2,600 68,952Moody’s Corp. 800 16,072Paychex, Inc.+ 2,200 57,816Western Union Co. 3,000 43,020
331,418
Computers - 2.15%Apple, Inc.*+ 5,200 443,820EMC Corp.* 7,300 76,431Hewlett-Packard Co. 7,800 283,062International Business
Machines Corp.+ 1,000 84,160Lexmark International, Inc.,
Class A*+ 3,000 80,700NetApp, Inc.*# 5,800 81,026Teradata Corp.*# 6,300 93,429
1,142,628
Cosmetics/Personal Care - 1.38%Avon Products, Inc.# 5,700 136,971Colgate-Palmolive Co.#+ 4,400 301,576Estee Lauder Cos., Inc.,
Class A 1,600 49,536Procter & Gamble Co.# 4,000 247,280
735,363
Distribution/Wholesale - 0.07%WW Grainger, Inc.+ 500 39,420
116 Semi-Annual Report | December 31, 2008 (Unaudited)
Balanced FundSCHEDULE OF INVESTMENTS (continued)Showing percentage of net assets as of December 31, 2008 (Unaudited)
Industry Company Shares Value
Common Stocks (continued)
Diversified Financial Services - 0.81%Ameriprise Financial, Inc.# 2,780 $ 64,941Charles Schwab Corp. 9,700 156,849E*Trade Financial Corp.* 11,400 13,110Franklin Resources, Inc.# 2,800 178,584Merrill Lynch & Co., Inc. 1,000 11,640SLM Corp.* 810 7,209
432,333
Electric Utilities - 1.40%AES Corp.*# 14,100 116,184Allegheny Energy, Inc.# 2,300 77,878Dominion Resources, Inc. 5,620 201,421Exelon Corp. 1,100 61,171Pepco Holdings, Inc. 3,700 65,712Progress Energy, Inc.+ 1,900 75,715Public Service Enterprise Group,
Inc. 5,100 148,767
746,848
Electrical Components & Equipment - 0.58%Emerson Electric Co.+ 3,600 131,796Energy Conversion Devices,
Inc.*# 7,000 176,470
308,266
Electronics - 0.15%Thermo Fisher Scientific, Inc.* 2,300 78,361
Engineering & Construction - 0.13%Fluor Corp.+ 1,600 71,792
Entertainment - 0.03%International Game Technology 1,200 14,268
Environmental Control - 0.04%Republic Services, Inc., Class A 810 20,080
Food - 1.07%Campbell Soup Co. 3,200 96,032General Mills, Inc. 1,200 72,900Kraft Foods, Inc., Class A 3,400 91,290Kroger Co. 3,800 100,358Safeway, Inc. 8,700 206,799
567,379
Forest Products & Paper - 0.10%International Paper Co.# 4,500 53,100
Industry Company Shares Value
Gas - 0.56%Nicor, Inc. 1,200 $ 41,688Sempra Energy 6,000 255,780
297,468
Healthcare-Products - 4.63%Baxter International, Inc. 6,500 348,335Becton Dickinson & Co. 3,420 233,894CR Bard, Inc. 2,600 219,076Hospira, Inc.* 7,700 206,514Medtronic, Inc. 1,000 31,420St. Jude Medical, Inc.*# 17,080 562,957Stryker Corp.+ 5,260 210,137Thoratec Corp.*# 20,000 649,800
2,462,133
Healthcare-Services - 0.67%Aetna, Inc. 1,800 51,300CIGNA Corp. 2,700 45,495Humana, Inc.* 1,000 37,280Laboratory Corp. of America
Holdings*+ 800 51,528Quest Diagnostics, Inc. 1,500 77,865UnitedHealth Group, Inc. 3,600 95,760
359,228
Household Products/Wares - 0.43%Clorox Co.# 1,530 85,007Kimberly-Clark Corp.# 2,700 142,398
227,405
Insurance - 2.64%Aflac, Inc. 800 36,672Allstate Corp.# 1,000 32,760AON Corp. 3,500 159,880Berkshire Hathaway, Inc.,
Class B* 120 385,680Chubb Corp. 4,500 229,500Genworth Financial, Inc.,
Class A 2,600 7,358MetLife, Inc.# 4,600 160,356Principal Financial Group, Inc. 4,700 106,079Progressive Corp. 5,520 81,751Travelers Cos., Inc. 4,500 203,400
1,403,436
Internet - 0.85%Amazon.com, Inc.*# 3,100 158,968eBay, Inc.* 6,900 96,324Google, Inc., Class A* 600 184,590Yahoo!, Inc.* 1,000 12,200
452,082
www.bridgeway.com 117
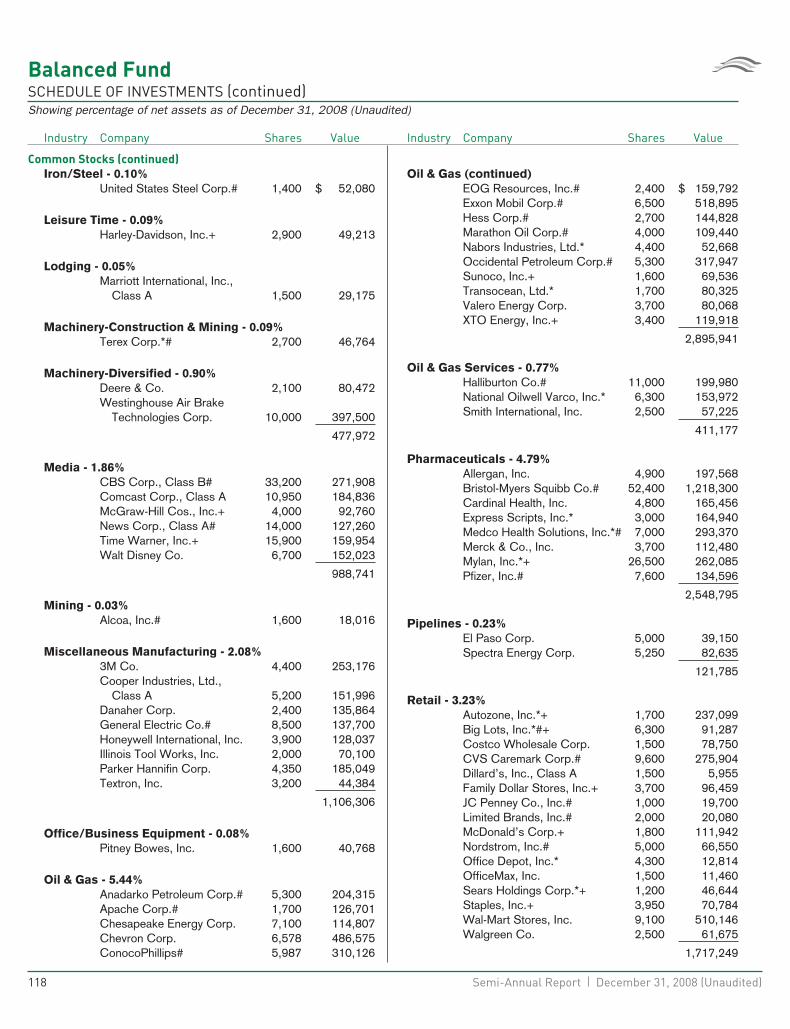
Balanced FundSCHEDULE OF INVESTMENTS (continued)Showing percentage of net assets as of December 31, 2008 (Unaudited)
Industry Company Shares Value
Common Stocks (continued)
Iron/Steel - 0.10%United States Steel Corp.# 1,400 $ 52,080
Leisure Time - 0.09%Harley-Davidson, Inc.+ 2,900 49,213
Lodging - 0.05%Marriott International, Inc.,
Class A 1,500 29,175
Machinery-Construction & Mining - 0.09%Terex Corp.*# 2,700 46,764
Machinery-Diversified - 0.90%Deere & Co. 2,100 80,472Westinghouse Air Brake
Technologies Corp. 10,000 397,500
477,972
Media - 1.86%CBS Corp., Class B# 33,200 271,908Comcast Corp., Class A 10,950 184,836McGraw-Hill Cos., Inc.+ 4,000 92,760News Corp., Class A# 14,000 127,260Time Warner, Inc.+ 15,900 159,954Walt Disney Co. 6,700 152,023
988,741
Mining - 0.03%Alcoa, Inc.# 1,600 18,016
Miscellaneous Manufacturing - 2.08%3M Co. 4,400 253,176Cooper Industries, Ltd.,
Class A 5,200 151,996Danaher Corp. 2,400 135,864General Electric Co.# 8,500 137,700Honeywell International, Inc. 3,900 128,037Illinois Tool Works, Inc. 2,000 70,100Parker Hannifin Corp. 4,350 185,049Textron, Inc. 3,200 44,384
1,106,306
Office/Business Equipment - 0.08%Pitney Bowes, Inc. 1,600 40,768
Oil & Gas - 5.44%Anadarko Petroleum Corp.# 5,300 204,315Apache Corp.# 1,700 126,701Chesapeake Energy Corp. 7,100 114,807Chevron Corp. 6,578 486,575ConocoPhillips# 5,987 310,126
Industry Company Shares Value
Oil & Gas (continued)EOG Resources, Inc.# 2,400 $ 159,792Exxon Mobil Corp.# 6,500 518,895Hess Corp.# 2,700 144,828Marathon Oil Corp.# 4,000 109,440Nabors Industries, Ltd.* 4,400 52,668Occidental Petroleum Corp.# 5,300 317,947Sunoco, Inc.+ 1,600 69,536Transocean, Ltd.* 1,700 80,325Valero Energy Corp. 3,700 80,068XTO Energy, Inc.+ 3,400 119,918
2,895,941
Oil & Gas Services - 0.77%Halliburton Co.# 11,000 199,980National Oilwell Varco, Inc.* 6,300 153,972Smith International, Inc. 2,500 57,225
411,177
Pharmaceuticals - 4.79%Allergan, Inc. 4,900 197,568Bristol-Myers Squibb Co.# 52,400 1,218,300Cardinal Health, Inc. 4,800 165,456Express Scripts, Inc.* 3,000 164,940Medco Health Solutions, Inc.*# 7,000 293,370Merck & Co., Inc. 3,700 112,480Mylan, Inc.*+ 26,500 262,085Pfizer, Inc.# 7,600 134,596
2,548,795
Pipelines - 0.23%El Paso Corp. 5,000 39,150Spectra Energy Corp. 5,250 82,635
121,785
Retail - 3.23%Autozone, Inc.*+ 1,700 237,099Big Lots, Inc.*#+ 6,300 91,287Costco Wholesale Corp. 1,500 78,750CVS Caremark Corp.# 9,600 275,904Dillard’s, Inc., Class A 1,500 5,955Family Dollar Stores, Inc.+ 3,700 96,459JC Penney Co., Inc.# 1,000 19,700Limited Brands, Inc.# 2,000 20,080McDonald’s Corp.+ 1,800 111,942Nordstrom, Inc.# 5,000 66,550Office Depot, Inc.* 4,300 12,814OfficeMax, Inc. 1,500 11,460Sears Holdings Corp.*+ 1,200 46,644Staples, Inc.+ 3,950 70,784Wal-Mart Stores, Inc. 9,100 510,146Walgreen Co. 2,500 61,675
1,717,249
118 Semi-Annual Report | December 31, 2008 (Unaudited)
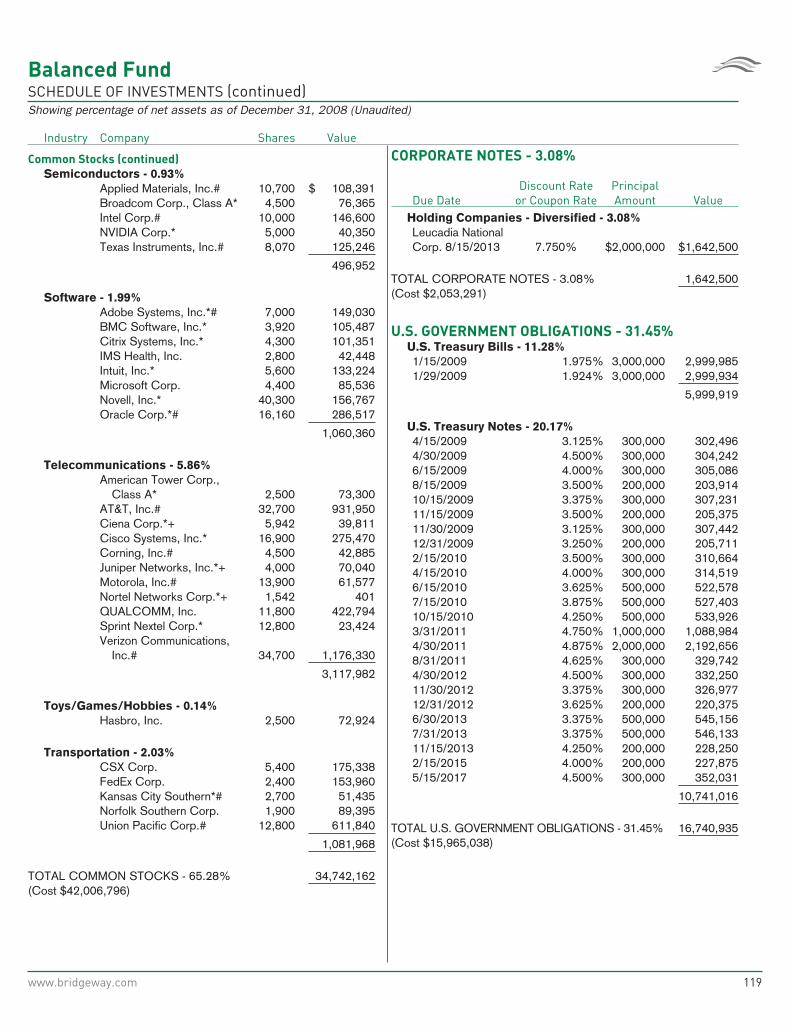
Balanced FundSCHEDULE OF INVESTMENTS (continued)Showing percentage of net assets as of December 31, 2008 (Unaudited)
Industry Company Shares Value
Common Stocks (continued)
Semiconductors - 0.93%Applied Materials, Inc.# 10,700 $ 108,391Broadcom Corp., Class A* 4,500 76,365Intel Corp.# 10,000 146,600NVIDIA Corp.* 5,000 40,350Texas Instruments, Inc.# 8,070 125,246
496,952
Software - 1.99%Adobe Systems, Inc.*# 7,000 149,030BMC Software, Inc.* 3,920 105,487Citrix Systems, Inc.* 4,300 101,351IMS Health, Inc. 2,800 42,448Intuit, Inc.* 5,600 133,224Microsoft Corp. 4,400 85,536Novell, Inc.* 40,300 156,767Oracle Corp.*# 16,160 286,517
1,060,360
Telecommunications - 5.86%American Tower Corp.,
Class A* 2,500 73,300AT&T, Inc.# 32,700 931,950Ciena Corp.*+ 5,942 39,811Cisco Systems, Inc.* 16,900 275,470Corning, Inc.# 4,500 42,885Juniper Networks, Inc.*+ 4,000 70,040Motorola, Inc.# 13,900 61,577Nortel Networks Corp.*+ 1,542 401QUALCOMM, Inc. 11,800 422,794Sprint Nextel Corp.* 12,800 23,424Verizon Communications,
Inc.# 34,700 1,176,330
3,117,982
Toys/Games/Hobbies - 0.14%Hasbro, Inc. 2,500 72,924
Transportation - 2.03%CSX Corp. 5,400 175,338FedEx Corp. 2,400 153,960Kansas City Southern*# 2,700 51,435Norfolk Southern Corp. 1,900 89,395Union Pacific Corp.# 12,800 611,840
1,081,968
TOTAL COMMON STOCKS - 65.28% 34,742,162(Cost $42,006,796)
CORPORATE NOTES - 3.08%
Due DateDiscount Rate
or Coupon RatePrincipalAmount Value
Holding Companies - Diversified - 3.08%Leucadia NationalCorp. 8/15/2013 7.750% $2,000,000 $1,642,500
TOTAL CORPORATE NOTES - 3.08% 1,642,500(Cost $2,053,291)
U.S. GOVERNMENT OBLIGATIONS - 31.45%U.S. Treasury Bills - 11.28%1/15/2009 1.975% 3,000,000 2,999,9851/29/2009 1.924% 3,000,000 2,999,934
5,999,919
U.S. Treasury Notes - 20.17%4/15/2009 3.125% 300,000 302,4964/30/2009 4.500% 300,000 304,2426/15/2009 4.000% 300,000 305,0868/15/2009 3.500% 200,000 203,91410/15/2009 3.375% 300,000 307,23111/15/2009 3.500% 200,000 205,37511/30/2009 3.125% 300,000 307,44212/31/2009 3.250% 200,000 205,7112/15/2010 3.500% 300,000 310,6644/15/2010 4.000% 300,000 314,5196/15/2010 3.625% 500,000 522,5787/15/2010 3.875% 500,000 527,40310/15/2010 4.250% 500,000 533,9263/31/2011 4.750% 1,000,000 1,088,9844/30/2011 4.875% 2,000,000 2,192,6568/31/2011 4.625% 300,000 329,7424/30/2012 4.500% 300,000 332,25011/30/2012 3.375% 300,000 326,97712/31/2012 3.625% 200,000 220,3756/30/2013 3.375% 500,000 545,1567/31/2013 3.375% 500,000 546,13311/15/2013 4.250% 200,000 228,2502/15/2015 4.000% 200,000 227,8755/15/2017 4.500% 300,000 352,031
10,741,016
TOTAL U.S. GOVERNMENT OBLIGATIONS - 31.45% 16,740,935(Cost $15,965,038)
www.bridgeway.com 119

Balanced FundSCHEDULE OF INVESTMENTS (continued)Showing percentage of net assets as of December 31, 2008 (Unaudited)
Industry Company Shares Value
PURCHASED CALL OPTIONS - 0.15%Pfizer, Inc.
Expiring January, 2010 at$20.00 550 $ 77,825
TOTAL PURCHASED CALL OPTIONS - 0.15% 77,825(Cost $115,234)
TOTAL INVESTMENTS - 97.93% $53,203,422(Cost $60,140,359)Other Assets in Excess of Liabilities - 2.07% 18,765
NET ASSETS - 100.00% $53,222,187
* Non Income Producing Security.# Security subject to call option written by the Fund.+ This security or a portion of the security is out on loan at December 31,
2008. Total loaned securities had a market value of $3,791,244 atDecember 31, 2008.
(a) Rate represents the effective yield at purchase.Ltd – Limited
See Notes to Financial Statements.
120 Semi-Annual Report | December 31, 2008 (Unaudited)
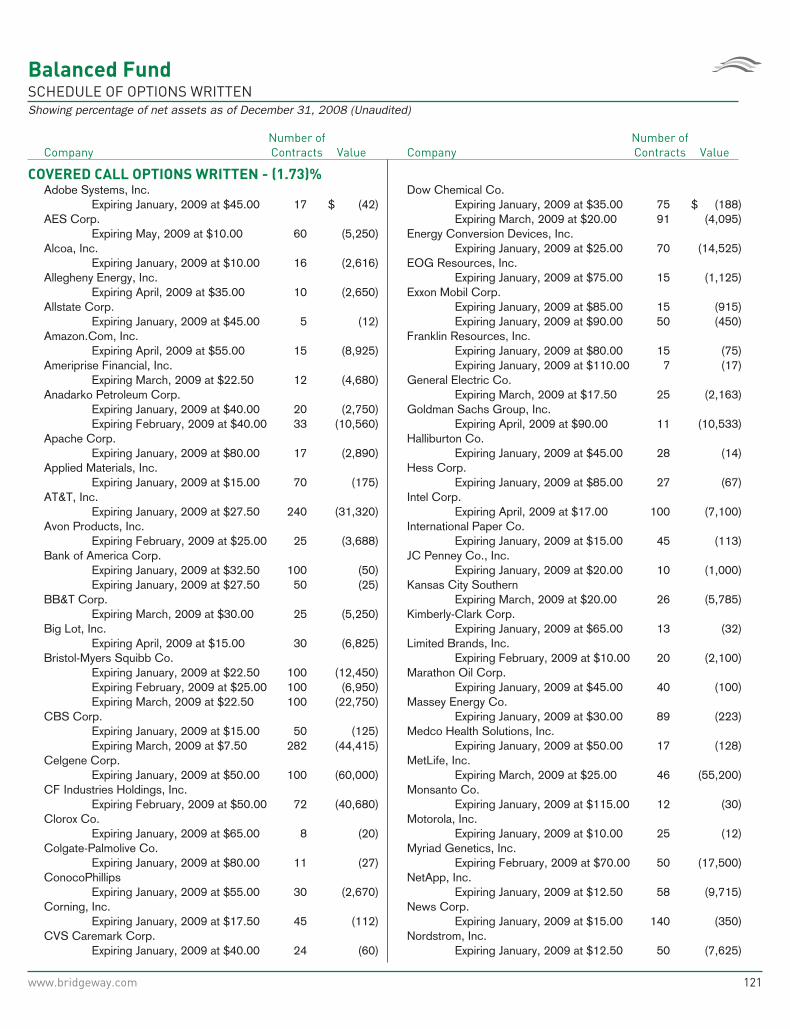
Balanced FundSCHEDULE OF OPTIONS WRITTENShowing percentage of net assets as of December 31, 2008 (Unaudited)
CompanyNumber ofContracts Value
COVERED CALL OPTIONS WRITTEN - (1.73)%Adobe Systems, Inc.
Expiring January, 2009 at $45.00 17 $ (42)AES Corp.
Expiring May, 2009 at $10.00 60 (5,250)Alcoa, Inc.
Expiring January, 2009 at $10.00 16 (2,616)Allegheny Energy, Inc.
Expiring April, 2009 at $35.00 10 (2,650)Allstate Corp.
Expiring January, 2009 at $45.00 5 (12)Amazon.Com, Inc.
Expiring April, 2009 at $55.00 15 (8,925)Ameriprise Financial, Inc.
Expiring March, 2009 at $22.50 12 (4,680)Anadarko Petroleum Corp.
Expiring January, 2009 at $40.00 20 (2,750)Expiring February, 2009 at $40.00 33 (10,560)
Apache Corp.Expiring January, 2009 at $80.00 17 (2,890)
Applied Materials, Inc.Expiring January, 2009 at $15.00 70 (175)
AT&T, Inc.Expiring January, 2009 at $27.50 240 (31,320)
Avon Products, Inc.Expiring February, 2009 at $25.00 25 (3,688)
Bank of America Corp.Expiring January, 2009 at $32.50 100 (50)Expiring January, 2009 at $27.50 50 (25)
BB&T Corp.Expiring March, 2009 at $30.00 25 (5,250)
Big Lot, Inc.Expiring April, 2009 at $15.00 30 (6,825)
Bristol-Myers Squibb Co.Expiring January, 2009 at $22.50 100 (12,450)Expiring February, 2009 at $25.00 100 (6,950)Expiring March, 2009 at $22.50 100 (22,750)
CBS Corp.Expiring January, 2009 at $15.00 50 (125)Expiring March, 2009 at $7.50 282 (44,415)
Celgene Corp.Expiring January, 2009 at $50.00 100 (60,000)
CF Industries Holdings, Inc.Expiring February, 2009 at $50.00 72 (40,680)
Clorox Co.Expiring January, 2009 at $65.00 8 (20)
Colgate-Palmolive Co.Expiring January, 2009 at $80.00 11 (27)
ConocoPhillipsExpiring January, 2009 at $55.00 30 (2,670)
Corning, Inc.Expiring January, 2009 at $17.50 45 (112)
CVS Caremark Corp.Expiring January, 2009 at $40.00 24 (60)
CompanyNumber ofContracts Value
Dow Chemical Co.Expiring January, 2009 at $35.00 75 $ (188)Expiring March, 2009 at $20.00 91 (4,095)
Energy Conversion Devices, Inc.Expiring January, 2009 at $25.00 70 (14,525)
EOG Resources, Inc.Expiring January, 2009 at $75.00 15 (1,125)
Exxon Mobil Corp.Expiring January, 2009 at $85.00 15 (915)Expiring January, 2009 at $90.00 50 (450)
Franklin Resources, Inc.Expiring January, 2009 at $80.00 15 (75)Expiring January, 2009 at $110.00 7 (17)
General Electric Co.Expiring March, 2009 at $17.50 25 (2,163)
Goldman Sachs Group, Inc.Expiring April, 2009 at $90.00 11 (10,533)
Halliburton Co.Expiring January, 2009 at $45.00 28 (14)
Hess Corp.Expiring January, 2009 at $85.00 27 (67)
Intel Corp.Expiring April, 2009 at $17.00 100 (7,100)
International Paper Co.Expiring January, 2009 at $15.00 45 (113)
JC Penney Co., Inc.Expiring January, 2009 at $20.00 10 (1,000)
Kansas City SouthernExpiring March, 2009 at $20.00 26 (5,785)
Kimberly-Clark Corp.Expiring January, 2009 at $65.00 13 (32)
Limited Brands, Inc.Expiring February, 2009 at $10.00 20 (2,100)
Marathon Oil Corp.Expiring January, 2009 at $45.00 40 (100)
Massey Energy Co.Expiring January, 2009 at $30.00 89 (223)
Medco Health Solutions, Inc.Expiring January, 2009 at $50.00 17 (128)
MetLife, Inc.Expiring March, 2009 at $25.00 46 (55,200)
Monsanto Co.Expiring January, 2009 at $115.00 12 (30)
Motorola, Inc.Expiring January, 2009 at $10.00 25 (12)
Myriad Genetics, Inc.Expiring February, 2009 at $70.00 50 (17,500)
NetApp, Inc.Expiring January, 2009 at $12.50 58 (9,715)
News Corp.Expiring January, 2009 at $15.00 140 (350)
Nordstrom, Inc.Expiring January, 2009 at $12.50 50 (7,625)
www.bridgeway.com 121
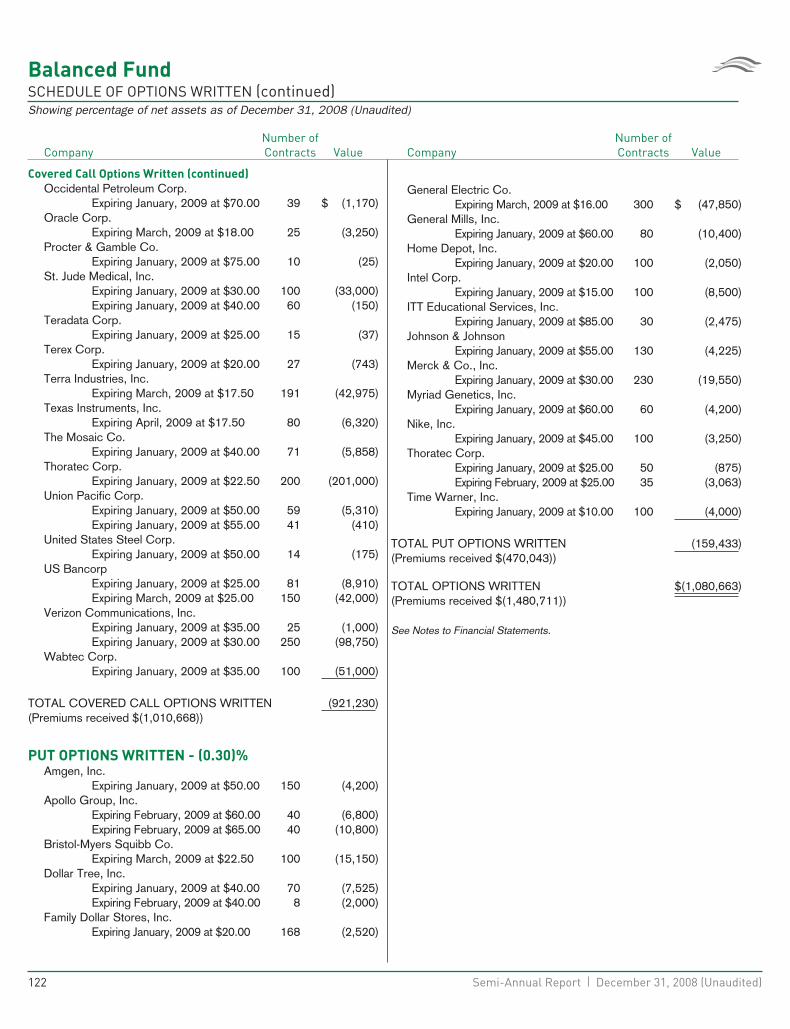
Balanced FundSCHEDULE OF OPTIONS WRITTEN (continued)Showing percentage of net assets as of December 31, 2008 (Unaudited)
CompanyNumber ofContracts Value
Covered Call Options Written (continued)
Occidental Petroleum Corp.Expiring January, 2009 at $70.00 39 $ (1,170)
Oracle Corp.Expiring March, 2009 at $18.00 25 (3,250)
Procter & Gamble Co.Expiring January, 2009 at $75.00 10 (25)
St. Jude Medical, Inc.Expiring January, 2009 at $30.00 100 (33,000)Expiring January, 2009 at $40.00 60 (150)
Teradata Corp.Expiring January, 2009 at $25.00 15 (37)
Terex Corp.Expiring January, 2009 at $20.00 27 (743)
Terra Industries, Inc.Expiring March, 2009 at $17.50 191 (42,975)
Texas Instruments, Inc.Expiring April, 2009 at $17.50 80 (6,320)
The Mosaic Co.Expiring January, 2009 at $40.00 71 (5,858)
Thoratec Corp.Expiring January, 2009 at $22.50 200 (201,000)
Union Pacific Corp.Expiring January, 2009 at $50.00 59 (5,310)Expiring January, 2009 at $55.00 41 (410)
United States Steel Corp.Expiring January, 2009 at $50.00 14 (175)
US BancorpExpiring January, 2009 at $25.00 81 (8,910)Expiring March, 2009 at $25.00 150 (42,000)
Verizon Communications, Inc.Expiring January, 2009 at $35.00 25 (1,000)Expiring January, 2009 at $30.00 250 (98,750)
Wabtec Corp.Expiring January, 2009 at $35.00 100 (51,000)
TOTAL COVERED CALL OPTIONS WRITTEN (921,230)(Premiums received $(1,010,668))
PUT OPTIONS WRITTEN - (0.30)%Amgen, Inc.
Expiring January, 2009 at $50.00 150 (4,200)Apollo Group, Inc.
Expiring February, 2009 at $60.00 40 (6,800)Expiring February, 2009 at $65.00 40 (10,800)
Bristol-Myers Squibb Co.Expiring March, 2009 at $22.50 100 (15,150)
Dollar Tree, Inc.Expiring January, 2009 at $40.00 70 (7,525)Expiring February, 2009 at $40.00 8 (2,000)
Family Dollar Stores, Inc.Expiring January, 2009 at $20.00 168 (2,520)
CompanyNumber ofContracts Value
General Electric Co.Expiring March, 2009 at $16.00 300 $ (47,850)
General Mills, Inc.Expiring January, 2009 at $60.00 80 (10,400)
Home Depot, Inc.Expiring January, 2009 at $20.00 100 (2,050)
Intel Corp.Expiring January, 2009 at $15.00 100 (8,500)
ITT Educational Services, Inc.Expiring January, 2009 at $85.00 30 (2,475)
Johnson & JohnsonExpiring January, 2009 at $55.00 130 (4,225)
Merck & Co., Inc.Expiring January, 2009 at $30.00 230 (19,550)
Myriad Genetics, Inc.Expiring January, 2009 at $60.00 60 (4,200)
Nike, Inc.Expiring January, 2009 at $45.00 100 (3,250)
Thoratec Corp.Expiring January, 2009 at $25.00 50 (875)Expiring February, 2009 at $25.00 35 (3,063)
Time Warner, Inc.Expiring January, 2009 at $10.00 100 (4,000)
TOTAL PUT OPTIONS WRITTEN (159,433)(Premiums received $(470,043))
TOTAL OPTIONS WRITTEN $(1,080,663)(Premiums received $(1,480,711))
See Notes to Financial Statements.
122 Semi-Annual Report | December 31, 2008 (Unaudited)

THIS PAGE INTENTIONALLY LEFT BLANK
www.bridgeway.com 123
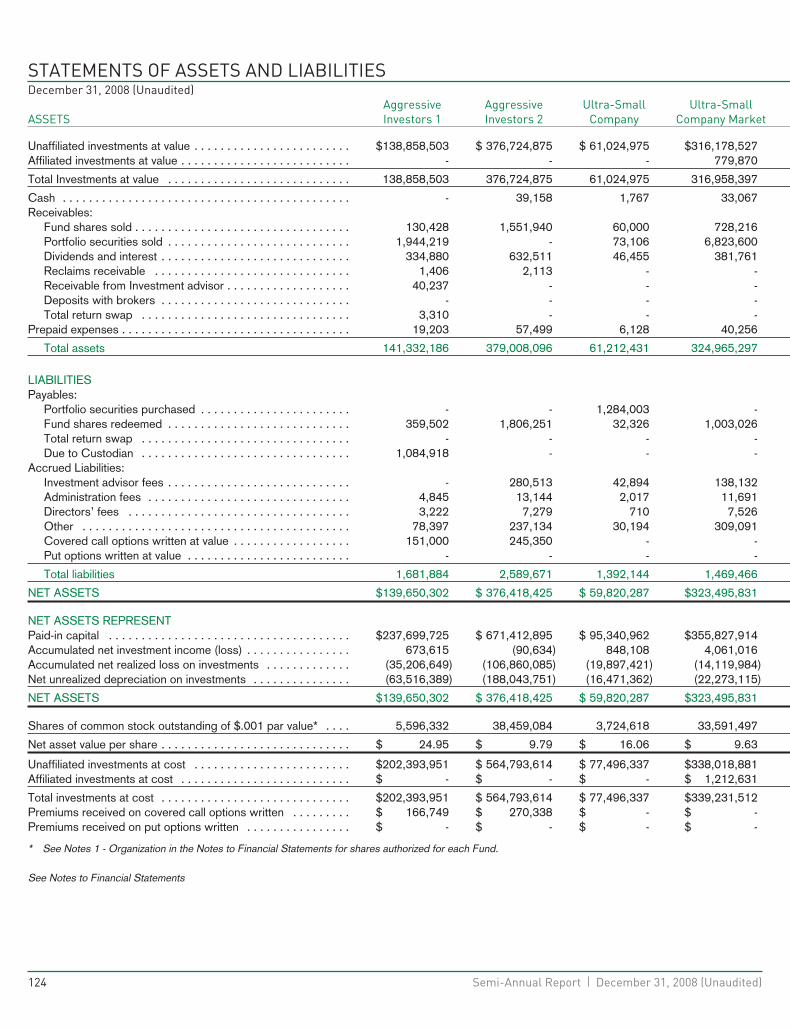
STATEMENTS OF ASSETS AND LIABILITIESDecember 31, 2008 (Unaudited)
ASSETSAggressiveInvestors 1
AggressiveInvestors 2
Ultra-SmallCompany
Ultra-SmallCompany Market
Unaffiliated investments at value . . . . . . . . . . . . . . . . . . . . . . . . $138,858,503 $ 376,724,875 $ 61,024,975 $316,178,527Affiliated investments at value . . . . . . . . . . . . . . . . . . . . . . . . . . - - - 779,870
Total Investments at value . . . . . . . . . . . . . . . . . . . . . . . . . . . . 138,858,503 376,724,875 61,024,975 316,958,397
Cash . . . . . . . . . . . . . . . . . . . . . . . . . . . . . . . . . . . . . . . . . . . . - 39,158 1,767 33,067Receivables:
Fund shares sold . . . . . . . . . . . . . . . . . . . . . . . . . . . . . . . . . 130,428 1,551,940 60,000 728,216Portfolio securities sold . . . . . . . . . . . . . . . . . . . . . . . . . . . . 1,944,219 - 73,106 6,823,600Dividends and interest . . . . . . . . . . . . . . . . . . . . . . . . . . . . . 334,880 632,511 46,455 381,761Reclaims receivable . . . . . . . . . . . . . . . . . . . . . . . . . . . . . . 1,406 2,113 - -Receivable from Investment advisor . . . . . . . . . . . . . . . . . . . 40,237 - - -Deposits with brokers . . . . . . . . . . . . . . . . . . . . . . . . . . . . . - - - -Total return swap . . . . . . . . . . . . . . . . . . . . . . . . . . . . . . . . 3,310 - - -
Prepaid expenses . . . . . . . . . . . . . . . . . . . . . . . . . . . . . . . . . . . 19,203 57,499 6,128 40,256
Total assets 141,332,186 379,008,096 61,212,431 324,965,297
LIABILITIESPayables:
Portfolio securities purchased . . . . . . . . . . . . . . . . . . . . . . . - - 1,284,003 -Fund shares redeemed . . . . . . . . . . . . . . . . . . . . . . . . . . . . 359,502 1,806,251 32,326 1,003,026Total return swap . . . . . . . . . . . . . . . . . . . . . . . . . . . . . . . . - - - -Due to Custodian . . . . . . . . . . . . . . . . . . . . . . . . . . . . . . . . 1,084,918 - - -
Accrued Liabilities:Investment advisor fees . . . . . . . . . . . . . . . . . . . . . . . . . . . . - 280,513 42,894 138,132Administration fees . . . . . . . . . . . . . . . . . . . . . . . . . . . . . . . 4,845 13,144 2,017 11,691Directors’ fees . . . . . . . . . . . . . . . . . . . . . . . . . . . . . . . . . . 3,222 7,279 710 7,526Other . . . . . . . . . . . . . . . . . . . . . . . . . . . . . . . . . . . . . . . . . 78,397 237,134 30,194 309,091Covered call options written at value . . . . . . . . . . . . . . . . . . 151,000 245,350 - -Put options written at value . . . . . . . . . . . . . . . . . . . . . . . . . - - - -
Total liabilities 1,681,884 2,589,671 1,392,144 1,469,466
NET ASSETS $139,650,302 $ 376,418,425 $ 59,820,287 $323,495,831
NET ASSETS REPRESENTPaid-in capital . . . . . . . . . . . . . . . . . . . . . . . . . . . . . . . . . . . . . $237,699,725 $ 671,412,895 $ 95,340,962 $355,827,914Accumulated net investment income (loss) . . . . . . . . . . . . . . . . 673,615 (90,634) 848,108 4,061,016Accumulated net realized loss on investments . . . . . . . . . . . . . (35,206,649) (106,860,085) (19,897,421) (14,119,984)Net unrealized depreciation on investments . . . . . . . . . . . . . . . (63,516,389) (188,043,751) (16,471,362) (22,273,115)
NET ASSETS $139,650,302 $ 376,418,425 $ 59,820,287 $323,495,831
Shares of common stock outstanding of $.001 par value* . . . . 5,596,332 38,459,084 3,724,618 33,591,497
Net asset value per share . . . . . . . . . . . . . . . . . . . . . . . . . . . . . $ 24.95 $ 9.79 $ 16.06 $ 9.63
Unaffiliated investments at cost . . . . . . . . . . . . . . . . . . . . . . . . $202,393,951 $ 564,793,614 $ 77,496,337 $338,018,881Affiliated investments at cost . . . . . . . . . . . . . . . . . . . . . . . . . . $ - $ - $ - $ 1,212,631
Total investments at cost . . . . . . . . . . . . . . . . . . . . . . . . . . . . . $202,393,951 $ 564,793,614 $ 77,496,337 $339,231,512Premiums received on covered call options written . . . . . . . . . $ 166,749 $ 270,338 $ - $ -Premiums received on put options written . . . . . . . . . . . . . . . . $ - $ - $ - $ -
* See Notes 1 - Organization in the Notes to Financial Statements for shares authorized for each Fund.
See Notes to Financial Statements
124 Semi-Annual Report | December 31, 2008 (Unaudited)
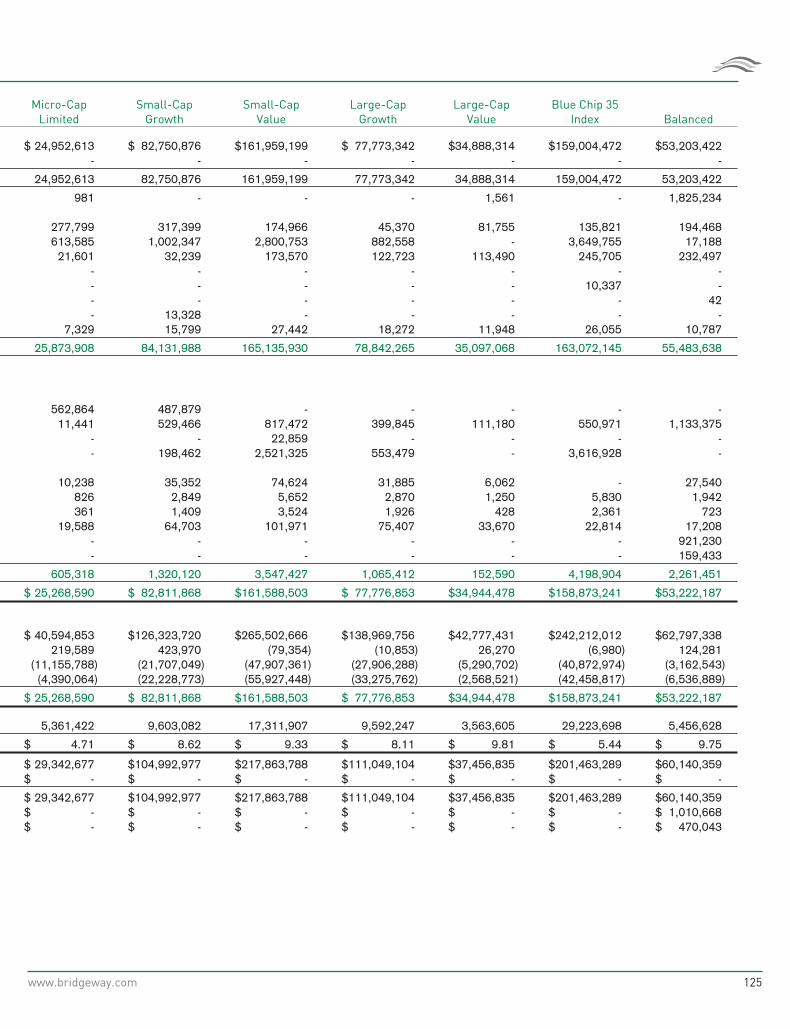
Micro-CapLimited
Small-CapGrowth
Small-CapValue
Large-CapGrowth
Large-CapValue
Blue Chip 35Index Balanced
$ 24,952,613 $ 82,750,876 $161,959,199 $ 77,773,342 $34,888,314 $159,004,472 $53,203,422- - - - - - -
24,952,613 82,750,876 161,959,199 77,773,342 34,888,314 159,004,472 53,203,422
981 - - - 1,561 - 1,825,234
277,799 317,399 174,966 45,370 81,755 135,821 194,468613,585 1,002,347 2,800,753 882,558 - 3,649,755 17,18821,601 32,239 173,570 122,723 113,490 245,705 232,497
- - - - - - -- - - - - 10,337 -- - - - - - 42- 13,328 - - - - -
7,329 15,799 27,442 18,272 11,948 26,055 10,787
25,873,908 84,131,988 165,135,930 78,842,265 35,097,068 163,072,145 55,483,638
562,864 487,879 - - - - -11,441 529,466 817,472 399,845 111,180 550,971 1,133,375
- - 22,859 - - - -- 198,462 2,521,325 553,479 - 3,616,928 -
10,238 35,352 74,624 31,885 6,062 - 27,540826 2,849 5,652 2,870 1,250 5,830 1,942361 1,409 3,524 1,926 428 2,361 723
19,588 64,703 101,971 75,407 33,670 22,814 17,208- - - - - - 921,230- - - - - - 159,433
605,318 1,320,120 3,547,427 1,065,412 152,590 4,198,904 2,261,451
$ 25,268,590 $ 82,811,868 $161,588,503 $ 77,776,853 $34,944,478 $158,873,241 $53,222,187
$ 40,594,853 $126,323,720 $265,502,666 $138,969,756 $42,777,431 $242,212,012 $62,797,338219,589 423,970 (79,354) (10,853) 26,270 (6,980) 124,281
(11,155,788) (21,707,049) (47,907,361) (27,906,288) (5,290,702) (40,872,974) (3,162,543)(4,390,064) (22,228,773) (55,927,448) (33,275,762) (2,568,521) (42,458,817) (6,536,889)
$ 25,268,590 $ 82,811,868 $161,588,503 $ 77,776,853 $34,944,478 $158,873,241 $53,222,187
5,361,422 9,603,082 17,311,907 9,592,247 3,563,605 29,223,698 5,456,628
$ 4.71 $ 8.62 $ 9.33 $ 8.11 $ 9.81 $ 5.44 $ 9.75
$ 29,342,677 $104,992,977 $217,863,788 $111,049,104 $37,456,835 $201,463,289 $60,140,359$ - $ - $ - $ - $ - $ - $ -
$ 29,342,677 $104,992,977 $217,863,788 $111,049,104 $37,456,835 $201,463,289 $60,140,359$ - $ - $ - $ - $ - $ - $ 1,010,668$ - $ - $ - $ - $ - $ - $ 470,043
www.bridgeway.com 125
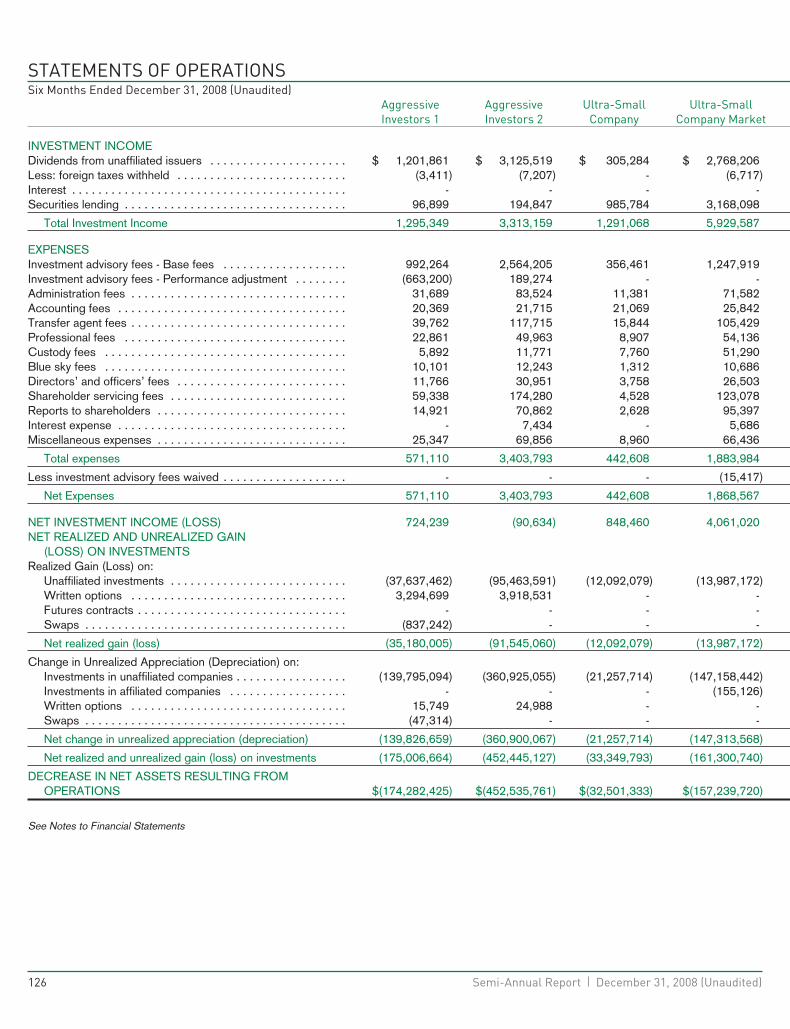
STATEMENTS OF OPERATIONSSix Months Ended December 31, 2008 (Unaudited)
AggressiveInvestors 1
AggressiveInvestors 2
Ultra-SmallCompany
Ultra-SmallCompany Market
INVESTMENT INCOMEDividends from unaffiliated issuers . . . . . . . . . . . . . . . . . . . . . $ 1,201,861 $ 3,125,519 $ 305,284 $ 2,768,206Less: foreign taxes withheld . . . . . . . . . . . . . . . . . . . . . . . . . . (3,411) (7,207) - (6,717)Interest . . . . . . . . . . . . . . . . . . . . . . . . . . . . . . . . . . . . . . . . . . - - - -Securities lending . . . . . . . . . . . . . . . . . . . . . . . . . . . . . . . . . . 96,899 194,847 985,784 3,168,098
Total Investment Income 1,295,349 3,313,159 1,291,068 5,929,587
EXPENSESInvestment advisory fees - Base fees . . . . . . . . . . . . . . . . . . . 992,264 2,564,205 356,461 1,247,919Investment advisory fees - Performance adjustment . . . . . . . . (663,200) 189,274 - -Administration fees . . . . . . . . . . . . . . . . . . . . . . . . . . . . . . . . . 31,689 83,524 11,381 71,582Accounting fees . . . . . . . . . . . . . . . . . . . . . . . . . . . . . . . . . . . 20,369 21,715 21,069 25,842Transfer agent fees . . . . . . . . . . . . . . . . . . . . . . . . . . . . . . . . . 39,762 117,715 15,844 105,429Professional fees . . . . . . . . . . . . . . . . . . . . . . . . . . . . . . . . . . 22,861 49,963 8,907 54,136Custody fees . . . . . . . . . . . . . . . . . . . . . . . . . . . . . . . . . . . . . 5,892 11,771 7,760 51,290Blue sky fees . . . . . . . . . . . . . . . . . . . . . . . . . . . . . . . . . . . . . 10,101 12,243 1,312 10,686Directors’ and officers’ fees . . . . . . . . . . . . . . . . . . . . . . . . . . 11,766 30,951 3,758 26,503Shareholder servicing fees . . . . . . . . . . . . . . . . . . . . . . . . . . . 59,338 174,280 4,528 123,078Reports to shareholders . . . . . . . . . . . . . . . . . . . . . . . . . . . . . 14,921 70,862 2,628 95,397Interest expense . . . . . . . . . . . . . . . . . . . . . . . . . . . . . . . . . . . - 7,434 - 5,686Miscellaneous expenses . . . . . . . . . . . . . . . . . . . . . . . . . . . . . 25,347 69,856 8,960 66,436
Total expenses 571,110 3,403,793 442,608 1,883,984
Less investment advisory fees waived . . . . . . . . . . . . . . . . . . . - - - (15,417)
Net Expenses 571,110 3,403,793 442,608 1,868,567
NET INVESTMENT INCOME (LOSS) 724,239 (90,634) 848,460 4,061,020NET REALIZED AND UNREALIZED GAIN
(LOSS) ON INVESTMENTSRealized Gain (Loss) on:
Unaffiliated investments . . . . . . . . . . . . . . . . . . . . . . . . . . . (37,637,462) (95,463,591) (12,092,079) (13,987,172)Written options . . . . . . . . . . . . . . . . . . . . . . . . . . . . . . . . . 3,294,699 3,918,531 - -Futures contracts . . . . . . . . . . . . . . . . . . . . . . . . . . . . . . . . - - - -Swaps . . . . . . . . . . . . . . . . . . . . . . . . . . . . . . . . . . . . . . . . (837,242) - - -
Net realized gain (loss) (35,180,005) (91,545,060) (12,092,079) (13,987,172)
Change in Unrealized Appreciation (Depreciation) on:Investments in unaffiliated companies . . . . . . . . . . . . . . . . . (139,795,094) (360,925,055) (21,257,714) (147,158,442)Investments in affiliated companies . . . . . . . . . . . . . . . . . . - - - (155,126)Written options . . . . . . . . . . . . . . . . . . . . . . . . . . . . . . . . . 15,749 24,988 - -Swaps . . . . . . . . . . . . . . . . . . . . . . . . . . . . . . . . . . . . . . . . (47,314) - - -
Net change in unrealized appreciation (depreciation) (139,826,659) (360,900,067) (21,257,714) (147,313,568)
Net realized and unrealized gain (loss) on investments (175,006,664) (452,445,127) (33,349,793) (161,300,740)
DECREASE IN NET ASSETS RESULTING FROMOPERATIONS $(174,282,425) $(452,535,761) $(32,501,333) $(157,239,720)
See Notes to Financial Statements
126 Semi-Annual Report | December 31, 2008 (Unaudited)
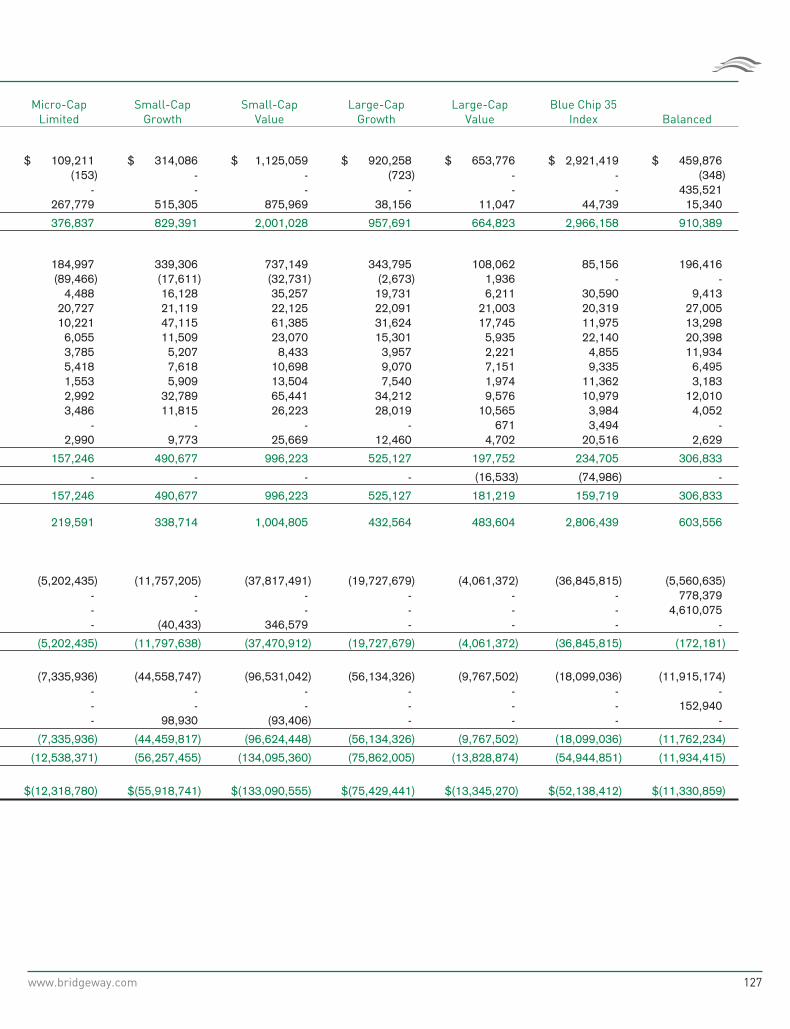
Micro-CapLimited
Small-CapGrowth
Small-CapValue
Large-CapGrowth
Large-CapValue
Blue Chip 35Index Balanced
$ 109,211 $ 314,086 $ 1,125,059 $ 920,258 $ 653,776 $ 2,921,419 $ 459,876(153) - - (723) - - (348)
- - - - - - 435,521267,779 515,305 875,969 38,156 11,047 44,739 15,340
376,837 829,391 2,001,028 957,691 664,823 2,966,158 910,389
184,997 339,306 737,149 343,795 108,062 85,156 196,416(89,466) (17,611) (32,731) (2,673) 1,936 - -
4,488 16,128 35,257 19,731 6,211 30,590 9,41320,727 21,119 22,125 22,091 21,003 20,319 27,00510,221 47,115 61,385 31,624 17,745 11,975 13,2986,055 11,509 23,070 15,301 5,935 22,140 20,3983,785 5,207 8,433 3,957 2,221 4,855 11,9345,418 7,618 10,698 9,070 7,151 9,335 6,4951,553 5,909 13,504 7,540 1,974 11,362 3,1832,992 32,789 65,441 34,212 9,576 10,979 12,0103,486 11,815 26,223 28,019 10,565 3,984 4,052
- - - - 671 3,494 -2,990 9,773 25,669 12,460 4,702 20,516 2,629
157,246 490,677 996,223 525,127 197,752 234,705 306,833
- - - - (16,533) (74,986) -
157,246 490,677 996,223 525,127 181,219 159,719 306,833
219,591 338,714 1,004,805 432,564 483,604 2,806,439 603,556
(5,202,435) (11,757,205) (37,817,491) (19,727,679) (4,061,372) (36,845,815) (5,560,635)- - - - - - 778,379- - - - - - 4,610,075- (40,433) 346,579 - - - -
(5,202,435) (11,797,638) (37,470,912) (19,727,679) (4,061,372) (36,845,815) (172,181)
(7,335,936) (44,558,747) (96,531,042) (56,134,326) (9,767,502) (18,099,036) (11,915,174)- - - - - - -- - - - - - 152,940- 98,930 (93,406) - - - -
(7,335,936) (44,459,817) (96,624,448) (56,134,326) (9,767,502) (18,099,036) (11,762,234)
(12,538,371) (56,257,455) (134,095,360) (75,862,005) (13,828,874) (54,944,851) (11,934,415)
$(12,318,780) $(55,918,741) $(133,090,555) $(75,429,441) $(13,345,270) $(52,138,412) $(11,330,859)
www.bridgeway.com 127
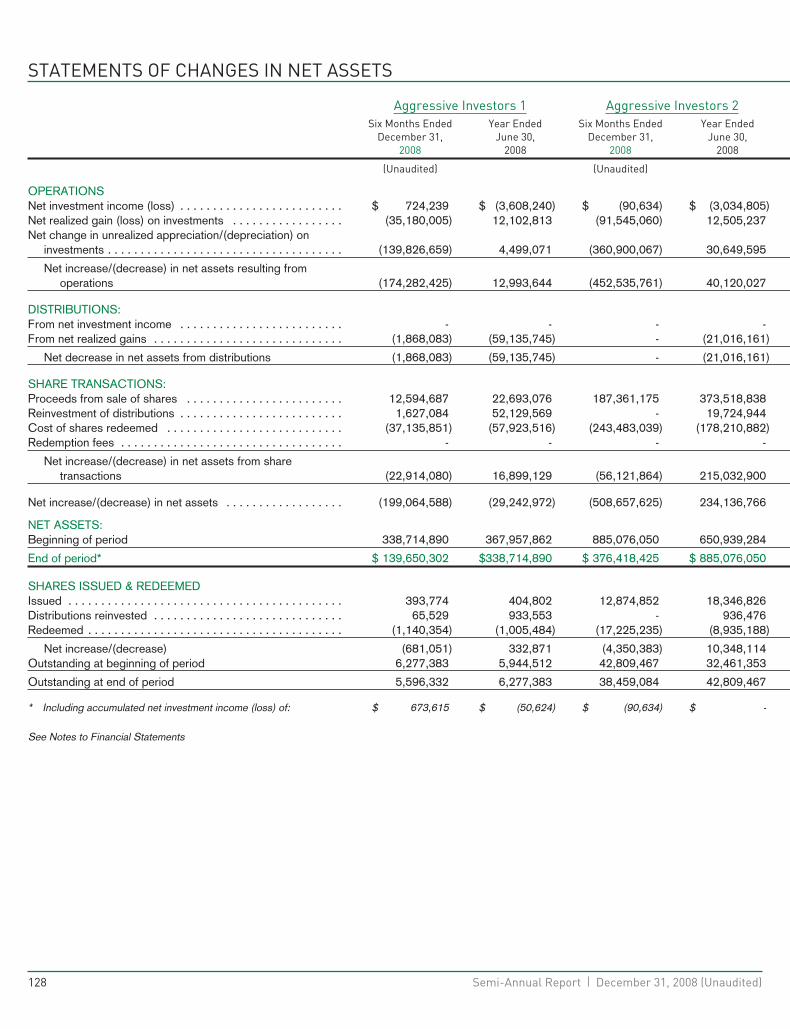
STATEMENTS OF CHANGES IN NET ASSETS
Aggressive Investors 1 Aggressive Investors 2Six Months Ended
December 31,Year Ended
June 30,Six Months Ended
December 31,Year Ended
June 30,2008 2008 2008 2008
(Unaudited) (Unaudited)
OPERATIONSNet investment income (loss) . . . . . . . . . . . . . . . . . . . . . . . . . $ 724,239 $ (3,608,240) $ (90,634) $ (3,034,805)Net realized gain (loss) on investments . . . . . . . . . . . . . . . . . (35,180,005) 12,102,813 (91,545,060) 12,505,237Net change in unrealized appreciation/(depreciation) on
investments . . . . . . . . . . . . . . . . . . . . . . . . . . . . . . . . . . . . (139,826,659) 4,499,071 (360,900,067) 30,649,595
Net increase/(decrease) in net assets resulting fromoperations (174,282,425) 12,993,644 (452,535,761) 40,120,027
DISTRIBUTIONS:From net investment income . . . . . . . . . . . . . . . . . . . . . . . . . - - - -From net realized gains . . . . . . . . . . . . . . . . . . . . . . . . . . . . . (1,868,083) (59,135,745) - (21,016,161)
Net decrease in net assets from distributions (1,868,083) (59,135,745) - (21,016,161)
SHARE TRANSACTIONS:Proceeds from sale of shares . . . . . . . . . . . . . . . . . . . . . . . . 12,594,687 22,693,076 187,361,175 373,518,838Reinvestment of distributions . . . . . . . . . . . . . . . . . . . . . . . . . 1,627,084 52,129,569 - 19,724,944Cost of shares redeemed . . . . . . . . . . . . . . . . . . . . . . . . . . . (37,135,851) (57,923,516) (243,483,039) (178,210,882)Redemption fees . . . . . . . . . . . . . . . . . . . . . . . . . . . . . . . . . . - - - -
Net increase/(decrease) in net assets from sharetransactions (22,914,080) 16,899,129 (56,121,864) 215,032,900
Net increase/(decrease) in net assets . . . . . . . . . . . . . . . . . . (199,064,588) (29,242,972) (508,657,625) 234,136,766
NET ASSETS:Beginning of period 338,714,890 367,957,862 885,076,050 650,939,284
End of period* $ 139,650,302 $338,714,890 $ 376,418,425 $ 885,076,050
SHARES ISSUED & REDEEMEDIssued . . . . . . . . . . . . . . . . . . . . . . . . . . . . . . . . . . . . . . . . . . 393,774 404,802 12,874,852 18,346,826Distributions reinvested . . . . . . . . . . . . . . . . . . . . . . . . . . . . . 65,529 933,553 - 936,476Redeemed . . . . . . . . . . . . . . . . . . . . . . . . . . . . . . . . . . . . . . . (1,140,354) (1,005,484) (17,225,235) (8,935,188)
Net increase/(decrease) (681,051) 332,871 (4,350,383) 10,348,114Outstanding at beginning of period 6,277,383 5,944,512 42,809,467 32,461,353
Outstanding at end of period 5,596,332 6,277,383 38,459,084 42,809,467
* Including accumulated net investment income (loss) of: $ 673,615 $ (50,624) $ (90,634) $ -
See Notes to Financial Statements
128 Semi-Annual Report | December 31, 2008 (Unaudited)
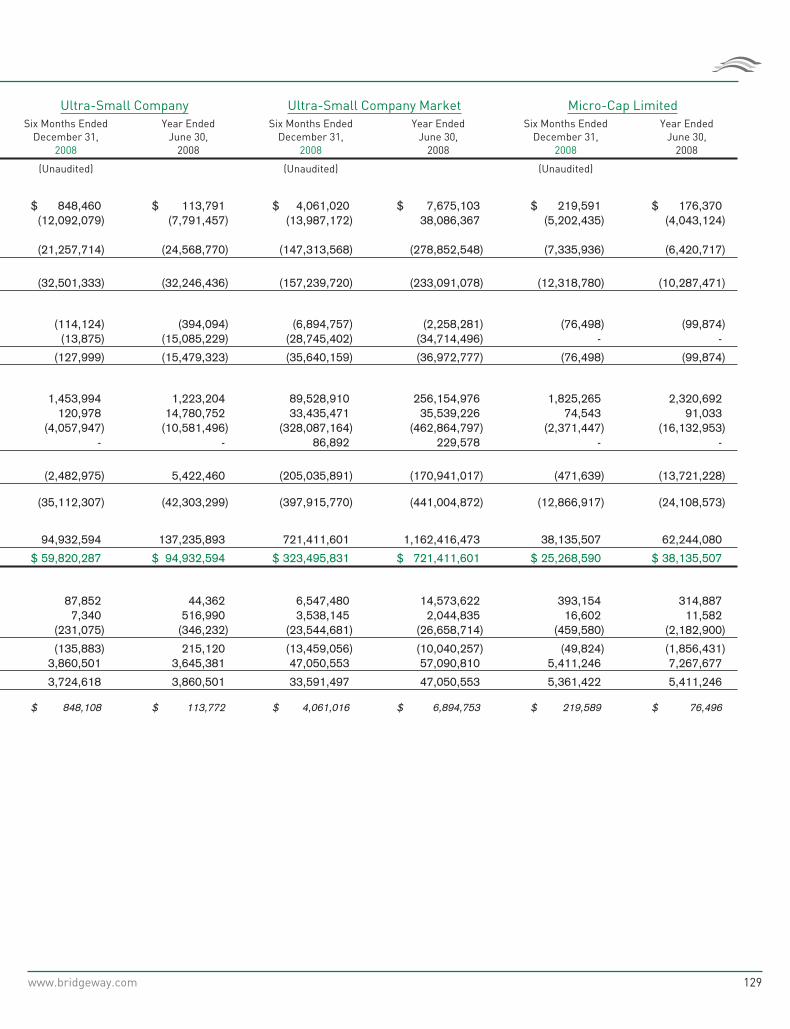
Ultra-Small Company Ultra-Small Company Market Micro-Cap LimitedSix Months Ended
December 31,Year Ended
June 30,Six Months Ended
December 31,Year Ended
June 30,Six Months Ended
December 31,Year Ended
June 30,2008 2008 2008 2008 2008 2008
(Unaudited) (Unaudited) (Unaudited)
$ 848,460 $ 113,791 $ 4,061,020 $ 7,675,103 $ 219,591 $ 176,370(12,092,079) (7,791,457) (13,987,172) 38,086,367 (5,202,435) (4,043,124)
(21,257,714) (24,568,770) (147,313,568) (278,852,548) (7,335,936) (6,420,717)
(32,501,333) (32,246,436) (157,239,720) (233,091,078) (12,318,780) (10,287,471)
(114,124) (394,094) (6,894,757) (2,258,281) (76,498) (99,874)(13,875) (15,085,229) (28,745,402) (34,714,496) - -
(127,999) (15,479,323) (35,640,159) (36,972,777) (76,498) (99,874)
1,453,994 1,223,204 89,528,910 256,154,976 1,825,265 2,320,692120,978 14,780,752 33,435,471 35,539,226 74,543 91,033
(4,057,947) (10,581,496) (328,087,164) (462,864,797) (2,371,447) (16,132,953)- - 86,892 229,578 - -
(2,482,975) 5,422,460 (205,035,891) (170,941,017) (471,639) (13,721,228)
(35,112,307) (42,303,299) (397,915,770) (441,004,872) (12,866,917) (24,108,573)
94,932,594 137,235,893 721,411,601 1,162,416,473 38,135,507 62,244,080
$ 59,820,287 $ 94,932,594 $ 323,495,831 $ 721,411,601 $ 25,268,590 $ 38,135,507
87,852 44,362 6,547,480 14,573,622 393,154 314,8877,340 516,990 3,538,145 2,044,835 16,602 11,582
(231,075) (346,232) (23,544,681) (26,658,714) (459,580) (2,182,900)
(135,883) 215,120 (13,459,056) (10,040,257) (49,824) (1,856,431)3,860,501 3,645,381 47,050,553 57,090,810 5,411,246 7,267,677
3,724,618 3,860,501 33,591,497 47,050,553 5,361,422 5,411,246
$ 848,108 $ 113,772 $ 4,061,016 $ 6,894,753 $ 219,589 $ 76,496
www.bridgeway.com 129
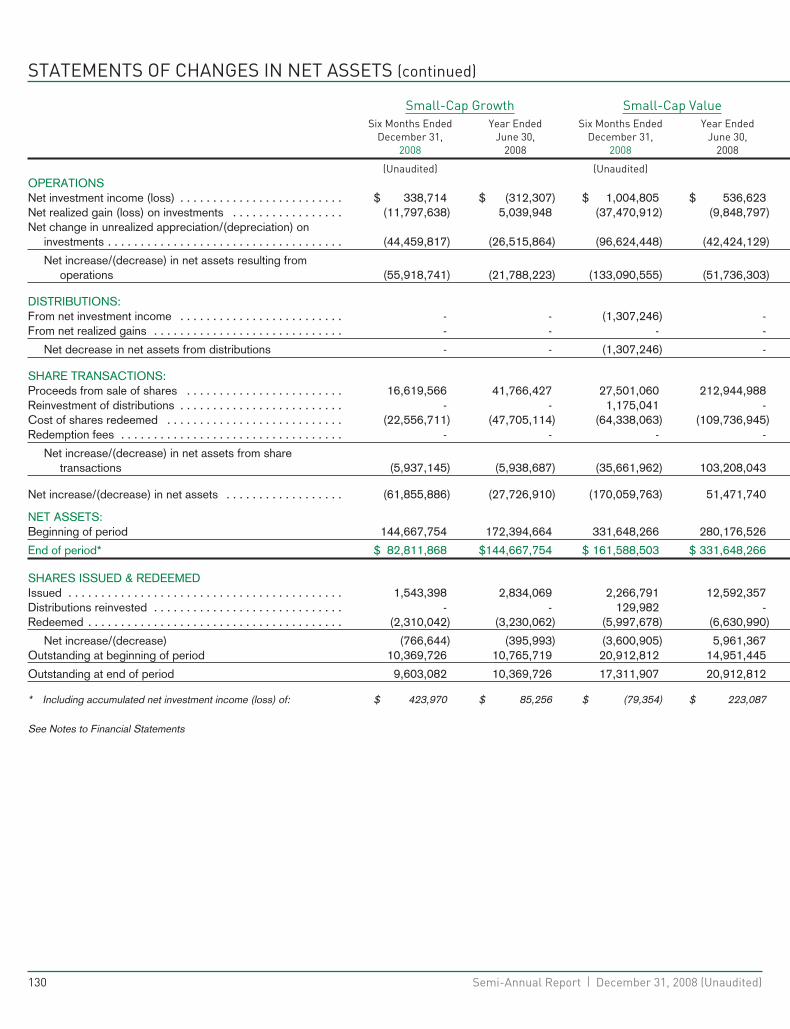
STATEMENTS OF CHANGES IN NET ASSETS (continued)
Small-Cap Growth Small-Cap ValueSix Months Ended
December 31,Year Ended
June 30,Six Months Ended
December 31,Year Ended
June 30,2008 2008 2008 2008
(Unaudited) (Unaudited)OPERATIONSNet investment income (loss) . . . . . . . . . . . . . . . . . . . . . . . . . $ 338,714 $ (312,307) $ 1,004,805 $ 536,623Net realized gain (loss) on investments . . . . . . . . . . . . . . . . . (11,797,638) 5,039,948 (37,470,912) (9,848,797)Net change in unrealized appreciation/(depreciation) on
investments . . . . . . . . . . . . . . . . . . . . . . . . . . . . . . . . . . . . (44,459,817) (26,515,864) (96,624,448) (42,424,129)
Net increase/(decrease) in net assets resulting fromoperations (55,918,741) (21,788,223) (133,090,555) (51,736,303)
DISTRIBUTIONS:From net investment income . . . . . . . . . . . . . . . . . . . . . . . . . - - (1,307,246) -From net realized gains . . . . . . . . . . . . . . . . . . . . . . . . . . . . . - - - -
Net decrease in net assets from distributions - - (1,307,246) -
SHARE TRANSACTIONS:Proceeds from sale of shares . . . . . . . . . . . . . . . . . . . . . . . . 16,619,566 41,766,427 27,501,060 212,944,988Reinvestment of distributions . . . . . . . . . . . . . . . . . . . . . . . . . - - 1,175,041 -Cost of shares redeemed . . . . . . . . . . . . . . . . . . . . . . . . . . . (22,556,711) (47,705,114) (64,338,063) (109,736,945)Redemption fees . . . . . . . . . . . . . . . . . . . . . . . . . . . . . . . . . . - - - -
Net increase/(decrease) in net assets from sharetransactions (5,937,145) (5,938,687) (35,661,962) 103,208,043
Net increase/(decrease) in net assets . . . . . . . . . . . . . . . . . . (61,855,886) (27,726,910) (170,059,763) 51,471,740
NET ASSETS:Beginning of period 144,667,754 172,394,664 331,648,266 280,176,526
End of period* $ 82,811,868 $144,667,754 $ 161,588,503 $ 331,648,266
SHARES ISSUED & REDEEMEDIssued . . . . . . . . . . . . . . . . . . . . . . . . . . . . . . . . . . . . . . . . . . 1,543,398 2,834,069 2,266,791 12,592,357Distributions reinvested . . . . . . . . . . . . . . . . . . . . . . . . . . . . . - - 129,982 -Redeemed . . . . . . . . . . . . . . . . . . . . . . . . . . . . . . . . . . . . . . . (2,310,042) (3,230,062) (5,997,678) (6,630,990)
Net increase/(decrease) (766,644) (395,993) (3,600,905) 5,961,367Outstanding at beginning of period 10,369,726 10,765,719 20,912,812 14,951,445
Outstanding at end of period 9,603,082 10,369,726 17,311,907 20,912,812
* Including accumulated net investment income (loss) of: $ 423,970 $ 85,256 $ (79,354) $ 223,087
See Notes to Financial Statements
130 Semi-Annual Report | December 31, 2008 (Unaudited)
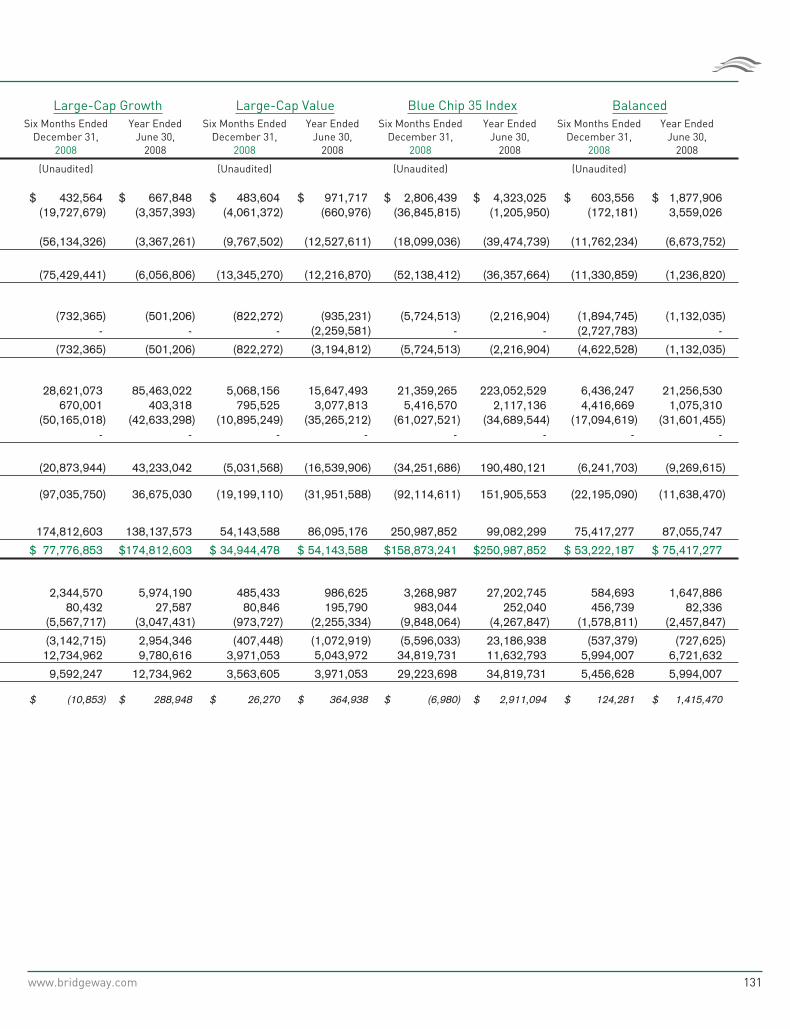
Large-Cap Growth Large-Cap Value Blue Chip 35 Index BalancedSix Months Ended
December 31,Year Ended
June 30,Six Months Ended
December 31,Year Ended
June 30,Six Months Ended
December 31,Year Ended
June 30,Six Months Ended
December 31,Year Ended
June 30,2008 2008 2008 2008 2008 2008 2008 2008
(Unaudited) (Unaudited) (Unaudited) (Unaudited)
$ 432,564 $ 667,848 $ 483,604 $ 971,717 $ 2,806,439 $ 4,323,025 $ 603,556 $ 1,877,906(19,727,679) (3,357,393) (4,061,372) (660,976) (36,845,815) (1,205,950) (172,181) 3,559,026
(56,134,326) (3,367,261) (9,767,502) (12,527,611) (18,099,036) (39,474,739) (11,762,234) (6,673,752)
(75,429,441) (6,056,806) (13,345,270) (12,216,870) (52,138,412) (36,357,664) (11,330,859) (1,236,820)
(732,365) (501,206) (822,272) (935,231) (5,724,513) (2,216,904) (1,894,745) (1,132,035)- - - (2,259,581) - - (2,727,783) -
(732,365) (501,206) (822,272) (3,194,812) (5,724,513) (2,216,904) (4,622,528) (1,132,035)
28,621,073 85,463,022 5,068,156 15,647,493 21,359,265 223,052,529 6,436,247 21,256,530670,001 403,318 795,525 3,077,813 5,416,570 2,117,136 4,416,669 1,075,310
(50,165,018) (42,633,298) (10,895,249) (35,265,212) (61,027,521) (34,689,544) (17,094,619) (31,601,455)- - - - - - - -
(20,873,944) 43,233,042 (5,031,568) (16,539,906) (34,251,686) 190,480,121 (6,241,703) (9,269,615)
(97,035,750) 36,675,030 (19,199,110) (31,951,588) (92,114,611) 151,905,553 (22,195,090) (11,638,470)
174,812,603 138,137,573 54,143,588 86,095,176 250,987,852 99,082,299 75,417,277 87,055,747
$ 77,776,853 $174,812,603 $ 34,944,478 $ 54,143,588 $158,873,241 $250,987,852 $ 53,222,187 $ 75,417,277
2,344,570 5,974,190 485,433 986,625 3,268,987 27,202,745 584,693 1,647,88680,432 27,587 80,846 195,790 983,044 252,040 456,739 82,336
(5,567,717) (3,047,431) (973,727) (2,255,334) (9,848,064) (4,267,847) (1,578,811) (2,457,847)
(3,142,715) 2,954,346 (407,448) (1,072,919) (5,596,033) 23,186,938 (537,379) (727,625)12,734,962 9,780,616 3,971,053 5,043,972 34,819,731 11,632,793 5,994,007 6,721,632
9,592,247 12,734,962 3,563,605 3,971,053 29,223,698 34,819,731 5,456,628 5,994,007
$ (10,853) $ 288,948 $ 26,270 $ 364,938 $ (6,980) $ 2,911,094 $ 124,281 $ 1,415,470
www.bridgeway.com 131
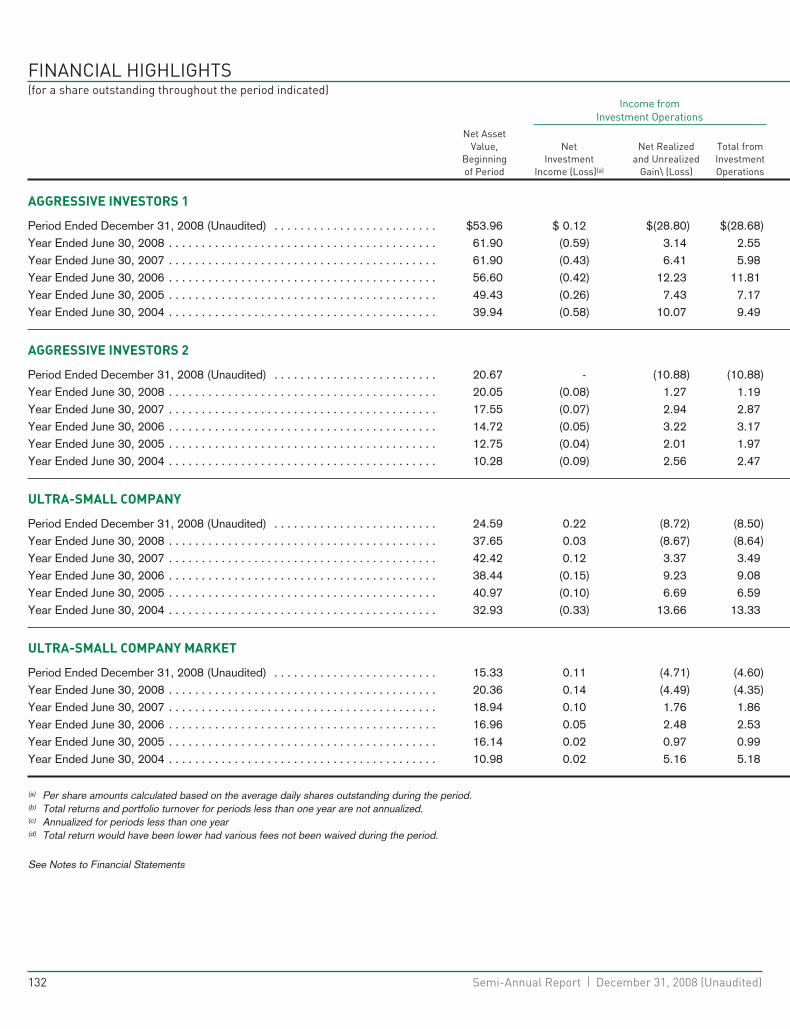
FINANCIAL HIGHLIGHTS(for a share outstanding throughout the period indicated)
Income fromInvestment Operations
Net AssetValue,
Beginningof Period
NetInvestment
Income (Loss)(a)
Net Realizedand Unrealized
Gain\ (Loss)
Total fromInvestmentOperations
AGGRESSIVE INVESTORS 1
Period Ended December 31, 2008 (Unaudited) . . . . . . . . . . . . . . . . . . . . . . . . . $53.96 $ 0.12 $(28.80) $(28.68)Year Ended June 30, 2008 . . . . . . . . . . . . . . . . . . . . . . . . . . . . . . . . . . . . . . . . . 61.90 (0.59) 3.14 2.55Year Ended June 30, 2007 . . . . . . . . . . . . . . . . . . . . . . . . . . . . . . . . . . . . . . . . . 61.90 (0.43) 6.41 5.98Year Ended June 30, 2006 . . . . . . . . . . . . . . . . . . . . . . . . . . . . . . . . . . . . . . . . . 56.60 (0.42) 12.23 11.81Year Ended June 30, 2005 . . . . . . . . . . . . . . . . . . . . . . . . . . . . . . . . . . . . . . . . . 49.43 (0.26) 7.43 7.17Year Ended June 30, 2004 . . . . . . . . . . . . . . . . . . . . . . . . . . . . . . . . . . . . . . . . . 39.94 (0.58) 10.07 9.49
AGGRESSIVE INVESTORS 2
Period Ended December 31, 2008 (Unaudited) . . . . . . . . . . . . . . . . . . . . . . . . . 20.67 - (10.88) (10.88)Year Ended June 30, 2008 . . . . . . . . . . . . . . . . . . . . . . . . . . . . . . . . . . . . . . . . . 20.05 (0.08) 1.27 1.19Year Ended June 30, 2007 . . . . . . . . . . . . . . . . . . . . . . . . . . . . . . . . . . . . . . . . . 17.55 (0.07) 2.94 2.87Year Ended June 30, 2006 . . . . . . . . . . . . . . . . . . . . . . . . . . . . . . . . . . . . . . . . . 14.72 (0.05) 3.22 3.17Year Ended June 30, 2005 . . . . . . . . . . . . . . . . . . . . . . . . . . . . . . . . . . . . . . . . . 12.75 (0.04) 2.01 1.97Year Ended June 30, 2004 . . . . . . . . . . . . . . . . . . . . . . . . . . . . . . . . . . . . . . . . . 10.28 (0.09) 2.56 2.47
ULTRA-SMALL COMPANY
Period Ended December 31, 2008 (Unaudited) . . . . . . . . . . . . . . . . . . . . . . . . . 24.59 0.22 (8.72) (8.50)Year Ended June 30, 2008 . . . . . . . . . . . . . . . . . . . . . . . . . . . . . . . . . . . . . . . . . 37.65 0.03 (8.67) (8.64)Year Ended June 30, 2007 . . . . . . . . . . . . . . . . . . . . . . . . . . . . . . . . . . . . . . . . . 42.42 0.12 3.37 3.49Year Ended June 30, 2006 . . . . . . . . . . . . . . . . . . . . . . . . . . . . . . . . . . . . . . . . . 38.44 (0.15) 9.23 9.08Year Ended June 30, 2005 . . . . . . . . . . . . . . . . . . . . . . . . . . . . . . . . . . . . . . . . . 40.97 (0.10) 6.69 6.59Year Ended June 30, 2004 . . . . . . . . . . . . . . . . . . . . . . . . . . . . . . . . . . . . . . . . . 32.93 (0.33) 13.66 13.33
ULTRA-SMALL COMPANY MARKET
Period Ended December 31, 2008 (Unaudited) . . . . . . . . . . . . . . . . . . . . . . . . . 15.33 0.11 (4.71) (4.60)Year Ended June 30, 2008 . . . . . . . . . . . . . . . . . . . . . . . . . . . . . . . . . . . . . . . . . 20.36 0.14 (4.49) (4.35)Year Ended June 30, 2007 . . . . . . . . . . . . . . . . . . . . . . . . . . . . . . . . . . . . . . . . . 18.94 0.10 1.76 1.86Year Ended June 30, 2006 . . . . . . . . . . . . . . . . . . . . . . . . . . . . . . . . . . . . . . . . . 16.96 0.05 2.48 2.53Year Ended June 30, 2005 . . . . . . . . . . . . . . . . . . . . . . . . . . . . . . . . . . . . . . . . . 16.14 0.02 0.97 0.99Year Ended June 30, 2004 . . . . . . . . . . . . . . . . . . . . . . . . . . . . . . . . . . . . . . . . . 10.98 0.02 5.16 5.18
(a) Per share amounts calculated based on the average daily shares outstanding during the period.(b) Total returns and portfolio turnover for periods less than one year are not annualized.(c) Annualized for periods less than one year(d) Total return would have been lower had various fees not been waived during the period.
See Notes to Financial Statements
132 Semi-Annual Report | December 31, 2008 (Unaudited)
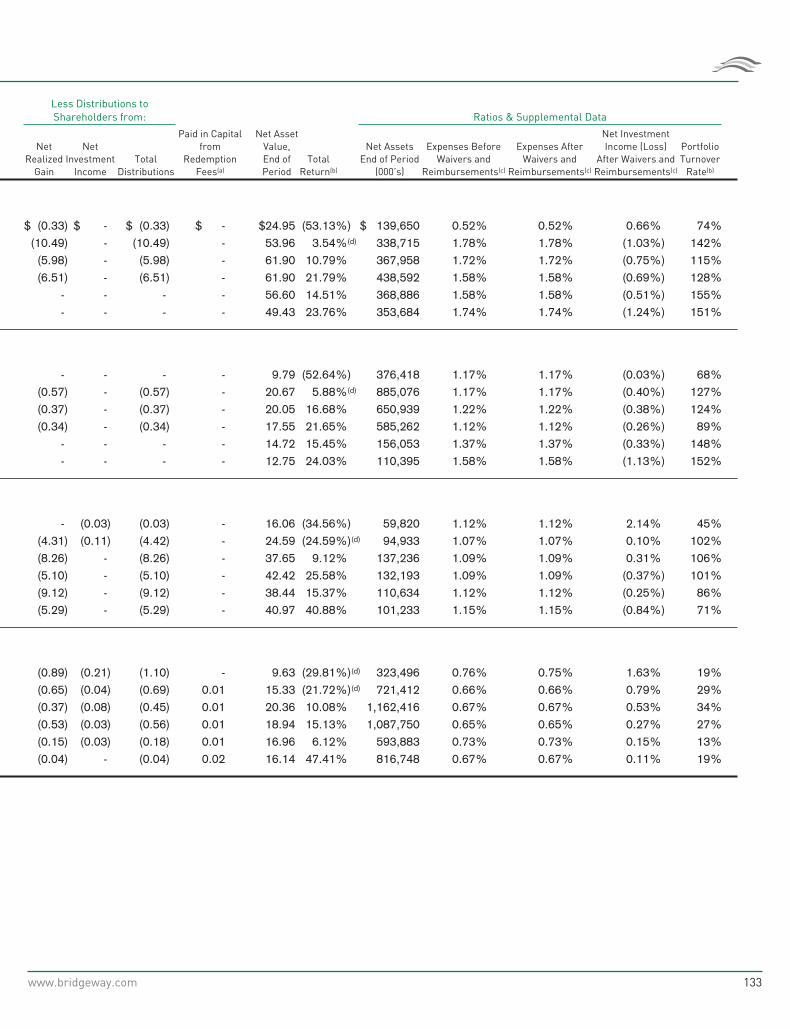
Less Distributions toShareholders from: Ratios & Supplemental Data
NetRealized
Gain
NetInvestment
IncomeTotal
Distributions
Paid in Capitalfrom
RedemptionFees(a)
Net AssetValue,End ofPeriod
TotalReturn(b)
Net AssetsEnd of Period
(000’s)
Expenses BeforeWaivers and
Reimbursements(c)
Expenses AfterWaivers and
Reimbursements(c)
Net InvestmentIncome (Loss)
After Waivers andReimbursements(c)
PortfolioTurnover
Rate(b)
$ (0.33) $ - $ (0.33) $ - $24.95 (53.13%) $ 139,650 0.52% 0.52% 0.66% 74%(10.49) - (10.49) - 53.96 3.54%(d) 338,715 1.78% 1.78% (1.03%) 142%(5.98) - (5.98) - 61.90 10.79% 367,958 1.72% 1.72% (0.75%) 115%(6.51) - (6.51) - 61.90 21.79% 438,592 1.58% 1.58% (0.69%) 128%
- - - - 56.60 14.51% 368,886 1.58% 1.58% (0.51%) 155%- - - - 49.43 23.76% 353,684 1.74% 1.74% (1.24%) 151%
- - - - 9.79 (52.64%) 376,418 1.17% 1.17% (0.03%) 68%(0.57) - (0.57) - 20.67 5.88%(d) 885,076 1.17% 1.17% (0.40%) 127%(0.37) - (0.37) - 20.05 16.68% 650,939 1.22% 1.22% (0.38%) 124%(0.34) - (0.34) - 17.55 21.65% 585,262 1.12% 1.12% (0.26%) 89%
- - - - 14.72 15.45% 156,053 1.37% 1.37% (0.33%) 148%- - - - 12.75 24.03% 110,395 1.58% 1.58% (1.13%) 152%
- (0.03) (0.03) - 16.06 (34.56%) 59,820 1.12% 1.12% 2.14% 45%(4.31) (0.11) (4.42) - 24.59 (24.59%)(d) 94,933 1.07% 1.07% 0.10% 102%(8.26) - (8.26) - 37.65 9.12% 137,236 1.09% 1.09% 0.31% 106%(5.10) - (5.10) - 42.42 25.58% 132,193 1.09% 1.09% (0.37%) 101%(9.12) - (9.12) - 38.44 15.37% 110,634 1.12% 1.12% (0.25%) 86%(5.29) - (5.29) - 40.97 40.88% 101,233 1.15% 1.15% (0.84%) 71%
(0.89) (0.21) (1.10) - 9.63 (29.81%)(d) 323,496 0.76% 0.75% 1.63% 19%(0.65) (0.04) (0.69) 0.01 15.33 (21.72%)(d) 721,412 0.66% 0.66% 0.79% 29%(0.37) (0.08) (0.45) 0.01 20.36 10.08% 1,162,416 0.67% 0.67% 0.53% 34%(0.53) (0.03) (0.56) 0.01 18.94 15.13% 1,087,750 0.65% 0.65% 0.27% 27%(0.15) (0.03) (0.18) 0.01 16.96 6.12% 593,883 0.73% 0.73% 0.15% 13%(0.04) - (0.04) 0.02 16.14 47.41% 816,748 0.67% 0.67% 0.11% 19%
www.bridgeway.com 133
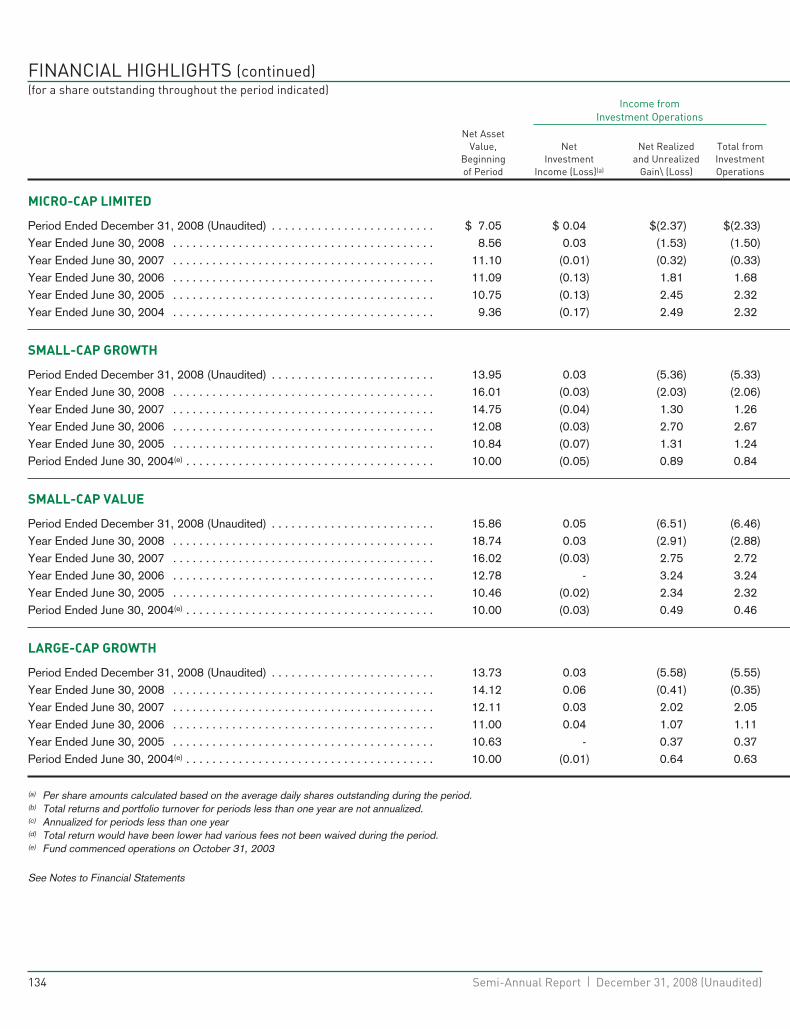
FINANCIAL HIGHLIGHTS (continued)(for a share outstanding throughout the period indicated)
Income fromInvestment Operations
Net AssetValue,
Beginningof Period
NetInvestment
Income (Loss)(a)
Net Realizedand Unrealized
Gain\ (Loss)
Total fromInvestmentOperations
MICRO-CAP LIMITED
Period Ended December 31, 2008 (Unaudited) . . . . . . . . . . . . . . . . . . . . . . . . . $ 7.05 $ 0.04 $(2.37) $(2.33)Year Ended June 30, 2008 . . . . . . . . . . . . . . . . . . . . . . . . . . . . . . . . . . . . . . . . 8.56 0.03 (1.53) (1.50)Year Ended June 30, 2007 . . . . . . . . . . . . . . . . . . . . . . . . . . . . . . . . . . . . . . . . 11.10 (0.01) (0.32) (0.33)Year Ended June 30, 2006 . . . . . . . . . . . . . . . . . . . . . . . . . . . . . . . . . . . . . . . . 11.09 (0.13) 1.81 1.68Year Ended June 30, 2005 . . . . . . . . . . . . . . . . . . . . . . . . . . . . . . . . . . . . . . . . 10.75 (0.13) 2.45 2.32Year Ended June 30, 2004 . . . . . . . . . . . . . . . . . . . . . . . . . . . . . . . . . . . . . . . . 9.36 (0.17) 2.49 2.32
SMALL-CAP GROWTH
Period Ended December 31, 2008 (Unaudited) . . . . . . . . . . . . . . . . . . . . . . . . . 13.95 0.03 (5.36) (5.33)Year Ended June 30, 2008 . . . . . . . . . . . . . . . . . . . . . . . . . . . . . . . . . . . . . . . . 16.01 (0.03) (2.03) (2.06)Year Ended June 30, 2007 . . . . . . . . . . . . . . . . . . . . . . . . . . . . . . . . . . . . . . . . 14.75 (0.04) 1.30 1.26Year Ended June 30, 2006 . . . . . . . . . . . . . . . . . . . . . . . . . . . . . . . . . . . . . . . . 12.08 (0.03) 2.70 2.67Year Ended June 30, 2005 . . . . . . . . . . . . . . . . . . . . . . . . . . . . . . . . . . . . . . . . 10.84 (0.07) 1.31 1.24Period Ended June 30, 2004(e) . . . . . . . . . . . . . . . . . . . . . . . . . . . . . . . . . . . . . . 10.00 (0.05) 0.89 0.84
SMALL-CAP VALUE
Period Ended December 31, 2008 (Unaudited) . . . . . . . . . . . . . . . . . . . . . . . . . 15.86 0.05 (6.51) (6.46)Year Ended June 30, 2008 . . . . . . . . . . . . . . . . . . . . . . . . . . . . . . . . . . . . . . . . 18.74 0.03 (2.91) (2.88)Year Ended June 30, 2007 . . . . . . . . . . . . . . . . . . . . . . . . . . . . . . . . . . . . . . . . 16.02 (0.03) 2.75 2.72Year Ended June 30, 2006 . . . . . . . . . . . . . . . . . . . . . . . . . . . . . . . . . . . . . . . . 12.78 - 3.24 3.24Year Ended June 30, 2005 . . . . . . . . . . . . . . . . . . . . . . . . . . . . . . . . . . . . . . . . 10.46 (0.02) 2.34 2.32Period Ended June 30, 2004(e) . . . . . . . . . . . . . . . . . . . . . . . . . . . . . . . . . . . . . . 10.00 (0.03) 0.49 0.46
LARGE-CAP GROWTH
Period Ended December 31, 2008 (Unaudited) . . . . . . . . . . . . . . . . . . . . . . . . . 13.73 0.03 (5.58) (5.55)Year Ended June 30, 2008 . . . . . . . . . . . . . . . . . . . . . . . . . . . . . . . . . . . . . . . . 14.12 0.06 (0.41) (0.35)Year Ended June 30, 2007 . . . . . . . . . . . . . . . . . . . . . . . . . . . . . . . . . . . . . . . . 12.11 0.03 2.02 2.05Year Ended June 30, 2006 . . . . . . . . . . . . . . . . . . . . . . . . . . . . . . . . . . . . . . . . 11.00 0.04 1.07 1.11Year Ended June 30, 2005 . . . . . . . . . . . . . . . . . . . . . . . . . . . . . . . . . . . . . . . . 10.63 - 0.37 0.37Period Ended June 30, 2004(e) . . . . . . . . . . . . . . . . . . . . . . . . . . . . . . . . . . . . . . 10.00 (0.01) 0.64 0.63
(a) Per share amounts calculated based on the average daily shares outstanding during the period.(b) Total returns and portfolio turnover for periods less than one year are not annualized.(c) Annualized for periods less than one year(d) Total return would have been lower had various fees not been waived during the period.(e) Fund commenced operations on October 31, 2003
See Notes to Financial Statements
134 Semi-Annual Report | December 31, 2008 (Unaudited)
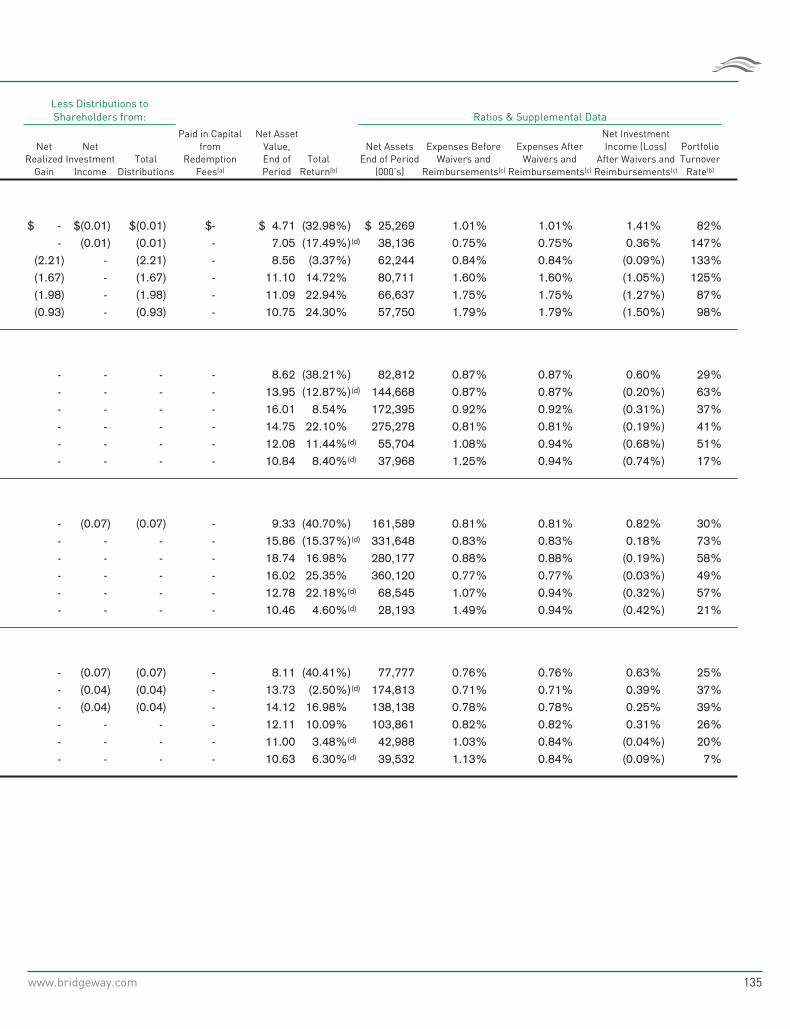
Less Distributions toShareholders from: Ratios & Supplemental Data
NetRealized
Gain
NetInvestment
IncomeTotal
Distributions
Paid in Capitalfrom
RedemptionFees(a)
Net AssetValue,End ofPeriod
TotalReturn(b)
Net AssetsEnd of Period
(000’s)
Expenses BeforeWaivers and
Reimbursements(c)
Expenses AfterWaivers and
Reimbursements(c)
Net InvestmentIncome (Loss)
After Waivers andReimbursements(c)
PortfolioTurnover
Rate(b)
$ - $(0.01) $(0.01) $- $ 4.71 (32.98%) $ 25,269 1.01% 1.01% 1.41% 82%- (0.01) (0.01) - 7.05 (17.49%)(d) 38,136 0.75% 0.75% 0.36% 147%
(2.21) - (2.21) - 8.56 (3.37%) 62,244 0.84% 0.84% (0.09%) 133%(1.67) - (1.67) - 11.10 14.72% 80,711 1.60% 1.60% (1.05%) 125%(1.98) - (1.98) - 11.09 22.94% 66,637 1.75% 1.75% (1.27%) 87%(0.93) - (0.93) - 10.75 24.30% 57,750 1.79% 1.79% (1.50%) 98%
- - - - 8.62 (38.21%) 82,812 0.87% 0.87% 0.60% 29%- - - - 13.95 (12.87%)(d) 144,668 0.87% 0.87% (0.20%) 63%- - - - 16.01 8.54% 172,395 0.92% 0.92% (0.31%) 37%- - - - 14.75 22.10% 275,278 0.81% 0.81% (0.19%) 41%- - - - 12.08 11.44%(d) 55,704 1.08% 0.94% (0.68%) 51%- - - - 10.84 8.40%(d) 37,968 1.25% 0.94% (0.74%) 17%
- (0.07) (0.07) - 9.33 (40.70%) 161,589 0.81% 0.81% 0.82% 30%- - - - 15.86 (15.37%)(d) 331,648 0.83% 0.83% 0.18% 73%- - - - 18.74 16.98% 280,177 0.88% 0.88% (0.19%) 58%- - - - 16.02 25.35% 360,120 0.77% 0.77% (0.03%) 49%- - - - 12.78 22.18%(d) 68,545 1.07% 0.94% (0.32%) 57%- - - - 10.46 4.60%(d) 28,193 1.49% 0.94% (0.42%) 21%
- (0.07) (0.07) - 8.11 (40.41%) 77,777 0.76% 0.76% 0.63% 25%- (0.04) (0.04) - 13.73 (2.50%)(d) 174,813 0.71% 0.71% 0.39% 37%- (0.04) (0.04) - 14.12 16.98% 138,138 0.78% 0.78% 0.25% 39%- - - - 12.11 10.09% 103,861 0.82% 0.82% 0.31% 26%- - - - 11.00 3.48%(d) 42,988 1.03% 0.84% (0.04%) 20%- - - - 10.63 6.30%(d) 39,532 1.13% 0.84% (0.09%) 7%
www.bridgeway.com 135
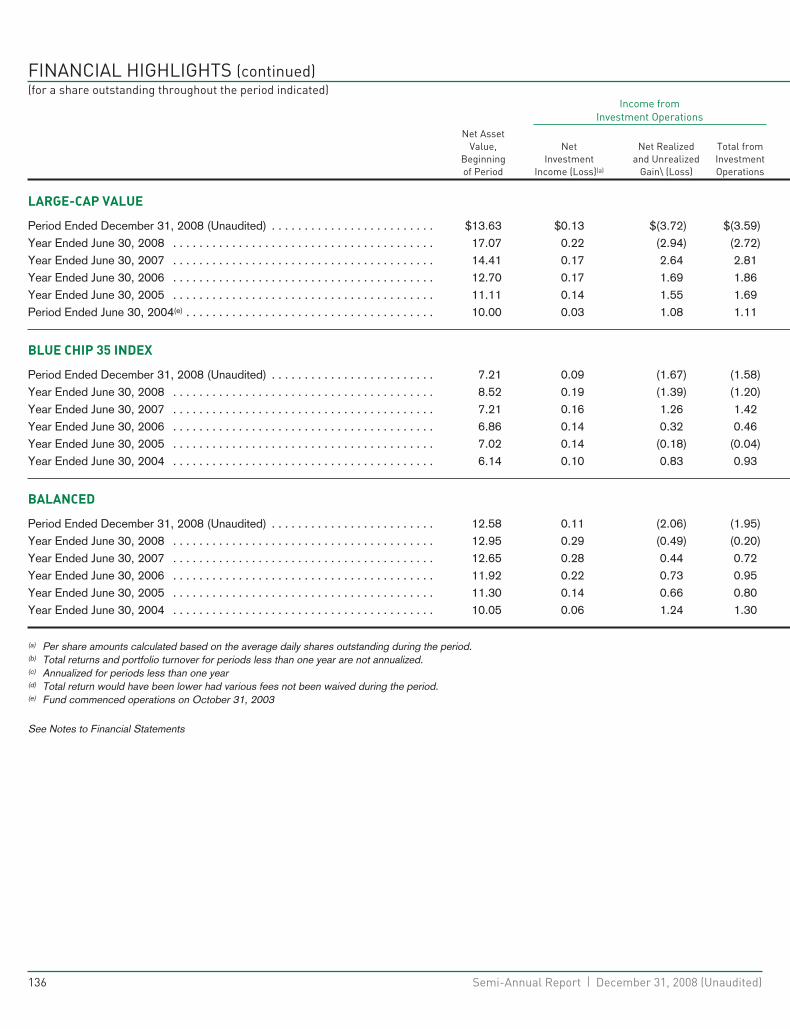
FINANCIAL HIGHLIGHTS (continued)(for a share outstanding throughout the period indicated)
Income fromInvestment Operations
Net AssetValue,
Beginningof Period
NetInvestment
Income (Loss)(a)
Net Realizedand Unrealized
Gain\ (Loss)
Total fromInvestmentOperations
LARGE-CAP VALUE
Period Ended December 31, 2008 (Unaudited) . . . . . . . . . . . . . . . . . . . . . . . . . $13.63 $0.13 $(3.72) $(3.59)Year Ended June 30, 2008 . . . . . . . . . . . . . . . . . . . . . . . . . . . . . . . . . . . . . . . . 17.07 0.22 (2.94) (2.72)Year Ended June 30, 2007 . . . . . . . . . . . . . . . . . . . . . . . . . . . . . . . . . . . . . . . . 14.41 0.17 2.64 2.81Year Ended June 30, 2006 . . . . . . . . . . . . . . . . . . . . . . . . . . . . . . . . . . . . . . . . 12.70 0.17 1.69 1.86Year Ended June 30, 2005 . . . . . . . . . . . . . . . . . . . . . . . . . . . . . . . . . . . . . . . . 11.11 0.14 1.55 1.69Period Ended June 30, 2004(e) . . . . . . . . . . . . . . . . . . . . . . . . . . . . . . . . . . . . . . 10.00 0.03 1.08 1.11
BLUE CHIP 35 INDEX
Period Ended December 31, 2008 (Unaudited) . . . . . . . . . . . . . . . . . . . . . . . . . 7.21 0.09 (1.67) (1.58)Year Ended June 30, 2008 . . . . . . . . . . . . . . . . . . . . . . . . . . . . . . . . . . . . . . . . 8.52 0.19 (1.39) (1.20)Year Ended June 30, 2007 . . . . . . . . . . . . . . . . . . . . . . . . . . . . . . . . . . . . . . . . 7.21 0.16 1.26 1.42Year Ended June 30, 2006 . . . . . . . . . . . . . . . . . . . . . . . . . . . . . . . . . . . . . . . . 6.86 0.14 0.32 0.46Year Ended June 30, 2005 . . . . . . . . . . . . . . . . . . . . . . . . . . . . . . . . . . . . . . . . 7.02 0.14 (0.18) (0.04)Year Ended June 30, 2004 . . . . . . . . . . . . . . . . . . . . . . . . . . . . . . . . . . . . . . . . 6.14 0.10 0.83 0.93
BALANCED
Period Ended December 31, 2008 (Unaudited) . . . . . . . . . . . . . . . . . . . . . . . . . 12.58 0.11 (2.06) (1.95)Year Ended June 30, 2008 . . . . . . . . . . . . . . . . . . . . . . . . . . . . . . . . . . . . . . . . 12.95 0.29 (0.49) (0.20)Year Ended June 30, 2007 . . . . . . . . . . . . . . . . . . . . . . . . . . . . . . . . . . . . . . . . 12.65 0.28 0.44 0.72Year Ended June 30, 2006 . . . . . . . . . . . . . . . . . . . . . . . . . . . . . . . . . . . . . . . . 11.92 0.22 0.73 0.95Year Ended June 30, 2005 . . . . . . . . . . . . . . . . . . . . . . . . . . . . . . . . . . . . . . . . 11.30 0.14 0.66 0.80Year Ended June 30, 2004 . . . . . . . . . . . . . . . . . . . . . . . . . . . . . . . . . . . . . . . . 10.05 0.06 1.24 1.30
(a) Per share amounts calculated based on the average daily shares outstanding during the period.(b) Total returns and portfolio turnover for periods less than one year are not annualized.(c) Annualized for periods less than one year(d) Total return would have been lower had various fees not been waived during the period.(e) Fund commenced operations on October 31, 2003
See Notes to Financial Statements
136 Semi-Annual Report | December 31, 2008 (Unaudited)
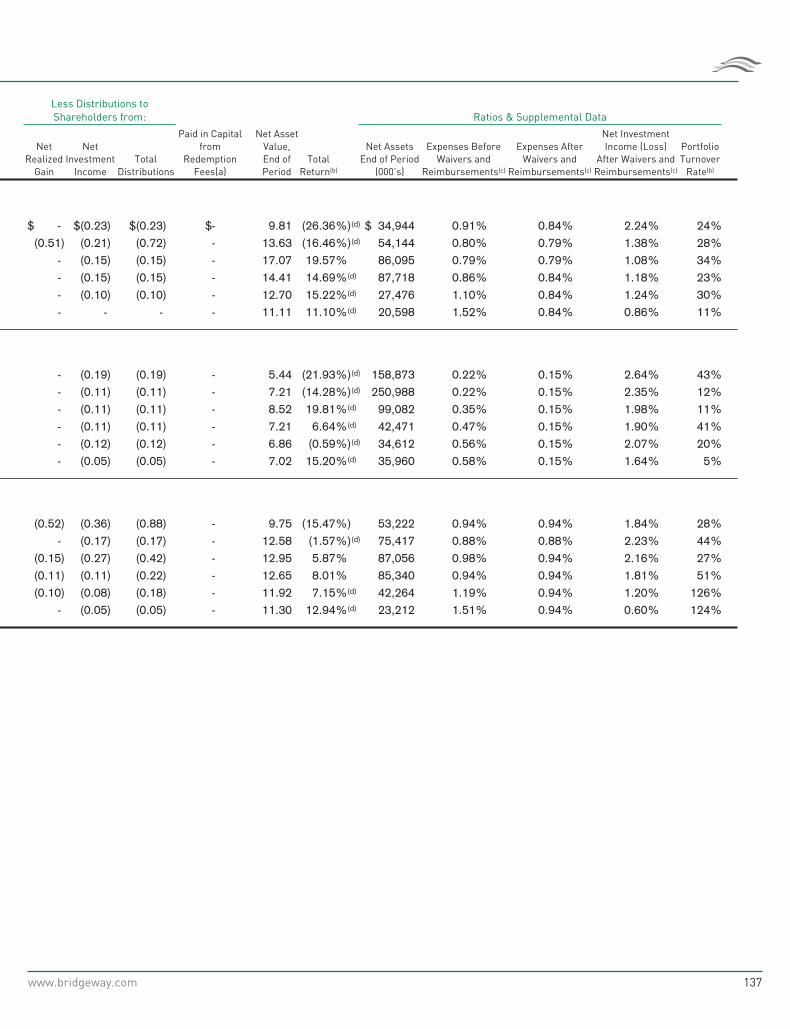
Less Distributions toShareholders from: Ratios & Supplemental Data
NetRealized
Gain
NetInvestment
IncomeTotal
Distributions
Paid in Capitalfrom
RedemptionFees(a)
Net AssetValue,End ofPeriod
TotalReturn(b)
Net AssetsEnd of Period
(000’s)
Expenses BeforeWaivers and
Reimbursements(c)
Expenses AfterWaivers and
Reimbursements(c)
Net InvestmentIncome (Loss)
After Waivers andReimbursements(c)
PortfolioTurnover
Rate(b)
$ - $(0.23) $(0.23) $- 9.81 (26.36%)(d) $ 34,944 0.91% 0.84% 2.24% 24%(0.51) (0.21) (0.72) - 13.63 (16.46%)(d) 54,144 0.80% 0.79% 1.38% 28%
- (0.15) (0.15) - 17.07 19.57% 86,095 0.79% 0.79% 1.08% 34%- (0.15) (0.15) - 14.41 14.69%(d) 87,718 0.86% 0.84% 1.18% 23%- (0.10) (0.10) - 12.70 15.22%(d) 27,476 1.10% 0.84% 1.24% 30%- - - - 11.11 11.10%(d) 20,598 1.52% 0.84% 0.86% 11%
- (0.19) (0.19) - 5.44 (21.93%)(d) 158,873 0.22% 0.15% 2.64% 43%- (0.11) (0.11) - 7.21 (14.28%)(d) 250,988 0.22% 0.15% 2.35% 12%- (0.11) (0.11) - 8.52 19.81%(d) 99,082 0.35% 0.15% 1.98% 11%- (0.11) (0.11) - 7.21 6.64%(d) 42,471 0.47% 0.15% 1.90% 41%- (0.12) (0.12) - 6.86 (0.59%)(d) 34,612 0.56% 0.15% 2.07% 20%- (0.05) (0.05) - 7.02 15.20%(d) 35,960 0.58% 0.15% 1.64% 5%
(0.52) (0.36) (0.88) - 9.75 (15.47%) 53,222 0.94% 0.94% 1.84% 28%- (0.17) (0.17) - 12.58 (1.57%)(d) 75,417 0.88% 0.88% 2.23% 44%
(0.15) (0.27) (0.42) - 12.95 5.87% 87,056 0.98% 0.94% 2.16% 27%(0.11) (0.11) (0.22) - 12.65 8.01% 85,340 0.94% 0.94% 1.81% 51%(0.10) (0.08) (0.18) - 11.92 7.15%(d) 42,264 1.19% 0.94% 1.20% 126%
- (0.05) (0.05) - 11.30 12.94%(d) 23,212 1.51% 0.94% 0.60% 124%
www.bridgeway.com 137
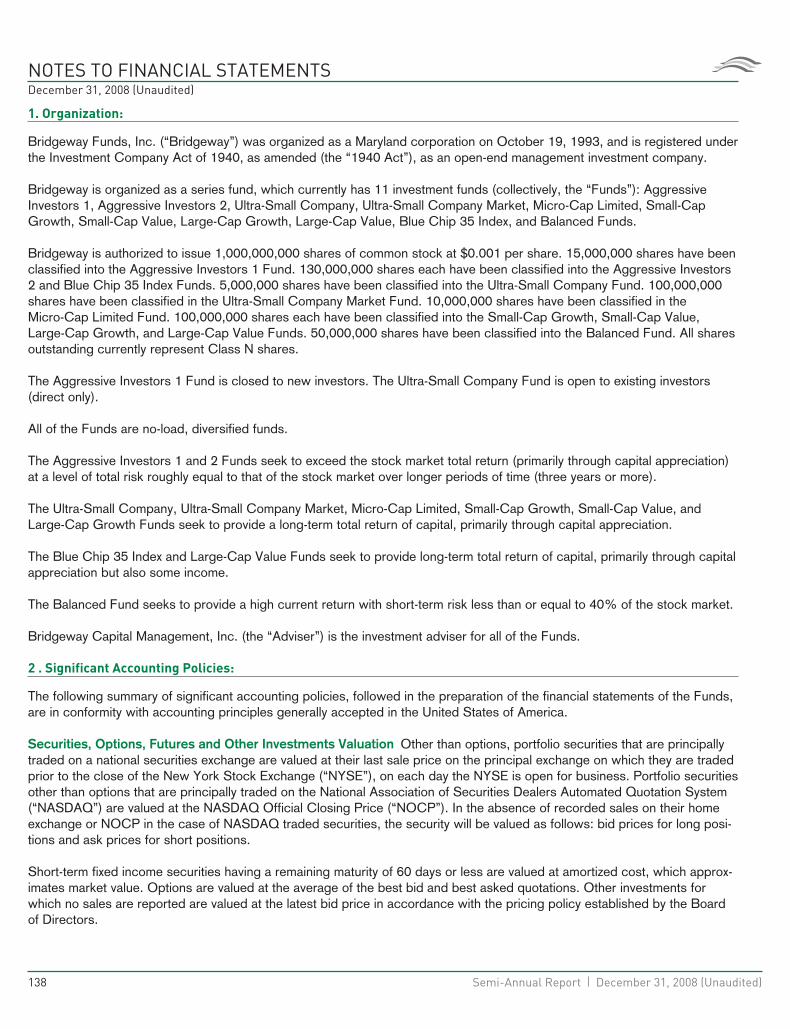
NOTES TO FINANCIAL STATEMENTSDecember 31, 2008 (Unaudited)
1. Organization:
Bridgeway Funds, Inc. (“Bridgeway”) was organized as a Maryland corporation on October 19, 1993, and is registered underthe Investment Company Act of 1940, as amended (the “1940 Act”), as an open-end management investment company.
Bridgeway is organized as a series fund, which currently has 11 investment funds (collectively, the “Funds”): AggressiveInvestors 1, Aggressive Investors 2, Ultra-Small Company, Ultra-Small Company Market, Micro-Cap Limited, Small-CapGrowth, Small-Cap Value, Large-Cap Growth, Large-Cap Value, Blue Chip 35 Index, and Balanced Funds.
Bridgeway is authorized to issue 1,000,000,000 shares of common stock at $0.001 per share. 15,000,000 shares have beenclassified into the Aggressive Investors 1 Fund. 130,000,000 shares each have been classified into the Aggressive Investors2 and Blue Chip 35 Index Funds. 5,000,000 shares have been classified into the Ultra-Small Company Fund. 100,000,000shares have been classified in the Ultra-Small Company Market Fund. 10,000,000 shares have been classified in theMicro-Cap Limited Fund. 100,000,000 shares each have been classified into the Small-Cap Growth, Small-Cap Value,Large-Cap Growth, and Large-Cap Value Funds. 50,000,000 shares have been classified into the Balanced Fund. All sharesoutstanding currently represent Class N shares.
The Aggressive Investors 1 Fund is closed to new investors. The Ultra-Small Company Fund is open to existing investors(direct only).
All of the Funds are no-load, diversified funds.
The Aggressive Investors 1 and 2 Funds seek to exceed the stock market total return (primarily through capital appreciation)at a level of total risk roughly equal to that of the stock market over longer periods of time (three years or more).
The Ultra-Small Company, Ultra-Small Company Market, Micro-Cap Limited, Small-Cap Growth, Small-Cap Value, andLarge-Cap Growth Funds seek to provide a long-term total return of capital, primarily through capital appreciation.
The Blue Chip 35 Index and Large-Cap Value Funds seek to provide long-term total return of capital, primarily through capitalappreciation but also some income.
The Balanced Fund seeks to provide a high current return with short-term risk less than or equal to 40% of the stock market.
Bridgeway Capital Management, Inc. (the “Adviser”) is the investment adviser for all of the Funds.
2 . Significant Accounting Policies:
The following summary of significant accounting policies, followed in the preparation of the financial statements of the Funds,are in conformity with accounting principles generally accepted in the United States of America.
Securities, Options, Futures and Other Investments Valuation Other than options, portfolio securities that are principallytraded on a national securities exchange are valued at their last sale price on the principal exchange on which they are tradedprior to the close of the New York Stock Exchange (“NYSE”), on each day the NYSE is open for business. Portfolio securitiesother than options that are principally traded on the National Association of Securities Dealers Automated Quotation System(“NASDAQ”) are valued at the NASDAQ Official Closing Price (“NOCP”). In the absence of recorded sales on their homeexchange or NOCP in the case of NASDAQ traded securities, the security will be valued as follows: bid prices for long posi-tions and ask prices for short positions.
Short-term fixed income securities having a remaining maturity of 60 days or less are valued at amortized cost, which approx-imates market value. Options are valued at the average of the best bid and best asked quotations. Other investments forwhich no sales are reported are valued at the latest bid price in accordance with the pricing policy established by the Boardof Directors.
138 Semi-Annual Report | December 31, 2008 (Unaudited)
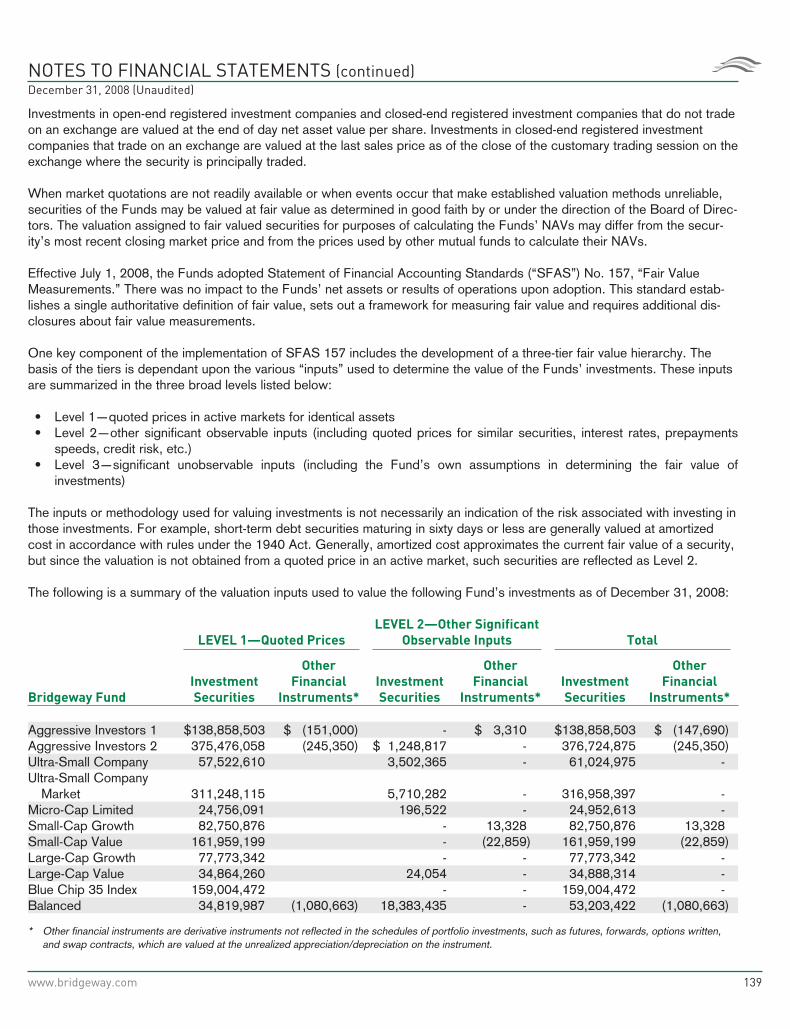
NOTES TO FINANCIAL STATEMENTS (continued)December 31, 2008 (Unaudited)
Investments in open-end registered investment companies and closed-end registered investment companies that do not tradeon an exchange are valued at the end of day net asset value per share. Investments in closed-end registered investmentcompanies that trade on an exchange are valued at the last sales price as of the close of the customary trading session on theexchange where the security is principally traded.
When market quotations are not readily available or when events occur that make established valuation methods unreliable,securities of the Funds may be valued at fair value as determined in good faith by or under the direction of the Board of Direc-tors. The valuation assigned to fair valued securities for purposes of calculating the Funds’ NAVs may differ from the secur-ity’s most recent closing market price and from the prices used by other mutual funds to calculate their NAVs.
Effective July 1, 2008, the Funds adopted Statement of Financial Accounting Standards (“SFAS”) No. 157, “Fair ValueMeasurements.” There was no impact to the Funds’ net assets or results of operations upon adoption. This standard estab-lishes a single authoritative definition of fair value, sets out a framework for measuring fair value and requires additional dis-closures about fair value measurements.
One key component of the implementation of SFAS 157 includes the development of a three-tier fair value hierarchy. Thebasis of the tiers is dependant upon the various “inputs” used to determine the value of the Funds’ investments. These inputsare summarized in the three broad levels listed below:
• Level 1—quoted prices in active markets for identical assets• Level 2—other significant observable inputs (including quoted prices for similar securities, interest rates, prepayments
speeds, credit risk, etc.)• Level 3—significant unobservable inputs (including the Fund’s own assumptions in determining the fair value of
investments)
The inputs or methodology used for valuing investments is not necessarily an indication of the risk associated with investing inthose investments. For example, short-term debt securities maturing in sixty days or less are generally valued at amortizedcost in accordance with rules under the 1940 Act. Generally, amortized cost approximates the current fair value of a security,but since the valuation is not obtained from a quoted price in an active market, such securities are reflected as Level 2.
The following is a summary of the valuation inputs used to value the following Fund’s investments as of December 31, 2008:
LEVEL 1—Quoted Prices
LEVEL 2—Other Significant
Observable Inputs Total
Bridgeway Fund
Investment
Securities
Other
Financial
Instruments*
Investment
Securities
Other
Financial
Instruments*
Investment
Securities
Other
Financial
Instruments*
Aggressive Investors 1 $138,858,503 $ (151,000) - $ 3,310 $138,858,503 $ (147,690)Aggressive Investors 2 375,476,058 (245,350) $ 1,248,817 - 376,724,875 (245,350)Ultra-Small Company 57,522,610 3,502,365 - 61,024,975 -Ultra-Small Company
Market 311,248,115 5,710,282 - 316,958,397 -Micro-Cap Limited 24,756,091 196,522 - 24,952,613 -Small-Cap Growth 82,750,876 - 13,328 82,750,876 13,328Small-Cap Value 161,959,199 - (22,859) 161,959,199 (22,859)Large-Cap Growth 77,773,342 - - 77,773,342 -Large-Cap Value 34,864,260 24,054 - 34,888,314 -Blue Chip 35 Index 159,004,472 - - 159,004,472 -Balanced 34,819,987 (1,080,663) 18,383,435 - 53,203,422 (1,080,663)
* Other financial instruments are derivative instruments not reflected in the schedules of portfolio investments, such as futures, forwards, options written,and swap contracts, which are valued at the unrealized appreciation/depreciation on the instrument.
www.bridgeway.com 139
NOTES TO FINANCIAL STATEMENTS (continued)December 31, 2008 (Unaudited)
Securities Lending Upon lending its securities to third parties, the Fund receives compensation in the form of fees. TheFund also continues to receive dividends on the securities loaned. The loans are secured by collateral at least equal to the fairvalue of the securities loaned plus accrued interest. Gain or loss in the fair value of the securities loaned that may occur dur-ing the term of the loan will be for the account of the Fund. The Fund has the right under the lending agreement to recoverthe securities from the borrower on demand. Additionally, the Fund does not have the right to sell or repledge collateralreceived in the form of securities unless the borrower goes into default. The risks to the Fund of securities lending are thatthe borrower may not provide additional collateral when required or return the securities when due.
As of December 31, 2008, the Funds had securities on loan and related collateral with values shown below
Bridgeway Fund
Securities on
Loan Value
Value of
Securities
Received as
Collateral
Aggressive Investors 1 $38,667,815 $39,335,574Aggressive Investors 2 $82,210,098 $85,777,485Ultra-Small Company $ 7,823,129 $ 8,118,071Ultra-Small Company Market $34,875,495 $37,861,788Micro-Cap Limited $ 3,031,379 $ 3,069,485Small-Cap Growth $24,594,643 $25,255,166Small-Cap Value $22,107,190 $22,526,261Large-Cap Growth $11,399,173 $11,620,032Large-Cap Value $ 528,625 $ 553,060Blue Chip 35 Index $10,767,911 $10,834,770Balanced $ 3,791,244 $ 3,878,144
It is the Fund’s policy to obtain additional collateral from or return excess collateral to the borrower by the end of the nextbusiness day, following the valuation date of the securities loaned. Therefore, the value of the collateral held may be tempora-rily less than that required under the lending contract.
Federal Income Taxes It is the Funds’ policy to continue to comply with the provisions of the Internal Revenue Code appli-cable to registered investment companies and to distribute income to the extent necessary so that the Funds are not subjectto federal income tax. Therefore, no federal income tax provision is required.
Use of Estimates in Financial Statements In preparing financial statements in conformity with accounting principles gen-erally accepted in the United States of America, management makes estimates and assumptions that affect the reportedamounts of assets and liabilities at the date of the financial statements and the disclosure of contingent assets and liabilities atthe date of the financial statements as well as the reported amounts of revenue and expenses during the reporting period.Actual results could differ from those estimates.
Risks and Uncertainties The Funds provide for various investment options, including stocks and call and put options. Suchinvestments are exposed to various risks, such as interest rate, market and credit risks. Due to the risks involved, it is at leastreasonably possible that changes in risks in the near term would materially affect shareholders’ account values and theamounts reported in the financial statements and financial highlights.
Security Transactions, Expenses, Gains and Losses and Allocations Fund expenses that are not series specific are allo-cated to each series based upon its relative proportion of net assets to the Funds’ total net assets or other appropriate basis.
Security transactions are accounted for as of the trade date, the date the order to buy or sell is executed. Realized gains andlosses are computed on the identified cost basis. Dividend income is recorded on the ex-dividend date, and interest income isrecorded on the accrual basis from settlement date. Particularly related to the Balanced Fund, discounts and premiums areaccreted/amortized on the effective interest method.
140 Semi-Annual Report | December 31, 2008 (Unaudited)
NOTES TO FINANCIAL STATEMENTS (continued)December 31, 2008 (Unaudited)
Futures Contracts A futures contract is an agreement between two parties to buy or sell a financial instrument at a set priceon a future date. Upon entering into such a contract a Fund is required to pledge to the broker an amount of cash or U.S.government securities equal to the minimum “initial margin” requirements of the exchange on which the futures contract istraded. The contract amount reflects the extent of a Fund’s exposure in these financial instruments. The Fund’s participationin the futures markets involves certain risks, including imperfect correlation between movements in the price of futures con-tracts and movements in the price of the securities hedged or used for cover. The Fund’s activities in the futures contractsare conducted through regulated exchanges that do not result in counterparty credit risks on a periodic basis. Pursuant to acontract, the Fund agrees to receive from or pay to the broker an amount of cash equal to the fluctuation in value of the con-tract. Such receipts or payments are known as “variation margin” and are recorded by the Fund as unrealized appreciation ordepreciation. When a contract is closed, the Fund records a realized gain or loss equal to the difference between the value ofthe contract at the time it was opened and the value at the time it was closed. As of December 31, 2008, the Funds had noopen futures contracts.
Options An option is a contract conveying a right to buy or sell a financial instrument at a specified price during a stipulatedperiod. The premium paid by a Fund for the purchase of a call or a put option is included in the Fund’s Schedule of Invest-ments as an investment and subsequently marked to market to reflect the current market value of the option. When a Fundwrites a call or a put option, an amount equal to the premium received by the Fund is included in the Fund’s Statement ofAssets and Liabilities as a liability and is subsequently marked to market to reflect the current market value of the option writ-ten. If an option which a Fund has written either expires on its stipulated expiration date, or if the Fund enters into a closingpurchase transaction, the Fund realizes a gain (or a loss if the cost of a closing purchase transaction exceeds the premiumreceived when the option was written) without regard to any unrealized gain or loss on the underlying security, and the liabilityrelated to such options is extinguished. If a call option that a Fund has written is assigned, the Fund realizes a gain or lossfrom the sale of the underlying security and the proceeds from such sale are increased by the premium originally received. Ifa put option that a Fund has written is assigned, the amount of the premium originally received reduces the cost of the secu-rity that the Fund purchased upon exercise of the option. Buying calls increases a Fund’s exposure to the underlying securityto the extent of any premium paid. Buying puts on a stock market index tends to limit a Fund’s exposure to a stock marketdecline. All options purchased by the Funds were listed on exchanges and considered liquid positions with readily availablemarket quotes.
Covered Call Options and Secured Puts The Aggressive Investors 1, Aggressive Investors 2, and Balanced Funds maywrite call options on a covered basis, that is, the Fund will own the underlying security, or the Fund may write secured puts.The principal reason for writing covered calls and secured puts on a security is to attempt to realize income, through thereceipt of premiums. The option writer has, in return for the premium, given up the opportunity for profit from a substantialprice increase in the underlying security so long as the obligation as a writer continues, but has retained the risk of lossshould the price of the security decline. All options were listed on exchanges and considered liquid positions with readilyavailable market quotes. As of December 31, 2008 the following funds had outstanding written options, AggressiveInvestors 1, Aggressive Investor 2 and Balanced Funds.
A summary of the options transactions written by each of the Funds is as follows:
Aggressive Investors 1 Fund
Written Call Options
Aggressive Investors 1 Fund
Written Put Options
Contracts Premiums Contracts Premiums
Outstanding, June 30, 2008 - $ - - $ -Positions Opened 3,924 3,677,260 500 65,805Exercised - - (500) (65,805)Expired (1,040) (674,494) - -Closed (2,684) (2,836,017) - -
Outstanding, December 31, 2008 200 $ 166,749 - $ -
Market Value, December 31, 2008 $ 151,000 $ -
www.bridgeway.com 141
NOTES TO FINANCIAL STATEMENTS (continued)December 31, 2008 (Unaudited)
Aggressive Investors 2 Fund
Written Call Options
Contracts Premiums
Outstanding, June 30, 2008 - $ -Positions Opened 4,900 4,473,880Exercised - -Expired (1,291) (648,216)Closed (3,289) (3,555,326)
Outstanding, December 31, 2008 320 $ 270,338
Market Value, December 31, 2008 $ 245,350
Balanced Fund Written
Call Options
Balanced Fund Written
Put Options
Contracts Premiums Contracts Premiums
Outstanding, June 30, 2008 4,223 $ 729,973 1,695 $ 594,878Positions Opened 9,454 2,591,545 5,973 1,767,335Exercised (1,005) (142,073) (2,345) (861,685)Expired (7,413) (1,944,785) (1,295) (381,795)Closed (884) (223,992) (2,137) (648,690)
Outstanding, December 31, 2008 4,375 $ 1,010,668 1,891 $ 470,043
Market Value, December 31, 2008 $ 921,230 $ 159,433
Swaps. Each Fund may enter into total return swaps. Total return swaps are agreements that provide a Fund with a returnbased on the performance of an underlying asset, in exchange for fee payments to a counterparty based on a specified rate.The difference in the value of these income streams is recorded daily by the Funds, and is settled in cash monthly. The feepaid by a Fund will typically be determined by multiplying the face value of the swap agreement by an agreed upon interestrate. In addition, if the underlying asset declines in value over the term of the swap, the Fund would also be required to paythe dollar value of that decline to the counterparty. Total return swaps could result in losses if the underlying asset does notperform as anticipated by the Adviser. A Fund may use its own net asset value as the underlying asset in a total return swap.This strategy serves to reduce cash drag (the impact of cash on a Fund’s overall return) by replacing it with the impact ofmarket exposure based upon the Fund’s own investment holdings. The following total return swaps were open as ofDecember 31, 2008:
Portfolio
Swap
Counterparty
Notional
Principal
Maturity
Date
Net Unrealized
Gain\(Loss)
Small-Cap Growth ReFlow Management Co. 229,267 January 1, 2009 $13,328
Indemnification Under Bridgeway’s organizational documents, the Funds’ officers, directors, employees and agents areindemnified against certain liabilities that may arise out of the performance of their duties to the Funds. Additionally, in thenormal course of business, the Funds enter into contracts that contain a variety of indemnification clauses. The Funds’ max-imum exposure under these arrangements is unknown as this would involve future claims that may be made against theFunds that have not yet occurred. However, the Funds have not had prior claims or losses pursuant to these contracts.
142 Semi-Annual Report | December 31, 2008 (Unaudited)
NOTES TO FINANCIAL STATEMENTS (continued)December 31, 2008 (Unaudited)
3. Management Fees, Other Related Party Transactions and Contingencies:
The Funds have entered into management agreements with the Adviser. As compensation for the advisory services rendered,facilities furnished, and expenses borne by the Adviser, the Funds pay the Adviser a fee pursuant to each Fund’s manage-ment agreement, as described below.
Aggressive Investors 1: A total advisory fee is paid by the Fund to the Adviser that is comprised of a Base Fee and a Per-formance Adjustment. The Base Fee equals the Base Fee Rate times the average daily net assets of the Fund. The Base FeeRate is based on the following annual rates: 0.90% of the first $250 million of the Fund’s average daily net assets, 0.875% ofthe next $250 million and 0.85% of any excess over $500 million.
The Performance Adjustment equals 4.67% times the difference in cumulative total return between the Fund and the Stan-dard and Poor’s 500 Index with dividends reinvested (hereinafter “Index”) over a rolling five-year performance period. ThePerformance Adjustment Rate varies from a minimum of –0.70% to a maximum of +0.70%. However, the PerformanceAdjustment Rate is zero if the difference between the cumulative Fund performance and the Index performance is less than orequal to 2%.
Aggressive Investors 2: A total advisory fee is paid by the Fund to the Adviser that is comprised of a Base Fee and a Per-formance Adjustment. The Base Fee equals the Base Fee Rate times the average daily net assets of the Fund. The Base Feerate is based on the following annual rates: 0.90% of the first $250 million of the Fund’s average daily net assets, 0.875% ofthe next $250 million, 0.85% from $500 million to $1 billion, and 0.80% over $1 billion.
The Performance Adjustment equals 2.00% times the difference in cumulative total return between the Fund and the Stan-dard and Poor’s 500 Index with dividends reinvested (hereinafter “Index”) over a rolling five-year performance period. ThePerformance Adjustment Rate varies from a minimum of -0.30% to a maximum of +0.30%. However, the PerformanceAdjustment Rate is zero if the difference between the cumulative Fund performance and the Index performance is less than orequal to 2%.
Ultra-Small Company: The Fund pays management fees based on the following annual rates: 0.90% of the first $250 millionof the Fund’s average daily net assets, 0.875% of the next $250 million and 0.85% of any excess over $500 million. Themanagement fees are computed daily and are payable monthly. However, during any period that the Fund’s net assets rangefrom $27,500,000 to $55,000,000, the advisory fee will be determined as if the Fund had $55,000,000 under management.This is limited to a maximum annualized expense ratio of 1.49% of average net assets.
Ultra-Small Company Market: The Fund’s management fee is a flat 0.50% of the value of the Fund’s average daily netassets, computed daily and payable monthly.
Micro-Cap Limited: A total advisory fee is paid by the Fund to the Adviser that is comprised of a Base Fee and a Perform-ance Adjustment. The Base Fee equals the Base Fee Rate times the average daily net assets of the Fund. The Base FeeRate is based on the following annual rates: 0.90% of the first $250 million of the Fund’s average daily net assets, 0.875% ofthe next $250 million and 0.85% of any excess over $500 million. However, during any quarter that the Fund’s net assetsrange from $27,500,000 to $55,000,000, the advisory fee will be determined as if the Fund had $55,000,000 undermanagement. This is limited to a maximum annualized expense ratio of 1.49% of the net assets in the quarter the advisory feeis determined.
The Performance Adjustment equals 2.87% times the difference in cumulative total return between the Fund and the CRSPCap-based Portfolio 9 Index with dividends reinvested (hereinafter “Index”) over a rolling five-year performance period. ThePerformance Adjustment Rate varies from a minimum of –0.70% to a maximum of +0.70%. However, the PerformanceAdjustment Rate is zero if the difference between the cumulative Fund performance and the Index performance is less than orequal to 2%.
Small-Cap Growth and Small-Cap Value: A total advisory fee is paid by each Fund to the Adviser that is comprised of aBase Fee and a Performance Adjustment. The Base Fee equals the Base Fee Rate times the average daily net assets of theFund. The Base Fee Rate is based on the annual rate of 0.60% of the value of the Fund’s average daily net assets.
www.bridgeway.com 143
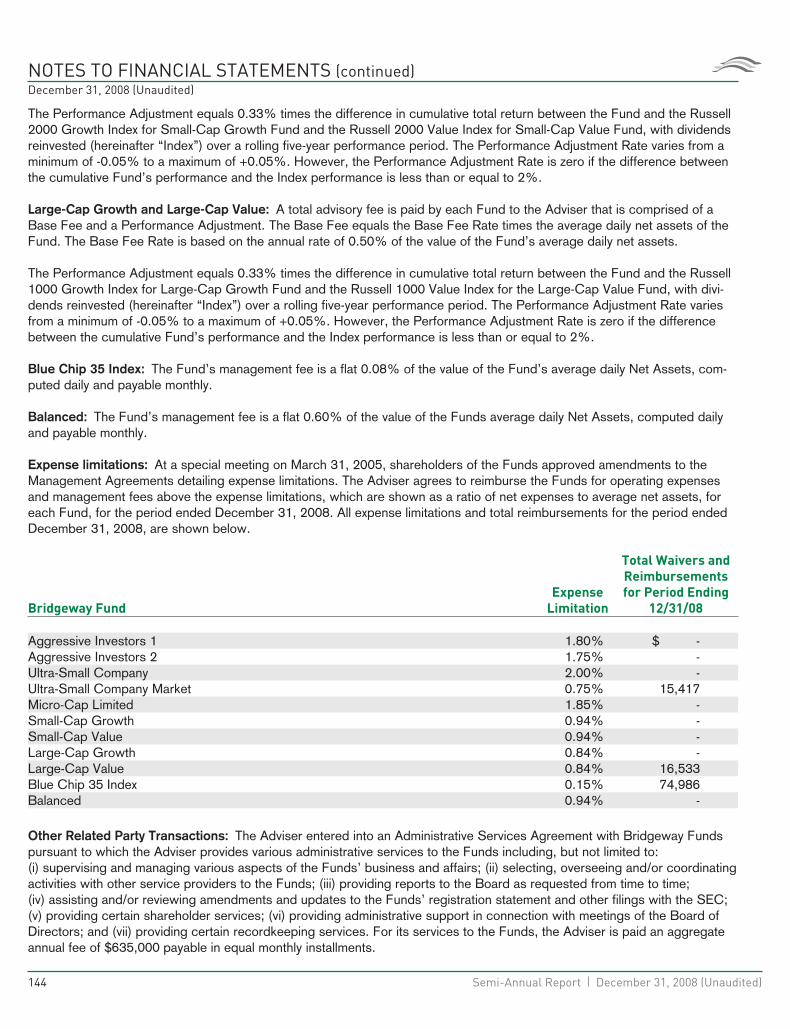
NOTES TO FINANCIAL STATEMENTS (continued)December 31, 2008 (Unaudited)
The Performance Adjustment equals 0.33% times the difference in cumulative total return between the Fund and the Russell2000 Growth Index for Small-Cap Growth Fund and the Russell 2000 Value Index for Small-Cap Value Fund, with dividendsreinvested (hereinafter “Index”) over a rolling five-year performance period. The Performance Adjustment Rate varies from aminimum of -0.05% to a maximum of +0.05%. However, the Performance Adjustment Rate is zero if the difference betweenthe cumulative Fund’s performance and the Index performance is less than or equal to 2%.
Large-Cap Growth and Large-Cap Value: A total advisory fee is paid by each Fund to the Adviser that is comprised of aBase Fee and a Performance Adjustment. The Base Fee equals the Base Fee Rate times the average daily net assets of theFund. The Base Fee Rate is based on the annual rate of 0.50% of the value of the Fund’s average daily net assets.
The Performance Adjustment equals 0.33% times the difference in cumulative total return between the Fund and the Russell1000 Growth Index for Large-Cap Growth Fund and the Russell 1000 Value Index for the Large-Cap Value Fund, with divi-dends reinvested (hereinafter “Index”) over a rolling five-year performance period. The Performance Adjustment Rate variesfrom a minimum of -0.05% to a maximum of +0.05%. However, the Performance Adjustment Rate is zero if the differencebetween the cumulative Fund’s performance and the Index performance is less than or equal to 2%.
Blue Chip 35 Index: The Fund’s management fee is a flat 0.08% of the value of the Fund’s average daily Net Assets, com-puted daily and payable monthly.
Balanced: The Fund’s management fee is a flat 0.60% of the value of the Funds average daily Net Assets, computed dailyand payable monthly.
Expense limitations: At a special meeting on March 31, 2005, shareholders of the Funds approved amendments to theManagement Agreements detailing expense limitations. The Adviser agrees to reimburse the Funds for operating expensesand management fees above the expense limitations, which are shown as a ratio of net expenses to average net assets, foreach Fund, for the period ended December 31, 2008. All expense limitations and total reimbursements for the period endedDecember 31, 2008, are shown below.
Bridgeway Fund
Expense
Limitation
Total Waivers and
Reimbursements
for Period Ending
12/31/08
Aggressive Investors 1 1.80% $ -Aggressive Investors 2 1.75% -Ultra-Small Company 2.00% -Ultra-Small Company Market 0.75% 15,417Micro-Cap Limited 1.85% -Small-Cap Growth 0.94% -Small-Cap Value 0.94% -Large-Cap Growth 0.84% -Large-Cap Value 0.84% 16,533Blue Chip 35 Index 0.15% 74,986Balanced 0.94% -
Other Related Party Transactions: The Adviser entered into an Administrative Services Agreement with Bridgeway Fundspursuant to which the Adviser provides various administrative services to the Funds including, but not limited to:(i) supervising and managing various aspects of the Funds’ business and affairs; (ii) selecting, overseeing and/or coordinatingactivities with other service providers to the Funds; (iii) providing reports to the Board as requested from time to time;(iv) assisting and/or reviewing amendments and updates to the Funds’ registration statement and other filings with the SEC;(v) providing certain shareholder services; (vi) providing administrative support in connection with meetings of the Board ofDirectors; and (vii) providing certain recordkeeping services. For its services to the Funds, the Adviser is paid an aggregateannual fee of $635,000 payable in equal monthly installments.
144 Semi-Annual Report | December 31, 2008 (Unaudited)
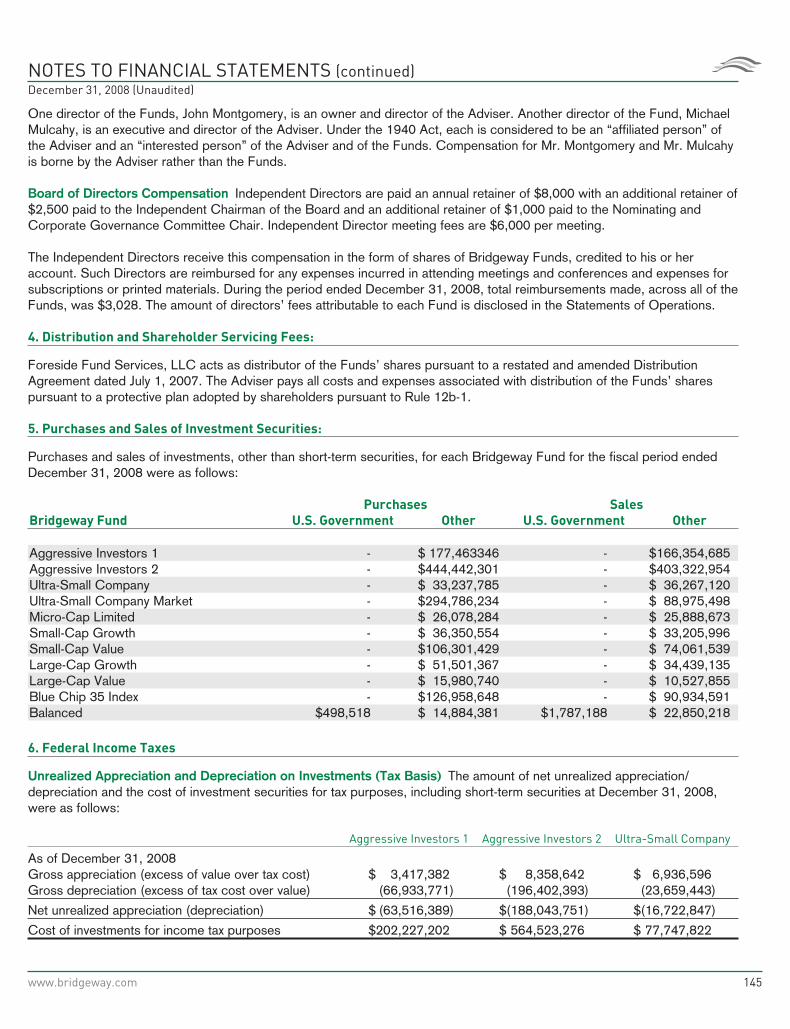
NOTES TO FINANCIAL STATEMENTS (continued)December 31, 2008 (Unaudited)
One director of the Funds, John Montgomery, is an owner and director of the Adviser. Another director of the Fund, MichaelMulcahy, is an executive and director of the Adviser. Under the 1940 Act, each is considered to be an “affiliated person” ofthe Adviser and an “interested person” of the Adviser and of the Funds. Compensation for Mr. Montgomery and Mr. Mulcahyis borne by the Adviser rather than the Funds.
Board of Directors Compensation Independent Directors are paid an annual retainer of $8,000 with an additional retainer of$2,500 paid to the Independent Chairman of the Board and an additional retainer of $1,000 paid to the Nominating andCorporate Governance Committee Chair. Independent Director meeting fees are $6,000 per meeting.
The Independent Directors receive this compensation in the form of shares of Bridgeway Funds, credited to his or heraccount. Such Directors are reimbursed for any expenses incurred in attending meetings and conferences and expenses forsubscriptions or printed materials. During the period ended December 31, 2008, total reimbursements made, across all of theFunds, was $3,028. The amount of directors’ fees attributable to each Fund is disclosed in the Statements of Operations.
4. Distribution and Shareholder Servicing Fees:
Foreside Fund Services, LLC acts as distributor of the Funds’ shares pursuant to a restated and amended DistributionAgreement dated July 1, 2007. The Adviser pays all costs and expenses associated with distribution of the Funds’ sharespursuant to a protective plan adopted by shareholders pursuant to Rule 12b-1.
5. Purchases and Sales of Investment Securities:
Purchases and sales of investments, other than short-term securities, for each Bridgeway Fund for the fiscal period endedDecember 31, 2008 were as follows:
Purchases Sales
Bridgeway Fund U.S. Government Other U.S. Government Other
Aggressive Investors 1 - $ 177,463346 - $166,354,685Aggressive Investors 2 - $444,442,301 - $403,322,954Ultra-Small Company - $ 33,237,785 - $ 36,267,120Ultra-Small Company Market - $294,786,234 - $ 88,975,498Micro-Cap Limited - $ 26,078,284 - $ 25,888,673Small-Cap Growth - $ 36,350,554 - $ 33,205,996Small-Cap Value - $106,301,429 - $ 74,061,539Large-Cap Growth - $ 51,501,367 - $ 34,439,135Large-Cap Value - $ 15,980,740 - $ 10,527,855Blue Chip 35 Index - $126,958,648 - $ 90,934,591Balanced $498,518 $ 14,884,381 $1,787,188 $ 22,850,218
6. Federal Income Taxes
Unrealized Appreciation and Depreciation on Investments (Tax Basis) The amount of net unrealized appreciation/depreciation and the cost of investment securities for tax purposes, including short-term securities at December 31, 2008,were as follows:
Aggressive Investors 1 Aggressive Investors 2 Ultra-Small Company
As of December 31, 2008Gross appreciation (excess of value over tax cost) $ 3,417,382 $ 8,358,642 $ 6,936,596Gross depreciation (excess of tax cost over value) (66,933,771) (196,402,393) (23,659,443)
Net unrealized appreciation (depreciation) $ (63,516,389) $(188,043,751) $(16,722,847)
Cost of investments for income tax purposes $202,227,202 $ 564,523,276 $ 77,747,822
www.bridgeway.com 145
NOTES TO FINANCIAL STATEMENTS (continued)December 31, 2008 (Unaudited)
Ultra-SmallCompany Market Micro-Cap Limited Small-Cap Growth Small-Cap Value
As of December 31, 2008Gross appreciation (excess of value over tax
cost) $ 73,153,445 $ 2,647,705 $ 6,901,306 $ 14,145,956Gross depreciation (excess of tax cost over
value) (96,587,505) (7,146,761) (29,130,079) (70,073,404)
Net unrealized appreciation (depreciation) $ (23,434,060) $ (4,499,056) $ (22,228,773) $ (55,927,448)
Cost of investments for income tax purposes $340,392,457 $29,451,669 $104,992,977 $217,863,788
Large-Cap Growth Large-Cap Value Blue Chip 35 Index Balanced
As of December 31, 2008Gross appreciation (excess of value over tax
cost) $ 3,716,897 $ 2,889,668 $ 3,949,251 $ 5,041,081Gross depreciation (excess of tax cost over
value) (37,077,705) (5,573,616) (48,145,780) (11,924,676)
Net unrealized appreciation (depreciation) $ (33,360,808) $ (2,683,948) $ (44,196,529) $ (6,883,595)
Cost of investments for income tax purposes $111,134,150 $37,572,262 $203,201,001 $ 59,006,354
The differences between book and tax net unrealized appreciation are primarily due to wash sale loss deferrals.
Classifications of Distributions Net investment income (loss) and net realized gain (loss) may differ for financial statementand tax purposes. The character of distributions made during the year from net investment income or net realized gains maydiffer from its ultimate characterization for federal income tax purposes.
The difference between book and tax components of net assets and the resulting reclassifications were primarily a result ofthe differing book/tax treatment of net operating losses and certain expenses.
The tax character of the distributions paid by the Funds during the last two fiscal years ended June 30, 2008 and June 30,2007, respectively are as follows:
Aggressive Investors 1 Aggressive Investors 2Year
EndedJune 30, 2008
YearEnded
June 30, 2007
YearEnded
June 30, 2008
YearEnded
June 30, 2007
Distributions paid from:Long Term Capital Gain $59,135,745 $38,922,847 $21,016,161 $12,277,639
Total $59,135,745 $38,922,847 $21,016,161 $12,277,639
Ultra-Small Company Ultra-Small Company MarketYear
EndedJune 30, 2008
YearEnded
June 30, 2007
YearEnded
June 30, 2008
YearEnded
June 30, 2007
Distributions paid from:Ordinary income $ 394,104 $ 1,877,630 $ 2,258,281 $ 4,933,248Long Term Capital Gain 15,085,219 23,500,754 34,714,496 22,318,728
Total $15,479,323 $25,378,384 $36,972,777 $27,251,976
146 Semi-Annual Report | December 31, 2008 (Unaudited)
NOTES TO FINANCIAL STATEMENTS (continued)December 31, 2008 (Unaudited)
Micro-Cap Limited Large-Cap GrowthYear
EndedJune 30, 2008
YearEnded
June 30, 2007
YearEnded
June 30, 2008
YearEnded
June 30, 2007
Distributions paid from:Ordinary income $ 99,874 $ 1,475 $ 501,206 $ 357,354Long Term Capital Gain - 14,953,926 - -
Total $ 99,874 $14,955,401 $ 501,206 $ 357,354
Large-Cap Value Blue Chip 35 IndexYear
EndedJune 30, 2008
YearEnded
June 30, 2007
YearEnded
June 30, 2008
YearEnded
June 30, 2007
Distributions paid from:Ordinary income $ 935,266 $ 819,616 $2,216,904 $1,021,236Long Term Capital Gain 2,259,546 - - -
Total $3,194,812 $ 819,616 $2,216,904 $1,021,236
BalancedYear
EndedJune 30, 2008
YearEnded
June 30, 2007
Distributions paid from:Ordinary income $1,132,035 $ 2,182,831Long Term Capital Gain - 719,840
Total $1,132,035 $ 2,902,671
At June 30, 2008, the Funds had available for tax purposes, capital loss carryovers as follows:
Ultra-Small Company Micro-Cap Limited Small-Cap Growth Small-Cap Value
Expiring 6/30/2013 - - - $ 948,5516/30/2015 - $1,910,229 $9,909,411 -6/30/2016 $3,822,016 1,720,318 - 1,491,117
Large-Cap Growth Blue Chip 35 Index Balanced
Expiring 6/30/2009 - $ 100,306 -6/30/2010 - 429,064 -6/30/2011 - 337,509 -6/30/2012 - 327,296 -6/30/2013 $2,323,531 282,192 -6/30/2014 2,412,639 402,963 -6/30/2015 - 418,882 $ 21,7416/30/2016 1,302,044 31,461 -
www.bridgeway.com 147
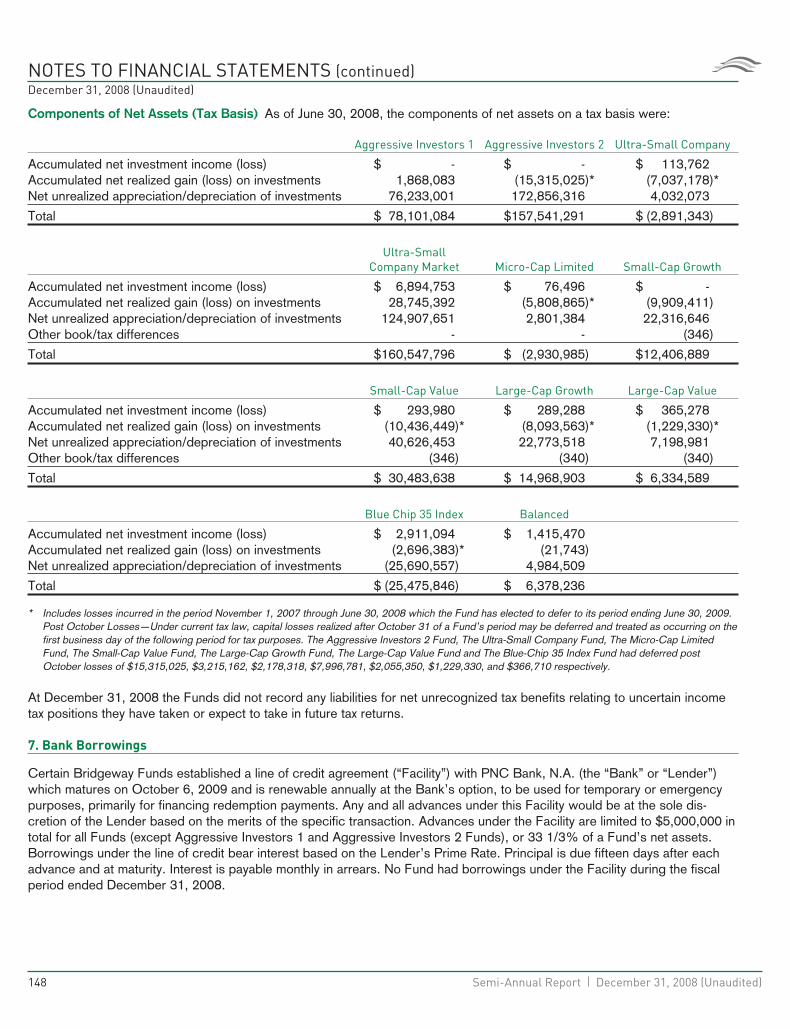
NOTES TO FINANCIAL STATEMENTS (continued)December 31, 2008 (Unaudited)
Components of Net Assets (Tax Basis) As of June 30, 2008, the components of net assets on a tax basis were:
Aggressive Investors 1 Aggressive Investors 2 Ultra-Small Company
Accumulated net investment income (loss) $ - $ - $ 113,762Accumulated net realized gain (loss) on investments 1,868,083 (15,315,025)* (7,037,178)*Net unrealized appreciation/depreciation of investments 76,233,001 172,856,316 4,032,073
Total $ 78,101,084 $157,541,291 $ (2,891,343)
Ultra-SmallCompany Market Micro-Cap Limited Small-Cap Growth
Accumulated net investment income (loss) $ 6,894,753 $ 76,496 $ -Accumulated net realized gain (loss) on investments 28,745,392 (5,808,865)* (9,909,411)Net unrealized appreciation/depreciation of investments 124,907,651 2,801,384 22,316,646Other book/tax differences - - (346)
Total $160,547,796 $ (2,930,985) $12,406,889
Small-Cap Value Large-Cap Growth Large-Cap Value
Accumulated net investment income (loss) $ 293,980 $ 289,288 $ 365,278Accumulated net realized gain (loss) on investments (10,436,449)* (8,093,563)* (1,229,330)*Net unrealized appreciation/depreciation of investments 40,626,453 22,773,518 7,198,981Other book/tax differences (346) (340) (340)
Total $ 30,483,638 $ 14,968,903 $ 6,334,589
Blue Chip 35 Index Balanced
Accumulated net investment income (loss) $ 2,911,094 $ 1,415,470Accumulated net realized gain (loss) on investments (2,696,383)* (21,743)Net unrealized appreciation/depreciation of investments (25,690,557) 4,984,509
Total $ (25,475,846) $ 6,378,236
* Includes losses incurred in the period November 1, 2007 through June 30, 2008 which the Fund has elected to defer to its period ending June 30, 2009.Post October Losses—Under current tax law, capital losses realized after October 31 of a Fund’s period may be deferred and treated as occurring on thefirst business day of the following period for tax purposes. The Aggressive Investors 2 Fund, The Ultra-Small Company Fund, The Micro-Cap LimitedFund, The Small-Cap Value Fund, The Large-Cap Growth Fund, The Large-Cap Value Fund and The Blue-Chip 35 Index Fund had deferred postOctober losses of $15,315,025, $3,215,162, $2,178,318, $7,996,781, $2,055,350, $1,229,330, and $366,710 respectively.
At December 31, 2008 the Funds did not record any liabilities for net unrecognized tax benefits relating to uncertain incometax positions they have taken or expect to take in future tax returns.
7. Bank Borrowings
Certain Bridgeway Funds established a line of credit agreement (“Facility”) with PNC Bank, N.A. (the “Bank” or “Lender”)which matures on October 6, 2009 and is renewable annually at the Bank’s option, to be used for temporary or emergencypurposes, primarily for financing redemption payments. Any and all advances under this Facility would be at the sole dis-cretion of the Lender based on the merits of the specific transaction. Advances under the Facility are limited to $5,000,000 intotal for all Funds (except Aggressive Investors 1 and Aggressive Investors 2 Funds), or 33 1/3% of a Fund’s net assets.Borrowings under the line of credit bear interest based on the Lender’s Prime Rate. Principal is due fifteen days after eachadvance and at maturity. Interest is payable monthly in arrears. No Fund had borrowings under the Facility during the fiscalperiod ended December 31, 2008.
148 Semi-Annual Report | December 31, 2008 (Unaudited)
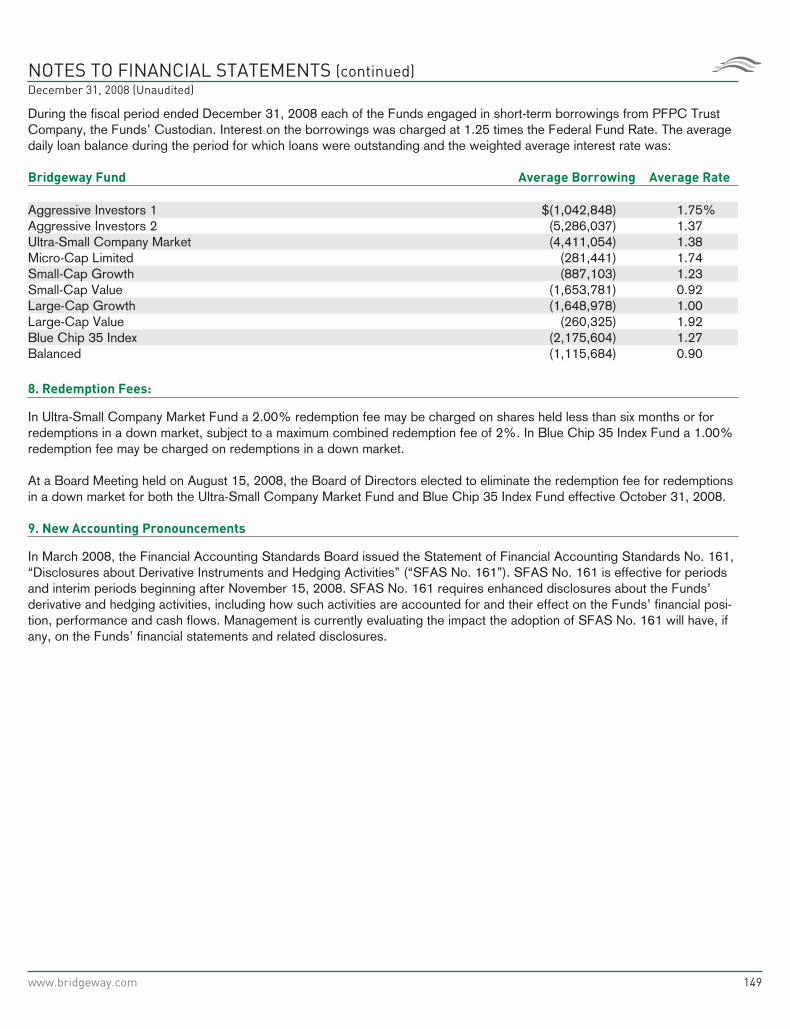
NOTES TO FINANCIAL STATEMENTS (continued)December 31, 2008 (Unaudited)
During the fiscal period ended December 31, 2008 each of the Funds engaged in short-term borrowings from PFPC TrustCompany, the Funds’ Custodian. Interest on the borrowings was charged at 1.25 times the Federal Fund Rate. The averagedaily loan balance during the period for which loans were outstanding and the weighted average interest rate was:
Bridgeway Fund Average Borrowing Average Rate
Aggressive Investors 1 $(1,042,848) 1.75%Aggressive Investors 2 (5,286,037) 1.37Ultra-Small Company Market (4,411,054) 1.38Micro-Cap Limited (281,441) 1.74Small-Cap Growth (887,103) 1.23Small-Cap Value (1,653,781) 0.92Large-Cap Growth (1,648,978) 1.00Large-Cap Value (260,325) 1.92Blue Chip 35 Index (2,175,604) 1.27Balanced (1,115,684) 0.90
8. Redemption Fees:
In Ultra-Small Company Market Fund a 2.00% redemption fee may be charged on shares held less than six months or forredemptions in a down market, subject to a maximum combined redemption fee of 2%. In Blue Chip 35 Index Fund a 1.00%redemption fee may be charged on redemptions in a down market.
At a Board Meeting held on August 15, 2008, the Board of Directors elected to eliminate the redemption fee for redemptionsin a down market for both the Ultra-Small Company Market Fund and Blue Chip 35 Index Fund effective October 31, 2008.
9. New Accounting Pronouncements
In March 2008, the Financial Accounting Standards Board issued the Statement of Financial Accounting Standards No. 161,“Disclosures about Derivative Instruments and Hedging Activities” (“SFAS No. 161”). SFAS No. 161 is effective for periodsand interim periods beginning after November 15, 2008. SFAS No. 161 requires enhanced disclosures about the Funds’derivative and hedging activities, including how such activities are accounted for and their effect on the Funds’ financial posi-tion, performance and cash flows. Management is currently evaluating the impact the adoption of SFAS No. 161 will have, ifany, on the Funds’ financial statements and related disclosures.
www.bridgeway.com 149

OTHER INFORMATIONDecember 31, 2008 (Unaudited)
1. Proxy Voting
Fund policies and procedures used in determining how to vote proxies relating to Funds’ securities and a summary of proxiesvoted by the Funds for the period ended June 30, 2008 are available without a charge, upon request, by contacting BridgewayFunds at 1-800-661-3550 and on the Securities and Exchange Commission’s (“SEC”) website at http://www.sec.gov.
2. Fund Holdings
The complete schedules of the Funds’ holdings for the second and fourth quarters of each fiscal year are contained in theFunds’ Semi-Annual and Annual shareholder reports, respectively.
The Bridgeway Funds file complete schedules of the Funds’ holdings with the SEC for the first and third quarters of eachfiscal year on Form N-Q within 60 days after the end of the period. Copies of the Funds’ Form N-Q are available withoutcharge, upon request, by contacting Bridgeway Funds at 1-800-661-3550 and on the SEC’s website at http://www.sec.gov.You may also review and copy Form N-Q at the SEC’s Public Reference Room in Washington, D.C. For more informationabout the operation of the Public Reference Room, please call 1-800-SEC-0330.
150 Semi-Annual Report | December 31, 2008 (Unaudited)
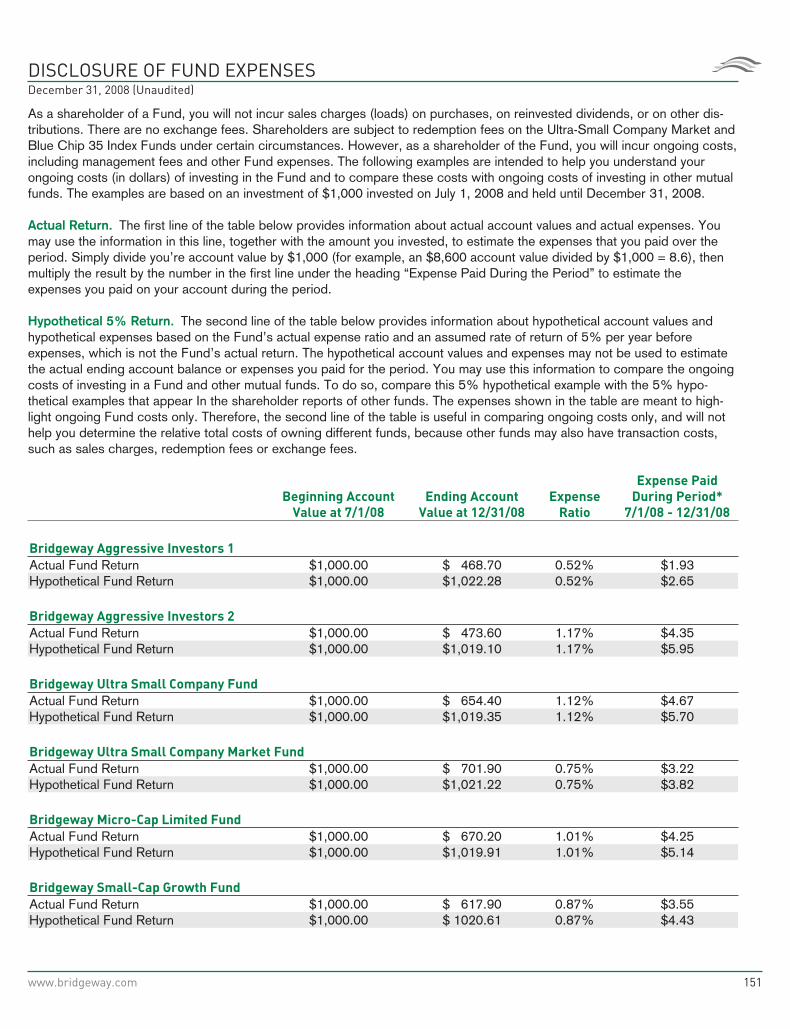
DISCLOSURE OF FUND EXPENSESDecember 31, 2008 (Unaudited)
As a shareholder of a Fund, you will not incur sales charges (loads) on purchases, on reinvested dividends, or on other dis-tributions. There are no exchange fees. Shareholders are subject to redemption fees on the Ultra-Small Company Market andBlue Chip 35 Index Funds under certain circumstances. However, as a shareholder of the Fund, you will incur ongoing costs,including management fees and other Fund expenses. The following examples are intended to help you understand yourongoing costs (in dollars) of investing in the Fund and to compare these costs with ongoing costs of investing in other mutualfunds. The examples are based on an investment of $1,000 invested on July 1, 2008 and held until December 31, 2008.
Actual Return. The first line of the table below provides information about actual account values and actual expenses. Youmay use the information in this line, together with the amount you invested, to estimate the expenses that you paid over theperiod. Simply divide you’re account value by $1,000 (for example, an $8,600 account value divided by $1,000 = 8.6), thenmultiply the result by the number in the first line under the heading “Expense Paid During the Period” to estimate theexpenses you paid on your account during the period.
Hypothetical 5% Return. The second line of the table below provides information about hypothetical account values andhypothetical expenses based on the Fund’s actual expense ratio and an assumed rate of return of 5% per year beforeexpenses, which is not the Fund’s actual return. The hypothetical account values and expenses may not be used to estimatethe actual ending account balance or expenses you paid for the period. You may use this information to compare the ongoingcosts of investing in a Fund and other mutual funds. To do so, compare this 5% hypothetical example with the 5% hypo-thetical examples that appear In the shareholder reports of other funds. The expenses shown in the table are meant to high-light ongoing Fund costs only. Therefore, the second line of the table is useful in comparing ongoing costs only, and will nothelp you determine the relative total costs of owning different funds, because other funds may also have transaction costs,such as sales charges, redemption fees or exchange fees.
Beginning Account
Value at 7/1/08
Ending Account
Value at 12/31/08
Expense
Ratio
Expense Paid
During Period*
7/1/08 - 12/31/08
Bridgeway Aggressive Investors 1
Actual Fund Return $1,000.00 $ 468.70 0.52% $1.93Hypothetical Fund Return $1,000.00 $1,022.28 0.52% $2.65
Bridgeway Aggressive Investors 2
Actual Fund Return $1,000.00 $ 473.60 1.17% $4.35Hypothetical Fund Return $1,000.00 $1,019.10 1.17% $5.95
Bridgeway Ultra Small Company Fund
Actual Fund Return $1,000.00 $ 654.40 1.12% $4.67Hypothetical Fund Return $1,000.00 $1,019.35 1.12% $5.70
Bridgeway Ultra Small Company Market Fund
Actual Fund Return $1,000.00 $ 701.90 0.75% $3.22Hypothetical Fund Return $1,000.00 $1,021.22 0.75% $3.82
Bridgeway Micro-Cap Limited Fund
Actual Fund Return $1,000.00 $ 670.20 1.01% $4.25Hypothetical Fund Return $1,000.00 $1,019.91 1.01% $5.14
Bridgeway Small-Cap Growth Fund
Actual Fund Return $1,000.00 $ 617.90 0.87% $3.55Hypothetical Fund Return $1,000.00 $ 1020.61 0.87% $4.43
www.bridgeway.com 151
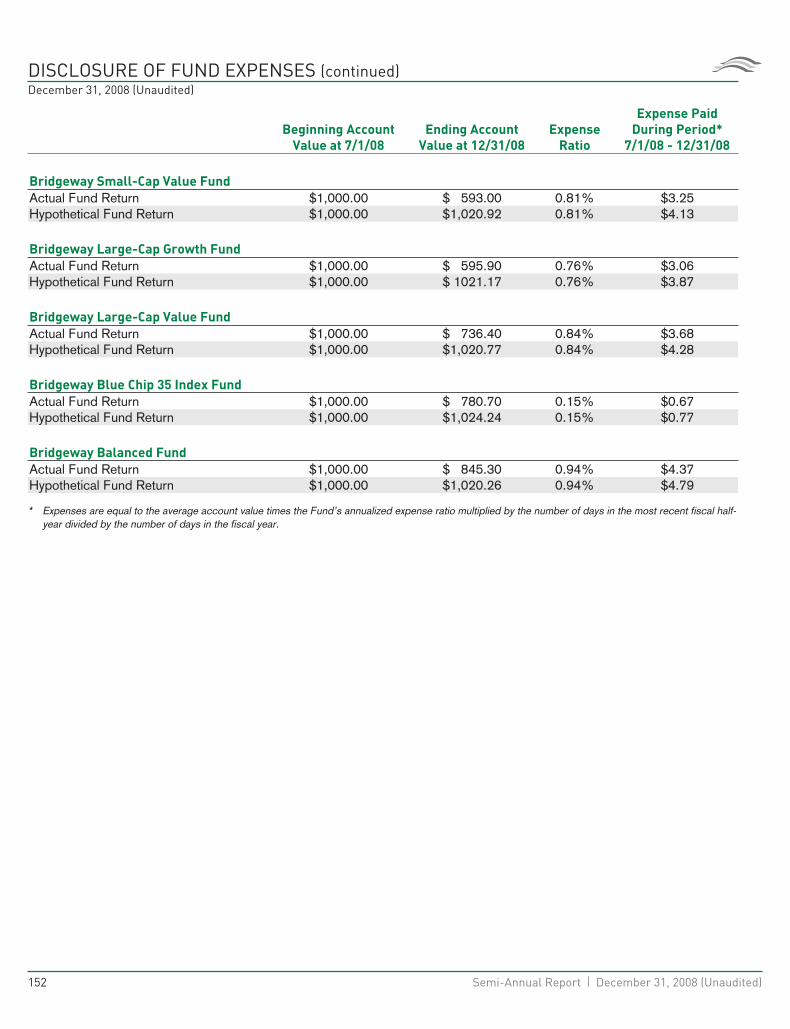
DISCLOSURE OF FUND EXPENSES (continued)December 31, 2008 (Unaudited)
Beginning Account
Value at 7/1/08
Ending Account
Value at 12/31/08
Expense
Ratio
Expense Paid
During Period*
7/1/08 - 12/31/08
Bridgeway Small-Cap Value Fund
Actual Fund Return $1,000.00 $ 593.00 0.81% $3.25Hypothetical Fund Return $1,000.00 $1,020.92 0.81% $4.13
Bridgeway Large-Cap Growth Fund
Actual Fund Return $1,000.00 $ 595.90 0.76% $3.06Hypothetical Fund Return $1,000.00 $ 1021.17 0.76% $3.87
Bridgeway Large-Cap Value Fund
Actual Fund Return $1,000.00 $ 736.40 0.84% $3.68Hypothetical Fund Return $1,000.00 $1,020.77 0.84% $4.28
Bridgeway Blue Chip 35 Index Fund
Actual Fund Return $1,000.00 $ 780.70 0.15% $0.67Hypothetical Fund Return $1,000.00 $1,024.24 0.15% $0.77
Bridgeway Balanced Fund
Actual Fund Return $1,000.00 $ 845.30 0.94% $4.37Hypothetical Fund Return $1,000.00 $1,020.26 0.94% $4.79
* Expenses are equal to the average account value times the Fund’s annualized expense ratio multiplied by the number of days in the most recent fiscal half-year divided by the number of days in the fiscal year.
152 Semi-Annual Report | December 31, 2008 (Unaudited)

THIS PAGE INTENTIONALLY LEFT BLANK

THIS PAGE INTENTIONALLY LEFT BLANK

BRIDGEWAY FUNDS, INC.
Citi Fund Services, LLC
PO Box 182218
Columbus, OH 43218-2218
(713) 661-3500 (800)-661-3550
CUSTODIAN
PNC Global Investment Services
8800 Tinicum Blvd., 4th Floor
Philadelphia, PA 19153
DISTRIBUTOR
Foreside Fund Services, LLC
Three Canal Plaza, Suite 100
Portland, ME 04101
You can review and copy information about our Funds (including the SAI) at the SEC’s Public ReferenceRoom in Washington, D.C. To find out more about this public service, call the SEC at 800-SEC-0330.Reports and other information about the Funds is also available on the SEC’s website at www.sec.gov. Youcan receive copies of this information, for a fee, by writing the Public Reference Section, Securities andExchange Commission, Washington, D.C. 20549-0102 or by sending an electronic request to the followingemail address: [email protected]
185-SR-1208