Semi-annual report 2018
28
Semi-annual report 2018 Motley Fool 100 Index ETF A Series of The RBB Fund Inc. 2/28/18 (UNAUDITED) Important…Don’t Miss Out! Stay on top of your investment with up-to-date insights from our portfolio managers. Sign up for our free email newsletter today! Details are on the back inside cover.
Transcript of Semi-annual report 2018
Semi-annual report 2018
Motley Fool 100 Index ETFA Series of The RBB Fund Inc.
2/28/18(UNAUDITED)
Important…Don’t Miss Out!Stay on top of your investment with up-to-date insights from our portfolio managers. Sign up
for our free email newsletter today! Details are on the back inside cover.
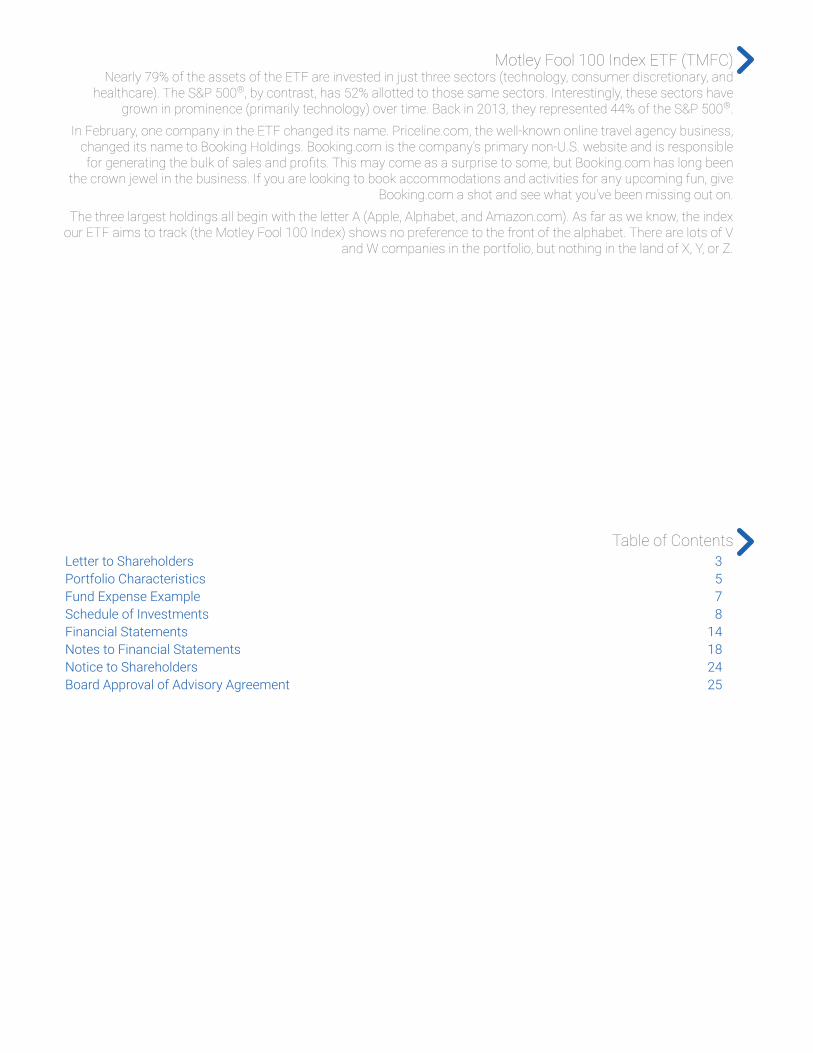
Motley Fool 100 Index ETF (TMFC) Nearly 79% of the assets of the ETF are invested in just three sectors (technology, consumer discretionary, and
healthcare). The S&P 500®, by contrast, has 52% allotted to those same sectors. Interestingly, these sectors have grown in prominence (primarily technology) over time. Back in 2013, they represented 44% of the S&P 500®.
In February, one company in the ETF changed its name. Priceline.com, the well-known online travel agency business, changed its name to Booking Holdings. Booking.com is the company’s primary non-U.S. website and is responsible for generating the bulk of sales and profi ts. This may come as a surprise to some, but Booking.com has long been
the crown jewel in the business. If you are looking to book accommodations and activities for any upcoming fun, give Booking.com a shot and see what you’ve been missing out on.
The three largest holdings all begin with the letter A (Apple, Alphabet, and Amazon.com). As far as we know, the index our ETF aims to track (the Motley Fool 100 Index) shows no preference to the front of the alphabet. There are lots of V
and W companies in the portfolio, but nothing in the land of X, Y, or Z.
Table of ContentsLetter to Shareholders 3Portfolio Characteristics 5 Fund Expense Example 7Schedule of Investments 8Financial Statements 14Notes to Financial Statements 18Notice to Shareholders 24Board Approval of Advisory Agreement 25

3
MOTLEY FOOL 100 INDEX ETF LETTER TO SHAREHOLDERS
FEBRUARY 28, 2018 (UNAUDITED)Dear Fellow Fool 100 ETF Shareholders,
Welcome, and from everyone at Motley Fool Asset Management, we sincerely thank you for being in the very fi rst wave of investors in our very fi rst exchange-traded fund (ETF). We are delighted and humbled by the excitement and support from you, our investors, and from our many partners for the Motley Fool 100 ETF.
Th e launch of a new product is always exhilarating, intense, and more than a little nerve-wracking. And with the Motley Fool 100 ETF, we were not only introducing a new product, we were stepping out of our known and comfortable world of mutual funds into the unknown (to us): exchange-traded funds. Th at meant learning a whole new set of rules, creating new partnerships, building a new website, and fi ling lots of very long documents with the Securities and Exchange Commission¹. I defi nitely had a few sleepless nights leading up to our opening day.
All of that was well worth it, though, because it allowed us to deliver exactly the product so many of you have been asking for – what we believe to be an easy, less expensive way to invest in Th e Motley Fool’s top investment ideas.
ETFs seem ubiquitous now, but I was surprised how many times over the past few months I was asked to explain how they work and their history. Th e fi rst exchange-traded fund was introduced in
1993, and now, 25 years later, ETFs are a more than $3 trillion market. It’s not diffi cult to understand why these investment vehicles have taken off . Th ey’re generally less expensive, tax-effi cient², off er low or no minimum investment requirement, and if you have a brokerage account, you can buy any ETF on the market for the same trading cost as buying any stock. Easy, cheap, tax-effi cient³. And with the right investment strategy, a very Foolish solution.
We believe the Motley Fool 100 Index is just that investment strategy – the 100 largest stocks in the Motley Fool universe, weighted by market cap and vetted by the Fool’s analysts. It aims to be a simple, less expensive way to build the core of any portfolio.
We’re delighted so many of you agreed and have been early adopters in investing with us. (By the way, I was right there with you, investing on the fi rst day.) More than that, we hope you will continue to embrace the Foolish long-term, buy-and-hold investing philosophy. We’re only a month into this adventure, and we want to have you with us for many years to come.
Foolish best,
Denise Coursey
PresidentDenise H. Coursey
¹ Th e SEC does not endorse, indemnify, approve, nor disapprove of any security.² Any tax or legal information provided is merely a summary of our understanding and interpretation of some of the current income tax
regulations and it is not exhaustive. Investors must consult their tax advisor or legal counsel for advice and information concerning their particular situation. Neither the Fund nor any of its representatives may give legal or tax advice.
³ Mutual funds, ETFs, hedge funds, equities, bonds, and other asset classes have diff erent risk profi les, which should be considered when investing. All investments contain risk and may lose value.
4
Must be preceded or accompanied by a prospectus.
Shares of any ETF are bought and sold at market price, not net asset value (“NAV”), and are not individually redeemed from the Fund. Brokerage commissions will reduce returns.
Th e Motley Fool 100 Index is a new market-cap weighted index that measures the performance of Th e Motley Fool’s 100 largest active buy recommendations or highest-rated stocks in Fool IQ, the company’s analyst opinion database. Every company included in the Index is incorporated and listed in the U.S. You cannot invest directly in an index.
Investing involves risk. Principal loss is possible. Th e Fund is non-diversifi ed, which means its NAV, market price and total returns may fl uctuate or fall more than a diversifi ed fund. Gains or losses on a single stock may have a greater impact on the Fund. Th e Fund is not actively managed and the Adviser does not attempt to take defensive positions in any market conditions, including adverse markets. Th e Index is comprised of the 100 largest U.S. companies that are either active recommendations of Th e Motley Fool LLC’s newsletter or are among the 150 highest rated U.S. companies in Th e Motley Fool LLC’s analyst opinion database, and are weighted based on their market value relative to the total market value of other companies in the Index. Changes in Th e Motley Fool LLC’s recommendations or rankings methodologies may have an adverse eff ect on the Fund. Factors that aff ect a security’s value can change over time, and these changes may not be refl ected in the Index methodology. Th e Fund is recently organized, with no operating history. As a result, prospective investors have a limited track record on which to base their investment decision. In addition, there can be no assurance that the Fund will grow to, or maintain, an economically viable size.
Th e Motley Fool 100 ETF is distributed by Quasar Distributors, LLC.
5
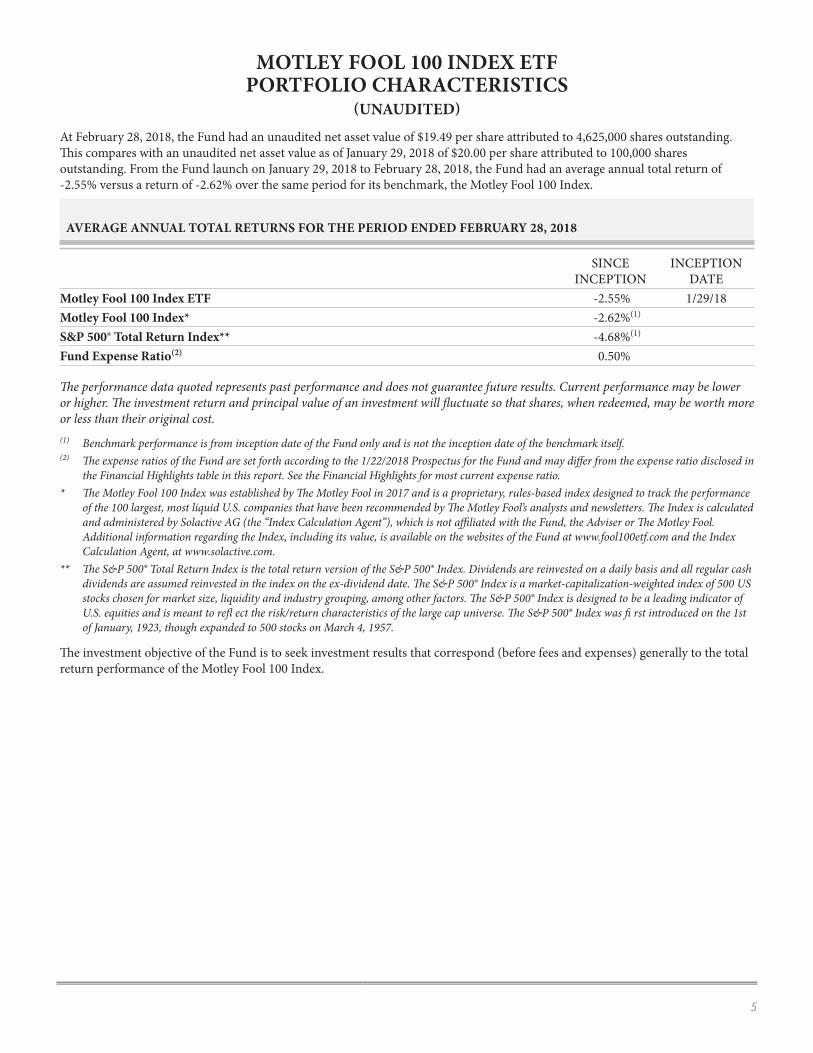
MOTLEY FOOL 100 INDEX ETF PORTFOLIO CHARACTERISTICS
(UNAUDITED)At February 28, 2018, the Fund had an unaudited net asset value of $19.49 per share attributed to 4,625,000 shares outstanding. Th is compares with an unaudited net asset value as of January 29, 2018 of $20.00 per share attributed to 100,000 shares outstanding. From the Fund launch on January 29, 2018 to February 28, 2018, the Fund had an average annual total return of -2.55% versus a return of -2.62% over the same period for its benchmark, the Motley Fool 100 Index.
AVERAGE ANNUAL TOTAL RETURNS FOR THE PERIOD ENDED FEBRUARY 28, 2018
SINCE INCEPTION
INCEPTION DATE
Motley Fool 100 Index ETF -2.55% 1/29/18Motley Fool 100 Index* -2.62%(1)
S&P 500® Total Return Index** -4.68%(1)
Fund Expense Ratio(2) 0.50%
Th e performance data quoted represents past performance and does not guarantee future results. Current performance may be lower or higher. Th e investment return and principal value of an investment will fl uctuate so that shares, when redeemed, may be worth more or less than their original cost.(1) Benchmark performance is from inception date of the Fund only and is not the inception date of the benchmark itself.(2) Th e expense ratios of the Fund are set forth according to the 1/22/2018 Prospectus for the Fund and may diff er from the expense ratio disclosed in
the Financial Highlights table in this report. See the Financial Highlights for most current expense ratio.* Th e Motley Fool 100 Index was established by Th e Motley Fool in 2017 and is a proprietary, rules-based index designed to track the performance
of the 100 largest, most liquid U.S. companies that have been recommended by Th e Motley Fool’s analysts and newsletters. Th e Index is calculated and administered by Solactive AG (the “Index Calculation Agent”), which is not affi liated with the Fund, the Adviser or Th e Motley Fool. Additional information regarding the Index, including its value, is available on the websites of the Fund at www.fool100etf.com and the Index Calculation Agent, at www.solactive.com.
** Th e S&P 500® Total Return Index is the total return version of the S&P 500® Index. Dividends are reinvested on a daily basis and all regular cash dividends are assumed reinvested in the index on the ex-dividend date. Th e S&P 500® Index is a market-capitalization-weighted index of 500 US stocks chosen for market size, liquidity and industry grouping, among other factors. Th e S&P 500® Index is designed to be a leading indicator of U.S. equities and is meant to refl ect the risk/return characteristics of the large cap universe. Th e S&P 500® Index was fi rst introduced on the 1st of January, 1923, though expanded to 500 stocks on March 4, 1957.
Th e investment objective of the Fund is to seek investment results that correspond (before fees and expenses) generally to the total return performance of the Motley Fool 100 Index.
6
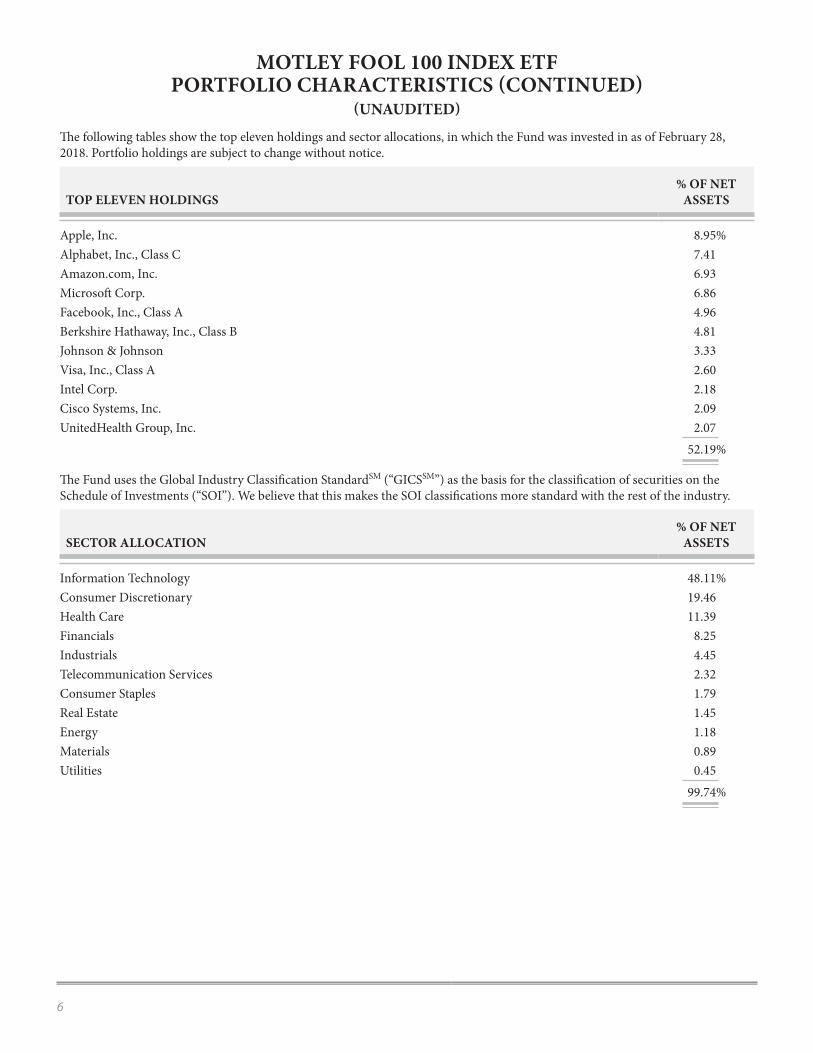
Th e following tables show the top eleven holdings and sector allocations, in which the Fund was invested in as of February 28, 2018. Portfolio holdings are subject to change without notice.
TOP ELEVEN HOLDINGS % OF NET
ASSETS
Apple, Inc. 8.95%Alphabet, Inc., Class C 7.41Amazon.com, Inc. 6.93Microsoft Corp. 6.86Facebook, Inc., Class A 4.96Berkshire Hathaway, Inc., Class B 4.81Johnson & Johnson 3.33Visa, Inc., Class A 2.60Intel Corp. 2.18Cisco Systems, Inc. 2.09UnitedHealth Group, Inc. 2.07
52.19%
Th e Fund uses the Global Industry Classifi cation StandardSM (“GICSSM”) as the basis for the classifi cation of securities on the Schedule of Investments (“SOI”). We believe that this makes the SOI classifi cations more standard with the rest of the industry.
SECTOR ALLOCATION% OF NET
ASSETS
Information Technology 48.11%Consumer Discretionary 19.46Health Care 11.39Financials 8.25Industrials 4.45Telecommunication Services 2.32Consumer Staples 1.79Real Estate 1.45Energy 1.18Materials 0.89Utilities 0.45
99.74%
MOTLEY FOOL 100 INDEX ETF PORTFOLIO CHARACTERISTICS (CONTINUED)
(UNAUDITED)
7
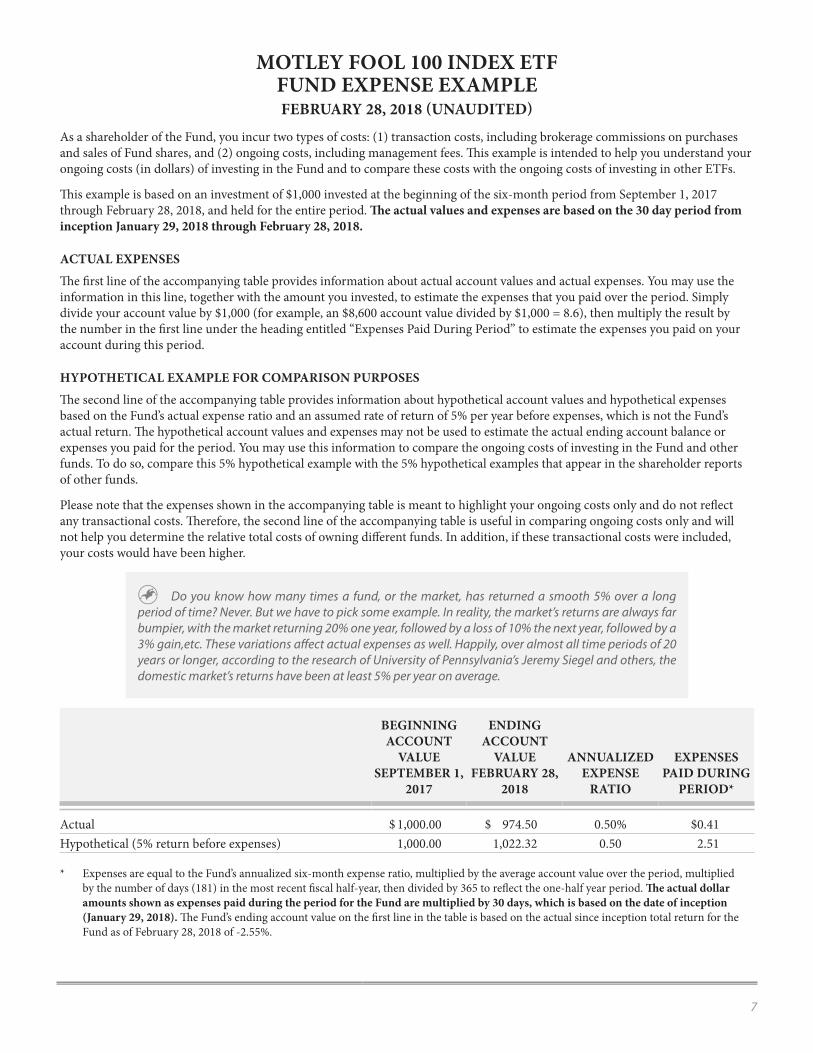
As a shareholder of the Fund, you incur two types of costs: (1) transaction costs, including brokerage commissions on purchases and sales of Fund shares, and (2) ongoing costs, including management fees. Th is example is intended to help you understand your ongoing costs (in dollars) of investing in the Fund and to compare these costs with the ongoing costs of investing in other ETFs.
Th is example is based on an investment of $1,000 invested at the beginning of the six-month period from September 1, 2017 through February 28, 2018, and held for the entire period. Th e actual values and expenses are based on the 30 day period from inception January 29, 2018 through February 28, 2018.
ACTUAL EXPENSESTh e fi rst line of the accompanying table provides information about actual account values and actual expenses. You may use the information in this line, together with the amount you invested, to estimate the expenses that you paid over the period. Simply divide your account value by $1,000 (for example, an $8,600 account value divided by $1,000 = 8.6), then multiply the result by the number in the fi rst line under the heading entitled “Expenses Paid During Period” to estimate the expenses you paid on your account during this period.
HYPOTHETICAL EXAMPLE FOR COMPARISON PURPOSESTh e second line of the accompanying table provides information about hypothetical account values and hypothetical expenses based on the Fund’s actual expense ratio and an assumed rate of return of 5% per year before expenses, which is not the Fund’s actual return. Th e hypothetical account values and expenses may not be used to estimate the actual ending account balance or expenses you paid for the period. You may use this information to compare the ongoing costs of investing in the Fund and other funds. To do so, compare th is 5% hypothetical example with the 5% hypothetical examples that appear in the shareholder reports of other funds.
Please note that the expenses shown in the accompanying table is meant to highlight your ongoing costs only and do not refl ect any transactional costs. Th erefore, the second line of the accompanying table is useful in comparing ongoing costs only and will not help you determine the relative total costs of owning diff erent funds. In addition, if these transactional costs were included, your costs would have been higher.
Do you know how many times a fund, or the market, has returned a smooth 5% over a long period of time? Never. But we have to pick some example. In reality, the market’s returns are always far bumpier, with the market returning 20% one year, followed by a loss of 10% the next year, followed by a 3% gain,etc. These variations aff ect actual expenses as well. Happily, over almost all time periods of 20 years or longer, according to the research of University of Pennsylvania’s Jeremy Siegel and others, the domestic market’s returns have been at least 5% per year on average.
BEGINNINGACCOUNT
VALUE SEPTEMBER 1,
2017
ENDINGACCOUNT
VALUE FEBRUARY 28,
2018
ANNUALIZED EXPENSE
RATIO
EXPENSESPAID DURING
PERIOD *
Actual $ 1,000.00 $ 974.50 0.50% $0.41Hypothetical (5% return before expenses) 1,000.00 1,022.32 0.50 2.51
* Expenses are equal to the Fund’s annualized six-month expense ratio, multiplied by the average account value over the period, multiplied by the number of days (18 1) in the most recent fi scal half-year, then divided by 365 to refl ect the one-half year period. Th e actual dollar amounts shown as expenses paid during the period for the Fund are multiplied by 30 days, which is based on the date of inception (January 29, 2018). Th e Fund’s ending account value on the fi rst line in the table is based on the actual since inception total return for the Fund as of February 28, 2018 of -2.55%.
MOTLEY FOOL 100 INDEX ETF FUND EXPENSE EXAMPLEFEBRUARY 28, 2018 (UNAUDITED)
8
The accompanying notes are an integral part of these fi nancial statements.
NUMBER OF
SHARESVALUE
(NOTE 2)
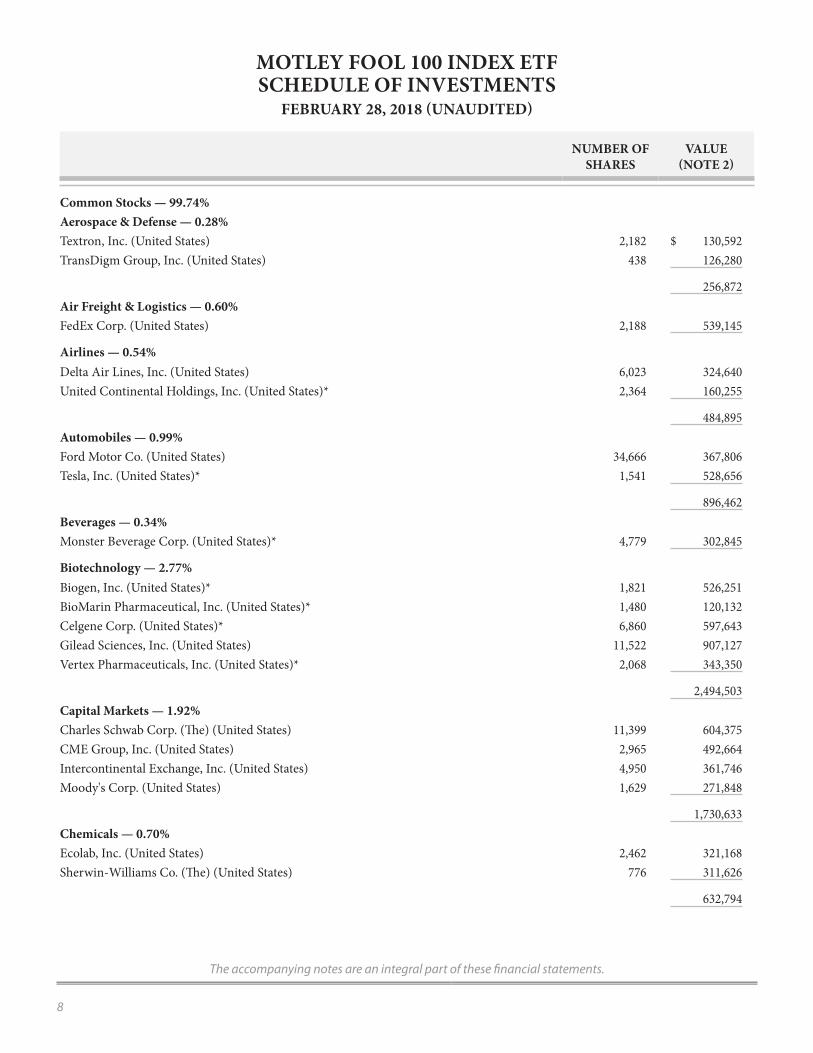
Common Stocks — 99. 74%Aerospace & Defense — 0.28%Textron, Inc. (United States) 2,182 $ 130,592TransDigm Group, Inc. (United States) 438 126,280
256,872Air Freight & Logistics — 0.60%FedEx Corp. (United States) 2,188 539,145
Airlines — 0.54%Delta Air Lines, Inc. (United States) 6,023 324,640United Continental Holdings, Inc. (United States)* 2,364 160,255
484,895Automobiles — 0.99%Ford Motor Co. (United States) 34,666 367,806Tesla, Inc. (United States)* 1,541 528,656
896,462Beverages — 0.34%Monster Beverage Corp. (United States)* 4,779 302,845
Biotechnology — 2.77%Biogen, Inc. (United States)* 1,821 526,251BioMarin Pharmaceutical, Inc. (United States)* 1,480 120,132Celgene Corp. (United States)* 6,860 597,643Gilead Sciences, Inc. (United States) 11,522 907,127Vertex Pharmaceuticals, Inc. (United States)* 2,068 343,350
2,494,503Capital Markets — 1.92%Charles Schwab Corp. (Th e) (United States) 11,399 604,375CME Group, Inc. (United States) 2,965 492,664Intercontinental Exchange, Inc. (United States) 4,950 361,746Moody's Corp. (United States) 1,629 271,848
1,730,633Chemicals — 0.70%Ecolab, Inc. (United States) 2,462 321,168Sherwin-Williams Co. (Th e) (United States) 776 311,626
632,794
MOTLEY FOOL 100 INDEX ETFSCHEDULE OF INVESTMENTS
FEBRUARY 28, 2018 (UNAUDITED)
9
The accompanying notes are an integral part of these fi nancial statements.
NUMBER OF
SHARESVALUE
(NOTE 2)
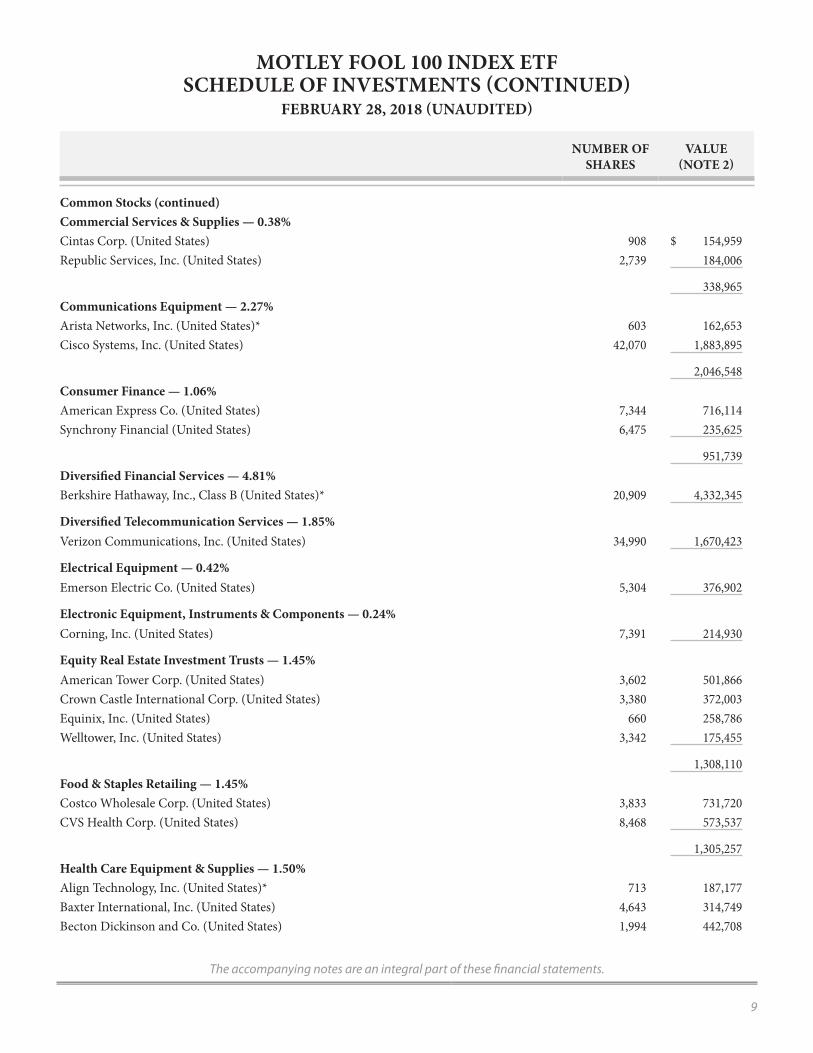
Common Stocks (continued)Commercial Services & Supplies — 0.38%Cintas Corp. (United States) 908 $ 154,959Republic Services, Inc. (United States) 2,739 184,006
338,965Communications Equipment — 2.27%Arista Networks, Inc. (United States)* 603 162,653Cisco Systems, Inc. (United States) 42,070 1,883,895
2,046,548Consumer Finance — 1.06%American Express Co. (United States) 7,344 716,114Synchrony Financial (United States) 6,475 235,625
951,739Diversifi ed Financial Services — 4.81%Berkshire Hathaway, Inc., Class B (United States)* 20,909 4,332,345
Diversifi ed Telecommunication Services — 1.85%Verizon Communications, Inc. (United States) 34,990 1,670,423
Electrical Equipment — 0.42%Emerson Electric Co. (United States) 5,304 376,902
Electronic Equipment, Instruments & Components — 0.24%Corning, Inc. (United States) 7,391 214,930
Equity Real Estate Investment Trusts — 1.45%American Tower Corp. (United States) 3,602 501,866Crown Castle International Corp. (United States) 3,380 372,003Equinix, Inc. (United States) 660 258,786Welltower, Inc. (United States) 3,342 175,455
1,308,110Food & Staples Retailing — 1.45%Costco Wholesale Corp. (United States) 3,833 731,720CVS Health Corp. (United States) 8,468 573,537
1,305,257Health Care Equipment & Supplies — 1.50%Align Technology, Inc. (United States)* 713 187,177Baxter International, Inc. (United States) 4,643 314,749Becton Dickinson and Co. (United States) 1,994 442,708
MOTLEY FOOL 100 INDEX ETFSCHEDULE OF INVESTMENTS (CONTINUED)
FEBRUARY 28, 2018 (UNAUDITED)
10
The accompanying notes are an integral part of these fi nancial statements.
NUMBER OF
SHARESVALUE
(NOTE 2)
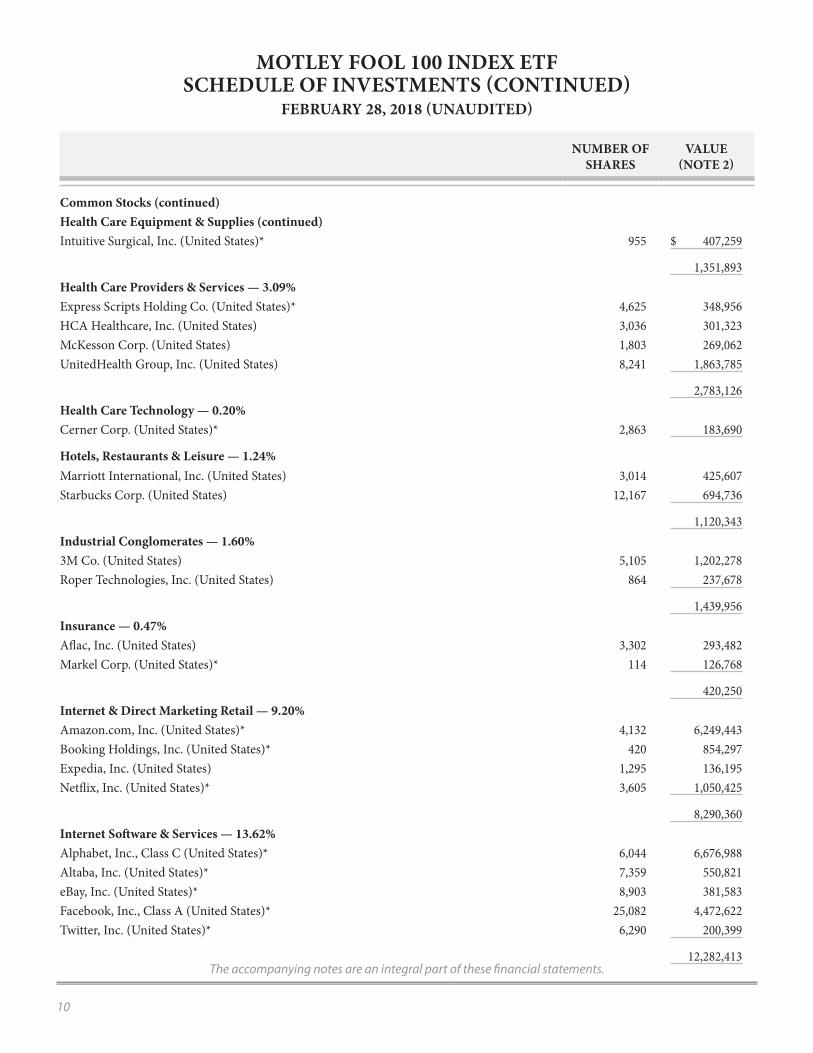
Common Stocks (continued)Health Care Equipment & Supplies (continued)Intuitive Surgical, Inc. (United States)* 955 $ 407,259
1,351,893Health Care Providers & Services — 3.09%Express Scripts Holding Co. (United States)* 4,625 348,956HCA Healthcare, Inc. (United States) 3,036 301,323McKesson Corp. (United States) 1,803 269,062UnitedHealth Group, Inc. (United States) 8,241 1,863,785
2,783,126Health Care Technology — 0.20%Cerner Corp. (United States)* 2,863 183,690
Hotels, Restaurants & Leisure — 1.24%Marriott International, Inc. (United States) 3,014 425,607Starbucks Corp. (United States) 12,167 694,736
1,120,343Industrial Conglomerates — 1.60%3M Co. (United States) 5,105 1,202,278Roper Technologies, Inc. (United States) 864 237,678
1,439,956Insurance — 0.47%Afl ac, Inc. (United States) 3,302 293,482Markel Corp. (United States)* 114 126,768
420,250Internet & Direct Marketing Retail — 9.20%Amazon.com, Inc. (United States)* 4,132 6,249,443Booking Holdings, Inc. (United States)* 420 854,297Expedia, Inc. (United States) 1,295 136,195Netfl ix, Inc. (United States)* 3,605 1,050,425
8,290,360Internet Soft ware & Services — 13. 62%Alphabet, Inc., Class C (United States)* 6,044 6,676,988Altaba, Inc. (United States)* 7,359 550,821eBay, Inc. (United States)* 8,903 381,583Facebook, Inc., Class A (United States)* 25,082 4,472,622Twitter, Inc. (United States)* 6,290 200,399
12,282,413
MOTLEY FOOL 100 INDEX ETFSCHEDULE OF INVESTMENTS (CONTINUED)
FEBRUARY 28, 2018 (UNAUDITED)
11
The accompanying notes are an integral part of these fi nancial statements.
NUMBER OF
SHARESVALUE
(NOTE 2)
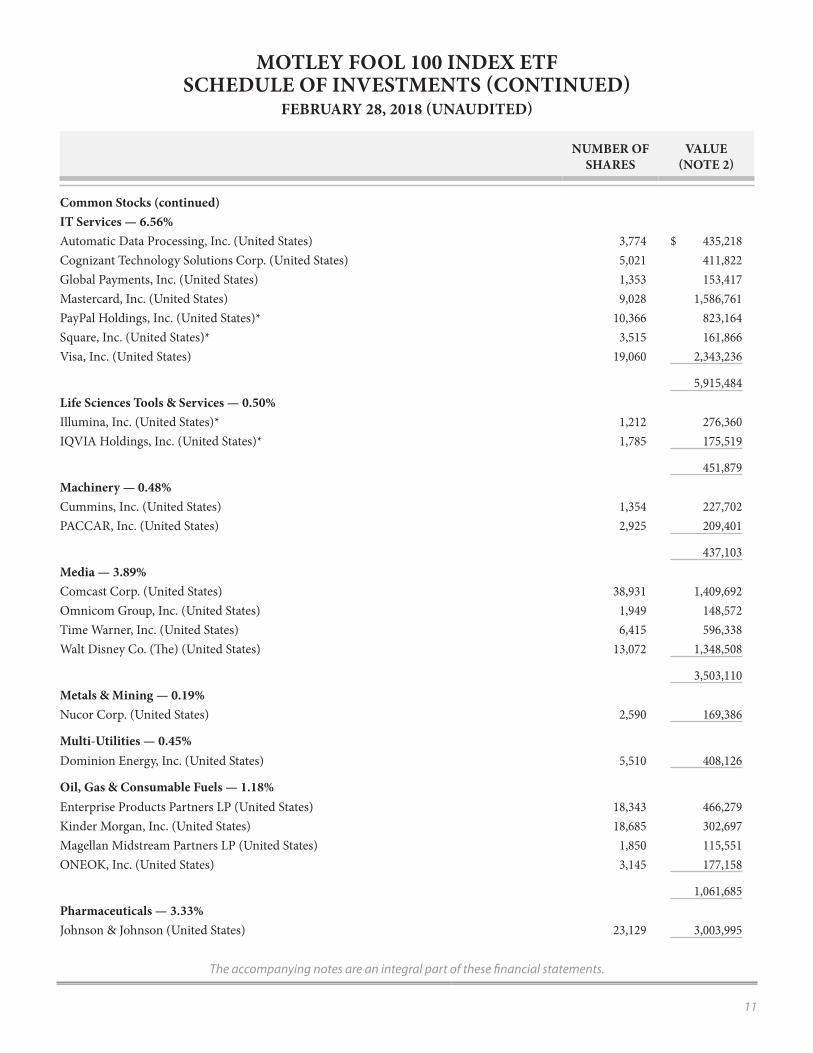
Common Stocks (continued)IT Services — 6.56%Automatic Data Processing, Inc. (United States) 3,774 $ 435,218Cognizant Technology Solutions Corp. (United States) 5,021 411,822Global Payments, Inc. (United States) 1,353 153,417Mastercard, Inc. (United States) 9,028 1,586,761PayPal Holdings, Inc. (United States)* 10,366 823,164Square, Inc. (United States)* 3,515 161,866Visa, Inc. (United States) 19,060 2,343,236
5,915,484Life Sciences Tools & Services — 0.50%Illumina, Inc. (United States)* 1,212 276,360IQVIA Holdings, Inc. (United States)* 1,785 175,519
451,879Machinery — 0.48%Cummins, Inc. (United States) 1,354 227,702PACCAR, Inc. (United States) 2,925 209,401
437,103Media — 3.89%Comcast Corp. (United States) 38,931 1,409,692Omnicom Group, Inc. (United States) 1,949 148,572Time Warner, Inc. (United States) 6,415 596,338Walt Disney Co. (Th e) (United States) 13,072 1,348,508
3,503,110Metals & Mining — 0.19%Nucor Corp. (United States) 2,590 169,386
Multi-Utilities — 0.45%Dominion Energy, Inc. (United States) 5,510 408,126
Oil, Gas & Consumable Fuels — 1.18%Enterprise Products Partners LP (United States) 18,343 466,279Kinder Morgan, Inc. (United States) 18,685 302,697Magellan Midstream Partners LP (United States) 1,850 115,551ONEOK, Inc. (United States) 3,145 177,158
1,061,685Pharmaceuticals — 3.33%Johnson & Johnson (United States) 23,129 3,003,995
MOTLEY FOOL 100 INDEX ETFSCHEDULE OF INVESTMENTS (CONTINUED)
FEBRUARY 28, 2018 (UNAUDITED)
12
The accompanying notes are an integral part of these fi nancial statements.
NUMBER OF
SHARESVALUE
(NOTE 2)
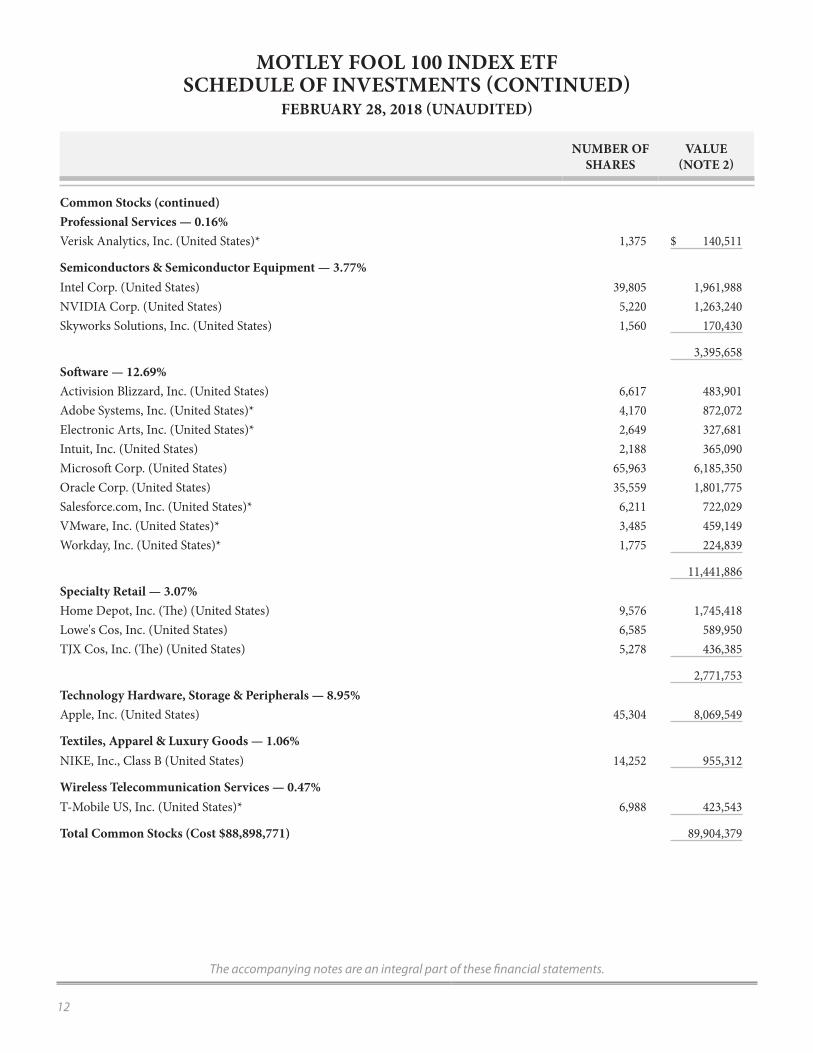
Common Stocks (continued)Professional Services — 0.16%Verisk Analytics, Inc. (United States)* 1,375 $ 140,511
Semiconductors & Semiconductor Equipment — 3.77%Intel Corp. (United States) 39,805 1,961,988NVIDIA Corp. (United States) 5,220 1,263,240Skyworks Solutions, Inc. (United States) 1,560 170,430
3,395,658Soft ware — 12.69%Activision Blizzard, Inc. (United States) 6,617 483,901Adobe Systems, Inc. (United States)* 4,170 872,072Electronic Arts, Inc. (United States)* 2,649 327,681Intuit, Inc. (United States) 2,188 365,090Microsoft Corp. (United States) 65,963 6,185,350Oracle Corp. (United States) 35,559 1,801,775Salesforce.com, Inc. (United States)* 6,211 722,029VMware, Inc. (United States)* 3,485 459,149Workday, Inc. (United States)* 1,775 224,839
11,441,886Specialty Retail — 3.07%Home Depot, Inc. (Th e) (United States) 9,576 1,745,418Lowe's Cos, Inc. (United States) 6,585 589,950TJX Cos, Inc. (Th e) (United States) 5,278 436,385
2,771,753Technology Hardware, Storage & Peripherals — 8.95%Apple, Inc. (United States) 45,304 8,069,549
Textiles, Apparel & Luxury Goods — 1.06%NIKE, Inc., Class B (United States) 14,252 955,312
Wireless Telecommunication Services — 0.47%T-Mobile US, Inc. (United States)* 6,988 423,543
Total Common Stocks (Cost $88, 898,771) 89, 904,379
MOTLEY FOOL 100 INDEX ETFSCHEDULE OF INVESTMENTS (CONTINUED)
FEBRUARY 28, 2018 (UNAUDITED)
13
The accompanying notes are an integral part of these fi nancial statements.
NUMBER OF
SHARESVALUE
(NOTE 2)
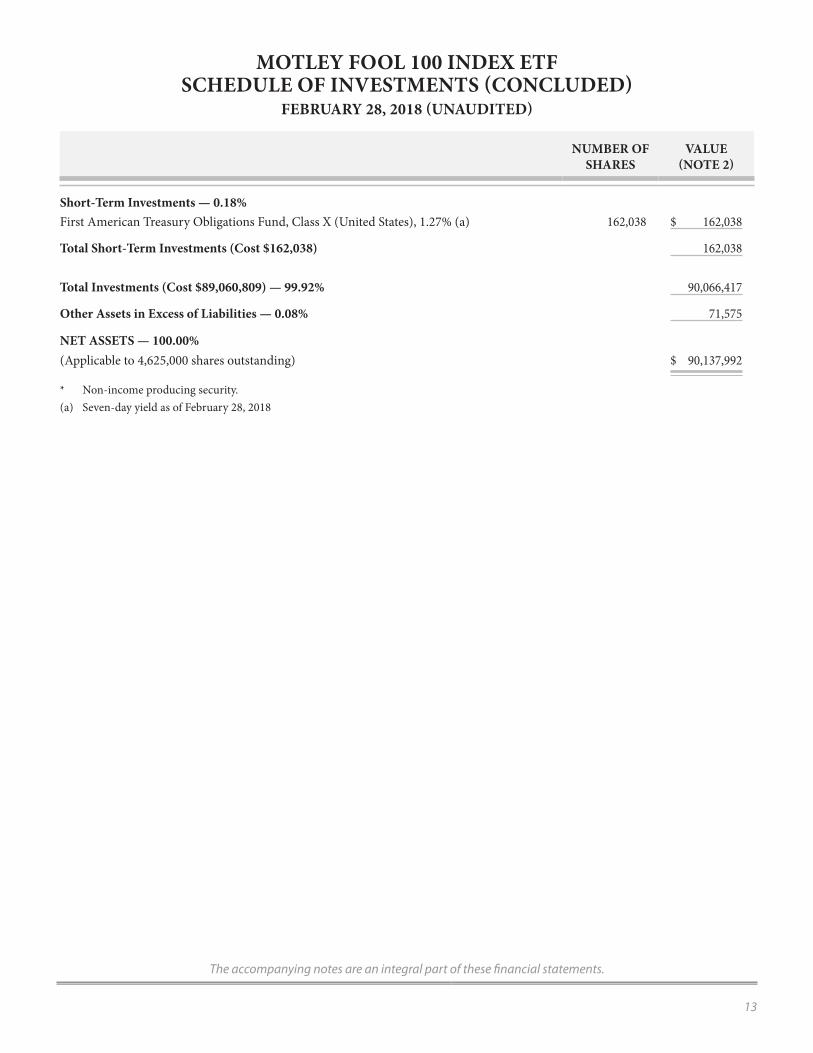
Short-Term Investments — 0.18%First American Treasury Obligations Fund, Class X (United States), 1.27% (a) 162,038 $ 162,038
Total Short-Term Investments (Cost $162,038) 162,038
Total Investments (Cost $89,060,809) — 99.92% 90,066,417
Other Assets in Excess of Liabilities — 0.08% 71,575
NET ASSETS — 100.00%(Applicable to 4,625,000 shares outstanding) $ 90,137,992
* Non-income producing security.(a) Seven-day yield as of February 28, 2018
MOTLEY FOOL 100 INDEX ETFSCHEDULE OF INVESTMENTS (CONCLUDED)
FEBRUARY 28, 2018 (UNAUDITED)
The accompanying notes are an integral part of these fi nancial statements.
14
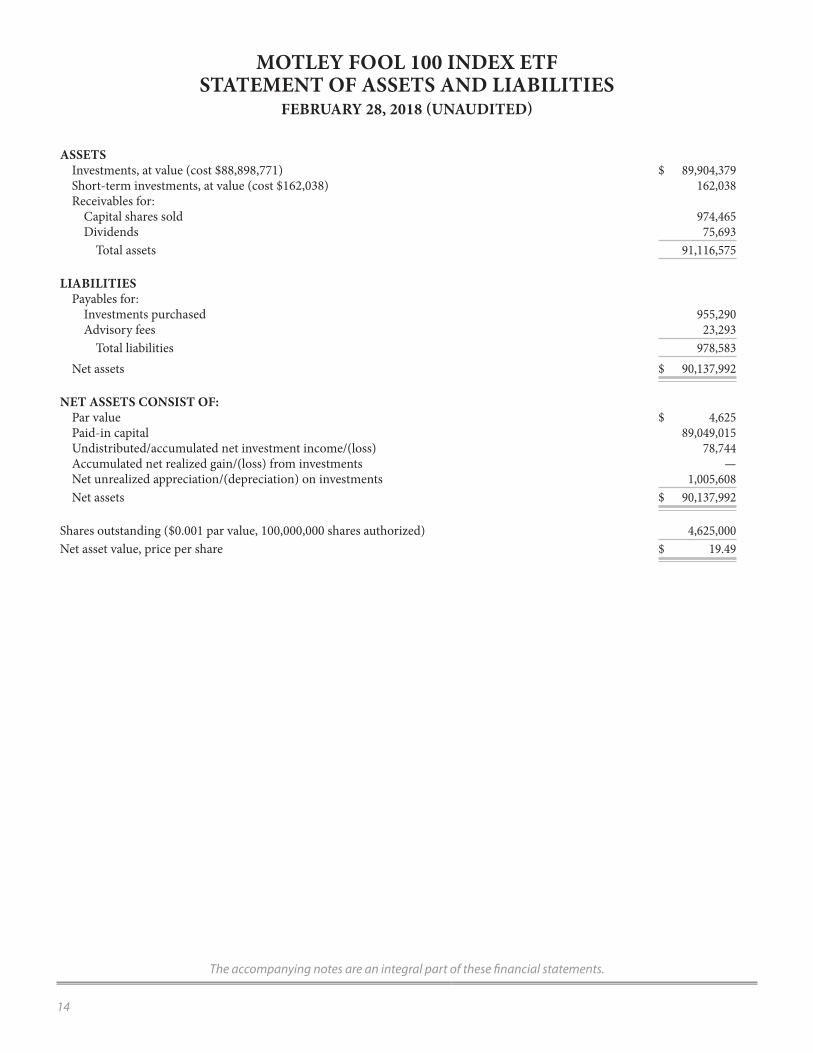
MOTLEY FOOL 100 INDEX ETFSTATEMENT OF ASSETS AND LIABILITIES
FEBRUARY 28, 2018 (UNAUDITED)
ASSETSInvestments, at value (cost $88,898,771) $ 89,904,379Short-term investments, at value (cost $162,038) 162,038Receivables for:
Capital shares sold 974,465Dividends 75,693
Total assets 91,116,575
LIABILITIESPayables for:
Investments purchased 955,290 Advisory fees 23,293
Total liabilities 978,583Net assets $ 90,137,992
NET ASSETS CONSIST OF:Par value $ 4,625Paid-in capital 89,049,015Undistributed/accumulated net investment income/(loss) 78,744Accumulated net realized gain/(loss) from investments —Net unrealized appreciation/(depreciation) on investments 1,005,608Net assets $ 90,137,992
Shares outstanding ($0.001 par value, 100,000,000 shares authorized) 4,625,000Net asset value, price per share $ 19.49
15
The accompanying notes are an integral part of these fi nancial statements.
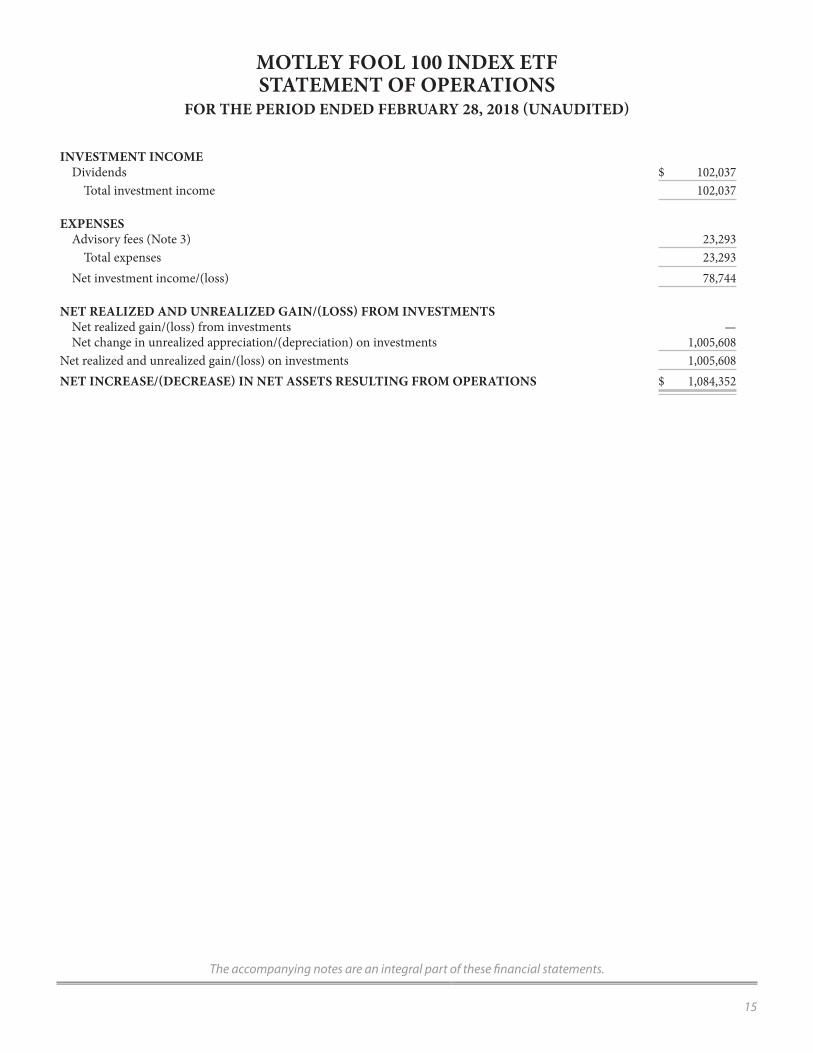
MOTLEY FOOL 100 INDEX ETF STATEMENT OF OPERATIONS
FOR THE PERIOD ENDED FEBRUARY 28, 2018 (UNAUDITED)
INVESTMENT INCOMEDividends $ 102,037
Total investment income 102,037
EXPENSESAdvisory fees (Note 3) 23,293
Total expenses 23,293Net investment income/(loss) 78,744
NET REALIZED AND UNREALIZED GAIN/(LOSS) FROM INVESTMENTSNet realized gain/(loss) from investments —Net change in unrealized appreciation/(depreciation) on investments 1,005,608
Net realized and unrealized gain/(loss) on investments 1,005,608NET INCREASE/(DECREASE) IN NET ASSETS RESULTING FROM OPERATIONS $ 1,084,352
The accompanying notes are an integral part of these fi nancial statements.
16
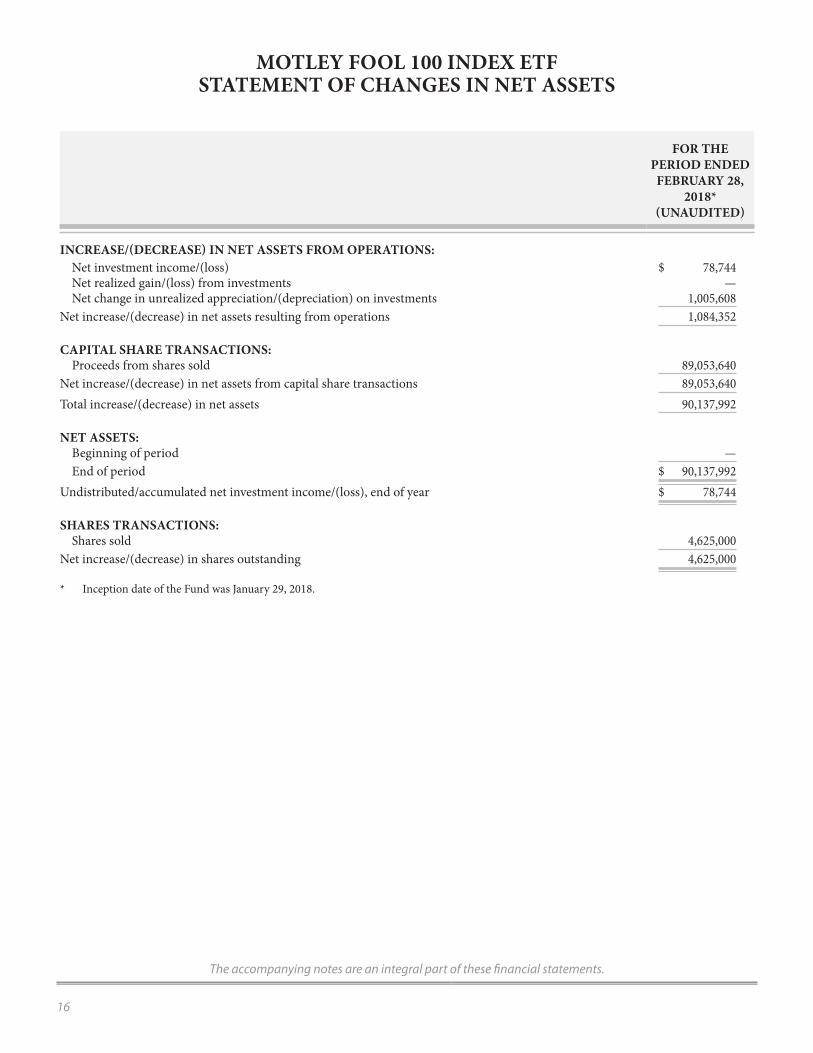
MOTLEY FOOL 100 INDEX ETF STATEMENT OF CHANGES IN NET ASSETS
FOR THE PERIOD ENDEDFEBRUARY 28,
2018*(UNAUDITED)
INCREASE/(DECREASE) IN NET ASSETS FROM OPERATIONS:Net investment income/(loss) $ 78,744Net realized gain/(loss) from investments —Net change in unrealized appreciation/(depreciation) on investments 1,005,608
Net increase/(decrease) in net assets resulting from operations 1,084,352
CAPITAL SHARE TRANSACTIONS:Proceeds from shares sold 89,053,640
Net increase/(decrease) in net assets from capital share transactions 89,053,640Total increase/(decrease) in net assets 90,137,992
NET ASSETS:Beginning of period —End of period $ 90,137,992
Undistributed/accumulated net investment income/(loss), end of year $ 78,744
SHARES TRANSACTIONS:Shares sold 4,625,000
Net increase/(decrease) in shares outstanding 4,625,000
* Inception date of the Fund was January 29, 2018.
17
The accompanying notes are an integral part of these fi nancial statements.
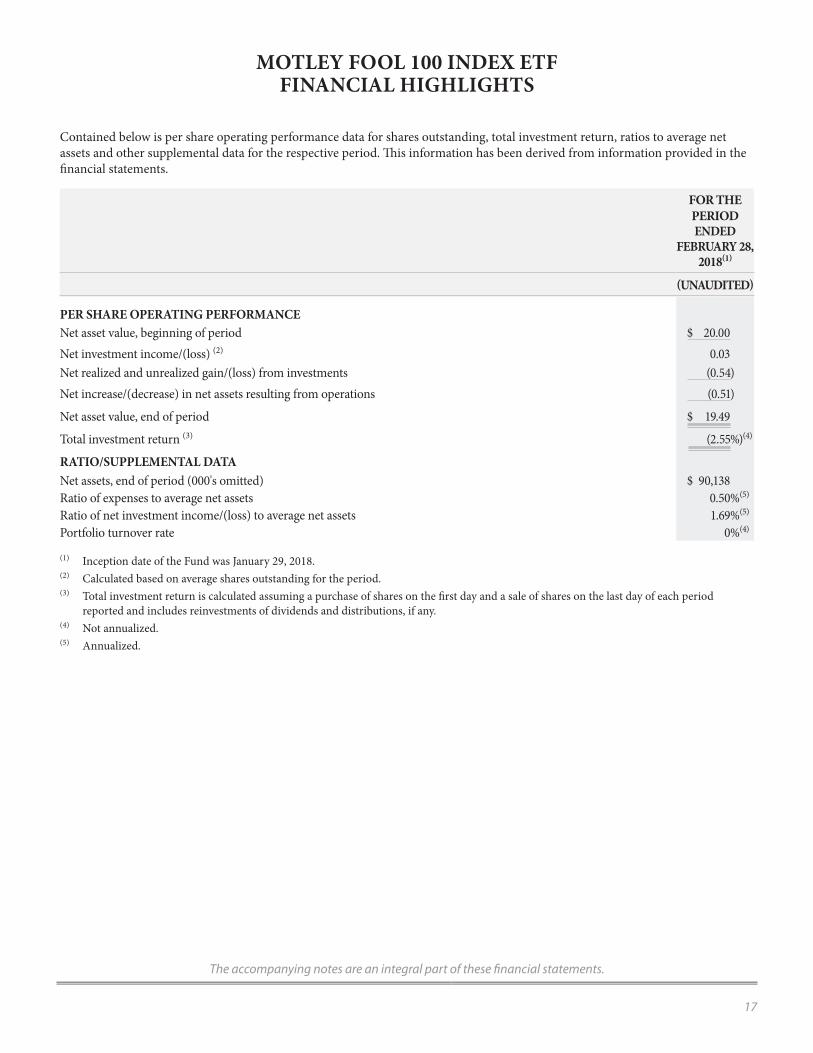
Contained below is per share operating performance data for shares outstanding, total investment return, ratios to average net assets and other supplemental data for the respective period. Th is information has been derived from information provided in the fi nancial statements.
FOR THEPERIOD ENDED
FEBRUARY 28, 2018(1)
(UNAUDITED)
PER SHARE OPERATING PERFORMANCENet asset value, beginning of period $ 20.00Net investment income/(loss) ( 2) 0.03Net realized and unrealized gain/(loss) from investments (0.54)Net increase/(decrease) in net assets resulting from operations (0.51)
Net asset value, end of period $ 19.49
Total investment return (3) (2.55%)(4)
RATIO/SUPPLEMENTAL DATANet assets, end of period (000's omitted) $ 90,138Ratio of expenses to average net assets 0.50%(5)
Ratio of net investment income/(loss) to average net assets 1.69%(5)
Portfolio turnover rate 0%(4)
(1) Inception date of the Fund was January 29, 2018.( 2) Calculated based on average shares outstanding for the period.(3) Total investment return is calculated assuming a purchase of shares on the fi rst day and a sale of shares on the last day of each period
reported and includes reinvestments of dividends and distributions, if any.( 4) Not annualized.( 5) Annualized.
MOTLEY FOOL 100 INDEX ETF FINANCIAL HIGHLIGHTS
18
MOTLEY FOOL 100 INDEX ETFNOTES TO FINANCIAL STATEMENTS
FEBRUARY 28, 2018 (UNAUDITED)
1. ORGANIZATION AND SIGNIFICANT ACCOUNTING POLICIESTh e RBB Fund, Inc. (“RBB” or the “Company”) was incorporated under the laws of the State of Maryland on February 29,
1988 and is registered under the Investment Company Act of 1940, as amended, (the “1940 Act”), as an open-end management investment company. RBB is a “series fund,” which is a mutual fund divided into separate portfolios. Each portfolio is treated as a separate entity for certain matters under the 1940 Act, and for other purposes, and a shareholder of one portfolio is not deemed to be a shareholder of any other portfolio. Currently, RBB has twenty-nine active investment portfolios, including the Motley Fool 100 Index ETF (the “Fund”), which commenced investment operations on January 29, 2018.
RBB has authorized capital of one hundred billion shares of common stock of which 87.023 billion shares are currently classifi ed into one hundred and eighty-one classes of common stock. Each class represents an interest in an active or inactive RBB investment portfolio.
Th e investment objective of the Fund is to achieve investment results that correspond (before fees and expenses) generally to the total return performance of the Motley Fool 100 Index (the “Index”). Th e Index was developed by Th e Motley Fool, LLC (“Th e Motley Fool”), an affi liate of the Adviser, and was established in 2017. It is a proprietary, rules-based index designed to track the performance of the 100 largest, most liquid U.S. companies that have been recommended by Th e Motley Fool’s analysts and newsletters.
Th e Fund is an investment company and follows accounting and reporting guidance in the Financial Accounting Standards Board (“FASB”) Accounting Standards Codifi cation Topic 946 “Financial Services - Investment Companies”.
Th e end of the reporting period for the Fund is February 28, 2018, and the period covered by these Notes to Financial Statements is the period January 29, 2018 through February 28, 2018 (the “current fi scal period”).
PORTFOLIO VALUATION — Th e Fund’s net asset value (“NAV”) is calculated once daily at the close of regular trading hours on the New York Stock Exchange (“NYSE”) (generally 4:00 p.m. Eastern time) on each day the NYSE is open. Securities held by the Fund are valued using the closing price or the last sale price on a national securities exchange or the National Association of Securities Dealers Automatic Quotation System (“NASDAQ”) market system where they are primarily traded. Equity securities traded in the over-the-counter (“OTC”) market are valued at their closing prices. If there were no transactions on that day, securities traded principally on an exchange or on NASDAQ will be valued at the mean of the last bid and ask prices prior to the market close. Fixed income securities are valued using an independent pricing service, which considers such factors as security prices, yields, maturities and ratings, and are deemed representative of market values at the close of the market. Foreign securities are valued based on prices from the primary market in which they are traded, and are translated from the local currency into U.S. dollars using current exchange rates. If market quotations are unavailable or deemed unreliable, securities will be valued in accordance with procedures adopted by the Company’s Board of Directors (the “Board”). Relying on prices supplied by pricing services or dealers or using fair valuation may result in values that are higher or lower than the values used by other investment companies and investors to price the same investments. Such procedures use fundamental valuation methods, which may include, but are not limited to, an analysis of the eff ect of any restrictions on the resale of the security, industry analysis and trends, signifi cant changes in the issuer’s fi nancial position, and any other event which could have a signifi cant impact on the value of the security. Determination of fair value involves subjective judgment as the actual market value of a particular security can be established only by negotiations between the parties in a sales transaction, and the diff erence between the recorded fair value and the value that would be received in a sale could be signifi cant.
FAIR VALUE MEASUREMENTS — Th e inputs and valuation techniques used to measure the fair value of the Fund ’s investments are summarized into three levels as described in the hierarchy below:
• Level 1 – Prices are determined using quoted prices in active markets for identical securities .• Level 2 – Prices are determined using other signifi cant observable inputs (including quoted prices for similar securities,
interest rates, prepayment speeds, credit risk, etc.) .• Level 3 – Prices are determined using signifi cant unobservable inputs (including the Fund’s own assumptions in
determining the fair value of investments).Th e inputs or methodologies used for valuing securities are not necessarily an indication of the risk associated with investing in
those securities.
19
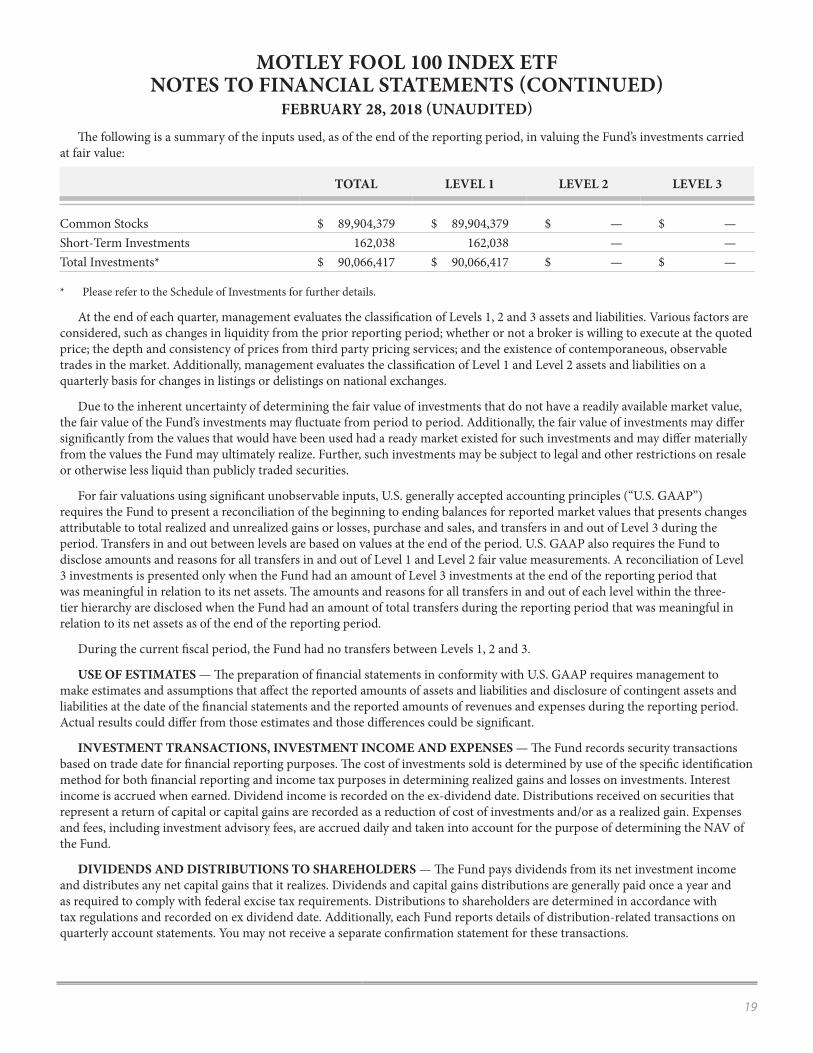
Th e following is a summary of the inputs used, as of the end of the reporting period, in valuing the Fund’s investments carried at fair value:
TOTAL LEVEL 1 LEVEL 2 LEVEL 3
Common Stocks $ 89,904,379 $ 89,904,379 $ — $ — Short-Term Investments 162,038 162,038 — —Total Investments* $ 90,066,417 $ 90,066,417 $ — $ —
* Please refer to the Schedule of Investments for further details.
At the end of each quarter, management evaluates the classifi cation of Levels 1, 2 and 3 assets and liabilities. Various factors are considered, such as changes in liquidity from the prior reporting period; whether or not a broker is willing to execute at the quoted price; the depth and consistency of prices from third party pricing services; and the existence of contemporaneous, observable trades in the market. Additionally, management evaluates the classifi cation of Level 1 and Level 2 assets and liabilities on a quarterly basis for changes in listings or delistings on national exchanges.
Due to the inherent uncertainty of determining the fair value of investments that do not have a readily available market value, the fair value of the Fund ’s investments may fl uctuate from period to period. Additionally, the fair value of investments may diff er signifi cantly from the values that would have been used had a ready market existed for such investments and may diff er materially from the values the Fund may ultimately realize. Further, such investments may be subject to legal and other restrictions on resale or otherwise less liquid than publicly traded securities.
For fair valuations using signifi cant unobservable inputs, U.S. generally accepted accounting principles (“U.S. GAAP”) requires the Fund to present a reconciliation of the beginning to ending balances for reported market values that presents changes attributable to total realized and unrealized gains or losses, purchase and sales, and transfers in and out of Level 3 during the period. Transfers in and out between levels are based on values at the end of the period. U.S. GAAP also requires the Fund to disclose amounts and reasons for all transfers in and out of Level 1 and Level 2 fair value measurements. A reconciliation of Level 3 investments is presented only when the Fund had an amount of Level 3 investments at the end of the reporting period that was meaningful in relation to its net assets. Th e amounts and reasons for all transfers in and out of each level within the three-tier hierarchy are disclosed when the Fund had an amount of total transfers during the reporting period that was meaningful in relation to its net assets as of the end of the reporting period.
During the current fi scal period, the Fund had no transfers between Levels 1, 2 and 3.
USE OF ESTIMATES — Th e preparation of fi nancial statements in conformity with U.S. GAAP requires management to make estimates and assumptions that aff ect the reported amounts of assets and liabilities and disclosure of contingent assets and liabilities at the date of the fi nancial statements and the reported amounts of revenues and expenses during the reporting period. Actual results could diff er from those estimates and those diff erences could be signifi cant.
INVESTMENT TRANSACTIONS, INVESTMENT INCOME AND EXPENSES — Th e Fund records security transactions based on trade date for fi nancial reporting purposes. Th e cost of investments sold is determined by use of the specifi c identifi cation method for both fi nancial reporting and income tax purposes in determining realized gains and losses on investments. Interest income is accrued when earned. Dividend income is recorded on the ex-dividend date. Distributions received on securities that represent a return of capital or capital gains are recorded as a reduction of cost of investments and/or as a realized gain. Expenses and fees, including investment advisory fees, are accrued daily and taken into account for the purpose of determining the NAV of the Fund .
DIVIDENDS AND DISTRIBUTIONS TO SHAREHOLDERS — Th e Fund pays dividends from its net investment income and distributes any net capital gains that it realizes. Dividends and capital gains distributions are generally paid once a year and as required to comply with federal excise tax requirements. Distributions to shareholders are determined in accordance with tax regulations and recorded on ex dividend date. Additionally, each Fund reports details of distribution-related transactions on quarterly account statements. You may not receive a separate confi rmation statement for these transactions.
MOTLEY FOOL 100 INDEX ETFNOTES TO FINANCIAL STATEMENTS (CONTINUED)
FEBRUARY 28, 2018 (UNAUDITED)
20
U.S. TAX STATUS — No provision is made for U.S. income taxes as it is the Fund’s intention to continue to qualify for and elect the tax treatment applicable to regulated investment companies under Subchapter M of the Internal Revenue Code of 1986, as amended, and make the requisite distributions to its shareholders which will be suffi cient to relieve it from U.S. income and excise taxes.
CASH AND CASH EQUIVALENTS — Cash and cash equivalents are valued at cost plus accrued interest, which approximates market value.
OTHER — In the normal course of business, the Fund may enter into contracts that provide general indemnifi cations. Th e Fund’s maximum exposure under these arrangements is dependent on claims that may be made against the Fund in the future, and, therefore, cannot be estimated; however, based on experience, the risk of material loss from such claims is considered remote.
2. INVESTMENT POLICIES AND PRACTICESTh e sections below describe some of the diff erent types of investments that may be made by the Fund and the investment
practices in which the Fund may engage.
When we say that the Fund may invest in other types of securities and in other asset classes, the “may” is well worth emphasizing, as the Fund’s primary focus is to track the makeup and returns of the Motley Fool 100 Index.
TYPES OF FIXED-INCOME SECURITIES — Th e Fund may invest in bonds and other types of debt obligations of U.S. and foreign issuers. Fixed income securities purchased by the Fund may include, among others, bonds, notes, and debentures issued by corporations; debt securities issued or guaranteed by the U.S. government or one of its agencies or instrumentalities (“U.S. Government Securities”); municipal securities; mortgage-backed and asset-backed securities; and debt securities issued or guaranteed by foreign governments, their agencies, instrumentalities, or political subdivisions, or by government-owned, -controlled, or -sponsored entities, including central banks. Th ese investments also include money market instruments and other types of obligations. Investors should recognize that, although securities ratings issued by Standard & Poor’s® Ratings Services (“S&P”), a division of Th e McGraw-Hill Companies, Inc., and Moody’s Investors Services©, Inc. (“Moody’s”), provide a generally useful guide as to credit risks, they do not off er any criteria to evaluate interest rate risk. Changes in interest rate levels generally cause fl uctuations in the prices of fi xed-income securities and will, therefore, cause fl uctuations in the NAV per share of the Fund. Subsequent to the purchase of a fi xed-income security by the Fund, the ratings or credit quality of such security may deteriorate. Any such subsequent adverse changes in the rating or quality of a security held by the Fund would not require the Fund to sell the security.
REAL ESTATE INVESTMENT TRUSTS — Real estate investment trusts (“REITs”) are pooled investment vehicles that manage a portfolio of real estate or real estate-related loans to earn profi ts for their shareholders. REITs are generally classifi ed as equity REITs, mortgage REITs, or a combination of equity and mortgage REITs. Investing in REITs involves certain unique risks in addition to those risks associated with investing in the real estate industry in general. Equity REITs may be aff ected by changes in the value of the underlying property owned by the REITs, while mortgage REITs may be aff ected by the quality of the borrower on any credit extended. REITs are dependent upon management skills, may not be diversifi ed geographically or by property type, and are subject to heavy cash-fl ow dependency, default by borrowers, and self-liquidation. REITs must also meet certain requirements under the Internal Revenue Code of 1986, as amended (the “Code”), to avoid entity level tax and be eligible to pass through certain tax attributes of their income to shareholders. REITs are consequently subject to the risk of failing to meet these requirements for favorable tax treatment and of failing to maintain their exemptions from registration under the 1940 Act. REITs are also subject to the risks of changes in the Code, aff ecting their tax status.
REITs (especially mortgage REITs) are also subject to interest rate risks. When interest rates decline, the value of a REIT’s investment in fi xed-rate obligations can be expected to rise. Conversely, when interest rates rise, the value of a REIT’s investment in fi xed-rate obligations can be expected to decline. In contrast, as interest rates on adjustable-rate mortgage loans are reset periodically, yields on a REIT’s investments in such loans will gradually align themselves to refl ect changes in market interest rates, causing the value of such investments to fl uctuate less dramatically in response to interest rate fl uctuations than would investments in fi xed-rate obligations.
MOTLEY FOOL 100 INDEX ETFNOTES TO FINANCIAL STATEMENTS (CONTINUED)
FEBRUARY 28, 2018 (UNAUDITED)
21
Th e management of a REIT may be subject to confl icts of interest with respect to the operation of the business of the REIT and may be involved in real estate activities competitive with the REIT. REITs may own properties through joint ventures or in other circumstances in which a REIT may not have control over its investments. REITs may use signifi cant amounts of leverage.
REITs oft en do not provide complete tax information until aft er the end of the calendar year. Consequently, because of the delay, it may be necessary for the Fund, if invested in REITs, to request permission to extend the deadline for issuance of Forms 1099-DIV beyond January 31. Alternatively, amended Forms 1099-DIV may be sent.
TEMPORARY INVESTMENTS — During periods of adverse market or economic conditions, the Fund may temporarily invest all or a substantial portion of its assets in high-quality, fi xed-income securities, money market instruments, and shares of money market mutual funds, or it may hold cash. At such times, the Fund would not be pursuing its stated investment objective with its usual investment strategies. Th e Fund may also hold these investments for liquidity purposes. Fixed-income securities will be deemed to be of high quality if they are rated “A” or better by S&P or Moody’s or, if unrated, are determined to be of comparable quality by the Adviser. Money market instruments are high-quality, short-term fi xed income obligations (which generally have remaining maturities of one year or less), and may include U.S. Government Securities, commercial paper, certifi cates of deposit and banker’s acceptances issued by domestic branches of United States banks that are members of the Federal Deposit Insurance Corporation, and repurchase agreements for U.S. Government Securities. In lieu of purchasing money market instruments, the Fund may purchase shares of money market mutual funds that invest primarily in U.S. Government Securities and repurchase agreements involving those securities, subject to certain limitations imposed by the 1940 Act. Th e Fund, as an investor in a money market fund, will indirectly bear the fees and expenses of the money market fund. Th ese indirect fees and expenses will be in addition to the fees and expenses of the Fund . Repurchase agreements involve certain risks not associated with direct investments in debt securities.
3. INVESTMENT ADVISER AND OTHER SERVICES Th e Fund pays all of its expenses other than those expressly assumed by Motley Fool Asset Management (the “Adviser”).
Expenses of the Fund are deducted from the Fund ’s total income before dividends are paid. Subject to the supervision of the Board, the Adviser manages the overall investment operations of the Fund in accordance with the Fund ’s investment objective and policies and formulates a continuing investment strategy for the Fund pursuant to the terms of the Investment Advisory Agreement between the Adviser and the Company on behalf of the Fund . Th e Adviser is a wholly owned subsidiary of Th e Motley Fool Holdings Inc. (“TMF Holdings”), a multimedia fi nancial-services holding company that also owns Th e Motley Fool , which publishes investment information and analysis across a wide range of media, including investment newsletter services, websites, and books. TMF Holdings is controlled by David Gardner and Tom Gardner, along with other private shareholders. Th e Fund compensates the Adviser a unitary management fee for its services at an annual rate of 0.50% based on the Fund’s average daily net assets (the “Advisory Fee”), payable on a monthly basis in arrears . From the Advisory Fee, the Adviser pays most of the expenses of the Fund, including the cost of transfer agency, custody, fund administration, legal, audit and other services. However, the Adviser is not responsible for interest expenses, brokerage commissions and other trading expenses, fees and expenses of the independent directors and their independent legal counsel, taxes and other extraordinary costs such as litigation and other expenses not incurred in the ordinary course of business.
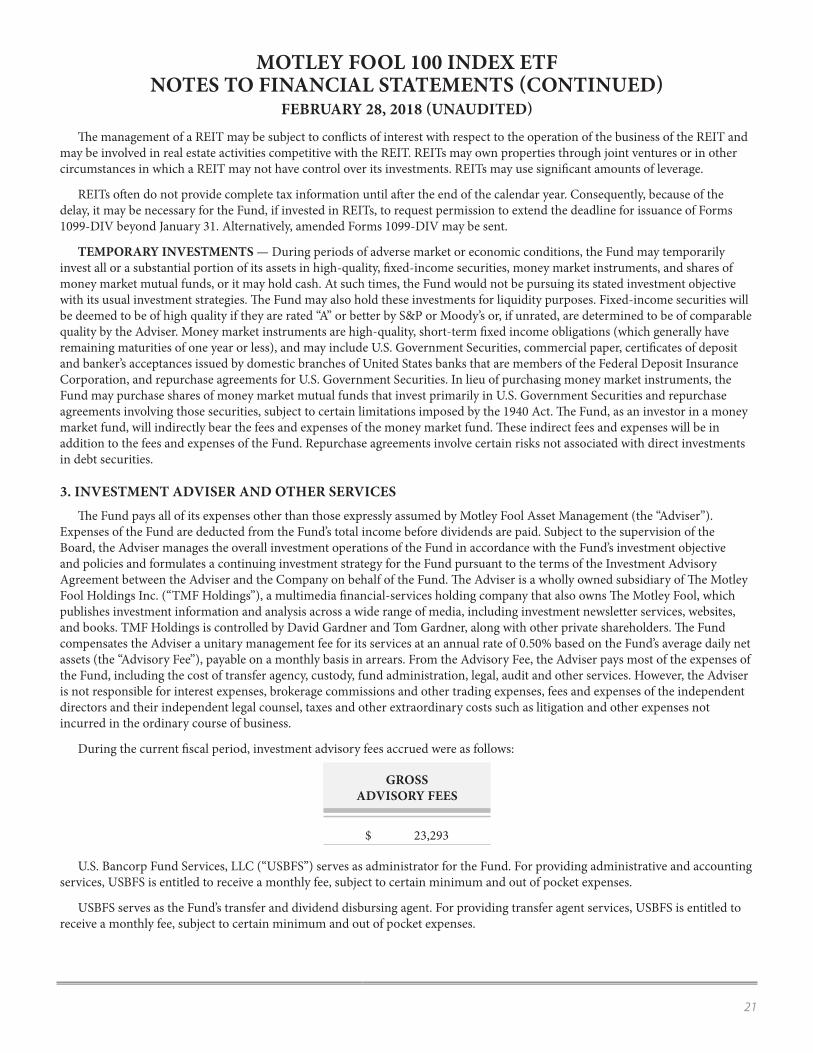
During the current fi scal period, investment advisory fees accrued were as follows:
GROSSADVISORY FEES
$ 23,293
U.S. Bancorp Fund Services, LLC (“USBFS”) serves as administrator for the Fund. For providing administrative and accounting services, USBFS is entitled to receive a monthly fee, subject to certain minimum and out of pocket expenses.
USBFS serves as the Fund’s transfer and dividend disbursing agent. For providing transfer agent services, USBFS is entitled to receive a monthly fee, subject to certain minimum and out of pocket expenses.
MOTLEY FOOL 100 INDEX ETFNOTES TO FINANCIAL STATEMENTS (CONTINUED)
FEBRUARY 28, 2018 (UNAUDITED)
22
U.S. Bank, N.A. (the “Custodian”) provides certain custodial services to the Fund. Th e Custodian is entitled to receive a monthly fee, subject to certain minimum and out of pocket expenses.
Quasar Distributors, LLC serves as the principal underwriter and distributor of the Fund’s shares pursuant to a Distribution Agreement with RBB.
Under the Fund’s unitary fee, the Adviser compensates USBFS for its services provided.
DIRECTOR’S AND OFFICER’S COMPENSATION — Th e Directors of the Company receive an annual retainer and meeting fees for meetings attended. Employees of Vigilant Compliance, LLC serve as President, Chief Compliance Offi cer and Assistant Treasurer of the Company. Vigilant Compliance, LLC is compensated for the services provided to the Company. An employee of RBB serves as Treasurer and Secretary, and is compensated for services provided. Certain employees of USBFS serve as offi cers of the Company. Th ey are not compensated by the Fund or the Company.
4. PURCHASES AND SALES OF INVESTMENT SECURITIESDuring the current fi scal period, aggregate purchases and sales and maturities of investment securities (excluding in-kind
transactions and short-term investments) of the Fund were as follows:
PURCHASES SALES
$ 1,754,129 $ —
Th ere were no purchases or sales of long-term U.S. Government Securities during the current fi scal period.
During the current fi scal period, aggregate purchases and sales and maturities of in-kind transactions of the Fund were as follows:
PURCHASES SALES
$ 87,145,535 $ —
5. FEDERAL INCOME TAX INFORMATIONTh e Fund follows the authoritative guidance on accounting for and disclosure of uncertainty in tax positions, which requires
the Fund to determine whether a tax position is more likely than not to be sustained upon examination, including resolution of any related appeals or litigation processes, based on the technical merits of the position. In the normal course of business, the Fund is subject to examination by federal, state and local jurisdictions, where applicable, for tax years for which applicable statutes of limitations have not expired. Th e amount and character of tax basis distributions and composition of net assets, including undistributed/(accumulated) net investment income/(loss), are fi nalized at fi scal year-end; accordingly, tax basis balances have not been determined for the period ended February 28, 2018. Since the Fund does not have a full fi scal year, the tax cost of investments is the same as noted on the Schedule of Investments.
6. SHARE TRANSACTIONSShares of the Fund are listed and trade on the Cboe BZX Exchange, Inc. (the “Exchange”). Market prices for the shares may be
diff erent from their NAV. Th e Fund issues and redeems shares on a continuous basis at NAV only in blocks of 25,000 shares, called “Creation Units.” Creation Units are issued and redeemed principally in-kind for securities included in a specifi ed universe. Once created, shares generally trade in the secondary market at market prices that change throughout the day. Except when aggregated in Creation Units, shares are not redeemable securities of the Fund. Creation Units may only be purchased or redeemed by certain fi nancial institutions (“Authorized Participants”). An Authorized Participant is either (i) a broker-dealer or other participant in the clearing process through the Continuous Net Settlement System of the National Securities Clearing Corporation or (ii) a Depository Trust Company participant and, in each case, must have executed a Participant Agreement with the Distributor. Most
MOTLEY FOOL 100 INDEX ETFNOTES TO FINANCIAL STATEMENTS (CONTINUED)
FEBRUARY 28, 2018 (UNAUDITED)
23
MOTLEY FOOL 100 INDEX ETFNOTES TO FINANCIAL STATEMENTS (CONCLUDED)
FEBRUARY 28, 2018 (UNAUDITED)retail investors do not qualify as Authorized Participants nor have the resources to buy and sell whole Creation Units. Th erefore, they are unable to purchase or redeem shares directly from the Fund. Rather, most retail investors may purchase shares in the secondary market with the assistance of a broker and are subject to customary brokerage commissions or fees.
Th e Fund currently off ers one class of shares, which has no front-end sales load, no deferred sales charge, and no redemption fee. A fi xed transaction fee is imposed for the transfer and other transaction costs associated with the purchase or sale of Creation Units. Th e standard fi xed transaction fee for the Fund is $250, payable to the custodian. In addition, a variable fee may be charged on all cash transactions or substitutes for Creation Units of up to a maximum of 2% as a percentage of the value of the Creation Units subject to the transaction. Variable fees are imposed to compensate the Fund for the transaction costs associated with the cash transactions. Variable fees received by the Fund, if any, are displayed in the capital shares transactions section of the Statement of Changes in Net Assets. Th e Fund may issue an unlimited number of shares of benefi cial interest, with $0.001 par value per share. Shares of the Fund have equal rights and privileges.
7. SUBSEQUENT EVENTSManagement has evaluated the impact of all subsequent events on the Fund through the date the fi nancial statements were
issued and has determined that there were no signifi cant events requiring recognition or disclosure in the fi nancial statements.

24
MOTLEY FOOL 100 INDEX ETF NOTICE TO SHAREHOLDERS
(UNAUDITED)
INFORMATION ON PROXY VOTINGPolicies and procedures that the Fund uses to determine how to vote proxies relating to portfolio securities as well as information regarding how the Fund voted proxies relating to portfolio securities during the most recent 12-month period ended June 30 are available (i) without charge, upon request, by calling (888) 863-8803; and (ii) on the U.S. Securities and Exchange Commission’s (“SEC”) website at http://www.sec.gov .
QUARTERLY SCHEDULE OF INVESTMENTSTh e Company fi les a complete schedule of portfolio holdings with the SEC for the fi rst and third quarters of each fi scal year (quarters ended November 30 and May 31) on Form N-Q. Shareholders can obtain the Form N-Q (i) without charge, upon request, by calling (888) 863-8803; and (ii) on the SEC’s website at http://www.sec.gov . Th e Form N-Q may be reviewed or copied at the SEC Public Reference Room in Washington, D.C. Information on the operation of the Public Reference Room may be obtained by calling (800) SEC-0330.
25
MOTLEY FOOL 100 INDEX ETF BOARD APPROVAL OF ADVISORY AGREEMENT
(UNAUDITED)As required by the 1940 Act, the Board of the Company, including all of the Directors who are not “interested persons” of
the Company, as that term is defi ned in the 1940 Act (the “Independent Directors”), considered the approval of the investment advisory agreement between the Adviser and the Company (the “Investment Advisory Agreement”) on behalf of the Fund at a meeting of the Board held on December 7, 2017 (the “Meeting”). At the Meeting, the Board, including all of the Independent Directors, approved the Investment Advisory Agreement for an initial term ending August 16, 2019. In approving the Investment Advisory Agreement, the Board considered information provided by the Adviser with the assistance and advice of counsel to the Independent Directors and the Company.
In considering the approval of the Investment Advisory Agreement between the Company and the Adviser with respect to the Fund, the Directors took into account all materials provided prior to and during the Meeting and at other meetings throughout the past year, the presentations made during the Meeting, and the discussions held during the Meeting. Among other things, the Directors considered (i) the nature, extent, and quality of services to be provided to the Fund by the Adviser; (ii) descriptions of the experience and qualifi cations of the personnel providing those services; (iii) the Adviser’s investment philosophy and process; (iv) the Adviser’s assets under management and client descriptions; (v) the Adviser’s soft dollar commission and trade allocation policies, including information on the types of research and services obtained in connection with soft dollar commissions; (vi) the Adviser’s advisory fee arrangements and other similarly managed clients, as applicable; (vii) the Adviser’s compliance procedures; (viii) the Adviser’s fi nancial information and insurance coverage; (ix) the extent to which economies of scale are relevant to the Fund; and (x) a report prepared by Broadridge/Lipper comparing the Fund’s proposed management fees and total expense ratio to those of its Lipper Group. Th e Directors noted that the Fund had not yet commenced operations, and consequently there was no performance information to review with respect to the Fund.
As part of their review, the Directors considered the nature, extent and quality of the services to be provided by the Adviser. Th e Directors concluded that the Adviser had substantial resources to provide services to the Fund.
Th e Board also considered the advisory fee rate payable by the Fund under the Investment Advisory Agreement. In this regard, information on the fees to be paid by the Fund and the Fund’s total operating expense ratio were compared to similar information for index exchange-traded funds advised by other, unaffi liated investment advisory fi rms. Th e Directors noted that the Fund’s actual advisor fees ranked in the fi rst quintile of its Lipper Expense Group. Th e Directors also considered that the total expenses of the Fund ranked in the fourth quintile of its Lipper Expense Universe.
Aft er reviewing the information regarding the Adviser’s costs, profi tability and economies of scale, and aft er considering the services to be provided by the Adviser, the Directors concluded that the investment advisory fees to be paid by the Fund to the Adviser were fair and reasonable and that the Investment Advisory Agreement should be approved for an initial period ending August 31, 2019.
26
Investment AdviserMotley Fool Asset Management, LLC
2000 Duke StreetSuite 275
Alexandria, VA 22314
Administrator and Transfer Agent U.S. Bancorp Fund Services, LLC
P.O. Box 701 Milwaukee, WI 53201
Custodian U.S. Bank, N.A.
1555 North Rivercenter Drive, Suite 302 Milwaukee, WI 53212
Principal Underwriter Quasar Distributors, LLC
777 East Wisconsin Avenue, Floor 6 Milwaukee, WI 53202
Legal CounselDrinker Biddle & Reath LLP
One Logan Square, Suite 2000 Philadelphia, PA 19103-6996

Stay informed about your investment!
Shareholders like you are very important to us, and we’re committed to communicating with you about important matters. The best way to stay “in the know” is to sign up for our free email newsletter. You’ll get quarterly
performance updates, insights about the stock market and investing, and more.
Simply send an email to [email protected] today to sign up!

M 10
0- SA
R18