Select Sires Sales: Thru September 2012 - PA Dairy Summit2)_Mergler.pdf · Blaine –Showcase...
94
2/18/2016 1 Joel Mergler Vice President International Development Select Sires, Inc.
Transcript of Select Sires Sales: Thru September 2012 - PA Dairy Summit2)_Mergler.pdf · Blaine –Showcase...
2/18/2016
1
Joel Mergler
Vice President International Development
Select Sires, Inc.
2/18/2016
2

2/18/2016
3

2/18/2016
4
Members
Cooperatives
Latin American Distributors
2/18/2016
5
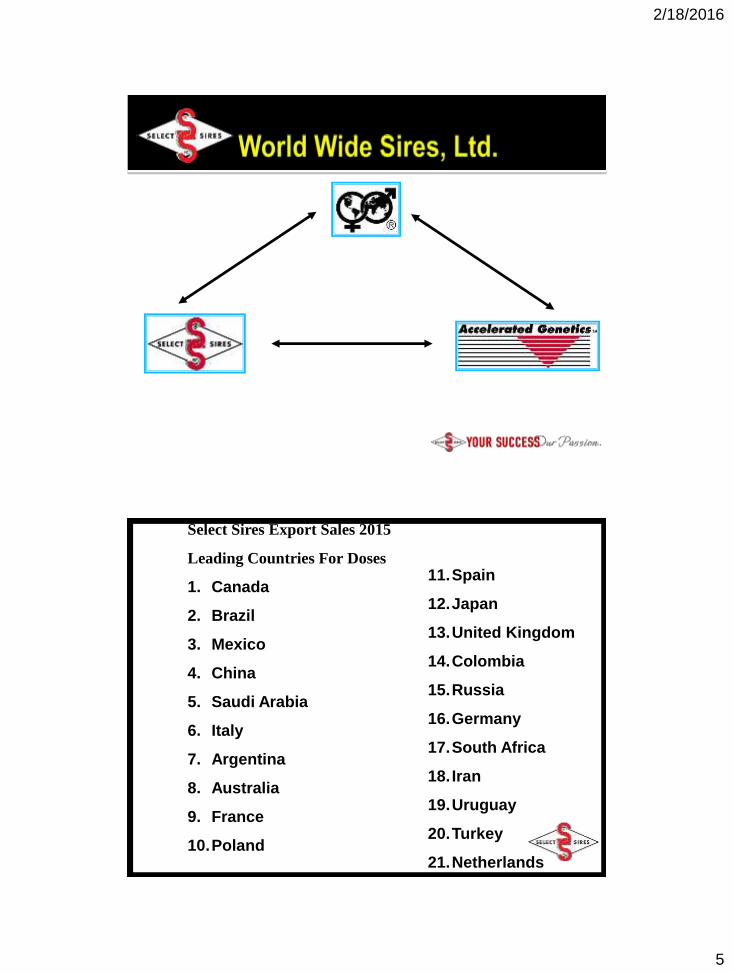
Select Sires Export Sales 2015
Leading Countries For Doses
1. Canada
2. Brazil
3. Mexico
4. China
5. Saudi Arabia
6. Italy
7. Argentina
8. Australia
9. France
10.Poland
11.Spain
12.Japan
13.United Kingdom
14.Colombia
15.Russia
16.Germany
17.South Africa
18.Iran
19.Uruguay
20.Turkey
21.Netherlands

2/18/2016
6
Select Sires Export Sales 2015
Leading Countries For Value
1. Canada
2. Mexico
3. Saudi Arabia
4. Italy
5. Japan
6. France
7. China
8. Brazil
9. Spain
10.Australia
11.United Kingdom
12.Germany
13.Netherlands
14.Argentina
15.Switzerland
16.Iran
17.Korea
18.Russia
19.Denmark
20.Peru
21.South Africa
X
X
X
X
X
X
X
X
XX
XX
X
X
XX
X
XX
X
XX
X
XX
X
X
XX
X
X
X
X
X XX
X
X
X
X
XX
X
X

2/18/2016
7
2/18/2016
8
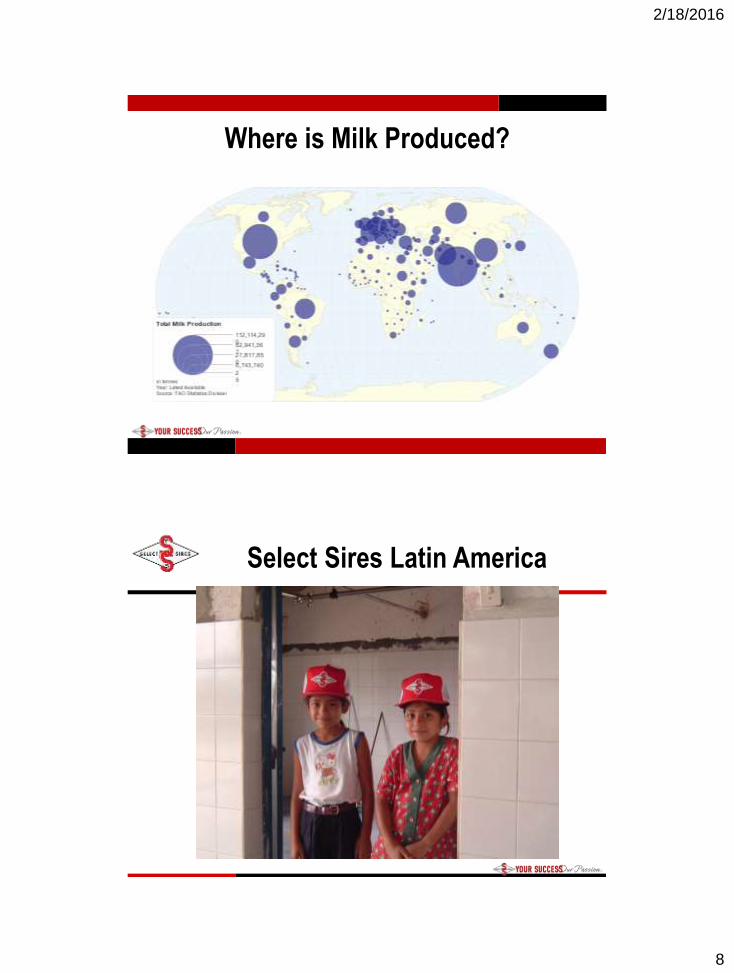
Where is Milk Produced?
Select Sires Latin America

2/18/2016
9
2/18/2016
10
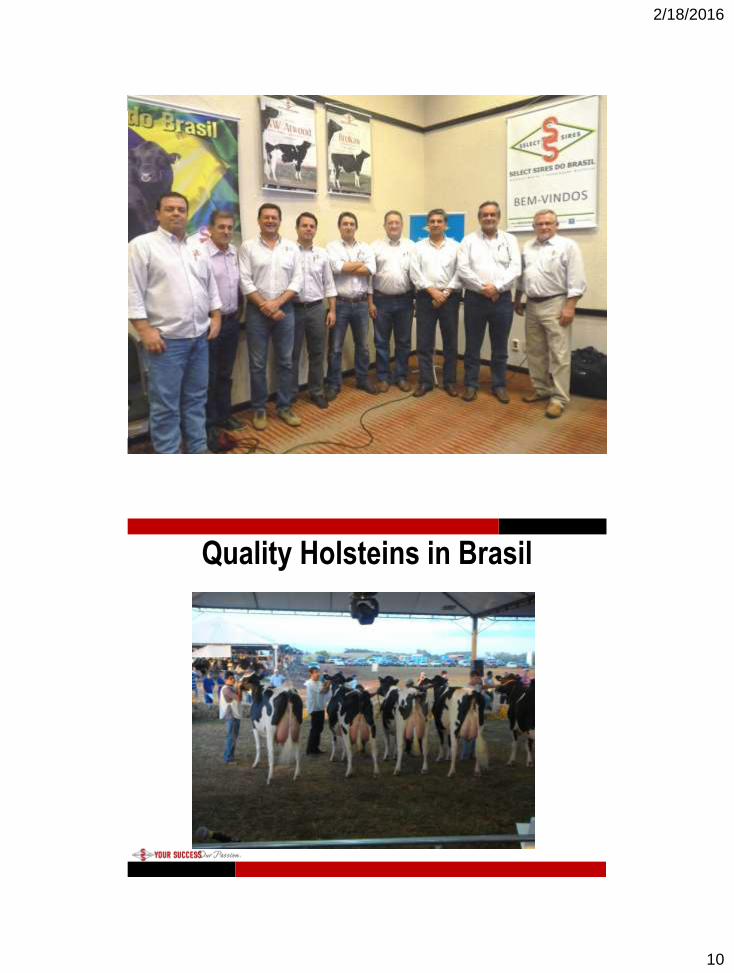
Quality Holsteins in Brasil
2/18/2016
11
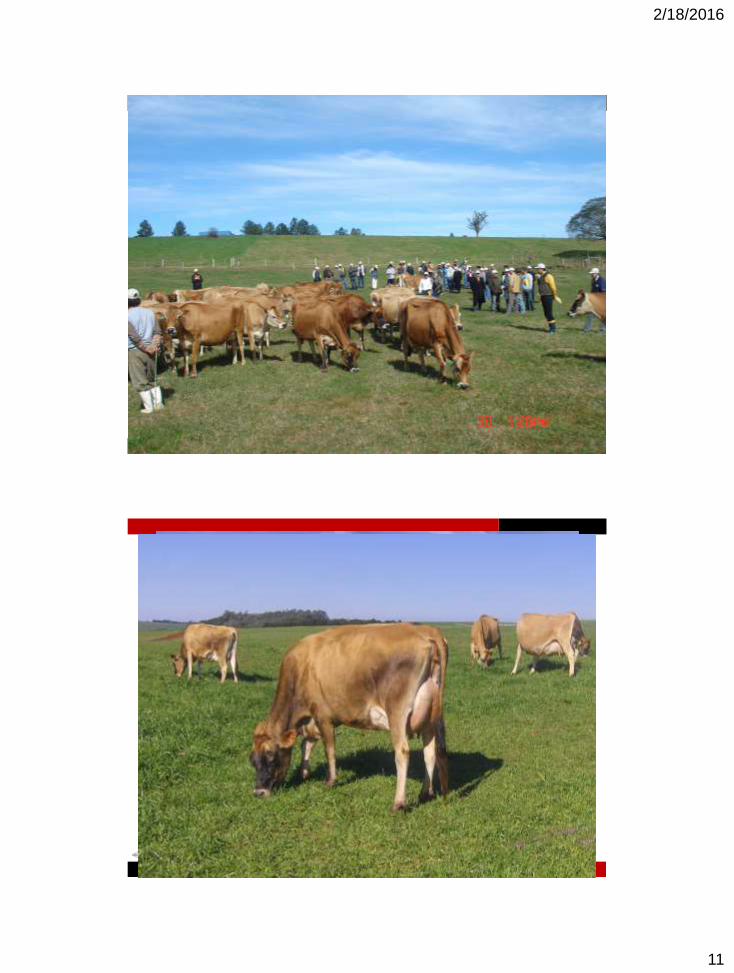
Jerseys in southern Brasil
2/18/2016
12
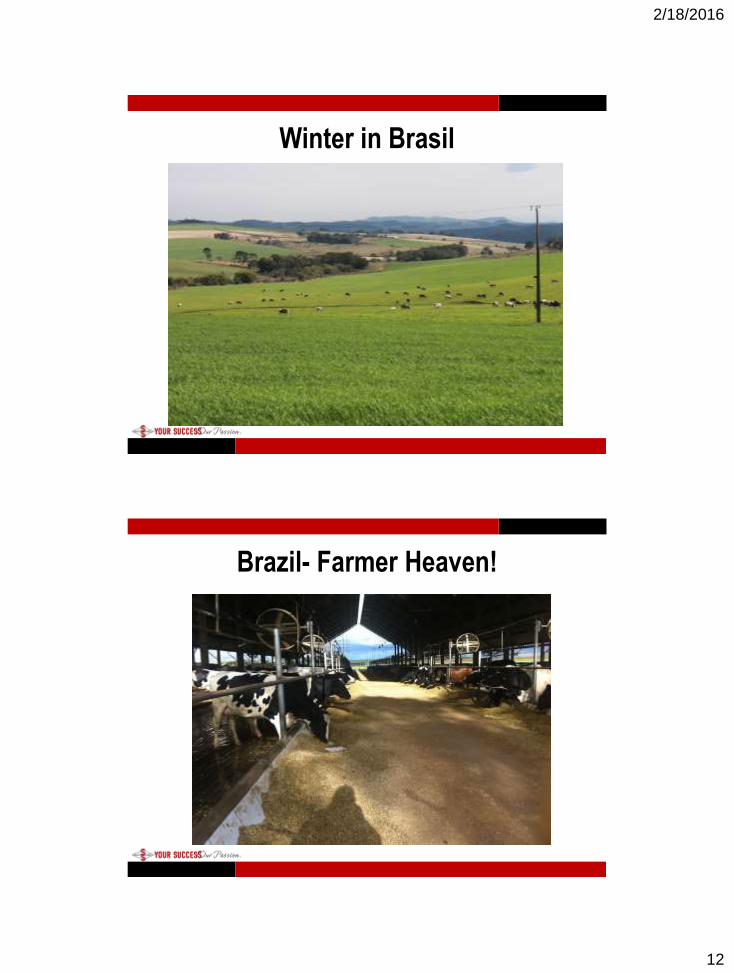
Winter in Brasil
Brazil- Farmer Heaven!

2/18/2016
13
3/4 GirolandoSired by Moscow
Just fresh milking 70 lbs./day
2/18/2016
14
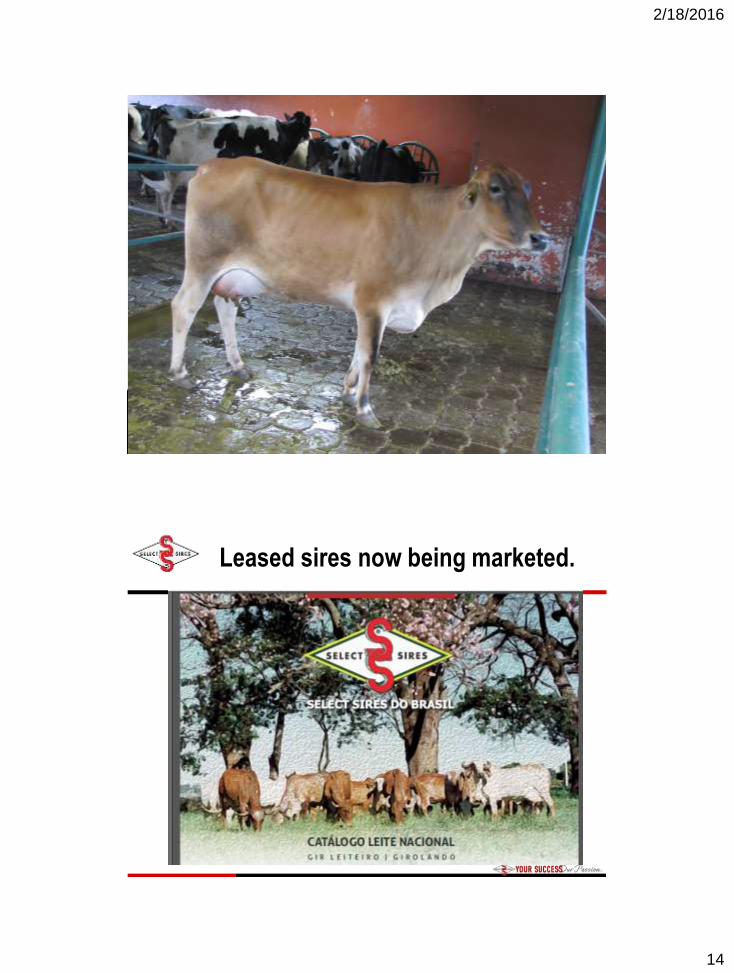
Leased sires now being marketed.

2/18/2016
15
Falcon - Sanchez son5/8 GirOlandro
Dam –Produced 29,901 lbs. of milk
Black hair is a necessity for this market!
Luxo – GW Atwood son ¾ GirOlandro
Dam –projected to 33,069 lbs.
Blaine –Showcase GirOlandro?

2/18/2016
16
Modern dairies being built
throughout Brazil
Industry is changing

2/18/2016
17
Political Struggles w/ U.S. Importation
• Argentina • Unable to receive import permits October thru February 2015
• Troubled economy
» 35% inflation in 2014
» Home loan interest at 30% -max of 20 years
» Car loans -28% interest
» Farm land loans –25% interest
• Brazil • The downturn in their dairy markets has arrived.
• New import restrictions impact available sires to export.
• US dollar (3-1-15 @ B$3.09 to US$1.00 ) takes away profit margin
• 9-15-15B$3.86 to US $1.00
2/18/2016
18
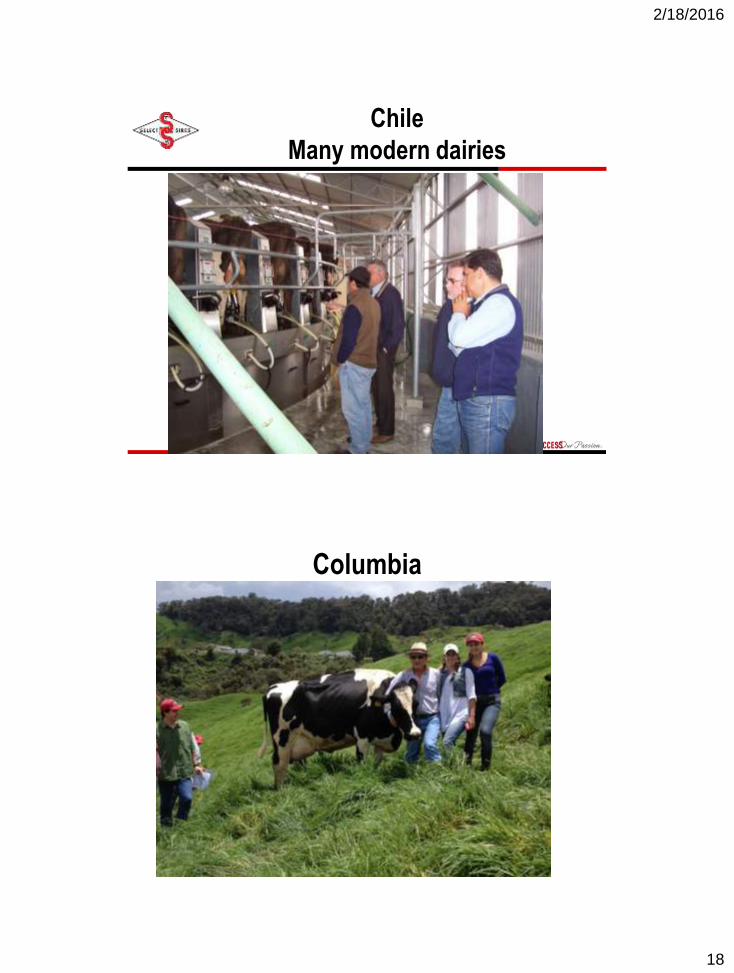
Chile
Many modern dairies
Columbia

2/18/2016
19
2/18/2016
20
2/18/2016
21

2/18/2016
22

2/18/2016
23
2/18/2016
24
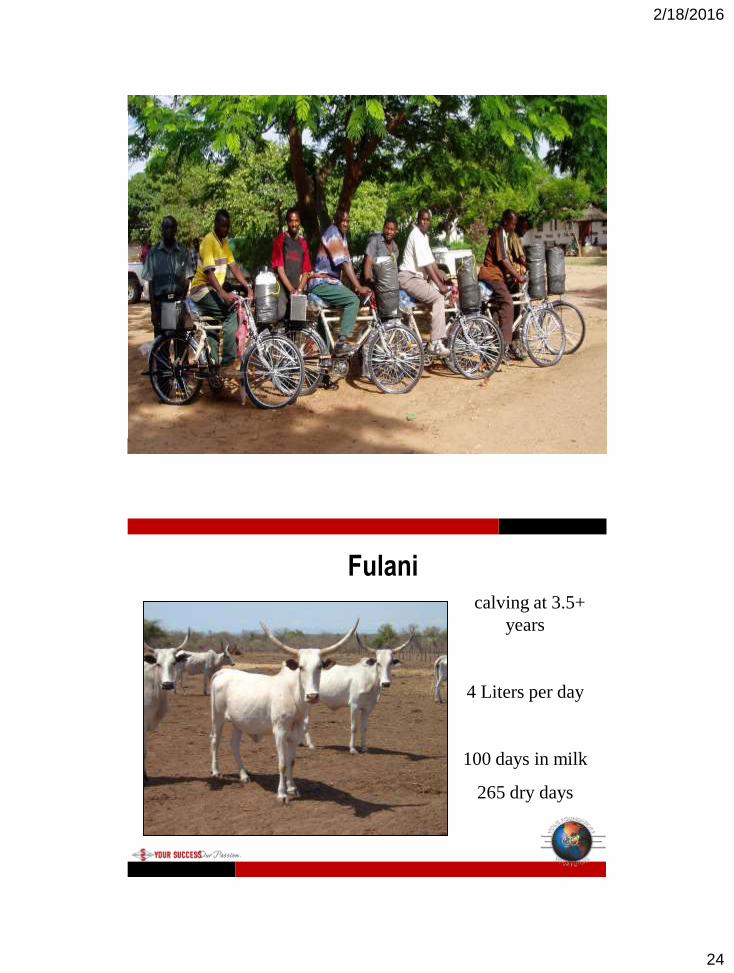
First
2calving at 3.5+
years
4 Liters per day
100 days in milk
265 dry days
Fulani
2/18/2016
25
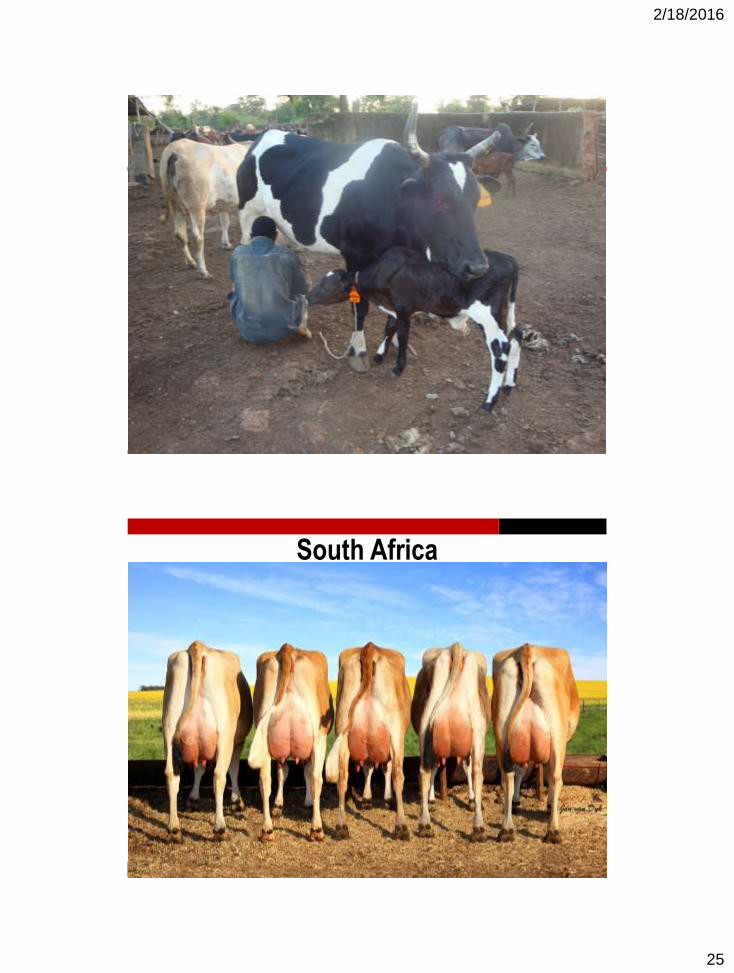
South Africa
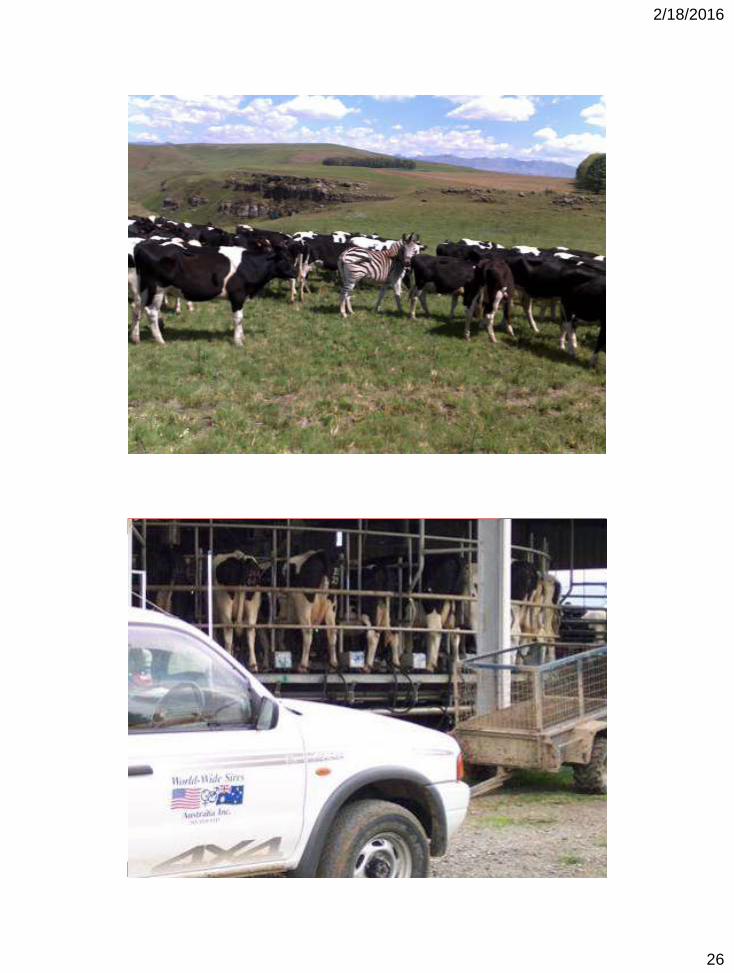
2/18/2016
26
2/18/2016
27

2/18/2016
28
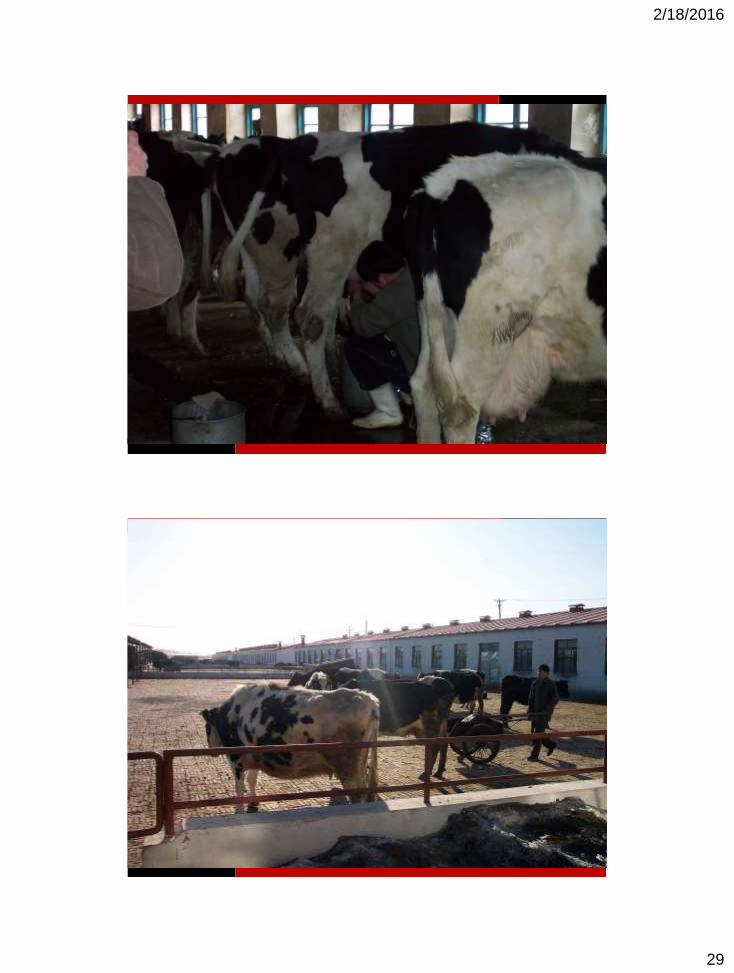
China has world largest population-the demands of food is also
very huge, including dairy products;
Dairy cattle population increased from 4.89 million head in 2000,
to 14 million in 2012-13, 3X increase.
Canadian Pacific Genetics
Semen Market in China
Excellence in Superior Genetics and Quality Services
2/18/2016
29

2/18/2016
30

2/18/2016
31

2/18/2016
32
2/18/2016
33
加拿大太平洋遗传育种中心
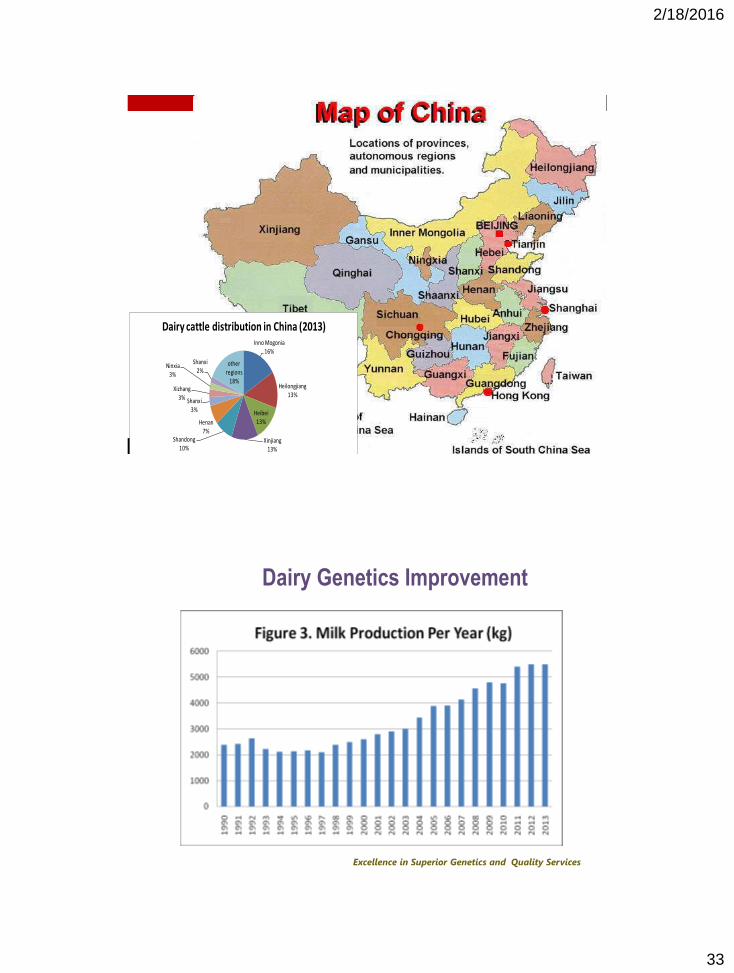
Inno Mogonia16%
Heilongjiang13%
Heibei13%
Xinjiang13%
Shandong10%
Henan7%
Shanxi3%
Xizhang3%
Ninxia3%
Shanxi2%
other regions
18%
Dairy cattle distribution in China (2013)
Dairy Genetics Improvement
Excellence in Superior Genetics and Quality Services

2/18/2016
34

2/18/2016
35

2/18/2016
36

2/18/2016
37
2/18/2016
38

2/18/2016
39

2/18/2016
40
2/18/2016
41
2/18/2016
42
2/18/2016
43
2/18/2016
44

2/18/2016
45

2/18/2016
46

2/18/2016
47
2/18/2016
48
2/18/2016
49

2/18/2016
50
2/18/2016
51

2/18/2016
52
2/18/2016
53
2/18/2016
54

2/18/2016
55

2/18/2016
56
2/18/2016
57

2/18/2016
58

2/18/2016
59
2/18/2016
60
2/18/2016
61
2/18/2016
62
2/18/2016
63
2/18/2016
64
2/18/2016
65

2/18/2016
66
file:///.file/id=657
1367.8132112
Total Herd = 105,000 animals

2/18/2016
67
2/18/2016
68
2/18/2016
69

2/18/2016
70

2/18/2016
71

2/18/2016
72

2/18/2016
73

2/18/2016
74

2/18/2016
75

2/18/2016
76

2/18/2016
77
1930’s – 3,300 lbs/cow/year
2/18/2016
78
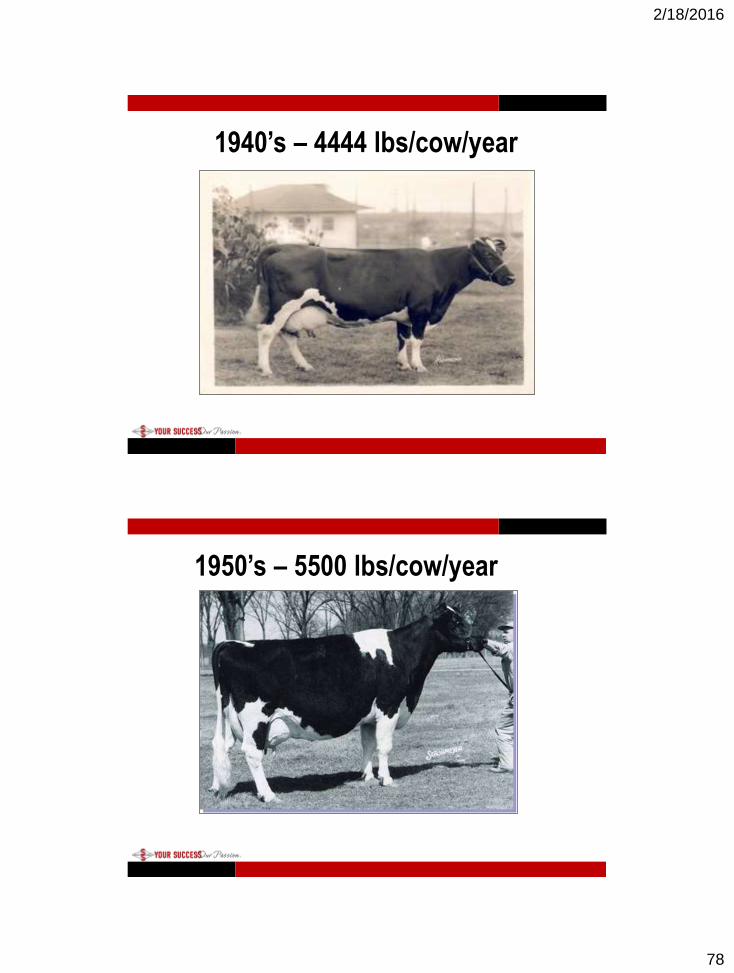
1940’s – 4444 lbs/cow/year
1950’s – 5500 lbs/cow/year
2/18/2016
79
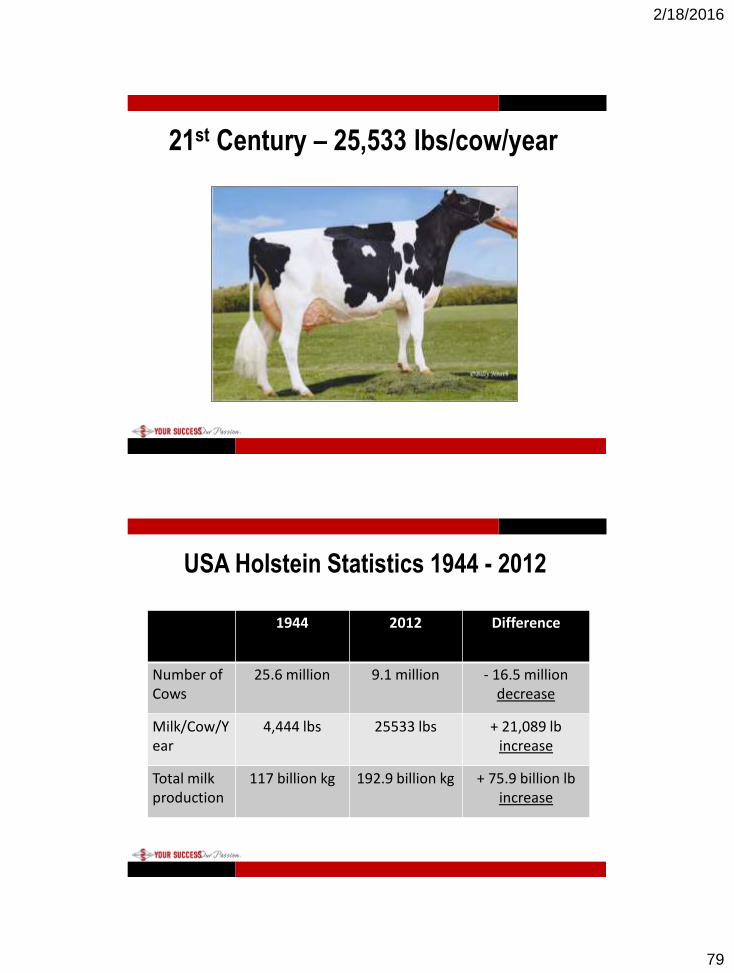
21st Century – 25,533 lbs/cow/year
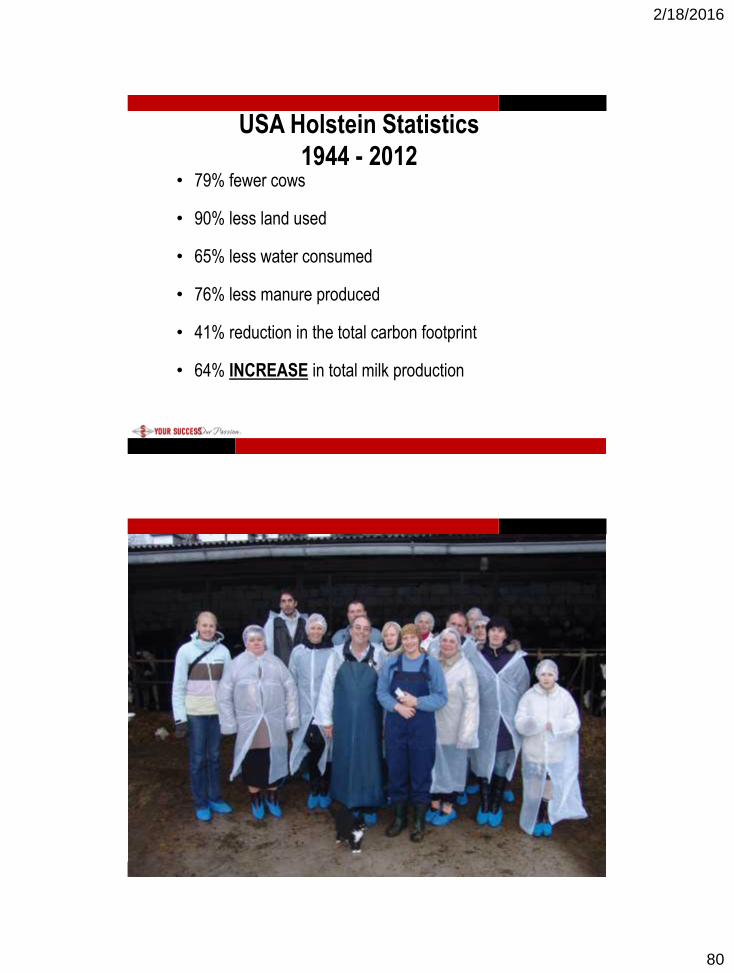
USA Holstein Statistics 1944 - 2012
1944 2012 Difference
Number of Cows
25.6 million 9.1 million - 16.5 million decrease
Milk/Cow/Year
4,444 lbs 25533 lbs + 21,089 lbincrease
Total milk production
117 billion kg 192.9 billion kg + 75.9 billion lbincrease
2/18/2016
80
• 79% fewer cows
• 90% less land used
• 65% less water consumed
• 76% less manure produced
• 41% reduction in the total carbon footprint
• 64% INCREASE in total milk production
USA Holstein Statistics
1944 - 2012

2/18/2016
81
2/18/2016
82
2/18/2016
83

2/18/2016
84

2/18/2016
85
2/18/2016
86
2/18/2016
87

2/18/2016
88
Breeding for the Global Population

2/18/2016
89
X
X
X
X
X
X
X
X
XX
XX
X
X
XX
X
XX
X
XX
X
XX
X
X
XX
X
X
X
X
X XX
X
X
X
X
XX
X
X

2/18/2016
90
2/18/2016
91

2/18/2016
92

2/18/2016
93
Select Sires Making A World of Difference

2/18/2016
94
THANK YOU