Sankaran Bharat - George Mason University
56
Transcript of Sankaran Bharat - George Mason University

Immobilization of Biological Matter using Transparent Metal Electrodes and Silicon Microstructures
A thesis submitted in partial fulfillment of the requirements for the degree of Master of Science at George Mason University
By
Bharat Sankaran Bachelor of Science
George Mason University, 2006
Director: Dr. V. Rao Mulpuri, Professor Department of Electrical and Computer Engineering
Fall Semester 2007 George Mason University
Fairfax, VA

ii
ACKNOWLEDGEMENTS
I would like to thank the many friends, relatives, and supporters who have helped me during this period. I would like to thank Dr. Samuel P. Forry, Milena Racic, Dr. Michael Gaitan, Dr. Alessandro Tona, and Andraes Jahn at the National Institutes of Standards and Technology for help in Indium Tin Oxide microelectrode research. I would like to thank Dr. David Geho and Alessandra Lucchini for help in proteomics. Dr. Mulpuri V. Rao helped me with all aspects of this work and guided me in academics as well as research as my Thesis Director.

iii
TABLE OF CONTENTS
Page List of Figures…………………………………………………………………………….iv Abstract................................................................................................................…………v 1. Introduction.............................................................................................................…….1 2. Dielectrophoretic Capture of Mammalian Cells using Transparent ITO Electrodes…...4 Overview..........................................................................................................................4 Materials and Methods.....................................................................................................6 Results and Discussions.................................................................................................11 3. Silicon-based Microarray Substrates for Clinical Proteomics………………………...19 Overview........................................................................................................................19 Materials and Methods...................................................................................................24 Results and Discussions.................................................................................................33 4. Conclusions……………………………………………................................................37 List of References..............................................................................................................38

iv
LIST OF FIGURES Figure Page 1. Fabrication of ITO microelectrode arrays….......................................................……….7 2. Advantages of ITO microelectrodes..............................................................................12 3. Cellular immobilization by DEP within microfluidic systems .....................................14 4. Conditions for Single Cell Trapping…………..............................................................16 5. Fluorescence Microscopy of immobilized cells............................................................18 6. Illustration of designer surfaces….................................................................................25 7. Schematic view of square sector....................................................................................26 8. Cross sectional view of 6 mm window..........................................................................26 9. Final Device for biological use......................................................................................28 10. Steps leading from biopsies to microarray testing..……………………………….....30 11. Schematic of Reverse Phase microarray testing…......................................................31 12. Different types of microarrays tested…………..........................................................32 13. RPA analysis of native silicon and dielectric layer microarrays….............................33 14. RPA analysis of chemically coated microarrays.........................................................35

ABSTRACT
IMMOBLIZATION OF BIOLOGICAL MATTER USING TRANSPARENT METAL ELECTRODES AND SILICON MICROSTRUCTURES Bharat Sankaran, B.S.
George Mason University, 2006
Thesis Director: Dr. V. Rao Mulpuri
This thesis describes the development of two different methods to produce an optimal
platform for immobilizing biological matter (cells and proteins). Firstly, transparent
indium tin oxide (ITO) microelectrodes were fabricated and used to immobilize
suspended NIH 3T3 fibroblast cells by positive dielectrophoresis (DEP). The ITO
electrodes facilitated microscopic observation of immobilized cells as compared to
metallized electrodes. DEP was used to capture arrays of individual cells and small cell
clusters within a microfluidic network. The extent of cellular immobilization (no-cell,
single-cell, or multiple-cell capture) directly correlated with the applied voltage and
inversely with the flow velocity. Specific conditions yielding predominantly single-cell
capture were identified. The viability of immobilized cells was confirmed using
fluorescence microscopy.

In the second method, silicon microtechnology was used to make silicon microarray
sector slides for facilitating high accuracy protein interactions and identifications.
Photolithography and anisotropic chemical etching was used for creating pyramid-like
array structures in each sector, to increase the sector surface area and hence the
concentration of the reactant. The silicon microarrays were coated with different
dielectric films to investigate if they improve the presence and relative abundance of
specific variants of key signaling molecules. The microarray structures were also
modified with a chemical surface coating: 3-metcaptopropyltrimethoxysilane (MPTMS).
Competitive binding assays were then used to test the protein binding accuracy and
sensitivity of the silicon based microarrays. Native silicon and dielectric layer
microarrays produced poor protein molecule capture during Reverse Phase Antibody
process. The presence of MPTMS was found to improve the extent of protein
immobilization, thereby improving characterization of immobilized proteins on
microarray structures.

1
1. Introduction
Biological specimens contain a large number of molecular markers, out of which some
proportion of the materials can be used to develop sensory tools capable of identifying biologically
active analytes, patient’s disease, and the patient’s response to a therapeutic regimen. At present, the
challenge lies in developing tools that effectively probe high-impact cellular and molecular
populations for information out of the larger background of unresponsive molecules. While it has
been shown that each class of molecules in the human body has some individual sensory and
response entities that can been developed for biological applications, the development of cell based
biosensors and the study of alterations to proteins are of particular interest.
The development of cell based biosensors is particularly important as they detect a change in a
biological environment in response to signals. Within an individual mammalian cell, analyte
sensitive materials like receptors, enzymes, and channels exist. Thus, cell based biosensors respond
primarily to active analytes, and has been developed for such applications such as environmental
monitoring of pollutants. Two important factors have been instrumental in the development of
biosensors: selectiveness to specific analytes and the physiologically relevant response to stimuli.
Biosensors have the capability to provide a fast, economical, selective measurement medium for
monitoring cell concentrations. However, the development of biosensors is impeded by several
factors, including source of cells, continuous use with little replacement of sensor material,

2
portability, and rapid patterning of cells within a well defined microenvironment. In this work, we
describe one method of patterning cells on transparent metal electrodes using positive
dielectrophoresis. This method can be used for immobilizing cells for a variety of biological
applications with different electrode geometries where the need for a well defined cell pattern is
imperative.
Another important research direction lies in the development of tools that can detect alterations
to proteins. This is because proteins play a fundamental role in the function of an organism, and
because they are the recognizable part of the external face of cells. In particular, proteins are
significant subjects for study within oncology research. Investigating protein signaling pathways
based on posttranslational modifications (such as phosphorylation, the addition of a phosphate group
to a protein which can determine if certain enzymes and receptors are switched on or off) holds
significant promise in unraveling key aspects of disease processes [1-4], while cell surface receptors
and the sugar modifications they undergo present potential cell surface markers for diagnostics.
In the last few years, vast progress has been seen in the fields of protein science, cell and
molecular biology, and bioinformatics. Therefore, there are increased demands for new technologies
that can identify proteins and perform detailed studies on their structure at high speeds and with high
sensitivity. DNA sequencing data has been used for developing gene expression profiling platforms,
which have been essential for providing information on human diseases [5-7]. However, a detailed
insight into biological processes like malignant transformation, cell differentiation, and many others
cannot be provided with sequence and transcript data alone. While DNA contains the genetic
information for the development and functioning of living organisms, proteins are the result of
complex regulatory mechanisms whose outcome is directly reflected in the actual biological

3
processes occurring in the body. These processes range from defining the morphology through the
cytoskeleton to enzyme catalysts of biochemical reactions to cell signaling and immune response
functions. Protein identity modification, expression level with its temporal and spatial distribution,
and interaction information is essential before cell responses can be understood. In this work, we
present a fabrication method for developing silicon pyramid structures for developing antibody based
biosensors.
4
2. Dielectrophoretic Capture of Mammalian Cells using Transparent ITO
Electrodes
2.1 Overview
The viability and fate of mammalian cells in culture is strongly influenced by their
specific location within defined microenvironments [8]. A principal engineering challenge for
developing cell based biosensors is the rapid patterning of viable cells into well controlled
arrangements [9]. Cell patterning can be achieved by a variety of methods including: mechanical
techniques using microtweezers [10], physical barriers like elastomeric stencils [11] and microwells
[12], optical techniques using laser tweezers [13], and by electrical techniques such as
dielectrophoresis (DEP). For DEP manipulation, induced dipoles in polarizable particles (like
biological cells) allow attractive and repulsive forces to be generated locally at regions of electric
field curvature [14]. The simplicity and low cost of fabrication methods for monolithic
microelectrode systems favor the utilization of DEP for the manipulation of cells.
A variety of DEP electrode sizes, shapes, and arrangements are achievable using
conventional semiconductor fabrication techniques such as photolithography, wet chemical etching,
electron beam scattering, sputtering, lift off processes, and laser ablation. Thousands of distinct
electrodes for trapping individual biological cells have been created on a single substrate using
microfabrication techniques [15]. Applications of DEP microarrays include: manipulating cell-cell

5
interactions [15], achieving active position control of single cell/microbead contacts in a micro-well
array chip [16], creating traps for single-particle patterning [17], designing a three-dimensional grid
electrode system to position a single cell [18], generation of dielectrophoretic field cages [19], and
separating particles by differential dielectric properties [20-23].
Most DEP efforts utilize metal microelectrode materials (Au, Pt, Cr) that are opaque
and complicate microscopic observation of immobilized cells. However, many biological researchers
commonly rely on microscopic observation techniques such as phase microscopy and fluorescence
to characterize cells in culture. The utilization of optically transparent electrode materials (e.g.
indium tin oxide (ITO)) in place of conventional metal electrodes has been identified as a needed
improvement step for more effective integration of DEP cell patterning with common cell culture
assays [23,24].
DEP applications can be classified into: positive dielectrophoresis, where cells are
pulled towards the electrodes and negative dielectrophoresis, where cells are pushed away from the
electrodes. Negative DEP has been a favored technique in a variety of single cell capture
investigation, including negative DEP quadrupole field cages [23], posts [25], traps [17], and cages
[26]. However, negative DEP is not suitable direct patterning of most mammalian cell lines because
trapped cells remain suspended in solution between the electrodes. Conversely, positive DEP
captures cells against the microelectrode surface and thus can be used for efficient patterning of cells
[15, 24, 27].
DEP cell patterning is particularly useful when combined with microfluidic systems,
because DEP allows rapid manipulation of cellular position while microfluidics enable manipulation
of the soluble microenvironment around immobilized cells [24,28,29]. Successful DEP

6
immobilization of cells within microfluidic channels results from the interplay between DEP
trapping forces and viscous drag from solution flow [28, 29]. Even after a first cell is immobilized at
the field maximum, other cells may be immobilized nearby, but with weaker holding forces.
In this report, we describe the fabrication and characterization of transparent ITO
microelectrodes for DEP trapping of viable mammalian fibroblast cells from suspension in a
microfluidic environment. The ITO microelectrodes were fabricated using simple photolithography
and wet etching techniques, and greatly facilitated microscopic observation of captured cells as
compared to traditional metal DEP electrodes. The capture efficiency was characterized with respect
to the flow velocity and electric field strength and revealed conditions yielding reproducible capture
of individual cells or of small clusters of cells. Phase contrast and fluorescence microscopy were
used to analyze the immobilized cells and demonstrate the utility of transparent DEP
microelectrodes for biological applications.
2.2 Materials and Methods
2.2.1 Materials and Reagents
Glass slides (25x75x1.1mm) with a conductive ITO film (Sheet resistance: 70 -125 Ω,
thickness: 30-60nm, 88% transmittance of visible light) were obtained from Delta Technologies
(Stillwater, MN). Microposit® S1813 positive photoresist, Microposit® MF CD 26-A developer,
and Microchem SU-8 negative photoresist were obtained from Microchem Corporation (Newton,
MA). 12M Hydrochloric acid, Hexamethyldisilazine (HMDS), and 50-70% Nitric acid were
obtained from Mallinckrodt Baker (Phillipsburg, NJ). Triton X surfactant was obtained from SPI
supplies (West Chester, PA). Sylgard® 184 silicon elastomer kit (Polydimethylsiloxane (PDMS) and
curing agent) was obtained from Dow Corning (Midland, MI). Silver Bond Epoxy was obtained

7
from Epoxy Technologies (Billerica, MA). Live/Dead Viability/Cytotoxicity Kit was obtained from
Invitrogen (Carlsbad, CA).
2.2.2 ITO electrode and microchannel fabrication
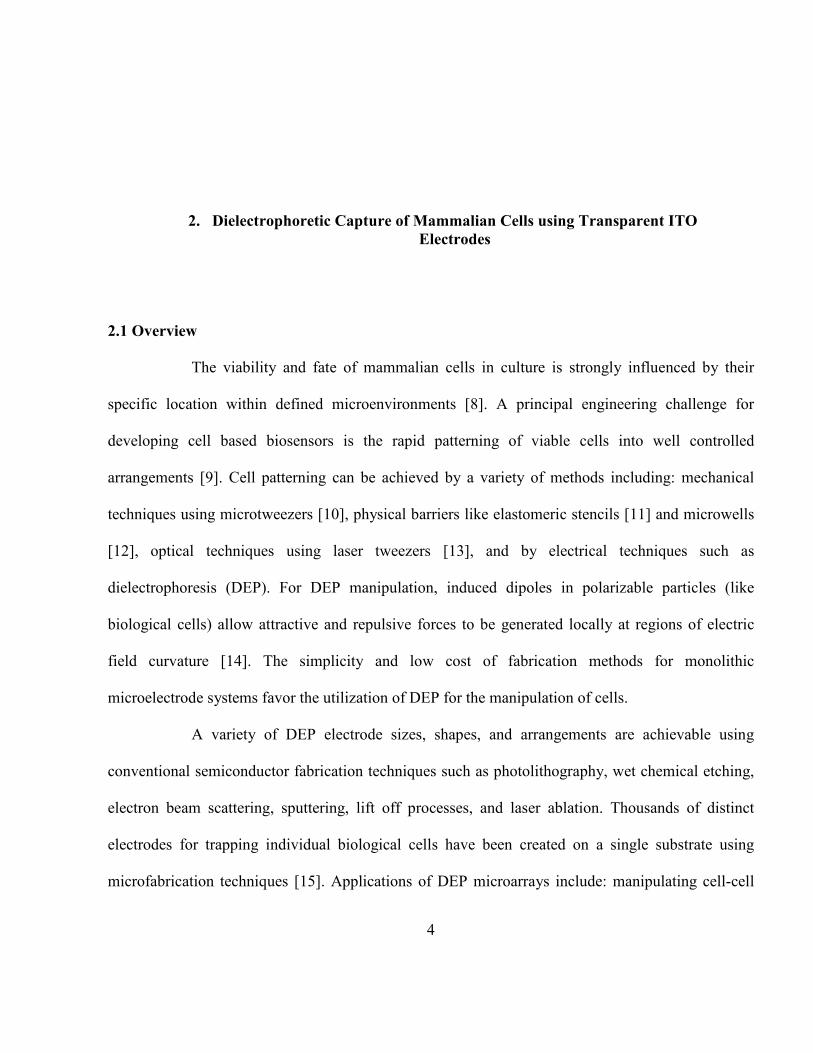
The transparent ITO electrodes were created using common semiconductor methods (Figure 1).
8
Figure 1: Fabrication of ITO microelectrode array and PDMS microchannel
Patterned ITO electrodes
SU8 mastermold of microchannel
Pattern photoresist and etch ITO
Cast PDMS, create openings
for tubing
Microchannel aligned over electrodes, electrical and fluidic connection
Glass
Photomask
PDMS with microchannel
ITO electrodes in microchannel for DEP trapping
Syringe Pump
AC Signal Generator
Photoresist coated ITO

9
An ITO coated glass slide was washed with acetone (5 minutes) and methanol (5 minutes), rinsed
with deionized water, and dried (175 °C for 30 minutes). A spin coater (Laurell, North Wales, PA)
was used to deposit HMDS (3000 rpm for 10s) and a positive photoresist (Shipley S1813, 4500rpm
for 40s), and the photoresist solvent was baked (115 °C for 1 minute) to improve adhesion. The slide
was exposed (hard contact, 150 mJ/cm2) using a Karl SUSS MA8 mask aligner which transferred
the mask pattern to the photoresist. The wafer was immersed in developer solution (MF CD 26-A,
Shipley Corporation) for 1 min 50s to uniformly remove the exposed photoresist. The revealed ITO
was acid-etched by two different procedures: immersion in an aqueous solution of 20%
Hydrochloric acid, 5% Nitric acid, plus a few drops of surfactant (Triton X-100, to promote wetting
the ITO surface) for 20 minutes (recommended by the ITO supplier); and immersion in 9M
Hydrochloric acid solution for 4 minutes. Both procedures produced good results, and the latter
process was adopted because it was faster. Following the removal of unwanted ITO, the remaining
photoresist was stripped (20 minute acetone wash), and the patterned ITO electrodes were visually
inspected to confirm well defined structures. A passivation layer of Si3N4 (1000 Å) was uniformly
deposited over the ITO electrodes by a PE-CVD (Unaxis 790, OC Oerlikon AG, St. Petersburg, FL)
process. Electrical connection to the monolithic ITO electrodes was made using wire leads attached
with conductive silver epoxy (cured at 150 °C for 90 minutes).
The microchannel fabrication process is shown in figure 1. A mold of the microchannel
was created using photolithography of SU-8 epoxy-polymer. 50 ml of PDMS prepolymer was mixed
with 5 ml of curing agent and degassed in a desiccator chamber for 1 hour. The mixture was then
cast over the SU-8 mold and cured for 1 hour at 100 °C. The resulting microchannel was removed
from the mold and aligned over the ITO microelectrodes by hand. Two openings through the PDMS
10
to the microchannel were created using syringe needles (25G, BD, Franklin Lakes, NJ) on either side
of the electrode structure, allowing tubing to be inserted directly for solution delivery.
2.2.3 Cell Culture
NIH3T3 cells were maintained as described previously [30] and passaged every 3-4
days. Prior to DEP experiments, cells were removed from tissue culture polystyrene flasks by
trypsinization. Suspended cells were centrifuged (1000 rpm, 5 °C, 5 minutes) to remove the
supernatant growth media and resuspended (750,000 cells/ml) in an isotonic sucrose solution (320
mMolar) for introduction into the microfluidic DEP device. Sedimentation of cells prior to
introduction led to lower than expected cell densities (~100,000 cells/ml) within the microfluidic
system.
2.2.4 Microscopic and Flow Methods
The assembled DEP microfluidic device was placed on a Zeiss inverted microscope
(Zeiss Axiovert 200, Zeiss Corp. Thornwood, NY) equipped with a 3-CCD camera (COHU 1100,
Alacron, Nashua, NH). Images were acquired using either phase contrast, a common technique for
observing biological samples, or fluorescence microscopy. Cell delivery through the microfluidic
system was accomplished by loading the cell solution into a 1 cc syringe (BD, Franklin Lakes, NJ)
connected to tubing (360µm OD PEEK™, Upchurch Scientific, Oak Harbor, WA) using a Luer
connector (BD, Franklin Lakes, NJ). The free end of the tubing was inserted directly into the
previously created opening in the PDMS microchannel. The volumetric flow rate of the cell
suspension into the microchannel was controlled using a syringe pump (Harvard Scientific PHD
22/2000, Holliston, MA).
11
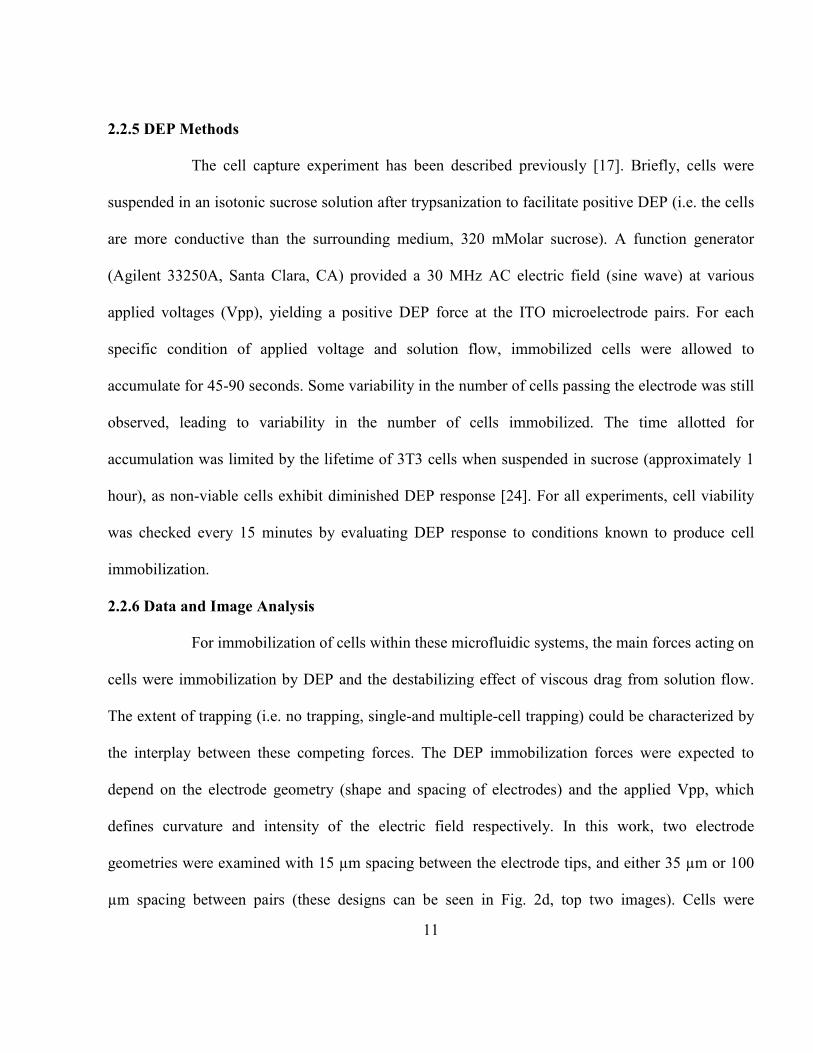
2.2.5 DEP Methods
The cell capture experiment has been described previously [17]. Briefly, cells were
suspended in an isotonic sucrose solution after trypsanization to facilitate positive DEP (i.e. the cells
are more conductive than the surrounding medium, 320 mMolar sucrose). A function generator
(Agilent 33250A, Santa Clara, CA) provided a 30 MHz AC electric field (sine wave) at various
applied voltages (Vpp), yielding a positive DEP force at the ITO microelectrode pairs. For each
specific condition of applied voltage and solution flow, immobilized cells were allowed to
accumulate for 45-90 seconds. Some variability in the number of cells passing the electrode was still
observed, leading to variability in the number of cells immobilized. The time allotted for
accumulation was limited by the lifetime of 3T3 cells when suspended in sucrose (approximately 1
hour), as non-viable cells exhibit diminished DEP response [24]. For all experiments, cell viability
was checked every 15 minutes by evaluating DEP response to conditions known to produce cell
immobilization.
2.2.6 Data and Image Analysis
For immobilization of cells within these microfluidic systems, the main forces acting on
cells were immobilization by DEP and the destabilizing effect of viscous drag from solution flow.
The extent of trapping (i.e. no trapping, single-and multiple-cell trapping) could be characterized by
the interplay between these competing forces. The DEP immobilization forces were expected to
depend on the electrode geometry (shape and spacing of electrodes) and the applied Vpp, which
defines curvature and intensity of the electric field respectively. In this work, two electrode
geometries were examined with 15 µm spacing between the electrode tips, and either 35 µm or 100
µm spacing between pairs (these designs can be seen in Fig. 2d, top two images). Cells were
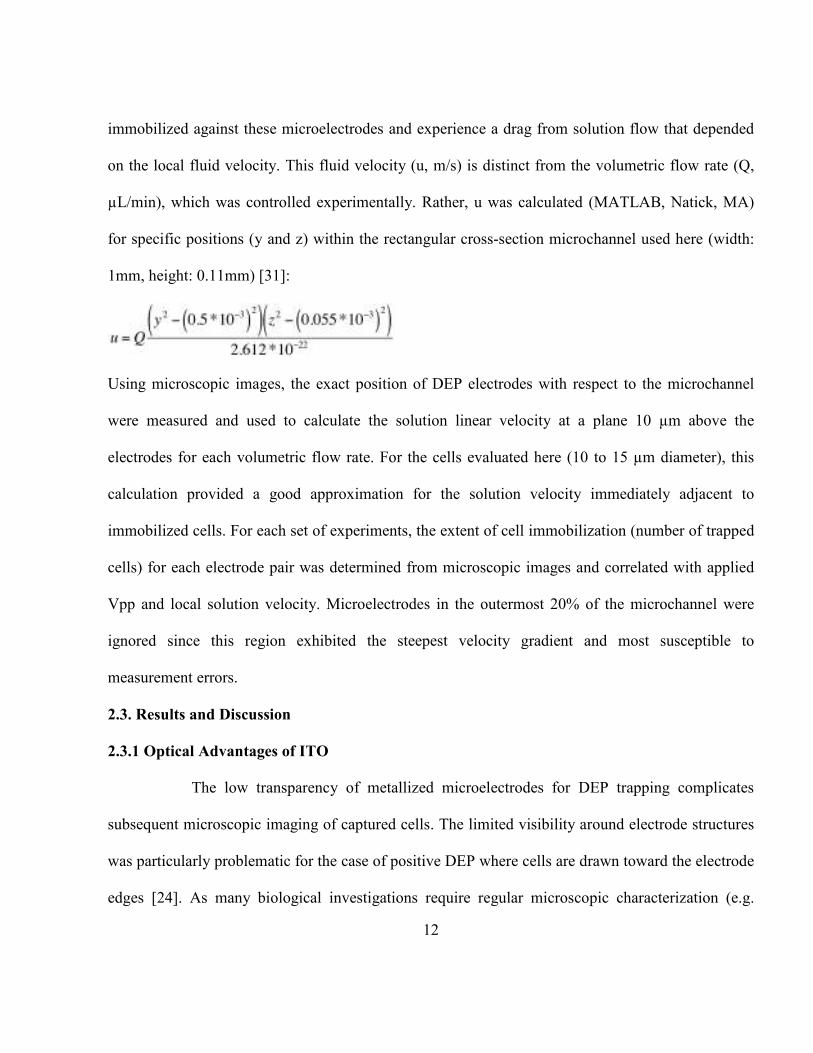
12
immobilized against these microelectrodes and experience a drag from solution flow that depended
on the local fluid velocity. This fluid velocity (u, m/s) is distinct from the volumetric flow rate (Q,
µL/min), which was controlled experimentally. Rather, u was calculated (MATLAB, Natick, MA)
for specific positions (y and z) within the rectangular cross-section microchannel used here (width:
1mm, height: 0.11mm) [31]:
Using microscopic images, the exact position of DEP electrodes with respect to the microchannel
were measured and used to calculate the solution linear velocity at a plane 10 µm above the
electrodes for each volumetric flow rate. For the cells evaluated here (10 to 15 µm diameter), this
calculation provided a good approximation for the solution velocity immediately adjacent to
immobilized cells. For each set of experiments, the extent of cell immobilization (number of trapped
cells) for each electrode pair was determined from microscopic images and correlated with applied
Vpp and local solution velocity. Microelectrodes in the outermost 20% of the microchannel were
ignored since this region exhibited the steepest velocity gradient and most susceptible to
measurement errors.
2.3. Results and Discussion
2.3.1 Optical Advantages of ITO
The low transparency of metallized microelectrodes for DEP trapping complicates
subsequent microscopic imaging of captured cells. The limited visibility around electrode structures
was particularly problematic for the case of positive DEP where cells are drawn toward the electrode
edges [24]. As many biological investigations require regular microscopic characterization (e.g.

13
phase-contrast microscopy), compromised imaging capability limited the integration of DEP
trapping with common cell-based assays [17]. Indium tin oxide is a transparent conductor that has
been used previously in electronic and DEP applications [23]. When monolithic DEP
microelectrodes fabricated from Au and ITO were compared under identical phase-contrast
microscopy conditions, the Au microelectrodes significantly obscured the field of view while the
ITO microelectrodes provided minimal distortions (Figure 2a and 2b).
14
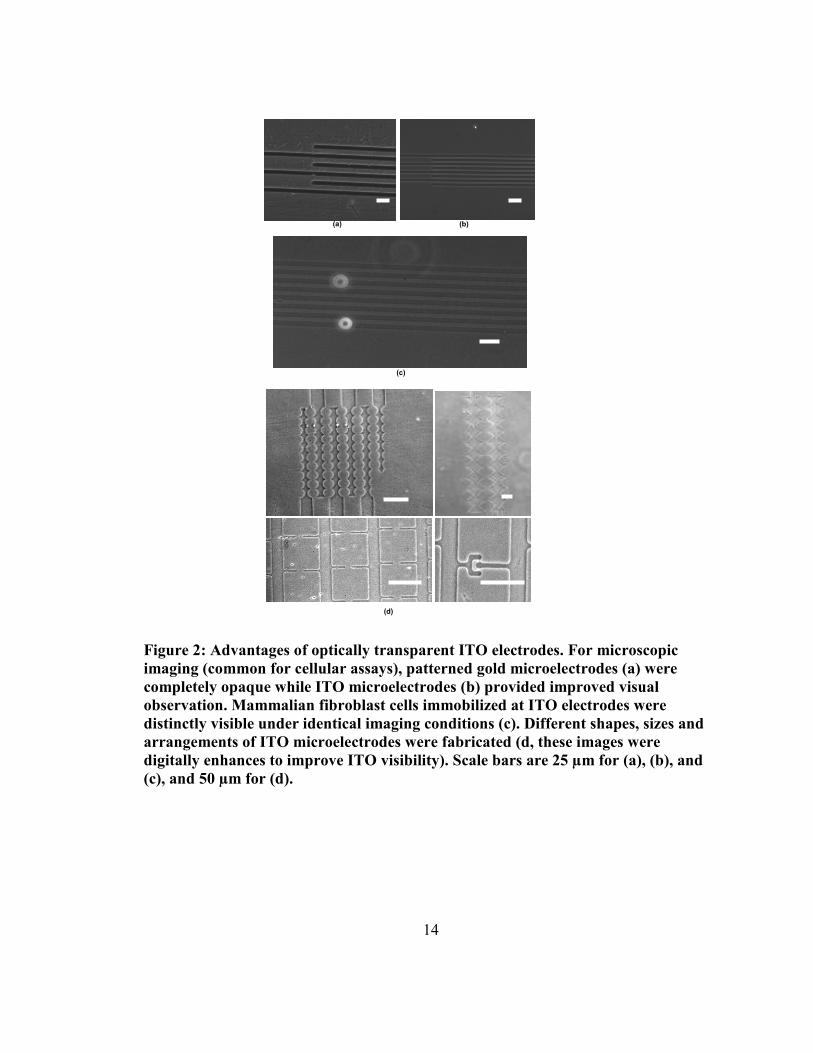
Figure 2: Advantages of optically transparent ITO electrodes. For microscopic
imaging (common for cellular assays), patterned gold microelectrodes (a) were
completely opaque while ITO microelectrodes (b) provided improved visual
observation. Mammalian fibroblast cells immobilized at ITO electrodes were
distinctly visible under identical imaging conditions (c). Different shapes, sizes and
arrangements of ITO microelectrodes were fabricated (d, these images were
digitally enhances to improve ITO visibility). Scale bars are 25 µm for (a), (b), and
(c), and 50 µm for (d).
20 µm
(d)
(a) (b)
(c)
15
When imaged using phase contrast optics, the ITO structures appeared slightly phase-dark with
a faint halo. During DEP immobilization of mammalian cells on ITO microelectrode arrays,
suspended and immobilized cells appeared phase bright, and were readily observed microscopically
(Figure 2c). This represented a significant improvement over previous efforts using Au electrodes
[24]. The simple fabrication methodology employed in this work allowed straightforward fabrication
of a variety of ITO microelectrode shapes, sizes and arrangements (Figure 2d). The particular
designs investigated here were devised to generate regions of electric field curvature between
microelectrode pairs (DEP traps) that were similar in size to individual mammalian cells in
suspension (10 – 15 µm diameter). The application of these structures for trapping individual cells or
small cell clusters is discussed subsequently.
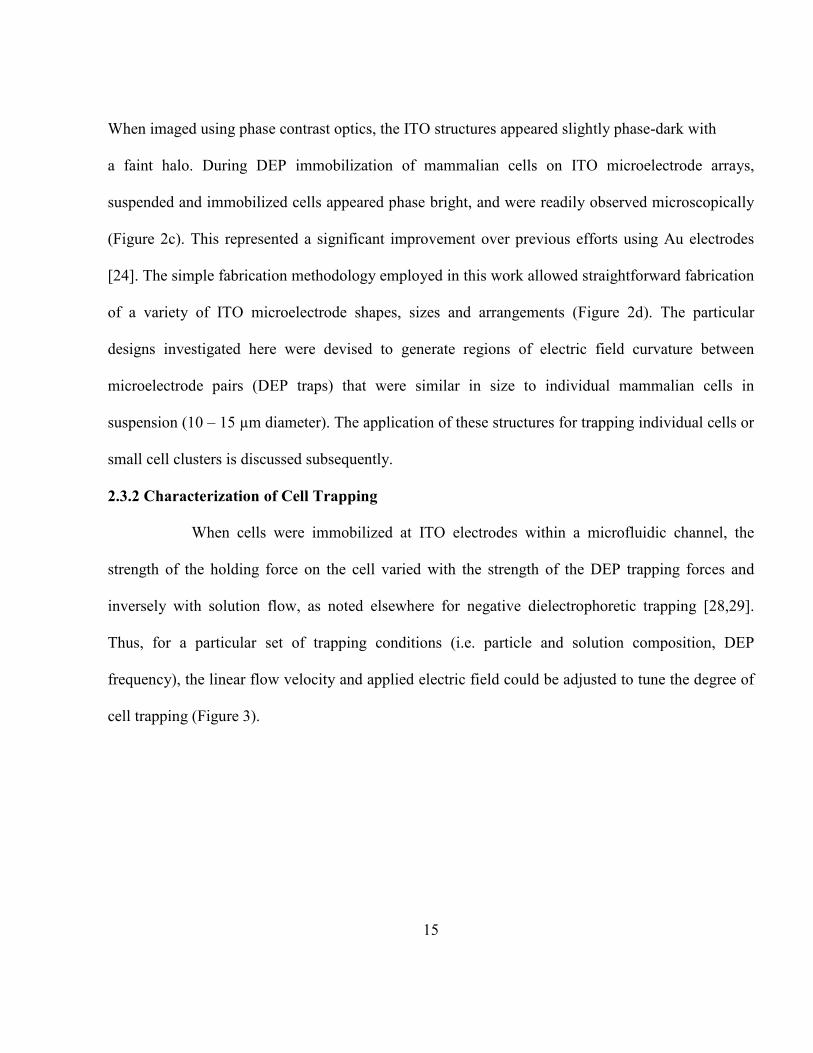
2.3.2 Characterization of Cell Trapping
When cells were immobilized at ITO electrodes within a microfluidic channel, the
strength of the holding force on the cell varied with the strength of the DEP trapping forces and
inversely with solution flow, as noted elsewhere for negative dielectrophoretic trapping [28,29].
Thus, for a particular set of trapping conditions (i.e. particle and solution composition, DEP
frequency), the linear flow velocity and applied electric field could be adjusted to tune the degree of
cell trapping (Figure 3).

16
Figure 3: Cellular immobilization by DEP within microfluidic systems. Under conditions of
high flow rates (4 µL/min) and low applied voltage (2 Vpp), no cell immobilization was
observed in the microfluidic channel (a). Low flow rates (2µL/min) and high applied voltage (6
Vpp) gave rise to multiple-cell trapping at each electrode pair (b). When flow rate and DEP
voltage (1 µL/min, and 3 Vpp, respectively) were balanced, predominately single cell trapping
was observed (c). Simultaneous single-and multiple-cell trapping was observed for different
solution velocities (indicated in mm/s) at different electrode positions for 2µL/min solution flow
and 3 Vpp applied voltage (d). Scale bars were 200 µm for all panels
(b) (a)
Channel
Walls
(c)
(d)
Flow
Profile
0.19
0.2
0.19
0.17
0.13
17
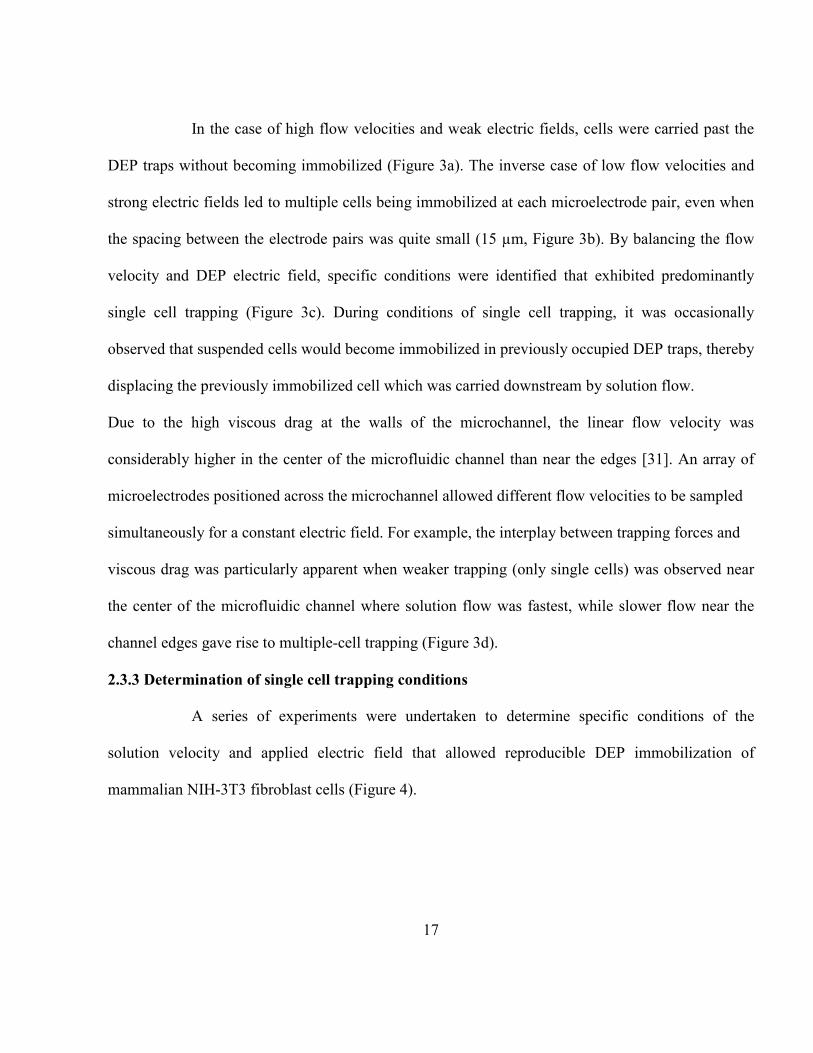
In the case of high flow velocities and weak electric fields, cells were carried past the
DEP traps without becoming immobilized (Figure 3a). The inverse case of low flow velocities and
strong electric fields led to multiple cells being immobilized at each microelectrode pair, even when
the spacing between the electrode pairs was quite small (15 µm, Figure 3b). By balancing the flow
velocity and DEP electric field, specific conditions were identified that exhibited predominantly
single cell trapping (Figure 3c). During conditions of single cell trapping, it was occasionally
observed that suspended cells would become immobilized in previously occupied DEP traps, thereby
displacing the previously immobilized cell which was carried downstream by solution flow.
Due to the high viscous drag at the walls of the microchannel, the linear flow velocity was
considerably higher in the center of the microfluidic channel than near the edges [31]. An array of
microelectrodes positioned across the microchannel allowed different flow velocities to be sampled
simultaneously for a constant electric field. For example, the interplay between trapping forces and
viscous drag was particularly apparent when weaker trapping (only single cells) was observed near
the center of the microfluidic channel where solution flow was fastest, while slower flow near the
channel edges gave rise to multiple-cell trapping (Figure 3d).
2.3.3 Determination of single cell trapping conditions
A series of experiments were undertaken to determine specific conditions of the
solution velocity and applied electric field that allowed reproducible DEP immobilization of
mammalian NIH-3T3 fibroblast cells (Figure 4).

18
0 1 2 3 4 5 6 7
(a)
Flow Velocity (mm/s)
Average number of cells
immobilized
0 0.05 0.1 0.15 0.2 0.25 0.3 0.35 0.4 0.45 0.5
0.5
0.4
0.3
0.2
0.1
Average number of cells im
mobilized
No cells
Multiple cell
Single cell
Vpp2 (V2)
(b)
Flow Velocity (mm/s)
4
3
2
1
0
4 9 16 25 36 49 64
2 Vpp
3 Vpp
5 Vpp
8 Vpp
0 1 2 3 4 5 6 7
(a)
Flow Velocity (mm/s)
Average number of cells
immobilized
0 0.05 0.1 0.15 0.2 0.25 0.3 0.35 0.4 0.45 0.5
0.5
0.4
0.3
0.2
0.1
Average number of cells im
mobilized
No cells
Multiple cell
Single cell
Vpp2 (V2)
(b)
Flow Velocity (mm/s)
4
3
2
1
0
4 9 16 25 36 49 64
0.5
0.4
0.3
0.2
0.1
Average number of cells im
mobilized
No cells
Multiple cell
Single cell
Vpp2 (V2)
(b)
Flow Velocity (mm/s)
4
3
2
1
0
4 9 16 25 36 49 64
2 Vpp
3 Vpp
5 Vpp
8 Vpp
Figure 4: Cellular immobilization was tuned using flow velocity and applied voltage.
The average number of immobilized cells is plotted as a function of calculated flow
velocity for 4 distinct applied voltages (a). Each data point represents the average of
2-16 replicates with the standard deviation indicated as vertical error bars; error in
calculating flow velocity was 10% (estimated, horizontal error bars). A false color
plot of the mean number of cells immobilized per DEP trap versus flow velocity and
electric field indicated sets of conditions exhibiting similar extents of cellular
immobilization (b). Diamonds in (b) indicate experimental data with linear
approximation of the surface values between known data points.
19
The position of each ITO electrode pair within the microchannel was measured from
microscopic images, allowing a linear flow velocity to be calculated for each DEP trap. The number
of cells immobilized during DEP trapping was correlated with the calculated flow velocity and the
applied electric field. At all electric field strengths, the effect of drag from solution flow was evident
in the significant decrease in the number of immobilized cells per DEP trap that was observed with
increasing solution velocity (Figure 4a). For each applied voltage, the flow rate could be adjusted to
yield predominantly single-cell trapping (e.g. 0.0002 m/s at 5 Vpp). The importance of applied
electric field strength was evident in the separation between traces in Figure 4a.
When the average number of immobilized cells was plotted in false color against Vpp2
and flow velocity, the transitions between no-cell, single-cell, and multiple-cell immobilization were
apparent (Figure 4b). Within the variance of the experimental data, the expected trade-off between
Vpp2 and flow velocity was observed. Thus, increases in Vpp2 were offset by increases in flow rate
to yield similar extents of cellular immobilization. The most significant source of variance in the
data arose from local variations in cell density during DEP immobilization and from the limited time
(45 – 90 seconds) available at each set of conditions. Nevertheless, for all conditions where the mean
number of trapped cells per electrode pair was between 0.75 and 1.25 cells, single cell trapping was
observed for 67% of all cases.
2.3.4 Fluorescence Microscopy of Cells Immobilized on ITO Electrodes
Following cellular immobilization by DEP, it was important to verify that immobilized
cells remained viable even in the presence of the significant AC electric fields. A common
fluorescent assay for cellular viability was performed for immobilized 3T3 cells at ITO
microelectrodes. When the fluorescent responses of calcein (494 excitation, 517 nm emission,

20
indicative of viable cells) and ethidium homodimer-1 (577nm excitation, 595nm emission, indicative
of nonviable cells) were measured, no background emission or absorption by the ITO structures was
observed (Figure 5).
Figure 5: Phase contrast and fluorescence microscopy of immobilized cells. Cells stained in a
conventional viability assay were immobilized by DEP using transparent ITO electrodes. The
green fluorescence (shown, indicating cell viability) was clearly visible for all immobilized cell
with negligible red fluorescence (not shown, indicating nonviable cells). No interference from
the ITO was observed for either phase or fluorescence images.

21
All of the cells immobilized by DEP were found to be viable, supporting previous
indications that only viable cells with good membrane integrity can be immobilized by DEP [24].

22
3. Silicon-based Microarray Substrates for Clinical Proteomics
3.1 Overview
3.1.1 From Genomics to Proteomics
We are now facing a post-genomics era as the human genome has been mapped and sequenced
[32]. A rapidly developing discipline, Clinical Proteomics, has emerged which takes as its focus the
large scale study of proteins and the proteome (the entire set of proteins found in a particular cell
type) from tissues of clinical importance. Clinical Proteomics is a complex field for several reasons.
Firstly, the level of gene transcription provides an imprecise measurement of protein levels and gives
only a vague idea about gene expression. While a large amount of messenger ribonucleic acid
(mRNA) may be produced, inefficient translation or degradation may result in minimal protein
production. Secondly, many proteins experience posttranslational modifications like phosphorylation
which will alter their effects considerably, and it is the ratio of these modified forms that is important
to the cell state. Thirdly, studying individual polypeptides may not give us an idea about cellular
function, since many polypeptides form large complexes that direct the activity, and one protein may
participate in more than one type of complex. The function of the polypeptide will only be relevant
with respect to these complexes. Thus, the proteome is not a constant entity like the genome, and is
even more variable than the transcripotome. Clinical proteomics will help in unraveling knowledge

23
about the structure of the proteins in the proteome and the functional interactions between the
proteins.
Clinical Proteomics is tasked with generating tools that allow low abundance, disease-specific
protein targets to be measured in actual patient specimens, with high accuracy. In particular, protein
micro-arrays are one class of high throughput assay being used to study molecular derangements in
patient tissues. With this approach, known protein targets are probed using validated antibodies that
detect the presence and relative abundance of isoform-specific variants of key molecules which can
act as response indicators. The standardization and clinical validation of this technology will be an
essential step in bringing personalized medicine into everyday clinical practice.
Protein modeling and profiling can help in the understanding of many major diseases and can
provide targets for drug development. In drug development, understanding the evolving states of a
disease is very important, such that only disease processes are affected and not those essential to
patient survival. To obtain this information, analytical tools that can characterize and monitor key
targets both qualitatively and quantitatively are required. Biological material, especially human
biological material, is essential in order to understand the molecular effects of both diseases and the
drugs which can cure these diseases. However, human clinical samples present unique challenges for
proteomics studies relative to experimental systems. Individual genotype information and detailed
history are usually not available, which affect the analyte profile and abundance, while variations in
sample size are inherent in biopsy processes; thus these types of samples require a very efficient
strategy for proteomic analysis, more so if modified subfractions are to be analyzed. Thus, reverse
phase protein micro-arrays have been developed in order to meet the demands presented by the
limited amounts of material present in clinical specimens. These microarrays interrogate
24
immobilized proteins, the basic concept for which was developed early as 40 years ago [33]. An
application for this format is to take proteins extracted from micro-dissected cells and directly
immobilize them onto an array substrate. The protein analytes are then probed using an antibody that
has been validated as specific for a target protein.
3.1.2 Minaturization to Micro Level Proteomics
As explained above, the demands for lowered detection levels are ever increasing. Therefore,
miniaturization in concert with improved assay platforms to provide systems that can analyze and
detect proteins will overcome many of the problems seen in the beginning stages of this field.
Existing platforms require some manual procedures and have slow assay protocols were used, which
lead to longer processing times. Robotics for automated procedures will lead to faster (and more
reproducible) processing speeds which is important for performing studies like drug mechanism of
action. Immobilizing the substrate and studying the variations in modification ratios of proteins that
bind to it in a flow system will lead to faster processing speeds. Another major importance of faster
processing speeds is to allow the throughput needed for studies examining the side effects of drugs,
in order to produce results more rapidly [34]. Smaller sizes mean faster processing speeds; faster
processing speeds help us perform studies on side effects of drugs faster. A major advantage of
silicon based microstructure technology is the feasibility of easy batch processing, which can lead to
lower manufacturing costs. The fabricated silicon structures are also highly reproducible and can
possess high mechanical strengths after fabrication [35].
Another major importance of silicon micro fabrication is the possibility of machining of very
small biological identification systems. Sample amounts in biological research fields are often small
and it is desired that the identification system consumes minimal sample volumes. Therefore, mass

25
spectrometry has evolved as a widely used analytical method in recent years due to this reason [36-
40]. Thus, the protein microarray – which consumes a small sample amount – is the next step which
can measure the amount of specific protein directly and accurately.
3.1.3 Microarray Substrates
In order for a substrate to be an effective micro-array surface, it must have high binding
properties for proteins. It is asserted that ‘microspot’ assays that rely on immobilization of
interacting elements on a few square microns should be capable of detecting analytes with higher
sensitivity compared to conventional macro level immunoassays (ambient analyte model of Elkins et
al. [41-42]). This principle will be applied in this project in which proteins are immobilized in an
array of solid support and are detected by specific antibodies. These arrays can be used to
characterize enzymes [43-44], to improve our knowledge of gene function [45-46], and to
distinguish antibody specificity [47-48]. These microarrays also help us examine how dense the
microspot assay can be packed. If the microspot assay is densely packed in flat microarrays, the
probes used are too close to allow the transcripts to diffuse in. With the microarray pyramid
technology, space between the pyramids will allow us ample space for the transcripts to diffuse in
while allowing densely packed microspot assays.
There are many types of microarray supports that are presently available:
1. Filters and membranes (e.g., nitrocellulose or PVDF): They are readily derived for
covalent attachment [49-50]. These solid supports are low cost and reusable. However, these
filters and membranes have some disadvantages. They allow only a limited spot density as
each sample tends to spread out. Nitrocellulose also possesses intrinsic autofluorescence which
can lead to blurred results when imaging.

26
2. Derivatized glass substrates: These are compatible with most commercial microarrayers
and are low cost and readily derivatized for covalent attachment [51]. Unfortunately, they
could introduce concentration effects. One common effect seen is nonuniform spot intensity
profiles caused by localized aggregation on the spot. Another nonuniform profile seen is the
well known “coffee stain effect” (dried ring).
3. Gel pads and agarose film: They provide reduced evaporation rate from the surface and
high sample capacity, and no protein modifications are required [52]. However, these
substrates are hard to fabricate and thus are not available commercially.
4. Porous Silicon Substrates: This is another support for localized immobilization of proteins.
Porous silicon has an increased surface area compared to merely roughened silicon. However,
when chemically modified porous silicon substrates were spotted with a heterogeneous mixture
of proteins (lysates derived from cellular lysates), a large spreading of the spots through the
substrate was observed. This was due to the combination of the physicochemical modification
of the silicon and the surface tension properties of the cellular lysates [53].
As mentioned above, numerous substrates have been used as micro-array
substrates. All of these substrates have inherent disadvantages. For this reason, other
substrates are being investigated that have low intrinsic autofluoresence and high protein
binding properties.
In this project, “designer surfaces” composed of silicon have been developed which
provides us all the advantages of the existing microarray technologies and eliminates most if
not all of their disadvantages. The surface chemistry of the microarray substrate is a key factor
in deciding the functioning and quality of the microarray [54-57].

27
3.1.4 Silicon Microstructures
For microarray structures, the substrate surface must possess low intrinsic signal for the
reporter/detection system. It is shown that silicon can be used as a microarray substrate [58-60].
Silicon, which can be physicochemically modified, has very low intrinsic autofluorescence when
compared with nitrocellulose. On the other hand, native silicon has very low protein binding
properties. Through a combination of targeted surface roughening using lithographic patterning and
chemical surface coatings, “designer surfaces” have been created which will improve native silicon’s
protein binding properties. The extent of protein binding amongst the various designer surfaces has
been investigated.
3.1.5 Project Goals
The goal of this research program is to generate new protein micro-array surfaces using silicon.
This approach provides flexibility of using well developed silicon based photolithography for
creating array surfaces with tailored interactive properties. For example, photolithography was used
to create zones, or sectors, within the array surfaces. These sectors were be probed with distinct
antibodies, enabling considerably more information to be gleaned from a single slide. Even though
silicon has low protein binding properties, it is easy to change the surface properties of silicon by
forming a silicon dioxide, silicon nitride, oxynitride, or other dielectric layers. The efficiency of
protein binding was compared between the various dielectric and chemical layers and native silicon.
3.2 Materials and Methods
3.2.1 Silicon Microstructure Fabrication
In this project, the surface of a silicon wafer was patterned to create several microarray
substrates each having multiple number of patterned sectors with designer surfaces. The size of each
28
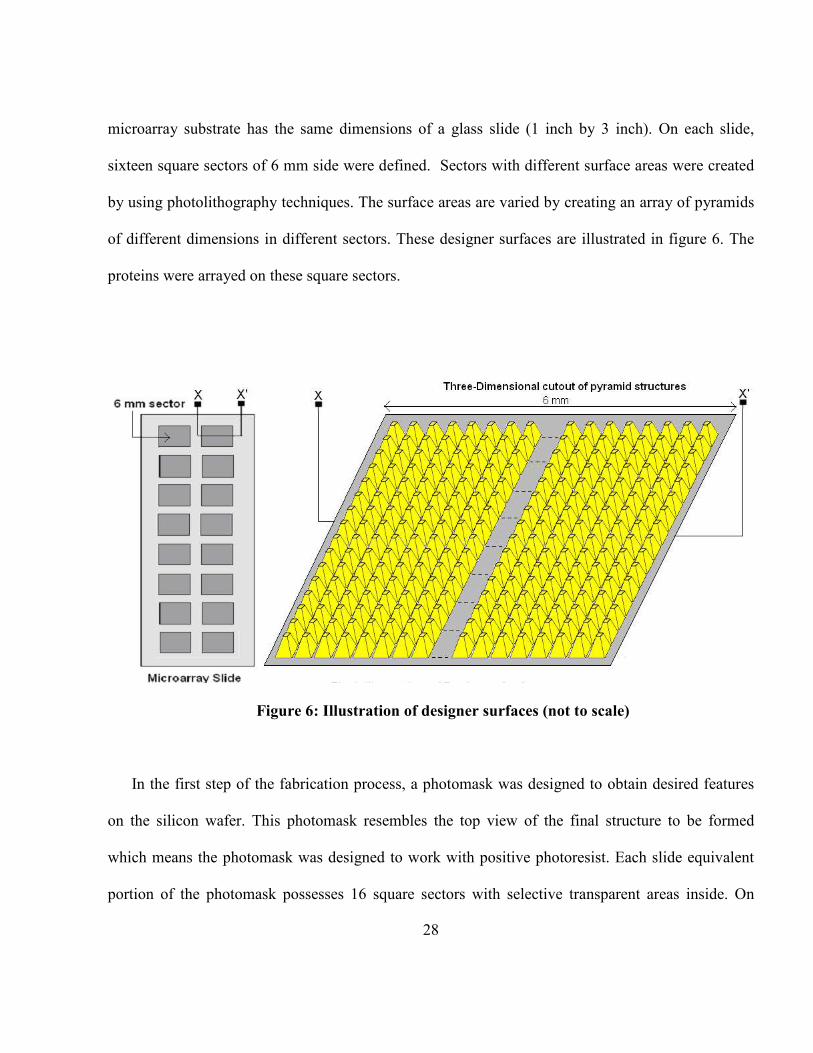
microarray substrate has the same dimensions of a glass slide (1 inch by 3 inch). On each slide,
sixteen square sectors of 6 mm side were defined. Sectors with different surface areas were created
by using photolithography techniques. The surface areas are varied by creating an array of pyramids
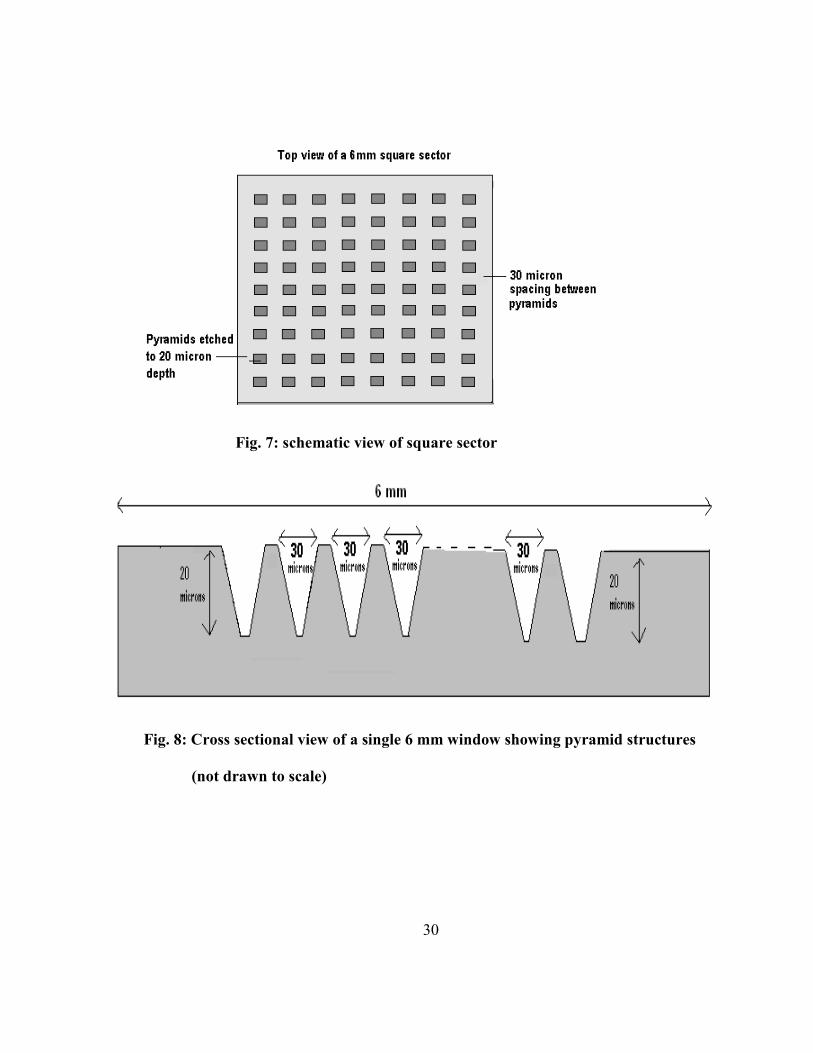
of different dimensions in different sectors. These designer surfaces are illustrated in figure 6. The
proteins were arrayed on these square sectors.
Figure 6: Illustration of designer surfaces (not to scale)
In the first step of the fabrication process, a photomask was designed to obtain desired features
on the silicon wafer. This photomask resembles the top view of the final structure to be formed
which means the photomask was designed to work with positive photoresist. Each slide equivalent
portion of the photomask possesses 16 square sectors with selective transparent areas inside. On

29
each sector, small dark squares were arrayed which represents the top surface of pyramids in that
sector. Initially, two different sizes for the top surface of the pyramids were considered. These are 25
microns and 10 microns. The efficiency of the protein arraying was compared between these two
different dimensions. The spacing between squares (top surfaces of the pyramids) is 30 µm in each
case. This spacing is selected to accommodate slanted sidewall portions of the pyramids having a 20
µm height.
30
Fig. 7: schematic view of square sector
Fig. 8: Cross sectional view of a single 6 mm window showing pyramid structures
(not drawn to scale)

31
Once the photomask is designed, approximately 2,000 Ǻ of masking oxide was deposited on
the silicon surface using Plasma Enhanced Chemical Vapor Deposition (PECVD). Thermally grown
oxide can also be used instead of a deposited oxide. A layer of positive photoresist was then spun on
the wafer. Using a mask aligner system in which the photomask is positioned on top of the silicon
dioxide layer, selective areas on the photoresist layer were exposed to ultraviolet light. These areas
are the sector areas on the photomask. After this step, the silicon wafer was immersed in MF-319
developer solution. The areas of the photoresist, which were exposed to ultraviolet light, were then
removed.
Selective etching of the silicon dioxide layer was then performed. When the silicon wafer was
immersed in BOE (Buffered Oxide Etch, silicon dioxide etching agent), the silicon dioxide regions
not protected by the photoresist was etched away and the silicon surface was exposed. Then, the
protective photoresist layer was removed by soaking in acetone.
The silicon dioxide layer now acts as the mask for the next etching step. Wet chemical etching
of silicon was performed using Tetramethyl Ammonium Hydroxide (TMAH). As etching with
TMAH results in anisotropic patterns, pyramids with side walls at an angle of 54.7° was obtained.
The etch depth was monitored by a stylus profilometer. Once wet etching is completed and the
necessary pyramids are formed, the silicon dioxide masking layer was removed using the BOE
solution. After this step, the silicon wafer was diced into 1 inch by 3 inch slides which were loaded
into the micro-assayer system. The final device is illustrated as in Figure 9. Each sector will have
pyramids of one of the two top surface dimensions, 10 µm and 25 µm.

32
Fig. 9: Final device for biological use
3.2.2 Dielectric Film Deposition
The final device illustrated in Fig. 4 is made of native silicon, which has poor protein binding
properties. Thus, dielectric films were deposited on the final device to potentially improve the
protein binding properties of our microarray substrate. Two dielectric layers are considered in this
work.
1) Silicon Dioxide: Approximately 200 Ǻ of silicon dioxide was thermally grown in a
furnace. Wet Oxidation was used as the oxide grown by this technique is more porous than
oxide grown in a dry oxidation furnace.
2) Silicon Nitride: Approximately 200 Ǻ of silicon nitride will be deposited using a Plasma
Enhanced Chemical Vapor Deposition (PECVD) system.
The effect of increasing dielectric layer thickness on the protein binding properties of the
microarray was then studied.
3.2.3 Application of Chemical Surface Coatings
The main objective of protein and antibody microarray technology is to improve our
understanding of interaction partners. The presence of optimal specific binding conditions is an
33
important feature of microarray support. Early coatings used for this purpose include PVDF
(polyvinyllidene fluoride), which was a support material for high-density protein microarrays [37].
However, it was soon discovered that even higher densities and decreased sample consumption and
quantification are required. A crucial requirement in achieving this goal is to maintain high binding
capacity of proteins with low variability and low background noise. Thus, surface coatings are
required even for the designer silicon surfaces to improve the native protein binding properties of
silicon. Initially, in this project, the chemical surface coatings initially considered was 3-
metcaptopropyltrimethoxysilane (MPTMS). This chemical was chosen as it was shown that it
improves the native binding properties of plasma roughened silicon to levels better than that of
nitrocellulose coated glass slides [29].
To apply the surface coatings, the silicon slide will be immersed overnight in a solution of
MPTMS and isopropyl alcohol. Then, the slides were removed over a filter paper and dried in
vacuum using a desiccator system. The silicon microarray slides are now ready for analysis.
3.2.4 Microarray Testing Procedure
The microarray testing was performed in the Center for Applied Proteomics and
Molecular Medicine (CAPMM) in George Mason University. Initially, proteins were extracted
from cells obtained from patient biopsies (figure 10).

34
Figure 10: Steps leading from biopsies to microarray testing
Reverse Phase Protein Microarray (RPA) testing format was used to test the silicon based
protein microarrays. This procedure was chosen as RPA can profile patient biopsies in a high
throughput manner [34]. In this format, each array was incubated with one detection protein
(e.g. antibody), and a single analyte endpoint was measured and directly compared across
multiple samples (figure 11).

35
Fig. 11: Schematic of a reverse phase microarray. A substrate like nitrocellulose is
coated with a heterogeneous mixture of analytes, such as proteins extracted from
tumor cells. The analytes are probed using a primary antibody. A biotinylated
secondary antibody is used to detect the bound primary antibody.
The RPA format enables extremely sensitive detection, with detection levels approaching
miniscule amounts of a given analyte when used with extrinsic amplification systems. One of
the PIs (Liotta) has extensive experience in utilizing the reverse phase system for detecting a
large number of low-abundance analytes using validated antibodies. The current antibody
repertoire encompasses over 150 validated antibodies recognizing a wide variety of disease-
related analytes, including post-translationally modified signaling proteins. Published data
using this experimental platform demonstrates that reverse phase capture can be applied to
numerous disease states in order to provide insight into how proteins contribute to disease

36
states [61–69]. Initially, tissue specimens were frozen in liquid nitrogen at the time of
collection. The specimens were sectioned by cryostat, then stained and treated with
phosphatase and kinase inhibitors. Reverse phase protein microarrays were prepared from
cellular lysates printed onto the silicon base microarray slides stained with a pre-validated
selection of phospho-specific antibodies, and analyzed using imaging software. The protein
binding accuracy and sensitivity of the silicon-based microarrays will be compared amongst
the different dielectric coatings (oxide/nitride) and chemical coatings. The various types of
silicon-based microarrays that were tested are shown in Fig. 12
.
Figure 13: Different Types of silicon microarrays tested

37
3.3 Results and Discussions
3.3.1 Comparison of Protein Binding amongst Dielectric Layers
Images of silicon microarrays with dielectric layers after RPA are shown in figure 13.
(a) Plain Silicon
(b) Silicon Dioxide on Silicon
(c) Silicon Nitride on Silicon
Figure 13: Silicon Microarrays with dielectric layers after RPA analysis. Note
singularly low immobilization of proteins in (b) and noise in (c)

38
For plain silicon microarrays (figure 13(a)), faint microdots are arrayed on the silicon
microstructures. This indicates that a small percentage of proteins are immobilized. This
indicates that native silicon is not a good platform for RPA analysis, as discussed earlier. For the
silicon dioxide coated silicon slide (figure 13(b)), no clear array pattern is observed. This
indicates that no proteins have been immobilized on the pyramid structures. For the silicon
nitride coated silicon slide (Figure 13(c)), clear microdot arrays are seen, indicating protein
immobilization and low background fluorescence. This indicates that silicon nitride may be a
good platform for RPA analysis. However, a significant amount of noise is seen in the image.
This could have arisen from particulates on the microarray surface.
Comparison between native silicon and dielectric layers platforms indicates that while
proteins are being immobilized through RPA analysis, clear imaging is not obtained which limits
visual observation, and thereby characterization of proteins. Therefore, chemical surface coatings
are indeed necessary as indicated in figure 14.
3.3.1 Effect of Chemical Coatings on RPA analysis
Images of various microarrays with chemical coating after RPA are shown in figure 14.

39
(a) Plain Silicon with MPTMS
(b) Silicon Oxide with MPTMS
(d) Silicon Nitride with MPTMS
Figure 14: Silicon Microarrays with dielectric layers and chemical coatings
after RPA analysis.
40
Plain silicon with MPTMS coating (figure 14(a)) exhibits much better protein
immobilization when compared to native silicon microstructures (figure 13(a)). The microdot
arrays are clearly visible and enable easy characterization of proteins. The effect of chemical
coatings is clearly indicated for the silicon oxide microarrays with MPTMS coating (figure
14(b)). The clearly visible microdot arrays shows much better protein immobilization when
compared to native silicon oxide (figure 13(b)), where no microdot arrays are visible. For silicon
nitride with MPTMS (figure 14(c)), the microdot arrays are visible with not background noise as
compared to plain silicon nitride (figure 13(c)). However, it is noticed that the microdot patterns
are more intense in the plain silicon nitride microarrays than with chemical coatings. This might
indicate that the presence of chemical coatings may introduce some background fluorescence
during RPA analysis.
It is clearly seen that the microarrays with chemical coatings indicates better response to
RPA analysis than with native silicon and dielectric layer microstructures. This collaborates with
previous findings that chemical coatings are necessary for the successful integration of silicon
microstructures and RPA analysis.

41
4. Conclusions
This work presented two fabrication methods for immobilizing separate biological
materials, specifically mammalian cells and proteins.
The ITO microelectrodes demonstrated here offer superior optical capabilities as
compared with metal electrodes and are easy to fabricate in a variety of shapes, sizes, and
arrangements. Microscopic analysis of captured cells is greatly improved for phase contrast and
fluorescent imaging. By varying the applied electric field and solution velocity within
microfluidic DEP systems, the extent of cellular immobilization could be tuned from no cells
immobilized to immobilization of small cell clusters. Conditions for immobilization of
predominantly single cells were also identified. These measurements will be useful in designing
alternate electrode or microchannel geometries that exhibit specific immobilization
characteristics.
The silicon microstructures demonstrated here offer a novel immobilization
technique for proteins. RPA analysis indicates that native silicon and dielectric layers are not
sufficient for clear characterization of immobilized proteins. The application of chemical
coatings greatly improved the images obtained from RPA analysis as compared to native silicon
and dielectric layer structures. This work will be useful in designing new silicon microarray
structures which could exhibit better response than existing nitrocellulose coated glass slides.

42
List of References

43
List of References
1. Hunter, T., Signaling--2000 and beyond. Cell 100 (1), 113-127, 2000
2. Knezevic, V., Leethanakul, C., Bischel, V.E., Worth, J.M., Prabhu, V.V., Gutkind, J.S., Liotta,
L.A., Munson, P.J., Petcoin 3rd, E.F., Krizman, D.B., Proteomics(1), 1271-1278, 2001
3. Miller, J.C., Zhou, H., Kwekel, J., Cavallo, R., Burke, J., Butler, J., The, B.S., Haab, B.B., Proteomics(3), 56-63, 2003
4. Sreekumar, A., Chinnaiyan, A.M., Biotechniques, 33, 46-53, 2002
5. Staudt, L.M., Annual Review of Medicine, 53, 303-318, 2002.
6. Lockhart, D.J., WInzeler, E.A., Nature, 405, 827-836, 2000
7. Staudt, L.M., Brown, P.O., Annual Review of Immunology, 18, 829-859, 2000
8. Chen, C. S., Mrksich, M., Huang, S., Whitesides, G. M., Ingber, D. E., Science, 1997, 276,
1425– 1428.
9. Pancrazio, J.J., Whelan, J.P., Borkholder, D.A., Ma, W., Stenger, D.A., Ann. Biomed. Eng. 1999. 27 (6), 697–711.
10. Dregelid, E., Svendsen, E., Journal of Cardiovascular Surgery, 1988, 29, 464-469.
11. Folch, A., Jo, B.H., Hurtado, O., Beebe, D. J., Tonor, M., J. Biomed. Mater. Res. 2000, 52, 346–
353.
12. Revzin, A., Tompkins, R. G., Toner, M., Langmuir, 2003, 19, 9855–9862.
13. Misawa, H., Juodkazis, S., Progress in Polymer Science, 1999, 24, 665-697.
14. Gascoyne , P. R. C., Vykoukal, J, Electrophoresis, 2002, 23, 1973-1983.
15. Gray, D. S., Tan, J. L., Voldman, J., Chen, C. S., Biosens. Bioelectron. 2004, 19, 771–780.

44
16. Kim, BG, Yun, KS, Yoon, E., 18th IEEE International Conference on Micro Electro Mechanical
Systems, 2005, 702-705. 17. Rosenthal, A., Voldman, J., Biophysical Journal, 2005, 88, 2193–2205.
18. Suehiro, J., Pethig, R., J. Phys. D: Appl. Phys., 1998, 31, 3298-3305.
19. Fuhr, G. R., Reichle, C., TrAC Trends in Analytical Chemistry, 2000, 19, 402-409.
20. Gascoyne, P. R. C., Wang, X.-B., Huang, Y., Becker, F. F., IEEE Trans. Ind. Appl 1997, 33,
670–678.
21. Talary, M. S., Mills, K. I., Hoy, T., Burnett, A. K., Pethig, R., Med. Biol. Eng. Comput. 1995, 33, 235–237.
22. Markx, G. H., Talary, M. S., Pethig, R., J. Biotechnol. 1994, 32, 29 –37.
23. Fiedler, S., Shirley, S., Schnelle, T., Fuhr, G., Anal. Chem. 1998, 70 (9), 1909 -1915.
24. Forry, S.P., Reyes, D.R., Gaitan, M., Locascio, L.E., J. Am. Chem. Soc. 2006, 128(42), 13678 -
13679.
25. Voldman, J., Toner, M., Gray, M.L., Schmidt, M.A., Journal of Electrostatics, 2003, 57(1), 69-90.
26. Manaresi, N., Romani, A., Medoro, G., IEEE Journal of Solid-State Circuits, 2003, 38(12),
2297-2305.
27. Prasad, S., Zhang, X., Yang, M., Ni, Y.C., Parpura, V., et al. J. Neurosci. Methods. 2004, 135, 79–88.
28. Voldman, J., Braff, R.A., Toner, M., Gray, M.L., Schmidt, M.A., Biophys. J. 2001, 80, 531-541.
29. Yang, J., Huang, Y., Wang, XB, Becker, F.F., Gascoyne, P.R.C., Anal. Chem. 1999, 71, 911-
918,
30. Halter, M., Tona, A., Bhadriraju, K., Plant. A.L., Elliott, J.T., Cytometry Part A, 2007, 71A, 827-834.
31. Oosterbroek, R.E., “Modeling, Design and Realization of Microfluidic Components” 1999 PhD
Thesis, University of Twente, 30-64
45
32. Little, J., Khoury, M. J., Bradley, L., Clyne, M., Gwinn, M., Lin, B., Lindegren, M., Yoon, P.,
The Human Genome Project Is Complete. How Do We Develop a Handle for the Pump? American Journal of Epidemiology, 157(8), 667-673, 2003
33. Silman, I., Katchalski, E., Water-insoluble derivatives of enzymes, antigens, and antibodies.
Annual Review Biochemistry, 35, 873-908, 1966.
34. Liotta, L.A., Espina, V., Mehta, A.I., Calvert, V., Rosenblatt, K., Geho, D., Protein microarrays: meeting analytical challenges for clinical applications, Cancer Cell, 3, 317-325, 2003
35. Manz, A., Becker, H., Microsystem Technology in Chemistry and Life Sciences. Springer
Verlag, Berlin, 1999
36. Little, D.P., Cornish, T.J., O'Donnell, M.J., Braun A., Cotter, R.J., Köster, H. MALDI on a Chip: Analysis of Arrays of Low-Femtomole to Subfemtomole Quantities of Synthetic Oligonucleotides and DNA Diagnostic Products Dispensed by a Piezoelectric Pipet. Analytical Chemistry, 69 (22), 4540 - 4546, 1997
37. Jespersen, S., Niessen, W.M.A., Tjaden Greef, U.R., Litborn, E., Lindberg, U., Roeraade, J.,
Attomole detection of proteins by matrix-assisted laser desorption/ionization mass spectrometry with the use of picoliter vials. Rapid Communication Mass Spectrometry, 8, 581, 1994
38. Ekström, S., Önnerfjord, P., Nilsson, J., Bengtsson, M., Laurell, T., Marko-Varga, G., Integrated
Microanalytical Technology Enabling Rapid and Automated Protein Identification, Analytical Chemistry, 72 (2), 286 -293, 2000
39. Miliotis, T., Kjellström, S., Nilsson, J., Laurell, T., Edholm, L.E., Marko-Varga, G., Capillary
liquid chromatography interfaced to matrix-assisted laser desorption/ionization time-of-flight mass spectrometry using an on-line coupled piezoelectric flow-through microdispenser, Journal of Mass Spectrometry, 35(3), 369-377, 2000
40. J.D. Harrison, A. van den Berg (Editors), Micro Total Analysis Systems ‘98, Kluwer, 1998
41. Elkins, R., Chu F.W., Microarrays: their origins and applications. Trends Biotechnology, 17,
217-218, 1999
42. Ekins, R., Chu, F., Biggart, E., Multispot, multianalyte, immunoassay. Annales de biologie clinique (Paris), 48, 655-666, 1990
43. Lueking, A., Horn, M., Eickhoff, H., Büssow, K., Lehrach, H., Walter, G., Protein microarray for
gene expression and antibody screening. Analytical Biochemistry, 270, 103-111, 1999

46
44. Angenendt, P., Lehrach, H., Kreutzberger, J., Glökler J., Subnanoliter enzymatic assays on
microarrays. Proteomics, 5, 420 - 425, 2005 45. Armin, K., Tanja, F., Alexandraet, P., Identification of barley CK2α targets by using the protein
microarray technology. Phytochemistry 65, 1777-1784, 2004
46. Gloker, J. and Angenendt, P. (2003) Protein and antibody microarray technology, J. Chromatogr. B Analyt. Technol. Biomed. Life Sci. 797, 229-240
47. Kersten, B., Feilner, T., Angenendt, P., Giavalisco, P., Brenner, W., Burkle, L., Proteomic
approaches in plant biology. Current Proteomics, 1, 131-144, 2004
48. Bacarese- Hamilton, T., Gray, J., Crisanti, A., Protein microarray technology for unraveling the antibody specificity repertoire against microbial proteomes. Current Opinions in Molecular Thereupeutics, 5, 278-284, 2003
49. Park S.S., Cho, S.I., Kim, M.S., Kim, Y.K., Kim, B.G., Integration of on-column immobilized
enzyme reactor in microchip electrophoresis. Electrophoresis, 24, 200-206, 2003
50. Hayashi, H., Takiguchi, K., Higashi-Fujime, S., Measurement of ATPase activity of immobilized myosin heads. J Biochem (Tokyo), 105, 875-877, 1989
51. MacBeath, G., Schreiber, S.L., Printing proteins as microarrays for high-throughput function
determination. Science, 289, 1760-1763, 2000
52. Arenkov, P., Kukhtin, A., Gemmell, A., Voloshchuk, S., Chupeeva, V., Mirzabekove, A., Protein microchips: use for immunoassay and enzymativ reactions. Analytical Biochemistry, 278, 123-131, 2000
53. Nijdam A.J., Ming-Cheng, M., Geho, D.H., Fedele, R., Herrmann, P., Killian, K., Espina, V., Petricoin 3rd, E.F., Liotta, L.A., Ferrari, M., Physicochemically modified silicon as a substrate for protein microarrays. Biomaterials. 28(3), 550-558, 2007
54. Kusnezow, W., Hoheisel, J.D., Solid Supports for microarray immunoassays. Journal of
Molecular Recognition, 16, 165-176, 2003.
55. Steinhauer, C., Wingren, C., Malmborg-Hager, A.C., Borrebaeck, C.A.K., SIngle framework recombinant antibody framgments designed for protein chip applications. Biotechniques, 33, 38-45, 2002
47
56. Zhu, H., Snyder, M., Protein chip technology. Current Opinions in Chemical Biology, 7, 55-63,
2003
57. Kusnezow, W., Hoheisel, J.D., Antibody microarrays: promises and problems. Biotechniques, 33, 14-23, 2002
58. Borrebaeck, C.A.K., Ekstrom, S., Malmborg-Hager, A.C., Nilsson, J., Laurell, T., Marko-Varga,
G., Protein chips based on recombinant antibody fragments: a highly sensitive approach as detected by mass-spectrometry. Biotechniques 30, 1126-1132, 2001
59. Bussow, K., Cahill, D., Nietfeld, W., Bancroft, D., Scherzinger, E., Lehrach, H., Walter, G., A
method for global protein expression and antibody screening on high density filters of an arrayed cDNA library. Nucleic Acids Research, 26, 5007-5008, 1998
60. Ressine, A., Ekstrom, S., Marko-Varga, G., Laurell, T., Macro-nanoporous silicon as a support
for high performance protein microarrays, Analytical Chemistry, 75, 6986-6974, 2003
61. Holt, L.J., Büssow, K., Walter, G., Tomlinson, I.M., Bypassing selection: direct screening for antibody-antigen interactions using protein arrays. Nucleic Acids Research, 28(15), E72-e72, 2000
62. Gulmann, C., Espina, V., Petricoin 3rd, E., Longo, D.L., Santi, M., Knutsen, T., Raffeld, M.,
Jaffe, E., Liotta, L.A., Feldman, A.L., Proteomic analysis of apoptotic pathways reveals prognostic factors in follicular lymphoma. Clin Cancer Research, 11(5847), 2005
63. Herrmann, P. C., Gillespie, J. W., Charboneau, L., Bichsel, V. E., Paweletz, C. P., Calvert, V.
S., Kohn, E. C., Emmert-Buck, M. R., Liotta, L. A., Petricoin 3rd., E.F., Mitochondrial proteome: altered cytochrome c oxidase subunit levels in prostate cancer. Proteomics 3:1801, 2003
64. Paweletz, C. P., L., Charboneau, L., Bichsel, V. E. , Simone, N. L., Chen, T., Gillespie, J. W.,
Emmert-Buck, M. R. , Roth, M. J., Petricoin, I. E., Liotta, L. A., Reverse phase protein microarrays which capture disease progression show activation of pro-survival pathways at the cancer invasion front. Oncogene 20:1981., 2001
65. Petricoin 3rd, E. F., Bichsel, V. E. , Calvert, V. S., Espina, V., Winters, M., Young, L., Belluco,
C., Trock, B. J., Lippman, M., Fishman, D. A., Sgroi, D. C., Munson, P. J., Esserman, L. J., Liotta, L. A., Mapping molecular networks using proteomics: a vision for patient-tailored combination therapy. Journal of Clinical Oncology, 23:3614, 2005
66. Sheehan, K. M., Calvert, V. S., Kay, E. W., Lu, Y., Fishman, D., Espina, V., Aquino, J., Speer,
R., Araujo, R., Mills, G. B., Liotta, L. A., Petricoin 3rd, Wulfkuhle, E. F., Use of reverse phase
48
protein microarrays and reference standard development for molecular network analysis of metastatic ovarian carcinoma. Mol. Cell. Proteomics, 4:346, 2005
67. Wulfkuhle, J. D., Sgroi, D. C., Krutzsch, H., McLean, K., McGarvey, K., Knowlton, M., Chen, S., Shu, H., Sahin, A., Kurek, R., Wallwiener, D., Merino, M. J. , Petricoin 3rd, E. F., Zhao, Y., Steeg, P.S., Proteomics of human breast ductal carcinoma in situ. Cancer Res., 62:6740, 2002
68. Wulfkuhle, J. D., Aquino, J. A., Calvert, V. S., Fishman, D. A., Coukos, G., Liotta, L. A.,
Petricoin 3rd, E. F., Signal pathway profiling of ovarian cancer from human tissue specimens using reverse-phase protein microarrays. Proteomics, 3:2085, 2003
69. Zha, H., Raffeld, M., Charboneau, L., Pittaluga, S., Kwak, L. W., Petricoin 3rd, E., Liotta, L. A.,
Jaffe, E. S., Similarities of prosurvival signals in Bcl-2-positive and Bcl-2-negative follicular lymphomas identified by reverse phase protein microarray. Lab Invest., 84:235, 2004

49
CURRICULUM VITAE
Bharat Sankaran graduated from D.A.V. Higher Secondary School, Chennai, India, in 2002. He received his Bachelor of Science from George Mason University in 2006. He was a Guest Researcher in the National Institutes of Standards and Technology, Gaithersburg, Maryland from 2006-2007.