$&RPSDULVRQRI3ROLFLHVLQ7ZHOYH2(&' … · 7DFNOLQJ([FHVVLYH:DLWLQJ7LPHVIRU(OHFWLYH ... (Department...
55
DELSA/ELSA/WD/HEA(2003)6 OECD HEALTH WORKING PAPERS Tackling Excessive Waiting Times for Elective Surgery: A Comparison of Policies in Twelve OECD Countries Jeremy Hurst and Luigi Siciliani 6
Transcript of $&RPSDULVRQRI3ROLFLHVLQ7ZHOYH2(&' … · 7DFNOLQJ([FHVVLYH:DLWLQJ7LPHVIRU(OHFWLYH ... (Department...

DELSA/ELSA/WD/HEA(2003)6
OECD HEALTH WORKING PAPERS
Tackling Excessive Waiting Times for ElectiveSurgery: A Comparison of Policies in Twelve OECD
Countries
Jeremy Hurst and Luigi Siciliani
6

Unclassified DELSA/ELSA/WD/HEA(2003)6 Organisation de Coopération et de Développement Economiques Organisation for Economic Co-operation and Development 07-Jul-2003 ___________________________________________________________________________________________
English - Or. English DIRECTORATE FOR EMPLOYMENT, LABOUR AND SOCIAL AFFAIRS EMPLOYMENT, LABOUR AND SOCIAL AFFAIRS COMMITTEE
Tackling Excessive Waiting Times for Elective Surgery: A Comparison of Policies in Twelve OECD Countries
Jeremy Hurst and Luigi Siciliani
JEL classification: I11, I18, H4
JT00147152
Document complet disponible sur OLIS dans son format d'origine Complete document available on OLIS in its original format
DE
LSA
/EL
SA/W
D/H
EA
(2003)6 U
nclassified
English - O
r. English
DELSA/ELSA/WD/HEA(2003)6
2
DIRECTORATE FOR EMPLOYMENT, LABOUR AND SOCIAL AFFAIRS
OECD HEALTH WORKING PAPERS This series is designed to make available to a wider readership health studies prepared for use within the OECD. Authorship is usually collective, but principal writers are named. The papers are generally available only in their original language – English or French – with a summary in the other. Comment on the series is welcome, and should be sent to the Directorate for Employment, Labour and Social Affairs, 2, rue André-Pascal, 75775 PARIS CEDEX 16, France.
The opinions expressed and arguments employed here are the responsibility of the author(s) and do not necessarily reflect those of the OECD
Applications for permission to reproduce or translate all or part of this material should be made to:
Head of Publications Service
OECD 2, rue André-Pascal
75775 Paris, CEDEX 16 France
Copyright OECD 2003

DELSA/ELSA/WD/HEA(2003)6
3
ACKNOWLEDGEMENTS
The authors wish to thank those colleagues who helped them in the drafting of this report: John Martin, Martine Durand and Peter Scherer for comments on earlier versions of the paper; Gabrielle Hodgson for her statistical assistance, Hilary Carroll for help in finding literature and Marianne Scarborough for her secretarial assistance. They also wish to thank the following experts from participating countries. Australia: Alice Creelman, Mary-Julia Diethelm, Jacky Fogerty, Elaine Pulleine, Phil Ghirardello (Department of Health and Ageing), Jeff Richardson (Monash University); Canada: Diane Lugsdin, Sylvie Gauthier (Health Canada), Jennifer Zelmer, Indra Pulcins (Canadian Institute for Health Information), John McGurran (Western Canada Waiting List Project); Denmark: Frans Clemmesen, Steffen Nielsen, Henrik Mulvad Hansen (Department of Interior and Health); Finland: Jouko Isolauri (Ministry of Social Affairs and Health); Järvelin Jutta, Unto Häkkinen (STAKES); Ireland: Joseph Cregan, Robbie Breen (Department of Health and Children); Italy: Alessandro Solipaca (ISTAT); Netherlands: Saskia Van Eck, Marian van der Maten, Anno Pomp (Ministry of Health, Welfare and Sports); New Zealand: Francis Dickinson, Andrew Holmes; Norway: Marit Getz Wold, Inger M. Nilstad, Guri G. Kjæserud, (Ministry of Health), Ola Kindseth, Karl-Gerhard Hem (Sintef Unimed); Spain: Carmen M. de Pancorbo, Isabel de la Mata Barranco, Maria A. Gogorcena; Sweden: Marianne Hanning (Swedish Federation of County Councils); United Kingdom: Clive Smee, Barry McCormick, David Bensley, Elizabeth Lawler (English Department of Health). They also wish to thank others who helped them in an expert capacity: Peter C. Smith (University of York), Reinhard Busse (Technische Universitaet Berlin), Alain Sommers (BIAC), Elizabeth Docteur (OECD), and Lynelle Moon. Finally, they wish to thank Joergen Lotz (Danish delegation to the OECD) for helping to devise the project and for his strong support.

DELSA/ELSA/WD/HEA(2003)6
4
SUMMARY
Waiting times for elective (non-urgent) surgery are a main health policy concern in approximately half of OECD countries. Mean waiting times for elective surgical procedures are above three months in several countries and maximum waiting times can stretch into years. They generate dissatisfaction for the patients and among the general public. Is there a solution? This report discusses the waiting-time phenomenon and provides a comparative analysis of policies to tackle waiting times across 12 OECD countries.
At worst, waiting times can lead to deterioration in health, loss of utility and extra costs. However, one surprising result is that there is little evidence of health deterioration from a review of studies of patients waiting for a few months for different elective procedures across a range of countries. Moreover, such patients are quite tolerant of short and moderate waits, although the general public often expresses more concern about waiting.
It is argued that there will be both optimum rates of surgery and optimum waiting times which will differ across countries. Waiting times tend to be formed in countries which combine public health insurance (with zero or low cost sharing) and constraints on surgical capacity. Public health insurance removes from patients the financial barriers to access leading to high potential demand. Constraints on capacity – desirable to achieve optimum surgery rates – prevent supply from matching this demand. Under such circumstances non-price rationing in the form of waiting lists takes over from price rationing as a means of equilibrating supply and demand. Optimum waiting times will not be zero. It can be cost-effective to maintain short queues of elective patients because the adverse health consequences of short delays are small and because there are savings in hospital capacity from allowing queues to form.
It is argued that, in principle, waiting times can be reduced through supply-side policies, if the volume of surgery is not considered adequate, or through demand-side policies, if the volume of surgery is considered to be adequate. Supply-side policies include raising public capacity by increasing the number of specialists and beds, or by using the available capacity in the private sector. They also include increasing productivity by funding extra activity, fostering day-surgery, and linking the remuneration system of doctors and hospitals to the activity performed. Demand-side policies include the prioritisation of patients according to need and managing access to waiting lists accordingly. Alternatively, they may involve encouraging private health insurance coverage, with the aim of diverting demand from public care to private care.
A number of provisional results are identified in the review of the policies. On the supply side, the pronounced and prolonged reductions in long waiting for coronary revascularisation surgery in Denmark have been brought about by significant increases in activity, backed up by increases in capacity. The striking reductions in long waiting in England and Spain have been due to a combination of maximum waiting-time targets, additional activity and changed incentives. In addition, in Spain, it seems that there was a marked fall in mean waiting times of patients on the list for various procedures following the linking of financial incentives to the achievement of waiting-time targets in 1998. Many OECD countries have implemented visible improvements in the efficiency of surgical units, particularly by increasing the share of same-day surgery.

DELSA/ELSA/WD/HEA(2003)6
5
However, a common experience is to take measures aimed at reducing waiting times by increasing activity, only to find that after a brief period demand has increased and waiting times have reverted to levels similar to those before the introduction of the measures. Such responses may be hard to overcome, since demand responds positively to reductions in waiting times. Moreover, demand is rising secularly because of technological changes.
New Zealand’s dramatic reductions in waiting beyond six months have, by contrast, been the result mainly of demand management, based on strenuous work on clinical guidelines for prioritising elective patients. Australia seems to have had some recent success in reducing waiting times for public patients for a selection of elective conditions following increased tax incentives – and coverage - for private health insurance. However, it is too early to judge the long-term success of these policies.
Several countries have found that the application of ‘maximum waiting-times guarantees’ has conflicted with clinical prioritisation. Moreover, although England has brought down long waiting, the mean waiting times of patients admitted to surgical units (as opposed to the mean waiting times of those on the list) has changed little in the past decade. Attempts to avoid the clinical prioritisation issue, by offering guarantees to patients conditional on high need, have been tried and abandoned in Norway and Sweden.
It is important to add that the different policies mentioned above will have had different implications for the benefits and costs of health care. For example, demand management is a cheap way of controlling waiting times but is unlikely to improve health (unless surgery is unnecessary). Increasing surgical capacity and activity is a more costly way of bringing down waiting times but it can bring improvements in health.
RESUME
Les délais d’attente précédant des interventions chirurgicales non urgentes constituent un problème de santé publique majeur dans pratiquement la moitié des pays de l’OCDE. Les délais d’attente médians sont supérieurs à trois mois dans plusieurs pays et les délais maximums peuvent atteindre plusieurs années. Ces attentes sont source d’insatisfaction pour les malades et dans l’opinion. Comment peut-on résoudre ce problème ? Le présent rapport examine le phénomène des délais d’attente et propose une analyse comparative des mesures prises pour tenter d’en venir à bout dans douze pays de l’OCDE.
Les délais d’attente peuvent aller jusqu’à entraîner une détérioration de la santé et une perte de capacités des malades ainsi que des surcoûts. Paradoxalement, l’analyse d’études effectuées dans un certain nombre de pays au sujet de malades devant attendre quelques mois avant de subir différentes interventions non urgentes ne fait pas véritablement apparaître de détérioration de la santé des patients concernés. Qui plus est, des attentes brèves ou relativement brèves sont tout à fait tolérées par les malades, même si l’opinion se montre souvent davantage préoccupée par les problèmes d’attente.
Il semblerait que les taux optimaux d’interventions chirurgicales de même que les délais d’attente optimaux diffèrent selon les pays. Des délais d’attente tendent à apparaître dans les pays qui se caractérisent à la fois par un système d’assurance maladie public (prévoyant une participation financière des patients faible ou nulle) et des contraintes sur les capacités chirurgicales. L’assurance maladie supprime pour les patients l’obstacle du coût de l’accès aux soins, ce qui engendre une demande potentielle élevée. Mais les contraintes qui pèsent sur les capacités – qui sont souhaitables si l’on veut parvenir à un
DELSA/ELSA/WD/HEA(2003)6
6
taux optimal d’interventions chirurgicales – empêchent l’offre de traitements de répondre à cette demande. Dans ces conditions, un rationnement des soins non fondé sur les prix sous la forme de listes d’attente se substitue au rationnement fondé sur les prix comme moyen d’assurer l’équilibre entre l’offre et la demande. Les délais d’attente optimaux ne sont jamais nuls. De courtes listes de malades en attente d’actes chirurgicaux non urgents peuvent se révéler rentables dans la mesure où de brefs délais d’attente ne peuvent avoir de conséquences graves sur la santé et où la formation de files d’attente permet d’optimiser l’utilisation des capacités hospitalières.
En principe, les délais d’attente peuvent être abaissés au moyen de mesures agissant sur l’offre si le volume des actes chirurgicaux n’est pas considéré comme suffisant, ou au moyen de mesures portant sur la demande, si ce volume est jugé adéquat. Au nombre des mesures concernant l’offre, figure le renforcement des capacités de l’hôpital public moyennant l’augmentation du nombre de spécialistes et de lits, ou le recours aux capacités disponibles dans le secteur privé. On peut aussi chercher à élever la productivité en finançant des activités supplémentaires, en mettant l’accent sur la chirurgie ambulatoire et en liant la rémunération des médecins et des hôpitaux au volume des activités exécutées. Les mesures portant sur la demande sont notamment le classement par ordre de priorité des patients en fonction de la nécessité des interventions et la gestion des inscriptions sur les listes d’attente conformément à ce classement. Une autre démarche consiste à encourager le recours à l’assurance maladie privée, dans le but de ne pas faire porter la demande sur les soins de santé publics mais privés.
L’examen de ces mesures met en évidence un certain nombre de résultats. En ce qui concerne l’offre, une augmentation sensible des activités, rendue possible par un accroissement des capacités, a permis une réduction marquée et durable d’attentes prolongées précédant les revascularisations coronariennes au Danemark. Le raccourcissement spectaculaire de délais d’attente élevés en Angleterre et en Espagne est imputable à une combinaison de mesures, à savoir la fixation d’objectifs concernant les délais d’attente maximaux, l’augmentation des activités et la mise en place de nouvelles incitations. Il semble, en outre, que l’Espagne ait enregistré une réduction notable des délais médians pour les patients en attente de différentes interventions en subordonnant l’octroi d’avantages financiers au respect des objectifs concernant les délais d’attente à compter de 1998. De nombreux pays de l’OCDE sont parvenus à améliorer sensiblement l’efficience d’unités chirurgicales, en particulier en augmentant la part de la chirurgie ambulatoire.
Cependant, certains pays ont en commun d’avoir adopté des mesures visant à abaisser les délais d’attente en augmentant les activités, et constaté qu’après une courte période, la demande s’était elle aussi accrue et que les délais d’attente étaient revenus à leurs niveaux antérieurs. De tels problèmes peuvent se révéler difficiles à résoudre, la demande réagissant positivement à la réduction des délais d’attente. En outre, les évolutions technologiques contribuent à une augmentation permanente de la demande.
En Nouvelle-Zélande, la baisse spectaculaire des attentes supérieures à six mois a été, en revanche, essentiellement la conséquence de la gestion de la demande, à la suite de recherches intensives visant à l’élaboration de directives cliniques applicables au classement par ordre de priorité des patients en attente d’interventions non urgentes. L’Australie semble être parvenue récemment à réduire dans une certaine mesure les délais d’attente pour les patients du système public souffrant de certaines pathologies non urgentes à la suite de l’adoption d’incitations fiscales en faveur d’un plus large recours à l’assurance privée. Il est toutefois trop tôt pour juger du succès à long terme de ces mesures.
Plusieurs pays ont constaté qu’il y avait conflit entre le principe du « délai maximum garanti » et le principe des priorités cliniques. En outre, bien que l’Angleterre ait abaissé sensiblement des délais d’attente élevés, le temps d’attente médian des personnes admises en chirurgie (par rapport au temps d’attente médian des personnes en liste d’attente) a peu changé au cours des dix dernières années. Des

DELSA/ELSA/WD/HEA(2003)6
7
formules visant à régler le problème des priorités cliniques en proposant un délai garanti aux patients en fonction de l’urgence de leur pathologie, ont été expérimentées et abandonnées en Norvège et en Suède.
A noter également que les différentes mesures mentionnées ci-dessus influent différemment sur l’utilité et le coût des systèmes de santé. Ainsi, la gestion de la demande est un moyen peu onéreux de régulariser les temps d’attente, mais ne paraît guère pouvoir améliorer la santé (sauf si l’acte chirurgical se révèle inutile). Par contre, l’accroissement des capacités et des activités chirurgicales représente un moyen plus coûteux d’abaisser les délais d’attente mais qui peut contribuer à l’amélioration de la santé des patients.
DELSA/ELSA/WD/HEA(2003)6
8
TABLE OF CONTENTS
ACKNOWLEDGEMENTS............................................................................................................................ 3
SUMMARY.................................................................................................................................................... 4
RESUME ........................................................................................................................................................ 5
TABLE OF CONTENTS................................................................................................................................ 8
1. INTRODUCTION ...................................................................................................................................... 9
2. THE WAITING TIME PHENOMENON ................................................................................................ 10
2.1 The problem ........................................................................................................................................ 10 2.2 International comparisons of waiting times ........................................................................................ 11 2.3 Key aspects in the provision of surgery .............................................................................................. 12 2.4 The determinants of waiting lists and waiting times........................................................................... 13 2.5 Measurement of waiting times ............................................................................................................ 16 2.6 Conceptualising optimum surgery rates .............................................................................................. 17 2.7 Conceptualising optimum ‘inpatient’ waiting times ........................................................................... 19 2.8 Policies to pursue both optimal surgery rates and optimal waiting times ........................................... 21
3. REVIEW OF THE MAIN POLICY INITIATIVES................................................................................. 23
3.1 Supply-side policies ............................................................................................................................ 24 3.2 Demand-side policies .......................................................................................................................... 34 3.3 Policies acting directly on waiting times (and affecting both the demand and the supply of elective surgery) ..................................................................................................................................................... 40
4. CONCLUSIONS ...................................................................................................................................... 44
REFERENCES ............................................................................................................................................. 48

DELSA/ELSA/WD/HEA(2003)6
9
1. INTRODUCTION
1. Waiting times for elective surgery are an important health policy concern in approximately half of OECD countries. Mean waiting times for elective surgical procedures are above three months in several countries and maximum waiting times can stretch into years. They generate dissatisfaction for the patients and among the general public. Is there a solution? Policy makers have increasingly addressed this issue in the last twenty years.
2. This report discusses the waiting-time phenomenon and provides a comparative analysis of policies across 12 OECD countries. The latter is based on the responses to a questionnaire sent to the countries participating in the OECD Waiting-times project in April 2002.
3. It is argued that, in principle, waiting times can be reduced through supply-side policies, if the volume of surgery is not considered adequate, or through demand-side policies, if the volume of surgery is considered to be adequate. Supply-side policies may raise public capacity by increasing the number of specialists and beds, or by using the available capacity in the private sector. They may alternatively increase productivity by funding extra activity, fostering day-surgery, and linking the remuneration system of doctors and hospitals to the activity performed. Demand-side policies may for example prioritise patients according to need and provide the treatment only to the patients with higher need. Alternatively, they may encourage private health insurance coverage, which could generate a reduction in the demand of public treatments and an increase in the demand of private treatment.
4. Section 2 of this report sets up a framework to describe the waiting-time phenomenon and to identify the desired level of surgery rates and waiting times. Section 3 discusses the policies that can be implemented to reach the desired levels. Section 4 contains conclusions. Three annexes are also provided. Annex 1 reviews the literature, which aims at estimating the costs for the patients waiting for elective surgery. Annex 2 discusses the main issues related to the measurements of waiting times. Annex 3 provides detailed country reviews, which present and discuss the main policy initiatives introduced in each of the 12 countries involved in this study.
5. This report is the first delivered within the OECD Waiting-Times Project, whose aims are: to evaluate policies which have been adopted to tackle excessive waiting times, in an international context, and to explain waiting-times variations for elective surgery across countries. This report addresses the first of these questions. The project involves 12 OECD countries, Australia, Canada, Denmark, Finland, Ireland, Italy, the Netherlands, New Zealand, Norway, Spain, Sweden, and the United Kingdom, all of which have reported waiting-time problems.

DELSA/ELSA/WD/HEA(2003)6
10
2. THE WAITING TIME PHENOMENON
2.1 The problem
6. Waiting for publicly funded, elective surgery is seen as one of the most important health system problems in many OECD countries. Part of the reason for that is that general public opinion surveys (surveys not confined to people with recent experience of using health services) suggest that waiting for elective surgery is very unpopular. In the United Kingdom, a regular public opinion survey has indicated for several years that waiting for specialist assessment and waiting for elective surgery are perceived, respectively, as the first and second most important failings of the health care system (see Jowell et al., 2000). In Spain, a public opinion ‘barometer’ has identified waiting times for elective surgery as the leading source of public dissatisfaction with inpatient services1. Against this, certain surveys which have been focussed on those actually kept waiting for certain elective procedures, suggest that whereas such respondents are intolerant of long waits, exceeding three to six months, they can be quite sanguine about short and moderate waits, depending on the severity of the symptoms (see, for example, Dunn et al., 1997 and Derrett et al., 1999).
7. One explanation for the increasing waiting times lies in the important advances in surgical technology and in anaesthesia over the last two or three decades. These advances have improved greatly the range, the safety and the effectiveness of the surgical procedures that can be offered by modern health systems. Many procedures are now carried out at a lower unit cost, as day cases rather than involving one or more overnight stays in hospital. As a consequence, there have been dramatic increases in the demand for surgical procedures, especially elective (non urgent) procedures, such as cataract surgery, hip replacements and coronary artery bypass surgery, in all OECD countries. Governments and insurers have responded to rising demand by increasing the funds going into surgery, in varying degrees. However, supply seems to have struggled to keep up with increasing demand in many countries. About half of OECD countries have continued to, or have begun to, experience problems with excessive waiting for elective surgery.
8. There is no international consensus on what represents ‘excessive’ waiting but in recent years a number of countries have set targets of either three months or six months for maximum waiting times. Currently, mean waiting times for elective surgical procedures are above three months in some countries and maximum waiting times can stretch into years. Prior to that, there is often waiting for the initial assessment by a surgical specialist - two or three months, on average, in some countries for some specialties.
9. There have been a significant number of attempts to estimate directly both the adverse and the positive consequences of waiting. The costs of delay can include: deterioration in the condition for which treatment is awaited, including death as an extreme outcome; the loss of utility from delay (especially if treatment can relieve significant pain or disability); an increase in the cost of surgery and of other treatments, pre- or post-surgery; additional loss of income from work; and additional income support payments (transfers), pre- or post-surgery. Such loss of benefits and costs are likely to vary greatly across conditions, across countries and through time. The consequences of long delays for serious conditions will be different from the consequences of short delays for mild conditions. Annex 1 contains a review of some of the main literature on the costs of waiting. Various tentative conclusions may be drawn. First, there is surprisingly little evidence of deterioration in health during waiting in most of the studies reviewed, which cover a variety of procedures, a variety of waiting times, and a variety of countries. That may have been
1 Information supplied by Ministry of Health.
DELSA/ELSA/WD/HEA(2003)6
11
because waiting times are typically shorter for the more acute conditions, such as coronary artery disease. Also, surgeons may be quite good at triage – that is at re-prioritising patients whose conditions become unstable or deteriorate. Secondly, there is evidence of considerable tolerance of short and moderate waiting, as reported above. Naturally, that is less true in relation to coronary artery disease than it is in relation to cataracts. Third, a couple of studies of patients’ willingness to pay for reductions in waiting, suggest that there is relatively moderate willingness to pay - perhaps around ₤65 (or $100) for a reduction in waiting of one month, at current price levels. Fourth, however, there is some evidence of differences across countries in tolerance of waiting. On the positive side, a few studies suggest that some patients get better while waiting and no longer require surgery. More important, the savings in terms of avoided excess surgical capacity from maintaining waiting lists may be substantial (Feldman, 1994).
2.2 International comparisons of waiting times
10. Although administrative data on waiting times are now being collected in a number of OECD countries, international comparisons remain limited. One explanation is that there are many different ways of measuring waiting times (see Annex 2). An attempt will be made to collect and compare administrative data in the future work of the OECD Waiting-times Project.
11. A small amount of comparative waiting-time data is already available from international surveys. Such surveys have the advantage that they have been collected according to common definitions and common methodologies across countries. However, they are often based on small samples of respondents.
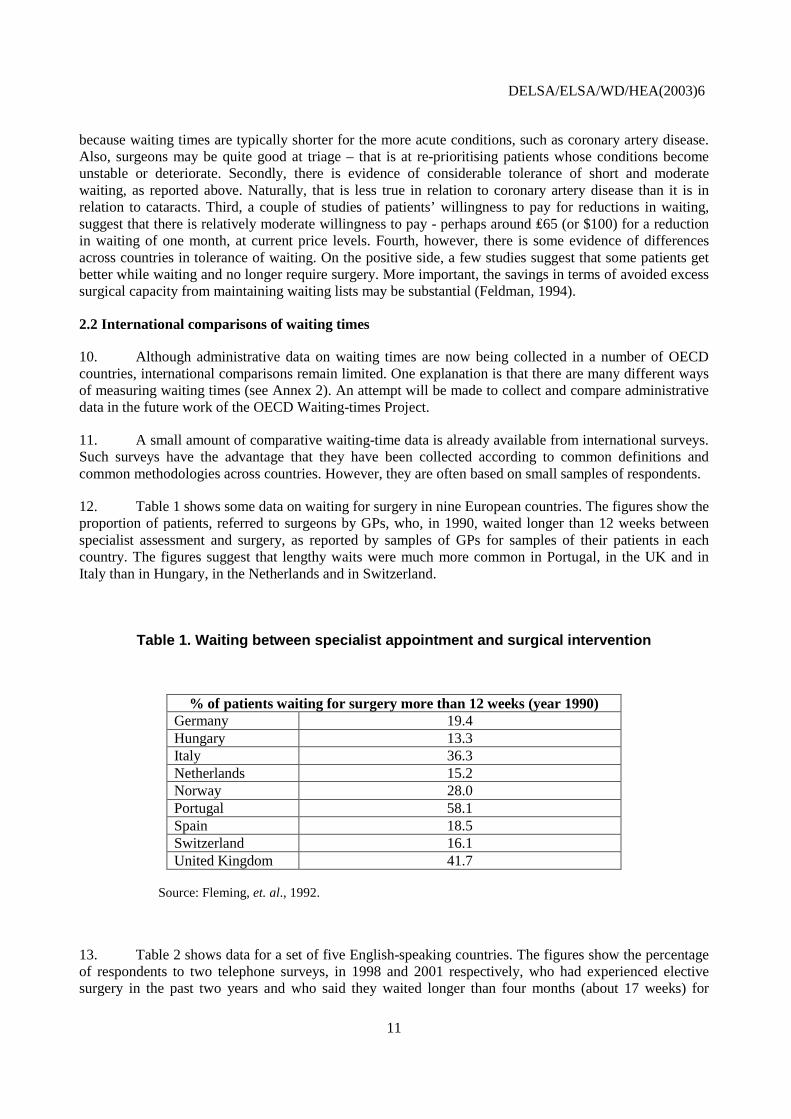
12. Table 1 shows some data on waiting for surgery in nine European countries. The figures show the proportion of patients, referred to surgeons by GPs, who, in 1990, waited longer than 12 weeks between specialist assessment and surgery, as reported by samples of GPs for samples of their patients in each country. The figures suggest that lengthy waits were much more common in Portugal, in the UK and in Italy than in Hungary, in the Netherlands and in Switzerland.
Table 1. Waiting between specialist appointment and surgical intervention
% of patients waiting for surgery more than 12 weeks (year 1990) Germany 19.4 Hungary 13.3 Italy 36.3 Netherlands 15.2 Norway 28.0 Portugal 58.1 Spain 18.5 Switzerland 16.1 United Kingdom 41.7
Source: Fleming, et. al., 1992. 13. Table 2 shows data for a set of five English-speaking countries. The figures show the percentage of respondents to two telephone surveys, in 1998 and 2001 respectively, who had experienced elective surgery in the past two years and who said they waited longer than four months (about 17 weeks) for

DELSA/ELSA/WD/HEA(2003)6
12
surgery. The figures suggest that lengthy waits were much more common in the UK than in Australia, Canada and New Zealand and were negligible in the USA. However, there are signs that long waiting times had increased in all five countries, particularly in Canada, between 1998 and 2001.
Table 2. Percentage of patients waiting for elective surgery more than 4 months
Base: Those with elective surgery in the past 2 years (%) Year 1998 Year 2001 Australia 17 23 Canada 12 27 New Zealand 22 26 United Kingdom 33 38 United States 1 5
Source: Blendon, et. al., 2002.
2.3 Key aspects in the provision of surgery
14. It is desirable to consider certain key aspects of the provision of surgery before turning to the phenomenon of waiting times for surgery.
15. First, the provision of surgery has to take account of the differing urgency with which interventions are required. It may also have to take account of fluctuating demands from medical patients when beds or staff are shared in general hospitals. It is common to see the following classification of prioritisation of surgery, although many administrations use more detailed categories of urgency:
1. Emergency surgery - surgery is required immediately (e.g. rupture of abdominal aortic aneurysm);
2. Urgent surgery - surgery is required, prior to discharge home (e.g. colon cancer with obstruction);
3. Elective surgery - surgery is necessary but the patient can be sent home and the timing of the procedure can be scheduled (e.g. stable coronary artery disease).
16. Because there is no international agreement on prioritisation of surgery, it should not be assumed that the terms set out here are used in the same way across countries.
17. This report is concerned mainly with ‘elective’ surgery (Category 3, above). In particular, it is concerned with procedures such as cataract surgery, hip replacement, knee replacement, coronary artery bypass surgery, percutaneous transluminal coronary angioplasty, hernia repair, cholecystectomy, hysterectomy, prostatectomy and ligation and stripping of varicose veins. These are prominent among the procedures which regularly account for the bulk of surgical waiting lists.
18. Second, the final demand for surgery is decided by the surgeon rather than by the patient. The patient has a demand for health (reduction of symptoms, improvement in prognosis) that the physician as his/her agent translates into a demand for medical care. Depending on demographic and epidemiological circumstances, a flow of individual patients will reach surgeons with conditions which might benefit from surgery, some as emergencies, some as a result of self-referral and some after referral by a general

DELSA/ELSA/WD/HEA(2003)6
13
practitioner. It is the surgeon who will establish the options for intervention, after making an expert assessment of the patient’s condition, the risk of undertaking a particular procedure, the size of any net improvement that might be brought about and the urgency with which any treatment should be given. After discussion with the patient, where feasible, it is the surgeon who will decide whether to offer the patient a place on a waiting list or not. When discussing the options with the patient, the surgeon may be influenced by the effect of the decision on his or her personal income - carrying out the procedure will add to his or her income in the case of fee for service payment and will have no effect on his or her income in the case of salaried payment. He or she may also be obliged to consider the necessity for rationing, especially under public programs (see below). These factors may lead the surgeon to raise or lower his or her threshold for offering elective surgery. The demand for elective surgery is always ‘surgeon-managed’ and may even be ‘surgeon-led’ or ‘surgeon-induced’.
19. Third, the practice of surgery has evolved rapidly over many decades yet has been less affected by health technology assessment and ‘evidence-based medicine’ than has pharmaceutical-based practice. ‘Surgical procedures are often introduced into practice without rigorous evaluation’ (Horng and Miller, 2002). That has helped to perpetuate a climate of uncertainty in which variations in clinical opinion about the indications for elective surgery can flourish.
20. There is indirect evidence for the leading role of the surgeon in demand, and of variability in the exercise of that role, in the evidence that exists of large geographical variations in elective surgery rates for many procedures, across small geographical areas in OECD countries (Wennberg and Gittelsohn, 1973, McPherson, 1989). Generally, such variations in elective surgery rates cannot be explained by variations in the demographic or epidemiological characteristics of the populations being served or by local resource variations. Rather, it seems likely that they are a consequence of physicians’ leading role in deciding surgery rates and the variations in clinical opinion, referred to above. The literature usually attributes such geographical variations to differences in ‘clinical signature’ or in ‘clinical enthusiasm’ among surgeons. Surgery rates seem to vary more for some conditions than for others. One international comparison suggested that rates of tonsillectomy, hernorrhoidectomy, hysterectomy and prostatectomy varied more than rates of appendectomy, hernia repair and cholecystectomy in three countries (McPherson, et al. 1982). There is also evidence of large variations in general practitioner referral rates for surgery across small areas, which, similarly, have been attributed to clinical uncertainty (Coulter, et al., 2001). Such ‘small area’ variations should be distinguished from variations in surgery rates across large areas, such as countries. These are likely to be due to differences in resource levels as well as to differences in clinical opinion (Bunker, 1970; Forrest et al., 2002).
2.4 The determinants of waiting lists and waiting times
21. Waiting lists for elective surgery generally tend to be found in countries which combine public health insurance, with zero or low patient cost sharing and constraints on surgical capacity. Public health insurance and zero cost sharing remove the financial barriers to access to surgery. Constraints on capacity prevent supply from matching demand. Under such circumstances, non-price rationing, in the form of waiting times for elective surgery, takes over from price rationing as a means of equilibrating demand and supply.
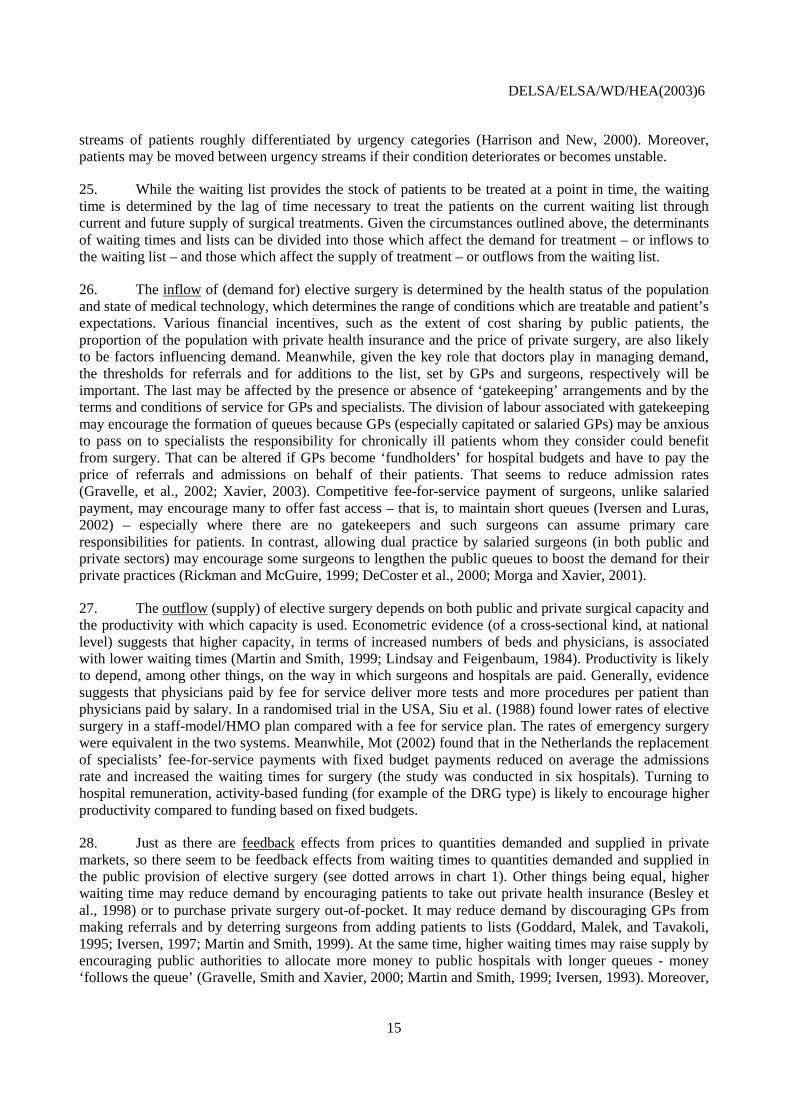
22. Chart 1 depicts in a simplified form the way in which patients flow through a typical health care system that has publicly insured secondary care and limited capacity. Patients suffering from conditions which might benefit from surgical interventions arrive for assessment by a surgeon as emergencies and as self-referrals or are referred for assessment by GPs. After assessment, some patients with minor conditions which can be treated by other means may be treated medically or referred back to the GP (or to another specialist). Others will be treated as emergencies or as urgent patients and be offered surgery without waiting. Still others, for whom surgery can be scheduled, may be asked to wait for ‘elective’ surgery and

DELSA/ELSA/WD/HEA(2003)6
14
be given a future date for treatment (booked) or put on a public waiting list. Some of this last group may choose private surgery to ‘jump the queue’, provided they can pay for it or are privately insured. Meanwhile, if significant queues and waiting times build up, there are likely to be leakages from the queue because, for example, patients move away from the hospital catchment area, their conditions improve spontaneously or they die while waiting.
23. It is easy for a stock of patients waiting for elective surgery to build up if the flow of additions to the waiting list at some point exceeds the rate at which patients are removed from the list by receiving treatment (Worthington 1987, 1991; von Ackere and Smith, 1999, 2001). Some of the imbalances may arise from short-term fluctuations in demand, especially from emergency patients (including medical patients), who take priority for beds and staff in general hospitals. Others may be longer term and structural. The hospital or surgical unit will have an incentive to encourage such queues to persist because it assists the hospital or surgical unit to keep its beds and operating theatres optimally loaded and its unit costs down when there are unpredictable fluctuations in the demand for emergency treatment.
24. It is important to recognise that an elective waiting list is usually not a simple queue governed by ‘first come first served’ behaviour. Rather, a typical waiting list will consist of a number of different
GP ass- essment
Waiting list (stock)
Surgeon assessment
Public procedure performed
additions inflow
treatments outflow
leakage
Private procedure performed
Private elective treatment
Emergency surgical treatment
referrals
Return to GP
Waiting time
+ + -
- +
Health status Technology Severity thresholds Patients expectations Cost sharing PHI coverage Price of private surgery
+
Public capacity (beds, surgeons) Capacity in the private sector Productivity (public and private)
+
Chart 1
Emergency arrivals
DELSA/ELSA/WD/HEA(2003)6
15
streams of patients roughly differentiated by urgency categories (Harrison and New, 2000). Moreover, patients may be moved between urgency streams if their condition deteriorates or becomes unstable.
25. While the waiting list provides the stock of patients to be treated at a point in time, the waiting time is determined by the lag of time necessary to treat the patients on the current waiting list through current and future supply of surgical treatments. Given the circumstances outlined above, the determinants of waiting times and lists can be divided into those which affect the demand for treatment – or inflows to the waiting list – and those which affect the supply of treatment – or outflows from the waiting list.
26. The inflow of (demand for) elective surgery is determined by the health status of the population and state of medical technology, which determines the range of conditions which are treatable and patient’s expectations. Various financial incentives, such as the extent of cost sharing by public patients, the proportion of the population with private health insurance and the price of private surgery, are also likely to be factors influencing demand. Meanwhile, given the key role that doctors play in managing demand, the thresholds for referrals and for additions to the list, set by GPs and surgeons, respectively will be important. The last may be affected by the presence or absence of ‘gatekeeping’ arrangements and by the terms and conditions of service for GPs and specialists. The division of labour associated with gatekeeping may encourage the formation of queues because GPs (especially capitated or salaried GPs) may be anxious to pass on to specialists the responsibility for chronically ill patients whom they consider could benefit from surgery. That can be altered if GPs become ‘fundholders’ for hospital budgets and have to pay the price of referrals and admissions on behalf of their patients. That seems to reduce admission rates (Gravelle, et al., 2002; Xavier, 2003). Competitive fee-for-service payment of surgeons, unlike salaried payment, may encourage many to offer fast access – that is, to maintain short queues (Iversen and Luras, 2002) – especially where there are no gatekeepers and such surgeons can assume primary care responsibilities for patients. In contrast, allowing dual practice by salaried surgeons (in both public and private sectors) may encourage some surgeons to lengthen the public queues to boost the demand for their private practices (Rickman and McGuire, 1999; DeCoster et al., 2000; Morga and Xavier, 2001).
27. The outflow (supply) of elective surgery depends on both public and private surgical capacity and the productivity with which capacity is used. Econometric evidence (of a cross-sectional kind, at national level) suggests that higher capacity, in terms of increased numbers of beds and physicians, is associated with lower waiting times (Martin and Smith, 1999; Lindsay and Feigenbaum, 1984). Productivity is likely to depend, among other things, on the way in which surgeons and hospitals are paid. Generally, evidence suggests that physicians paid by fee for service deliver more tests and more procedures per patient than physicians paid by salary. In a randomised trial in the USA, Siu et al. (1988) found lower rates of elective surgery in a staff-model/HMO plan compared with a fee for service plan. The rates of emergency surgery were equivalent in the two systems. Meanwhile, Mot (2002) found that in the Netherlands the replacement of specialists’ fee-for-service payments with fixed budget payments reduced on average the admissions rate and increased the waiting times for surgery (the study was conducted in six hospitals). Turning to hospital remuneration, activity-based funding (for example of the DRG type) is likely to encourage higher productivity compared to funding based on fixed budgets.
28. Just as there are feedback effects from prices to quantities demanded and supplied in private markets, so there seem to be feedback effects from waiting times to quantities demanded and supplied in the public provision of elective surgery (see dotted arrows in chart 1). Other things being equal, higher waiting time may reduce demand by encouraging patients to take out private health insurance (Besley et al., 1998) or to purchase private surgery out-of-pocket. It may reduce demand by discouraging GPs from making referrals and by deterring surgeons from adding patients to lists (Goddard, Malek, and Tavakoli, 1995; Iversen, 1997; Martin and Smith, 1999). At the same time, higher waiting times may raise supply by encouraging public authorities to allocate more money to public hospitals with longer queues - money ‘follows the queue’ (Gravelle, Smith and Xavier, 2000; Martin and Smith, 1999; Iversen, 1993). Moreover,
DELSA/ELSA/WD/HEA(2003)6
16
higher waiting times may help to reduce unused capacity, reducing the probability that the number of treatments offered is higher than the number of treatments demanded (Cooper, 1981). Likewise, higher waiting times may be an indirect signal to private hospitals to expand activity. The presence of such feedback effects may help in reaching equilibrium waiting times.
2.5 Measurement of waiting times
29. Developing evidence-based policies to tackle excessive waiting for elective surgery, requires measurement of waiting times to gauge the scale of the problem and to monitor the impact of interventions to reduce waiting. However, the measurement of waiting times is a complex matter subject to considerable international variation (taking note of many countries which do not gather waiting-time data). Annex 2 contains a review of certain measurement issues. Some of the key points it contains are summarised here.
30. It is difficult to define the start of any waiting period for elective surgery for international comparisons. Most of the countries involved in this study have GP gatekeepers. Some measure the delay between the GP referral to the surgeon and the assessment of the specialist (outpatient waiting time). Most countries measure the delay between the time a patient is put on the waiting list and the time the procedure is carried out (inpatient waiting time). Finally some countries measure the delay between the time of the GP referral and the time the procedure is carried out.
31. Several countries count the number of patients on waiting lists for surgical procedures. However, the number on the list is of little use for monitoring the size of the problem of waiting. What really matters is not how many patients are waiting but how long each one waits, or, at least, how many wait longer than some period that is deemed to be acceptable. It is quite possible for waiting times to go down when waiting lists go up. Moreover, waiting lists tend to move directly with surgical activity (i.e. waiting lists are not scale invariant; Goldacre et al., 1987) whereas waiting times tend to move inversely with surgical capacity (numbers of beds and physicians), other things being equal (Martin and Smith, 1999). That suggests that waiting lists can be a perverse indicator of performance.
32. One important issue relating to the measurement of waiting times on the waiting list, is whether ‘inpatient’ waiting is measured: a. by taking a periodic census of patients on a list and recording waiting up to that date or b. by recording waiting of all patients at the time of admission for treatment. These two measures may differ significantly (see annex 2 for more details). They also tend to respond differently to certain policy initiatives, such as maximum waiting-times guarantees. In addition, mean waiting times tend to be systematically higher than median waiting times.
33. Armstrong (2000) shows that both these statistics may be biased measures of the full waiting experienced by all those who join waiting lists. In particular, the experience of patients who are removed from the list, those who are suspended or deferred, those who die while waiting and those put to the back of the queue is not reflected in measure b. Armstrong has suggested that more complete and accurate waiting-time statistics should be compiled using life-table methods. However, it is not clear that the gain in accuracy would be worth the additional cost of compiling such data.
34. Patients who are treated as emergencies are excluded from waiting-times statistics. That is understandable but it means that the measurement of the performance of surgical units across countries is incomplete. If the ratio of emergency to elective admissions varies between countries, mean or median waiting times based only on waiting list patients will give a misleading picture of the average speed with which a catchment population is receiving surgical attention.
DELSA/ELSA/WD/HEA(2003)6
17
2.6 Conceptualising optimum surgery rates
35. Before moving to the review of policies to tackle excessive waiting times, it can be suggested that all health systems are faced by two challenges: seeking optimum rates of surgery; and seeking optimum waiting times for elective treatments. These challenges exist whether the systems are based primarily on private market mechanisms or whether they are heavily regulated by government or whether they are a mixture of the two. This section and the following two address the search for these optima and a discussion of some of the relevant policy levers in public systems2. Part of the discussion is conceptual. In practice, it is difficult to operationalise the optimisation of surgery rates and waiting times, because of uncertainty about the benefits of elective surgery, about the costs of waiting, and about the implications of continuous technological change. The optima that are being sought are not only very fuzzy but are also moving targets. Whether the targets have been reached or not will be a matter for judgement, whether by centralised or decentralised actors. Nevertheless, it may be useful to try to clarify some of the economic issues about which judgements have to be made.
36. In principle, the optimum rate of surgery, including both emergency and elective procedures, is that which maximises total health gains and consumer satisfaction, given certain resource constraints. Standard welfare economics theory suggests that this is attained when the social marginal benefit from an increase in the rate of surgery equals the marginal cost (Fuchs, 1998).
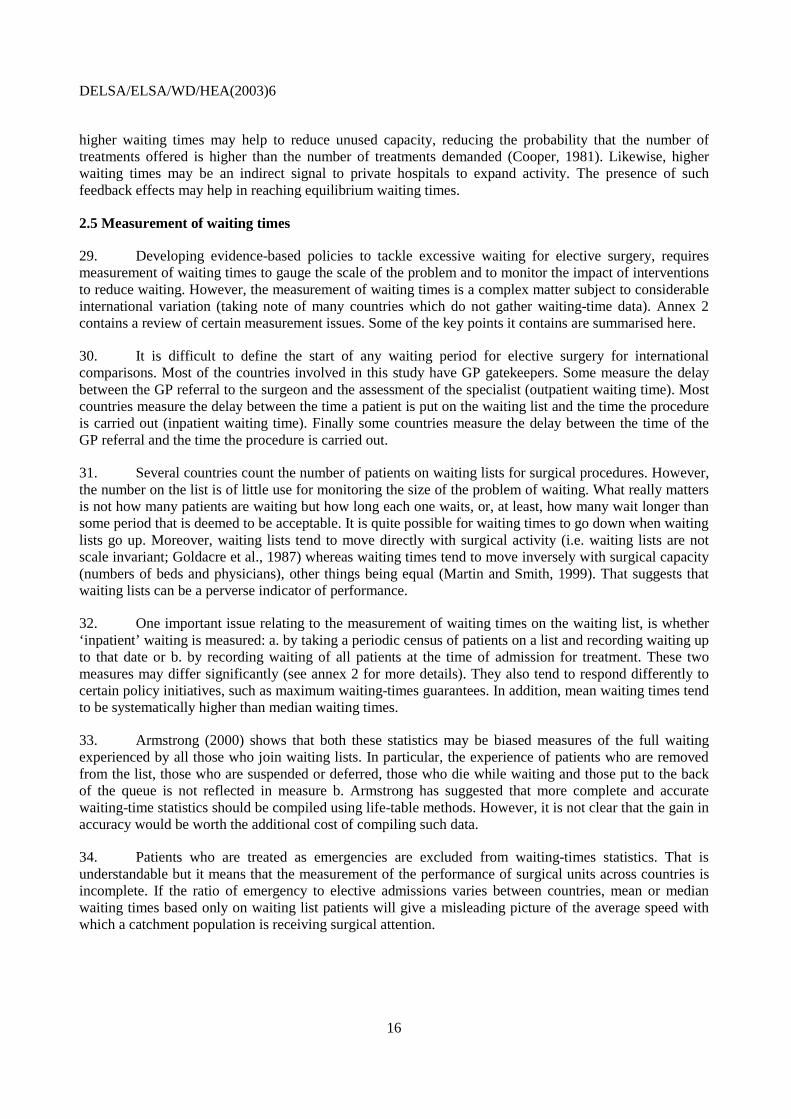
37. Chart 2.A, which abstracts from uncertainty about the benefits and costs of surgery and technological change, depicts some conventional hypotheses about the total social benefits and the total social costs of surgery. The rate of surgery is shown on the horizontal axis. The benefits and costs of surgery, denominated in $, are shown on the vertical axis. It is assumed that as the rate of surgery increases, the total social benefits from surgery rise at a diminishing rate. The social benefit curve can be thought of as ranking all the potential beneficiaries of surgery in a society at any point of time in order of their clinical priority - from those with the greatest capacity to benefit and urgency, through those with lesser capacity to benefit and urgency, to those for whom the net benefits are zero and, eventually, to those for whom the net benefits are negative, because the risks of surgery outweigh the benefits. It is also assumed that the total social costs of surgery rise at an increasing rate with the rate of surgery, because of rising marginal opportunity costs for the skilled human and other resources required to deliver surgery.3
2 The discussion is limited to ‘comparative statics’ analysis although the phenomenon of waiting times is
dynamic in nature. 3 The social benefits of surgery in a given country will depend, among other things, on the prevalence of the
conditions which might benefit from surgery, the technical possibilities for intervention, the individual utilities (satisfaction) from interventions and the social welfare function. The last determines what weights are given to individual utilities. For the purposes of this project, we use as a ‘benchmark’ a social welfare function based on the idea that there is social solidarity or there are ‘caring externalities’ (Culyer, 1989). That is the idea that every citizen has a right of access to necessary medical care and treatment should be in accordance with need (capacity to benefit). All of the 12 countries participating in this OECD project adhere to such principles. To put into practice such principles, they have arranged for universal (or virtually universal) health insurance coverage for basic health care to be available to their citizens, payment for which is broadly in accordance with ability to pay (implying re-distribution of income). Such coverage can be attained by public health insurance alone or by a mix of public and private health insurance. They have also arranged for there to be little or no cost sharing by patients, which allows for treatment to be broadly in accordance with need, at least within the publicly funded parts of their health care system.

DELSA/ELSA/WD/HEA(2003)6
18
38. The optimum rate of surgery is the rate A, at which the slope of the total benefit curve equals the slope of the total cost curve. That is where marginal benefits equal marginal costs, as depicted in Chart 2.B. The marginal benefit curve can be thought of as the demand curve (managed by surgeons) and under certain conditions in well-informed, private markets the marginal cost curve will equate to the supply curve. However, in many public systems capacity and supply will be set by a combination of government policies which affect capacity and the productivity with which capacity is used. Note that the optimal rate, A, is below the rate B, where cumulative benefits are maximised. In the presence of health insurance (and therefore moral hazard) patients may seek operations and surgeons may seek to operate on patients between A and B, because there is some additional clinical benefit to be gained beyond A. However, from a well-informed, third party payers’ point of view, the marginal gains would not be worth the marginal costs beyond A. In planned systems, the implicit target for government policy makers is to try to arrange for supply to be at A – but that will always be a difficult target to achieve in an uncertain and changing world.
39. Different heath care systems may be associated with in-built tendencies to deliver rates of surgery above or below the optimal level, A. It may be useful to consider two alternatives, here presented in a
A B
Chart 2. Optimum surgery rates
Surgery rate
Total benefit
Total cost
Benefit and cost
$
Benefit and cost
$Marginal cost
Marginal benefit
A B
Chart 2.B
Chart 2.A

DELSA/ELSA/WD/HEA(2003)6
19
stylised form. In the case of public health insurance4, it is possible to distinguish at least two major models of health care financing and delivery. The ‘Bismarck’ (also known as the social health insurance) model relies typically on public health insurance and mixed public and private provision. Traditionally, it involves payment systems for providers under which ‘money follows the patient’, combined with fee controls. Such systems were formerly rather open-ended but have usually been put under budget constraints in the last couple of decades. Under activity-related payments, the rate of surgery and the capacity to support it may well have a tendency to expand beyond A. Meanwhile, the alternative ‘Beveridge’ or ‘integrated’ (also known as National Health Service) model, relies mainly on tax funding and public providers. Traditionally, it involves payment of providers by salary or capitation and closed-ended, annual global budgets for services. It also involves control of capacity. Under such arrangements, the rate of surgery can be below, at or (conceivably) above A. However, there may well be a tendency for rates to settle below A, because of the combination of opportunities for governments to squeeze capacity, in the interests of saving public expenditure, and the absence of activity-related financial incentives for providers. In addition, this model is likely to be unresponsive to changing technology and additional demand in the short run.
40. There is likely to be excess demand for elective surgery in publicly insured health systems. At a zero or heavily subsidised price for surgery, the quantity demanded will be in the vicinity of B in Chart 2.B. Meanwhile, the quantity supplied is likely to be very broadly in the vicinity of A, depending on the success with which the public system achieves the optimum at A. It is the resulting excess demand which gives rise to waiting lists and waiting times. As we have seen in Section 2.4, lists tend to build up if inflows (quantity demanded) exceed outflows (quantity supplied) of surgery. However, waiting times are likely to act as an alternative to prices in helping to generate equilibrium in queues. That is because of feedback effects – high waiting times will discourage demand and encourage supply, low waiting times will have the opposite effect.
2.7 Conceptualising optimum ‘inpatient’ waiting times
41. An important idea (following Cullis and Jones, 1985 and Iversen, 1993) is that there is an optimum mean waiting time for patients on the inpatient and day case waiting lists. Chart 3 depicts hypotheses about the effect of different waiting times on the benefits and costs of surgery. Mean waiting time is shown on the horizontal axis. The total benefits and costs of surgery are shown on the vertical axis. The chart assumes that surgery is provided at a given rate, which might or might not be the optimum rate. The rate of surgery is therefore excluded from the chart. Surgeons can, of course, vary lists and hence waiting times by varying their clinical thresholds for admitting patients to lists for any given rate of surgery.
42. It is assumed that the total benefits from surgery fall as the mean waiting time increases5. That is because health status is likely to deteriorate (on average) with waiting and because of the postponement of the benefit from surgery (time preference). On the whole, the evidence presented in Section 2.1, above and
4 In the case of private markets for surgery, when out-of-pocket payments are used it can be expected that
the equilibrium rate of surgery will be determined by patients’ ability and willingness to pay on the demand side and by competition and costs on the supply side. Prices will guide both patients and providers in the market towards an equilibrium rate of surgery and an equilibrium waiting time (putting aside the problems that arise if surgeons do not act as perfect agents). Waiting times are likely to be low partly because prices will ration demand. The equilibrium rate of surgery is likely to be higher in the presence of private health insurance, because of moral hazard. In that case, waiting times can be expected to be low partly because of the creation of spare capacity.
5 It is possible that total benefits might rise initially at low waiting times, before falling at higher waiting times, if surgeons enter patients who are not yet ‘ready’ for surgery to waiting lists. That would be more likely in systems with high rates of surgery.
DELSA/ELSA/WD/HEA(2003)6
20
Annex 1, suggests benefits decline only slowly for many categories of elective patient. Of course, benefits would fall more steeply for emergency patients.
43. Meanwhile, the costs of supplying surgery for different waiting times are assumed to be roughly U-shaped. At first, costs fall as waiting times increase. That is because there can be considerable savings in surgical (and, in general hospitals, bed) capacity if a waiting list is formed and elective patients are called in for treatment only when there are lulls in the flow of emergency patients (Cooper, 1981; Goddard, Malek, Tavakoli, 1995). This reduces the probability that supply exceeds demand, leaving capacity unused6. However, the administrative costs of a well-managed waiting list will increase with the length of the list, as will the diversion of clinical resources into regular reassessment of patients on the list (Iversen, 1993). Beyond a certain point, rising administrative and clinical costs are likely to outweigh falling capacity costs, as the length of the list increases.
44. We suggest that there is an optimum waiting time at OL where the marginal benefit of waiting on the list is equal to the marginal cost of waiting. The marginal reduction in a patients’ benefit from a higher waiting time is equal to the marginal reduction in the per-unit cost of treatment. Under Bismarckian social health insurance, so long as ‘money follows the patient’ under competitive conditions, there will be market incentives to find the optimum waiting time. Although some competing surgeons with high reputations may build up long waiting lists there are likely to be other surgeons, with lesser reputations, who will seek to make a living by offering rapid access to procedures (Iversen and Luras, 2002). However, under Beveridgean, public integrated health systems, there will be no such financial incentives to find the optimum waiting time. Rather, salaried surgeons and their managers may seek to minimise costs, setting waiting times, for example, at OM. Yet longer waiting times may be adopted by providers if hospital payment mechanisms mean that ‘money follows the queue’ or if surgeons can work in both the public and private sectors, which gives them incentives to maintain long waiting lists for public patients (Iversen, 1997).
6 Of course, it is also possible to run hospitals at too high a level of capacity leading, for example, to queuing
for emergency services. Maintaining some level of spare capacity is essential for efficient handling of emergencies.

DELSA/ELSA/WD/HEA(2003)6
21
2.8 Policies to pursue both optimal surgery rates and optimal waiting times
45. The discussion above has suggested that both markets and policy makers face the challenge of groping their way towards optimal surgery rates and optimum waiting times in an uncertain and changing world. In publicly funded health systems two of the key policy levers to achieve these goals are: changing the rate of surgery, which will depend both on surgical capacity and the productivity with which capacity is used: and changing the rate of entry to waiting lists by influencing the clinical thresholds for admitting patients to lists, a process managed mainly by surgeons. This section brings these challenges and these two levers together. It leads towards the ‘review of policies’ in subsequent sections.
46. Table 3, which abstracts from problems of uncertainty and continuous technological change, explores the combinations of the two policy levers that would be required in principle to tackle different combinations of appropriate and inappropriate surgery rates and waiting times in public systems. Most if not all of the countries with waiting time problems will find themselves in the first column of this Table

DELSA/ELSA/WD/HEA(2003)6
22
(waiting times ‘too high’) and either the second or the third rows (surgery rates ‘appropriate’ or surgery rates ‘too low’, respectively). The last column (waiting times ‘too low’) may be of little interest to countries which do not consider that they have waiting time problems. However, it may be relevant for countries which suspect that they have excess surgical capacity. Again it must be emphasised that, in practice, identifying the optimal rate of elective surgery and the optimal waiting time are difficult tasks in a world with moral hazard (arising from health insurance), clinical uncertainty, a lack of evidence about outcomes and continuous technological advance.
47. There will be different benefits and costs of adopting the various policies described in the cells of Table 3. For example, there will be significant resource costs to raising surgery rates, if that requires investment in extra capacity. By contrast, there will be few resource costs to raising clinical thresholds, although it may be difficult to change clinical behaviour under a given set of institutional and financial incentives.
Table 3. Combinations of policies to pursue optimal surgery rates and optimal waiting times
WAITING TIMES Too High Optimal/
Appropriate Too Low
SURGERY Too High Reduce surgery rates. Raise thresholds to reduce entrants to the list by a higher proportion.
Reduce surgery rates. Raise thresholds to reduce entrants to the list by a similar proportion.
Reduce surgery rates. Raise thresholds to reduce entrants to the list by a lower proportion.
RATES Optimal/ appropriate
Leave surgery rates unchanged. Raise thresholds for entrants to the list.
No action Leave surgery rates unchanged. Lower thresholds for entrants to the list.
Too Low Raise surgery rates. Lower thresholds to raise entrants to the list by a lower proportion.
Raise surgery rates. Lower thresholds to raise entrants to the list by a similar proportion.
Raise surgery rates. Lower thresholds to raise entrants to the list by a higher proportion.
DELSA/ELSA/WD/HEA(2003)6
23
3. REVIEW OF THE MAIN POLICY INITIATIVES
48. This review is structured thematically, according to the major policies which have been used to reduce or manage waiting times. Policies may address the problem by affecting the supply of surgery, the demand for surgery, or by acting directly on the waiting times. For example, on the supply side, policy levers include raising surgery rates by increasing the capacity and by improving the productivity of providers of surgery. On the demand side, they include management of demand thresholds and the subsidisation of private health insurance. Policies acting directly on waiting times include maximum waiting-times guarantees or financial and non-financial incentives related to the achievement of reductions of waiting times. For each policy, we analyse the main incentives, and provide the available evidence on its effectiveness. It is important to point out that, in practice, policies are often adopted in combinations. Such combined policies have been allocated to the policy lever which appears to be the dominant component of the combined policy. A detailed presentation of the different experiences for each of the 12 countries involved in the project is to be found in Annex 3.
49. The framework, developed in section 2, suggests that waiting times can be reduced through supply-side policies, if the volume of surgery is not considered adequate or through demand-side policies, if the volume of surgery is considered to be adequate. Policy makers are likely to want to pursue both optimum surgery rates and optimum waiting times by operating such levers – despite the difficulties in identifying such optima. In the countries included in this study, they are also likely to want to pursue principles such as treatment in accordance with need and equity of access.
50. One pre-requisite for the development and evaluation of policies is the collection of an adequate database. Over the years, many governments have invested in extracting waiting-times data from their administrative databases. Several have provided online information on waiting times broken down by surgical procedures, by hospitals, and sometimes at specialist level, to assist consumer choice. The quality of administrative databases has generally increased over time (see section 3.1.9 for more details).
51. We attempt to evaluate policies with respect to both benefits and costs. The evaluations are however handicapped by the fact that they are mainly based on ‘before and after’ comparisons - with their limited ability to determine causation. Also, they are invariably subject to confounding factors (for example the contemporaneous introduction of other policies).
52. To evaluate the different policies we have often referred to variations in aggregate waiting-times figures. It is important to warn readers that, while the aggregate waiting times are comparable within a country across different years (unless changes in definitions occurred), they may not be comparable across-countries. For example, as has been mentioned in Section 2.5 above, they may include the waiting time from GP referral to specialist assessment (as for Denmark). They may include or exclude waiting times in day-surgery and may refer to different summary statistics (mean, median); they may also refer to the waiting time of the patients admitted or to the waiting time of the patients on the list at a point in time. Finally they may include different sub-sets of procedures. A more detailed discussion of the different measurements of waiting times is contained in Annex 2.

DELSA/ELSA/WD/HEA(2003)6
24
3.1 Supply-side policies
53. If the volume of surgery is not considered adequate, waiting times can be reduced through supply-side policies. The policies described below may be classified into three main categories “increasing productivity of public hospitals” (funding extra-activity, introducing activity-based funding, encouraging day-surgery, reforming the contract for specialists), “increasing capacity” (via the public sector, via the private sector, sending patients abroad), and “changing incentives” (increasing choice for the patients).
3.1.1 Increasing productivity in the public sector by funding extra activity
54. In many of the countries in this study, public hospitals have been funded according to fixed budgets. Several governments have tried to tackle high waiting times by adding temporary and limited amounts of resources to these budgets. Often, the intention has been to provide extra-funds to existing hospitals to perform extra activity (for a given capacity), raising the productivity of the hospitals (in terms of number of treatments per surgeon or per bed). However, the extra funding may be allocated according to very different criteria. It is then important to analyse for ‘how long’, to ‘whom’ and ‘how’ the extra-funding is allocated. Most often these increases in funding have had a temporary nature. The funding may be allocated either directly to the final provider of surgery (the hospital) but it may also be allocated to some intermediate institution between the government and the hospital, such as the county or the health authority.
55. There have been at least three different ways in which funds have been tied to the achievement of waiting-time objectives: i. they may be allocated to hospitals with higher waiting lists and waiting times (in England after 1986); ii. they may be allocated to hospitals who perform extra-activity (in Sweden between 1987 and 1989, in the Netherlands between 1997 and 2000, and in Australia under the Medicare Agreements between 1993-1998); or iii. they may be allocated to hospitals who perform extra-activity and succeed in reducing waiting times (in Spain between 1996-2000; in Victoria (Australia) in 1993).
56. Temporary policies have temporary effects. Policy makers may think of a waiting list as a backlog of patients that can be eliminated through the one-off introduction of temporary dedicated funding. However such a perspective ignores the dynamic nature of waiting times and waiting lists and the continuous nature of technological change. The waiting time is affected not only by the number of patients on the list at one point in time but also by the number of patients that are continuously added to the list (Worthington, 1987 and 1991). A temporary increase in supply may, at most, slow down the growth in waiting times or decrease waiting times for a short period of time. Apart from technological change, new demand is likely to be stimulated by a reduction in waiting times, dissipating the effect of an increase in activity.
57. Moreover, several incentive issues arise from the above types of funding. If additional funding is allocated to hospitals with higher waiting times and lists, hospitals may not have sufficient incentive to reduce the waiting time because of the expectation that the additional resources will be withdrawn once the waiting time has been reduced (Iversen, 1993).
58. In the case that additional funding is allocated to hospitals conditional on the delivery of extra-activity, two problems may be identified. First, it may be difficult to distinguish between ‘ordinary’ activity and ‘extra-activity’ and the hospital has an incentive to shift ‘ordinary’ activity into ‘extra-activity’ (Gonzalez-Busto, Garcia, 1999). Second, there may be an increase in the demand for surgery if the waiting time decreases. The impact in terms of reductions in waiting times may then be small or non-existent.
59. In the case that additional funding is allocated to hospitals conditional upon the delivery of extra-activity and an agreed reduction in waiting times, then the hospital has an incentive to increase activity
DELSA/ELSA/WD/HEA(2003)6
25
and, at the same time, it has no incentive to increase the number of additions to the list (by allowing thresholds to fall). Such a dual approach seems the most appropriate to obtain significant reductions in waiting times.
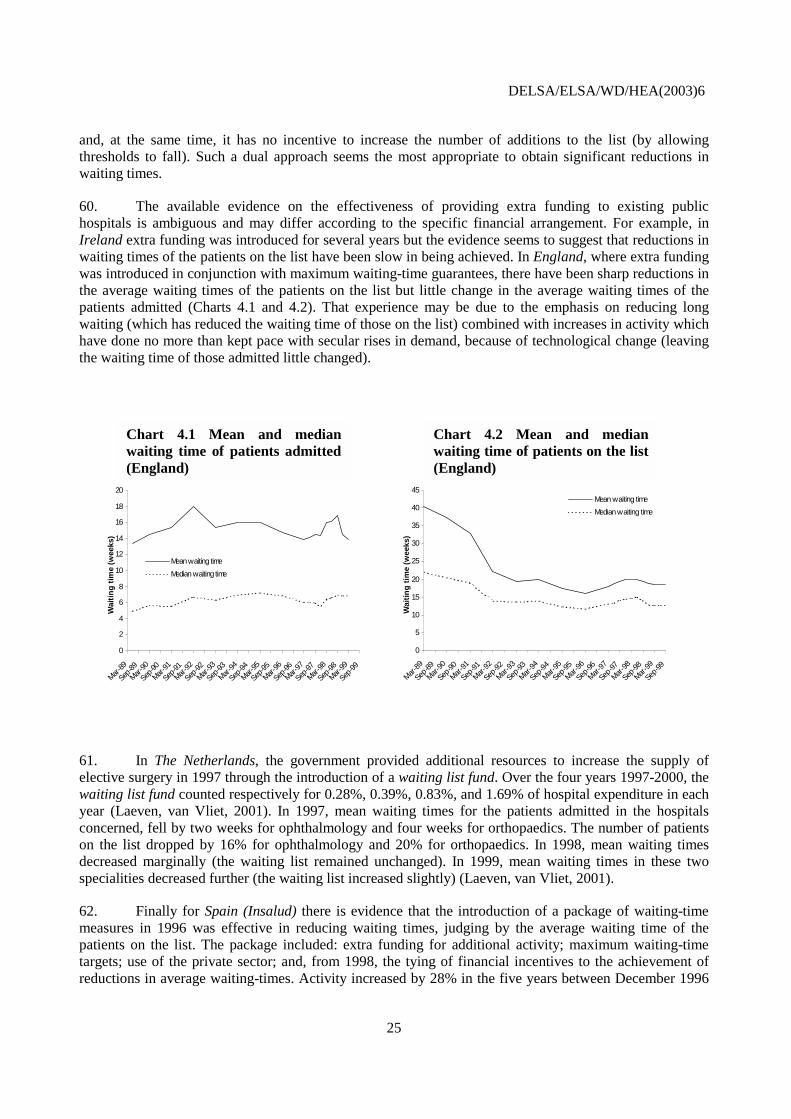
60. The available evidence on the effectiveness of providing extra funding to existing public hospitals is ambiguous and may differ according to the specific financial arrangement. For example, in Ireland extra funding was introduced for several years but the evidence seems to suggest that reductions in waiting times of the patients on the list have been slow in being achieved. In England, where extra funding was introduced in conjunction with maximum waiting-time guarantees, there have been sharp reductions in the average waiting times of the patients on the list but little change in the average waiting times of the patients admitted (Charts 4.1 and 4.2). That experience may be due to the emphasis on reducing long waiting (which has reduced the waiting time of those on the list) combined with increases in activity which have done no more than kept pace with secular rises in demand, because of technological change (leaving the waiting time of those admitted little changed).
61. In The Netherlands, the government provided additional resources to increase the supply of elective surgery in 1997 through the introduction of a waiting list fund. Over the four years 1997-2000, the waiting list fund counted respectively for 0.28%, 0.39%, 0.83%, and 1.69% of hospital expenditure in each year (Laeven, van Vliet, 2001). In 1997, mean waiting times for the patients admitted in the hospitals concerned, fell by two weeks for ophthalmology and four weeks for orthopaedics. The number of patients on the list dropped by 16% for ophthalmology and 20% for orthopaedics. In 1998, mean waiting times decreased marginally (the waiting list remained unchanged). In 1999, mean waiting times in these two specialities decreased further (the waiting list increased slightly) (Laeven, van Vliet, 2001).
62. Finally for Spain (Insalud) there is evidence that the introduction of a package of waiting-time measures in 1996 was effective in reducing waiting times, judging by the average waiting time of the patients on the list. The package included: extra funding for additional activity; maximum waiting-time targets; use of the private sector; and, from 1998, the tying of financial incentives to the achievement of reductions in average waiting-times. Activity increased by 28% in the five years between December 1996
0
2
4
6
8
10
12
14
16
18
20
Mar-89
Sep-
89
Mar-90
Sep-
90
Mar-91
Sep-
91
Mar-92
Sep-
92
Mar-93
Sep-
93
Mar-94
Sep-
94
Mar-95
Sep-
95
Mar-96
Sep-
96
Mar-97
Sep-
97
Mar-98
Sep-
98
Mar-99
Sep-
99
Wai
tin
g t
ime
(wee
ks)
Mean waiting time
Median waiting time
Chart 3.1 Mean and medianwaiting time of patients admitted(England)
0
5
10
15
20
25
30
35
40
45
Mar-8
9
Sep-
89
Mar-9
0
Sep-
90
Mar-9
1
Sep-91
Mar-9
2
Sep-
92
Mar-9
3
Sep-
93
Mar-9
4
Sep-94
Mar-9
5
Sep-95
Mar-9
6
Sep-
96
Mar-9
7
Sep-97
Mar-9
8
Sep-98
Mar-9
9
Sep-
99
Wai
tin
g t
ime
(wee
ks)
Mean waiting time
Median waiting time
Chart 3.2 Mean and medianwaiting time of patients on the list(England)
Chart 4.1 Mean and median waiting time of patients admitted (England)
Chart 4.2 Mean and median waiting time of patients on the list (England)

DELSA/ELSA/WD/HEA(2003)6
26
and December 2000 (chart 5.2), at an annual growth rate of 6.5%. Average waiting times (of the patients on the list) fell from 210 days in June 1996 to 67 in December 2000 (chart 5.1, Pancorbo and Moral, 2002). There may be some parallels between British and Spanish experience in reducing the waiting times of patients on the list (Charts 4.2 and 5.1).
0
50
100
150
200
250
Jun-96 Dec-96 Jun-97 Dec-97 Jun-98 Dec-98 Jun-99 Dec-99 Jun-00 Dec-00
Wai
tin
g t
ime
(day
s)
Chart 5.1 Mean waiting time (days) for patients
on the list. (Insalud, Spain)
Chart 5.2 Surgical treatments provided,
(Insalud, Spain)
0
50000
100000
150000
200000
250000
300000
350000
400000
450000
500000
Jun-96
Dec-96
Jun-97
Dec-97
Jun-98
Dec-98
Jun-99
Dec-99
Jun-00
Dec-00
Nu
mb
erTotal activityPublic activity (normal)Public activity (extra hours)Private activity
63. Examining the change in waiting times at surgical procedure level for Insalud patients, the reductions in waiting times were more mixed and varied in an interesting way over time (OECD data questionnaire). Table 4 shows how the waiting times (of the patients on the list) were declining over the whole period 1992-2000, with the exception of cholecystectomy, inguinal and femorial hernia, and vaginal hysterectomy. However, the rate of decline generally accelerated after the introduction of the package of measures in 1996 (see last two columns in Table 4). More significantly, perhaps, the comparison of waiting times in 1998 and 1999 suggests that there were pronounced reductions in waiting times for most procedures following the tying of financial incentives to the achievement of maximum and mean waiting-time targets in 1998.
Table 4. Spain. Waiting times on the list for publicly funded patients (days)
1992 1993 1994 1995 1996 1997 1998 1999 2000 1994-2000
1996-2000
ICD-9-CM code
Mean waiting
time
Mean waiting
time
Mean waiting
time
Mean waiting
time
Mean waiting
time
Mean waiting
time
Mean waiting
time
Mean waiting
time
Mean waiting
time
Avg. growth
rate
Avg. growth
rate
Cataract surgery 13.1-13.7 68.07 62.13 61.62 54.54 58.24 55.39 55.52 47.62 47.64 -4.2% -4.9%
Cholecystectomy 51.2 103.36 58.26 50.44 48.18 60.8 56.02 61.97 53.21 53.81 1.1% -3.0%
Inguinal and fem. Hernia
53.0-53.3 84.61 49.96 47.01 48.27 59.35 47.86 54.86 44.42 48.29 0.4% -5.0%
Prostatectomy 60.2-60.6 119.43 46.88 81.65 49.36 55.94 38.52 56.05 39.21 42.66 -10.3% -6.6%
Vaginal hysterectomy 68.5 71.09 19 25.32 43.98 58.67 55.73 41.26 52.52 18.5% 4.5%
Knee arthroscopy 80.26,80.6 51.39 82.22 65.78 71.41 72.51 61.03 58.22 61.3 53.77 -3.3% -7.2%
Hip replacement 81.51-81.53 271.43 77.25 81.53 97.24 80.65 70.02 72.29 63.71 59.77 -5.0% -7.2%
Knee replacement 81.54-81.55 91.31 75.64 88.88 104.91 79.94 74.7 71.86 60.11 63.38 -5.5% -5.6%
Varicose veins 38.5 232.75 80.39 57.23 69.41 66.05 57.04 78.32 58.61 50.63 -2.0% -6.4%

DELSA/ELSA/WD/HEA(2003)6
27
64. In Victoria (Australia), during the period July 1993 - July 1994, there is evidence that following extra-funding conditional upon reductions in waiting times, the number of ‘category 1’ patients (supposed to receive treatment in 30 days) waiting more than 30 days fell dramatically from 849 to 5. The number of ‘category 2’ patients (supposed to receive treatment in 90 days) waiting more than 90 days fell from 5 435 to 3 026. The number of ‘category 3’ patients (supposed to receive treatment within 12 months) waiting more than 12 months remained stable at approximately 15 300 patients (Street and Duckett, 1996).
3.1.2 Increasing productivity by introducing activity-related payment (of the DRG type) for public hospitals
65. A more systematic and long-term policy to raise productivity is to introduce activity-related payments for hospitals remuneration. In most of the countries included in this review, publicly funded hospitals were formerly financed through fixed (or semi-fixed) budgets. Several countries have now begun to introduce activity-related payments to public hospitals, if only partially, usually in the form of payments by case, classified by Diagnosis Related Groups (DRGs).
66. Fixed budgets provide poor incentives for productivity, since higher volumes of activity leave revenues unchanged. Greater effort, or ingenuity, to raise productivity goes unrewarded. Conversely, lower activity provides comfortable margins and a quieter life for staff without any sacrifice of revenue. This is sometimes called ‘the efficiency trap’. Under activity-based payments, by contrast, higher productivity is rewarded with higher revenues. In this way providers have an incentive to increase the volume of activity up to the frontier of their ‘production function’. The increase in activity will require additional funding unless activity-based funding is combined with pre-determined macro budgets, in which case fee rates must go down if the total volume of activity goes up (however, quality may suffer in this case). The upward pressure on expenditure may be reinforced by a well-known phenomenon associated with activity-based funding: an increase in the reported intensity of the case-mix of the hospital (‘DRG-creep’).
67. Analogously to most policies introduced on the supply side, an increase in activity is not a guarantee of success in reducing waiting times. The final effect will depend on both the feedback effects on demand and the secular trends in demand.
68. In Norway the government introduced partial activity-based remuneration in 1997, covering 30% of the average DRG-based costs per inpatient treated (50% since 1999 and 55% since 2002). A study of 48 acute hospitals between 1992 and 2000 suggested that the policy led to a rise in the annual growth rate of hospital activity from 2% between 1992-1996 to 3.2% between 1997-1999 (Biorn et al., 2002). Surprisingly, overall real public health expenditure on health remained stable or decreased (OECD Health Data). However, no evidence is available on the impact on waiting times. Other countries have recently considered the introduction of activity-based funding. In Denmark, since 1999 the counties have been obliged to use a minimum of 10% of their grants for activity-based financing in the health care sector. In England, where there is purchaser/provider separation, hospitals will be ‘paid by results’ through the use of Health Resource Groups (HRG) - an English version of DRGs – from 2002. In the Netherlands from 2003 the system will be changed to an activity-based remuneration system through the implementation of ‘Diagnosis treatment combinations’ (DBCs), a system similar to the American DRG-pricing.
3.1.3 Increasing productivity by reforming the contract of specialists
69. A complementary policy to the reform of hospital remuneration, is the reform of specialist remuneration. Two main approaches have been adopted. The first consists of providing rewards or penalties for specialists to reach predetermined targets, either in terms of output (to encourage productivity) or in terms of reductions in waiting times. The second approach consists in reinforcing the

DELSA/ELSA/WD/HEA(2003)6
28
exclusivity of the relationship between the public employer (NHS or other public insurers) and the specialists, partially limiting the extent to which specialists are allowed to have ‘dual practices’ (working both in publicly funded and privately funded institutions).
70. If specialists are salaried, higher effort in production will go unrewarded. Moreover, they may also have incentive to keep severity threshold levels low and refer many low-severity patients for treatment, since long waiting times may be a sign of prestige. The introduction of bonuses (or penalties) for specialists respecting pre-determined waiting-times targets may to some extent reverse these incentives by encouraging increases in productivity and raising of the severity thresholds to be admitted on the waiting list.
71. In Spain, bonuses for specialists who have achieved waiting-times reductions (which accounted for 2-3% of their salary), may have contributed to a steady reduction in waiting times. Other countries are following this idea. In England, from 2001 the ‘Performance Fund’ has included rewards for staff (new equipment, improved facilities and amenities), and cash incentives for individuals and teams. Moreover, since 1998 executive directors of Health Authorities and Trusts not reaching waiting times (or other) targets can be dismissed.
72. In The Netherlands, fixed budgets for specialists, in replacement of fee for service arrangements, were piloted between 1995 and 1997 in five hospitals and extended to all hospitals by 1997. During the experimental period, admissions went down and inpatient waiting times increased in five of the six hospitals involved in the pilot (Mot, 2002).
73. On a separate issue, it has been pointed out (Yates, 1987, 1995; Iversen, 1997; Morga and Xavier, 2001) how a conflict of interest may arise for surgeons employed in public hospitals who also work in private practices (dual practice). Specialists working for public hospitals may have an incentive to use long waiting times (for public patients) to raise the demand for their private practice. This incentive is strengthened when a significant share of patients are privately insured (Morga and Xavier, 2001).
74. Dual practice is indeed common among several OECD countries (Denmark, England, Ireland, New Zealand, Norway, Spain, Sweden, Australia, Finland and Italy), even if restrictions may be imposed either in terms of earnings (in England there is a 10% private earning restriction for full-time specialists, not for part-time specialists), in terms of authorisations (Finland) or by other regulations (in Italy only part-time specialists are entitled to dual practice). Moreover, in a limited number of countries, specialists working in publicly funded hospitals can also visit or treat private patients within the same institution (for example in Australia, Denmark, England, and Ireland). Countries where specialists cannot in any case either visit or treat private patients in public hospitals are Spain, Sweden and Netherlands.
75. In Ireland, in the Health Strategy it was noted that the current mix between public and private practice was a contributory factor to unacceptably long waiting times for public patients. It was proposed that newly appointed specialists within publicly funded hospitals should work exclusively for public patients for a specified number of years. There will also be greater surveillance and monitoring of the public/private mix to ensure that admissions to acute hospitals are managed so that the designed ratio between public and private patients is maintained and access by public patients is protected. In England, it was proposed that the specialist’ contract should be changed from an ambiguous ‘five to seven’ fixed sessions per week to ‘seven fixed sessions’. Moreover, it was proposed that newly qualified specialists should work exclusively for the NHS for the first seven years of their career, providing eight fixed sessions. However, this contract was rejected by the specialists in England in 2002.
DELSA/ELSA/WD/HEA(2003)6
29
3.1.4 Increasing productivity in the public sector by improving the management of the waiting list
76. Some countries have tried to reduce waiting times by encouraging improvements in the management of surgical units. The simple idea is that, by eliminating inefficiency in the management of the list, the number of treatments for a given level of personnel and capital endowment, can be increased.
77. In Australia the ‘National Demonstration Hospital Program’ (1995-1997) identified a number of ways to improve elective surgery management: the introduction of ‘Pre-admission and admission services’; optimisation of patient’s health status prior to admission; facilitation of day-surgery admissions; optimisation of the operating room schedule, by reducing cancellations on the day of the scheduled surgery; education of the patient and the family about hospital procedures; and computerisation of patient’s data. It suggested that efficient management would require an ‘operating theatre utilisation’ of about 80-85% and the introduction of an Operating Room Management Committee charged with monitoring the number of cancelled operations and the number of unused sessions (for further details, see National Demonstration Hospitals Program, 1997a). An 18-month evaluation study following the project, suggested that 61% of the hospitals involved had overall efficiency gains. Operating room utilisation increased by 5.1% and the number of procedures per hour increased by 5.5%. Cancellation of surgery on the planned day of admission decreased by 59%. The rate of unplanned, unbooked re-admissions fell by 26% (National Demonstration Hospitals Program, 1997b).
3.1.5 Increasing productivity by raising the use of day-surgery
78. In the last twenty years there has been a steady growth in the share of surgery carried out by day-surgery in many countries, thanks mainly to technological and medical innovations, such as less invasive surgery and better anaesthetics. Day-surgery is beneficial because it reduces the unit cost of treatment, which is driven by the length of stay. For a given endowment of beds, the availability of less invasive surgery can increase the volume of treatments performed and free up hospital beds. However, if the increase in day-surgery utilisation is accompanied by a contemporaneous reduction in the number of hospitals beds (as in most OECD countries), then the net impact on activity may be lessened. Moreover, less invasive and safer treatments raise the net benefits for the patient, making the procedures more desirable. That is likely to lead an increase in demand, especially for groups such as the very elderly, for whom there would otherwise be counter-indications for invasive surgery. The final effect on waiting times is then indeterminate.
79. Several governments have taken steps to encourage day surgery. For example in England it is planned to introduce ‘Diagnostic and Treatment Centres’ (NHS Plan). In partnership with the private sector, Diagnostic and Treatment Centres will be developed to increase the number of elective operations which can be treated in a single day or with a short stay. These Centres will focus on routine hospital surgery and not on hospital emergency work so they can concentrate on getting waiting times down. Also, in Australia, several States and Territories have promoted the extension of day-surgery admissions within their hospitals. In Queensland (Australia), targets in terms of percentage of procedures performed as day surgery have been set as high as 50%, with a longer-term goal of 80%.
3.1.6 Funding extra-capacity in the public sector
80. Many countries have invested in extra medical and surgical capacity in the last two decades to face the increasing demand arising from technological changes, which have increased the range of conditions and patients that are treatable surgically. For example physician numbers have increased in all the countries in this study except Canada and Sweden. However past increases in capacity seem to have been recently found insufficient in at least two countries, England and Ireland. Both of these countries

DELSA/ELSA/WD/HEA(2003)6
30
have relatively lower levels of capacity, but have recently announced large future increases (6% increase in Ireland during the period 2002/2003; 7.4% increase in England by 2004).
81. Large increases in capacity may have a different impact on waiting times according to the level of excess demand and of the initial waiting time. Countries with low supply and high initial waiting times are likely to have elastic demand to variations in waiting times. For this reason, the effect of even large increases in capacity on waiting times may be quite modest. Nevertheless, there is econometric evidence (of a cross-sectional kind, at national level) showing that higher capacity in terms of higher beds and physicians is associated with lower waiting times (Martin and Smith, 1999; Lindsay and Feigenbaum, 1984).
82. The expansion of physical capacity (building new surgical units) is a long-run policy which may require time to be implemented (for example between two and five years). The process of increasing the health workforce may be even slower, since physicians and specialists need to be trained for several years before they can become active. Although it is possible to recruit staff from abroad, such staff may encounter assimilation difficulties and such a policy can also take time.
83. It is interesting to compare how different countries vary capacity to respond to increases in demand driven by changes in medical technology. In this respect, there is an interesting contrast in the way that Denmark and England reacted in the 1990s to the upsurge in demand for coronary revascularisation procedures (coronary artery bypass grafting (CABG) and percutaneous coronary angioplasty (PTCA). In Denmark, It was recognised by the late 1980s that rates of revascularisation were low by international standards, despite high rates of cardiovascular disease. Alarmingly long waiting lists had sprung up for the new revascularisation procedures. Accordingly, a national ‘Heart Plan’ was drawn up in 1992 which described optimal treatment patterns for heart disease and the numbers of patients who could benefit. A new Government decided to fund the Plan to the cost of 700 million Danish Crowns in 1993. There was investment in additional operating theatres and equipment and more staff were employed. Fortunately, Denmark had increased its training of doctors in the 1980s and there were reasonable numbers of junior doctors who could be given more responsibility7. Doctor numbers per thousand had been above the OECD average in 1980 and they increased by 50% in the following 15 years. As a result, procedure rates increased rapidly – by about 70% for CABG and nearly 5 fold for PTCA between 1993 and 2000 (chart 6.1) (Videbaek and Madsen, 2001). This brought down waiting times in a sustained way. Patients waiting more than four weeks for PTCA and CABG declined from 50% to 29% for both procedures combined between 1994 and 2001 (chart 6.2). Data on median waiting times are available from 1996. They suggest that median waiting times declined by about 50% for both PTCA and CABG between 1996 and 2001 (chart 6.3). There is also evidence that the successful implementation of the ‘Heart Plan’ may have had favourable effects on health outcomes. Mortality within 28 days after admission for a heart attack had been fairly stable in Denmark between 1985 and 1992 at around 30%. It fell by over a third thereafter, to below 20% in 1998. Better drugs as well as increased surgery rates are likely to have played a part in these changes.
7 Information supplied by Danish Heart Foundation.

DELSA/ELSA/WD/HEA(2003)6
31
0
20
40
60
80
100
120
1990 1991 1992 1993 1994 1995 1996 1997 1998 1999 2000
Pro
ced
ure
s / 1
0000
0 p
op
ula
tio
n
PTCA - DenmarkPTCA - EnglandCoronary bypass - DenmarkCoronary bypass - England
PTCA - Denmark
PTCA - England
CABG - Denmark
CABG - England
0
10
20
30
40
50
60
1994 1995 1996 1997 1998 1999 2000 2001
Per
cen
t w
aiti
ng
>=
4 w
eeks
PTCA & Bypass
0
20
40
60
80
100
120
140
160
180
200
1991 1992 1993 1994 1995 1996 1997 1998 1999 2000 2001
Med
ian
wai
ting
tim
e (d
ays)
PTCA - DenmarkPTCA - EnglandCoronary bypass - DenmarkCoronary bypass - England CABG - England
PTCA - England
PTCA - Denmark
CABG - Denmark
Chart 6.1 Procedure rates for bypass and PTCA. Denmark and England
Chart 6.2 Percentage of patients waiting longer than 4 weeks. Denmark
Chart 6.3. Median waiting time for patients admitted for bypass and PTCA. Denmark and England.

DELSA/ELSA/WD/HEA(2003)6
32
84. Meanwhile in England, although it may have been recognised by the late 1980s that revascularisation procedures were low by international standards despite high rates of coronary artery disease, it was not until 1999 that a Government Plan, or ‘National Service Framework for Coronary Heart Disease’ was published (Department of Health, 2001). There it was acknowledged that, “…over many years the NHS has not invested sufficiently in coronary revascularisation.” ₤50 million was earmarked for extra facilities and staff for coronary care. Britain had fewer physicians per capita than Denmark in 1980 (only two thirds of the OECD average) and numbers had increased by only 23% in the subsequent 15 years. By 1995, Britain had half the number of physicians per capita of Denmark. Although England had slightly higher rates of PTCA and CABG than Denmark in 1990, growth rates for these procedures grew more slowly than in Denmark in the following decade (Chart 6.1). Whereas in Denmark, waiting times for these procedures fell, in England they rose steeply. Median waiting times rose to 65 days for PTCA and 200 days for CABG in 2001 (compared with 19 days and 21 days, respectively, in Denmark). These figures may not be strictly comparable across the countries because in Denmark, “patients who are admitted as urgent cases but have in fact been waiting for treatment are included as waiting patients”. Moreover, in Denmark the waiting time is measured from the day of GP referral to the day of treatment (response to OECD questionnaire).
85. Although it is difficult to make precise comparisons, mortality following admission after heart attack seems to have declined for most age and gender groups in England but did so more slowly than in Denmark between 1992 and 1998, judging by data made available for the Oxford Region to the OECD’s Aging Related Diseases Project. England announced further significant and sustained increases in NHS spending, capacity and staff in the Budget of 2002.
3.1.7 Using capacity in the private sector
86. An alternative to increasing capacity in the public sector is to use existing capacity in the private sector. Such initiatives can take the form of a purchaser of health services (the government, the county/region/health authority or the public hospital itself) contracting out to privately-owned providers some volume of activity for publicly funded patients. It is sometimes the case that patients can access the private provider only after a predetermined time has been waited (usually two, three months). This was the case in Denmark since July 2002 under the initiative “money follows the patient”, in Ireland under the new dedicated “National Treatment Purchase Fund” and in Sweden under the three-month maximum waiting-time guarantee between 1992-1996. Other countries which made use of private providers are England, New Zealand, in Spain (Insalud), and Australia.
87. Buying from the private sector may present some advantages. First, it may be the quickest way to increase capacity compared to other options (for example by constructing new public hospitals, which may take years and may imply a high initial investment cost). Second, contracting with private providers may introduce an element of competition with public providers. A potential disadvantage is that if the supply of specialists is limited and specialists work both within the public and private sector, an increase in activity in the private sector may necessitate a reduction in the activity performed in the public sector. As for the other supply policies, the final effect on waiting times will also depend on variations in demand.
88. In the case of England, the use of private hospitals and private beds in the early years of the ‘Waiting-times Initiative’ may have helped to achieve the reductions in long waiting that were observed. In the case of Spain, the policy may well have contributed to the overall success of Insalud’s initiative.
DELSA/ELSA/WD/HEA(2003)6
33
However, in Sweden during 1992-1996 it has been observed that very few patients opted for a private treatment, after waiting for three months (Hanning and Spangberg, 2000).
3.1.8 Using capacity abroad
89. Some countries, like Norway, Denmark, Ireland, England and Netherlands have increased the supply of surgery by purchasing extra activity abroad. This policy is normally justified by the shortage of capacity in the public health care system. The arguments in favour of this initiative (and against national private providers) are that the national private sector may be fairly small and already working at maximum capacity as well. This may be especially the case when the workforce is short of surgeons. (If the supply of surgeons is limited, a large availability of beds, even in the private sector, will not help to increase the maximum number of treatments to be provided). Another element to be taken into account in choosing to send patients abroad is the purchasing power of the currency in the country. The obvious consideration is that countries with strong purchasing power may find it less expensive to buy treatments abroad. However, exchange rates are subject to variations.
90. It is difficult to provide evidence of the effectiveness of these initiatives since they are rather recent. The only country that has sent a significant number of patients abroad for several years is Norway, for which no significant reductions in waiting times have been observed. Treatments abroad have included mainly orthopaedic patients and to a lesser extent plastic surgery. For these patients, the cost of treatment has been estimated to be approximately the same as at home. On the other hand, critics have pointed out that the funding for patient abroad could have been used more effectively to finance national initiatives. Moreover, patients who returned to Norway, may still need some further assistance and treatment from their local hospitals (which increases the estimated cost). Among the benefits of the policy, it was considered that Norwegian doctors could also benefit by accompanying the patients by learning about more efficient management models applied abroad.
3.1.9 Increasing choice for patients
91. Traditionally, tax-funded, integrated health systems have offered patients little, if any, choice of surgical provider. However, several countries with systems such as those of England, Denmark, Norway and Sweden, have recently introduced more choice for patients, often in conjunction with activity-based payment. Part of the logic is that by increasing choice, patients will tend to move from areas with high waiting times to areas with low waiting times, leading to a fairer distribution of waiting times across regions and providers. In addition, it is reasoned that an increase in patient choice will encourage hospitals to compete for patients and revenues. Patient choice within publicly funded programmes may be extended not only to public hospitals but also, subject to assessment for eligibility, to private hospitals and even to treatment abroad. Such choice may well be conditional on the patient having waited for a certain amount of time (for example two/three months). Alternatively patient’s choice may be confined to a particular geographical area (for example the county) or involve some restrictions on the choice of the type of hospitals.
92. A prerequisite for this type of policy is the dissemination of information on waiting times. Over the years, many governments have invested in extracting waiting times data from their administrative databases. Several have provided online information on waiting times broken down by surgical procedures, by hospitals, and sometimes at specialist level, to assist consumer choice8.
8 See for example http://www.nhs.uk/waitingtimes/waitingtimes.asp for England ;
http://www.swl.hlth.gov.bc.ca/swl/index.htm for British Columbia, Canada; http://www.venteinfo.dk/ventelister/ for Denmark; http://www.wachtlijstaanpak.nl/ for the Netherlands; http://www.sykehusvalg.net/ for Norway; http://www.lf.se/vantetider/ for Sweden.
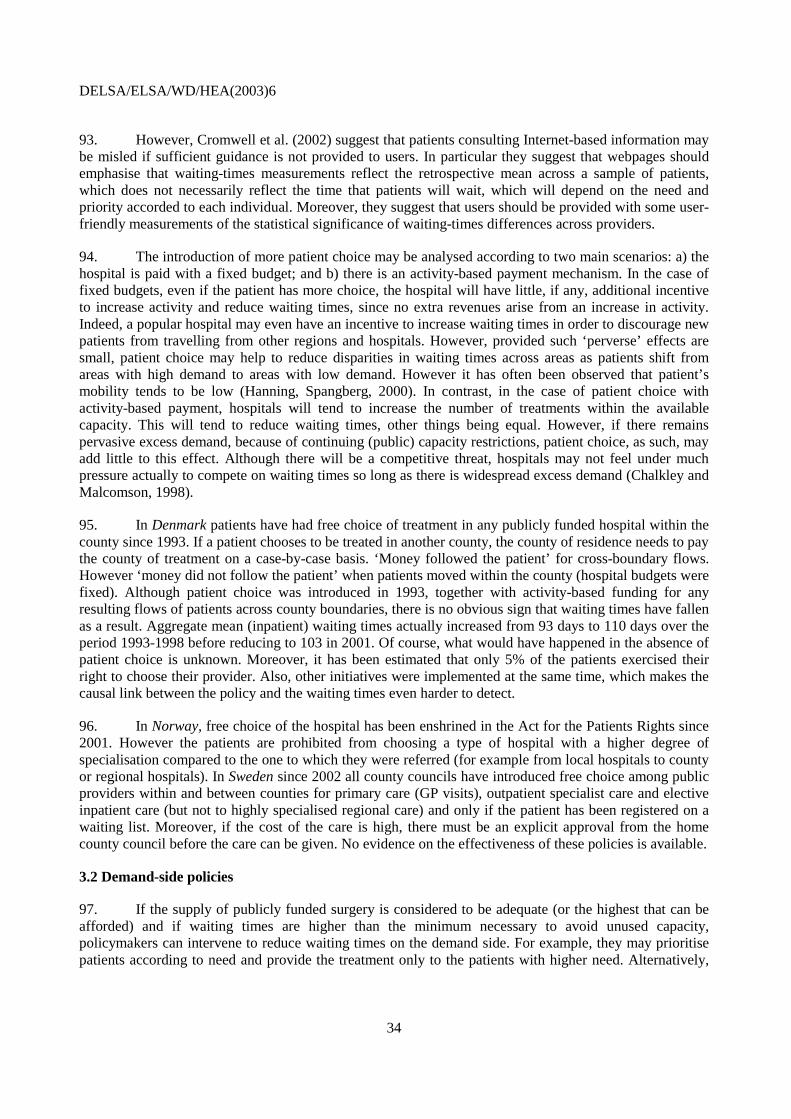
DELSA/ELSA/WD/HEA(2003)6
34
93. However, Cromwell et al. (2002) suggest that patients consulting Internet-based information may be misled if sufficient guidance is not provided to users. In particular they suggest that webpages should emphasise that waiting-times measurements reflect the retrospective mean across a sample of patients, which does not necessarily reflect the time that patients will wait, which will depend on the need and priority accorded to each individual. Moreover, they suggest that users should be provided with some user-friendly measurements of the statistical significance of waiting-times differences across providers.
94. The introduction of more patient choice may be analysed according to two main scenarios: a) the hospital is paid with a fixed budget; and b) there is an activity-based payment mechanism. In the case of fixed budgets, even if the patient has more choice, the hospital will have little, if any, additional incentive to increase activity and reduce waiting times, since no extra revenues arise from an increase in activity. Indeed, a popular hospital may even have an incentive to increase waiting times in order to discourage new patients from travelling from other regions and hospitals. However, provided such ‘perverse’ effects are small, patient choice may help to reduce disparities in waiting times across areas as patients shift from areas with high demand to areas with low demand. However it has often been observed that patient’s mobility tends to be low (Hanning, Spangberg, 2000). In contrast, in the case of patient choice with activity-based payment, hospitals will tend to increase the number of treatments within the available capacity. This will tend to reduce waiting times, other things being equal. However, if there remains pervasive excess demand, because of continuing (public) capacity restrictions, patient choice, as such, may add little to this effect. Although there will be a competitive threat, hospitals may not feel under much pressure actually to compete on waiting times so long as there is widespread excess demand (Chalkley and Malcomson, 1998).
95. In Denmark patients have had free choice of treatment in any publicly funded hospital within the county since 1993. If a patient chooses to be treated in another county, the county of residence needs to pay the county of treatment on a case-by-case basis. ‘Money followed the patient’ for cross-boundary flows. However ‘money did not follow the patient’ when patients moved within the county (hospital budgets were fixed). Although patient choice was introduced in 1993, together with activity-based funding for any resulting flows of patients across county boundaries, there is no obvious sign that waiting times have fallen as a result. Aggregate mean (inpatient) waiting times actually increased from 93 days to 110 days over the period 1993-1998 before reducing to 103 in 2001. Of course, what would have happened in the absence of patient choice is unknown. Moreover, it has been estimated that only 5% of the patients exercised their right to choose their provider. Also, other initiatives were implemented at the same time, which makes the causal link between the policy and the waiting times even harder to detect.
96. In Norway, free choice of the hospital has been enshrined in the Act for the Patients Rights since 2001. However the patients are prohibited from choosing a type of hospital with a higher degree of specialisation compared to the one to which they were referred (for example from local hospitals to county or regional hospitals). In Sweden since 2002 all county councils have introduced free choice among public providers within and between counties for primary care (GP visits), outpatient specialist care and elective inpatient care (but not to highly specialised regional care) and only if the patient has been registered on a waiting list. Moreover, if the cost of the care is high, there must be an explicit approval from the home county council before the care can be given. No evidence on the effectiveness of these policies is available.
3.2 Demand-side policies
97. If the supply of publicly funded surgery is considered to be adequate (or the highest that can be afforded) and if waiting times are higher than the minimum necessary to avoid unused capacity, policymakers can intervene to reduce waiting times on the demand side. For example, they may prioritise patients according to need and provide the treatment only to the patients with higher need. Alternatively,
DELSA/ELSA/WD/HEA(2003)6
35
they may encourage private health insurance coverage, which could generate a reduction in the demand of public treatments and an increase in the demand of private treatment.
3.2.1 Controlling demand on the basis of need
98. An important option available to policy makers for reducing waiting times is to try to control the level of demand for elective surgery. Surgeons may be encouraged to prioritise patients more systematically in terms of urgency and need and to raise their thresholds to match demand better to the available capacity. At the same time, general practitioners may be persuaded to provide ongoing alternative ambulatory medical care for the patients who cannot be offered surgery in the near future.
99. An important pre-requisite for this policy is the availability of agreed prioritisation guidelines, as described in the next section.
100. There is only one country where this approach has been implemented fully. In New Zealand, in recognition of the fact that resources for the public service are limited, it has been decided that patients on the waiting list should be prioritised according to need and that public treatment should be provided only to the patients with higher need. A ‘booking system’ has been introduced which gives patients certainty about their eligibility for surgery (not certainty of treatment). Patients are classified according to three possible categories: a) Scheduled for surgery/booked, b) Certainty of treatment within six months, c) Active care and review. Patients with high need are scheduled for treatment (booked) or given assurance that they will receive the treatment within 6 months (certainty) (Hefford, Holmes, 1999).
101. What patients gain from this policy is more certainty about ‘eligibility’. Moreover if they are eligible for treatment (their need is sufficiently high) then they will also receive it in a timely way (within the six months guarantee). On the other hand, patients with low need will not receive surgery but will continue to be cared for by GPs, under ‘active care and review’. The only situation in which low-severity patients may receive the treatment is if, after some time, their health status deteriorates. An advantage of the policy is that the resource costs of implementation are small. To reduce waiting times, the government instead of paying for a higher supply of treatments, induces the surgeons to add to the list only the patients with highest need.
102. The main problem of such a policy lies in making it ‘operational’. First of all, the specialists may not agree with the government about the idea of controlling demand and may feel that even patients with relatively low need should have access to the publicly-funded service. GPs may be unhappy with their increased duties. Moreover, if waiting time decreases, patients may become even more demanding for surgery.
103. There is some preliminary evidence on the overall impact of controlling demand on the level of waiting times in New Zealand. The number of patients waiting for treatment longer than six months has decreased from 35 500 in the first quarter of fiscal year 1999/2000 to 16 900 in the first quarter of fiscal year 2001/2002. An analogous reduction has been observed for the number of patients waiting more than two years for treatment, which reduced from 14 200 to 3 400 over the same period.
DELSA/ELSA/WD/HEA(2003)6
36
104. At the same time, the composition of the patients on the waiting list has changed. In the third quarter of fiscal year 1999/2000, 30% of the patients were ‘booked or given certainty’, and only 2% were in ‘active review’. The remaining 68% of the patients on the list were put into a third category not expressively envisaged in the government’s strategy, the so-called ‘residual waiting list’ (Chart 7). This last category included all the patients on the waiting list that did not fit in the other two categories (‘booked/certainty’ and ‘active review’). According to Gauld and Derrett (2000), patients on the ‘residual waiting list’ are patients who, in theory, should be referred back to the GP because they score too low but that in practice are going to be reconsidered for surgery within the next 12 months. By the first quarter of fiscal year 2001/2002, the situation has changed significantly: 41% of the patients were ‘booked or given certainty’, and only 38% were in ‘active review’. The remaining 21% of the patients were still classified as being on the ‘residual waiting list’. This evidence shows how controlling the demand of patients on the basis of their ‘need’ may not be a simple option to enforce, since surgeons may have a level of severity threshold that is different from the one suggested by the government (treatment should only be provided to the patients, whose severity is high enough and whose treatment can be provided within six months) (Gauld and Derret, 2000).
3.2.2 Explicit guidelines to prioritise patients on the list (for a given level of average waiting time)
105. One prerequisite for implementing the above policy, is that patients are prioritised according to their need. The introduction of guidelines to prioritise patients may serve to pursue an “efficiency goal” (reduce excessive waiting times, analysed in the above section) but as well an “equity goal” (making waiting fair). The purpose of this section is to focus on this equity goal and on the practical problems encountered to prioritise patients.
106. If waiting times cannot be reduced or completely eliminated (to avoid the possibility of unused capacity), at least patients should wait according to some explicit and equitable criteria. Moreover, without nationally agreed regulations, surgeons may use different criteria to prioritise patients on the list (Edwards et al., 2002) leading to systematic disparities in waiting among homogenous classes of patients. Prioritisation policies aim at reducing such systematic disparities. However, there is a still debate over which of several possible criteria should be used.
0
10,000
20,000
30,000
40,000
50,000
60,000
70,000
80,000
99/00 99/00 99/00 99/00 00/01 00/01 00/01 00/01 01/02 01/02
Q1 Q2 Q3 Q4 Q1 Q2 Q3 Q4 Q1 Q2Quarter
Nu
mb
er o
f p
atie
nts
Booked or given certaintyResidual waiting listActive reviewTotal
Chart 7. Status of the patients on the waiting
list (New Zealand)
DELSA/ELSA/WD/HEA(2003)6
37
107. There are different criteria, most of them clinical, which may be used to prioritise patients on the list: severity of condition, expected benefit, need, urgency, the decay rate of the disease and the time already spent on the list. In some countries, it has also been discussed whether patients should be prioritised according to some non-clinical criteria such as the ‘ability to work’. The tools developed to prioritise patients may be ‘less formalised’ taking the form of ‘guidelines’ suggesting according to which general criteria patients should be prioritised and by establishing (two to four) main urgency categories, or may be ‘more formalised’ taking the form of ‘priority scoring systems’. OECD countries differ in the approach used, as shown in the following examples.
108. Less formalised systems use two-level to four-level classification systems, as in Spain (‘high-priority’ and ‘low-priority’), in Sweden (‘very urgent’, ‘urgent’ and ‘non-urgent’), in Australia and Italy (admission within 30 days, within 90 days, within 12 months).
109. More formalised approaches are used in New Zealand and Canada, most often priority scoring systems which assign a score to the need of each patient. In New Zealand, a priority scoring system has been developed, broken down by main surgical procedure9 (‘Nationally consistent clinical assessment’ strategy). Also in Canada, the ‘Cardiac Care Network of Ontario’ (CCN) since 1990 developed urgency rating scores (URS) and the ‘Manitoba Cataract Waiting List Project’ has developed a scoring system based on a Visual Functioning Index (VF-14), a questionnaire with 14 items, with the scope of measuring the severity of functional impairment of the patients. Finally the ‘Western Canada Waiting List’ project (WCWL), a project funded by the Health Transition Fund (Health Canada), is developing explicit criteria to prioritise patients in need of cataract surgery, general surgery, hip and knee replacement, and MRI scanning (Noseworthy, McGurran, 2001).
110. More formalised criteria may find opponents among specialists who feel that their autonomy has been put at risk. A recent survey in Wales for example (Edwards et al., 2002) suggests that while 87% of GPs and 92% of health authority commissioners are in favour of more explicit prioritisation system, only 53% of the consultants were in favour.
111. The utilisation of more formalised prioritisation tools may also raise some methodological issues. What remains to be fully evaluated is to what extent the guidelines can be used consistently by different providers, and to what extent different providers using the same tool would take similar decisions regarding the prioritisation of the patients. This is still object of current research. For example, Gauld and Derrett (2000) argue that any scoring system may be open to abuse by clinicians and patients trying to gain higher priority. Moreover, there is evidence that some prioritisation tools they may be problematic in the sense that may lead to different scoring by different surgeons (for example on cataract surgery see Halliwall, 1998; for cholecystectomy, see Dennett et al., 1998). The Western Canada Waiting List Program found that prioritisation tools could be reliably introduced for general surgery, hip and knee procedures. Least reliability was found in the development of prioritisation tools for diagnostic and MRI scanning procedures (WCWL, 2001). In Sweden the National Waiting List Project in 2001 found there was good
9. As an example, for the prioritisation of the patients in need of cataract surgery the following categories
have been identified. Patients affected by “Lens induced glaucoma” should be treated within 4 weeks (urgent, 71-90 points). Patients categorised as “Cataract extraction required in order to treat posterior segment disease” should be treated within 12 weeks (semi-urgent, 51-70 points). For all other cataracts a separate scoring system has been developed (1-50 points). For patients falling in this last category, points may be assigned according to the following criteria: “visual acuity score” (max 5 points), “clinical modifiers” (max 5 points), “severity of visual impairment” (max 10 points), “ability to work, give care, live independently” (max 5 points), “other disability” (max 5 points). If patients score 21-50 they are considered “routine” and should be treated within six months. Patients scoring less than 20 are “deferrable” (see http://www.nzgg-careplans.org.nz/ ).

DELSA/ELSA/WD/HEA(2003)6
38
agreement among orthopaedic specialists in prioritising acute cases, but less agreement for cases with lower priority.
112. Another methodological issue relates to the opportunity of including among the criteria for determining the priority score the waiting time that the patient has already waited on the list. Several authors have suggested that this should not be criterion for prioritisation, on the ground that it may negate the objective of treating the most urgent cases first.
113. Finally, countries seem to differ about the opportunity of introducing non-clinical criteria for prioritising patients. In New Zealand, social factors have been explicitly considered, such as the ‘ability to work’, ‘to give care to dependants’ or ‘to live independently’ (Hefford and Holmes, 1999). A similar approach was adopted by the Western Canada Waiting List project, which included among the priority criteria for cataract surgery the ‘ability to work and live independently or care for dependants’. For hip and knee replacement it included the ‘threat to patient role and independence in the society’ (WCWL, 2001). In other countries, like the Netherlands, it has been debated if employees should have priority in receiving elective surgery, when treatment was funded by the employer. However this principle was regarded by the government as unacceptable on equity grounds and was never implemented (Brower, Schut, 1999).
3.2.3 Subsidise private health insurance
114. An alternative option for reducing demand for publicly funded surgery is the subsidisation of voluntary private health insurance (PHI). The main idea is that lowering the price for PHI coverage will induce substitution of private for public surgery, allowing waiting lists and times to fall.
115. However, this simple reasoning should be qualified. First, the substitution effect is likely to be strong when some dimensions of the quality of the public provision are low (for example high waiting times) and some dimensions of private provision, as perceived by the patients, are high (for example better hotel facilities and the possibility to choose the doctor). On the other hand, if PHI covers treatments not covered by the public service (for example plastic surgery) then an increase in PHI coverage may induce an overall increase in demand, instead of a substitution effect. In this last case public waiting times may remain unchanged.
116. Second, the causal relationship between PHI coverage and waiting times is a complex one. If an increase in PHI coverage does indeed induce a shift of patients from public to private, reducing waiting times, on the other hand, this reduction may decrease the incentive for the population to buy voluntary PHI (feedback mechanism). In fact, there is some evidence that suggests that waiting times play a significant role in inducing the purchase of PHI. However other factors also play a role such as income, age and political affiliation (for the United Kingdom, see Besley; King and Mossialos, 2002). Third, if patients holding PHI are subject to significant co-payments, they may still choose to wait for public treatment where co-payments are lower or zero. Finally, if private hospitals have no ability to expand in the short or medium term to respond to increases in demand, due to market access regulations or to shortages of capacity or medical workforce, the expected reductions in waiting times may be delayed.
117. The percentage of the total population covered by private health insurance varies significantly across OECD. Countries with high coverage are Australia (44.1% in 2002), Ireland (48% in 2002), New Zealand (35% in 2001). Countries with lower coverage are Spain (16.4% in 1998), Italy (12.2% in 2001), United Kingdom (11.5% in 1998), Finland (3% in 2001), Norway (0.45% in 2001). However, these figures do not necessarily indicate variations in coverage for elective surgery since the benefits of PHI – the services covered – vary considerably across countries.

DELSA/ELSA/WD/HEA(2003)6
39
118. In England Besley et al. (1998) have investigated to what extent areas with high health insurance coverage have had low waiting lists. Results were unexpected in the sense that areas with high coverage had higher waiting lists. The authors suggest that the government may under-fund public services in areas with higher private insurance coverage.
119. Australia has been the most active country in subsidising voluntary PHI coverage in recent years and represents an interesting case. The percentage of the population covered by PHI fell from 50% in 1984 to 30.5% in 1998. Attempts were made to change this trend through several policies including the ‘1997 and 1998 PHI incentive schemes’ and the introduction of ‘lifetime health cover’ in 2000, which introduced tax rebates. As a result, the percentage of population covered by private health insurance increased sharply from 30.5% in 1999 to 44.1% in 2002.
120. The recent increase in PHI coverage has been accompanied by an increase in the share of activity that is privately funded for many common surgical procedures. As the table below shows, the private shares rose between 1999-2000 and 2000-2001 having fallen or remained stable in the period 1993-94 to 1998-99. This can be attributed to an increase of activity in the private sector and to a reduction of activity in the public sector. The growth rates of overall activity have fallen in the last two years.
121. Nevertheless, reductions in waiting times for publicly funded patients admitted for the same procedures have been observed between years 1999-2000 and 2000-2001. An interpretation is that the demand from public patients fell more rapidly than the supply. Median waiting times decreased significantly for cataract surgery, coronary bypass, cholecystectomy, total and partial hip replacement, knee replacement (respectively, by 9.2%, 13.6%, 10.4%, 15.3%, 22.6%), while they increased for other procedures like prostatectomy, litigation and stripping of varicose veins (by 16.7%, 10.6%). However data on waiting times are not available for the years before 1999.
Table 5. Activity and median waiting times (of the patients admitted) in Australia
Procedures/ 100000 pop.
Privately funded patients
Procedures/ 100000 pop.
Publicly funded patients
Procedures/ 100000 pop.
Total (public and private)
Procedures/ 100000 pop. % of private
activity
Median Waiting
times for public
patients
Annual growth
rate 93/94-98/99
Annual growth
rate 99/00-00/01
Annual growth
rate 93/94-98/99
Annual growth
rate 99/00-00/01
Annual growth
rate 93/94-98/99
Annual growth
rate 99/00-00/01
Annual growth
rate 93/94-98/99
Annual growth
rate 99/00-00/01
Annual growth
rate 99/00-00/01
Cataract surgery 9.8% 6.4% 10.9% 2.3% 10.1% 5.3% -0.3% 1.0% -9.20%
PTCA 10.9% 10.5% 17.6% 2.0% 13.9% 6.3% -2.6% 3.9%
Coronary bypass -1.0% -3.1% 4.3% -6.4% 1.5% -4.8% -2.4% 1.8% -13.6%
Cholecystectomy 0.8% 12.7% 5.2% -5.8% 3.2% 2.2% -2.3% 10.2% -10.4% Inguinal and fem. Hernia -0.5% 4.9% 3.1% -5.4% 1.0% 0.3% -1.5% 4.6% 0.0%
Prostatectomy -6.7% 2.8% -3.9% -3.4% -5.7% 0.4% -1.2% 2.4% 16.7% Vaginal hysterectomy -0.1% 10.5% 7.9% -11.3% 3.4% -0.2% -3.4% 10.8% 2.6%
Knee arthroscopy -7.3% 0.8% -3.1% -11.5% -6.1% -4.0% -1.3% 5.1%
Hip replacement 4.2% 9.6% 4.3% -3.5% 4.3% 3.8% 0.0% 5.6% -15.3%
Knee replacement 7.9% 12.3% 9.7% -2.8% 8.6% 6.8% -0.6% 5.2% -22.6%
Varicose veins -1.7% 1.9% 2.7% -16.6% 0.1% -6.1% -1.7% 8.4% 10.6%
122. In Victoria (Australia) the increase of PHI coverage from 29.7% in June 1999 to 44.5% in December 2001, led to a marked increase in private sector elective surgery and a reduction in public sector

DELSA/ELSA/WD/HEA(2003)6
40
elective surgery (the private sector share increased from 51.5% in 1998-9 to 56.2% in 2000-01). Overall both additions and removals from waiting lists have decreased, leaving the total waiting list nearly unchanged. No information on waiting-times changes was provided (Hanning, 2002). Evidence from other Australian States and Territories (Hopkins and Frech, 2001), suggest that in New South Wales the median waiting time for public patients declined from 1.6 months in financial year 1998/1999 to 0.99 months in 2001. In Western Australia the number of cases on the waiting list declined from 16 998 on June 1998 to 9 778 in August 2001. The median waiting time declined from 7.5 months to 5.75 months in the same period.
123. Overall, in Australia, waiting times for public patients result significantly lower compared with three other countries in this study: the United Kingdom, Finland and Denmark (by 30% to 55% for several common surgical procedures), as suggested by the data collection conducted by this project. In Australia, as much as 50% (or more) of the activity may indeed be privately funded. We may then be tempted to conclude that lower waiting times in Australia are due to the higher role played by PHI coverage combined with higher private capacity. However it needs to be pointed out that waiting-time variations across countries reflect many factors, such as the total amount of health care expenditure, public hospital capacity and the size of the medical work force.
124. However, a high percentage of PHI coverage is not a guarantee of success for reducing waiting times for public patients. Despite Ireland being characterised by a similar percentage of patients covered by PHI (48% of the population), waiting times continue to be a cause of social and political concern. In fact the percentage of patients waiting on the list more than twelve months in March 2002 was 38%. Unlike some other OECD countries, patients with PHI have a choice to have their elective treatment provided in a private hospital or provided publicly in a public hospital. This may possibly generate a perverse incentive for public hospitals’ waiting times to remain high. In theory, no more than 20% of public hospital activity should be devoted to privately-funded patients in Ireland. However recent evidence suggests that 30% of elective activity is privately funded in public hospitals (this is not the case for emergency treatments; Wiley, 2001). In addition, although the gap in terms of real health expenditure (per capita) has been narrowed compared to OECD average, capacity in terms of hospital beds availability and the number of medical consultants is still relatively low.
3.3 Policies acting directly on waiting times (and affecting both the demand and the supply of elective surgery)
125. In the above sections we have shown how different policies can affect directly the supply and demand for surgery to reduce or manage waiting times. Another possibility is to implement policies that influence indirectly the supply and demand for surgery by acting directly on waiting times, for example by introducing maximum waiting-times guarantees or introducing financial or non-financial incentives linked to waiting-times reductions. In the absence of extra funding such policies might be expected to affect waiting times by leading to the raising of severity thresholds rather than by boosting supply.
3.3.1 Maximum waiting-time guarantee
126. One of the most common policies introduced to reduce waiting times is the “maximum waiting-times guarantee”. Such guarantees are intended to regulate waiting times so that patients should never wait over a certain time limit. While several countries have introduced waiting-times guarantees, the exact formulation of the guarantee differs substantially across countries. We denote as an “unconditional guarantee” a guarantee that is provided unconditionally to the patients (England, and Sweden between 1992-1996). We denote as a “conditional guarantee” a guarantee that is given only to a share of the patients, for example “all the patients with higher need, should be treated within ‘x’ months” (Norway between 1990-2000, New Zealand, and Sweden, between 1992-1996). An alternative and less discretionary

DELSA/ELSA/WD/HEA(2003)6
41
formulation of a “conditional guarantee” is of the type “y% of the patients should be treated within ‘x’ months” (Netherlands, Italy, and Denmark). Another important distinction is between maximum ‘inpatient’ (the time between specialist assessment and treatment) and ‘outpatient’ waiting-time guarantees (time between GP referral and specialist assessment). Some countries have also set maximum ‘outpatient’ waiting-time guarantees, such as Norway between 1997-2000, Netherlands, and Sweden, England.
127. A reason for policy makers to introduce “maximum waiting-times guarantees” is that long waiting (for example longer than 12 months), even for a small number of patients, continues to be a cause of social, media and political concern. In addition, they may assume that long waiting is associated with prolonged suffering and deteriorating health. However, if clinical prioritisation is working well, it is the least needy who will wait longest.
128. If waiting times include the patients on the list (as opposed to the patients admitted), a straightforward way for the providers to attempt satisfying the guarantee, is by undertaking regular validations of waiting lists to ensure that only those medically suitable and available to have surgery are included on the list. Another way for the hospitals to eliminate the longest waits is for managers to persuade the surgeons to give higher priority to patients waiting for long time. Alternatively, they may expect increases in productivity in order to be able to satisfy the maximum waiting-time target (Hanning and Lundstrom, 1998).
129. The implementation of waiting-time guarantees will have a low cost if they are not accompanied by additional resources. The guarantee in this case may be effective in reducing long waiting (as in the U.K.) but not very effective in reducing overall waiting times. Moreover, the introduction of an ‘unconditional maximum waiting-time guarantee’ may induce the provider to give higher priority to less severe patients (who have waited longest), as long as they approach the maximum waiting time (Goddard and Tavakoli, 1994). This behaviour conflicts with clinical priority and the guarantee may in practice act as a guarantee for low-priority patients.
130. To overcome the criticism about clinical prioritisation generated by ‘unconditional waiting-times guarantees’, some countries have implemented ‘conditional’ guarantees, that include only patients with higher ‘need’ or a certain ‘percentage of the patients’. However, even if ‘conditional guarantees’ overcome the criticism of appropriate patient prioritisation, they may suffer from other limitations. For example it may prove difficult for the government (or any other purchaser of health services) to establish uniform criteria to evaluate the need of the patients and the offering of the guarantee. In the absence of clear eligibility criteria, the assessment of the patient’s need will be at the discretion of the physician and the provider may provide the guarantee only for the patients (s)he is sure to treat in an adequate time.
131. An interesting solution has been advocated recently in several countries (Denmark, The Netherlands and Italy) that involves specifying conditional guarantees in terms of a percentage (for example 80%) of the patients. This formulation seems most promising since it offers a possible solution to the clinical prioritisation issue without introducing ‘discretion’ in the system.
132. Another general point is that achievement of the maximum waiting-times guarantee may be obtained at the expense of increasing the outpatient waiting time. For this reason, outpatient waiting-time measurements and outpatient maximum waiting-time guarantees have become more common.
133. There is a wide range of examples of the implementation of maximum waiting-time guarantees. However, in a number of countries they have been modified or abandoned (Denmark, Norway, and Sweden). Moreover there seems to be no great agreement on the way to formulate the guarantee.
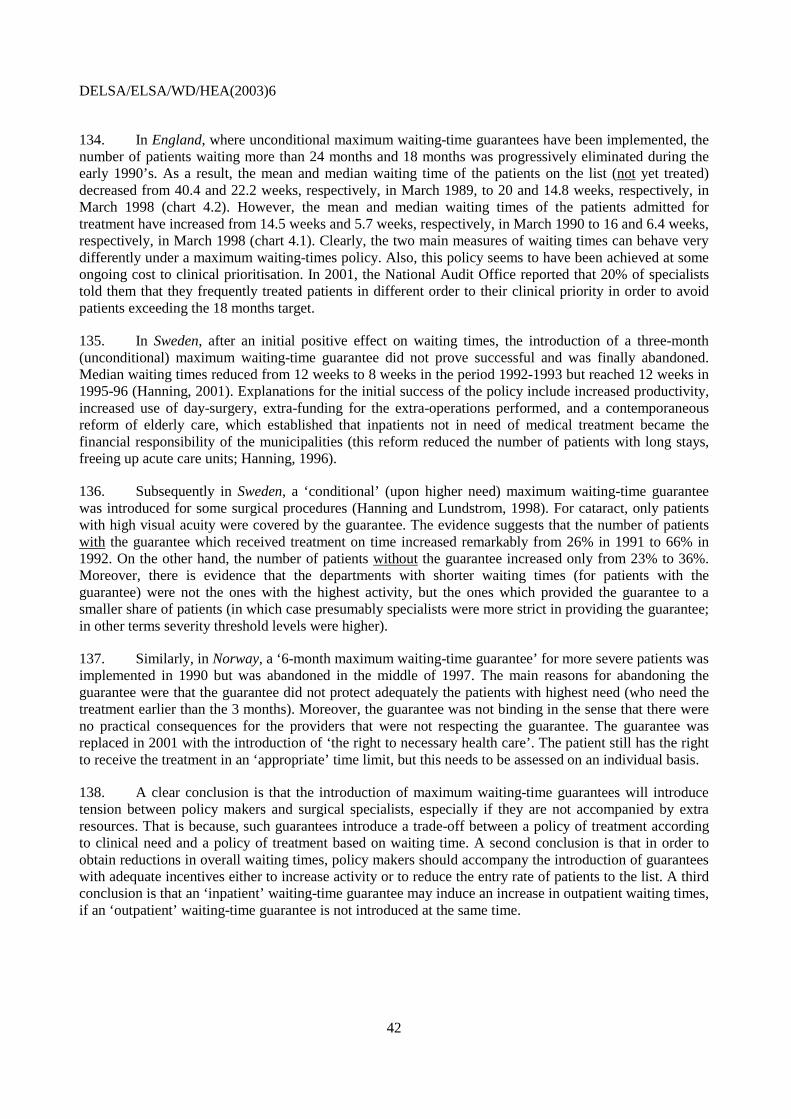
DELSA/ELSA/WD/HEA(2003)6
42
134. In England, where unconditional maximum waiting-time guarantees have been implemented, the number of patients waiting more than 24 months and 18 months was progressively eliminated during the early 1990’s. As a result, the mean and median waiting time of the patients on the list (not yet treated) decreased from 40.4 and 22.2 weeks, respectively, in March 1989, to 20 and 14.8 weeks, respectively, in March 1998 (chart 4.2). However, the mean and median waiting times of the patients admitted for treatment have increased from 14.5 weeks and 5.7 weeks, respectively, in March 1990 to 16 and 6.4 weeks, respectively, in March 1998 (chart 4.1). Clearly, the two main measures of waiting times can behave very differently under a maximum waiting-times policy. Also, this policy seems to have been achieved at some ongoing cost to clinical prioritisation. In 2001, the National Audit Office reported that 20% of specialists told them that they frequently treated patients in different order to their clinical priority in order to avoid patients exceeding the 18 months target.
135. In Sweden, after an initial positive effect on waiting times, the introduction of a three-month (unconditional) maximum waiting-time guarantee did not prove successful and was finally abandoned. Median waiting times reduced from 12 weeks to 8 weeks in the period 1992-1993 but reached 12 weeks in 1995-96 (Hanning, 2001). Explanations for the initial success of the policy include increased productivity, increased use of day-surgery, extra-funding for the extra-operations performed, and a contemporaneous reform of elderly care, which established that inpatients not in need of medical treatment became the financial responsibility of the municipalities (this reform reduced the number of patients with long stays, freeing up acute care units; Hanning, 1996).
136. Subsequently in Sweden, a ‘conditional’ (upon higher need) maximum waiting-time guarantee was introduced for some surgical procedures (Hanning and Lundstrom, 1998). For cataract, only patients with high visual acuity were covered by the guarantee. The evidence suggests that the number of patients with the guarantee which received treatment on time increased remarkably from 26% in 1991 to 66% in 1992. On the other hand, the number of patients without the guarantee increased only from 23% to 36%. Moreover, there is evidence that the departments with shorter waiting times (for patients with the guarantee) were not the ones with the highest activity, but the ones which provided the guarantee to a smaller share of patients (in which case presumably specialists were more strict in providing the guarantee; in other terms severity threshold levels were higher).
137. Similarly, in Norway, a ‘6-month maximum waiting-time guarantee’ for more severe patients was implemented in 1990 but was abandoned in the middle of 1997. The main reasons for abandoning the guarantee were that the guarantee did not protect adequately the patients with highest need (who need the treatment earlier than the 3 months). Moreover, the guarantee was not binding in the sense that there were no practical consequences for the providers that were not respecting the guarantee. The guarantee was replaced in 2001 with the introduction of ‘the right to necessary health care’. The patient still has the right to receive the treatment in an ‘appropriate’ time limit, but this needs to be assessed on an individual basis.
138. A clear conclusion is that the introduction of maximum waiting-time guarantees will introduce tension between policy makers and surgical specialists, especially if they are not accompanied by extra resources. That is because, such guarantees introduce a trade-off between a policy of treatment according to clinical need and a policy of treatment based on waiting time. A second conclusion is that in order to obtain reductions in overall waiting times, policy makers should accompany the introduction of guarantees with adequate incentives either to increase activity or to reduce the entry rate of patients to the list. A third conclusion is that an ‘inpatient’ waiting-time guarantee may induce an increase in outpatient waiting times, if an ‘outpatient’ waiting-time guarantee is not introduced at the same time.

DELSA/ELSA/WD/HEA(2003)6
43
3.3.2 Financial and non-financial incentives to reduce waiting times
139. In some countries, policy makers have started to reward hospitals directly for obtaining reductions in waiting times. Such measures contrast with older-type policies, which have, in effect, provided more resources to hospitals with higher waiting times and lists, on the basis that higher waiting times may indicate higher need. The new policies reward reductions in waiting, on the basis that lower waiting times are a signal of better management and higher efficiency. The rewards may be financial through the implementation of premiums and bonuses (as in England, Ireland, Spain and Victoria - Australia), or non-financial (as in England, New Zealand and Australia).
140. The introduction of financial and non-financial incentives to reduce waiting times may induce either or both of two major changes in the behaviour of the hospital and its surgeons. On the one hand, the hospital and its surgeons may increase the level of supply of elective treatments (the rate of exits from the waiting list). On the other hand, the surgeons may reduce the demand for elective treatments, by raising their thresholds for adding patients to the waiting list (the rate of entries to the waiting list). Depending on the remuneration system for the activity of the hospital, the first strategy (increase in supply) may be more or less attractive for the provider. For example if the hospitals are remunerated with a fixed budget, then the increase in supply will increase costs without increasing revenues. If the hospital is remunerated by fee for service, then the extra costs can be met from the extra revenues. The second strategy (reduction in demand) is not costly for the providers, at least in financial terms (it may be costly for the surgeon in terms of professional dissatisfaction from neglecting the treatment to some of the patients). It is to be expected that when financial incentives are provided to reduce waiting times, both an increase in supply and a reduction in demand may occur. However a reduction in demand is the most likely strategy to be adopted in the presence of fixed budgets since it is not associated with increases in costs.
141. It is not easy to evaluate the impact of the policy of “rewarding low waiting times” in isolation. Only three countries (Spain, England and New Zealand) have implemented it and on all occasions in concomitance with other actions. In Spain, extra-funding was provided conditional upon reductions in waiting times and conditional upon increases in surgical activity. In England, New Zealand, and Victoria (Australia) waiting times have been only recently introduced as one of several performance indicators over which hospitals are evaluated.
3.3.3 Reducing waiting times for patients on sick leave
142. Waiting times may introduce a cost not only for the patients, but also for other public institutions. In particular, patients may claim sickness benefits while waiting for the elective treatment on the ground that they are unable to continue to work (i.e. some of the patients in need of hip or knee replacement). For example, in England, 5-10% of the patients on the list are on sick leave from work (Harrison and New, 2000). In Norway, since 1988 the Ministry of Health and Social Affairs has encouraged projects aimed at reducing the waiting times for patients on sick leave, in order to reduce the cost of sickness benefits. The Parliament has considered making this initiative a permanent one but some criticisms have been raised about giving priority to people that are employed, as opposed to the unemployed or retired.
143. Lack of co-ordination among different public institutions may generate sources of inefficiencies. As the social cost in terms of sickness benefits is likely not to be borne by the Department of Health, this may generate a negative externality for social security systems.
144. In Finland a recent report found that the costs of delayed treatments (sickness benefits, costs of medicines, social welfare expenses) for both the working population and pensioners exceed the costs of treatment, often very substantially. Delayed treatment has been shown in many investigations to greatly increase the risk of remaining on a disability pension.

DELSA/ELSA/WD/HEA(2003)6
44
4. CONCLUSIONS
145. These conclusions are provisional and subject to amendment in the light of further work. In some respects they have the status of hypotheses which require further testing during future work. They cover the phenomenon of waiting for elective surgery and a review of policies to tackle excessive waiting. They are based on a reading of the economics and epidemiological literatures and on the responses to a policy questionnaire completed by countries participating in the project. Further work has yet to be undertaken on the causes of variations in waiting times across OECD countries, including countries which do not appear to suffer from waiting times problems.
146. The phenomenon of waiting for elective surgery. There is a problem of excess waiting for publicly funded, elective surgery in many OECD countries. Views on what represents excessive waiting will vary across countries but several have set targets for maximum waiting of three or six months in recent years (in general for inpatient waiting, but seldom for outpatient waiting). Such levels of waiting times are still regularly exceeded in many countries. Excessive waiting for elective surgery can, at worst, lead to deterioration in the health of patients, prolongation of suffering, loss of utility, patient uncertainty (in the absence of booking systems) and extra costs. There is evidence in several countries of major dissatisfaction among the general public with waiting times for specialist assessment and for elective surgery.
147. However, a review of the literature on the cost of waiting for particular procedures in specific countries (Annex 1) suggest that there is little evidence of harm from short or moderate waits for elective surgery. Moreover, in some countries which have reported the results of satisfaction surveys of people who have actually been kept waiting, there is evidence of tolerance of short and moderate waits. In addition, there is evidence of only modest willingness to pay for reductions in waiting times.
148. There has been investment in many countries in recent years to obtain data on waiting times for elective surgery and in some cases for specialist assessment. However, there have been few international comparisons of such waiting times and few international comparisons of surgery rates and little explanation of the causes of variations in waiting times.
149. An important finding of this report is that countries measure waiting times in very different ways. The most important distinction is between the ‘waiting times of the patients admitted’ and the ‘waiting times of the patients on the list at a census date’. Both present advantages and disadvantages, and countries should consider measuring both of them. In general it is reasoned that the ‘waiting time of the patients admitted’ is a more appropriate measurement on the ground that it is representative of all the patients and includes the completed time waited. However, it does not include the patients who never received the treatment, the ones that renounced it or those who died while waiting. On the other hand, the ‘waiting time of the patients on the list at a census date’ is biased towards patients waiting for long time and refers to an ‘uncompleted’ wait.
150. It has been argued in this report that there will be, in principle, in any health system an optimum rate of surgery and an optimum rate of waiting time, which is not zero. The main reason for the optimum waiting time being greater than zero, is that forming a queue for elective surgery may generate substantial savings in surgical capacity (since demand is stochastic) and may generate only a modest loss of benefit for elective patients from short to medium waits. Unfortunately, it is difficult to quantify either the optimum rate of surgery or the optimum waiting time because of the uncertainty about the benefit from the

DELSA/ELSA/WD/HEA(2003)6
45
treatment, especially in a world with rapidly changing technology. In practice, clinicians, managers and policy makers will have to use informed judgement about optimum rates of surgery and appropriate waiting times.
151. Evidence of long waiting for a particular procedure represents an ambiguous signal. It may indicate a sub-optimal supply of surgery but, alternatively, it may indicate a satisfactory rate of surgery accompanied by an excessive propensity to add patients on the list (even if the expected benefit is lower than the cost of treatment). The formation of waiting lists depends not only on the rate of exit from waiting lists (that is, on the rate of admissions for surgery) but also on the rate of entry to waiting lists. The latter is determined mainly by surgeons, although GP referral propensities and patient choice will play a part. Surgeons’ propensity to add patients to lists will depend upon the individual surgeons’ clinical thresholds, which in turn will be influenced by the institutions and incentives of the different health care systems in which they operate. Systems where ‘money follows the patient’ are likely to have a lower propensity to add patients to lists than systems where ‘money follows the queue’.
152. It is not easy to draw clear lessons for policy from the material gathered so far under this project. Although it has been possible to describe a range of waiting-times policies, it has not always been easy to identify their effects or their consequences for costs and benefits. There are several reasons for that. First, few policies have been thoroughly monitored and evaluated after their implementation. In particular, the availability of waiting-times data itself has often been limited. Secondly, many waiting-times policies have been implemented in the form of packages of measures, which makes it difficult to assess the effects of the individual measures. Third, the review of policies, above, has been confined to uncontrolled, ‘before and after’ comparisons. We do not know the counterfactual – what would have happened to waiting times in the absence of the policy interventions under investigation. Lastly, it is rare to find information on the costs of policy implementation.
153. Supply-side policies. All OECD countries have experienced rapid growth in the demand for surgery in recent years because of technological advances which have extended the range of conditions which are treatable surgically. If policy makers consider that excess waiting has arisen because the rate of surgery has become inadequate, the right policy is to increase the supply of surgery. That may be done in various ways. A government can fund extra activity by public providers, leaving public capacity unchanged. It can increase both funding of activity and make additional investments to extend the capacity of public providers. It can purchase from the private sector or send patients abroad for surgery.
154. The different ways of increasing supply will generally have different costs and will require different time scales. In the short run it may be possible to purchase extra activity from public facilities at low marginal cost if there is spare capacity. If public facilities are already working close to full capacity, it will be possible to purchase extra activity only at high marginal cost in the short run. In these circumstances, purchasing from the private sector or sending patients abroad may be a better solution in the short to medium term, depending on relative prices. In the medium to longer term, it may well be cheaper to expand activity by expanding public capacity. For example, Denmark adjusted its public capacity to respond to the upsurge in demand for coronary revascularisation procedures more rapidly than did England in the 1990s. As a consequence, waiting times for revascularisation fell in Denmark whereas they rose steeply in England.
155. Three types of incentive arrangements have been utilised where there is funding of extra activity by public providers, or by private providers contracted to public purchasers: i) more funding to providers with higher waiting lists; ii) more funding to providers who perform extra-activity; and iii) more funding to providers conditional upon both an increase in activity and a reduction in waiting times. Among these three arrangements, the third seems to provide the best incentives to secure reductions in waiting times since it addresses the problem of increases in the rate of entry to waiting lists (demand generation). Spain (Insalud)
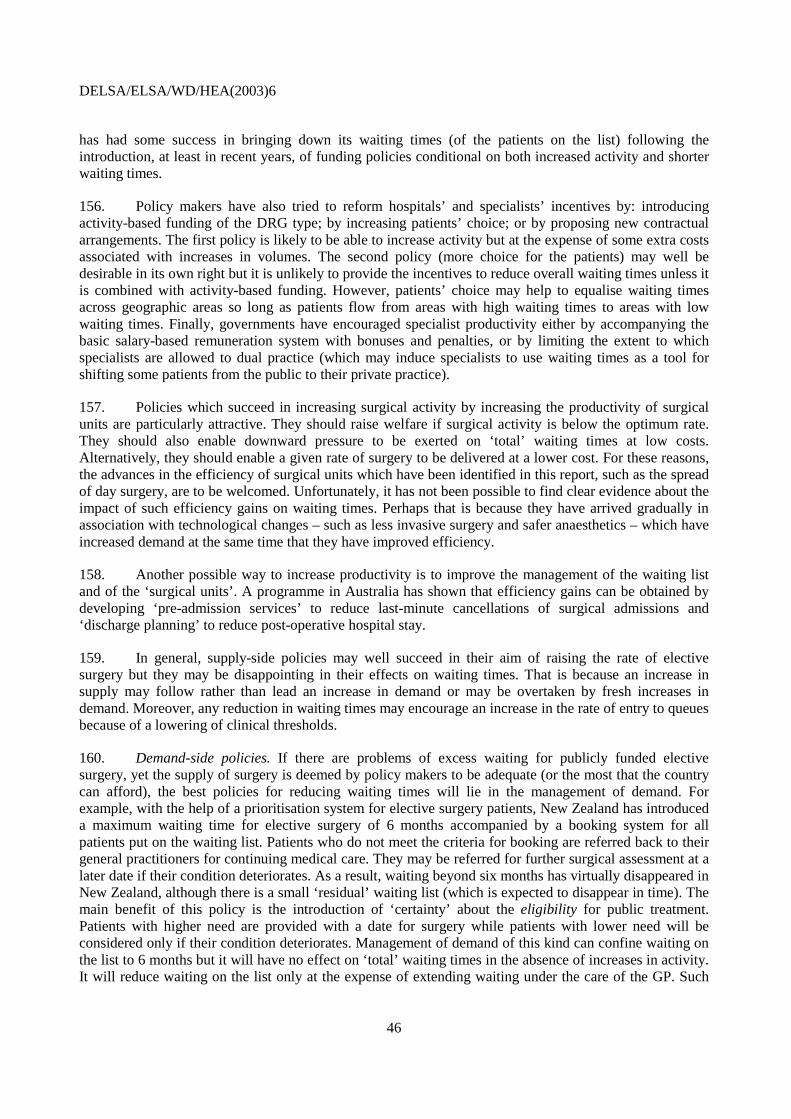
DELSA/ELSA/WD/HEA(2003)6
46
has had some success in bringing down its waiting times (of the patients on the list) following the introduction, at least in recent years, of funding policies conditional on both increased activity and shorter waiting times.
156. Policy makers have also tried to reform hospitals’ and specialists’ incentives by: introducing activity-based funding of the DRG type; by increasing patients’ choice; or by proposing new contractual arrangements. The first policy is likely to be able to increase activity but at the expense of some extra costs associated with increases in volumes. The second policy (more choice for the patients) may well be desirable in its own right but it is unlikely to provide the incentives to reduce overall waiting times unless it is combined with activity-based funding. However, patients’ choice may help to equalise waiting times across geographic areas so long as patients flow from areas with high waiting times to areas with low waiting times. Finally, governments have encouraged specialist productivity either by accompanying the basic salary-based remuneration system with bonuses and penalties, or by limiting the extent to which specialists are allowed to dual practice (which may induce specialists to use waiting times as a tool for shifting some patients from the public to their private practice).
157. Policies which succeed in increasing surgical activity by increasing the productivity of surgical units are particularly attractive. They should raise welfare if surgical activity is below the optimum rate. They should also enable downward pressure to be exerted on ‘total’ waiting times at low costs. Alternatively, they should enable a given rate of surgery to be delivered at a lower cost. For these reasons, the advances in the efficiency of surgical units which have been identified in this report, such as the spread of day surgery, are to be welcomed. Unfortunately, it has not been possible to find clear evidence about the impact of such efficiency gains on waiting times. Perhaps that is because they have arrived gradually in association with technological changes – such as less invasive surgery and safer anaesthetics – which have increased demand at the same time that they have improved efficiency.
158. Another possible way to increase productivity is to improve the management of the waiting list and of the ‘surgical units’. A programme in Australia has shown that efficiency gains can be obtained by developing ‘pre-admission services’ to reduce last-minute cancellations of surgical admissions and ‘discharge planning’ to reduce post-operative hospital stay.
159. In general, supply-side policies may well succeed in their aim of raising the rate of elective surgery but they may be disappointing in their effects on waiting times. That is because an increase in supply may follow rather than lead an increase in demand or may be overtaken by fresh increases in demand. Moreover, any reduction in waiting times may encourage an increase in the rate of entry to queues because of a lowering of clinical thresholds.
160. Demand-side policies. If there are problems of excess waiting for publicly funded elective surgery, yet the supply of surgery is deemed by policy makers to be adequate (or the most that the country can afford), the best policies for reducing waiting times will lie in the management of demand. For example, with the help of a prioritisation system for elective surgery patients, New Zealand has introduced a maximum waiting time for elective surgery of 6 months accompanied by a booking system for all patients put on the waiting list. Patients who do not meet the criteria for booking are referred back to their general practitioners for continuing medical care. They may be referred for further surgical assessment at a later date if their condition deteriorates. As a result, waiting beyond six months has virtually disappeared in New Zealand, although there is a small ‘residual’ waiting list (which is expected to disappear in time). The main benefit of this policy is the introduction of ‘certainty’ about the eligibility for public treatment. Patients with higher need are provided with a date for surgery while patients with lower need will be considered only if their condition deteriorates. Management of demand of this kind can confine waiting on the list to 6 months but it will have no effect on ‘total’ waiting times in the absence of increases in activity. It will reduce waiting on the list only at the expense of extending waiting under the care of the GP. Such
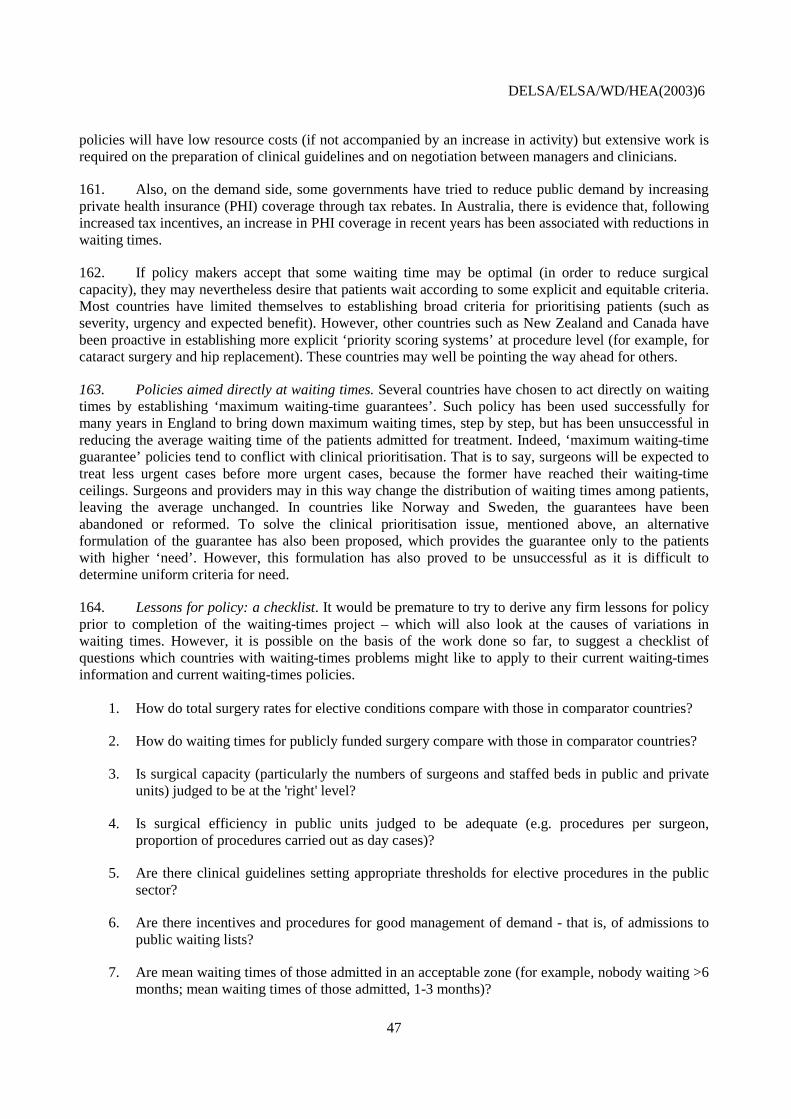
DELSA/ELSA/WD/HEA(2003)6
47
policies will have low resource costs (if not accompanied by an increase in activity) but extensive work is required on the preparation of clinical guidelines and on negotiation between managers and clinicians.
161. Also, on the demand side, some governments have tried to reduce public demand by increasing private health insurance (PHI) coverage through tax rebates. In Australia, there is evidence that, following increased tax incentives, an increase in PHI coverage in recent years has been associated with reductions in waiting times.
162. If policy makers accept that some waiting time may be optimal (in order to reduce surgical capacity), they may nevertheless desire that patients wait according to some explicit and equitable criteria. Most countries have limited themselves to establishing broad criteria for prioritising patients (such as severity, urgency and expected benefit). However, other countries such as New Zealand and Canada have been proactive in establishing more explicit ‘priority scoring systems’ at procedure level (for example, for cataract surgery and hip replacement). These countries may well be pointing the way ahead for others.
163. Policies aimed directly at waiting times. Several countries have chosen to act directly on waiting times by establishing ‘maximum waiting-time guarantees’. Such policy has been used successfully for many years in England to bring down maximum waiting times, step by step, but has been unsuccessful in reducing the average waiting time of the patients admitted for treatment. Indeed, ‘maximum waiting-time guarantee’ policies tend to conflict with clinical prioritisation. That is to say, surgeons will be expected to treat less urgent cases before more urgent cases, because the former have reached their waiting-time ceilings. Surgeons and providers may in this way change the distribution of waiting times among patients, leaving the average unchanged. In countries like Norway and Sweden, the guarantees have been abandoned or reformed. To solve the clinical prioritisation issue, mentioned above, an alternative formulation of the guarantee has also been proposed, which provides the guarantee only to the patients with higher ‘need’. However, this formulation has also proved to be unsuccessful as it is difficult to determine uniform criteria for need.
164. Lessons for policy: a checklist. It would be premature to try to derive any firm lessons for policy prior to completion of the waiting-times project – which will also look at the causes of variations in waiting times. However, it is possible on the basis of the work done so far, to suggest a checklist of questions which countries with waiting-times problems might like to apply to their current waiting-times information and current waiting-times policies.
1. How do total surgery rates for elective conditions compare with those in comparator countries?
2. How do waiting times for publicly funded surgery compare with those in comparator countries?
3. Is surgical capacity (particularly the numbers of surgeons and staffed beds in public and private units) judged to be at the 'right' level?
4. Is surgical efficiency in public units judged to be adequate (e.g. procedures per surgeon, proportion of procedures carried out as day cases)?
5. Are there clinical guidelines setting appropriate thresholds for elective procedures in the public sector?
6. Are there incentives and procedures for good management of demand - that is, of admissions to public waiting lists?
7. Are mean waiting times of those admitted in an acceptable zone (for example, nobody waiting >6 months; mean waiting times of those admitted, 1-3 months)?
DELSA/ELSA/WD/HEA(2003)6
48
REFERENCES
Anderson, G., 1997, “Willingness to pay to shorten waiting time for cataract surgery”, Health Affairs, 16(5), 181-190.
Armstrong, P.W., 2000, “First steps in analysing NHS waiting times: avoiding the ‘stationary and closed population’ fallacy”, Statistics in Medicine, 19, 2037-2051.
Arrow, K., 1963, “Uncertainty and the welfare economics of medical care”, American Economic Review, LIII, 5, 941-973.
Besley, T., et al., 1998, “Private and public health insurance in the UK”, European Economic Review, 42, 491-497.
Biorn, E., T. Hagen, T. Iversen, J. Magnussen, 2002, The effect of activity-based financing on hospital efficiency, Working paper 8, Health Economics Research Programme, University of Oslo.
Blendon, R.J., et al., 2002, “Inequities in health care: a five-country survey”, Health Affairs, 21,3, 182-191.
Brouwer, W., F. Schut, 1999, “Priority care for employees: a blessing in disguise?”, Health Economics, 8, 65-73.
Bunker, J.P., 1970, “A comparison of operations and surgeons in the United States and in England and Wales”, New England Journal of Medicine, 282, 3, 135-144.
Chalkley, M., and J.M. Malcomson, 1998, “Contracting for health services with unmonitored quality”, The Economic Journal, 108, 1093-1110.
Cooper, R.B., 1981, “Basic Queuing Theory”, North Holland, New York.
Coulter, A., et al., 1990, “Relation between general practices’ outpatient referral rates and rates of elective admission to hospital”, British Medical Journal, 301, 273-276.
Cromwell, D.A., et al., 2002, “Surgery dot.com: the quality of information disseminated by web-based waiting time information services”‚ Medical Journal of Australia, 177.
Cullis, J.C., and P.R. Jones, 1986, “Rationing by waiting lists: an implication”, American Economic Review, 76, 1, 250-6.
Cullis, J.G., and P.R. Jones, 1985, “National Health Service waiting lists, a discussion of competing explanations and a policy proposal”, Journal of Health Economics, 4, 119-135.
Cullis, J., P. Jones and C. Propper, 2000, “Waiting lists and medical treatment: analysis and policies”, Handbook of Health Economics, vol.1.
Cullis, J.G., and P.R. Jones, 1985, “National Health Service waiting lists, a discussion of competing explanations and a policy proposal”, Journal of Health Economics, 4, 119-135.
Culyer, A.J., 1989, “The Normative Economics of Health Care Finance and Provision”, Oxford Review of Economic Policy, 5(1).
DELSA/ELSA/WD/HEA(2003)6
49
Culyer, A.J., and J.G. Cullis, 1976, “Some Economics of Hospital waiting lists in the NHS”, Journal of Social Policy, 5, 3, 239-64.
DeCoster, C., et al., 2000, “Waiting times for surgical procedures”, Medical Care, 37, 6, 187-205.
Dennett, V., et al., 1998, “Priority access criteria for elective cholecystectomy: a comparison of three scoring methods”, New Zealand Medical Journal, 111, 291-3.
Department of Health (England), 2001, National Service Framework for Coronary Heart Disease, http://www.doh.gov.uk/nsf/coronarych5.htm.
Derrett, S., et al., 1999, “Waiting for elective surgery: effects on health related quality of life”, International Journal for Quality in Health Care, 11, 47-57.
Donelan, K., 1999, “The cost of health system change: public discontent in five nations”, Health Affairs, 18(3), 206-216.
Don, B., A. Lee, and M.J. Goldacre, 1987, “Waiting list statistics. III. Comparison of two measures of waiting times”, British Medical Journal, 295, 1247-1248.
Dunn, E., et al., 1997, “Patients acceptance of waiting for cataract surgery: what makes a wait too long?”, Soc. Sci. Med., 44, 11, 1603-1610.
Edwards, R., et al., 2002, “Clinical and lay preferences for the explicit prioritisation of elective waiting lists: survey evidence from Wales”, Health Policy, in press.
Feldman, R., 1994, “The cost of rationing medical care by insurance coverage and by waiting”, Health Economics, 3, 361-372.
Fleming, D.M., et al., 1992, “The European study of referrals from primary to secondary care”, Royal College of General Practitioners, London, Occasional Paper No. 56.
Forrest, C.B., et al., 2002, “Comparison of speciality referral rates in the United Kingdom and the United States: retrospective cohort analysis”, British Medical Journal, 325, 370-371.
Fuchs, V.R., 1998, Who shall live? Health Economics and Social Choice, Expanded Edition.
Gauld, R., and S. Derrett, 2000, “Solving surgical waiting list problem? New Zealand’s booking system”, International Journal of health planning and management, 15, 259-272.
Gonzlez-Busto, Garcia, 1999, “Waiting lists in Spanish public hospitals: a system dynamic approach”, System Dynamics Review, 15(3), 203-224.
Gittelsohn, A.M., et al., 1991, “Income, race and surgery in Maryland”, American Journal of Public Health, 81,11, 1435-1441.
Goddard, J., M. Tavakoli, 1994, “Rationing and Waiting List Management – Some Efficiency and Equity Considerations”, in Setting Priorities in Health Care, edited by M. Malek, John Wiley and Sons.
Goddard, J., M. Malek, and M. Tavakoli, 1995, “An Economic Model of the Market for Hospital Treatment for Nonurgent Conditions”, Health Economics, 4 (1), 41-55.

DELSA/ELSA/WD/HEA(2003)6
50
Goldacre, M.J., A. Lee and B. Don, 1987, “Waiting list statistics I: relation between admissions from waiting list and length of waiting list”, British Medical Journal, 295, 1105-1108.
Gravelle, H., M. Dusheiko, M. Sutton, 2002, “The demand for elective surgery in a public system: time and money prices in the UK National Health Service”, Journal of Health Economics, 21, 423-429.
Halliwell, T., 1998, “How fair is cataract prioritisation?”, New Zealand Medical Journal, 11, 406-7.
Hanning, B., 2002, “Has the increase in private health insurance uptake affected the Victorian public hospital surgical waiting list?”, Australian Health Review, 25, p.64-71.
Hanning, M., and M. Lundström, 1998, “Assessment of the Maximum Waiting-time Guarantee for Cataract surgery. The Case of a Swedish Policy”, International Journal of Technology Assessment in Health Care, 14, 180-193.
Hanning, M., and U.W. Spangberg, , 2000, “Maximum waiting time - a threat to clinical freedom? Implementation of a policy to reduce waiting times”, Health Policy, 52, 15-32.
Hanning, M., 2001, “Waiting list initiatives in Sweden”, IHEA, York, July 2001.
Harrison, A., and New, B., 2000, “Access to elective care: what should really be done about waiting lists?” Kings Fund, London.
Hefford, B., Holmes, A., 1999, “Booking systems for elective services: the New Zealand experience”, Australian Health Review, 22, 4, 61-73.
Horng, S., and F.G. Miller, 2002, “Is Placebo Surgery Unethical?”, New England Journal of Medicine, 347, 137-139, July 11.
Hopkins, S., and H. Frech, 2001, “The rise in private health insurance in Australia: Early effects on insurance and hospital markets”, Economic and Labour Relations Review, 12, 225-238.
Iversen, T., 1993, “A theory of hospital waiting lists”, Journal of Health Economics, 12, 55-71.
Iversen, T., 1997, “The effect of a private sector on the waiting time in a National Health Service”, Journal of Health Economics; 16, 381-396.
Iversen, T., and H. Luras, (2002), ‘Waiting times as a competitive device: an example from general medical practice’, International Journal of Health Care Finance and Economics, 2, 189-204.
Jónsdóttir, H., et al., 1998, “The experience of people awaiting coronary artery bypass graft surgery: the Icelandic experience”, Journal of Advanced Nursing, 1998, 27, 68-74.
Jowell, R. et al., 2000, British Social Attitudes Survey, The 17th Report.
King, D., and E. Mossialos, 2002, “The determinants of private medical insurance prevalence in England”, LSE Health and Social Care Discussion paper n.3.
Laeven, van Vliet, 2001, “Incentives and waiting lists. Intervention on waiting lists and their impact on demand”, International Health Economics Association conference, University of York.

DELSA/ELSA/WD/HEA(2003)6
51
Lindsay, C.M., and B. Feigenbaum, 1984, “Rationing by waiting lists”, American Economic Review, 74, 3, 404-417.
Lundborn, J., et al., 1992, “Factors affecting return to work after aorta coronary bypass surgery”, Scandanavian Journal of Cardiovascular Surgery, 26, 187-192.
Martin, S., and P.C. Smith, 1999, “Rationing by waiting lists: an empirical investigation”, Journal of Public Economics, 71, 141-64.
McPherson, K., et al., 1982, “Small area variations in the use of common surgical procedures: an international comparison of New England, England and Norway”, The New England Journal of Medicine, 307, 21, 1310-1314.
McPherson, K., 1989, “International differences in medical care practice”, Health Care Financing Review, Annual Supplement.
Mot, E.S., 2002, “Paying the medical specialist: the eternal puzzle: experiments in the Netherlands”, PhD Thesis, Amsterdam.
Morga, A., and A. Xavier, 2001, “Hospital specialists’ private practice and its impact on the number of NHS patients treated and on the delay for elective treatment”, Discussion papers in Economics, The University of York, n.2001/01.
Naylor, C.D., et al., 2000, “Benchmarking the vital risk of waiting for coronary artery bypass surgery in Ontario”; Canadian Medical Association Journal; 162(6), 775-9.
National Demonstration Hospitals Program, 1997a, “Towards best practice in elective surgery: a guide”, Commonwealth Department of Health and Family Services.
National Demonstration Hospitals Program, 1997b, “Performance Evaluation”, Commonwealth Department of Health and Family Services.
Noseworthy, T., and J. McGurran, 2001, “From chaos to order: making sense of waiting lists in Canada. Final report“, Western Canada Waiting list project.
Pancorbo, C., and L. Moral, 2002, “Surgical waiting list reduction programme. The Spanish experience”, HOPE publication.
Propper, C., 1990, “Contingent valuation of time spent on NHS waiting lists”, The Economic Journal, 100 (Conference 1990), 193-199.
Rachlis, M.M., et al., 1991, “The vital risk of delayed coronary surgery, lessons from the randomised trials”, Iatrogenics, 103-11
Rickman, N., A. McGuire, 1999, “Providers’ reimbursement in the health care market”, Scottish Journal of Political Economy, 46, 1, 53-71.
Sarin, S., et al., 1993, “Does venous function deteriorate in patients waiting for varicose vein surgery?” Journal of the Royal Society of Medicine, 86, 21-23.
Siu, A.L., et al., 1988, “Use of the hospital in a randomised trial of prepaid care”, Journal of American Medical Association, 259, 1343-1346.
DELSA/ELSA/WD/HEA(2003)6
52
Street, A., and S. Duckett, 1996, “Are waiting lists inevitable?”, Health Policy, 36, 1-15.
Van Ackere, A., and P.C. Smith, 2001, “A note on the integration of system dynamics and economic models”, Journal of Economic Dynamics and Control, 26(1), 1-10.
Van Ackere, A., P. Smith, 1999, “Towards a macro model of National Health Service waiting lists”, System Dynamics Review, 15(3), 225-252.
Videbaek, J., and M. Madsen, 2001, Heart Statistics, 2000/2001, Danish Heart Foundation and National Institute of Public Health, Copenhagen.
Wennberg, J.E., and A. Gittelsohn, 1982, “Variation in medical care among small areas”, Scientific American, 246, 1000-112.
Worthington, D.J., 1987, “Queuing models for hospital waiting list”, Journal of Operational Research Society, 38(5), 413-422.
Worthington, D.J., 1991, “Hospital waiting list management models”, Journal of Operational Research Society, 42(10), 833-843.
Wiley, M., 2001, “Reform and renewal of the Irish health care system: policy and practice”, in Callan, T., and McCoy, D., Budget perspectives. Proceeding of a conference held on the 9 October 2001, The Economic and Social Research Institute.
Xavier, A., 2003, “Hospital competition, GP Fundholders and waiting times in the UK internal market: the case of elective surgery”, International Journal of Health care Finance and Economics, 3, 25-51.
Yates, J., 1987, “Why are we waiting?”, Oxford University Press, Oxford.
Yates, J., 1995, “Private eye, heart and hip”, Churchill Livingstone, London.

DELSA/ELSA/WD/HEA(2003)6
53
OECD HEALTH WORKING PAPERS
Most recent releases are:
No. 1 PHARMACEUTICAL USE AND EXPENDITURE FOR CARDIOVASCULAR DISEASE AND STROKE: A STUDY OF 12 OECD COUNTRIES (2003) Michael Dickson and Stéphane Jacobzone
No. 2 INVESTMENT IN POPULATION HEALTH IN FIVE OECD COUNTRIES (2003) Jan Bennett
No. 3 OECD STUDY OF CROSS-NATIONAL DIFFERENCES IN THE TREATMENT, COSTS AND OUTCOMES OF ISCHAEMIC HEART DISEASE (2003) Pierre Moise, Stéphane Jacobzone and the ARD-IHD Experts Group
No. 4 SURVEY OF PHARMACOECONOMIC ASSESSMENT ACTIVITY IN ELEVEN COUNTRIES (2003) Michael Dickson, Jeremy Hurst and Stéphane Jacobzone
No. 5 STROKE CARE IN OECD COUNTRIES: A COMPARISON OF TREATMENT, COSTS AND OUTCOMES IN 17 COUNTRIES (2003) Lynelle Moon, Pierre Moïse, Stéphane Jacobzone and the ARD-Stroke Experts Group
Other series of working papers available from the OECD include:
OECD SOCIAL, EMPLOYMENT AND MIGRATION WORKING PAPERS
Most recent releases are:
No. 1 CAREER INTERRUPTIONS DUE TO PARENTAL LEAVE: A COMPARATIVE STUDY OF DENMARK AND SWEDEN (2003) Elina Pylkkänen and Nina Smith
No. 2 THE DETERMINANTS OF CHILD LABOUR: THEORY AND EVIDENCE (2003) Drusilla K. Brown, Alan V. Deardorff and Robert M. Stern
No. 3 LE TRAVAIL DES ENFANTS EN AMÉRIQUE LATINE (2003) Pierre-Emmanuel Couralet
No. 4 CHILD LABOUR IN AFRICA (2003) Sonia Bhalotra
No. 5 CHILD LABOUR IN SOUTH ASIA (2003) Eric V. Edmonds
No. 6 SOCIAL POLICIES, FAMILY TYPES AND CHILD OUTCOMES IN SELECTED OECD COUNTRIES (2003) Sheila B. Kamerman, Michelle Neuman, Jane Waldfogel and Jeanne Brooks-Gunn
No. 7 THE IMPACT OF PARENTAL LEAVE ON MATERNAL RETURN TO WORK AFTER CHILDBIRTH IN THE UNITED STATES (2003) Sandra L. Hofferth and Sally C. Curtin
No. 8 FINANCIAL RESOURCES AND RETIREMENT IN NINE OECD COUNTRIES: THE ROLE OF THE TAX SYSTEM (2003) Edward Whitehouse and Gordon Keenay
No. 9 THE VALUE OF PENSION ENTITLEMENTS: A MODEL OF NINE OECD COUNTRIES (2003) Edward Whitehouse
LABOUR MARKET AND SOCIAL POLICY OCCASIONAL PAPERS
This series has now been replaced by two separate series: OECD HEALTH WORKING PAPERS and OECD SOCIAL, EMPLOYMENT AND MIGRATION WORKING PAPERS, available on the OECD website.
No. 63 THE EVOLVING RETIREMENT INCOME PACKAGE: TRENDS IN ADEQUACY AND EQUALITY IN NINE OECD COUNTRIES (2002) Atsuhiro Yamada
No. 62 THE RELATIONSHIP BETWEEN PERSONAL, FAMILY, RESOURCE AND WORK FACTORS AND MATERNAL EMPLOYMENT IN AUSTRALIA (2002) Edith Gray and Peter McDonald
No. 61 LOW FERTILITY AND LABOUR FORCE PARTICIPATION OF ITALIAN WOMEN: EVIDENCE AND INTERPRETATIONS (2002) Daniela Del Boca
Recent available working papers can be found on the OECD website: www.oecd.org.

DELSA/ELSA/WD/HEA(2003)6
54
RECENT RELATED OECD PUBLICATIONS:
AGEING AND EMPLOYMENT POLICIES – SWEDEN (2003)
AGEING AND EMPLOYMENT POLICIES – BELGIUM (2003) (French version only with Executive summary in English)
A DISEASE-BASED COMPARISON OF HEALTH SYSTEMS What is Best and at What Cost? (2003)
OECD REVIEWS OF HEALTH CARE SYSTEMS – KOREA (2003)
TRANSFORMING DISABILITY INTO ABILITY: Policies to Promote Work and Income Security for Disabled People (2003)
BABIES AND BOSSES:Reconciling Work and Family Life (2003)
OECD HEALTH DATA (2003) available in English, French, Spanish and German on CD-ROM (Windows 95, 98, 2000, NT or Me)
SOCIETY AT A GLANCE: OECD Social Indicators (2002)
TOWARDS ASIA’S SUSTAINABLE DEVELOPMENT – The Role of Social Protection (2002)
MEASURING UP: IMPROVING HEALTH SYSTEMS PERFORMANCE IN OECD COUNTRIES (2002)
BENEFITS AND WAGES – OECD Indicators (2002)
KNOWLEDGE AND SKILLS FOR LIFE: First Results from PISA 2000 (2001)
AGEING AND INCOME: Financial Resources and Retirement in 9 OECD Countries (2001)
HEALTH AT A GLANCE (2001)
SOCIETY AT A GLANCE: OECD Social Indicators (2001)
INNOVATIONS IN LABOUR MARKET POLICIES: The Australian Way (2001)
OECD EMPLOYMENT OUTLOOK July 2002 (published annually)
LABOUR MARKET POLICIES AND THE PUBLIC EMPLOYMENT SERVICE (Prague Conference) (2001)
TRENDS IN INTERNATIONAL MIGRATION: SOPEMI 2000 Edition (2001)
REFORMS FOR AN AGEING SOCIETY (2000)
PUSHING AHEAD WITH REFORM IN KOREA: Labour Market And Social Safety-Net Policies (2000)
A SYSTEM OF HEALTH ACCOUNTS (2000)
OECD ECONOMIC STUDIES No. 31, 2000/2 (Special issue on “Making Work Pay”) (2000)
OECD SOCIAL EXPENDITURE DATABASE, 1980-1998 (2001) Third edition - Available in English and French on CD-ROM
For a full list, consult the OECD On-Line Bookstore at www.oecd.org, or write for a free written catalogue to the following address:
OECD Publications Service 2, rue André-Pascal, 75775 PARIS CEDEX 16
or to the OECD Distributor in your country


![· 7khs urjudpphv kdool qfoxghw zrw \shvr ifrxuvhvy l ]& ruh& rxuvhvd qg( ohfwlyh& rxuvhv ( dfkf rxuvhv kdoo kdyh f uhglwv 3 urmhfw 'lvvhuwdwlrqd qg9 lyd9 rf hv kdooe h f uhglwv](https://static.fdocuments.us/doc/165x107/5ea6fe24564be16b902fc194/7khs-urjudpphv-kdool-qfoxghw-zrw-shvr-ifrxuvhvy-l-ruh-rxuvhvd-qg-ohfwlyh.jpg)

![PHYSICS SDM CBCS FINAL SYLLABUS4719 · ^ d } o o p ~ µ } v } u } µ u h i ] w &2856( 3$77(51 $1' 6&+(0( 2) (;$0,1$7,21 &ruh (ohfwlyh 3dshu &rgh 7lwoh ri wkh 3dshu ,qvwuxfwlr](https://static.fdocuments.us/doc/165x107/60dc0b09df62936f482211a5/physics-sdm-cbcs-final-syllabus4719-d-o-o-p-v-u-u-h-i-w-2856.jpg)


![ARBITRAGE DE GRIEF EN VERTU DU CODE DU …€¦ · INTRODUCTION [1] Cette sentence ... Les délais prévus à l'article 1.4.02 débutent à compter de la date de ... technicien en](https://static.fdocuments.us/doc/165x107/5b9b106609d3f24f678cf8cb/arbitrage-de-grief-en-vertu-du-code-du-introduction-1-cette-sentence-les.jpg)