ROIL Corporate Presentation May...
30
INVESTOR PRESENTATION Confidential Material May 2013 OTCQX: ROIL
Transcript of ROIL Corporate Presentation May...

INVESTOR PRESENTATION
Confidential Material
May 2013
OTCQX: ROIL

1
DISCLAIMER
FFFFORWARDORWARDORWARDORWARD LLLLOOKINGOOKINGOOKINGOOKING SSSSTATEMENTSTATEMENTSTATEMENTSTATEMENTS ANDANDANDAND OTHEROTHEROTHEROTHER MATTERSMATTERSMATTERSMATTERS
THE FINANCIAL AND OPERATING PROJECTIONS CONTAINED HEREIN REPRESENT CERTAIN ESTIMATES OF RICHFIELD OIL
AND GAS COMPANY (“RICHFIELD” OR THE “COMPANY”) AS OF THE DATE HEREOF. RICHFIELD’S INDEPENDENT PUBLIC
ACCOUNTANTS HAVE NOT EXAMINED, REVIEWED OR COMPILED THE PROJECTIONS AND, ACCORDINGLY, DO NOT
EXPRESS AN OPINION OR OTHER FORM OF ASSURANCE WITH RESPECT THERETO. FURTHERMORE, NEITHER RICHFIELD
NOR ITS MANAGEMENT CAN GIVE ANY ASSURANCE THAT THE PROJECTIONS CONTAINED HEREIN ACCURATELY
REPRESENT RICHFIELD’S RESULTS OF OPERATIONS OR FINANCIAL CONDITION. SOME OF THESE ASSUMPTIONS
INEVITABLY WILL NOT MATERIALIZE AND UNANTICIPATED EVENTS MAY OCCUR THAT COULD AFFECT RICHFIELD’S
RESULTS. THEREFORE, RICHFIELD’S ACTUAL RESULTS ACHIEVED DURING THE PERIODS COVERED BY THE PROJECTIONS
WILL VARY AND MAY VARY MATERIALLY FROM THE PROJECTED RESULTS. THESE VARIATIONS COULD MATERIALLY
AFFECT RICHFIELD’S ABILITY TO MAKE PAYMENTS WITH RESPECT TO ANY OF ITS OUTSTANDING AND/OR FUTURE
DEBT SERVICE OBLIGATIONS.
UNLESS OTHERWISE NOTED, THE FORECASTED INDUSTRY AND MARKET DATA CONTAINED IN THE ASSUMPTIONS FOR
THE PROJECTIONS ARE BASED UPON MANAGEMENT ESTIMATES AND INDUSTRY AND MARKET PUBLICATIONS AND
SURVEYS. THE INFORMATION FROM INDUSTRY AND MARKET PUBLICATIONS HAS BEEN OBTAINED FROM SOURCES
BELIEVED TO BE RELIABLE, BUT THERE CAN BE NO ASSURANCE AS TO THE ACCURACY OR COMPLETENESS OF THE
INCLUDED INFORMATION. RICHFIELD HAS NOT INDEPENDENTLY VERIFIED ANY OF THE DATA FROM THIRD-PARTY
SOURCES, NOR HAS RICHFIELD ASCERTAINED THE UNDERLYING ECONOMIC ASSUMPTIONS RELIED UPON THEREIN.
THESE MATERIALS ARE BEING SUPPLIED TO YOU SOLELY FOR YOUR INFORMATION AND FOR USE AT THE
PRESENTATION. THIS PRESENTATION AND THESE MATERIALS MAY NOT BE REPRODUCED, REDISTRIBUTED OR PASSED
ON, DIRECTLY OR INDIRECTLY, TO ANY OTHER PERSON OR PUBLISHED, IN WHOLE OR IN PART, BY ANY MEDIUM OR
FOR ANY PURPOSE.

2
Page
Company Overview 3
Kansas Asset Overview 10
Utah and Wyoming Asset Overview 21
TABLE OF CONTENTS

Company Overview

4
INVESTMENT HIGHLIGHTS
• Demonstrated a unique ability to identify, evaluate and develop undercapitalized assets• Found in excess of 1 BBoe of reservoirs in the UT / WY overthrust belt• Pioneered the dewatering production methods now in use throughout Kansas and
Oklahoma, by many operators
Strong Management Team with Proven Track Record
Strong Management Team with Proven Track Record
• Award-winning geologists with over 208 years of combined experience in analyzing drilling and development opportunities in Kansas and Utah
• Experts in exploring for and producing from reservoirs that are not in capillary pressure equilibrium and subject to damage from standard drilling techniques
• Expertise in overthrust geology in Rockies
Best in Class Geological Team Best in Class Geological Team
• Fields with long production histories and significant well control• Documented pay in areas with low historical recovery due to antiquated methods• Significant inventory of low-cost, high-return behind pipe and offset opportunities
Low Risk AssetsLow Risk Assets
• Database of over 300,000 wells – most comprehensive Kansas dataset• Allows for rapid identification and evaluation of potential acquisitions• Proven strategy originally developed by the Richfield management team
Proprietary Database and Research Technology
Proprietary Database and Research Technology
• 1,656 MBoe Proved Reserves (95% oil) - 5,447 MBoe 2P Reserves (91% oil)• $33.9 million Proved PV-10 ($158.3 million 2P PV-10)• Additional unbooked potential in horizontal Mississippian well locations• World class upside in Utah acreage in the Navajo Sandstone, Mancos Shale,
Mississippian, and other formations
Liquids-Rich Asset Base with Significant Upside Potential
Liquids-Rich Asset Base with Significant Upside Potential
Superior Well EconomicsSuperior Well Economics
• Well costs range from $0.25 - $0.50 million, with 26 MBoe EUR per zone• Additional performance-based upside of 80 MBoe per well in the Arbuckle Formation• Re-work and new drill type wells produce IRR’s of 329% and 126%, respectively

5
HIGHLY EXPERIENCED MANAGEMENT TEAM
• 27 years in managing all aspects of oil company development, including geological analysis, design and implementation of advanced engineering, field management and finance
• Founder & CEO of publicly traded HEGCO Canada, an oil & gas exploration company (1995-2000), Iron Thunder Drilling (1998), Nemaha Services (1991), Hewitt Energy Group, Inc. (1988), and New Century Petroleum (1986)
Douglas C. Hewitt: President and CEO
Douglas C. Hewitt: President and CEO
• Practiced law since 1980, over 17 years experience advising oil and gas companies in all areas including leasing, environmental and regulatory compliance and securities matters
• Practiced law with Dexter & Dexter Attorneys at Law from 2004 to 2008• Served as the General Counsel and CFO of HEGCO Canada, Inc. from 1997 to 2002
Mike A. Cederstrom: General Counsel and Corporate Secretary
Mike A. Cederstrom: General Counsel and Corporate Secretary
George T. Ulrich: ControllerGeorge T. Ulrich: Controller• 28 years experience in public and private companies in senior accounting roles, including
15 years with Iomega Corporation• Significant experience in SEC reporting and filings for public companies
• Over 30 years in public accounting and CFO positions for the oil and gas and financial services industries, internationally
• Served as an officer and director for numerous private and public companies• Lead roles in acquisitions, divestitures, turnaround situations and start-up businesses
Glenn G. MacNeil: CFO and DirectorGlenn G. MacNeil: CFO and Director
David K. Detton: Land and LegalDavid K. Detton: Land and Legal
• Licensed Utah attorney since 1976, former partner in two of the 100 largest U.S. law firms• Managed land teams for over $1 B in acquisitions of oil & gas companies• Managed company’s recent acquisitions of over 12,000 acres of mineral rights and 10,000
acre feet of water rights
Alan D. Gaines: Chairman of the Board of Directors
Alan D. Gaines: Chairman of the Board of Directors
• 30 years experience as an energy investment and merchant banker, and has participated in the raising of debt and equity financing in excess of $100 billion
• Chairman, and Founder of Dune Energy, Inc. since its formation in May 2001 through April 2011 and CEO form inception though May 2007

6
DISTINGUISHED BOARD OF DIRECTORS
• 40 years of entrepreneurial experience• Founded Valley Sanitation and merged with 10 other waste businesses to form Superior
Services, Inc.• In 1996, as President and Chairman, completed a successful IPO on the NASDAQ• In 1999, Superior was sold to Vivendi, a French conglomerate for over $1 billion
Joseph P. Tate: Independent Director
Joseph P. Tate: Independent Director
• 38 years of experience in the investment banking industry• Served with The First Boston Corporation / Credit Suisse First Boston in corporate finance
and public finance, including as Vice President and Treasurer. Served as Sr. Managing Director of Cambridge Holding and Cambridge Partners, LLC
John J. McFadden: Independent Director
John J. McFadden: Independent Director
• Brings many years of top-level business and entrepreneurial experience to the Company's Board
• From 1998 to 2002, Mr. Grimm served as: President and CEO of Sam's Club as well as Executive Vice President of Wal-Mart Stores Inc., based in Bentonville, Arkansas
• Mr. Grimm served as the CEO of Pace Membership Warehouse, a subsidiary of Kmart Stores Inc.
• Founder, President and CEO of Price Savers Membership Warehouse, which achieved one billion dollars in sales in its last year prior to being acquired by Kmart Stores Inc.
Thomas R. Grimm: Independent Director
Thomas R. Grimm: Independent Director
7
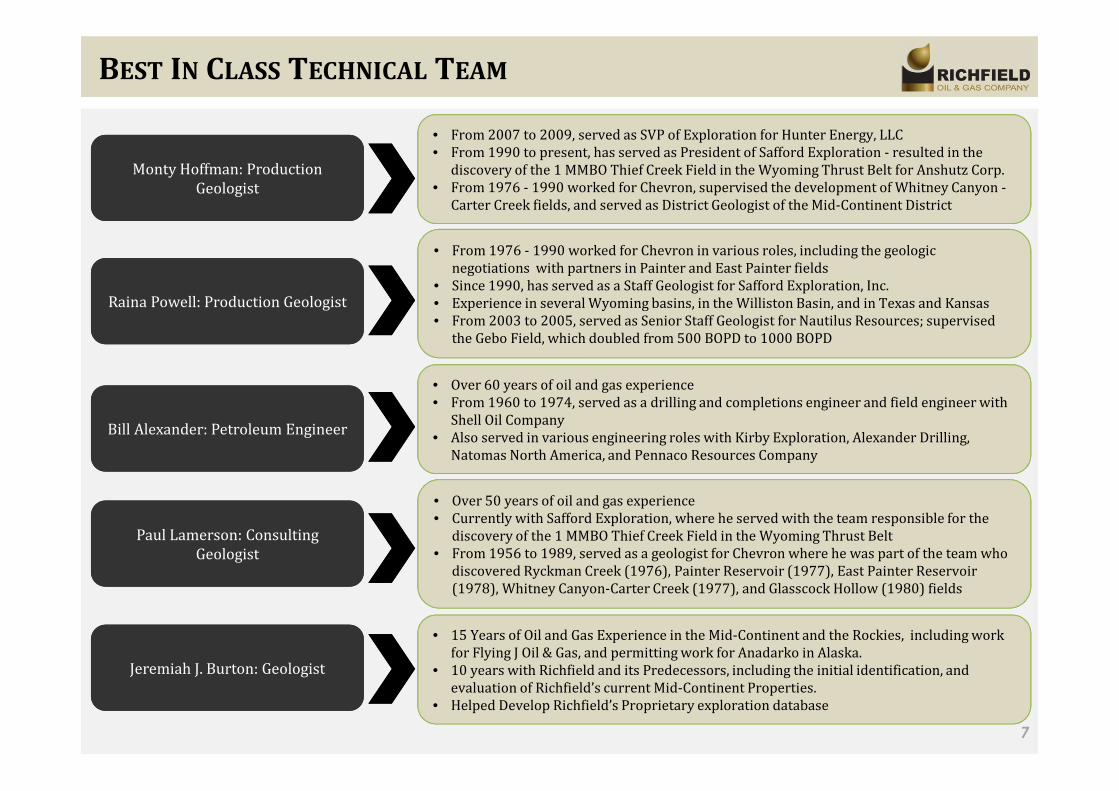
BEST IN CLASS TECHNICAL TEAM
• From 2007 to 2009, served as SVP of Exploration for Hunter Energy, LLC• From 1990 to present, has served as President of Safford Exploration - resulted in the
discovery of the 1 MMBO Thief Creek Field in the Wyoming Thrust Belt for Anshutz Corp.• From 1976 - 1990 worked for Chevron, supervised the development of Whitney Canyon -
Carter Creek fields, and served as District Geologist of the Mid-Continent District
Monty Hoffman: Production Geologist
Monty Hoffman: Production Geologist
• Over 50 years of oil and gas experience• Currently with Safford Exploration, where he served with the team responsible for the
discovery of the 1 MMBO Thief Creek Field in the Wyoming Thrust Belt• From 1956 to 1989, served as a geologist for Chevron where he was part of the team who
discovered Ryckman Creek (1976), Painter Reservoir (1977), East Painter Reservoir (1978), Whitney Canyon-Carter Creek (1977), and Glasscock Hollow (1980) fields
Paul Lamerson: Consulting Geologist
Paul Lamerson: Consulting Geologist
Raina Powell: Production GeologistRaina Powell: Production Geologist
Jeremiah J. Burton: GeologistJeremiah J. Burton: Geologist
• From 1976 - 1990 worked for Chevron in various roles, including the geologic negotiations with partners in Painter and East Painter fields
• Since 1990, has served as a Staff Geologist for Safford Exploration, Inc.• Experience in several Wyoming basins, in the Williston Basin, and in Texas and Kansas• From 2003 to 2005, served as Senior Staff Geologist for Nautilus Resources; supervised
the Gebo Field, which doubled from 500 BOPD to 1000 BOPD
• 15 Years of Oil and Gas Experience in the Mid-Continent and the Rockies, including work for Flying J Oil & Gas, and permitting work for Anadarko in Alaska.
• 10 years with Richfield and its Predecessors, including the initial identification, and evaluation of Richfield’s current Mid-Continent Properties.
• Helped Develop Richfield’s Proprietary exploration database
Bill Alexander: Petroleum EngineerBill Alexander: Petroleum Engineer
• Over 60 years of oil and gas experience• From 1960 to 1974, served as a drilling and completions engineer and field engineer with
Shell Oil Company• Also served in various engineering roles with Kirby Exploration, Alexander Drilling,
Natomas North America, and Pennaco Resources Company

8
� North American exploration and production company based in Salt Lake City, Utah
� Publicly-traded on the OTCQX U.S. Premier Market; Ticker Symbol: ROIL
� Incorporated April 2011, simultaneous with the merger with Hewitt Petroleum, Inc.
� Unique balance of low-risk assets with immediate cash flow impact and long-term upside:
� Kansas - Low-risk, low-cost, high return assets
� Wyoming – Low-risk, moderate cost, high return assets
� Independence Project, Mancos Shale - Moderate risk, high upside
� Central Utah Overthrust –High Risk, high upside
� Near-term strategy focuses on increasing cash flow through exploitation of Kansas and Wyoming assets
� 2013 – 2014 capital program includes 80 re-work and new drill operations
� 5 additional horizontal Mississippian well locations
� Pursue cash-flow accretive bolt-on acquisitions in core operating region
� Central Utah Overthrust acreage provides significant upside potential through Mancos Shale exposure
� Approximately 12,444 acres with unbooked resource potential in the Navajo Sandstone, Mancos Shale, and deep Mississippian formations (127 potential drilling locations) - 89.5% WI in the HUOP Freedom Trend Prospect and 59.6% WI in the Liberty Prospect
� 20,000 acres prospective for the Mancos Shale (31 potential drilling locations)
o Partnered with experienced, NYSE-listed, independent operator with extensive experience in unconventional resource plays – 4% WI in the Independence Prospect
COMPANY SUMMARY

9
2012 RESERVES SUMMARY – DEVELOPED PROPERTIES ONLY
Source: Pinnacle Energy Services, LLC Reserves and Engineering Evaluation dated January 18, 2013Note: Excludes Utah and Wyoming resource potential.1. Represents 5 horizontal Mississippian well locations; additional reserves and present value represent increase well performance from the PD and PUD drilling locations.
Significant Performance-Based Upside
Reserve Drilling Net Net Reserves Data
Class Locations PV-10 ($MM) Oil (MBbl) Gas (MMcf) MBoe % Oil
PD 32 $15.6 546 118 566 96.5%
PUD 43 18.3 1,022 409 1,090 93.7%
Total Proved 75 $33.9 1,568 527 1,656 94.7%
PROB1 5 $124.4 3,407 2,304 3,791 89.9%
Total 2P 80 $158.3 4,975 2,831 5,447 91.3%

Kansas Asset Overview

11
0
100
200
300
400
500
600
700
800
His
tori
cal
Gro
ss P
rod
uct
ion
(B
oe
/d
)
Braman Field – Historical Production And Development Activity
� Douglas Hewitt pioneered the dewatering production methods now in use throughout Oklahoma, by many operators
PROVEN PRODUCTION METHOD
Source: IHS Herold
Acquired for $5,000
$2.6 million total capital expenditures:• 6 New Drills• 3 Re-works• 5 Wells high-volume
submersible pumps
Peak Production: 715 Boe/d
Sold for $6 million

12
� Proprietary database that includes well data from several public and private sources
� Data on 300,000+ wells drilled in the mid-continent since the 1920s
� Invested over $3 million in unique strategic advantage which allows Richfield to:
� Allocate capital to best drilling targets
� Identify and evaluate acquisition targets
EXPLORE AND RESEARCH SYSTEM (“EARS”)
Production history charts
Well data
Well logs & cross-sections
Most Comprehensive Source of Kansas Production, Completion, and Geological Data

13
Richfield Leaseholds and Major Kansas Operators Richfield Properties
� Richfield’s acreage is located in the heart of the Central Kansas Uplift
� 2,626 acres
� 78 total drilling and workover locations
MAJOR OPERATORS IN KANSAS
Source: Company filings, PLS Oil & Gas Database
Central Kansas Uplift
Central Kansas Uplift
Gorham Field• 1,218 acres• 45 locations
Trapp Field• 160 acres
• 7 locations
Koelsch Field• 480 acres
• 10 locations
Perth Field• 480 acres
• 10 locations
South Haven Field• 248 acres
• 5 locations
Bull Field (Oklahoma)• 40 acres
• 1 location
Richfield Leases
Cherokee Basin
Bourbon Arch
Forecast City Basin
Nemaha Anticline
Salina Basin
Sedgwick Basin
Cambridge Arch
Legend Operator
Apache
Chesapeake
Encana
Sandridge
Shell
Hugoton Embayment of the
Anadarko Basin

14
Unproduced Oil and Gas Zones Arbuckle Overview
� Main target is the Arbuckle formation, a water-drive reservoir system that has yielded 2.4 billion barrels since the late-1920s
� Typically outfit new or recompleted Arbuckle wells with high volume submersible pumps
� Typical well will produce 10-40 BOPD and with proper well density, these oil rates can increase
� Untapped Potential
� Formation has been produced almost exclusively from its topmost layer
� Productive lower Arbuckle intervals exist in every major CKU field. These zones were only sporadically produced—mainly due to a lack of information sharing among an unsophisticated, under-capitalized producer base
� Behind Pipe Reserves
� Recent cased hole logs on Richfield’s wells identify significant new reserves in two of Central Kansas’ largest fields
CENTRAL KANSAS UPLIFT OVERVIEW
2009 Halliburton TMD Log, Gorham Field
2009 Halliburton TMD Log, Trapp Field

15
Operating Region Richfield Development Plan
Asset Overview ($ in millions)
� A geological report on a Gorham Field well log indicates over 50’ of pay� Only the top 2’ – 5’ of the Arbuckle has been
produced in the entire field� 2013 - $4.7 million capital expenditures
� 20 re-works/recompletions (including 7 PDP and 1 SWD)
� 5 new drill locations (including 2 SWDs)� 2014 - $12.2 million capital expenditures
� 7 re-works/recompletions� 23 new drill locations (including 3 SWDs)
� Anticipated production growth:� Current NRI Production: 24 Boe/d� Expected 2013 Exit NRI Rate: 240 Boe/d
GORHAM FIELD
Gross Acreage 1,218
Average WI / NRI 100% / 80%
Locations PV-10
PDP (Re-work) 7 $2.0
Re-work 12 7.9
New Drill 26 8.3
Total Proved 45 $18.2
Performance-Based 93.2
Total $111.4
Source: Pinnacle Energy Services, LLC Reserves and Engineering Evaluation dated January 18, 2013

16
Operating Region Field Description
Asset Overview ($ in millions)
KOELSCH FIELD
� Field was discovered in 1952 and abandoned in 1957, leaving 3.9 – 6.4 MMBoe recoverable
� 2013 - $0.5 million capital expenditures� 1 re-work/recompletion (including 1 PDP)� 1 new drill location
� 2014 - $1.7 million capital expenditures� 2 re-works/recompletions (including 1 PDP)� 4 new drill locations (including 1 SWD)
� Anticipated production growth:� Current NRI Production: 9 Boe/d� Expected 2013 Exit NRI Rate: 41 Boe/d
Gross Acreage 480
Average WI / NRI 85.5% / 67.5%
Locations PV-10
PDP (2 Re-work) 3 $0.9
Re-work 1 0.8
New Drill 4 0.9
Probable (Mississippian) 2 2.6
Total 10 $5.3
Performance-Based 11.5
Total $16.8
Source: Pinnacle Energy Services, LLC Reserves and Engineering Evaluation dated January 18, 2013

17
Operating Region Field Description
Asset Overview ($ in millions)
TRAPP FIELD
� Focus area is the highest part of the structure� Wells historically experienced the highest IPs,
highest EURs, and most recoverable reserves� Should the pilot project prove successful, ROIL can
expand to the entire field� 2013 - $0.1 million capital expenditures
� 3 re-works/recompletions (including 1 PDP)� 2014 - $2.6 million capital expenditures
� 2 re-works/recompletions � 5 new drill locations (including 1 SWD)
� Anticipated production growth:� Current NRI Production: 1 Boe/d� Expected 2013 Exit NRI Rate: 3 Boe/d
Gross Acreage 160
Average WI / NRI 100% / 78%
Locations PV-10
PDP (Re-work) 1 $0.0
Re-work 2 0.5
New Drill 4 1.3
Total 7 $1.7
Performance-Based 12.8
Total $14.6
Source: Pinnacle Energy Services, LLC Reserves and Engineering Evaluation dated January 18, 2013

18
Operating Region Field Description
Asset Overview ($ in millions)
PERTH FIELD
� Estimated 12.6 MMBoe of reserves in place, representing recovery efficiency of only 15%� ROIL estimates recovery efficiencies of up to 40%� Acquired properties to redrill and produce the
remaining recoverable reserves of 2 to 3 MMBoe� 2013 - $3.1 million capital expenditures
� 5 re-works/recompletions (2 PDP and 1 SWD)� 7 new drill locations (including 1 SWD)
� Anticipated production growth:� Current NRI Production: 5 Boe/d� Expected 2013 Exit NRI Rate: 199 Boe/d
Gross Acreage 480
Average WI / NRI 85% / 66.3%
Locations PV-10
PDP (Re-work) 2 $0.8
Re-work – 1.3
New Drill 6 5.3
Probable (Mississippian) 2 1.3
Total 10 $8.7Source: Pinnacle Energy Services, LLC Reserves and Engineering Evaluation dated January 18, 2013

19
Operating Region Field Description
Asset Overview ($ in millions)
SOUTH HAVEN
� 2013 - $1.6 million capital expenditures� 1 re-work/recompletion� 3 new drill locations
� Anticipated production growth:� Current NRI Production: 38 Boe/d� Expected 2013 Exit NRI Rate: 135 Boe/d
Source: Pinnacle Energy Services, LLC Reserves and Engineering Evaluation dated January 18, 2013
Consists of 248 acres
1 re-work/recompletion
4 new drill locations
To be updated
To be updated

Utah and Wyoming Asset Overview

Central Utah Overthrust— a string of pearls
• 40% of world oil reserves are arrayed along thrust belts.
• The North American Thrust Belt runs from Alaska (Prudhoe Bay) to Mexico (Cantrell Field).
� Four billion barrels of oil-equivalent (BOE) found in Canadian Overthrust.
� National and state parks, great depths and extreme volcanism have limited activity in Montana and northwestern Wyoming
� Two billion BOE found in northeast Utah and southwest Wyoming in 1970’s and 80’s
• Two large reported discoveries on both the Paxton and the Gunnison Thrust confirm productivity of Central Utah Overthrust.
� Covenant Field, discovered in 2003/4, has estimated 150 million Bbls with 13 million BO produced to date.
� Providence Field, discovered in 2008, multi pay system. Production testing is underway.
21
National and state parks
Extreme volcanism
North American Overthrust (Rocky Mountains):

22
� Liberty #1 Discovery Well – Drilled in 2010
� Logs and testing demonstrated over 1,200 gross feet of interconnected fractures in Jurassic Twin Creek Limestone and 427 feet of oil saturated deeper Navajo Sandstone
� Freedom Trend Prospect
� Gravity maps show prominent structural anomalies
� 2D seismic shows three, overlapping structural closures in the Twin Creek-Navajo
� Independence Project – Drilling operations are anticipated to begin Q3 2013, in the organically rich, Tununk member of the Lower Mancos Shale
� Hogback Ridge (UT- WY Overthrust) – New acreage has been acquired, offsetting a past producing well. Geological research and lease acquisition is ongoing
UTAH AND WYOMING ASSET OVERVIEW
Nephi
Freedom
Trend
Prospect
Richfield Leases
Discovery
Industry Targets
Industry Well Permit
Liberty Field(Gas/Oil
Condensate Discovery)
Independence
Play (Oil Discovery)
Covenant Field (oil)
Providence Field (oil)
Wolverine Painted Rock
(Flowed Gas & Condensate)
Field Acres
Existing
Wells
Drilling
Locations
Working
Interst
Liberty Prospect (UT) 1,025 - 9 74.7%
Liberty Prospect (UT) 160 1 - 64.3%
HUOP Fredom Trend Prospect (UT) 11,259 - 140 89.5%
Independence Prospect (UT) 20,000 1 31 4.0%
Hogback Ridge (UT) 1,511 - 9 100.0%
Graham Reserv (WY) 640 1 1 100.0%
Srping Valley (WY) 160 - 1 100.0%
Total 34,755 3 191

23
Central Utah Overthrust—Source and Migration Pathway
Mississippian Source BasinSeveral Billion barrels of Oil Generated
The U.S. Geological Survey estimates that several billion barrels of oil were generated from Mississippian aged (359-318 million year old) source rocks, mostly likely the Chainman Shale, in western Utah and Nevada. However, only 65 billion barrels has been found in Utah’s Tar sands.
• Oil found in the Covenant Field has a different source.
• The HPI Liberty #1 discovered pristine Mississippian Oil from this large source basin, for the first time.
• This identifies a migration pathway from Western Utah, into the Central Utah Overthrust.
• There are many more undrilled structural closures in the central Utah over-thrust, the largest of which is Richfield’s HUOP Freedom Trend Prospect.
• That prospect covers 11 contiguous miles on the northern end of the Gunnison Thrust.Providence Field
Liberty Field
Covenant Field
Freedom Trend Prospect
Modified from Willis 1999
Modified from Schelling 2007
Tar sands
Tar sands
Tar sands
Tar sands
Only 65 Billion barrels of oil are accounted for in Utah’s Tar Sands
Mississippian Oil Migration Pathway and trapped oil

HUOP Freedom Trend Prospect
Gravity maps show prominent structural anomalies—similar to those in the Covenant and Providence fields but
substantially larger.
24
Multi-spectral satellite photography reveals Freedom Trend acreage to be among the most hydrocarbon-saturated on the Overthrust.
North
9,000 feet
12,000 feet
6,000 feet
2D seismic shows three, overlapping structural closures in the Twin Creek-Navajo. One engineering study found potential gross reservoir volume in excess of several billion barrels.

25
Providence Field Cross Section
Source: Wolverine Gas & Oil Corp.Categorized as several times larger
than Covenant Field
Covenant Field Cross Section
Source: Wolverine Gas & Oil Corp.150 million Barrels of Oil
Fountain Green Prospect. Initial test well, to 13 ,000 feet in Jurassic will target three repeated sections of Twi n Creek-
Navajo with the untested sourcing Mississippian sup er giant.
Richfield’s Freedom Trend Cross SectionSource: Hewitt Petroleum/Richfield Oil & Gas.
Categorized Seismically as several times larger than Providence Discovery
Wolverine Gas and Oil Company’s Covenant Field and subsequent Oxy/Wolverine Providence field discoveries in 2003/4 and 2008, show important similarities with Fountain Green.
• Richfield's position covers the largest identified undrilled structure in the Central Utah Overthrust. • We anticipate a discovery in three stacked Navajo formations, 1,000+ feet thick each, filled to spill point.• The Freedom Trend prospect is in the Mississippian oil migration path.
HUOP Freedom Trend Prospect

High Energy Wedge
delineated by blue faults
•There is a High Energy Wedge (HEW), intersecting the top of the Cretaceous backthrust in Fountain Green. •This appears to be a collapsed zone with extensive natural fracturing. •The HEW is about 2,500’ thick, covers about 17 Square miles. The potential reserves of this system are as large as the Navajo potential.•The HEW is up-dip of where the Tununk Shale is currently generating hydrocarbons
This structure map of the Emery Fm, is based off of 2-D Seismic, and is overlaid with our Geochemical anomaly survey. I t is extremely interesting to note that the Geochemical anomalies are outlined by the faults (in blue) that delineate the High Energy Wedge.
Proposed Location
Cretaceous Backthrust
High Energy Wedge
Unconformity
26
HUOP Freedom Trend Prospect - Cretaceous Reservoirs
The Cretaceous-Tertiary unconformity is in a position to be an excellent trap for hydrocarbons in the Cretaceous Backthrust.

• In 1976, Hansen Oil drilled the Moroni #1A, to a TD of 21,260’, looking for a Mississippian Objective
• Circulation was lost in the naturally fractured Tununk Shale (Lower Mancos) at 11,551’. Oil flowed continuously to the pits. It took 4 months to drill past it and set casing. The well was later plugged.
• In 1998 Cimarron drilled a horizontal Sidetrack in the Tununk with 6 failed laterals.
• Limited perforations in the Tununk, through the stuck drill pipe, have tested as much as 720 BOPD, but Severe mechanical constrictions and LCM’s have combined to make this discovery well inoperative in it’s current condition.
Moroni #1-AXZ Gas Flare 20,800 Units
27
Tununk Shale Fracturing
When the Horizontal was being drilled, Lost Circulation Materials were recovered over 300’ from where they were put in the ground during the 1976 drilling operations. This shows extreme natural fracturing.
The extreme nature of the fracturing at the Moroni #1 AXZH is confirmed by the Dipole Shear Anisotropy log at right.
Because Richfield’s acreage is on the Western side of the Tununk play, close to where the shoreline was, there are fewer clays, and more quartz, which allows the shale to be fractured and maintain those fractures.
Tununk Core Fragment from Irons #1, Sanpete Co. UT, Showing Silt and Sand stringers interbedded within the shale
Utah during the late Cretaceous

Mancos Shale and Others Compared
Eagle Ford ShaleTexas
200 feet Thick11,500 feet deep4.5% Total Organic Carbon.650 Pressure GradientRequires Hydraulic FracturingOil & Gas Prone
Tuscaloosa Marine ShaleLouisiana, Mississippi
200 feet thick10,000 – 15,000 feet deep1% - 4% Total Organic Carbon.7 Pressure Gradient
Bakken ShaleNorth Dakota, Montana, Canada
150 feet thick10,500 feet deep11% Total Organic Carbon.500 Pressure Gradient85 feet of interbedded siltstone
and sandstoneRequires Hydraulic FracturingOil Prone
Independence ProjectMancos Shale (Tununk) Utah
600-3,000’ feet thick11,550 Feet Deep7% Total Organic Carbon.660 Pressure Gradient180 feet of interbedded
siltstone and sandstoneExtensive Natural FracturesOil & Gas Prone
Utica ShaleOhio, Pennsylvania, West Virginia
140 feet thick7,500 – 9,500 feet deep7% Total Organic Carbon.46 Pressure Gradient
A good shale play is defined by having total organic carbon (“TOC’s) greater than 2%, high thermal maturity and a brittle nature that can be fractured. Natural Fractures eliminate the need for Hydraulic Fracturing, saving money reducing possible environmental/political issues.
The Tununk member of the Mancos shale is thick, has high TOC’s, interbedded sandstones, natural fractures, and a high pressure gradient, which should yield a higher than average recovery factor.
28

OTCQX: ROIL
15 W. South Temple, Suite 1050
Salt Lake City, Utah 84101
Phone: (801) 519-8500
www.richfieldoilandgas.com
Contact Information
29