
Riyaj Real World PeRiyaj Real World Performance Issues RAC Focusrformance Issues RAC Focus
40
©OraInternals Riyaj Shamsudeen Real World Performance issues: RAC focused By Riyaj Shamsudeen
-
Upload
gauravkumarsinha -
Category
Documents
-
view
224 -
download
1
Transcript of Riyaj Real World PeRiyaj Real World Performance Issues RAC Focusrformance Issues RAC Focus

©OraInternals Riyaj Shamsudeen
Real World Performance issues: RAC focused
By Riyaj Shamsudeen

©OraInternals Riyaj Shamsudeen 2
Who am I?
18 years using Oracle products/DBA OakTable member Oracle ACE Certified DBA versions 7.0,7.3,8,8i,9i &10g Specializes in RAC, performance tuning,
Internals and E-business suite Chief DBA with OraInternals Co-author of “Expert Oracle Practices” ‘2009 Co-author of “Pro Oracle SQL” ‘2010 Email: [email protected] Blog : orainternals.wordpress.com URL: www.orainternals.com

©OraInternals Riyaj Shamsudeen 3
Disclaimer
These slides and materials represent the work and opinions of the author and do not constitute official positions of my current or past employer or any other organization. This material has been peer reviewed, but author assume no responsibility whatsoever for the test cases.
If you corrupt your databases by running my scripts, you are solely responsible for that.
This material should not should not be reproduced or used without the authors' written permission.

©OraInternals Riyaj Shamsudeen 4
This presentation
Idea behind this presentation is to show how scientific techniques can be used to troubleshoot the performance issues, however bizarre those
issues may be.
To paraphrase Tanel, “[It] is an Art for those who don’t understand…”

©OraInternals Riyaj Shamsudeen 5
Agenda
Issue: Hung RAC cluster due to single process
Issue: LMS: A friend or foe?
Issue: Extreme GC Buffer Busy waits

©OraInternals Riyaj Shamsudeen 6
Problem
All RAC instances are stuck for 10-15 minutes intermittently. Application is not responsive during that time period.
This happens randomly and no specific correlation with time of day.

©OraInternals Riyaj Shamsudeen 7
AWR analysis
Top User Events
Event Event Class % Event Avg Active Sessions gc buffer busy acquire Cluster 46.61 6.42 CPU + Wait for CPU CPU 21.91 3.02 gc cr block busy Cluster 9.14 1.26 enq: CF - contention Other 4.44 0.61 gc current block busy Cluster 2.50 0.35
AWR analysis indicates gc buffer busy waits, many sessions were waiting for GC events.

©OraInternals Riyaj Shamsudeen 8
ASH analysis
ASH report confirms the issue too.
Top User Events
Event Event Class % Event Avg Active Sessions gc buffer busy acquire Cluster 43.68 11.48 gc cr block busy Cluster 10.92 2.87 CPU + Wait for CPU CPU 9.84 2.59 row cache lock Concurrency 5.12 1.35 gc cr multi block request Cluster 4.90 1.29

©OraInternals Riyaj Shamsudeen 9
Why gc buffer busy?
GC buffer busy waits indicates that buffer is busy waiting for some sort of Global event.
Another session is working on that buffer and that session is waiting for a global cache event.
We need to understand why that session 2 is waiting for global cache event.

©OraInternals Riyaj Shamsudeen 10
Another node…
In RAC, it is essential to review performance statistics from all nodes.
One node performance can bring down entire cluster performance or even lead to hung cluster.
Top User Events
Event Event Class % Event Avg Active Sessions buffer busy waits Concurrency 30.92 12.00 log file sync Commit 23.61 9.16 log buffer space Configuration 16.88 6.55 CPU + Wait for CPU CPU 7.48 2.90 row cache lock Concurrency 3.31 1.29

11
Review of waits
Node #1 Node #2 Node #3 Node #4
User sessions are waiting for Global buffer busy waits.
User sessions are waiting for buffer busy waits and log file sync waits.
Background sessions are Waiting for CF locks.
Event % Event buffer busy waits 30.92 log file sync 23.61 log buffer space 16.88
Event % Activity enq: CF - contention 5.52 CPU + Wait for CPU 2.62 enq: TM - contention 1.28 gc cr block busy 1.27

©OraInternals Riyaj Shamsudeen 12
Buffer busy waits
Buffer busy waits indicates that buffers are not available and busy undergoing a short change.
Buffer busy waits can be caused by DBW trying to write buffers too.
Top User Events
Event Event Class % Event Avg Active Sessions buffer busy waits Concurrency 30.92 12.00 log file sync Commit 23.61 9.16 log buffer space Configuration 16.88 6.55 CPU + Wait for CPU CPU 7.48 2.90 row cache lock Concurrency 3.31 1.29

©OraInternals Riyaj Shamsudeen 13
Log file sync waits
Log file sync waits indicates that log file write mechanism is not fast enough.
This could be due to problem with LGWR, Log file I/O performance issue or even OS CPU scheduling issues.
Top User Events
Event Event Class % Event Avg Active Sessions buffer busy waits Concurrency 30.92 12.00 log file sync Commit 23.61 9.16 log buffer space Configuration 16.88 6.55 CPU + Wait for CPU CPU 7.48 2.90 row cache lock Concurrency 3.31 1.29

©OraInternals Riyaj Shamsudeen 14
Background waits
Further review of ASH report indicates that there were waits for background processes too.
Few enq: CF contention waits. %Activity is 5.5, but that can be misleading.
Top Background Events
Event Event Class % Activity Avg Active Sessions enq: CF - contention Other 5.52 0.63 CPU + Wait for CPU CPU 2.62 0.30 enq: TM - contention Application 1.28 0.15 gc cr block busy Cluster 1.27 0.15
©OraInternals Riyaj Shamsudeen 15
Review
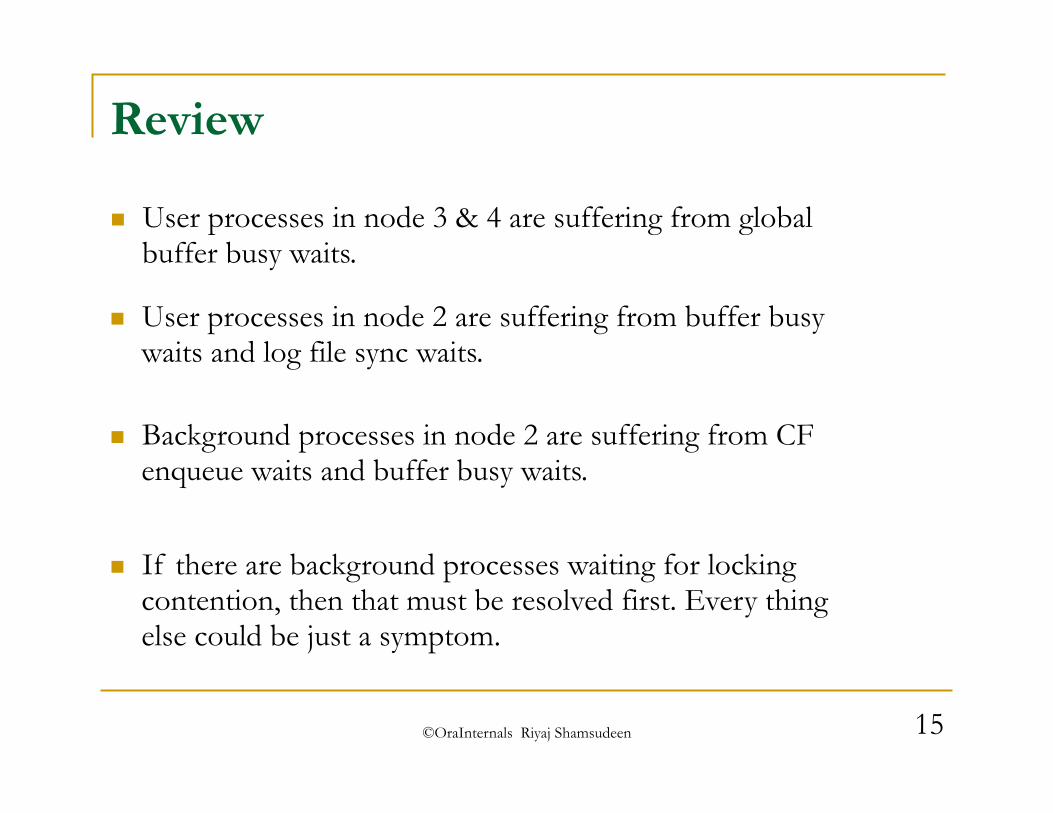
User processes in node 3 & 4 are suffering from global buffer busy waits.
User processes in node 2 are suffering from buffer busy waits and log file sync waits.
Background processes in node 2 are suffering from CF enqueue waits and buffer busy waits.
If there are background processes waiting for locking contention, then that must be resolved first. Every thing else could be just a symptom.

©OraInternals Riyaj Shamsudeen 16
gv$lock INST ADDR KADDR SID TY ID1 ID2 LMODE REQ CTIME BLOCK ----- ---------------- ---------------- ---- -- ----- ----- ------ ----- -------- -----
4 0000001022E12398 0000001022E123F0 4368 CF 0 0 0 4 8 0 4 0000001022E12FE0 0000001022E13038 4369 CF 0 0 0 4 39 0
... 4 0000001022E15588 0000001022E155E0 4374 CF 0 0 0 4 34 0 4 0000001022E12BD0 0000001022E12C28 4375 CF 0 0 0 4 39 0
4 0000001022DFBD30 0000001022DFBD88 4387 CF 0 0 2 0 120592 2 4 0000001022E13E98 0000001022E13EF0 4388 CF 0 0 0 5 49 0
... 1 0000001022E12058 0000001022E120B0 4372 CF 0 0 0 4 41 0 1 0000001022E121F8 0000001022E12250 4373 CF 0 0 0 4 41 0
1 0000001022E12E40 0000001022E12E98 4374 CF 0 0 0 4 41 0 1 0000001022E133F0 0000001022E13448 4376 CF 0 0 0 4 41 0
1 0000001022DFBD30 0000001022DFBD88 4387 CF 0 0 2 0 121783 2
3 0000001022E09BC8 0000001022E09C20 4134 CF 0 0 0 4 99 0
3 0000001022E15A68 0000001022E15AC0 4368 CF 0 0 0 4 39 0
3 0000001022E15658 0000001022E156B0 4369 CF 0 0 0 4 39 0 3 0000001022E15C08 0000001022E15C60 4370 CF 0 0 0 4 39 0 ...
3 0000001022E154B8 0000001022E15510 4376 CF 0 0 0 4 39 0 3 0000001022DFBD30 0000001022DFBD88 4387 CF 0 0 2 0 120855 2
2 0000001022E15318 0000001022E15370 4368 CF 0 0 0 4 40 0 ... 2 0000001022E14EF0 0000001022E14F48 4373 CF 0 0 0 5 81 0
2 0000001022DFBD30 0000001022DFBD88 4387 CF 0 0 2 0 121231 2 38 rows selected.
Notice that no process holding CF lock in an incompatible mode.

©OraInternals Riyaj Shamsudeen 17
Locking scenario
CF-0-0
lock
Hash bucket
lock Waiters’ queue
Holders’ queue
lock
lock
4387/1
4387/2
4387/3
lock 4387/4
lock
lock
lock
lock
…
4134/3
Resource CF lock is held only in compatible mode.
pid 4134 has highest ctime of 99 seconds and state is WAITING. So, it is first in the waiters’ queue.
But why waiting?

©OraInternals Riyaj Shamsudeen 18
Problem continued.. INST_ID ADDR KADDR SID TY ID1 ID2 LMODE REQUEST CTIME BLOCK ---------- ---------------- ---------------- ---------- -- ---------- ---------- ---------- ---------- ---------- ---------- 4 0000001022E12398 0000001022E123F0 4368 CF 0 0 0 4 193 0 4 0000001022E12FE0 0000001022E13038 4369 CF 0 0 0 4 224 0 4 0000001022E13CF8 0000001022E13D50 4370 CF 0 0 0 5 266 0 4 0000001022E0FD20 0000001022E0FD78 4371 CF 0 0 0 4 224 0 4 0000001022E12E40 0000001022E12E98 4372 CF 0 0 0 4 224 0 4 0000001022E126D8 0000001022E12730 4373 CF 0 0 0 4 224 0 4 0000001022E15588 0000001022E155E0 4374 CF 0 0 0 4 219 0 4 0000001022E12BD0 0000001022E12C28 4375 CF 0 0 0 4 224 0 4 0000001022DFBD30 0000001022DFBD88 4387 CF 0 0 2 0 120777 2 4 0000001022E13E98 0000001022E13EF0 4388 CF 0 0 0 5 234 0 2 0000001022E15318 0000001022E15370 4368 CF 0 0 0 4 224 0 2 0000001022E15CD8 0000001022E15D30 4369 CF 0 0 0 4 224 0 2 0000001022E14108 0000001022E14160 4370 CF 0 0 0 4 224 0 2 0000001022E15E90 0000001022E15EE8 4371 CF 0 0 0 4 223 0 2 0000001022E15B38 0000001022E15B90 4372 CF 0 0 0 4 224 0 2 0000001022E14EF0 0000001022E14F48 4373 CF 0 0 0 5 265 0 2 0000001022E154B8 0000001022E15510 4374 CF 0 0 0 4 224 0 2 0000001022E15DA8 0000001022E15E00 4375 CF 0 0 0 4 224 0 2 0000001022DFBD30 0000001022DFBD88 4387 CF 0 0 2 0 121415 2 1 0000001022E13660 0000001022E136B8 4368 CF 0 0 0 4 225 0 1 0000001022E12128 0000001022E12180 4369 CF 0 0 0 4 225 0 1 0000001022E13250 0000001022E132A8 4370 CF 0 0 0 4 225 0 1 0000001022E10CA8 0000001022E10D00 4371 CF 0 0 0 4 249 0 1 0000001022E12058 0000001022E120B0 4372 CF 0 0 0 4 225 0 1 0000001022E121F8 0000001022E12250 4373 CF 0 0 0 4 225 0 1 0000001022E12E40 0000001022E12E98 4374 CF 0 0 0 4 225 0 1 0000001022E133F0 0000001022E13448 4376 CF 0 0 0 4 225 0 1 0000001022DFBD30 0000001022DFBD88 4387 CF 0 0 2 0 121967 2
3 0000001022E09BC8 0000001022E09C20 4134 CF 0 0 0 4 283 0 3 0000001022E0EE68 0000001022E0EEC0 4190 CF 0 0 0 4 18 0 3 0000001022E15A68 0000001022E15AC0 4368 CF 0 0 0 4 223 0 3 0000001022E15658 0000001022E156B0 4369 CF 0 0 0 4 223 0 3 0000001022E15C08 0000001022E15C60 4370 CF 0 0 0 4 223 0 3 0000001022E13590 0000001022E135E8 4371 CF 0 0 0 4 238 0 3 0000001022E13F68 0000001022E13FC0 4372 CF 0 0 0 4 225 0 3 0000001022E15998 0000001022E159F0 4373 CF 0 0 0 4 223 0 3 0000001022E15318 0000001022E15370 4374 CF 0 0 0 4 223 0 3 0000001022E154B8 0000001022E15510 4376 CF 0 0 0 4 223 0 3 0000001022DFBD30 0000001022DFBD88 4387 CF 0 0 2 0 121039 2
Process is waiting for 283 Seconds

©OraInternals Riyaj Shamsudeen 19
Pstack Pstack 4134
#0 0x00000030364cb053 in __select_nocancel () from /lib64/libc.so.6 #1 0x0000000001d92111 in skgpnap () #2 0x000000000752d9b6 in ksliwat () #3 0x000000000752b668 in kslwait () .... #9 0x000000000753ed1b in ksqgtlctx () #10 0x000000000753db0b in ksqgelctx () #11 0x00000000076f5bb8 in kcc_get_enqueue () #12 0x00000000076f329b in kccocx () #13 0x00000000076f3140 in kccbcx () #14 0x0000000005563b0c in kcra_scan_redo () #15 0x000000000556334d in kcra_dump_redo () #16 0x0000000005561fcc in kcra_dump_redo_internal ()
Usually called if the process dumping due to errors or exceptions.
Is there a process dumping errors?

©OraInternals Riyaj Shamsudeen 20
Alert log
*** 2009-05-21 10:46:04.109 *** SESSION ID:(4134.4598) 2009-05-21 10:46:04.109 *** CLIENT ID:() 2009-05-21 10:46:04.109 *** SERVICE NAME:(PROD) 2009-05-21 10:46:04.109 *** MODULE NAME:() 2009-05-21 10:46:04.109 *** ACTION NAME:() 2009-05-21 10:46:04.109 Dump continued from file: /plogs/PROD/dump/diag/rdbms/prod/PROD3/trace/
PROD3_ora_1004.trc ORA-07445: exception encountered: core dump [ksxpmprp()+42] [SIGSEGV] [ADDR:0x14] [PC:
0x33BB5BE] [Address not mapped to object] []
At the same time, alert log had entries for that SID 4134
At the end of the trace file it was hung in ‘PINNED BUFFER HISTORY’.

©OraInternals Riyaj Shamsudeen 21
That’s a bug! Of course, that’s a bug we were encountering.
As per the bug, process requests for CF locks, but hangs until cleaned up by pmon.
Of course, easy fix is to kill the processes encountering ORA-7445 errors immediately and the long term fix was to fix these bugs (Both ORA-7445 errors and bug 8318486).
Bug 8318486: CF ENQUEUE CONTENTION WHILE DUMPING REDO RECORDS IN PINNED BUFFER HISTORY

©OraInternals Riyaj Shamsudeen 22
CF enqueue wierdness
INST_ID SID TY ID1 ID2 LMODE REQUEST CTIME BLOCK ---------- ---- -- ---------- ---------- ---------- ---------- ---------- ----------
2 4387 CF 0 0 2 0 122115 2 1 4113 CF 0 4 4 0 77 0
1 4113 CF 0 0 4 0 77 2 1 4387 CF 0 0 2 0 122667 2 4 4387 CF 0 0 2 0 121476 2
3 4387 CF 0 0 2 0 121739 2

©OraInternals Riyaj Shamsudeen 23
Agenda
Issue: Hung RAC cluster due to single process
Issue: LMS: A friend or foe?
Issue: Extreme GC Buffer Busy waits

©OraInternals Riyaj Shamsudeen 24
Problem
Client had high Global Cache response time waits.
Global Cache and Enqueue Services - Workload Characteristics ~~~~~~~~~~~~~~~~~~~~~~~~~~~~~~~~~~~~~~~~~~~~~~~~~~~~~~~~~~~~ Avg global enqueue get time (ms): 2.5
Avg global cache cr block receive time (ms): 18.2 Avg global cache current block receive time (ms): 14.6
Avg global cache cr block build time (ms): 0.3 Avg global cache cr block send time (ms): 0.2 Global cache log flushes for cr blocks served %: 25.1 Avg global cache cr block flush time (ms): 5.2
Avg global cache current block pin time (ms): 0.4 Avg global cache current block send time (ms): 0.2 Global cache log flushes for current blocks served %: 1.7 Avg global cache current block flush time (ms): 5.2

©OraInternals Riyaj Shamsudeen 25
GC CR latency
GC CR latency ~=
Time spent in sending message to LMS +
LMS processing (building blocks etc) + LGWR latency ( if any) +
LMS send time +
Wire latency
Statistics : gc cr block flush time gc cr block build time gc cr block send time

©OraInternals Riyaj Shamsudeen 26
CR latency
Wait time Node 1 Node 2 Node 3 Node 4
Avg. CR block receive time 18.2 6.7 20.0 17.3
Avg CUR block receive time 14.6 5.0 11.6 17.3
Three instances are suffering from CR latency, except instance 2!
In RAC, node suffering from chronic issues causes GC performance issues in other nodes. With that logic in mind, node 2 should be suffering from chronic issues.

©OraInternals Riyaj Shamsudeen 27
Breakdown of latency
Statistics Node 1 Node 2 Node 3 Node 4 Total
gc cr block build time 11,392 148,666 5,267 6,632 171,957
Gc cr block flush time 56,634 75,751 34,406 53,031 219,822
Gc cr block send time 9,153 7,779 4,018 7,905 28,855
Sum of flush time is higher, but it is comparable across the cluster.
But, notice the build time in node 2.

©OraInternals Riyaj Shamsudeen 28
Consistent reads
Statistics Node 1 Node 2 Node 3 Node 4
data blocks consistent Reads – undo records applied
2,493,242 86,988,512 3,090,308 7,208,575
db block changes 6,276,149 43,898,418 20,698,189 14,259,340
For CR blocks, time is spent in building blocks, which indicates consistent block generation.
Very high value compared to other nodes.

©OraInternals Riyaj Shamsudeen 29
Time line We wanted to see when this problem started. Surprisingly,
instance 2 had a pattern of increasing flush time.

©OraInternals Riyaj Shamsudeen 30
Db block changes with segstats as ( select * from (
select inst_id, owner, object_name, object_type , value , rank() over (partition by inst_id, statistic_name order by value
desc ) rnk , statistic_name from gv$segment_statistics where value >0
) where rnk <11 ) ,
sumstats as ( select inst_id, statistic_name, sum(value) sum_value from gv$segment_statistics group by statistic_name, inst_id)
select a.inst_id, a.statistic_name, a.owner, a.object_name, a.object_type,a.value,
(a.value/b.sum_value)*100 perc from segstats a , sumstats b
where a.statistic_name = b.statistic_name and a.inst_id=b.inst_id and a.statistic_name ='db block changes'
order by a.statistic_name, a.value desc /
INST_ID STATISTIC_NAME OWNER OBJECT_NAME TYPE VALUE PERC ------- ------------------ ----- ------------------------------ ----- ------------ ------ 2 db block changes AR CUSTOM_TABLE TABLE 122949282400 81.39 4 INV MTL_MATERIAL_TRANS_TEMP_N1 INDEX 1348827648 16.59 3 AR RA_INTERFACE_LINES_N2 INDEX 791733296 9.77 3 AR RA_CUSTOMER_TRX_LINES_N2 INDEX 715855840 8.83 1 INV MTL_MATERIAL_TRANS_TEMP_N1 INDEX 652495808 12.44 ...
Unfortunately, AWR report does not capture segments with high ‘db block changes’.
©OraInternals Riyaj Shamsudeen 31
Solution
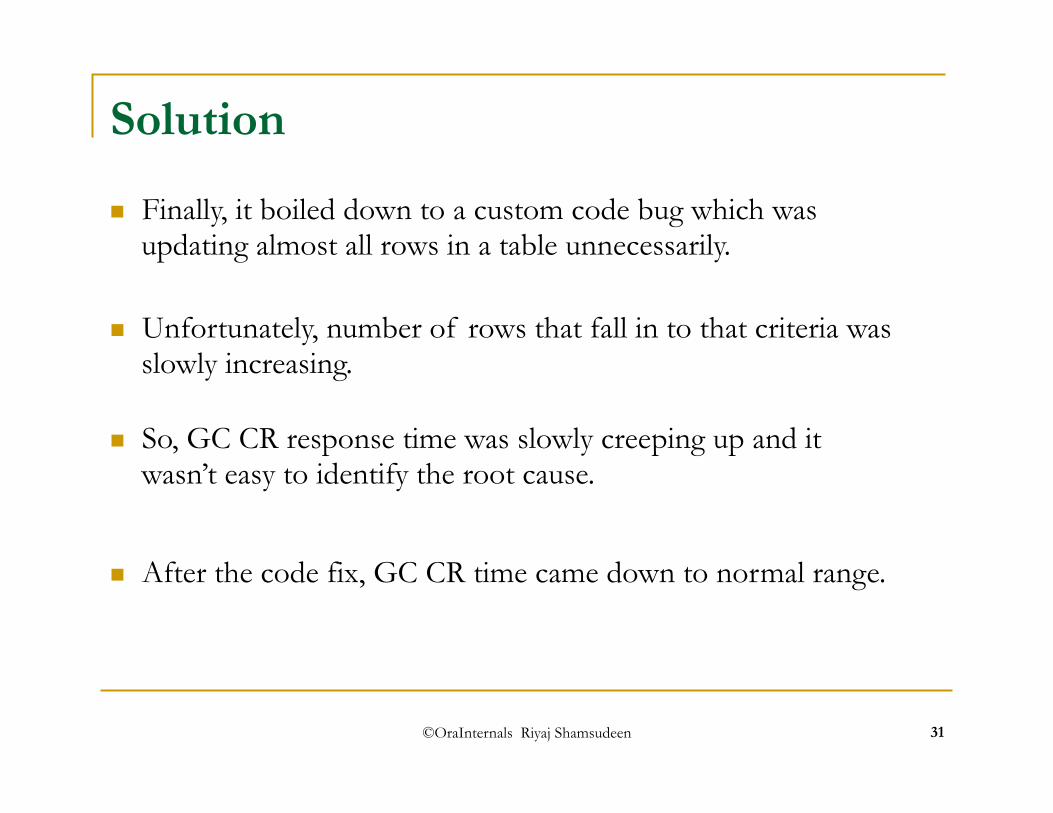
Finally, it boiled down to a custom code bug which was updating almost all rows in a table unnecessarily.
Unfortunately, number of rows that fall in to that criteria was slowly increasing.
So, GC CR response time was slowly creeping up and it wasn’t easy to identify the root cause.
After the code fix, GC CR time came down to normal range.

©OraInternals Riyaj Shamsudeen 32
Agenda
Issue: Hung RAC cluster due to single process
Issue: LMS: A friend or foe?
Issue: Extreme GC Buffer Busy waits

©OraInternals Riyaj Shamsudeen 33
Problem
Excessive amount of gc buffer busy waits in the database.

©OraInternals Riyaj Shamsudeen 34
ASH to help
Excessive amount of gc buffer busy waits in the database.
Select sql_id, event, current_obj#,sum (cnt) from gv$active_session_history where sample_time between sysdate-1 and sysdate group by sample_time, sql_id, event, current_obj# order by 3 / SQL_ID |EVENT |CURRENT_OBJ#| COUNT(*) --------------------|----------------------------------------|------------|----------
… 14t0wadn1t0us |gc buffer busy | 8366| 33

©OraInternals Riyaj Shamsudeen 35
Right hand growth
Excessive amount of gc buffer busy waits in the database.
Select sql_id, event, current_obj#,sum (cnt) from gv$active_session_history where sample_time between sysdate-1 and sysdate group by sample_time, sql_id, event, current_obj# order by 3 / SQL_ID |EVENT |CURRENT_OBJ#| COUNT(*) --------------------|----------------------------------------|------------|----------
… 14t0wadn1t0us |gc buffer busy | 8366| 33

©OraInternals Riyaj Shamsudeen 36
Non-partitioned indexes
Ses 1
Ses 2
Ses 3
Ses 4
Ses 5
Ses 6

©OraInternals Riyaj Shamsudeen 37
Hash Partitioned indexes Ses 1 Ses 2 Ses 3 Ses 4 Ses 5 Ses 6
©OraInternals Riyaj Shamsudeen 38
Solution
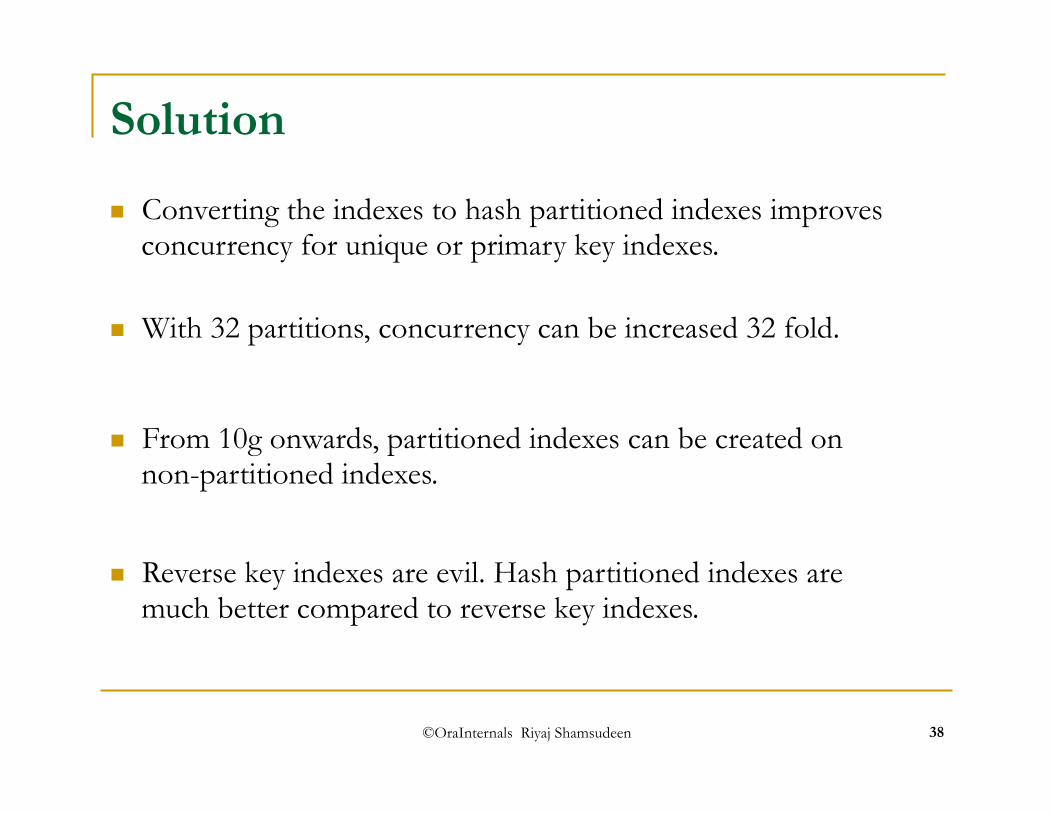
Converting the indexes to hash partitioned indexes improves concurrency for unique or primary key indexes.
With 32 partitions, concurrency can be increased 32 fold.
From 10g onwards, partitioned indexes can be created on non-partitioned indexes.
Reverse key indexes are evil. Hash partitioned indexes are much better compared to reverse key indexes.

©OraInternals Riyaj Shamsudeen 39
Contact info: Email: [email protected] Blog : orainternals.wordpress.com URL : www.orainternals.com
Thank you for attending!

©OraInternals Riyaj Shamsudeen 40
References
Oracle support site. Metalink.oracle.com. Various documents Internal’s guru Steve Adam’s website
www.ixora.com.au Jonathan Lewis’ website www.jlcomp.daemon.co.uk Julian Dyke’s website www.julian-dyke.com
‘Oracle8i Internal Services for Waits, Latches, Locks, and Memory’ by Steve Adams Tom Kyte’s website Asktom.oracle.com Blog: http://orainternals.wordpress.com