By Riyaj Shamsudeen - Oracle database internals by Riyaj · By Riyaj Shamsudeen ©OraInternals...
74
©OraInternals Riyaj Shamsudeen Why does Optimizer hates my SQL! By Riyaj Shamsudeen
Transcript of By Riyaj Shamsudeen - Oracle database internals by Riyaj · By Riyaj Shamsudeen ©OraInternals...

©OraInternals Riyaj Shamsudeen
Why does Optimizer hates my SQL!
ByRiyaj Shamsudeen
©OraInternals Riyaj Shamsudeen 2
Who am I?
� 17 years using Oracle products� Over 16 years as Oracle DBA� Certified DBA versions 7.0,7.3,8,8i &9i� Specializes in performance tuning, Internals and E-business suite� Principal at OraInternals – A performance consulting company. http://www.orainternals.com
� OakTable member� Email: [email protected]� Blog : http://orainternals.wordpress.com

©OraInternals Riyaj Shamsudeen 3
Disclaimer
These slides and materials represent the work and opinions of the author and do not constitute official positions of my current or past employer or any other organization. This material has been peer reviewed, but author assume no responsibility whatsoever for the test cases.
If you corrupt your databases by running my scripts, you are solely responsible for that.
This material should not be reproduced or used without the authors' written permission.
©OraInternals Riyaj Shamsudeen 4
Agenda� Selectivity� Cardinality & histograms� Correlation issues� Few more reasons behind optimizer decisions.
� Bind peeking issues� Lack of statistics� Lack of system statistics� Missing statistics on indexes� Missing statistics on columns� Arithmetic comparison issues.
©OraInternals Riyaj Shamsudeen 5
Selectivity
Selectivity is a measure, with values ranging between 0 and 1, indicating how many elements will be selected from a fixed set of elements.

©OraInternals Riyaj Shamsudeen 6
Selectivity – Example
FLCACACACATXTXTXCode
Ronaldo30Ronaldinho20Pele20Raj20Juan20Larry10Mary10Scott10EmpDept� Selectivity of predicate
dept =:b1 is 1/NDV=1/3=0.333
� Selectivity of predicate(dept=:b1 or code=:b2)
=~ (1/3) +( 1/3 ) – (1/3)*(1/3)= 0.555� Selectivity of predicate(dept=:b1 and code=:b2)=~ (1/3)*(1/3)= 0.111
NDV : # of distinct values

©OraInternals Riyaj Shamsudeen 7
Selectivity� Lower the selectivity, better the predicates are.
� Probability concepts will be applied in calculating selectivity of many predicates.
p(A and B) = p(A) * p (B)
p(A or B) = p(A) + p(B) – p(A) * p (B)

©OraInternals Riyaj Shamsudeen 8
Agenda - Part I� Selectivity� Cardinality & histograms� Correlation issues� Few more reasons behind optimizer decisions.
� Bind peeking issues� Lack of statistics� Lack of system statistics� Missing statistics on indexes� Missing statistics on columns� Arithmetic comparison issues.

©OraInternals Riyaj Shamsudeen 9
Cardinality� Cardinality is a measure, an estimate of number of rows expectedfrom a row source.
� In a very simple sense:Cardinality = Selectivity * Number of rows
� Cardinality estimates are very essential and need to be accuratefor the optimizer to choose optimal execution plan.

©OraInternals Riyaj Shamsudeen 10
Cardinality – No histogram
Ronaldo30Ronaldinho20Pele20Jill20Karen20Larry10Mary10Scott10EmpDept� Cardinality of predicate
dept =:b1 = (Selectivity * Num_rows)= (1/3) * 8 = 2.6 rows = 3 rows
� Under estimation of cardinality is a root cause for many SQL performance issues.
143Actual
3dept=303dept=20
=3dept=10ChangeEstimatepredicate
©OraInternals Riyaj Shamsudeen 11
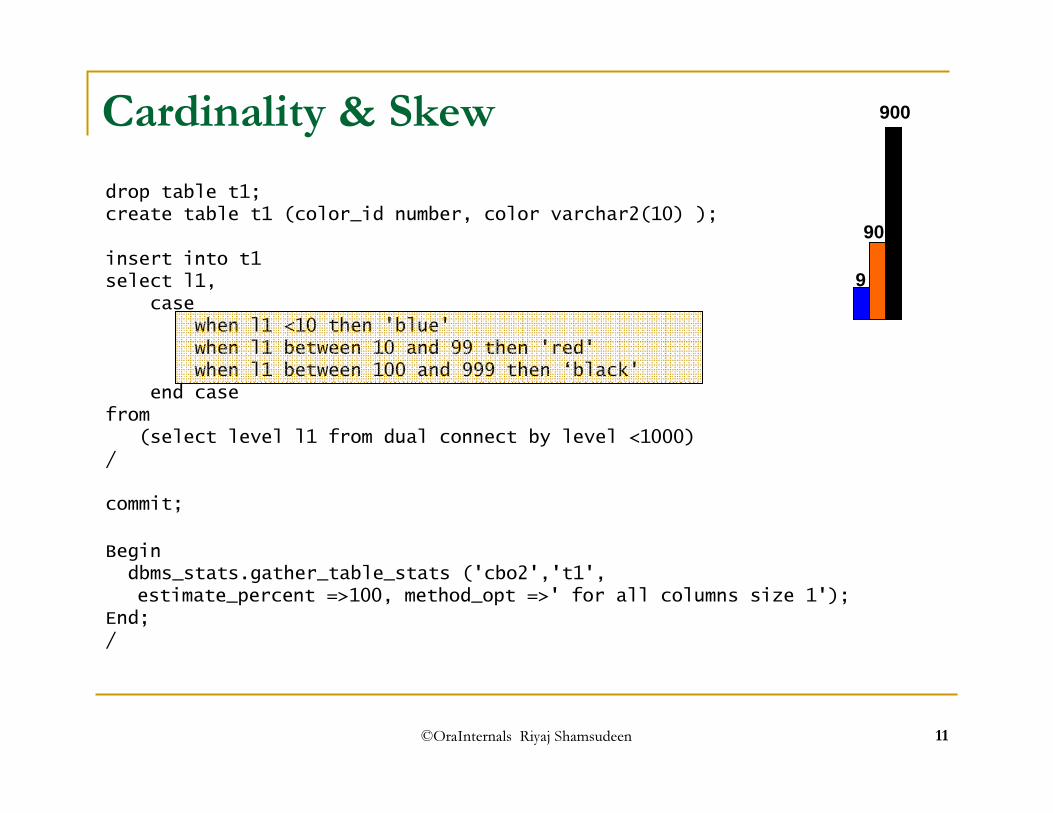
Cardinality & Skewdrop table t1;create table t1 (color_id number, color varchar2(10) );insert into t1select l1,
casewhen l1 <10 then 'blue'when l1 between 10 and 99 then 'red'when l1 between 100 and 999 then ‘black'
end casefrom
(select level l1 from dual connect by level <1000)/commit;
9
90
900
Begindbms_stats.gather_table_stats ('cbo2','t1', estimate_percent =>100, method_opt =>' for all columns size 1');
End;/

©OraInternals Riyaj Shamsudeen 12
Cardinality : w/o histogramsselect color, count(*) from t1 group by color order by 2COLOR COUNT(*)---------- ----------blue 9red 90white 900select count(*) from t1 where color='blue';
SQL> select * from table (dbms_xplan.display_cursor);------------------------------------------------------------------------| Id | Operation | Name | Rows | Bytes | Cost (%CPU)| Time |------------------------------------------------------------------------| 0 | SELECT STATEMENT | | | | 3 (100)|| 1 | SORT AGGREGATE | | 1 | 6 | ||* 2 | TABLE ACCESS FULL| T1 | 333 | 1998 | 3 (0)| 00:01 |------------------------------------------------------------------------Predicate Information (identified by operation id):---------------------------------------------------
2 - filter("COLOR"='blue')
©OraInternals Riyaj Shamsudeen 13
If the column values have skew and if there are predicates accessing that column, then use histograms. But, use them sparingly!
Histograms
©OraInternals Riyaj Shamsudeen 14
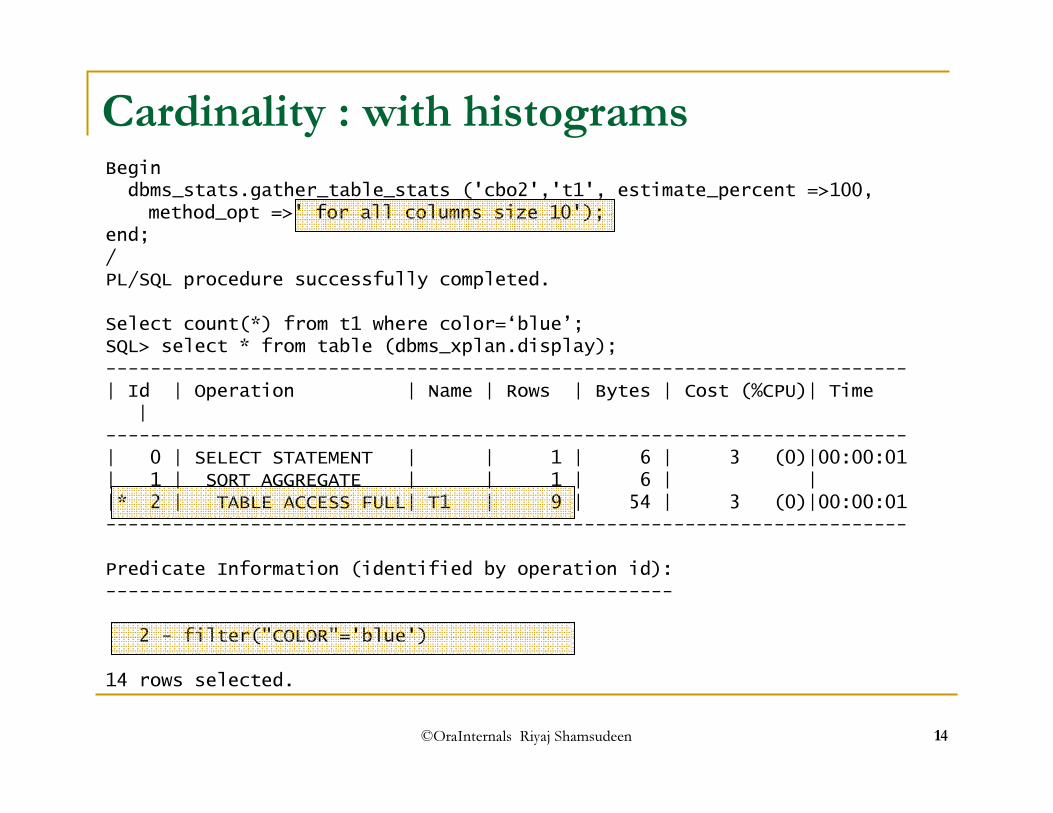
Cardinality : with histogramsBegindbms_stats.gather_table_stats ('cbo2','t1', estimate_percent =>100,method_opt =>' for all columns size 10');
end;/PL/SQL procedure successfully completed.Select count(*) from t1 where color=‘blue’;SQL> select * from table (dbms_xplan.display);------------------------------------------------------------------------| Id | Operation | Name | Rows | Bytes | Cost (%CPU)| Time
|------------------------------------------------------------------------| 0 | SELECT STATEMENT | | 1 | 6 | 3 (0)|00:00:01 | 1 | SORT AGGREGATE | | 1 | 6 | ||* 2 | TABLE ACCESS FULL| T1 | 9 | 54 | 3 (0)|00:00:01 ------------------------------------------------------------------------Predicate Information (identified by operation id):---------------------------------------------------
2 - filter("COLOR"='blue')14 rows selected.

©OraInternals Riyaj Shamsudeen 15
� If there are few distinct values then use that many # of buckets. Else use appropriate size(max 254). Size auto can be used too, but verify number of buckets generated are relevant, especially, if estimate_percent is not set to 100.
� In many cases, 100% statistics might be needed.
Histograms …
� Collecting histograms in all columns is not recommended and has a side effect of increasing CPU usage. Also, statistics collection can run longer.

©OraInternals Riyaj Shamsudeen 16
begindbms_stats.gather_table_stats ('cbo2','t1', estimate_percent =>1, method_opt =>' for all columns size 10');
end;/1 select column_name , endpoint_number from dba_tab_histograms2* where table_name='T1' and column_name='COLOR'
SQL> /ColumnName ENDPOINT_NUMBER------------------------- ---------------COLOR 0COLOR 12 rows selected.
Histograms & estimates
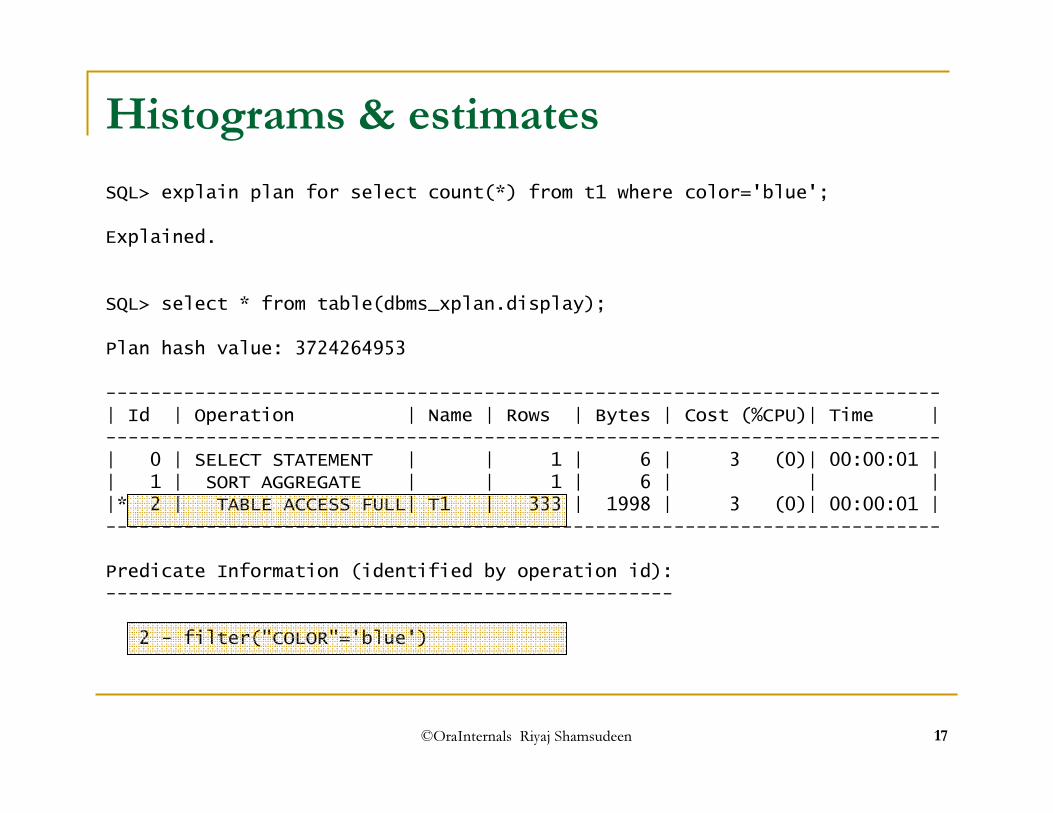
Withestimate_percent=1 only two buckets are
found!
©OraInternals Riyaj Shamsudeen 17
SQL> explain plan for select count(*) from t1 where color='blue';Explained.
SQL> select * from table(dbms_xplan.display);Plan hash value: 3724264953---------------------------------------------------------------------------| Id | Operation | Name | Rows | Bytes | Cost (%CPU)| Time |---------------------------------------------------------------------------| 0 | SELECT STATEMENT | | 1 | 6 | 3 (0)| 00:00:01 || 1 | SORT AGGREGATE | | 1 | 6 | | ||* 2 | TABLE ACCESS FULL| T1 | 333 | 1998 | 3 (0)| 00:00:01 |---------------------------------------------------------------------------Predicate Information (identified by operation id):---------------------------------------------------
2 - filter("COLOR"='blue')
Histograms & estimates

©OraInternals Riyaj Shamsudeen 18
� Method_opt parameter in dbms_stats package defaults to ‘ for all columns size auto’.
� Dbms_stats can automatically collect histograms for columns with skewed distribution.
10g method_opt

©OraInternals Riyaj Shamsudeen 19
Agenda - Part I� Selectivity� Cardinality & histograms� Correlation issues� Few more reasons behind optimizer madness.
� Bind peeking issues� Lack of statistics� Lack of system statistics� Missing statistics on indexes� Missing statistics on columns� Arithmetic comparison issues.

©OraInternals Riyaj Shamsudeen 20
Optimizer assumes no correlation between predicates.
Correlation explained
In this example,All triangles are blue.All circles are red.All squares are black.
Predicates shape=‘CIRCLE’ and color =‘RED’are correlated.
But optimizer assumes no-correlation.

©OraInternals Riyaj Shamsudeen 21
Correlation …drop table t1;create table t1 (color_id number, color varchar2(10), shape varchar2(10) );insert into t1select l1,
casewhen l1 <10 then 'blue'when l1 between 10 and 99 then 'red'when l1 between 100 and 999 then ‘black'
end case,case
when l1 <10 then 'triangle'when l1 between 10 and 99 then ‘circle'when l1 between 100 and 999 then 'rectangle'
end casefrom
(select level l1 from dual connect by level <1000)/commit;exec dbms_stats.gather_table_stats ('cbo2','t1', estimate_percent =>100,
method_opt =>' for all columns size 1');
©OraInternals Riyaj Shamsudeen 22
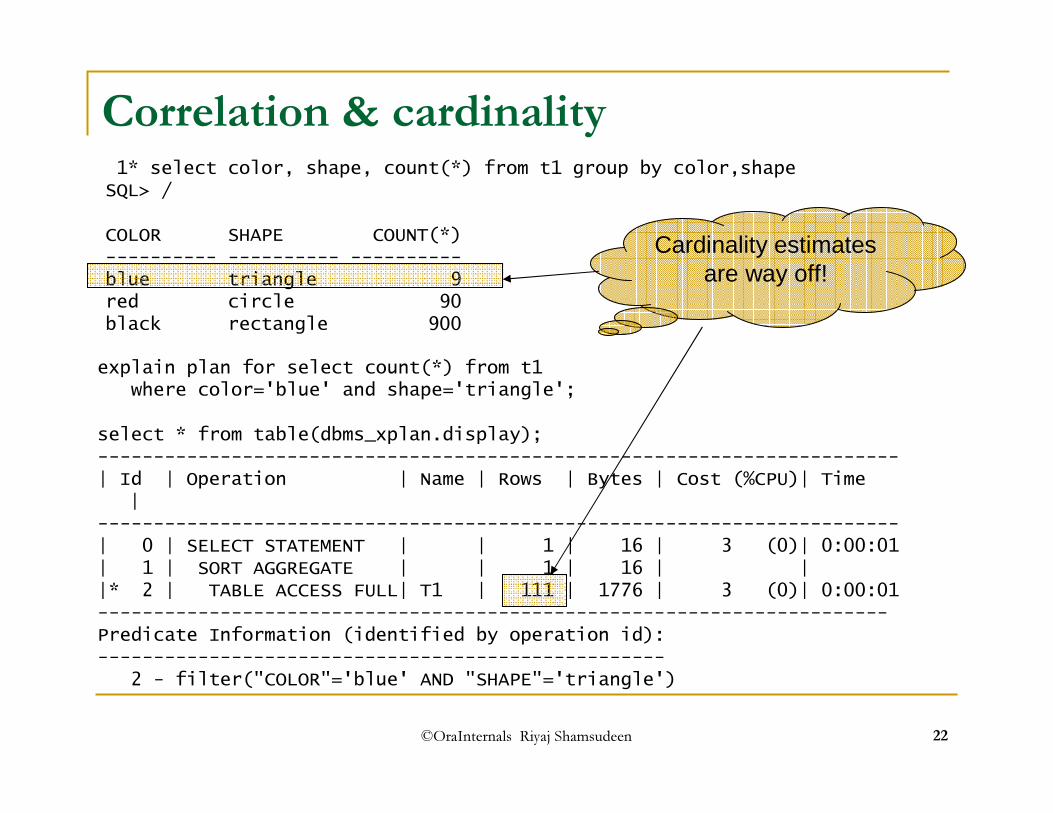
Correlation & cardinality1* select color, shape, count(*) from t1 group by color,shapeSQL> /COLOR SHAPE COUNT(*)---------- ---------- ----------blue triangle 9red circle 90black rectangle 900explain plan for select count(*) from t1
where color='blue' and shape='triangle';select * from table(dbms_xplan.display);------------------------------------------------------------------------| Id | Operation | Name | Rows | Bytes | Cost (%CPU)| Time
|------------------------------------------------------------------------| 0 | SELECT STATEMENT | | 1 | 16 | 3 (0)| 0:00:01 | 1 | SORT AGGREGATE | | 1 | 16 | ||* 2 | TABLE ACCESS FULL| T1 | 111 | 1776 | 3 (0)| 0:00:01 -----------------------------------------------------------------------Predicate Information (identified by operation id):---------------------------------------------------
2 - filter("COLOR"='blue' AND "SHAPE"='triangle')
Cardinality estimates are way off!
©OraInternals Riyaj Shamsudeen 23
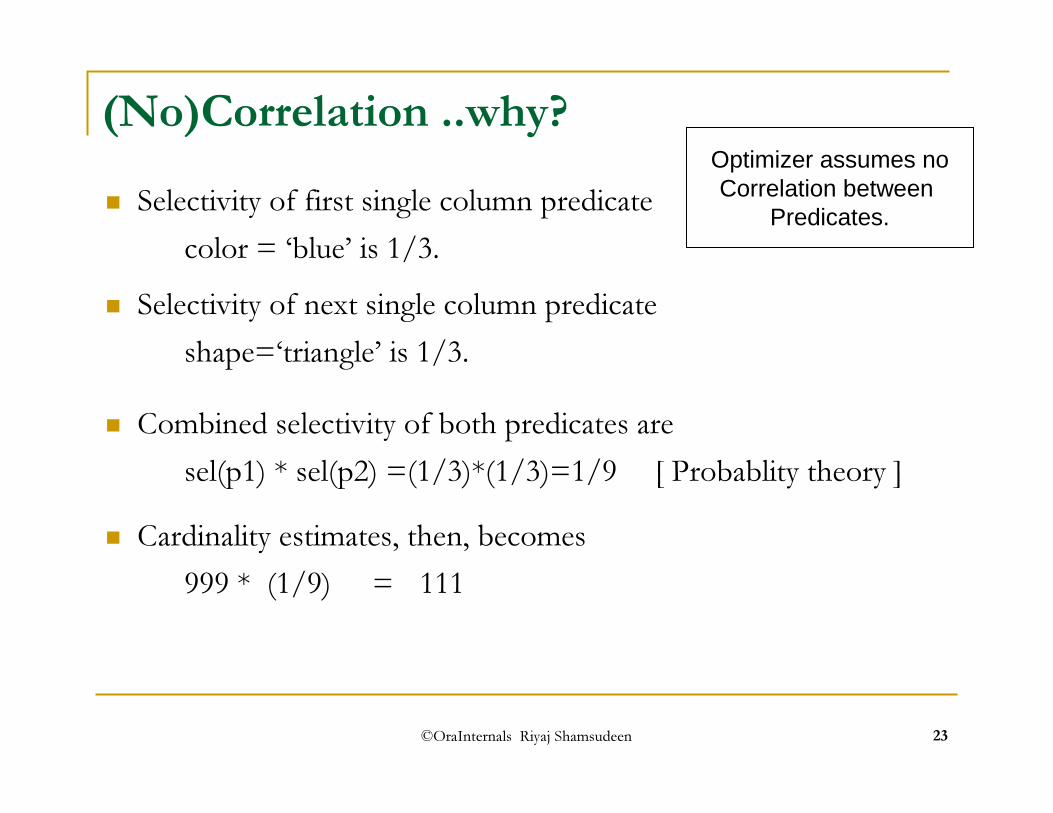
(No)Correlation ..why?� Selectivity of first single column predicate
color = ‘blue’ is 1/3.� Selectivity of next single column predicate
shape=‘triangle’ is 1/3.� Combined selectivity of both predicates are
sel(p1) * sel(p2) =(1/3)*(1/3)=1/9 [ Probablity theory ]� Cardinality estimates, then, becomes
999 * (1/9) = 111
Optimizer assumes noCorrelation between
Predicates.

©OraInternals Riyaj Shamsudeen 24
Correlation w/ Histograms.. alter session set optimizer_dynamic_sampling=0;exec dbms_stats.gather_table_stats ('cbo2','t1', estimate_percent =>100,
method_opt =>' for all columns size 5');
explain plan for select count(*) from t1 where color='blue' and shape='triangle';
select * from table(dbms_xplan.display);------------------------------------------------------------------------| Id | Operation | Name | Rows | Bytes | Cost (%CPU)| Time ------------------------------------------------------------------------| 0 | SELECT STATEMENT | | 1 | 16 | 3 (0)| 0:00:01 | 1 | SORT AGGREGATE | | 1 | 16 | ||* 2 | TABLE ACCESS FULL| T1 | 1 | 16 | 3 (0)|00:00:01 ------------------------------------------------------------------------Predicate Information (identified by operation id):---------------------------------------------------
2 - filter("SHAPE"='triangle' AND "COLOR"='blue')
With histograms, row Estimates are farther away
from reality
©OraInternals Riyaj Shamsudeen 25
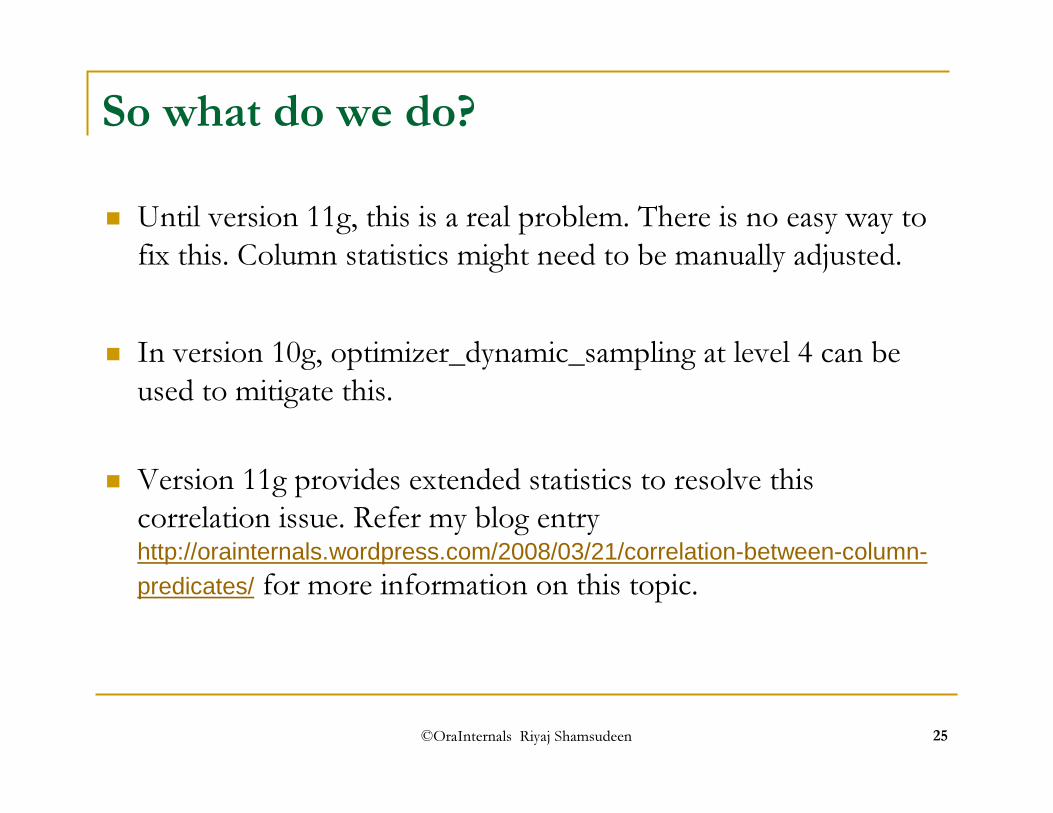
So what do we do?� Until version 11g, this is a real problem. There is no easy way to fix this. Column statistics might need to be manually adjusted.
� In version 10g, optimizer_dynamic_sampling at level 4 can be used to mitigate this.
� Version 11g provides extended statistics to resolve this correlation issue. Refer my blog entry http://orainternals.wordpress.com/2008/03/21/correlation-between-column-
predicates/ for more information on this topic.
©OraInternals Riyaj Shamsudeen 26
Agenda - Part I� Selectivity� Cardinality & histograms� Correlation issues� Few issues behind optimizer decisions.
� Bind peeking issues� Lack of statistics� Lack of system statistics� Missing statistics on indexes� Missing statistics on columns� Arithmetic comparison issues.
©OraInternals Riyaj Shamsudeen 27
#1. Bind peeking…
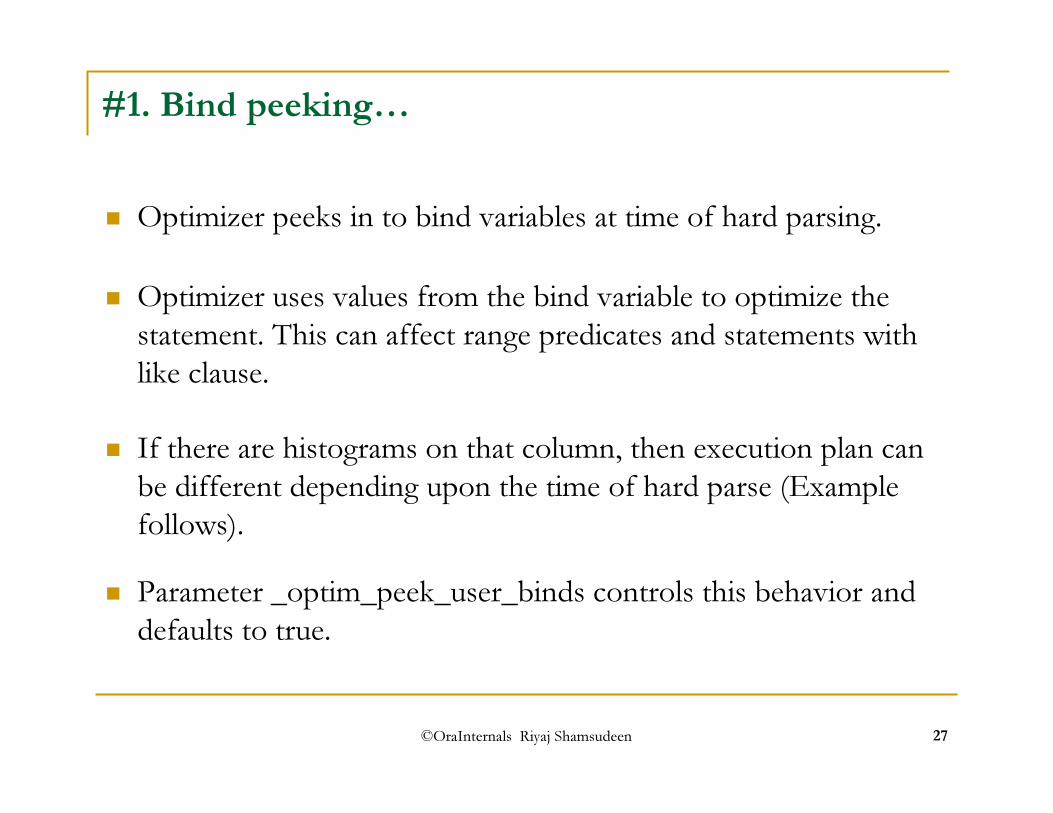
� Optimizer peeks in to bind variables at time of hard parsing.
� If there are histograms on that column, then execution plan can be different depending upon the time of hard parse (Example follows).
� Parameter _optim_peek_user_binds controls this behavior and defaults to true.
� Optimizer uses values from the bind variable to optimize the statement. This can affect range predicates and statements with like clause.

©OraInternals Riyaj Shamsudeen 28
Bind peeking examplevariable v_color varchar2(12)exec :v_color :='blue';select count(*) from t1 where color=:v_color;select * from table
(dbms_xplan.display_cursor);SQL_ID 209g46tpf1gnq, child number 0-------------------------------------select count(*) from t1 where color=:v_colorPlan hash value: 2432955788-------------------------------------------| Id | Operation | Name | Rows |-------------------------------------------| 0 | SELECT STATEMENT | | || 1 | SORT AGGREGATE | | 1 ||* 2 | INDEX RANGE SCAN| T1_I1 | 9 |-------------------------------------------Predicate Information ----------------------
2 - access("COLOR"=:V_COLOR)
exec :v_color :='black';select count(*) from t1 where color=:v_color;select * from table
(dbms_xplan.display_cursor);SQL_ID 209g46tpf1gnq, child number 0-------------------------------------select count(*) from t1 where color=:v_colorPlan hash value: 2432955788-------------------------------------------| Id | Operation | Name | Rows |-------------------------------------------| 0 | SELECT STATEMENT | | || 1 | SORT AGGREGATE | | 1 ||* 2 | INDEX RANGE SCAN| T1_I1 | 9 |-------------------------------------------Predicate Information ----------------------
2 - access("COLOR"=:V_COLOR)
©OraInternals Riyaj Shamsudeen 29
Bind peeking issues
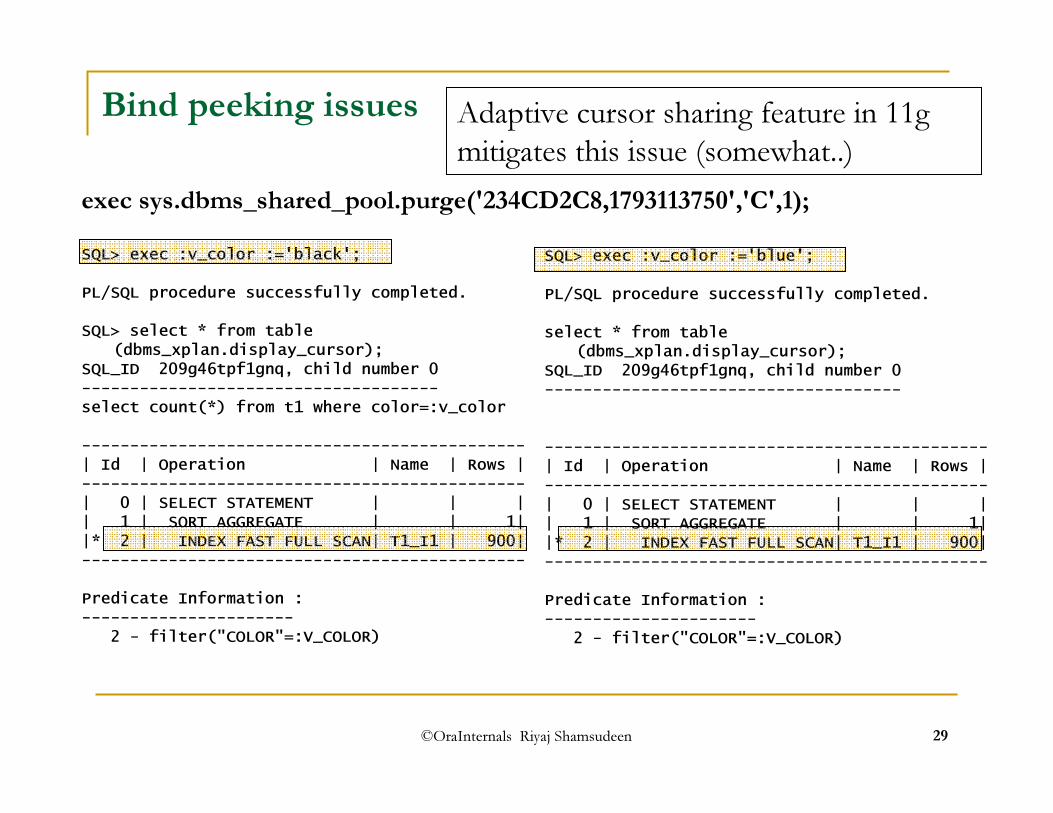
SQL> exec :v_color :='black';PL/SQL procedure successfully completed.SQL> select * from table
(dbms_xplan.display_cursor);SQL_ID 209g46tpf1gnq, child number 0-------------------------------------select count(*) from t1 where color=:v_color----------------------------------------------| Id | Operation | Name | Rows |----------------------------------------------| 0 | SELECT STATEMENT | | || 1 | SORT AGGREGATE | | 1||* 2 | INDEX FAST FULL SCAN| T1_I1 | 900|----------------------------------------------Predicate Information :----------------------
2 - filter("COLOR"=:V_COLOR)
SQL> exec :v_color :='blue';PL/SQL procedure successfully completed.select * from table
(dbms_xplan.display_cursor);SQL_ID 209g46tpf1gnq, child number 0-------------------------------------
----------------------------------------------| Id | Operation | Name | Rows |----------------------------------------------| 0 | SELECT STATEMENT | | || 1 | SORT AGGREGATE | | 1||* 2 | INDEX FAST FULL SCAN| T1_I1 | 900|----------------------------------------------Predicate Information :----------------------
2 - filter("COLOR"=:V_COLOR)
exec sys.dbms_shared_pool.purge('234CD2C8,1793113750','C',1);
Adaptive cursor sharing feature in 11g mitigates this issue (somewhat..)

©OraInternals Riyaj Shamsudeen 30
#2. Lack of object statistics� Without object statistics, optimizer assumes few basic statistics.
� # of distinct keys 100 and Average Row length 100� From table length, calculates # of rows in the table.
# of rows =~ (# of blocks)* (block_size) /100=~ 5 * 8192/100=409 rows (for 5 blocks table)
� So, single column predicate cardinality is:409/100 =~ 4 rows.
-------------------------------------+-----------------------------------+| Id | Operation | Name | Rows | Bytes | Cost | Time |-------------------------------------+-----------------------------------+| 0 | SELECT STATEMENT | | | | 1 | || 1 | SORT AGGREGATE | | 1 | 7 | | || 2 | INDEX RANGE SCAN | T1_I1 | 4 | 28 | 1 | 00:00:01 |-------------------------------------+-----------------------------------+Predicate Information:----------------------2 - access("COLOR"='black')

©OraInternals Riyaj Shamsudeen 31
In 10g..� This problem is partly resolved by Version 10g defaults. In version 10g, optimizer_dynamic_sampling is set to 2.
� If there are no statistics on tables, Optimizer will dynamicallysample rows and calculate statistics.
� This may be a viable option if # of rows in the table is volatile, such as interface tables.
� Cardinality is accurate with dynamic sampling. --------------------------------------------------------------------------Id | Operation | Name | Rows | Bytes | Cost (%CPU)| Time |--------------------------------------------------------------------------
0 | SELECT STATEMENT | | 1 | 7 | 3 (0)| 00:00:01 |1 | SORT AGGREGATE | | 1 | 7 | | |
* 2 | TABLE ACCESS FULL| T1 | 900 | 6300 | 3 (0)| 00:00:01 |--------------------------------------------------------------------------predicate Information (identified by operation id):--------------------------------------------------2 - filter("COLOR"='black')
©OraInternals Riyaj Shamsudeen 32
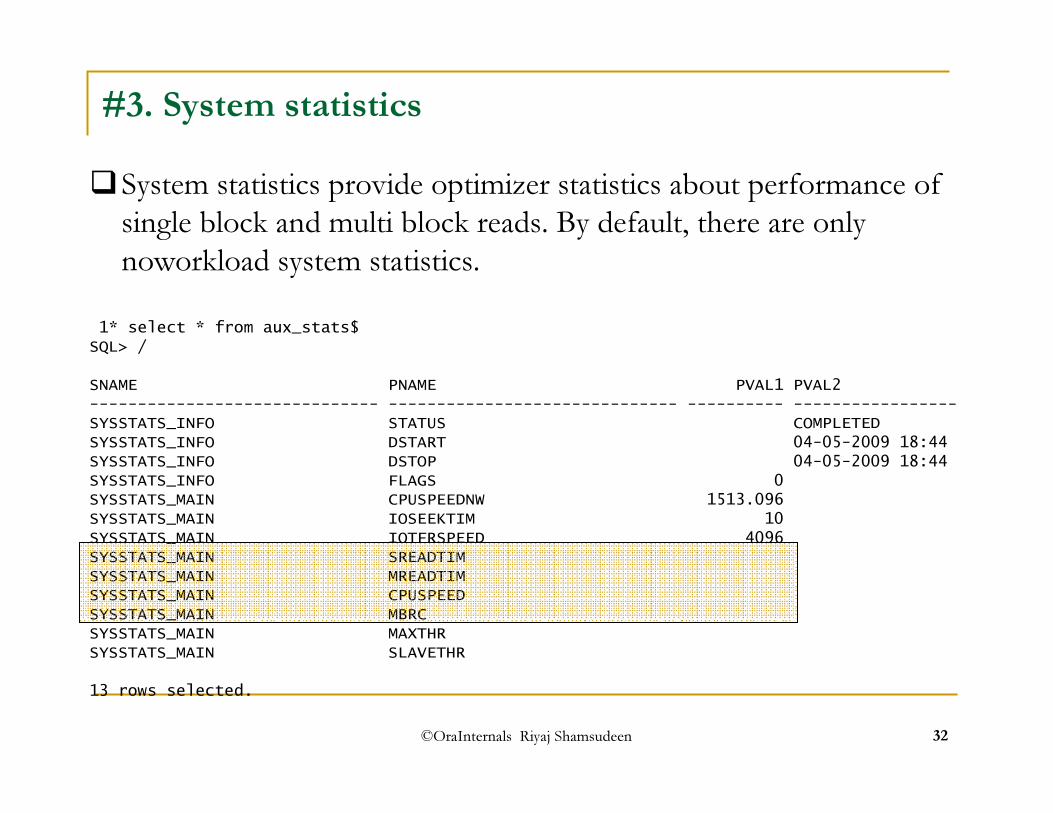
#3. System statistics�System statistics provide optimizer statistics about performance of single block and multi block reads. By default, there are only noworkload system statistics.
1* select * from aux_stats$SQL> /SNAME PNAME PVAL1 PVAL2------------------------------ ------------------------------ ---------- -----------------SYSSTATS_INFO STATUS COMPLETEDSYSSTATS_INFO DSTART 04-05-2009 18:44SYSSTATS_INFO DSTOP 04-05-2009 18:44SYSSTATS_INFO FLAGS 0SYSSTATS_MAIN CPUSPEEDNW 1513.096SYSSTATS_MAIN IOSEEKTIM 10SYSSTATS_MAIN IOTFRSPEED 4096SYSSTATS_MAIN SREADTIMSYSSTATS_MAIN MREADTIMSYSSTATS_MAIN CPUSPEEDSYSSTATS_MAIN MBRCSYSSTATS_MAIN MAXTHRSYSSTATS_MAIN SLAVETHR13 rows selected.

©OraInternals Riyaj Shamsudeen 33
Effect of system statisticsexplain plan for select v1 from t1 where n3 between 10 and 30;--------------------------------------------------------------------------| Id | Operation | Name | Rows | Bytes | Cost (%CPU)| Time |--------------------------------------------------------------------------| 0 | SELECT STATEMENT | | 1362 | 138K| 19 (0)| 00:00:01 ||* 1 | TABLE ACCESS FULL| T1 | 1362 | 138K| 19 (0)| 00:00:01 |--------------------------------------------------------------------------
begindbms_stats.set_system_stats ('cpuspeed',588);dbms_stats.set_system_stats ('sreadtim',5);dbms_stats.set_system_stats ('mreadtim',30);dbms_stats.set_system_stats ('mbrc',12);
end;/explain plan for select v1 from t1 where n3 between 10 and 30;
-------------------------------------------------------------------------------------| Id | Operation | Name | Rows | Bytes | Cost (%CPU)| Time |-------------------------------------------------------------------------------------| 0 | SELECT STATEMENT | | 1362 | 138K| 32 (0)| 00:00:01 || 1 | TABLE ACCESS BY INDEX ROWID| T1 | 1362 | 138K| 32 (0)| 00:00:01 ||* 2 | INDEX RANGE SCAN | T1_N3 | 1362 | | 4 (0)| 00:00:01 |-------------------------------------------------------------------------------------
Plan with noworkloadsystem statistics.
Plan with system statistics.

©OraInternals Riyaj Shamsudeen 34
Cost difference
05
101520253035
FTS Index scan
w/o system statswith system stats
� Cost of Full Table scanwent up from 19 to 35 after adding system statistics.
� Cost of Index range scanremained the same.
� Optimizer chose index range scan.
� Adjusting Optimizer parameters optimizer_index_cachingand optimizer_index_cost_adj are another method, but system statistics are preferred.

©OraInternals Riyaj Shamsudeen 35
aux_stats$�Aux_stats$ shows values for sreadtim, mreadtime etc..SQL> select * from aux_stats$;SNAME PNAME PVAL1 PVAL2------------------------------ ------------------------------ ---------- -----------------
---SYSSTATS_INFO STATUS COMPLETEDSYSSTATS_INFO DSTART 04-05-2009 19:24SYSSTATS_INFO DSTOP 04-05-2009 19:24SYSSTATS_INFO FLAGS 1SYSSTATS_MAIN CPUSPEEDNW 1513.096SYSSTATS_MAIN IOSEEKTIM 10SYSSTATS_MAIN IOTFRSPEED 4096SYSSTATS_MAIN SREADTIM 5SYSSTATS_MAIN MREADTIM 30SYSSTATS_MAIN CPUSPEED 588SYSSTATS_MAIN MBRC 12SYSSTATS_MAIN MAXTHRSYSSTATS_MAIN SLAVETHR13 rows selected.
©OraInternals Riyaj Shamsudeen 36
Agenda - Part II
� Few more issues continued…� Missing statistics on indexes� Missing statistics on columns� Column type mismatch� Index on non-selective columns� Index efficiency� Null and index� Arithmetic comparison issues.
� Hints
©OraInternals Riyaj Shamsudeen 37
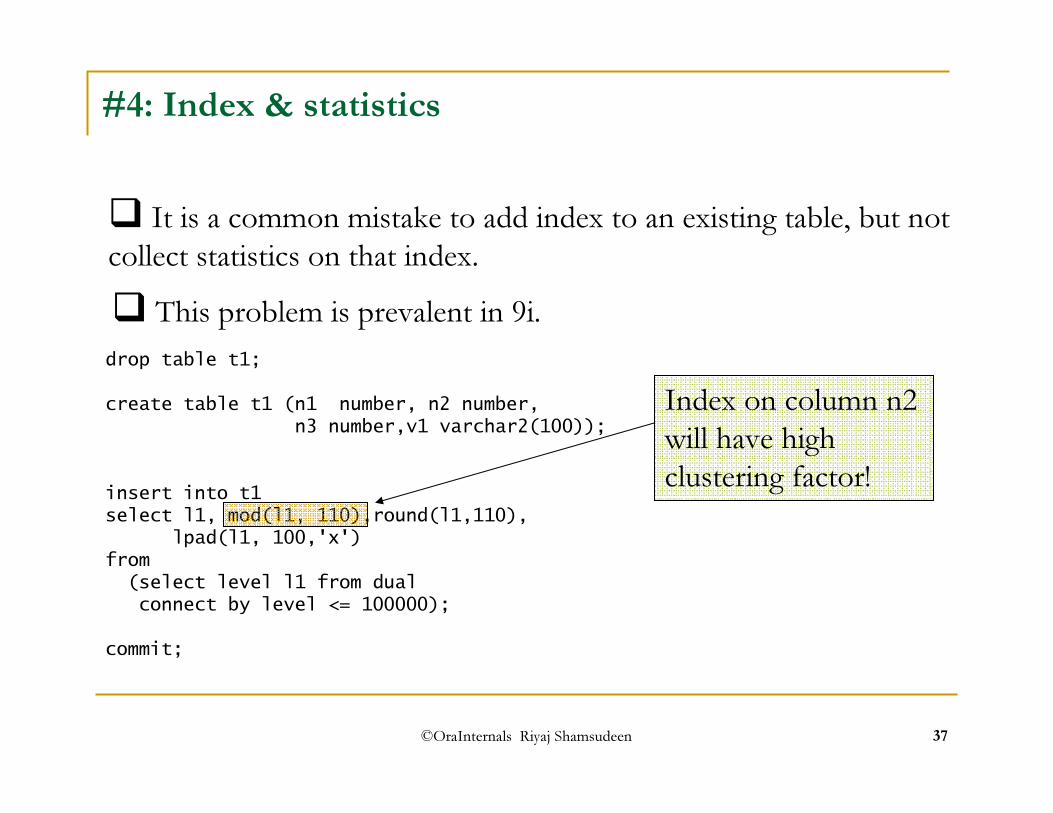
#4: Index & statistics
� This problem is prevalent in 9i.drop table t1;create table t1 (n1 number, n2 number,
n3 number,v1 varchar2(100));
insert into t1 select l1, mod(l1, 110),round(l1,110),
lpad(l1, 100,'x') from (select level l1 from dual connect by level <= 100000);
commit;
Index on column n2 will have high clustering factor!
� It is a common mistake to add index to an existing table, but not collect statistics on that index.

©OraInternals Riyaj Shamsudeen 38
Index with statistics
create index t1_n2 on t1(n2);Begin
dbms_Stats.gather_table_stats( user, 't1' , estimate_percent =>100,cascade =>true);
End;/
explain plan for select v1 from t1 where n2=10;Select * from table(dbms_xplan.display);-------------------------------------+-----------------------------------+| Id | Operation | Name | Rows | Bytes | Cost | Time |-------------------------------------+-----------------------------------+| 0 | SELECT STATEMENT | | | | 892 | || 1 | TABLE ACCESS FULL | T1 | 909 | 93K | 892 | 00:00:05 |-------------------------------------+-----------------------------------+Predicate Information:----------------------1 - filter("N2"=10)
Access Path: index (AllEqRange)Index: T1_N2resc_io: 912.00 resc_cpu: 6868703ix_sel: 0.009091
ix_sel_with_filters: 0.009091 Cost: 914.34 Resp: 914.34 Degree: 1
Index access through t1_n2 is costly and optimizer chose FTS correctly.

©OraInternals Riyaj Shamsudeen 39
Index with out statistics
Begin dbms_Stats.delete_index_stats
(user, 't1_n2');End;/
explain plan for select v1 from t1 where n2=10;Select * from table(dbms_xplan.display);-----------------------------------------------+-----------------------------------+| Id | Operation | Name | Rows | Bytes | Cost | Time |-----------------------------------------------+-----------------------------------+| 0 | SELECT STATEMENT | | | | 9 | || 1 | TABLE ACCESS BY INDEX ROWID | T1 | 909 | 93K | 9 | 00:00:01 || 2 | INDEX RANGE SCAN | T1_N2 | 909 | | 1 | 00:00:01 |-----------------------------------------------+-----------------------------------+Predicate Information:----------------------2 - access("N2"=10)
Access Path: index (AllEqRange)Index: T1_N2resc_io: 9.00 resc_cpu: 74373ix_sel: 0.009091 ix_sel_with_filters: 0.009091 Cost: 9.03 Resp: 9.03 Degree: 1
Index chosen even though execution of this plan is costly.

©OraInternals Riyaj Shamsudeen 40
10g…
� In create index statement “compute statistics” is the default and so index will be created with statistics.
� Again, 10g fixes this issue.
� Parameter _optimizer_compute_index_stats controls this behavior and statistics collection forced during create index orrebuild of an index.
©OraInternals Riyaj Shamsudeen 41
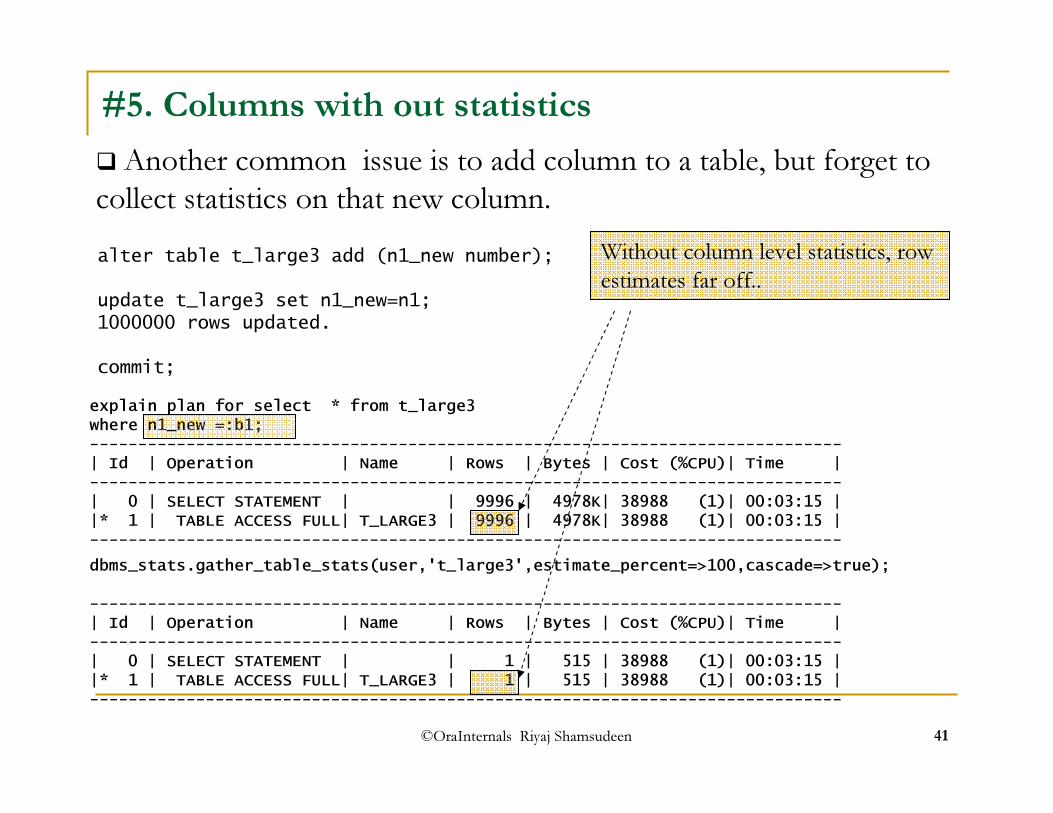
#5. Columns with out statistics
alter table t_large3 add (n1_new number);update t_large3 set n1_new=n1;1000000 rows updated.commit;
� Another common issue is to add column to a table, but forget tocollect statistics on that new column.
explain plan for select * from t_large3where n1_new =:b1;------------------------------------------------------------------------------| Id | Operation | Name | Rows | Bytes | Cost (%CPU)| Time |------------------------------------------------------------------------------| 0 | SELECT STATEMENT | | 9996 | 4978K| 38988 (1)| 00:03:15 ||* 1 | TABLE ACCESS FULL| T_LARGE3 | 9996 | 4978K| 38988 (1)| 00:03:15 |------------------------------------------------------------------------------dbms_stats.gather_table_stats(user,'t_large3',estimate_percent=>100,cascade=>true);------------------------------------------------------------------------------| Id | Operation | Name | Rows | Bytes | Cost (%CPU)| Time |------------------------------------------------------------------------------| 0 | SELECT STATEMENT | | 1 | 515 | 38988 (1)| 00:03:15 ||* 1 | TABLE ACCESS FULL| T_LARGE3 | 1 | 515 | 38988 (1)| 00:03:15 |------------------------------------------------------------------------------
Without column level statistics, row estimates far off..

©OraInternals Riyaj Shamsudeen 42
#6. Column type mismatch
� It is recommended to have join columns of same data type.
� If there is a mismatch in data type, then to_number or to_charfunctions need to be applied. Applying a function over a column disallows use of index on that column.
SQL> desc t1Name Null? Type--------------- -------- ---------------COLOR_ID VARCHAR2(32)COMMENTS VARCHAR2(30)
SQL> desc t2Name Null? Type--------------- -------- ---------------COLOR_ID NUMBERCOMMENTS VARCHAR2(30)

©OraInternals Riyaj Shamsudeen 43
Column type mismatch…select t1.* from t1, t2 where t1.color_id = t2.color_id and t1.color_id=10;--------------------------------------------------------------------------------------------| Id | Operation | Name | Rows | Bytes | Cost (%CPU)| Time |--------------------------------------------------------------------------------------------| 0 | SELECT STATEMENT | | 1 | 13 | 5 (0)| 00:00:01 || 1 | NESTED LOOPS | | | | | || 2 | NESTED LOOPS | | 1 | 13 | 5 (0)| 00:00:01 ||* 3 | TABLE ACCESS FULL | T2 | 1 | 4 | 3 (0)| 00:00:01 ||* 4 | INDEX RANGE SCAN | T1_COLOR_ID | 1 | | 1 (0)| 00:00:01 || 5 | TABLE ACCESS BY INDEX ROWID| T1 | 1 | 9 | 2 (0)| 00:00:01 |--------------------------------------------------------------------------------------------Query Block Name / Object Alias (identified by operation id):-------------------------------------------------------------
1 - SEL$13 - SEL$1 / T2@SEL$14 - SEL$1 / T1@SEL$15 - SEL$1 / T1@SEL$1
Predicate Information (identified by operation id):---------------------------------------------------
3 - filter(TO_NUMBER("T2"."COLOR_ID")=10)4 - access("T1"."COLOR_ID"=10)
filter("T1"."COLOR_ID"=TO_NUMBER("T2"."COLOR_ID"))
Due to data type mismatch, to_number conversion function applied over the join column.
Index not chosen..

©OraInternals Riyaj Shamsudeen 44
#7. Index(btree) on non-selective columns
create table sel_t3 ( state_code varchar2(2), first_name varchar2(30), last_name varchar2(30) );insert into sel_t3select case when l1 between 0 and 100000 then ‘TX’
when l1 between 100001 and 150000 then ‘OK’when l1 between 150001 and 200000 then ‘CA’
end ,rpad ( 'Jill', 30,'x'),rpad ( 'Somebody', 30,'x') from(select level l1 from dual connect by level <=100000)
/commit;create index sel_t3_i1 on sel_t3 ( state_code);
0100002000030000400005000060000700008000090000100000
TX OK CA
� Indexed columns should have good selectivity, for btree indices. If selectivity is closer to one, then cost of access through index can be more than cost of Full table scan.
� In the example below, selectivity of column state_code is poor.

©OraInternals Riyaj Shamsudeen 45
Index(btree) on non-selective columns…
explain plan forselect first_name||','||last_name from sel_t3 where state_code='TX';--------------------------------------------| Id | Operation | Name | Rows |--------------------------------------------| 0 | SELECT STATEMENT | | 99915 ||* 1 | TABLE ACCESS FULL| SEL_T3 | 99915 |--------------------------------------------Predicate Information (identified by operation id):---------------------------------------------------
1 - filter("STATE_CODE"='TX')
Index: SEL_T3_I1resc_io: 1241.00 resc_cpu: 48209447ix_sel: 0.504751 ix_sel_with_filters: 0.504751 Cost: 1243.18 Resp: 1243.18 Degree: 1
� Index selectivity with filters is 0.5, meaning over half the rows in the table qualify for this predicate condition.
©OraInternals Riyaj Shamsudeen
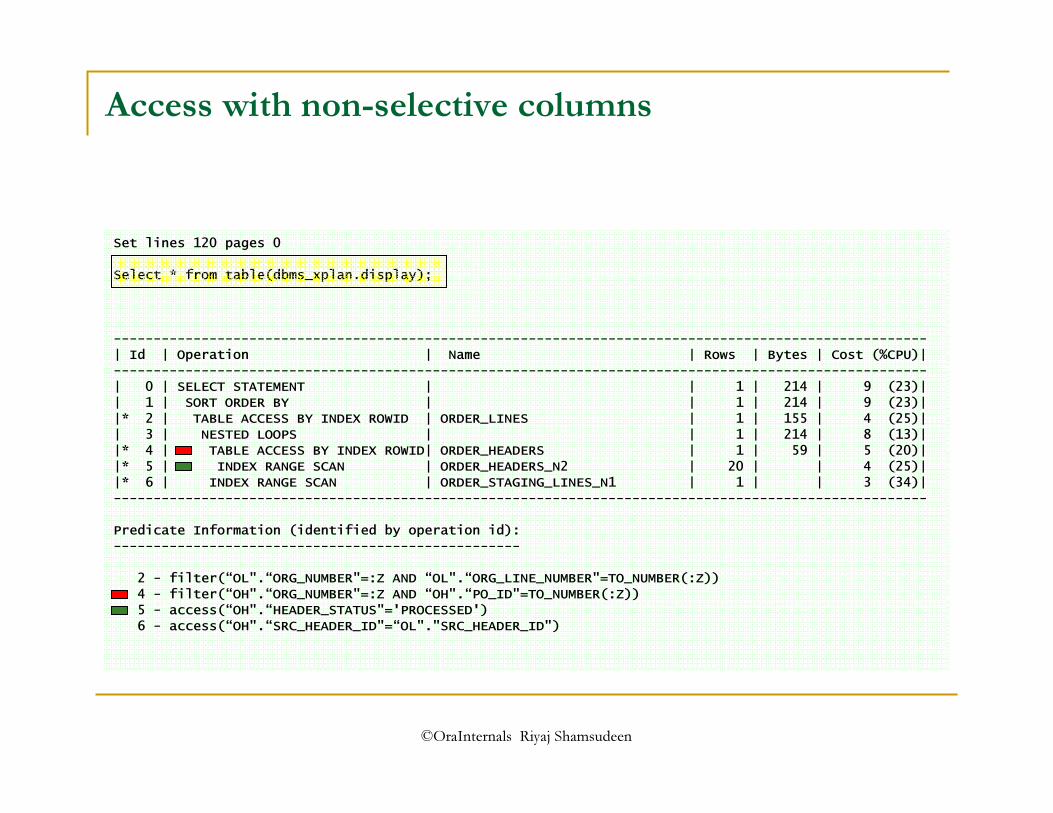
Access with non-selective columns
Set lines 120 pages 0Select * from table(dbms_xplan.display);
------------------------------------------------------------------------------------------------------| Id | Operation | Name | Rows | Bytes | Cost (%CPU)|------------------------------------------------------------------------------------------------------| 0 | SELECT STATEMENT | | 1 | 214 | 9 (23)|| 1 | SORT ORDER BY | | 1 | 214 | 9 (23)||* 2 | TABLE ACCESS BY INDEX ROWID | ORDER_LINES | 1 | 155 | 4 (25)|| 3 | NESTED LOOPS | | 1 | 214 | 8 (13)||* 4 | TABLE ACCESS BY INDEX ROWID| ORDER_HEADERS | 1 | 59 | 5 (20)||* 5 | INDEX RANGE SCAN | ORDER_HEADERS_N2 | 20 | | 4 (25)||* 6 | INDEX RANGE SCAN | ORDER_STAGING_LINES_N1 | 1 | | 3 (34)|------------------------------------------------------------------------------------------------------Predicate Information (identified by operation id):---------------------------------------------------
2 - filter(“OL".“ORG_NUMBER"=:Z AND “OL".“ORG_LINE_NUMBER"=TO_NUMBER(:Z))4 - filter(“OH".“ORG_NUMBER"=:Z AND “OH".“PO_ID"=TO_NUMBER(:Z))5 - access(“OH".“HEADER_STATUS"='PROCESSED')6 - access(“OH".“SRC_HEADER_ID"=“OL"."SRC_HEADER_ID")

©OraInternals Riyaj Shamsudeen
With selective index
Explain plan for SELECT …..Set lines 120 pages 0Select * from table(dbms_xplan.display);
------------------------------------------------------------------------------------------------------| Id | Operation | Name | Rows | Bytes | Cost (%CPU)|------------------------------------------------------------------------------------------------------| 0 | SELECT STATEMENT | | 1 | 206 | 9 (23)|| 1 | SORT ORDER BY | | 1 | 206 | 9 (23)||* 2 | TABLE ACCESS BY INDEX ROWID | ORDER_LINES | 1 | 155 | 4 (25)|| 3 | NESTED LOOPS | | 1 | 206 | 8 (13)|| 4 | TABLE ACCESS BY INDEX ROWID| ORDER_HEADERS | 1 | 51 | 5 (20)||* 5 | INDEX RANGE SCAN | ORDER_HEADERS_N2 | 1 | | 4 (25)||* 6 | INDEX RANGE SCAN | ORDER_STAGING_LINES_N1 | 1 | | 3 (34)|------------------------------------------------------------------------------------------------------Predicate Information (identified by operation id):---------------------------------------------------
2 - filter(“OL".“ORG_NUMBER"=:Z AND “OL".“ORG_LINE_NUMBER"=TO_NUMBER(:Z))5 - access("RSH".“HEADER_STATUS"='PROCESSED' AND "RSH".“ORG_NUMBER"=:Z AND
"RSH".“PO_ID"=TO_NUMBER(:Z))6 - access("RSH"."SRC_HEADER_ID"="RSL"."SRC_HEADER_ID")
drop index ORDER_HEADERS_N2;;create index ORDER_HEADERS_N2 on ORDER_HEADERS (header_status, org_number, po_id ) compress 1 compute statistics;

©OraInternals Riyaj Shamsudeen 48
#8. Index efficiency?DESC T1 ...N2 NUMBERN3 NUMBER...select count(distinct(n2)) n2_count,
count(distinct(n3)) n3_countfrom t1;N2_COUNT N3_COUNT
---------- ----------62 63
1 row selected.
create index t1_n2 on t1(n2);create index t1_n3 on t1(n3);Begin dbms_Stats.gather_table_stats( user, 't1' ,
estimate_percent =>100, cascade =>true);
End;/
explain plan forselect n1 from t1 where n3=:b1;------------------------------------------------------------------| Id | Operation | Name | Rows | Cost (%CPU)|------------------------------------------------------------------| 0 | SELECT STATEMENT | | 61 | 3 (0)|| 1 | TABLE ACCESS BY INDEX ROWID| T1 | 61 | 3 (0)||* 2 | INDEX RANGE SCAN | T1_N3 | 61 | 1 (0)|------------------------------------------------------------------Predicate Information (identified by operation id):---------------------------------------------------
2 - access("N3"=TO_NUMBER(:B1))
explain plan forselect n1 from t1 where n2=:b1;-------------------------------------------------------| Id | Operation | Name | Rows | Cost (%CPU)|-------------------------------------------------------| 0 | SELECT STATEMENT | | 62 | 19 (0)||* 1 | TABLE ACCESS FULL| T1 | 62 | 19 (0)|-------------------------------------------------------Predicate Information (identified by operation id):---------------------------------------------------
1 - filter("N2"=TO_NUMBER(:B1))
Why would the optimizer not choose t1_n2 index?

©OraInternals Riyaj Shamsudeen 49
Index properties..drop table t1;create table t1 (n1 number, n2 number, n3 number, v1 varchar2(100) );
insert into t1 select l1,
mod(l1, 62) n2,round (l1/62) n3, lpad(l1, 100,'x') v1
from (select level l1 from dual
connect by level <=3844);
commit;
783843Clustering factor
161Avg. datablock/key
11Avg. leaf block/key
38443844# of rows
6362Distinct keys
88Leaf blocks
11Level
NoNoUnique
T1_N3T1_N2Property

©OraInternals Riyaj Shamsudeen 50
Index efficiency
Index with Low clustering factor
TableRoot block
Branch block
Leaf blocks
n3=:b1
Data file
120
121
122
123
124
125
126

©OraInternals Riyaj Shamsudeen 51
Index efficiency
Index with highClustering factor
TableRoot block
Branch block
Leaf blocks
n2=:b1
Data file
120
121
122
123
124
125
126

©OraInternals Riyaj Shamsudeen 52
Index efficiency
� Optimizer did not choose index on n2 since clustering factor of that index is very high.
� Accessing table through the index will be costlier due to visits to table blocks can increase I/O.
� Avoiding table blocks by adding more columns to that index might be of help.

©OraInternals Riyaj Shamsudeen 53
#9. Cardinality and null
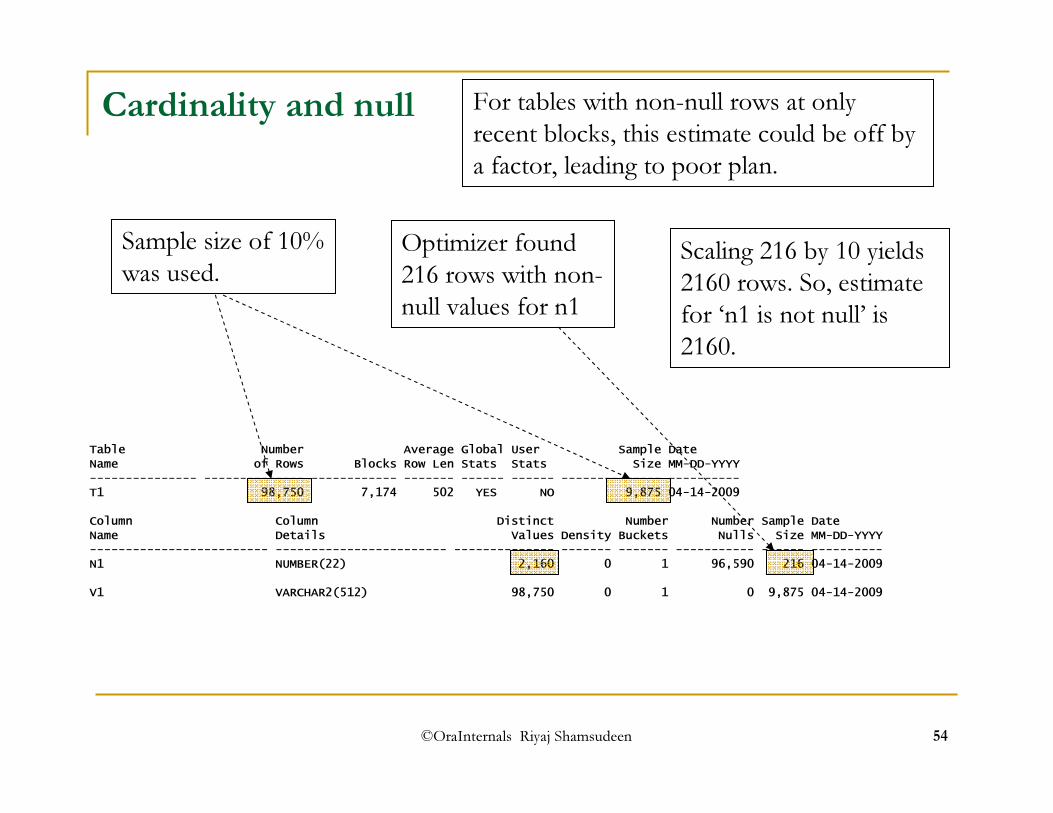
Table Number Average Global User Sample DateName of Rows Blocks Row Len Stats Stats Size MM-DD-YYYY--------------- -------------- ------------ ------- ------ ------ -------------- ----------T1 98,750 7,174 502 YES NO 9,875 04-14-2009Column Column Distinct Number Number Sample DateName Details Values Density Buckets Nulls Size MM-DD-YYYY------------------------- ------------------------ -------------- ------- ------- ----------- ------ ----------N1 NUMBER(22) 2,160 0 1 96,590 216 04-14-2009V1 VARCHAR2(512) 98,750 0 1 0 9,875 04-14-2009
Explain plan for select count(*) from t1 where n1 is not null;---------------------------------------------------------------------------| Id | Operation | Name | Rows | Bytes | Cost (%CPU)| Time |---------------------------------------------------------------------------| 0 | SELECT STATEMENT | | 1 | 2 | 3612 (1)| 00:00:19 || 1 | SORT AGGREGATE | | 1 | 2 | | ||* 2 | TABLE ACCESS FULL| T1 | 2160 | 4320 | 3612 (1)| 00:00:19 |---------------------------------------------------------------------------Predicate Information (identified by operation id):---------------------------------------------------
2 - filter("N1" IS NOT NULL) How did the optimizer came up with an estimate of 2160?
©OraInternals Riyaj Shamsudeen 54
Cardinality and null
Table Number Average Global User Sample DateName of Rows Blocks Row Len Stats Stats Size MM-DD-YYYY--------------- -------------- ------------ ------- ------ ------ -------------- ----------T1 98,750 7,174 502 YES NO 9,875 04-14-2009Column Column Distinct Number Number Sample DateName Details Values Density Buckets Nulls Size MM-DD-YYYY------------------------- ------------------------ -------------- ------- ------- ----------- ------ ----------N1 NUMBER(22) 2,160 0 1 96,590 216 04-14-2009V1 VARCHAR2(512) 98,750 0 1 0 9,875 04-14-2009
Sample size of 10% was used.
Optimizer found 216 rows with non-null values for n1
Scaling 216 by 10 yields 2160 rows. So, estimate for ‘n1 is not null’ is 2160.
For tables with non-null rows at only recent blocks, this estimate could be off by a factor, leading to poor plan.

©OraInternals Riyaj Shamsudeen 55
Cardinality and null
� In few cases, sample percent might not be good enough to get good estimate of null values.
� Also, null values are not stored in single column btree indices. So, following SQL might not use indices:select * from t1 where n1 is null;select * from t1 where (n1=:b1 or n1 is null);[Work around: create multi-column indices: (n1, 0) ]
� Use of nvl functions and function based index may be needed.
©OraInternals Riyaj Shamsudeen 56
#10. Arithmetic comparisons
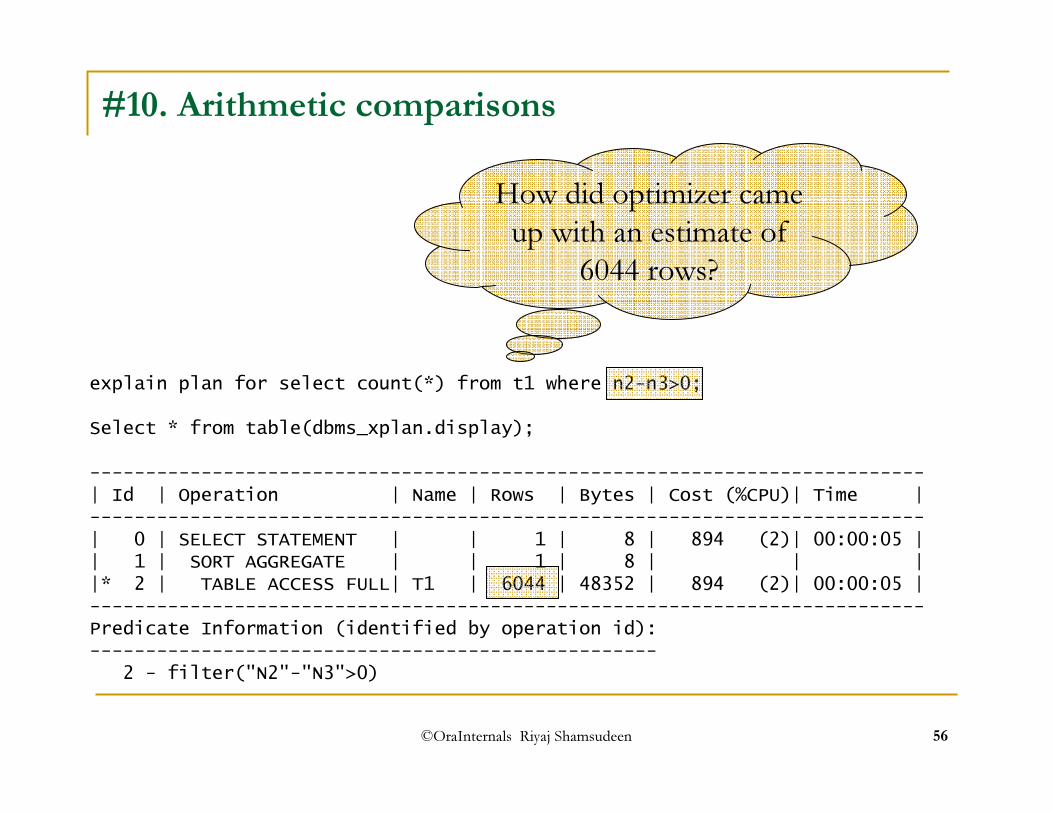
explain plan for select count(*) from t1 where n2-n3>0;Select * from table(dbms_xplan.display);---------------------------------------------------------------------------| Id | Operation | Name | Rows | Bytes | Cost (%CPU)| Time |---------------------------------------------------------------------------| 0 | SELECT STATEMENT | | 1 | 8 | 894 (2)| 00:00:05 || 1 | SORT AGGREGATE | | 1 | 8 | | ||* 2 | TABLE ACCESS FULL| T1 | 6044 | 48352 | 894 (2)| 00:00:05 |---------------------------------------------------------------------------Predicate Information (identified by operation id):---------------------------------------------------
2 - filter("N2"-"N3">0)
How did optimizer came up with an estimate of
6044 rows?
©OraInternals Riyaj Shamsudeen 57
Arithmetic comparisons …
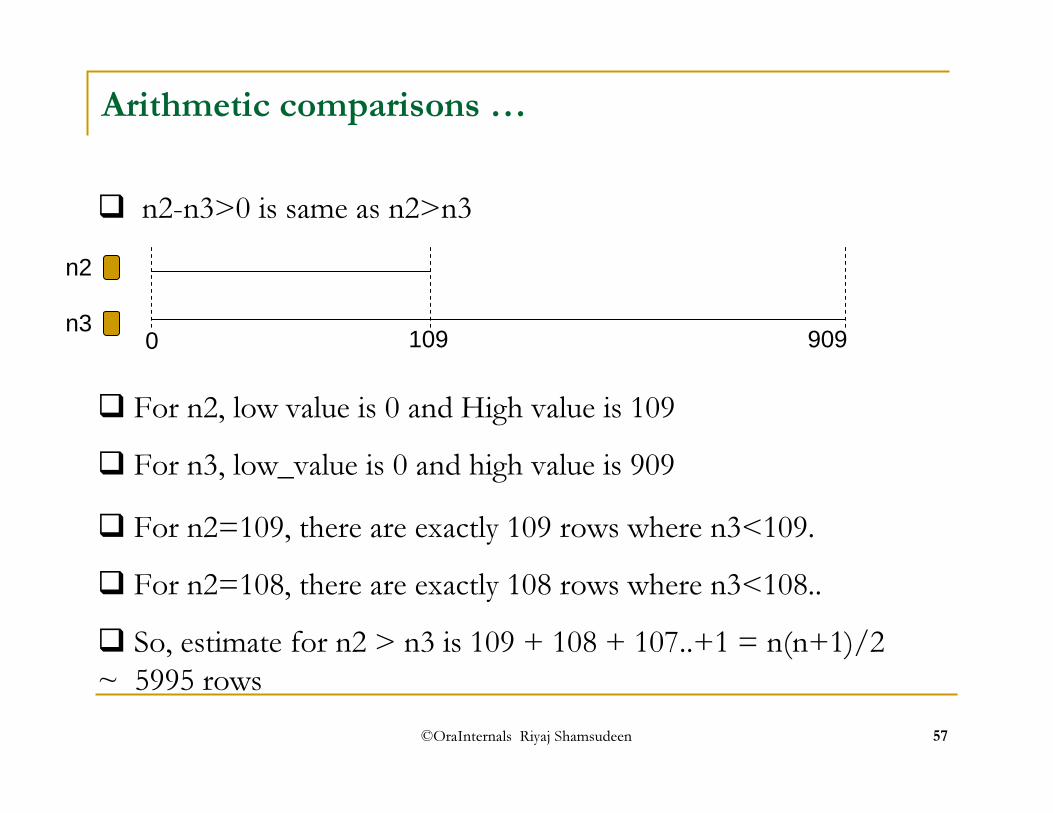
� n2-n3>0 is same as n2>n3
0 109 909
n2
n3
� For n2, low value is 0 and High value is 109� For n3, low_value is 0 and high value is 909� For n2=109, there are exactly 109 rows where n3<109.� For n2=108, there are exactly 108 rows where n3<108..� So, estimate for n2 > n3 is 109 + 108 + 107..+1 = n(n+1)/2 ~ 5995 rows

©OraInternals Riyaj Shamsudeen 58
Arithmetic comparisons
explain plan for select count(*) from t1 where n2-n3>1;Select * from table(dbms_xplan.display);
--------------------------------------------------------------------------| Id | Operation | Name | Rows | Bytes | Cost (%CPU)| Time |--------------------------------------------------------------------------| 0 | SELECT STATEMENT | | 5935 | 649K| 894 (2)| 00:00:05 ||* 1 | TABLE ACCESS FULL| T1 | 5935 | 649K| 894 (2)| 00:00:05 |--------------------------------------------------------------------------
This is exactly 109 less than prior slide
©OraInternals Riyaj Shamsudeen 59
Arithmetic and bind variables
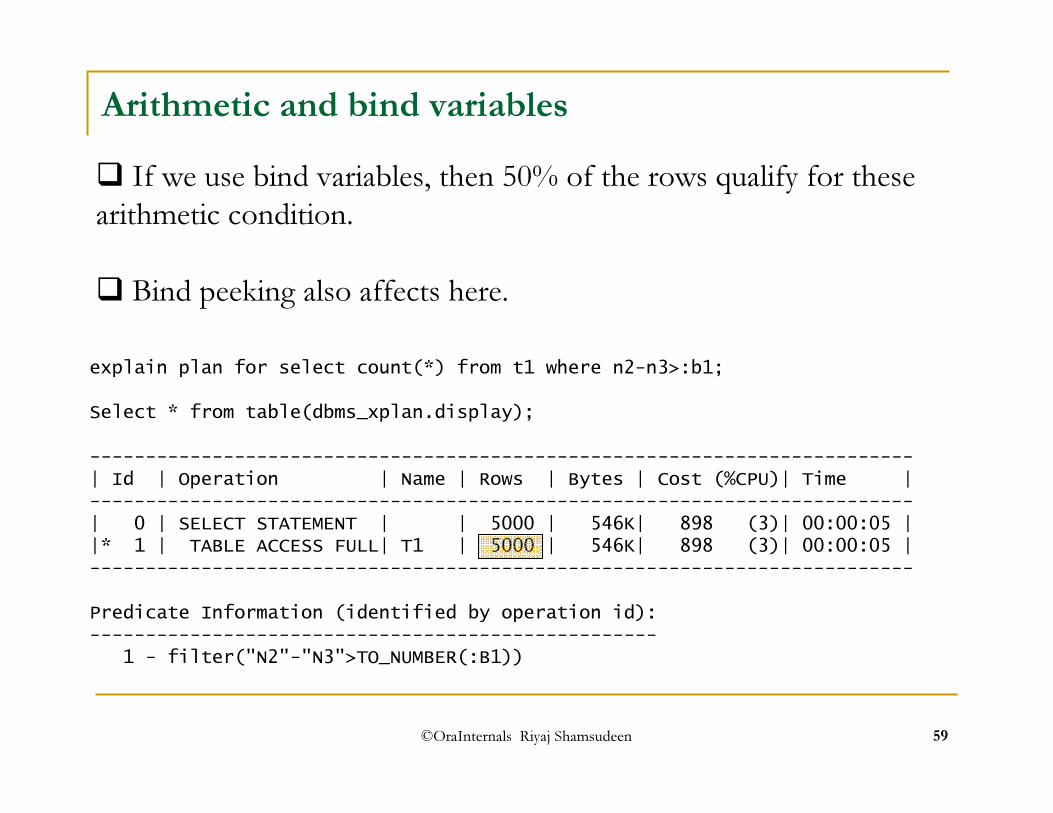
explain plan for select count(*) from t1 where n2-n3>:b1;Select * from table(dbms_xplan.display);--------------------------------------------------------------------------| Id | Operation | Name | Rows | Bytes | Cost (%CPU)| Time |--------------------------------------------------------------------------| 0 | SELECT STATEMENT | | 5000 | 546K| 898 (3)| 00:00:05 ||* 1 | TABLE ACCESS FULL| T1 | 5000 | 546K| 898 (3)| 00:00:05 |--------------------------------------------------------------------------Predicate Information (identified by operation id):---------------------------------------------------
1 - filter("N2"-"N3">TO_NUMBER(:B1))
� If we use bind variables, then 50% of the rows qualify for these arithmetic condition.� Bind peeking also affects here.
©OraInternals Riyaj Shamsudeen 60
Agenda - Part II
� Few more issues continued…� Missing statistics on indexes� Missing statistics on columns� Column type mismatch� Index on non-selective columns� Index efficiency� Arithmetic comparison issues.
� Hints

©OraInternals Riyaj Shamsudeen 61
HINTS� Hints are directive to the optimizer and almost always honored by the optimizer.
� Hints are not honored only if the hints are inconsistent with itself or another hint.
� Avoid hints, if possible. Many software upgrade performance issues that I have seen is due to hints(bad).
� In some cases, hints are necessary evils �

©OraInternals Riyaj Shamsudeen 62
ORDERED
� ORDERED hint Dictates optimizer an exact sequence of tables to join [ top to bottom or L->R canonically speaking].
Select …From t1,
t2,t3,t4
t1 t2 t3 t4

©OraInternals Riyaj Shamsudeen 63
ORDERED
explain plan forselect /*+ ORDERED */
t1.n1, t2.n2 fromt_large2 t2, t_large t1
where t1.n1 = t2.n1 and t2.n2=100/-------------------------------------------------------------------------------------| Id | Operation | Name | Rows | Bytes | Cost (%CPU)| Time |-------------------------------------------------------------------------------------| 0 | SELECT STATEMENT | | 1 | 13 | 1401 (5)| 00:00:08 || 1 | NESTED LOOPS | | 1 | 13 | 1401 (5)| 00:00:08 ||* 2 | INDEX FAST FULL SCAN| T_LARGE2_N2 | 1 | 8 | 1399 (6)| 00:00:07 ||* 3 | INDEX RANGE SCAN | T_LARGE_N1 | 1 | 5 | 2 (0)| 00:00:01 |-------------------------------------------------------------------------------------
t2 t1
t1.n1=t2.n1
n2=100

©OraInternals Riyaj Shamsudeen 64
ORDERED
� Later developer added another table to the join..
explain plan forselect /*+ ORDERED */
t1.n1, t2.n2 fromt_large3 t3,t_large2 t2, t_large t1
where t1.n1 = t2.n1 and t2.n2=100and t1.n1=t3.n1
/
t2 t1
t1.n1=t2.n1
n1=100
t3
-----------------------------------------------------------------------------------------------| Id | Operation | Name | Rows | Bytes |TempSpc| Cost (%CPU)| Time |-----------------------------------------------------------------------------------------------| 0 | SELECT STATEMENT | | 1 | 18 | | 1397M (6)|999:59:59 ||* 1 | HASH JOIN | | 1 | 18 | 11M| 1397M (6)|999:59:59 || 2 | MERGE JOIN CARTESIAN | | 499K| 6345K| | 1397M (6)|999:59:59 || 3 | INDEX FAST FULL SCAN | T_LARGE3_N1 | 999K| 4880K| | 1161 (4)| 00:00:06 || 4 | BUFFER SORT | | 1 | 8 | | 1397M (6)|999:59:59 ||* 5 | INDEX FAST FULL SCAN| T_LARGE2_N2 | 1 | 8 | | 1398 (6)| 00:00:07 || 6 | INDEX FAST FULL SCAN | T_LARGE_N1 | 1100K| 5371K| | 1176 (5)| 00:00:06 |-----------------------------------------------------------------------------------------------
Optimizer did exactly what it is told to!

©OraInternals Riyaj Shamsudeen 65
Ordered & leading
explain plan forselect /*+ leading (t2) */
t1.n1, t2.n2 fromt_large3 t3,t_large2 t2, t_large t1
where t1.n1 = t2.n1 and t2.n2=100and t1.n1=t3.n1
/
t2 t1
t1.n1=t2.n1
n1=100
t3
--------------------------------------------------------------------------------------| Id | Operation | Name | Rows | Bytes | Cost (%CPU)| Time |--------------------------------------------------------------------------------------| 0 | SELECT STATEMENT | | 1 | 18 | 1403 (5)| 00:00:08 || 1 | NESTED LOOPS | | 1 | 18 | 1403 (5)| 00:00:08 || 2 | NESTED LOOPS | | 1 | 13 | 1401 (5)| 00:00:08 ||* 3 | INDEX FAST FULL SCAN| T_LARGE2_N2 | 1 | 8 | 1399 (6)| 00:00:07 ||* 4 | INDEX RANGE SCAN | T_LARGE_N1 | 1 | 5 | 2 (0)| 00:00:01 ||* 5 | INDEX RANGE SCAN | T_LARGE3_N1 | 1 | 5 | 2 (0)| 00:00:01 |
If you must, use leading instead of ordered..
©OraInternals Riyaj Shamsudeen 66
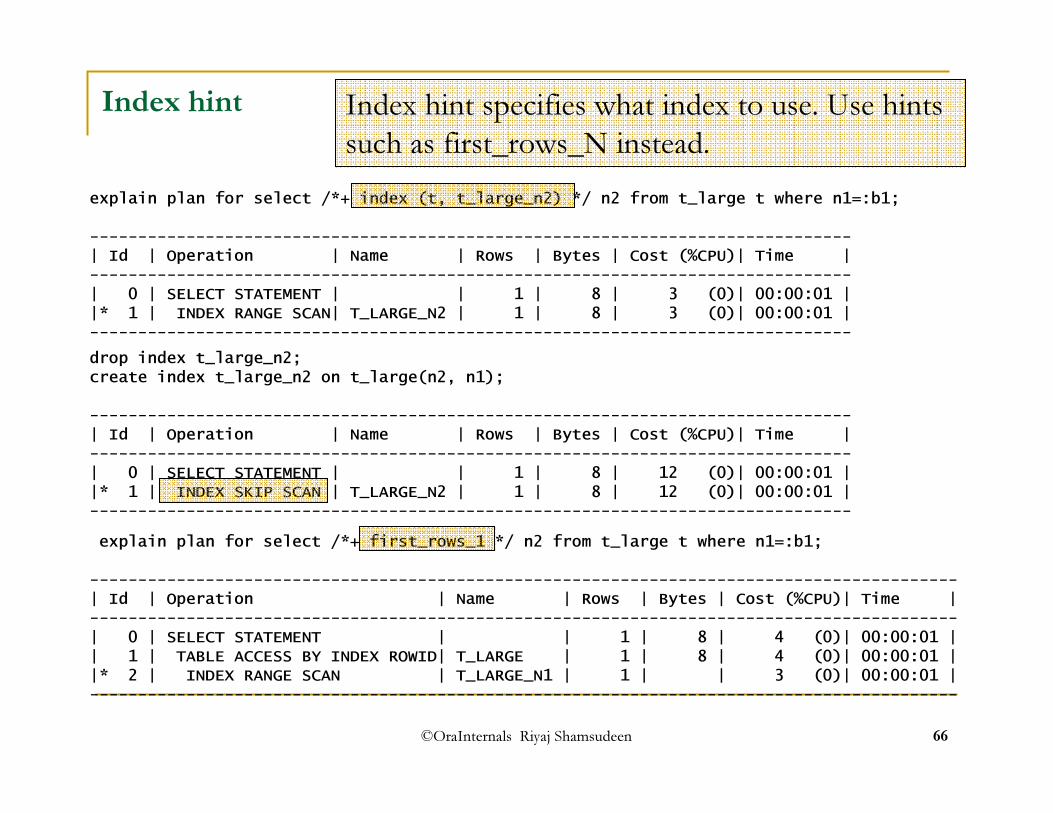
Index hint
explain plan for select /*+ index (t, t_large_n2) */ n2 from t_large t where n1=:b1;-------------------------------------------------------------------------------| Id | Operation | Name | Rows | Bytes | Cost (%CPU)| Time |-------------------------------------------------------------------------------| 0 | SELECT STATEMENT | | 1 | 8 | 3 (0)| 00:00:01 ||* 1 | INDEX RANGE SCAN| T_LARGE_N2 | 1 | 8 | 3 (0)| 00:00:01 |-------------------------------------------------------------------------------drop index t_large_n2;create index t_large_n2 on t_large(n2, n1);-------------------------------------------------------------------------------| Id | Operation | Name | Rows | Bytes | Cost (%CPU)| Time |-------------------------------------------------------------------------------| 0 | SELECT STATEMENT | | 1 | 8 | 12 (0)| 00:00:01 ||* 1 | INDEX SKIP SCAN | T_LARGE_N2 | 1 | 8 | 12 (0)| 00:00:01 |-------------------------------------------------------------------------------
Index hint specifies what index to use. Use hints such as first_rows_N instead.
explain plan for select /*+ first_rows_1 */ n2 from t_large t where n1=:b1;------------------------------------------------------------------------------------------| Id | Operation | Name | Rows | Bytes | Cost (%CPU)| Time |------------------------------------------------------------------------------------------| 0 | SELECT STATEMENT | | 1 | 8 | 4 (0)| 00:00:01 || 1 | TABLE ACCESS BY INDEX ROWID| T_LARGE | 1 | 8 | 4 (0)| 00:00:01 ||* 2 | INDEX RANGE SCAN | T_LARGE_N1 | 1 | | 3 (0)| 00:00:01 |------------------------------------------------------------------------------------------
©OraInternals Riyaj Shamsudeen 67
Agenda - Part II
� Few more issues continued…� Missing statistics on indexes� Missing statistics on columns� Column type mismatch� Index on non-selective columns� Index efficiency� Arithmetic comparison issues.
� Hints� Few guidelines

©OraInternals Riyaj Shamsudeen 68
Guidelines – CBO setup� Setup optimizer parameters correctly.
� Setup optimizer_mode to match workload� first_rows_N. For e.g., If the workload is such that most of the queries always returns 10 rows, then set this to first_rows_10. JLewis[2] has good discussion on this topic at http://jonathanlewis.wordpress.com/2008/11/11/first_rows_n/� All_rows for DSS and other workloads.
� Collect system statistics�Make sure sreadtim/mreadtim are matching with workload.�MBRC – Multi block read count is set properly.
©OraInternals Riyaj Shamsudeen 69
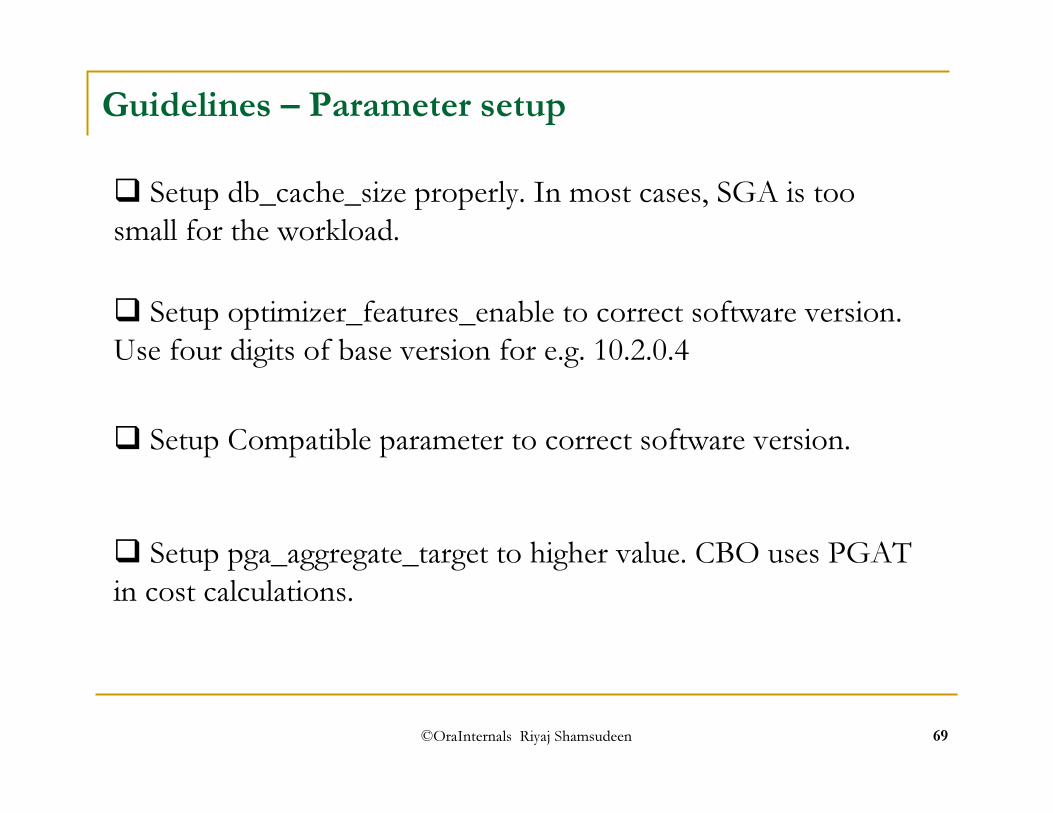
Guidelines – Parameter setup� Setup db_cache_size properly. In most cases, SGA is too small for the workload.
� Setup pga_aggregate_target to higher value. CBO uses PGAT in cost calculations.
� Setup optimizer_features_enable to correct software version. Use four digits of base version for e.g. 10.2.0.4
� Setup Compatible parameter to correct software version.
©OraInternals Riyaj Shamsudeen 70
Guidelines – Object statistics� Use higher estimate_percent for smaller tables and modest estimate_percent for large tables.
� Add optimal indices to the table. For DSS type applications use bitmap indices.
� For tables with volatile data, use dynamic sampling or lock the statistics with representative data.

©OraInternals Riyaj Shamsudeen 71
Guidelines – Histograms
� Collect histograms on columns with skewed data and if those columns are specified in predicates.
� If collecting histograms, try to use estimate_percent of 100%.
� Stop collecting histogram on all columns.
©OraInternals Riyaj Shamsudeen 72
Guidelines – Hints
� Avoid use of hints. If you must, use soft hints such as leading, first_rows etc.
� Hints might work today, but will be problematic during future upgrade.
� If optimizer is not choosing the optimal plan, understand root cause and resolve that. I know, Easier said than done.� If the root cause can not be resolved, use outlines or sqlprofiles to resolve performance issue of that SQL statement.

©OraInternals Riyaj Shamsudeen 73
Guidelines – Use SQL*Trace, tkprof and profiler
� Last, but not least, to resolve an SQL performance issue, use sqltrace or profiler to understand the bottleneck.
� Resolve that bottleneck to tune that SQL, rather than randomly trying various options.
� Structures of tables, indices also important. Use features suchas bitmap indices, partitioning, compressed indices etc to improve index efficiency.

©OraInternals Riyaj Shamsudeen 74
References
1. Oracle support site. Metalink.oracle.com. Various documents2. Internal’s guru Steve Adam’s websitewww.ixora.com.au3. Jonathan Lewis’ websitewww.jlcomp.daemon.co.uk4. Julian Dyke’s websitewww.julian-dyke.com5. ‘Oracle8i Internal Services for Waits, Latches, Locks, and Memory’by Steve Adams6. Randolf Geist : http://oracle-randolf.blogspot.com7. Tom Kyte’s websiteAsktom.oracle.com