
RAC Performance myths - Oracle database internals by Riyaj · PDF fileRAC Performance myths -...
75
©OraInternals Riyaj Shamsudeen RAC Performance myths - Battle of the nodes By Riyaj Shamsudeen
Transcript of RAC Performance myths - Oracle database internals by Riyaj · PDF fileRAC Performance myths -...

©OraInternals Riyaj Shamsudeen
RAC Performance myths -Battle of the nodes
By
Riyaj Shamsudeen

©OraInternals Riyaj Shamsudeen 3
Who am I?
� 17 years using Oracle products/DBA� OakTable member� Certified DBA versions 7.0,7.3,8,8i &9i� Specializes in RAC, performance tuning,
Internals and E-business suite� Chief DBA with OraInternals� Co-author of “Expert Oracle Practices” ‘2010� Email: rshamsud at gmail.com� Blog : orainternals.wordpress.com

©OraInternals Riyaj Shamsudeen 4
Disclaimer
These slides and materials represent the work and opinions of the author and do not constitute official positions of my current or past employer or any other organization. This material has been peer reviewed, but author assume no responsibility whatsoever for the test cases.
If you corrupt your databases by running my scripts, you are solely responsible for that.
This material should not be reproduced or used without the authors' written permission.

©OraInternals Riyaj Shamsudeen 5
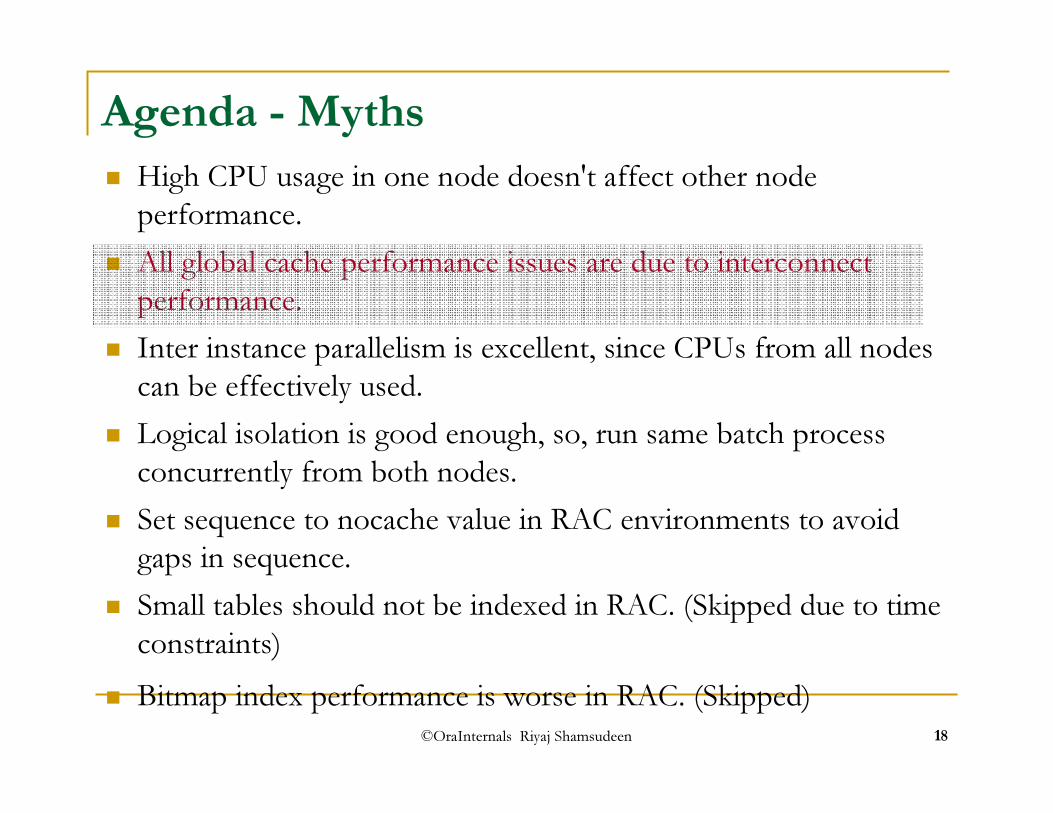
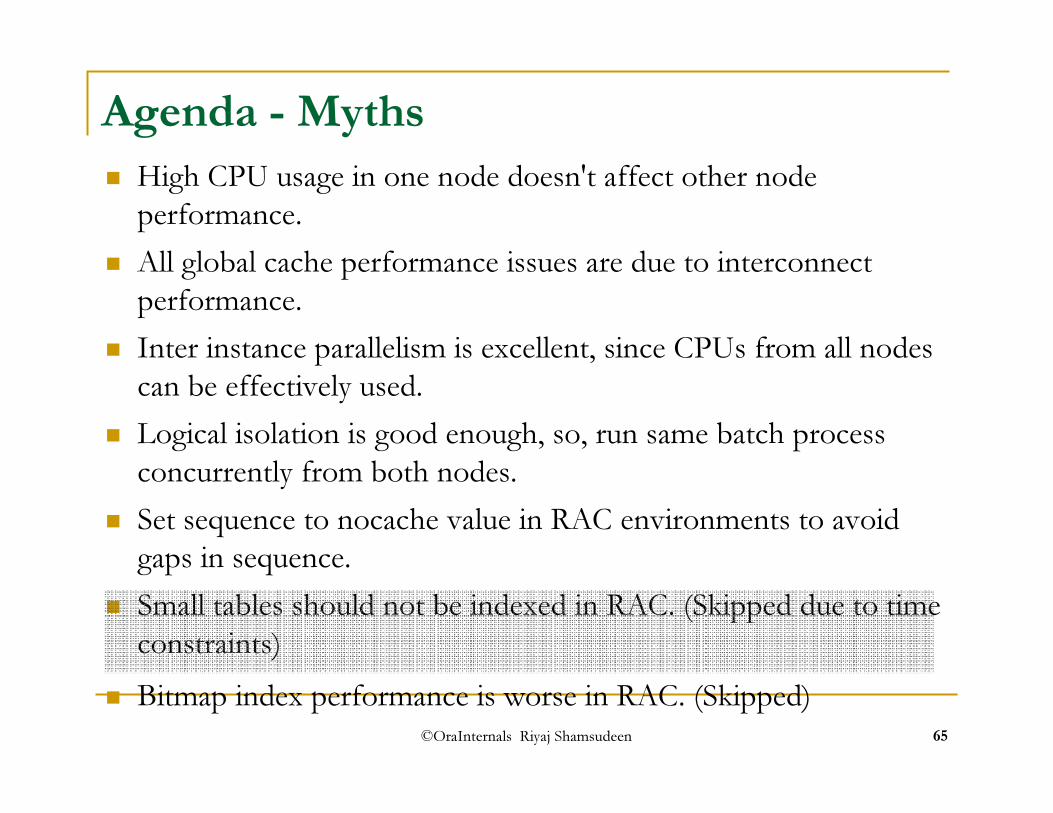
Agenda - Myths� High CPU usage in one node doesn't affect other node
performance.� All global cache performance issues are due to interconnect
performance.� Inter instance parallelism is excellent, since CPUs from all nodes
can be effectively used.� Logical isolation is good enough, so, run same batch process
concurrently from both nodes.� Set sequence to nocache value in RAC environments to avoid
gaps in sequence.� Small tables should not be indexed in RAC. (Skipped due to time
constraints)� Bitmap index performance is worse in RAC. (Skipped)

©OraInternals Riyaj Shamsudeen 6
Typical RAC node setup
Database
Instance #1
Online users reports
AdhocusersHeavy batchprocesses
Instance #2 Instance #3 Instance #4

©OraInternals Riyaj Shamsudeen 7
Reporting node
� Idea here is to put online “money-paying” users to all nodes and throw costly reports/adhoc SQL/batch in to one node.
� High CPU usage in the batch node shouldn't cause any issues to online users, right?
� Not Exactly!
©OraInternals Riyaj Shamsudeen 8
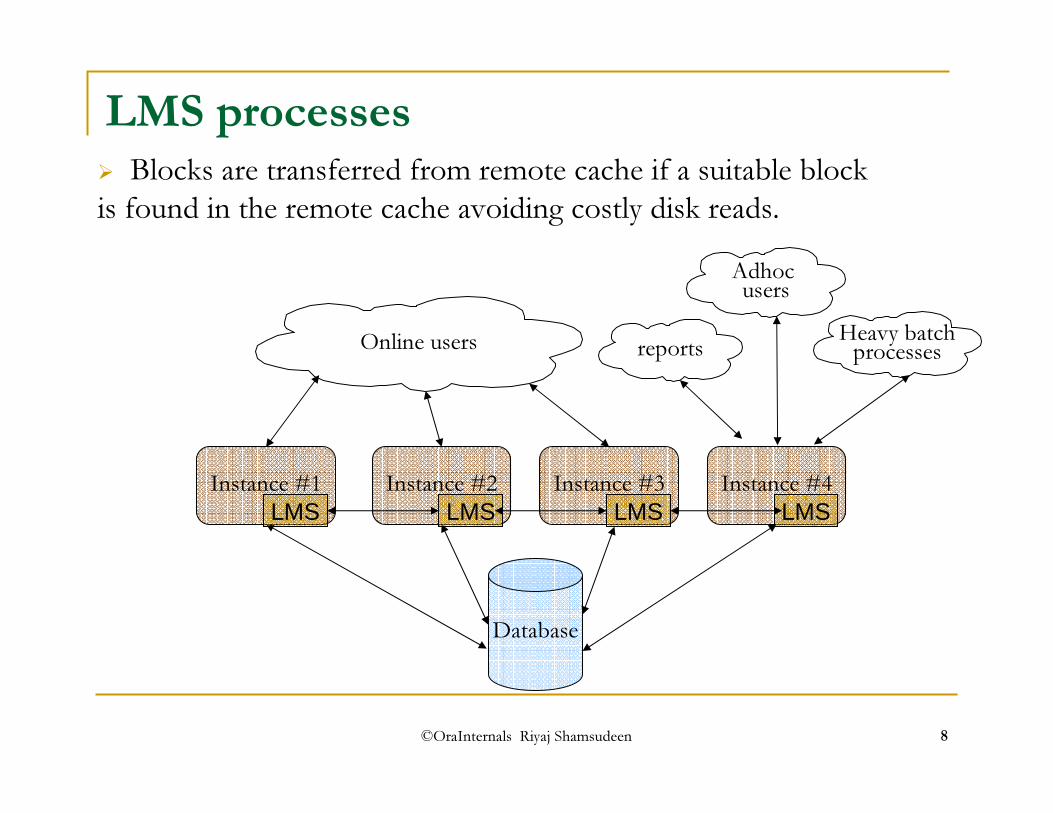
LMS processes
Database
Instance #1
Online users reports
AdhocusersHeavy batchprocesses
Instance #2 Instance #3 Instance #4LMS LMS LMS LMS
� Blocks are transferred from remote cache if a suitable block is found in the remote cache avoiding costly disk reads.
©OraInternals Riyaj Shamsudeen 9
Global cache transfer
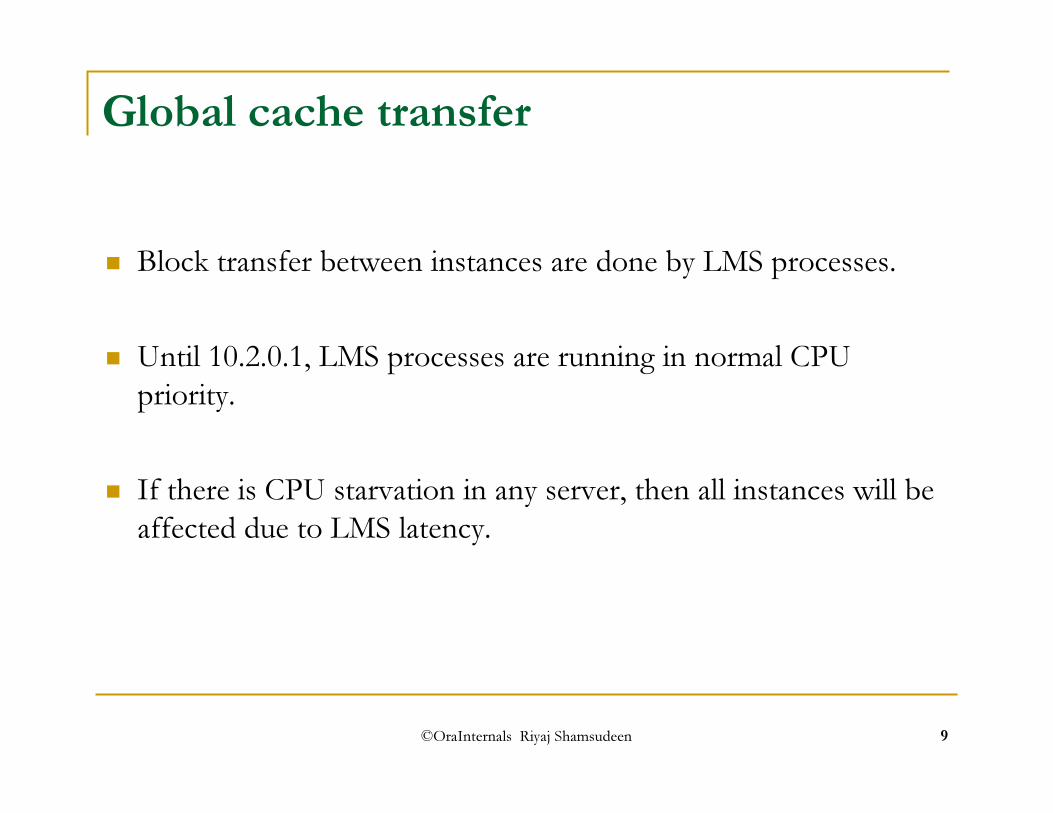
� Block transfer between instances are done by LMS processes.
� Until 10.2.0.1, LMS processes are running in normal CPU priority.
� If there is CPU starvation in any server, then all instances will be affected due to LMS latency.
©OraInternals Riyaj Shamsudeen 10
LMS processes – normal state
40%
LMS
Node 1
CPUusage
User
40%
LMS
User
40%
LMS
User
Node 2 Node 3
40%
LMS
User
Node 4
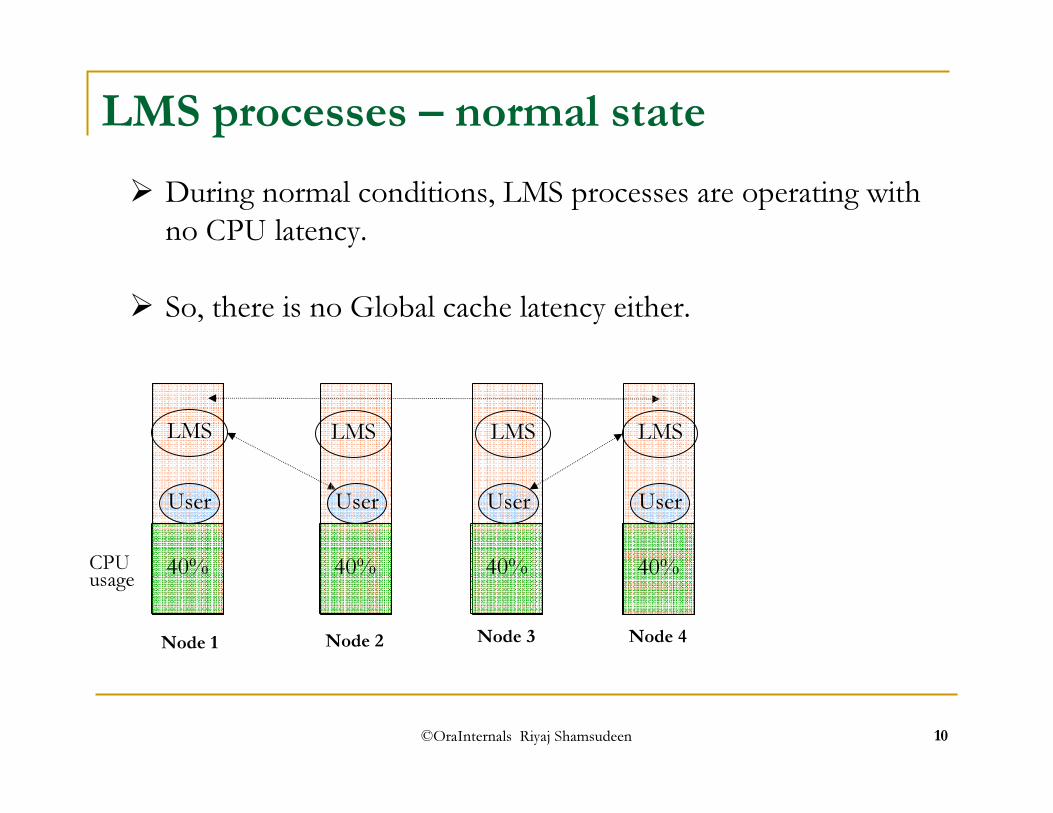
� During normal conditions, LMS processes are operating with no CPU latency.
� So, there is no Global cache latency either.

©OraInternals Riyaj Shamsudeen 11
CPU latency
40%
LMS
Node 1
CPUusage
User
40%
LMS
User
40%
LMS
User
Node 2 Node 3
80%
LMS
User
Node 4
� If one node is suffering from CPU starvation then LMS process running in that node will suffer from CPU latency.
� This will result in Global cache latency in other nodes.
©OraInternals Riyaj Shamsudeen 12
Global Cache waits
� Global Cache waits increases due to increase in LMS latency in the CPU starved node.
� Much of these GC waits are blamed on interconnect interface and hardware.
� In many cases, interconnect is performing fine, it is that GCS server processes are introducing latencies.

©OraInternals Riyaj Shamsudeen 13
LMS & 10.2.0.3� In 9i, increasing priority of LMS processes to RT helps (more
covered later).
� From Oracle release 10.2.0.3 LMS processes run in Real Time priority by default.
� Two parameters control this behaviour:• _high_priority_processes• _os_sched_high_priority

©OraInternals Riyaj Shamsudeen 14
Parameters in 10gR2� _high_priority_processes:
Default value: LMS*|VKTM*This parameter controls what background processes should get Real time priority. Default is all LMS processes and VKTM process.
� _os_sched_high_priority :Default value: 1This is a switch. If set to 0, no background process will run in high priority.

©OraInternals Riyaj Shamsudeen 15
oradism� Of course, bumping priority needs higher privileges such as root
in UNIX.
� Oradism utility is used to increase the priority class of these critical background process in UNIX.
� Verify that LMS processes are using Real time priority in UNIX and if not, oradism might not have been configured properly.
� In Windows, oradism service is used to increase the priority.

©OraInternals Riyaj Shamsudeen 16
More LMS processes?� Typical response is to increase number of LMS processes
adjusting _lm_lms (9i) or gcs_server_processes(10g).
� Increase in LMS processes without enough need increases xcalls/migrates/tlb-misses in massive servers.
� Further, LMS process runs in RT CPU priority and so, CPU usage will increase.

©OraInternals Riyaj Shamsudeen 17
LMS & CPU usage
� In huge servers, by default, number of LMS processes might be quite high. It is possible to get up to 26 LMS processes by default.
� Typically, same number of LMS processes as interconnect or remote nodes is a good starting point.
� If there is enormous amount of interconnect traffic, then configure LMS processes to be twice the interconnect.
©OraInternals Riyaj Shamsudeen 18
Agenda - Myths� High CPU usage in one node doesn't affect other node
performance.� All global cache performance issues are due to interconnect
performance.� Inter instance parallelism is excellent, since CPUs from all nodes
can be effectively used.� Logical isolation is good enough, so, run same batch process
concurrently from both nodes.� Set sequence to nocache value in RAC environments to avoid
gaps in sequence.� Small tables should not be indexed in RAC. (Skipped due to time
constraints)� Bitmap index performance is worse in RAC. (Skipped)

©OraInternals Riyaj Shamsudeen 19
Node1 GC workloadGlobal Cache and Enqueue Services - Workload Characteristics~~~~~~~~~~~~~~~~~~~~~~~~~~~~~~~~~~~~~~~~~~~~~~~~~~~~~~~~~~~~
Avg global enqueue get time (ms): 8.9
Avg global cache cr block receive time (ms): 63.3Avg global cache current block receive time (ms): 42.1
Avg global cache cr block build time (ms): 0.3Avg global cache cr block send time (ms): 0.1
Global cache log flushes for cr blocks served %: 4.5Avg global cache cr block flush time (ms): 51.5
Avg global cache current block pin time (ms): 0.0Avg global cache current block send time (ms): 4.8
Global cache log flushes for current blocks served %: 0.1Avg global cache current block flush time (ms): 30.0
Average GC CR block Receive time is very high

©OraInternals Riyaj Shamsudeen 20
Could this be interconnect issue?
� Common reaction to any Global cache performance issue: It is an interconnect hardware or network problem.
� It could be, but not necessarily.
� Unless interconnect is flooded, wire latency is a very small fraction of global cache latency.

©OraInternals Riyaj Shamsudeen 21
LMS Processing (over simplified)
Rx Msg
CR / CURblock build
Msg to LGWR(if needed)
Wakeup
Log buffer processing
Log file write
Signal LMS
Wake up
Send Block
OS,Networkstack
OS,Networkstack
Copy to SGA/ PGA
User sessionprocessing
Send GCMessage
OS,Networkstack
User LMSx LGWR
Node 1 Node 2

©OraInternals Riyaj Shamsudeen 22
LMS and Log flush
� For CR blocks, if the buffer is NOT busy, LMS process can send block immediately.
� For CR blocks, if the buffer is busy, LMS process waits for Log flush to complete.
� For CURRENT blocks, LMS process waits for log flush to complete.

©OraInternals Riyaj Shamsudeen 23
GC CR latency
� GC CR latency ~=Time spent in sending message to LMS +LMS processing +LGWR latency ( if any) +Wire latency

©OraInternals Riyaj Shamsudeen 24
GC CURRENT latency
� GC CUR latency ~=Time spent in sending message to LMS +LMS processing : Pin block +LGWR latency: Log flush +Wire latency

©OraInternals Riyaj Shamsudeen 25
Node2 GC workloadGlobal Cache and Enqueue Services - Workload Characteristics~~~~~~~~~~~~~~~~~~~~~~~~~~~~~~~~~~~~~~~~~~~~~~~~~~~~~~~~~~~~
Avg global enqueue get time (ms): 0.3
Avg global cache cr block receive time (ms): 10.4Avg global cache current block receive time (ms): 3.2
Avg global cache cr block build time (ms): 0.1Avg global cache cr block send time (ms): 0.0
Global cache log flushes for cr blocks served %: 5.0Avg global cache cr block flush time (ms): 4380.0
Avg global cache current block pin time (ms): 0.0Avg global cache current block send time (ms): 0.1
Global cache log flushes for current blocks served %: 0.1Avg global cache current block flush time (ms): 0.0
In this specific case, log flush was very slow due to an hardwareissue

©OraInternals Riyaj Shamsudeen 26
LGWR and CPU priority� LGWR performance is akin to Global cache performance.
� If LGWR suffers from performance issues, it will reflect on Global cache performance.
� For example, If LGWR suffers from CPU latency issues, then LMS will have longer waits for ‘gcs log flush sync’ event
� This leads to poor GC performance in other nodes.

©OraInternals Riyaj Shamsudeen 27
LGWR priority� Method to increase priority for LGWR and LMS in 9i (Example
for Solaris)�. If you don’t want to increase priority to RT for LGWR, at least, consider FX priority.
priocntl -e -c class -m userlimit -p prioritypriocntl -e -c RT -p 59 `pgrep -f ora_lgwr_${ORACLE_SID}`priocntl -e -c FX -m 60 -p 60 `pgrep -f ora_lms[0-9]*_${ORACLE_SID}`
� In 10g, parameter _high_priority_processes can be used (needs database restart though)
alter system set "_high_priority_processes"="LMS*|LGWR*" scope=spfile sid='*';

©OraInternals Riyaj Shamsudeen 28
Pitfalls of RT mode� Of course, there are few! � LMS process can continuously consume CPU and can introduce
CPU starvation in servers with few CPUs.� A bug was opened to make LMS process sleep intermittently, but
that causes LMS to be less active and can cause GC latency.� Another undocumented parameter
_high_priority_process_num_yields_before_sleep was introduced as a tunable. But, hardly a need to alter this parameter.
� Hyper-active LGWR can lead to latch contention issues.

©OraInternals Riyaj Shamsudeen 29
Binding..� Another option is to bind LGWR/LMS to specific
processors or processor sets.
� Still, interrupts can pre-empt LMS processors and LGWR. So, binding LMS to processor set without interrupts helps (see psradm in solaris).
� But, of course, processor binding is useful in servers with higher number of CPUs such as E25K platforms.

©OraInternals Riyaj Shamsudeen 30
Summary� In summary,
• Use optimal # of LMS processes• Use RT or FX high priority for LMS and LGWR processes.• Configure decent hardware for online redo log files.• Tune LGWR writes and Of course, avoid double buffering and double copy using optimal file systems.• Of course, tune SQL statement to reduce logical reads and reduce redo size.

©OraInternals Riyaj Shamsudeen 31
Agenda - Myths� High CPU usage in one node doesn't affect other node
performance.� All global cache performance issues are due to interconnect
performance.� Inter instance parallelism is excellent, since CPUs from all nodes
can be effectively used.� Logical isolation is good enough, so, run same batch process
concurrently from both nodes.� Set sequence to nocache value in RAC environments to avoid
gaps in sequence.� Small tables should not be indexed in RAC. (Skipped due to time
constraints)� Bitmap index performance is worse in RAC. (Skipped)
©OraInternals Riyaj Shamsudeen 32
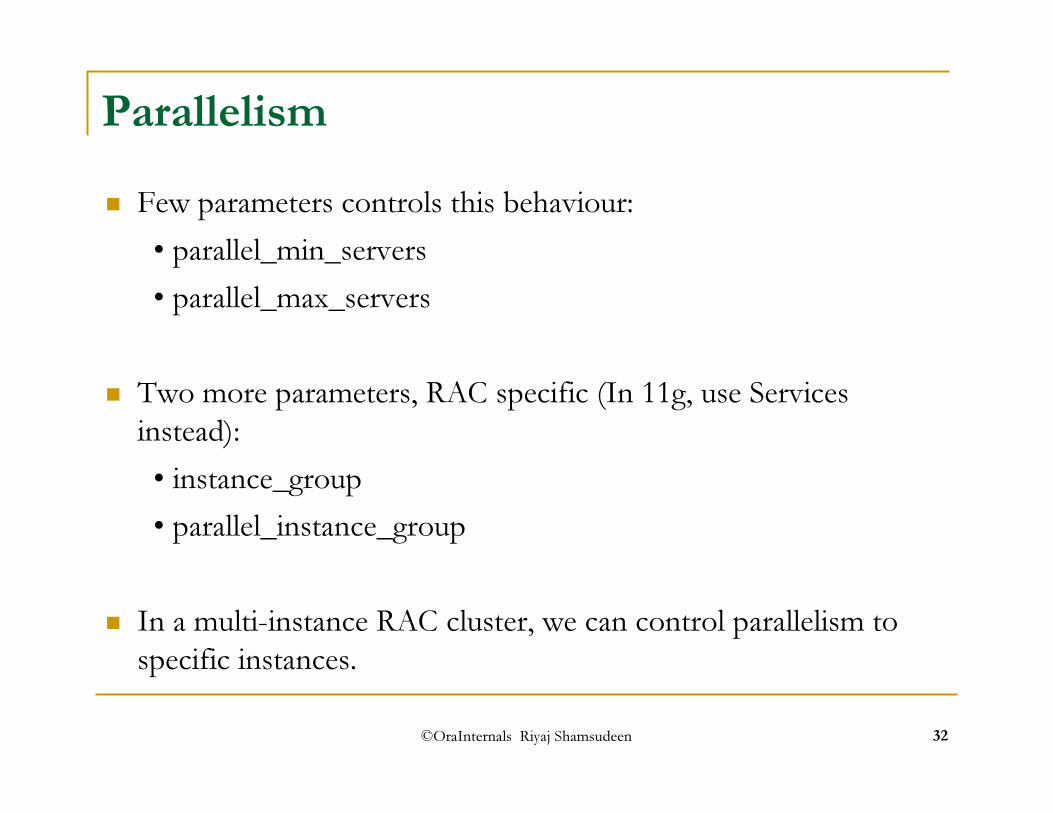
Parallelism� Few parameters controls this behaviour:
• parallel_min_servers• parallel_max_servers
� Two more parameters, RAC specific (In 11g, use Services instead):• instance_group• parallel_instance_group
� In a multi-instance RAC cluster, we can control parallelism to specific instances.

©OraInternals Riyaj Shamsudeen 33
Parallelism� Let's say that there are three instances: inst1, inst2, inst3.� To span slaves across all instances
• inst1.instance_groups='inst1','all'• inst2.instance_groups='inst2','all'• inst3.instance_groups='inst3','all'• inst1.parallel_instance_group='all'
QC
P001 P002 P001 P002 P001 P002
Inst 1 Inst 2 Inst 3SQL

©OraInternals Riyaj Shamsudeen 34
Parallelism� To span slaves across all instances inst1 and inst2 alone,
parameters will be:• inst1.instance_groups='inst1','all', 'inst12'• inst2.instance_groups='inst2','all','inst12'• inst3.instance_groups='inst3','all'• inst1.parallel_instance_group='inst12'
QC
P001 P002 P001 P002
Inst 1 Inst 2 Inst 3SQL

©OraInternals Riyaj Shamsudeen 35
So, how do we measure?
� Parallel query traffic is not factored in Statspack or AWR report until Version 11g.
� There is no easy way to measure PQ traffic using database utilities.
� I used dtrace based Solaris tool udpsnoop.d to measure UDP traffic between various nodes for this presentation.
� Packet sizes were aggregated to calculate interconnect traffic� This method is very accurate and reliable.

©OraInternals Riyaj Shamsudeen 36
SQL 1
alter session set parallel_instance_group=‘inst12';
select /*+ parallel ( t1, 8) */min (t1.CUSTOMER_TRX_LINE_ID +t1.CUSTOMER_TRX_LINE_ID ) , avg(t1.SET_OF_BOOKS_ID+t1.set_of_books_id),max ( t1.SET_OF_BOOKS_ID+t1.set_of_books_id ),avg( t1.QUANTITY_ORDERED + t1.QUANTITY_ORDERED ),
max(t1.ATTRIBUTE_CATEGORY ), max(t1.attribute1),max(t1.attribute2)
From BIG_TABLE t1;
� This SQL is performing a simple aggregation with parallel servers from two nodes.
This is a single table aggregation.

©OraInternals Riyaj Shamsudeen 37
PQ allocationINST PROC Slave Set Slave QC RDOP DOP SIZE------- ------------ ----- ----- ----- ------- ---- ---- -----
1 SYS QC 10933 10933 33141 - p000 (Slave) 1 10958 10933 16 161 - p001 (Slave) 1 10948 10933 16 161 - p002 (Slave) 1 10953 10933 16 161 - p003 (Slave) 1 10925 10933 16 161 - p004 (Slave) 1 10916 10933 16 161 - p005 (Slave) 1 10938 10933 16 161 - p006 (Slave) 1 10951 10933 16 161 - p007 (Slave) 1 10946 10933 16 162 - p000 (Slave) 1 10949 10933 16 16 21522 - p001 (Slave) 1 10937 10933 16 16 21522 - p002 (Slave) 1 10946 10933 16 16 21522 - p003 (Slave) 1 10956 10933 16 16 21522 - p004 (Slave) 1 10902 10933 16 16 21522 - p005 (Slave) 1 10981 10933 16 16 21522 - p006 (Slave) 1 10899 10933 16 16 21522 - p007 (Slave) 1 10927 10933 16 16 2152
Eight slaves allocated from node 1 and node 2 each.

©OraInternals Riyaj Shamsudeen 38
PQ Optimization
QC
P1
Inst 2
1 Read partial table
2 Aggregate data
Merge3
P2 P3 P8P1
Inst 1
P2 P3 P8… …
� PQ code is optimized to reduce GC traffic. � For a single table, GC traffic is minimal.
Just 2152 bytes

©OraInternals Riyaj Shamsudeen 39
SQL 2
alter session set parallel_instance_group=‘inst12';
select /*+ parallel ( t1, 16) parallel (t2, 16) */t1.CUSTOMER_TRX_LINE_ID , t1.SET_OF_BOOKS_ID, max(t1.ATTRIBUTE_CATEGORY ), s
um( t2.QUANTITY_ORDERED), sum(t1.QUANTITY_ORDERED)frombackup.big_table1_part t1,backup.big_table1_part t2where t1.CUSTOMER_TRX_LINE_ID = t2.CUSTOMER_TRX_LINE_IDgroup byt1.CUSTOMER_TRX_LINE_ID , t1.SET_OF_BOOKS_ID
;
� This SQL is an hash join between two big tables and then aggregation.

©OraInternals Riyaj Shamsudeen 40
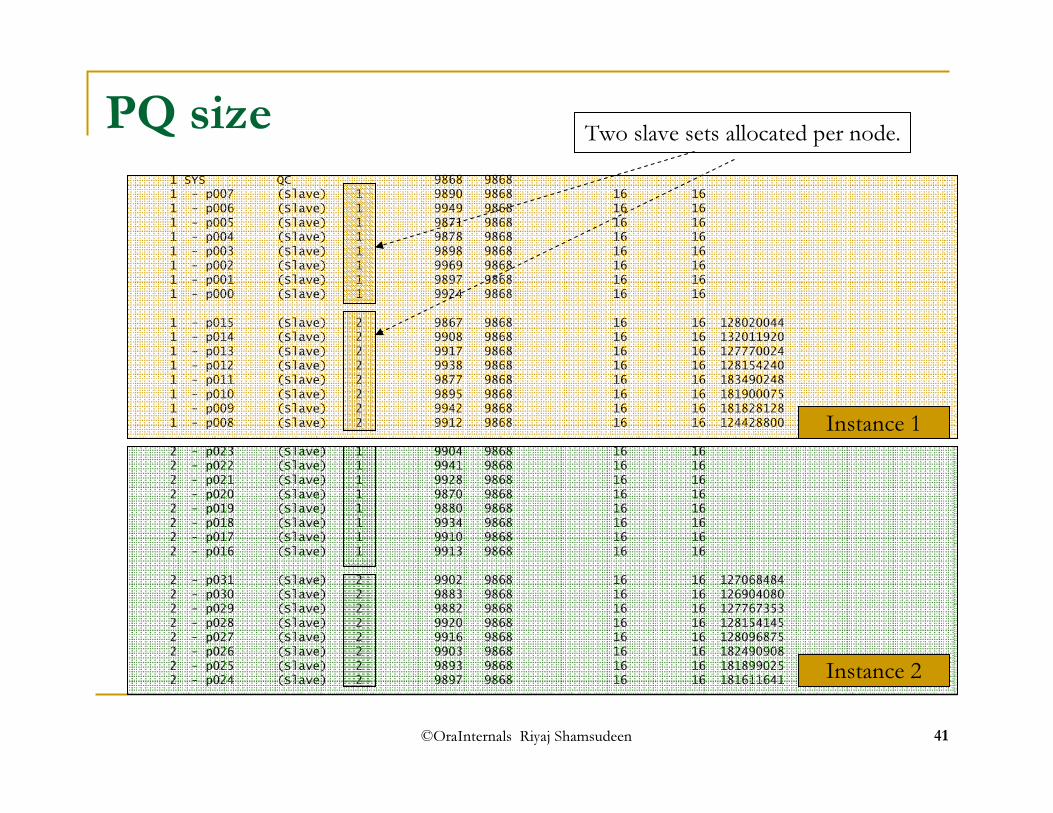
PQ allocation -21 SYS QC 9868 98681 - p007 (Slave) 1 9890 9868 16 161 - p006 (Slave) 1 9949 9868 16 161 - p005 (Slave) 1 9871 9868 16 161 - p004 (Slave) 1 9878 9868 16 161 - p003 (Slave) 1 9898 9868 16 161 - p002 (Slave) 1 9969 9868 16 161 - p001 (Slave) 1 9897 9868 16 161 - p000 (Slave) 1 9924 9868 16 161 - p015 (Slave) 2 9867 9868 16 161 - p014 (Slave) 2 9908 9868 16 161 - p013 (Slave) 2 9917 9868 16 161 - p012 (Slave) 2 9938 9868 16 161 - p011 (Slave) 2 9877 9868 16 161 - p010 (Slave) 2 9895 9868 16 161 - p009 (Slave) 2 9942 9868 16 161 - p008 (Slave) 2 9912 9868 16 162 - p023 (Slave) 1 9904 9868 16 162 - p022 (Slave) 1 9941 9868 16 162 - p021 (Slave) 1 9928 9868 16 162 - p020 (Slave) 1 9870 9868 16 162 - p019 (Slave) 1 9880 9868 16 162 - p018 (Slave) 1 9934 9868 16 162 - p017 (Slave) 1 9910 9868 16 162 - p016 (Slave) 1 9913 9868 16 162 - p031 (Slave) 2 9902 9868 16 162 - p030 (Slave) 2 9883 9868 16 162 - p029 (Slave) 2 9882 9868 16 162 - p028 (Slave) 2 9920 9868 16 162 - p027 (Slave) 2 9916 9868 16 162 - p026 (Slave) 2 9903 9868 16 162 - p025 (Slave) 2 9893 9868 16 162 - p024 (Slave) 2 9897 9868 16 16
Instance 1
Instance 2
Two slave sets allocated per node.
©OraInternals Riyaj Shamsudeen 41
PQ size1 SYS QC 9868 98681 - p007 (Slave) 1 9890 9868 16 161 - p006 (Slave) 1 9949 9868 16 161 - p005 (Slave) 1 9871 9868 16 161 - p004 (Slave) 1 9878 9868 16 161 - p003 (Slave) 1 9898 9868 16 161 - p002 (Slave) 1 9969 9868 16 161 - p001 (Slave) 1 9897 9868 16 161 - p000 (Slave) 1 9924 9868 16 161 - p015 (Slave) 2 9867 9868 16 16 1280200441 - p014 (Slave) 2 9908 9868 16 16 1320119201 - p013 (Slave) 2 9917 9868 16 16 1277700241 - p012 (Slave) 2 9938 9868 16 16 1281542401 - p011 (Slave) 2 9877 9868 16 16 1834902481 - p010 (Slave) 2 9895 9868 16 16 1819000751 - p009 (Slave) 2 9942 9868 16 16 1818281281 - p008 (Slave) 2 9912 9868 16 16 1244288002 - p023 (Slave) 1 9904 9868 16 162 - p022 (Slave) 1 9941 9868 16 162 - p021 (Slave) 1 9928 9868 16 162 - p020 (Slave) 1 9870 9868 16 162 - p019 (Slave) 1 9880 9868 16 162 - p018 (Slave) 1 9934 9868 16 162 - p017 (Slave) 1 9910 9868 16 162 - p016 (Slave) 1 9913 9868 16 162 - p031 (Slave) 2 9902 9868 16 16 1270684842 - p030 (Slave) 2 9883 9868 16 16 1269040802 - p029 (Slave) 2 9882 9868 16 16 1277673532 - p028 (Slave) 2 9920 9868 16 16 1281541452 - p027 (Slave) 2 9916 9868 16 16 1280968752 - p026 (Slave) 2 9903 9868 16 16 1824909082 - p025 (Slave) 2 9893 9868 16 16 1818990252 - p024 (Slave) 2 9897 9868 16 16 181611641
Instance 1
Instance 2
Two slave sets allocated per node.

©OraInternals Riyaj Shamsudeen 42
PQ explain plan
--------------------------------------------------------------------------------------------| Id | Operation | Name | E-Rows | OMem | 1Mem | Used-Mem |--------------------------------------------------------------------------------------------| 1 | PX COORDINATOR | | | | | || 2 | PX SEND QC (RANDOM) | :TQ10001 | 85M| | | || 3 | HASH GROUP BY | | 85M| 1096K| 1096K| || 4 | PX RECEIVE | | 85M| | | || 5 | PX SEND HASH | :TQ10000 | 85M| | | || 6 | HASH GROUP BY | | 85M| 1180K| 1180K| || 7 | PX PARTITION RANGE ALL| | 85M| | | ||* 8 | HASH JOIN | | 85M| 2047M| 37M| || 9 | TABLE ACCESS FULL | BIG_TABLE1_PART | 85M| | | || 10 | TABLE ACCESS FULL | BIG_TABLE1_PART | 85M| | | |--------------------------------------------------------------------------------------------Predicate Information (identified by operation id):---------------------------------------------------
8 - access("T1"."CUSTOMER_TRX_LINE_ID"="T2"."CUSTOMER_TRX_LINE_ID")

©OraInternals Riyaj Shamsudeen 43
PQ Optimization 2
QC
P1
Inst 2
P2 P3 P8P1
Inst 1
P2 P3 P8… …
P9 P10 P11 P16… P9 P10 P11 P16…
Producers
Consumers
Communication between producers/consumers areNot limited to one node. Gigabytes of data flew Between node 1 and node 2.
©OraInternals Riyaj Shamsudeen 44
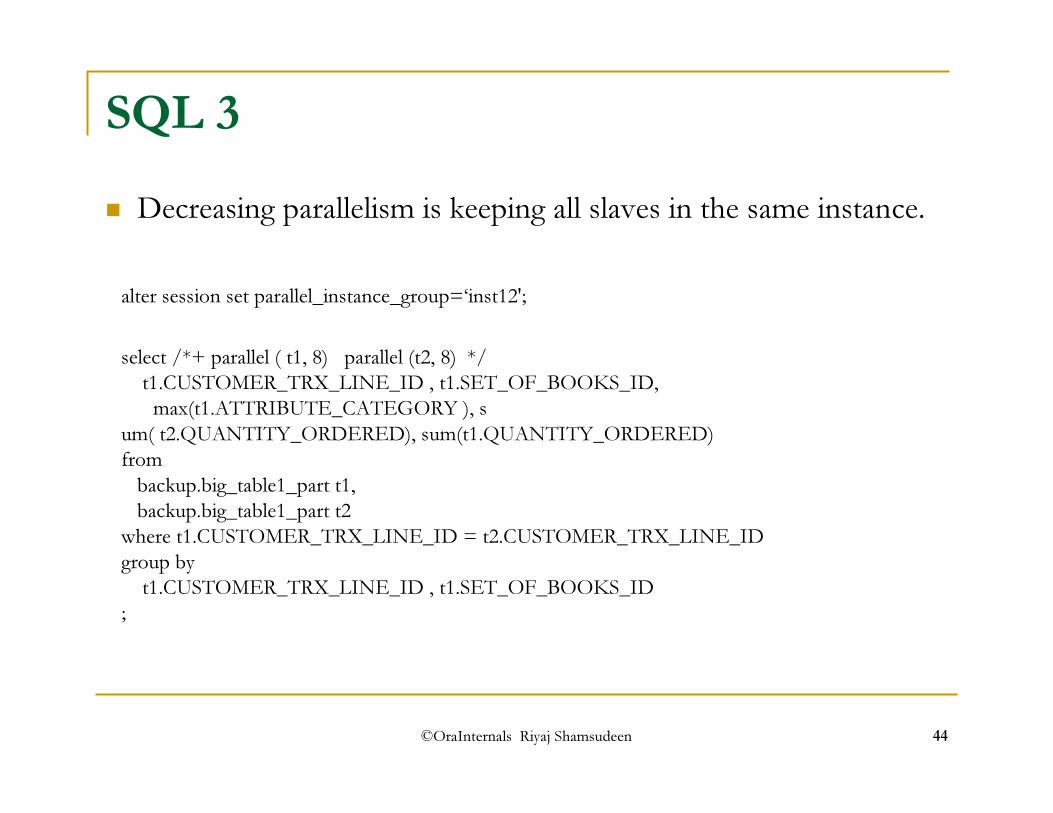
SQL 3
alter session set parallel_instance_group=‘inst12';
select /*+ parallel ( t1, 8) parallel (t2, 8) */t1.CUSTOMER_TRX_LINE_ID , t1.SET_OF_BOOKS_ID, max(t1.ATTRIBUTE_CATEGORY ), s
um( t2.QUANTITY_ORDERED), sum(t1.QUANTITY_ORDERED)frombackup.big_table1_part t1,backup.big_table1_part t2where t1.CUSTOMER_TRX_LINE_ID = t2.CUSTOMER_TRX_LINE_IDgroup byt1.CUSTOMER_TRX_LINE_ID , t1.SET_OF_BOOKS_ID
;
� Decreasing parallelism is keeping all slaves in the same instance.

©OraInternals Riyaj Shamsudeen 45
PQ allocation -3INST_ID Username QC/Slave Slave Set SID QC SID Requested DOP Actual DOP
---------- ------------ ---------- ---------- ------ ------ ------------- ----------1 SYS QC 9897 98972 - p002 (Slave) 1 9870 9897 8 82 - p000 (Slave) 1 9877 9897 8 82 - p003 (Slave) 1 9936 9897 8 82 - p004 (Slave) 1 9927 9897 8 82 - p005 (Slave) 1 9926 9897 8 82 - p001 (Slave) 1 9913 9897 8 82 - p006 (Slave) 1 9909 9897 8 82 - p007 (Slave) 1 9893 9897 8 82 - p013 (Slave) 2 9949 9897 8 82 - p014 (Slave) 2 9883 9897 8 82 - p011 (Slave) 2 9904 9897 8 82 - p008 (Slave) 2 9916 9897 8 82 - p012 (Slave) 2 9920 9897 8 82 - p009 (Slave) 2 9922 9897 8 82 - p015 (Slave) 2 9928 9897 8 82 - p010 (Slave) 2 9882 9897 8 8
Instance 2
All slaves allocated in the same node reducing Interconnect traffic.

©OraInternals Riyaj Shamsudeen 46
PQ Optimization 3
QC
P1
Inst 2
P2 P3 P8
Inst 1
…
P9 P10 P11 P16…
Producers
Consumers
Still, consumers to Query Co-ordinator PQ trafficUses Interconnect.

©OraInternals Riyaj Shamsudeen 47
Analysis� It’s hard to see the issues with AWR report since the PQ
interconnect traffic is not correctly printed.
� Oracle Version 10g and 11g has reduced interconnect traffic withinnovative optimizer plans. PQ server allocation was optimized to minimize interconnect traffic.
� For example, with few parallel slaves all servers were allocated in the same node reducing GC traffic.
� But, QC and servers were not running in the same node in test case 3.
©OraInternals Riyaj Shamsudeen 48
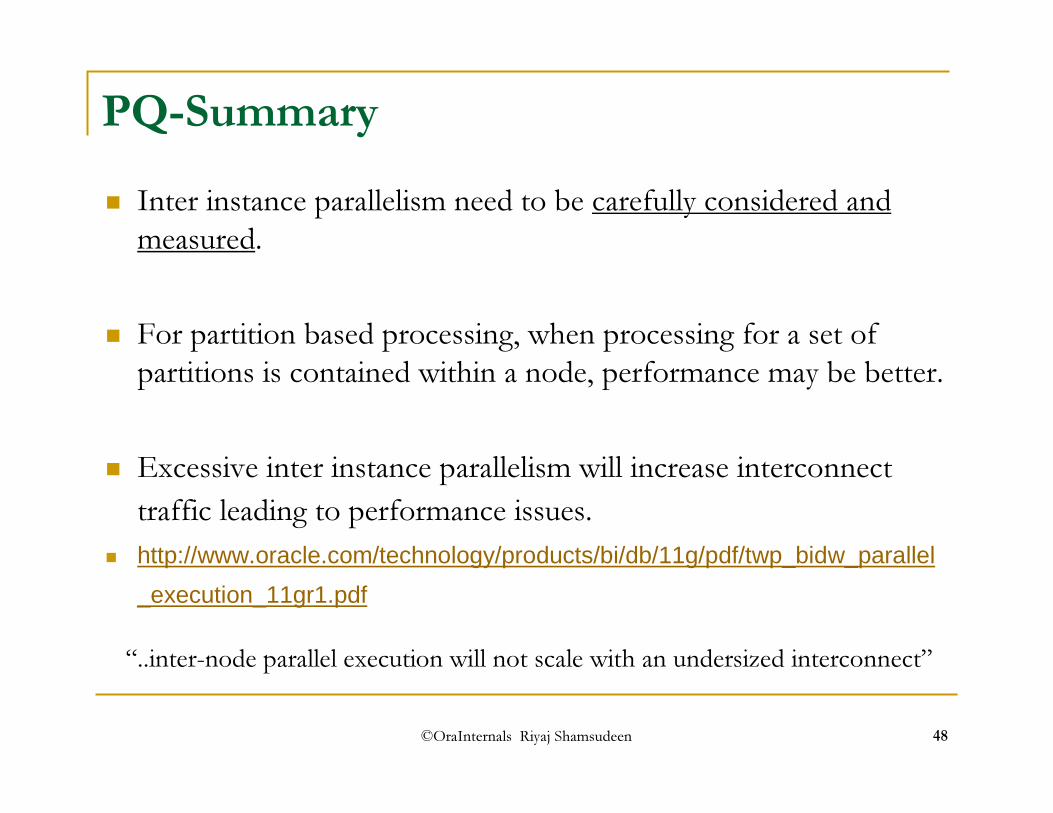
PQ-Summary� Inter instance parallelism need to be carefully considered and
measured.
� For partition based processing, when processing for a set of partitions is contained within a node, performance may be better.
� Excessive inter instance parallelism will increase interconnect traffic leading to performance issues.
� http://www.oracle.com/technology/products/bi/db/11g/pdf/twp_bidw_parallel
_execution_11gr1.pdf
“..inter-node parallel execution will not scale with an undersized interconnect”

©OraInternals Riyaj Shamsudeen 49
Agenda - Myths� High CPU usage in one node doesn't affect other node
performance.� All global cache performance issues are due to interconnect
performance.� Inter instance parallelism is excellent, since CPUs from all nodes
can be effectively used.� Logical isolation is good enough, so, run same batch process
concurrently from both nodes.� Set sequence to nocache value in RAC environments to avoid
gaps in sequence.� Small tables should not be indexed in RAC. (Skipped due to time
constraints)� Bitmap index performance is worse in RAC. (Skipped)

©OraInternals Riyaj Shamsudeen 50
Concurrent processing?� A batch process was designed to accept organization_id as an
argument, and spawns multiple threads for each organization.
� This is multi-node RAC cluster and so� Batch process was started in node 1 for org_id=1.� Same batch process was started in node 2 for org_id=2.
� But batch code accessing one set of tables and they are not partitioned.

©OraInternals Riyaj Shamsudeen 51
Concurrent processing?
Inst 1 Inst 2Inst 3
Batch processesfor org_id=2
t1 t1 t1
CR mode
CUR mode
Batch processes for org_id=1
Same code runs from both nodes, but for different organizations.

©OraInternals Riyaj Shamsudeen 52
Concurrent processing?
Inst 1 Inst 2Inst 3
Batch processesfor org_id=2
t1 t1 t1
CR mode
CUR mode
Batch processes for org_id=1
But, same blocks are accessedAnd modified from both nodes,Increasing GCS waits and GCS Communication.

©OraInternals Riyaj Shamsudeen 53
Are GCS waits cheap?� Typical Global cache waits are 1-3ms for a decent hardware
setup.
� Typical Single block or multi-block reads are 2-4ms for decent hardware.
� But typical access to the buffer in local SGA is just nano seconds (10-100ns).
� Higher global cache waits still introduces latency comparable toI/O based latencies.

©OraInternals Riyaj Shamsudeen 54
What happened?� Enormous increase in Global cache waits! (5 minutes statspack)Top 5 Timed Events~~~~~~~~~~~~~~~~~~ % TotalEvent Waits Time (s) Ela Time-------------------------------------------- ------------ ----------- --------CPU time 3,901 46.17PL/SQL lock timer 80 2,316 27.42global cache cr request 123,725 670 7.93global cache null to x 13,551 446 5.28buffer busy global CR 12,383 215 2.54
� If this has been a non-RAC, access to buffers would be in terms of nano seconds instead of milli-seconds.
� Point is that since these batch processes are accessing same physical blocks, they need to be grouped at physical level and scheduled to run from one node.
� Proper partitioning will help, but global indices needs special attention.

©OraInternals Riyaj Shamsudeen 55
Tkprof output� Trace file analysis also shows excessive global cache waits.Elapsed times include waiting on following events:Event waited on Times Max. Wait Total Waited---------------------------------------- Waited ---------- ------------log file sync 13 0.08 0.28latch free 2185 0.17 32.76global cache cr request 21719 0.31 71.18db file sequential read 50 0.04 0.33global cache s to x 791 0.06 5.31row cache lock 113 0.02 0.41global cache null to x 4881 0.30 97.41buffer busy global CR 3306 0.23 15.26global cache open x 903 0.06 5.83buffer busy waits 1462 0.98 17.90global cache busy 644 0.98 10.36buffer deadlock 224 0.02 0.07global cache null to s 89 0.15 0.77buffer busy global cache 1066 0.31 27.62enqueue 302 0.17 2.61KJC: Wait for msg sends to complete 102 0.00 0.00global cache open s 62 0.01 0.13cr request retry 4 0.00 0.00

©OraInternals Riyaj Shamsudeen 56
Agenda - Myths� High CPU usage in one node doesn't affect other node
performance.� All global cache performance issues are due to interconnect
performance.� Inter instance parallelism is excellent, since CPUs from all nodes
can be effectively used.� Logical isolation is good enough, so, run same batch process
concurrently from both nodes.� Set sequence to nocache value in RAC environments to avoid
gaps in sequence.� Small tables should not be indexed in RAC. (Skipped due to time
constraints)� Bitmap index performance is worse in RAC. (Skipped)

©OraInternals Riyaj Shamsudeen 57
Sequence operation in RAC
Inst 1 Inst 2
1 First access to sequencecaches values from 10 to 29
2 SEQ$ updated with last_value as 29
Second access cachesvalue from 30-493
emp_seqcache 20 start with 10
10-29
4 SEQ$ updated with last_value as 49
5 Subsequent accesses returnsvalues until value reaches 29
6 After 29, values will bein 50-69 range.
SEQ$ updated with last_value as 69
30-49
7
1. 60 access to sequenceresults in 3 changes to block.2. These changes might notresult in physicalreads/writes.3. Gaps in sequence values.4. Still, log flush needed forcache transfer.

©OraInternals Riyaj Shamsudeen 58
Sequence operation in RAC
Inst 1 Inst 2
1 First access to sequencereturns value 10
2 SEQ$ updated with last_value as 10
Second access returnsvalue of 113
emp_seqnocachestart with 10
10
4 SEQ$ updated with last_value as 11
5 Subsequent accesses returnsvalue 12
6 Due to nocache values, there will be no gaps.
SEQ$ updated with last_value as 12
11
7
1. 3 access to sequenceresults in 3 block changes.2. No gaps in sequencevalues.3. But, SEQ$ table blockstransferred back and forth.

©OraInternals Riyaj Shamsudeen 59
Sequences – Test caseset timing onalter session set events '10046 trace name context forever, level 8';declare
l_v1 varchar2(512);l_n1 number :=0;
beginfor loop_cnt in 1 .. 10000loop
-- Random access-- Also making undo blocks to be pinged..insert into t1select t1_seq.nextval, lpad( loop_cnt, 500, 'x') from dual;if mod(loop_cnt, 1000) =0 then
commit;end if;
end loop;end;/
Single row inserts using sequence values..

©OraInternals Riyaj Shamsudeen 60
Code executions – one nodeINSERT INTO T1 SELECT T1_SEQ.NEXTVAL, LPAD( :B1 , 500, 'x') FROM DUALcall count cpu elapsed disk query current rows------- ------ -------- ---------- ---------- ---------- ---------- ----------Parse 1 0.00 0.00 0 0 0 0Execute 10000 5.28 7.66 1 794 25670 10000Fetch 0 0.00 0.00 0 0 0 0------- ------ -------- ---------- ---------- ---------- ---------- ----------total 10001 5.29 7.66 1 794 25670 10000
update seq$ set increment$=:2,minvalue=:3,maxvalue=:4,cycle#=:5,order$=:6,cache=:7,highwater=:8,audit$=:9,flags=:10 where obj#=:1
call count cpu elapsed disk query current rows------- ------ -------- ---------- ---------- ---------- ---------- ----------Parse 10000 0.32 0.30 0 0 0 0Execute 10000 2.74 3.04 0 10000 20287 10000Fetch 0 0.00 0.00 0 0 0 0------- ------ -------- ---------- ---------- ---------- ---------- ----------total 20000 3.06 3.34 0 10000 20287 10000

©OraInternals Riyaj Shamsudeen 61
Code executions – two nodesINSERT INTO T1 SELECT T1_SEQ.NEXTVAL, LPAD( :B1 , 500, 'x') FROM DUALcall count cpu elapsed disk query current rows------- ------ -------- ---------- ---------- ---------- ---------- ----------Parse 1 0.00 0.00 0 0 0 0Execute 10000 8.02 81.23 0 1584 27191 10000Fetch 0 0.00 0.00 0 0 0 0------- ------ -------- ---------- ---------- ---------- ---------- ----------total 10001 8.02 81.23 0 1584 27191 10000
Elapsed times include waiting on following events:Event waited on Times Max. Wait Total Waited---------------------------------------- Waited ---------- ------------row cache lock 5413 2.93 62.86gc current block 2-way 63 0.16 0.41gc cr block 2-way 46 0.00 0.06
Excessive row cache lockwaits

©OraInternals Riyaj Shamsudeen 62
Code executions – two nodes
update seq$ set increment$=:2,minvalue=:3,maxvalue=:4,cycle#=:5,order$=:6,cache=:7,highwater=:8,audit$=:9,flags=:10
where obj#=:1call count cpu elapsed disk query current rows------- ------ -------- ---------- ---------- ---------- ---------- ----------Parse 10000 0.35 0.30 0 0 0 0Execute 10000 4.08 11.18 0 10000 20290 10000Fetch 0 0.00 0.00 0 0 0 0------- ------ -------- ---------- ---------- ---------- ---------- ----------total 20000 4.44 11.49 0 10000 20290 10000
Event waited on Times Max. Wait Total Waited---------------------------------------- Waited ---------- ------------gc current block 2-way 5166 0.01 5.39log file switch completion 3 0.16 0.22gc current grant busy 1 0.00 0.00
5000 blocks transferredbetween nodes..

©OraInternals Riyaj Shamsudeen 63
Cache and Order� If ordering is a must, then use ORDER and cache attributes for
sequences:create sequence test_seq order cache 1000;
� With ‘cache’ and ‘order’, RAC is using GES layer to synchronize the sequence values (at least from 10g onwards).
Elapsed times include waiting on following events:Event waited on Times Max. Wait Total Waited---------------------------------------- Waited ---------- ------------row cache lock 24 0.00 0.02DFS lock handle 3430 0.03 2.94gc current block 2-way 13 0.21 0.24gc cr block 2-way 4 0.00 0.00

©OraInternals Riyaj Shamsudeen 64
Sequence- summary� Nocache sequences increases 'row cache lock' waits. Use cache
and Order atributes (tested in 10g).
� Nocache increases interconnect traffic.
� Nocache increases elapsed time.
� If no gaps are needed, control sequence access from just one node or use non-sequence based techniques.
©OraInternals Riyaj Shamsudeen 65
Agenda - Myths� High CPU usage in one node doesn't affect other node
performance.� All global cache performance issues are due to interconnect
performance.� Inter instance parallelism is excellent, since CPUs from all nodes
can be effectively used.� Logical isolation is good enough, so, run same batch process
concurrently from both nodes.� Set sequence to nocache value in RAC environments to avoid
gaps in sequence.� Small tables should not be indexed in RAC. (Skipped due to time
constraints)� Bitmap index performance is worse in RAC. (Skipped)

©OraInternals Riyaj Shamsudeen 66
Small tables� Even small tables must be indexed.
� Excessive full table scans on smaller tables will increase CPU usage.
� This guideline applies to RAC environments too.
� I think, this myth arises due to misunderstanding of the problem.

©OraInternals Riyaj Shamsudeen 67
Small tablesset timing ondrop table t_small2;create table t_small2 (n1 number, v1 varchar2(10) ) tablespace users;insert into t_small2 select n1, lpad(n1,10,'x')�from (select level n1 from dual connect by level <=10001 );commit;
select segment_name, sum(bytes)/1024 from dba_segments where segment_name='T_SMALL2'and owner='CBQT' group by segment_nameSQL> /SEGMENT_NAME SUM(BYTES)/1024---------------------------------------- ---------------T_SMALL2 256

©OraInternals Riyaj Shamsudeen 68
Test casealter session set events '10046 trace name context forever , level 8';set serveroutput on size 100000declarev_n1 number;v_v1 varchar2(512);b_n1 number;
beginfor i in 1 .. 100000 loop
b_n1 := trunc(dbms_random.value (1,10000));select n1, v1 into v_n1, v_v1 from t_small2 where n1 =b_n1;
end loop;exceptionwhen no_data_found thendbms_output.put_line (b_n1);
end;/
Concurrently running this plsql block in both nodes.

©OraInternals Riyaj Shamsudeen 69
Results from RAC nodes.SELECT N1, V1FROMT_SMALL2 WHERE N1 =:B1call count cpu elapsed disk query current rows------- ------ -------- ---------- ---------- ---------- ---------- ----------Parse 1 0.00 0.00 0 0 0 0Execute 100000 2.81 3.08 0 1 0 0Fetch 100000 62.72 63.71 0 3100000 0 100000------- ------ -------- ---------- ---------- ---------- ---------- ----------total 200001 65.54 66.79 0 3100001 0 100000
Rows Row Source Operation------- ---------------------------------------------------100000 TABLE ACCESS FULL T_SMALL2 (cr=3100000 pr=0 pw=0 time=63391728 us)�
63 seconds of CPUs consumed

©OraInternals Riyaj Shamsudeen 70
Results with an indexREM adding an index and repeating testcreate index t_small2_n1 on t_small2(n1);
call count cpu elapsed disk query current rows------- ------ -------- ---------- ---------- ---------- ---------- ----------Parse 1 0.00 0.00 0 0 0 0Execute 100000 1.64 1.61 0 2 0 0Fetch 100000 1.79 1.78 23 300209 0 100000------- ------ -------- ---------- ---------- ---------- ---------- ----------total 200001 3.43 3.40 23 300211 0 100000
Rows Row Source Operation------- ---------------------------------------------------100000 TABLE ACCESS BY INDEX ROWID T_SMALL2 (cr=300209 pr=23 pw=0 time=1896719 us)�100000 INDEX RANGE SCAN T_SMALL2_N1 (cr=200209 pr=23 pw=0 time=1109464 us)(object id
53783)�
CPU usage dropped from 63 seconds to 3.5 seconds.

©OraInternals Riyaj Shamsudeen 71
Agenda - Myths� High CPU usage in one node doesn't affect other node
performance.� All global cache performance issues are due to interconnect
performance.� Inter instance parallelism is excellent, since CPUs from all nodes
can be effectively used.� Logical isolation is good enough, so, run same batch process
concurrently from both nodes.� Set sequence to nocache value in RAC environments to avoid
gaps in sequence.� Small tables should not be indexed in RAC.� Bitmap index performance is worse compared to single instance.

©OraInternals Riyaj Shamsudeen 72
Bitmap index� Bitmap indices are optimal for low cardinality columns.
� Bitmap indices are not suitable for table with massive DML changes.
� Bitmap index performance does not worsen because of RAC for select queries.
� Of course, having bitmap indices on columns with enormous DML changes is not optimal even in single instance databases.

©OraInternals Riyaj Shamsudeen 73
Test case - SelectCreate bitmap index t_large2_n4 on t_large2(n4);
alter session set events '10046 trace name context forever , level 8';set serveroutput on size 100000declarev_n1 number;v_v1 varchar2(512);b_n1 number;
beginfor i in 1 .. 100000 loop
b_n1 := trunc(dbms_random.value (1,10000));select count(*) into v_n1 from t_large2 where n4 =b_n1;
end loop;exceptionwhen no_data_found thendbms_output.put_line (b_n1);
end;/

©OraInternals Riyaj Shamsudeen 74
Result – Single threadSELECT COUNT(*) FROM T_LARGE2 WHERE N4 =:B1
call count cpu elapsed disk query current rows------- ------ -------- ---------- ---------- ---------- ---------- ----------Parse 1 0.00 0.00 0 0 0 0Execute 100000 2.87 2.93 2 2 0 0Fetch 100000 1.86 2.03 78 200746 0 100000------- ------ -------- ---------- ---------- ---------- ---------- ----------total 200001 4.73 4.97 80 200748 0 100000
Rows Row Source Operation------- ---------------------------------------------------100000 SORT AGGREGATE (cr=200746 pr=78 pw=0 time=2854389 us)�100000 BITMAP CONVERSION COUNT (cr=200746 pr=78 pw=0 time=1766444 us)�

©OraInternals Riyaj Shamsudeen 75
Result – From two nodesSELECT COUNT(*)�FROMT_LARGE2 WHERE N4 =:B1
call count cpu elapsed disk query current rows------- ------ -------- ---------- ---------- ---------- ---------- ----------Parse 1 0.00 0.01 0 0 0 0Execute 100000 2.82 2.95 0 2 0 0Fetch 100000 1.90 1.94 3 200753 0 100000------- ------ -------- ---------- ---------- ---------- ---------- ----------total 200001 4.73 4.90 3 200755 0 100000
Misses in library cache during parse: 1

©OraInternals Riyaj Shamsudeen 76
References
� Oracle support site. Metalink.oracle.com. Various documents� Internal’s guru Steve Adam’s websitewww.ixora.com.au� Jonathan Lewis’ websitewww.jlcomp.daemon.co.uk� Julian Dyke’s websitewww.julian-dyke.com� ‘Oracle8i Internal Services for Waits, Latches, Locks, and Memory’by Steve Adams� Tom Kyte’s websiteAsktom.oracle.com