Results and discussion Fig. 3. Axial temperature distribution for the flat plate experiment.
11
Fig. 3. Axial temperature distribution for the at plate experiment. fl
-
Upload
dylan-harper -
Category
Documents
-
view
215 -
download
2
Transcript of Results and discussion Fig. 3. Axial temperature distribution for the flat plate experiment.
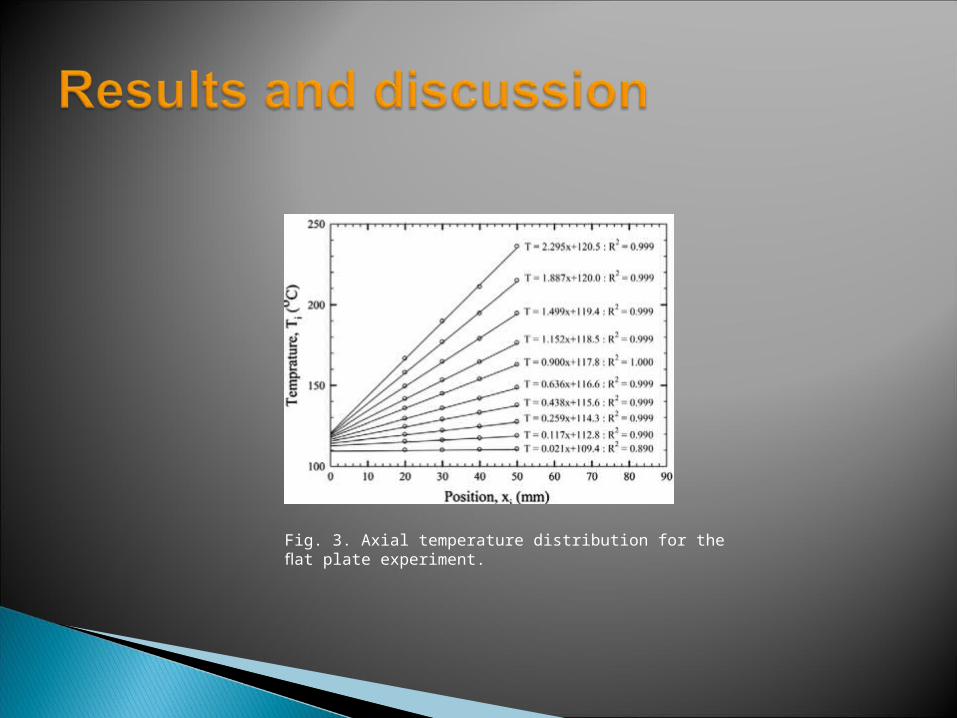
Fig. 3. Axial temperature distribution for the flat plate experiment.
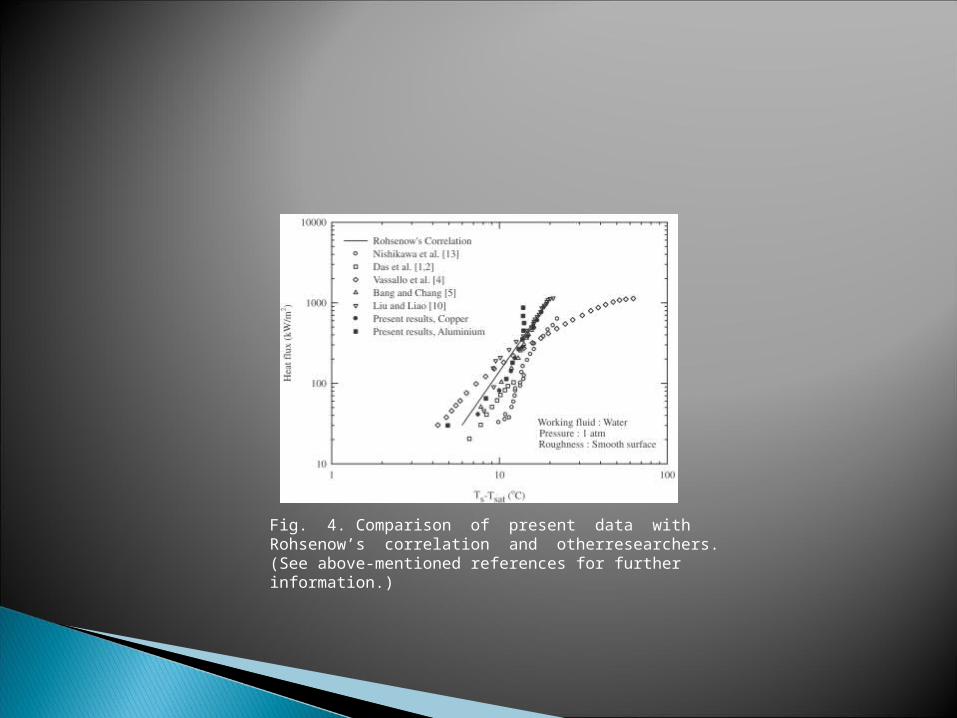
Fig. 4. Comparison of present data with Rohsenow’s correlation and otherresearchers. (See above-mentioned references for further information.)
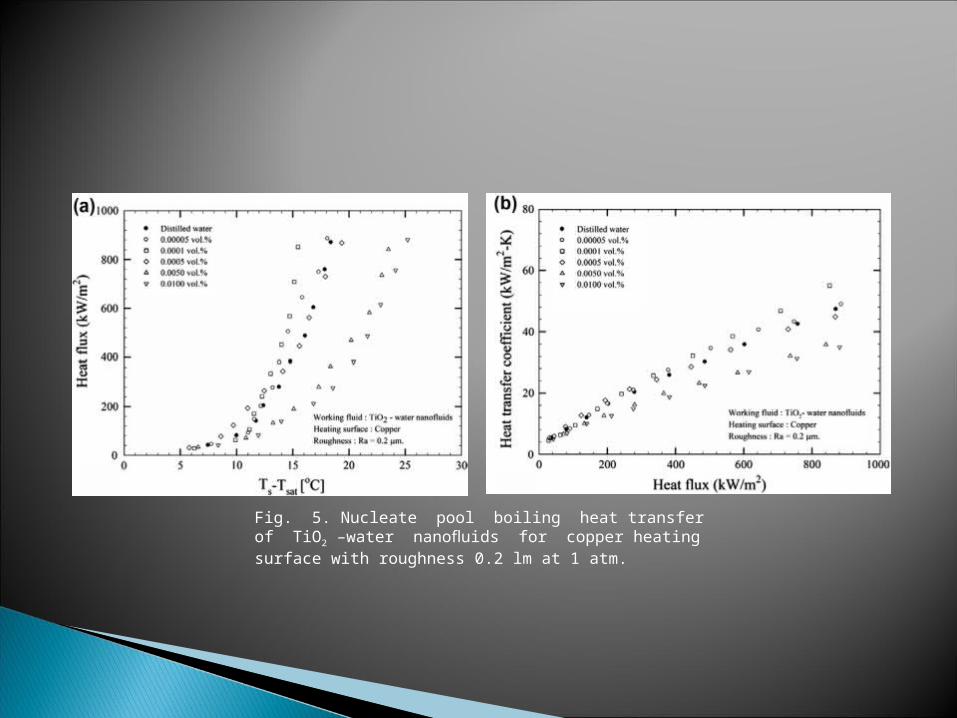
Fig. 5. Nucleate pool boiling heat transfer of TiO2 –water nanofluids for copper heating surface with roughness 0.2 lm at 1 atm.
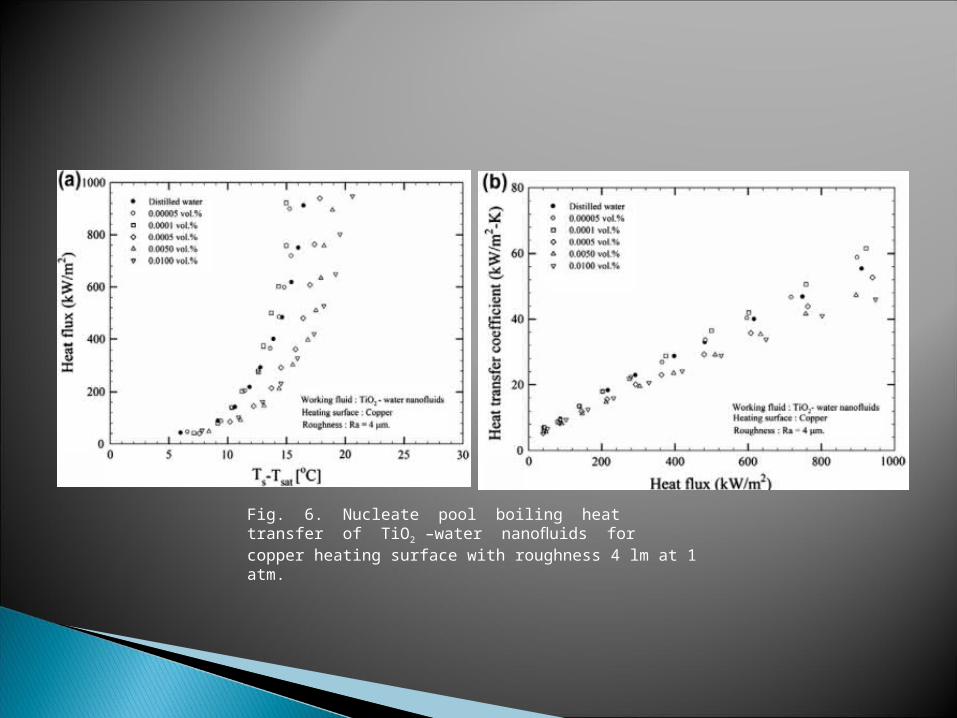
Fig. 6. Nucleate pool boiling heat transfer of TiO2 –water nanofluids for copper heating surface with roughness 4 lm at 1 atm.
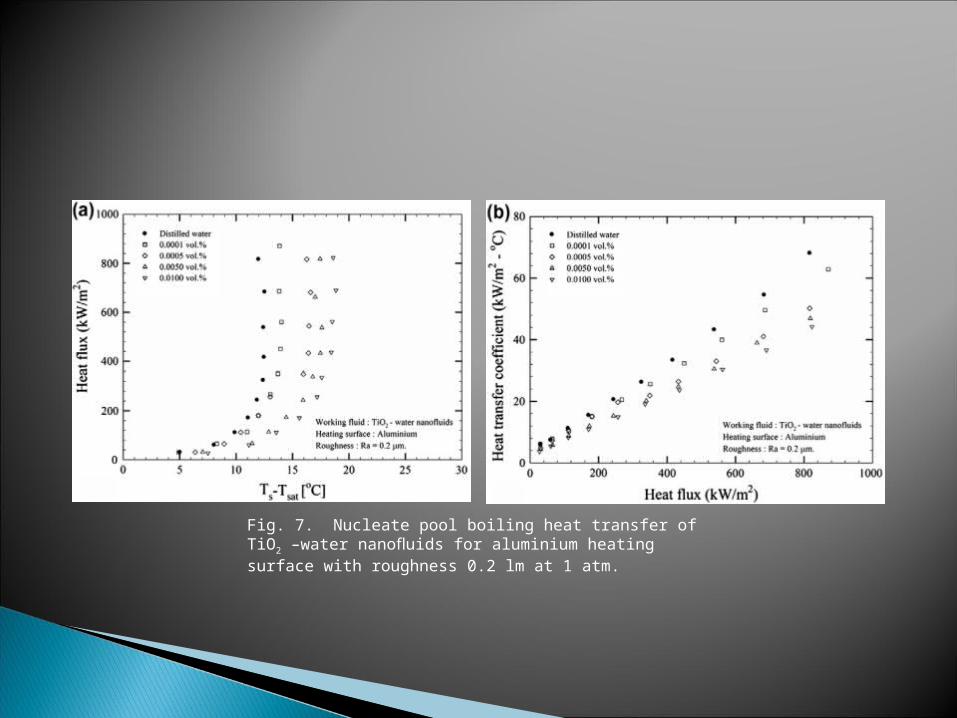
Fig. 7. Nucleate pool boiling heat transfer of TiO2 –water nanofluids for aluminium heating surface with roughness 0.2 lm at 1 atm.
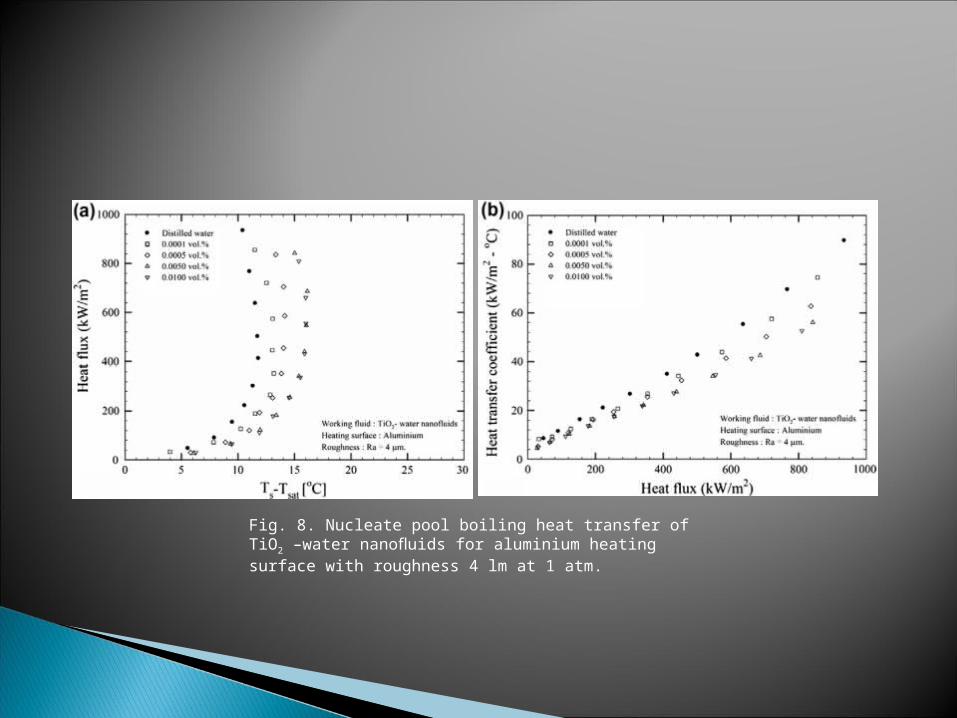
Fig. 8. Nucleate pool boiling heat transfer of TiO2 –water nanofluids for aluminium heating surface with roughness 4 lm at 1 atm.
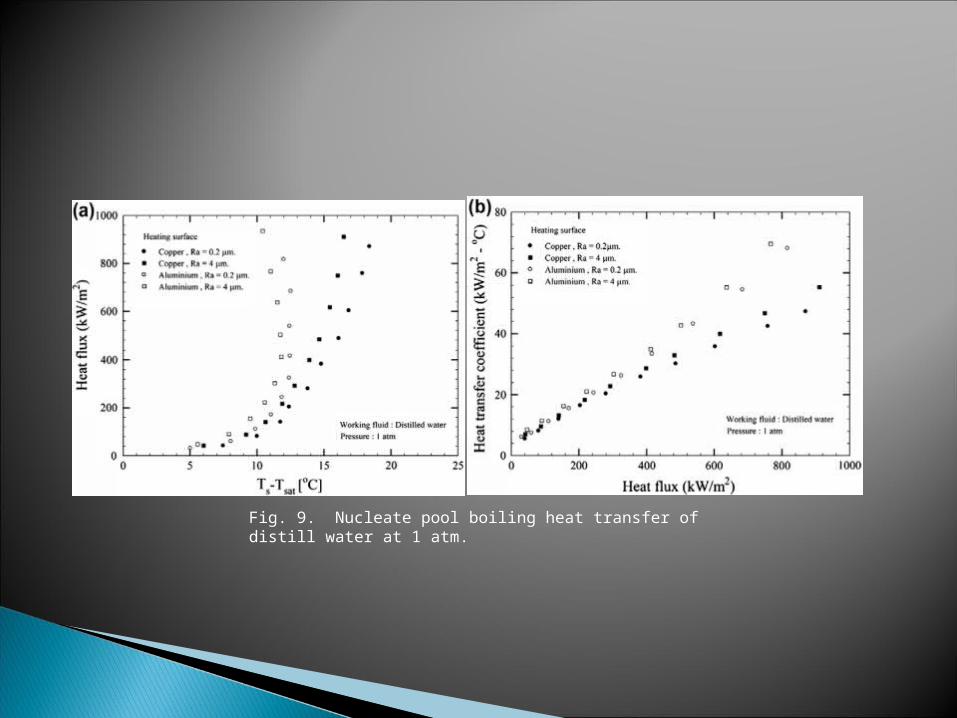
Fig. 9. Nucleate pool boiling heat transfer of distill water at 1 atm.
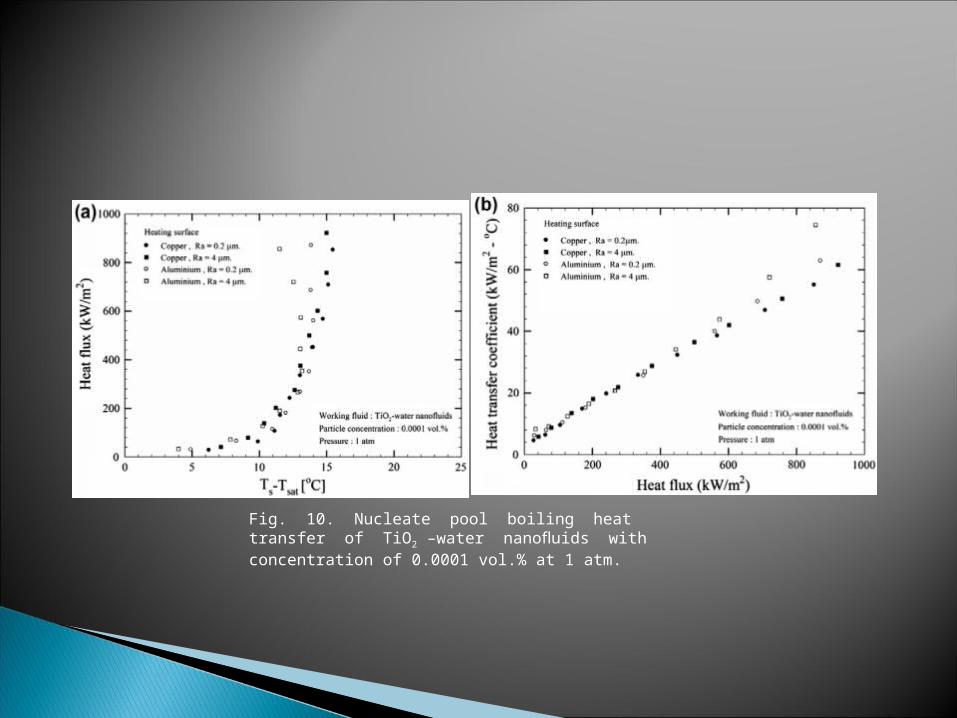
Fig. 10. Nucleate pool boiling heat transfer of TiO2 –water nanofluids with concentration of 0.0001 vol.% at 1 atm.
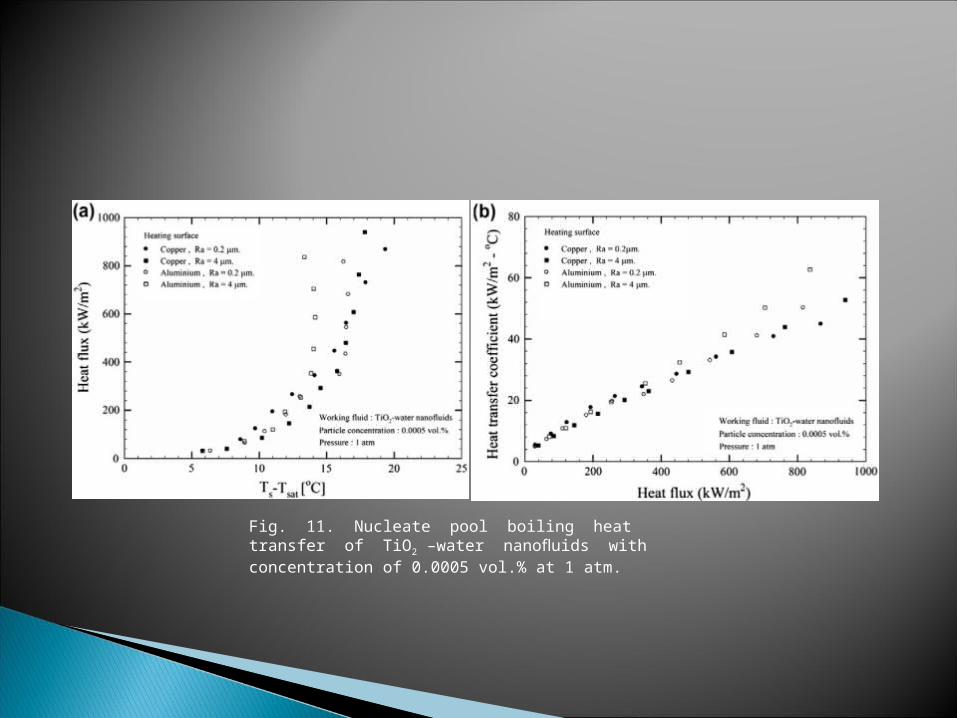
Fig. 11. Nucleate pool boiling heat transfer of TiO2 –water nanofluids with concentration of 0.0005 vol.% at 1 atm.
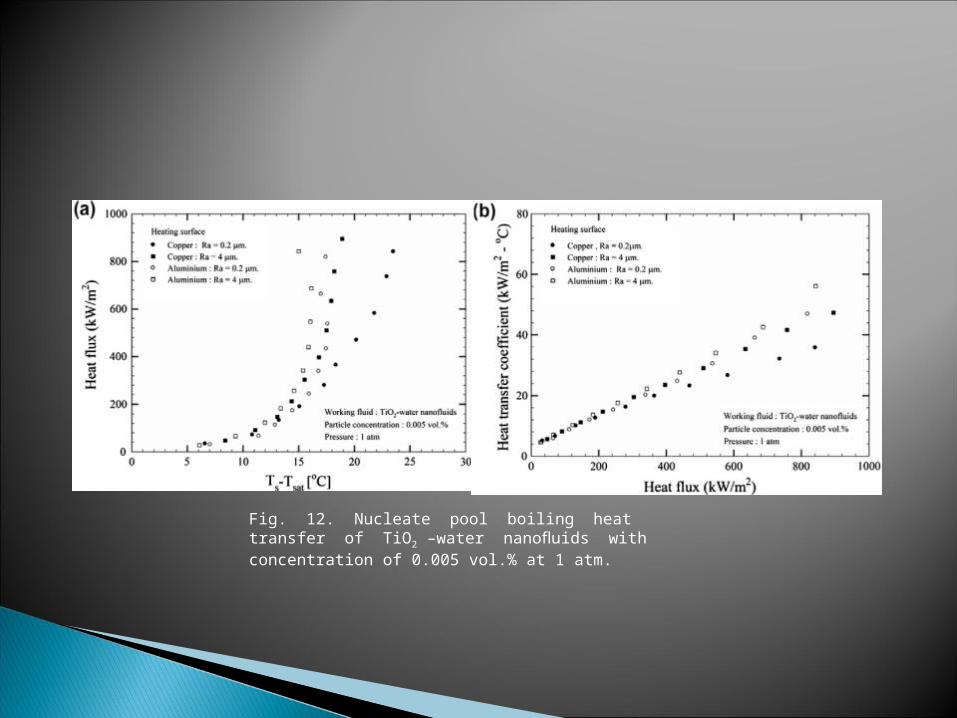
Fig. 12. Nucleate pool boiling heat transfer of TiO2 –water nanofluids with concentration of 0.005 vol.% at 1 atm.
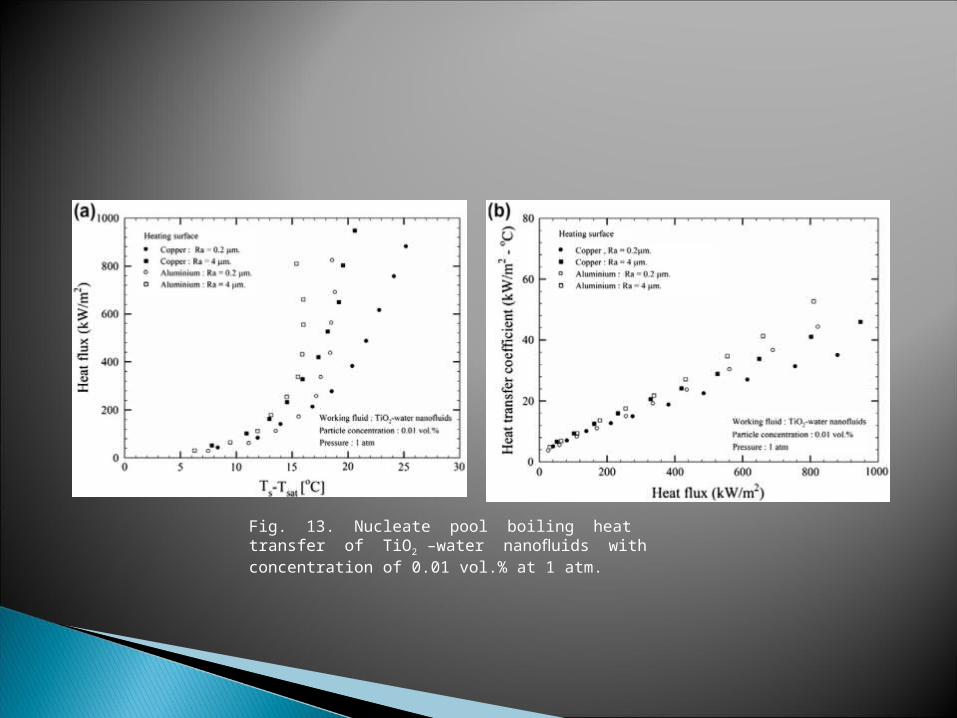
Fig. 13. Nucleate pool boiling heat transfer of TiO2 –water nanofluids with concentration of 0.01 vol.% at 1 atm.


![Foliations of asymptotically flat manifolds by surfaces of ... · Foliations of asymptotically flat manifolds using constant mean curvature surfaces have been considered in [9],](https://static.fdocuments.us/doc/165x107/5fdb240cc1f24f434c4bc542/foliations-of-asymptotically-iat-manifolds-by-surfaces-of-foliations-of-asymptotically.jpg)