Mechanics of Materials - University of Cambridge · J. Dean et al./Mechanics of Materials 65 (2013)...
11
A procedure for extracting primary and secondary creep parameters from nanoindentation data J. Dean a , A. Bradbury a , G. Aldrich-Smith b , T.W. Clyne a,⇑ a Department of Materials Science & Metallurgy, Cambridge University, Pembroke Street, Cambridge CB2 3QZ, UK b AWE, Aldermaston, Reading, Berkshire RG7 4PR, UK article info Article history: Received 14 October 2012 Received in revised form 28 January 2013 Available online 21 June 2013 Keywords: Nanoindentation Finite element analysis Creep Non-destructive testing abstract A methodology is presented for the extraction of creep parameters from nanoindentation data – i.e. data obtained from an indentation system with a high resolution displacement measuring capability. The procedure involves consideration of both primary and secondary creep regimes. The sensitivities inherent in the methodology are explored and it is con- cluded that, provided certain conditions are satisfied, it should be reasonably robust and reliable. In contrast to this, it is also shown that the methodology commonly used at pres- ent to obtain (steady state) creep parameters is in general highly unreliable; the effects responsible for this are identified. Ó 2013 Elsevier Ltd. All rights reserved. 1. Introduction The stress and strain fields within a specimen during indentation are complex, for all indenter shapes, even if it’s assumed that the material (and also the scale of the in- denter tip, the nature of any oxide film at the surface etc.) are such that it can be treated as an isotropic continuum. While the measured outputs (load–displacement-time relationships) are dependent on the constitutive relations characterising the material behaviour, inferring these rela- tions from such output data presents major challenges. In fact, provided the testing can be done under conditions such that creep has a negligible influence on the character- istics being measured, it is possible to extract both the yield stress and the (initial) work-hardening rate from experimental indentation data, using FEM modelling, in a fairly tractable and straightforward way. Dean et al. (2010a) recently presented recommendations about how to optimise these procedures, concluding that the yield stress can typically be estimated with an accuracy of around ±10% and the work hardening rate to about ±25%. This is clearly a very useful capability, which is likely to be exploited increasingly in the future. A subsequent paper (Dean et al., 2010b) explored the scope for deducing resid- ual stress levels in surface layers from indentation data, concluding that, while this can also be done (provided the yield stress is known to a high precision), the accuracy is unlikely to be better than about ±50%. In practice, creep effects often exert a strong influence on the indentation response, even when testing is carried out at ambient temperature. As an example of this influ- ence, it is common to impose a ‘dwell period’ at constant (peak) applied load, during which progressive penetration occurs. If this is not done, then the initial unloading gradi- ent is often found to be non-linear, and Young’s modulus values derived from this gradient then tend to be inaccu- rate. The dwell period is regarded as allowing creep effects (under the load concerned) to diminish until they become acceptably small. Some attempts have been made to quan- tify this. For example, Chudoba and Richter (2001) sug- gested that the period should be long enough for the depth increase occurring in one minute to be less than one percent of the current depth. In fact, there has been extensive recognition of the po- tential significance of creep during indentation, both as a factor that might complicate the extraction of plastic or elastic characteristics (Chudoba and Richter, 2001; Seltzer 0167-6636/$ - see front matter Ó 2013 Elsevier Ltd. All rights reserved. http://dx.doi.org/10.1016/j.mechmat.2013.05.014 ⇑ Corresponding author. E-mail address: [email protected] (T.W. Clyne). Mechanics of Materials 65 (2013) 124–134 Contents lists available at SciVerse ScienceDirect Mechanics of Materials journal homepage: www.elsevier.com/locate/mechmat
Transcript of Mechanics of Materials - University of Cambridge · J. Dean et al./Mechanics of Materials 65 (2013)...

Mechanics of Materials 65 (2013) 124–134
Contents lists available at SciVerse ScienceDirect
Mechanics of Materials
journal homepage: www.elsevier .com/locate /mechmat
A procedure for extracting primary and secondary creepparameters from nanoindentation data
0167-6636/$ - see front matter � 2013 Elsevier Ltd. All rights reserved.http://dx.doi.org/10.1016/j.mechmat.2013.05.014
⇑ Corresponding author.E-mail address: [email protected] (T.W. Clyne).
J. Dean a, A. Bradbury a, G. Aldrich-Smith b, T.W. Clyne a,⇑a Department of Materials Science & Metallurgy, Cambridge University, Pembroke Street, Cambridge CB2 3QZ, UKb AWE, Aldermaston, Reading, Berkshire RG7 4PR, UK
a r t i c l e i n f o
Article history:Received 14 October 2012Received in revised form 28 January 2013Available online 21 June 2013
Keywords:NanoindentationFinite element analysisCreepNon-destructive testing
a b s t r a c t
A methodology is presented for the extraction of creep parameters from nanoindentationdata – i.e. data obtained from an indentation system with a high resolution displacementmeasuring capability. The procedure involves consideration of both primary and secondarycreep regimes. The sensitivities inherent in the methodology are explored and it is con-cluded that, provided certain conditions are satisfied, it should be reasonably robust andreliable. In contrast to this, it is also shown that the methodology commonly used at pres-ent to obtain (steady state) creep parameters is in general highly unreliable; the effectsresponsible for this are identified.
� 2013 Elsevier Ltd. All rights reserved.
1. Introduction
The stress and strain fields within a specimen duringindentation are complex, for all indenter shapes, even ifit’s assumed that the material (and also the scale of the in-denter tip, the nature of any oxide film at the surface etc.)are such that it can be treated as an isotropic continuum.While the measured outputs (load–displacement-timerelationships) are dependent on the constitutive relationscharacterising the material behaviour, inferring these rela-tions from such output data presents major challenges. Infact, provided the testing can be done under conditionssuch that creep has a negligible influence on the character-istics being measured, it is possible to extract both theyield stress and the (initial) work-hardening rate fromexperimental indentation data, using FEM modelling, in afairly tractable and straightforward way. Dean et al.(2010a) recently presented recommendations about howto optimise these procedures, concluding that the yieldstress can typically be estimated with an accuracy ofaround ±10% and the work hardening rate to about ±25%.This is clearly a very useful capability, which is likely to
be exploited increasingly in the future. A subsequent paper(Dean et al., 2010b) explored the scope for deducing resid-ual stress levels in surface layers from indentation data,concluding that, while this can also be done (providedthe yield stress is known to a high precision), the accuracyis unlikely to be better than about ±50%.
In practice, creep effects often exert a strong influenceon the indentation response, even when testing is carriedout at ambient temperature. As an example of this influ-ence, it is common to impose a ‘dwell period’ at constant(peak) applied load, during which progressive penetrationoccurs. If this is not done, then the initial unloading gradi-ent is often found to be non-linear, and Young’s modulusvalues derived from this gradient then tend to be inaccu-rate. The dwell period is regarded as allowing creep effects(under the load concerned) to diminish until they becomeacceptably small. Some attempts have been made to quan-tify this. For example, Chudoba and Richter (2001) sug-gested that the period should be long enough for thedepth increase occurring in one minute to be less thanone percent of the current depth.
In fact, there has been extensive recognition of the po-tential significance of creep during indentation, both as afactor that might complicate the extraction of plastic orelastic characteristics (Chudoba and Richter, 2001; Seltzer

J. Dean et al. / Mechanics of Materials 65 (2013) 124–134 125
and Mai, 2008) and also in terms of the scope for obtainingcreep parameters from indentation data (Stone et al., 2010;Galli and Oyen, 2009; Cao, 2007). Various procedures havebeen proposed for evaluation of creep parameters. How-ever, it is fairly clear that none of them represent univer-sally robust or reliable methodologies, and several papershave highlighted this point (Goodall and Clyne, 2006; Chenet al., 2010).
A prime cause for this lack of reliability is that most pro-posed methodologies tend to focus on steady state (stage II)creep, with the assumption being (explicitly or implicitly)made that the influence of primary creep can somehow beeliminated from the measurements. Unfortunately, whilethis is easily done during conventional (uniform stress field)testing, it is virtually impossible during indentation testing,since regions of the specimen undergoing primary creep arecontinually entering the creep strain field (and influencingthe indenter displacement response). This difficulty hasbeen recognised in a general sense by some workers (Takagiet al., 2008; Stone and Elmustafa, 2008), and extensive FEMstudies have been carried out to study stress and strainfields, but the emphasis has always tended to be on the ideathat some sort of ‘‘quasi-steady state’’ does become estab-lished (fairly quickly), and that measurements yielding(stage II) creep parameters can be made in this regime.
One of the difficulties here is that a ‘‘creep indentationcurve’’ (displacement history during a constant load‘‘dwell’’) often exhibits a (short) initial transient followedby a regime of approximately constant penetration rate,which is very reminiscent of ‘‘stage II’’ in a creep strain his-tory obtained during conventional (uniform stress field)testing. However, in reality the system is not in any senseconforming to a steady state in this regime. The stress andstrain field under the indenter are continually changingand local regions are constantly moving along their owncreep strain history curves (with many regions inevitablybeing in the early – i.e. primary – part of the curve, evenafter an extended period of indentation). There is norequirement that the resultant indenter displacement his-tory should be linear at any stage, although it’s certainlypossible that it could be at least approximately linear.
If attempts are made to treat an indenter displacementhistory as if it were a creep strain history, problems immedi-ately arise with identifying a (unique) strain, and hencestrain rate, after any specified time, and also a representa-tive stress. The effective strain rate is often taken to be thepenetration rate divided by the current depth, while an‘‘equivalent’’ stress was defined by Mulhearn and Tabor(1960) as the applied load divided by the projected contactarea. However, there is really no justification whatsoeverfor representing the actual situation as if it correspondedto a uniformly loaded sample experiencing these stressesand strains, particularly since primary creep typically gener-ates much higher (and more variable) strain rates than sec-ondary creep (under the same applied stress) – i.e. thesensitivities governing creep behaviour are such that mak-ing such an assumption is likely to cause massive errors. In-deed, while there have not been many publicationsspecifically highlighting the unreliability of such proceduresfor extracting creep parameters from indentation data, mostresearchers in the field are well aware of the difficulties.
Of course, there have been reports of successful mea-surement of creep parameters via indentation. Fujiwaraand Otsuka (2001) focussed on the ‘‘steady state’’ part ofthe creep dwell curve and hence derived n (stress expo-nent) and Q (activation energy) for a eutectic Sn–Pb alloy,reporting good agreement with values obtained by con-ventional creep testing. Liu et al. (2007a) used a similar ap-proach to obtain n for Mg–Sn alloys. Liu et al. (2007) alsoreported good agreement between values of n for an Al al-loy obtained via uniaxial creep tests (between 212 MPaand 246 MPa, at 200 �C), which gave n = 5.3, and via inden-tation (at fixed loads corresponding to ‘representative’stresses between 905 MPa and 1415 MPa, also at 200 �C),which gave n = 4.9. Such agreement is surprising in viewof the large difference in stress levels between the twotypes of test, and also since a stress of 1.4 GPa would be ex-pected to induce high levels of damage in Al. Changes increep mechanism would certainly be likely if the stresswere to change over such a large range.
It’s also worth noting that, as pointed out by Goodalland Clyne (2006), most studies in which good correlationhas been reported between creep parameters obtained byindentation and by uniaxial testing were carried out onmaterials that creep rapidly at room temperature – notablyPb, Sn and In. In such materials, which exhibit very highstage II creep rates, the effects of primary creep, and thesensitivity to changes in creep mechanism, may be lesspronounced than with more creep-resistant materials.
In the present paper, a procedure is described in whichfull account is taken of the nature of the stress and strainhistories experienced by local regions under the indenter,and the consequences for its displacement characteristics.A methodology is presented for extracting creep parame-ters defining the complete (primary plus secondary) creepcurve, dependent only on a suitable functional form beingestablished for it.
2. Experimental procedures
2.1. Material
The experimental work has been conducted on OFHCextruded copper rod, in as-received form. The material isthe same as that employed in a previous study (Dean et al.,2010a), which was focussed on obtaining the yield stressand work hardening rate from indentation data. Informationis provided there about the preparation procedures, micro-structure etc. In the previous study, it was shown that moreconsistent data are obtained when the indent straddles sev-eral grains, rather than being located within a single grain,and it was therefore ensured that such ‘‘multi-grain’’ inter-rogation was being carried out in all of the tests describedhere. All tests involved compressive loading in the axial(extrusion) direction of the copper rod.
2.2. Uniaxial compression testing to obtain stress–strain data
The macroscopic stress–strain behaviour of the copperwas characterised using conventional mechanical testingprocedures. Cylinders (8 mm height, 6 mm diameter) were

126 J. Dean et al. / Mechanics of Materials 65 (2013) 124–134
compressed in the axial direction between flat platens ofsilicon carbide, under displacement control (0.1 mm s�1),using a 10 kN ESH servo-hydraulic mechanical test ma-chine. The ends were lubricated with molybdenum disul-phide, to minimise barreling. Displacements weremeasured using a Linear Variable Displacement Transducer(LVDT). For testing at elevated temperatures, specimenswere enclosed within a furnace. Yield stresses and (initial)work-hardening rates were obtained at 25 �C, 50 �C, 100 �Cand 150 �C. As can be seen in Table I, the yield stress ran-ged from 286 MPa at 298 K to 265 MPa at 423 K.
2.3. Uniaxial compression testing to obtain creep data
Macroscopic creep tests (over a range of temperatureand stress) were conducted in compression, using a cus-tomised loading arrangement. Cylinders (4 mm diameter,5 mm height), with lubricated ends, were compressed be-tween (heated) flat platens of hardened steel, using staticweights to generate the load. Displacements were mea-sured using a scanning laser extensometer, with an accu-racy of ±1 lm. These tests were carried out at 4temperatures, with stress levels ranging from 82 MPa upto 182 MPa, the latter representing a substantial propor-tion of the yield stress.
2.4. Indentation procedure
Indentation testing was carried out using a pendulum-based nanoindenter (MicroMaterials Ltd) housed in a vac-uum chamber. Tests were carried out under vacuum, usinga spherical diamond indenter (nominally 10 lm radius),with the indentation direction parallel to the extrusion axisof the copper bar, at temperatures of 25 �C, 50 �C, 100 �Cand 150 �C. Both specimen and tip were heated, in orderto minimise thermal drift – see below.
Tests were carried out with loading rates of 0.1, 0.5, 3.0,10.0, and 20.0 mN s�1 (with 3 indents made at each loadingrate), until a prescribed depth of 2 lm had been attained.The maximum load required to reach this depth is depen-dent on the material response (including its creep re-sponse). Once this depth had been reached, the load atthat point was held constant for a specified period(3600 s) – the creep dwell period – before the indenterwas retracted at an unloading rate of 20 mN s�1.
Considerable attention was paid to thermal drift, whichis potentially of some significance in creep studies, partic-ularly during extended loading (such as the 1 h dwellsused in the current work). It is, of course, important to sep-arate thermal drift effects from displacements due to spec-imen deformation (creep). On the other hand, thermal drift
Table IMeasured values of the yield stress and (initial) work-hardening rate ofcopper samples, for the four temperatures employed.
Temperature (K) Yield stress (MPa) Work hardening rate (MPa)
298 286 312323 280 235373 275 211423 265 128
measurements made using a set-up from which the speci-men had been removed could be misleading as a conse-quence of the altered thermal environment. This issuewas addressed by measuring the thermal drift rate with atungsten specimen in place, having the same dimensionsas the copper samples. The thermal conductivity of tung-sten is relatively high (about half that of Cu), so that thethermal environment would be similar in the two cases,while the tungsten is expected to be effectively immunefrom creep over the range of temperature concerned. Thethermal drift rate was measured at the highest tempera-ture (150 �C), with the applied force having been reducedto 10% of the maximum, during the unloading phase. Thedrift rate was found to be constant at �0.02 nm s-1 over aperiod of an hour, and this rate appeared to be characteris-tic of the physical set-up over the range of temperaturesemployed in the present work. All displacement data weretherefore corrected for this thermal drift, the correctionbeing relatively small, but not insignificant – particularlyfor the dwell at constant load.
The system compliance was established using high loadindentations on three reference materials, namely singlecrystal tungsten, a tool steel and fused silica. Data are pre-sented after correction for this compliance.
3. FEM modelling
3.1. Mesh formulation and boundary condition specification
An axisymmetric finite element model was built usingABAQUS commercial software. The specimen was mod-elled as a deformable body and meshed with 5625 linear
Fig. 1. Schematic illustration of how the creep strain history of a volumeelement is assumed to be composed of a series of incremental strains,each dependent on the creep curve for the stress level concerned and theprior cumulative creep strain experienced by the element.

J. Dean et al. / Mechanics of Materials 65 (2013) 124–134 127
quadrilateral (hybrid) elements (type CAX4H). The inden-ter was modelled as an analytical rigid body. The meshwas refined directly beneath the indenter, in order to im-prove the resolution in this region. A sensitivity analysisconfirmed that this mesh was sufficiently fine to achieveconvergence, numerical stability and mesh-independentresults. (The same mesh was used in an earlier paper (Deanet al., 2010a), where is it described more fully.)
Experimental displacement histories, for each of theloading rates, were specified as a boundary condition. Theload at the point when the indenter depth reached 2 lmwas an output of the modelling, dependent on the materialresponse (i.e. its yielding and creep characteristics). In a sec-
Fig. 2. Experimental creep strain data from conventional compression testing, atare corresponding modelled stage II strain rates, obtained using Eq. (2) with pa
ond set of simulations, experimental load histories, for eachof the loading rates, were specified as a boundary condition.The indenter displacement at the end of the dwell periodwas an output of the modelling, dependent on the materialresponse. The predicted displacement of the indenter duringthe creep dwell period was continuously output, for com-parison with experimental data.
If the procedure were being applied to a material withunknown creep characteristics, then the algorithm forobtaining them would consist of iterative refinement tothe creep parameters, such that optimum agreement wasreached between predicted and measured load–displace-ment-time relationships. In the present work, some
temperatures of (a) 298 K, (b) 348 K, (c) 423 K and (d) 473 K. Also shownrameter values of A = 3.79 10�8 MPa�n s�1, n = 1.47 and Q = 13.4 kJ mol�1.

128 J. Dean et al. / Mechanics of Materials 65 (2013) 124–134
iteration was employed, but this was fairly limited, anddata obtained during the conventional creep testing wereused to identify the regime of parameter values in whichthis was carried out.
3.2. Constitutive relations
3.2.1. PlasticityMeasured values of the yield stress (0.2% proof stress)
and (initial) work-hardening rate, as a function of temper-ature, are presented in Table I. Both were found to decreasewith increasing temperature in an approximately linearfashion. The constitutive plasticity relation was assumedto take the following form:
rðTÞ ¼ rYðTÞ þ kðTÞepl ð1Þ
where epl is the equivalent plastic strain and k is the work-hardening rate.
3.2.2. CreepTwo constitutive creep laws were employed. The first
was the conventional steady-state creep law, expressedas a strain rate
Fig. 3. Plots of the natural logarithm of the strain rate in stage II, asmeasured in conventional creep tests, against (a) the log of the appliedstress (in MPa) and (b) the reciprocal of the absolute temperature,showing how estimates of the stress exponent and the activation energywere obtained.
decreep
dt¼ Arnexp
�QRT
� �ð2Þ
in which A is a constant (units of s�1 MPa�n), n is the stressexponent, Q is the activation energy (J mole�1), R is the uni-versal gas constant and T is the absolute temperature. Thiswas implemented in ABAQUS using the user subroutine⁄CREEP. Values for A, n and Q were obtained from the mac-roscopic creep tests (§2.3). It was assumed that, in any vol-ume element, the creep rate given by Eq. (2), for the local(deviatoric) stress (and temperature) concerned, is instan-taneously adopted at any point during the test. (Of course,the local stress in a volume element changes continuously,in a way that is dictated by the applied load, loading geom-etry and constraint imposed by the presence of all theother volume elements.)
The second creep relationship employed was one repre-senting the complete creep strain history (primary + sec-ondary regimes), sometimes termed the Miller–Nortonlaw,
ecreep ¼Crntmþ1
mþ 1exp
�QRT
� �ð3Þ
Fig. 4. Experimental indentation data obtained at ambient temperature(T = 298 K), showing (a) load–displacement plots during both the build-up of the load and the dwell, and (b) displacement histories during thedwell, for five different loading rates during the build-up.

J. Dean et al. / Mechanics of Materials 65 (2013) 124–134 129
in which C is a constant (units of MPa�n s�(m+1)), t is thetime (s) and m is a dimensionless constant. The values ofthe parameters in this expression were obtained by itera-tive fitting to the measured uniaxial creep strain histories.The same thing was also done for the indentation test data,with the fitting being carried out in terms of the load re-quired to penetrate 2 lm, and the displacement duringthe dwell, both as a function of loading rate.
It’s important to note how Eq. (3) was applied in orderto obtain the increments of strain generated in a given vol-ume element as it experienced a changing (deviatoric)stress throughout the test. The equation can be differenti-ated with respect to time, to give
decreep
dt¼ Crntmexp
�QRT
� �
The time can thus be expressed in terms of both strain rateand strain.
t ¼decreep
dt
Crn exp �QRT
� �" #1=m
¼ ð1þmÞecreep
Crn exp �QRT
� �" #1=ð1þmÞ
Eliminating t and rearranging allows the strain rate to beexpressed as a function of the strain
decreep
dt¼ Crn exp
�QRT
� �ð1þmÞecreep� �m
� 1=ð1þmÞ
ð4Þ
The manner in which successive increments of strainwere established, as indentation continued (and the stresswithin the volume element changed) is illustrated in Fig. 1.As can be seen, it was assumed that the cumulative creepstrain defines the ‘state’ of (a volume element of) the mate-rial. The instantaneous creep strain rate was then definedby the current stress (in the volume element concerned)and the prior strain: the creep strain rate thus has no expli-cit dependence on time.
Fig. 5. Plots of the natural logarithm of the apparent strain rate in stage II,as obtained in indentation tests, against (a) the log of the ‘‘equivalent’’stress (in MPa) and (b) the reciprocal of the absolute temperature,showing how attempts were made to estimate the stress exponent andthe activation energy.
4. Steady state creep parameters from uniform stressfield testing
Experimental creep strain histories, for the tempera-tures and stress levels employed, are shown in Fig. 2. Alsoshown on these plots are the corresponding (steady state)creep strain history gradients, obtained using Eq. (2) withbest fit values of A (3.79 10�8 MPa�n s�1), n (1.47) and Q(13.4 kJ mol�1). These values of n and Q were obtained asaverage gradients of the plots shown in Fig. 3, where itcan be seen that there is a reasonable degree of internalconsistency – i.e. the data do lie on approximately straightlines, as expected. It’s a little difficult to say whether thesevalues of Q and n are of the magnitude expected. They areboth relatively low. However, it’s worth noting that thesetests were carried out at relatively low homologous tem-peratures (�0.3), where diffusion through low resistancepathways (dislocations and grain boundaries) might be ex-pected to dominate over lattice diffusion: this is certainlyexpected to give rise to a relatively low value for Q, andpossibly for n as well.
5. Creep parameters from indentation using a ‘‘steadystate’’ assumption
5.1. Indentation data
Indentation data obtained at 298 K are presented inFig. 4. Fig. 4(a) shows load–displacement curves, for sev-eral different loading rates. These curves include the dwellperiod. (The unloading portions have been removed, forclarity.) There are two noteworthy points. The first con-cerns the load required to reach the specified indentationdepth of 2 lm. This decreases with decreasing loading rate.This can be attributed to creep deformation occurring dur-ing loading (with simultaneous plasticity). The effect ismore pronounced with a low loading rate, since the timeto reach the specified depth is then longer. For instance,at 298 K, the time to reach 2 lm at 0.1 mN s�1 is�1500 s, whereas at 20 mN s�1 it only takes �8 s.
The second point to note concerns the continued pene-tration of the indenter into the specimen at constant loadduring the dwell period, shown in Fig. 4(b). This regimecorresponds to the horizontal portions in Fig. 4(a). When
130 J. Dean et al. / Mechanics of Materials 65 (2013) 124–134
the loading rate to 2 lm depth is low, the displacement ofthe indenter (during the dwell period of 1 h) is less thanthat that for higher initial loading rates. This is consistentwith there being a greater creep contribution during theloading phase at low loading rates, leading to greater relax-ation of the stresses. The driving force for continued creepduring the dwell period is thus reduced. When the 2 lmdepth was reached at low loading rates, the indenter thuscontinued to penetrate to a lesser degree than when the2 lm depth was reached at a higher loading rate.
5.2. Steady-state creep analysis
There is a commonly-employed methodology forobtaining steady-state creep parameters from indentation
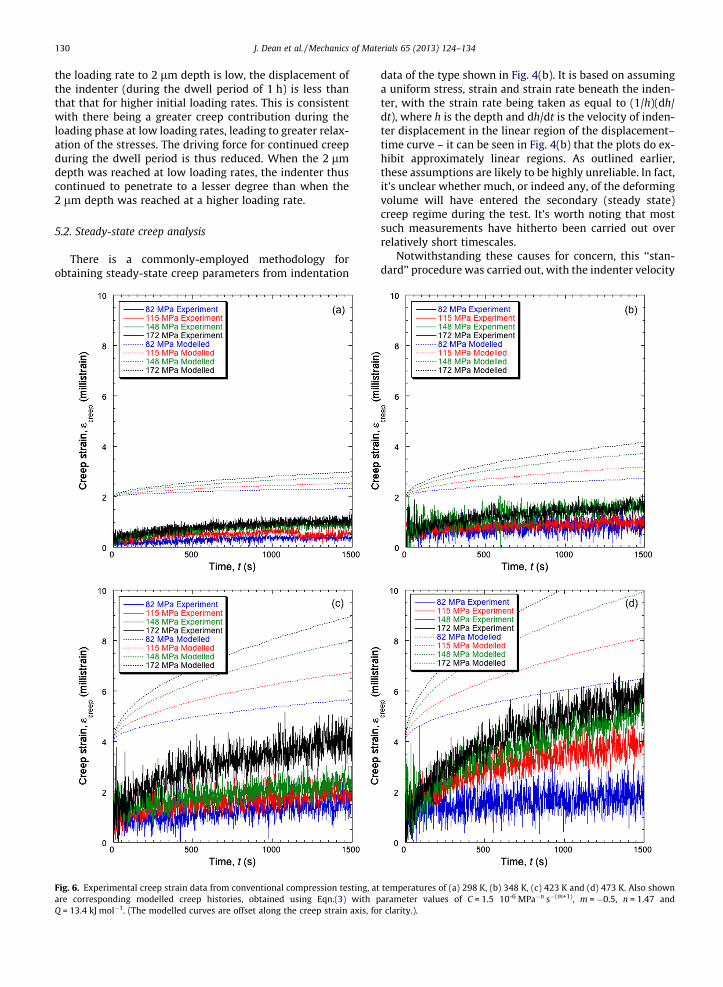
Fig. 6. Experimental creep strain data from conventional compression testing, atare corresponding modelled creep histories, obtained using Eqn.(3) with pQ = 13.4 kJ mol�1. (The modelled curves are offset along the creep strain axis, fo
data of the type shown in Fig. 4(b). It is based on assuminga uniform stress, strain and strain rate beneath the inden-ter, with the strain rate being taken as equal to (1/h)(dh/dt), where h is the depth and dh/dt is the velocity of inden-ter displacement in the linear region of the displacement–time curve – it can be seen in Fig. 4(b) that the plots do ex-hibit approximately linear regions. As outlined earlier,these assumptions are likely to be highly unreliable. In fact,it’s unclear whether much, or indeed any, of the deformingvolume will have entered the secondary (steady state)creep regime during the test. It’s worth noting that mostsuch measurements have hitherto been carried out overrelatively short timescales.
Notwithstanding these causes for concern, this ‘‘stan-dard’’ procedure was carried out, with the indenter velocity
temperatures of (a) 298 K, (b) 348 K, (c) 423 K and (d) 473 K. Also shownarameter values of C = 1.5 10-6 MPa�n s�(m+1), m = �0.5, n = 1.47 and
r clarity.).

J. Dean et al. / Mechanics of Materials 65 (2013) 124–134 131
being evaluated from the approximately linear parts of thecurves in Fig. 4(b), and applied for all loading rates, temper-atures and ‘‘equivalent stresses’’. These data are presentedin Fig. 5. It’s clear from these plots that any attempt to deter-mine the steady-state creep parameters in this way will behighly unreliable. The values obtained for n range fromabout �2 to +2, while Q values vary between �0 and6 kJ mole�1. Moreover, these values have been obtained byplotting linear fits through data that exhibit little or no cor-relation, and it’s clear that there can be no confidence at allin the procedure.
Fig. 7. Comparisons, for the four temperatures, between experimentaldata and predictions obtained using the FEM model, assuming that thesteady state creep rates shown as predicted gradients in the plots of Fig. 2applied in all volume elements throughout. The output data are: (a) theload required for the indenter to reach an initial depth of 2 lm and (b) thefurther penetration during a 1-h dwell at this load, both as a function ofthe (imposed) rate of load increase during the initial period.
6. Creep parameters from indentation under unsteadyconditions
6.1. Functional representation of the complete creep straincurve
The main source of error in the procedure of §5.2 isfairly clear. Primary creep is evidently having a stronginfluence on the observed behaviour, even after extendedperiods of indentation, and any analysis that takes no ac-count of this is likely to be highly unreliable. This is unsur-prising, since creep rates at the start of the primary regimeare typically greater than those in the steady state regimeby something like 1–2 orders of magnitude. This is illus-trated by the data in Fig. 6. For example, from the modelledplots (extrapolating beyond the times shown in Fig. 6), thecreep rate after one minute is about 25 times greater thanthat after 10 h, for m = �0.5.
In order to incorporate the effect of primary creep in acomprehensive model algorithm, a functional representa-tion is required for the complete creep strain history – orat least for the portion of interest, which would commonlyinclude the whole of the primary part of the curve and ex-tend into stage II. In the present work, this has been doneusing Eq. (3). Of course, other functional forms could beused, but all of them are likely to be more or less empiricaland the only issue of significance here is whether the ac-tual (macroscopic) behaviour of the material can be well-captured by the expression concerned, using best fit valuesof the parameters.
Fig. 6 shows the creep curves obtained by conventionalcompression testing, together with predictions from Eq. (3)for a best fit set of parameter values – these are given inthe caption. It can be seen that there is good agreementover the complete range of temperature and stress levels.Furthermore, these best fit parameter values correspondwell in the case of n and Q to those obtained in §4 as anoutcome of the analysis focussed solely on stage II behav-iour – i.e. steady state strain rates. This is helpful and ofcourse it’s certainly plausible that the activation energyand stress sensitivity could be similar in the primary andsecondary parts of a given creep strain curve. Indeed, goodagreement at longer times is only likely if the values of nand Q are similar to those obtained in the steady state anal-ysis. Nevertheless, the fact that the primary sections ofthese curves can also be well-captured using these valuesis encouraging.
6.2. Simulation of the indentation process
Progression of indentation was simulated using the FEMformulation outlined in §3, with different sets of creepparameter values. Of course, a possible approach is to as-sume that, in all volume elements, the steady state creeprate (Eq. (2)) is instantaneously adopted, correspondingto the local stress (and temperature), and is maintainedfor the duration of each time increment. This procedurethus takes account of the (changing) stress field withinthe specimen, but takes no account of primary creep (or in-deed of any effect of prior strain on the strain rate).
The outcome of such a simulation (using the steadystate creep parameter values in the caption of Fig. 2) isshown in Fig. 7, for two sets of experimental output datacorresponding to plots of the type shown in Fig. 4. Oneset concerns the load required to reach a penetration depthof 2 lm during the load increase phase and the other re-lates to the further penetration occurring by the end ofthe dwell period, with both of these being examined as a

132 J. Dean et al. / Mechanics of Materials 65 (2013) 124–134
function of the rate of load increase. (The first of these out-puts is particularly sensitive to the early part of the creepstrain history, whereas the second is expected to be moredependent on slightly later portions – although, even inthat case, the sensitivity to the initial creep rate is likelyto be quite high, since the creep strain field is continuallyexpanding.)
It can be seen in Fig. 7 that the predictions fail to cap-ture the key elements of the experimental behaviour. Inparticular, it is predicted that neither of the outputs showany sensitivity to loading rate, whereas in practice there isa relatively strong dependence, particularly at the lowerend of the range. This is clearly due to severe under-predic-tion of creep strain rates. It’s evident that this is arisingfrom neglect of primary creep. When primary creep isincorporated into the modelling, the agreement withexperiment is improved. For example, Fig. 8 shows corre-sponding plots to those of Fig. 7, with Eq. (4) being em-ployed in the FEM model, using the set of creepparameter values shown in Fig. 6. It can be seen that thesensitivity to loading rate is now reasonably well captured.
Fig. 8. Comparisons, for the four temperatures, between experimental andpredicted outputs of the same type as in Fig. 7. Predictions were obtainedusing the FEM model, with the creep behaviour represented by Eq. (4) andFig. 1, for the same set of parameter values as was used in Fig. 6 (C = 1.5 10-
6 MPa�n s�(m+1), m = �0.5, n = 1.47 and Q = 13.4 kJ mol�1).
Of course, if indentation testing were being employedto characterise the creep response in the absence of priorinformation, then an iterative process would need to becarried out (based on chosen outputs, such as those beingemployed here) and a best fit set of parameter valueswould be obtained. The procedures by which such optimi-sation could be tackled, and indeed the outputs selected forcomparison (and the functional form of the modelled creepcurve), can all be adapted to suit particular objectives andother aspects of the case concerned. In the present work,some iterative optimisation was carried out, although itwas not a comprehensive or systematic process, and itwas focussed on the stress exponent. This was done inview of the fact that Fig. 8 indicates that the predicteddependence on temperature is in good agreement withexperiment, so it appeared unnecessary to change the va-lue of Q. The outcome is shown in Fig. 9, correspondingto the set of creep parameter values shown in the caption.It can be seen that the agreement is markedly better thanin Fig. 8, although, understandably, it’s not perfect. Themost significant point to note here is that the creep
Fig. 9. Comparisons, for the four temperatures, between experimentaland predicted outputs of the same type as in Fig. 7. Predictions wereobtained using the FEM model, with the creep behaviour represented byEq. (4) and Fig. 1, for the following set of parameter values: C = 1.5 10-
6 MPa�n s�(m+1), m = �0.5, n = 1.71 and Q = 13.4 kJ mol�1.

J. Dean et al. / Mechanics of Materials 65 (2013) 124–134 133
parameters that would have been obtained via this optimi-sation are close (i.e. within�10–20%) to those derived frommacroscopic (uniform stress field) testing. This is certainlyencouraging, although it must be recognised that priorknowledge of the latter set of values inevitably had an influ-ence on the iterative optimisation process carried out withthe indentation data. It’s clear that, in order to examinethe usefulness of the procedure more rigorously, studiesshould be carried out based solely on indentation testing,involving material with completely unknown creep charac-teristics, and these are currently being instigated.
It is perhaps worth noting that, during study of creepvia indentation, not only is primary creep likely to have astrong influence on the observed behaviour, but there willalways tend to be regions (close to the indenter) in whichthe (deviatoric) stress is relatively high – i.e. close to theyield stress for the temperature concerned. Furthermore,depending on the sensitivity of the creep strain rate tostress, the measured response is likely to be quite stronglyaffected by what happens in these regions. The methodol-ogy, and indeed any methodology for the extraction ofcreep parameters from indentation data, may thereforebe rather unsuitable for study of what might be termed a‘‘low stress’’ regime of creep.
7. Conclusions
The following conclusions can be drawn from this work.
(a) Nanoindentation has been carried out on extrudedcopper samples, for periods of one hour, over a rangeof temperature (between ambient and 150 �C). Thematerial concerned has been comprehensively char-acterised in terms of plasticity and creep behaviourover this temperature range, using conventional(uniform stress field) testing procedures. This creepbehaviour, covering both primary and secondaryregimes, has been characterised using a previously-proposed functional form for the creep strain his-tory, with a best fit set of parameter values. Thefocus of the paper is to explore whether such param-eter values can be obtained solely from experimen-tal indentation data, via iterative usage of an FEMindentation model.
(b) Displacement–time plots during indentation oftenappear to enter a steady state quite quickly, such thatthe velocity becomes approximately constant. Byidentifying ‘‘effective’’ stresses, strains and strainrates within the material, and employing a similaranalysis to that applied to the steady state portionof a conventional creep curve, it is in principle possi-ble to evaluate corresponding steady state creepparameters. In practice, the procedure is known tobe unreliable and this has been highlighted byattempting to apply it to the copper indentation data,with the outcome being inconsistent and inaccurate.
(c) There are two main probable causes of the unreli-ability outlined above. Firstly, the stress and strainfields under an indenter are far from being uniformand, secondly, primary creep is likely to have a
strong influence on the observed behaviour. In orderto explore the relative importance of these twoeffects, an FEM process model was employed, withsteady state creep rates assumed to be instanta-neously adopted in all volume elements. Thisapproach thus addressed the first source of error,but not the second. Comparisons were madebetween prediction and experiment for two outputparameters – the load needed to reach a prescribeddepth and the indenter penetration during a onehour dwell with this load, both as a function of load-ing rate. The predictions failed to capture theobserved (relatively high) dependence of these out-puts on loading rate (particularly at relatively lowloading rates), and it’s therefore clear that therewas a severe under-prediction of creep rates (dueto neglect of primary creep). This illustrated theimportance of the primary creep behaviour.
(d) By using the FEM model in conjunction with an ana-lytical expression representing the complete creepcurve, in combination with an assumption that theprior strain defines the starting point on the curveconcerned within each volume element, predictionswere obtained for the above two outputs. Theseshowed fairly good agreement with experiment,using values for the creep curve parametersobtained from conventional creep testing. Betteragreement was obtained by using a slightly differentset of values and the effect of these changes gives anindication of the sensitivities involved. It is tenta-tively concluded that, for material with unknowncreep characteristics, the proposed methodologycould be used to evaluate creep parameter valueswith an estimated reliability of something like±10–20%, which is regarded as an encouraging out-come. The methodology could be refined by usingalternative functional forms for the creep straincurve, outputs for comparison and iterative proce-dures to obtain a best fit set of parameter values.The results presented here could be taken as sug-gesting that similar values of the activation energyand the stress exponent are appropriate in both pri-mary and secondary parts of the creep strain curve,at least for the copper employed in this work.
Acknowledgements
Financial support for this work has been provided byAWE.
References
Dean, J., Wheeler, J.M., Clyne, T.W., 2010a. Use of quasi-staticnanoindentation data to obtain stress-strain characteristics formetallic materials. Acta Mater. 58, 3613–3623.
Dean, J., Aldrich-Smith, G., Clyne, T.W., 2010b. Use of nanoindentation tomeasure residual stresses in surface layers. Acta Mater. 59, 2749–2761.
Chudoba, T., Richter, F., 2001. Investigation of creep behaviour under loadduring indentation experiments and its influence on hardness andmodulus results. Surf. Coat. Technol. 148, 191–198.

134 J. Dean et al. / Mechanics of Materials 65 (2013) 124–134
Seltzer, R., Mai, Y., 2008. Depth sensing indentation of linear viscoelastic-plastic solids: A simple method to determine creep compliance. Eng.Fract. Mech. 75, 4852–4862.
Stone, D., Jakes, J., Puthoff, J., Elmustafa, A., 2010. Analysis of indentationcreep. J. Mat. Res. 25, 611–621.
Galli, M., Oyen, M., 2009. Creep properties from indentation tests byanalytical and numerical techniques. Int. J. Mat. Res. 100, 954–959.
Cao, Y., 2007. Determination of the creep exponent of a power-law creepsolid using indentation tests. Mech. Time-Depend. Mater. 11, 159–172.
Goodall, R., Clyne, T.W., 2006. A critical appraisal of the extraction ofcreep parameters from nanoindentation data obtained at roomtemperature. Acta Mater. 54, 5489–5499.
Chen, W., Cheng, Y., Li, M., 2010. Indentation of power law creep solids byself-similar indenters. Mat. Sci. Eng. A 527, 5613–5618.
Takagi, H., Dao, M., Fujiwara, M., 2008. Analysis on pseudo-steadyindentation creep. Acta Mech. Solida Sin. 21, 283–288.
Stone, D., Elmustafa, A., 2008. Analysis of indentation creep. In: Proc. MRS(Fundamentals of Nanoindentation and Nanotribology IV), vol. 1049,pp. 163–68.
Mulhearn, T.O., Tabor, D., 1960. Creep and hardness of metals: a physicalstudy. J. Inst. Met. 89, 7–12.
Fujiwara, M., Otsuka, M., 2001. Indentation creep of beta-Sn and Sn–Pbeutectic alloy. Mater. Sci. Eng. A A319–321, 929–933.
Liu, H., Chen, Y., Tang, Y., Wei, S., Nuiu, G., 2007a. Tensile and indentationcreep behaviour of Mg-5%Sn and Mg-5%Sn-2%Di alloys. Mater. Sci.Eng. A 464, 124–128.
Liu, Y.J., Zhao, B., Xu, B.X., Yue, Z.F., 2007. Experimental and numericalstudy of the method to determine the creep parameters from theindentation creep testing. Mater. Sci. Eng. A 456, 103–108.