


Languages
Pages
Legal

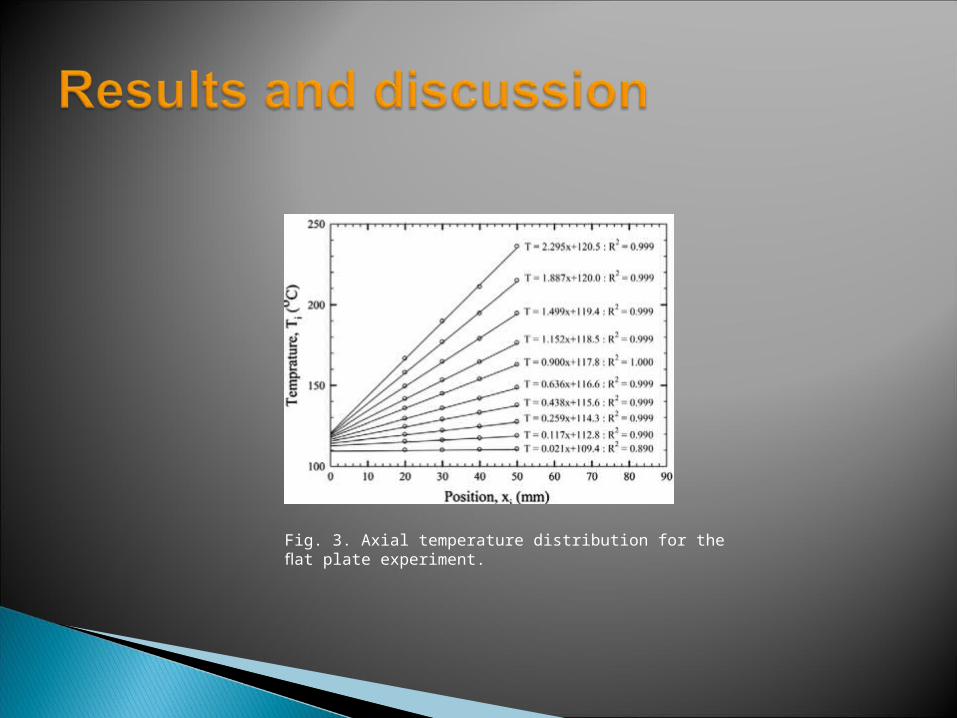
Fig. 3. Axial temperature distribution for the flat plate experiment.
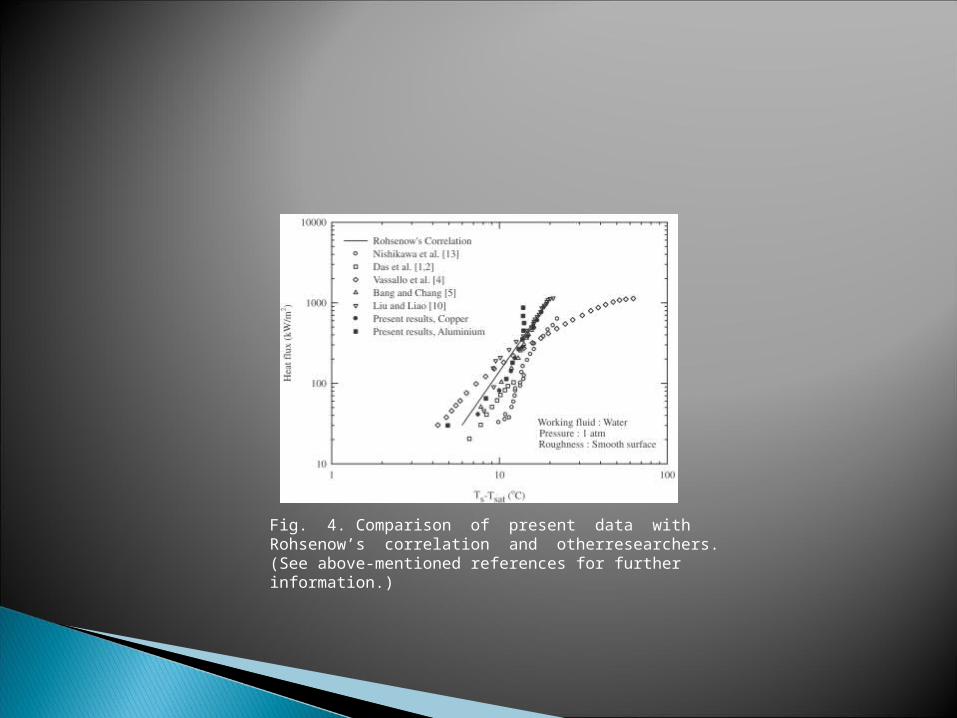
Fig. 4. Comparison of present data with Rohsenow’s correlation and otherresearchers. (See above-mentioned references for further information.)
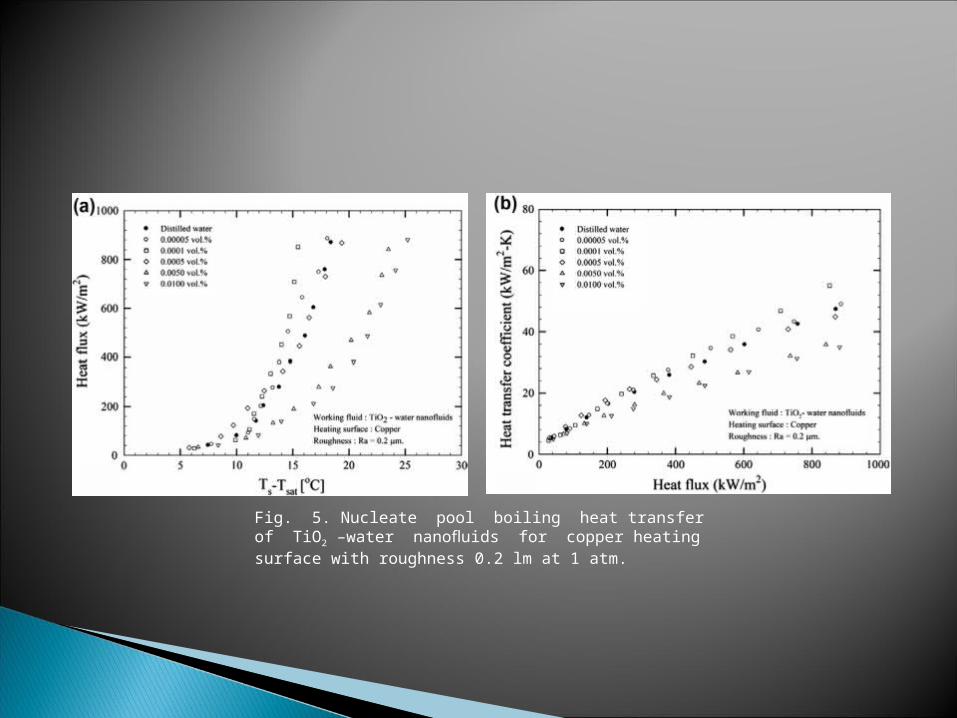
Fig. 5. Nucleate pool boiling heat transfer of TiO2 –water nanofluids for copper heating surface with roughness 0.2 lm at 1 atm.
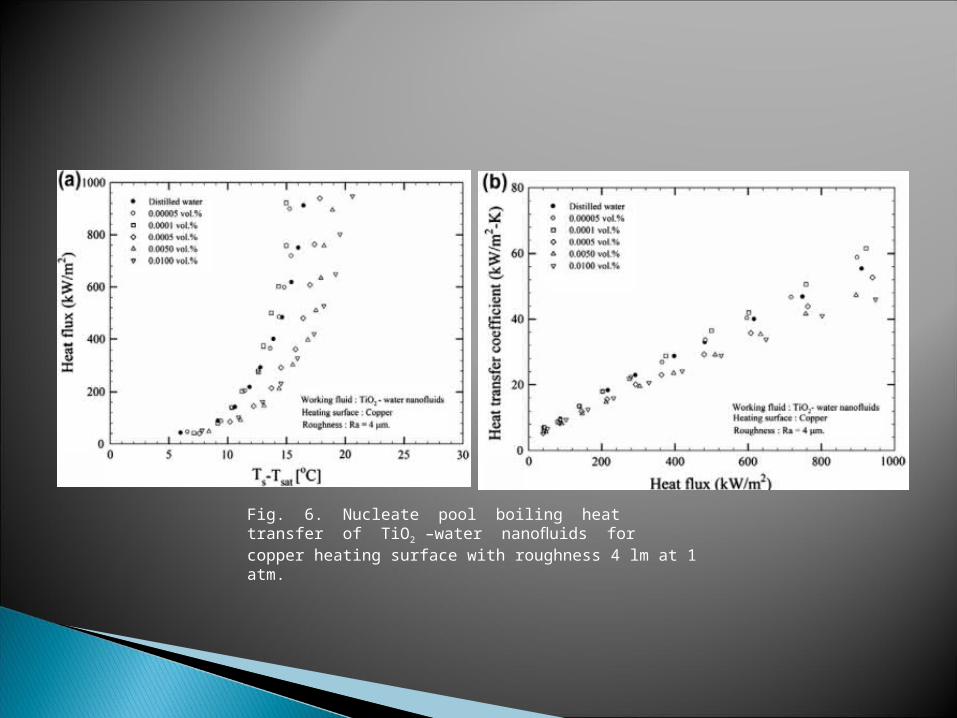
Fig. 6. Nucleate pool boiling heat transfer of TiO2 –water nanofluids for copper heating surface with roughness 4 lm at 1 atm.
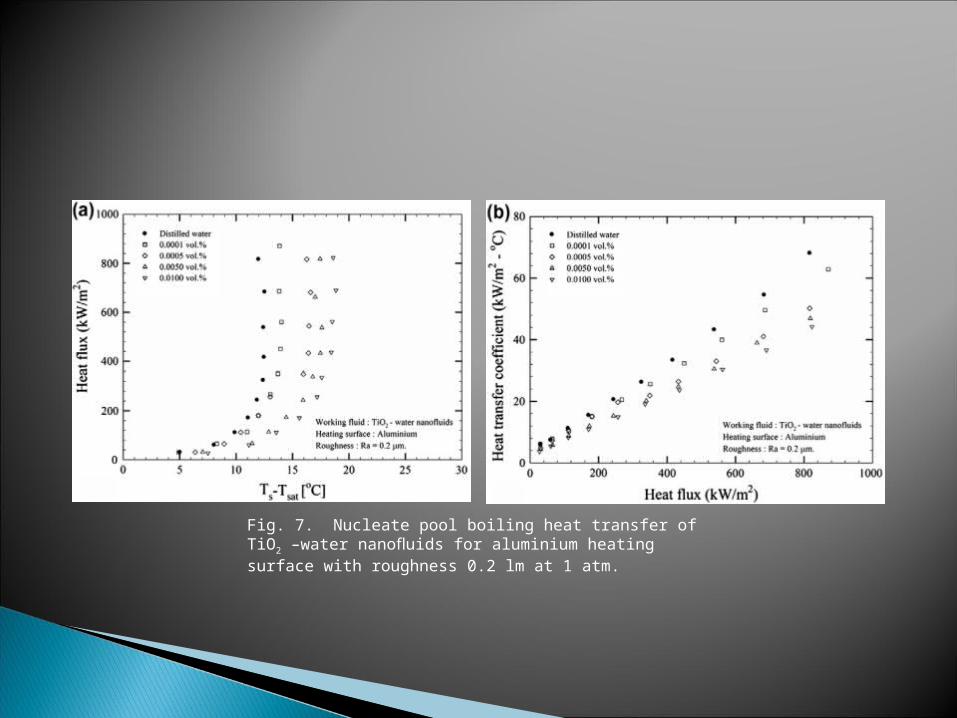
Fig. 7. Nucleate pool boiling heat transfer of TiO2 –water nanofluids for aluminium heating surface with roughness 0.2 lm at 1 atm.
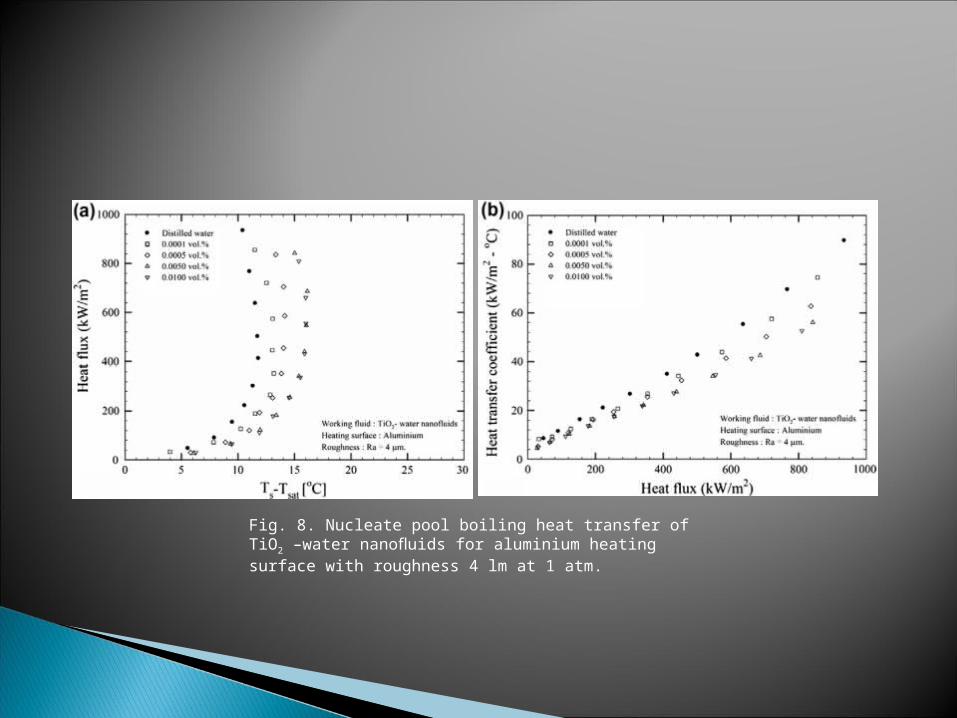
Fig. 8. Nucleate pool boiling heat transfer of TiO2 –water nanofluids for aluminium heating surface with roughness 4 lm at 1 atm.
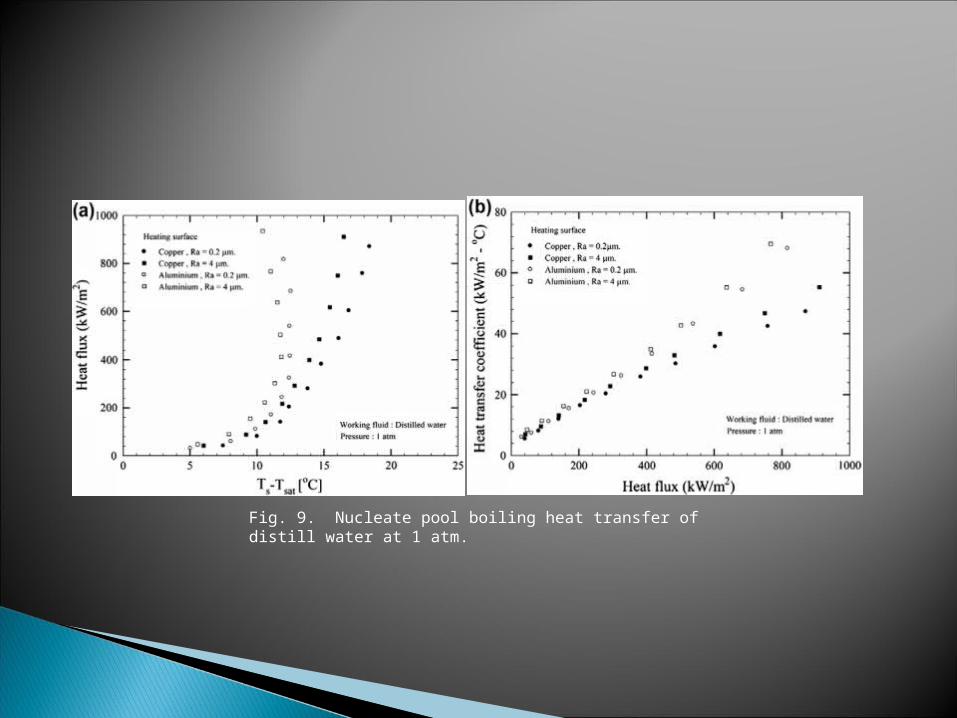
Fig. 9. Nucleate pool boiling heat transfer of distill water at 1 atm.
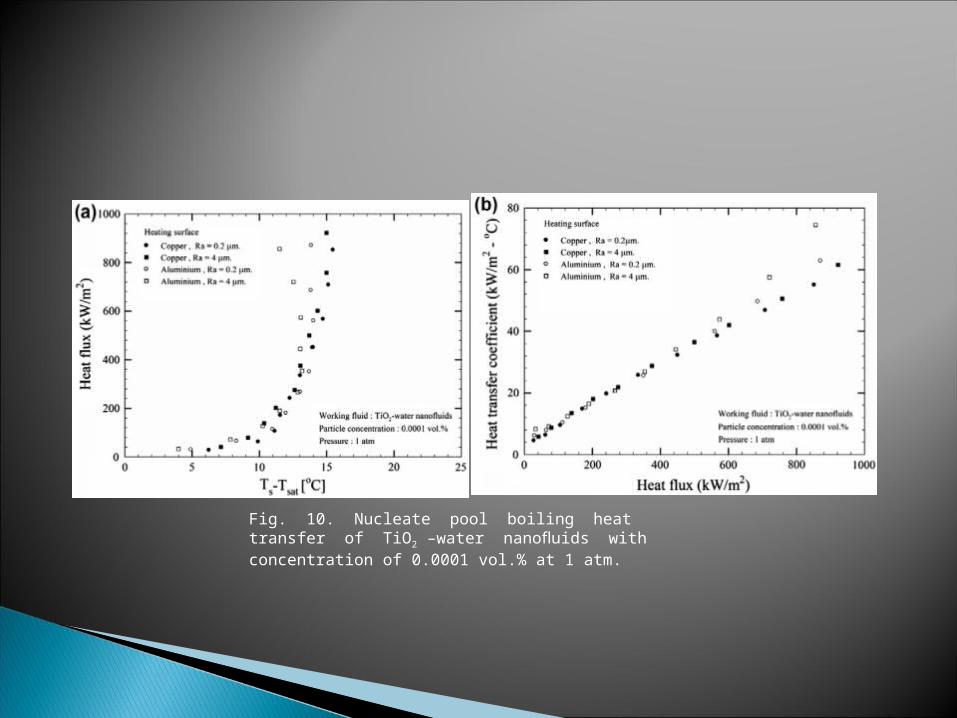
Fig. 10. Nucleate pool boiling heat transfer of TiO2 –water nanofluids with concentration of 0.0001 vol.% at 1 atm.
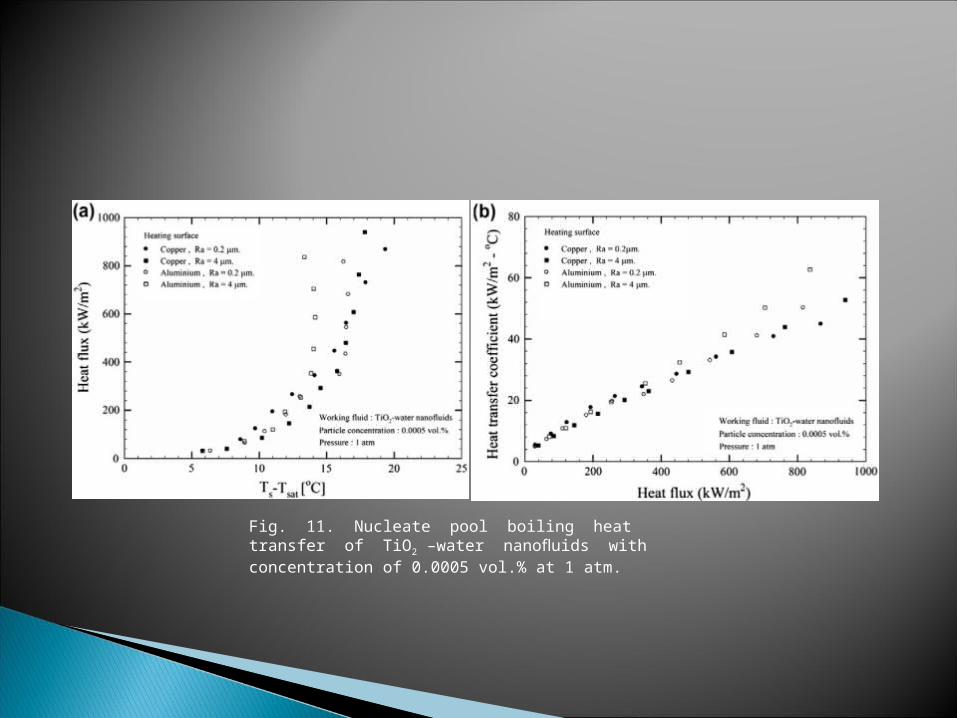
Fig. 11. Nucleate pool boiling heat transfer of TiO2 –water nanofluids with concentration of 0.0005 vol.% at 1 atm.
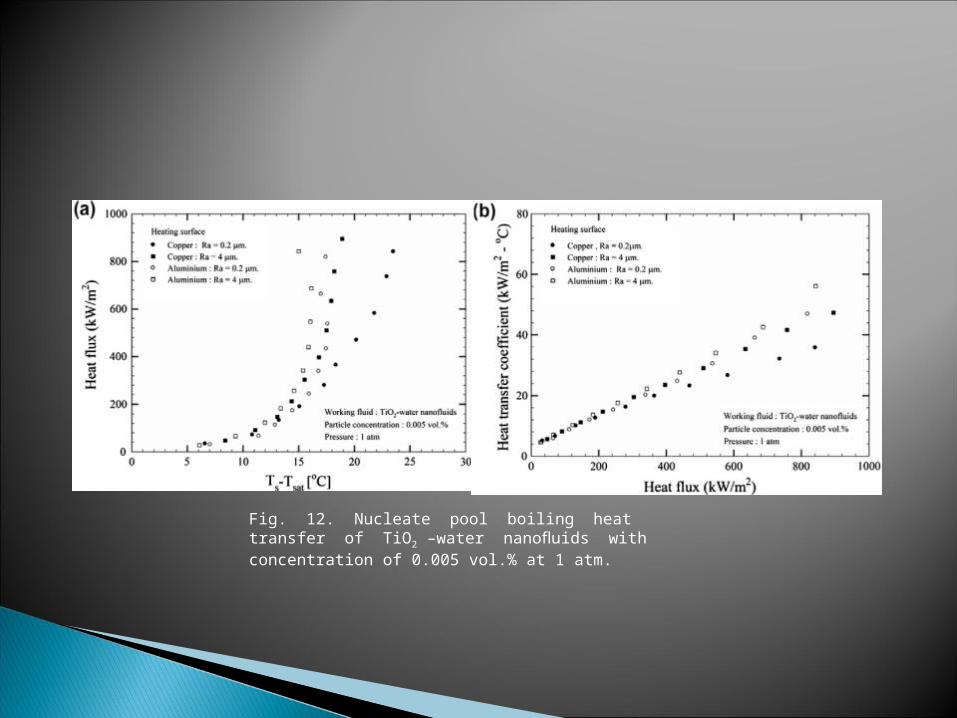
Fig. 12. Nucleate pool boiling heat transfer of TiO2 –water nanofluids with concentration of 0.005 vol.% at 1 atm.
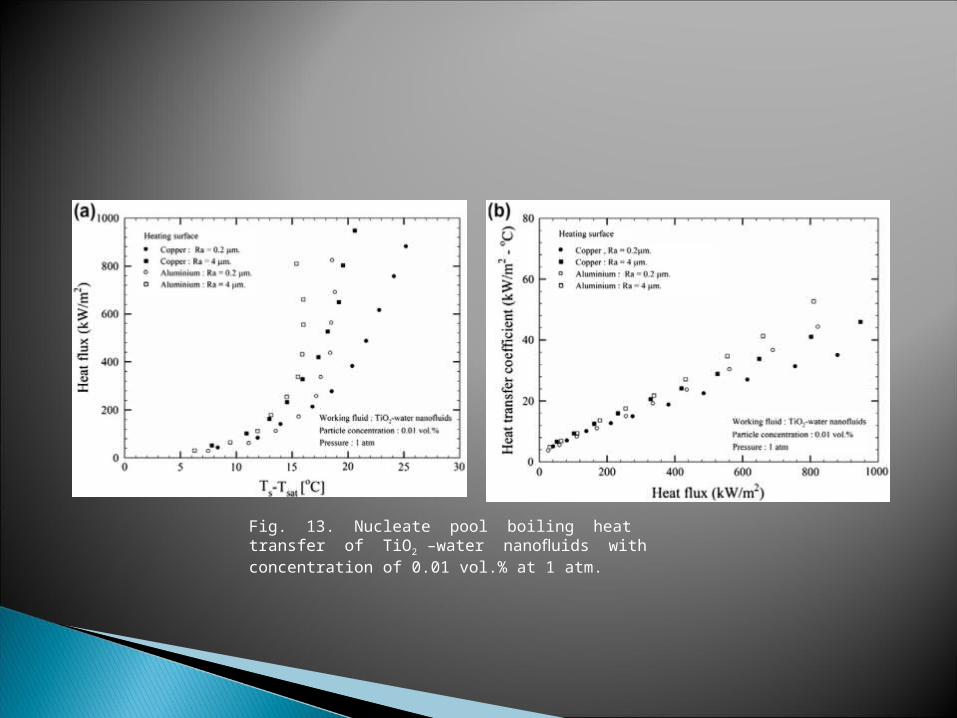
Fig. 13. Nucleate pool boiling heat transfer of TiO2 –water nanofluids with concentration of 0.01 vol.% at 1 atm.
Top Related