Report of the House Appropriations...
15
Report of the House Appropriations Subcommittee on Elementary & Secondary Education House Bill 1400
Transcript of Report of the House Appropriations...

Report of the House Appropriations
Subcommittee
on
Elementary & Secondary Education
House Bill 1400

February 2, 2003 Respectfully Submitted by the House Appropriations Subcommittee on Elementary & Secondary Education:
James H. Dillard, II, Chairman
Robert Tata
Phillip A. Hamilton
Beverly J. Sherwood
M. Kirkland Cox
John S. (Jack) Reid J. Paul Councill, Jr. Marian Van Landingham

REPORT OF THE SUBCOMMITTEE on
ELEMENTARY & SECONDARY EDUCATION Mr. Chairmen and Members of the Committee:
Once again, public education is the top priority of this Com-mittee and the House as a whole. Public education was exempted from any reductions in the introduced budget and even received ad-ditional funding. And our Subcommittee is recommending additional funding to address critical gaps in school construction and student testing in the introduced budget. Just prior to the General Assembly Session last year, the Joint Legislative Audit and Review Commission (JLARC) staff released a report that concluded the State would need to add a billion dollars in new funding to public education just to meet the costs of the current Standards of Quality (SOQ), the so called JLARC Tier 1 recommenda-tions. This Session JLARC staff provided an update that showed that the General Assembly’s actions last year addressed almost half of the Tier I deficiencies by adding $497 million in SOQ funding. Specifically, the actions taken by the General Assembly last year completely funded the routine updates to the cost model, com-pletely ended the practice of counting locally generated revenues to-ward the state share of public education, and funded the majority of the costs of administrative positions accidentally dropped from the state’s funding.

- 2 -
To address half of a billion dollar problem is quite an accom-plishment even when revenues are strong. But in the worst revenue situation in 40 years, the accomplishment was truly remarkable. But we cannot rest on our laurels, there is more to do. That is why the Subcommittee is recommending adding $16.9 million to the Standards of Quality accounts to fund the state’s share of increased costs of health insurance premiums. School divisions and school teachers have struggled with these costs which have been increasing dramatically. It is time the state did more to help pay its fair share. The source of the $16.9 million for the Health Insurance Pre-mium Supplement was the funding for the proposed Student Achievement Block grant. As you will recall, in the Governor’s pro-posal three programs would have been eliminated and used to estab-lish a new block grant. The new block grant could have been used to expand four other existing programs. The Subcommittee believes that instead of expanding programs and adding a new incentive account, the money should be used for our basic responsibility – adequately funding the Standards of Quality. School divisions will receive not one dime less than they would have received under the introduced budget from this action. The distribution of these funds will remain the same as the distri-bution under the old programs. The Subcommittee is also proud of another major achieve-ment. The introduced budget proposed eliminating $20.0 million we had set aside last year for an interest rate subsidy program. This funding, given today’s favorable interest rates, could have meant that $200 million in school construction projects would be off the Literary Fund waiting list. It concerned the Subcommittee to see this funding eliminated, especially at a time when localities are searching for ways to pay for new schools.

- 3 -
Therefore, the Subcommittee is recommending $12.0 million be used for a subsidy program. If interest rates remain favorable, this will mean that $120 million in school construction projects could come off the Literary Fund waiting list. This represents help for 32 school projects. The source for the majority of this funding is the global set-tlement. Since this is one-time funding, the Subcommittee felt the best use would be a one-time use, like the subsidy program. In ad-dition, several bills have been passed by the House that would in-crease revenue to the Literary Fund. We would propose that the funding be allowed to go to the Literary Fund for the subsidy. And, the actions of our General Government Subcommittee made it possible for us to add another $2.0 million in funding to the Liter-ary Fund. In addition to these two major actions, the Subcommittee is recommending restorations of two important testing initiatives pro-posed for elimination in the introduced budget. We are recom-mending $2.9 million to provide separate History tests for the 6th, 7th and 8th grades. We strongly believe that this will lead to even higher scores on the History Standards of Learning tests. In addi-tion, we are recommending restoring the $425,000 needed for the Algebra Readiness diagnostic test. It does not make much sense to us that you would eliminate the test that tells you which students need remediation through the Algebra Readiness program. To accomplish these important restorations, ones that will benefit students in all of the Commonwealth’s school divisions, the Subcommittee had to make some reductions to programs that do not go directly to our local school divisions. I now would like for Committee staff to explain the Subcom-mittee’s recommendations in more detail. I hope it will be the pleasure of the Committee to adopt our recommendations.

Budget Amendment Recommendations
2002-04 BIENNIAL TOTALGeneral Nongeneral
Amendment Fund Fund Total
ELEMENTARY & SECONDARY EDUCATION
Department of EducationRestore Separate History Tests 2,834,904 2,834,904Restore Algebra Readiness Test 425,000 425,000Balances-Teacher Certification (462,500) (462,500)Plan - Consolidating Deaf/Blind Services Language LanguageSpeech-Language Pathologist Caseloads Language LanguageFederal Funding Increases: Teacher Quality Enhancement Grant 1,100,000 1,100,000 Title VI-A 8,200,000 8,200,000 Title II-A 2,000,000 2,000,000 Title II-D 550,000 550,000 Title IV-B 460,000 460,000 Title IV-A 2,000,000 2,000,000 IDEA - Special Education 979,085 979,085
=========== =========== ===========Subtotal Department 2,797,404 15,289,085 18,086,489
Direct Aid to Public EducationRestore GF for Teacher Retirement 8,000,000 (8,000,000) 0Restore $12 M Subsidy for Construction Language LanguageMove Grant to SOQ for Health Insurance Language LanguageEliminate Other Accounts: Project Discovery (849,060) (849,060) Small School Division Grants (400,000) (400,000) SW Education Consortium (209,950) (209,950) Migrant Education (300,000) (300,000) Southside Regional Consortium (182,750) (182,750) William King Arts Center (97,750) (97,750) Western Consortium (63,750) (63,750)Technical: Census Count Correction (4,177,955) (4,177,955) Sales Tax Increase/Basic Aid Offset 1,985,562 1,985,562Balances: State Operated Programs (449,810) (449,810) K-3 Reduced Class Size (69,735) (69,735) At-risk Four-Year-Olds (24,306) (24,306) Early Reading (48,635) (48,635)Participation Updates: At-risk Four-Year-Olds - Warren 94,031 94,031 Summer School - Winchester 78,331 78,331 Special Ed Homebound - Washington 49,625 49,625 Gov. School for Isle of Wight 19,542 19,542
A-1

Budget Amendment Recommendations
2002-04 BIENNIAL TOTALGeneral Nongeneral
Amendment Fund Fund Total
Gov. School for James City/Wmburg 4,232 4,232SOL Remediation: Accountability Language LanguageFederal Funding Increases: Title III-A 4,000,000 4,000,000
Direct Aid to Public Education (continued)
Title II-A 50,200,000 50,200,000 Title II-D 10,100,000 10,100,000 Title IV-B 8,750,000 8,750,000 IDEA - Special Education Grant 18,000,000 18,000,000
TransfersGlobal Settlement Language Language
=========== =========== ===========Subtotal Direct Aid 3,357,622 83,050,000 86,407,622
TOTAL HB1400 6,155,026 98,339,085 104,494,111
A-2
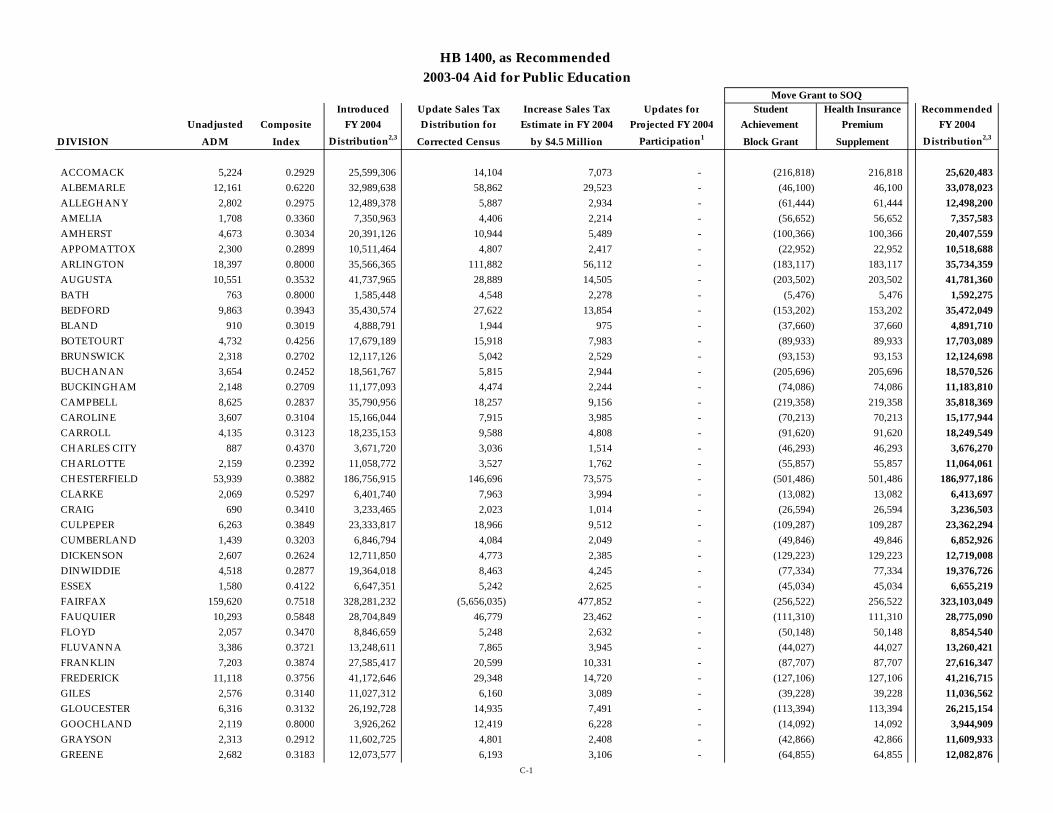
Introduced Update Sales Tax Increase Sales Tax Updates for Student Health Insurance RecommendedUnadjusted Composite FY 2004 Distribution for Estimate in FY 2004 Projected FY 2004 Achievement Premium FY 2004
DIVISION ADM Index Distribution2,3 Corrected Census by $4.5 Million Participation1 Block Grant Supplement Distribution2,3
ACCOMACK 5,224 0.2929 25,599,306 14,104 7,073 - (216,818) 216,818 25,620,483 ALBEMARLE 12,161 0.6220 32,989,638 58,862 29,523 - (46,100) 46,100 33,078,023 ALLEGHANY 2,802 0.2975 12,489,378 5,887 2,934 - (61,444) 61,444 12,498,200 AMELIA 1,708 0.3360 7,350,963 4,406 2,214 - (56,652) 56,652 7,357,583 AMHERST 4,673 0.3034 20,391,126 10,944 5,489 - (100,366) 100,366 20,407,559 APPOMATTOX 2,300 0.2899 10,511,464 4,807 2,417 - (22,952) 22,952 10,518,688 ARLINGTON 18,397 0.8000 35,566,365 111,882 56,112 - (183,117) 183,117 35,734,359 AUGUSTA 10,551 0.3532 41,737,965 28,889 14,505 - (203,502) 203,502 41,781,360 BATH 763 0.8000 1,585,448 4,548 2,278 - (5,476) 5,476 1,592,275 BEDFORD 9,863 0.3943 35,430,574 27,622 13,854 - (153,202) 153,202 35,472,049 BLAND 910 0.3019 4,888,791 1,944 975 - (37,660) 37,660 4,891,710 BOTETOURT 4,732 0.4256 17,679,189 15,918 7,983 - (89,933) 89,933 17,703,089 BRUNSWICK 2,318 0.2702 12,117,126 5,042 2,529 - (93,153) 93,153 12,124,698 BUCHANAN 3,654 0.2452 18,561,767 5,815 2,944 - (205,696) 205,696 18,570,526 BUCKINGHAM 2,148 0.2709 11,177,093 4,474 2,244 - (74,086) 74,086 11,183,810 CAMPBELL 8,625 0.2837 35,790,956 18,257 9,156 - (219,358) 219,358 35,818,369 CAROLINE 3,607 0.3104 15,166,044 7,915 3,985 - (70,213) 70,213 15,177,944 CARROLL 4,135 0.3123 18,235,153 9,588 4,808 - (91,620) 91,620 18,249,549 CHARLES CITY 887 0.4370 3,671,720 3,036 1,514 - (46,293) 46,293 3,676,270 CHARLOTTE 2,159 0.2392 11,058,772 3,527 1,762 - (55,857) 55,857 11,064,061 CHESTERFIELD 53,939 0.3882 186,756,915 146,696 73,575 - (501,486) 501,486 186,977,186 CLARKE 2,069 0.5297 6,401,740 7,963 3,994 - (13,082) 13,082 6,413,697 CRAIG 690 0.3410 3,233,465 2,023 1,014 - (26,594) 26,594 3,236,503 CULPEPER 6,263 0.3849 23,333,817 18,966 9,512 - (109,287) 109,287 23,362,294 CUMBERLAND 1,439 0.3203 6,846,794 4,084 2,049 - (49,846) 49,846 6,852,926 DICKENSON 2,607 0.2624 12,711,850 4,773 2,385 - (129,223) 129,223 12,719,008 DINWIDDIE 4,518 0.2877 19,364,018 8,463 4,245 - (77,334) 77,334 19,376,726 ESSEX 1,580 0.4122 6,647,351 5,242 2,625 - (45,034) 45,034 6,655,219 FAIRFAX 159,620 0.7518 328,281,232 (5,656,035) 477,852 - (256,522) 256,522 323,103,049 FAUQUIER 10,293 0.5848 28,704,849 46,779 23,462 - (111,310) 111,310 28,775,090 FLOYD 2,057 0.3470 8,846,659 5,248 2,632 - (50,148) 50,148 8,854,540 FLUVANNA 3,386 0.3721 13,248,611 7,865 3,945 - (44,027) 44,027 13,260,421 FRANKLIN 7,203 0.3874 27,585,417 20,599 10,331 - (87,707) 87,707 27,616,347 FREDERICK 11,118 0.3756 41,172,646 29,348 14,720 - (127,106) 127,106 41,216,715 GILES 2,576 0.3140 11,027,312 6,160 3,089 - (39,228) 39,228 11,036,562 GLOUCESTER 6,316 0.3132 26,192,728 14,935 7,491 - (113,394) 113,394 26,215,154 GOOCHLAND 2,119 0.8000 3,926,262 12,419 6,228 - (14,092) 14,092 3,944,909 GRAYSON 2,313 0.2912 11,602,725 4,801 2,408 - (42,866) 42,866 11,609,933 GREENE 2,682 0.3183 12,073,577 6,193 3,106 - (64,855) 64,855 12,082,876
HB 1400, as Recommended 2003-04 Aid for Public Education
Move Grant to SOQ
C-1

Introduced Update Sales Tax Increase Sales Tax Updates for Student Health Insurance RecommendedUnadjusted Composite FY 2004 Distribution for Estimate in FY 2004 Projected FY 2004 Achievement Premium FY 2004
DIVISION ADM Index Distribution2,3 Corrected Census by $4.5 Million Participation1 Block Grant Supplement Distribution2,3
HB 1400, as Recommended 2003-04 Aid for Public Education
Move Grant to SOQ
GREENSVILLE 1,695 0.2196 8,917,077 2,565 1,286 - (112,187) 112,187 8,920,928 HALIFAX 5,791 0.2380 30,263,649 10,369 5,201 - (156,877) 156,877 30,279,219 HANOVER 18,063 0.4756 54,536,452 58,611 29,397 - (120,628) 120,628 54,624,460 HENRICO 44,333 0.5113 138,212,695 169,298 84,910 - (446,442) 446,442 138,466,902 HENRY 8,123 0.2930 37,091,117 18,708 9,385 - (265,247) 265,247 37,119,210 HIGHLAND 266 0.6224 1,064,136 1,493 747 - (10,033) 10,033 1,066,375 ISLE OF WIGHT 5,026 0.3632 19,707,738 15,039 7,543 - (100,986) 100,986 19,730,319 JAMES CITY 7,981 0.6228 19,547,788 39,073 19,597 - (6,609) 6,609 19,606,458 KING GEORGE 3,056 0.3514 11,689,950 7,632 3,828 - (20,439) 20,439 11,701,411 KING AND QUEEN 880 0.3658 4,428,777 2,482 1,244 - (40,443) 40,443 4,432,503 KING WILLIAM 1,937 0.3459 8,461,275 4,665 2,340 - (19,396) 19,396 8,468,280 LANCASTER 1,370 0.6258 3,833,698 6,732 3,371 - (30,131) 30,131 3,843,801 LEE 3,736 0.1859 21,154,536 5,163 2,603 - (155,532) 155,532 21,162,303 LOUDOUN 39,676 0.6851 88,480,552 195,119 97,861 - (157,518) 157,518 88,773,531 LOUISA 4,255 0.6086 11,763,086 20,840 10,452 - (60,349) 60,349 11,794,378 LUNENBURG 1,745 0.2481 9,224,974 3,451 1,732 - (84,548) 84,548 9,230,156 MADISON 1,773 0.4150 7,352,994 6,143 3,089 - (60,855) 60,855 7,362,226 MATHEWS 1,338 0.4786 4,911,739 4,584 2,300 - (22,659) 22,659 4,918,623 MECKLENBURG 4,928 0.3346 21,573,113 11,339 5,688 - (182,583) 182,583 21,590,140 MIDDLESEX 1,268 0.5572 4,303,151 5,744 2,887 - (24,050) 24,050 4,311,782 MONTGOMERY 9,215 0.3875 36,830,629 29,995 15,043 - (156,207) 156,207 36,875,667 NELSON 1,990 0.4831 7,295,173 8,006 4,023 - (44,291) 44,291 7,307,202 NEW KENT 2,548 0.4219 9,483,050 8,177 4,101 - (16,580) 16,580 9,495,328 NORTHAMPTON 1,984 0.3407 9,643,229 5,378 2,697 - (92,786) 92,786 9,651,304 NORTHUMBERLAND 1,421 0.5972 4,126,872 6,469 3,239 - (31,657) 31,657 4,136,580 NOTTOWAY 2,348 0.2451 12,001,211 4,498 2,230 - (62,329) 62,329 12,007,939 ORANGE 3,984 0.4221 14,740,516 13,334 6,688 - (83,418) 83,418 14,760,538 PAGE 3,580 0.2959 15,901,450 7,413 3,718 - (90,892) 90,892 15,912,581 PATRICK 2,619 0.2813 11,924,516 5,221 2,614 - (62,035) 62,035 11,932,351 PITTSYLVANIA 8,687 0.2793 39,702,096 19,251 9,657 - (290,626) 290,626 39,731,004 POWHATAN 4,005 0.3956 14,621,571 11,469 5,753 - (50,963) 50,963 14,638,793 PRINCE EDWARD 2,745 0.3108 12,604,488 6,981 3,502 - (75,682) 75,682 12,614,970 PRINCE GEORGE 6,046 0.2596 26,345,284 10,988 5,510 - (67,183) 67,183 26,361,782 PRINCE WILLIAM 61,602 0.3895 236,822,140 170,552 85,540 - (538,997) 538,997 237,078,232 PULASKI 4,985 0.3263 21,123,052 12,519 6,279 - (89,487) 89,487 21,141,850 RAPPAHANNOCK 1,051 0.7170 2,669,489 6,637 3,329 - (14,526) 14,526 2,679,455 RICHMOND 1,205 0.3455 4,902,723 2,841 1,429 - (23,728) 23,728 4,906,994 ROANOKE 14,396 0.4177 51,754,350 46,300 23,222 - (200,141) 200,141 51,823,872 ROCKBRIDGE 2,810 0.4271 10,773,817 9,097 4,563 - (57,690) 57,690 10,787,477
C-2

Introduced Update Sales Tax Increase Sales Tax Updates for Student Health Insurance RecommendedUnadjusted Composite FY 2004 Distribution for Estimate in FY 2004 Projected FY 2004 Achievement Premium FY 2004
DIVISION ADM Index Distribution2,3 Corrected Census by $4.5 Million Participation1 Block Grant Supplement Distribution2,3
HB 1400, as Recommended 2003-04 Aid for Public Education
Move Grant to SOQ
ROCKINGHAM 11,019 0.3516 43,028,789 32,119 16,109 - (202,453) 202,453 43,077,017 RUSSELL 4,130 0.2548 19,614,252 8,250 4,128 - (164,841) 164,841 19,626,631 SCOTT 3,741 0.2286 18,764,819 6,092 3,055 - (109,137) 109,137 18,773,965 SHENANDOAH 5,725 0.3825 22,136,437 16,245 8,147 - (102,913) 102,913 22,160,828 SMYTH 4,994 0.2498 24,292,929 9,564 4,797 (34,601) (70,660) 70,660 24,272,690 SOUTHAMPTON 2,743 0.2919 13,600,082 7,122 3,564 - (66,690) 66,690 13,610,768 SPOTSYLVANIA 22,534 0.3548 85,314,508 57,237 28,708 - (276,380) 276,380 85,400,453 STAFFORD 25,152 0.3296 92,326,455 56,557 28,366 - (209,147) 209,147 92,411,377 SURRY 1,090 0.8000 2,286,482 5,778 2,893 - (21,992) 21,992 2,295,153 SUSSEX 1,338 0.3003 6,491,675 2,654 1,341 - (69,509) 69,509 6,495,669 TAZEWELL 7,013 0.2678 32,786,970 13,874 6,958 - (198,412) 198,412 32,807,802 WARREN 5,325 0.3781 19,787,010 14,551 7,298 - (92,614) 92,614 19,808,860 WASHINGTON 7,108 0.3484 28,238,648 16,155 8,103 - (199,653) 199,653 28,262,907 WESTMORELAND 1,868 0.3719 7,831,720 5,776 2,887 - (46,733) 46,733 7,840,383 WISE 6,620 0.2146 32,060,142 10,115 5,076 - (270,436) 270,436 32,075,333 WYTHE 4,272 0.3125 18,524,407 9,983 4,998 - (139,391) 139,391 18,539,389 YORK 12,013 0.3792 42,600,638 31,587 15,842 - (87,283) 87,283 42,648,067 ALEXANDRIA 10,892 0.8000 22,002,171 69,310 34,762 - (171,678) 171,678 22,106,243 BRISTOL 2,293 0.3748 10,482,790 6,502 3,256 - (51,695) 51,695 10,492,548 BUENA VISTA 1,069 0.2373 5,366,329 1,825 916 - (48,124) 48,124 5,369,069 CHARLOTTESVILLE 4,171 0.5710 16,276,511 23,697 11,886 (69,202) (81,978) 81,978 16,242,892 COLONIAL HEIGHTS 2,797 0.4755 8,973,404 9,779 4,905 - (15,737) 15,737 8,988,089 COVINGTON 858 0.3407 3,923,707 2,075 1,028 - (35,033) 35,033 3,926,811 DANVILLE 7,225 0.2927 32,571,820 18,243 9,152 - (227,593) 227,593 32,599,214 FALLS CHURCH 1,885 0.8000 3,473,304 11,123 5,578 - (5,531) 5,531 3,490,006 FREDERICKSBURG 2,450 0.7011 5,990,885 12,654 6,346 - (33,092) 33,092 6,009,885 GALAX 1,333 0.3378 5,361,208 2,569 1,289 - (29,471) 29,471 5,365,066 HAMPTON 22,795 0.2613 103,362,101 50,071 25,113 4,232 (503,130) 503,130 103,441,517 HARRISONBURG 4,167 0.5286 13,543,237 15,634 7,842 - (46,535) 46,535 13,566,713 HOPEWELL 3,845 0.2496 18,041,032 7,152 3,579 - (76,670) 76,670 18,051,763 LYNCHBURG 8,743 0.3833 36,267,817 31,022 15,560 - (169,807) 169,807 36,314,399 MARTINSVILLE 2,686 0.2990 12,006,714 6,468 3,245 - (57,043) 57,043 12,016,427 NEWPORT NEWS 31,585 0.2675 140,062,209 74,021 37,126 - (547,532) 547,532 140,173,357 NORFOLK 34,071 0.2655 165,348,996 74,404 37,320 (69,202) (771,769) 771,769 165,391,518 NORTON 686 0.3435 3,066,025 1,746 870 - (29,154) 29,154 3,068,640 PETERSBURG 5,305 0.2196 27,682,015 7,123 3,632 - (132,685) 132,685 27,692,769 PORTSMOUTH 15,669 0.2164 78,175,501 23,038 11,764 - (416,684) 416,684 78,210,303 RADFORD 1,531 0.3232 6,238,198 3,197 1,595 - (32,396) 32,396 6,242,990 RICHMOND CITY 24,249 0.4456 102,728,447 96,139 48,091 (138,403) (633,132) 633,132 102,734,274
C-3

Introduced Update Sales Tax Increase Sales Tax Updates for Student Health Insurance RecommendedUnadjusted Composite FY 2004 Distribution for Estimate in FY 2004 Projected FY 2004 Achievement Premium FY 2004
DIVISION ADM Index Distribution2,3 Corrected Census by $4.5 Million Participation1 Block Grant Supplement Distribution2,3
HB 1400, as Recommended 2003-04 Aid for Public Education
Move Grant to SOQ
ROANOKE CITY 13,082 0.3949 55,650,358 39,016 19,579 - (337,773) 337,773 55,708,953 STAUNTON 2,629 0.3959 13,199,631 9,676 4,870 (103,802) (45,648) 45,648 13,110,375 SUFFOLK 13,105 0.3018 57,371,373 31,229 15,663 - (177,031) 177,031 57,418,266 VIRGINIA BEACH 75,360 0.3394 285,901,092 196,780 98,720 - (825,816) 825,816 286,196,592 WAYNESBORO 2,921 0.3651 10,992,731 8,180 4,102 - (22,194) 22,194 11,005,013 WILLIAMSBURG 723 0.8000 2,854,119 4,656 2,335 (34,601) (80,848) 80,848 2,826,508 WINCHESTER 3,509 0.5587 11,082,171 14,639 7,342 78,331 (34,976) 34,976 11,182,482 FAIRFAX CITY 2,736 0.8000 4,931,522 (127,573) 8,885 - (870) 870 4,812,833 FRANKLIN CITY 1,368 0.3173 6,836,411 3,056 1,534 - (22,813) 22,813 6,841,001 CHESAPEAKE CITY 39,643 0.3344 157,791,903 103,694 52,008 - (640,333) 640,333 157,947,605 LEXINGTON 659 0.4544 2,296,709 1,616 810 - (4,544) 4,544 2,299,135 EMPORIA 962 0.2889 4,548,764 2,083 1,047 - (3,445) 3,445 4,551,893 SALEM 3,860 0.4166 13,180,457 11,831 5,906 - (41,082) 41,082 13,198,193 BEDFORD CITY 974 0.3446 4,127,991 2,388 1,197 - (1,247) 1,247 4,131,576 POQUOSON 2,505 0.3294 9,234,026 5,567 2,792 - (17,920) 17,920 9,242,385 MANASSAS CITY 6,597 0.4109 24,880,224 21,022 10,544 - (65,999) 65,999 24,911,789 MANASSAS PARK 2,441 0.3200 11,043,964 4,924 2,469 - (34,161) 34,161 11,051,357 COLONIAL BEACH 549 0.2921 2,679,875 995 499 - (31,067) 31,067 2,681,369 WEST POINT 743 0.2823 3,376,697 1,131 578 - (19,264) 19,264 3,378,406
4,212,351,356 (2,795,474) 1,985,562 (367,247) (16,915,113) 16,915,113 4,211,174,197
3Includes VPSA Technology grants from non-general funds.
Note: This analysis includes state funds for Standards of Quality (Group I), Incentive-Based accounts (Group II), and Categorical accounts (Group 3). Federal funds are not included in this analysis. 1Updated participation reflects actual contract costs in State-operated programs, actual participation in the Early Reading initiative, to adjust payments to the Governor's Schools for students from James City County, and an adjustment to include Winchester in Summer School payments.2Estimated distributions are based on projected average daily membership (ADM) and participation rates. Final entitlements will be calculated based on actual March 31 ADM and/or final participation rates.
C-4