PXL vibration and stability 1/7/2014. Measurements of: Cooling air induced vibration of the PXL...
10
PXL vibration and stability 1/7/2014
-
Upload
clyde-daniels -
Category
Documents
-
view
213 -
download
0
Transcript of PXL vibration and stability 1/7/2014. Measurements of: Cooling air induced vibration of the PXL...

PXL vibration and stability
1/7/2014

Measurements of:
• Cooling air induced vibration of the PXL sensors as a function of air flow
• DC position change as a function of air flow• Position change between power on, warm sector and
power off cold sector

Radial sector motion measured with capacitive probe inserted through hole in PST
North half sectors populated with operating ladders. South half populated with empty sector tubes. System operated with full cooling air

Probe position 1
Probe position 2
Sector 3, ladder position out3 Sector 3, ladder position out2
Probe faces the carbon tube flat just west of the ladders
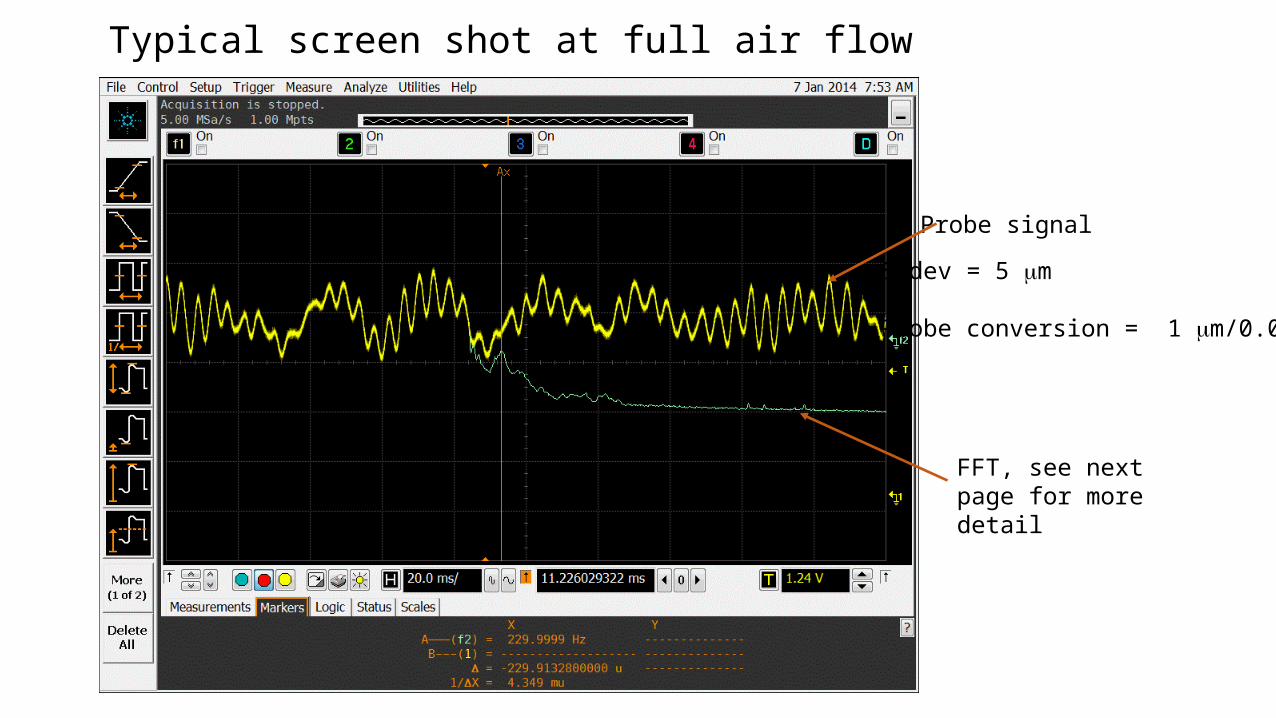
Typical screen shot at full air flow
Probe signal
FFT, see next page for more detail
Stdev = 5 m
Probe conversion = 1 m/0.04 V

Fourier transform of sector vibration
40 Hz
70 Hz
230 HzMain resonance of the carbon sector tube

Measured sector radial vibration as a function cooling air flow for position 1
More precisely this shows measured vibration as a function of blower RPM since flow has been obtained in this case by scaling linearly with RPM. It has been shown, however, that the flow does indeed scale very closely to the blower RPM.
The measured vibration with no air flowing: 35 nm RMS
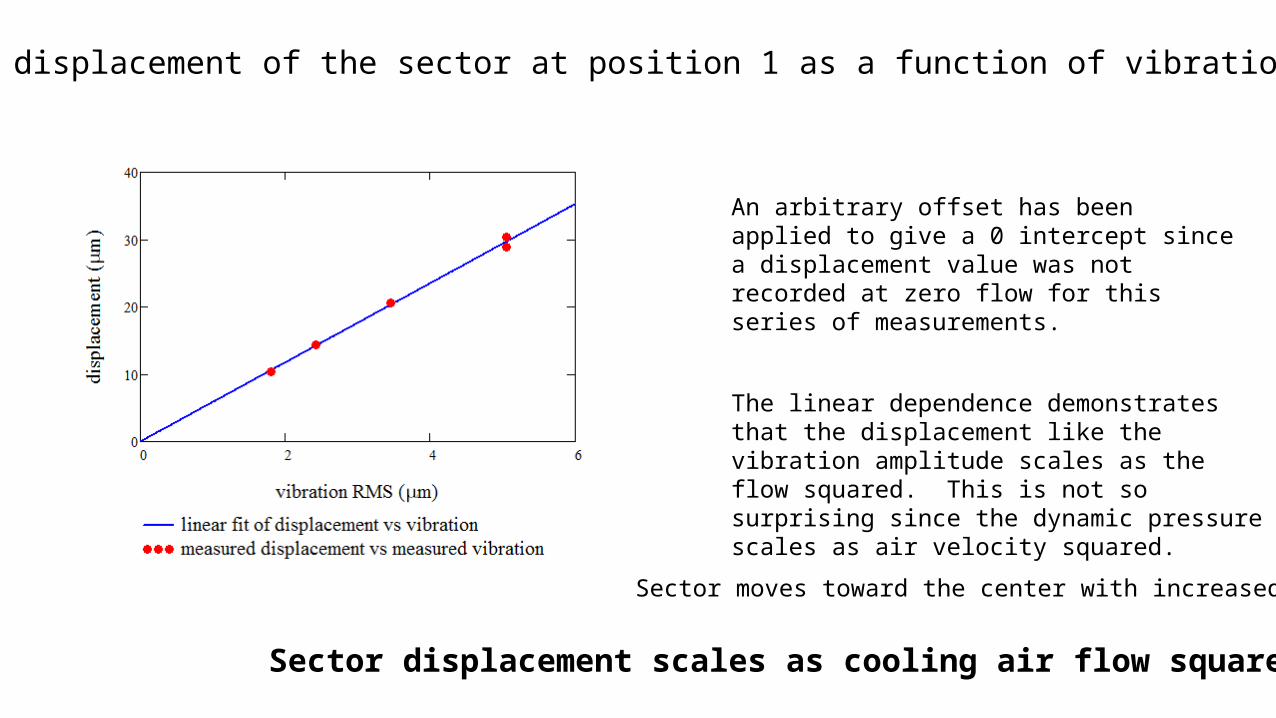
Radial displacement of the sector at position 1 as a function of vibration amplitude
An arbitrary offset has been applied to give a 0 intercept since a displacement value was not recorded at zero flow for this series of measurements.
The linear dependence demonstrates that the displacement like the vibration amplitude scales as the flow squared. This is not so surprising since the dynamic pressure scales as air velocity squared.
Sector displacement scales as cooling air flow squared.
Sector moves toward the center with increased flow.
Radial movement between power on and power off with full flow, i.e. Blower RPM = 5940
The sector end moves 3 to 8 m in toward the center when ladder power is applied.The temperature rise with power on is between 10 and 12 deg C depending where on the silicon one measures.
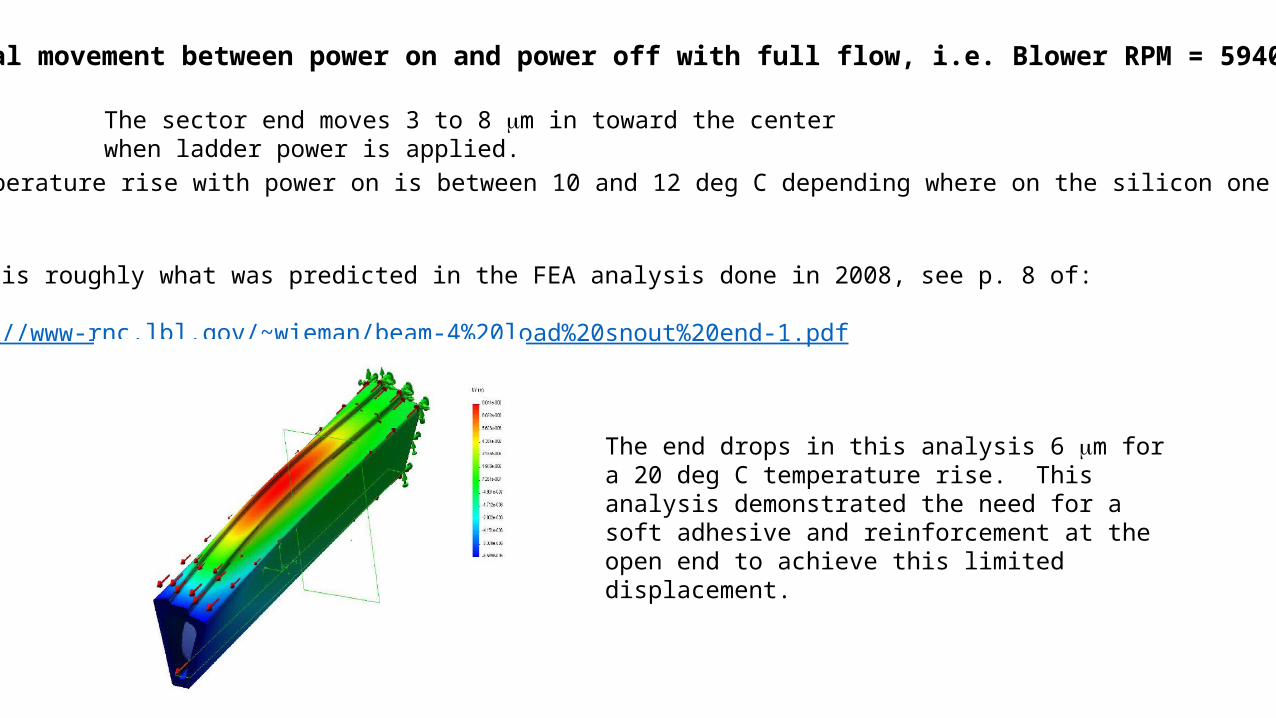
This is roughly what was predicted in the FEA analysis done in 2008, see p. 8 of:
http://www-rnc.lbl.gov/~wieman/beam-4%20load%20snout%20end-1.pdf
The end drops in this analysis 6 m for a 20 deg C temperature rise. This analysis demonstrated the need for a soft adhesive and reinforcement at the open end to achieve this limited displacement.

Summary
Sector vibration in the radial direction scales as: flow2
Sector vibration at full flow: 5 µm RMS
Sector DC displacement scales as: flow2
Sector moves in at full flow: 25 µm - 30 µm
Sector moves in when ladders powered: 3 µm - 8 µm
Sources:OneNote logbook: work>sector vibration>Vibration test full with MSCAnalysis: As>AHFT1>cHFT>m>vibration wind>vibration measured full detector.xmcd