Puma Consolidated Financial ... - PUMA® - About PUMA
166
Combined Management Report for the Financial Year 2019 • Overview 2019 • PUMA Group Essential Information ➢ Commercial Activities and Organizational Structure ➢ Targets and Strategy ➢ Product Development and Design ➢ Sourcing ➢ Employees ➢ Management System ➢ Information regarding the Non-financial Report • Economic Report ➢ General Economic Conditions ➢ Sales ➢ Regional Development ➢ Results of Operations ➢ Dividends ➢ Net Assets and Financial Position ➢ Cash Flow ➢ Statement regarding the Business Development and the Overall Situation of the Group • Comments on the German GAAP Financial Statements of PUMA SE • Further Information ➢ Information concerning Takeovers ➢ Compensation Report ➢ Corporate Governance Report including the Statement on Corporate Governance in accordance with § 289f and § 315d HGB • Risk and Opportunity Report • Outlook Combined Management Report: This report combines the Management Report of the PUMA Group and the Management Report of PUMA SE.
Transcript of Puma Consolidated Financial ... - PUMA® - About PUMA
Combined Management Report
for the Financial Year 2019
• Overview 2019
• PUMA Group Essential Information
➢ Commercial Activities and Organizational Structure
➢ Targets and Strategy
➢ Product Development and Design
➢ Sourcing
➢ Employees
➢ Management System
➢ Information regarding the Non-financial Report
• Economic Report
➢ General Economic Conditions
➢ Sales
➢ Regional Development
➢ Results of Operations
➢ Dividends
➢ Net Assets and Financial Position
➢ Cash Flow
➢ Statement regarding the Business Development and the Overall
Situation of the Group
• Comments on the German GAAP Financial Statements of PUMA SE
• Further Information
➢ Information concerning Takeovers
➢ Compensation Report
➢ Corporate Governance Report including the Statement on
Corporate Governance in accordance with § 289f and § 315d HGB
• Risk and Opportunity Report
• Outlook
Combined Management Report:
This report combines the Management Report of the PUMA Group and the Management Report of PUMA SE.
2
Overview 2019
In 2019, the PUMA Group (hereinafter PUMA) continued on its path to become the fastest sports brand in
the world, by further strengthening its sports performance positioning. PUMA entered into many new
partnerships with internationally renowned football clubs and the brand increased its visibility at key sports
events globally through the numerous victories of our sponsored athletes and teams.
Our brand ambassadors Selena Gomez and Cara Delevingne created new Sportstyle collections that made
waves on the catwalks and in the streets. We also opened our flagship store in New York City and even
entered the virtual world of esports. All of this strengthened the PUMA brand and helped us live up to our
vision of being “Forever Faster”.
In our sports performance business, the year started with a bang, as we announced our partnership with
Manchester City in February. This deal is PUMA’s largest ever, both in terms of scope and ambition. We
were also excited to welcome Pep Guardiola, one of the most celebrated football managers in the world,
as a brand ambassador.
In Spain, we signed a contract with Valencia CF, one of the most respected clubs in Spanish football. We
also became the official match ball partner of Spanish football league LaLiga Santander and LaLiga 1|2|3.
This means that all goals in one of Europe’s strongest professional football leagues are now scored with
the PUMA LaLiga 1 football.
The Women’s World Cup in France was one of the highlights of the football year and firmly put women’s
football in the spotlight. During this tournament, PUMA sponsored quarter finalist Italy and a total of 78
players. To highlight our commitment to the sport, PUMA launched the latest evolution of the PUMA ONE
football boot as the „PUMA ONE Trailblazer“, exclusively worn by our leading female players. PUMA is now
in the position to have a title-contending presence in all major football leagues and with the national teams
of Egypt and Morocco joining the PUMA family in 2019, we now sponsor 12 federations.
Our PUMA teams were also successful in other team sports: Denmark took the title at the Handball World
Championships in Denmark and Germany. New Zealand won the Women’s Netball World Championships
and the Richmond Tigers were victorious in the AFL Grand Final in Australia. PUMA also played an important
role in the Rugby World Cup, with Duane Vermeulen being voted Player of the Match in the final.
The World Athletics Championships in Doha were an important event for our track and field athletes. PUMA
enjoyed a high level of visibility during the tournament by supporting a total of 115 athletes and 12 national
federations. Norwegian hurdler Karsten Warholm successfully defended his title over 400m hurdles and
was later voted European Male Athlete of the Year. During the tournament 22 medals were won by athletes
wearing PUMA.
3
PUMA also welcomed new partners in Motorsport, where we signed a long-term contract with Porsche to
become the exclusive technical partner for racing apparel and footwear. We launched a separate
collaboration with Porsche Design to create premium lifestyle products inspired by motorsports, which aim
at the higher end of the market.
Our Formula 1 teams Mercedes AMG Petronas, Scuderia Ferrari and Aston Martin Red Bull Racing once
again dominated the Formula 1 season, where PUMA further expanded its leading presence by becoming
the official trackside retail partner during F1 race weekends. Our brand ambassador Lewis Hamilton was
crowned Formula 1 Champion for the sixth time.
Making sure we also support the female champions of tomorrow, PUMA partnered with W Series, the first
racing competition for upcoming female talent in motorsport.
In our Golf category, we celebrated the 10-year anniversary with golf ambassador Rickie Fowler, one of
the most vibrant ambassadors of the brand. Our latest addition to our roster of golf players, Gary Woodland,
won the US Open in June.
Also in North America, PUMA’s first full NBA Basketball season - after our return to the sport in 2018 - saw
Toronto Raptors shooting guard Danny Green become the first PUMA athlete to win the NBA Finals since
Isiah Thomas in 1990. We launched our first basketball shoe, the CLYDE COURT, in several new colors as
well as two additional performance basketball shoes, the UPROAR and the CLYDE HARDWOOD. Both
products were highly visible on court throughout the NBA Season, the All-Star Game, the Playoffs and the
NBA Finals.
Deriving straight from the basketball court, the lifestyle shoe RALPH SAMPSON was one of our most
important footwear styles in 2019. In the “chunky”-shoe category, several new colorways and
collaborations within the RS-X-franchise continued to resonate well with our customers. Sneakers with a
bulkier appearance, often referred to as “chunky” or “dad” shoes, have been an important trend over the
past two years. The CALI franchise, presented by PUMA’s ambassador Selena Gomez, was successful within
the women’s lifestyle category.
Selena also launched her second collection with PUMA, but she was not the only women’s brand
ambassador to get creative with personal collections in 2019: Cara Delevingne teamed up with PUMA and
French luxury fashion house Balmain, while Adriana Lima presented a line of products reflecting her
experience in fitness and boxing.
As esports is becoming increasingly relevant for our consumers, PUMA announced its first-ever partnership
in virtual sports with esports team cloud9. We also created our first products to meet the needs of esports
athletes and gamers, such as an active gaming seat and active gaming socks. Through these partnerships,
we are positioning ourselves to benefit from the fast-growing gaming and esports markets. Keeping it high-
tech, our first-ever smartwatch helps athletes train, stay motivated, track goals and connect with others
while on the go.
4
On the operational side, we continued to invest in our distribution and logistical network as well as in
organizational processes. We celebrated the topping out ceremony for our new multichannel distribution
center in Geiselwind, Germany, which is expected to be operational in early 2021. In addition, PUMA North
America announced the opening of a new distribution hub just outside of Indianapolis for 2020. In August,
we opened our New York flagship store on Fifth Avenue, which provides a deeply immersive brand
experience and marks another milestone for our company.
PUMA’s net sales increased in the financial year 2019 by 16.7% currency-adjusted. In the reporting
currency, the Euro, this corresponds to an increase in sales of 18.4% from € 4,648 million in the previous
year to € 5,502 million in 2019. The increase of our brand heat and the continued focus on the improvement
of our product range significantly contributed to the sales growth. This was particularly a result of the
consistent implementation of our "Forever Faster" corporate strategy. Furthermore, we once again
demonstrated our ability to react quickly and flexibly to changes and trends in our market environment.
Despite the increase in uncertainty in the economic environment, as a result of the trade conflict between
the United States of America and China, and in connection with Brexit, PUMA was able to achieve strong
sales growth in the financial year 2019. Therefore, the currency-adjusted sales growth of around 10%
prospected in the previous Combined Management Report for 2019 and the forecast of a currency-adjusted
sales growth of around 15%, that was adjusted upwards during the year, were exceeded. As a
consequence, PUMA was able to exceed the € 5 billion sales mark for the first time in the history of the
company.
In addition to the strong sales growth, the increased gross profit margin contributed significantly to the
increase in profitability in the financial year 2019. PUMA's gross profit margin improved by 40 basis points
from 48.4% in the previous year to 48.8% in 2019. The main drivers for the development of the gross
profit margin were the product mix and the regional mix and a higher proportion of our own retail sales. A
slightly positive currency effect also contributed to the improved gross profit margin.
Other operating income and expenses in total increased in 2019 by 17.8%. The increase was mainly driven
by higher sales-related costs, including costs for logistics, and higher expenses for marketing and
investments in our own retail stores. The slightly lower increase compared to sales reflects the achieved
operating leverage and results in a decrease of our cost ratio from 41.5% in the previous year to 41.3% in
2019. The continued focus on strict control of other operating income and expenses also significantly
contributed to our improved profitability in 2019.
The operating result (EBIT) increased in the past financial year by 30.5% from € 337.4 million to € 440.2
million and was therefore above the guidance from the beginning of 2019, which had originally forecast an
operating result within a range of between € 395 million and € 415 million. We were also able to slightly
exceed the guidance, as adjusted during the year, for an operating result within a range of between € 420
million and € 430 million. The improvement in profitability is overall the result of the strong sales growth
in combination with an improved gross profit margin and a slight operating leverage. This is also reflected
in the development of consolidated net earnings and earnings per share, which increased by 40.0%
compared to the previous year. Consolidated net earnings increased from € 187.4 million in the previous
5
year to € 262.4 million, and earnings per share increased accordingly from € 1.25 in the previous year to
€ 1.76. As a result, PUMA was able to fully achieve or even slightly exceed the financial targets of the
previous financial year.
The strong business development enables the Management Board and the Supervisory Board to propose
to the Annual General Meeting on May 7, 2020, a dividend payout of € 0.50 per share for the financial year
2019. This corresponds to a payout ratio of 28.5% of net earnings and means a dividend increase of 42.8%
compared to the previous year. The dividend proposal is in accordance with PUMA's dividend policy, which
foresees a payout ratio of 25% to 35% of consolidated net earnings. In the previous year, a dividend of
€ 0.35 per share was distributed (payout ratio previous year: 27.9%).
To make PUMA more attractive for retail investors and in order to further diversify its shareholder base,
the Management Board decided in 2019 to exercise a stock split with a 1:10 ratio. The stock split was
subsequently approved by the Annual General Meeting on April 18, 2019. The stock split was carried out
on June 10, 2019. The shareholders received nine additional shares for every share held on this date. The
market price per share was accordingly adjusted at a ratio of 1:10. The PUMA share price developed very
well in 2019. At the end of the year, the share price was at € 68.35. Taking the stock split into account,
this represents an increase of 60.1% compared to the previous year’s € 42.70. The market capitalization
of the PUMA Group increased accordingly to around € 10.2 billion at year-end 2019 (previous year: € 6.4
billion).
6
PUMA Group Essential Information
Commercial Activities and Organizational Structure
PUMA SE operates as a European stock corporation with Group headquarters in Herzogenaurach, Germany.
In the internal reporting, our business activities are mapped according to three regions (EMEA, the Americas
and Asia/Pacific) and three product divisions (footwear, apparel and accessories). A detailed description
can be found in the segment reporting in chapter 26 of the Notes to the Consolidated Financial Statements.
Our revenues are derived from the sale of products from the PUMA and Cobra Golf brands via the wholesale
and retail trade, as well as from sales directly to consumers in our own retail stores and online stores. We
market and distribute our products worldwide primarily via our own subsidiaries. There are distribution
agreements in place with independent distributors in a small number of countries.
As of December 31, 2019, 101 subsidiaries were controlled directly or indirectly by PUMA SE. Our
subsidiaries carry out various tasks at the local level, such as distribution, marketing, product development,
sourcing and administration. A full list of all subsidiaries can be found in chapter 2 of the Notes to the
Consolidated Financial Statements.
7
Targets and Strategy
PUMA has continued to focus on six strategic priorities to guide it on its way to become the fastest sports
brand in the world. We focus on brand heat, a competitive product range, a leading offer for women,
improving our distribution quality and organizational speed as well as leveraging our re-entry into basketball
to strengthen our position on the North American market.
For more than 70 years, PUMA has created brand heat by partnering with the greatest athletes: Usain
Bolt, Lewis Hamilton, Pelé, Maradona, Tommie Smith, Boris Becker, Linford Christie, Serena Williams, Heike
Drechsler and Martina Navratilova, just to name a few. Today, PUMA continues to strengthen its position
as a sports brand through partnerships with some of the most elite ambassadors: the Italian national
football team, star strikers Antoine Griezmann, Romelu Lukaku, Sergio Agüero and Luis Suarez, top football
manager Pep Guardiola, international top clubs Manchester City, Borussia Dortmund, Valencia CF and AC
Milan, golf stars Lexi Thompson and Rickie Fowler, the six-time Formula 1 world champion Lewis Hamilton,
Norwegian hurdler and world champion Karsten Warholm, Canadian sprinter André De Grasse and the
Jamaican and Cuban Olympic Federations. Teaming up with the best athletes, teams and federations is key
in keeping PUMA’s brand credibility at high levels.
To connect with young, trend-setting consumers, PUMA also drives brand heat by working with icons of
culture and fashion such as Selena Gomez, Cara Delevingne and Adriana Lima. This has made PUMA one
of the hottest sports and fashion brands for young consumers.
PUMA aims to design “cool stuff that works” and in 2019, we significantly improved our product offering.
Our most important performance footwear styles included the PUMA FUTURE football boot and our running
& training shoes based on our LQD CELL and HYBRID technology platforms. In Sportstyle, our bestselling
models were the RS-X, CALI and the RALPH SAMPSON. At the end of the year, we launched the RS-X3,
CALI SPORT and the RIDER, which is inspired by one of the first jogging shoes launched in the 1980s. With
these models, we see ourselves in a good starting position for 2020. In apparel, we saw strong growth
across the portfolio, especially from “Big Cat” logo applications and motorsport apparel.
Creating a leading product offer for women remains a priority for PUMA, to capitalize on this growing
segment in the global sportswear market. More and more women take up sports worldwide and athletic
wear has long made its way into everyday outfits. “Where the gym meets the runway” continues to be the
theme for our initiatives in the women´s segment. In 2019, our best-selling sneakers for women were the
CALI, DEFY and MUSE.
Returning to basketball, with an approach that resonated well beyond the court, was an important step
towards increasing our credibility as a sports brand in North America. With the support of JAY-Z, our
Creative Director for basketball, we added the UPROAR and the CLYDE HARDWOOD as new performance
shoes to this category in 2019. We added young and highly talented NBA players to our roster such as RJ
Barrett (New York Knicks), Kyle Kuzma (Los Angeles Lakers) and Marcus Smart (Boston Celtics). While
revenues from basketball performance products are still small, as expected, we are already seeing the
benefits of being back on court, as sales of Sportstyle products and other performance categories in the
8
US have picked up. Bringing back the court-style sneaker RALPH SAMPSON from our basketball archive,
now one of our best-selling shoes in 2019, would not have been possible without re-entering basketball.
PUMA improved the quality of its distribution and expanded its presence in key sports performance and
Sportstyle accounts around the world. We continued to strengthen our relationships with key retailers by
being a flexible and service-oriented business partner. By improving sell-through, we further expanded the
shelf space given to us in our partners’ retail stores. As sell-through in wholesale improved, we expanded
our retail store network and achieved like-for-like sales growth, while registering continued strong growth
of our eCommerce business. Furthermore, PUMA upgraded its owned-and-operated retail store network
with further refurbishments. On a regional basis, the Asia/Pacific, driven by China, and Americas regions
contributed with double-digit increases, while EMEA continued to grow, despite a difficult market
environment.
Operationally, we continued to improve infrastructure, processes and systems that are required to
support our overall growth ambition. In 2019, a strong focus was put on expanding our logistical network
with the project launch of two new multi-channel distribution center initiatives, one in Geiselwind, Germany
and one outside of Indianapolis, USA – both are expected to be operational in 2020 and early 2021. Beyond
distribution center expansion, PUMA continued to focus on standardization of ERP systems and
enhancements of product development tools. This, combined with improvements of the overall IT
infrastructure, enables us a faster and better communication and information exchange. PUMA’s global
trading entity (PUMA International Trading GmbH - PIT), which manages global order and invoice flows
centrally, has extended its scope in order to support streamlining transactional processes and ensuring
faster lead times for growing markets and allowing us to come one step closer to our mantra of being
“Forever Faster”. In sourcing, the long-term collaboration with suppliers remains the key component of our
sourcing strategy to ensure a stable sourcing base, consistent quality of our products and being well
prepared for changes in the trade environment.
In addition to our business priorities, social, economic and environmental sustainability remains a core
value for PUMA. In 2019, we delivered our 10FOR20 sustainability targets and developed our next set of
sustainability targets for 2025, with a renewed focus on increasing the amount of sustainable products. In
addition, we continued our leading role at the Fashion Charter for Climate Action under the umbrella of UN
Climate and signed the Fashion Pact. The Fashion Pact is a global coalition of companies in the fashion and
textile industry, along with suppliers and distributors, all committed to a common core of environmental
goals in three areas: stopping global warming, restoring biodiversity and protecting the oceans. The Pact
was launched at the 2019 G7 summit in France. Our long-standing social compliance program has been
supplemented by the aspect of a more responsible procurement policy and has been recognized by the
renewed accreditation by the Fair Labor Association.
9
Product Development and Design
Building on more than 70 years of sports innovation and leading design, PUMA is in the very fortunate
situation of having an inspiring archive of products. PUMA’s designers can take inspiration from iconic
historic styles to mix the past and the present. In 2019, many of our most successful models derived from
our history.
As the heir of RS Running System series, which was first introduced some 40 years ago, the RS-X continued
to do well in the “Chunky Shoe” segment. In 2019, the RS-X made a bold entry into the market as the RS-
X Trophy in black and gold and dropped in several other versions during the year.
In 2019, PUMA also built on its CELL technology platform, which uses hexagonal cells in the heel for superior
cushioning and stability. We used CELL in the retro CELL Alien and CELL Endura models, which stayed true
to their ancestors from the 80s. We also went one step further by creating new CELL shapes, using the
updated LQD CELL technology. LQD CELL is versatile enough to work across a variety of shoe designs and
offers stable cushioning as a constant benefit. The first product to use this new technology was the LQD
CELL Origin AR sneaker, which came to life with an augmented reality app on mobile phones. LQD CELL
technology was deployed throughout the year in several training products.
After returning to basketball last year, PUMA relaunched the “Ralph Sampson” sneaker, named after the
legendary basketball star, which was first introduced in the 1980s. This shoe is a new successful addition
to our offering and was presented in different colors and styles throughout 2019.
Towards the end of 2019, PUMA revived the RIDER, one of the first jogging shoes. Launched in October
as the FAST RIDER OG, our designers reinterpreted the “Federbein” sole, which imitates the shock-
absorbing qualities of a car suspension for additional comfort and high rebound. PUMA will continue to add
new products to the RIDER franchise in 2020.
The CALI and the NOVA, presented by our brand ambassadors Selena Gomez and Cara Delevingne
respectively, continued to be our most successful Sportstyle franchises for women. Both ambassadors were
deeply involved in the design process and created their own collections. Cara Delevingne teamed up with
PUMA and French luxury brand Balmain for a boxing-inspired line of products. Supermodel and women’s
training ambassador Adriana Lima also presented a collection aimed at women who want to look their best,
even during the toughest workouts. PUMA also teamed up with a selected number of brands and designers,
such as Ader Error, Helly Hansen and Les Benjamins to create cool and stylish collections.
Throughout its history, PUMA has catered to the needs of professional athletes. We launched new versions
of our PUMA FUTURE football boot in 2019. Made for agile players, the FUTURE allows for sharp turns and
complex movements on the football pitch.
10
Together with Swiss apparel technology group X-Bionic, PUMA launched a collection of thermoregulating
running gear, which keeps athletes at an optimal temperature at all times.
We also started a line of products for professional gamers and esports athletes. Together with Dutch
gaming accessories maker PLAYSEAT, PUMA launched a gaming seat, which takes gamers away from
slouching on the sofa and towards a more active sitting position. The seat was accompanied by the launch
of gaming socks, a further example of how our Innovation department is looking for new ways to provide
products for this fast-growing market.
Keeping it high-tech, PUMA also launched its first smartwatch in 2019, which should help athletes get the
best out of their workouts with a built-in heart rate tracking, GPS and many of their favorite apps.
Research and product development at PUMA mainly comprise the areas of innovation (new technologies),
product design and model and collection development. The research and product development activities
range from the analysis of scientific studies and customer surveys through the generation of creative ideas
to the implementation of innovations in commercial products. The activities in research and product
development are directly linked to sourcing activities.
As of December 31, 2019, a total of 999 people were employed in research and development/ product
management (previous year: 946). In 2019, research and development/ product management expenses
totaled € 114.3 million (previous year: € 97.8 million), of which € 61.7 million (previous year: € 54.0 million)
related to research and development.
11
Sourcing
The Sourcing Organization
PUMA Group’s sourcing functions, referred to as PUMA Group sourcing (PGS), manages all sourcing related
activities for PUMA and Cobra, including vendor selection, product development, price negotiation and
production control. These activities are centrally managed by PUMA International Trading GmbH (PIT), the
group’s global trading entity, with its head office in the Corporate headquarters in Herzogenaurach
(Germany). In addition, PIT is responsible for procurement and supply into the PUMA distribution channels
worldwide. PIT receives volume forecasts from PUMA subsidiaries and licensees worldwide, translates these
forecasts into production plans which are subsequently distributed to the referenced vendors. The PUMA
subsidiaries confirm their forecasts into purchase orders to PIT, which in turn consolidates these
requirements and purchases from the vendors. There is a clear buy/sell relationship between the sales-
subsidiaries and PIT and between PIT and the vendors, for added transparency.
The centralization of both the sourcing and procurement functions, along with the rollout of a cloud-based
purchase order collaboration and payment platform, linking the sales-subsidiaries, PIT and the vendors,
has enabled the digitalization of the supply chain creating transparency, operational efficiency and reducing
complexity. For example, container fill rates are optimized, foreign currency risks are managed by PIT
directly via a centralized currency hedging policy, and all payments to vendors are automated and paper
free.
In order to meet our customers’ requirements concerning service, quality, social and environmental
compliance we focus on six core strategic pillars of collaboration, product, quality, growth management,
margins and landed cost, and sustainability. The centralization of sourcing and procurement allows for
continuous improvements in all of these areas. Furthermore, the integration of the PUMA sustainability
function (social, environment, chemical and occupational health and safety) into operations, since 2016,
has ensured these areas are part of our day to day business.
In 2019 further operating improvements were realized in sourcing, in particular with regards to the
centralization and standardization of processes and systems, capacity management and data analysis. To
avoid production peaks and subsequent delays on product availability, sourcing has proactively coordinated
ordering windows for earlier production visibility and additionally, reduced production lead time by pre-
positioning supply of materials. Short-lead time programs have been further increased to react on latest
developments and trends in the markets. In this regard sourcing has extended its local supply chain for
the China sales-subsidiary to provide the right organizational setup with a focus on design, costing and
lead time. To mitigate the negative impact of the international trade environment, alternative sourcing
locations have been allocated for the US market in the fourth quarter of 2019.
12
2019 saw the continued growth and expansion of the PUMA Vendor Finance Program for our suppliers.
This innovative program launched in 2016 allows vendors to be paid earlier and the rate of interest charged
is dependent on their sustainability performance. PUMA developed this program initially with the
International Finance Corporation (IFC), the trade finance arm of the World Bank. The program has been
expanded for the first time to include private international banks. Since the program is based on PUMA’s
credit rating our vendors are able to benefit from the best possible interest rates and maintain their own
lines of credit.
The Sourcing Markets
During the financial year 2019, PIT purchased from 131 independent suppliers (previous year: 152) in 32
countries worldwide. The strategic cooperation with long-term partners remained to be one of the key
competitive advantages in 2019 to ensure stable sourcing of a significantly increased sourcing volume, in
particular in the apparel division.
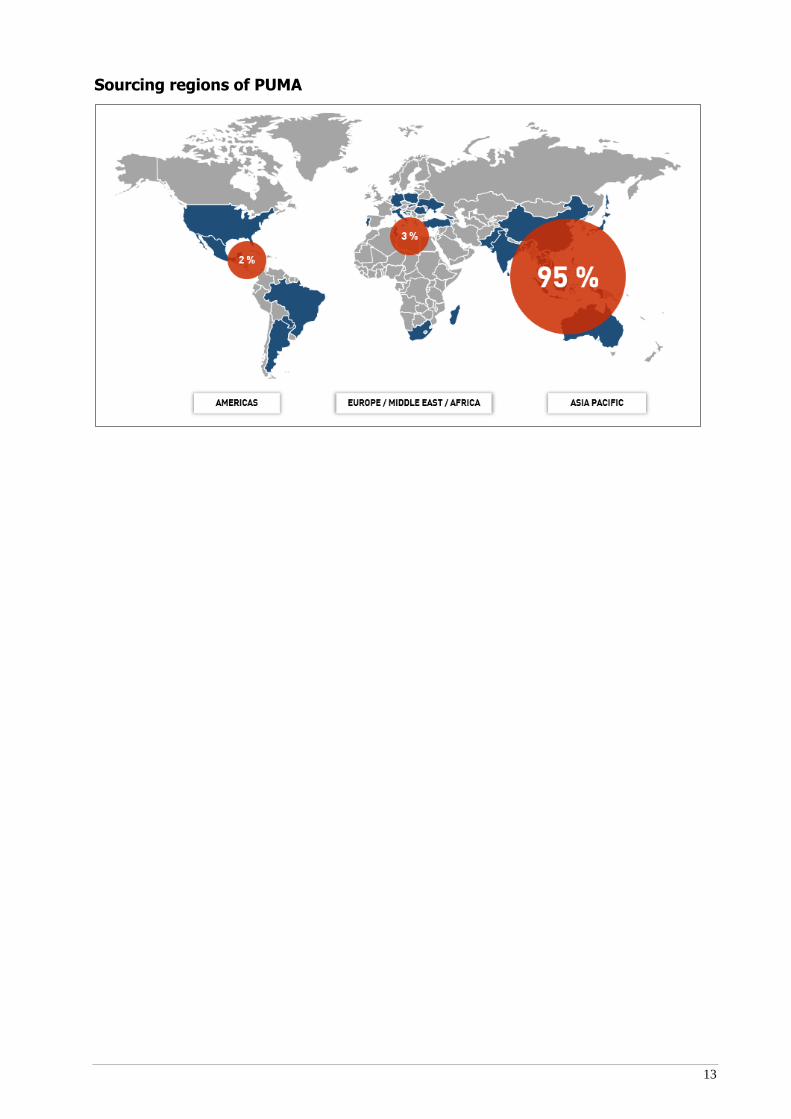
Asia remains the strongest sourcing region overall with 95% of the total volume, followed by EMEA with
3% (thereof Europe with 1.5% and Africa with 1.5%) and the Americas with 2%.
As a result, the six most important sourcing countries (93% of the total volume) are all located on the
Asian continent. Once more, Vietnam was the strongest production country with a total of 33%. China
followed at 25%. Bangladesh, which focuses on apparel, is in third place at 15%. Bangladesh thus
continued to increase its share of the sourcing volume by two percentage points compared to 2019.
Cambodia was in fourth place at 13%. Indonesia, which focuses on footwear production, produces 4% of
the total volume and is in fifth place. India is in sixth place at 3%.
Rising wage costs and macroeconomic influences, such as changes in the trade environment due to tariffs,
have continued to influence sourcing markets in 2019. Such impacts need to be taken into account in
allocating the production. This is a significant component of our sourcing strategy to ensure secure and
competitive sourcing of products and, furthermore, to successfully manage the increasing sourcing volumes
due to the positive business development.
13
Sourcing regions of PUMA
14
Employees
Number of employees
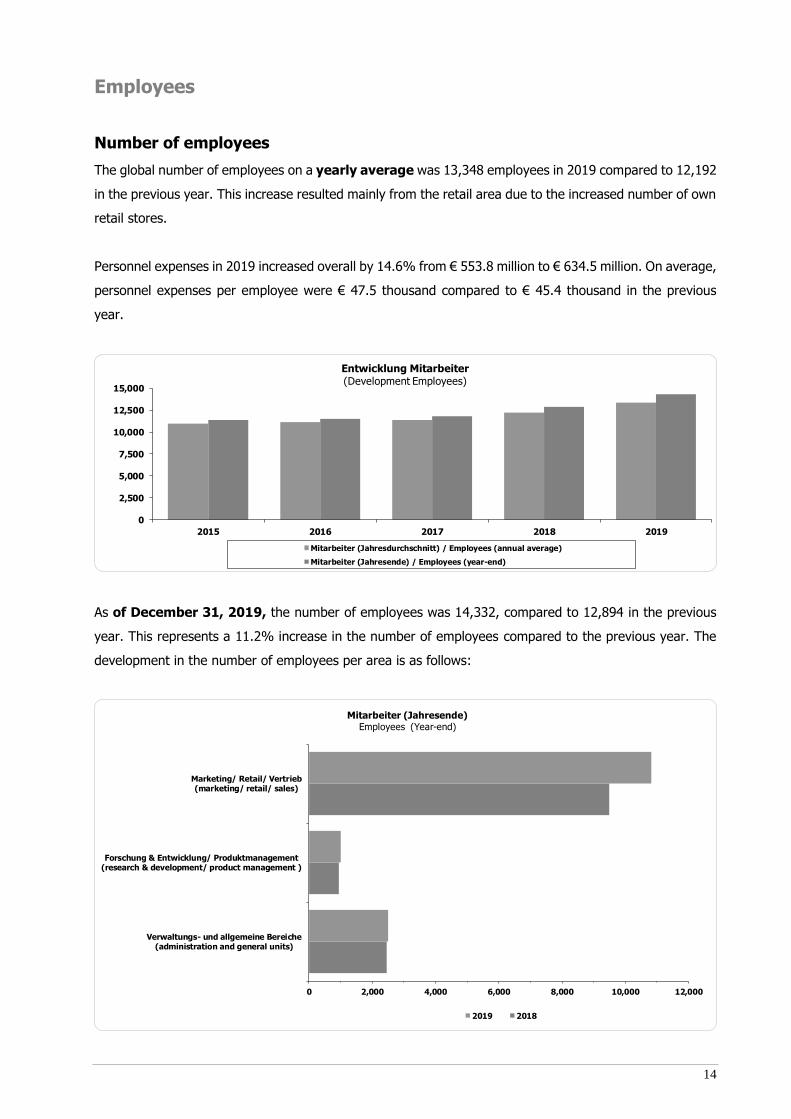
The global number of employees on a yearly average was 13,348 employees in 2019 compared to 12,192
in the previous year. This increase resulted mainly from the retail area due to the increased number of own
retail stores.
Personnel expenses in 2019 increased overall by 14.6% from € 553.8 million to € 634.5 million. On average,
personnel expenses per employee were € 47.5 thousand compared to € 45.4 thousand in the previous
year.
As of December 31, 2019, the number of employees was 14,332, compared to 12,894 in the previous
year. This represents a 11.2% increase in the number of employees compared to the previous year. The
development in the number of employees per area is as follows:
0
2,500
5,000
7,500
10,000
12,500
15,000
2015 2016 2017 2018 2019
Entwicklung Mitarbeiter(Development Employees)
Mitarbeiter (Jahresdurchschnitt) / Employees (annual average)
Mitarbeiter (Jahresende) / Employees (year-end)
0 2,000 4,000 6,000 8,000 10,000 12,000
Verwaltungs- und allgemeine Bereiche(administration and general units)
Forschung & Entwicklung/ Produktmanagement(research & development/ product management )
Marketing/ Retail/ Vertrieb(marketing/ retail/ sales)
Mitarbeiter (Jahresende)Employees (Year-end)
2019 2018
15
Talent Recruitment and Development
In a business environment undergoing rapid change, PUMA must be able to adapt quickly to new market
situations to ensure success over the long term. We have therefore created a modern working environment
that fosters agile thinking, creativity and interaction. We provide our employees with general working
conditions and flexible working opportunities that offer them a good work-life balance. We ensure that our
employees are familiar with agile working methods and encourage them to be versatile and adaptable.
During this change process and the associated impact on the organization, the employee is always the
focus of our actions. In order to take this into account both internally and externally, we have renamed the
Human Resources department “People & Organization”.
To support our company strategy and to ensure our business success, our main focus is on acquiring and
developing talent. Having and retaining highly qualified and motivated personnel in the long term is the
main part of our strategy to ensure future competitiveness and growth. This becomes particularly important
in an ever-changing, increasingly complex environment. We use digital platforms and social media for our
target group-specific, individual recruiting measures, as well as our career website, to attract external
candidates. A range of initiatives at universities gives us the opportunity to approach potential employees
and identify suitable candidates. Extensive networks of qualified applicants and current candidate pools
help us to quickly fill vacancies. In the competitive labor market, being an attractive employer, and being
perceived as such by current and potential employees are of critical importance. Top employer rankings
and multiple awards evidence PUMA’s attractiveness.
The digitalization, the related simplification and acceleration of business processes made further progress.
"Workday", one of the leading human capital management systems, which we introduced globally in 2017,
contains the modules "recruiting", "talent and performance", "time recording and absence management"
and "learning". As a result, only one software solution is used for major parts of important personnel
processes. In 2019, we continued to link Workday with other systems and have steadily increased the
number of employees and applicants who regularly and actively use the system. The evaluation of our
centrally available global data enables us to conduct large-scale analyses. The resulting conclusions offer
a solid basis for continuous process improvement and decisions.
Our aim is to help each of our employees to develop in an international environment and at the same time
successfully and sustainably retain them in our company. Based on the Workday software, a systematic
succession plan is created as part of talent management in addition to the performance assessment and
target-setting. We identify the talent available within the group as part of annual performance reviews and
foster talent development based on individual development plans. This type of talent management means
that we can offer our employees attractive career and development opportunities.
The ongoing professional and personal development of our employees also ensures that our workforce has
the necessary expertise to guarantee continuous growth and market competence particularly in times of
digital change. The range of training we provide therefore includes a number of online and offline training
courses and workshops that are standardized or tailored to individual needs. The constant development of
16
our PUMA training programs ensures that our employees have innovative and diverse opportunities to
expand their qualifications and develop their existing skills or acquire new skills at any time. This approach
helps employees to achieve their personal goals and PUMA to reach its corporate goals.
In 2019, we have started to train employees to become "agile coaches" in order to prepare and motivate
our workforce for the digital change. These coaches apply agile working methods, can pass on their
knowledge to other colleagues on site and are also available as experts on the subject. In addition to the
management content already available on the ILP (International Leadership Program), we send our staff
on external and internal training courses to qualify in agile methods such as Scrum, Design Thinking and
KanBan. The high level of interest and steadily increasing numbers of staff attending these courses show
that we are on the right path.
To provide adequate entry-level and development opportunities to talented individuals at all levels,
including the range of different apprenticeships and dual-study programs, we also promote the systematic
training of our professionals and managers.
To ensure a common understanding of leadership throughout the company, all managers complete our
international leadership training program comprising the seminar series ILP and ILP². The program helps
to develop participants over a longer period, provides them with the opportunities to apply the newly
acquired knowledge in practice between the individual modules and to share knowledge with other seminar
participants to learn from each other. Our goal is to provide our staff with the required skills and expertise
to successfully lead their teams. They receive intensive training and coaching, including interactive learning,
roleplay simulations and best practice learning, as well as joint projects. The digitalization and the changing
work environment lead to new challenges for managers in particular. The key topics are therefore coaching,
mindful leadership and agile working methods. The training course “from employee to manager” prepares
staff that are about to take on a management role for the first time. In addition to the training module, the
program also offers individual coaching.
Using Speed Up and Speed Up², we conduct development programs for employees on different levels.
Various groups consisting of top talents are given intensive preparation for the next step in their careers
by taking on interdisciplinary projects and tasks, targeted training courses, mentoring, and coaching as
well as job rotations. Increased visibility to upper management, the creation of cross-functional cooperation
and establishing a strong network are also important components of this program.
In the past year, we conducted a global employee survey with the help of the external provider Wills Towers
Watson in order to get feedback from our employees and involve them in the design of their work
environment. More than 9,750 employees participated and used the opportunity to share their opinion on
their workplace and work life. We are proud of 91% employee engagement and appreciate the high level
of commitment of our employees and their loyalty to the brand. The category “change” received the lowest
positive responses with 63% and was identified as an important future area of action. The results were
communicated on a global, local and departmental level and necessary improvement measures were
defined.
17
Works Council
The trust-based collaboration with the Works’ Councils is an important part of our corporate culture. In
2019, the European Works Council of PUMA SE represented employees from 15 European countries and
had 18 members. The German Works Council of PUMA SE has 15 members and represents the employees
of the PUMA Group in Germany. A designated member of the Works Councils represents the interests of
employees with disabilities.
Compensation
We at PUMA offer our employees a targeted and competitive compensation system, which consists of
several components. In addition to a fixed base salary, the PUMA bonus system, profit-sharing programs
and various social benefits and intangible benefits form part of a performance-based compensation system.
We also offer long-term incentive programs for the senior management level that honor the sustainable
development and performance of the business. The bonus system is transparent and globally standardized.
Incentives are exclusively linked to company goals.
18
Management System
We use a variety of indicators to manage our performance in relation to our top corporate goals. We
have defined growth and profitability as key targets within finance-related areas. Our focus therefore
is on improving sales, gross profit margin, and operating result (EBIT). These are the financial control
parameters that are of particular significance. Moreover, we aim to minimize working capital and improve
free cash flow. Our Group's Planning and Management System has been designed to provide a variety
of instruments in order to assess current business developments and derive future strategy and investment
decisions. This involves the continuous monitoring of key financial indicators within the PUMA Group and a
monthly comparison with budget targets. Any deviations from the targets are analyzed in detail and
appropriate countermeasures are taken in the event such deviations have a negative impact.
Changes in net sales are also influenced by currency exchange effects. This is why we also state any
changes in sales in Euro, the reporting currency, adjusted for currency exchange effects in order to provide
information that is relevant to the decision-making process when assessing the revenue position. Currency-
adjusted sales volumes are used for comparison purposes and are based on the values that would arise if
the foreign currencies included in the consolidated financial statements were not translated at the average
rates for the previous reporting year, but were instead translated at the corresponding average rates for
the current year. As a result, currency-adjusted figures are not to be regarded as a substitute or as superior
financial indicators, but should instead always be regarded as additional information.
We use the indicator free cash flow in order to determine the change in cash and cash equivalents after
deducting all expenses incurred to maintain or expand the organic business of the PUMA Group. Free cash
flow is calculated from the cash flow from operating activities and investment activities. We also use the
indicator free cash flow before acquisitions, which goes beyond free cash flow and includes an
adjustment for incoming and outgoing payments that are associated with investments in companies.
We use the indicator working capital in order to assess the financial position. Working capital is essentially
the difference between current assets - including in particular inventories and trade receivables - and
current liabilities. Cash and cash equivalents, the positive and negative market values of derivative financial
instruments and current finance and lease liabilities are not included in working capital.
Non-financial performance indicators are of only minor importance as control variables at PUMA.
19
The calculation of key financial control parameters that PUMA uses are defined as follows:
The recognition of net sales is based on the provisions of IFRS 15 Revenue from contracts with customers.
PUMA's gross profit margin is calculated as cost of sales divided by net sales. Cost of sales mainly comprise
the carrying amounts of inventory that were recognized as expenses during the reporting period.
PUMA's operating result (EBIT) is the sum of net sales and royalty and commission income, minus cost of
sales and other operating income and expenses (OPEX). EBIT is defined as operating result, less
depreciation and amortization, provisions and impairment loss, before interest (= financial result) and
before taxes. The financial result contains interest income and interest expenses and currency conversion
differences and the income from associated companies in the previous year. The EBIT margin is calculated
as EBIT divided by net sales.
PUMA's working capital is calculated based on the sum of current assets less the sum of current liabilities.
In addition, cash and cash equivalents and positive and negative market values of derivative financial
instruments are deducted. The market values of derivative financial instruments are recognized in the
balance sheet in the items Other Current Assets and Other Current Liabilities not attributable to working
capital. Current finance and lease liabilities are also not part of working capital.
In order to present the impact of the first-time application of IFRS 16 Leases on the results of operations
of the PUMA Group as transparently as possible, we also present the impact of the new accounting standard
on the operating result before interest (= financial result), taxes and depreciation and amortization
(EBITDA). EBITDA is calculated based on the operating result (EBIT) adding depreciation and amortization,
which may also contain any incurred impairment expenses relating to property, plant and equipment and
financial assets. The EBITDA margin is calculated as EBITDA divided by net sales.
20
Information regarding the Non-financial Report
In accordance with Sections 289b and 315b of the German Commercial Code (HGB), we are required to
make a non-financial declaration for PUMA SE and the PUMA Group within the Combined Management
Report or present a non-financial report external to the Combined Management Report, in which we report
on environmental, social and other non-financial aspects. PUMA has been publishing Sustainability Reports
since 2003 under the provisions of the Global Reporting Initiative (GRI) and since 2010 has published
financial data and key sustainability indicators in one report. In this context, we report the information
required under Sections 289b and 315b of the HGB in the Sustainability chapter of our Annual Report. The
Non-financial Report for the financial year 2019 will be available by April 30, 2020, at the latest on the
following page of our website: https://about.puma.com/en/investor-relations/financial-reports
Furthermore, important sustainability information can be found on PUMA’s website in the section
Sustainability at any time: http://about.puma.com/en/sustainability
21
Economic Report
General Economic Conditions
Global Economy
According to the winter forecast of the Kiel Institute for the World Economy (ifw Kiel) dated December 11,
2019, the momentum of the global economy has slowed down in 2019. The experts at ifw Kiel expect
global gross domestic product (GDP) to rise by 3.0% in 2019. This represents a slight decline of 0.2%
compared to the summer forecast. The forecast for 2019 is also 0.7% below the growth in global GDP in
2018 (3.7%).
In 2019, the global economy was burdened by an intensification of the trade conflict between the United
States of America and China. The increase in customs duties and the extension of tariffs to additional
product groups has greatly reduced trade between the two countries, leading to greater economic
uncertainty in world trade and weaker industrial production. In the advanced economies, the overall
economic situation continued to deteriorate. In the United States of America, the strong fiscal stimuli,
particularly in the form of the tax reform from 2018, have expired. In contrast, the pace of expansion in
the euro zone has not slowed further, primarily due to brisk private consumer demand. In Japan and the
United Kingdom, industrial production even picked up. Overall, the economic gap between the advanced
economies, which had been observed in the previous year, narrowed in the course of 2019.
In the emerging markets, on the other hand, economic momentum has stabilized in 2019, as the financial
environment in particular has improved. A more expansive monetary policy and lower interest rates in the
United States of America have led to less devaluation pressure on the currencies in the emerging markets
and enabled a noticeable reduction in key interest rates. However, the economic development in the
individual emerging markets varies. While GDP growth rates declined in China and India, Brazil, Russia and
the other Asian emerging markets recorded an increase in the pace of expansion.
Sporting goods industry
Despite geopolitical tensions and trade conflicts, the sporting goods industry continued to grow strongly
worldwide in 2019. More exercise and physical activity, as well as an increasingly healthy and sustainable
lifestyle, continued to gain in importance for an ever-increasing proportion of the world's population. In
addition, the popularity of athletic footwear and apparel as an integral part of everyday fashion
("athleisure") increased. In addition, higher household incomes due to a stable labor market led to an
increase in consumer spending on sporting goods.
22
Sales
Illustration of Sales Development in 2019 Compared to the Outlook
PUMA’s 2018 Management Report had predicted a currency-adjusted growth in net sales of around 10%
for the financial year 2019. This forecast was increased several times throughout the year and PUMA
ultimately expected a currency-adjusted sales growth of around 15% for the financial year 2019. PUMA
was able to surpass the revised forecast for the financial year 2019, exceeding the originally planned sales
target.
More details on sales development are provided below.
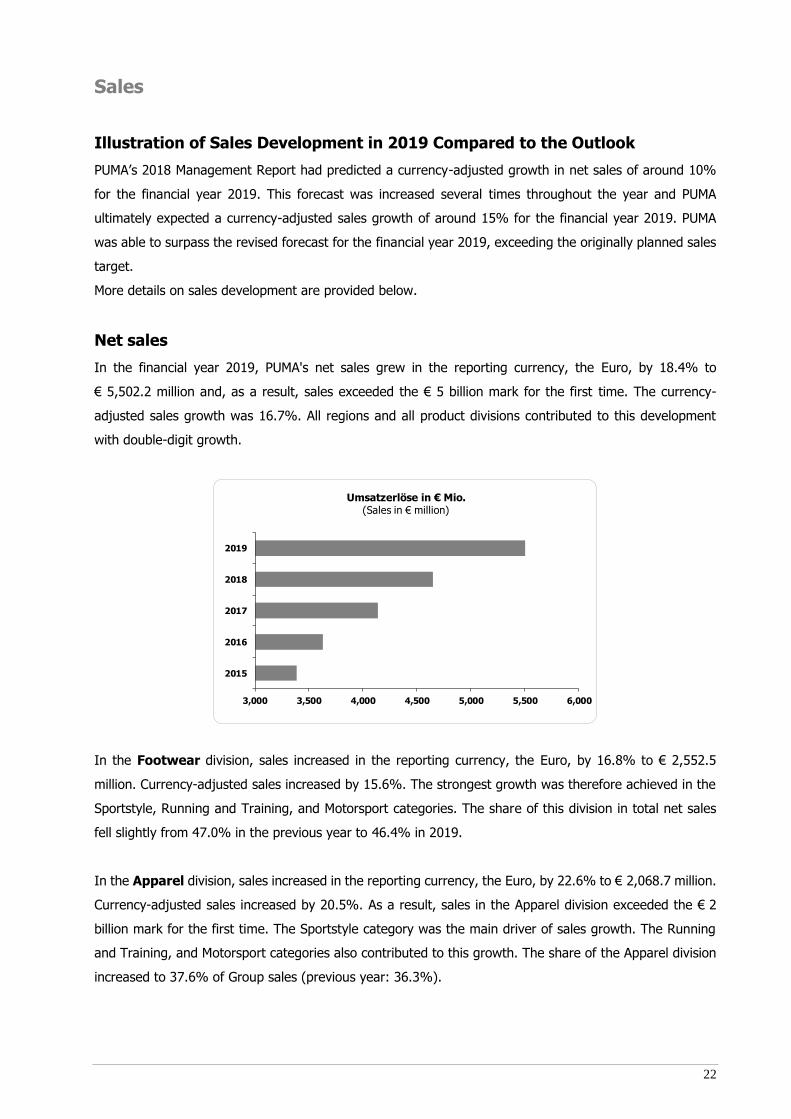
Net sales
In the financial year 2019, PUMA's net sales grew in the reporting currency, the Euro, by 18.4% to
€ 5,502.2 million and, as a result, sales exceeded the € 5 billion mark for the first time. The currency-
adjusted sales growth was 16.7%. All regions and all product divisions contributed to this development
with double-digit growth.
In the Footwear division, sales increased in the reporting currency, the Euro, by 16.8% to € 2,552.5
million. Currency-adjusted sales increased by 15.6%. The strongest growth was therefore achieved in the
Sportstyle, Running and Training, and Motorsport categories. The share of this division in total net sales
fell slightly from 47.0% in the previous year to 46.4% in 2019.
In the Apparel division, sales increased in the reporting currency, the Euro, by 22.6% to € 2,068.7 million.
Currency-adjusted sales increased by 20.5%. As a result, sales in the Apparel division exceeded the € 2
billion mark for the first time. The Sportstyle category was the main driver of sales growth. The Running
and Training, and Motorsport categories also contributed to this growth. The share of the Apparel division
increased to 37.6% of Group sales (previous year: 36.3%).
3,000 3,500 4,000 4,500 5,000 5,500 6,000
2015
2016
2017
2018
2019
Umsatzerlöse in € Mio. (Sales in € million)
23
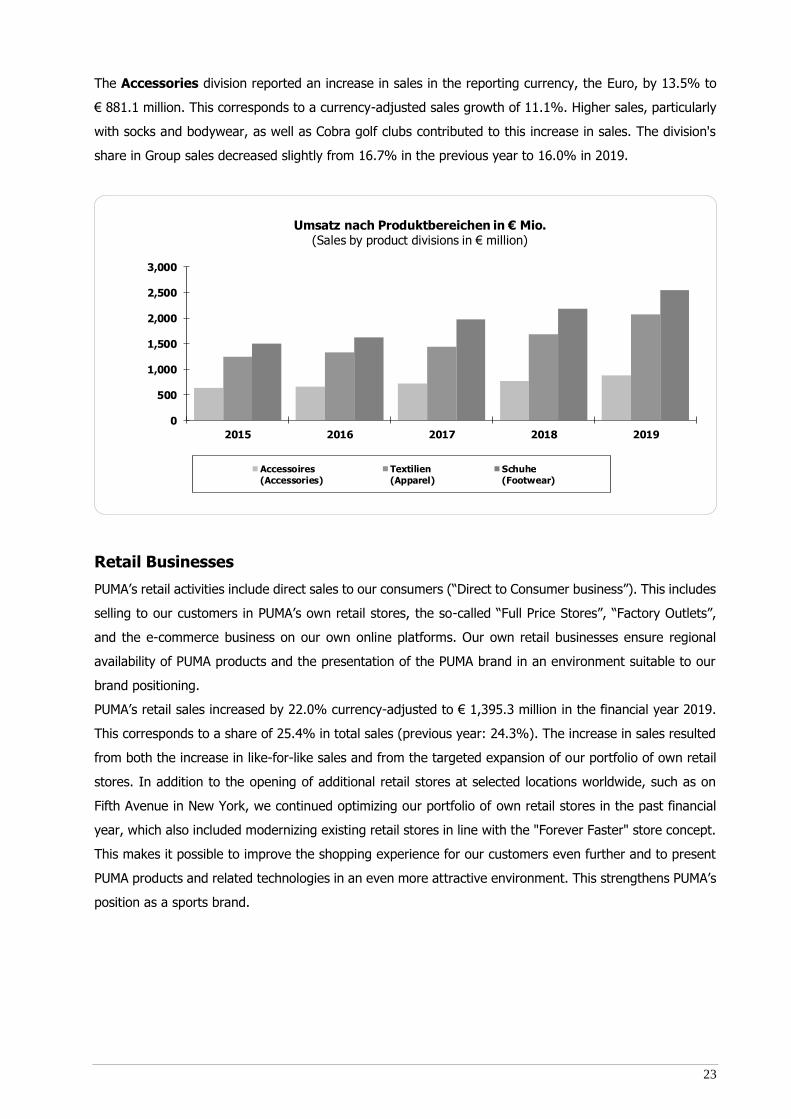
The Accessories division reported an increase in sales in the reporting currency, the Euro, by 13.5% to
€ 881.1 million. This corresponds to a currency-adjusted sales growth of 11.1%. Higher sales, particularly
with socks and bodywear, as well as Cobra golf clubs contributed to this increase in sales. The division's
share in Group sales decreased slightly from 16.7% in the previous year to 16.0% in 2019.
Retail Businesses
PUMA’s retail activities include direct sales to our consumers (“Direct to Consumer business”). This includes
selling to our customers in PUMA’s own retail stores, the so-called “Full Price Stores”, “Factory Outlets”,
and the e-commerce business on our own online platforms. Our own retail businesses ensure regional
availability of PUMA products and the presentation of the PUMA brand in an environment suitable to our
brand positioning.
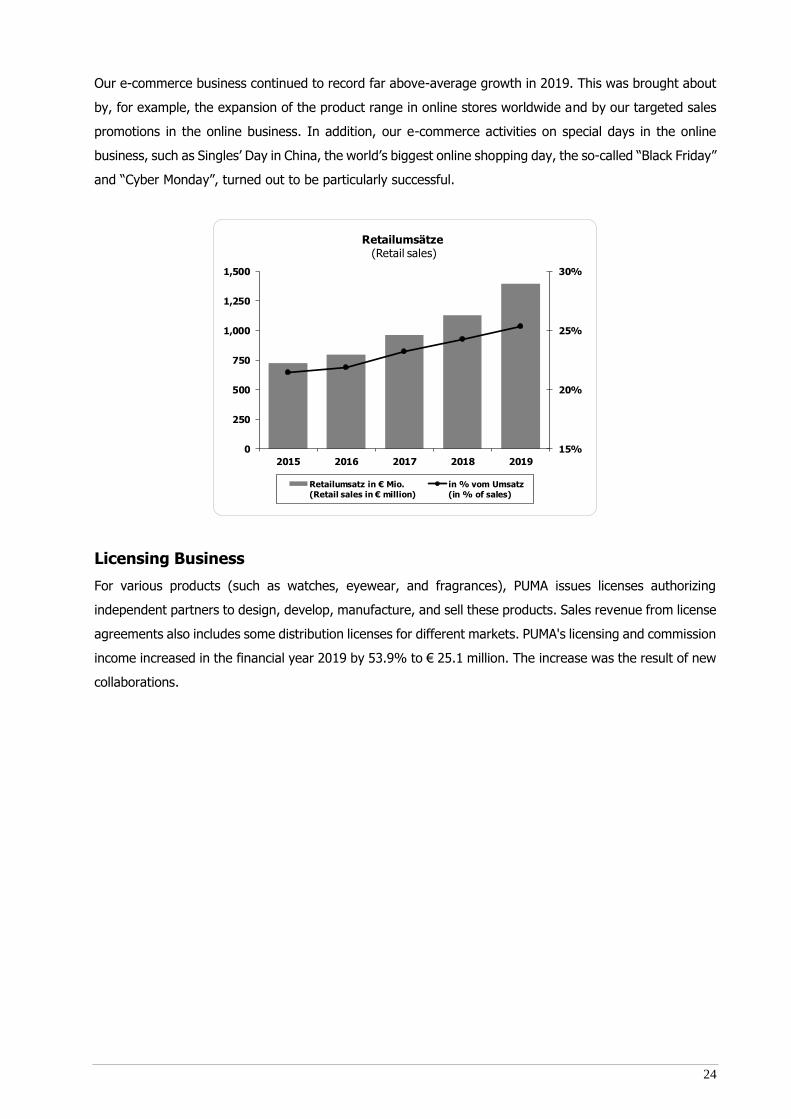
PUMA’s retail sales increased by 22.0% currency-adjusted to € 1,395.3 million in the financial year 2019.
This corresponds to a share of 25.4% in total sales (previous year: 24.3%). The increase in sales resulted
from both the increase in like-for-like sales and from the targeted expansion of our portfolio of own retail
stores. In addition to the opening of additional retail stores at selected locations worldwide, such as on
Fifth Avenue in New York, we continued optimizing our portfolio of own retail stores in the past financial
year, which also included modernizing existing retail stores in line with the "Forever Faster" store concept.
This makes it possible to improve the shopping experience for our customers even further and to present
PUMA products and related technologies in an even more attractive environment. This strengthens PUMA’s
position as a sports brand.
0
500
1,000
1,500
2,000
2,500
3,000
2015 2016 2017 2018 2019
Umsatz nach Produktbereichen in € Mio.(Sales by product divisions in € million)
Accessoires(Accessories)
Textilien(Apparel)
Schuhe(Footwear)
24
Our e-commerce business continued to record far above-average growth in 2019. This was brought about
by, for example, the expansion of the product range in online stores worldwide and by our targeted sales
promotions in the online business. In addition, our e-commerce activities on special days in the online
business, such as Singles’ Day in China, the world’s biggest online shopping day, the so-called “Black Friday”
and “Cyber Monday”, turned out to be particularly successful.
Licensing Business
For various products (such as watches, eyewear, and fragrances), PUMA issues licenses authorizing
independent partners to design, develop, manufacture, and sell these products. Sales revenue from license
agreements also includes some distribution licenses for different markets. PUMA's licensing and commission
income increased in the financial year 2019 by 53.9% to € 25.1 million. The increase was the result of new
collaborations.
15%
20%
25%
30%
0
250
500
750
1,000
1,250
1,500
2015 2016 2017 2018 2019
Retailumsätze(Retail sales)
Retailumsatz in € Mio.(Retail sales in € million)
in % vom Umsatz(in % of sales)
25
Regional Development
In the following explanation of the regional distribution of sales, the sales are allocated to the customer’s
actual region (“customer site”). It is divided into three geographic regions (EMEA, America and Asia/Pacific).
A more detailed regional presentation of the sales according to the registered office of the respective Group
company can be found in chapter 26 in the Notes to the Consolidated Financial Statements.
PUMA's net sales increased in the reporting currency, the Euro, by 18.4% in the financial year 2019. This
corresponds to a currency-adjusted sales growth of 16.7% compared to the previous year. All regions
contributed to this development with double-digit growth.
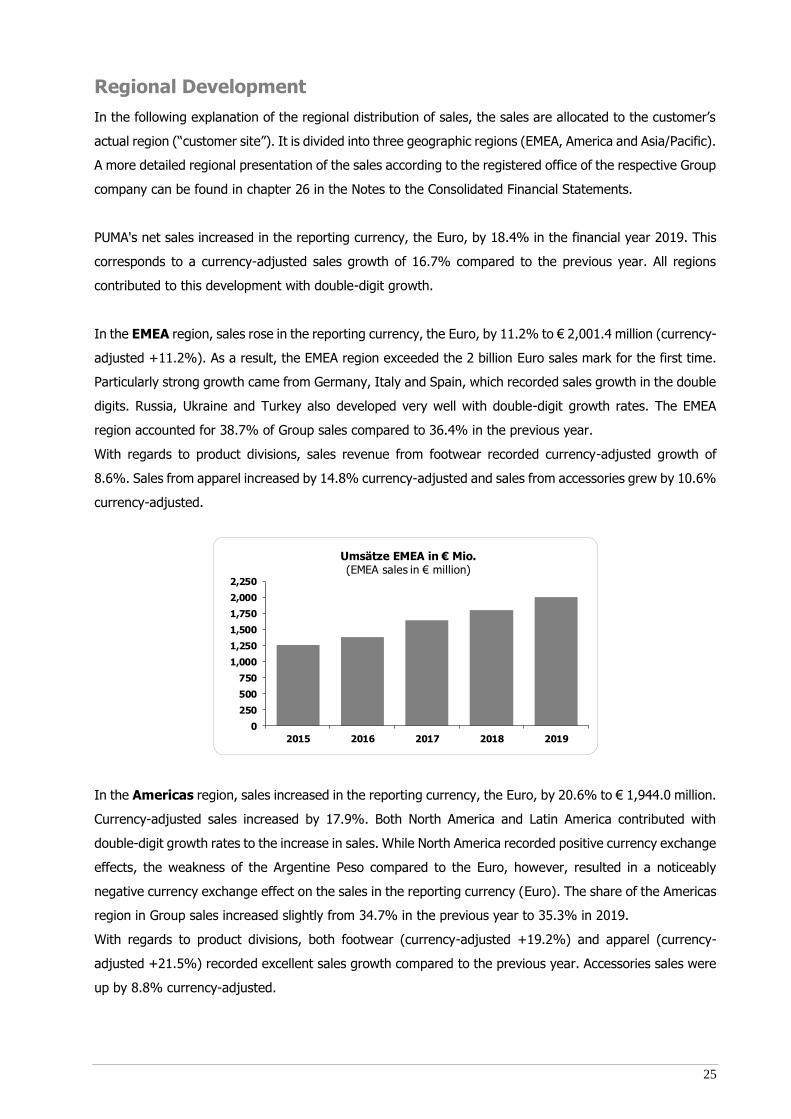
In the EMEA region, sales rose in the reporting currency, the Euro, by 11.2% to € 2,001.4 million (currency-
adjusted +11.2%). As a result, the EMEA region exceeded the 2 billion Euro sales mark for the first time.
Particularly strong growth came from Germany, Italy and Spain, which recorded sales growth in the double
digits. Russia, Ukraine and Turkey also developed very well with double-digit growth rates. The EMEA
region accounted for 38.7% of Group sales compared to 36.4% in the previous year.
With regards to product divisions, sales revenue from footwear recorded currency-adjusted growth of
8.6%. Sales from apparel increased by 14.8% currency-adjusted and sales from accessories grew by 10.6%
currency-adjusted.
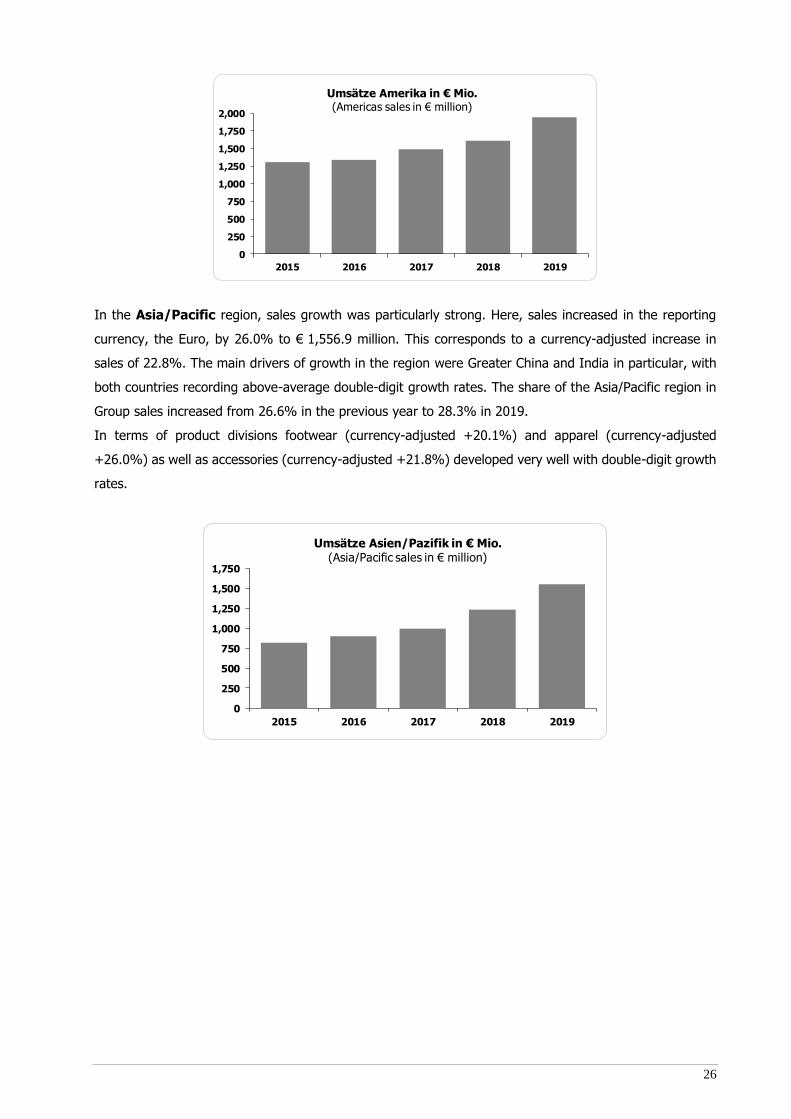
In the Americas region, sales increased in the reporting currency, the Euro, by 20.6% to € 1,944.0 million.
Currency-adjusted sales increased by 17.9%. Both North America and Latin America contributed with
double-digit growth rates to the increase in sales. While North America recorded positive currency exchange
effects, the weakness of the Argentine Peso compared to the Euro, however, resulted in a noticeably
negative currency exchange effect on the sales in the reporting currency (Euro). The share of the Americas
region in Group sales increased slightly from 34.7% in the previous year to 35.3% in 2019.
With regards to product divisions, both footwear (currency-adjusted +19.2%) and apparel (currency-
adjusted +21.5%) recorded excellent sales growth compared to the previous year. Accessories sales were
up by 8.8% currency-adjusted.
0
250
500
750
1,000
1,250
1,500
1,750
2,000
2,250
2015 2016 2017 2018 2019
Umsätze EMEA in € Mio.(EMEA sales in € million)
26
In the Asia/Pacific region, sales growth was particularly strong. Here, sales increased in the reporting
currency, the Euro, by 26.0% to € 1,556.9 million. This corresponds to a currency-adjusted increase in
sales of 22.8%. The main drivers of growth in the region were Greater China and India in particular, with
both countries recording above-average double-digit growth rates. The share of the Asia/Pacific region in
Group sales increased from 26.6% in the previous year to 28.3% in 2019.
In terms of product divisions footwear (currency-adjusted +20.1%) and apparel (currency-adjusted
+26.0%) as well as accessories (currency-adjusted +21.8%) developed very well with double-digit growth
rates.
0
250
500
750
1,000
1,250
1,500
1,750
2,000
2015 2016 2017 2018 2019
Umsätze Amerika in € Mio.(Americas sales in € million)
0
250
500
750
1,000
1,250
1,500
1,750
2015 2016 2017 2018 2019
Umsätze Asien/Pazifik in € Mio.(Asia/Pacific sales in € million)
27
Results of Operations
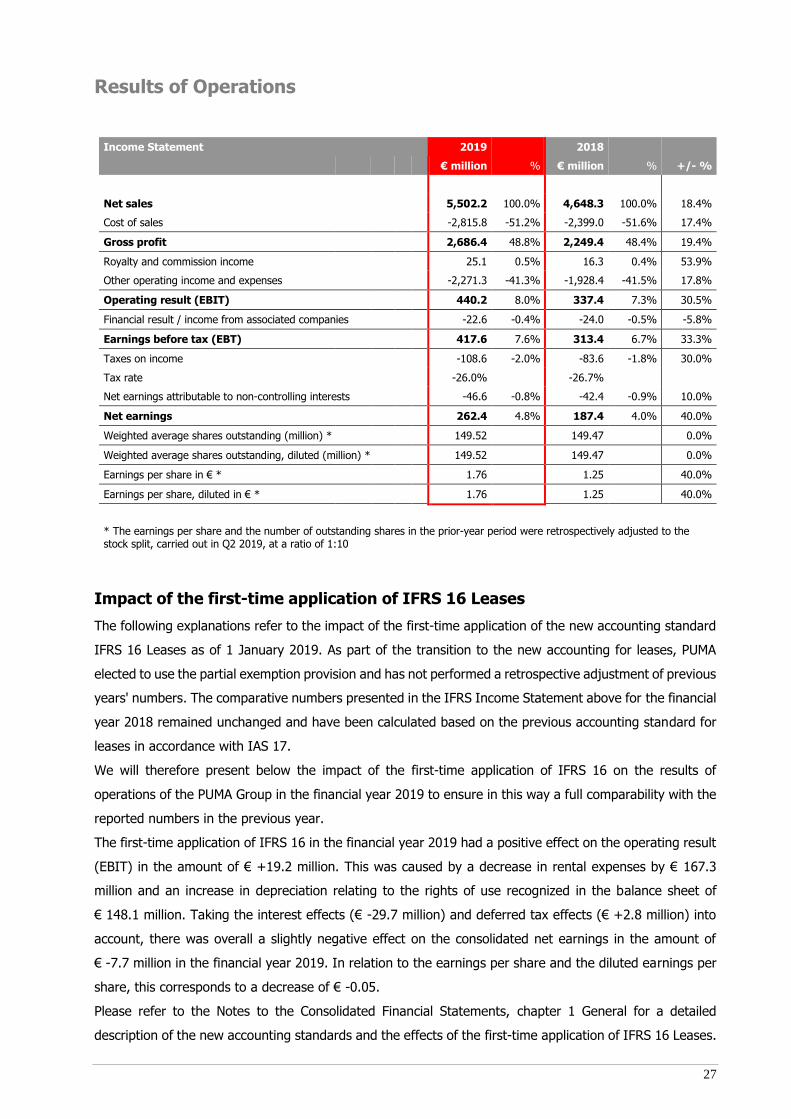
Income Statement 2019 2018
€ million % € million % +/- %
Net sales 5,502.2 100.0% 4,648.3 100.0% 18.4%
Cost of sales -2,815.8 -51.2% -2,399.0 -51.6% 17.4%
Gross profit 2,686.4 48.8% 2,249.4 48.4% 19.4%
Royalty and commission income 25.1 0.5% 16.3 0.4% 53.9%
Other operating income and expenses -2,271.3 -41.3% -1,928.4 -41.5% 17.8%
Operating result (EBIT) 440.2 8.0% 337.4 7.3% 30.5%
Financial result / income from associated companies -22.6 -0.4% -24.0 -0.5% -5.8%
Earnings before tax (EBT) 417.6 7.6% 313.4 6.7% 33.3%
Taxes on income -108.6 -2.0% -83.6 -1.8% 30.0%
Tax rate -26.0% -26.7%
Net earnings attributable to non-controlling interests -46.6 -0.8% -42.4 -0.9% 10.0%
Net earnings 262.4 4.8% 187.4 4.0% 40.0%
Weighted average shares outstanding (million) * 149.52 149.47 0.0%
Weighted average shares outstanding, diluted (million) * 149.52 149.47 0.0%
Earnings per share in € * 1.76 1.25 40.0%
Earnings per share, diluted in € * 1.76 1.25 40.0%
* The earnings per share and the number of outstanding shares in the prior-year period were retrospectively adjusted to the stock split, carried out in Q2 2019, at a ratio of 1:10
Impact of the first-time application of IFRS 16 Leases
The following explanations refer to the impact of the first-time application of the new accounting standard
IFRS 16 Leases as of 1 January 2019. As part of the transition to the new accounting for leases, PUMA
elected to use the partial exemption provision and has not performed a retrospective adjustment of previous
years' numbers. The comparative numbers presented in the IFRS Income Statement above for the financial
year 2018 remained unchanged and have been calculated based on the previous accounting standard for
leases in accordance with IAS 17.
We will therefore present below the impact of the first-time application of IFRS 16 on the results of
operations of the PUMA Group in the financial year 2019 to ensure in this way a full comparability with the
reported numbers in the previous year.
The first-time application of IFRS 16 in the financial year 2019 had a positive effect on the operating result
(EBIT) in the amount of € +19.2 million. This was caused by a decrease in rental expenses by € 167.3
million and an increase in depreciation relating to the rights of use recognized in the balance sheet of
€ 148.1 million. Taking the interest effects (€ -29.7 million) and deferred tax effects (€ +2.8 million) into
account, there was overall a slightly negative effect on the consolidated net earnings in the amount of
€ -7.7 million in the financial year 2019. In relation to the earnings per share and the diluted earnings per
share, this corresponds to a decrease of € -0.05.
Please refer to the Notes to the Consolidated Financial Statements, chapter 1 General for a detailed
description of the new accounting standards and the effects of the first-time application of IFRS 16 Leases.
28
Illustration of Earnings Development in 2019 Compared to the Outlook
In the outlook of the 2018 Annual Report, PUMA forecasted a slight improvement in the gross profit margin
for the financial year 2019. PUMA expected a slightly weaker increase of other operating income and
expenses (OPEX) compared to net sales. The forecast for the operating result (EBIT) was within a range
of between € 395 million and € 415 million. This forecast already included the impact of the application of
the new accounting rules for leases in accordance with IFRS 16. In addition, a significant improvement in
net earnings was expected for the financial year 2019.
The forecasts for the operating result were adjusted upward several times throughout the year, and PUMA
now expected an operating result (EBIT) within a range of between € 420 million and € 430 million. In
accordance with previous forecasts, the Management Board continued to expect a significant improvement
in net earnings for the financial year 2019.
PUMA was able to fully achieve the increased forecasts in 2019, and even slightly exceed them with regard
to the operating result. This means that PUMA slightly exceeded the originally targeted improvement in
operating result for 2019.
More details on earnings development are provided below.
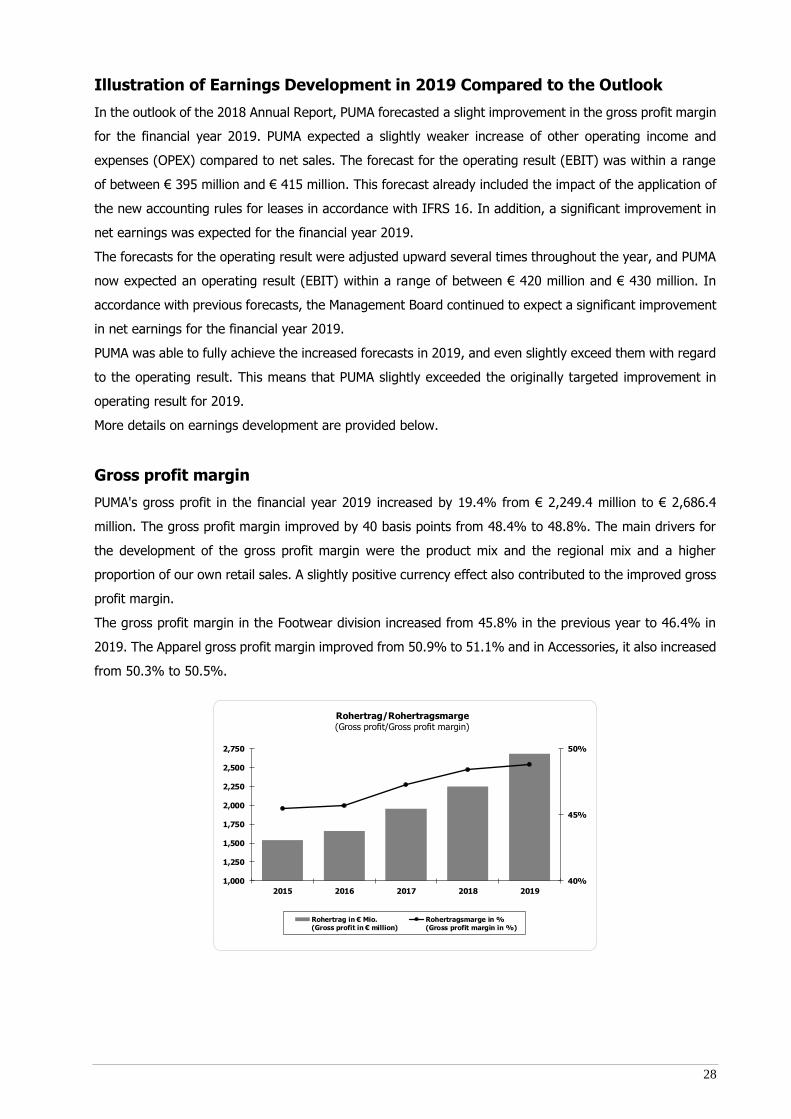
Gross profit margin
PUMA's gross profit in the financial year 2019 increased by 19.4% from € 2,249.4 million to € 2,686.4
million. The gross profit margin improved by 40 basis points from 48.4% to 48.8%. The main drivers for
the development of the gross profit margin were the product mix and the regional mix and a higher
proportion of our own retail sales. A slightly positive currency effect also contributed to the improved gross
profit margin.
The gross profit margin in the Footwear division increased from 45.8% in the previous year to 46.4% in
2019. The Apparel gross profit margin improved from 50.9% to 51.1% and in Accessories, it also increased
from 50.3% to 50.5%.
40%
45%
50%
1,000
1,250
1,500
1,750
2,000
2,250
2,500
2,750
2015 2016 2017 2018 2019
Rohertrag/Rohertragsmarge(Gross profit/Gross profit margin)
Rohertrag in € Mio.(Gross profit in € million)
Rohertragsmarge in %(Gross profit margin in %)
29
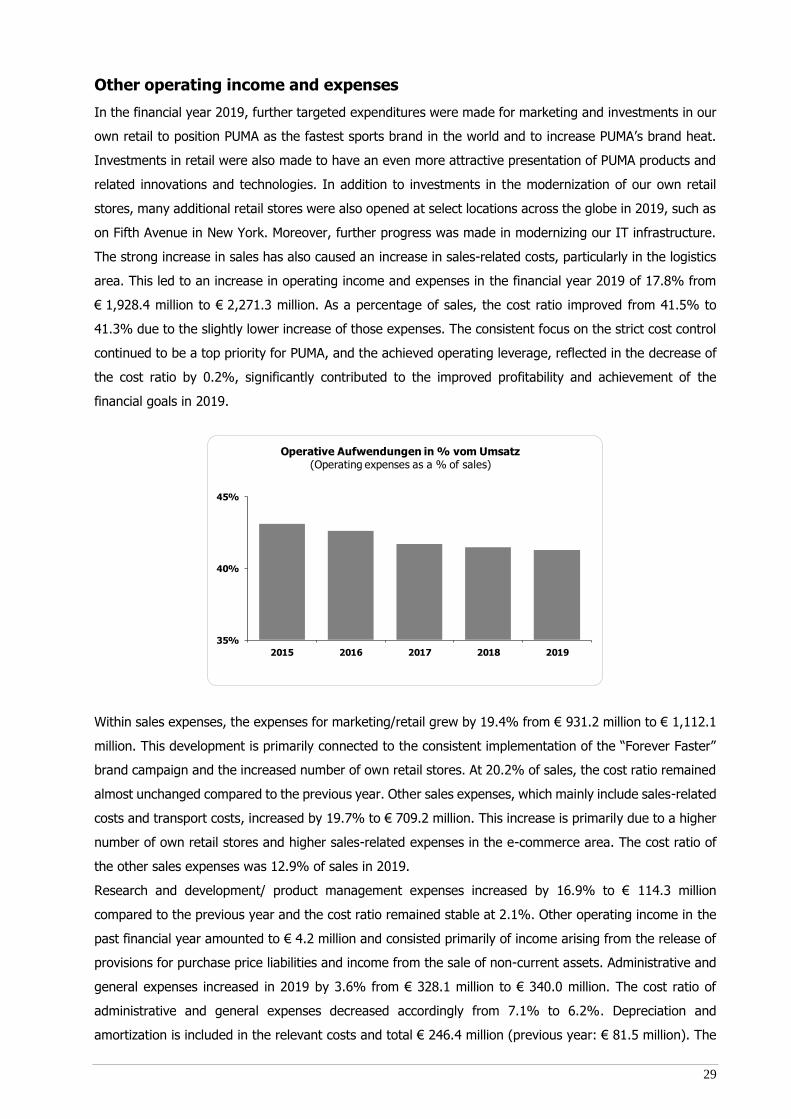
Other operating income and expenses
In the financial year 2019, further targeted expenditures were made for marketing and investments in our
own retail to position PUMA as the fastest sports brand in the world and to increase PUMA’s brand heat.
Investments in retail were also made to have an even more attractive presentation of PUMA products and
related innovations and technologies. In addition to investments in the modernization of our own retail
stores, many additional retail stores were also opened at select locations across the globe in 2019, such as
on Fifth Avenue in New York. Moreover, further progress was made in modernizing our IT infrastructure.
The strong increase in sales has also caused an increase in sales-related costs, particularly in the logistics
area. This led to an increase in operating income and expenses in the financial year 2019 of 17.8% from
€ 1,928.4 million to € 2,271.3 million. As a percentage of sales, the cost ratio improved from 41.5% to
41.3% due to the slightly lower increase of those expenses. The consistent focus on the strict cost control
continued to be a top priority for PUMA, and the achieved operating leverage, reflected in the decrease of
the cost ratio by 0.2%, significantly contributed to the improved profitability and achievement of the
financial goals in 2019.
Within sales expenses, the expenses for marketing/retail grew by 19.4% from € 931.2 million to € 1,112.1
million. This development is primarily connected to the consistent implementation of the “Forever Faster”
brand campaign and the increased number of own retail stores. At 20.2% of sales, the cost ratio remained
almost unchanged compared to the previous year. Other sales expenses, which mainly include sales-related
costs and transport costs, increased by 19.7% to € 709.2 million. This increase is primarily due to a higher
number of own retail stores and higher sales-related expenses in the e-commerce area. The cost ratio of
the other sales expenses was 12.9% of sales in 2019.
Research and development/ product management expenses increased by 16.9% to € 114.3 million
compared to the previous year and the cost ratio remained stable at 2.1%. Other operating income in the
past financial year amounted to € 4.2 million and consisted primarily of income arising from the release of
provisions for purchase price liabilities and income from the sale of non-current assets. Administrative and
general expenses increased in 2019 by 3.6% from € 328.1 million to € 340.0 million. The cost ratio of
administrative and general expenses decreased accordingly from 7.1% to 6.2%. Depreciation and
amortization is included in the relevant costs and total € 246.4 million (previous year: € 81.5 million). The
35%
40%
45%
2015 2016 2017 2018 2019
Operative Aufwendungen in % vom Umsatz(Operating expenses as a % of sales)
30
increase year-on-year is mainly the result from the depreciation of rights of use assets in relation with the
first-time application of IFRS 16 Leases.
Result before interest, taxes, depreciation and amortization (EBITDA)
The result before interest (= financial result), taxes, depreciation and amortization increased by 63.7% in
the financial year 2019 from € 419.5 million to € 686.6 million. The increase was positively impacted in the
amount of € 167.2 million by the first-time application of the new accounting standard for leases (IFRS 16).
Without this effect from the first-time application of IFRS 16, PUMA's EBITDA would have improved by
around € 100 million or 23.8% to € 519.4 million year-on-year.
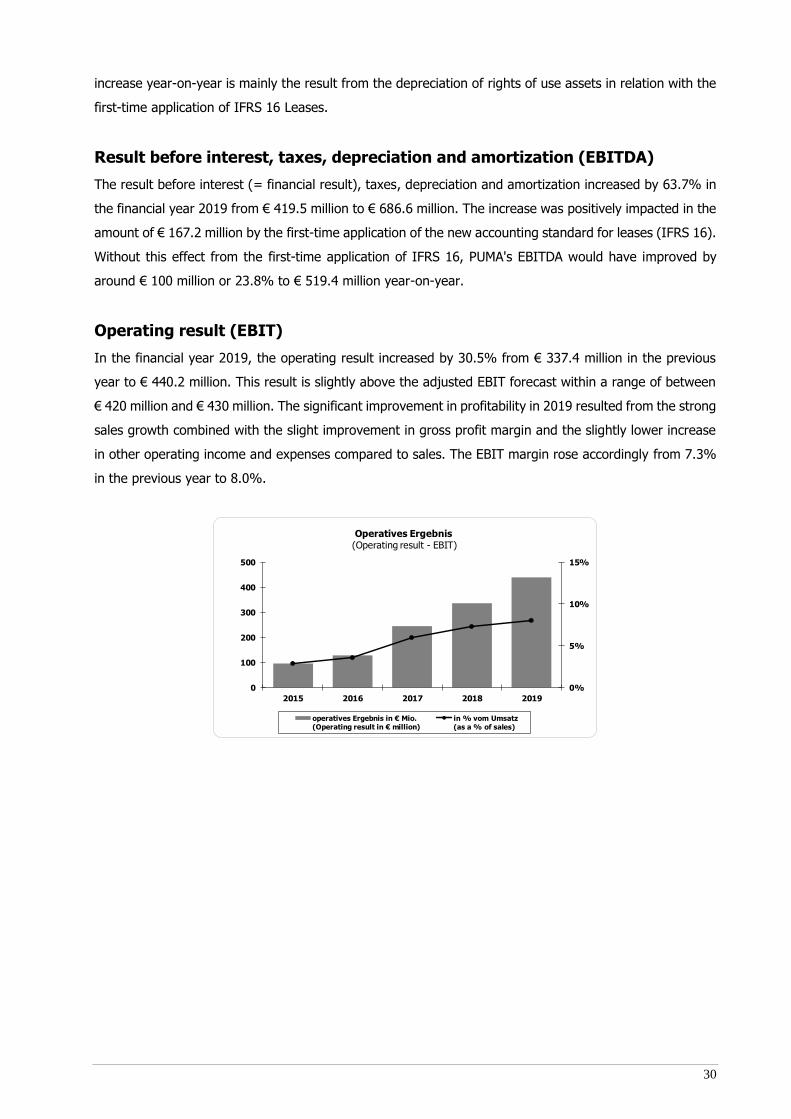
Operating result (EBIT)
In the financial year 2019, the operating result increased by 30.5% from € 337.4 million in the previous
year to € 440.2 million. This result is slightly above the adjusted EBIT forecast within a range of between
€ 420 million and € 430 million. The significant improvement in profitability in 2019 resulted from the strong
sales growth combined with the slight improvement in gross profit margin and the slightly lower increase
in other operating income and expenses compared to sales. The EBIT margin rose accordingly from 7.3%
in the previous year to 8.0%.
0%
5%
10%
15%
0
100
200
300
400
500
2015 2016 2017 2018 2019
Operatives Ergebnis(Operating result - EBIT)
operatives Ergebnis in € Mio.(Operating result in € million)
in % vom Umsatz(as a % of sales)
31
Financial Result
The financial result improved from overall € -24.0 million in the previous year to € -22.6 million in 2019,
despite the additional interest expense of € 29.7 million from the compounding of lease liabilities in
connection with the new accounting standard for leases (IFRS 16). This positive development is primarily
the result of gains from currency conversion differences of € 10.2 million in 2019, compared to a loss from
the currency conversion of € -14.4 million in the previous year. In addition, interest income of € 4.0 million
in the previous year increased to € 7.2 million in 2019, and interest expenses fell from € 14.6 million in the
previous year to € 13.9 million this year.
Earnings before tax (EBT)
In the financial year 2019, PUMA generated earnings before taxes of € 417.6 million. This corresponds to
an increase of 33.3% year-on-year (€ 313.4 million). Tax expenses were € 108.6 million compared to € 83.6
million in the previous year, and the tax ratio decreased slightly from 26.7% to 26.0% in 2019.
Net earnings attributable to non-controlling interests
Net earnings attributable to non-controlling interests relate to companies in the North American market, in
each of which the same shareholder holds a minority stake. The earnings attributable to this shareholder
increased by 10.0% to € 46.6 million in the financial year 2019 (previous year: € 42.4 million). These
companies concern PUMA North America and PUMA United Canada, which were created in the past financial
year from a merger and renaming of the companies, Janed, PUMA Accessories and PUMA Kids Apparel.
The business purpose of these companies is the sale of socks, bodywear and children's apparel on the
North American market.
Net earnings
Consolidated net earnings increased in the financial year 2019 by 40.0% from € 187.4 million to € 262.4
million. The significant improvement in net earnings mainly resulted from the strong sales growth combined
with the improvement in the gross profit margin and operating leverage. The improved financial result and
a slightly lower tax rate also had a positive effect on the net earnings in 2019. Taking the stock split at a
ratio of 1:10 into account, the earnings per share and diluted earnings per share increased accordingly by
40.0% from € 1.25 in the previous year to € 1.76 in 2019.
32
Dividends
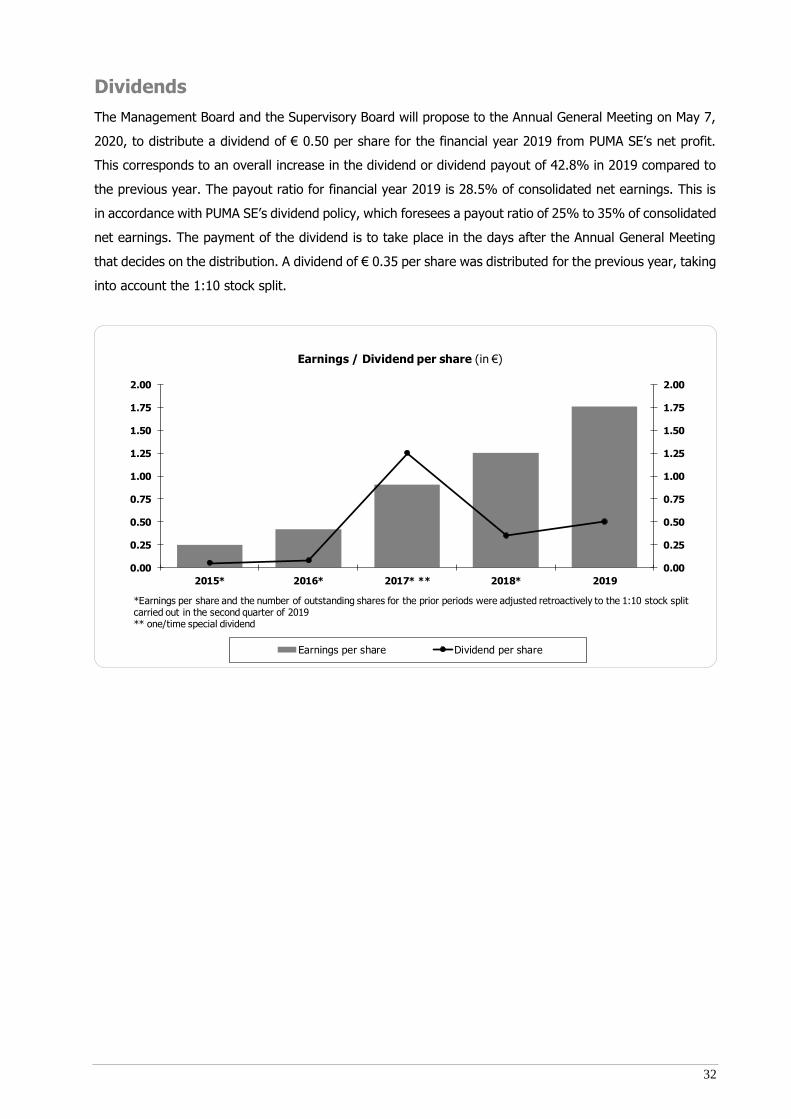
The Management Board and the Supervisory Board will propose to the Annual General Meeting on May 7,
2020, to distribute a dividend of € 0.50 per share for the financial year 2019 from PUMA SE’s net profit.
This corresponds to an overall increase in the dividend or dividend payout of 42.8% in 2019 compared to
the previous year. The payout ratio for financial year 2019 is 28.5% of consolidated net earnings. This is
in accordance with PUMA SE’s dividend policy, which foresees a payout ratio of 25% to 35% of consolidated
net earnings. The payment of the dividend is to take place in the days after the Annual General Meeting
that decides on the distribution. A dividend of € 0.35 per share was distributed for the previous year, taking
into account the 1:10 stock split.
0.00
0.25
0.50
0.75
1.00
1.25
1.50
1.75
2.00
0.00
0.25
0.50
0.75
1.00
1.25
1.50
1.75
2.00
2015* 2016* 2017* ** 2018* 2019
Earnings / Dividend per share (in €)
Earnings per share Dividend per share
*Earnings per share and the number of outstanding shares for the prior periods were adjusted retroactively to the 1:10 stock split carried out in the second quarter of 2019** one/time special dividend
33
Net Assets and Financial Position
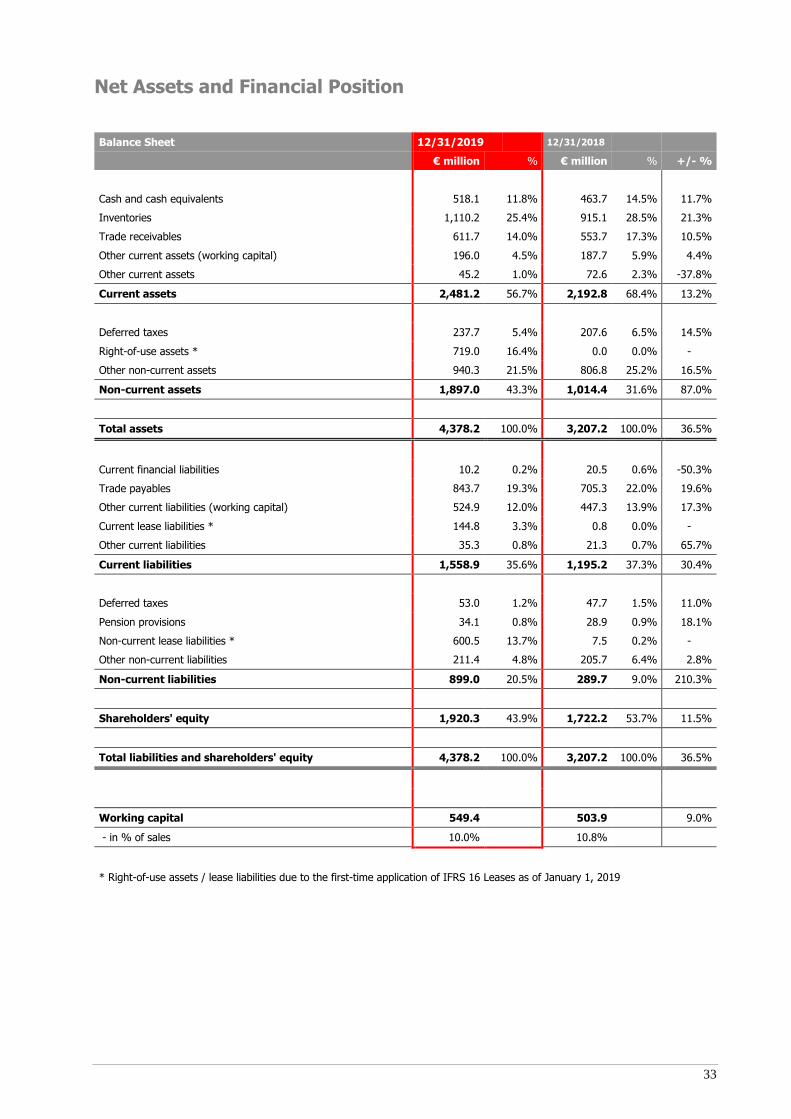
Balance Sheet 12/31/2019 12/31/2018
€ million % € million % +/- %
Cash and cash equivalents 518.1 11.8% 463.7 14.5% 11.7%
Inventories 1,110.2 25.4% 915.1 28.5% 21.3%
Trade receivables 611.7 14.0% 553.7 17.3% 10.5%
Other current assets (working capital) 196.0 4.5% 187.7 5.9% 4.4%
Other current assets 45.2 1.0% 72.6 2.3% -37.8%
Current assets 2,481.2 56.7% 2,192.8 68.4% 13.2%
Deferred taxes 237.7 5.4% 207.6 6.5% 14.5%
Right-of-use assets * 719.0 16.4% 0.0 0.0% -
Other non-current assets 940.3 21.5% 806.8 25.2% 16.5%
Non-current assets 1,897.0 43.3% 1,014.4 31.6% 87.0%
Total assets 4,378.2 100.0% 3,207.2 100.0% 36.5%
Current financial liabilities 10.2 0.2% 20.5 0.6% -50.3%
Trade payables 843.7 19.3% 705.3 22.0% 19.6%
Other current liabilities (working capital) 524.9 12.0% 447.3 13.9% 17.3%
Current lease liabilities * 144.8 3.3% 0.8 0.0% -
Other current liabilities 35.3 0.8% 21.3 0.7% 65.7%
Current liabilities 1,558.9 35.6% 1,195.2 37.3% 30.4%
Deferred taxes 53.0 1.2% 47.7 1.5% 11.0%
Pension provisions 34.1 0.8% 28.9 0.9% 18.1%
Non-current lease liabilities * 600.5 13.7% 7.5 0.2% -
Other non-current liabilities 211.4 4.8% 205.7 6.4% 2.8%
Non-current liabilities 899.0 20.5% 289.7 9.0% 210.3%
Shareholders' equity 1,920.3 43.9% 1,722.2 53.7% 11.5%
Total liabilities and shareholders' equity 4,378.2 100.0% 3,207.2 100.0% 36.5%
Working capital 549.4 503.9 9.0%
- in % of sales 10.0% 10.8%
* Right-of-use assets / lease liabilities due to the first-time application of IFRS 16 Leases as of January 1, 2019
34
Impact of the first-time application of IFRS 16 Leases
The following explanations refer to the impact of the first-time application of the new accounting standard
IFRS 16 Leases as of January 1, 2019. As a result of the new standard all leases must be accounted for in
the form of a right-of-use asset on the asset side of the balance sheet and a related current or non-current
lease liability on the liabilities side of the balance sheet. As part of the transition to the new accounting for
leases, PUMA elected to use the partial exemption provision and has not performed a retrospective
adjustment of the previous year’s figures. In the balance sheet above, the rights-of-use relating to assets
and the lease liabilities were added as additional balance sheet items. The previous year's figures remained
unchanged. In order to ensure full comparability with the reported previous year's figures, the impacts of
the first-time application of IFRS 16 on PUMA Group’s net assets in the financial year 2019 will be presented
and explained below.
The recognition in the balance sheet of the right-of-use assets in the amount of € 719.0 million and the
related current lease liabilities (€ 144.8 million) and non-current lease liabilities (€ 600.5 million) resulted
in a significant increase of the balance sheet total as of the balance sheet date on December 31, 2019. The
right-of-use assets refer to own retail stores totaling € 419.6 million, warehouses and distribution centers
totaling € 175.7 million and other lease items, mainly technical equipment and machines and motor vehicles
totaling € 123.7 million as of December 31, 2019.
The significantly increased balance sheet total specifically resulted in a decrease of the equity ratio. The
equity ratio, calculated as a quotient of equity and balance sheet total, decreased from 53.7% in the
previous year to 43.9% as of December 31, 2019. In absolute numbers, the equity of the PUMA Group,
however, increased by 11.5% from € 1,722.2 million to € 1,920.3 million. If the lease liabilities recognized
in the balanced sheet were disregarded for comparison purposes, the equity ratio as of December 31, 2019
would be almost unchanged at 52.9%.
The new leasing standard analogously caused a significant increase of the debt ratio, calculated as the
quotient of debt capital to equity. The ratio of debt to equity was at 86% at the end of 2018. Due to the
recognition of the lease liabilities on the balance sheet, the debt ratio has now increased to 128% as of
December 31, 2019. If, for comparison purposes, the lease liabilities recognized on the balance sheet were
disregarded, this would result in an almost unchanged debt ratio of 89.2% as of December 31, 2019.
Please refer to the Notes to the Consolidated Financial Statements, chapter 1 General for a detailed
description of the new accounting standards and the effects of the first-time application of IFRS 16 Leases.
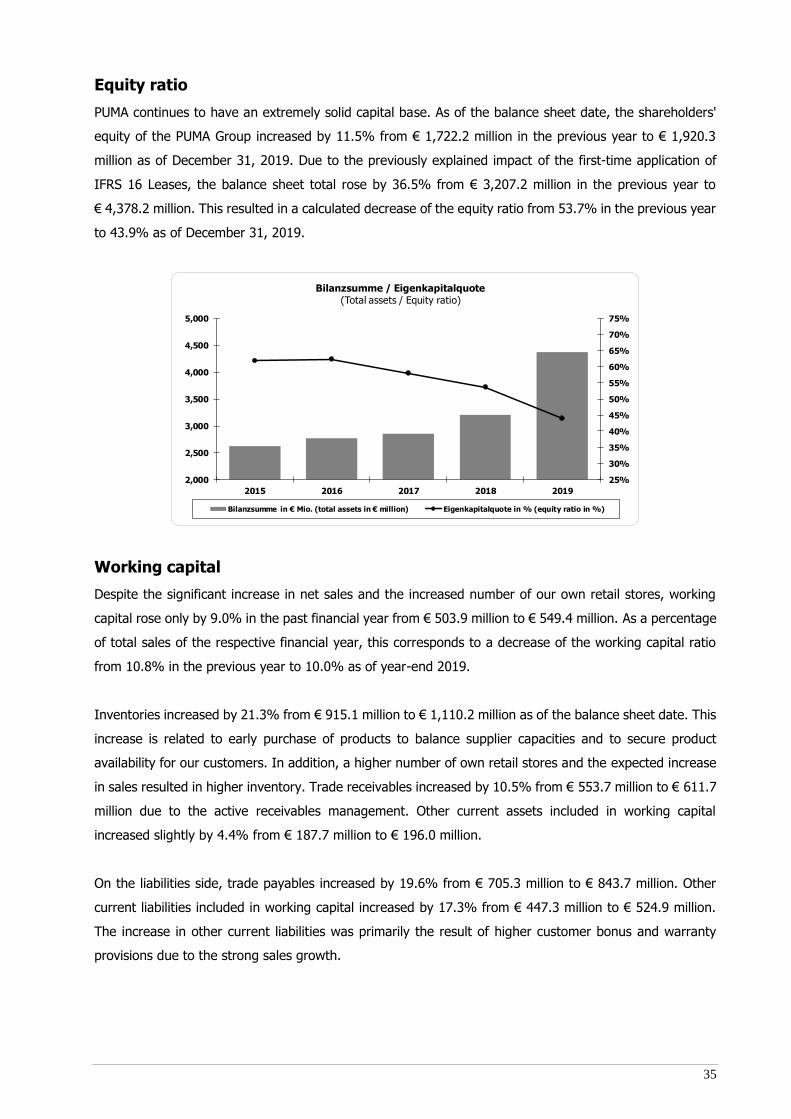
35
Equity ratio
PUMA continues to have an extremely solid capital base. As of the balance sheet date, the shareholders'
equity of the PUMA Group increased by 11.5% from € 1,722.2 million in the previous year to € 1,920.3
million as of December 31, 2019. Due to the previously explained impact of the first-time application of
IFRS 16 Leases, the balance sheet total rose by 36.5% from € 3,207.2 million in the previous year to
€ 4,378.2 million. This resulted in a calculated decrease of the equity ratio from 53.7% in the previous year
to 43.9% as of December 31, 2019.
Working capital
Despite the significant increase in net sales and the increased number of our own retail stores, working
capital rose only by 9.0% in the past financial year from € 503.9 million to € 549.4 million. As a percentage
of total sales of the respective financial year, this corresponds to a decrease of the working capital ratio
from 10.8% in the previous year to 10.0% as of year-end 2019.
Inventories increased by 21.3% from € 915.1 million to € 1,110.2 million as of the balance sheet date. This
increase is related to early purchase of products to balance supplier capacities and to secure product
availability for our customers. In addition, a higher number of own retail stores and the expected increase
in sales resulted in higher inventory. Trade receivables increased by 10.5% from € 553.7 million to € 611.7
million due to the active receivables management. Other current assets included in working capital
increased slightly by 4.4% from € 187.7 million to € 196.0 million.
On the liabilities side, trade payables increased by 19.6% from € 705.3 million to € 843.7 million. Other
current liabilities included in working capital increased by 17.3% from € 447.3 million to € 524.9 million.
The increase in other current liabilities was primarily the result of higher customer bonus and warranty
provisions due to the strong sales growth.
25%
30%
35%
40%
45%
50%
55%
60%
65%
70%
75%
2,000
2,500
3,000
3,500
4,000
4,500
5,000
2015 2016 2017 2018 2019
Bilanzsumme / Eigenkapitalquote(Total assets / Equity ratio)
Bilanzsumme in € Mio. (total assets in € million) Eigenkapitalquote in % (equity ratio in %)
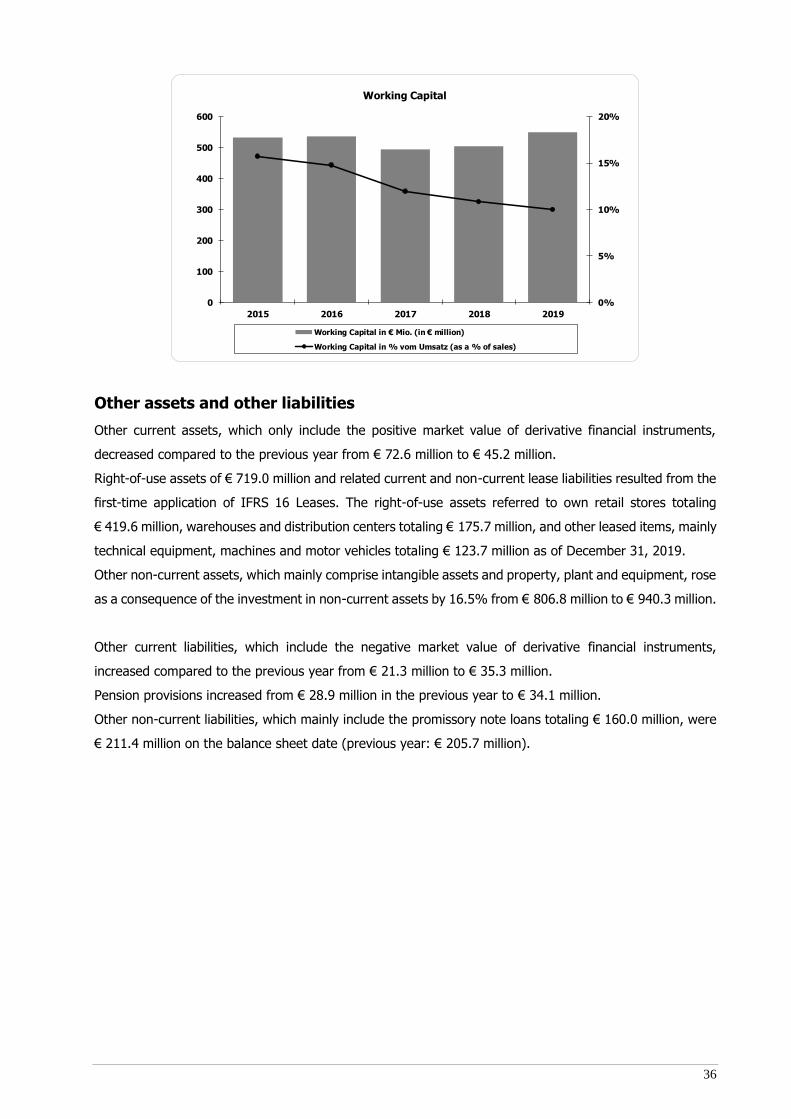
36
Other assets and other liabilities
Other current assets, which only include the positive market value of derivative financial instruments,
decreased compared to the previous year from € 72.6 million to € 45.2 million.
Right-of-use assets of € 719.0 million and related current and non-current lease liabilities resulted from the
first-time application of IFRS 16 Leases. The right-of-use assets referred to own retail stores totaling
€ 419.6 million, warehouses and distribution centers totaling € 175.7 million, and other leased items, mainly
technical equipment, machines and motor vehicles totaling € 123.7 million as of December 31, 2019.
Other non-current assets, which mainly comprise intangible assets and property, plant and equipment, rose
as a consequence of the investment in non-current assets by 16.5% from € 806.8 million to € 940.3 million.
Other current liabilities, which include the negative market value of derivative financial instruments,
increased compared to the previous year from € 21.3 million to € 35.3 million.
Pension provisions increased from € 28.9 million in the previous year to € 34.1 million.
Other non-current liabilities, which mainly include the promissory note loans totaling € 160.0 million, were
€ 211.4 million on the balance sheet date (previous year: € 205.7 million).
0%
5%
10%
15%
20%
0
100
200
300
400
500
600
2015 2016 2017 2018 2019
Working Capital
Working Capital in € Mio. (in € million)
Working Capital in % vom Umsatz (as a % of sales)
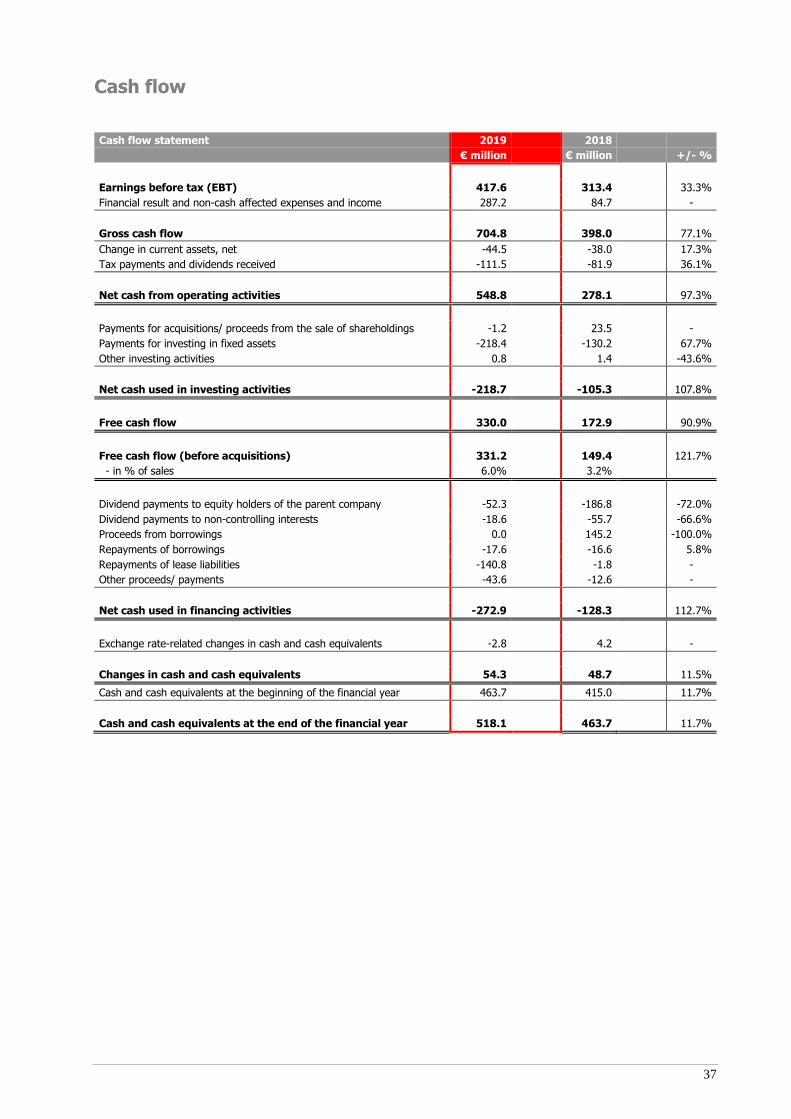
37
Cash flow
Cash flow statement 2019 2018
€ million € million +/- %
Earnings before tax (EBT) 417.6 313.4 33.3%
Financial result and non-cash affected expenses and income 287.2 84.7 -
Gross cash flow 704.8 398.0 77.1%
Change in current assets, net -44.5 -38.0 17.3%
Tax payments and dividends received -111.5 -81.9 36.1%
Net cash from operating activities 548.8 278.1 97.3%
Payments for acquisitions/ proceeds from the sale of shareholdings -1.2 23.5 -
Payments for investing in fixed assets -218.4 -130.2 67.7%
Other investing activities 0.8 1.4 -43.6%
Net cash used in investing activities -218.7 -105.3 107.8%
Free cash flow 330.0 172.9 90.9%
Free cash flow (before acquisitions) 331.2 149.4 121.7%
- in % of sales 6.0% 3.2%
Dividend payments to equity holders of the parent company -52.3 -186.8 -72.0%
Dividend payments to non-controlling interests -18.6 -55.7 -66.6%
Proceeds from borrowings 0.0 145.2 -100.0%
Repayments of borrowings -17.6 -16.6 5.8%
Repayments of lease liabilities -140.8 -1.8 -
Other proceeds/ payments -43.6 -12.6 -
Net cash used in financing activities -272.9 -128.3 112.7%
Exchange rate-related changes in cash and cash equivalents -2.8 4.2 -
Changes in cash and cash equivalents 54.3 48.7 11.5%
Cash and cash equivalents at the beginning of the financial year 463.7 415.0 11.7%
Cash and cash equivalents at the end of the financial year 518.1 463.7 11.7%
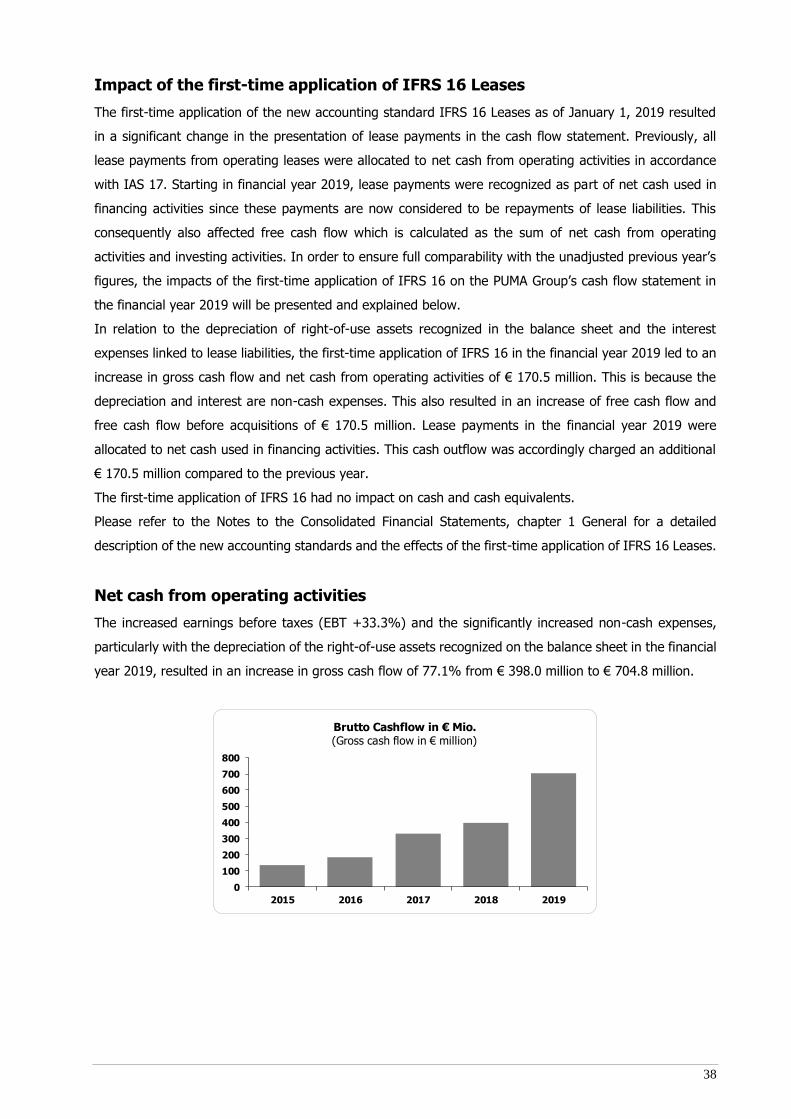
38
Impact of the first-time application of IFRS 16 Leases
The first-time application of the new accounting standard IFRS 16 Leases as of January 1, 2019 resulted
in a significant change in the presentation of lease payments in the cash flow statement. Previously, all
lease payments from operating leases were allocated to net cash from operating activities in accordance
with IAS 17. Starting in financial year 2019, lease payments were recognized as part of net cash used in
financing activities since these payments are now considered to be repayments of lease liabilities. This
consequently also affected free cash flow which is calculated as the sum of net cash from operating
activities and investing activities. In order to ensure full comparability with the unadjusted previous year’s
figures, the impacts of the first-time application of IFRS 16 on the PUMA Group’s cash flow statement in
the financial year 2019 will be presented and explained below.
In relation to the depreciation of right-of-use assets recognized in the balance sheet and the interest
expenses linked to lease liabilities, the first-time application of IFRS 16 in the financial year 2019 led to an
increase in gross cash flow and net cash from operating activities of € 170.5 million. This is because the
depreciation and interest are non-cash expenses. This also resulted in an increase of free cash flow and
free cash flow before acquisitions of € 170.5 million. Lease payments in the financial year 2019 were
allocated to net cash used in financing activities. This cash outflow was accordingly charged an additional
€ 170.5 million compared to the previous year.
The first-time application of IFRS 16 had no impact on cash and cash equivalents.
Please refer to the Notes to the Consolidated Financial Statements, chapter 1 General for a detailed
description of the new accounting standards and the effects of the first-time application of IFRS 16 Leases.
Net cash from operating activities
The increased earnings before taxes (EBT +33.3%) and the significantly increased non-cash expenses,
particularly with the depreciation of the right-of-use assets recognized on the balance sheet in the financial
year 2019, resulted in an increase in gross cash flow of 77.1% from € 398.0 million to € 704.8 million.
0
100
200
300
400
500
600
700
800
2015 2016 2017 2018 2019
Brutto Cashflow in € Mio.(Gross cash flow in € million)
39
The continuing strong focus on working capital management significantly contributed to the fact that the
cash outflow from the change in net current assets* only increased from € -38.0 million in the previous
year to € -44.5 million in the financial year 2019. Cash outflow from tax payments and dividends received
increased from € -81.9 million in the previous year to € -111.5 million in the financial year 2019. Overall,
this resulted in an improvement of net cash from operating activities by € 270.7 million from € 278.1 million
to € 548.8 million. Even without the aforementioned one-off effect of € 170.5 million relating to the first-
time application of IFRS 16 Leases, net cash from operating activities would have improved by slightly more
than € 100 million in 2019 compared to the previous year.
Net cash used in investing activities
Net cash used in investing activities rose from € 105.3 million to € 218.7 million in the financial year 2019.
The investments in fixed assets increased in accordance with our investment plan from € 130.2 million in
the previous year to € 218.4 million in 2019. The increase referred primarily to investments in own retail
stores and into the new multi-channel distribution center in Germany. In addition, investments into the
improvement of the IT infrastructure continued.
Payments for acquisitions in 2019 were related to the acquisition of the remaining shares of the Genesis
Group International Ltd.
________________________________________________________________________________________________________
* Net current assets include normal working capital line items plus current assets and liabilities, which are not normally
part of the working capital calculation. Current lease liabilities are not part of the net current assets.
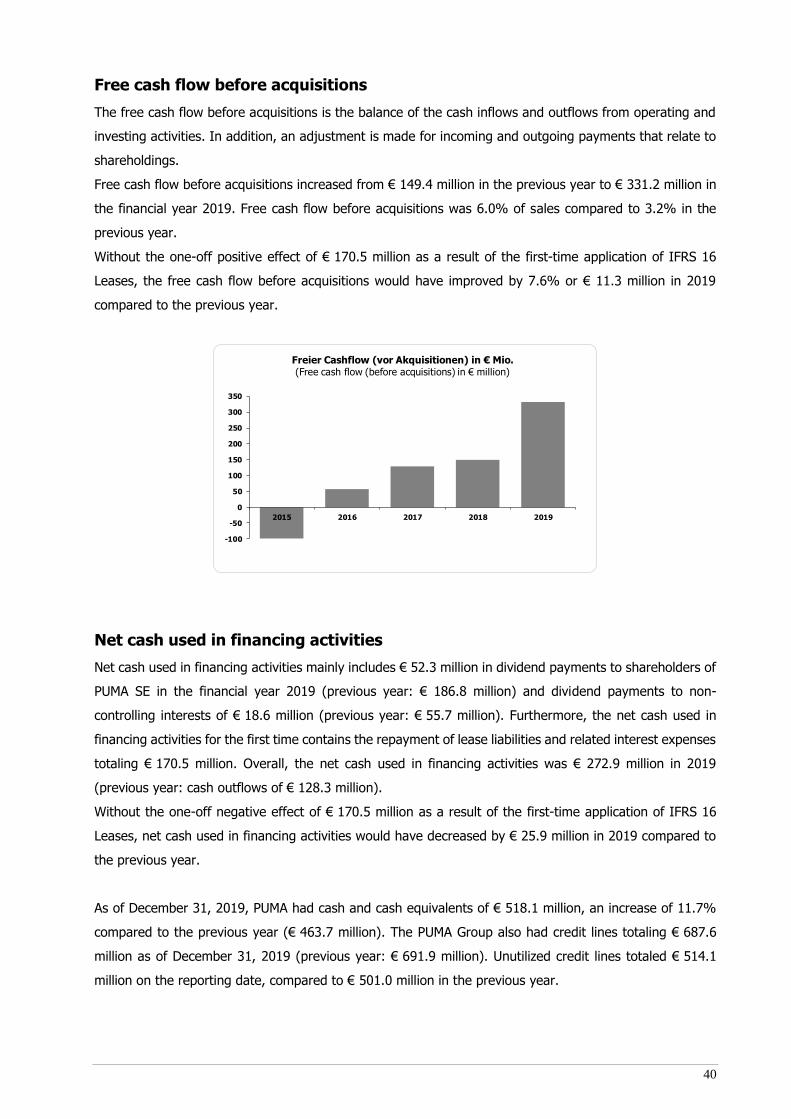
40
Free cash flow before acquisitions
The free cash flow before acquisitions is the balance of the cash inflows and outflows from operating and
investing activities. In addition, an adjustment is made for incoming and outgoing payments that relate to
shareholdings.
Free cash flow before acquisitions increased from € 149.4 million in the previous year to € 331.2 million in
the financial year 2019. Free cash flow before acquisitions was 6.0% of sales compared to 3.2% in the
previous year.
Without the one-off positive effect of € 170.5 million as a result of the first-time application of IFRS 16
Leases, the free cash flow before acquisitions would have improved by 7.6% or € 11.3 million in 2019
compared to the previous year.
Net cash used in financing activities
Net cash used in financing activities mainly includes € 52.3 million in dividend payments to shareholders of
PUMA SE in the financial year 2019 (previous year: € 186.8 million) and dividend payments to non-
controlling interests of € 18.6 million (previous year: € 55.7 million). Furthermore, the net cash used in
financing activities for the first time contains the repayment of lease liabilities and related interest expenses
totaling € 170.5 million. Overall, the net cash used in financing activities was € 272.9 million in 2019
(previous year: cash outflows of € 128.3 million).
Without the one-off negative effect of € 170.5 million as a result of the first-time application of IFRS 16
Leases, net cash used in financing activities would have decreased by € 25.9 million in 2019 compared to
the previous year.
As of December 31, 2019, PUMA had cash and cash equivalents of € 518.1 million, an increase of 11.7%
compared to the previous year (€ 463.7 million). The PUMA Group also had credit lines totaling € 687.6
million as of December 31, 2019 (previous year: € 691.9 million). Unutilized credit lines totaled € 514.1
million on the reporting date, compared to € 501.0 million in the previous year.
-100
-50
0
50
100
150
200
250
300
350
2015 2016 2017 2018 2019
Freier Cashflow (vor Akquisitionen) in € Mio.(Free cash flow (before acquisitions) in € million)
41
Statement regarding the Business Development and the Overall
Situation of the Group
Overall, we are very satisfied with the business and economic development of the PUMA Group in the past
financial year. In 2019, PUMA was able to fully achieve or even slightly exceed its financial targets, which
had already been raised during the year. We owe this in particular to the further consistent implementation
of our "Forever Faster" corporate strategy. We have therefore continued to make targeted investments in
marketing and concluded contracts with internationally renowned football clubs, such as Manchester City
and Valencia CF, to strengthen our position as a sports brand and further increase our brand heat.
Moreover, the strategic focus on the further improvement of our product range for women and the return
to basketball have significantly contributed to the successful business performance in 2019. The opening
of our new flagship store on Fifth Avenue in New York and the project launch of our new multi-channel
distribution centers in Germany and the U.S. represented additional milestones in PUMA's organizational
development in the past financial year.
PUMA was again able to record a strong growth in sales with a currency-adjusted sales growth of 16.7%
in 2019. All regions and all product divisions contributed to this development with double-digit growth. In
2019, we were also once again able to make significant improvements in terms of profitability. In 2019,
the operating result (EBIT), net earnings and earnings per share increased by more than 30% compared
to the previous year. In addition to the strong sales growth, this is primarily due to the improvement in the
gross profit margin and also to the decrease in the cost ratio of other operating expenses. In the past
financial year, the operating result of € 440.2 million was even slightly above our forecast of € 420 million
to € 430 million, which had been raised during the year. Earnings per share rose by 40% from € 1.25 to
€ 1.76 compared to the previous year. This means we fully achieved and even slightly exceeded our
profitability targets in the past financial year.
With regards to the balance sheet, we believe that PUMA has continued to have an extremely solid capital
base. On the balance sheet date, the equity of the PUMA Group was more than € 1.9 billion (previous year:
€ 1.7 billion) and the equity ratio was just under 44%. Furthermore, the consistent focus on working capital
management contributed to the fact that working capital increased by only 9% compared to the previous
year despite the significant increase in sales. The increase in earnings before taxes (EBT) and the working
capital management in the past financial year also contributed to a significant improvement in cash flow.
Free cash flow before acquisitions improved in 2019 by 7.6% or € 11.3 million to € 331.2 million, even if
the one-off positive effect of € 170.5 million from the first-time application of IFRS 16 is disregarded. Cash
and cash equivalents amounted to € 518.1 million on the balance sheet date (previous year: € 463.7
million).
As a result, the asset, financial and income situation of the PUMA Group is overall solid at the time the
Combined Management Report was prepared. This enables the Management Board and the Supervisory
Board to propose to the Annual General Meeting on May 7, 2020, a dividend of € 0.50 per share for the
financial year 2019. This corresponds to a payout ratio of 28.5% in relation to the consolidated net earnings
and is in line with our dividend policy.
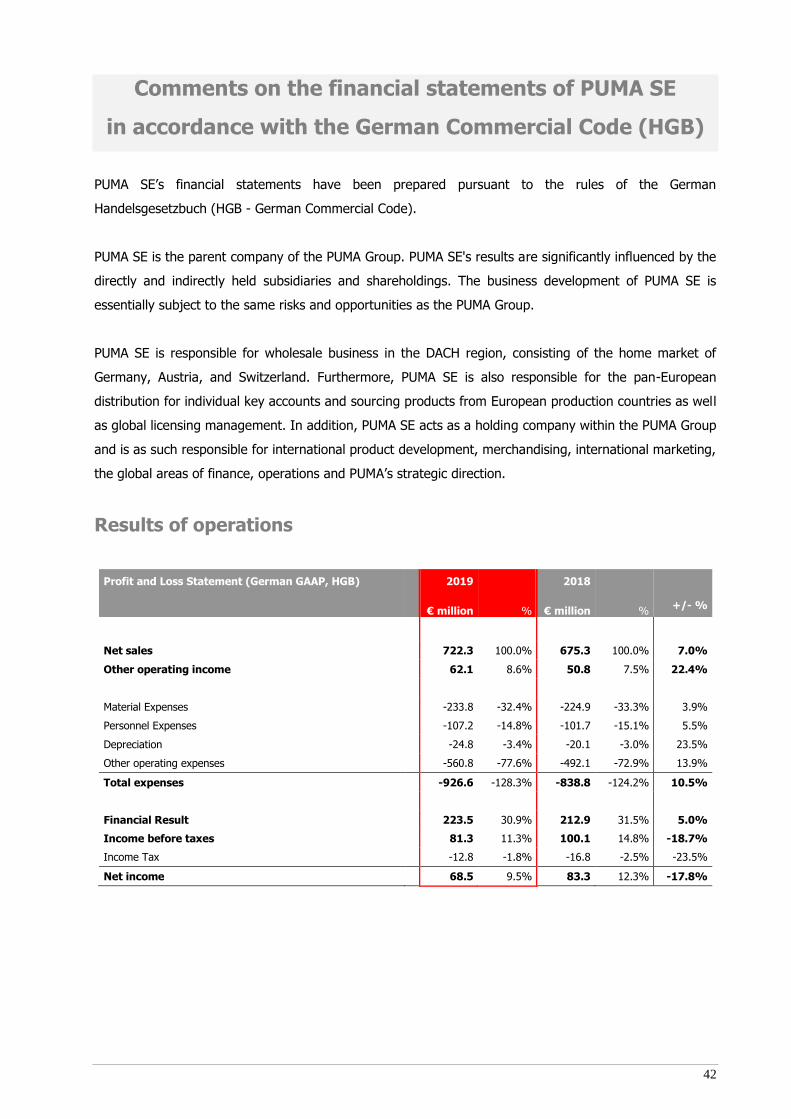
42
Comments on the financial statements of PUMA SE
in accordance with the German Commercial Code (HGB)
PUMA SE’s financial statements have been prepared pursuant to the rules of the German
Handelsgesetzbuch (HGB - German Commercial Code).
PUMA SE is the parent company of the PUMA Group. PUMA SE's results are significantly influenced by the
directly and indirectly held subsidiaries and shareholdings. The business development of PUMA SE is
essentially subject to the same risks and opportunities as the PUMA Group.
PUMA SE is responsible for wholesale business in the DACH region, consisting of the home market of
Germany, Austria, and Switzerland. Furthermore, PUMA SE is also responsible for the pan-European
distribution for individual key accounts and sourcing products from European production countries as well
as global licensing management. In addition, PUMA SE acts as a holding company within the PUMA Group
and is as such responsible for international product development, merchandising, international marketing,
the global areas of finance, operations and PUMA’s strategic direction.
Results of operations
Profit and Loss Statement (German GAAP, HGB) 2019 2018
€ million % € million %
+/- %
Net sales 722.3 100.0% 675.3 100.0% 7.0%
Other operating income 62.1 8.6% 50.8 7.5% 22.4%
Material Expenses -233.8 -32.4% -224.9 -33.3% 3.9%
Personnel Expenses -107.2 -14.8% -101.7 -15.1% 5.5%
Depreciation -24.8 -3.4% -20.1 -3.0% 23.5%
Other operating expenses -560.8 -77.6% -492.1 -72.9% 13.9%
Total expenses -926.6 -128.3% -838.8 -124.2% 10.5%
Financial Result 223.5 30.9% 212.9 31.5% 5.0%
Income before taxes 81.3 11.3% 100.1 14.8% -18.7%
Income Tax -12.8 -1.8% -16.8 -2.5% -23.5%
Net income 68.5 9.5% 83.3 12.3% -17.8%
43
Net sales rose in the financial year 2019 overall by 7.0% to € 722.3 million. The increase resulted from
both increased product sales and commission income from license management. Revenue from PUMA SE
product sales increased by 7.6% to € 354.6 million. The royalty and commission income included in net
sales increased by 10.7% to € 335.6 million. The other revenue, which mainly consisted of recharges of
costs to affiliated companies was € 32.1 million in 2019 (previous year: € 42.4 million).
Other operating income amounted to € 62.1 million in 2019 (previous year: € 50.8 million) and includes
in particular realized and unrealized gains from currency conversion related to the measurement of
receivables and payables in foreign currencies on the balance sheet date.
The total expenditure from material expenses, personnel expenses, depreciation and other operating
expenses increased by 10.5% to € 926.6 million compared to the previous year (previous year: total € 838.8
million). The increase in material expenses was associated with the increase in sales. Depreciation increased
primarily due to investments in IT and the expansion of the administration building in Herzogenaurach in
the previous year. Other operating expenses increased compared to the previous year due to higher
marketing expenditures as a result of new sponsoring agreements with clubs and athletes. Furthermore,
higher warehousing and freight costs, in relation to the increase in sales and higher inventory, contributed
to the increase in other operating expenses.
The financial result improved compared to the previous year by 5.0% to € 223.5 million. The
improvement was due to higher dividends from affiliated companies, while the income from the transfer of
profits from affiliated companies decreased and expenses from loss transfers increased.
Income before taxes fell in 2019 by 18.7% from € 100.1 million to € 81.3 million. Taxes on income
amounted to € 12.8 million (previous year: € 16.8 million). These include current income taxes for 2019
totaling € 2.1 million, taxes on income from previous years of € 0.1 million, and expenditures for foreign
withholding taxes on license and dividend payments in 2019 of € 15.8 million. In addition, income tax
reimbursements of € 5.2 million for previous years, after a mutual agreement procedure has been settled,
are included. Net income in the financial year 2019 was € 68.5 million compared to € 83.3 million in the
previous year.
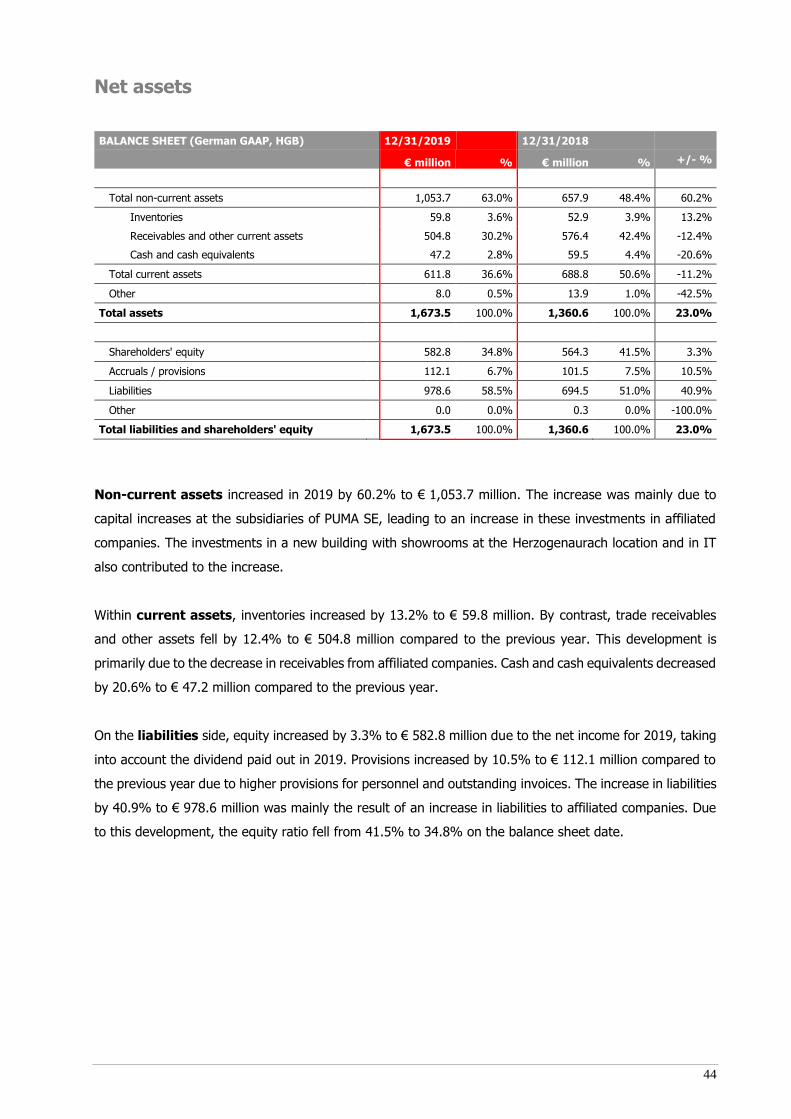
44
Net assets
BALANCE SHEET (German GAAP, HGB) 12/31/2019 12/31/2018
€ million % € million % +/- %
Total non-current assets 1,053.7 63.0% 657.9 48.4% 60.2%
Inventories 59.8 3.6% 52.9 3.9% 13.2%
Receivables and other current assets 504.8 30.2% 576.4 42.4% -12.4%
Cash and cash equivalents 47.2 2.8% 59.5 4.4% -20.6%
Total current assets 611.8 36.6% 688.8 50.6% -11.2%
Other 8.0 0.5% 13.9 1.0% -42.5%
Total assets 1,673.5 100.0% 1,360.6 100.0% 23.0%
Shareholders' equity 582.8 34.8% 564.3 41.5% 3.3%
Accruals / provisions 112.1 6.7% 101.5 7.5% 10.5%
Liabilities 978.6 58.5% 694.5 51.0% 40.9%
Other 0.0 0.0% 0.3 0.0% -100.0%
Total liabilities and shareholders' equity 1,673.5 100.0% 1,360.6 100.0% 23.0%
Non-current assets increased in 2019 by 60.2% to € 1,053.7 million. The increase was mainly due to
capital increases at the subsidiaries of PUMA SE, leading to an increase in these investments in affiliated
companies. The investments in a new building with showrooms at the Herzogenaurach location and in IT
also contributed to the increase.
Within current assets, inventories increased by 13.2% to € 59.8 million. By contrast, trade receivables
and other assets fell by 12.4% to € 504.8 million compared to the previous year. This development is
primarily due to the decrease in receivables from affiliated companies. Cash and cash equivalents decreased
by 20.6% to € 47.2 million compared to the previous year.
On the liabilities side, equity increased by 3.3% to € 582.8 million due to the net income for 2019, taking
into account the dividend paid out in 2019. Provisions increased by 10.5% to € 112.1 million compared to
the previous year due to higher provisions for personnel and outstanding invoices. The increase in liabilities
by 40.9% to € 978.6 million was mainly the result of an increase in liabilities to affiliated companies. Due
to this development, the equity ratio fell from 41.5% to 34.8% on the balance sheet date.
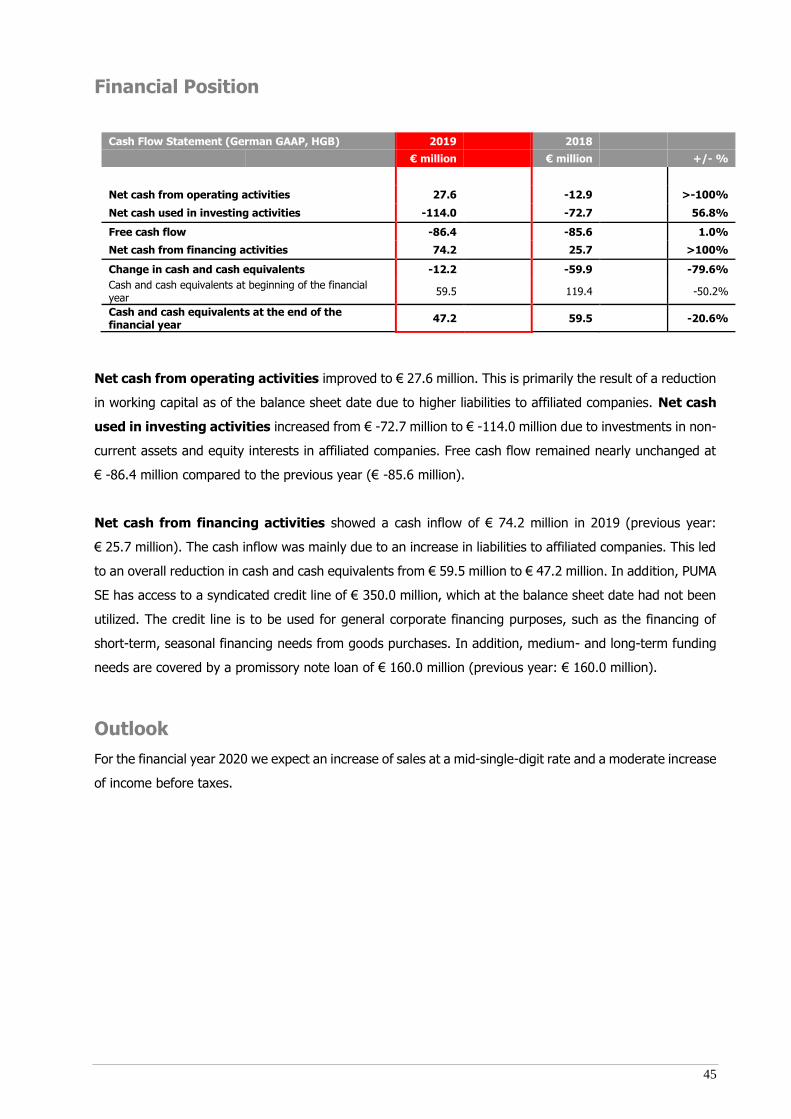
45
Financial Position
Cash Flow Statement (German GAAP, HGB) 2019 2018
€ million € million +/- %
Net cash from operating activities 27.6 -12.9 >-100%
Net cash used in investing activities -114.0 -72.7 56.8%
Free cash flow -86.4 -85.6 1.0%
Net cash from financing activities 74.2 25.7 >100%
Change in cash and cash equivalents -12.2 -59.9 -79.6%
Cash and cash equivalents at beginning of the financial year
59.5 119.4 -50.2%
Cash and cash equivalents at the end of the financial year
47.2 59.5 -20.6%
Net cash from operating activities improved to € 27.6 million. This is primarily the result of a reduction
in working capital as of the balance sheet date due to higher liabilities to affiliated companies. Net cash
used in investing activities increased from € -72.7 million to € -114.0 million due to investments in non-
current assets and equity interests in affiliated companies. Free cash flow remained nearly unchanged at
€ -86.4 million compared to the previous year (€ -85.6 million).
Net cash from financing activities showed a cash inflow of € 74.2 million in 2019 (previous year:
€ 25.7 million). The cash inflow was mainly due to an increase in liabilities to affiliated companies. This led
to an overall reduction in cash and cash equivalents from € 59.5 million to € 47.2 million. In addition, PUMA
SE has access to a syndicated credit line of € 350.0 million, which at the balance sheet date had not been
utilized. The credit line is to be used for general corporate financing purposes, such as the financing of
short-term, seasonal financing needs from goods purchases. In addition, medium- and long-term funding
needs are covered by a promissory note loan of € 160.0 million (previous year: € 160.0 million).
Outlook
For the financial year 2020 we expect an increase of sales at a mid-single-digit rate and a moderate increase
of income before taxes.
46
Further Information
Information concerning Takeovers
The following information, valid December 31, 2019, is presented in accordance with Art. 9 p. 1 c) (ii) of
the SE Regulation in conjunction with Sections 289a, 315a German Commercial Code (HGB). Details under
Sections 289a, 315a HGB which do not apply at PUMA SE are not mentioned.
Composition of the subscribed capital (Sections 289a [1][1][1], 315a [1][1][3] HGB)
On the balance sheet date, subscribed capital totaled € 150,824,640.00 and was divided into 150.824.640
no-par-value shares with a proportional amount in the statutory capital of EUR 1.00 per share. As of the
balance sheet date, the Company held 1,276,839 treasury shares.
Shareholdings exceeding 10% of the voting rights (Sections 289a [1][1][3], 315a [1][1][3]
HGB)
As of December 31, 2019, there was one shareholding in PUMA SE that exceeded 10% of the voting rights.
It was held by the Pinault family via several companies controlled by them (ranked by size of stake held by
the Pinault family: Financière Pinault S.C.A., Artémis S.A.S. and Kering S.A.). The shareholding of Kering
S.A. in PUMA SE amounted to 15.7% of the share capital according to Kering’s press release from May 16,
2018. The shareholding of Artémis S.A.S. and Kering S.A. amounts to 44.22% of the share capital according
to their voting rights notification as of May 24, 2018.
Statutory provisions and regulations of the Articles of Association on the appointment and
dismissal of the members of the Management Board and on amendments to the Articles of
Association (Sections 289a [1][1][6], 315a [1][1][6] HGB)
Regarding the appointment and dismissal of the members of the Management Board, reference is made to
the applicable statutory requirements of § 84 German Stock Corporation Act (AktG). Moreover, Section 7[1]
of PUMA SE’s Articles of Association stipulates that Management Board shall consist of two members in the
minimum; the Supervisory Board determines the number of members in the Management Board. The
Supervisory Board may appoint deputy members of the Management Board and appoint a member of the
Management Board as chairperson of the Management Board. Members of the Management Board may be
dismissed only for good cause, within the meaning of Section 84[3] of the German Stock Corporation Act
(AktG) or if the employment agreement is terminated, in which case a resolution must be adopted by the
Supervisory Board with a simple majority of the votes cast.
Amendments to the Articles of Association of the Company require a resolution by the Annual General
Meeting. Resolutions of the Annual General Meeting require a majority according to Art. 59 SE Regulation
and Sections 133[1], 179 [2] [1] German Stock Corporation Act (AktG) (i.e. a simple majority of votes and
a majority of at least three quarters of the share capital represented at the time the resolution is adopted).
The Company has not made use of Section 51 SEAG.
47
Authority of the Management Board to issue or repurchase shares (Sections 289a [1][1][7],
315a [1][1][7] HGB)
The authority of the Management Board to issue shares result from Section 4 of the Articles of Association
and from the statutory provisions:
Authorized Capital
The Management Board shall be authorized with the approval of the Supervisory Board to increase the
share capital of the Company by up to EUR 15,000,000.00 by issuing, once or several times, new no par-
value bearer shares against contributions in cash and/or kind until 11 April 2022 (Authorized Capital 2017).
In case of capital increases against contributions in cash, the new shares may be acquired by one or several
banks, designated by the Management Board, subject to the obligation to offer them to the shareholders
for subscription (indirect pre-emption right).
The shareholders shall generally be entitled to pre-emption rights. However, the Management Board shall
be authorized with the approval of the Supervisory Board to partially or completely exclude pre-emption
rights
• to avoid peak amounts;
• in case of capital increases against contributions in cash if the pro-rated amount of the share capital
attributable to the new shares for which pre-emption rights have been excluded does not exceed
10% of the share capital and the issue price of the newly created shares is not significantly lower
than the relevant exchange price for already listed shares of the same class, Section 186 (3)
sentence 4 AktG. The 10% limit of the share capital shall apply at the time of the resolution on this
authorization by the Annual General Meeting as well as at the time of exercise of the authorization.
Shares of the Company (i) which are issued or sold during the term of the Authorised Capital 2017
excluding shareholders’ pre-emption rights directly or respectively applying Section 186 (3)
sentence 4 AktG or (ii) which are or can be issued to service option and convertible bonds applying
Section 186 (3) sentence 4 AktG while excluding shareholders’ pre-emption rights during the term
of the Authorised Capital 2017, shall be counted towards said limit of 10%.;
• in case of capital increases against contributions in cash insofar as it is required to grant pre-
emption rights regarding the Company’s shares to holders of option or convertible bonds which
have been or will be issued by the Company or its direct or indirect subsidiaries to such an extent
to which they would be entitled after exercising option or conversion rights or fulfilling the
conversion obligation as a shareholder;
• in case of capital increases against contributions in kind for carrying out mergers or for the (also
indirect) acquisition of companies, participation in companies or parts of companies or other assets
including intellectual property rights and receivables against the Company or any companies
controlled by it in the sense of Section 17 AktG.
The total amount of shares issued or to be issued based upon this authorization while excluding
shareholders’ pre-emption rights may neither exceed 20% of the share capital at the time of the
authorization becoming effective nor at the time of exercising the authorization; this limit must include all
shares which have been disposed of or issued or are to be issued during the term of this authorization
based on other authorizations while excluding pre-emption rights or which are to be issued because of an
48
issue of option or convertible bonds during the term of this authorization while excluding pre-emption
rights.
The Management Board shall be entitled with the approval of the Supervisory Board to determine the
remaining terms of the rights associated with the new shares as well as the conditions of the issuance of
shares.
The Management Board of PUMA SE did not make use of the existing Authorized Capital 2017 in the current
reporting period.
Conditional Capital
The Annual General Meeting of 12 April 2018 has authorized the Management Board until 11 April 2023
with the approval of the Supervisory Board to issue once or several times, in whole or in part, and at the
same time in different tranches bearer and/or registered convertible bonds and/or bonds with warrants,
and participation rights and/or participating bonds or combinations thereof with or without maturity
restrictions in the total nominal amount of up to EUR 1,000,000,000.00 (Conditional Capital 2018).
The share capital is conditionally increased by up to EUR 30,164,920.00 by issue of up to 30,164,920 new
no-par bearer shares. The conditional capital increase shall only be implemented to the extent that
option/conversion rights are exercised or the option/conversion obligations are performed or tenders are
carried out and to the extent that other forms of performance are not applied.
No use has been made of this authorization to date.
Authorization to purchase treasury shares
The resolution adopted by the Annual General Meeting on May 6, 2015 authorized the company to purchase
treasury shares up to a value of 10% of the share capital until May 5, 2020.
Significant agreements of the Company which are subject to a change of control as a result of
a takeover bid and the resulting effects (Section 289a [1][1][8], 315a [1][1][8] HGB)
Material financing agreements of PUMA SE with its creditors contain the standard change-of-control clauses.
In the case of change of control the creditor is entitled to termination and early calling-in of any outstanding
amounts.
For more details, please refer to the relevant disclosures in the Notes to the Consolidated Financial
Statements (chapter 18).
49
Compensation Report
Compensation Philosophy
The Management Board compensation system is designed to create incentives for a sustainable and profit-
oriented company performance. The objective of the compensation system is to stimulate the
implementation of long-term Group strategy by ensuring that the relevant success parameters that govern
the performance-based compensation are aligned with the PUMA SE management system. Furthermore,
the long-term interests of our shareholders are taken into account by making the variable compensation
strongly dependent on the performance of the PUMA SE share.
With a greater share of performance-based and therefore variable compensation, the intention is to reward
the contribution of our Management Board members towards a sustainable development of our Company,
while negative deviations from the set targets will result in a significant reduction of variable compensation.
Governance in Compensation Matters
It is the responsibility of the PUMA SE Supervisory Board to determine the compensation of the
Management Board. The entire Supervisory Board decides on matters relating to the compensation of the
Management Board members based on the respective recommendations of the Personnel Committee which
is comprised of members of the Supervisory Board. Criteria for calculating the total compensation are the
responsibilities and performance of the individual Management Board member, the economic situation,
long-term strategic planning and related goals, the sustainability of targeted results and the company’s
long-term prospects.
Overview of compensation elements
The compensation of the Management Board consists of non-performance-based and performance-based
components. The non-performance-based components comprise the basic compensation, company pension
contributions and other fringe benefits, while the performance-based components are divided into two
parts, a bonus and a component with long-term incentive effect:
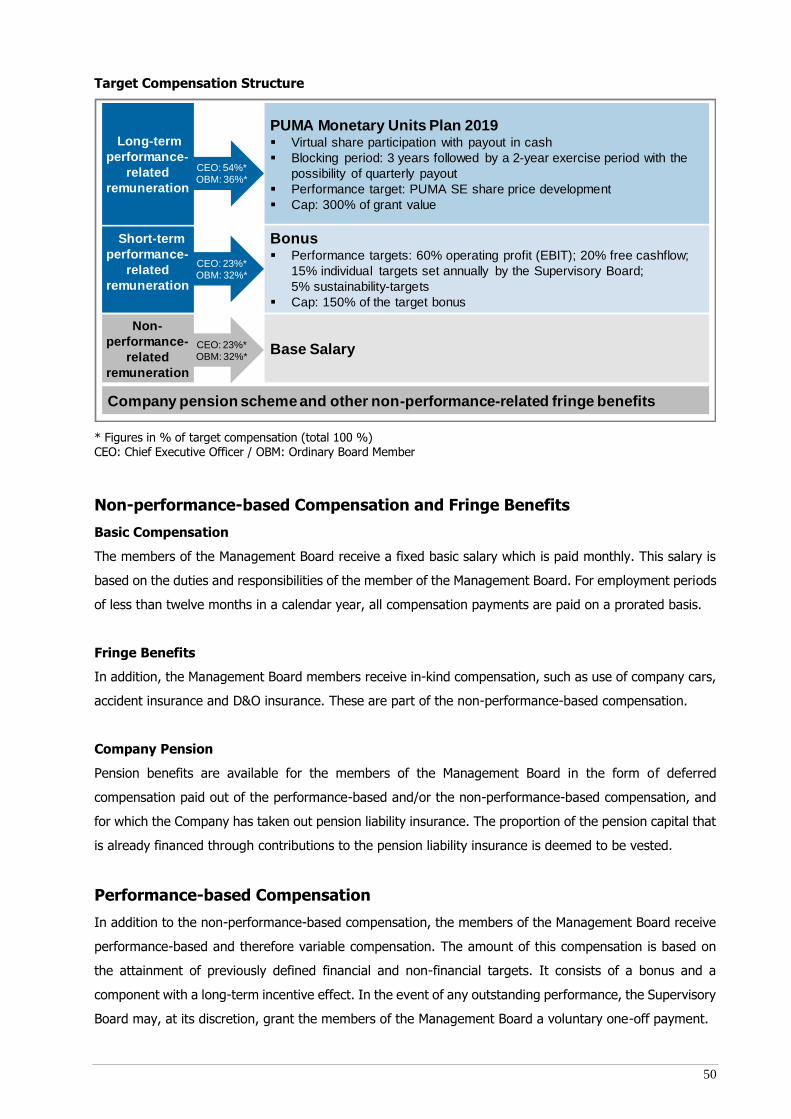
50
Target Compensation Structure
* Figures in % of target compensation (total 100 %) CEO: Chief Executive Officer / OBM: Ordinary Board Member
Non-performance-based Compensation and Fringe Benefits
Basic Compensation
The members of the Management Board receive a fixed basic salary which is paid monthly. This salary is
based on the duties and responsibilities of the member of the Management Board. For employment periods
of less than twelve months in a calendar year, all compensation payments are paid on a prorated basis.
Fringe Benefits
In addition, the Management Board members receive in-kind compensation, such as use of company cars,
accident insurance and D&O insurance. These are part of the non-performance-based compensation.
Company Pension
Pension benefits are available for the members of the Management Board in the form of deferred
compensation paid out of the performance-based and/or the non-performance-based compensation, and
for which the Company has taken out pension liability insurance. The proportion of the pension capital that
is already financed through contributions to the pension liability insurance is deemed to be vested.
Performance-based Compensation
In addition to the non-performance-based compensation, the members of the Management Board receive
performance-based and therefore variable compensation. The amount of this compensation is based on
the attainment of previously defined financial and non-financial targets. It consists of a bonus and a
component with a long-term incentive effect. In the event of any outstanding performance, the Supervisory
Board may, at its discretion, grant the members of the Management Board a voluntary one-off payment.
PUMA Monetary Units Plan 2019▪ Virtual share participation with payout in cash
▪ Blocking period: 3 years followed by a 2-year exercise period with the
possibility of quarterly payout
▪ Performance target: PUMA SE share price development
▪ Cap: 300% of grant value
Bonus▪ Performance targets: 60% operating profit (EBIT); 20% free cashflow;
15% individual targets set annually by the Supervisory Board;
5% sustainability-targets
▪ Cap: 150% of the target bonus
Base Salary
Short-term
performance-
related
remuneration
Non-
performance-
related
remuneration
Company pension scheme and other non-performance-related fringe benefits
Long-term
performance-
related
remuneration
CEO: 54%*OBM: 36%*
CEO: 23%*OBM: 32%*
CEO: 23%*OBM: 32%*
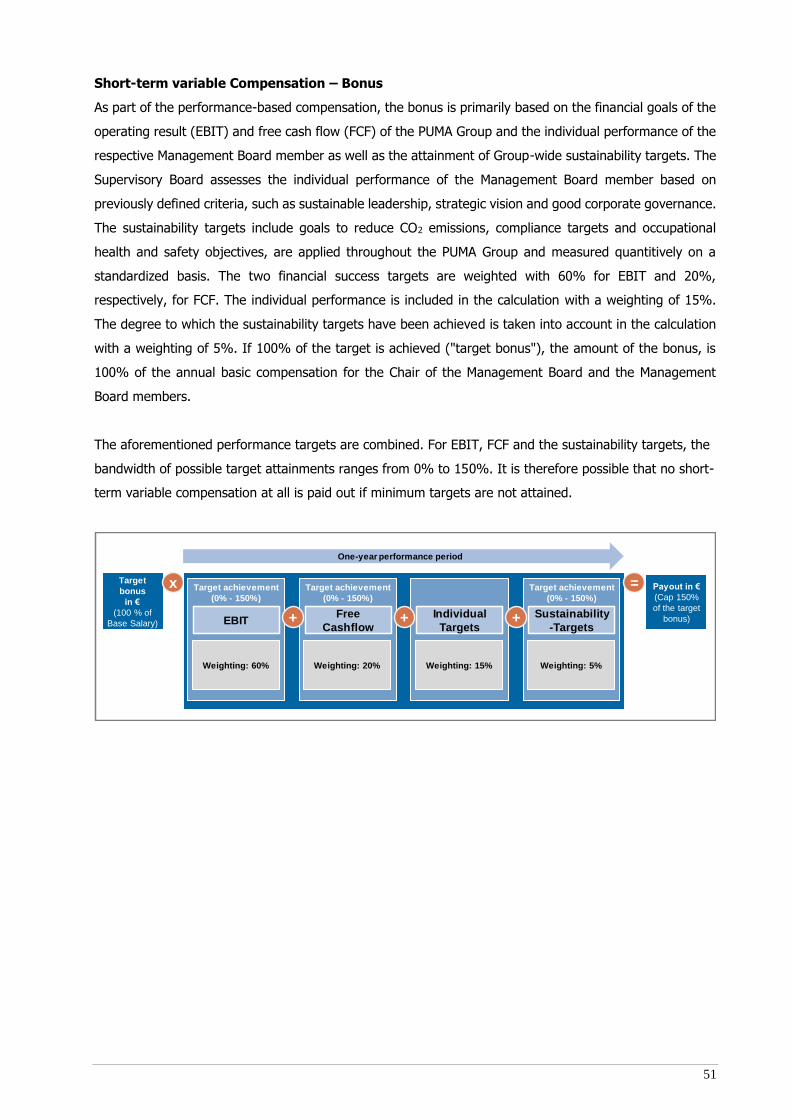
51
Short-term variable Compensation – Bonus
As part of the performance-based compensation, the bonus is primarily based on the financial goals of the
operating result (EBIT) and free cash flow (FCF) of the PUMA Group and the individual performance of the
respective Management Board member as well as the attainment of Group-wide sustainability targets. The
Supervisory Board assesses the individual performance of the Management Board member based on
previously defined criteria, such as sustainable leadership, strategic vision and good corporate governance.
The sustainability targets include goals to reduce CO2 emissions, compliance targets and occupational
health and safety objectives, are applied throughout the PUMA Group and measured quantitively on a
standardized basis. The two financial success targets are weighted with 60% for EBIT and 20%,
respectively, for FCF. The individual performance is included in the calculation with a weighting of 15%.
The degree to which the sustainability targets have been achieved is taken into account in the calculation
with a weighting of 5%. If 100% of the target is achieved ("target bonus"), the amount of the bonus, is
100% of the annual basic compensation for the Chair of the Management Board and the Management
Board members.
The aforementioned performance targets are combined. For EBIT, FCF and the sustainability targets, the
bandwidth of possible target attainments ranges from 0% to 150%. It is therefore possible that no short-
term variable compensation at all is paid out if minimum targets are not attained.
Target
bonus
in €
(100 % of
Base Salary)
Payout in €
(Cap 150%
of the target
bonus)
x
One-year performance period
Target achievement
(0% - 150%)
Target achievement
(0% - 150%)
EBITFree
Cashflow
Weighting: 60% Weighting: 20%
+ Individual
Targets
Weighting: 15%
+
Target achievement
(0% - 150%)
Sustainability
-Targets
Weighting: 5%
+
=
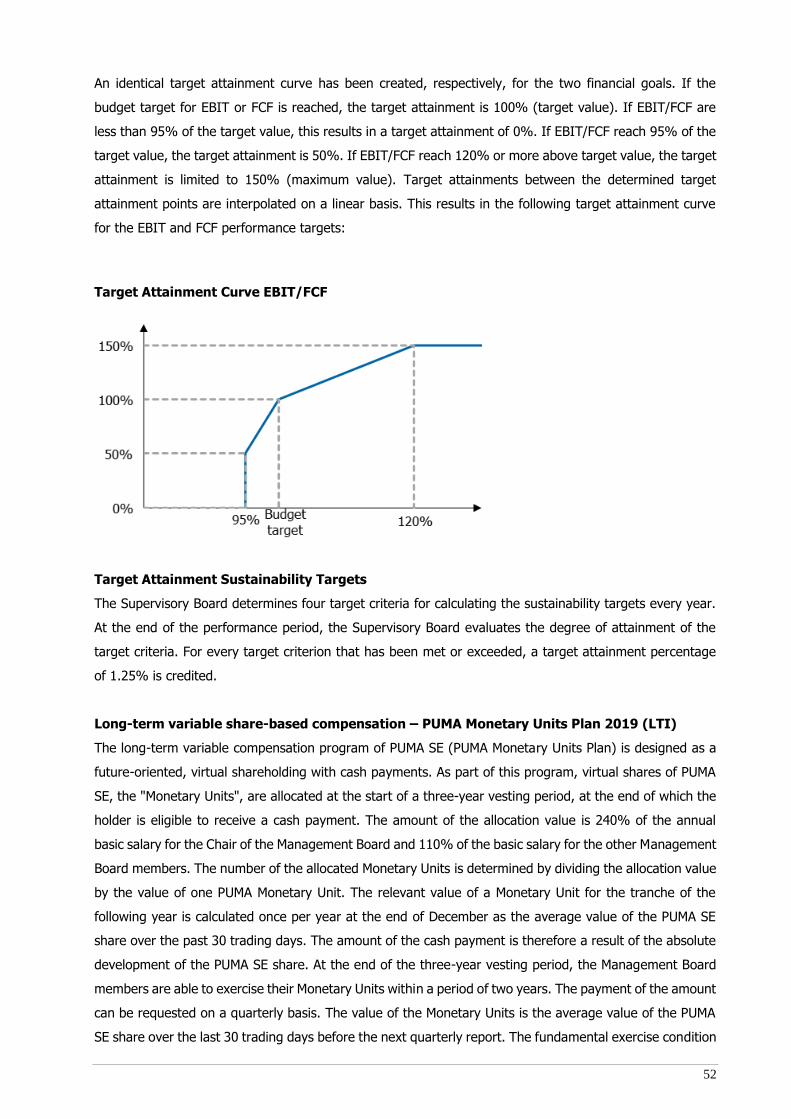
52
An identical target attainment curve has been created, respectively, for the two financial goals. If the
budget target for EBIT or FCF is reached, the target attainment is 100% (target value). If EBIT/FCF are
less than 95% of the target value, this results in a target attainment of 0%. If EBIT/FCF reach 95% of the
target value, the target attainment is 50%. If EBIT/FCF reach 120% or more above target value, the target
attainment is limited to 150% (maximum value). Target attainments between the determined target
attainment points are interpolated on a linear basis. This results in the following target attainment curve
for the EBIT and FCF performance targets:
Target Attainment Curve EBIT/FCF
Target Attainment Sustainability Targets
The Supervisory Board determines four target criteria for calculating the sustainability targets every year.
At the end of the performance period, the Supervisory Board evaluates the degree of attainment of the
target criteria. For every target criterion that has been met or exceeded, a target attainment percentage
of 1.25% is credited.
Long-term variable share-based compensation – PUMA Monetary Units Plan 2019 (LTI)
The long-term variable compensation program of PUMA SE (PUMA Monetary Units Plan) is designed as a
future-oriented, virtual shareholding with cash payments. As part of this program, virtual shares of PUMA
SE, the "Monetary Units", are allocated at the start of a three-year vesting period, at the end of which the
holder is eligible to receive a cash payment. The amount of the allocation value is 240% of the annual
basic salary for the Chair of the Management Board and 110% of the basic salary for the other Management
Board members. The number of the allocated Monetary Units is determined by dividing the allocation value
by the value of one PUMA Monetary Unit. The relevant value of a Monetary Unit for the tranche of the
following year is calculated once per year at the end of December as the average value of the PUMA SE
share over the past 30 trading days. The amount of the cash payment is therefore a result of the absolute
development of the PUMA SE share. At the end of the three-year vesting period, the Management Board
members are able to exercise their Monetary Units within a period of two years. The payment of the amount
can be requested on a quarterly basis. The value of the Monetary Units is the average value of the PUMA
SE share over the last 30 trading days before the next quarterly report. The fundamental exercise condition
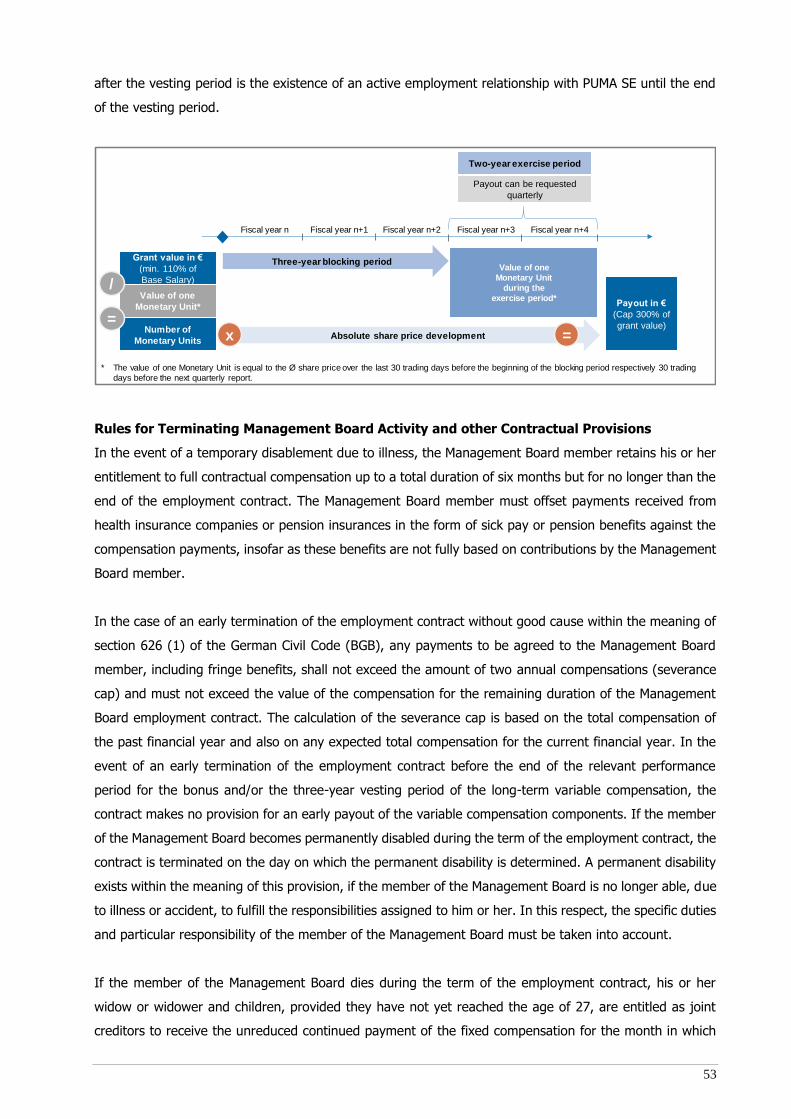
53
after the vesting period is the existence of an active employment relationship with PUMA SE until the end
of the vesting period.
Rules for Terminating Management Board Activity and other Contractual Provisions
In the event of a temporary disablement due to illness, the Management Board member retains his or her
entitlement to full contractual compensation up to a total duration of six months but for no longer than the
end of the employment contract. The Management Board member must offset payments received from
health insurance companies or pension insurances in the form of sick pay or pension benefits against the
compensation payments, insofar as these benefits are not fully based on contributions by the Management
Board member.
In the case of an early termination of the employment contract without good cause within the meaning of
section 626 (1) of the German Civil Code (BGB), any payments to be agreed to the Management Board
member, including fringe benefits, shall not exceed the amount of two annual compensations (severance
cap) and must not exceed the value of the compensation for the remaining duration of the Management
Board employment contract. The calculation of the severance cap is based on the total compensation of
the past financial year and also on any expected total compensation for the current financial year. In the
event of an early termination of the employment contract before the end of the relevant performance
period for the bonus and/or the three-year vesting period of the long-term variable compensation, the
contract makes no provision for an early payout of the variable compensation components. If the member
of the Management Board becomes permanently disabled during the term of the employment contract, the
contract is terminated on the day on which the permanent disability is determined. A permanent disability
exists within the meaning of this provision, if the member of the Management Board is no longer able, due
to illness or accident, to fulfill the responsibilities assigned to him or her. In this respect, the specific duties
and particular responsibility of the member of the Management Board must be taken into account.
If the member of the Management Board dies during the term of the employment contract, his or her
widow or widower and children, provided they have not yet reached the age of 27, are entitled as joint
creditors to receive the unreduced continued payment of the fixed compensation for the month in which
Two-year exercise period
Payout can be requested
quarterly
Fiscal year n Fiscal year n+1 Fiscal year n+2 Fiscal year n+3 Fiscal year n+4
* The value of one Monetary Unit is equal to the Ø share price over the last 30 trading days before the beginning of the blocking period respectively 30 trading
days before the next quarterly report.
Payout in €
(Cap 300% of
grant value)
Value of one
Monetary Unit
during the
exercise period*Value of one
Monetary Unit*
Grant value in €
(min. 110% of
Base Salary)
Number of
Monetary Units
/
=Absolute share price developmentx =
Three-year blocking period
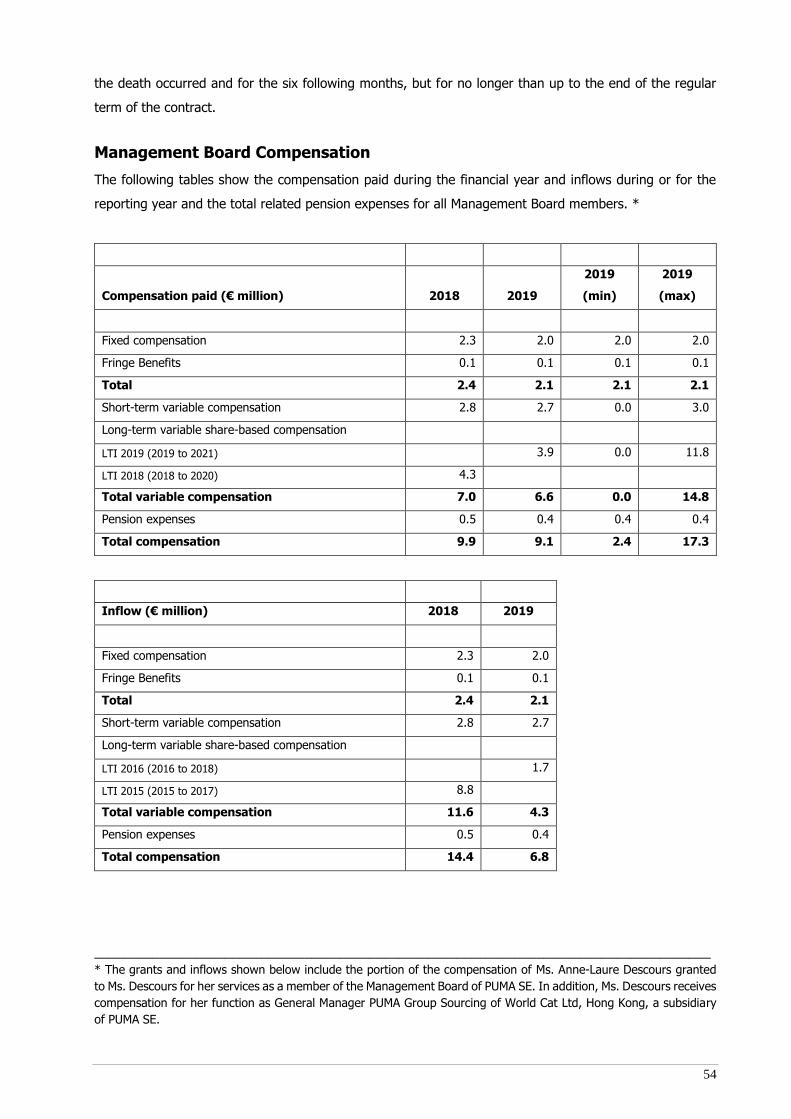
54
the death occurred and for the six following months, but for no longer than up to the end of the regular
term of the contract.
Management Board Compensation
The following tables show the compensation paid during the financial year and inflows during or for the
reporting year and the total related pension expenses for all Management Board members. *
Compensation paid (€ million) 2018 2019
2019
(min)
2019
(max)
Fixed compensation 2.3 2.0 2.0 2.0
Fringe Benefits 0.1 0.1 0.1 0.1
Total 2.4 2.1 2.1 2.1
Short-term variable compensation 2.8 2.7 0.0 3.0
Long-term variable share-based compensation
LTI 2019 (2019 to 2021) 3.9 0.0 11.8
LTI 2018 (2018 to 2020) 4.3
Total variable compensation 7.0 6.6 0.0 14.8
Pension expenses 0.5 0.4 0.4 0.4
Total compensation 9.9 9.1 2.4 17.3
Inflow (€ million) 2018 2019
Fixed compensation 2.3 2.0
Fringe Benefits 0.1 0.1
Total 2.4 2.1
Short-term variable compensation 2.8 2.7
Long-term variable share-based compensation
LTI 2016 (2016 to 2018) 1.7
LTI 2015 (2015 to 2017) 8.8
Total variable compensation 11.6 4.3
Pension expenses 0.5 0.4
Total compensation 14.4 6.8
_____________________________________________________________________________________
* The grants and inflows shown below include the portion of the compensation of Ms. Anne-Laure Descours granted
to Ms. Descours for her services as a member of the Management Board of PUMA SE. In addition, Ms. Descours receives
compensation for her function as General Manager PUMA Group Sourcing of World Cat Ltd, Hong Kong, a subsidiary
of PUMA SE.
55
Pension benefits are available for the members of the Management Board in the form of deferred
compensation paid out of the performance-based and/or the non-performance-based compensation, for
which the Company has taken out pension liability insurance. The proportion of the pension capital that is
already financed through contributions to the pension liability insurance is deemed to be vested. During
the financial year, PUMA allocated € 0.4 million for members of the Management Board (previous year:
€ 0.5 million). The present value of the pension benefits granted to active Management Board members of
€ 10.8 million as of December 31, 2019 (previous year: € 10.1 million) was netted against the pledged
asset value of the pension liability insurance on the balance sheet.
Compensation for former Management Board Members
The appointment of Lars Radoor Sørensen as member of the Management Board was terminated by mutual
agreement with effect from the end of January 31, 2019. At this point, Mr. Sørensen's Management Board
employment contract had a remaining term through December 31, 2020. Mr. Sørensen's Management
Board employment contract was terminated by mutual agreement with effect from the end of January 31,
2020. For the period from January 31, 2019 until January 31, 2020, the basic salary and short-term variable
compensation was paid out assuming a target attainment of 100%. The tranche of the long-term variable
compensation was prorated for 2018-2020 and reduced by 11/36. No tranche was granted for 2019-2021.
The compensation components for Mr. Sørensen based on his work as a Management Board member are
included in section “Management Board Compensation”.
There were pension obligations to former members of the Management Board and their widows/widowers
amounting to € 3.3 million (previous year: € 3.2 million) as well as contribution-based pension commitments
in connection with the deferred compensation of former members of the Management Board and Managing
Directors amounting to € 11.6 million (previous year: € 10.6 million). Both items were recognized as
liabilities within pension provisions to the extent they were not offset against asset values of an equal
amount. Pension obligations to former members of the Management Board and their widows/widowers
were incurred amounting to € 0.2 million (previous year: € 0.2 million).
Supervisory Board Compensation System
The Supervisory Board compensation system consists of two components. As for the Management Board,
the relevant criteria for calculating the compensation are the responsibilities and performance of the
individual Supervisory Board member, the long-term strategic planning and related goals, the sustainability
of achieved results and the Company’s long-term prospects. For this reason, the first component of the
Supervisory Board compensation is a fixed, non-performance-based amount, while the second component
is a performance-based compensation.
The non-performance-based component conforms to § 15 of the Articles of Association, according to which
each Supervisory Board member receives a fixed annual compensation of € 25,000.00. This amount is
payable after the Annual General Meeting for the respective financial year. In addition to the fixed, annual
compensation, the members of the Supervisory Board are entitled to an increase of their fixed
compensation based on their position on the board and their participation in committees. The Chair of the
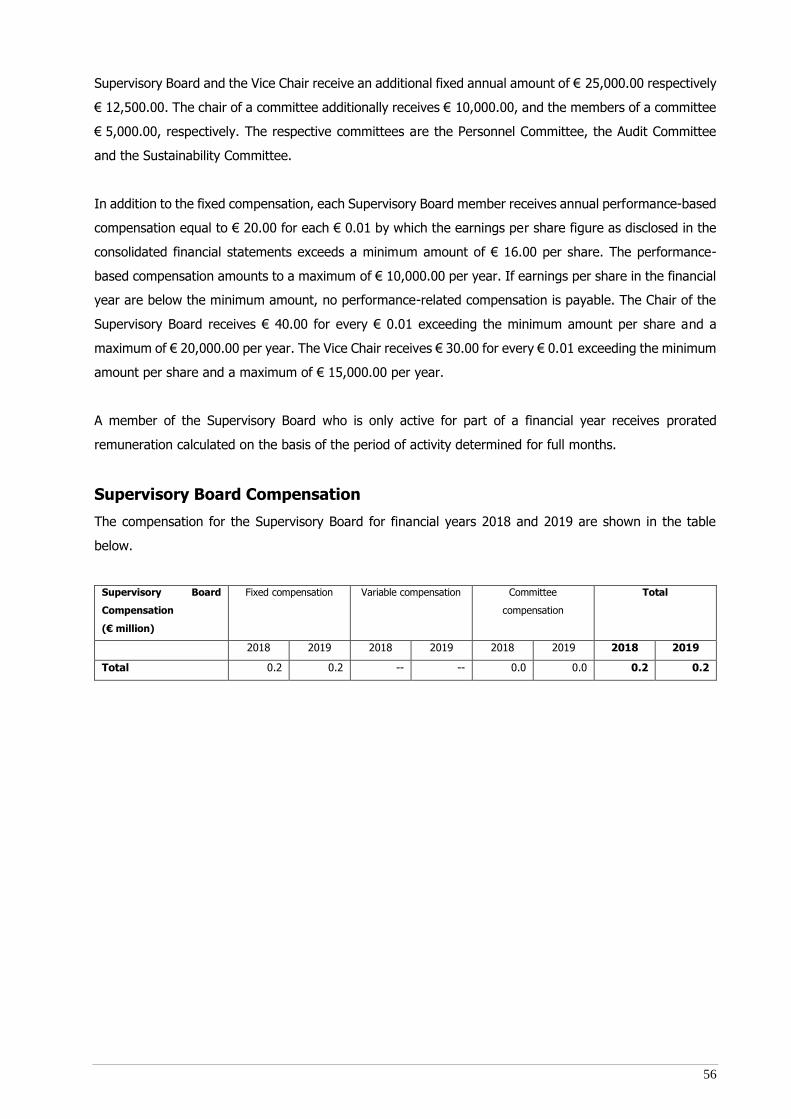
56
Supervisory Board and the Vice Chair receive an additional fixed annual amount of € 25,000.00 respectively
€ 12,500.00. The chair of a committee additionally receives € 10,000.00, and the members of a committee
€ 5,000.00, respectively. The respective committees are the Personnel Committee, the Audit Committee
and the Sustainability Committee.
In addition to the fixed compensation, each Supervisory Board member receives annual performance-based
compensation equal to € 20.00 for each € 0.01 by which the earnings per share figure as disclosed in the
consolidated financial statements exceeds a minimum amount of € 16.00 per share. The performance-
based compensation amounts to a maximum of € 10,000.00 per year. If earnings per share in the financial
year are below the minimum amount, no performance-related compensation is payable. The Chair of the
Supervisory Board receives € 40.00 for every € 0.01 exceeding the minimum amount per share and a
maximum of € 20,000.00 per year. The Vice Chair receives € 30.00 for every € 0.01 exceeding the minimum
amount per share and a maximum of € 15,000.00 per year.
A member of the Supervisory Board who is only active for part of a financial year receives prorated
remuneration calculated on the basis of the period of activity determined for full months.
Supervisory Board Compensation
The compensation for the Supervisory Board for financial years 2018 and 2019 are shown in the table
below.
Supervisory Board
Compensation
(€ million)
Fixed compensation Variable compensation Committee
compensation
Total
2018 2019 2018 2019 2018 2019 2018 2019
Total 0.2 0.2 -- -- 0.0 0.0 0.2 0.2
57
Corporate Governance Report including the Statement on
Corporate Governance in accordance with Section 289f and Section
315d HGB
Effective implementation of the principles of corporate governance is an important aspect of PUMA's
corporate policy. Transparent and responsible corporate governance is a key prerequisite for achieving
corporate targets and for increasing the Company’s value in a sustainable manner. The Management and
the Supervisory Board work closely with each other in the interests of the entire Company to ensure that
the Company is managed and monitored in an efficient way that will ensure sustainable added value
through good corporate governance. In the following the Management Board and the Supervisory Board
report on the corporate governance at PUMA SE in accordance with Section 3.10 of the German Corporate
Governance Code. This section also includes the Statement of Compliance in accordance with Art. 9(1) c(ii)
of the SE Regulation (SE-VO) in conjunction with Section 289f and Section 315d HGB. Pursuant to Section
317 (2) Sentence 6 of the German Commercial Code (HGB), the purpose of the audit of the statements
pursuant to Section 289f (2) and (5) and Section 315d of the HGB is limited to determining whether such
statements have actually been provided.
PUMA SE has the legal form of a European company (Societas Europaea, or SE). Being an SE headquartered
in Germany, PUMA SE is subject to European and German law for SEs while remaining subject to German
stock corporation law. As a company listed in Germany, PUMA SE adheres to the German Corporate
Governance Code (DCGK).
PUMA SE has a dual management system featuring strict personal and functional separation between the
Management Board and the Supervisory Board (two-tier board). Accordingly, the Management Board
manages the company while the Supervisory Board monitors and advises the Management Board.
Statement of Compliance pursuant to Section 161 AktG for 2019:
In their Statement of Compliance the Management Board and the Supervisory Board of PUMA SE declare
at least once a year whether the DCGK has been and is being observed. On November 9, 2019, the
Management Board and the Supervisory Board declared that PUMA SE has complied and will comply with
the recommendations of the DCGK (version dated February 7, 2017) since the last Statement of Compliance
dated November 9, 2018, with the following exceptions and, if not, why not.
Exceptions to the Code’s recommendations
- In derogation of No. 3.8 p. 3 of the Code, members of the Supervisory Board are provided with
D&O insurance with no deductible. The Supervisory Board feels that it can dispense with a
deductible for members of the Supervisory Board, because the D&O insurance is group insurance
for people in Germany and abroad, and a deductible is fairly unusual abroad.
58
- According to No. 4.2.3 p. 2 s. 4 of the Code both positive and negative developments shall be
taken into account when determining variable remuneration components. As regards negative
developments this recommendation is deviated from, since the structure of the PUMA Monetary
Unit Plan may not fully comply with the purpose of the recommendation, but it comes fairly close.
- In derogation of No. 4.2.3 p. 2 s. 6 of the Code the compensation of the members of the
Management Board does not show the maximum amount limits in total or their variable
compensation components. This is due to the fact that neither the existing PUMA Monetary Units
Plans 2016/2017/2018 nor the PUMA Board Member Bonus Plan nor the discretionary extra bonus
clause provide for a maximum amount.
- In derogation of No. 4.2.3 p. 2 s. 8 of the Code subsequent amendments to the performance
targets or comparison parameters are not excluded. This provides the possibility to the supervisory
board to react to extraordinary effects using its equitable discretion.
- According to No. 4.2.3 p. 3 of the Code the target level of pension benefits for every pension
commitment shall be established by the Supervisory Board. Due to the defined contribution plans,
PUMA does not comply with this recommendation.
- In accordance with the authorization by the Annual General Meeting on April 12, 2018, pursuant
to Section 286 p. 5 HGB, the Company shall not publish the amounts of compensation for individual
members of the Management Board until the authorization expires (Nos. 4.2.4 and 4.2.5 of the
Code). The members of the Management Board shall adhere to the authorization when they
prepare the annual financial statements. Based on the authorization of the Annual General Meeting,
and in derogation of No. 4.2.5 p. 3 of the Code the information stated in this Section regarding the
compensation of the members of the Management Board is not included in the Compensation
Report.
- In derogation of No. 5.4.6 p. 2 s. 2 of the Code, members of the Supervisory Board receive
performance-based compensation that is not linked to the sustainable success of the Company.
The compensation was authorized by the Annual General Meeting on April 12, 2018, it is stipulated
in the Articles of Association and is deemed to be proper and correct by PUMA SE.
- In derogation of No. 5.4.6. p. 3 of the Code, the compensation of the Supervisory Board members
is not shown individually. In the opinion of PUMA SE, this is not additional information relevant to
the capital market as the respective remuneration regulations included in the Articles of Association
are in the public domain.
Herzogenaurach, November 09, 2019
PUMA SE
For the Management Board For the Supervisory Board
Bjørn Gulden Michael Lämmermann Jean-François Palus
59
Relevant disclosures of corporate governance practices that are applied beyond the regulatory
requirements
CORPORATE SOCIAL RESPONSIBILITY
In order to fulfill our ecological and social responsibility as a global sporting goods manufacturer, PUMA
has developed groupwide guidelines on environmental management and on compliance with workplace
and social standards. PUMA is convinced that only on such a foundation can a lasting and sustainable
corporate success be achieved. That is why PUMA is committed to the principles of the UN Global Compact.
The PUMA Code of Conduct prescribes ethical and environmental standards with which both employees
and suppliers are required to comply. The PUMA Code of Conduct was revised in 2016 and explicitly
addresses PUMA's obligation and commitment in respect of human rights and combating corruption.
Detailed information on the company's corporate social responsibility strategy can be found in the
Sustainability section of the Annual Report or on the company's homepage (http://about.PUMA.com under
"SUSTAINABILITY").
COMPLIANCE MANAGEMENT SYSTEM
PUMA’s management acts in compliance with laws and self-imposed standards of conduct. PUMA has set
up a Compliance Management System (CMS) to systematically prevent, detect and sanction violations in
the areas of corruption, money laundering, conflicts of interest, antitrust law, fraud and embezzlement.
Violations of the law or internal guidelines will not be tolerated.
The PUMA Code of Ethics is an important building block of the CMS and is binding for employees of all
subsidiaries worldwide. It defines the guidelines and values that shape PUMA's identity. PUMA expects all
employees to be aware of these values and to act accordingly. The Code of Ethics contains rules, among
other things, on dealing with conflicts of interest and personal data and prohibits insider trading, anti-
competitive behavior and corruption in any form. In order to familiarize employees with the rules of the
Code of Ethics and to establish uniform behavioral guidelines, the Code of Ethics is flanked by specific
Group-wide guidelines.
All employees are familiarized with the regulatory areas of the Code of Ethics through ongoing mandatory
e-learning. In addition, employees selected on the basis of risk-based principles are given in-depth
knowledge in classroom training. In the past fiscal year, comprehensive face-to-face training courses were
held in particular in the areas of anti-corruption and antitrust law. In 2019, all PUMA employees were
encouraged by the CEO of PUMA SE to complete the e-learning on the Code of Ethics on the topics of anti-
corruption, data protection and inappropriate behavior in the workplace. The clear Tone from the Top
resulted in 99% of PUMA employees successfully completing the e-learning on the Code of Ethics.
The Management Board is responsible for the proper functioning of the CMS. It is supported by a
compliance organization consisting of the Chief Compliance Officer and compliance officers in the main
operating Group companies. The Chief Compliance Officer of PUMA SE reports directly to the CEO of PUMA
SE. The local Compliance Officers also serve as direct contact persons for employees and support them by
60
appropriate communication measures as well as in dealing with and processing compliance incidents. The
Audit Committee of the Supervisory Board of PUMA SE is regularly informed about the current status of the
implementation of compliance structures and serious compliance violations. The Chief Compliance Officer
works closely with the Legal Department and Internal Audit. In addition, regular meetings of the "PUMA
SE Risk & Compliance Committee" take place. At the meetings of this committee, compliance risks are
analyzed and evaluated and appropriate measures (guidelines, training, etc.) are defined and approved.
The review of the implementation of the requirements in the compliance guidelines is regularly part of the
audit plan of the internal audit department.
PUMA has a Group-wide electronic whistleblower platform, which is operated by an external provider and
to which employees and third parties can report protected illegal or unethical conduct. Violations from all
risk areas can be reported. Insofar as they do not fall within the competence of the compliance organization,
the responsible specialist departments are responsible for identifying and taking measures. The introduction
of the platform was communicated throughout the Group by the CEO and the communication was flanked
by appropriate information material. Every year, the local compliance officers expressly draw attention to
the whistleblower system through appropriate communication measures or in face-to-face training
sessions. Whistleblowers who report misconduct in good faith are protected from retaliation. All reports are
followed up immediately and, if confirmed, appropriate measures are taken. In 2019, the Compliance
Department at headquarters received 33 reports of alleged violations. In three of these cases, allegations
of corruption were made. In two of these cases, the investigation is still ongoing; in the third case, the
investigation has been completed and could not confirm the allegation. In addition to the whistleblower
platform, there is a global hotline for whistleblowers from the supply chain.
Description of the working practices of the Management Board and the Supervisory Board
PUMA SE has three bodies – the Management Board, the Supervisory Board and the Annual General
Meeting.
MANAGEMENT BOARD
The Management Board of PUMA SE manages the company on its own responsibility with the goal of
sustainable value creation. It develops PUMA's strategic orientation and coordinates it with the Supervisory
Board. In addition, it ensures group-wide compliance with legal requirements and an effective risk
management and internal control system.
The members of the Management Board are appointed by the Supervisory Board. The Supervisory Board
has set a general age limit of 70 years for the members Management Board. The Management Board
currently consists of three members and has a CEO. Further information on the areas of responsibility of
the members of the Management Board can be found in the Notes to the Consolidated Financial Statements
(last chapter).
61
The members of the Management Board are obliged to disclose conflicts of interest to the Supervisory
Board without delay and to inform the other members of the Management Board accordingly. They may
only assume secondary activities, in particular supervisory board and comparable mandates outside the
PUMA Group, with the prior consent of the Supervisory Board. In the past fiscal year, the members of the
Management Board of PUMA SE did not report any conflicts of interest.
The principles of cooperation of the Management Board of PUMA SE are set out in the Rules of Procedure
for the Management Board, which can be viewed at http://about.PUMA.com under "Corporate
Governance".
SUPERVISORY BOARD
The German Codetermination Act does not apply to PUMA SE as a European company. Rather, the size and
composition of the Supervisory Board are determined by the Articles of Association of PUMA SE and the
Agreement on the Involvement of Employees in PUMA SE dated 11 July 2011 and its amendment dated 7
February 2018. The Supervisory Board of PUMA SE consists of six members, four of whom are shareholder
representatives and two of whom are employee representatives. CVs of the individual Supervisory Board
members are available on the Internet and are updated regularly. The term of office of the current
Supervisory Board members ends at the end of the Annual General Meeting which resolves on the discharge
of the members of the Supervisory Board for the financial year 2022. Further information on the members
of the Supervisory Board can be found in the Notes to the Consolidated Financial Statements (last chapter).
The Supervisory Board appoints the members of the Management Board and may dismiss them at any time
for good cause. Initial appointments are generally for three years. The Supervisory Board determines the
remuneration system for the Management Board and reviews it regularly (most recently in 2018). It
determines the individual total compensation of each member of the Board of Management, taking into
account the ratio of the Management Board compensation to compensation in the MDAX (horizontal
comparison) and to the average compensation of the first management level below the Management Board
(n-1) as well as to the average compensation of all employees (vertical comparison). The relevant workforce
is the workforce of PUMA SE. Variable compensation components have a multi-year, mainly future-related
assessment basis. Variable remuneration components that last several years are not paid out prematurely.
Starting in the 2019 fiscal year, the Supervisory Board has set maximum limits for the individual
compensation of the Management Board both in total and with regard to its variable components.
The Supervisory Board monitors and advises the Management Board on the implementation of the strategy.
The Management Board informs the Supervisory Board regularly, promptly and comprehensively about all
issues of relevance to the Company relating to strategy, planning, business development, the risk situation,
risk management and compliance management system. It deals with deviations in the course of business
from the established plans and targets, stating the reasons. The Supervisory Board is involved by the
Management Board in decisions of paramount importance for the company or beyond the ordinary course
of business of PUMA SE and the PUMA Group to which it has rights of approval. The Supervisory Board
62
receives regular reports on succession planning and the criteria applied by the Management Board in this
regard.
Prior to Supervisory Board meetings, the Management Board regularly speaks separately to the employee
representatives and the shareholder representatives. At the end of the regular meetings, the Supervisory
Board always has the opportunity to discuss issues even in the absence of the Management Board. It also
makes regular use of this opportunity. The members of the Supervisory Board also participate in the
meetings by telephone or video conference.
The Supervisory Board regularly reviews the efficiency of its activities. The last time this review took place
was at the beginning of 2019.
The members of the Supervisory Board attend on their own responsibility courses of training and further
training that might be necessary for the performance of their tasks, and are supported by the Company in
doing so. In an onboarding program, new members of the Supervisory Board not only receive training from
the legal department on their rights and duties, but also have the opportunity in particular to meet the
members of the Management Board and other executives for a bilateral exchange on current management
issues and thus gain an overview of relevant topics of the Company.
SHAREHOLDERS AND ANNUAL GENERAL MEETING
The shareholders of PUMA SE exercise their rights, in particular their information and voting rights, at the
Annual General Meeting. Each share has one vote. Our shareholders can exercise their voting rights
themselves or through a proxy appointed by the company and bound by instructions. All documents and
information on the Annual General Meeting are available on the website of PUMA SE.
As part of our comprehensive investor relations and public relations work, we are in close contact with our
shareholders. We inform shareholders, financial analysts, shareholders' associations, the media and the
interested public comprehensively and regularly about the situation of the Company and inform them
immediately about significant business changes. The Chairman of the Supervisory Board is also prepared
to discuss Supervisory Board-specific issues with investors within an appropriate framework.
In addition to other communication channels, we make intensive use of the Company's website for our
investor relations work. At about.puma.com/en/investor-relations, all material information published in the
2019 financial year, including annual, quarterly and half-yearly financial reports, press releases, voting
rights announcements by major shareholders, presentations and the financial calendar, can be accessed.
63
Description of the working practices and the composition of the committees of the Supervisory
Board
The Supervisory Board meets at least every three months. Meetings must also be held if the best interests
of the Company so require or if a member of the Supervisory Board requests that the meeting be convened.
The Supervisory Board has established three committees to perform its duties and receives regular reports
on their work. The principles of cooperation of the Supervisory Board of PUMA SE and the duties of the
committees are set out in the Rules of Procedure for the Supervisory Board, which can be viewed at
http://about.PUMA.com under "Corporate Governance".
The Personnel Committee consists of three members. The Personnel Committee is responsible for entering
into and making changes to the Management Board members’ employment contracts and for establishing
policies for Human Resources and personnel development. The entire Supervisory Board decides on issues
involving the Management Board members’ compensation based on recommendations from the Personnel
Committee.
The Audit Committee consists of three members. The Chairman of the Audit Committee must be an
independent shareholder representative and must have expertise in the fields of accounting and auditing
in accordance with Section 100(5) AktG. In particular, the Audit Committee is responsible for accounting
issues and monitoring the accounting process, the effectiveness of the internal control system, the risk
management system, internal audits, compliance and the statutory audit of the financial statements, with
particular regard to the required independence of the statutory auditors, issuing the audit mandate to the
statutory auditors, defining the audit areas of focus, any additional services to be performed by the auditors
and the fee agreement. The recommendation of the Supervisory Board on the selection of the statutory
auditors must be based on a corresponding recommendation by the Audit Committee. Once the Annual
General Meeting has appointed the statutory auditors, and the Supervisory Board has issued the audit
assignment, the Audit Committee shall work with the statutory auditors to specify the scope of the audit
and the audit areas of focus. The statutory auditors shall attend a meeting to review the annual financial
statements and the consolidated financial statements and shall report on the key findings of their audit.
They shall also inform the Committee about other services they have provided in addition to auditing
services and shall confirm their independence. Each month, the Audit Committee shall receive financial
data on the PUMA Group, which will allow the tracking of developments in net assets, financial position,
results of operations and the order books on a continual basis. The Audit Committee shall also deal with
issues relating to the balance sheet and income statement and shall discuss these with the Management
Board. In addition, when the internal audit projects are completed, the Audit Committee shall receive the
audit reports, which must also include any actions taken.
The Nominating Committee has three members, who may only be representatives of the shareholders on
the Supervisory Board. The Nominating Committee proposes suitable shareholder candidates to the
Supervisory Board for its voting recommendations to the Annual General Meeting.
64
The current composition of the committees can be found in the Notes to the Consolidated Financial
Statements (last chapter).
Diversity Concept for the Supervisory Board
a) Objectives for the composition of the Supervisory Board
The Supervisory Board of PUMA SE is composed in such a way that its members as a group possess the
appropriate knowledge, skills and professional experience necessary for the proper performance of their
duties. The composition of the Supervisory Board is primarily determined by appropriate qualification,
taking into account diversity and the appropriate involvement of women. Based on Section 5.4.1 of the
Code, the Supervisory Board has set targets for his composition that have been fulfilled. In detail:
• The members of the Supervisory Board as a group have the experience and knowledge in the field
of management and/or monitoring market-oriented companies as well as in the business segments
and sales markets of PUMA. Details of this are presented under lit. b) of this chapter.
• A sufficient number of members have strong international backgrounds. This target has been
clearly surpassed simply because of the international origins of Jean-François Palus, Héloïse
Temple-Boyer, Thore Ohlsson and Fiona May.
• Including the employees' representative on the Supervisory Board, the Supervisory Board has an
appropriate number of independent members. In the opinion of the Supervisory Board, there are
currently no concrete indications of relevant circumstances that speak against independence with
regard to any of the shareholder representatives on the Supervisory Board. No member of the
Supervisory Board exercises directorships or advisory functions for major competitors. With regard
to Supervisory Board members Jean-François Palus and Héloïse Temple-Boyer, the Supervisory
Board is of the opinion that their functions as Directeur Général Délégué of Artémis S.A.S. do not
impair their independence within the meaning of the German Corporate Governance Code. The
Code does not contain an exhaustive definition of independence, but only mentions examples of
circumstances that speak against it. According to the Code, a member of the Supervisory Board is
not considered independent if he or she has a personal or business relationship with the company,
its executive bodies, a controlling shareholder or a company affiliated with the latter, and this
relationship may give rise to a material and not merely temporary conflict of interest. It is the task
of the Supervisory Board to assess the independence of the individual Supervisory Board members
on the basis of these indications. Artémis S.A.S. is not a controlling shareholder, as Artémis S.A.S.
is neither a majority shareholder nor does it have a de facto majority at the Annual General Meeting.
• The Chairman of the Audit Committee has specialist knowledge and experience in the application
of accounting principles and internal control procedures and is independent. Thore Ohlsson has
this knowledge and is independent. Jean-François Palus and Héloïse Temple-Boyer also bring this
knowledge with them.
• The members have sufficient time to perform his/her mandate in the Supervisory Board. Prior to
each election proposal, the Supervisory Board examines whether the candidates concerned are
able to complete the time required for the office.
• The Supervisory Board prevents potential significant and not only temporary conflicts of interest of
its members by regularly monitoring and critically scrutinizing its members' other activities. There
65
were no indications of actual conflicts of interest in the 2019 financial year.
• According to Section 1(4) of the Rules of Procedure for the Supervisory Board, Supervisory Board
members may, in principle, not be over 70 years of age and their maximum term of office may not
exceed three terms. In setting this age limit, the Supervisory Board deliberately decided against a
rigid maximum age limit and in favor of a flexible rule limit that provides the necessary leeway for
an appropriate assessment of the circumstances of the individual case, sufficiently broadly defines
the circle of potential candidates and also allows re-election. Mr Thore Ohlsson has reached the
statutory age limit. After careful consideration, he was nevertheless proposed by the Supervisory
Board for re-election in 2018 in order to ensure the necessary continuity after the spin-off from
Kering S.A. in the best interests of the company. All other Supervisory Board members did not
reach the standard age limit at the time of their election.
b) Profile of skills and expertise
The Supervisory Board has determined a competence profile for the entire Board. It stipulates that the
members of the Supervisory Board as a whole must cover the following professional competencies:
• Managing of large or mid-sized international companies (Jean-François Palus, Héloïse Temple-
Boyer, Thore Ohlsson)
• Leadership experience in the sporting or luxury goods industry (Jean-François Palus, Héloïse
Temple Boyer, Thore Ohlsson, Fiona May)
• International corporate background (Jean-François Palus, Héloïse Temple-Boyer, Thore Ohlsson,
Fiona May)
• Leadership experience with various disribution channels, including e-commerce (Jean-François
Palus, Thore Ohlsson)
• Expertise in building strong international brands (Jean-François Palus, Héloïse Temple-Boyer, Thore
Ohlsson, Fiona May)
• Marketing, sales and digital know how (Jean-François Palus, Héloïse Temple-Boyer, Thore Ohlsson)
• Financial expertise (accounting, treasury, risk management, corporate governance) (Jean-François
Palus, Thore Ohlsson, Héloïse Temple-Boyer)
• Expertise in serving on the Administrative or Supervisory boards of publicly listed companies (Jean-
François Palus, Heloise Temple-Boyer)
• Experience with mergers & acquisitions (Jean-François Palus, Thore Ohlsson)
• Understanding of the industrial constitution law and advocating the interests of the employees
(Martin Koeppel, Bernd Illig)
• HR expertise (Jean-François Palus)
• IT expertise (Bernd Illig).
The Supervisory Board of PUMA SE is currently composed in such a way that it has the competence profile
as an overall body.
66
c) Commitments to promote the participation of women in management positions in
accordance with Art. 9(1)c(ii) of the SE Regulation (SE-VO) in connection with Section
76(4), Section 111(5) AktG
The Supervisory Board shall define a target figure for the proportion of women on the Supervisory Board
and the Management Board. The Management Board, for its part, shall set target figures for the proportion
of women in the two management levels below the Management Board.
For the Supervisory Board of PUMA SE, a target figure of 30% has been set for the targeted proportion of
women. As of December 31, 2019, the six-member Supervisory Board included two women, Fiona May and
Héloïse Temple-Boyer, resulting in a female representation of 33%.
The Supervisory Board has set a target of 20% for the Management Board, provided that PUMA SE has
five or more members. The Management Board, which consisted of three members as of December 31,
2019 including Anne-Laure Descours, will be composed of 33% women and 66% men.
Together with the Supervisory Board, the Management Board has set a target of 25% for the first
management level below the Management Board and 30% for the second management level below the
Management Board. At Group level, the proportion of women is to increase to 30% for the first
management level below the Management Board and to 40% for the second management level. The
implementation deadline here, too, is October 31, 2021.
The current composition of the Supervisory Board largely implements the diversity concept.
Diversity Concept for the Management Board
The Supervisory Board and the Management Board promote an agile, open corporate culture in which the
advantages of diversity are consciously utilized and everyone can freely unfold their potential for the best
of the company. PUMA strives to fill Management Board positions and senior management positions
primarily with people developed within the company.
The Supervisory Board's decision regarding a particular appointment to the Management Board is always
taken in consideration of the Company's best interests based on the professional and personal suitability
of the candidate. It must be ensured that the members of the Management Board as a whole have the
knowledge, skills and experience required for the best possible fulfillment of the tasks of a member of the
Management Board of a sporting goods manufacturer such as PUMA. It is not necessary for every member
of the Management Board to reflect the technical requirements laid out in the following. The diversity
concept for the Management Board therefore stipulates that gender, internationality, age, educational
background and experience must be taken into account in its composition:
67
- Gender
PUMA aims to have 20% women on the Management Board by October 31, 2021, provided that the Board
has five or more Management Board members. In order to achieve this goal, the Management Board
ensures that an appropriate proportion of female candidates are included on the succession lists within the
framework of the internal global management structure for the development of junior staff for the
Management Board. In the future, the participation of women in the Management Board is to be guaranteed
in the event of a necessary replacement, in particular by giving special consideration to women in various
equally qualified candidates. Insofar as external candidates are to be appointed, suitably qualified female
candidates shall be considered in particular. The same applies to the filling of management functions. In
order to involve women even more in management functions in the future, PUMA promotes the
compatibility of family and career, for example through part-time and half-day models as well as flexible
working hours and the provision of childcare places. With Anne-Laure Descours a woman is represented
on the Management Board. The proportion of women on the Management Board is therefore currently
33%.
- Internationality
PUMA is a globally operating company. An appropriate number of board members must therefore have
international experience either due to their origin or due to their many years of professional experience
abroad. Notwithstanding the several years of international experience of all board members, this goal has
been exceeded simply because of the international origins of Bjørn Gulden and Anne-Laure Descours.
- Age
The Supervisory Board ensures a balanced age structure in the Management Board. This is important to
ensure the continuity of the Management Board's work and to facilitate smooth succession planning. In
principle, members of the Management Board may not be older than 70 years. All members of the
Management Board are below the standard age limit.
- Training and experience background
With regard to the educational and professional background, the selection of Management Board members
should be based on the competencies required in the PUMA Management Board in general as well as for
the respective Management Board with regard to corporate management, strategy development, finance
and accounting, supply chain, sales and HR. The same criteria apply here as were developed for the
competence profile of the Supervisory Board. These competencies do not have to be acquired as part of
university studies or other educational training, but may also have been acquired in other ways within or
outside PUMA. The members of the board have all the above mentioned competences.
The current composition of the Management Board largely implements the diversity concept.
68
Directors’ Dealings
Transactions by management personnel in PUMA shares reported to the Company are published at
https://about.puma.com/de-de/investor-relations/the-puma-share. Mr. Jean-François Palus reported in
May 2019 that he received PUMA shares in 2018 as part of the distribution of a dividend in kind by Kering
S.A. (Paris) to its shareholders. In October and November 2019, Mr. Palus also reported that, as part of a
related transaction, he first sold his PUMA shares and shortly thereafter repurchased the same number.
Mr. Bjørn Gulden reported a purchase in PUMA shares on 3 January 2020.
69
Risk and Opportunity Report
Entrepreneurial activities are always associated with opportunities and risks. This is particularly true for the
fast-moving sports and lifestyle industry in which PUMA globally operates and is therefore continuously
exposed to risks and opportunities that must be identified and managed. We need effective risk and
opportunity management through which risks and opportunities can be systematically recognized and
monitored. A risk is defined as one or more future events with unplanned, adverse effects for the company
up to any threat to the continued existence of the company. Similarly, an opportunity is defined as one or
more events with unplanned, positive consequences for the company.
The Management Board of PUMA SE has overall responsibility for the risk and opportunity management
system. The Risk Management Committee (RMC) is a management-level committee and responsible for
the design and monitoring of the risk management system and therefore also the first point of contact for
risk reporting. The task of operationally coordinating the group-wide risk management system has been
transferred to Group Internal Audit & Governance, Risk Management & Internal Control (GRC). Opportunity
management is not part of the risk management. Individual risk interviews are conducted with selected
executives as risk owners below the Management Board throughout the company at regular intervals of
currently twice a year. The objective of these interviews is to systematically identify, validate and categorize
risks and record countermeasures. The Group Internal Audit & GRC department provides a uniform
framework for the assessment of risks. The assessment considers the probability of occurrence, the
potential effect and the control of the risk.
The risks identified and assessed during the risk interviews are presented to the RMC in an aggregated
form in a so-called risk heat map. The RMC consists of a defined group of executives from various corporate
divisions, including the Management Board. Chair of the RMC is the Chief Financial Officer as member of
the Management Board. The results of the RMC meetings are reported to the Audit Committee as sub-
committee of the Supervisory Board by the Chair of the RMC and the Head of the Group Internal Audit &
GRC department. An integrated GRC tool used to document the risk management processes is available to
the Group Internal Audit & GRC department and to the risk owners.
PUMA also has a comprehensive reporting and controlling system, which is an essential component of its
risk management approach. PUMA’s reporting and controlling system is based on monthly financial
reporting as well as the review and plausibility reports on reported information issued by the Controlling
department.
Managers analyze opportunities and risks in annual planning discussions around the world, setting targets
and defining courses of action based on the results. The comprehensive reporting system continuously
monitors and generates reports on compliance with the set targets. This enables PUMA to promptly identify
any deviations or negative developments, and to initiate any necessary countermeasures in a timely
manner.
70
Risk and Opportunity Categories
The following explanations of opportunities and risks are shown in the order of their relative importance.
Macroeconomic Developments
As an internationally operating group, PUMA is exposed to global macroeconomic developments and the
associated risks. For example, economic developments in important sales markets may have an effect on
consumer behavior. This can have positive or negative effects on the planned sales and results. Likewise,
political changes and social developments may result in changes in the legal framework conditions, such
as in connection for example with Brexit and currency exchange rate fluctuations.
Overall, PUMA manages these challenges with geographic diversification and the development of alternative
scenarios for the possible occurrence of serious events. This applies in particular to political developments
and possible changes in legal framework conditions which are continuously monitored by PUMA.
Brand Image
Brand image and brand desirability are of key importance for PUMA, as consumer behavior can have a
negative effect on the brand as well as a positive one. Accordingly, PUMA has formulated the guiding
principle of “We want to become the fastest sports brand in the world” in order to underline the company’s
long-term direction and strategy. The “Forever Faster” brand promise does not just stand for PUMA’s
product range as a sports company, but also applies to all company processes.
PUMA manages brand image risks in particular through cooperation with brand ambassadors who embody
the core of the brand and PUMA’s brand values (“brave”, “confident”, “determined” and “joyful”) and have
a large potential for influencing PUMA’s target group. PUMA has therefore strengthened its position as
sports brand through partnerships with top athletes, such as star striker Antoine Griezmann, sprint legend
Usain Bolt, multiple Formula 1 world champion Lewis Hamilton and pro golfer Rickie Fowler. In 2019, we
were able to sign further brand ambassadors, such as the goalkeeper Jan Oblak, the football manager Pep
Guardiola, and Karsten Warholm, the 400-meter hurdles world champion. In football, PUMA has long-term
sponsorship agreements with top clubs, such as Manchester City, Borussia Dortmund, AC Milan, Olympique
Marseille and the Italian national team. PUMA's return to basketball and its engagement in athletics and
other sports should also be viewed in this context. PUMA reaches young trendsetters via brand ambassadors
and collaborations in the music, movie and fashion scene, such as with Jay-Z, Meek Mill, Adriana Lima,
Cara Delevingne and Selena Gomez, and also increasingly through influencers in social networks.
Information Technology
The ongoing digitalization of PUMA's business environment exposes the company to risks, but it also
increasingly provides opportunities. The failure of IT systems may significantly disrupt important
business procedures and processes. External attacks or wrong behavior, for example, may result in
the loss of confidential and sensitive data, and lead to high costs, loss of revenue and reputational
damage. Opportunities arise, for example, from improved, tailored communication with customers
via digital channels and new opportunities for product presentation. In addition, new or more
efficiently supported processes may add value or result in cost optimization.
71
To mitigate these risks and use the existing opportunities inherent in digitalization at the same time,
PUMA continuously carries out technical and organizational measures and invests in the renewal and
security of its IT landscape. IT systems are regularly checked, maintained and undergo security tests.
In addition, all employees are continuously sensitized using guidelines, training courses and
information campaigns.
Sourcing and Supply Chain
The majority of PUMA products is produced in selected Asian countries, in particular in Vietnam, China,
Bangladesh, Cambodia, Indonesia and India. Production in these countries is associated with significant
risks for PUMA, which result, for example, from exchange rate fluctuations, changes in sourcing and wage
costs, supply bottlenecks for raw materials or components, quality issues, but also from natural disasters
and political instability. Moreover, risks may result from an overdependence on individual manufacturers.
The portfolio is regularly reviewed and adjusted to avoid creating a dependence on individual suppliers and
sourcing markets. Generally, long-term master framework agreements are agreed upon to secure
production capacities required in the future. A quality assurance process and the direct collaboration with
manufacturers should permanently secure the quality of PUMA products.
Sourcing and the supply chain must also respond to risks and opportunities, including changes in duties
and tariffs as well as trade restrictions. PUMA accordingly continuously analyzes political and legal
framework conditions in order to be able to react to changes at an early stage.
The transport of products into the distribution countries is exposed to the risk of delays and disruptions
among service providers. The collaboration with service providers is accordingly secured by selection
processes, uniform contractual terms and permanent monitoring of relevant indicators.
Sustainability
Sustainability topics are highly important in sourcing, but also throughout the entire value chain. There is
a risk that suppliers will violate core labor standards of ILO (International Labour Organization), not comply
with environmental standards or use hazardous chemicals in production. This would violate PUMA's
requirements to suppliers and also lead to negative reporting. Adherence to applicable standards is ensured
through regular audits of supplier companies.
Climate change and increasing customer requirements with regard to sustainability are leading to a stronger
ecological focus both in our own locations and along the production and supply chain. A more efficient use
of resources and reduction of greenhouse gas emissions and the increased use of sustainable production
materials are expressions of PUMA's sustainability strategy.
72
Product and Market Environment
The risk posed by market-specific product influences, in particular the risk of substitutability in the highly
competitive sport and lifestyle market, is decisively countered by the early recognition and taking advantage
of relevant consumer trends. Only those companies that identify these trends at an early stage will be able
to gain an edge over their competitors.
Targeted investments in product design and product development are to ensure that the characteristic
PUMA design of the entire product range is consistent with the overall brand strategy (“Forever Faster”),
thereby creating a unique level of brand recognition.
Counterfeit Products
Counterfeit products can cause damage to consumer confidence in the brand and can damage PUMA's
brand image. For this reason, PUMA has made fighting brand piracy a high priority. The PUMA team
responsible for the protection of intellectual property not only ensures that we have a strong global portfolio
of property rights, such as brands, designs and patents, but also works closely with customs and police
forces and provides input regarding the implementation of effective legislation to protect intellectual
property.
Distribution Structure
PUMA utilizes various distribution channels, such as the traditional wholesale business with our retail
partners and the PUMA-owned retail and e-commerce business to reduce its dependency on individual
distribution channels. The wholesale business represents overall the largest revenue share. The focus on
the company-own retail and e-commerce business is intended to ensure a higher gross profit margin, better
distribution control and exclusive presentation of PUMA products in the desired brand environment.
In the wholesale business, up-and-coming retailers, including those offering their own brands, and
competitors pose the risk of intensified competition for consumers and market shares. Consumer purchase
behavior is also changing, focusing more on e-commerce and a combination of stationary and digital trade.
This requires continuous adjustment of the distribution structure. Distribution through the company's own
retail stores and e-commerce channels is, however, also associated with various risks for PUMA. These
include the necessary investments in expansion and infrastructure, setting up and refurbishing stores,
higher fixed costs and leases with long-term lease obligations. This can have an adverse impact on
profitability should business decline.
In order to avoid risks and take advantage of opportunities, PUMA carries out permanent monitoring of
distribution channels and regular reporting by the Controlling and specialized departments. A detailed
location and profitability analysis is carried out in our distribution channels before making any investment
decision. The company’s reporting and controlling system allows us to detect negative trends early on, and
to take the countermeasures required to manage individual stores. In e-commerce, global activities are
harmonized and investments in the IT platform are made to further optimize purchase transaction
settlement and further improve the shopping experience for consumers.
73
Reporting in the Media
A negative media report about PUMA, such as a product recall, infringement of laws, or internal or external
requirements, can also cause significant damage to the brand and ultimately result in the loss of sales and
profit, regardless of whether these events actually happened or were just rumors. PUMA manages this risk
by way of careful press, social media and public relations work which is managed from its group
headquarters in Herzogenaurach, Germany, and its subsidiary in the U.S. In addition, PUMA continuously
seeks an open dialog with key external stakeholders, such as suppliers, NGOs and industry initiatives, and
has institutionalized this as part of regularly held "Sustainability Stakeholder Meetings."
Organizational Challenges and Project Risks
PUMA's organizational structure with its group headquarters in Herzogenaurach, a central sourcing
organization and globally positioned distribution companies gives the group a global orientation. This results
in a risk for PUMA that the flows of goods and information are not sufficiently supported by modern IT
infrastructure. For this reason, existing business processes must be continually optimized and adapted.
This is carried out systematically through targeted optimization projects, which are planned and managed
centrally by a specialized department.
Personnel Department
The creative potential, commitment and performance of PUMA employees are important factors for a
successful business development and represent a significant opportunity for our business. PUMA
encourages independent thinking and action, which are key in an open corporate culture with flat
hierarchies. PUMA’s human resources strategy seeks to ensure this successful philosophy on a long-term
and sustainable basis. To achieve this goal, a control process is in place to detect and assess human-
resource risks. Accordingly, special attention has been paid to managing talent, identifying key positions
and high-potential individuals, and optimizing talent placement and succession planning. PUMA has
instituted additional national and global regulations and guidelines to ensure compliance with legal
provisions. PUMA will continue to make targeted investments in the human-resource needs of particular
functions or regions in order to meet the future requirements of its corporate strategy.
Legal Risks
As an internationally operating group, PUMA is exposed to various legal risks. These include contractual
risks or risks that a third party could assert claims and litigation for infringement of its trademark rights,
patent rights or other rights. The continuous monitoring of contractual obligations and the integration of
internal and external legal experts in contractual matters is to ensure that any legal risks are avoided.
74
Compliance Risks
PUMA is exposed to the risk that employees violate laws, directives and company standards (compliance
violations). These risks, such as theft, fraud, breach of trust, embezzlement and corruption, as well as
deliberate misrepresentations in financial reporting, may lead to significant monetary and reputational
damage. Therefore, PUMA uses various tools to manage these risks. This includes an integrated compliance
management system, the internal control system, group controlling and the internal audit department. As
part of the compliance management system, awareness measures are carried out regarding critical
compliance topics, such as corruption prevention and cartel law, and corresponding guidelines are
introduced in the group. PUMA employees also have access to an integrity system for reporting unethical
behavior.
Currency Risks
As an international company, PUMA is subject to currency risks resulting from the disparity between the
respective amounts of currency used on the purchasing and sales sides and from exchange-rate
fluctuations.
PUMA’s biggest sourcing market is Asia, where most payments are settled in US dollars (USD), while sales
of the PUMA Group are mostly invoiced in other currencies. PUMA manages currency risk in accordance
with internal guidelines. Currency forward contracts are used to hedge existing and future financial liabilities
in foreign currencies.
To hedge signed or pending contracts against currency risk, PUMA only concludes currency forward
contracts on customary market terms with reputable international financial institutions. As of the end of
2019, the net requirements for the 2020 planning period were adequately hedged against currency effects.
Foreign exchange risks may also arise from intra-group loans granted for financing purposes. Currency
swaps and currency forward transactions are used to hedge currency risks when converting intra-group
loans denominated in foreign currencies into the functional currencies of the group companies (Euro).
In order to disclose market risks, IFRS 7 requires sensitivity analyses that show the effects of hypothetical
changes in relevant risk variables on earnings and equity. The periodic effects are determined by relating
the hypothetical changes caused by the risk variables to the balance of the financial instruments held as of
the balance sheet date. The underlying assumption is that the balance as of the balance sheet date is
representative for the entire year.
Currency risks as defined by IFRS 7 arise on account of financial instruments being denominated in a
currency that is not the functional currency and is monetary in nature. Differences resulting from the
conversion of the individual financial statements to the group currency are not taken into account. All non-
functional currencies in which PUMA employs financial instruments are generally considered to be relevant
risk variables.
75
Currency sensitivity analyses are based on the following assumptions:
Material primary financial instruments (cash and cash equivalents, receivables, interest-bearing and non-
interest-bearing liabilities) are either denominated in the functional currency or are transferred into the
functional currency using currency forward transactions.
Currency forward contracts used to hedge against payment fluctuations caused by exchange rates are part
of an effective cash flow hedging relationship pursuant to IAS 39. Changes in the exchange rate of the
currencies underlying these contracts have an effect on the hedge reserve in equity and the fair value of
these hedging contracts.
Tax Risks
In an international business environment, applicable tax regulations must be observed. By means of
appropriate internal rules of conduct, employees are required to comply with and adhere to the relevant
tax regulations. In addition to compliance with national tax regulations to which the individual group
companies are subject, there are increasing risks in the course of intra-group transfer pricing, which must
be applied for various internal business transactions in accordance with the arm's length principle between
individual group companies. In all tax areas PUMA has taken adequate precautions with internal and
external tax experts in order to comply with the relevant tax regulations, but also to be able to react to
changes in the constantly changing tax environment.
For the group-internal transfer prices a corresponding documentation exists, which was prepared according
to international and national requirements and standards. There are guidelines and specifications for
determining transfer prices for intra-group transactions that are customary for foreign companies, which
comply with the applicable procedural rules and are binding on the employees acting on behalf of the
group. By means of internal tax reporting, external and internal tax experts are able to control and monitor
tax developments at PUMA on an ongoing basis. Both the Management Board and the Supervisory Board
are continuously informed about tax developments at PUMA in order to identify and avoid tax risks as early
as possible.
Default risks
Because of its business activities, PUMA is exposed to default risk that is managed by continuously
monitoring outstanding receivables and recognizing impairment losses, where appropriate. The default risk
is limited where possible by credit insurance and the maximum default risk is reflected by the carrying
amounts of the financial assets recognized on the balance sheet. Furthermore, default risks result to a
lesser extent from the counterparty’s other contractual financial obligations such as bank deposits and
derivative financial instruments.
76
Liquidity Risk
PUMA continually analyzes short-term capital requirements through rolling cash flow planning at the level
of the individual companies in coordination with the central Treasury department. PUMA maintains a
liquidity reserve, for example, in the form of cash and confirmed credit facilities in order to ensure the
company’s solvency, financial flexibility and a strategic liquidity buffer. In this respect, there was a
syndicated credit line amounting to € 350.0 million as of December 31, 2019, which was not utilized as of
the balance sheet date.
Medium and long-term funding requirements that cannot be directly covered by net cash from operating
activities are financed by taking out medium and long-term loans. For this purpose, promissory note loans
were issued in four tranches in July 2018 (one tranche each with a fixed and a variable coupon with a
residual term of 2 years for a total of € 100.0 million and one tranche each with a residual term of 4 years
for a total of € 60.0 million). Furthermore, an additional promissory note loan totaling € 70.0 million was
concluded in December 2019 with payout in January 2020. This promissory note loan comprises two
tranches with a fixed and a variable coupon and a term of 5 years.
Interest-Rate Risks
At PUMA, changes in interest rates do not have a significant impact on interest rate sensitivity and therefore
do not require the use of interest rate hedging instruments.
Summary
The assessment of the overall risk situation of the group and PUMA SE is the result of a consolidated
view of the individual risks described above. The Management Board is currently not aware of any
significant risks that, either independently or in combination with other risks, could jeopardize the
continued existence of the group and PUMA SE. In 2019, there was no significant change in the
overall assessment of the risk situation compared to the previous year.
However, we cannot exclude the possibility that in the future factors that are currently unknown to
us or that we currently assess as immaterial could influence the continued existence of the group
and PUMA SE and its consolidated companies. Due to the extremely solid balance sheet structure
and equity ratio, as well as the positive business outlook, the Management Board does not see any
risks that could jeopardize the continued existence of the PUMA Group and PUMA SE.
77
Main features of the internal control and risk management system
as it relates to the group’s accounting process
The Management Board of PUMA SE is responsible for the preparation and accuracy of the annual financial
statements, the consolidated financial statements and the combined management report of PUMA SE. The
consolidated financial statements were prepared in accordance with the International Financial Reporting
Standards that apply in the EU, the requirements of the German Commercial Code (HGB), the German
Stock Corporation Act (AktG) and the German SE Implementation Act (SEAG). Certain disclosures and
amounts are based on current estimates by the Management Board and the management.
The company’s Management Board is responsible for maintaining and regularly monitoring a suitable
internal control and risk management system covering the consolidated financial statements and the
disclosures in the combined management report. This control and risk management system is designed to
ensure the compliance and reliability of the internal and external accounting records, the presentation and
accuracy of the consolidated financial statements, and the combined management report and the
disclosures contained therein. It is based on a series of process-integrated monitoring steps and
encompasses the measures necessary to accomplish these, internal instructions, organizational and
authorization guidelines, the PUMA Code of Ethics, a clear separation of functions within the Group and the
dual-control principle. The adequacy and operating effectiveness of these measures are regularly reviewed
by the Group Internal Audit & GRC department.
For monthly financial reporting and consolidation, PUMA has a group-wide reporting and controlling system
that allows it to regularly and promptly detect deviations from projected figures and accounting
irregularities and, where necessary, to take countermeasures.
The risk management system can regularly, as well as on an ad-hoc basis, identify events that could affect
the company’s economic performance and its accounting process so that it can analyze and evaluate the
resulting risks and take the necessary actions to counter them.
In preparing the consolidated financial statements and the combined management report, it is also
sometimes necessary to make assumptions and estimates that are based on the information available on
the balance sheet date and which will affect the reported amounts and recognition of assets and liabilities,
income and expenses, contingent liabilities, and other data that must be reported, as well as how these
are classified.
78
The Supervisory Board’s Audit Committee meets regularly with the independent statutory auditors, the
Management Board, and the Group Internal Audit & GRC department to discuss the results of the statutory
audits of the financial statements and of the audit review with regard to the internal control and risk
management system as it relates to the accounting process. At the annual meeting on the financial
statements, the auditor reports to the Supervisory Board on the results of the audit of the annual and
consolidated financial statements.
In addition to the risk and opportunity management described, the Group Internal Audit & GRC department
carries out so-called Internal Control Self-Assessments (ICSA) at the process level for all essential business
processes. In these, process owners evaluate the existing control framework based on internal and external
guidelines and best-practice standards. The objective is to continuously improve the internal control system
and to identify specific risks at process level to be able to introduce countermeasures. The results of the
ICSA are reported to the Audit Committee and are used specifically by the Group Internal Audit & GRC
department in risk-oriented audit planning.
79
Outlook
Global Economy
After the dynamics of the global economy have slowed down in 2019, experts at the Kiel Institute for the
World Economy (ifw Kiel) expect global gross domestic product (GDP) to rise by 3.1% in 2020 (winter
forecast dated December 11, 2019). This corresponds to a slight increase in the GDP growth rate of 0.1%
compared to 2019. Accordingly, the global economy is expected to stabilize overall in 2020.
Experts expect that the increase in production in the advanced economies will remain moderate in 2020.
While economic momentum in the United States of America continues to slow down and the “Brexit” will
continue to put a strain on the UK economy in 2020, ifw Kiel expects the economy in the euro zone to
remain at a similar level compared to 2019. The expansion of the Chinese economy is likely to lose further
momentum in 2020. In the other emerging markets, however, the rise in production is likely to increase
slightly. Trade policy uncertainties continue to weigh on the outlook and remain a risk for the forecast.
Sporting goods industry
If there are no significant negative effects from the overall economic development, we expect the sporting
goods industry to continue its stable growth in 2020. It can be assumed that the trend towards sports
activities and a healthy lifestyle will continue and thus the demand for sporting goods will also continue to
rise. In addition, major sporting events in 2020, especially the Tokyo Summer Olympics and the European
Football Championship, should help to support growth in the sporting goods industry.
Outlook 2020
Our business developed strongly in 2019, both in terms of sales and profitability. We are confident that the
positive development will continue in 2020.
For the full year 2020, we therefore expect currency-adjusted sales growth of around 10%. We forecast
the gross profit margin to show a slight improvement compared to last year (2019: 48.8%) and operating
expenses (OPEX) to increase at a slightly lower rate than sales. Based on the current exchange rate levels
we expect an operating result (EBIT) for the financial year 2020 in a range between € 500 million and
€ 520 million (2019: € 440.2 million). We also expect a significant improvement of net earnings in 2020.
80
Investments
Investments in fixed assets of around € 200 million are planned for 2020. The majority of these investments
will be in infrastructure in order to create the operating requirements for the planned long-term growth.
The investments mainly concern own distribution and logistics centers and further investments in the
expansion and modernization of the Group's own retail stores.
Foundation for Long-Term Growth
The Management Board and the Supervisory Board have set the long-term strategic priorities. Action plans
are being implemented in a targeted and value-oriented manner. We believe that the corporate strategy
"Forever Faster" provides the basis for medium- and long-term positive development. We therefore confirm
our medium-term target of an average annual growth rate of currency-adjusted sales of around 10%
(CAGR) and the achievement of a 10% EBIT margin by 2021/ 2022.
Herzogenaurach, January 31, 2020
The Management Board
Gulden Lämmermann Descours
This is a translation of the German version. In case of doubt, the German version shall apply.

CONSOLIDATED FINANCIAL STATEMENTS
PUMA SE
for the Financial Year 2019
- International Financial Reporting Standards - IFRS
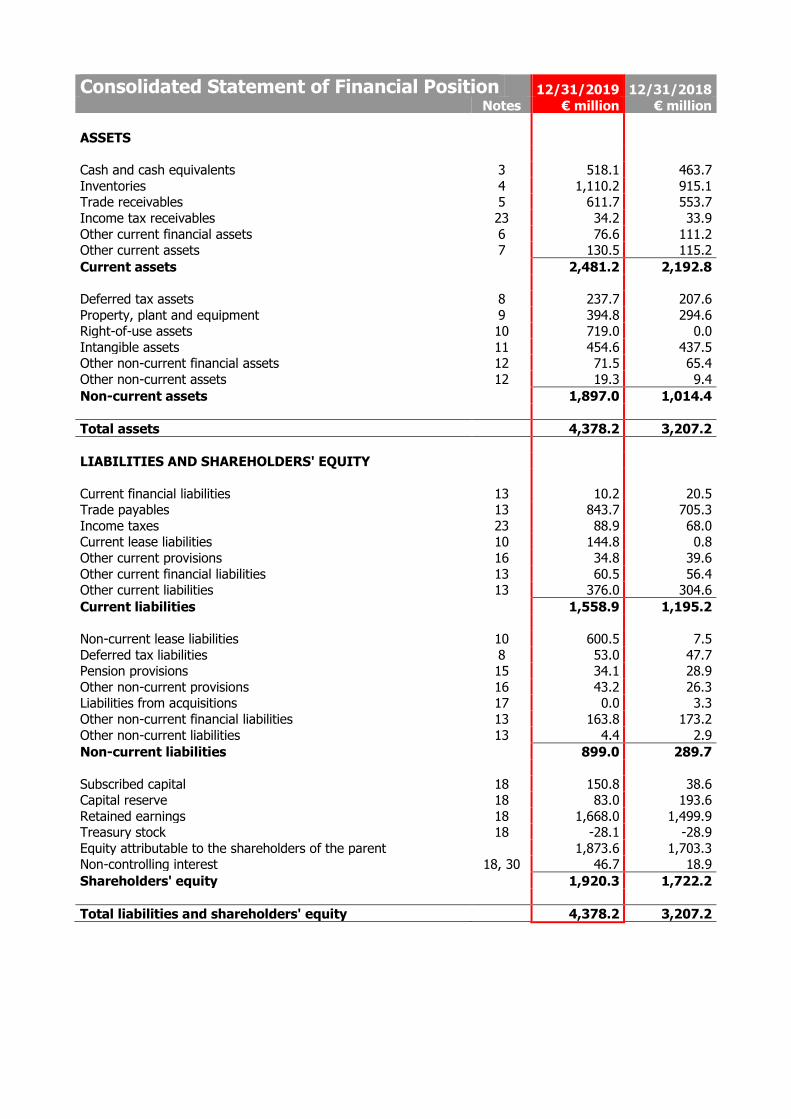
Consolidated Statement of Financial Position 12/31/2019 12/31/2018
Notes € million € million
ASSETS
Cash and cash equivalents 3 518.1 463.7
Inventories 4 1,110.2 915.1 Trade receivables 5 611.7 553.7
Income tax receivables 23 34.2 33.9
Other current financial assets 6 76.6 111.2 Other current assets 7 130.5 115.2
Current assets 0 2,481.2 2,192.8
0 Deferred tax assets 8 237.7 207.6
Property, plant and equipment 9 394.8 294.6 Right-of-use assets 10 719.0 0.0
Intangible assets 11 454.6 437.5 Other non-current financial assets 12 71.5 65.4
Other non-current assets 12 19.3 9.4
Non-current assets 0 1,897.0 1,014.4 0
Total assets 0 4,378.2 3,207.2
0 LIABILITIES AND SHAREHOLDERS' EQUITY 0
0
Current financial liabilities 13 10.2 20.5 Trade payables 13 843.7 705.3
Income taxes 23 88.9 68.0 Current lease liabilities 10 144.8 0.8
Other current provisions 16 34.8 39.6
Other current financial liabilities 13 60.5 56.4 Other current liabilities 13 376.0 304.6
Current liabilities 0 1,558.9 1,195.2 0
Non-current lease liabilities 10 600.5 7.5
Deferred tax liabilities 8 53.0 47.7 Pension provisions 15 34.1 28.9
Other non-current provisions 16 43.2 26.3 Liabilities from acquisitions 17 0.0 3.3
Other non-current financial liabilities 13 163.8 173.2
Other non-current liabilities 13 4.4 2.9
Non-current liabilities 0 899.0 289.7
0
Subscribed capital 18 150.8 38.6 Capital reserve 18 83.0 193.6
Retained earnings 18 1,668.0 1,499.9 Treasury stock 18 -28.1 -28.9
Equity attributable to the shareholders of the parent 0 1,873.6 1,703.3 Non-controlling interest 18, 30 46.7 18.9
Shareholders' equity 0 1,920.3 1,722.2
0
Total liabilities and shareholders' equity 0 4,378.2 3,207.2
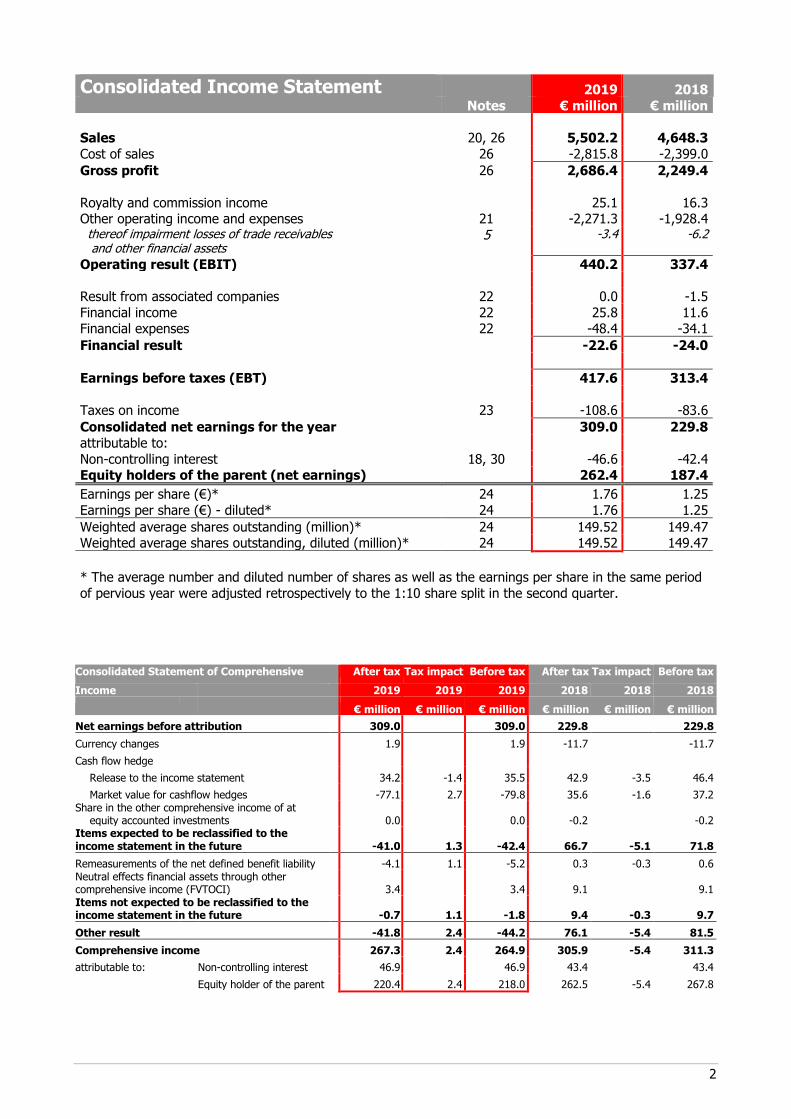
2
Consolidated Income Statement 2019 2018
Notes € million € million
Sales 20, 26 5,502.2 4,648.3
Cost of sales 26 -2,815.8 -2,399.0
Gross profit 26 2,686.4 2,249.4
0
Royalty and commission income 0 25.1 16.3 Other operating income and expenses 21 -2,271.3 -1,928.4 thereof impairment losses of trade receivables and other financial assets
5 -3.4 -6.2
Operating result (EBIT) 0 440.2 337.4
0 Result from associated companies 22 0.0 -1.5
Financial income 22 25.8 11.6 Financial expenses 22 -48.4 -34.1
Financial result 0 -22.6 -24.0
0
Earnings before taxes (EBT) 0 417.6 313.4
0
Taxes on income 23 -108.6 -83.6
Consolidated net earnings for the year 0 309.0 229.8
attributable to: 0
Non-controlling interest 18, 30 -46.6 -42.4 Equity holders of the parent (net earnings) 0 262.4 187.4
Earnings per share (€)* 24 1.76 1.25
Earnings per share (€) - diluted* 24 1.76 1.25
Weighted average shares outstanding (million)* 24 149.52 149.47 Weighted average shares outstanding, diluted (million)* 24 149.52 149.47
* The average number and diluted number of shares as well as the earnings per share in the same period
of pervious year were adjusted retrospectively to the 1:10 share split in the second quarter.
Consolidated Statement of Comprehensive After tax Tax impact Before tax After tax Tax impact Before tax
Income 2019 2019 2019 2018 2018 2018
€ million € million € million € million € million € million
Net earnings before attribution 309.0 309.0 229.8 229.8
Currency changes 1.9 1.9 -11.7 -11.7
Cash flow hedge
Release to the income statement 34.2 -1.4 35.5 42.9 -3.5 46.4
Market value for cashflow hedges -77.1 2.7 -79.8 35.6 -1.6 37.2 Share in the other comprehensive income of at
equity accounted investments 0.0 0.0 -0.2 -0.2 Items expected to be reclassified to the income statement in the future -41.0 1.3 -42.4 66.7 -5.1 71.8
Remeasurements of the net defined benefit liability -4.1 1.1 -5.2 0.3 -0.3 0.6 Neutral effects financial assets through other comprehensive income (FVTOCI) 3.4 3.4 9.1 9.1 Items not expected to be reclassified to the income statement in the future -0.7 1.1 -1.8 9.4 -0.3 9.7
Other result -41.8 2.4 -44.2 76.1 -5.4 81.5
Comprehensive income 267.3 2.4 264.9 305.9 -5.4 311.3
attributable to: Non-controlling interest 46.9 46.9 43.4 43.4
Equity holder of the parent 220.4 2.4 218.0 262.5 -5.4 267.8
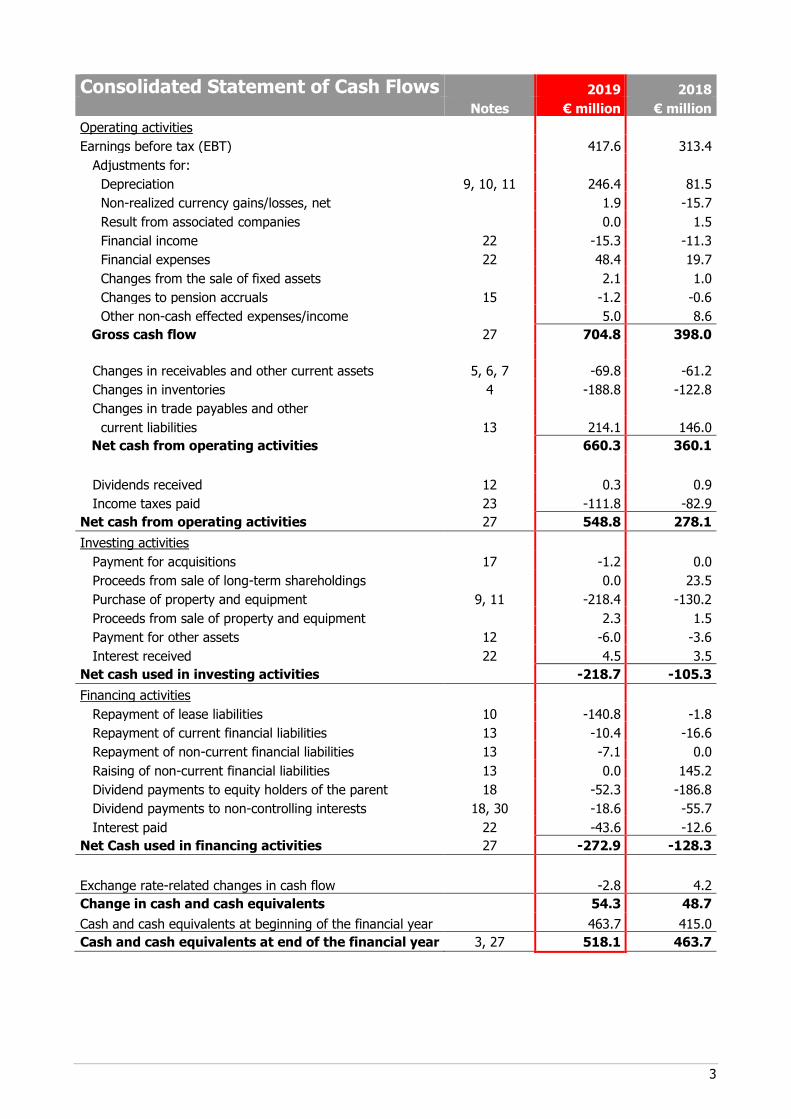
3
Consolidated Statement of Cash Flows 2019 2018
Notes € million € million
Operating activities
Earnings before tax (EBT) 0 417.6 313.4
Adjustments for: 0
Depreciation 9, 10, 11 246.4 81.5
Non-realized currency gains/losses, net 0 1.9 -15.7
Result from associated companies 0 0.0 1.5
Financial income 22 -15.3 -11.3
Financial expenses 22 48.4 19.7
Changes from the sale of fixed assets 0 2.1 1.0
Changes to pension accruals 15 -1.2 -0.6
Other non-cash effected expenses/income 0 5.0 8.6
Gross cash flow 27 704.8 398.0
0
Changes in receivables and other current assets 5, 6, 7 -69.8 -61.2
Changes in inventories 4 -188.8 -122.8
Changes in trade payables and other 0
current liabilities 13 214.1 146.0
Net cash from operating activities 0 660.3 360.1
0
Dividends received 12 0.3 0.9
Income taxes paid 23 -111.8 -82.9
Net cash from operating activities 27 548.8 278.1
Investing activities 0
Payment for acquisitions 17 -1.2 0.0
Proceeds from sale of long-term shareholdings 0 0.0 23.5
Purchase of property and equipment 9, 11 -218.4 -130.2
Proceeds from sale of property and equipment 0 2.3 1.5
Payment for other assets 12 -6.0 -3.6
Interest received 22 4.5 3.5
Net cash used in investing activities 0 -218.7 -105.3
Financing activities 0
Repayment of lease liabilities 10 -140.8 -1.8
Repayment of current financial liabilities 13 -10.4 -16.6
Repayment of non-current financial liabilities 13 -7.1 0.0
Raising of non-current financial liabilities 13 0.0 145.2
Dividend payments to equity holders of the parent 18 -52.3 -186.8
Dividend payments to non-controlling interests 18, 30 -18.6 -55.7
Interest paid 22 -43.6 -12.6
Net Cash used in financing activities 27 -272.9 -128.3
0
Exchange rate-related changes in cash flow 0 -2.8 4.2
Change in cash and cash equivalents 0 54.3 48.7
Cash and cash equivalents at beginning of the financial year 0 463.7 415.0
Cash and cash equivalents at end of the financial year 3, 27 518.1 463.7
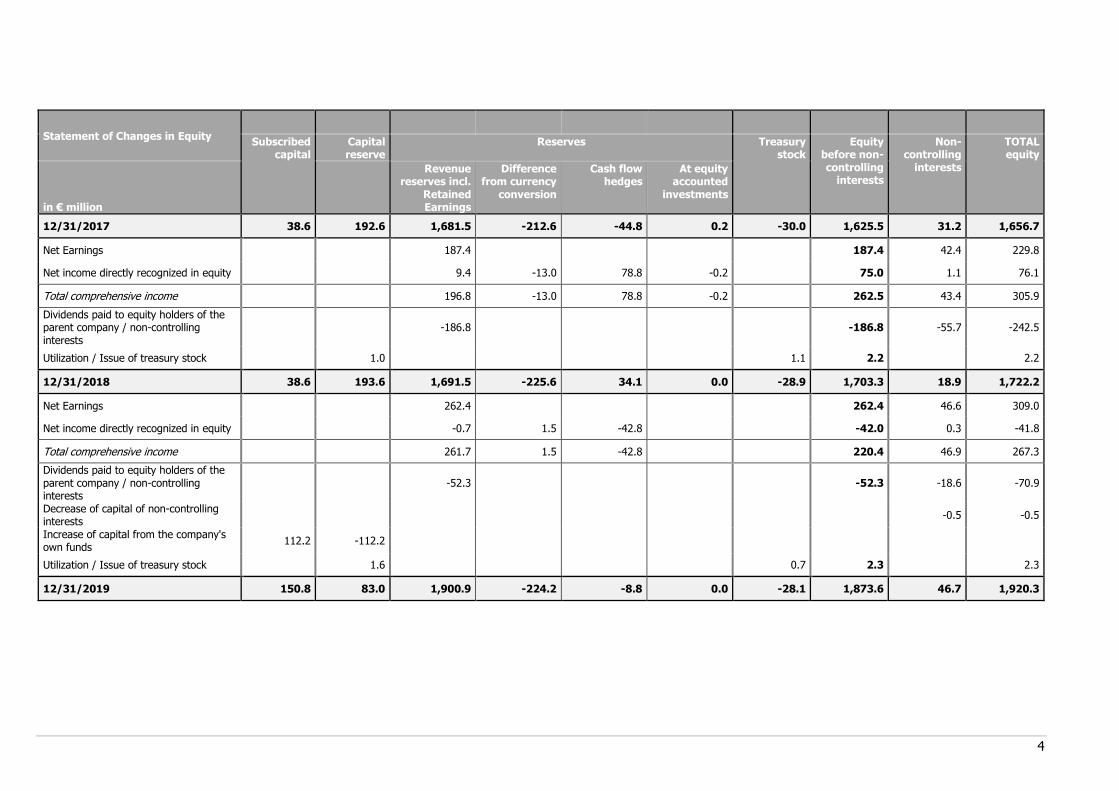
4
Statement of Changes in Equity
Subscribed capital
Capital reserve
Reserves Treasury stock
Equity before non-controlling
interests
Non-controlling
interests
TOTAL equity
in € million
Revenue reserves incl.
Retained Earnings
Difference from currency
conversion
Cash flow hedges
At equity accounted
investments
12/31/2017 38.6 192.6 1,681.5 -212.6 -44.8 0.2 -30.0 1,625.5 31.2 1,656.7
Net Earnings 187.4 187.4 42.4 229.8
Net income directly recognized in equity 9.4 -13.0 78.8 -0.2 75.0 1.1 76.1
Total comprehensive income 196.8 -13.0 78.8 -0.2 262.5 43.4 305.9
Dividends paid to equity holders of the parent company / non-controlling interests
-186.8 -186.8 -55.7 -242.5
Utilization / Issue of treasury stock 1.0 1.1 2.2 2.2
12/31/2018 38.6 193.6 1,691.5 -225.6 34.1 0.0 -28.9 1,703.3 18.9 1,722.2
Net Earnings 262.4 262.4 46.6 309.0
Net income directly recognized in equity -0.7 1.5 -42.8 -42.0 0.3 -41.8
Total comprehensive income 261.7 1.5 -42.8 220.4 46.9 267.3
Dividends paid to equity holders of the parent company / non-controlling interests
-52.3 -52.3 -18.6 -70.9
Decrease of capital of non-controlling interests
-0.5 -0.5
Increase of capital from the company's own funds
112.2 -112.2
Utilization / Issue of treasury stock 1.6 0.7 2.3 2.3
12/31/2019 150.8 83.0 1,900.9 -224.2 -8.8 0.0 -28.1 1,873.6 46.7 1,920.3
5
Notes to the Consolidated Financial Statements 1. General
Under the “PUMA” brand name, PUMA SE and its subsidiaries are engaged in the development and sale of a broad range of sports and sports lifestyle products, including footwear, apparel and accessories. The company
is a European stock corporation (Societas Europaea/SE) and parent company of the PUMA Group; its registered
office is on PUMA WAY 1, 91074 Herzogenaurach, Germany. The competent registry court is in Fürth (Bavaria), the register number is HRB 13085.
The consolidated financial statements of PUMA SE and its subsidiaries (hereinafter shortly referred to as the
“Group” or “PUMA”) were prepared in accordance with the “International Financial Reporting Standards (IFRS)”
accounting standards issued by the International Accounting Standards Board (IASB), as they are to be applied in the EU, and the supplementary accounting principles to be applied in accordance with Section 315e (1) of
the German Commercial Code. The IASB standards and interpretations, as they are to be applied in the EU, which are mandatory for financial years as of January 1, 2019, have been applied.
The items contained in the financial statements of the individual Group companies are measured based on the currency that corresponds to the currency of the primary economic environment in which the Company
operates. The consolidated financial statements are prepared in euros (EUR or €). The presentation of amounts in millions of euros with one decimal place may lead to rounding differences since the calculation of individual
items is based on figures presented in thousands.
The cost of sales method is used for the income statement.
The following new and amended standards and interpretations have been used for the first time in the current
financial year:
New and amended standards and interpretations
Standard Title
First-time adoption in the current financial year
IFRS 16 Leases
Amendments to IAS 19 Plan Amendment, Curtailment or Settlement
Amendment IAS 28 Long-term Interests in Associates and Joint Ventures
Amendment IFRS 9 Prepayment Features with Negative Compensation
IFRIC 23 Uncertainty Transactions and Advance Consideration
AIP 2015 - 2017 Improvements to IFRS
The standards and interpretations used for the first time as of January 1, 2019 had the following effects on the consolidated financial statements:
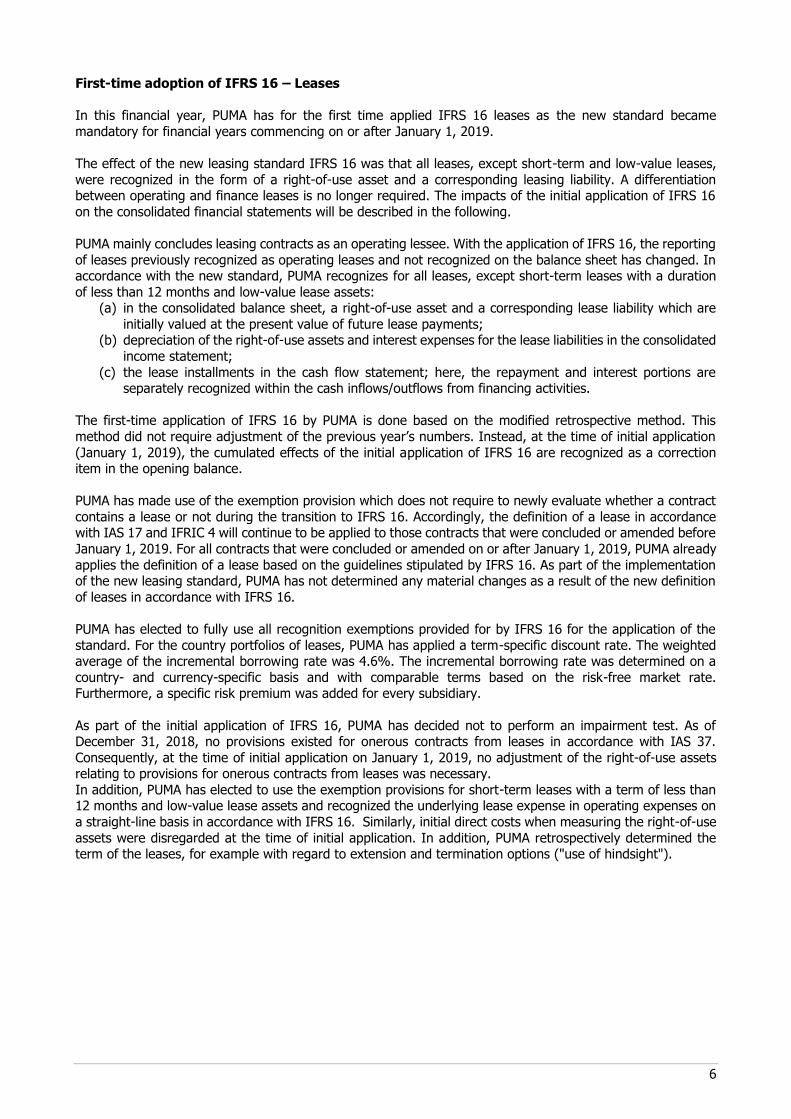
6
First-time adoption of IFRS 16 – Leases
In this financial year, PUMA has for the first time applied IFRS 16 leases as the new standard became
mandatory for financial years commencing on or after January 1, 2019.
The effect of the new leasing standard IFRS 16 was that all leases, except short-term and low-value leases,
were recognized in the form of a right-of-use asset and a corresponding leasing liability. A differentiation between operating and finance leases is no longer required. The impacts of the initial application of IFRS 16
on the consolidated financial statements will be described in the following.
PUMA mainly concludes leasing contracts as an operating lessee. With the application of IFRS 16, the reporting
of leases previously recognized as operating leases and not recognized on the balance sheet has changed. In accordance with the new standard, PUMA recognizes for all leases, except short-term leases with a duration
of less than 12 months and low-value lease assets: (a) in the consolidated balance sheet, a right-of-use asset and a corresponding lease liability which are
initially valued at the present value of future lease payments; (b) depreciation of the right-of-use assets and interest expenses for the lease liabilities in the consolidated
income statement;
(c) the lease installments in the cash flow statement; here, the repayment and interest portions are separately recognized within the cash inflows/outflows from financing activities.
The first-time application of IFRS 16 by PUMA is done based on the modified retrospective method. This
method did not require adjustment of the previous year’s numbers. Instead, at the time of initial application
(January 1, 2019), the cumulated effects of the initial application of IFRS 16 are recognized as a correction item in the opening balance.
PUMA has made use of the exemption provision which does not require to newly evaluate whether a contract
contains a lease or not during the transition to IFRS 16. Accordingly, the definition of a lease in accordance with IAS 17 and IFRIC 4 will continue to be applied to those contracts that were concluded or amended before
January 1, 2019. For all contracts that were concluded or amended on or after January 1, 2019, PUMA already
applies the definition of a lease based on the guidelines stipulated by IFRS 16. As part of the implementation of the new leasing standard, PUMA has not determined any material changes as a result of the new definition
of leases in accordance with IFRS 16.
PUMA has elected to fully use all recognition exemptions provided for by IFRS 16 for the application of the
standard. For the country portfolios of leases, PUMA has applied a term-specific discount rate. The weighted average of the incremental borrowing rate was 4.6%. The incremental borrowing rate was determined on a
country- and currency-specific basis and with comparable terms based on the risk-free market rate. Furthermore, a specific risk premium was added for every subsidiary.
As part of the initial application of IFRS 16, PUMA has decided not to perform an impairment test. As of December 31, 2018, no provisions existed for onerous contracts from leases in accordance with IAS 37.
Consequently, at the time of initial application on January 1, 2019, no adjustment of the right-of-use assets relating to provisions for onerous contracts from leases was necessary.
In addition, PUMA has elected to use the exemption provisions for short-term leases with a term of less than 12 months and low-value lease assets and recognized the underlying lease expense in operating expenses on
a straight-line basis in accordance with IFRS 16. Similarly, initial direct costs when measuring the right-of-use
assets were disregarded at the time of initial application. In addition, PUMA retrospectively determined the term of the leases, for example with regard to extension and termination options ("use of hindsight").
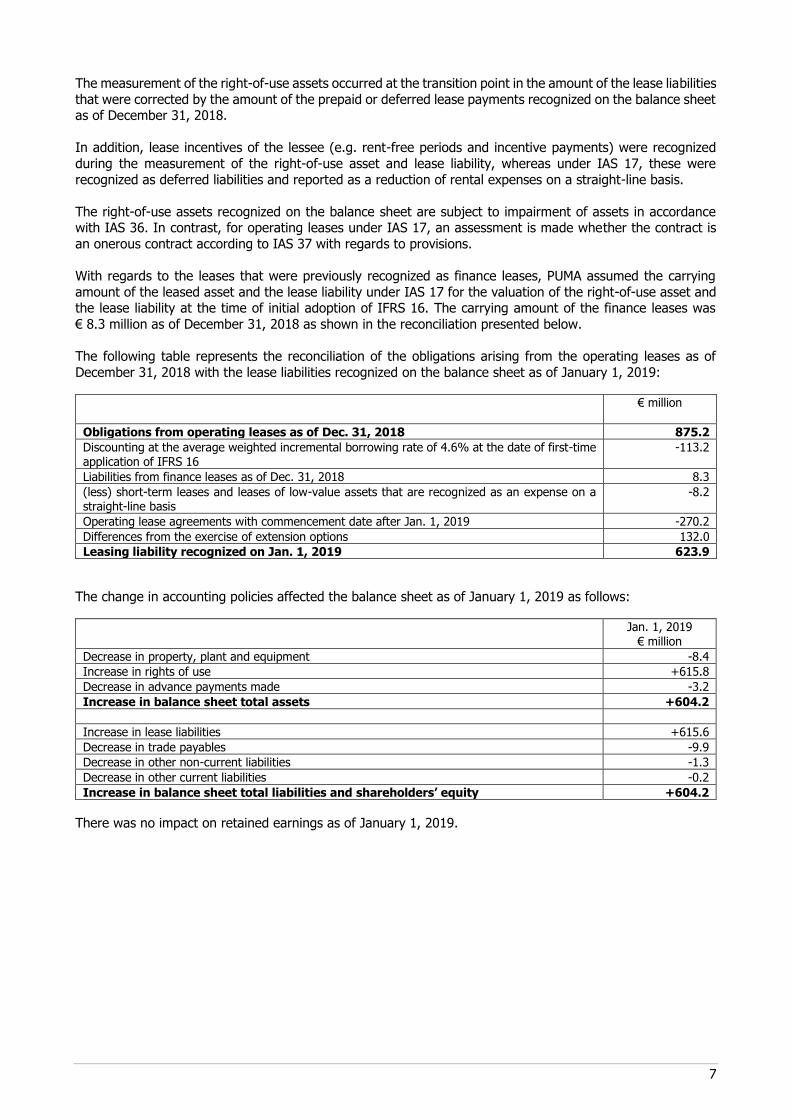
7
The measurement of the right-of-use assets occurred at the transition point in the amount of the lease liabilities
that were corrected by the amount of the prepaid or deferred lease payments recognized on the balance sheet as of December 31, 2018.
In addition, lease incentives of the lessee (e.g. rent-free periods and incentive payments) were recognized
during the measurement of the right-of-use asset and lease liability, whereas under IAS 17, these were
recognized as deferred liabilities and reported as a reduction of rental expenses on a straight-line basis.
The right-of-use assets recognized on the balance sheet are subject to impairment of assets in accordance with IAS 36. In contrast, for operating leases under IAS 17, an assessment is made whether the contract is
an onerous contract according to IAS 37 with regards to provisions.
With regards to the leases that were previously recognized as finance leases, PUMA assumed the carrying
amount of the leased asset and the lease liability under IAS 17 for the valuation of the right-of-use asset and the lease liability at the time of initial adoption of IFRS 16. The carrying amount of the finance leases was
€ 8.3 million as of December 31, 2018 as shown in the reconciliation presented below.
The following table represents the reconciliation of the obligations arising from the operating leases as of
December 31, 2018 with the lease liabilities recognized on the balance sheet as of January 1, 2019:
€ million
Obligations from operating leases as of Dec. 31, 2018 875.2
Discounting at the average weighted incremental borrowing rate of 4.6% at the date of first-time application of IFRS 16
-113.2
Liabilities from finance leases as of Dec. 31, 2018 8.3
(less) short-term leases and leases of low-value assets that are recognized as an expense on a straight-line basis
-8.2
Operating lease agreements with commencement date after Jan. 1, 2019 -270.2
Differences from the exercise of extension options 132.0
Leasing liability recognized on Jan. 1, 2019 623.9
The change in accounting policies affected the balance sheet as of January 1, 2019 as follows:
Jan. 1, 2019 € million
Decrease in property, plant and equipment -8.4
Increase in rights of use +615.8
Decrease in advance payments made -3.2
Increase in balance sheet total assets +604.2
Increase in lease liabilities +615.6
Decrease in trade payables -9.9
Decrease in other non-current liabilities -1.3
Decrease in other current liabilities -0.2
Increase in balance sheet total liabilities and shareholders’ equity +604.2
There was no impact on retained earnings as of January 1, 2019.
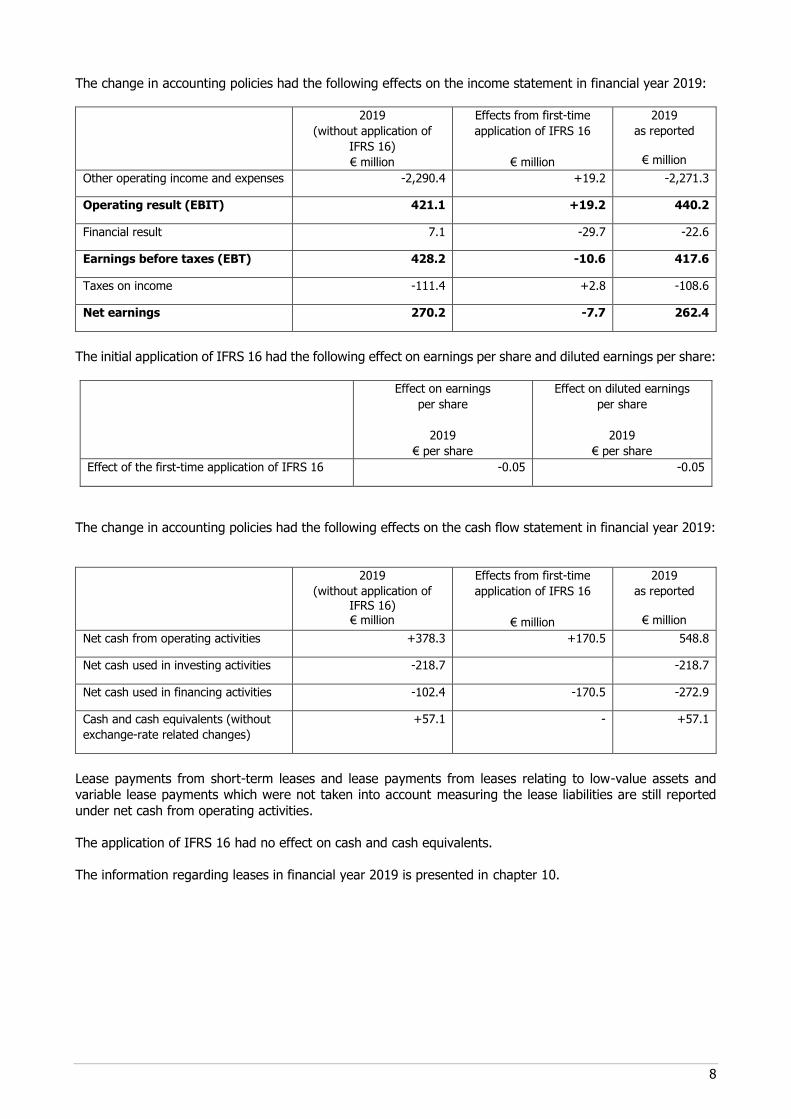
8
The change in accounting policies had the following effects on the income statement in financial year 2019:
2019
(without application of
IFRS 16)
€ million
Effects from first-time
application of IFRS 16
€ million
2019
as reported
€ million
Other operating income and expenses -2,290.4 +19.2 -2,271.3
Operating result (EBIT) 421.1 +19.2 440.2
Financial result 7.1 -29.7 -22.6
Earnings before taxes (EBT) 428.2 -10.6 417.6
Taxes on income -111.4 +2.8 -108.6
Net earnings 270.2 -7.7 262.4
The initial application of IFRS 16 had the following effect on earnings per share and diluted earnings per share:
Effect on earnings
per share
2019
€ per share
Effect on diluted earnings
per share
2019
€ per share
Effect of the first-time application of IFRS 16 -0.05 -0.05
The change in accounting policies had the following effects on the cash flow statement in financial year 2019:
2019
(without application of IFRS 16) € million
Effects from first-time
application of IFRS 16
€ million
2019
as reported
€ million
Net cash from operating activities +378.3 +170.5 548.8
Net cash used in investing activities -218.7 -218.7
Net cash used in financing activities -102.4 -170.5 -272.9
Cash and cash equivalents (without
exchange-rate related changes)
+57.1 - +57.1
Lease payments from short-term leases and lease payments from leases relating to low-value assets and variable lease payments which were not taken into account measuring the lease liabilities are still reported
under net cash from operating activities.
The application of IFRS 16 had no effect on cash and cash equivalents.
The information regarding leases in financial year 2019 is presented in chapter 10.
9
Changes in IAS 19 Plan Amendment, Curtailment or Settlement
The amendments to IAS 19 require that in the event of an amendment, curtailment or settlement of a defined
benefit pension plan, the current service cost and net interest for the remaining financial year must be revalued applying current actuarial assumptions which were used during the required remeasurement of the net liability
(of the asset). In addition, it was clarified that the effect on the asset ceiling that might arise from the plan
amendment, curtailment or settlement must be measured in a second step and recognized in other comprehensive income. The application of the amendments had no effects on the consolidated financial
statements as respective plan amendments, curtailments or settlements have not occurred.
Amendments to IFRIC 23 Uncertainty Transactions and Advance Consideration
IFRIC 23 clarifies the accounting of current and deferred tax liabilities where uncertainties exist regarding their income tax-related treatment. Such uncertainties may arise if the application of the respectively applicable tax
law is not clear with regard to a specific business case and is therefore also dependent on the interpretation of the law by the taxation authority. PUMA, however, is not aware of the respective interpretation at the time
the financial statements are prepared. IFRIC 23 specifies that a company should only take these uncertainties
into account with regard to recognized tax liabilities or claims if it is probable that the respective tax amounts will have to be paid or reimbursed. It is in this case to be assumed that the taxation authority will exercise its
right to review declared amounts and will have full knowledge of all pertaining information. In these cases, PUMA will always perform an individual assessment of tax-related matters and will measure
these with the most probable amount.
The application of IFRIC 23 had no effect on the consolidated financial statements as it did not change the recognized tax liabilities or claims.
The explanations regarding the assumptions made and estimates used with regard to taxes are presented in chapter 2 Significant Consolidation, Accounting and Valuation Principles.
Changes in Other Standards and Interpretations
The application of the amendment to IAS 28 (Long-term Interests in Associates and Joint Ventures) had no
effect on the consolidated financial statements as PUMA does not hold any such interests.
The application of the amendment to IFRS 9 (Prepayment features with negative compensation) had no effect
on the consolidated financial statements as PUMA has not concluded any agreements regarding financial instruments with these types of termination provisions.
The application of amendments as a result of the annual improvements to the IFRS (Annual Improvements
2015 – 2017) consecutively apply to step business combinations (IFRS 3), joint arrangements (IFRS 11),
capitalization of borrowing costs (IAS 23), and income tax consequences of dividend payments (IAS 12). The application had no effect on the consolidated financial statements.
10
New, but not yet mandatory standards and interpretations
The following standards and interpretations have been released but will only become effective in later reporting
periods and are not applied earlier by the Group.
Standard Title Date of
adoption *
Planned
adoption
Endorsed
Amendments to IFRS 9, IAS 39, IFRS 7 Interest Rate Benchmark Reform 1/1/2020 1/1/2020
Amendments Conceptual Framework Amendments to References to the Conceptual Framework
1/1/2020 1/1/2020
Amendment IAS 1 and IAS 8 Definition of Material 1/1/2020 1/1/2020
Endorsement pending
Amendments to IFRS 3 Definition of a Business 1/1/2020 1/1/2020
IFRS 17 Insurance Contracts 1/1/2021 1/1/2021
* Adjusted by EU endorsement, if applicable
PUMA does not expect any significant effects on the consolidated financial statements from these amendments.
11
2. Significant Consolidation, Accounting and Valuation Principles Consolidation Principles
The consolidated financial statements were prepared as of December 31, 2019, the reporting date of the
annual financial statements of the PUMA SE parent company, on the basis of uniform accounting and valuation principles according to IFRS, as applied in the EU.
Subsidiaries are companies in which the Group has existing rights that give it the current ability to direct the
relevant activities. The main activities are those that have a significant influence on the profitability of the company. Control is therefore considered to exist if the Group is exposed to variable returns from its
relationship with a company and has the power to govern those returns through its control of the relevant
activities. As a rule, control is based on PUMA’s direct or indirect majority of the voting rights. Consolidation begins at the point in time from which control is possible. It ends when this no longer exists.
The recognition of business combinations is based on the acquisition method. The assets, debts and contingent
liabilities that can be identified as part of a business combination are generally stated at their fair value as of
the acquisition date, regardless of the size of non-controlling interests. At the time of the acquisition, there is a separately exercisable right to vote on whether the interests of the non-controlling shareholders are valued
at fair value or at proportional net asset value.
The surplus of the consideration transferred that exceeds the Group’s share in the net assets stated at fair
value is reported as goodwill. If the consideration transferred is lower than the amount of the net assets stated at fair value, the difference is reported directly in the income statement.
Based on the structure of agreements with shareholders holding non-controlling interests in specific Group
companies, PUMA is the economic owner when it has a majority stake. The companies are fully included in the consolidated financial statements and, therefore, non-controlling interests are not disclosed. The present
value of the capital shares attributable to the non-controlling shareholders and the present value of the residual
purchase prices expected due to corporate performance are included in the capital consolidation as acquisition costs for the holdings. The costs directly attributable to the purchase and later differences of the present
values of the expected residual purchase prices are recognized in the income statement in accordance with IFRS 3.
With respect to the remaining controlling interests, losses attributable to non-controlling interests are allocated to the latter even if this results in a negative balance in non-controlling interests.
Receivables within the Group are offset against internal liabilities. As a general rule, any set-off differences
arising from exchange rate fluctuations are recognized in the income statement to the extent that they accrued during the reporting period. If receivables and liabilities are long-term and capital-replacing in nature, the
currency difference is recognized directly in equity and under Other Comprehensive Income.
In the course of the expense and income consolidation, inter-company sales and intra-group income are offset
against the expenses attributable to them. Interim profits not yet realized within the Group as well as intra-group investment income are eliminated by crediting them in the income statement.
12
Group of consolidated companies
In addition to PUMA SE, the consolidated financial statements include all subsidiaries in which PUMA SE directly or indirectly holds existing rights that give it the current ability to direct the relevant activities. At present,
control of all Group companies is based on a direct or indirect majority of voting rights. Associated companies are generally accounted for in the Group using the equity method. As of December 31,
2019, the Group does not comprise any associated companies.
The changes in the number of Group companies (including the parent company PUMA SE) in the financial year
2019 were as follows:
As of 12/31/2018 104
Formation of companies 3
Disposal of companies 5
As of 12/31/2019 102
The additions to the group of consolidated companies relate to the formation of:
• PUMA Logistik-Verwaltungs GmbH, Germany,
• PUMA United Canada Holding, Inc., USA and
• PUMA United Canada ULC, Canada
The disposals in the group of consolidated companies relate to the mergers of the following companies within
the consolidation scope:
• PUMA Kids Apparel North America, LLC, USA
• PUMA Kids Apparel Canada, LLC, USA
• PUMA Accessories North America, LLC, USA
• PUMA North America Accessories Canada, LLC, USA
Furthermore, Sport Equipment TI Cyprus Ltd. u.Li., Cyprus was liquidated during the financial year.
During the financial year, Janed, LLC, USA was renamed to PUMA United North America LLC, USA, and the
Dobotex companies to "stichd".
The changes in the group of consolidated companies did not have a significant effect on the net assets, financial position and results of operations.
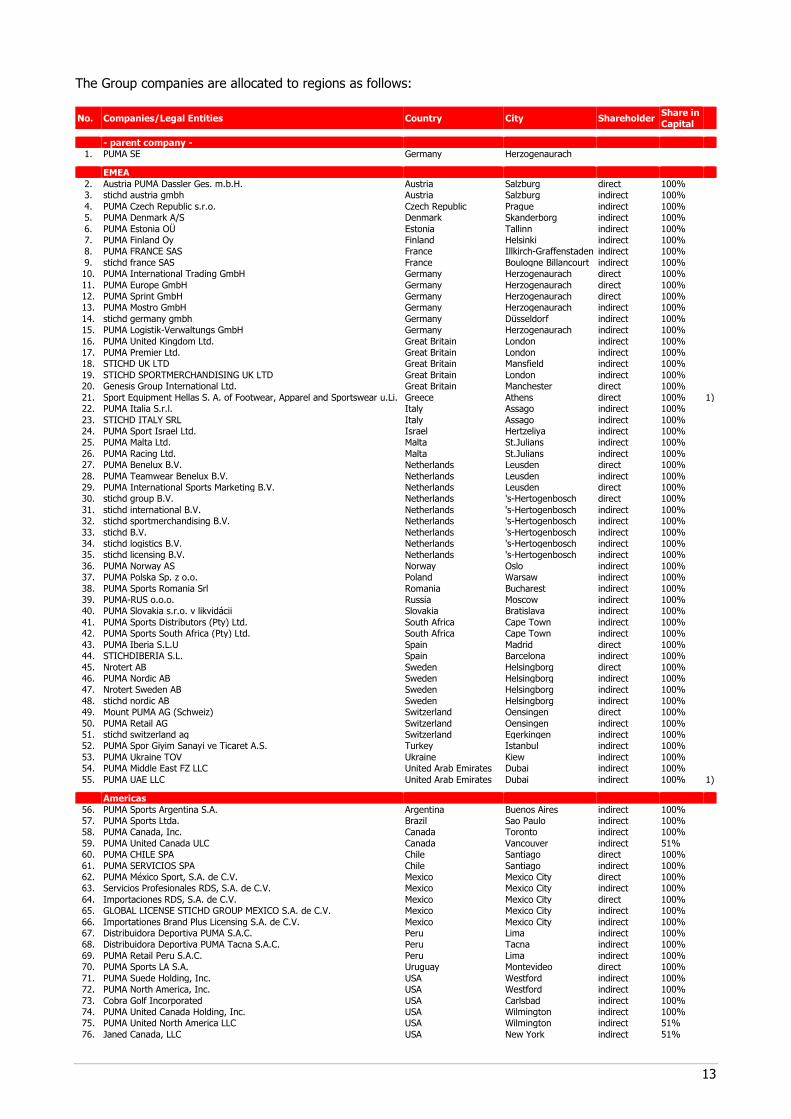
13
The Group companies are allocated to regions as follows:
No. Companies/Legal Entities Country City Shareholder Share in Capital
- parent company - 1. PUMA SE Germany Herzogenaurach
EMEA
2. Austria PUMA Dassler Ges. m.b.H. Austria Salzburg direct 100%
3. stichd austria gmbh Austria Salzburg indirect 100%
4. PUMA Czech Republic s.r.o. Czech Republic Prague indirect 100%
5. PUMA Denmark A/S Denmark Skanderborg indirect 100%
6. PUMA Estonia OÜ Estonia Tallinn indirect 100%
7. PUMA Finland Oy Finland Helsinki indirect 100%
8. PUMA FRANCE SAS France Illkirch-Graffenstaden indirect 100%
9. stichd france SAS France Boulogne Billancourt indirect 100%
10. PUMA International Trading GmbH Germany Herzogenaurach direct 100%
11. PUMA Europe GmbH Germany Herzogenaurach direct 100%
12. PUMA Sprint GmbH Germany Herzogenaurach direct 100%
13. PUMA Mostro GmbH Germany Herzogenaurach indirect 100%
14. stichd germany gmbh Germany Düsseldorf indirect 100%
15. PUMA Logistik-Verwaltungs GmbH Germany Herzogenaurach indirect 100%
16. PUMA United Kingdom Ltd. Great Britain London indirect 100%
17. PUMA Premier Ltd. Great Britain London indirect 100%
18. STICHD UK LTD Great Britain Mansfield indirect 100%
19. STICHD SPORTMERCHANDISING UK LTD Great Britain London indirect 100%
20. Genesis Group International Ltd. Great Britain Manchester direct 100%
21. Sport Equipment Hellas S. A. of Footwear, Apparel and Sportswear u.Li. Greece Athens direct 100% 1) 22. PUMA Italia S.r.l. Italy Assago indirect 100%
23. STICHD ITALY SRL Italy Assago indirect 100%
24. PUMA Sport Israel Ltd. Israel Hertzeliya indirect 100%
25. PUMA Malta Ltd. Malta St.Julians indirect 100%
26. PUMA Racing Ltd. Malta St.Julians indirect 100%
27. PUMA Benelux B.V. Netherlands Leusden direct 100%
28. PUMA Teamwear Benelux B.V. Netherlands Leusden indirect 100%
29. PUMA International Sports Marketing B.V. Netherlands Leusden direct 100%
30. stichd group B.V. Netherlands 's-Hertogenbosch direct 100%
31. stichd international B.V. Netherlands 's-Hertogenbosch indirect 100%
32. stichd sportmerchandising B.V. Netherlands 's-Hertogenbosch indirect 100%
33. stichd B.V. Netherlands 's-Hertogenbosch indirect 100%
34. stichd logistics B.V. Netherlands 's-Hertogenbosch indirect 100%
35. stichd licensing B.V. Netherlands 's-Hertogenbosch indirect 100%
36. PUMA Norway AS Norway Oslo indirect 100%
37. PUMA Polska Sp. z o.o. Poland Warsaw indirect 100%
38. PUMA Sports Romania Srl Romania Bucharest indirect 100%
39. PUMA-RUS o.o.o. Russia Moscow indirect 100%
40. PUMA Slovakia s.r.o. v likvidácii Slovakia Bratislava indirect 100%
41. PUMA Sports Distributors (Pty) Ltd. South Africa Cape Town indirect 100%
42. PUMA Sports South Africa (Pty) Ltd. South Africa Cape Town indirect 100%
43. PUMA Iberia S.L.U Spain Madrid direct 100%
44. STICHDIBERIA S.L. Spain Barcelona indirect 100%
45. Nrotert AB Sweden Helsingborg direct 100%
46. PUMA Nordic AB Sweden Helsingborg indirect 100%
47. Nrotert Sweden AB Sweden Helsingborg indirect 100%
48. stichd nordic AB Sweden Helsingborg indirect 100%
49. Mount PUMA AG (Schweiz) Switzerland Oensingen direct 100%
50. PUMA Retail AG Switzerland Oensingen indirect 100%
51. stichd switzerland ag Switzerland Egerkingen indirect 100%
52. PUMA Spor Giyim Sanayi ve Ticaret A.S. Turkey Istanbul indirect 100%
53. PUMA Ukraine TOV Ukraine Kiew indirect 100%
54. PUMA Middle East FZ LLC United Arab Emirates Dubai indirect 100%
55. PUMA UAE LLC United Arab Emirates Dubai indirect 100% 1)
Americas
56. PUMA Sports Argentina S.A. Argentina Buenos Aires indirect 100%
57. PUMA Sports Ltda. Brazil Sao Paulo indirect 100%
58. PUMA Canada, Inc. Canada Toronto indirect 100%
59. PUMA United Canada ULC Canada Vancouver indirect 51%
60. PUMA CHILE SPA Chile Santiago direct 100%
61. PUMA SERVICIOS SPA Chile Santiago indirect 100%
62. PUMA México Sport, S.A. de C.V. Mexico Mexico City direct 100%
63. Servicios Profesionales RDS, S.A. de C.V. Mexico Mexico City indirect 100%
64. Importaciones RDS, S.A. de C.V. Mexico Mexico City direct 100%
65. GLOBAL LICENSE STICHD GROUP MEXICO S.A. de C.V. Mexico Mexico City indirect 100%
66. Importationes Brand Plus Licensing S.A. de C.V. Mexico Mexico City indirect 100%
67. Distribuidora Deportiva PUMA S.A.C. Peru Lima indirect 100%
68. Distribuidora Deportiva PUMA Tacna S.A.C. Peru Tacna indirect 100%
69. PUMA Retail Peru S.A.C. Peru Lima indirect 100%
70. PUMA Sports LA S.A. Uruguay Montevideo direct 100%
71. PUMA Suede Holding, Inc. USA Westford indirect 100%
72. PUMA North America, Inc. USA Westford indirect 100%
73. Cobra Golf Incorporated USA Carlsbad indirect 100%
74. PUMA United Canada Holding, Inc. USA Wilmington indirect 100%
75. PUMA United North America LLC USA Wilmington indirect 51%
76. Janed Canada, LLC USA New York indirect 51%
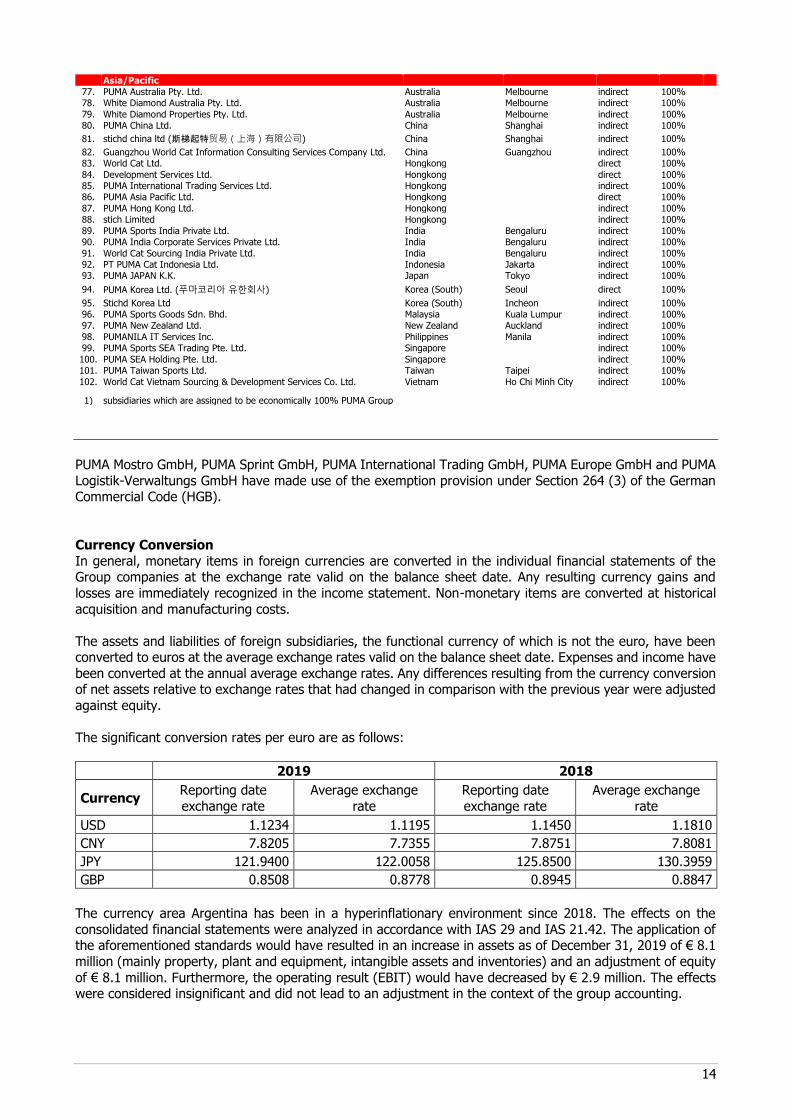
14
Asia/Pacific
77. PUMA Australia Pty. Ltd. Australia Melbourne indirect 100%
78. White Diamond Australia Pty. Ltd. Australia Melbourne indirect 100%
79. White Diamond Properties Pty. Ltd. Australia Melbourne indirect 100%
80. PUMA China Ltd. China Shanghai indirect 100%
81. stichd china ltd (斯梯起特贸易(上海)有限公司) China Shanghai indirect 100%
82. Guangzhou World Cat Information Consulting Services Company Ltd. China Guangzhou indirect 100%
83. World Cat Ltd. Hongkong direct 100%
84. Development Services Ltd. Hongkong direct 100%
85. PUMA International Trading Services Ltd. Hongkong indirect 100%
86. PUMA Asia Pacific Ltd. Hongkong direct 100%
87. PUMA Hong Kong Ltd. Hongkong indirect 100%
88. stich Limited Hongkong indirect 100%
89. PUMA Sports India Private Ltd. India Bengaluru indirect 100%
90. PUMA India Corporate Services Private Ltd. India Bengaluru indirect 100%
91. World Cat Sourcing India Private Ltd. India Bengaluru indirect 100%
92. PT PUMA Cat Indonesia Ltd. Indonesia Jakarta indirect 100%
93. PUMA JAPAN K.K. Japan Tokyo indirect 100%
94. PUMA Korea Ltd. (푸마코리아 유한회사) Korea (South) Seoul direct 100%
95. Stichd Korea Ltd Korea (South) Incheon indirect 100%
96. PUMA Sports Goods Sdn. Bhd. Malaysia Kuala Lumpur indirect 100%
97. PUMA New Zealand Ltd. New Zealand Auckland indirect 100%
98. PUMANILA IT Services Inc. Philippines Manila indirect 100%
99. PUMA Sports SEA Trading Pte. Ltd. Singapore indirect 100%
100. PUMA SEA Holding Pte. Ltd. Singapore indirect 100%
101. PUMA Taiwan Sports Ltd. Taiwan Taipei indirect 100%
102. World Cat Vietnam Sourcing & Development Services Co. Ltd. Vietnam Ho Chi Minh City indirect 100%
1) subsidiaries which are assigned to be economically 100% PUMA Group
PUMA Mostro GmbH, PUMA Sprint GmbH, PUMA International Trading GmbH, PUMA Europe GmbH and PUMA
Logistik-Verwaltungs GmbH have made use of the exemption provision under Section 264 (3) of the German Commercial Code (HGB).
Currency Conversion
In general, monetary items in foreign currencies are converted in the individual financial statements of the Group companies at the exchange rate valid on the balance sheet date. Any resulting currency gains and
losses are immediately recognized in the income statement. Non-monetary items are converted at historical
acquisition and manufacturing costs.
The assets and liabilities of foreign subsidiaries, the functional currency of which is not the euro, have been converted to euros at the average exchange rates valid on the balance sheet date. Expenses and income have
been converted at the annual average exchange rates. Any differences resulting from the currency conversion of net assets relative to exchange rates that had changed in comparison with the previous year were adjusted
against equity.
The significant conversion rates per euro are as follows:
2019 2018
Currency Reporting date
exchange rate
Average exchange
rate
Reporting date
exchange rate
Average exchange
rate
USD 1.1234 1.1195 1.1450 1.1810
CNY 7.8205 7.7355 7.8751 7.8081
JPY 121.9400 122.0058 125.8500 130.3959
GBP 0.8508 0.8778 0.8945 0.8847
The currency area Argentina has been in a hyperinflationary environment since 2018. The effects on the
consolidated financial statements were analyzed in accordance with IAS 29 and IAS 21.42. The application of the aforementioned standards would have resulted in an increase in assets as of December 31, 2019 of € 8.1
million (mainly property, plant and equipment, intangible assets and inventories) and an adjustment of equity
of € 8.1 million. Furthermore, the operating result (EBIT) would have decreased by € 2.9 million. The effects were considered insignificant and did not lead to an adjustment in the context of the group accounting.
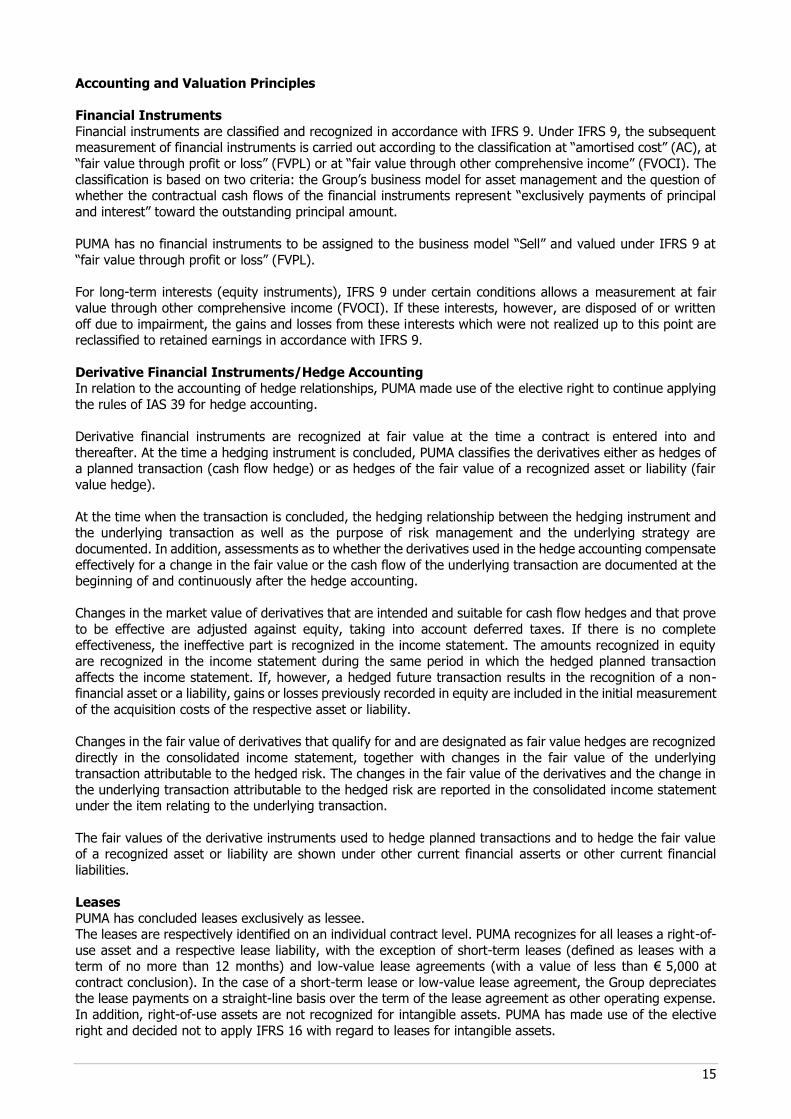
15
Accounting and Valuation Principles
Financial Instruments
Financial instruments are classified and recognized in accordance with IFRS 9. Under IFRS 9, the subsequent measurement of financial instruments is carried out according to the classification at “amortised cost” (AC), at
“fair value through profit or loss” (FVPL) or at “fair value through other comprehensive income” (FVOCI). The
classification is based on two criteria: the Group’s business model for asset management and the question of whether the contractual cash flows of the financial instruments represent “exclusively payments of principal
and interest” toward the outstanding principal amount.
PUMA has no financial instruments to be assigned to the business model “Sell” and valued under IFRS 9 at
“fair value through profit or loss” (FVPL).
For long-term interests (equity instruments), IFRS 9 under certain conditions allows a measurement at fair value through other comprehensive income (FVOCI). If these interests, however, are disposed of or written
off due to impairment, the gains and losses from these interests which were not realized up to this point are reclassified to retained earnings in accordance with IFRS 9.
Derivative Financial Instruments/Hedge Accounting In relation to the accounting of hedge relationships, PUMA made use of the elective right to continue applying
the rules of IAS 39 for hedge accounting.
Derivative financial instruments are recognized at fair value at the time a contract is entered into and
thereafter. At the time a hedging instrument is concluded, PUMA classifies the derivatives either as hedges of a planned transaction (cash flow hedge) or as hedges of the fair value of a recognized asset or liability (fair
value hedge).
At the time when the transaction is concluded, the hedging relationship between the hedging instrument and the underlying transaction as well as the purpose of risk management and the underlying strategy are
documented. In addition, assessments as to whether the derivatives used in the hedge accounting compensate
effectively for a change in the fair value or the cash flow of the underlying transaction are documented at the beginning of and continuously after the hedge accounting.
Changes in the market value of derivatives that are intended and suitable for cash flow hedges and that prove
to be effective are adjusted against equity, taking into account deferred taxes. If there is no complete
effectiveness, the ineffective part is recognized in the income statement. The amounts recognized in equity are recognized in the income statement during the same period in which the hedged planned transaction
affects the income statement. If, however, a hedged future transaction results in the recognition of a non-financial asset or a liability, gains or losses previously recorded in equity are included in the initial measurement
of the acquisition costs of the respective asset or liability.
Changes in the fair value of derivatives that qualify for and are designated as fair value hedges are recognized
directly in the consolidated income statement, together with changes in the fair value of the underlying transaction attributable to the hedged risk. The changes in the fair value of the derivatives and the change in
the underlying transaction attributable to the hedged risk are reported in the consolidated income statement under the item relating to the underlying transaction.
The fair values of the derivative instruments used to hedge planned transactions and to hedge the fair value of a recognized asset or liability are shown under other current financial asserts or other current financial
liabilities.
Leases
PUMA has concluded leases exclusively as lessee. The leases are respectively identified on an individual contract level. PUMA recognizes for all leases a right-of-
use asset and a respective lease liability, with the exception of short-term leases (defined as leases with a term of no more than 12 months) and low-value lease agreements (with a value of less than € 5,000 at
contract conclusion). In the case of a short-term lease or low-value lease agreement, the Group depreciates the lease payments on a straight-line basis over the term of the lease agreement as other operating expense.
In addition, right-of-use assets are not recognized for intangible assets. PUMA has made use of the elective
right and decided not to apply IFRS 16 with regard to leases for intangible assets.
16
The lease liability at initial recognition is measured at the present value of the not yet paid lease payments at
the beginning of the lease agreement. The present value is calculated using the incremental borrowing rate, as the interest rate underlying the lease contract is usually not known.
The following lease payments are included in the measurement of the lease liability:
• Fixed lease payments (including in-substance fixed payments), less any incentive payments to be
received;
• Variable lease payments based on an index or rate, initially measured based on the index or rate at
the start of the lease agreement; as a result, future adjustments after changes in the index or rate remain unrecognized;
• Exercise price of purchase options, if PUMA is sufficiently certain that it will exercise them;
• Expected payments from residual value guarantees; and
• Penalties for the early termination of lease agreements, if PUMA is sufficiently certain that it will
exercise this termination option and if this was taken respectively into account when determining the term of the lease agreement.
A number of lease agreements, particularly for real estate properties, contain extension and termination
options. When determining agreement terms, all facts and circumstances are taken into account that offer an
economic incentive to exercise the extension option or not exercise the termination option. The changes in the term of a lease due to the exercise or non-exercise of such options are only taken into account for the
agreement term if they are sufficiently certain.
The lease liability is recognized as a separate line item on the consolidated balance sheet.
The subsequent measurement of the lease liability is done by increasing the carrying amount by adding the
accrued interest of the lease liability (using the effective interest method) and by reducing the carrying amount of the lease liability by the lease payments made.
If the term of a lease has changed or if a material event has led to a change in the assessment relating to the exercise of a purchase option, PUMA will remeasure the lease liability by discounting the adjusted lease
payments using an updated interest rate and will adjust the corresponding right-of-use asset accordingly.
If lease payments have changed due to index or interest rate changes or due to a change in the expected payments to be made due to a residual value guarantee, PUMA will remeasure the lease liability by discounting
the adjusted lease payments using an unchanged discount rate. The corresponding right-of-use asset is
adjusted accordingly.
If a lease is changed and the change in the lease is not recognized as a separate lease, PUMA will remeasure the lease liability based on the lease term. As part of this, the changed lease payments are discounted using
the updated interest rate at the time the change becomes effective.
The right-of-use assets comprise the respective lease liability as part of initial measurement. Lease installments
that are paid before or at the beginning of the lease must be added. Lease incentives received from the lessor must be deducted and initial direct costs must be included. If dismantling obligations exist with regard to the
leased assets, they are included in the measurement of the right-of-use assets. The subsequent measurement of the right-of-use assets is at acquisition cost less accumulated depreciation and impairment losses.
The right-of-use assets are generally depreciated over the term of the lease. If the useful life of the asset underlying the lease is shorter, this limits the depreciation period accordingly. Depreciation starts with the
commencement of the lease.
The right-of-use assets are recognized as a separate line item in the consolidated balance sheet.
The right-of-use assets are subject to impairment of assets in accordance with IAS 36. This approach is
described in the following section "Impairment of Assets".
Variable lease payments that are not dependent on an index or interest rate are not included in the valuation
of the lease liabilities. These payments are recognized in the income statement as other expenses as soon as PUMA has received the underlying benefit. This applies primarily to turnover-based rents for retail stores.
17
As part of the practical expedient, IFRS 16 permits omitting to separate between non-leasing components and
leasing components. With regard to land and buildings, PUMA generally does not apply the practical expedient so that the right-of-use assets relating to land and buildings only contain leasing components. With regard to
other right-of-use assets (comprising technical equipment & machines and motor vehicles), the practical expedient is generally applied, as a result of which the leasing components and non-leasing components are
both recognized.
Cash and Cash Equivalents
Cash and cash equivalents include cash and bank balances. To the extent that bank deposits are not immediately required to finance current assets, they are invested as risk-free fixed-term deposits, presently
for a term of up to three months. The total amount of cash and cash equivalents is consistent with the cash
and cash equivalents stated in the cash flow statement.
Cash and cash equivalents are measured at amortised cost. They are subject to the impairment requirements in accordance with IFRS 9 "Financial Instruments". PUMA monitors the credit risk of these financial instruments
taking into account the economic situation, external credit rating and/or premiums for credit default swaps (CDS) of other financial institutions. The credit risk from cash and cash equivalents is classified as immaterial,
due to the relatively short terms and the investment-grade credit rating of the counterparty, which signals a
relative low probability of default.
Inventories Inventories are measured at acquisition or manufacturing costs or at the lower net realizable values derived
from the selling price on the balance sheet date. The acquisition cost of merchandise is determined using an
averaging method. Value adjustments are adequately recorded, depending on age, seasonality and realizable market prices, in a manner that is standard throughout the Group.
Trade Receivables
Trade Receivables are initially measured at the transaction price and subsequently at amortised cost with deduction of value adjustments. The transaction price according to IFRS 15 “Revenue from Contracts with
Customers” is the amount of the consideration expected by the company for the delivery of goods or the
provision of services to customers, not taking into account the amounts collected on behalf of third parties.
For determining the value adjustments to trade receivables, PUMA uniformly applies the simplified method in order to determine the expected credit losses over the remaining lifetime of the trade receivables (called
"lifetime expected credit losses") in accordance with the provisions of IFRS 9 “Financial Instruments”. For this,
trade receivables are classified by geographic region to suitable groups with shared credit risk characteristics. The expected credit losses are calculated using a matrix that presents the age structure of the receivables and
depicts a likelihood of loss for the individual maturity bands of the receivables on the basis of historic credit loss events and future-based factors. The percentage rates for the loss likelihoods are checked regularly to
ensure they are up to date. If objective indications of a credit impairment are found regarding the trade
receivables of a certain customer, a detailed analysis of this customer’s specific credit risk is conducted and an individual value adjustment is recognized for the trade receivables with respect to this customer. If a credit
insurance is in place, it is taken into account in the amount of the value adjustment.
Other assets Other assets are initially measured at fair value, taking into account transaction costs, and subsequently
measured at amortised costs after deduction of value adjustments.
Other financial assets are classified based on the business model for control and the cash flows of the financial
assets. In the Group, financial assets are held exclusively under a business model that provides for “holding” the asset until maturity, in order to collect the contractual cash flows. The subsequent measurement of the
Other financial assets is therefore always carried out at amortised cost. The business model “trading” and the
category “measured at fair value through profit or loss” (FVPL) are not used.
The non-current assets contain loans and other assets. Non-interest-bearing non-current assets are discounted to present value if the resulting effect is significant.
Non-current investments
The investments recognized under non-current financial assets belong to the category “measured at fair value
through other comprehensive income” (FVOCI), since these investments are held over the long term for strategic reasons.
18
All purchases and disposals of non-current investments are recorded on the trade date. Non-current
investments are initially recognized at fair value plus transaction costs. They are also recognized at fair value in subsequent periods if this can be reliably determined. Unrealized gains and losses are recognized in the
Other Comprehensive Income, taking into account deferred taxes. The gain or loss on disposal of non-current investments is transferred to retained earnings.
The category “measured at fair value through profit or loss” (FVPL) is not used in the Group.
Property, Plant and Equipment Property, plant and equipment are measured at acquisition costs, net of accumulated depreciation. The
depreciation period depends on the expected useful life of the respective item. The straight-line method of
depreciation is applied. The useful life depends on the type of the assets involved. Buildings are subject to a useful life of between ten and fifty years, and a useful life of between three to ten years is assumed for
movable assets. The acquisition costs of property, plant and equipment also include interest on borrowings in accordance with IAS 23, insofar as these accrue and the effect is significant.
Repair and maintenance costs are recorded as an expense as of the date on which they were incurred.
Substantial improvements and upgrades are capitalized to the extent that the criteria for capitalization of an
asset item apply.
Goodwill Goodwill resulting from a business combination is calculated based on the difference between the transferred
consideration and the Group's share in the fair value of the acquired assets and liabilities.
Goodwill amounts are allocated to the Group’s cash-generating units that are expected to benefit from the
synergy effects resulting from the business combination.
An impairment test of goodwill per group of cash-generating units (usually the smallest company level at which goodwill is monitored) is performed once a year and whenever there are indicators of impairment and can
result in an impairment loss. There is no reversal of an impairment loss for goodwill. See chapter 11 for further
details, in particular regarding the assumptions used for the calculation.
Other Intangible Assets Acquired intangible assets largely consist of concessions, intellectual property rights and similar rights. These
are measured at acquisition costs, net of accumulated amortization. The useful life of intangible assets is
between three and ten years. Depreciation is done on a straight-line basis.
If the capitalization requirements of IAS 38.57 "Intangible Assets" are met cumulatively, expenses in the development phase for internally generated intangible assets are capitalized at the time they arise. In
subsequent periods, internally generated intangible assets and acquired intangible assets are measured at
cost less accumulated amortization and impairment losses. In the Group, own work capitalized is generally depreciated on a straight-line basis over a useful life of 3 years.
The item also includes acquired trademark rights, which are assumed to have an indefinite useful life in light
of the history of the brands and due to the fact that the brands are continued by PUMA.
Impairment of Assets
Intangible assets with an indefinite useful life are not amortised according to schedule but are subjected to an annual impairment test. Property, plant and equipment, right-of-use assets, and other intangible assets with
finite useful lives are tested for impairment if there is any indication of impairment in the value of the asset concerned. In order to determine whether there is a requirement to record the impairment of an asset, the
recoverable amount of the respective asset (the higher amount of the fair value less costs to sell and value in
use) is compared with the carrying amount of the asset. If the recoverable amount is lower than the carrying amount, the difference is recorded as an impairment loss. The test for impairment is performed, if possible,
at the level of the respective individual asset, otherwise at the level of the cash-generating unit. Goodwill, on the other hand, is tested for impairment only at the level of a group of cash-generating units. If it is determined
within the scope of the impairment test that an asset needs to be written down, then the goodwill, if any, of the group of cash-generating units is written down initially and, in a second step, the remaining amount is
distributed proportionately over the remaining assets within the application scope of IAS 36. If the reason for
the recorded impairment no longer applies, a reversal of impairment loss is recorded to the maximum amount of the amortised costs. There is no reversal of an impairment loss for goodwill.
19
Impairment tests are performed using the discounted cash flow method. For determining the fair value less
costs to sell and value in use, the expected cash flows are based on corporate planning data. Expected cash flows are discounted using an interest rate in line with market conditions. As part of the fair value determination
less cost to sell, no special synergies of cash-generating units are taken into account, and corporate planning data is adjusted to the assumptions of market participants, if required. Moreover, there is a difference between
the fair value less costs to sell and the value in use because the costs to sell are also taken into account.
Trademarks with an indefinite useful life are subjected to an impairment test based on the relief-from-royalty
method during the financial year or when the occasion arises. Should indications of a value impairment of a self-used trademark arise, the recoverability of the trademark is not only measured individually using the relief-
from-royalty method, but the recoverable amount of the group of cash-generating units to which the trademark
is to be allocated is also determined.
The inclusion of the right-of-use assets due to the initial application of IFRS 16 resulted in an increase of the carrying amounts to be tested. This has an effect on the impairment tests in 2019. In contrast, the initial
application of IFRS 16 also resulted in an increase of the recoverable amount because lease payments were eliminated from Free cash flow. In addition, due to the recognition of the lease liabilities of peer group
companies on the balance sheet, their debt ratio has increased and consequently the weighted average capital
costs (WACC) have decreased. Overall, the adjustments did not have any effect on the result of the impairment tests. See chapter 11 for further details, in particular regarding the assumptions used for the calculation.
Financial Debt, Other Financial Liabilities and Other Liabilities In general, these items are recognized at their acquisition cost, taking into account transaction costs and
subsequently recognized at amortised cost. Non-interest or low-interest-bearing liabilities with a term of at least one year are recognized at present value, taking into account an interest rate in line with market
conditions, and are compounded until their maturity at their repayment amount. Liabilities from finance lease agreements are recorded as of the beginning of the lease transaction at the amount of the present value of
the minimum lease amount, or at the lower fair value, and are adjusted by the repayment amount of the lease
installments.
The category “measured at fair value through profit or loss” (FVPL) is not used in the Group with regard to financial liabilities.
As a general rule, current financial liabilities also include those long-term loans that have a maximum residual term of up to one year.
Provisions for Pensions and Similar Obligations
In addition to defined benefit plans, some companies apply defined contribution plans, which do not result in
any additional pension commitment other than the current contributions. The pension provision under defined benefit plans is generally calculated using the projected unit credit method. This method takes into account
not only known pension benefits and pension rights accrued as of the reporting date, but also expected future salary and pension increases. The defined benefit obligation (DBO) is calculated by discounting expected future
cash outflows at the rate of return on senior, fixed-rate corporate bonds. The currencies and maturity periods of the underlying corporate bonds are consistent with the currencies and maturity periods of the obligations
to be satisfied. In some of the plans, the obligation is accompanied by a plan asset. In that case, the pension
provision shown is reduced by the plan asset.
Revaluations, consisting of actuarial profits and losses, changes resulting from use of the asset ceiling and return on plan assets (without interest on the net debt) are immediately recorded under Other Comprehensive
Income. The revaluations recorded in Other Comprehensive Income are part of the retained earnings and are
no longer reclassified into the income statement. Past service costs are recorded as an expense if changes are made to the plan.
Details regarding the assumed life expectancy and the mortality tables used are shown in chapter 15.
20
Other Provisions
Provisions are recognized if the Group, as a result of a past event, has a current obligation and this obligation is likely to result in an outflow of resources with economic benefits, the amount of which can be reliably
estimated. The provisions are recognized at their settlement value as determined on the basis of the best possible estimate and are not offset by income. Non-current provisions are discounted.
Provisions for the expected expenses from warranty obligations pursuant to the respective national sales contract laws are recognized at the time of sale of the relevant products, according to the best estimate in
relation to the expenditure needed in order to fulfill the Group’s obligation.
Provisions are also recognized to account for onerous contracts. An onerous contract is assumed to exist where
the unavoidable costs for fulfilling the contract exceed the economic benefit arising from this contract.
Provisions for restructuring measures are also recorded if a detailed, formal restructuring plan has been prepared, which has created a justified expectation that the restructuring measures will be carried out by
those concerned due to its implementation starting or its major components being announced.
Treasury shares
Treasury stock is deducted from equity at its market price as of the date of acquisition, plus incidental acquisition costs. Pursuant to the authorization of the Annual General Meeting, treasury stock can be
repurchased for any authorized purpose, including the flexible management of the Company's capital requirements.
Management Incentive Programs PUMA uses cash-settled share-based payments and key performance indicator-based long-term incentive
programs.
For share-based remunerations with cash compensation, a liability is recorded for the services received and measured with its fair value upon recognition. Until the debt is cleared, its fair value is recalculated on every
balance sheet date and on the settlement date and all changes to the fair value are recognized in the income
statement.
During the three-year term of the respective programs, the medium-term targets of the PUMA Group with regard to operating result (EBIT), cash flow and gross profit margin are determined for key figure-based
compensation processes and recognized in the income statement as Other Provisions with their respective
degree of target achievement.
Recognition of Sales Revenues The Group recognizes sales revenues from the sale of sporting goods. The sales revenues are measured at
fair value of the consideration to which the Group expects to be entitled from the contract with the customer,
taking into account returns, discounts and rebates. Amounts collected on behalf of third parties are not included in the sales revenues. The Group records sales revenues at the time when PUMA fulfills its
performance obligation to the customer and has transferred the right of disposal over the product to the customer.
The Group sells footwear, apparel and accessories both to wholesalers and directly to customers through its
own retail stores. Meanwhile, the sales-related warranty services cannot be purchased separately and do not
lead to services that go beyond the assurance of the specifications at the time of the transfer of risk. Accordingly, the Group records warranties in the balance sheet in conformity with IAS 37 Provisions,
Contingent Liabilities and Contingent Assets.
In the case of sales of products to wholesalers, the sales revenue is recorded at the date on which the right
of disposal over the products is transferred to the customer, in other words, when the products have been shipped to the specific location of the wholesaler (delivery). After delivery, the wholesaler bears the inventory
risk and has full right of disposal over the manner and means of distribution and the selling price of the products. In the case of sales to end customers in the Group’s own retail stores, the sales revenues are
recorded at the date when the right of disposal over the products is transferred to the end customer, in other words, the date on which the end customer buys the products in the retail shop. The payment of the purchase
price is due as soon as the customer purchases the products.
21
Under certain conditions and according to the contractual stipulations, the customer has the option to
exchange products or return them for a credit. The amount of the expected returns is estimated on the basis of past experience and is deducted from sales revenues by a provision for returns. The asset value of the right
arising from the product return claim is recorded under Inventories and leads to a corresponding reduction of Cost of Sales.
Royalty and Commission Income The Group records royalty and commission income from the licensing of trademark rights to third parties.
Income from royalties is recognized in the income statement in accordance with the invoices to be submitted by the licensees. In certain cases, values must be estimated in order to permit accounting on an accrual basis.
Commission income is invoiced if the underlying purchase transaction is classified as realized.
Advertising and Promotional Expenses
Advertising expenses are recognized in the income statement as of the date of their accrual. In general, promotional expenses stretching over several years are recognized as an expense over the contractual term
on an accrual basis. Any expenditure surplus resulting from this allocation of expenses after the balance sheet date are recognized in the form of an impairment of assets or a provision for anticipated losses in the financial
statements.
Product Development
PUMA continuously develops new products in order to meet market requirements and market changes. Research costs are expensed in full at the time they are incurred. Development costs are also recognized as
an expense when they do not meet the recognition criteria of IAS 38 "Intangible Assets".
Financial result
The financial result includes the results from associated companies and interest income from financial investments as well as interest expenses from loans and in connection with financial instruments. Financial
results also include interest expenses from lease liabilities, discounted, non-current liabilities and from pension provisions that are associated with business combinations or arise from the measurement of pension
commitments.
Exchange rate effects that can be directly allocated to an underlying transaction are shown in the respective
income statement item.
Income taxes
Current income taxes are determined in accordance with the tax regulations of the respective countries where the Company conducts its operations.
Deferred taxes
Deferred taxes resulting from temporary valuation differences between the IFRS and tax balance sheets of
individual Group companies and from consolidation procedures, which are levied by the same taxation authority and can be netted, are charged to each taxable entity and recognized either as deferred tax assets
or deferred tax liabilities.
With regard to the leases that were capitalized, tax deduction potential is allocated to the respective right-of-use asset. If temporary differences arise during subsequent valuation from a netting perspective of right-of-
use asset and lease liability, deferred tax items will be created, provided the requirements under IAS 12 are
met.
Deferred tax assets may also include claims for tax reductions that result from the expected utilization of existing losses carried forward to subsequent years and which is sufficiently certain to materialize. Deferred
tax assets or liabilities may also result from accounting treatments that do not affect the income statement.
Deferred taxes are calculated on the basis of the tax rates that apply to the reversal in the individual countries and that are in force or adopted as of the balance sheet date.
Deferred tax assets are shown only to the extent that the respective tax advantage is likely to materialize.
Value adjustments are recognized on the basis of the past earnings situation and the business expectations for the foreseeable future, if this criterion is not fulfilled.
22
Assumptions and Estimates
The preparation of the consolidated financial statements requires some assumptions and estimates that have an impact on the measurement and presentation of the recognized assets and liabilities, income and expenses,
as well as contingent liabilities. The assumptions and estimates are based on premises, which in turn are based on currently available information. In individual cases, the actual values may deviate from the assumptions
and estimates made. Consequently, future periods involve a risk of adjustment to the carrying amount of the
assets and liabilities concerned. If the actual development differs from the expectation, the premises and, if necessary, the carrying amounts of the relevant assets and debts are adjusted with an effect on profit or loss.
All assumptions and estimates are continuously reassessed. They are based on historical experiences and
other factors, including expectations regarding future global and industry-related trends that appear
reasonable under the current circumstances. Assumptions and estimates are made in particular with regard to evaluating the control of companies with non-controlling interests, the measurement of goodwill and brands,
pension obligations, derivative financial instruments and taxes. The most significant forward-looking assumptions and sources of estimation and uncertainty as of the reporting date concerning the above-
mentioned items are discussed below.
Goodwill and Brands
A review of the impairment of goodwill is based on the calculation of the value in use as a leading valuation concept. In order to calculate the value in use, the Group must estimate the future cash flows from those
cash-generating units to which the goodwill is allocated. To this end, the data used were from the three-year plan, which is based on forecasts of the overall economic development and the resulting industry-specific
consumer behavior. Another key assumption concerns the determination of an appropriate interest rate for
discounting the cash flow to present value (discounted cash flow method). The “relief from royalty method” is used to value brands. See chapter 11 for further details, in particular regarding the assumptions used for the
calculation.
Pension Obligations Pension obligations are determined using an actuarial calculation. This calculation is contingent on a large
number of factors that are based on assumptions and estimates regarding the discount rate, the expected
return on plan assets, future wage and salary increases, mortality and future pension increases. Due to the long-term nature of the commitments made, the assumptions are subject to significant uncertainties. Any
change in these assumptions has an impact on the carrying amount of the pension obligations. The Group determines at the end of each year the discount rate applied to determine the present value of future
payments. This discount rate is based on the interest rates of corporate bonds with the highest credit rating
that are denominated in the currency in which the benefits are paid and the maturity of which corresponds to that of the pension obligations. See chapter 15 for further details, in particular regarding the parameters used
for the calculation.
Taxes
Tax items are determined taking into account the various prevailing local tax laws and the relevant administrative opinions and, due to their complexity, may be subject to different interpretations by persons
subject to tax on the one hand and the tax authorities on the other hand. Differing interpretations of tax laws may result in subsequent tax payments for past years; depending on the management’s assessment, these
differing opinions may be taken into account using the most probable amount for the respective case.
The recognition of deferred taxes, in particular with respect to tax losses carried forward, requires that
estimates and assumptions be made concerning future tax planning strategies as well as expected dates of occurrence and the amount of future taxable income. The taxable income from the relevant corporate planning
is derived for this judgment. This takes into account the past financial position and the business development expected in the future. Deferred tax assets on losses carried forward are recorded in the event of companies
incurring a loss only if it is highly probable that future positive income will be achieved that can be offset
against these tax losses carried forward in the next 5 years. Please see chapter 8 for further information and detailed assumptions.
Derivative Financial Instruments
The assumptions used for estimating derivative financial instruments are based on the prevailing market conditions as of the balance sheet date and thus reflect the fair value. See chapter 25 for further information.
23
Leases
The measurement of the lease liabilities is based on assumptions for the discount rates used, the term of the lease agreements and the deferral of fixed lease payments. To determine the present value of future minimum
lease payments, PUMA uses country- and currency-specific interest rates on borrowings with compatible terms. In addition to the basic lease period, the Group includes extension options in the determination of the
agreement term if management is sufficiently certain that such an option will be exercised after taking into
account all facts and circumstances. The fixed lease payments also include firmly agreed upon minimum amounts for agreements with a predominantly variable lease amount.
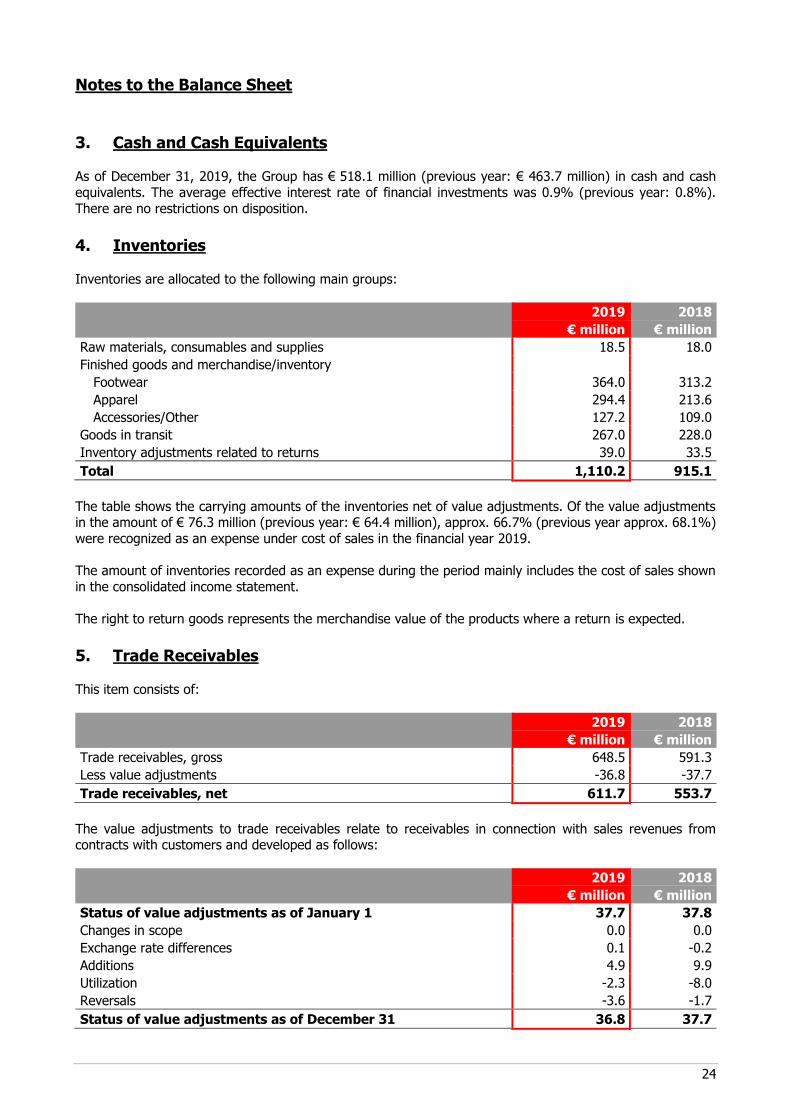
24
Notes to the Balance Sheet 3. Cash and Cash Equivalents As of December 31, 2019, the Group has € 518.1 million (previous year: € 463.7 million) in cash and cash
equivalents. The average effective interest rate of financial investments was 0.9% (previous year: 0.8%).
There are no restrictions on disposition.
4. Inventories Inventories are allocated to the following main groups:
2019 2018
€ million € million
Raw materials, consumables and supplies 18.5 18.0
Finished goods and merchandise/inventory
Footwear 364.0 313.2
Apparel 294.4 213.6
Accessories/Other 127.2 109.0
Goods in transit 267.0 228.0
Inventory adjustments related to returns 39.0 33.5
Total 1,110.2 915.1
The table shows the carrying amounts of the inventories net of value adjustments. Of the value adjustments in the amount of € 76.3 million (previous year: € 64.4 million), approx. 66.7% (previous year approx. 68.1%)
were recognized as an expense under cost of sales in the financial year 2019.
The amount of inventories recorded as an expense during the period mainly includes the cost of sales shown
in the consolidated income statement.
The right to return goods represents the merchandise value of the products where a return is expected.
5. Trade Receivables This item consists of:
2019 2018
€ million € million
Trade receivables, gross 648.5 591.3
Less value adjustments -36.8 -37.7
Trade receivables, net 611.7 553.7
The value adjustments to trade receivables relate to receivables in connection with sales revenues from contracts with customers and developed as follows:
2019 2018
€ million € million
Status of value adjustments as of January 1 37.7 37.8
Changes in scope 0.0 0.0
Exchange rate differences 0.1 -0.2
Additions 4.9 9.9
Utilization -2.3 -8.0
Reversals -3.6 -1.7
Status of value adjustments as of December 31 36.8 37.7
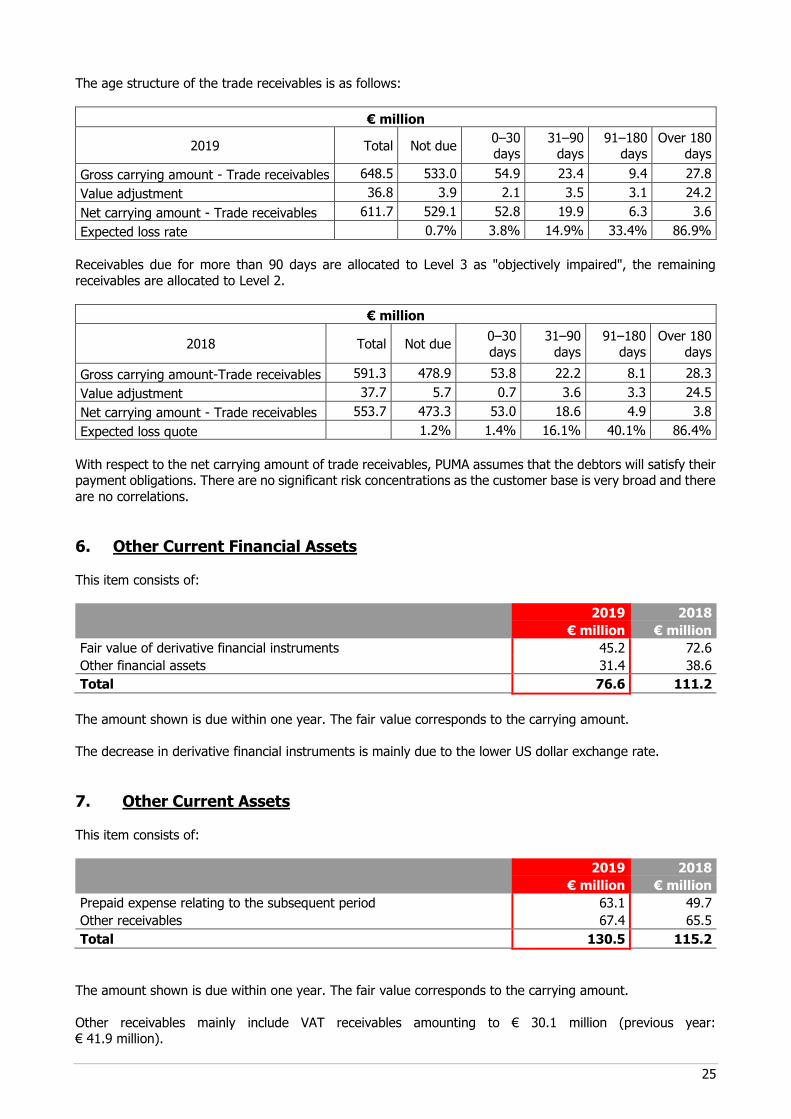
25
The age structure of the trade receivables is as follows:
€ million
2019 Total Not due 0–30 days
31–90 days
91–180 days
Over 180 days
Gross carrying amount - Trade receivables 648.5 533.0 54.9 23.4 9.4 27.8
Value adjustment 36.8 3.9 2.1 3.5 3.1 24.2
Net carrying amount - Trade receivables 611.7 529.1 52.8 19.9 6.3 3.6
Expected loss rate 0.7% 3.8% 14.9% 33.4% 86.9%
Receivables due for more than 90 days are allocated to Level 3 as "objectively impaired", the remaining
receivables are allocated to Level 2.
€ million
2018 Total Not due 0–30
days
31–90
days
91–180
days
Over 180
days
Gross carrying amount-Trade receivables 591.3 478.9 53.8 22.2 8.1 28.3
Value adjustment 37.7 5.7 0.7 3.6 3.3 24.5
Net carrying amount - Trade receivables 553.7 473.3 53.0 18.6 4.9 3.8
Expected loss quote 1.2% 1.4% 16.1% 40.1% 86.4%
With respect to the net carrying amount of trade receivables, PUMA assumes that the debtors will satisfy their payment obligations. There are no significant risk concentrations as the customer base is very broad and there
are no correlations.
6. Other Current Financial Assets
This item consists of:
2019 2018
€ million € million
Fair value of derivative financial instruments 45.2 72.6
Other financial assets 31.4 38.6
Total 76.6 111.2
The amount shown is due within one year. The fair value corresponds to the carrying amount.
The decrease in derivative financial instruments is mainly due to the lower US dollar exchange rate.
7. Other Current Assets This item consists of:
2019 2018
€ million € million
Prepaid expense relating to the subsequent period 63.1 49.7
Other receivables 67.4 65.5
Total 130.5 115.2
The amount shown is due within one year. The fair value corresponds to the carrying amount.
Other receivables mainly include VAT receivables amounting to € 30.1 million (previous year: € 41.9 million).
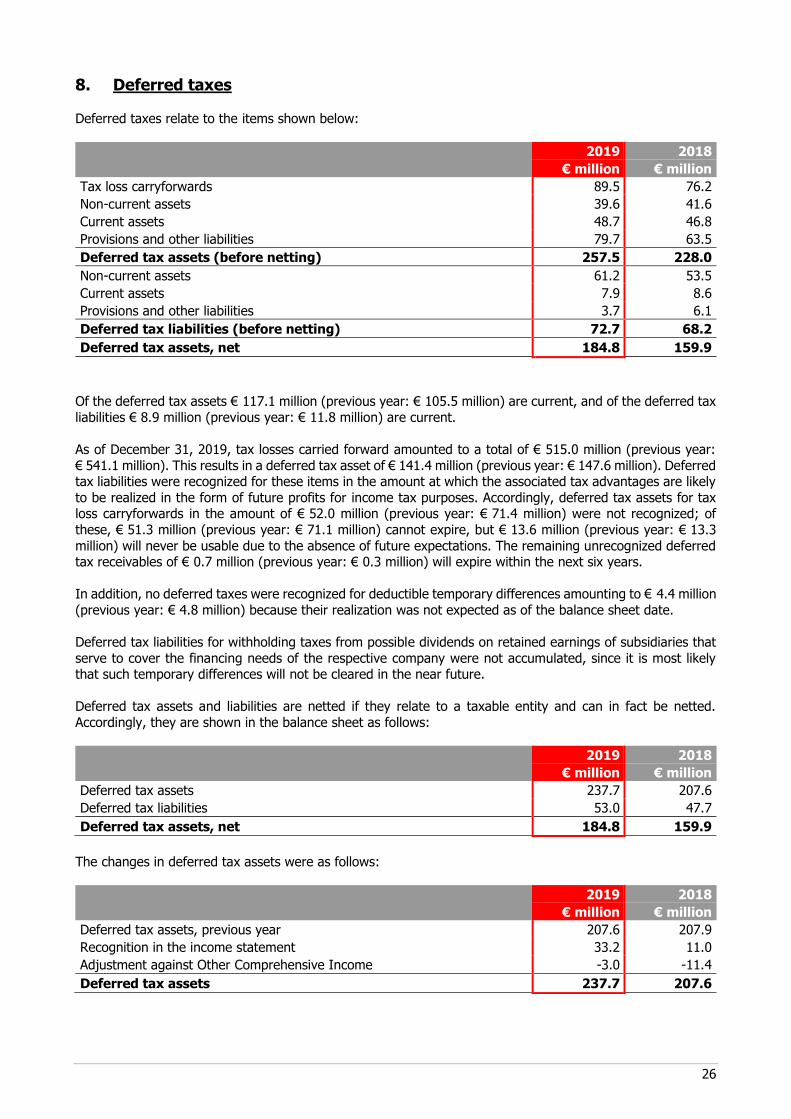
26
8. Deferred taxes Deferred taxes relate to the items shown below:
2019 2018
€ million € million
Tax loss carryforwards 89.5 76.2
Non-current assets 39.6 41.6
Current assets 48.7 46.8
Provisions and other liabilities 79.7 63.5
Deferred tax assets (before netting) 257.5 228.0
Non-current assets 61.2 53.5
Current assets 7.9 8.6
Provisions and other liabilities 3.7 6.1
Deferred tax liabilities (before netting) 72.7 68.2
Deferred tax assets, net 184.8 159.9
Of the deferred tax assets € 117.1 million (previous year: € 105.5 million) are current, and of the deferred tax
liabilities € 8.9 million (previous year: € 11.8 million) are current.
As of December 31, 2019, tax losses carried forward amounted to a total of € 515.0 million (previous year:
€ 541.1 million). This results in a deferred tax asset of € 141.4 million (previous year: € 147.6 million). Deferred tax liabilities were recognized for these items in the amount at which the associated tax advantages are likely
to be realized in the form of future profits for income tax purposes. Accordingly, deferred tax assets for tax loss carryforwards in the amount of € 52.0 million (previous year: € 71.4 million) were not recognized; of
these, € 51.3 million (previous year: € 71.1 million) cannot expire, but € 13.6 million (previous year: € 13.3
million) will never be usable due to the absence of future expectations. The remaining unrecognized deferred tax receivables of € 0.7 million (previous year: € 0.3 million) will expire within the next six years.
In addition, no deferred taxes were recognized for deductible temporary differences amounting to € 4.4 million
(previous year: € 4.8 million) because their realization was not expected as of the balance sheet date.
Deferred tax liabilities for withholding taxes from possible dividends on retained earnings of subsidiaries that
serve to cover the financing needs of the respective company were not accumulated, since it is most likely that such temporary differences will not be cleared in the near future.
Deferred tax assets and liabilities are netted if they relate to a taxable entity and can in fact be netted.
Accordingly, they are shown in the balance sheet as follows:
2019 2018
€ million € million
Deferred tax assets 237.7 207.6
Deferred tax liabilities 53.0 47.7
Deferred tax assets, net 184.8 159.9
The changes in deferred tax assets were as follows:
2019 2018
€ million € million
Deferred tax assets, previous year 207.6 207.9
Recognition in the income statement 33.2 11.0
Adjustment against Other Comprehensive Income -3.0 -11.4
Deferred tax assets 237.7 207.6
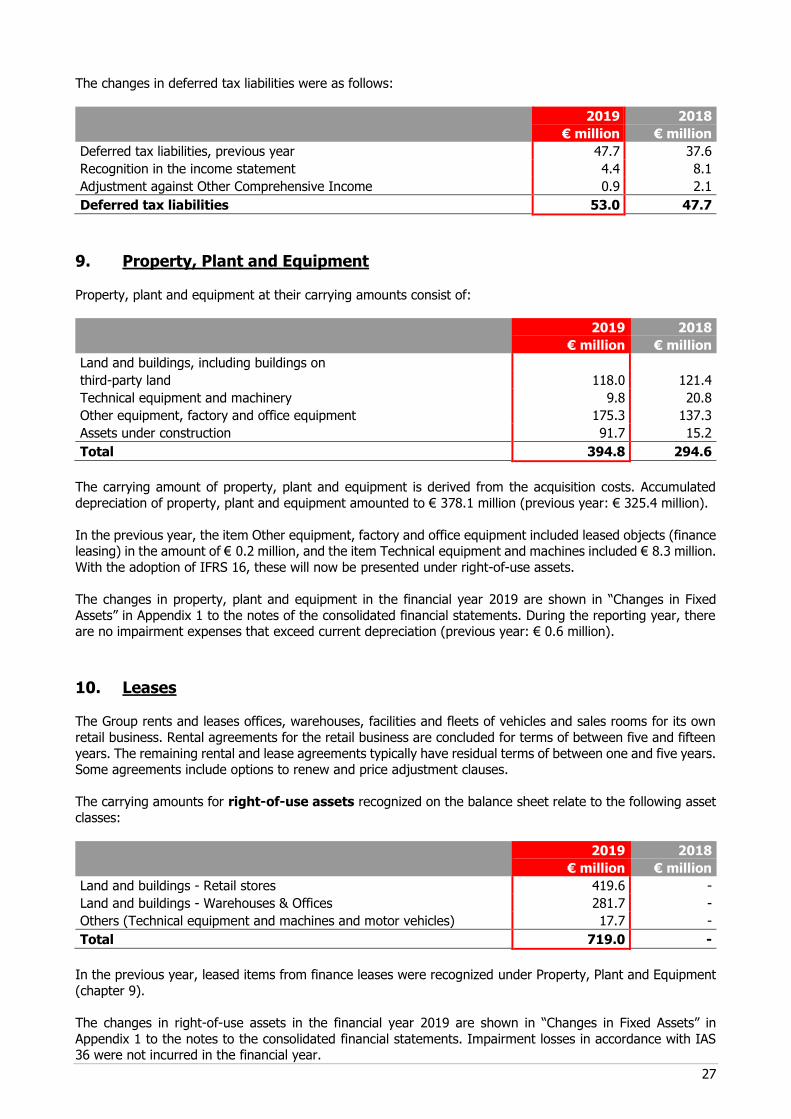
27
The changes in deferred tax liabilities were as follows:
2019 2018
€ million € million
Deferred tax liabilities, previous year 47.7 37.6
Recognition in the income statement 4.4 8.1
Adjustment against Other Comprehensive Income 0.9 2.1
Deferred tax liabilities 53.0 47.7
9. Property, Plant and Equipment
Property, plant and equipment at their carrying amounts consist of:
2019 2018
€ million € million
Land and buildings, including buildings on
third-party land 118.0 121.4
Technical equipment and machinery 9.8 20.8
Other equipment, factory and office equipment 175.3 137.3
Assets under construction 91.7 15.2
Total 394.8 294.6
The carrying amount of property, plant and equipment is derived from the acquisition costs. Accumulated
depreciation of property, plant and equipment amounted to € 378.1 million (previous year: € 325.4 million).
In the previous year, the item Other equipment, factory and office equipment included leased objects (finance leasing) in the amount of € 0.2 million, and the item Technical equipment and machines included € 8.3 million.
With the adoption of IFRS 16, these will now be presented under right-of-use assets.
The changes in property, plant and equipment in the financial year 2019 are shown in “Changes in Fixed
Assets” in Appendix 1 to the notes of the consolidated financial statements. During the reporting year, there are no impairment expenses that exceed current depreciation (previous year: € 0.6 million).
10. Leases The Group rents and leases offices, warehouses, facilities and fleets of vehicles and sales rooms for its own
retail business. Rental agreements for the retail business are concluded for terms of between five and fifteen
years. The remaining rental and lease agreements typically have residual terms of between one and five years. Some agreements include options to renew and price adjustment clauses.
The carrying amounts for right-of-use assets recognized on the balance sheet relate to the following asset
classes:
2019 2018
€ million € million
Land and buildings - Retail stores 419.6 -
Land and buildings - Warehouses & Offices 281.7 -
Others (Technical equipment and machines and motor vehicles) 17.7 -
Total 719.0 -
In the previous year, leased items from finance leases were recognized under Property, Plant and Equipment
(chapter 9).
The changes in right-of-use assets in the financial year 2019 are shown in “Changes in Fixed Assets” in
Appendix 1 to the notes to the consolidated financial statements. Impairment losses in accordance with IAS 36 were not incurred in the financial year.
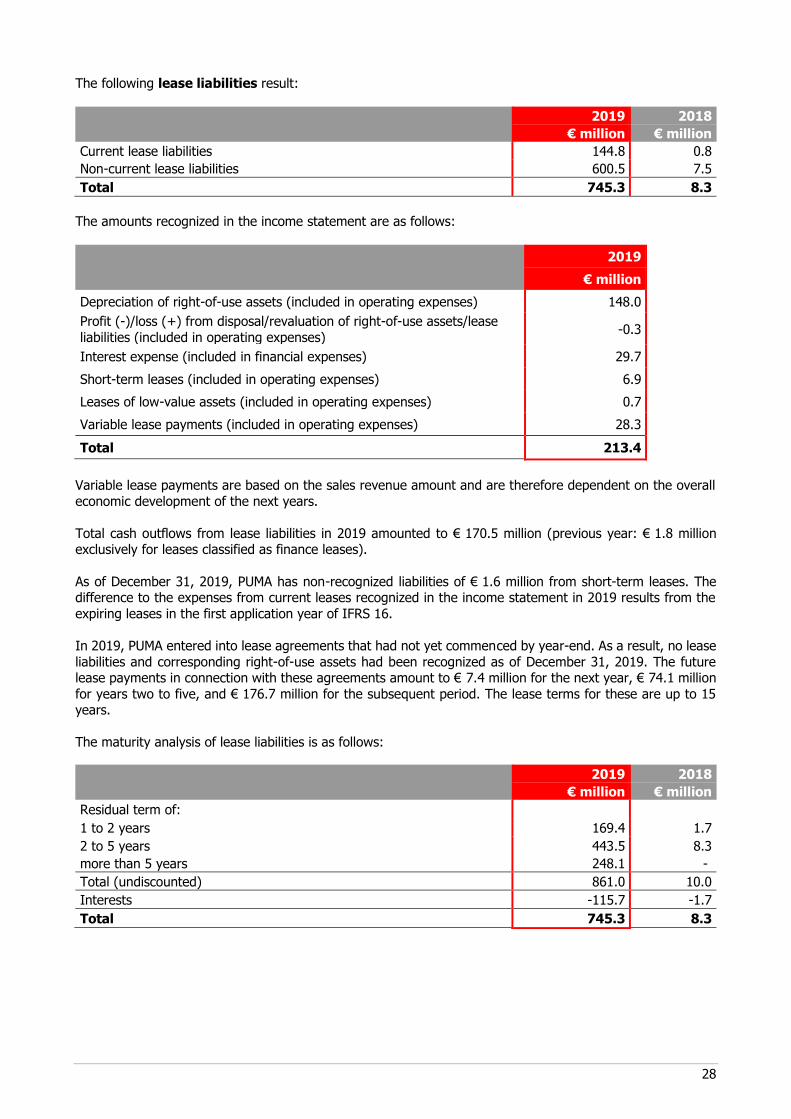
28
The following lease liabilities result:
2019 2018
€ million € million
Current lease liabilities 144.8 0.8
Non-current lease liabilities 600.5 7.5
Total 745.3 8.3
The amounts recognized in the income statement are as follows:
2019
€ million
Depreciation of right-of-use assets (included in operating expenses) 148.0
Profit (-)/loss (+) from disposal/revaluation of right-of-use assets/lease
liabilities (included in operating expenses) -0.3
Interest expense (included in financial expenses) 29.7
Short-term leases (included in operating expenses) 6.9
Leases of low-value assets (included in operating expenses) 0.7
Variable lease payments (included in operating expenses) 28.3
Total 213.4
Variable lease payments are based on the sales revenue amount and are therefore dependent on the overall
economic development of the next years.
Total cash outflows from lease liabilities in 2019 amounted to € 170.5 million (previous year: € 1.8 million exclusively for leases classified as finance leases).
As of December 31, 2019, PUMA has non-recognized liabilities of € 1.6 million from short-term leases. The difference to the expenses from current leases recognized in the income statement in 2019 results from the
expiring leases in the first application year of IFRS 16.
In 2019, PUMA entered into lease agreements that had not yet commenced by year-end. As a result, no lease
liabilities and corresponding right-of-use assets had been recognized as of December 31, 2019. The future lease payments in connection with these agreements amount to € 7.4 million for the next year, € 74.1 million
for years two to five, and € 176.7 million for the subsequent period. The lease terms for these are up to 15 years.
The maturity analysis of lease liabilities is as follows:
2019 2018
€ million € million
Residual term of:
1 to 2 years 169.4 1.7
2 to 5 years 443.5 8.3
more than 5 years 248.1 -
Total (undiscounted) 861.0 10.0
Interests -115.7 -1.7
Total 745.3 8.3
29
11. Intangible Assets Intangible assets mainly include goodwill, intangible assets with indefinite useful lives, assets associated with
the Company’s own retail activities and software licenses.
Goodwill and intangible assets with indefinite useful lives are not amortized according to schedule. Impairment
tests with regard to goodwill were performed in the past financial year using the discounted cash flow method. The data from the three-year plan for the respective cash-generating unit or group of cash-generating units
was used as a basis for this. Planning on the level of the cash-generating units was thereby derived from the PUMA Group’s three-year plan. Group-level planning shows an overall average annual sales growth of around
10% on a currency-adjusted basis and forecasts an EBIT margin of around 10% by 2021/2022. In addition to
the sales growth, the improved EBIT margin in the planning period also resulted from the slight increase in the gross profit margin and the slightly weaker percentage increase of other operating income and expenses
compared to sales. The planning of investments and working capital is primarily based on past experience. The future tax payments are based on current tax rates. Cash flows beyond the three-year period as a rule
are forecast with a steady growth rate of 2.0% (previous years: 2.0%).
The recoverable amount for the respective cash-generating unit or group of cash-generating units was determined on the basis of the value in use. This did not result in an impairment loss.
In connection with the Golf business unit (CPG - Cobra PUMA Golf), the Cobra brand exists as an intangible
asset with an indefinite useful life amounting to € 126.6 million (previous year: € 124.2 million). The carrying
amount of the Cobra brand is significant in comparison to the overall carrying amount of the intangible assets with an indefinite useful life. It was assigned to the North America business segment, where the headquarters
of Cobra PUMA Golf is located. The recoverable amount of the Cobra brand (level 3) was determined using the relief-from-royalty method. A discount rate of 5.9% p.a. (previous year: 6.1% p.a.), a royalty rate of 8%
(previous year: 8%) and a 2% growth rate (previous year: 2%) were applied. If indications of a value impairment of a self-used trademark should arise, the trademark is not only valued
individually using the relief-from-royalty method, but the recoverable amount of the group of cash-generating
units to which the trademark is to be allocated is also determined. In 2019, there were no indications of an impairment.
In the financial year, development costs in connection with Cobra brand golf clubs amounting to € 1.8 million
(previous year: € 1.7 million) were capitalized. Development costs are allocated to the item Other Intangible
Assets in “Changes in Fixed Assets”. Current amortization of development costs amounted to € 1.8 million in
the financial year (previous year: € 1.1 million).
The changes in intangible assets in the financial year are shown in “Changes in Fixed Assets” of Appendix 1
to the notes to the consolidated financial statements. The item Other intangible assets includes advance payments in the amount of € 9.9 million (previous year: € 21.3 million).
The current amortization of intangible assets in the amount of € 23.5 million (previous year: € 17.2 million) is
included in the other operating expenses. Of this, € 4.6 million relate to sales and distribution expenses
(previous year: € 3.5 million), € 0.1 million to expenses for product management/ merchandising (previous
year: € 1.2 million), € 1.8 million to development expenses (previous year: € 0.0 million), and € 17.0 million
to administrative and general expenses (previous year: € 12.5 million). As in the previous year, there were no
impairment expenses that exceed current depreciation.
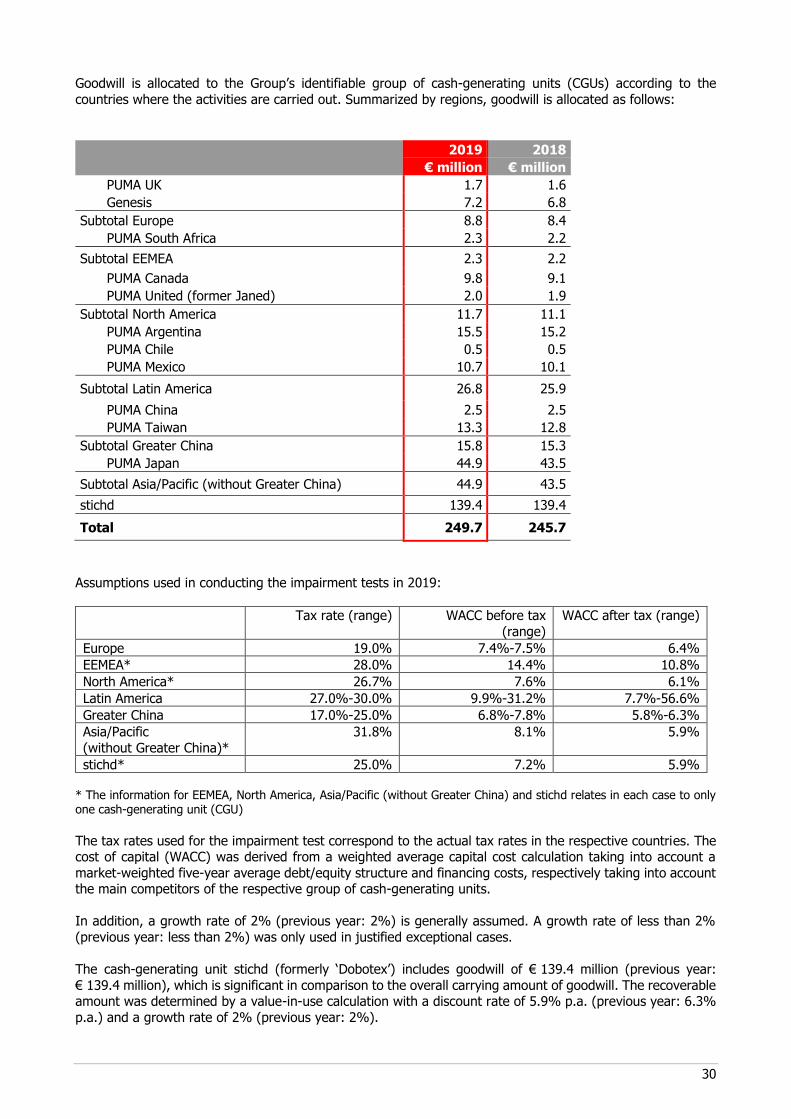
30
Goodwill is allocated to the Group’s identifiable group of cash-generating units (CGUs) according to the
countries where the activities are carried out. Summarized by regions, goodwill is allocated as follows:
2019 2018
€ million € million
PUMA UK 1.7 1.6
Genesis 7.2 6.8
Subtotal Europe 8.8 8.4
PUMA South Africa 2.3 2.2
Subtotal EEMEA 2.3 2.2
PUMA Canada 9.8 9.1
PUMA United (former Janed) 2.0 1.9
Subtotal North America 11.7 11.1
PUMA Argentina 15.5 15.2
PUMA Chile 0.5 0.5
PUMA Mexico 10.7 10.1
Subtotal Latin America 26.8 25.9
PUMA China 2.5 2.5
PUMA Taiwan 13.3 12.8
Subtotal Greater China 15.8 15.3
PUMA Japan 44.9 43.5
Subtotal Asia/Pacific (without Greater China) 44.9 43.5
stichd 139.4 139.4
Total 249.7 245.7
Assumptions used in conducting the impairment tests in 2019:
Tax rate (range) WACC before tax
(range)
WACC after tax (range)
Europe 19.0% 7.4%-7.5% 6.4%
EEMEA* 28.0% 14.4% 10.8%
North America* 26.7% 7.6% 6.1%
Latin America 27.0%-30.0% 9.9%-31.2% 7.7%-56.6%
Greater China 17.0%-25.0% 6.8%-7.8% 5.8%-6.3%
Asia/Pacific
(without Greater China)*
31.8% 8.1% 5.9%
stichd* 25.0% 7.2% 5.9% * The information for EEMEA, North America, Asia/Pacific (without Greater China) and stichd relates in each case to only one cash-generating unit (CGU)
The tax rates used for the impairment test correspond to the actual tax rates in the respective countries. The cost of capital (WACC) was derived from a weighted average capital cost calculation taking into account a
market-weighted five-year average debt/equity structure and financing costs, respectively taking into account the main competitors of the respective group of cash-generating units.
In addition, a growth rate of 2% (previous year: 2%) is generally assumed. A growth rate of less than 2%
(previous year: less than 2%) was only used in justified exceptional cases.
The cash-generating unit stichd (formerly ‘Dobotex’) includes goodwill of € 139.4 million (previous year:
€ 139.4 million), which is significant in comparison to the overall carrying amount of goodwill. The recoverable amount was determined by a value-in-use calculation with a discount rate of 5.9% p.a. (previous year: 6.3%
p.a.) and a growth rate of 2% (previous year: 2%).
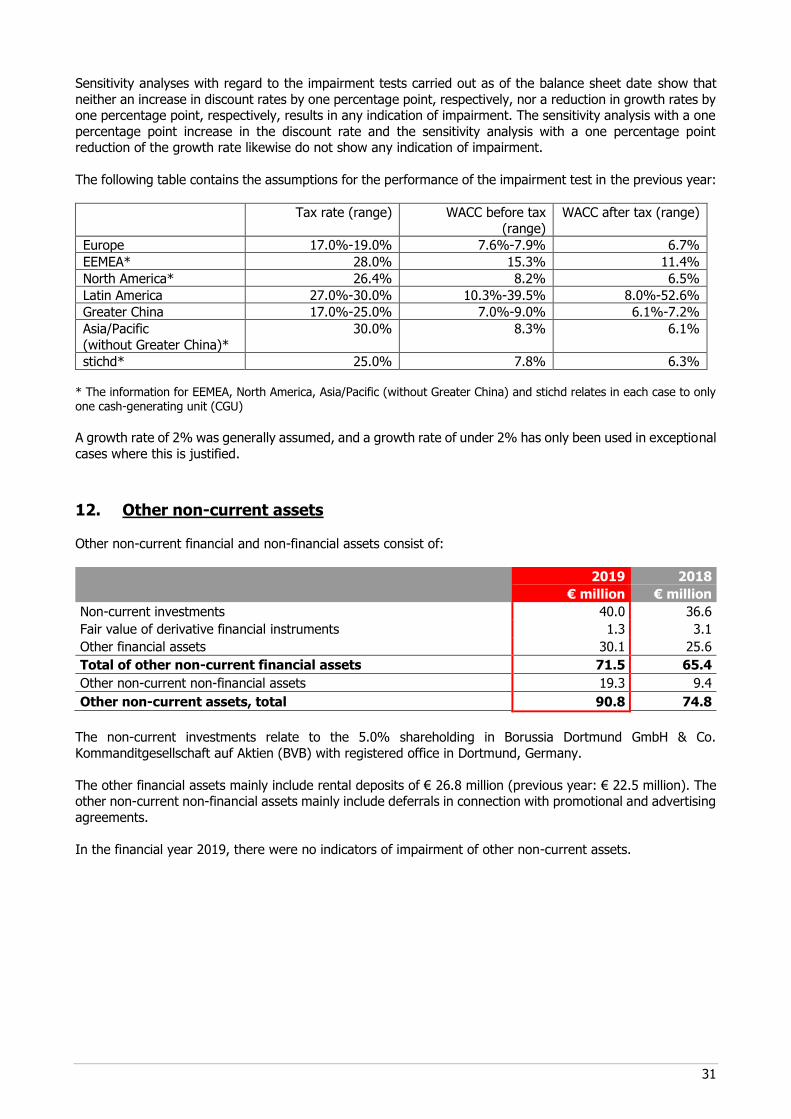
31
Sensitivity analyses with regard to the impairment tests carried out as of the balance sheet date show that
neither an increase in discount rates by one percentage point, respectively, nor a reduction in growth rates by one percentage point, respectively, results in any indication of impairment. The sensitivity analysis with a one
percentage point increase in the discount rate and the sensitivity analysis with a one percentage point reduction of the growth rate likewise do not show any indication of impairment.
The following table contains the assumptions for the performance of the impairment test in the previous year:
Tax rate (range) WACC before tax
(range)
WACC after tax (range)
Europe 17.0%-19.0% 7.6%-7.9% 6.7%
EEMEA* 28.0% 15.3% 11.4%
North America* 26.4% 8.2% 6.5%
Latin America 27.0%-30.0% 10.3%-39.5% 8.0%-52.6%
Greater China 17.0%-25.0% 7.0%-9.0% 6.1%-7.2%
Asia/Pacific
(without Greater China)*
30.0% 8.3% 6.1%
stichd* 25.0% 7.8% 6.3% * The information for EEMEA, North America, Asia/Pacific (without Greater China) and stichd relates in each case to only one cash-generating unit (CGU)
A growth rate of 2% was generally assumed, and a growth rate of under 2% has only been used in exceptional
cases where this is justified.
12. Other non-current assets Other non-current financial and non-financial assets consist of:
2019 2018
€ million € million
Non-current investments 40.0 36.6
Fair value of derivative financial instruments 1.3 3.1
Other financial assets 30.1 25.6
Total of other non-current financial assets 71.5 65.4
Other non-current non-financial assets 19.3 9.4
Other non-current assets, total 90.8 74.8
The non-current investments relate to the 5.0% shareholding in Borussia Dortmund GmbH & Co.
Kommanditgesellschaft auf Aktien (BVB) with registered office in Dortmund, Germany.
The other financial assets mainly include rental deposits of € 26.8 million (previous year: € 22.5 million). The other non-current non-financial assets mainly include deferrals in connection with promotional and advertising
agreements.
In the financial year 2019, there were no indicators of impairment of other non-current assets.
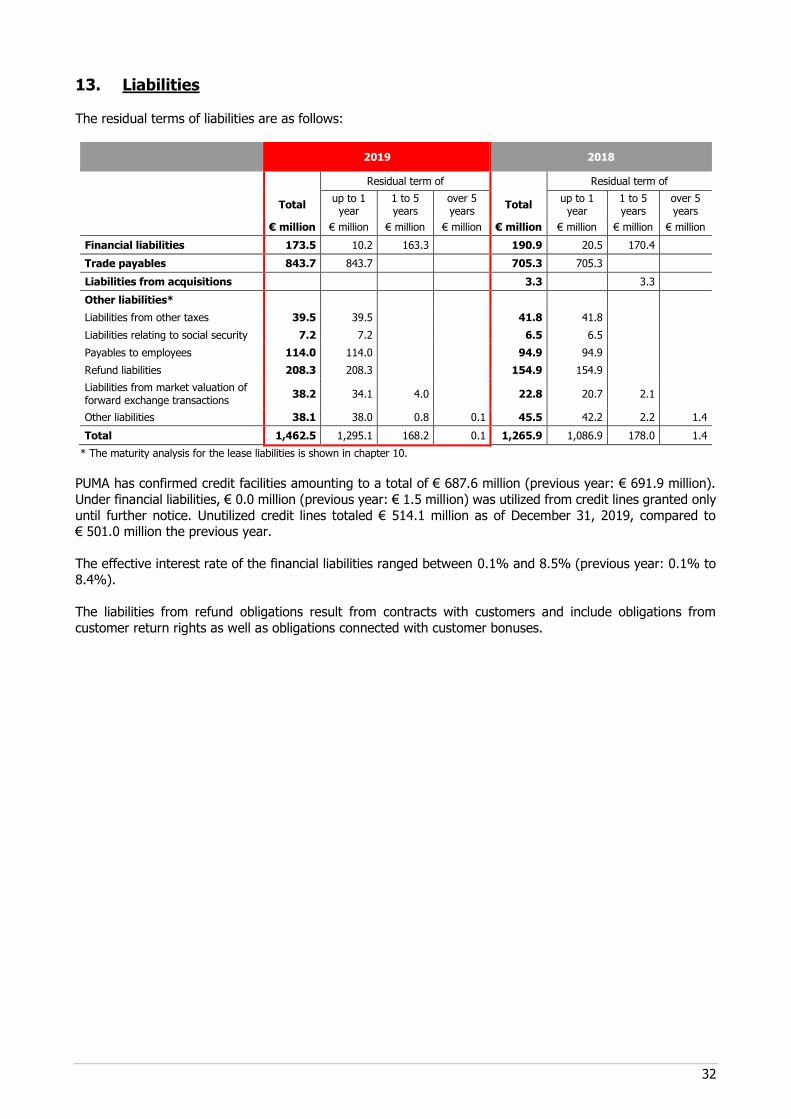
32
13. Liabilities The residual terms of liabilities are as follows:
2019 2018
Residual term of Residual term of
Total
up to 1 year
1 to 5 years
over 5 years
Total up to 1
year 1 to 5 years
over 5 years
€ million € million € million € million € million € million € million € million
Financial liabilities 173.5 10.2 163.3 0.0 190.9 20.5 170.4 0.0
Trade payables 843.7 843.7 0.0 0.0 705.3 705.3 0.0 0.0
Liabilities from acquisitions 0.0 0.0 0.0 0.0 3.3 0.0 3.3 0.0
Other liabilities* 0.0 0.0 0.0 0.0 0.0 0.0 0.0 0.0
Liabilities from other taxes 39.5 39.5 0.0 0.0 41.8 41.8 0.0 0.0
Liabilities relating to social security 7.2 7.2 0.0 0.0 6.5 6.5 0.0 0.0
Payables to employees 114.0 114.0 0.0 0.0 94.9 94.9 0.0 0.0
Refund liabilities 208.3 208.3 0.0 0.0 154.9 154.9 0.0 0.0
Liabilities from market valuation of forward exchange transactions
38.2 34.1 4.0 0.0 22.8 20.7 2.1 0.0
Other liabilities 38.1 38.0 0.8 0.1 45.5 42.2 2.2 1.4
Total 1,462.5 1,295.1 168.2 0.1 1,265.9 1,086.9 178.0 1.4
* The maturity analysis for the lease liabilities is shown in chapter 10.
PUMA has confirmed credit facilities amounting to a total of € 687.6 million (previous year: € 691.9 million).
Under financial liabilities, € 0.0 million (previous year: € 1.5 million) was utilized from credit lines granted only
until further notice. Unutilized credit lines totaled € 514.1 million as of December 31, 2019, compared to € 501.0 million the previous year.
The effective interest rate of the financial liabilities ranged between 0.1% and 8.5% (previous year: 0.1% to
8.4%).
The liabilities from refund obligations result from contracts with customers and include obligations from
customer return rights as well as obligations connected with customer bonuses.
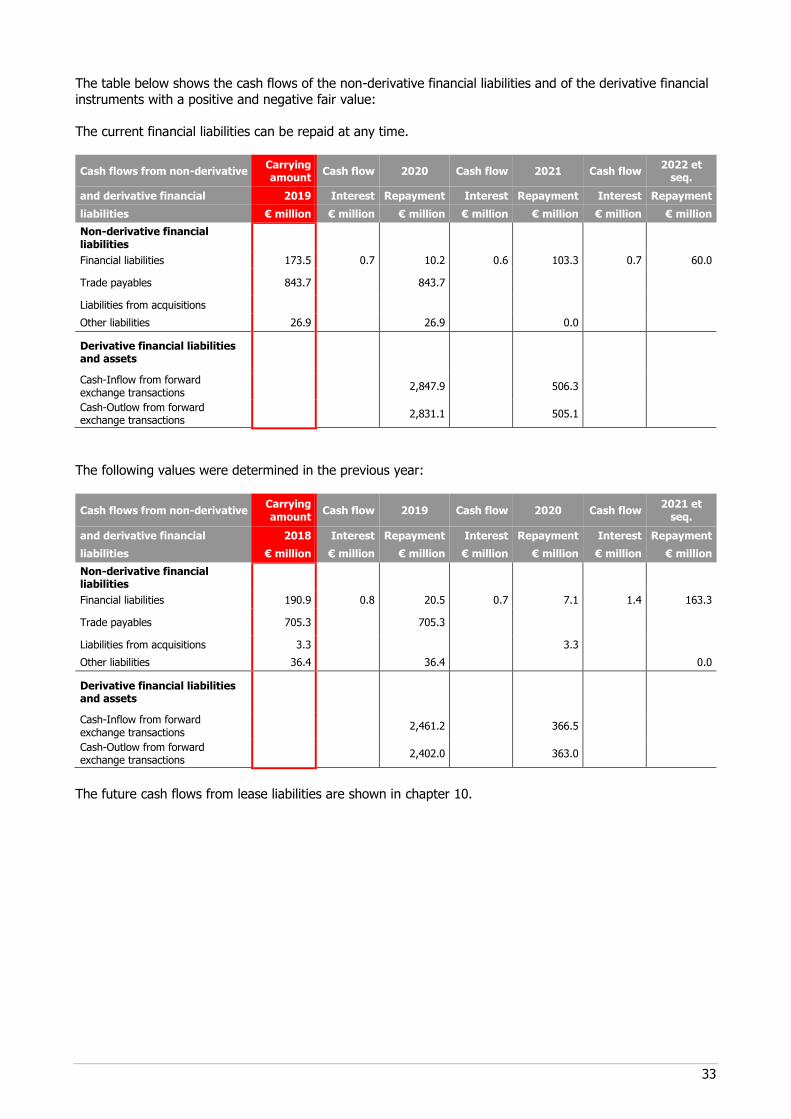
33
The table below shows the cash flows of the non-derivative financial liabilities and of the derivative financial
instruments with a positive and negative fair value:
The current financial liabilities can be repaid at any time.
Cash flows from non-derivative Carrying amount
Cash flow 2020 Cash flow 2021 Cash flow 2022 et
seq.
and derivative financial 2019 Interest Repayment Interest Repayment Interest Repayment
liabilities € million € million € million € million € million € million € million
Non-derivative financial liabilities
Financial liabilities 173.5 0.7 10.2 0.6 103.3 0.7 60.0
Trade payables 843.7 843.7
Liabilities from acquisitions Other liabilities 26.9 26.9 0.0
Derivative financial liabilities and assets
Cash-Inflow from forward exchange transactions
2,847.9 506.3
Cash-Outlow from forward exchange transactions
2,831.1 505.1
The following values were determined in the previous year:
Cash flows from non-derivative Carrying amount
Cash flow 2019 Cash flow 2020 Cash flow 2021 et
seq.
and derivative financial 2018 Interest Repayment Interest Repayment Interest Repayment
liabilities € million € million € million € million € million € million € million
Non-derivative financial liabilities
Financial liabilities 190.9 0.8 20.5 0.7 7.1 1.4 163.3
Trade payables 705.3 705.3
Liabilities from acquisitions 3.3 3.3 Other liabilities 36.4 36.4 0.0
Derivative financial liabilities and assets
Cash-Inflow from forward exchange transactions
2,461.2 366.5
Cash-Outlow from forward exchange transactions
2,402.0 363.0
The future cash flows from lease liabilities are shown in chapter 10.
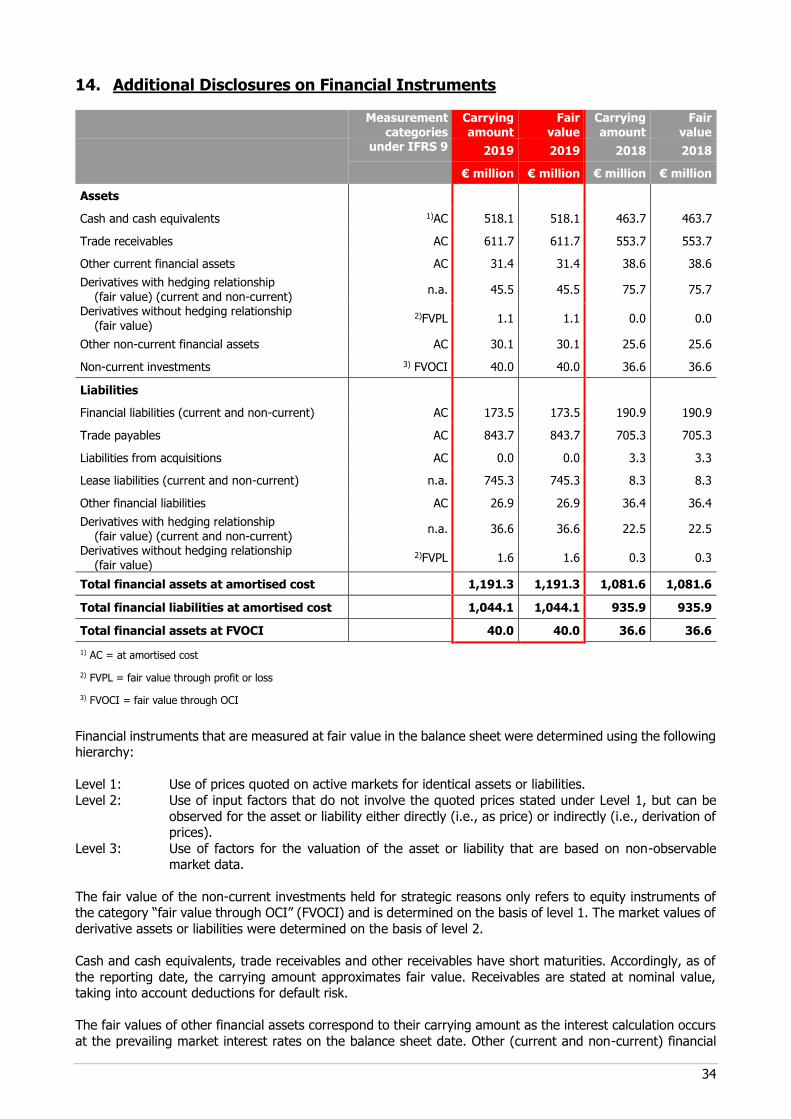
34
14. Additional Disclosures on Financial Instruments
Measurement
categories Carrying amount
Fair value
Carrying amount
Fair value
under IFRS 9 2019 2019 2018 2018
€ million € million € million € million
Assets
Cash and cash equivalents 1)AC 518.1 518.1 463.7 463.7
Trade receivables AC 611.7 611.7 553.7 553.7
Other current financial assets AC 31.4 31.4 38.6 38.6
Derivatives with hedging relationship (fair value) (current and non-current)
n.a. 45.5 45.5 75.7 75.7
Derivatives without hedging relationship
(fair value) 2)FVPL 1.1 1.1 0.0 0.0
Other non-current financial assets AC 30.1 30.1 25.6 25.6
Non-current investments 3) FVOCI 40.0 40.0 36.6 36.6
Liabilities
Financial liabilities (current and non-current) AC 173.5 173.5 190.9 190.9
Trade payables AC 843.7 843.7 705.3 705.3
Liabilities from acquisitions AC 0.0 0.0 3.3 3.3
Lease liabilities (current and non-current) n.a. 745.3 745.3 8.3 8.3
Other financial liabilities AC 26.9 26.9 36.4 36.4
Derivatives with hedging relationship (fair value) (current and non-current)
n.a. 36.6 36.6 22.5 22.5
Derivatives without hedging relationship (fair value)
2)FVPL 1.6 1.6 0.3 0.3
Total financial assets at amortised cost 1,191.3 1,191.3 1,081.6 1,081.6
Total financial liabilities at amortised cost 1,044.1 1,044.1 935.9 935.9
Total financial assets at FVOCI 40.0 40.0 36.6 36.6
1) AC = at amortised cost
2) FVPL = fair value through profit or loss
3) FVOCI = fair value through OCI
Financial instruments that are measured at fair value in the balance sheet were determined using the following hierarchy:
Level 1: Use of prices quoted on active markets for identical assets or liabilities.
Level 2: Use of input factors that do not involve the quoted prices stated under Level 1, but can be
observed for the asset or liability either directly (i.e., as price) or indirectly (i.e., derivation of prices).
Level 3: Use of factors for the valuation of the asset or liability that are based on non-observable market data.
The fair value of the non-current investments held for strategic reasons only refers to equity instruments of the category “fair value through OCI” (FVOCI) and is determined on the basis of level 1. The market values of
derivative assets or liabilities were determined on the basis of level 2.
Cash and cash equivalents, trade receivables and other receivables have short maturities. Accordingly, as of
the reporting date, the carrying amount approximates fair value. Receivables are stated at nominal value, taking into account deductions for default risk.
The fair values of other financial assets correspond to their carrying amount as the interest calculation occurs
at the prevailing market interest rates on the balance sheet date. Other (current and non-current) financial
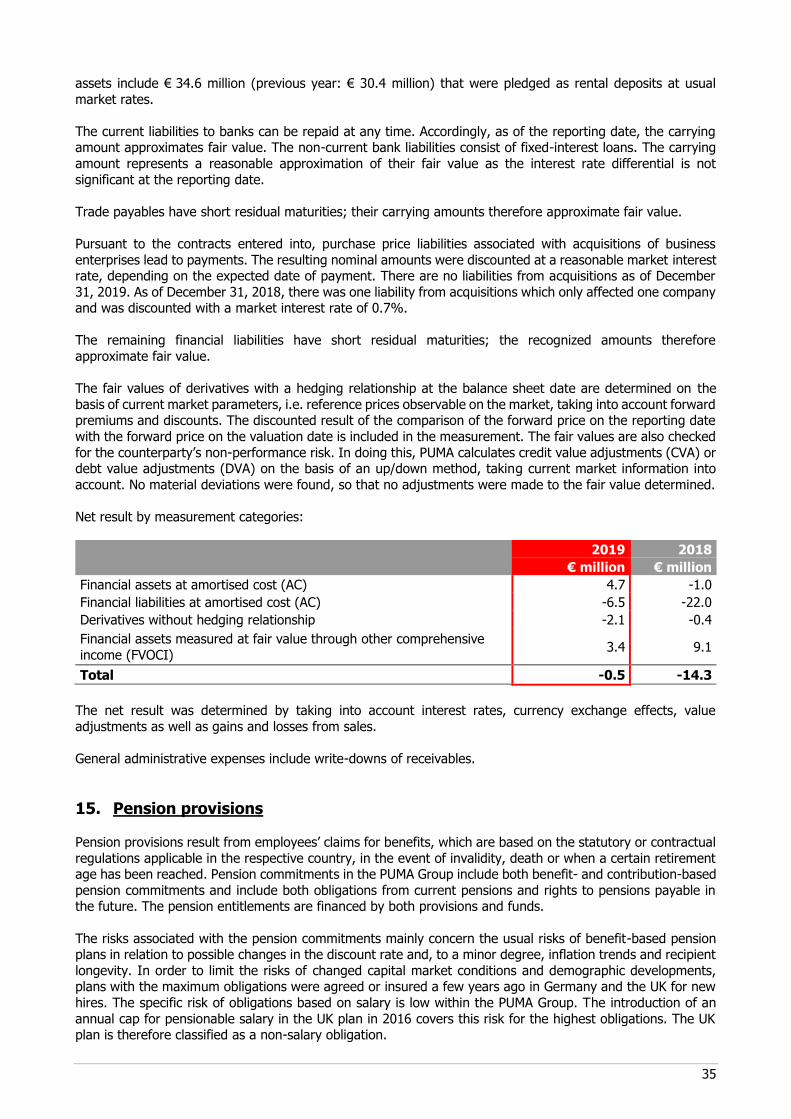
35
assets include € 34.6 million (previous year: € 30.4 million) that were pledged as rental deposits at usual
market rates.
The current liabilities to banks can be repaid at any time. Accordingly, as of the reporting date, the carrying amount approximates fair value. The non-current bank liabilities consist of fixed-interest loans. The carrying
amount represents a reasonable approximation of their fair value as the interest rate differential is not
significant at the reporting date.
Trade payables have short residual maturities; their carrying amounts therefore approximate fair value.
Pursuant to the contracts entered into, purchase price liabilities associated with acquisitions of business
enterprises lead to payments. The resulting nominal amounts were discounted at a reasonable market interest rate, depending on the expected date of payment. There are no liabilities from acquisitions as of December
31, 2019. As of December 31, 2018, there was one liability from acquisitions which only affected one company and was discounted with a market interest rate of 0.7%.
The remaining financial liabilities have short residual maturities; the recognized amounts therefore
approximate fair value.
The fair values of derivatives with a hedging relationship at the balance sheet date are determined on the
basis of current market parameters, i.e. reference prices observable on the market, taking into account forward premiums and discounts. The discounted result of the comparison of the forward price on the reporting date
with the forward price on the valuation date is included in the measurement. The fair values are also checked
for the counterparty’s non-performance risk. In doing this, PUMA calculates credit value adjustments (CVA) or debt value adjustments (DVA) on the basis of an up/down method, taking current market information into
account. No material deviations were found, so that no adjustments were made to the fair value determined.
Net result by measurement categories:
2019 2018
€ million € million
Financial assets at amortised cost (AC) 4.7 -1.0
Financial liabilities at amortised cost (AC) -6.5 -22.0
Derivatives without hedging relationship -2.1 -0.4
Financial assets measured at fair value through other comprehensive
income (FVOCI) 3.4 9.1
Total -0.5 -14.3
The net result was determined by taking into account interest rates, currency exchange effects, value
adjustments as well as gains and losses from sales.
General administrative expenses include write-downs of receivables.
15. Pension provisions Pension provisions result from employees’ claims for benefits, which are based on the statutory or contractual
regulations applicable in the respective country, in the event of invalidity, death or when a certain retirement age has been reached. Pension commitments in the PUMA Group include both benefit- and contribution-based
pension commitments and include both obligations from current pensions and rights to pensions payable in the future. The pension entitlements are financed by both provisions and funds.
The risks associated with the pension commitments mainly concern the usual risks of benefit-based pension plans in relation to possible changes in the discount rate and, to a minor degree, inflation trends and recipient
longevity. In order to limit the risks of changed capital market conditions and demographic developments, plans with the maximum obligations were agreed or insured a few years ago in Germany and the UK for new
hires. The specific risk of obligations based on salary is low within the PUMA Group. The introduction of an
annual cap for pensionable salary in the UK plan in 2016 covers this risk for the highest obligations. The UK plan is therefore classified as a non-salary obligation.
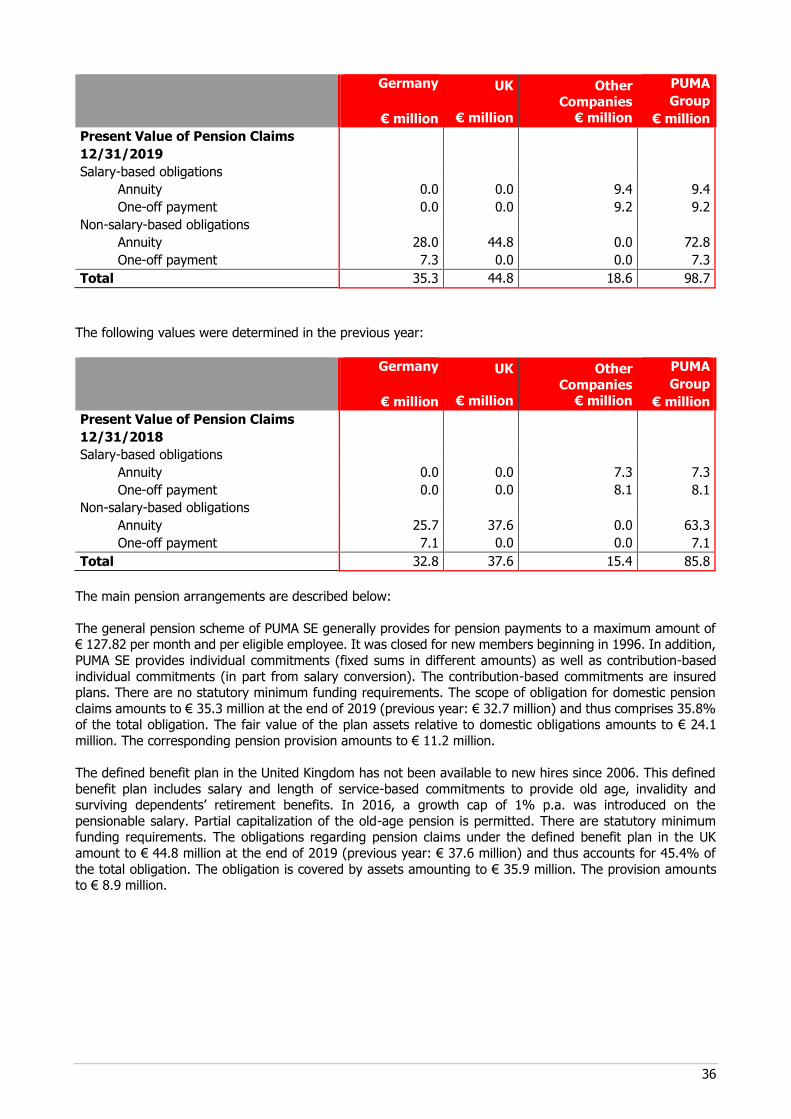
36
Germany
€ million
UK
€ million
Other
Companies € million
PUMA
Group
€ million
Present Value of Pension Claims
12/31/2019
Salary-based obligations
Annuity 0.0 0.0 9.4 9.4
One-off payment 0.0 0.0 9.2 9.2
Non-salary-based obligations
Annuity 28.0 44.8 0.0 72.8
One-off payment 7.3 0.0 0.0 7.3
Total 35.3 44.8 18.6 98.7
The following values were determined in the previous year:
Germany
€ million
UK
€ million
Other
Companies € million
PUMA
Group
€ million
Present Value of Pension Claims
12/31/2018
Salary-based obligations
Annuity 0.0 0.0 7.3 7.3
One-off payment 0.0 0.0 8.1 8.1
Non-salary-based obligations
Annuity 25.7 37.6 0.0 63.3
One-off payment 7.1 0.0 0.0 7.1
Total 32.8 37.6 15.4 85.8
The main pension arrangements are described below:
The general pension scheme of PUMA SE generally provides for pension payments to a maximum amount of € 127.82 per month and per eligible employee. It was closed for new members beginning in 1996. In addition,
PUMA SE provides individual commitments (fixed sums in different amounts) as well as contribution-based
individual commitments (in part from salary conversion). The contribution-based commitments are insured plans. There are no statutory minimum funding requirements. The scope of obligation for domestic pension
claims amounts to € 35.3 million at the end of 2019 (previous year: € 32.7 million) and thus comprises 35.8% of the total obligation. The fair value of the plan assets relative to domestic obligations amounts to € 24.1
million. The corresponding pension provision amounts to € 11.2 million.
The defined benefit plan in the United Kingdom has not been available to new hires since 2006. This defined
benefit plan includes salary and length of service-based commitments to provide old age, invalidity and surviving dependents’ retirement benefits. In 2016, a growth cap of 1% p.a. was introduced on the
pensionable salary. Partial capitalization of the old-age pension is permitted. There are statutory minimum funding requirements. The obligations regarding pension claims under the defined benefit plan in the UK
amount to € 44.8 million at the end of 2019 (previous year: € 37.6 million) and thus accounts for 45.4% of
the total obligation. The obligation is covered by assets amounting to € 35.9 million. The provision amounts to € 8.9 million.
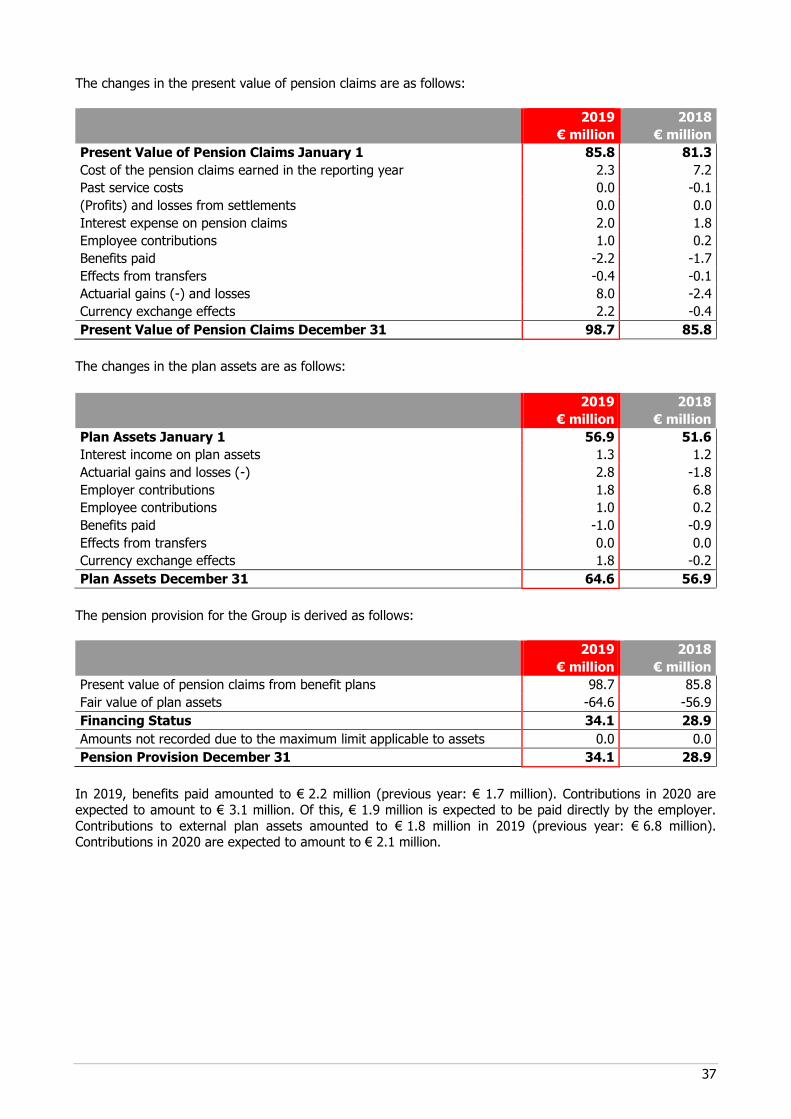
37
The changes in the present value of pension claims are as follows:
2019
€ million
2018
€ million
Present Value of Pension Claims January 1 85.8 81.3
Cost of the pension claims earned in the reporting year 2.3 7.2
Past service costs 0.0 -0.1
(Profits) and losses from settlements 0.0 0.0
Interest expense on pension claims 2.0 1.8
Employee contributions 1.0 0.2
Benefits paid -2.2 -1.7
Effects from transfers -0.4 -0.1
Actuarial gains (-) and losses 8.0 -2.4
Currency exchange effects 2.2 -0.4
Present Value of Pension Claims December 31 98.7 85.8
The changes in the plan assets are as follows:
2019
€ million
2018
€ million
Plan Assets January 1 56.9 51.6
Interest income on plan assets 1.3 1.2
Actuarial gains and losses (-) 2.8 -1.8
Employer contributions 1.8 6.8
Employee contributions 1.0 0.2
Benefits paid -1.0 -0.9
Effects from transfers 0.0 0.0
Currency exchange effects 1.8 -0.2
Plan Assets December 31 64.6 56.9
The pension provision for the Group is derived as follows:
2019
€ million
2018
€ million
Present value of pension claims from benefit plans 98.7 85.8
Fair value of plan assets -64.6 -56.9
Financing Status 34.1 28.9
Amounts not recorded due to the maximum limit applicable to assets 0.0 0.0
Pension Provision December 31 34.1 28.9
In 2019, benefits paid amounted to € 2.2 million (previous year: € 1.7 million). Contributions in 2020 are expected to amount to € 3.1 million. Of this, € 1.9 million is expected to be paid directly by the employer.
Contributions to external plan assets amounted to € 1.8 million in 2019 (previous year: € 6.8 million). Contributions in 2020 are expected to amount to € 2.1 million.
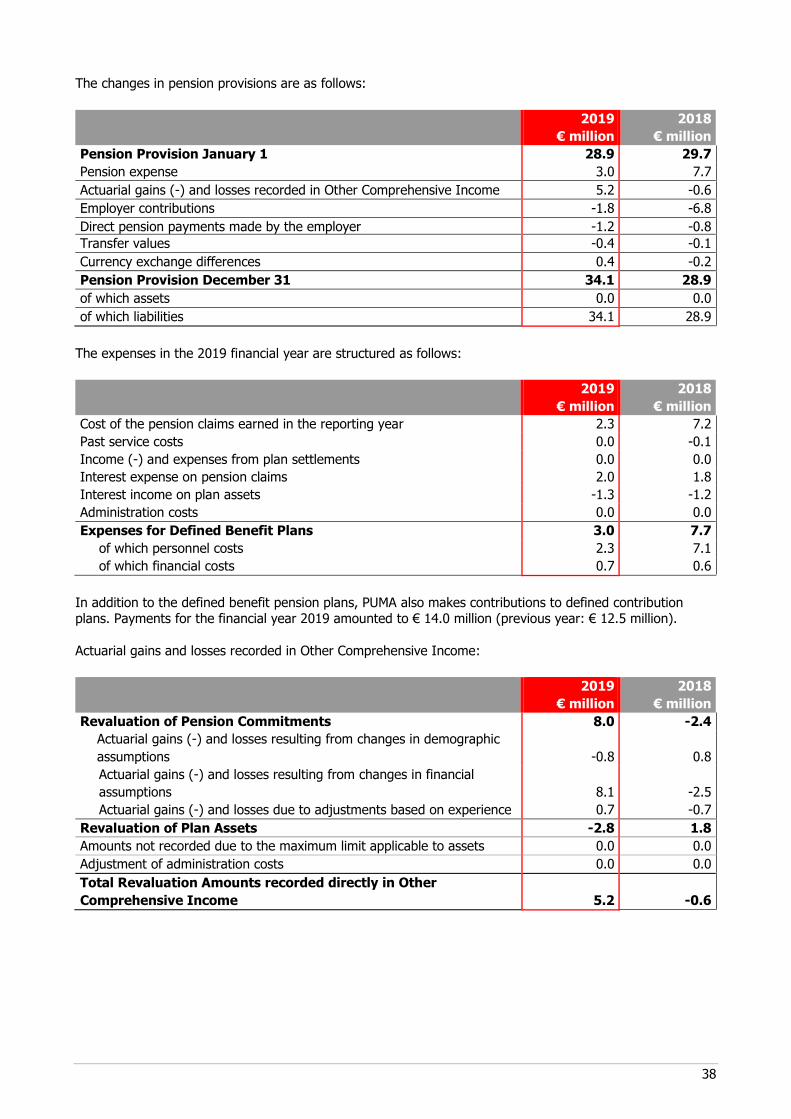
38
The changes in pension provisions are as follows:
2019
€ million
2018
€ million
Pension Provision January 1 28.9 29.7
Pension expense 3.0 7.7
Actuarial gains (-) and losses recorded in Other Comprehensive Income 5.2 -0.6
Employer contributions -1.8 -6.8
Direct pension payments made by the employer -1.2 -0.8
Transfer values -0.4 -0.1
Currency exchange differences 0.4 -0.2
Pension Provision December 31 34.1 28.9
of which assets 0.0 0.0
of which liabilities 34.1 28.9
The expenses in the 2019 financial year are structured as follows:
2019
€ million
2018
€ million
Cost of the pension claims earned in the reporting year 2.3 7.2
Past service costs 0.0 -0.1
Income (-) and expenses from plan settlements 0.0 0.0
Interest expense on pension claims 2.0 1.8
Interest income on plan assets -1.3 -1.2
Administration costs 0.0 0.0
Expenses for Defined Benefit Plans 3.0 7.7
of which personnel costs 2.3 7.1
of which financial costs 0.7 0.6
In addition to the defined benefit pension plans, PUMA also makes contributions to defined contribution plans. Payments for the financial year 2019 amounted to € 14.0 million (previous year: € 12.5 million).
Actuarial gains and losses recorded in Other Comprehensive Income:
2019
€ million
2018
€ million
Revaluation of Pension Commitments 8.0 -2.4
Actuarial gains (-) and losses resulting from changes in demographic
assumptions -0.8 0.8
Actuarial gains (-) and losses resulting from changes in financial
assumptions 8.1 -2.5
Actuarial gains (-) and losses due to adjustments based on experience 0.7 -0.7
Revaluation of Plan Assets -2.8 1.8
Amounts not recorded due to the maximum limit applicable to assets 0.0 0.0
Adjustment of administration costs 0.0 0.0
Total Revaluation Amounts recorded directly in Other
Comprehensive Income 5.2 -0.6
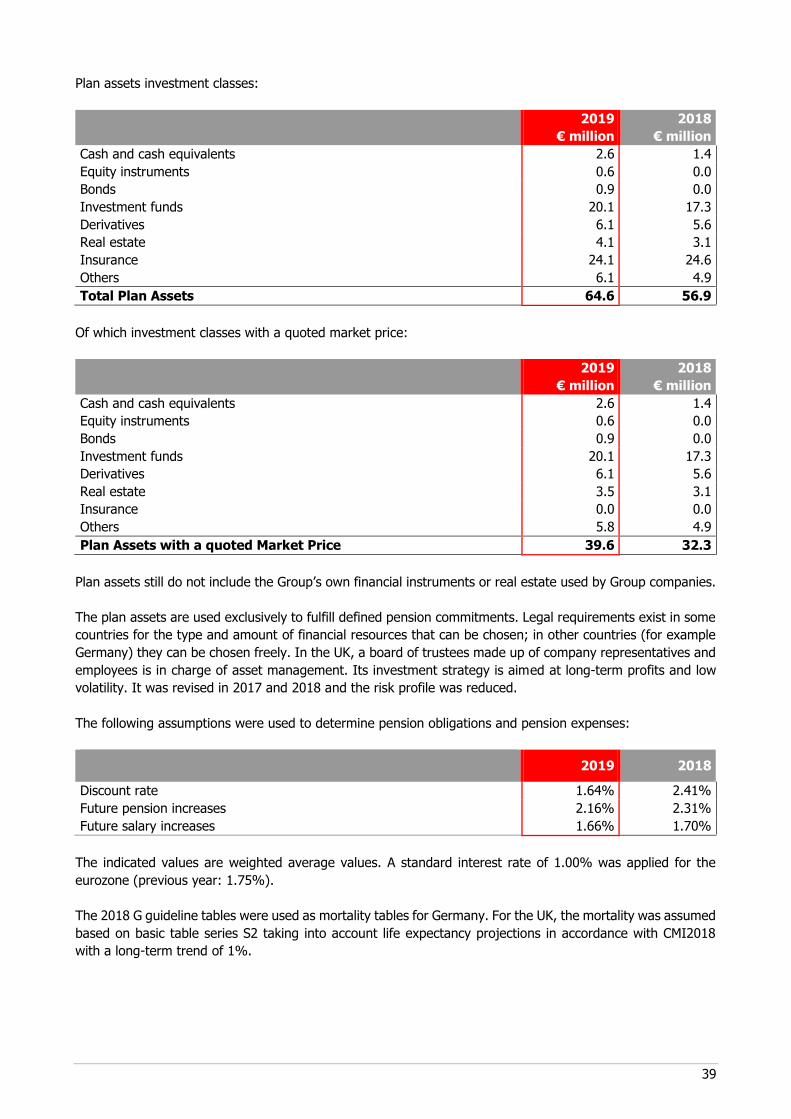
39
Plan assets investment classes:
2019
€ million
2018
€ million
Cash and cash equivalents 2.6 1.4
Equity instruments 0.6 0.0
Bonds 0.9 0.0
Investment funds 20.1 17.3
Derivatives 6.1 5.6
Real estate 4.1 3.1
Insurance 24.1 24.6
Others 6.1 4.9
Total Plan Assets 64.6 56.9
Of which investment classes with a quoted market price:
2019
€ million
2018
€ million
Cash and cash equivalents 2.6 1.4
Equity instruments 0.6 0.0
Bonds 0.9 0.0
Investment funds 20.1 17.3
Derivatives 6.1 5.6
Real estate 3.5 3.1
Insurance 0.0 0.0
Others 5.8 4.9
Plan Assets with a quoted Market Price 39.6 32.3
Plan assets still do not include the Group’s own financial instruments or real estate used by Group companies.
The plan assets are used exclusively to fulfill defined pension commitments. Legal requirements exist in some
countries for the type and amount of financial resources that can be chosen; in other countries (for example
Germany) they can be chosen freely. In the UK, a board of trustees made up of company representatives and
employees is in charge of asset management. Its investment strategy is aimed at long-term profits and low
volatility. It was revised in 2017 and 2018 and the risk profile was reduced.
The following assumptions were used to determine pension obligations and pension expenses:
2019 2018
Discount rate 1.64% 2.41%
Future pension increases 2.16% 2.31%
Future salary increases 1.66% 1.70%
The indicated values are weighted average values. A standard interest rate of 1.00% was applied for the
eurozone (previous year: 1.75%).
The 2018 G guideline tables were used as mortality tables for Germany. For the UK, the mortality was assumed
based on basic table series S2 taking into account life expectancy projections in accordance with CMI2018
with a long-term trend of 1%.
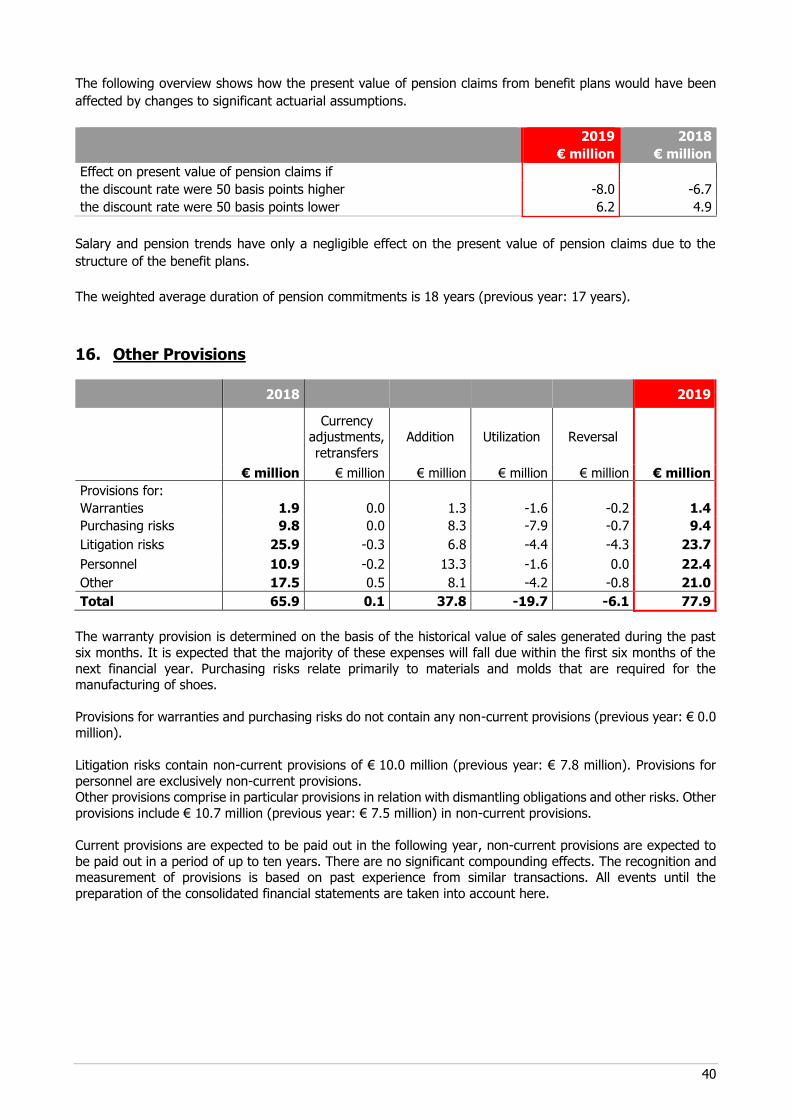
40
The following overview shows how the present value of pension claims from benefit plans would have been
affected by changes to significant actuarial assumptions.
2019
€ million
2018
€ million
Effect on present value of pension claims if
the discount rate were 50 basis points higher -8.0 -6.7
the discount rate were 50 basis points lower 6.2 4.9
Salary and pension trends have only a negligible effect on the present value of pension claims due to the
structure of the benefit plans.
The weighted average duration of pension commitments is 18 years (previous year: 17 years).
16. Other Provisions
2018 2019
Currency
adjustments,
retransfers
Addition Utilization Reversal
€ million € million € million € million € million € million
Provisions for:
Warranties 1.9 0.0 1.3 -1.6 -0.2 1.4
Purchasing risks 9.8 0.0 8.3 -7.9 -0.7 9.4
Litigation risks 25.9 -0.3 6.8 -4.4 -4.3 23.7
Personnel 10.9 -0.2 13.3 -1.6 0.0 22.4
Other 17.5 0.5 8.1 -4.2 -0.8 21.0
Total 65.9 0.1 37.8 -19.7 -6.1 77.9
The warranty provision is determined on the basis of the historical value of sales generated during the past
six months. It is expected that the majority of these expenses will fall due within the first six months of the
next financial year. Purchasing risks relate primarily to materials and molds that are required for the manufacturing of shoes.
Provisions for warranties and purchasing risks do not contain any non-current provisions (previous year: € 0.0
million).
Litigation risks contain non-current provisions of € 10.0 million (previous year: € 7.8 million). Provisions for
personnel are exclusively non-current provisions. Other provisions comprise in particular provisions in relation with dismantling obligations and other risks. Other
provisions include € 10.7 million (previous year: € 7.5 million) in non-current provisions.
Current provisions are expected to be paid out in the following year, non-current provisions are expected to
be paid out in a period of up to ten years. There are no significant compounding effects. The recognition and measurement of provisions is based on past experience from similar transactions. All events until the
preparation of the consolidated financial statements are taken into account here.
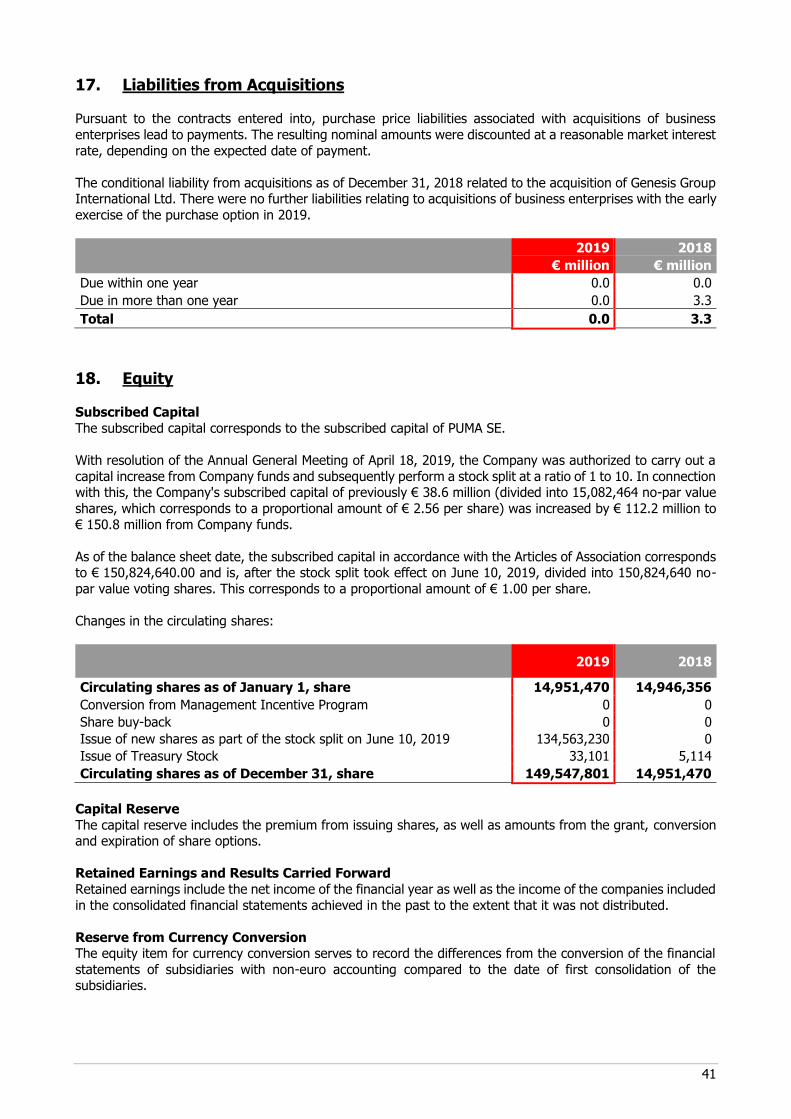
41
17. Liabilities from Acquisitions Pursuant to the contracts entered into, purchase price liabilities associated with acquisitions of business
enterprises lead to payments. The resulting nominal amounts were discounted at a reasonable market interest
rate, depending on the expected date of payment.
The conditional liability from acquisitions as of December 31, 2018 related to the acquisition of Genesis Group International Ltd. There were no further liabilities relating to acquisitions of business enterprises with the early
exercise of the purchase option in 2019.
2019 2018
€ million € million
Due within one year 0.0 0.0
Due in more than one year 0.0 3.3
Total 0.0 3.3
18. Equity Subscribed Capital
The subscribed capital corresponds to the subscribed capital of PUMA SE.
With resolution of the Annual General Meeting of April 18, 2019, the Company was authorized to carry out a
capital increase from Company funds and subsequently perform a stock split at a ratio of 1 to 10. In connection with this, the Company's subscribed capital of previously € 38.6 million (divided into 15,082,464 no-par value
shares, which corresponds to a proportional amount of € 2.56 per share) was increased by € 112.2 million to
€ 150.8 million from Company funds.
As of the balance sheet date, the subscribed capital in accordance with the Articles of Association corresponds to € 150,824,640.00 and is, after the stock split took effect on June 10, 2019, divided into 150,824,640 no-
par value voting shares. This corresponds to a proportional amount of € 1.00 per share.
Changes in the circulating shares:
2019 2018
Circulating shares as of January 1, share 14,951,470 14,946,356
Conversion from Management Incentive Program 0 0
Share buy-back 0 0
Issue of new shares as part of the stock split on June 10, 2019 134,563,230 0
Issue of Treasury Stock 33,101 5,114
Circulating shares as of December 31, share 149,547,801 14,951,470
Capital Reserve
The capital reserve includes the premium from issuing shares, as well as amounts from the grant, conversion and expiration of share options.
Retained Earnings and Results Carried Forward
Retained earnings include the net income of the financial year as well as the income of the companies included
in the consolidated financial statements achieved in the past to the extent that it was not distributed.
Reserve from Currency Conversion The equity item for currency conversion serves to record the differences from the conversion of the financial
statements of subsidiaries with non-euro accounting compared to the date of first consolidation of the subsidiaries.
42
Cash Flow Hedges
The “cash flow hedges” item includes the market valuation of derivative financial instruments. The item amounting to € -8.8 million (previous year: € 34.1 million) is offset by deferred taxes of € -0.1 million (previous
year: € -1.4 million).
Treasury Stock
The resolution adopted by the Annual General Meeting on May 6, 2015 authorized the Company to purchase treasury shares up to a value of 10% of the share capital until May 5, 2020. If purchased through the stock
exchange, the purchase price per share may not exceed or fall below 10% of the closing price for the Company’s shares with the same attributes in the XETRA trading system (or a comparable successor system)
during the last three trading days prior to the date of purchase. The Company did not make use of the authorization to purchase treasury stock during the reporting period.
As of the balance sheet date, the Company holds a total of 1,276,839 PUMA shares in its own portfolio, which
corresponds to 0.86% of the subscribed capital.
Authorized Capital
As of December 31, 2019, the Company’s Articles of Association provide for authorized capital totaling € 15,000,000: Pursuant to Section 4.2. of the Articles of Association, the Management Board is authorized with the consent
of the Supervisory Board to increase the Company’s share capital by April 11, 2022 by up to € 15,000,000
(Authorized Capital 2017) by issuing new no-par value bearer shares against cash and/or non-cash contributions on one or more occasions. In case of capital increases against contributions in cash, the new
shares may be acquired by one or several banks, designated by the Management Board, subject to the obligation to offer them to the shareholders for subscription (indirect pre-emption right). The shareholders
shall generally be entitled to pre-emption rights. However, the Management Board is authorized with the consent of the Supervisory Board to exclude shareholders’ subscription rights in whole or in part in the cases
specified in Section 4.2. of the Articles of Association.
The Management Board of PUMA SE did not make use of the existing authorized capital in the current reporting
period.
Conditional Capital
By resolution of the Annual General Meeting of April 12, 2018, the Management Board was authorized until April 11, 2023, with the consent of the Supervisory Board, through one or more issues, altogether or in parts
and in various tranches at the same time, to issue bearer or registered options and/or convertible bonds, profit-sharing rights or participation bonds or a combination of these instruments with or without a term
limitation in a total nominal amount of up to € 1,000,000,000.00 (Conditional Capital 2018).
In this connection, the share capital was increased conditionally by up to € 30,164,920.00 by the issue of up
to 30,164,920 new units of registered stock. The conditional capital increase will be performed only insofar as use is made of options or conversion rights or a conversion or option obligation is fulfilled or insofar as
deliveries are made and if other forms of fulfillment are not used for servicing.
No use has been made of the authorization to date.
Dividends
The amounts eligible for distribution relate to the retained earnings of PUMA SE, which is determined in accordance with German Commercial Law.
The Management Board and the Supervisory Board will propose to the Annual General Meeting that a dividend of € 0.50 per circulating share, or a total of € 74.8 million (with respect to the circulating shares as of
December 31, 2019), be distributed to the shareholders from the retained earnings of PUMA SE for the financial year 2019.
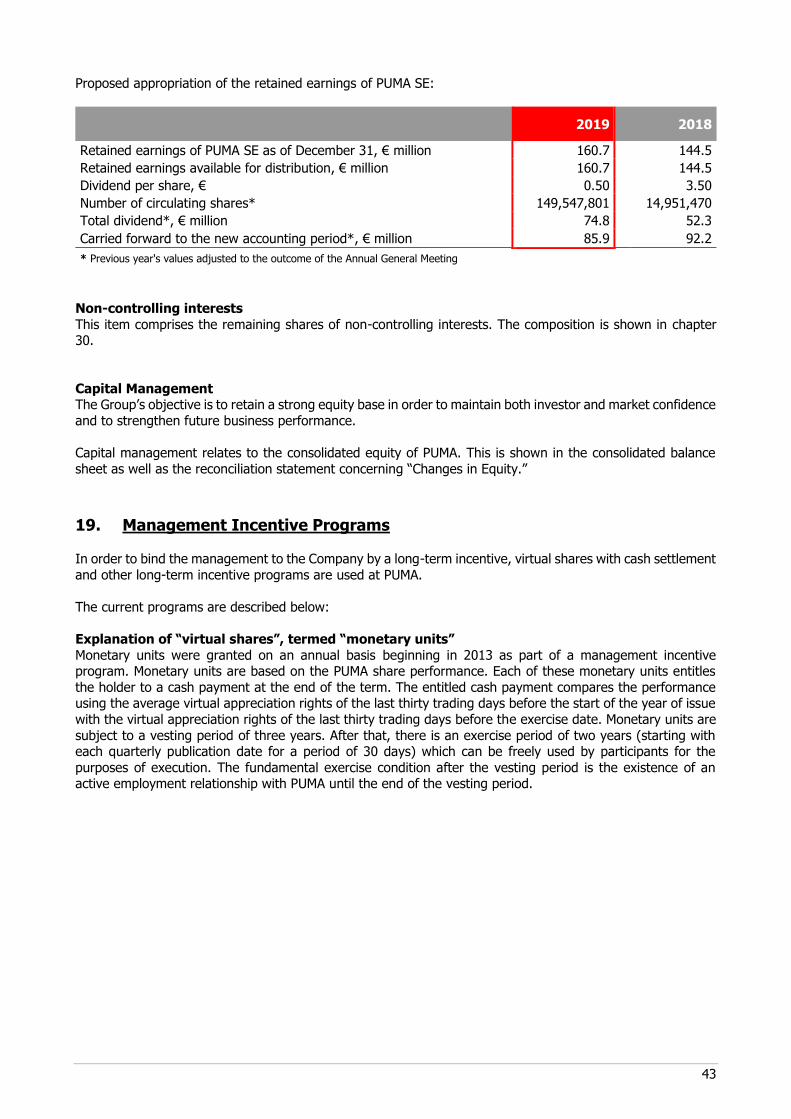
43
Proposed appropriation of the retained earnings of PUMA SE:
2019 2018
Retained earnings of PUMA SE as of December 31, € million 160.7 144.5
Retained earnings available for distribution, € million 160.7 144.5
Dividend per share, € 0.50 3.50
Number of circulating shares* 149,547,801 14,951,470
Total dividend*, € million 74.8 52.3
Carried forward to the new accounting period*, € million 85.9 92.2
* Previous year's values adjusted to the outcome of the Annual General Meeting
Non-controlling interests
This item comprises the remaining shares of non-controlling interests. The composition is shown in chapter 30.
Capital Management The Group’s objective is to retain a strong equity base in order to maintain both investor and market confidence
and to strengthen future business performance.
Capital management relates to the consolidated equity of PUMA. This is shown in the consolidated balance
sheet as well as the reconciliation statement concerning “Changes in Equity.”
19. Management Incentive Programs
In order to bind the management to the Company by a long-term incentive, virtual shares with cash settlement
and other long-term incentive programs are used at PUMA.
The current programs are described below:
Explanation of “virtual shares”, termed “monetary units”
Monetary units were granted on an annual basis beginning in 2013 as part of a management incentive program. Monetary units are based on the PUMA share performance. Each of these monetary units entitles
the holder to a cash payment at the end of the term. The entitled cash payment compares the performance using the average virtual appreciation rights of the last thirty trading days before the start of the year of issue
with the virtual appreciation rights of the last thirty trading days before the exercise date. Monetary units are
subject to a vesting period of three years. After that, there is an exercise period of two years (starting with each quarterly publication date for a period of 30 days) which can be freely used by participants for the
purposes of execution. The fundamental exercise condition after the vesting period is the existence of an active employment relationship with PUMA until the end of the vesting period.
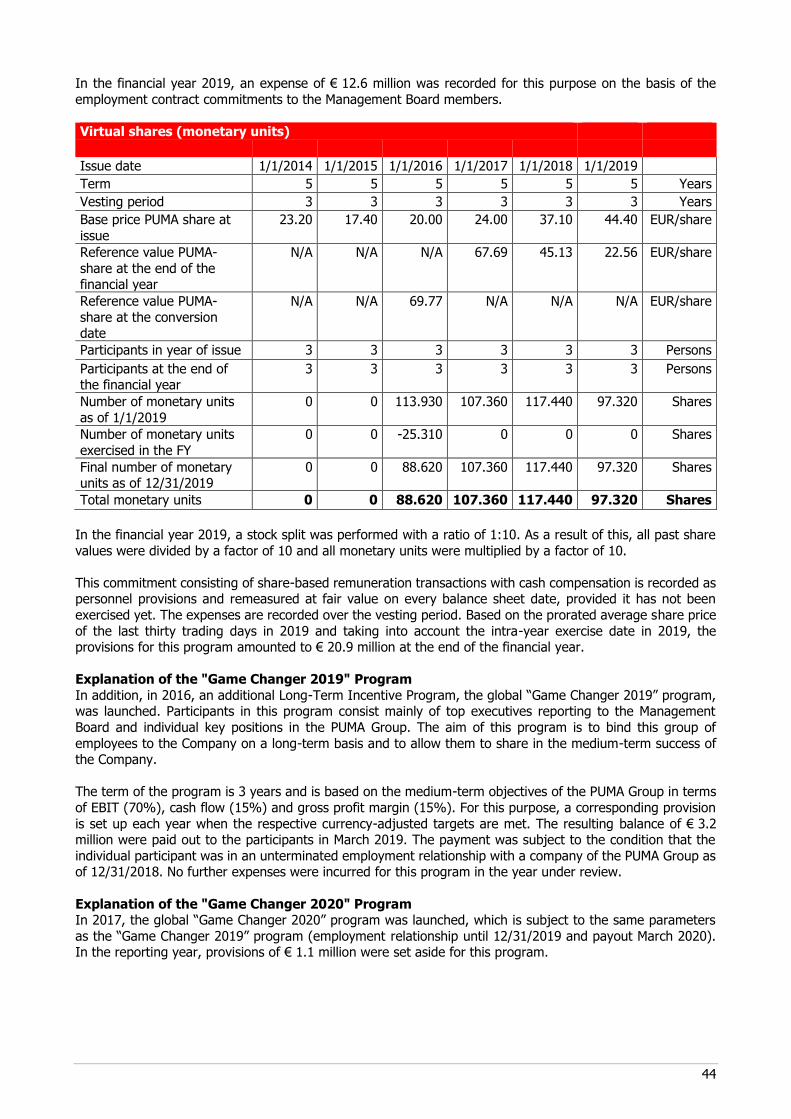
44
In the financial year 2019, an expense of € 12.6 million was recorded for this purpose on the basis of the
employment contract commitments to the Management Board members.
Virtual shares (monetary units)
Issue date 1/1/2014 1/1/2015 1/1/2016 1/1/2017 1/1/2018 1/1/2019
Term 5 5 5 5 5 5 Years
Vesting period 3 3 3 3 3 3 Years
Base price PUMA share at
issue
23.20 17.40 20.00 24.00 37.10 44.40 EUR/share
Reference value PUMA-
share at the end of the financial year
N/A N/A N/A 67.69 45.13 22.56 EUR/share
Reference value PUMA-
share at the conversion date
N/A N/A 69.77 N/A N/A N/A EUR/share
Participants in year of issue 3 3 3 3 3 3 Persons
Participants at the end of the financial year
3 3 3 3 3 3 Persons
Number of monetary units
as of 1/1/2019
0 0 113.930 107.360 117.440 97.320 Shares
Number of monetary units
exercised in the FY
0 0 -25.310 0 0 0 Shares
Final number of monetary units as of 12/31/2019
0 0 88.620 107.360 117.440 97.320 Shares
Total monetary units 0 0 88.620 107.360 117.440 97.320 Shares
In the financial year 2019, a stock split was performed with a ratio of 1:10. As a result of this, all past share
values were divided by a factor of 10 and all monetary units were multiplied by a factor of 10.
This commitment consisting of share-based remuneration transactions with cash compensation is recorded as personnel provisions and remeasured at fair value on every balance sheet date, provided it has not been
exercised yet. The expenses are recorded over the vesting period. Based on the prorated average share price
of the last thirty trading days in 2019 and taking into account the intra-year exercise date in 2019, the provisions for this program amounted to € 20.9 million at the end of the financial year.
Explanation of the "Game Changer 2019" Program
In addition, in 2016, an additional Long-Term Incentive Program, the global “Game Changer 2019” program, was launched. Participants in this program consist mainly of top executives reporting to the Management
Board and individual key positions in the PUMA Group. The aim of this program is to bind this group of
employees to the Company on a long-term basis and to allow them to share in the medium-term success of the Company.
The term of the program is 3 years and is based on the medium-term objectives of the PUMA Group in terms
of EBIT (70%), cash flow (15%) and gross profit margin (15%). For this purpose, a corresponding provision
is set up each year when the respective currency-adjusted targets are met. The resulting balance of € 3.2 million were paid out to the participants in March 2019. The payment was subject to the condition that the
individual participant was in an unterminated employment relationship with a company of the PUMA Group as of 12/31/2018. No further expenses were incurred for this program in the year under review.
Explanation of the "Game Changer 2020" Program In 2017, the global “Game Changer 2020” program was launched, which is subject to the same parameters
as the “Game Changer 2019” program (employment relationship until 12/31/2019 and payout March 2020). In the reporting year, provisions of € 1.1 million were set aside for this program.
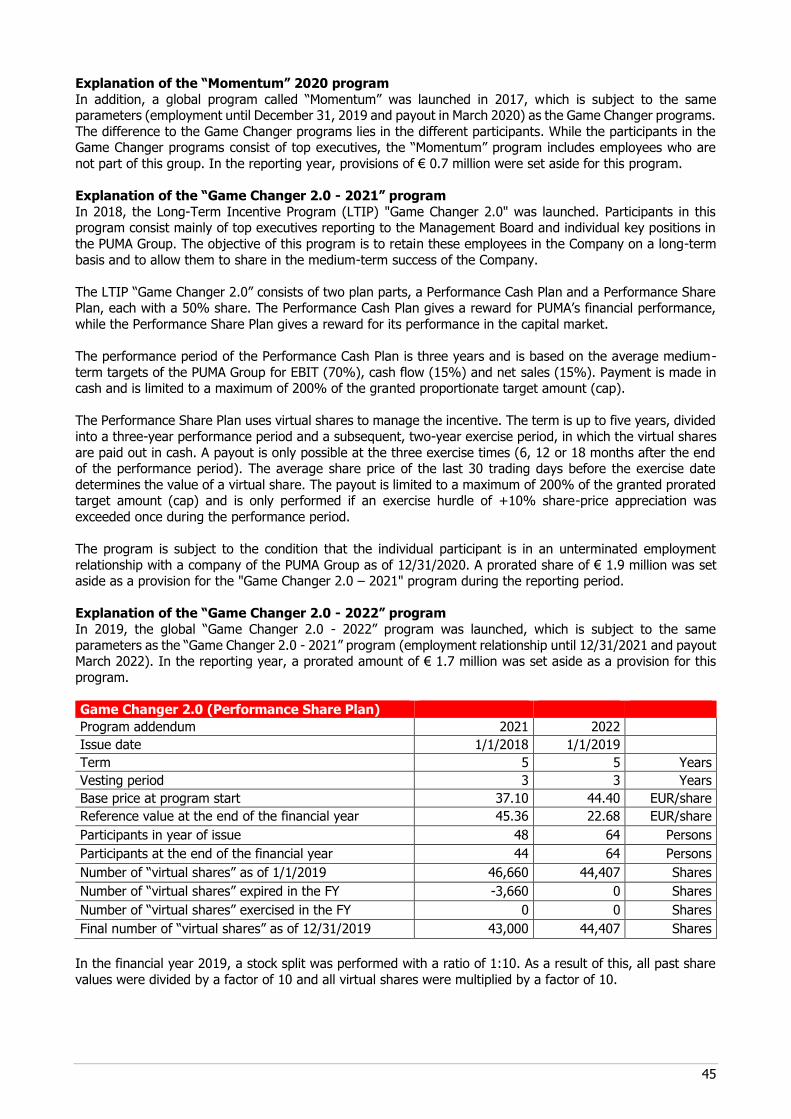
45
Explanation of the “Momentum” 2020 program
In addition, a global program called “Momentum” was launched in 2017, which is subject to the same parameters (employment until December 31, 2019 and payout in March 2020) as the Game Changer programs.
The difference to the Game Changer programs lies in the different participants. While the participants in the Game Changer programs consist of top executives, the “Momentum” program includes employees who are
not part of this group. In the reporting year, provisions of € 0.7 million were set aside for this program.
Explanation of the “Game Changer 2.0 - 2021” program
In 2018, the Long-Term Incentive Program (LTIP) "Game Changer 2.0" was launched. Participants in this program consist mainly of top executives reporting to the Management Board and individual key positions in
the PUMA Group. The objective of this program is to retain these employees in the Company on a long-term
basis and to allow them to share in the medium-term success of the Company.
The LTIP “Game Changer 2.0” consists of two plan parts, a Performance Cash Plan and a Performance Share Plan, each with a 50% share. The Performance Cash Plan gives a reward for PUMA’s financial performance,
while the Performance Share Plan gives a reward for its performance in the capital market.
The performance period of the Performance Cash Plan is three years and is based on the average medium-
term targets of the PUMA Group for EBIT (70%), cash flow (15%) and net sales (15%). Payment is made in cash and is limited to a maximum of 200% of the granted proportionate target amount (cap).
The Performance Share Plan uses virtual shares to manage the incentive. The term is up to five years, divided
into a three-year performance period and a subsequent, two-year exercise period, in which the virtual shares
are paid out in cash. A payout is only possible at the three exercise times (6, 12 or 18 months after the end of the performance period). The average share price of the last 30 trading days before the exercise date
determines the value of a virtual share. The payout is limited to a maximum of 200% of the granted prorated target amount (cap) and is only performed if an exercise hurdle of +10% share-price appreciation was
exceeded once during the performance period.
The program is subject to the condition that the individual participant is in an unterminated employment
relationship with a company of the PUMA Group as of 12/31/2020. A prorated share of € 1.9 million was set aside as a provision for the "Game Changer 2.0 – 2021" program during the reporting period.
Explanation of the “Game Changer 2.0 - 2022” program
In 2019, the global “Game Changer 2.0 - 2022” program was launched, which is subject to the same
parameters as the “Game Changer 2.0 - 2021” program (employment relationship until 12/31/2021 and payout March 2022). In the reporting year, a prorated amount of € 1.7 million was set aside as a provision for this
program.
Game Changer 2.0 (Performance Share Plan)
Program addendum 2021 2022
Issue date 1/1/2018 1/1/2019
Term 5 5 Years
Vesting period 3 3 Years
Base price at program start 37.10 44.40 EUR/share
Reference value at the end of the financial year 45.36 22.68 EUR/share
Participants in year of issue 48 64 Persons
Participants at the end of the financial year 44 64 Persons
Number of “virtual shares” as of 1/1/2019 46,660 44,407 Shares
Number of “virtual shares” expired in the FY -3,660 0 Shares
Number of “virtual shares” exercised in the FY 0 0 Shares
Final number of “virtual shares” as of 12/31/2019 43,000 44,407 Shares
In the financial year 2019, a stock split was performed with a ratio of 1:10. As a result of this, all past share
values were divided by a factor of 10 and all virtual shares were multiplied by a factor of 10.

46
Notes to the Income Statement 20. Net sales The net sales of the Group are broken down by product divisions and distribution channels as follows:
Breakdown by Distribution Channels
2019 2018
€ million € million
Wholesale 4,106.9 3,520.8
Retail 1,395.3 1,127.5
Total 5,502.2 4,648.3
Breakdown by Product Divisions
2019 2018
€ million € million
Footwear 2,552.5 2,184.7
Apparel 2,068.7 1,687.5
Accessories 881.1 776.1
Total 5,502.2 4,648.3
21. Other Operating Income and Expenses
According to the respective functions, other operating income and expenses include personnel, advertising,
sales and distribution expenses as well as rental and leasing expenditure, travel costs, legal and consulting expenses and other general expenses. Typical operating income that is associated with operating expenses
was offset. Rental and lease expenses associated with the Group’s own retail stores include turnover-based rental components.
Other operating income and expenses are allocated based on functional areas as follows:
2019 2018
€ million € million
Sales and distribution expenses 1,821.2 1,523.6
Product management/merchandising 52.6 43.8
Research and development 61.7 54.0
Administrative and general expenses 340.0 328.1
Other operating expenses 2,275.5 1,949.5
Other operating income 4.2 21.1
Total 2,271.3 1,928.4
Of which scheduled depreciation 246.4 81.5
Of which impairment expenses 0.0 0.6
Within the sales and distribution expenses, marketing/retail expenses account for a large proportion of the operating expenses. In addition to advertising and promotional expenses, they also include expenses
associated with the Group’s own retail activities. Other sales and distribution expenses include logistic expenses and other variable sales and distribution expenses.
In the consolidated financial statements of PUMA SE, fees of € 0.9 million (previous year: € 0.9 million) are recorded as operating expenses for the auditor of the consolidated financial statements. The fees break down
into costs for audit services of € 0.8 million (previous year: € 0.8 million), other assurance services amounting to € 0.1 million (previous year: € 0.1 million), in particular for EMIR audits and the review of the combined
non-financial report as well as for tax consultancy services of less than € 0.0 million (previous year: € 0.0 million).
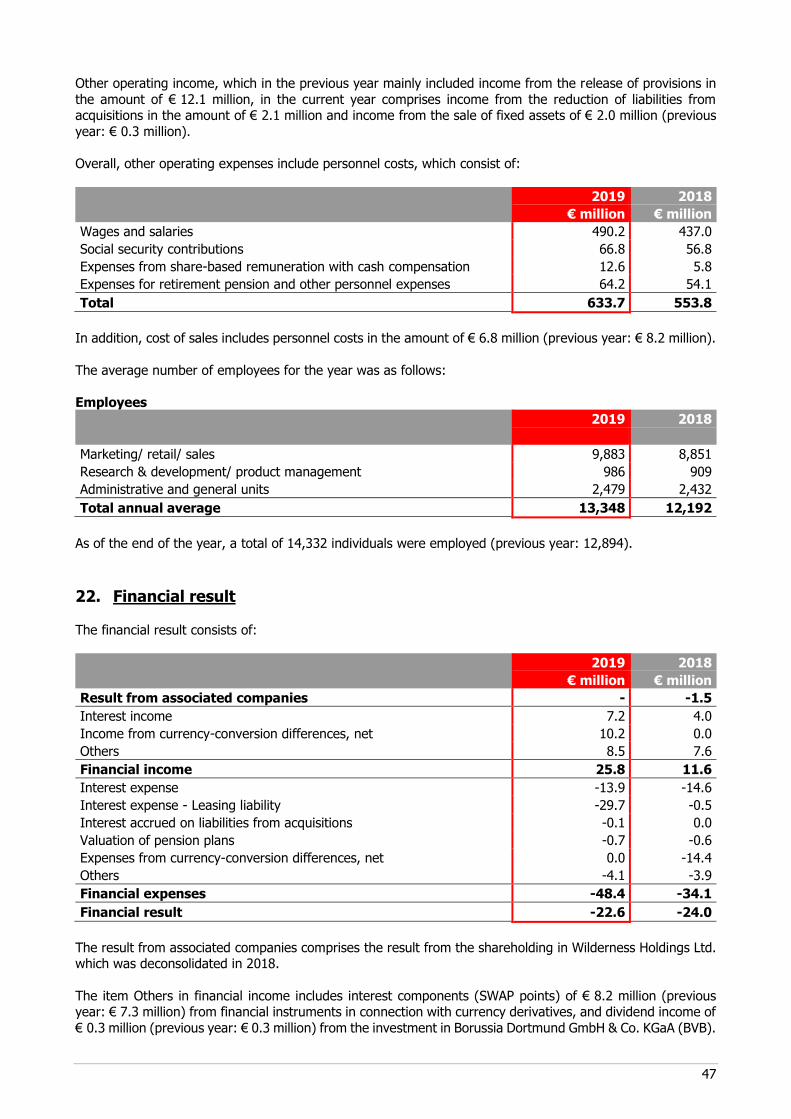
47
Other operating income, which in the previous year mainly included income from the release of provisions in
the amount of € 12.1 million, in the current year comprises income from the reduction of liabilities from acquisitions in the amount of € 2.1 million and income from the sale of fixed assets of € 2.0 million (previous
year: € 0.3 million).
Overall, other operating expenses include personnel costs, which consist of:
2019 2018
€ million € million
Wages and salaries 490.2 437.0
Social security contributions 66.8 56.8
Expenses from share-based remuneration with cash compensation 12.6 5.8
Expenses for retirement pension and other personnel expenses 64.2 54.1
Total 633.7 553.8
In addition, cost of sales includes personnel costs in the amount of € 6.8 million (previous year: € 8.2 million).
The average number of employees for the year was as follows:
Employees
2019 2018
Marketing/ retail/ sales 9,883 8,851
Research & development/ product management 986 909
Administrative and general units 2,479 2,432
Total annual average 13,348 12,192
As of the end of the year, a total of 14,332 individuals were employed (previous year: 12,894).
22. Financial result
The financial result consists of:
2019 2018
€ million € million
Result from associated companies - -1.5
Interest income 7.2 4.0
Income from currency-conversion differences, net 10.2 0.0
Others 8.5 7.6
Financial income 25.8 11.6
Interest expense -13.9 -14.6
Interest expense - Leasing liability -29.7 -0.5
Interest accrued on liabilities from acquisitions -0.1 0.0
Valuation of pension plans -0.7 -0.6
Expenses from currency-conversion differences, net 0.0 -14.4
Others -4.1 -3.9
Financial expenses -48.4 -34.1
Financial result -22.6 -24.0
The result from associated companies comprises the result from the shareholding in Wilderness Holdings Ltd. which was deconsolidated in 2018.
The item Others in financial income includes interest components (SWAP points) of € 8.2 million (previous year: € 7.3 million) from financial instruments in connection with currency derivatives, and dividend income of
€ 0.3 million (previous year: € 0.3 million) from the investment in Borussia Dortmund GmbH & Co. KGaA (BVB).
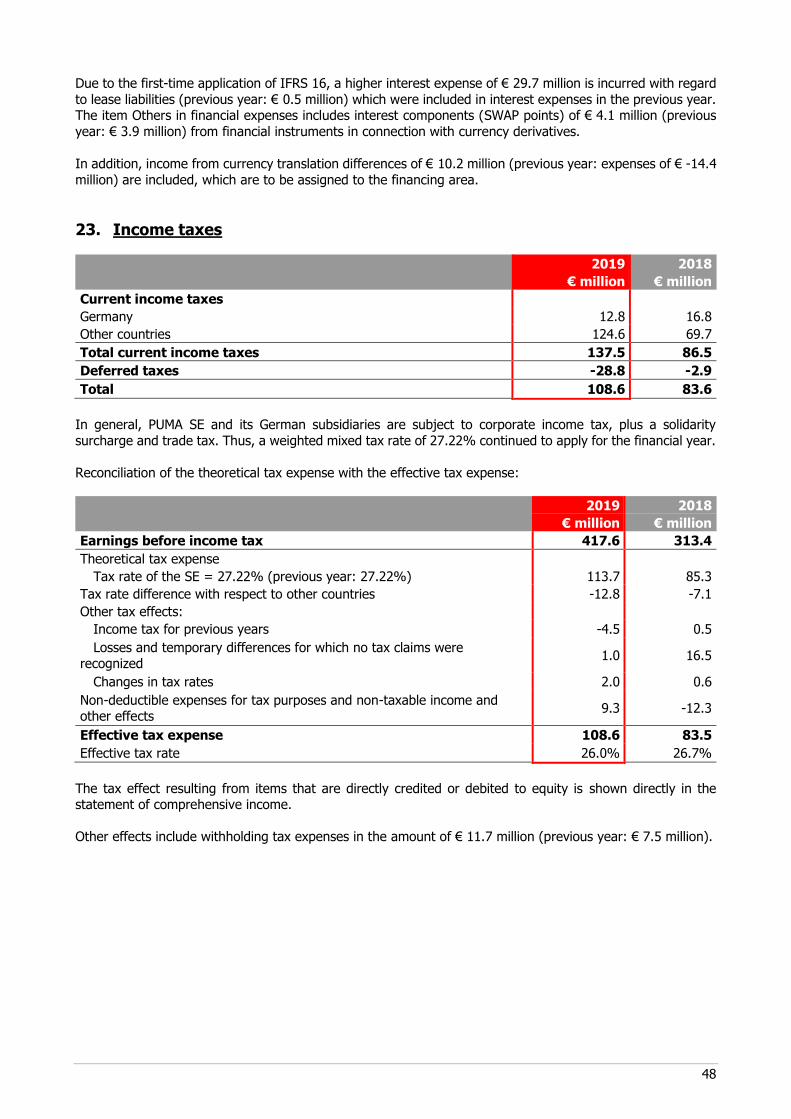
48
Due to the first-time application of IFRS 16, a higher interest expense of € 29.7 million is incurred with regard
to lease liabilities (previous year: € 0.5 million) which were included in interest expenses in the previous year. The item Others in financial expenses includes interest components (SWAP points) of € 4.1 million (previous
year: € 3.9 million) from financial instruments in connection with currency derivatives.
In addition, income from currency translation differences of € 10.2 million (previous year: expenses of € -14.4
million) are included, which are to be assigned to the financing area.
23. Income taxes
2019 2018
€ million € million
Current income taxes
Germany 12.8 16.8
Other countries 124.6 69.7
Total current income taxes 137.5 86.5
Deferred taxes -28.8 -2.9
Total 108.6 83.6
In general, PUMA SE and its German subsidiaries are subject to corporate income tax, plus a solidarity
surcharge and trade tax. Thus, a weighted mixed tax rate of 27.22% continued to apply for the financial year.
Reconciliation of the theoretical tax expense with the effective tax expense:
2019 2018
€ million € million
Earnings before income tax 417.6 313.4
Theoretical tax expense
Tax rate of the SE = 27.22% (previous year: 27.22%) 113.7 85.3
Tax rate difference with respect to other countries -12.8 -7.1
Other tax effects:
Income tax for previous years -4.5 0.5
Losses and temporary differences for which no tax claims were recognized
1.0 16.5
Changes in tax rates 2.0 0.6
Non-deductible expenses for tax purposes and non-taxable income and other effects
9.3 -12.3
Effective tax expense 108.6 83.5
Effective tax rate 26.0% 26.7%
The tax effect resulting from items that are directly credited or debited to equity is shown directly in the statement of comprehensive income.
Other effects include withholding tax expenses in the amount of € 11.7 million (previous year: € 7.5 million).
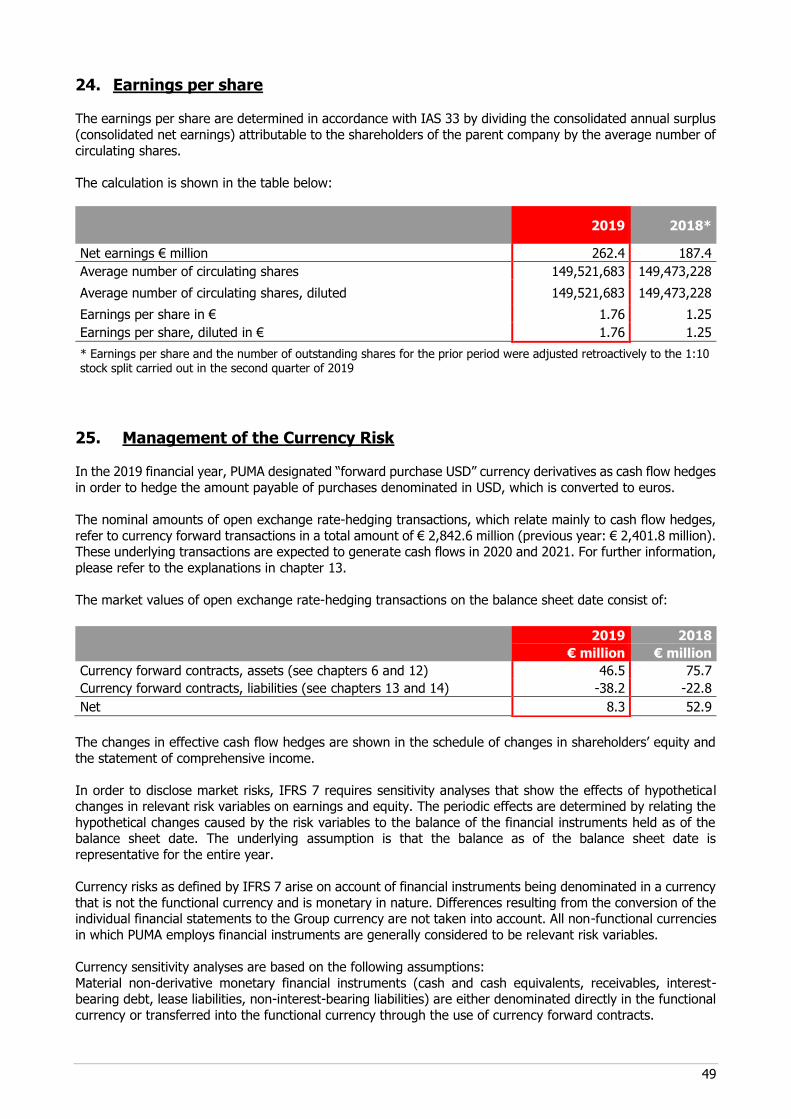
49
24. Earnings per share The earnings per share are determined in accordance with IAS 33 by dividing the consolidated annual surplus
(consolidated net earnings) attributable to the shareholders of the parent company by the average number of
circulating shares.
The calculation is shown in the table below:
2019 2018*
Net earnings € million 262.4 187.4
Average number of circulating shares 149,521,683 149,473,228
Average number of circulating shares, diluted 149,521,683 149,473,228
Earnings per share in € 1.76 1.25
Earnings per share, diluted in € 1.76 1.25
* Earnings per share and the number of outstanding shares for the prior period were adjusted retroactively to the 1:10 stock split carried out in the second quarter of 2019
25. Management of the Currency Risk In the 2019 financial year, PUMA designated “forward purchase USD” currency derivatives as cash flow hedges
in order to hedge the amount payable of purchases denominated in USD, which is converted to euros.
The nominal amounts of open exchange rate-hedging transactions, which relate mainly to cash flow hedges,
refer to currency forward transactions in a total amount of € 2,842.6 million (previous year: € 2,401.8 million). These underlying transactions are expected to generate cash flows in 2020 and 2021. For further information,
please refer to the explanations in chapter 13.
The market values of open exchange rate-hedging transactions on the balance sheet date consist of:
The changes in effective cash flow hedges are shown in the schedule of changes in shareholders’ equity and
the statement of comprehensive income.
In order to disclose market risks, IFRS 7 requires sensitivity analyses that show the effects of hypothetical changes in relevant risk variables on earnings and equity. The periodic effects are determined by relating the
hypothetical changes caused by the risk variables to the balance of the financial instruments held as of the balance sheet date. The underlying assumption is that the balance as of the balance sheet date is
representative for the entire year.
Currency risks as defined by IFRS 7 arise on account of financial instruments being denominated in a currency
that is not the functional currency and is monetary in nature. Differences resulting from the conversion of the individual financial statements to the Group currency are not taken into account. All non-functional currencies
in which PUMA employs financial instruments are generally considered to be relevant risk variables.
Currency sensitivity analyses are based on the following assumptions:
Material non-derivative monetary financial instruments (cash and cash equivalents, receivables, interest-bearing debt, lease liabilities, non-interest-bearing liabilities) are either denominated directly in the functional
currency or transferred into the functional currency through the use of currency forward contracts.
2019 2018
€ million € million
Currency forward contracts, assets (see chapters 6 and 12) 46.5 75.7
Currency forward contracts, liabilities (see chapters 13 and 14) -38.2 -22.8
Net 8.3 52.9
50
Currency forward contracts used to hedge against payment fluctuations caused by exchange rates are part of
an effective cash-flow hedging relationship pursuant to IAS 39. Changes in the exchange rate of the currencies underlying these contracts have an effect on the hedge reserve in equity and the fair value of these hedging
contracts. If, as of December 31, 2019, the USD had appreciated (devalued) against all other currencies by 10%, the
hedge reserve in equity and the fair value of the hedging contracts would have been € 150.6 million higher
(lower) (December 31, 2018: € 126.2 million higher (lower)).
Currency risks and other risk and opportunity categories are discussed in greater detail in the Combined Management Report in the Risk and Opportunity Management section as well as in chapters 2 and 13 of the
Notes to the consolidated financial statements.
26. Segment Reporting Segment reporting is based on geographical regions in accordance with our internal reporting structure, with
the exception of stichd. The geographical region forms the business segment. Sales revenue, the operating result (EBIT) and other segment information are allocated to the corresponding geographical regions according
to the registered office of the respective Group company.
The internal management reporting includes the following reporting segments: Europe, EEMEA (Eastern
Europe, Middle East and Africa), North America, Latin America, Greater China, Rest of Asia/Pacific (excluding Greater China) and stichd (formerly Dobotex). These are reported as reportable business segments in
accordance with the criteria of IFRS 8.
The reconciliation includes information on assets, liabilities, expenses and income in connection with
centralized functions that do not meet the definition of business segments in IFRS 8. Central expenses and income include in particular central sourcing, central treasury, central marketing and other global functions of
the Company headquarters.
The Company’s main decision-maker is defined as the entire Management Board of PUMA SE.
With the exception of stichd's (formerly Dobotex) sales of products amounting to € 32.7 million (previous year:
€ 26.9 million), there are no significant internal sales between the business segments, which are therefore not included in the presentation.
The operating result (EBIT) of the business segments is defined as gross profit less the attributable other operating expenses plus royalty and commission income and other operating income, but not taking into
account the costs of the central departments and the central marketing expenses.
The external sales, operating result (EBIT), inventories and trade receivables of the business segments are regularly reported to the main decision-maker. Investments, depreciation and non-current assets at the level
of the business segments are not reported to the chief operating decision- maker. Intangible assets are
allocated to the business segments in the manner described under chapter 11. Segment liabilities, the financial result and income taxes are not allocated to the business segments and are therefore not reported to the chief
operating decision-maker at the business segment level.
Non-current assets and depreciation comprise the carrying amounts and depreciation of property, plant and
equipment, right-of-use assets and intangible assets during the past financial year. The investments comprise additions to property, plant and equipment and intangible assets. In addition, total impairment expenses in
the amount of € 0.0 million (previous year: € 0.6 million, relating to the Europe segment) were recognized.
Since PUMA is active in only one business area, the sports equipment industry, products are additionally allocated according to the footwear, apparel and accessories product segments in accordance with the internal
reporting structure.
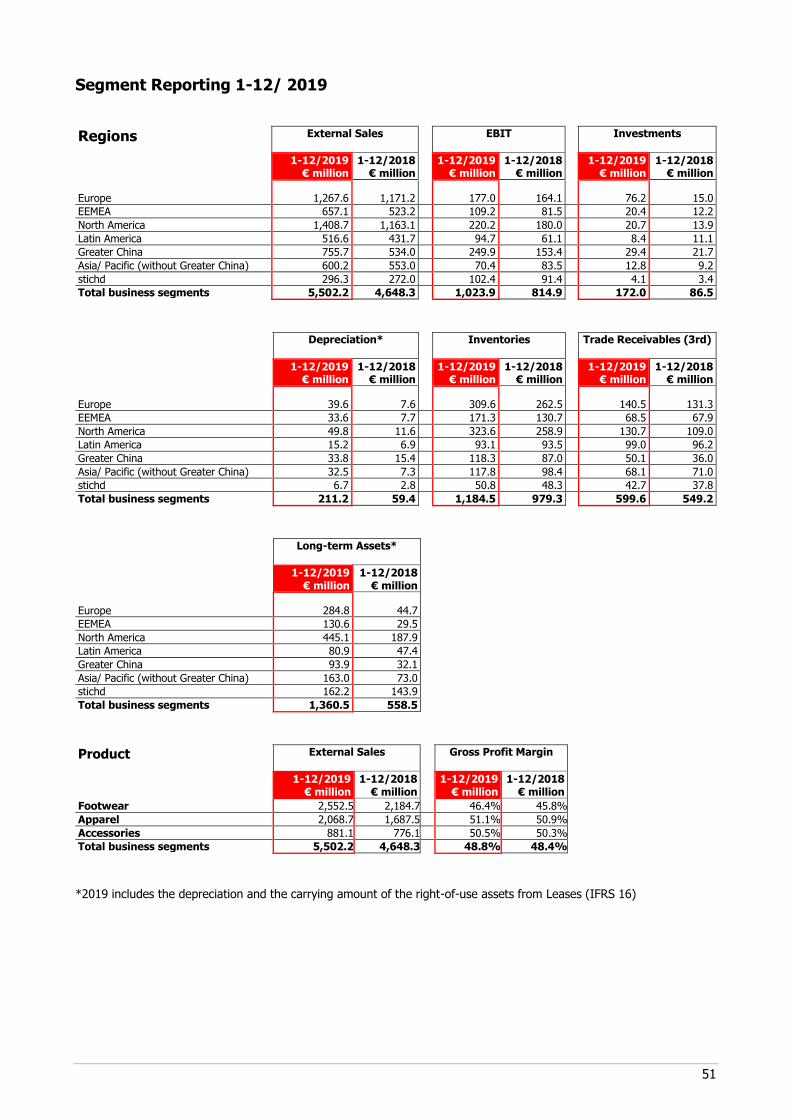
51
Segment Reporting 1-12/ 2019
Regions External Sales
EBIT
Investments
1-12/2019 € million
1-12/2018 € million
1-12/2019 € million
1-12/2018 € million
1-12/2019 € million
1-12/2018 € million
Europe 1,267.6 1,171.2 177.0 164.1 76.2 15.0
EEMEA 657.1 523.2 109.2 81.5 20.4 12.2
North America 1,408.7 1,163.1 220.2 180.0 20.7 13.9
Latin America 516.6 431.7 94.7 61.1 8.4 11.1
Greater China 755.7 534.0 249.9 153.4 29.4 21.7
Asia/ Pacific (without Greater China) 600.2 553.0 70.4 83.5 12.8 9.2
stichd 296.3 272.0 102.4 91.4 4.1 3.4
Total business segments 5,502.2 4,648.3 1,023.9 814.9 172.0 86.5
Depreciation*
Inventories
Trade Receivables (3rd)
1-12/2019 € million
1-12/2018 € million
1-12/2019 € million
1-12/2018 € million
1-12/2019 € million
1-12/2018 € million
Europe 39.6 7.6 309.6 262.5 140.5 131.3
EEMEA 33.6 7.7 171.3 130.7 68.5 67.9
North America 49.8 11.6 323.6 258.9 130.7 109.0
Latin America 15.2 6.9 93.1 93.5 99.0 96.2
Greater China 33.8 15.4 118.3 87.0 50.1 36.0
Asia/ Pacific (without Greater China) 32.5 7.3 117.8 98.4 68.1 71.0
stichd 6.7 2.8 50.8 48.3 42.7 37.8
Total business segments 211.2 59.4 1,184.5 979.3 599.6 549.2
Long-term Assets*
1-12/2019 € million
1-12/2018 € million
Europe 284.8 44.7
EEMEA 130.6 29.5
North America 445.1 187.9
Latin America 80.9 47.4
Greater China 93.9 32.1
Asia/ Pacific (without Greater China) 163.0 73.0
stichd 162.2 143.9
Total business segments 1,360.5 558.5
Product External Sales
Gross Profit Margin
1-12/2019 € million
1-12/2018 € million
1-12/2019 € million
1-12/2018 € million
Footwear 2,552.5 2,184.7 46.4% 45.8%
Apparel 2,068.7 1,687.5 51.1% 50.9%
Accessories 881.1 776.1 50.5% 50.3%
Total business segments 5,502.2 4,648.3 48.8% 48.4%
*2019 includes the depreciation and the carrying amount of the right-of-use assets from Leases (IFRS 16)
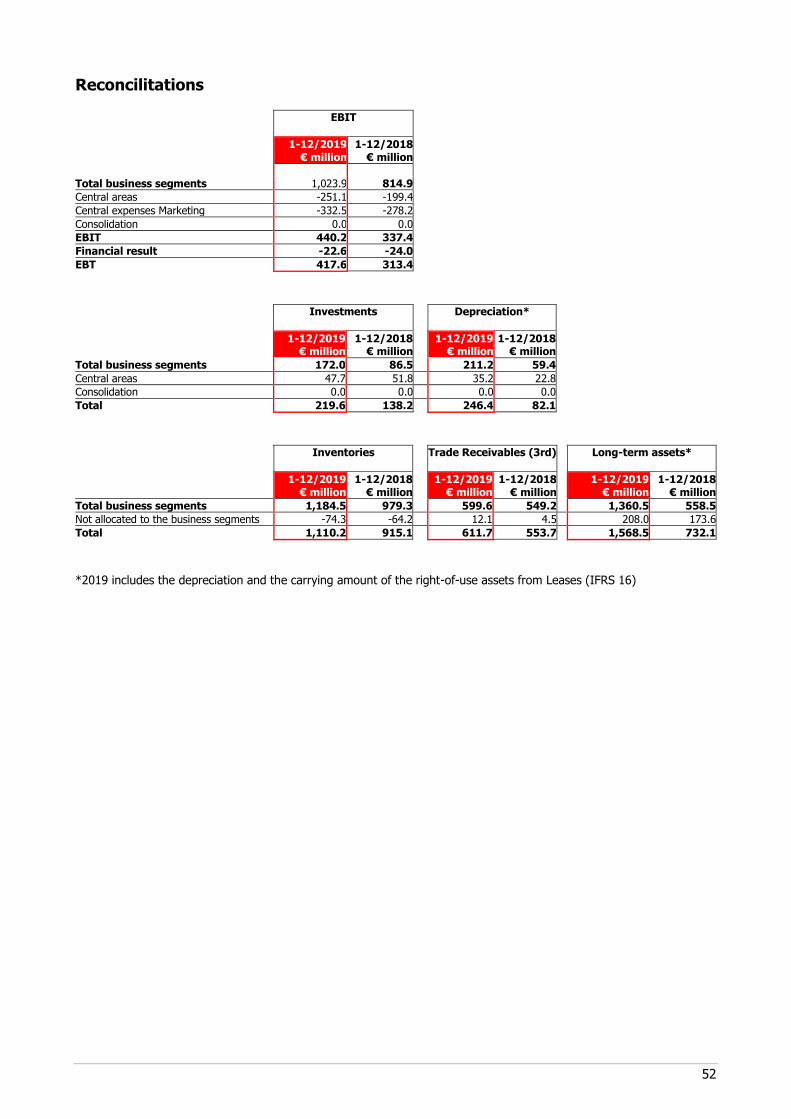
52
Reconcilitations
EBIT
1-12/2019 € million
1-12/2018 € million
Total business segments 1,023.9 814.9
Central areas -251.1 -199.4
Central expenses Marketing -332.5 -278.2
Consolidation 0.0 0.0
EBIT 440.2 337.4
Financial result -22.6 -24.0
EBT 417.6 313.4
Investments
Depreciation*
1-12/2019
€ million 1-12/2018
€ million 1-12/2019
€ million 1-12/2018
€ million
Total business segments 172.0 86.5 211.2 59.4
Central areas 47.7 51.8 35.2 22.8
Consolidation 0.0 0.0 0.0 0.0
Total 219.6 138.2 246.4 82.1
Inventories
Trade Receivables (3rd) Long-term assets*
1-12/2019 € million
1-12/2018 € million
1-12/2019 € million
1-12/2018 € million
1-12/2019 € million
1-12/2018 € million
Total business segments 1,184.5 979.3 599.6 549.2 1,360.5 558.5
Not allocated to the business segments -74.3 -64.2 12.1 4.5 208.0 173.6
Total 1,110.2 915.1 611.7 553.7 1,568.5 732.1
*2019 includes the depreciation and the carrying amount of the right-of-use assets from Leases (IFRS 16)
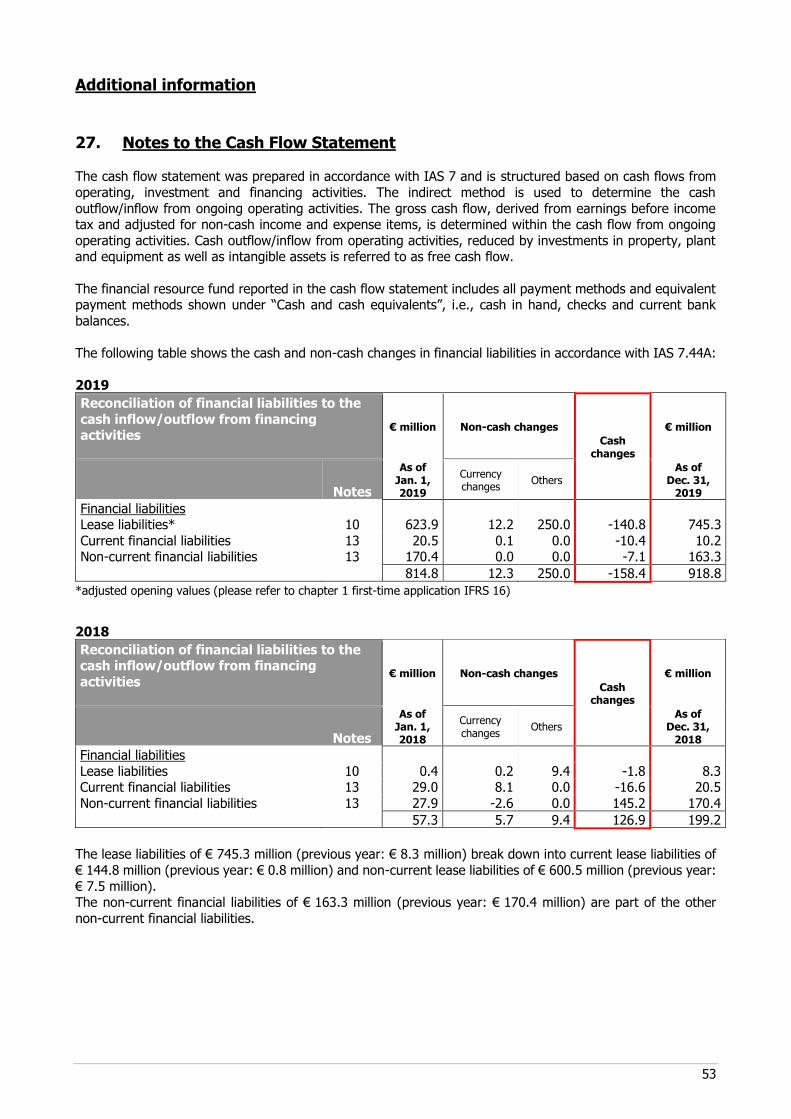
53
Additional information 27. Notes to the Cash Flow Statement The cash flow statement was prepared in accordance with IAS 7 and is structured based on cash flows from
operating, investment and financing activities. The indirect method is used to determine the cash
outflow/inflow from ongoing operating activities. The gross cash flow, derived from earnings before income tax and adjusted for non-cash income and expense items, is determined within the cash flow from ongoing
operating activities. Cash outflow/inflow from operating activities, reduced by investments in property, plant and equipment as well as intangible assets is referred to as free cash flow.
The financial resource fund reported in the cash flow statement includes all payment methods and equivalent payment methods shown under “Cash and cash equivalents”, i.e., cash in hand, checks and current bank
balances.
The following table shows the cash and non-cash changes in financial liabilities in accordance with IAS 7.44A:
2019
Reconciliation of financial liabilities to the
cash inflow/outflow from financing activities
€ million Non-cash changes
Cash changes
€ million
Notes
As of Jan. 1, 2019
Currency changes
Others As of
Dec. 31, 2019
Financial liabilities Lease liabilities* 10 623.9 12.2 250.0 -140.8 745.3
Current financial liabilities 13 20.5 0.1 0.0 -10.4 10.2 Non-current financial liabilities 13 170.4 0.0 0.0 -7.1 163.3
814.8 12.3 250.0 -158.4 918.8
*adjusted opening values (please refer to chapter 1 first-time application IFRS 16)
2018
Reconciliation of financial liabilities to the cash inflow/outflow from financing
activities
€ million Non-cash changes
Cash changes
€ million
Notes
As of Jan. 1, 2018
Currency changes
Others As of
Dec. 31, 2018
Financial liabilities
Lease liabilities 10 0.4 0.2 9.4 -1.8 8.3 Current financial liabilities 13 29.0 8.1 0.0 -16.6 20.5
Non-current financial liabilities 13 27.9 -2.6 0.0 145.2 170.4
57.3 5.7 9.4 126.9 199.2
The lease liabilities of € 745.3 million (previous year: € 8.3 million) break down into current lease liabilities of
€ 144.8 million (previous year: € 0.8 million) and non-current lease liabilities of € 600.5 million (previous year:
€ 7.5 million). The non-current financial liabilities of € 163.3 million (previous year: € 170.4 million) are part of the other
non-current financial liabilities.
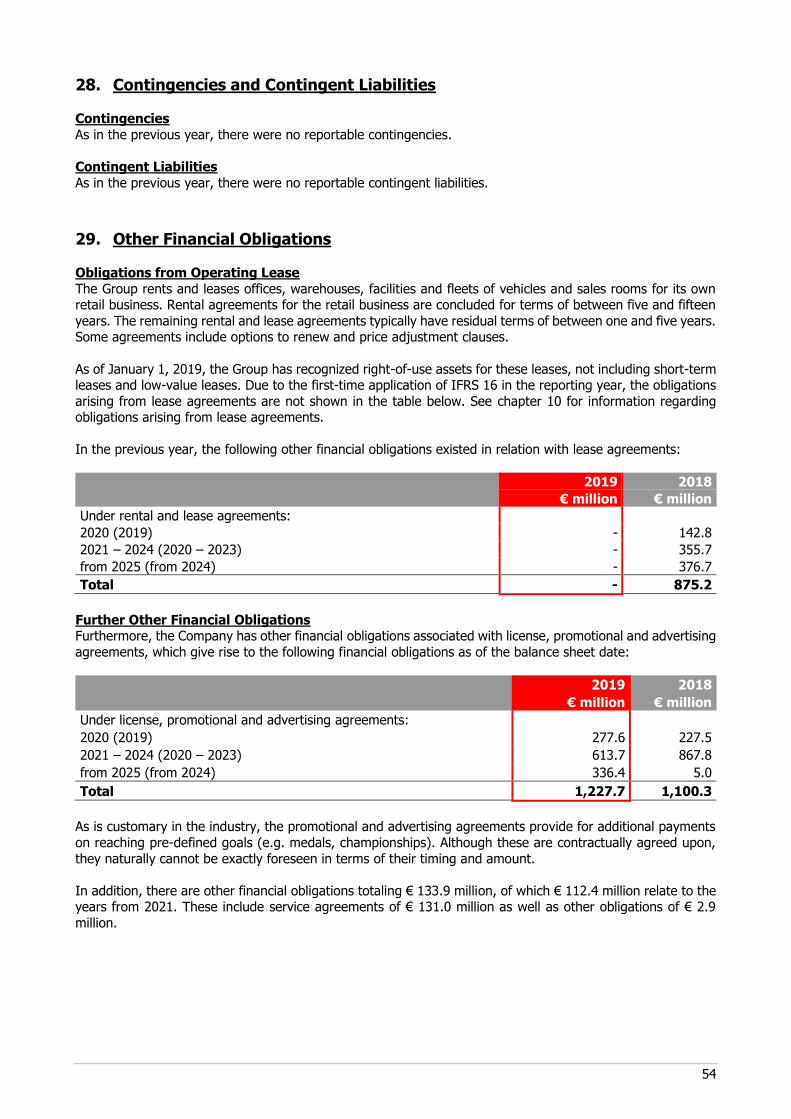
54
28. Contingencies and Contingent Liabilities Contingencies
As in the previous year, there were no reportable contingencies.
Contingent Liabilities
As in the previous year, there were no reportable contingent liabilities.
29. Other Financial Obligations
Obligations from Operating Lease
The Group rents and leases offices, warehouses, facilities and fleets of vehicles and sales rooms for its own retail business. Rental agreements for the retail business are concluded for terms of between five and fifteen
years. The remaining rental and lease agreements typically have residual terms of between one and five years. Some agreements include options to renew and price adjustment clauses.
As of January 1, 2019, the Group has recognized right-of-use assets for these leases, not including short-term leases and low-value leases. Due to the first-time application of IFRS 16 in the reporting year, the obligations
arising from lease agreements are not shown in the table below. See chapter 10 for information regarding obligations arising from lease agreements.
In the previous year, the following other financial obligations existed in relation with lease agreements:
2019 2018
€ million € million
Under rental and lease agreements:
2020 (2019) - 142.8
2021 – 2024 (2020 – 2023) - 355.7
from 2025 (from 2024) - 376.7
Total - 875.2
Further Other Financial Obligations Furthermore, the Company has other financial obligations associated with license, promotional and advertising
agreements, which give rise to the following financial obligations as of the balance sheet date:
2019 2018
€ million € million
Under license, promotional and advertising agreements:
2020 (2019) 277.6 227.5
2021 – 2024 (2020 – 2023) 613.7 867.8
from 2025 (from 2024) 336.4 5.0
Total 1,227.7 1,100.3
As is customary in the industry, the promotional and advertising agreements provide for additional payments
on reaching pre-defined goals (e.g. medals, championships). Although these are contractually agreed upon,
they naturally cannot be exactly foreseen in terms of their timing and amount.
In addition, there are other financial obligations totaling € 133.9 million, of which € 112.4 million relate to the years from 2021. These include service agreements of € 131.0 million as well as other obligations of € 2.9
million.
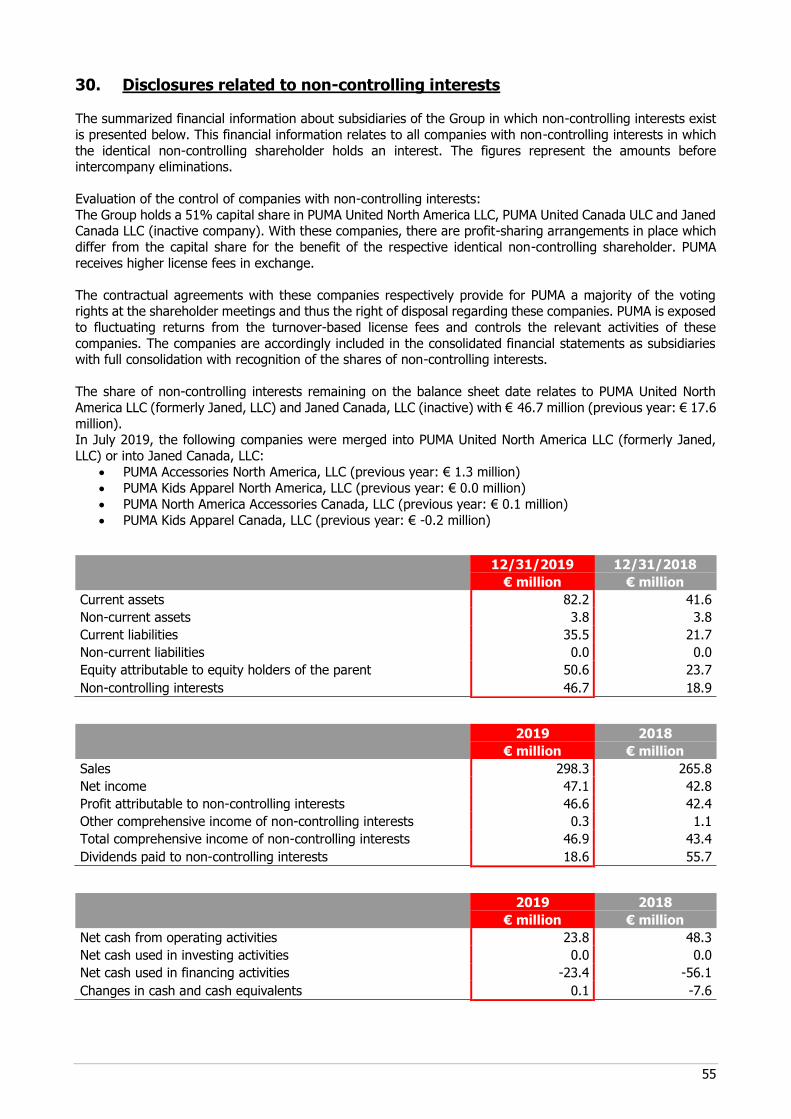
55
30. Disclosures related to non-controlling interests The summarized financial information about subsidiaries of the Group in which non-controlling interests exist
is presented below. This financial information relates to all companies with non-controlling interests in which
the identical non-controlling shareholder holds an interest. The figures represent the amounts before intercompany eliminations.
Evaluation of the control of companies with non-controlling interests:
The Group holds a 51% capital share in PUMA United North America LLC, PUMA United Canada ULC and Janed Canada LLC (inactive company). With these companies, there are profit-sharing arrangements in place which
differ from the capital share for the benefit of the respective identical non-controlling shareholder. PUMA
receives higher license fees in exchange.
The contractual agreements with these companies respectively provide for PUMA a majority of the voting rights at the shareholder meetings and thus the right of disposal regarding these companies. PUMA is exposed
to fluctuating returns from the turnover-based license fees and controls the relevant activities of these
companies. The companies are accordingly included in the consolidated financial statements as subsidiaries with full consolidation with recognition of the shares of non-controlling interests.
The share of non-controlling interests remaining on the balance sheet date relates to PUMA United North
America LLC (formerly Janed, LLC) and Janed Canada, LLC (inactive) with € 46.7 million (previous year: € 17.6
million). In July 2019, the following companies were merged into PUMA United North America LLC (formerly Janed,
LLC) or into Janed Canada, LLC:
• PUMA Accessories North America, LLC (previous year: € 1.3 million)
• PUMA Kids Apparel North America, LLC (previous year: € 0.0 million)
• PUMA North America Accessories Canada, LLC (previous year: € 0.1 million)
• PUMA Kids Apparel Canada, LLC (previous year: € -0.2 million)
2019 2018
€ million € million
Sales 298.3 265.8
Net income 47.1 42.8
Profit attributable to non-controlling interests 46.6 42.4
Other comprehensive income of non-controlling interests 0.3 1.1
Total comprehensive income of non-controlling interests 46.9 43.4
Dividends paid to non-controlling interests 18.6 55.7
2019 2018
€ million € million
Net cash from operating activities 23.8 48.3
Net cash used in investing activities 0.0 0.0
Net cash used in financing activities -23.4 -56.1
Changes in cash and cash equivalents 0.1 -7.6
12/31/2019 12/31/2018
€ million € million
Current assets 82.2 41.6
Non-current assets 3.8 3.8
Current liabilities 35.5 21.7
Non-current liabilities 0.0 0.0
Equity attributable to equity holders of the parent 50.6 23.7
Non-controlling interests 46.7 18.9
56
31. Management Board and Supervisory Board Disclosures pursuant to Section 314 (1) No. 6 HGB
Pursuant to Sections 286 (5), 314 (3) Sentence 1 HGB, the publication of the individual remuneration of the members of the Management Board in accordance with Section 285 No. 9 a) Sentences 5 to 8 and Section
314 (1) No. 6 a) Sentences 5 to 8 HGB may be waived for five years if the Annual General Meeting so resolves.
By resolution of the Annual Shareholders' Meeting on April 12, 2018, the Company was authorized to waive the disclosure requirements pursuant to Section 285 No. 9 a) Sentences 5 to 8 and Section 314 (1) No. 6 a)
Sentences 5 to 9 of the German Commercial Code for the fiscal year beginning January 1, 2018 and for all
subsequent fiscal years ending December 31, 2022 at the latest.
The Supervisory Board is of the opinion that the shareholders' legitimate interest in information is sufficiently taken into account by disclosing the total remuneration of the members of the Management Board. In
accordance with its statutory obligations, the Supervisory Board will ensure the appropriateness of individual
remuneration.
Compensation Philosophy The Management Board compensation system is designed to create incentives for a sustainable and profit-
oriented company performance. The objective of the compensation system is to stimulate the implementation of long-term Group strategy by ensuring that the relevant success parameters that govern the performance-
based compensation are aligned with the PUMA SE management system. Furthermore, the long-term interests of our shareholders are taken into account by making the variable compensation strongly dependent on the
performance of the PUMA SE share.
With a greater share of performance-based and therefore variable compensation, the intention is to reward the contribution of our Management Board members towards a sustainable development of our Company,
while negative deviations from the set targets will result in a significant reduction of variable compensation.
Governance in Compensation Matters It is the responsibility of the PUMA SE Supervisory Board to determine the compensation of the Management Board. The entire Supervisory Board decides on matters relating to the compensation of the Management
Board members based on the respective recommendations of the Personnel Committee which is comprised of members of the Supervisory Board. Criteria for calculating the total compensation are the responsibilities and
performance of the individual Management Board member, the economic situation, long-term strategic
planning and related goals, the sustainability of targeted results and the company’s long-term prospects.
Overview of compensation elements The compensation of the Management Board consists of non-performance-based and performance-based
components. The non-performance-based components comprise the basic compensation, company pension
contributions and other fringe benefits, while the performance-based components are divided into two parts, a bonus and a component with long-term incentive effect:
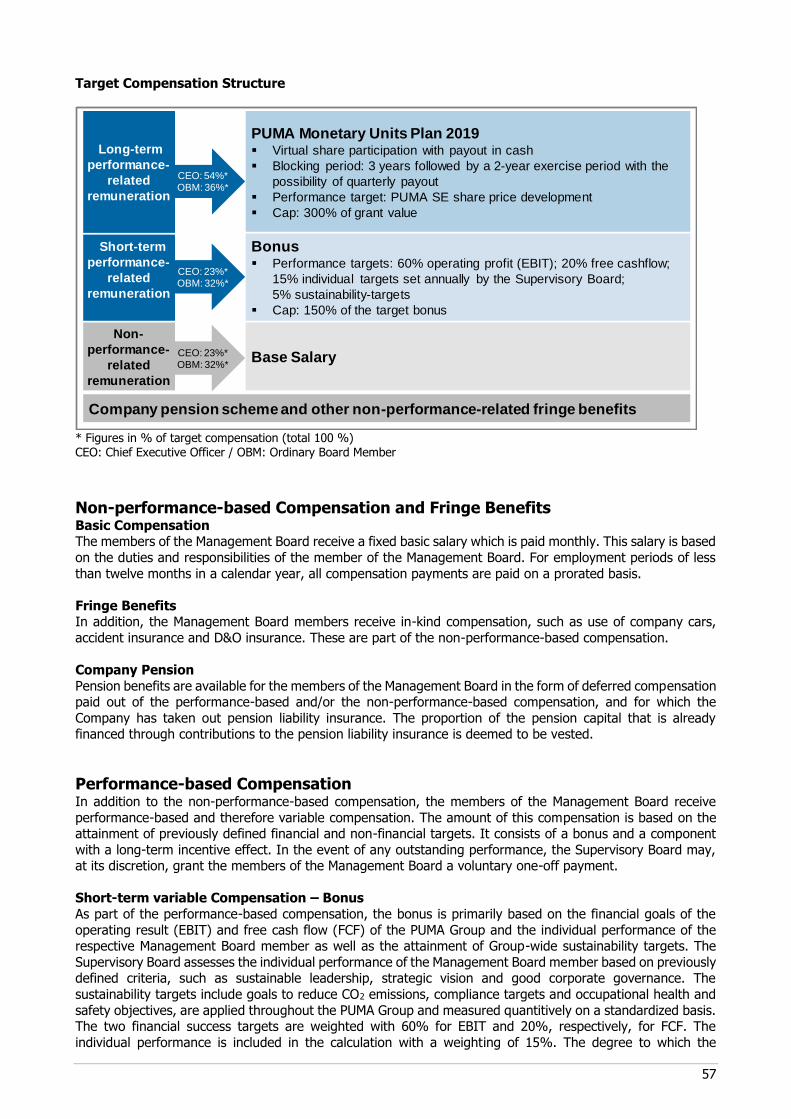
57
Target Compensation Structure
* Figures in % of target compensation (total 100 %) CEO: Chief Executive Officer / OBM: Ordinary Board Member
Non-performance-based Compensation and Fringe Benefits Basic Compensation The members of the Management Board receive a fixed basic salary which is paid monthly. This salary is based
on the duties and responsibilities of the member of the Management Board. For employment periods of less
than twelve months in a calendar year, all compensation payments are paid on a prorated basis.
Fringe Benefits In addition, the Management Board members receive in-kind compensation, such as use of company cars,
accident insurance and D&O insurance. These are part of the non-performance-based compensation.
Company Pension
Pension benefits are available for the members of the Management Board in the form of deferred compensation paid out of the performance-based and/or the non-performance-based compensation, and for which the
Company has taken out pension liability insurance. The proportion of the pension capital that is already financed through contributions to the pension liability insurance is deemed to be vested.
Performance-based Compensation
In addition to the non-performance-based compensation, the members of the Management Board receive
performance-based and therefore variable compensation. The amount of this compensation is based on the attainment of previously defined financial and non-financial targets. It consists of a bonus and a component
with a long-term incentive effect. In the event of any outstanding performance, the Supervisory Board may, at its discretion, grant the members of the Management Board a voluntary one-off payment.
Short-term variable Compensation – Bonus
As part of the performance-based compensation, the bonus is primarily based on the financial goals of the
operating result (EBIT) and free cash flow (FCF) of the PUMA Group and the individual performance of the respective Management Board member as well as the attainment of Group-wide sustainability targets. The
Supervisory Board assesses the individual performance of the Management Board member based on previously defined criteria, such as sustainable leadership, strategic vision and good corporate governance. The
sustainability targets include goals to reduce CO2 emissions, compliance targets and occupational health and
safety objectives, are applied throughout the PUMA Group and measured quantitively on a standardized basis. The two financial success targets are weighted with 60% for EBIT and 20%, respectively, for FCF. The
individual performance is included in the calculation with a weighting of 15%. The degree to which the
PUMA Monetary Units Plan 2019▪ Virtual share participation with payout in cash
▪ Blocking period: 3 years followed by a 2-year exercise period with the
possibility of quarterly payout
▪ Performance target: PUMA SE share price development
▪ Cap: 300% of grant value
Bonus▪ Performance targets: 60% operating profit (EBIT); 20% free cashflow;
15% individual targets set annually by the Supervisory Board;
5% sustainability-targets
▪ Cap: 150% of the target bonus
Base Salary
Short-term
performance-
related
remuneration
Non-
performance-
related
remuneration
Company pension scheme and other non-performance-related fringe benefits
Long-term
performance-
related
remuneration
CEO: 54%*OBM: 36%*
CEO: 23%*OBM: 32%*
CEO: 23%*OBM: 32%*
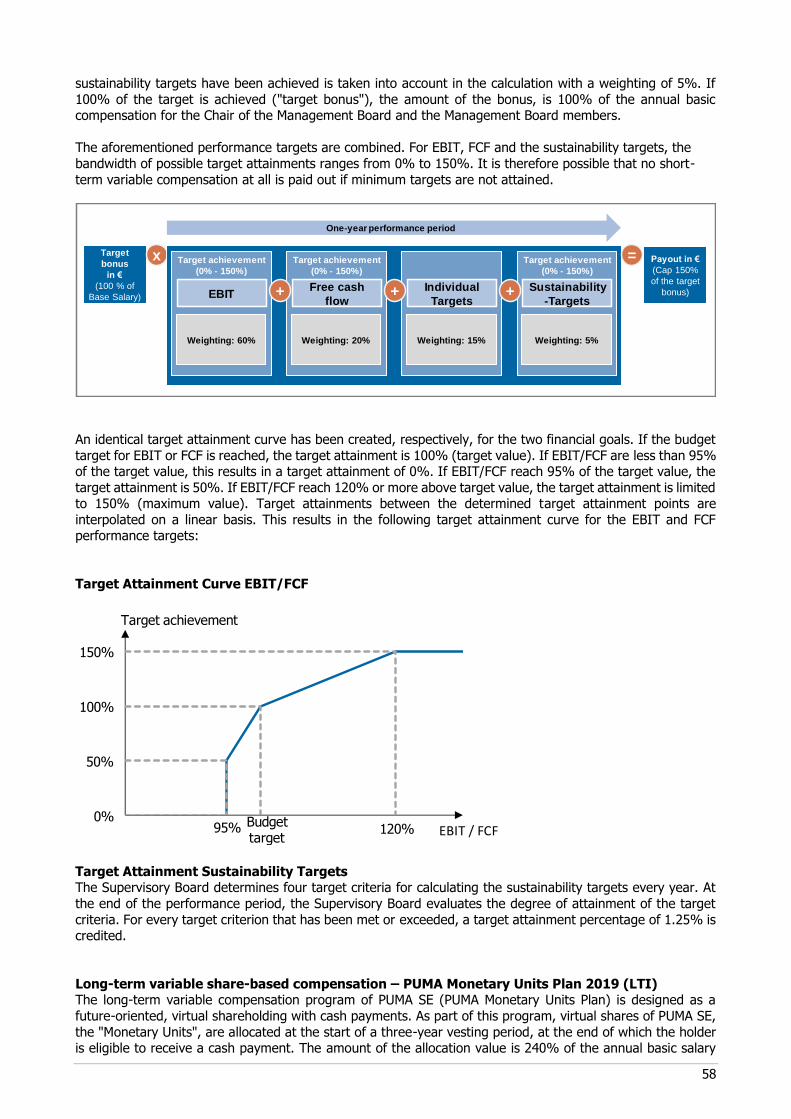
58
sustainability targets have been achieved is taken into account in the calculation with a weighting of 5%. If
100% of the target is achieved ("target bonus"), the amount of the bonus, is 100% of the annual basic compensation for the Chair of the Management Board and the Management Board members.
The aforementioned performance targets are combined. For EBIT, FCF and the sustainability targets, the
bandwidth of possible target attainments ranges from 0% to 150%. It is therefore possible that no short-
term variable compensation at all is paid out if minimum targets are not attained.
An identical target attainment curve has been created, respectively, for the two financial goals. If the budget
target for EBIT or FCF is reached, the target attainment is 100% (target value). If EBIT/FCF are less than 95% of the target value, this results in a target attainment of 0%. If EBIT/FCF reach 95% of the target value, the
target attainment is 50%. If EBIT/FCF reach 120% or more above target value, the target attainment is limited to 150% (maximum value). Target attainments between the determined target attainment points are
interpolated on a linear basis. This results in the following target attainment curve for the EBIT and FCF performance targets:
Target Attainment Curve EBIT/FCF
Target Attainment Sustainability Targets The Supervisory Board determines four target criteria for calculating the sustainability targets every year. At
the end of the performance period, the Supervisory Board evaluates the degree of attainment of the target
criteria. For every target criterion that has been met or exceeded, a target attainment percentage of 1.25% is credited.
Long-term variable share-based compensation – PUMA Monetary Units Plan 2019 (LTI) The long-term variable compensation program of PUMA SE (PUMA Monetary Units Plan) is designed as a
future-oriented, virtual shareholding with cash payments. As part of this program, virtual shares of PUMA SE,
the "Monetary Units", are allocated at the start of a three-year vesting period, at the end of which the holder is eligible to receive a cash payment. The amount of the allocation value is 240% of the annual basic salary
Target
bonus
in €
(100 % of
Base Salary)
Payout in €
(Cap 150%
of the target
bonus)
x
One-year performance period
Target achievement
(0% - 150%)
Target achievement
(0% - 150%)
EBITFree cash
flow
Weighting: 60% Weighting: 20%
+ Individual
Targets
Weighting: 15%
+
Target achievement
(0% - 150%)
Sustainability
-Targets
Weighting: 5%
+
=
0%
100%
Budgettarget
150%
120%
50%
95% EBIT / FCF
Target achievement
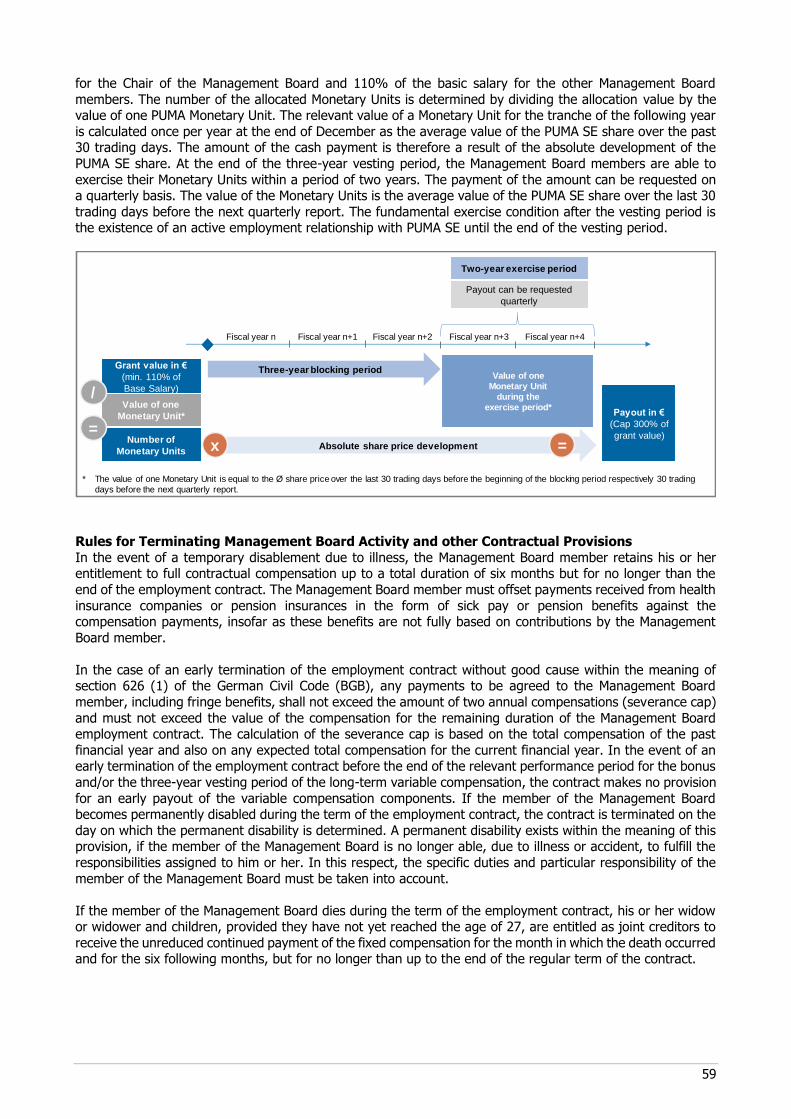
59
for the Chair of the Management Board and 110% of the basic salary for the other Management Board
members. The number of the allocated Monetary Units is determined by dividing the allocation value by the value of one PUMA Monetary Unit. The relevant value of a Monetary Unit for the tranche of the following year
is calculated once per year at the end of December as the average value of the PUMA SE share over the past 30 trading days. The amount of the cash payment is therefore a result of the absolute development of the
PUMA SE share. At the end of the three-year vesting period, the Management Board members are able to
exercise their Monetary Units within a period of two years. The payment of the amount can be requested on a quarterly basis. The value of the Monetary Units is the average value of the PUMA SE share over the last 30
trading days before the next quarterly report. The fundamental exercise condition after the vesting period is the existence of an active employment relationship with PUMA SE until the end of the vesting period.
Rules for Terminating Management Board Activity and other Contractual Provisions
In the event of a temporary disablement due to illness, the Management Board member retains his or her entitlement to full contractual compensation up to a total duration of six months but for no longer than the
end of the employment contract. The Management Board member must offset payments received from health
insurance companies or pension insurances in the form of sick pay or pension benefits against the compensation payments, insofar as these benefits are not fully based on contributions by the Management
Board member.
In the case of an early termination of the employment contract without good cause within the meaning of section 626 (1) of the German Civil Code (BGB), any payments to be agreed to the Management Board
member, including fringe benefits, shall not exceed the amount of two annual compensations (severance cap)
and must not exceed the value of the compensation for the remaining duration of the Management Board employment contract. The calculation of the severance cap is based on the total compensation of the past
financial year and also on any expected total compensation for the current financial year. In the event of an early termination of the employment contract before the end of the relevant performance period for the bonus
and/or the three-year vesting period of the long-term variable compensation, the contract makes no provision
for an early payout of the variable compensation components. If the member of the Management Board becomes permanently disabled during the term of the employment contract, the contract is terminated on the
day on which the permanent disability is determined. A permanent disability exists within the meaning of this provision, if the member of the Management Board is no longer able, due to illness or accident, to fulfill the
responsibilities assigned to him or her. In this respect, the specific duties and particular responsibility of the
member of the Management Board must be taken into account.
If the member of the Management Board dies during the term of the employment contract, his or her widow or widower and children, provided they have not yet reached the age of 27, are entitled as joint creditors to
receive the unreduced continued payment of the fixed compensation for the month in which the death occurred and for the six following months, but for no longer than up to the end of the regular term of the contract.
Two-year exercise period
Payout can be requested
quarterly
Fiscal year n Fiscal year n+1 Fiscal year n+2 Fiscal year n+3 Fiscal year n+4
* The value of one Monetary Unit is equal to the Ø share price over the last 30 trading days before the beginning of the blocking period respectively 30 trading
days before the next quarterly report.
Payout in €
(Cap 300% of
grant value)
Value of one
Monetary Unit
during the
exercise period*Value of one
Monetary Unit*
Grant value in €
(min. 110% of
Base Salary)
Number of
Monetary Units
/
=Absolute share price developmentx =
Three-year blocking period
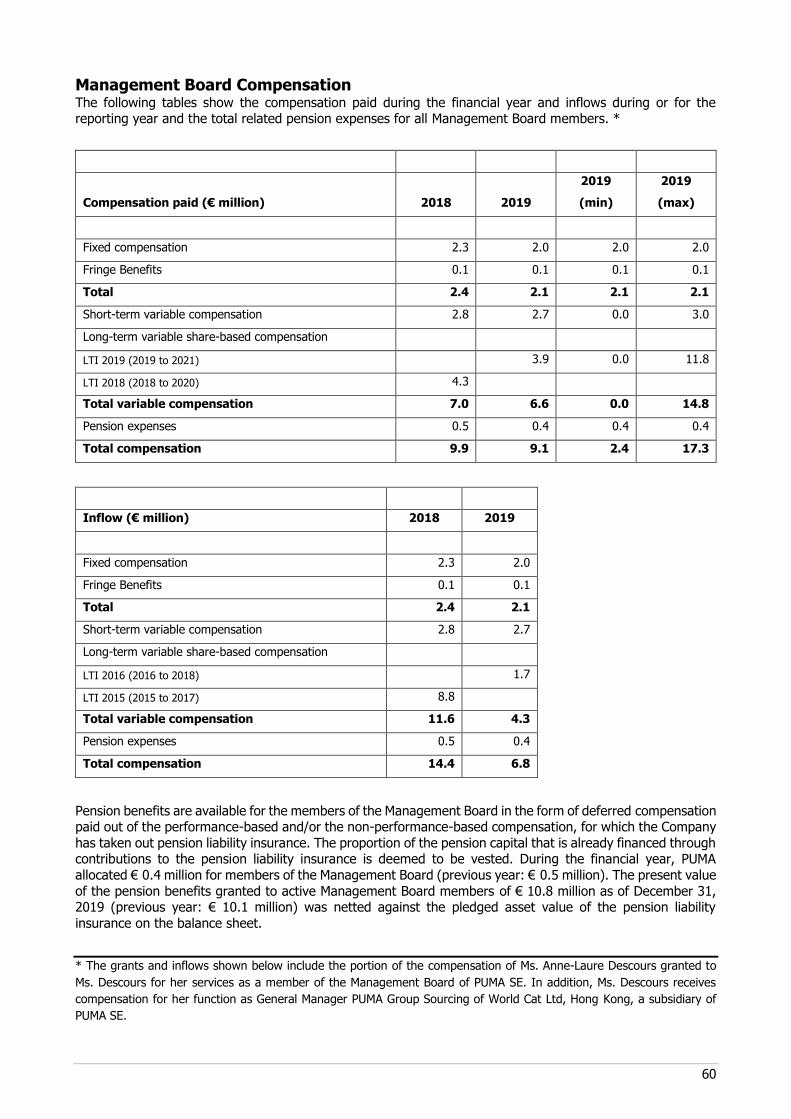
60
Management Board Compensation The following tables show the compensation paid during the financial year and inflows during or for the reporting year and the total related pension expenses for all Management Board members. *
Compensation paid (€ million) 2018 2019
2019
(min)
2019
(max)
Fixed compensation 2.3 2.0 2.0 2.0
Fringe Benefits 0.1 0.1 0.1 0.1
Total 2.4 2.1 2.1 2.1
Short-term variable compensation 2.8 2.7 0.0 3.0
Long-term variable share-based compensation
LTI 2019 (2019 to 2021) 3.9 0.0 11.8
LTI 2018 (2018 to 2020) 4.3
Total variable compensation 7.0 6.6 0.0 14.8
Pension expenses 0.5 0.4 0.4 0.4
Total compensation 9.9 9.1 2.4 17.3
Inflow (€ million) 2018 2019
Fixed compensation 2.3 2.0
Fringe Benefits 0.1 0.1
Total 2.4 2.1
Short-term variable compensation 2.8 2.7
Long-term variable share-based compensation
LTI 2016 (2016 to 2018) 1.7
LTI 2015 (2015 to 2017) 8.8
Total variable compensation 11.6 4.3
Pension expenses 0.5 0.4
Total compensation 14.4 6.8
Pension benefits are available for the members of the Management Board in the form of deferred compensation paid out of the performance-based and/or the non-performance-based compensation, for which the Company
has taken out pension liability insurance. The proportion of the pension capital that is already financed through contributions to the pension liability insurance is deemed to be vested. During the financial year, PUMA
allocated € 0.4 million for members of the Management Board (previous year: € 0.5 million). The present value
of the pension benefits granted to active Management Board members of € 10.8 million as of December 31, 2019 (previous year: € 10.1 million) was netted against the pledged asset value of the pension liability
insurance on the balance sheet.
* The grants and inflows shown below include the portion of the compensation of Ms. Anne-Laure Descours granted to
Ms. Descours for her services as a member of the Management Board of PUMA SE. In addition, Ms. Descours receives
compensation for her function as General Manager PUMA Group Sourcing of World Cat Ltd, Hong Kong, a subsidiary of
PUMA SE.
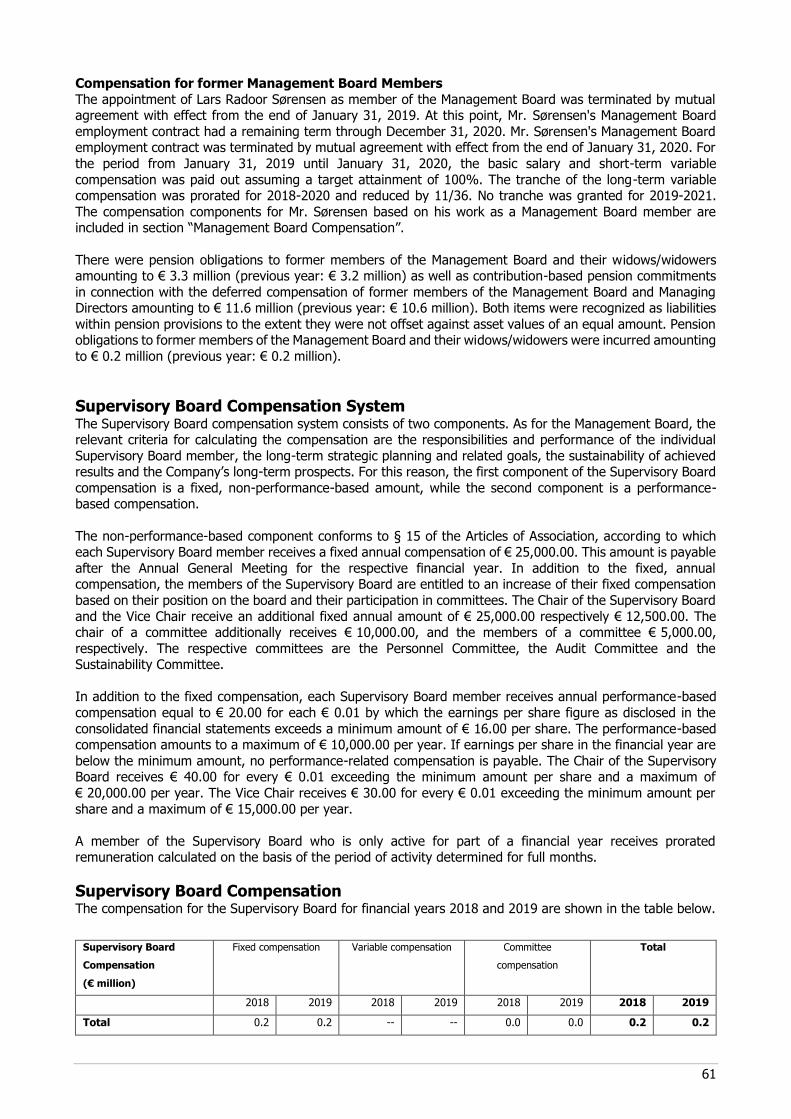
61
Compensation for former Management Board Members
The appointment of Lars Radoor Sørensen as member of the Management Board was terminated by mutual agreement with effect from the end of January 31, 2019. At this point, Mr. Sørensen's Management Board
employment contract had a remaining term through December 31, 2020. Mr. Sørensen's Management Board employment contract was terminated by mutual agreement with effect from the end of January 31, 2020. For
the period from January 31, 2019 until January 31, 2020, the basic salary and short-term variable
compensation was paid out assuming a target attainment of 100%. The tranche of the long-term variable compensation was prorated for 2018-2020 and reduced by 11/36. No tranche was granted for 2019-2021.
The compensation components for Mr. Sørensen based on his work as a Management Board member are included in section “Management Board Compensation”.
There were pension obligations to former members of the Management Board and their widows/widowers amounting to € 3.3 million (previous year: € 3.2 million) as well as contribution-based pension commitments
in connection with the deferred compensation of former members of the Management Board and Managing Directors amounting to € 11.6 million (previous year: € 10.6 million). Both items were recognized as liabilities
within pension provisions to the extent they were not offset against asset values of an equal amount. Pension obligations to former members of the Management Board and their widows/widowers were incurred amounting
to € 0.2 million (previous year: € 0.2 million).
Supervisory Board Compensation System The Supervisory Board compensation system consists of two components. As for the Management Board, the relevant criteria for calculating the compensation are the responsibilities and performance of the individual
Supervisory Board member, the long-term strategic planning and related goals, the sustainability of achieved results and the Company’s long-term prospects. For this reason, the first component of the Supervisory Board
compensation is a fixed, non-performance-based amount, while the second component is a performance-based compensation.
The non-performance-based component conforms to § 15 of the Articles of Association, according to which each Supervisory Board member receives a fixed annual compensation of € 25,000.00. This amount is payable
after the Annual General Meeting for the respective financial year. In addition to the fixed, annual compensation, the members of the Supervisory Board are entitled to an increase of their fixed compensation
based on their position on the board and their participation in committees. The Chair of the Supervisory Board
and the Vice Chair receive an additional fixed annual amount of € 25,000.00 respectively € 12,500.00. The chair of a committee additionally receives € 10,000.00, and the members of a committee € 5,000.00,
respectively. The respective committees are the Personnel Committee, the Audit Committee and the Sustainability Committee.
In addition to the fixed compensation, each Supervisory Board member receives annual performance-based
compensation equal to € 20.00 for each € 0.01 by which the earnings per share figure as disclosed in the
consolidated financial statements exceeds a minimum amount of € 16.00 per share. The performance-based compensation amounts to a maximum of € 10,000.00 per year. If earnings per share in the financial year are
below the minimum amount, no performance-related compensation is payable. The Chair of the Supervisory Board receives € 40.00 for every € 0.01 exceeding the minimum amount per share and a maximum of
€ 20,000.00 per year. The Vice Chair receives € 30.00 for every € 0.01 exceeding the minimum amount per
share and a maximum of € 15,000.00 per year.
A member of the Supervisory Board who is only active for part of a financial year receives prorated remuneration calculated on the basis of the period of activity determined for full months.
Supervisory Board Compensation The compensation for the Supervisory Board for financial years 2018 and 2019 are shown in the table below.
Supervisory Board
Compensation
(€ million)
Fixed compensation Variable compensation Committee
compensation
Total
2018 2019 2018 2019 2018 2019 2018 2019
Total 0.2 0.2 -- -- 0.0 0.0 0.2 0.2
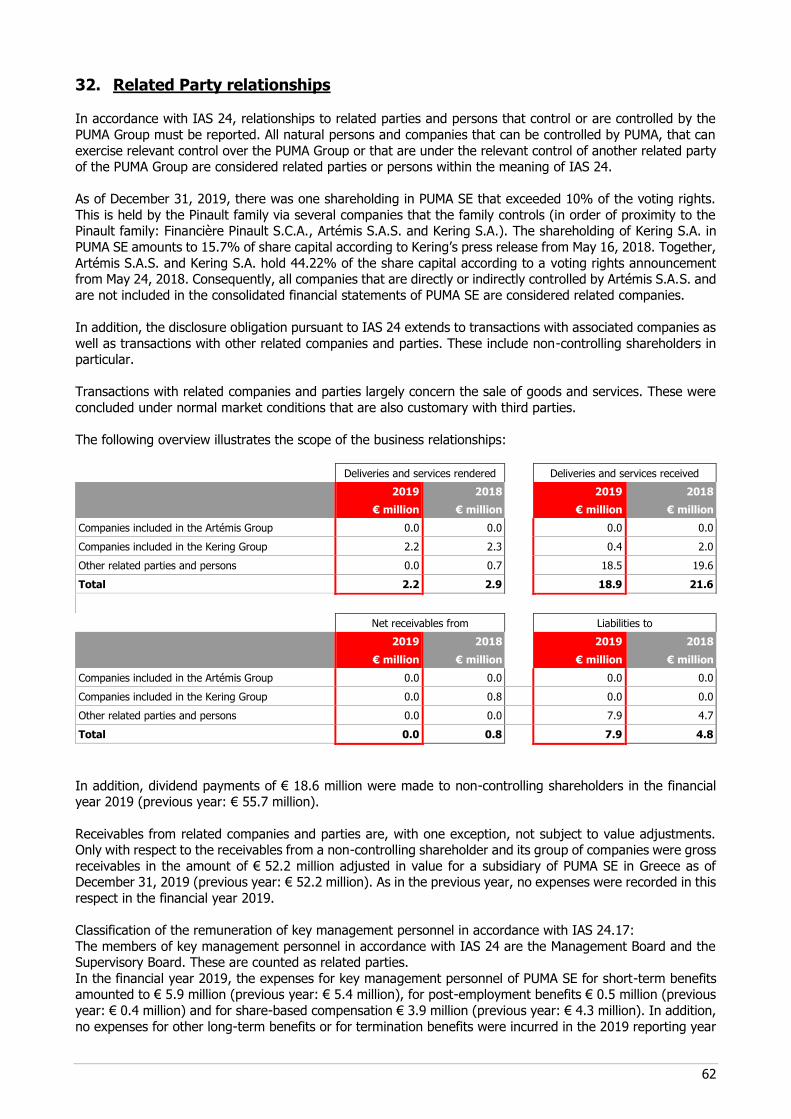
62
32. Related Party relationships In accordance with IAS 24, relationships to related parties and persons that control or are controlled by the
PUMA Group must be reported. All natural persons and companies that can be controlled by PUMA, that can
exercise relevant control over the PUMA Group or that are under the relevant control of another related party of the PUMA Group are considered related parties or persons within the meaning of IAS 24.
As of December 31, 2019, there was one shareholding in PUMA SE that exceeded 10% of the voting rights.
This is held by the Pinault family via several companies that the family controls (in order of proximity to the Pinault family: Financière Pinault S.C.A., Artémis S.A.S. and Kering S.A.). The shareholding of Kering S.A. in
PUMA SE amounts to 15.7% of share capital according to Kering’s press release from May 16, 2018. Together,
Artémis S.A.S. and Kering S.A. hold 44.22% of the share capital according to a voting rights announcement from May 24, 2018. Consequently, all companies that are directly or indirectly controlled by Artémis S.A.S. and
are not included in the consolidated financial statements of PUMA SE are considered related companies.
In addition, the disclosure obligation pursuant to IAS 24 extends to transactions with associated companies as
well as transactions with other related companies and parties. These include non-controlling shareholders in particular.
Transactions with related companies and parties largely concern the sale of goods and services. These were
concluded under normal market conditions that are also customary with third parties.
The following overview illustrates the scope of the business relationships:
Deliveries and services rendered Deliveries and services received
2019 2018 2019 2018
€ million € million € million € million
Companies included in the Artémis Group 0.0 0.0 0.0 0.0
Companies included in the Kering Group 2.2 2.3 0.4 2.0
Other related parties and persons 0.0 0.7 18.5 19.6
Total 2.2 2.9 18.9 21.6
Net receivables from Liabilities to
2019 2018 2019 2018
€ million € million € million € million
Companies included in the Artémis Group 0.0 0.0 0.0 0.0
Companies included in the Kering Group 0.0 0.8 0.0 0.0
Other related parties and persons 0.0 0.0 7.9 4.7
Total 0.0 0.8 7.9 4.8
In addition, dividend payments of € 18.6 million were made to non-controlling shareholders in the financial year 2019 (previous year: € 55.7 million).
Receivables from related companies and parties are, with one exception, not subject to value adjustments. Only with respect to the receivables from a non-controlling shareholder and its group of companies were gross
receivables in the amount of € 52.2 million adjusted in value for a subsidiary of PUMA SE in Greece as of December 31, 2019 (previous year: € 52.2 million). As in the previous year, no expenses were recorded in this
respect in the financial year 2019.
Classification of the remuneration of key management personnel in accordance with IAS 24.17:
The members of key management personnel in accordance with IAS 24 are the Management Board and the Supervisory Board. These are counted as related parties.
In the financial year 2019, the expenses for key management personnel of PUMA SE for short-term benefits amounted to € 5.9 million (previous year: € 5.4 million), for post-employment benefits € 0.5 million (previous
year: € 0.4 million) and for share-based compensation € 3.9 million (previous year: € 4.3 million). In addition,
no expenses for other long-term benefits or for termination benefits were incurred in the 2019 reporting year
63
or in the previous year. Accordingly, total expenses for the reporting year amount to € 10.3 million (previous
year: € 10.1 million). In addition, members of management in key positions at PUMA SE received compensation of € 1.1 million
(previous year: € 0.2 million) under other employment contracts within the Group. The compensation report of PUMA SE contains further details on the compensation of the Management Board
and the Supervisory Board.
33. Corporate Governance In November 2019, the Management Board and the Supervisory Board submitted the required compliance
declaration with respect to the recommendations issued by the Government Commission German Corporate Governance Code pursuant to Section 161 of the AktG (Aktiengesetz, German Stock Corporation Act) and
published it on the Company’s website (www.puma.com). Please also refer to the Corporate Governance
Report in the Combined Management Report.
34. Events after the Balance Sheet Date
There were no events after the balance sheet date which may have a material effect on the net assets, financial
position and results of operations of PUMA Group.
35. Date of Release The Management Board of PUMA SE released the consolidated financial statements on January 31, 2020 for distribution to the Supervisory Board. The task of the Supervisory Board is to review the consolidated financial
statements and state whether it approves them.
Herzogenaurach, January 31, 2020
The Management Board
Gulden Lämmermann Descours
This is a translation of the German version
In case of doubt, the German version shall apply.
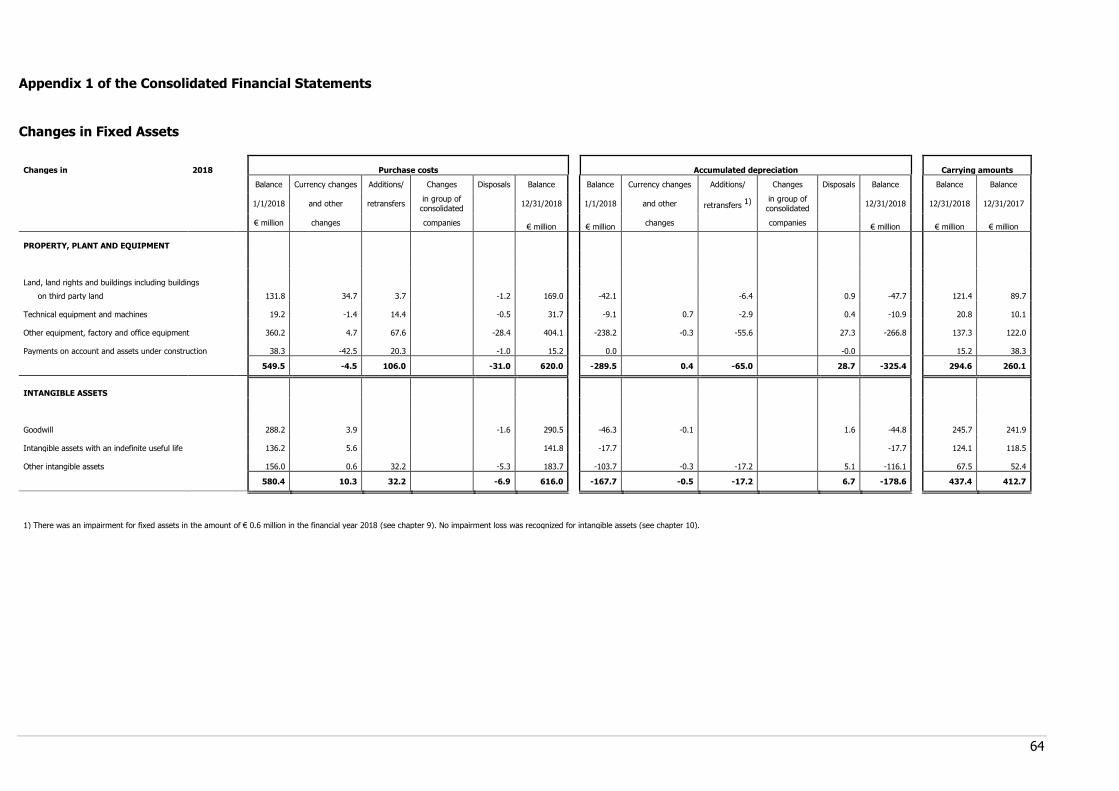
64
Appendix 1 of the Consolidated Financial Statements
Changes in Fixed Assets
Changes in 2018 Purchase costs Accumulated depreciation Carrying amounts
Balance Currency changes Additions/ Changes Disposals Balance Balance Currency changes Additions/ Changes Disposals Balance Balance Balance
1/1/2018 and other retransfers
in group of consolidated
12/31/2018 1/1/2018 and other retransfers 1)
in group of
consolidated 12/31/2018 12/31/2018 12/31/2017
€ million changes companies
€ million € million changes companies
€ million € million € million
PROPERTY, PLANT AND EQUIPMENT
Land, land rights and buildings including buildings
on third party land 131.8 34.7 3.7 -1.2 169.0 -42.1 -6.4 0.9 -47.7 121.4 89.7
Technical equipment and machines 19.2 -1.4 14.4 -0.5 31.7 -9.1 0.7 -2.9 0.4 -10.9 20.8 10.1
Other equipment, factory and office equipment 360.2 4.7 67.6 -28.4 404.1 -238.2 -0.3 -55.6 27.3 -266.8 137.3 122.0
Payments on account and assets under construction 38.3 -42.5 20.3 -1.0 15.2 0.0 -0.0 15.2 38.3
549.5 -4.5 106.0 -31.0 620.0 -289.5 0.4 -65.0 28.7 -325.4 294.6 260.1
INTANGIBLE ASSETS
Goodwill 288.2 3.9 -1.6 290.5 -46.3 -0.1 1.6 -44.8 245.7 241.9
Intangible assets with an indefinite useful life 136.2 5.6 141.8 -17.7 -17.7 124.1 118.5
Other intangible assets 156.0 0.6 32.2 -5.3 183.7 -103.7 -0.3 -17.2 5.1 -116.1 67.5 52.4
580.4 10.3 32.2 -6.9 616.0 -167.7 -0.5 -17.2 6.7 -178.6 437.4 412.7
1) There was an impairment for fixed assets in the amount of € 0.6 million in the financial year 2018 (see chapter 9). No impairment loss was recognized for intangible assets (see chapter 10).
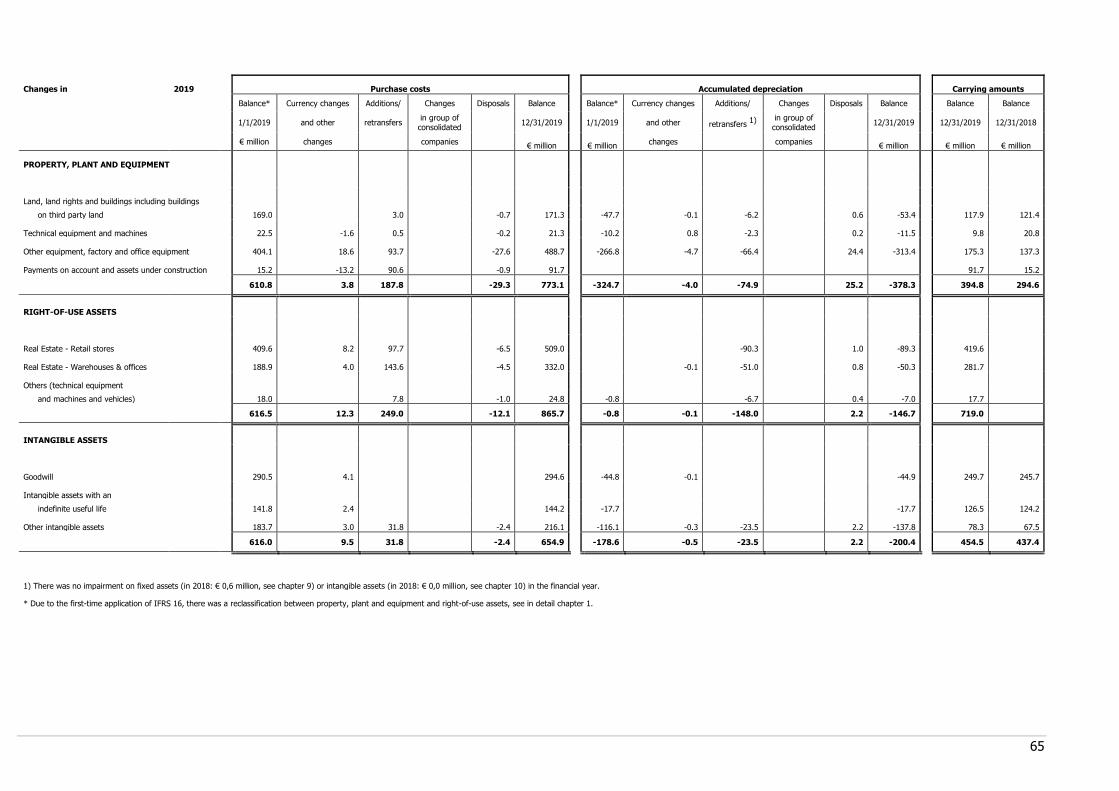
65
Changes in 2019 Purchase costs Accumulated depreciation Carrying amounts
Balance* Currency changes Additions/ Changes Disposals Balance Balance* Currency changes Additions/ Changes Disposals Balance Balance Balance
1/1/2019 and other retransfers
in group of consolidated
12/31/2019 1/1/2019 and other retransfers 1)
in group of
consolidated 12/31/2019 12/31/2019 12/31/2018
€ million changes companies
€ million € million changes companies
€ million € million € million
PROPERTY, PLANT AND EQUIPMENT
Land, land rights and buildings including buildings
on third party land 169.0 3.0 -0.7 171.3 -47.7 -0.1 -6.2 0.6 -53.4 117.9 121.4
Technical equipment and machines 22.5 -1.6 0.5 -0.2 21.3 -10.2 0.8 -2.3 0.2 -11.5 9.8 20.8
Other equipment, factory and office equipment 404.1 18.6 93.7 -27.6 488.7 -266.8 -4.7 -66.4 24.4 -313.4 175.3 137.3
Payments on account and assets under construction 15.2 -13.2 90.6 -0.9 91.7 91.7 15.2
610.8 3.8 187.8 -29.3 773.1 -324.7 -4.0 -74.9 25.2 -378.3 394.8 294.6
RIGHT-OF-USE ASSETS
Real Estate - Retail stores 409.6 8.2 97.7 -6.5 509.0 -90.3 1.0 -89.3 419.6
Real Estate - Warehouses & offices 188.9 4.0 143.6 -4.5 332.0 -0.1 -51.0 0.8 -50.3 281.7
Others (technical equipment
and machines and vehicles) 18.0 7.8 -1.0 24.8 -0.8 -6.7 0.4 -7.0 17.7
616.5 12.3 249.0 -12.1 865.7 -0.8 -0.1 -148.0 2.2 -146.7 719.0
INTANGIBLE ASSETS
Goodwill 290.5 4.1 294.6 -44.8 -0.1 -44.9 249.7 245.7
Intangible assets with an
indefinite useful life 141.8 2.4 144.2 -17.7 -17.7 126.5 124.2
Other intangible assets 183.7 3.0 31.8 -2.4 216.1 -116.1 -0.3 -23.5 2.2 -137.8 78.3 67.5
616.0 9.5 31.8 -2.4 654.9 -178.6 -0.5 -23.5 2.2 -200.4 454.5 437.4
1) There was no impairment on fixed assets (in 2018: € 0,6 million, see chapter 9) or intangible assets (in 2018: € 0,0 million, see chapter 10) in the financial year.
* Due to the first-time application of IFRS 16, there was a reclassification between property, plant and equipment and right-of-use assets, see in detail chapter 1.
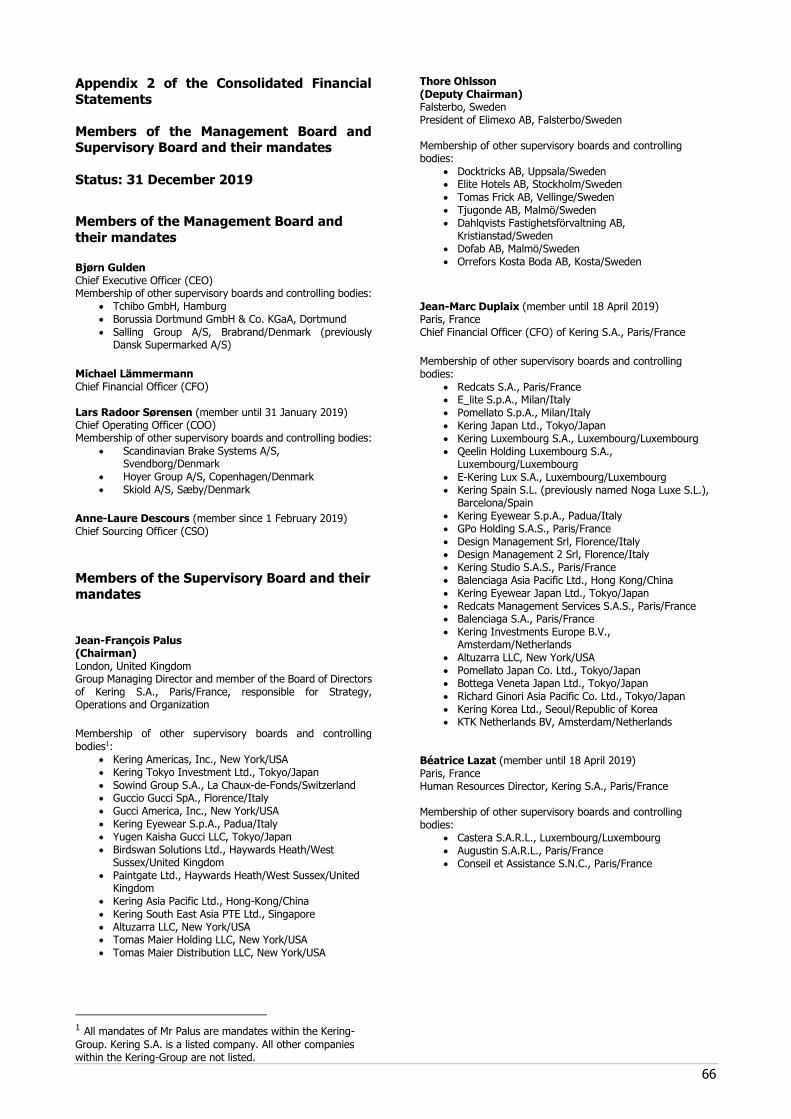
66
Appendix 2 of the Consolidated Financial
Statements
Members of the Management Board and Supervisory Board and their mandates
Status: 31 December 2019
Members of the Management Board and
their mandates Bjørn Gulden Chief Executive Officer (CEO) Membership of other supervisory boards and controlling bodies:
• Tchibo GmbH, Hamburg • Borussia Dortmund GmbH & Co. KGaA, Dortmund • Salling Group A/S, Brabrand/Denmark (previously
Dansk Supermarked A/S)
Michael Lämmermann Chief Financial Officer (CFO) Lars Radoor Sørensen (member until 31 January 2019) Chief Operating Officer (COO) Membership of other supervisory boards and controlling bodies:
• Scandinavian Brake Systems A/S, Svendborg/Denmark
• Hoyer Group A/S, Copenhagen/Denmark • Skiold A/S, Sæby/Denmark
Anne-Laure Descours (member since 1 February 2019) Chief Sourcing Officer (CSO)
Members of the Supervisory Board and their
mandates
Jean-François Palus (Chairman) London, United Kingdom Group Managing Director and member of the Board of Directors of Kering S.A., Paris/France, responsible for Strategy, Operations and Organization
Membership of other supervisory boards and controlling bodies1:
• Kering Americas, Inc., New York/USA • Kering Tokyo Investment Ltd., Tokyo/Japan • Sowind Group S.A., La Chaux-de-Fonds/Switzerland • Guccio Gucci SpA., Florence/Italy • Gucci America, Inc., New York/USA • Kering Eyewear S.p.A., Padua/Italy • Yugen Kaisha Gucci LLC, Tokyo/Japan • Birdswan Solutions Ltd., Haywards Heath/West
Sussex/United Kingdom • Paintgate Ltd., Haywards Heath/West Sussex/United
Kingdom • Kering Asia Pacific Ltd., Hong-Kong/China • Kering South East Asia PTE Ltd., Singapore • Altuzarra LLC, New York/USA • Tomas Maier Holding LLC, New York/USA • Tomas Maier Distribution LLC, New York/USA
1 All mandates of Mr Palus are mandates within the Kering-
Group. Kering S.A. is a listed company. All other companies within the Kering-Group are not listed.
Thore Ohlsson (Deputy Chairman) Falsterbo, Sweden President of Elimexo AB, Falsterbo/Sweden Membership of other supervisory boards and controlling bodies:
• Docktricks AB, Uppsala/Sweden • Elite Hotels AB, Stockholm/Sweden • Tomas Frick AB, Vellinge/Sweden • Tjugonde AB, Malmö/Sweden • Dahlqvists Fastighetsförvaltning AB,
Kristianstad/Sweden • Dofab AB, Malmö/Sweden • Orrefors Kosta Boda AB, Kosta/Sweden
Jean-Marc Duplaix (member until 18 April 2019) Paris, France Chief Financial Officer (CFO) of Kering S.A., Paris/France
Membership of other supervisory boards and controlling bodies:
• Redcats S.A., Paris/France • E_lite S.p.A., Milan/Italy • Pomellato S.p.A., Milan/Italy • Kering Japan Ltd., Tokyo/Japan • Kering Luxembourg S.A., Luxembourg/Luxembourg • Qeelin Holding Luxembourg S.A.,
Luxembourg/Luxembourg • E-Kering Lux S.A., Luxembourg/Luxembourg • Kering Spain S.L. (previously named Noga Luxe S.L.),
Barcelona/Spain • Kering Eyewear S.p.A., Padua/Italy • GPo Holding S.A.S., Paris/France • Design Management Srl, Florence/Italy • Design Management 2 Srl, Florence/Italy • Kering Studio S.A.S., Paris/France • Balenciaga Asia Pacific Ltd., Hong Kong/China • Kering Eyewear Japan Ltd., Tokyo/Japan • Redcats Management Services S.A.S., Paris/France • Balenciaga S.A., Paris/France • Kering Investments Europe B.V.,
Amsterdam/Netherlands • Altuzarra LLC, New York/USA • Pomellato Japan Co. Ltd., Tokyo/Japan • Bottega Veneta Japan Ltd., Tokyo/Japan • Richard Ginori Asia Pacific Co. Ltd., Tokyo/Japan • Kering Korea Ltd., Seoul/Republic of Korea • KTK Netherlands BV, Amsterdam/Netherlands
Béatrice Lazat (member until 18 April 2019) Paris, France Human Resources Director, Kering S.A., Paris/France Membership of other supervisory boards and controlling bodies:
• Castera S.A.R.L., Luxembourg/Luxembourg • Augustin S.A.R.L., Paris/France • Conseil et Assistance S.N.C., Paris/France
67
Héloïse Temple-Boyer (member since 18 April 2019) Paris, France Deputy CEO of ARTÉMIS S.A.S., Paris/France Membership of other supervisory boards and controlling bodies2:
• Kering S.A., Paris/France • Giambattista Valli S.A.S., Paris/ France • Société d’exploitation de l’hebdomadaire le Point S.A.,
Paris/France • Royalement Vôtre Editions S.A.S., Paris/France • ACHP Plc, London/United Kingdom • Christie’s International Plc, London/United Kingdom • Palazzo Grassi Spa, Venice/Italy
Fiona May (member since 18 April 2019) Calenzano, Italy Independent Management Consultant Membership of other supervisory boards and controlling bodies:
• R.C.S. Media Group Active Team Srl, Milano/Italy Martin Koeppel (Employees’ Representative) Weisendorf, Germany Chairman of the Works Counsel of PUMA SE Bernd Illig (Employees’ Representative) Bechhofen, Germany Administrator IT Systems of PUMA SE
Supervisory Board Committees
Personnel Committee
• Jean-François Palus (Chairman) • Béatrice Lazat (until 18 April 2019) • Fiona May (since 18 April 2019) • Martin Köppel
Audit Committee
• Thore Ohlsson (Chairman) • Jean-Marc Duplaix (until 18 April 2019) • Héloïse Temple-Boyer (since 18 April 2019) • Bernd Illig
Nominating Committee
• Jean-François Palus (Chairman) • Jean-Marc Duplaix (until 18 April 2019) • Béatrice Lazat (until 18 April 2019) • Héloïse Temple-Boyer (since 18 April 2019) • Fiona May (since 18 April 2019)
2 All mandates are mandates within the ARTÈMIS-Group.
Kering S.A. is a listed company.
Declaration by the Legal Representatives
We state to the best of our knowledge that the consolidated financial statements give a true and fair view
of the net assets, financial position and results of operations of the Group in accordance with the applicable
accounting principles, and that the Group management report, which is combined with the Management
report of PUMA SE for the financial year 2019, provides a true and fair view of the course of the
development and performance of the business and the position of the Group, together with a description
of the principal risks and opportunities associated with the expected performance of the Group.
Herzogenaurach, January 31, 2020
The Management Board
Gulden Lämmermann Descours
INDEPENDENT AUDITOR’S REPORT
To PUMA SE, Herzogenaurach
REPORT ON THE AUDIT OF THE CONSOLIDATED FINANCIAL STATEMENTS AND OF THE
COMBINED MANAGEMENT REPORT
Audit Opinions
We have audited the consolidated financial statements of PUMA SE, Herzogenaurach, and its
subsidiaries (the Group), which comprise the consolidated balance sheet as at 31 December 2019,
the consolidated income statement, the consolidated statement of comprehensive income, the
consolidated statement of changes in equity and the consolidated cash flow statement for the
financial year from 1 January to 31 December 2019 as well as the notes to the consolidated financial
statements, including a summary of significant accounting policies. In addition, we have audited the
combined management report of PUMA SE for the financial year from 1 January to 31 December
2019. In accordance with the German legal requirements, we have not audited the statement on
corporate governance and the corporate governance report specified in Chapter “Corporate
Governance Report including the Statement on Corporate Governance pursuant to § 289f and § 315d
HGB” of the combined management report.with the German legal requirements, we have not audited
the content of those parts of the notes to the consolidated financial statements and of the combined
management report as specified in the Chapter “Other information” of our independent auditor´s
report.
In our opinion, on the basis of the knowledge obtained in the audit
• the accompanying consolidated financial statements comply, in all material respects, with the
International Financial Reporting Standards (IFRS) as adopted by the EU, and the additional
requirements of German commercial law pursuant to Section 315e (1) German Commercial Code
(HGB) and, in compliance with these requirements, give a true and fair view of the assets,
liabilities, and financial position of the Group as at 31 December 2019, and of its financial
performance for the financial year from 1 January to 31 December 2019, and
• the accompanying combined management report as a whole provides an appropriate view of the
Group’s position. In all material respects, this combined management report is consistent with
the consolidated financial statements, complies with German legal requirements and appropriately
presents the opportunities and risks of future development. Our audit opinion on the combined
management report does not cover the content of the statement on corporate governance and
the corporate governance report specified in Chapter “Corporate Governance Report including the
Statement on Corporate Governance pursuant to § 289f and § 315d HGB” of the combined
management report.
Pursuant to Section 322 (3) Sentence 1 German Commercial Code (HGB), we declare that our audit
has not led to any reservations relating to the legal compliance of the consolidated financial
statements and of the combined management report.
Basis for the Audit Opinions
We conducted our audit of the consolidated financial statements and of the combined management
report in accordance with Section 317 German Commercial Code (HGB) and the EU Audit Regulation
(No. 537/2014; referred to subsequently as “EU Audit Regulation”) and in compliance with German
Generally Accepted Standards for Financial Statement Audits promulgated by the Institut der
Wirtschaftsprüfer (IDW). Our responsibilities under those requirements and principles are further
described in the “Auditor’s Responsibilities for the Audit of the Consolidated Financial Statements and
of the Combined Management Report” section of our auditor’s report. We are independent of the
group entities in accordance with the requirements of European law and German commercial and
professional law, and we have fulfilled our other German professional responsibilities in accordance
with these requirements. In addition, in accordance with Article 10 (2) Point (f) of the EU Audit
Regulation, we declare that we have not provided non-audit services prohibited under Article 5 (1)
of the EU Audit Regulation. We believe that the audit evidence we have obtained is sufficient and
appropriate to provide a basis for our audit opinions on the consolidated financial statements and on
the combined management report.
Key Audit Matters in the Audit of the Consolidated Financial Statements
Key audit matters are those matters that, in our professional judgment, were of most significance in
our audit of the consolidated financial statements for the financial year from 1 January to 31
December 2019. These matters were addressed in the context of our audit of the consolidated
financial statements as a whole and in forming our audit opinion thereon; we do not provide a
separate audit opinion on these matters.
In the following we present the key audit matters we have determined in the course of our audit:
1. Recoverability of goodwill
2. Recoverability of the Cobra brand
3. Impacts of first-time adoption of IFRS 16 on lease accounting
Our presentation of these key audit matters has been structured as follows:
a) Description (including reference to corresponding information in the consolidated financial
statements)
b) Auditor’s response
1. Recoverability of goodwill
a) The consolidated financial statements of PUMA SE show goodwill in the amount of mEUR 249.7
corresponding to approximately 5.7 % of the consolidated balance sheet total or 13.0 % of the
group equity.
Each financial year or in case of respective signs of impairment, goodwill is subject to impairment
tests. The impairment tests are performed by PUMA SE by applying the “discounted cash flow
method”. The valuation is based on the present values of the future cash flows. The company’s
valuation model is based on future cash flows, which are in turn based on the effective three-year
plan and valid at the date the impairment test. This detailed planning phase is extended with the
assumption of long-term growth rates. The discounting is performed using the weighted average
cost of capital (WACC). Here, the realizable amount is determined on the basis of the value in use
and a possible need for impairment is determined by comparing the value in use with the carrying
amount.
The outcome of this valuation highly depends on the legal representatives’ assessment of future
cash flows, the WACC rate applied and the long-term growth rate and therefore involves
uncertainties and discretion. Thus, the assessment of the recoverability of the goodwill was
classified as a key audit matter within the scope of our audit.
Information on the goodwill, provided by the legal representatives, is disclosed in Chapter 2
“Significant Consolidation, Accounting and Valuation Principles” and in Chapter 11 “Intangible
Assets” of the notes to the consolidated financial statements.
b) Within the scope of our risk-oriented audit, we gained an understanding of the systematic
approach applied when performing the impairment test. We satisfied ourselves, that the valuation
model used adequately presents the requirements of the relevant standards, whether the
necessary input data are completely and accurately determined and whether the calculations
within the model are performed correctly. We satisfied ourselves of the appropriateness of the
future cash flows used for the computation by reconciling these cash flows particularly with the
effective three-year plan as well as by interviewing the legal representatives or persons appointed
by them with regard to the material assumptions underlying this plan. In addition, we performed
a critical assessment of the plan under consideration of general and industry-specific market
expectations.
Since a material portion of the value in use results from the forecasted cash flows for the period
after the three-year plan (phase of perpetuity), we in particular critically assessed the sustainable
growth rate used within the perpetuity phase by means of general and industry-specific market
expectations. Since relatively low changes of the discounting rate may materially affect the
amount of the realizable value, we have also checked the parameters used when determining the
WACC rate involving internal valuation experts from the financial advisory sector and reproduced
the computation scheme.
Due to the material significance and taking into account the fact that the assessment of the
goodwill also depends on the economic framework conditions that cannot be influenced by the
Group, we performed in addition a critical assessment of the sensitivity analyses performed by
PUMA SE for the cash-generating units (so-called CGUs) with low headroom (present values
compared to the carrying amount) in order to be able to assess a possible impairment risk in case
of change of a material valuation assumption.
2. Recoverability of the Cobra brand
a) The consolidated financial statements of PUMA SE disclose for the Cobra brand a brand value in
the amount of mEUR 126.6 with the indefinite useful life corresponding to approximately 2.9% of
the consolidated balance sheet total or 6.6 % of the group equity.
The Cobra brand is subject to an impairment test conducted annually or in case of a triggering
event. The impairment test is conducted by PUMA SE based on the relief from royalty method.
According to this approach, the value of the brand results from future royalty that a company
would have to pay for the use of the brand if they had to license it. The approach uses forecasted
revenue generated with the Cobra brand based on the effective three-year plan, valid at the time
the impairment test is conducted. Subsequently, the projection period is extended assuming long-
term growth rates. The discounting is performed by means of the weighted average cost of capital
(WACC). The recoverable amount and the need for impairment is determined by comparing the
value in use with the carrying amount. If there are indications of impairment of the brand used
by the Group, the recoverability of the brand is assessed by reference to the recoverable amount
of the cash-generating unit to which the brand is allocated.
The outcome of this valuation highly depends on the legal representatives’ assumption of future
revenue to be generated with the Cobra brand, the royalty rate and the long-term growth rate as
well as the WACC rate applied and therefore involves uncertainties and discretion. Thus, the
assessment of the recoverability of the Cobra Brand was classified as key audit matter within the
scope of our audit.
Information on the Cobra brand, provided by the legal representatives, is disclosed in Chapter 2
“Significant Consolidation, Accounting and Valuation Principles” and in Chapter 11 “Intangible
Assets” of the notes to the consolidated financial statements.
b) As part of our risk-oriented audit, we first examined on the basis of the information available to
us and in discussions with the legal representatives and with persons appointed by them, that
there are no indications of impairment of the brand and that the recoverability of the brand can
be assessed by use of the relief-from-royalty method as part of the impairment test. We have
followed the methodological procedure for performing the impairment test using the relief-from-
royalty method. In this regard we examined, whether the valuation model adequately reflects the
conceptual requirements of the relevant standards, whether the necessary input data are
completely and accurately determined and whether the calculations applied to the model are made
correctly. We satisfied ourselves of the appropriateness of the assumed future revenue underlying
the computation (Cobra branded sales) by reconciling these sales particularly with the effective
three-year plan as well as by interviewing the legal representatives and with persons appointed
by them with regard to the material assumptions underlying this plan. In addition, we performed
a critical assessment of the plan taking into account general and industry-specific market
expectations.
Since a material portion of the value in use results from the forecasted revenue for the period
following the three-year plan (phase of perpetuity), we particularly reviewed the sustainable
growth rate applied to the perpetuity phase by means of general and industry-specific market
expectations. As even relatively small changes of the expected royalty rate and the used discount
rate may have a material effect on the value in use, we also assessed the parameters involved in
the assumed royalty rate and determination of the discount rate involving internal valuation
experts from the financial advisory sector and recalculated the computation scheme. Additionally,
we reviewed the applied royalty rate based on industry-specific average rates.
Due to the material significance and as the measurement of the brand also depends on general
economic conditions that are beyond the Group’s control, we additionally reviewed the sensitivity
analyses concerning the Cobra brand originally conducted by Puma SE in order to be able to
determine a potential impairment risk in case a material assumption underlying the measurement
changes.
3. Impacts of first-time adoption of IFRS 16 on lease accounting
a) In the consolidated financial statements of PUMA SE as at 31 December 2019, right-of-use assets
of mEUR 719,0 and lease liabilities of mEUR 745,3 are accounted for, corresponding to
approximately 16,4% or 17,0% of the consolidated balance sheet total and 37,4% or 38,8% of
the group equity. In the financial year 2019, the first-time adoption of the new lease accounting
standard (IFRS 16) has significant effects on the opening balance values and their rollover as at
the reporting date, since operating leases in particular have become subject to the recognition
requirement. The transition to IFRS 16 was performed applying the modified retrospective
approach; prior-period comparative figures were not restated. It was not reassessed whether or
not a contract is a lease within the meaning of IFRS 16. A central IT system has been
implemented for the purpose of lease accounting. The new IFRS 16 standard requires the
executive directors to make estimates and judgements. This is particularly the case in view of
the estimate as to exercising contractual renewal options, entailing implications on the lease
term, as to, where applicable, the value of the interest rate, as to the amount of lease liability
and the associated impact on the consolidated balance sheet, the consolidated statement of
comprehensive income and the consolidated cash flow statement. In this light and due to the
complexity of the new requirements, we classified the accounting of leases in accordance with
IFRS 16 as a key audit matter within the scope of our audit.
The information provided by the executive directors on lease accounting and on the impact of
the first time adoption of IFRS 16 are included in the notes to the consolidated financial
statements in Chapter 1 “General” and in Chapter 10 “Leases” of the notes to the consolidated
financial statements.
b) During our audit, we assessed, among other matters, the appropriateness and implementation
of the processes and controls established by the Company for the complete and correct
identification and recognition of leases. This also applies to the implementation of the central
IT system and the required adjustments to the existing IT systems in respect of lease accounting.
Further, our audit comprised assessing the impact of the initial adoption of IFRS 16. For this
purpose, we reperformed the implementation steps taken by the Company in response to the
initial adoption of IFRS 16, and evaluated the design of the established processes and of the
associated IT systems specific to lease accounting in accordance with IFRS 16. In this regard,
we inspected selected lease contracts, obtained an understanding of the identification of
performance obligations, and assessed whether the latter were completely and correctly
recognised and accounted for in the relevant IT systems. In this process, we inspected selected
contracts and other adequate evidence, and conducted interviews with employees of the
Company to assess, in particular, the appropriateness of the estimates made as to exercising
contractual renewal options, entailing implications on the lease term, as to the value of the
interest rate, as to the amount of lease liability as well as the associated impact on the
consolidated balance sheet, the consolidated statement of comprehensive income and the
consolidated cash flow statements. Moreover, we examined whether the IT systems and
processes that were established by the Company and adjusted to IFRS 16, including the controls
put in place, are appropriate. Furthermore, we reperformed whether the estimates and
judgements made by the executive directors are reasonably documented and substantiated.
The information provided by the executive directors in the notes to the consolidated financial
statements concerning the impact on the consolidated financial statements of the first time
adoption of IFRS 16, and the information concerning exercising options and the related
explanations in the notes to the consolidated financial statements constituted further areas of
audit focus.
Other information
The legal representatives are responsible for the other information. The other information comprises:
• the statement on corporate governance pursuant to Section 289f German Commercial Code
(HGB) specified in Chapter “Corporate Governance Report including the Statement on Corporate
Governance pursuant to § 289f and § 315d HGB” of the combined management report,
• the corporate governance report pursuant to No. 3.10 of the German Corporate Governance
Code specified in Chapter “Corporate Governance Report including the Statement on Corporate
Governance pursuant to § 289f and § 315d HGB” of the combined management report,
• the legal representatives‘ confirmation relating to the consolidated financial statements and to
the combined management report pursuant to Section 297 (2) Sentence 4 and Section 315 (1)
Sentence 5 German Commercial Code (HGB), respectively,
• the combined non-financial report which will be published after the issuance of this auditor´s
report and
• the remaining parts of the Annual Report which will be published after the issuance of this
auditor´s report, with the exception of the audited consolidated financial statements and
combined management report and our auditor’s report.
Our audit opinions on the consolidated financial statements and on the combined management report
do not cover the other information, and consequently we do not express an audit opinion or any
other form of assurance conclusion thereon.
In connection with our audit, our responsibility is to read the other information and, in so doing, to
consider whether the other information
• is materially inconsistent with the consolidated financial statements, with the combined
management report or our knowledge obtained in the audit, or
• otherwise appears to be materially misstated.
Responsibilities of the Legal representatives and the Supervisory Board for the
Consolidated Financial Statements and the Combined Management Report
The legal representatives are responsible for the preparation of the consolidated financial statements
that comply, in all material respects, with IFRSs as adopted by the EU and the additional
requirements of German commercial law pursuant to Section 315e (1) German Commercial Code
(HGB) and that the consolidated financial statements, in compliance with these requirements, give
a true and fair view of the assets, liabilities, financial position, and financial performance of the
Group. In addition, the legal representatives are responsible for such internal control as they have
determined necessary to enable the preparation of consolidated financial statements that are free
from material misstatement, whether due to fraud or error.
In preparing the consolidated financial statements, the legal representatives are responsible for
assessing the Group’s ability to continue as a going concern. They also have the responsibility for
disclosing, as applicable, matters related to going concern. In addition, they are responsible for
financial reporting based on the going concern basis of accounting unless there is an intention to
liquidate the Group or to cease operations, or there is no realistic alternative but to do so.
Furthermore, the legal representatives are responsible for the preparation of the combined
management report that, as a whole, provides an appropriate view of the Group’s position and is, in
all material respects, consistent with the consolidated financial statements, complies with German
legal requirements, and appropriately presents the opportunities and risks of future development. In
addition, the legal representatives are responsible for such arrangements and measures (systems)
as they have considered necessary to enable the preparation of a combined management report that
is in accordance with the applicable German legal requirements, and to be able to provide sufficient
appropriate evidence for the assertions in the combined management report.

The Supervisory Board is responsible for overseeing the Group’s financial reporting process for the
preparation of the consolidated financial statements and of the combined management report.
Auditor’s Responsibilities for the Audit of the Consolidated Financial Statements and of the
Combined Management Report
Our objectives are to obtain reasonable assurance about whether the consolidated financial
statements as a whole are free from material misstatement, whether due to fraud or error, and
whether the combined management report as a whole provides an appropriate view of the Group’s
position and, in all material respects, is consistent with the consolidated financial statements and the
knowledge obtained in the audit, complies with the German legal requirements and appropriately
presents the opportunities and risks of future development, as well as to issue an auditor’s report
that includes our audit opinions on the consolidated financial statements and on the combined
management report.
Reasonable assurance is a high level of assurance, but is not a guarantee that an audit conducted in
accordance with Section 317 German Commercial Code (HGB) and the EU Audit Regulation and in
compliance with German Generally Accepted Standards for Financial Statement Audits promulgated
by the Institut der Wirtschaftsprüfer (IDW) will always detect a material misstatement.
Misstatements can arise from fraud or error and are considered material if, individually or in the
aggregate, they could reasonably be expected to influence the economic decisions of users taken on
the basis of these consolidated financial statements and this combined management report.
We exercise professional judgment and maintain professional skepticism throughout the audit. We
also:
• Identify and assess the risks of material misstatement of the consolidated financial statements
and of the combined management report, whether due to fraud or error, design and perform audit
procedures responsive to those risks, and obtain audit evidence that is sufficient and appropriate
to provide a basis for our audit opinions. The risk of not detecting a material misstatement
resulting from fraud is higher than for one resulting from error, as fraud may involve collusion,
forgery, intentional omissions, misrepresentations, or the override of internal control.
• Obtain an understanding of internal control relevant to the audit of the consolidated financial
statements and of arrangements and measures relevant to the audit of the combined
management report in order to design audit procedures that are appropriate in the circumstances,
but not for the purpose of expressing an audit opinion on the effectiveness of these systems.
• Evaluate the appropriateness of accounting policies used by the legal representatives and the
reasonableness of estimates made by the legal representatives and related disclosures.
• Conclude on the appropriateness of the legal representatives’ use of the going concern basis of
accounting and, based on the audit evidence obtained, whether a material uncertainty exists
related to events or conditions that may cast significant doubt on the Group’s ability to continue
as a going concern. If we conclude that a material uncertainty exists, we are required to draw
attention in the auditor’s report to the related disclosures in the consolidated financial statements
and in the combined management report or, if such disclosures are inadequate, to modify our
respective audit opinions. Our conclusions are based on the audit evidence obtained up to the
date of our auditor’s report. However, future events or conditions may cause the Group to cease
to be able to continue as a going concern.
• Evaluate the overall presentation, structure and content of the consolidated financial statements,
including the disclosures, and whether the consolidated financial statements present the
underlying transactions and events in a manner that the consolidated financial statements give a
true and fair view of the assets, liabilities, financial position and financial performance of the
Group in compliance with IFRSs as adopted by the EU and with the additional requirements of
German commercial law pursuant to Section 315e (1) German Commercial Code HGB).
• Obtain sufficient appropriate audit evidence regarding the financial information of the entities or
business activities within the Group to express audit opinions on the consolidated financial
statements and on the combined management report. We are responsible for the direction,
supervision and performance of the group audit. We remain solely responsible for our audit
opinions.
• Evaluate the consistency of the combined management report with the consolidated financial
statements, its conformity with German law, and the view of the Group’s position it provides.
• Perform audit procedures on the prospective information presented by the executive directors in
the combined management report. On the basis of sufficient appropriate audit evidence we
evaluate, in particular, the significant assumptions used by the executive directors as a basis for
the prospective information, and evaluate the proper derivation of the prospective information
from these assumptions. We do not express a separate audit opinion on the prospective
information and on the assumptions used as a basis. There is a substantial unavoidable risk that
future events will differ materially from the prospective information.
We communicate with those charged with governance regarding, among other matters, the planned
scope and timing of the audit and significant audit findings, including any significant deficiencies in
internal control that we identify during our audit.
We also provide those charged with governance with a statement that we have complied with the
relevant independence requirements, and communicate with them all relationships and other matters
that may reasonably be thought to bear on our independence, and where applicable, the related
safeguards.
From the matters communicated with those charged with governance, we determine those matters
that were of most significance in the audit of the consolidated financial statements of the current
period and are therefore the key audit matters. We describe these matters in our auditor’s report
unless law or regulation precludes public disclosure about the matter.
OTHER LEGAL AND REGULATORY REQUIREMENTS
Further information pursuant to Article 10 of the EU Audit Regulation
We were elected as group auditor by the annual general meeting on 18 April 2019. We were engaged
by the Supervisory Board on 30 Juli 2019. We have been the group auditor of PUMA SE,
Herzogenaurach, without interruption since the financial year 2012.
We declare that the audit opinions expressed in this auditor’s report are consistent with the additional
report to the audit committee pursuant to Article 11 of the EU Audit Regulation (long form audit
report).
GERMAN PUBLIC AUDITOR RESPONSIBLE FOR THE ENGAGEMENT
The German Public Auditor responsible for the engagement is Dr. Thomas Reitmayr.
Munich, 31 January 2020
Deloitte GmbH
Wirtschaftsprüfungsgesellschaft
(Dr. Thomas Reitmayr) (Stefan Otto)
Wirtschaftsprüfer Wirtschaftsprüfer
[German Public Auditor] [German Public Auditor]
1
Report by the Supervisory Board
Dear Shareholders,
PUMA closes the year 2019 with record net sales and is growing faster in many areas, beating both the
markets and its competitors. The positive development of all key performance indicators is a remarkable
success – even without considering the background of increasing global uncertainties. The 2019 financial
year has begun with a change in the Management Board. Anne-Laure Descours was appointed Chief
Sourcing Officer. Especially in times when production sites are at the centre of trade wars, it is of great
advantage for PUMA to have in Anne-Laure Descours an experienced expert who is located in Hong Kong
and who makes the necessary decisions, if needed in coordination with our production partners. One
focus of the Supervisory Board's work was the discussion and decision on the share split, which intended
to make PUMA shares more attractive for all investors.
In the financial year 2019, the Supervisory Board has exercised all its duties under the law, statutes and
company rules. The Supervisory Board has dealt extensively with the status and the development of
PUMA and has regularly advised and supervised the Management Board in its management of the
Company.
In this regard, the Supervisory Board has in its four regular meetings discussed and resolved on the
Company’s business policies, all relevant aspects of corporate development and corporation planning, the
Company’s economic situation, including its net assets, financial position and results of operations, and all
key decisions for the Group. The Management Board has informed the Supervisory Board regularly,
comprehensively, and in a timely manner in written and verbal form about the implementation of all
decisions and about all major business transactions. Furthermore, in 2019 two extraordinary and a
constitutive meeting of the Supervisory Board took place. Urgent matters were decided using electronic
means of communication. All members participated in drawing up the resolutions. Where necessary,
representatives of the shareholders and employees held separate preliminary discussions prior to the
meetings.
Plenary Supervisory Board Attendance at meetings (referring to regular and extraordinary meetings)
Attendance in %
Jean-François Palus 7/7 100 Thore Ohlsson 7/7 100 Héloïse Temple-Boyer (since 18.4.2019) 4/4 100
2
Fiona May (since 18.4.2019) 4/4 100 Jean-Marc Duplaix (until 18.4.2019) 3/3 100 Béatrice Lazat (until 18.4.2019) 3/3 100 Martin Köppel 7/7 100 Bernd Illig 7/7 100
The Supervisory Board discussed in detail all of the Company’s key business transactions, based on the
reports by the Management Board and the committees, and presented its own ideas. The Management
Board has provided the Supervisory Board with detailed information on any deviations of the business
performance from the expected figures, both in writing and orally. The Supervisory Board verified all of
these explanations using the supporting documents, which were always submitted in good time before
the meetings. The Supervisory Board was involved in all key decisions at an early stage. In addition, the
Chairman of the Supervisory Board maintained, and continues to maintain, regular verbal or written
contact with the CEO and keeps himself informed of all major developments. Overall, these discussions
did not give rise to any doubts that the Management Board were managing the Group in anything other
than a lawful and proper manner.
Main advisory focus
In the financial year 2019, the focus was primarily on the following topics: Change in the Management
Board with the resignation of Lars Radoor Sørensen as Chief Operating Officer and appointment of Anne-
Laure Descours as Chief Sourcing Officer, Audit and approval of the 2018 financial statements, setting
the agenda for the Annual General Meeting of April 18, 2019, ongoing business and sales development,
the Group’s financial position, business and budget planning for 2019 and medium-term planning,
including investments, further improvements of the compliance management and the internal control
system as well as material litigation in the Group, proposal to the Annual General Meeting on the election
of Héloïse Temple-Boyer and Fiona May to the Company's Supervisory Board.
As every year, the Personnel Committee and the Supervisory Board set the target achievements for the
variable remuneration of the members Management Board regarding 2018 and decided on the bonus for
the members of the Management Board and the targets for the remuneration of the members of the
Management Board in 2019.
The share split was a central topic of discussion for the Supervisory Board in the first quarter of 2019, as
the price of PUMA shares had risen considerably in recent years and PUMA shares were no longer
affordable for the PUMA consumer. The share split was intended to bring the shares closer to other
stocks in the MDAX and make the shares more attractive to a broader investing public.
Conflicts of interest
The members of the Supervisory Board are required to disclose any conflicts of interest immediately. In
the past year, no such disclosures were made.
3
Committees
The Supervisory Board has established three committees to perform its duties: The Personnel Committee,
the Audit Committee and the Nominating Committee. The Personnel Committee and the Nominating
Committee each comprise two shareholder representatives and one employee representative. The
Nominating Committee is composed only of shareholder representatives. The composition of the
committees can be found in the notes to the consolidated financial statements. The Supervisory Board
receives regular reports on their work.
Personnel Committee
The Personnel Committee has the task of preparing the conclusion and amendment of employment
contracts with the members of the Management Board and establishing policies for Human Resources
and personnel development. It met three times in 2019. The discussions focused on proposals for
determining the bonus payments for the members of the Management Board. In addition, the Personnel
Committee dealt with the definition of the targets for 2019 and discussed the personnel composition of
the Management Board. The Supervisory Board was given corresponding recommendations for
resolution.
Audit Committee
The Audit Committee held four regular meetings in financial year 2019. In particular, the Audit
Committee is responsible for the annual and consolidated financial statements, the quarterly reports and
the half-yearly financial report, accounting issues and monitoring the accounting process, the
effectiveness of the internal control system, risk management and the risk management system, internal
audits, compliance management and the statutory audit of the financial statements, with particular
regard to the required independence of the statutory auditors, issuing the audit mandate to the statutory
auditors, defining the audit areas of focus, any additional services to be performed by the auditors and
the fee agreement. In addition, heads of Group functions were available for reports and questions on
individual agenda items at committee meetings.
Nominating Committee
The Nominating Committee has the task of proposing suitable candidates to the Supervisory Board for its
election proposals to the Annual General Meeting. It held one meeting in the past fiscal year. The
Nominating Committee recommended that the Supervisory Board propose to the Annual General Meeting
on April 18, 2019 that Ms. Héloïse Temple-Boyer (Group Managing Director of Artemis S.A.S.,
Paris/France) and Ms. Fiona May (Independent Management Consultant, Calenzano/Italy) be proposed
for election to the Supervisory Board.
4
Corporate Governance
As in previous years, the Supervisory Board addressed current developments in the German Corporate
Governance Code (GCGC) in the financial year 2019. The GCGC contains essential statutory regulations
and recommendations for the management and supervision of listed companies and standards for
responsible corporate governance. The corporate governance standards have long been a part of the
corporate routine.
Pursuant to Paragraph 3.10 of the GCGC, the Supervisory Board reports on corporate governance in the
Corporate Governance Report. With very few exceptions, the Company satisfies the requirements of the
GCGC and explains these system-related exceptions in the Statement of Compliance. The Statement of
Compliance of November 9, 2019 is available to our shareholders at any time on the Company’s website
under http://about.puma.com/en/investor-relations/corporate-governance/declaration-of-compliance/.
Annual financial statements adopted
The annual financial statements for PUMA SE prepared by the Management Board in accordance with
German Commercial Code (Handelsgesetzbuch/HGB), the consolidated financial statements and the
combined management report for PUMA SE and the PUMA Group, each for the financial year 2019,
prepared in accordance with Section 315a HGB on the basis of the International Financial Reporting
Standards (IFRS) have been audited by the statutory auditors, Deloitte GmbH
Wirtschaftsprüfungsgesellschaft, Munich, who were appointed at the Annual General Meeting on April 18,
2019 and commissioned by the Supervisory Board to audit the annual financial statements and the
consolidated financial statements and have been given an unqualified auditor’s opinion.
In their report, the statutory auditors conclude that PUMA’s institutionalized risk management system, in
accordance with Section 91(2) of the German Stock Corporation Act (Aktiengesetz/AktG), is capable of
detecting at an early stage and countering any developments that might jeopardize the continuity of the
Company as a going concern. The Supervisory Board has been updated by the Management Board
regularly on all relevant risks in this regard, in particular their assessments of market and procurement
risks, financial risks (including currency risks) and organizational risks.
The accounting records, the audit reports from the statutory auditors and the Management Board’s and
Supervisory Board’s recommendation on the appropriation of net profit were made available to all
members of the Supervisory Board in a timely manner. At the meeting of the Audit Committee on
February 18, 2020 and at the subsequent Supervisory Board meeting held on the same day, the statutory
auditors reported on the key results of their audit and discussed them in detail with the Management
Board and the members of the Supervisory Board. No discrepancies were detected.
5
The Supervisory Board reviewed in detail the annual financial statements, the combined management
report for PUMA SE and the PUMA Group, the Management Board’s and the Supervisory Board’s
recommendation on the appropriation of net profit and the consolidated financial statements and raised
no objections. In accordance with the recommendation of the Audit Committee, the Supervisory Board
agreed with the results of the audit of both statements and approved the annual financial statements of
PUMA SE and the consolidated financial statements for the 2019 financial year. The 2019 annual financial
statements have thus been adopted.
The Management Board and the Supervisory Board resolved to propose to the Annual General Meeting a
distribution of a dividend of € 0.50 per dividend entitled share for the financial year 2019. In this context,
the liquidity situation of the Company, the financing and the effects on the capital market were
discussed. A total amount of around € 74.8 million will be paid out in dividends from PUMA SE’s retained
earnings. The remaining retained earnings of around € 85.9 million will be carried forward.
Finally, in its meeting on February 18, 2020, the Supervisory Board was presented the first draft of the
non-financial report in accordance with §§ 315c in conjunction with §§ 289c to 289e of the German
Commercial Code (HGB) and the state of data collection was discussed. As soon as the non-financial
report is finalised, it will be submitted to the Supervisory Board for approval and will be published on the
website of the Company by April 30, 2020.
Personnel changes in the Supervisory Board
Mr. Jean-Marc Duplaix (Chief Financial Officer (CFO) of Kering S.A., Paris/France) and Ms. Béatrice Lazat
(Human Resources Director, Kering S.A., Paris, France) each resigned from their positions as members of
the Supervisory Board of PUMA SE effective April 18, 2019. On April 18, 2019, the Annual General
Meeting elected Ms. Héloïse Temple-Boyer (Group Managing Director of Artemis S.A.S., Paris, France)
and Ms. Fiona May (Independent Management Consultant, Calenzano/Italy) as members of the
Supervisory Board of PUMA SE. Their term of office ends - as those of the other members of the
Supervisory Board - at the end of the Annual General Meeting which decides on the discharge for the
fiscal year 2022.
Personnel changes in the Management Board
Mr. Lars Radoor Sørensen resigned from his office as member of the Management Board of PUMA SE
with effect from January 31, 2019. Mr. Radoor Sørensen's successor for IT and Logistics was Mr. Michael
Lämmermann, CFO of PUMA SE, with effect from February 1, 2019. Ms. Anne-Laure Descours was
appointed as Mr. Radoor Sørensen's successor for the Sourcing division with effect from February 1,
2019.
We would like to express our sincere thanks to all departing members of the Supervisory Board and
Management Board for their work.
6
Thanks
We would like to express our gratitude and recognition to the Management Board, the management
teams at the Group companies, the Works Council and all our employees for their hard work and their
outstanding cooperation in 2019.
Herzogenaurach, February 18, 2020
On behalf of the Supervisory Board
Jean-François Palus
Chairman