Project rashmi steel
40
4Q 2012 and FY 2012 Results 6 February 2013 Lakshmi N Mittal, Chairman and Chief Executive Officer Aditya Mittal, Chief Financial Officer
-
Upload
ranadeep-poddar -
Category
Business
-
view
68 -
download
3
Transcript of Project rashmi steel
4Q 2012 and FY 2012 Results
6 February 2013
Lakshmi N Mittal, Chairman and Chief Executive Officer
Aditya Mittal, Chief Financial Officer
1
Disclaimer
Forward-Looking Statements
This document may contain forward-looking information and statements about
ArcelorMittal and its subsidiaries. These statements include financial projections and estimates
and their underlying assumptions, statements regarding plans, objectives and expectations with
respect to future operations, products and services, and statements regarding future performance.
Forward-looking statements may be identified by the words “believe,” “expect,” “anticipate,”
“target” or similar expressions. Although ArcelorMittal’s management believes that the
expectations reflected in such forward-looking statements are reasonable, investors and holders
of ArcelorMittal’s securities are cautioned that forward-looking information and statements are
subject to numerous risks and uncertainties, many of which are difficult to predict and generally
beyond the control of ArcelorMittal, that could cause actual results and developments to differ
materially and adversely from those expressed in, or implied or projected by, the forward-looking
information and statements. These risks and uncertainties include those discussed or identified in
the filings with the Luxembourg Stock Market Authority for the Financial Markets (Commission de
Surveillance du Secteur Financier) and the United States Securities and Exchange Commission
(the “SEC”) made or to be made by ArcelorMittal, including ArcelorMittal’s Annual Report on Form
20-F for the year ended December 31, 2011 filed with the SEC. ArcelorMittal undertakes no
obligation to publicly update its forward-looking statements, whether as a result of new
information, future events, or otherwise.
2
Agenda
• Results overview and recent developments
• Market outlook
• Results analysis
• Outlook and guidance
3
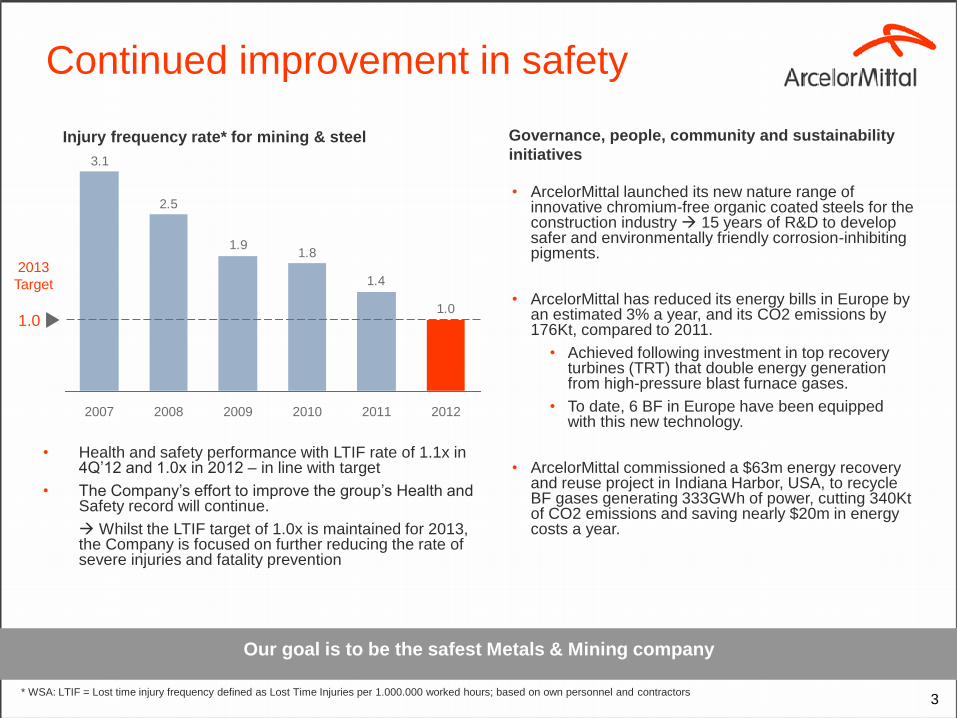
Continued improvement in safety
* WSA: LTIF = Lost time injury frequency defined as Lost Time Injuries per 1.000.000 worked hours; based on own personnel and contractors
Our goal is to be the safest Metals & Mining company
Governance, people, community and sustainability
initiatives
• ArcelorMittal launched its new nature range of innovative chromium-free organic coated steels for the construction industry 15 years of R&D to develop safer and environmentally friendly corrosion-inhibiting pigments.
• ArcelorMittal has reduced its energy bills in Europe by an estimated 3% a year, and its CO2 emissions by 176Kt, compared to 2011.
• Achieved following investment in top recovery turbines (TRT) that double energy generation from high-pressure blast furnace gases.
• To date, 6 BF in Europe have been equipped with this new technology.
• ArcelorMittal commissioned a $63m energy recovery and reuse project in Indiana Harbor, USA, to recycle BF gases generating 333GWh of power, cutting 340Kt of CO2 emissions and saving nearly $20m in energy costs a year.
Injury frequency rate* for mining & steel
1.0
1.4
1.81.9
2.5
3.1
1.0
2012 2011 2010 2009 2008 2007
2013
Target
• Health and safety performance with LTIF rate of 1.1x in 4Q’12 and 1.0x in 2012 – in line with target
• The Company’s effort to improve the group’s Health and Safety record will continue.
Whilst the LTIF target of 1.0x is maintained for 2013, the Company is focused on further reducing the rate of severe injuries and fatality prevention
4
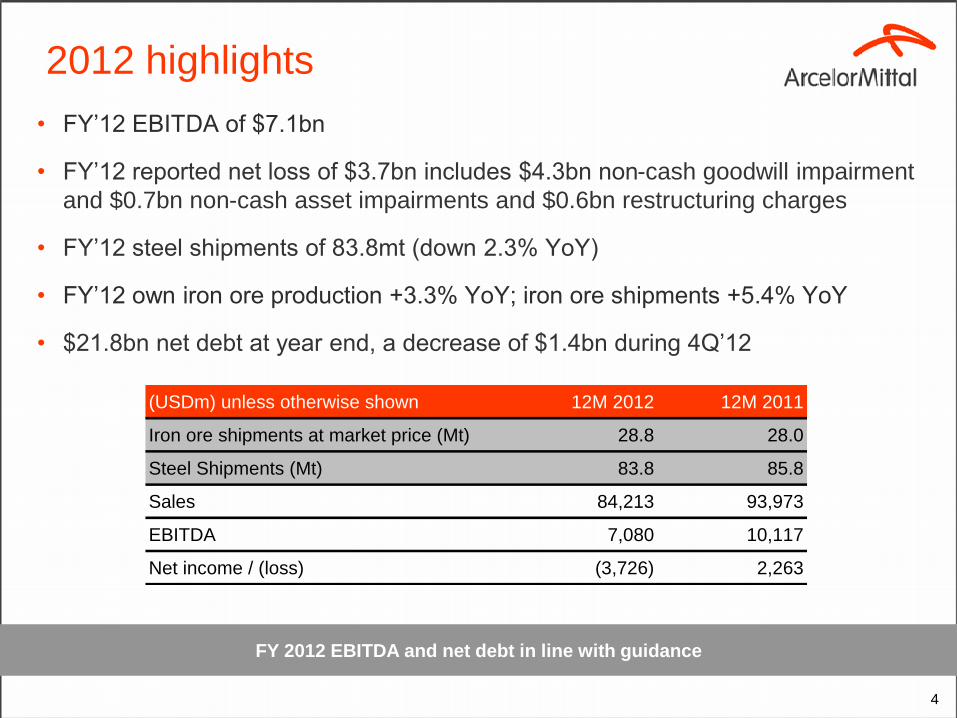
2012 highlights
• FY’12 EBITDA of $7.1bn
• FY’12 reported net loss of $3.7bn includes $4.3bn non-cash goodwill impairment
and $0.7bn non-cash asset impairments and $0.6bn restructuring charges
• FY’12 steel shipments of 83.8mt (down 2.3% YoY)
• FY’12 own iron ore production +3.3% YoY; iron ore shipments +5.4% YoY
• $21.8bn net debt at year end, a decrease of $1.4bn during 4Q’12
FY 2012 EBITDA and net debt in line with guidance
(USDm) unless otherwise shown 12M 2012 12M 2011
Iron ore shipments at market price (Mt) 28.8 28.0
Steel Shipments (Mt) 83.8 85.8
Sales 84,213 93,973
EBITDA 7,080 10,117
Net income / (loss) (3,726) 2,263
5
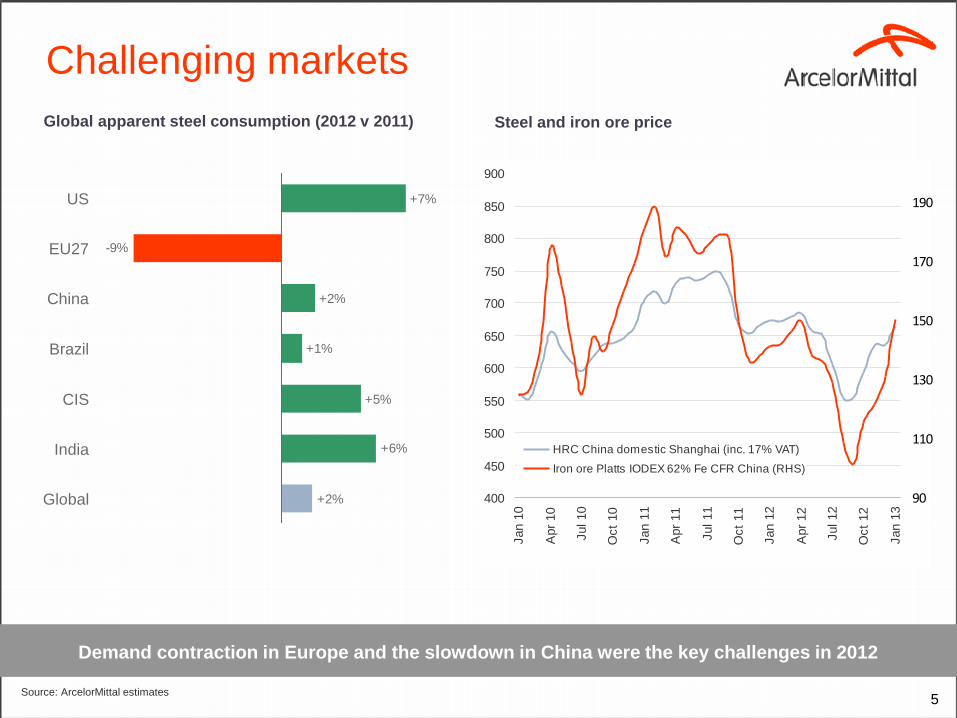
Challenging markets
1H
1,354 1,336
2,449 1,972
1,714
Global apparent steel consumption (2012 v 2011) Steel and iron ore price
+7%
+2%
+1%
+2%
+6%
+5%
-9%
CIS
Brazil
China
EU27
US
Global
India
Demand contraction in Europe and the slowdown in China were the key challenges in 2012
Source: ArcelorMittal estimates
400
450
500
550
600
650
700
750
800
850
900
Jan 1
0
Apr
10
Jul 10
Oct
10
Jan 1
1
Apr
11
Jul 11
Oct
11
Jan 1
2
Apr
12
Jul 12
Oct
12
Jan 1
3
90
110
130
150
170
190
HRC China domestic Shanghai (inc. 17% VAT)
Iron ore Platts IODEX 62% Fe CFR China (RHS)
6
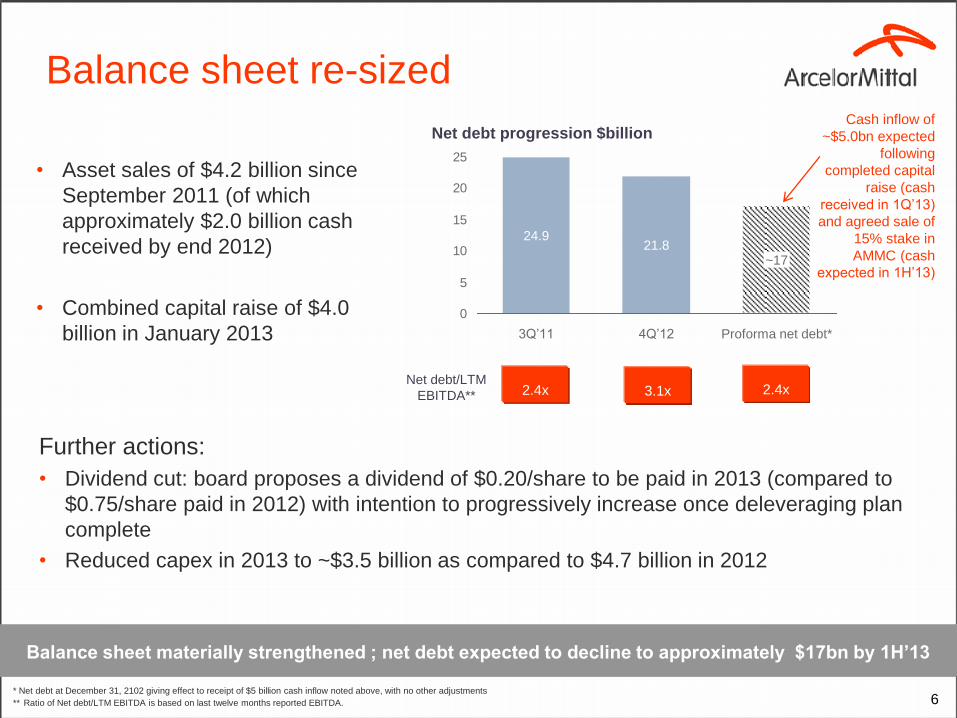
Balance sheet re-sized
• Asset sales of $4.2 billion since
September 2011 (of which
approximately $2.0 billion cash
received by end 2012)
• Combined capital raise of $4.0
billion in January 2013 0
5
10
15
20
25
Proforma net debt*
~17
4Q’12
21.8
3Q’11
24.9
Further actions:
• Dividend cut: board proposes a dividend of $0.20/share to be paid in 2013 (compared to
$0.75/share paid in 2012) with intention to progressively increase once deleveraging plan
complete
• Reduced capex in 2013 to ~$3.5 billion as compared to $4.7 billion in 2012
2.4x Net debt/LTM
EBITDA**
Cash inflow of
~$5.0bn expected
following
completed capital
raise (cash
received in 1Q’13)
and agreed sale of
15% stake in
AMMC (cash
expected in 1H’13)
Net debt progression $billion
3.1x 2.4x
* Net debt at December 31, 2102 giving effect to receipt of $5 billion cash inflow noted above, with no other adjustments
** Ratio of Net debt/LTM EBITDA is based on last twelve months reported EBITDA.
Balance sheet materially strengthened ; net debt expected to decline to approximately $17bn by 1H’13
7
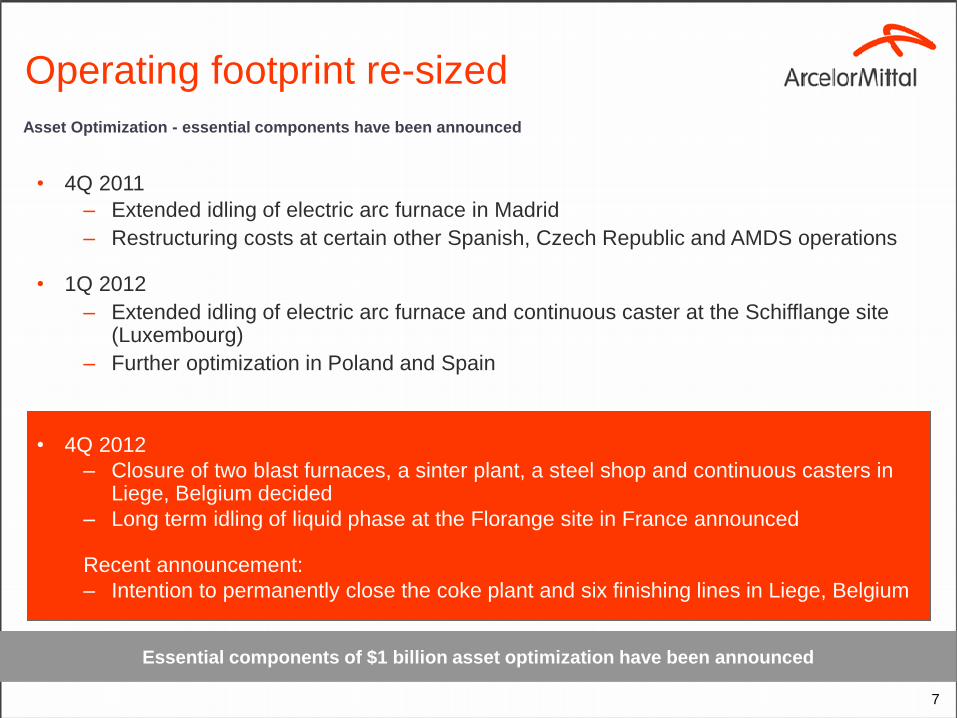
Operating footprint re-sized
Essential components of $1 billion asset optimization have been announced
Asset Optimization - essential components have been announced
• 4Q 2011
– Extended idling of electric arc furnace in Madrid
– Restructuring costs at certain other Spanish, Czech Republic and AMDS operations
• 1Q 2012
– Extended idling of electric arc furnace and continuous caster at the Schifflange site (Luxembourg)
– Further optimization in Poland and Spain
• 4Q 2012
– Closure of two blast furnaces, a sinter plant, a steel shop and continuous casters in Liege, Belgium decided
– Long term idling of liquid phase at the Florange site in France announced
Recent announcement:
– Intention to permanently close the coke plant and six finishing lines in Liege, Belgium
8
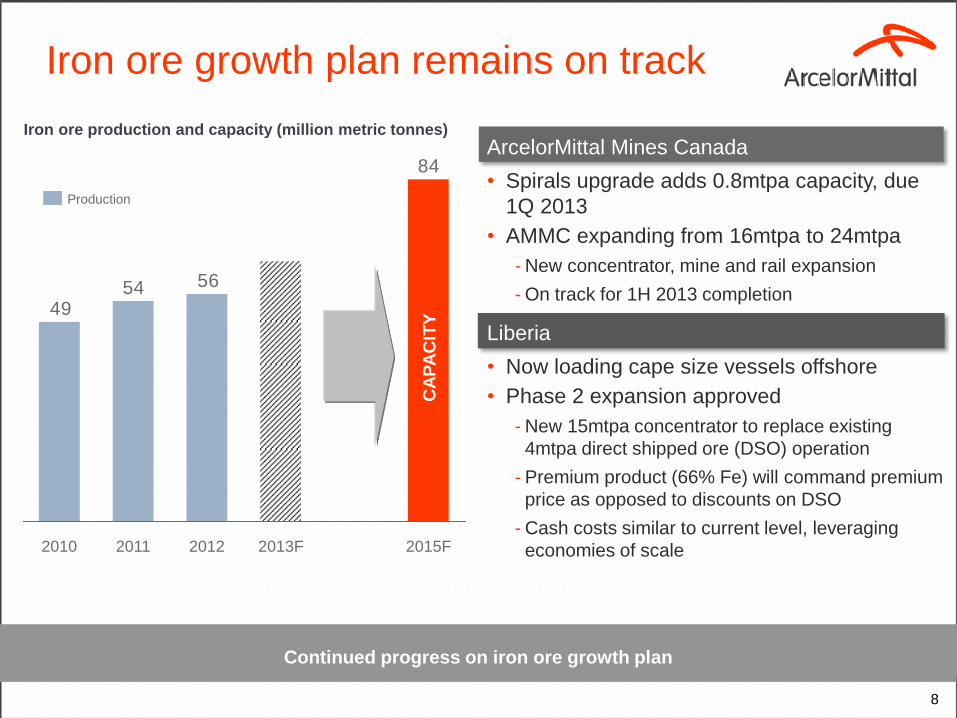
Iron ore growth plan remains on track
Iron ore production and capacity (million metric tonnes)
ArcelorMittal Mines Canada
• Spirals upgrade adds 0.8mtpa capacity, due
1Q 2013
• AMMC expanding from 16mtpa to 24mtpa
- New concentrator, mine and rail expansion
- On track for 1H 2013 completion
Liberia
• Now loading cape size vessels offshore
• Phase 2 expansion approved
- New 15mtpa concentrator to replace existing
4mtpa direct shipped ore (DSO) operation
- Premium product (66% Fe) will command premium
price as opposed to discounts on DSO
- Cash costs similar to current level, leveraging
economies of scale
84
565449
2015F 2010 2013F 2012 2011
Production
CA
PA
CIT
Y
Continued progress on iron ore growth plan
9
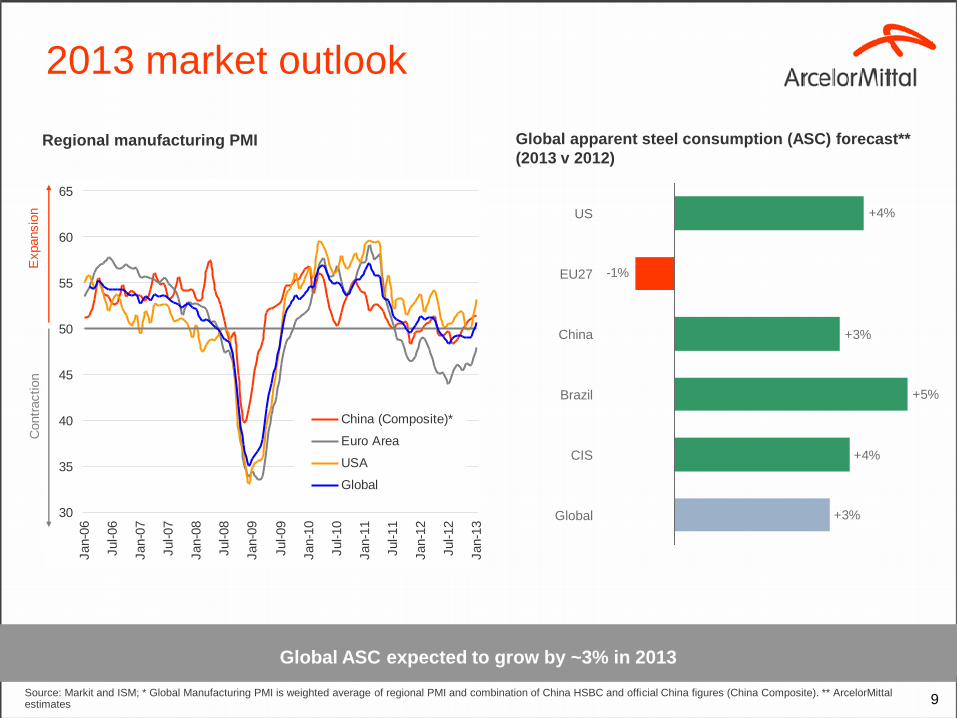
2013 market outlook
Regional manufacturing PMI Global apparent steel consumption (ASC) forecast**
(2013 v 2012)
+4%
+3%
+5%
+3%
-1%
+4%
Global
CIS
Brazil
China
EU27
US
Global ASC expected to grow by ~3% in 2013
Source: Markit and ISM; * Global Manufacturing PMI is weighted average of regional PMI and combination of China HSBC and official China figures (China Composite). ** ArcelorMittal estimates
30
35
40
45
50
55
60
65
Jan-0
6
Jul-06
Jan-0
7
Jul-07
Jan-0
8
Jul-08
Jan-0
9
Jul-09
Jan-1
0
Jul-10
Jan-1
1
Jul-11
Jan-1
2
Jul-12
Jan-1
3
China (Composite)*
Euro Area
USA
Global
Expansio
nC
ontr
action
10
Financial results
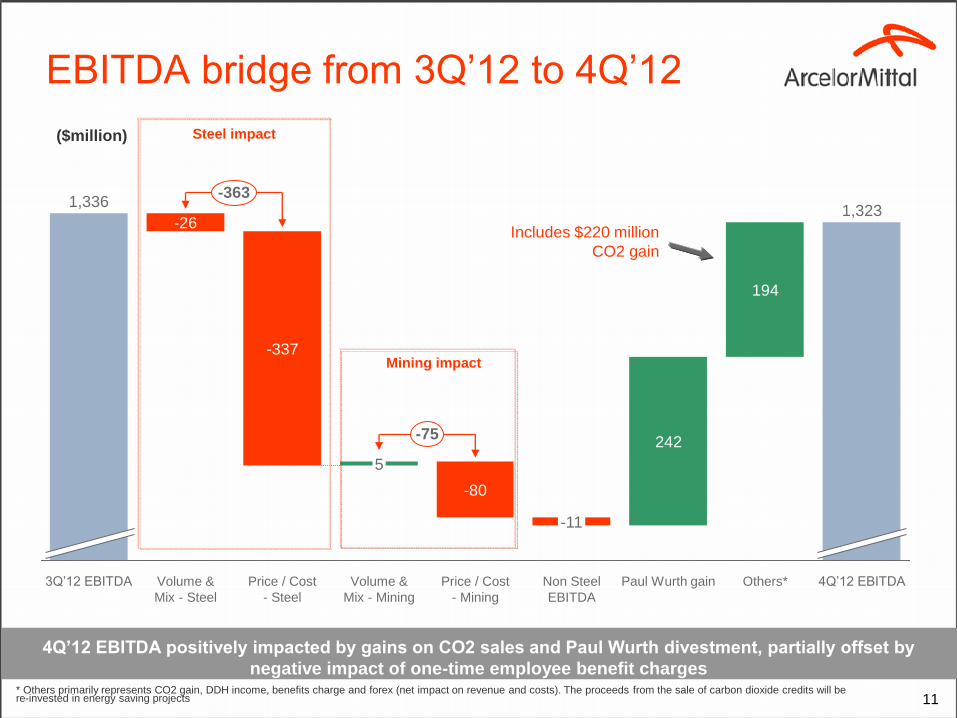
11 * Others primarily represents CO2 gain, DDH income, benefits charge and forex (net impact on revenue and costs). The proceeds from the sale of carbon dioxide credits will be re-invested in energy saving projects
EBITDA bridge from 3Q’12 to 4Q’12
4Q’12 EBITDA positively impacted by gains on CO2 sales and Paul Wurth divestment, partially offset by
negative impact of one-time employee benefit charges
248
753
241
3,413
2,582
61
Q1'11 EBITDA Volume & Mix Selling Price / Cost Non Steel EBITDA* Others** Q2'11 EBITDA
($million)
4Q’12 EBITDA Paul Wurth gain
-75
Others*
-363 1,336
-26
Volume &
Mix - Steel
-80
-11
1,323
242
Price / Cost
- Steel
Price / Cost
- Mining
5
Volume &
Mix - Mining
-337
194
3Q’12 EBITDA Non Steel
EBITDA
Includes $220 million
CO2 gain
Steel impact
Mining impact
3Q 2
012
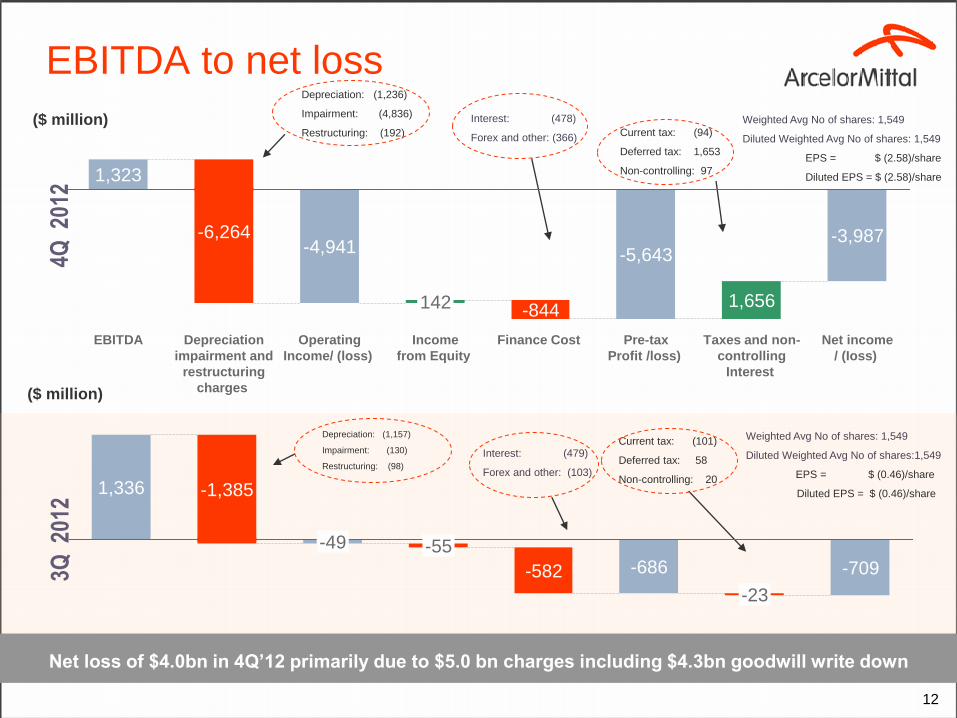
Depreciation: (1,157)
Impairment: (130)
Restructuring: (98)
Interest: (479)
Forex and other: (103)
Current tax: (101)
Deferred tax: 58
Non-controlling: 20
Weighted Avg No of shares: 1,549
Diluted Weighted Avg No of shares:1,549
EPS = $ (0.46)/share
Diluted EPS = $ (0.46)/share
($ million)
12
EBITDA to net loss 4Q
201
2
Depreciation: (1,236)
Impairment: (4,836)
Restructuring: (192)
Current tax: (94)
Deferred tax: 1,653
Non-controlling: 97
Weighted Avg No of shares: 1,549
Diluted Weighted Avg No of shares: 1,549
EPS = $ (2.58)/share
Diluted EPS = $ (2.58)/share
Net loss of $4.0bn in 4Q’12 primarily due to $5.0 bn charges including $4.3bn goodwill write down
($ million) Interest: (478)
Forex and other: (366)
Finance Cost
1,323
Net income
/ (Ioss)
1,656
Pre-tax
Profit /loss)
-3,987
Taxes and non-
controlling
Interest
-5,643
-844
Income
from Equity
142
Operating
Income/ (loss)
-4,941
Depreciation
impairment and
restructuring
charges
-6,264
EBITDA
-709
-23
-686 -582
-55
1,336
-49
-1,385
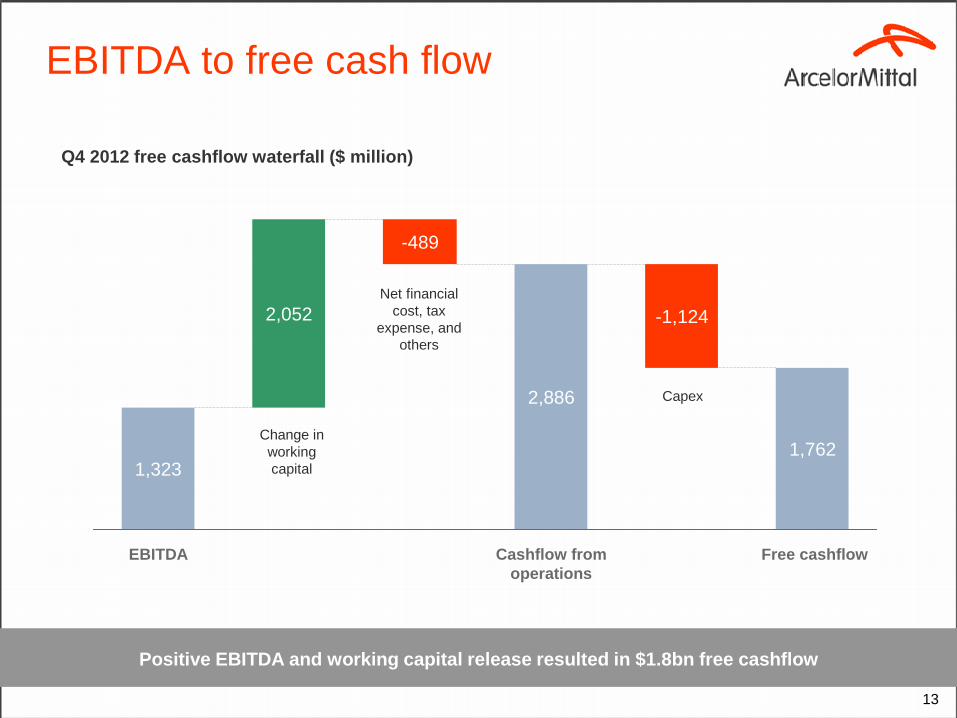
13
EBITDA to free cash flow
Q4 2012 free cashflow waterfall ($ million)
Positive EBITDA and working capital release resulted in $1.8bn free cashflow
1,762
-1,124
2,886
-489
2,052
1,323
Free cashflow Cashflow from
operations
EBITDA
Change in
working
capital
Net financial
cost, tax
expense, and
others
Capex
14
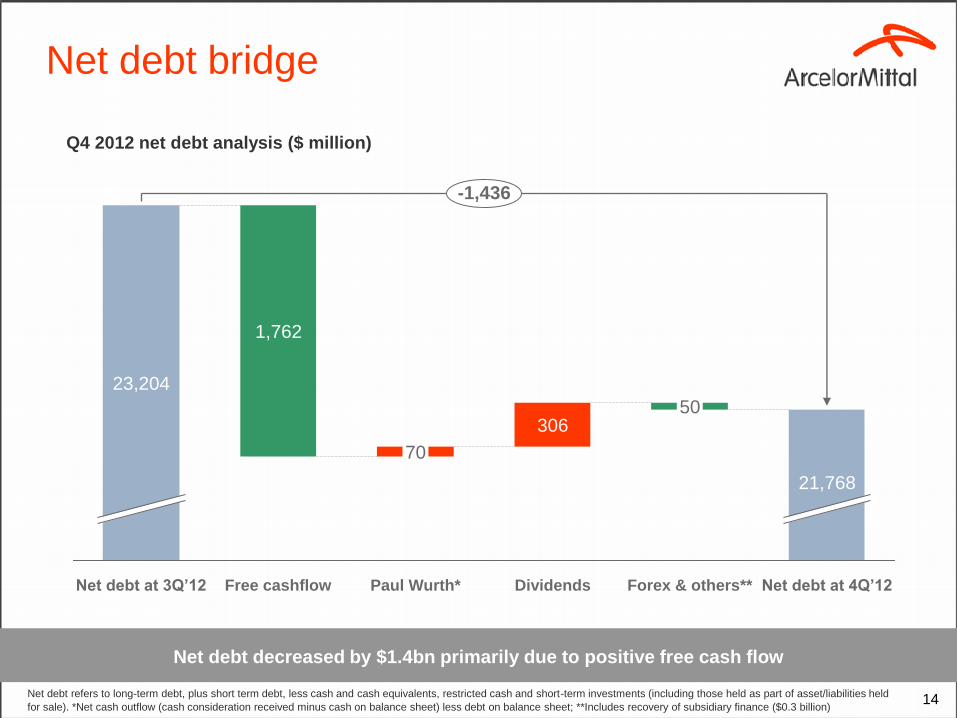
Net debt bridge
Q4 2012 net debt analysis ($ million)
Net debt decreased by $1.4bn primarily due to positive free cash flow
70
Free cashflow
1,762
Net debt at 3Q’12
23,204
306
Paul Wurth*
-1,436
Net debt at 4Q’12
50
21,768
Forex & others** Dividends
Net debt refers to long-term debt, plus short term debt, less cash and cash equivalents, restricted cash and short-term investments (including those held as part of asset/liabilities held
for sale). *Net cash outflow (cash consideration received minus cash on balance sheet) less debt on balance sheet; **Includes recovery of subsidiary finance ($0.3 billion)
15
Outlook and guidance
16
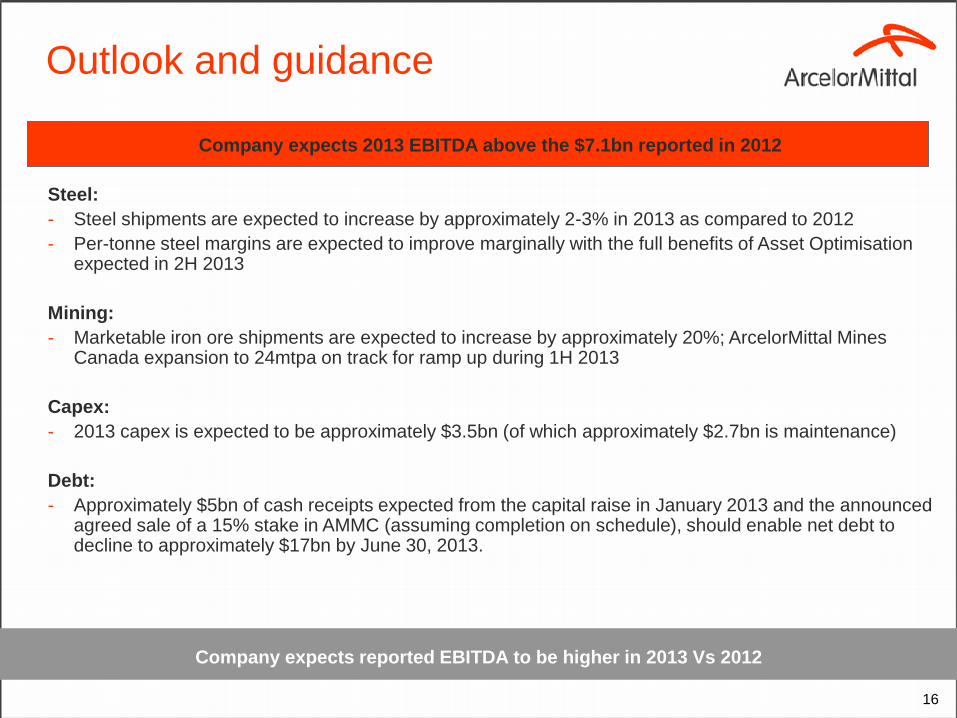
Outlook and guidance
Company expects reported EBITDA to be higher in 2013 Vs 2012
Company expects 2013 EBITDA above the $7.1bn reported in 2012
Steel:
- Steel shipments are expected to increase by approximately 2-3% in 2013 as compared to 2012
- Per-tonne steel margins are expected to improve marginally with the full benefits of Asset Optimisation expected in 2H 2013
Mining:
- Marketable iron ore shipments are expected to increase by approximately 20%; ArcelorMittal Mines Canada expansion to 24mtpa on track for ramp up during 1H 2013
Capex:
- 2013 capex is expected to be approximately $3.5bn (of which approximately $2.7bn is maintenance)
Debt:
- Approximately $5bn of cash receipts expected from the capital raise in January 2013 and the announced agreed sale of a 15% stake in AMMC (assuming completion on schedule), should enable net debt to decline to approximately $17bn by June 30, 2013.
Appendix
18
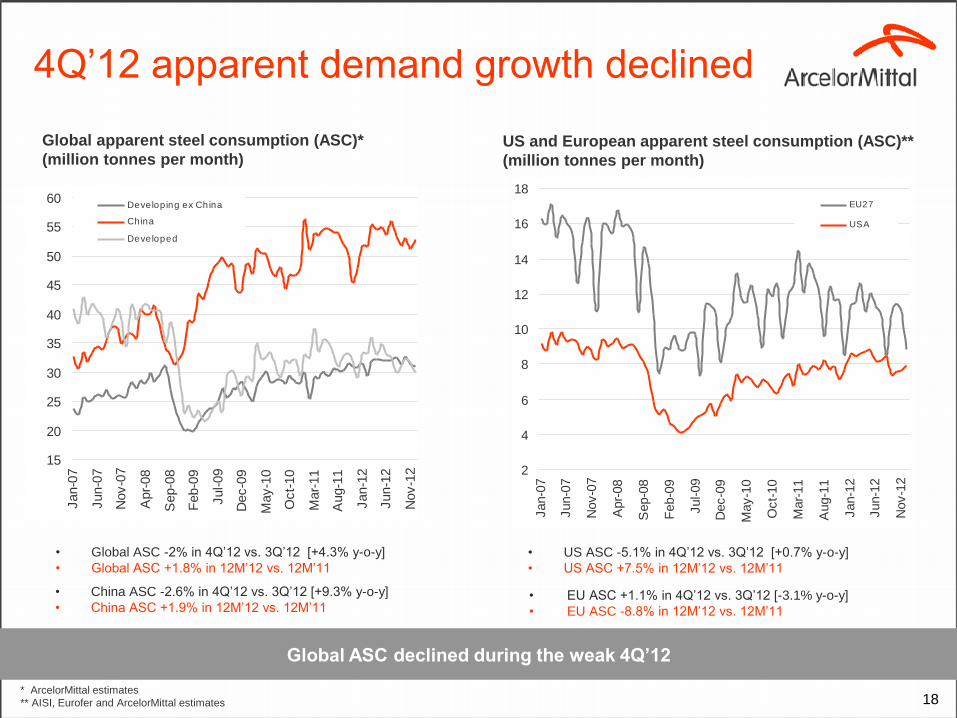
4Q’12 apparent demand growth declined
Global apparent steel consumption (ASC)*
(million tonnes per month) US and European apparent steel consumption (ASC)**
(million tonnes per month)
* ArcelorMittal estimates
** AISI, Eurofer and ArcelorMittal estimates
Global ASC declined during the weak 4Q’12
• China ASC -2.6% in 4Q’12 vs. 3Q’12 [+9.3% y-o-y]
• China ASC +1.9% in 12M’12 vs. 12M’11 • EU ASC +1.1% in 4Q’12 vs. 3Q’12 [-3.1% y-o-y]
• EU ASC -8.8% in 12M’12 vs. 12M’11
• Global ASC -2% in 4Q’12 vs. 3Q’12 [+4.3% y-o-y]
• Global ASC +1.8% in 12M’12 vs. 12M’11
• US ASC -5.1% in 4Q’12 vs. 3Q’12 [+0.7% y-o-y]
• US ASC +7.5% in 12M’12 vs. 12M’11
15
20
25
30
35
40
45
50
55
60
Jan-0
7
Jun-0
7
Nov-0
7
Apr-
08
Sep-0
8
Feb-0
9
Jul-09
Dec-0
9
May-1
0
Oct-
10
Mar-
11
Aug-1
1
Jan-1
2
Jun-1
2
Nov-1
2
Developing ex China
China
Developed
2
4
6
8
10
12
14
16
18
Jan-0
7
Jun-0
7
Nov-0
7
Apr-
08
Sep-0
8
Feb-0
9
Jul-09
Dec-0
9
May-1
0
Oct-
10
Mar-
11
Aug-1
1
Jan-1
2
Jun-1
2
Nov-1
2
EU27
USA
19
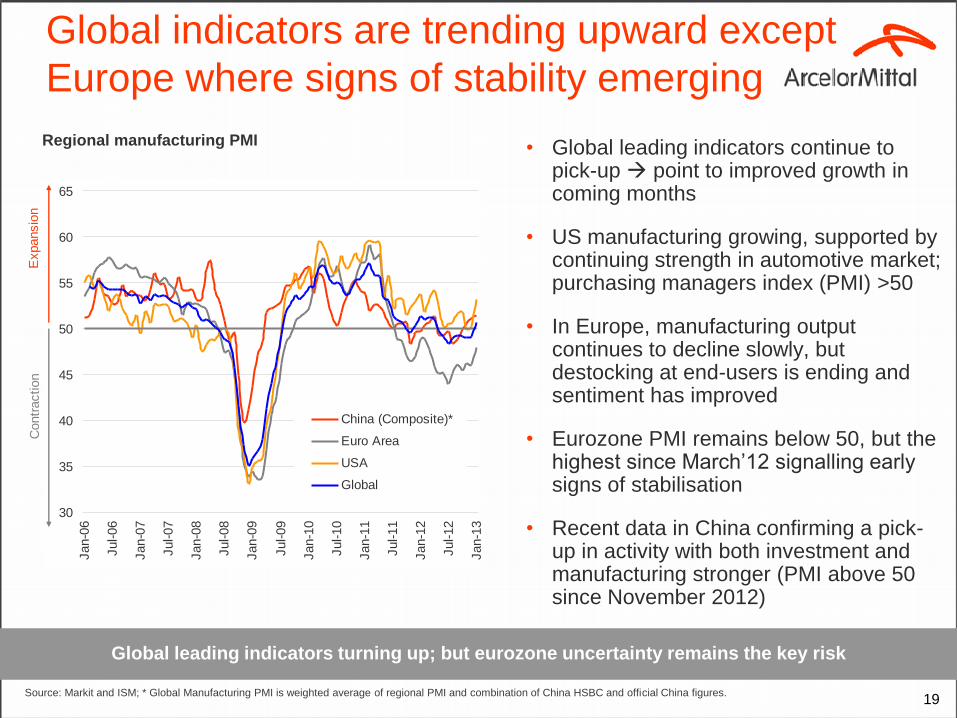
• Global leading indicators continue to pick-up point to improved growth in coming months
• US manufacturing growing, supported by continuing strength in automotive market; purchasing managers index (PMI) >50
• In Europe, manufacturing output continues to decline slowly, but destocking at end-users is ending and sentiment has improved
• Eurozone PMI remains below 50, but the highest since March’12 signalling early signs of stabilisation
• Recent data in China confirming a pick-up in activity with both investment and manufacturing stronger (PMI above 50 since November 2012)
Regional manufacturing PMI
Global leading indicators turning up; but eurozone uncertainty remains the key risk
Global indicators are trending upward except
Europe where signs of stability emerging
Source: Markit and ISM; * Global Manufacturing PMI is weighted average of regional PMI and combination of China HSBC and official China figures.
30
35
40
45
50
55
60
65
Jan-0
6
Jul-06
Jan-0
7
Jul-07
Jan-0
8
Jul-08
Jan-0
9
Jul-09
Jan-1
0
Jul-10
Jan-1
1
Jul-11
Jan-1
2
Jul-12
Jan-1
3
China (Composite)*
Euro Area
USA
Global
Expansio
nC
ontr
action
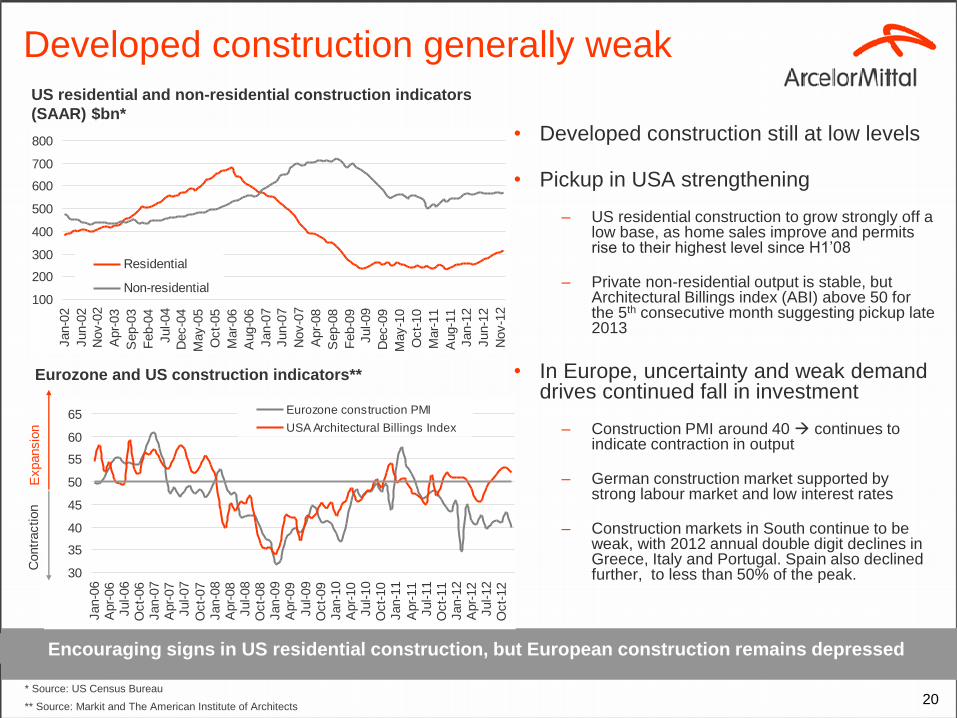
Developed construction generally weak
• Developed construction still at low levels
• Pickup in USA strengthening
– US residential construction to grow strongly off a low base, as home sales improve and permits rise to their highest level since H1’08
– Private non-residential output is stable, but Architectural Billings index (ABI) above 50 for the 5th consecutive month suggesting pickup late 2013
• In Europe, uncertainty and weak demand drives continued fall in investment
– Construction PMI around 40 continues to indicate contraction in output
– German construction market supported by strong labour market and low interest rates
– Construction markets in South continue to be weak, with 2012 annual double digit declines in Greece, Italy and Portugal. Spain also declined further, to less than 50% of the peak.
Eurozone and US construction indicators**
US residential and non-residential construction indicators
(SAAR) $bn*
Encouraging signs in US residential construction, but European construction remains depressed
20 * Source: US Census Bureau
** Source: Markit and The American Institute of Architects
100
200
300
400
500
600
700
800
Jan-0
2
Jun-0
2
Nov-0
2
Apr-
03
Sep-0
3
Feb-0
4
Jul-04
Dec-0
4
May-0
5
Oct-
05
Mar-
06
Aug-0
6
Jan-0
7
Jun-0
7
Nov-0
7
Apr-
08
Sep-0
8
Feb-0
9
Jul-09
Dec-0
9
May-1
0
Oct-
10
Mar-
11
Aug-1
1
Jan-1
2
Jun-1
2
Nov-1
2
Residential
Non-residential
Expansio
nC
ontr
action
30
35
40
45
50
55
60
65
Jan-0
6A
pr-
06
Jul-06
Oct-
06
Jan-0
7A
pr-
07
Jul-07
Oct-
07
Jan-0
8A
pr-
08
Jul-08
Oct-
08
Jan-0
9A
pr-
09
Jul-09
Oct-
09
Jan-1
0A
pr-
10
Jul-10
Oct-
10
Jan-1
1
Apr-
11
Jul-11
Oct-
11
Jan-1
2A
pr-
12
Jul-12
Oct-
12
Eurozone construction PMI
USA Architectural Billings Index
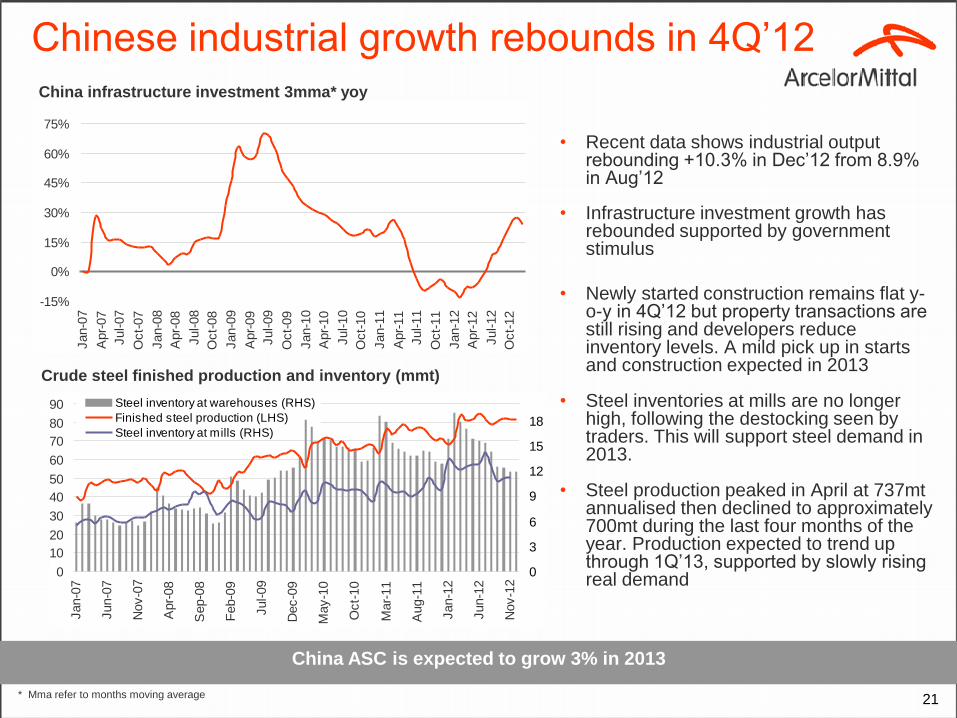
Chinese industrial growth rebounds in 4Q’12
• Recent data shows industrial output rebounding +10.3% in Dec’12 from 8.9% in Aug’12
• Infrastructure investment growth has rebounded supported by government stimulus
• Newly started construction remains flat y-o-y in 4Q’12 but property transactions are still rising and developers reduce inventory levels. A mild pick up in starts and construction expected in 2013
• Steel inventories at mills are no longer high, following the destocking seen by traders. This will support steel demand in 2013.
• Steel production peaked in April at 737mt annualised then declined to approximately 700mt during the last four months of the year. Production expected to trend up through 1Q’13, supported by slowly rising real demand
China ASC is expected to grow 3% in 2013
21
Crude steel finished production and inventory (mmt)
* Mma refer to months moving average
China infrastructure investment 3mma* yoy
0
10
20
30
40
50
60
70
80
90
Jan-0
7
Jun-0
7
Nov-0
7
Apr-
08
Sep-0
8
Feb-0
9
Jul-09
Dec-0
9
May-1
0
Oct-
10
Mar-
11
Aug-1
1
Jan-1
2
Jun-1
2
Nov-1
2
0
3
6
9
12
15
18
Steel inventory at warehouses (RHS)
Finished steel production (LHS)
Steel inventory at mills (RHS)
-15%
0%
15%
30%
45%
60%
75%
Jan-0
7
Apr-
07
Jul-07
Oct-
07
Jan-0
8
Apr-
08
Jul-08
Oct-
08
Jan-0
9
Apr-
09
Jul-09
Oct-
09
Jan-1
0
Apr-
10
Jul-10
Oct-
10
Jan-1
1
Apr-
11
Jul-11
Oct-
11
Jan-1
2
Apr-
12
Jul-12
Oct-
12
1000
1200
1400
1600
1800
2000
2200
2400
Ja
n-0
7
Ju
n-0
7
No
v-0
7
Ap
r-0
8
Se
p-0
8
Fe
b-0
9
Ju
l-0
9
De
c-0
9
Ma
y-1
0
Oct-
10
Ma
r-1
1
Au
g-1
1
Ja
n-1
2
Ju
n-1
2
No
v-1
2
1.6
1.8
2
2.2
2.4
2.6
2.8
3
3.2
3.4
3.6EU (EASSC)
Months Supply
0
2000
4000
6000
8000
10000
12000
14000
Ja
n-0
7
Ju
n-0
7
No
v-0
7
Ap
r-0
8
Se
p-0
8
Fe
b-0
9
Ju
l-0
9
De
c-0
9
Ma
y-1
0
Oct-
10
Ma
r-1
1
Au
g-1
1
Ja
n-1
2
Ju
n-1
2
No
v-1
2
2
2.2
2.4
2.6
2.8
3
3.2
3.4
3.6USA (MSCI)
Months Supply
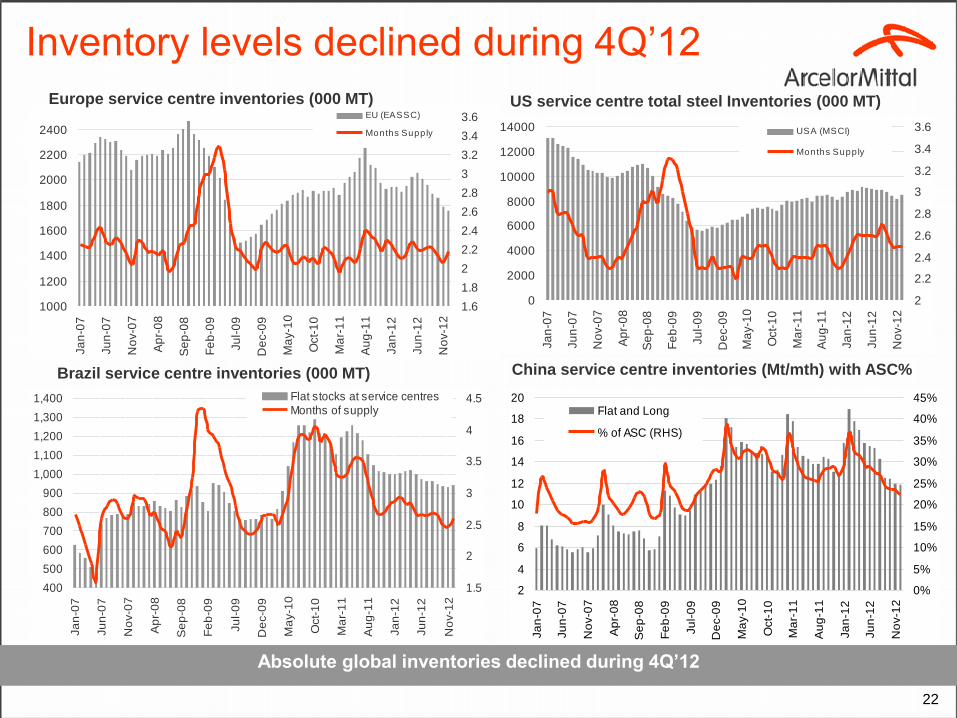
Inventory levels declined during 4Q’12
Europe service centre inventories (000 MT)
Brazil service centre inventories (000 MT)
US service centre total steel Inventories (000 MT)
Absolute global inventories declined during 4Q’12
22
China service centre inventories (Mt/mth) with ASC%
400
500
600
700
800
900
1,000
1,100
1,200
1,300
1,400
Ja
n-0
7
Ju
n-0
7
No
v-0
7
Ap
r-0
8
Se
p-0
8
Fe
b-0
9
Ju
l-0
9
De
c-0
9
Ma
y-1
0
Oct-
10
Ma
r-1
1
Au
g-1
1
Ja
n-1
2
Ju
n-1
2
No
v-1
2
1.5
2
2.5
3
3.5
4
4.5Flat stocks at service centresMonths of supply
2
4
6
8
10
12
14
16
18
20
Ja
n-0
7
Ju
n-0
7
No
v-0
7
Ap
r-0
8
Se
p-0
8
Fe
b-0
9
Ju
l-0
9
De
c-0
9
Ma
y-1
0
Oct-
10
Ma
r-1
1
Au
g-1
1
Ja
n-1
2
Ju
n-1
2
No
v-1
2
0%
5%
10%
15%
20%
25%
30%
35%
40%
45%Flat and Long
% of ASC (RHS)
23
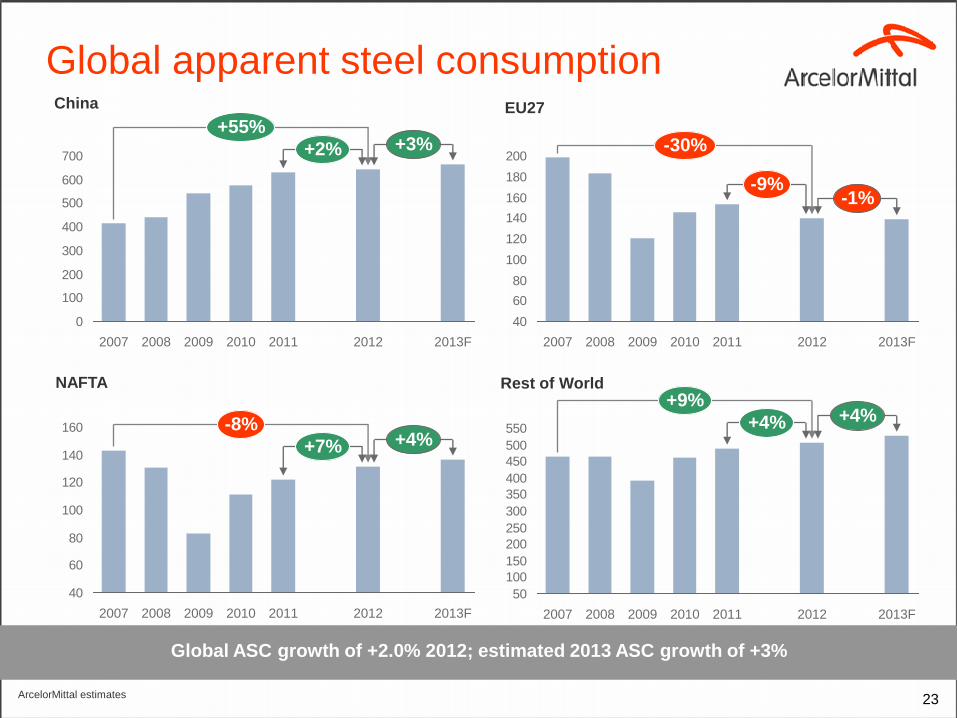
Global apparent steel consumption
Global ASC growth of +2.0% 2012; estimated 2013 ASC growth of +3%
China
NAFTA
EU27
Rest of World
0
100
200
300
400
500
600
700+3%
+55%
2013F 2012 2011 2010 2009 2008 2007
+2%
ArcelorMittal estimates
40
60
80
100
120
140
160
180
200
-9% -1%
-30%
2013F 2012 2011 2010 2009 2008 2007
40
60
80
100
120
140
160+4%
2013F
-8%
+7%
2012 2007 2009 2011 2010 2008
50
100
150
200
250
300
350
400
450
500
550 +4% +4%
2007 2011 2009 2013F 2012 2010
+9%
2008
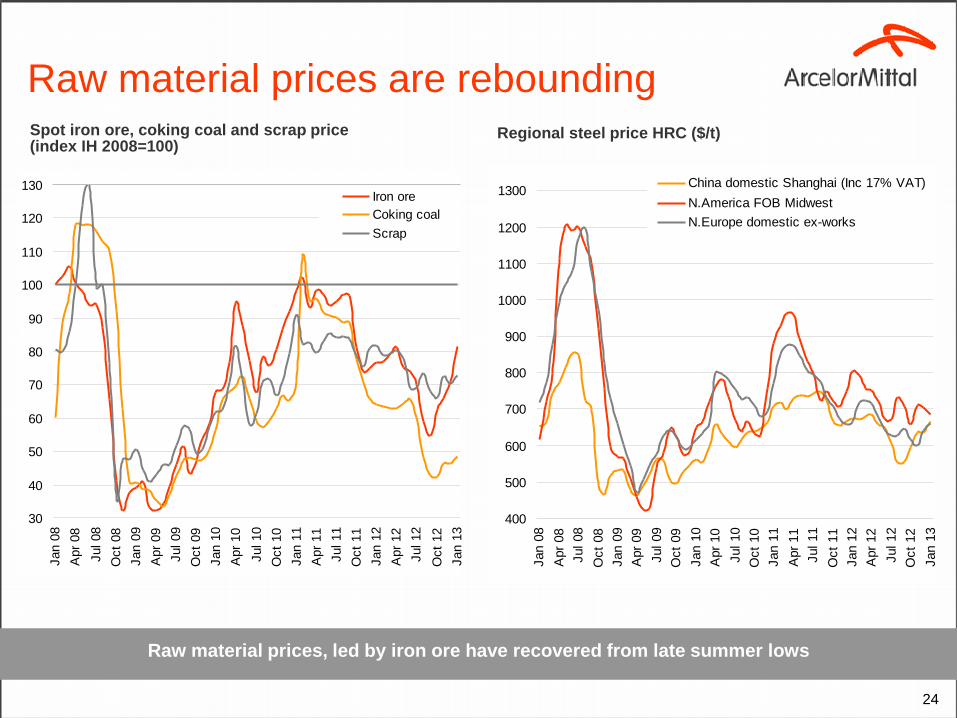
Raw material prices are rebounding Spot iron ore, coking coal and scrap price (index IH 2008=100)
Regional steel price HRC ($/t)
Raw material prices, led by iron ore have recovered from late summer lows
24
400
500
600
700
800
900
1000
1100
1200
1300
Jan 0
8
Apr
08
Jul 08
Oct
08
Jan 0
9
Apr
09
Jul 09
Oct
09
Jan 1
0
Apr
10
Jul 10
Oct
10
Jan 1
1
Apr
11
Jul 11
Oct
11
Jan 1
2
Apr
12
Jul 12
Oct
12
Jan 1
3
China domestic Shanghai (Inc 17% VAT)
N.America FOB Midwest
N.Europe domestic ex-works
30
40
50
60
70
80
90
100
110
120
130
Jan 0
8
Apr
08
Jul 08
Oct
08
Jan 0
9
Apr
09
Jul 09
Oct
09
Jan 1
0
Apr
10
Jul 10
Oct
10
Jan 1
1
Apr
11
Jul 11
Oct
11
Jan 1
2
Apr
12
Jul 12
Oct
12
Jan 1
3
Iron ore
Coking coal
Scrap
25
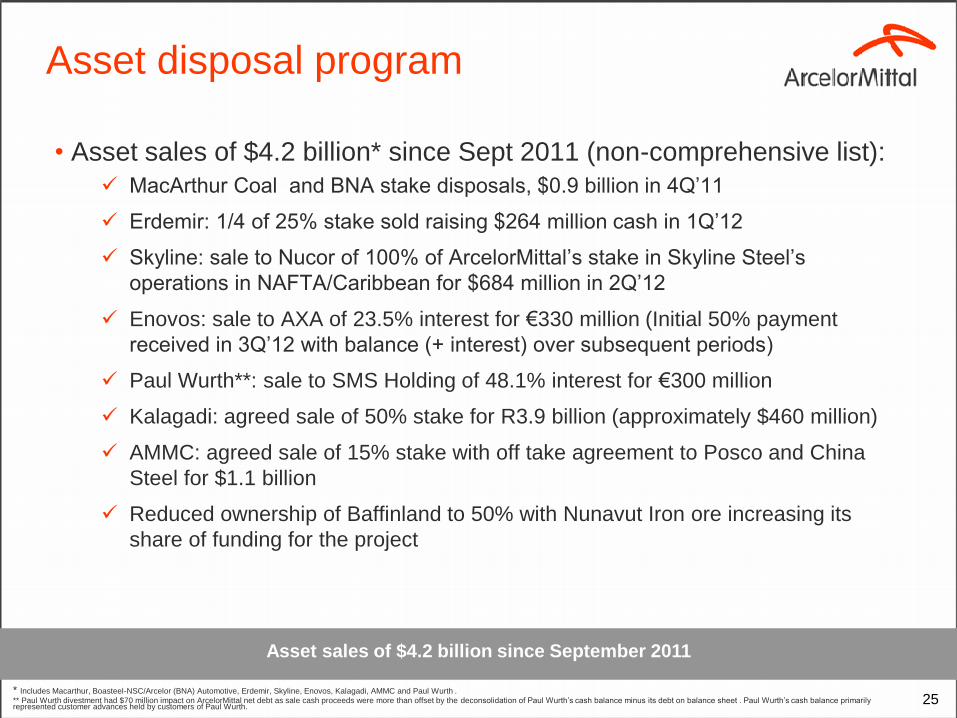
• Asset sales of $4.2 billion* since Sept 2011 (non-comprehensive list):
MacArthur Coal and BNA stake disposals, $0.9 billion in 4Q’11
Erdemir: 1/4 of 25% stake sold raising $264 million cash in 1Q’12
Skyline: sale to Nucor of 100% of ArcelorMittal’s stake in Skyline Steel’s
operations in NAFTA/Caribbean for $684 million in 2Q’12
Enovos: sale to AXA of 23.5% interest for €330 million (Initial 50% payment
received in 3Q’12 with balance (+ interest) over subsequent periods)
Paul Wurth**: sale to SMS Holding of 48.1% interest for €300 million
Kalagadi: agreed sale of 50% stake for R3.9 billion (approximately $460 million)
AMMC: agreed sale of 15% stake with off take agreement to Posco and China
Steel for $1.1 billion
Reduced ownership of Baffinland to 50% with Nunavut Iron ore increasing its
share of funding for the project
Asset sales of $4.2 billion since September 2011
* Includes Macarthur, Boasteel-NSC/Arcelor (BNA) Automotive, Erdemir, Skyline, Enovos, Kalagadi, AMMC and Paul Wurth .
** Paul Wurth divestment had $70 million impact on ArcelorMittal net debt as sale cash proceeds were more than offset by the deconsolidation of Paul Wurth’s cash balance minus its debt on balance sheet . Paul Wurth’s cash balance primarily represented customer advances held by customers of Paul Wurth.
Asset disposal program
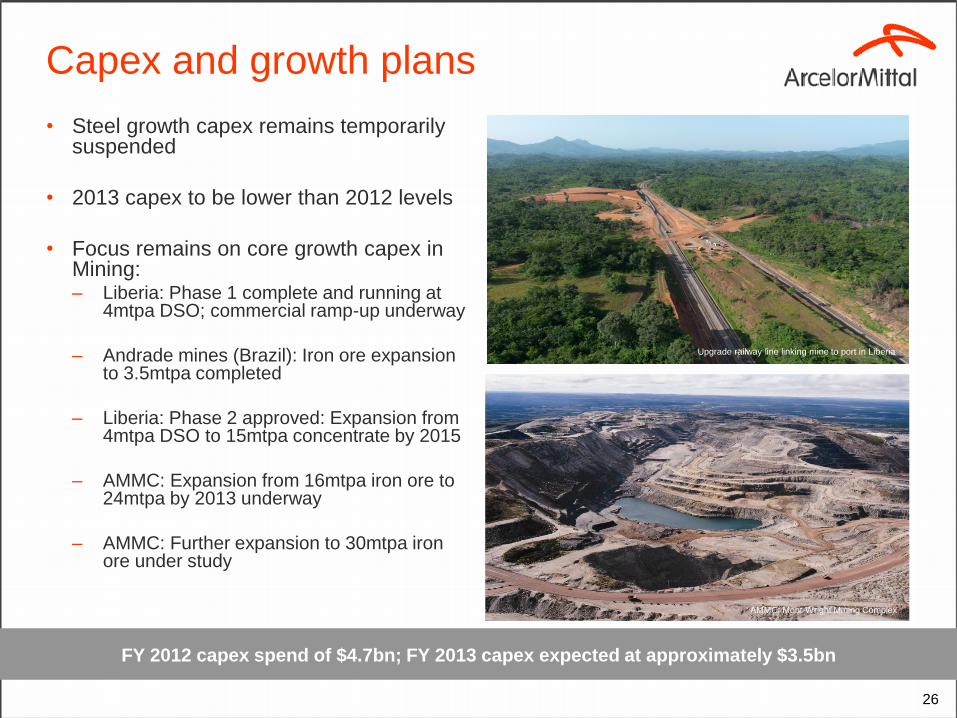
Capex and growth plans
• Steel growth capex remains temporarily suspended
• 2013 capex to be lower than 2012 levels
• Focus remains on core growth capex in Mining: – Liberia: Phase 1 complete and running at
4mtpa DSO; commercial ramp-up underway
– Andrade mines (Brazil): Iron ore expansion to 3.5mtpa completed
– Liberia: Phase 2 approved: Expansion from 4mtpa DSO to 15mtpa concentrate by 2015
– AMMC: Expansion from 16mtpa iron ore to 24mtpa by 2013 underway
– AMMC: Further expansion to 30mtpa iron ore under study
26
FY 2012 capex spend of $4.7bn; FY 2013 capex expected at approximately $3.5bn
Upgrade railway line linking mine to port in Liberia
AMMC: Mont-Wright Mining Complex
27
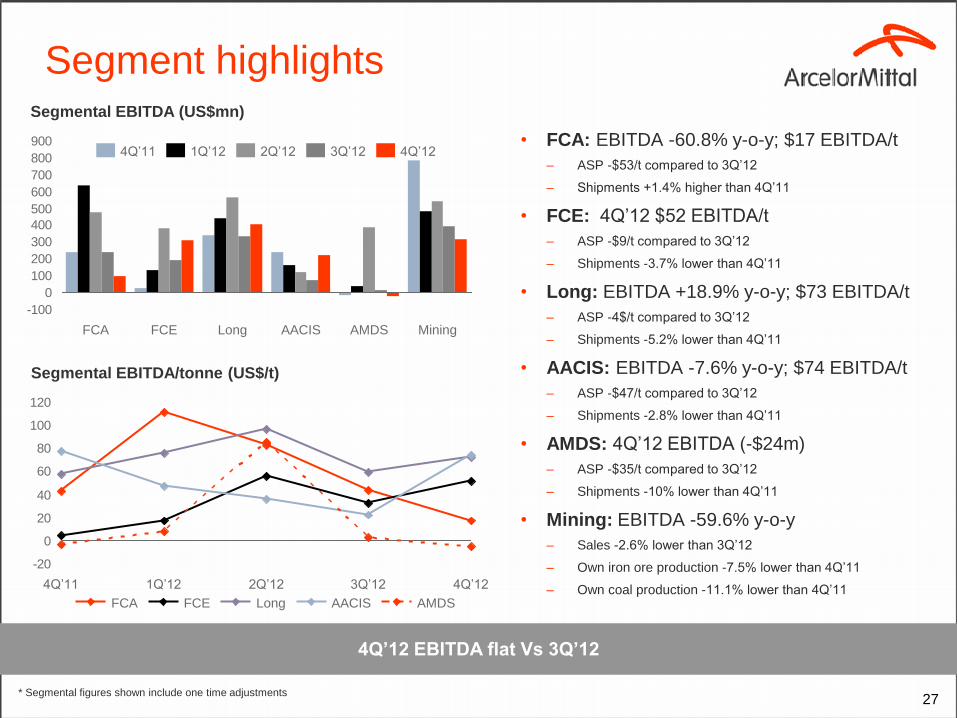
Segment highlights
4Q’12 EBITDA flat Vs 3Q’12
• FCA: EBITDA -60.8% y-o-y; $17 EBITDA/t
– ASP -$53/t compared to 3Q’12
– Shipments +1.4% higher than 4Q’11
• FCE: 4Q’12 $52 EBITDA/t
– ASP -$9/t compared to 3Q’12
– Shipments -3.7% lower than 4Q’11
• Long: EBITDA +18.9% y-o-y; $73 EBITDA/t
– ASP -4$/t compared to 3Q’12
– Shipments -5.2% lower than 4Q’11
• AACIS: EBITDA -7.6% y-o-y; $74 EBITDA/t
– ASP -$47/t compared to 3Q’12
– Shipments -2.8% lower than 4Q’11
• AMDS: 4Q’12 EBITDA (-$24m)
– ASP -$35/t compared to 3Q’12
– Shipments -10% lower than 4Q’11
• Mining: EBITDA -59.6% y-o-y
– Sales -2.6% lower than 3Q’12
– Own iron ore production -7.5% lower than 4Q’11
– Own coal production -11.1% lower than 4Q’11
-100
0
100
200
300
400
500
600
700
800
900
Mining AMDS AACIS Long FCE FCA
4Q’12 3Q’12 2Q’12 1Q’12 4Q’11
Segmental EBITDA (US$mn)
-20
0
20
40
60
80
100
120
4Q’12 3Q’12 2Q’12 1Q’12 4Q’11
AACIS Long FCE AMDS FCA
Segmental EBITDA/tonne (US$/t)
* Segmental figures shown include one time adjustments
28
Flat Carbon Americas (FCA)
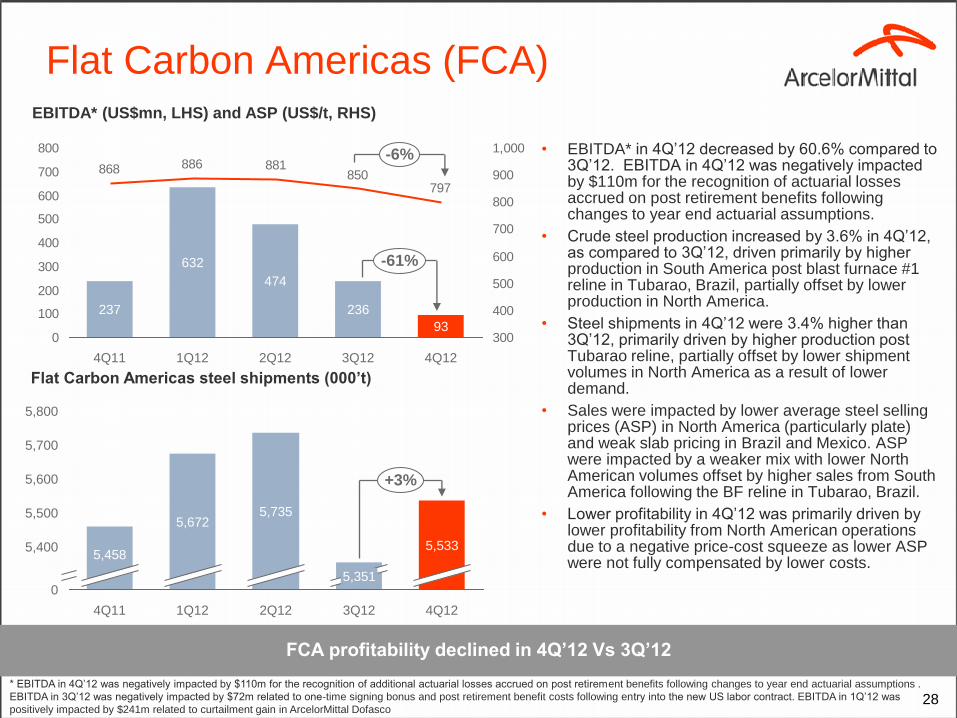
• EBITDA* in 4Q’12 decreased by 60.6% compared to 3Q’12. EBITDA in 4Q’12 was negatively impacted by $110m for the recognition of actuarial losses accrued on post retirement benefits following changes to year end actuarial assumptions.
• Crude steel production increased by 3.6% in 4Q’12, as compared to 3Q’12, driven primarily by higher production in South America post blast furnace #1 reline in Tubarao, Brazil, partially offset by lower production in North America.
• Steel shipments in 4Q’12 were 3.4% higher than 3Q’12, primarily driven by higher production post Tubarao reline, partially offset by lower shipment volumes in North America as a result of lower demand.
• Sales were impacted by lower average steel selling prices (ASP) in North America (particularly plate) and weak slab pricing in Brazil and Mexico. ASP were impacted by a weaker mix with lower North American volumes offset by higher sales from South America following the BF reline in Tubarao, Brazil.
• Lower profitability in 4Q’12 was primarily driven by lower profitability from North American operations due to a negative price-cost squeeze as lower ASP were not fully compensated by lower costs.
FCA profitability declined in 4Q’12 Vs 3Q’12
797850
881886868
0
100
200
300
400
500
600
700
800
300
400
500
600
700
800
900
1,000-6%
-61%
4Q12
93
3Q12
236
2Q12
474
1Q12
632
4Q11
237
5,800
5,700
5,600
5,500
5,400
0
4Q12
5,533
3Q12
5,735
4Q11 2Q12
5,672
+3%
5,351
5,458
1Q12
EBITDA* (US$mn, LHS) and ASP (US$/t, RHS)
Flat Carbon Americas steel shipments (000’t)
* EBITDA in 4Q’12 was negatively impacted by $110m for the recognition of additional actuarial losses accrued on post retirement benefits following changes to year end actuarial assumptions .
EBITDA in 3Q’12 was negatively impacted by $72m related to one-time signing bonus and post retirement benefit costs following entry into the new US labor contract. EBITDA in 1Q’12 was
positively impacted by $241m related to curtailment gain in ArcelorMittal Dofasco
29
Flat Carbon Europe (FCE)
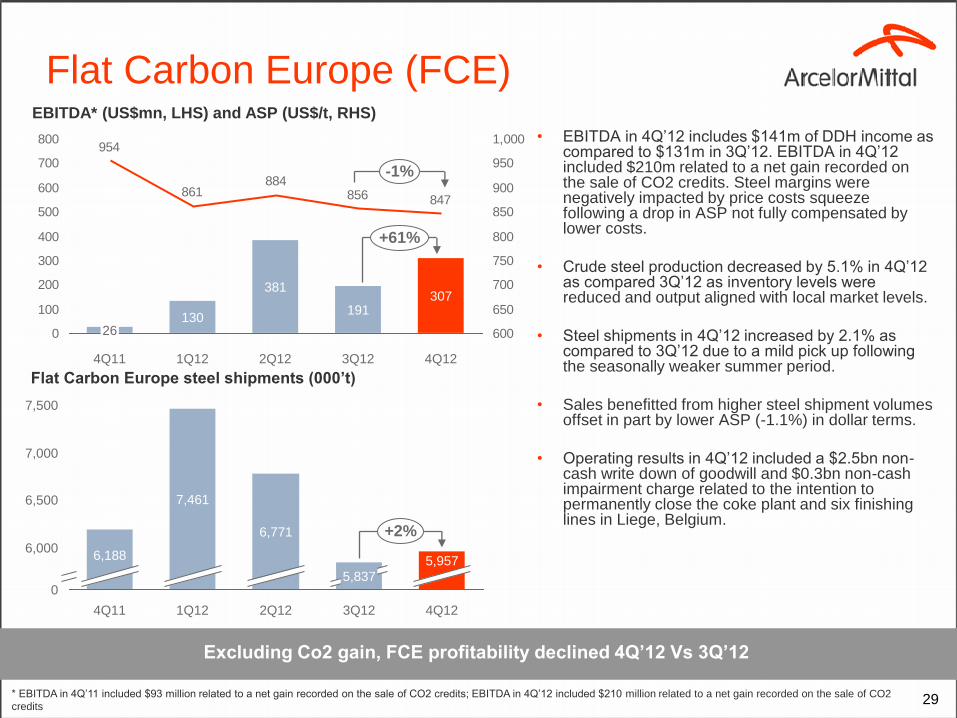
• EBITDA in 4Q’12 includes $141m of DDH income as compared to $131m in 3Q’12. EBITDA in 4Q’12 included $210m related to a net gain recorded on the sale of CO2 credits. Steel margins were negatively impacted by price costs squeeze following a drop in ASP not fully compensated by lower costs.
• Crude steel production decreased by 5.1% in 4Q’12 as compared 3Q’12 as inventory levels were reduced and output aligned with local market levels.
• Steel shipments in 4Q’12 increased by 2.1% as compared to 3Q’12 due to a mild pick up following the seasonally weaker summer period.
• Sales benefitted from higher steel shipment volumes offset in part by lower ASP (-1.1%) in dollar terms.
• Operating results in 4Q’12 included a $2.5bn non-cash write down of goodwill and $0.3bn non-cash impairment charge related to the intention to permanently close the coke plant and six finishing lines in Liege, Belgium.
Excluding Co2 gain, FCE profitability declined 4Q’12 Vs 3Q’12
847856884
861
954
0
100
200
300
400
500
600
700
800
600
650
700
750
800
850
900
950
1,000
-1%
+61%
4Q12
307
3Q12
191
2Q12
381
1Q12
130
4Q11
26
7,500
7,000
6,500
6,000
0
4Q11
7,461
5,837
6,771
1Q12
6,188
2Q12
+2%
4Q12
5,957
3Q12
EBITDA* (US$mn, LHS) and ASP (US$/t, RHS)
Flat Carbon Europe steel shipments (000’t)
* EBITDA in 4Q’11 included $93 million related to a net gain recorded on the sale of CO2 credits; EBITDA in 4Q’12 included $210 million related to a net gain recorded on the sale of CO2
credits
30
Long Carbon Americas & Europe (LCAE)
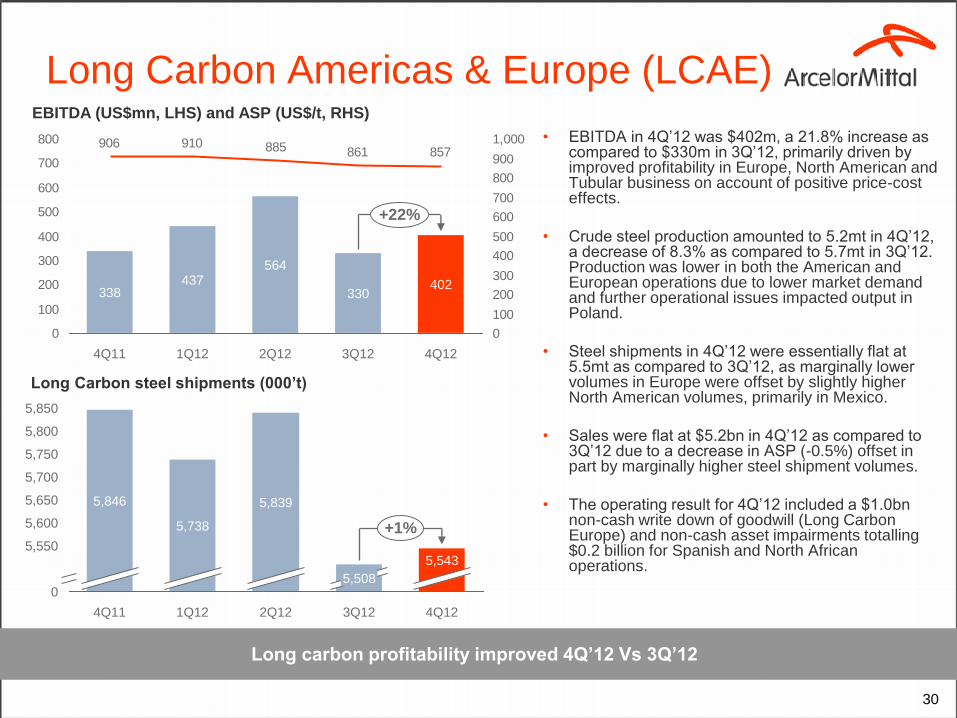
• EBITDA in 4Q’12 was $402m, a 21.8% increase as compared to $330m in 3Q’12, primarily driven by improved profitability in Europe, North American and Tubular business on account of positive price-cost effects.
• Crude steel production amounted to 5.2mt in 4Q’12, a decrease of 8.3% as compared to 5.7mt in 3Q’12. Production was lower in both the American and European operations due to lower market demand and further operational issues impacted output in Poland.
• Steel shipments in 4Q’12 were essentially flat at 5.5mt as compared to 3Q’12, as marginally lower volumes in Europe were offset by slightly higher North American volumes, primarily in Mexico.
• Sales were flat at $5.2bn in 4Q’12 as compared to 3Q’12 due to a decrease in ASP (-0.5%) offset in part by marginally higher steel shipment volumes.
• The operating result for 4Q’12 included a $1.0bn non-cash write down of goodwill (Long Carbon Europe) and non-cash asset impairments totalling $0.2 billion for Spanish and North African operations.
Long carbon profitability improved 4Q’12 Vs 3Q’12
0
5,600
5,650
5,700
5,750
5,850
5,800
5,550
+1%
4Q12
5,543
2Q12
5,846
4Q11
5,738
1Q12
5,839
5,508
3Q12
EBITDA (US$mn, LHS) and ASP (US$/t, RHS)
Long Carbon steel shipments (000’t)
857861885910906
0
100
200
300
400
500
600
700
800
0
100
200
300
400
500
600
700
800
900
1,000
437
4Q11
338
+22%
4Q12
402
3Q12
330
2Q12
564
1Q12
31
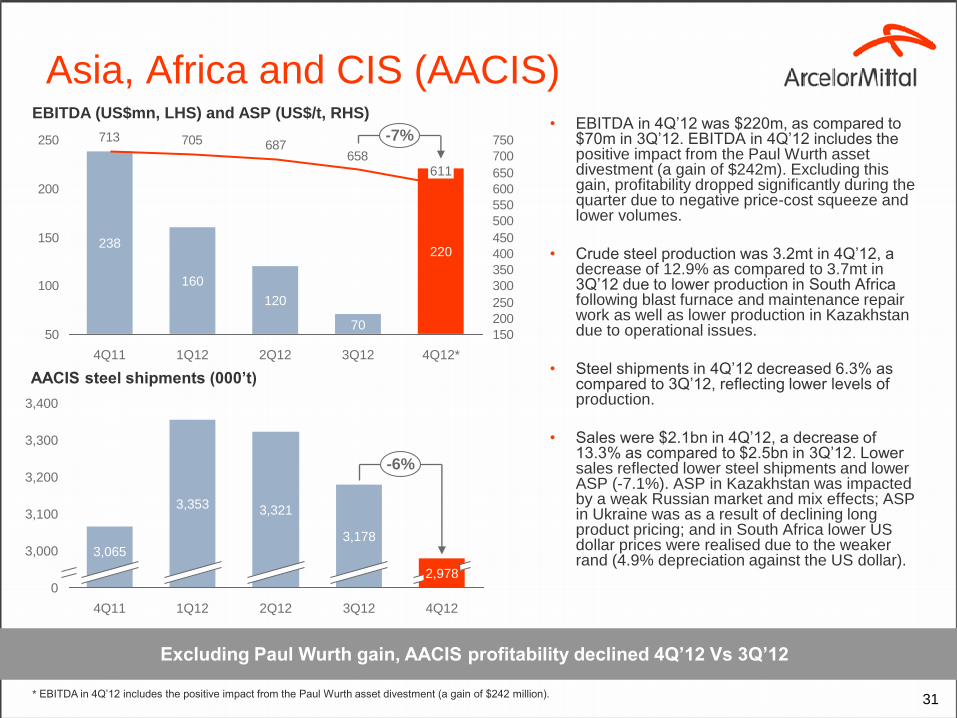
Asia, Africa and CIS (AACIS) • EBITDA in 4Q’12 was $220m, as compared to
$70m in 3Q’12. EBITDA in 4Q’12 includes the positive impact from the Paul Wurth asset divestment (a gain of $242m). Excluding this gain, profitability dropped significantly during the quarter due to negative price-cost squeeze and lower volumes.
• Crude steel production was 3.2mt in 4Q’12, a decrease of 12.9% as compared to 3.7mt in 3Q’12 due to lower production in South Africa following blast furnace and maintenance repair work as well as lower production in Kazakhstan due to operational issues.
• Steel shipments in 4Q’12 decreased 6.3% as compared to 3Q’12, reflecting lower levels of production.
• Sales were $2.1bn in 4Q’12, a decrease of 13.3% as compared to $2.5bn in 3Q’12. Lower sales reflected lower steel shipments and lower ASP (-7.1%). ASP in Kazakhstan was impacted by a weak Russian market and mix effects; ASP in Ukraine was as a result of declining long product pricing; and in South Africa lower US dollar prices were realised due to the weaker rand (4.9% depreciation against the US dollar).
Excluding Paul Wurth gain, AACIS profitability declined 4Q’12 Vs 3Q’12
3,400
3,100
3,300
3,200
0
3,000
-6%
4Q12
2,978
3Q12
3,178
2Q12 1Q12
3,353
4Q11
3,065
3,321
EBITDA (US$mn, LHS) and ASP (US$/t, RHS)
AACIS steel shipments (000’t)
658687705713
50
100
150
200
250
150
200
250
300
350
400
450
500
550
600
650
700
750-7%
4Q12*
220
3Q12 2Q12
238
70
120
160
1Q12 4Q11
611
* EBITDA in 4Q’12 includes the positive impact from the Paul Wurth asset divestment (a gain of $242 million).
32
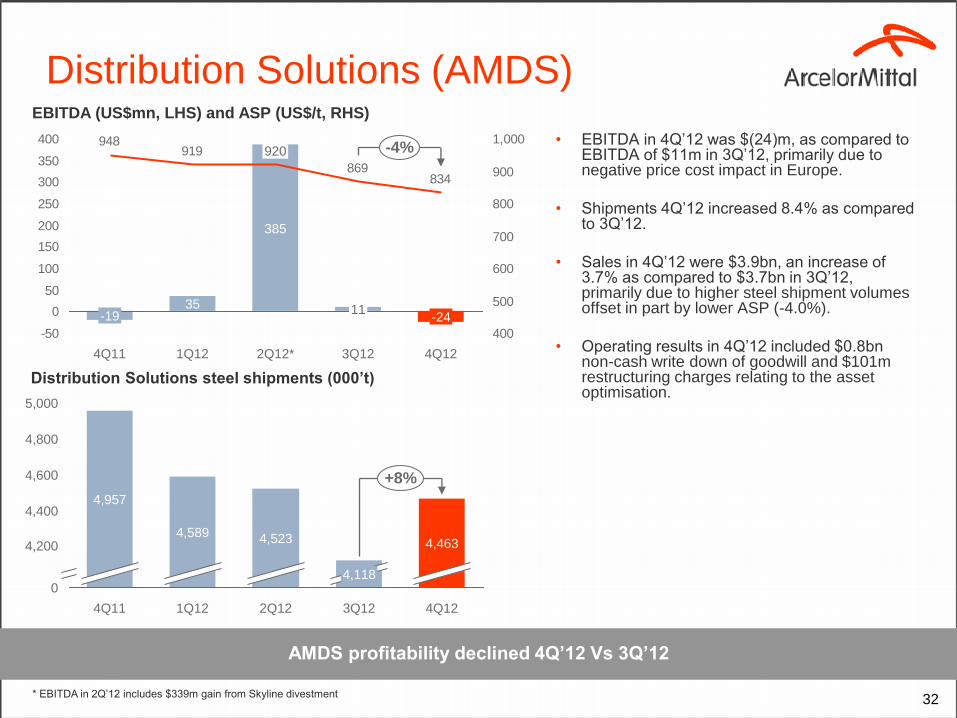
Distribution Solutions (AMDS)
• EBITDA in 4Q’12 was $(24)m, as compared to EBITDA of $11m in 3Q’12, primarily due to negative price cost impact in Europe.
• Shipments 4Q’12 increased 8.4% as compared to 3Q’12.
• Sales in 4Q’12 were $3.9bn, an increase of 3.7% as compared to $3.7bn in 3Q’12, primarily due to higher steel shipment volumes offset in part by lower ASP (-4.0%).
• Operating results in 4Q’12 included $0.8bn non-cash write down of goodwill and $101m restructuring charges relating to the asset optimisation.
AMDS profitability declined 4Q’12 Vs 3Q’12
4,800
4,600
4,400
4,200
5,000
0
+8%
4Q12
4,463
3Q12
4,118
2Q12
4,523
1Q12
4,589
4Q11
4,957
EBITDA (US$mn, LHS) and ASP (US$/t, RHS)
Distribution Solutions steel shipments (000’t)
834869
919948
-50
0
50
100
150
200
250
300
350
400
400
500
600
700
800
900
1,000-4%
4Q12
-24
3Q12
11
2Q12*
920
385
1Q12
35
4Q11
-19
* EBITDA in 2Q’12 includes $339m gain from Skyline divestment
33
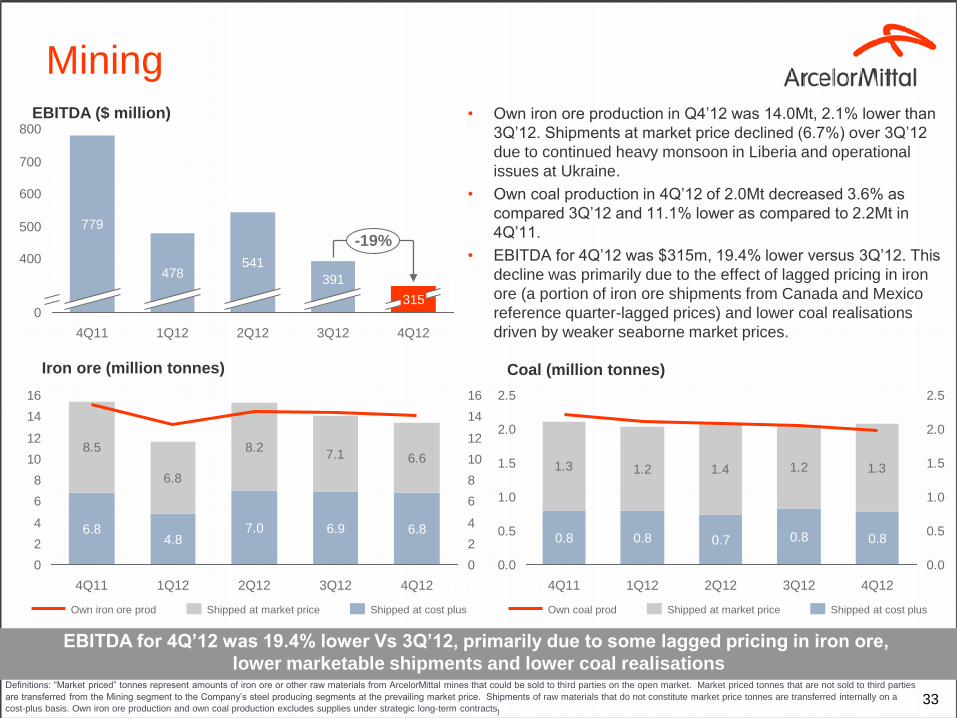
Mining • Own iron ore production in Q4’12 was 14.0Mt, 2.1% lower than
3Q’12. Shipments at market price declined (6.7%) over 3Q’12
due to continued heavy monsoon in Liberia and operational
issues at Ukraine.
• Own coal production in 4Q’12 of 2.0Mt decreased 3.6% as
compared 3Q’12 and 11.1% lower as compared to 2.2Mt in
4Q’11.
• EBITDA for 4Q’12 was $315m, 19.4% lower versus 3Q’12. This
decline was primarily due to the effect of lagged pricing in iron
ore (a portion of iron ore shipments from Canada and Mexico
reference quarter-lagged prices) and lower coal realisations
driven by weaker seaborne market prices.
EBITDA for 4Q’12 was 19.4% lower Vs 3Q’12, primarily due to some lagged pricing in iron ore,
lower marketable shipments and lower coal realisations Definitions: “Market priced” tonnes represent amounts of iron ore or other raw materials from ArcelorMittal mines that could be sold to third parties on the open market. Market priced tonnes that are not sold to third parties
are transferred from the Mining segment to the Company’s steel producing segments at the prevailing market price. Shipments of raw materials that do not constitute market price tonnes are transferred internally on a
cost-plus basis. Own iron ore production and own coal production excludes supplies under strategic long-term contracts)
600
500
0
400
800
700
1Q12
478
4Q11
-19%
4Q12
315
3Q12
391
2Q12
541
779
EBITDA ($ million)
8.5
6.8
8.27.1 6.6
0
2
4
6
8
10
12
14
16
0
2
4
6
8
10
12
14
16
4Q12
6.8
3Q12
6.9
2Q12
7.0
1Q12
4.8
4Q11
6.8
Shipped at cost plus Shipped at market price Own iron ore prod
Iron ore (million tonnes)
1.3 1.2 1.4 1.2 1.3
0.0
0.5
1.0
1.5
2.0
2.5
0.0
0.5
1.0
1.5
2.0
2.5
4Q12
0.8
3Q12
0.8
2Q12
0.7
1Q12
0.8
4Q11
0.8
Own coal prod Shipped at cost plus Shipped at market price
Coal (million tonnes)
34
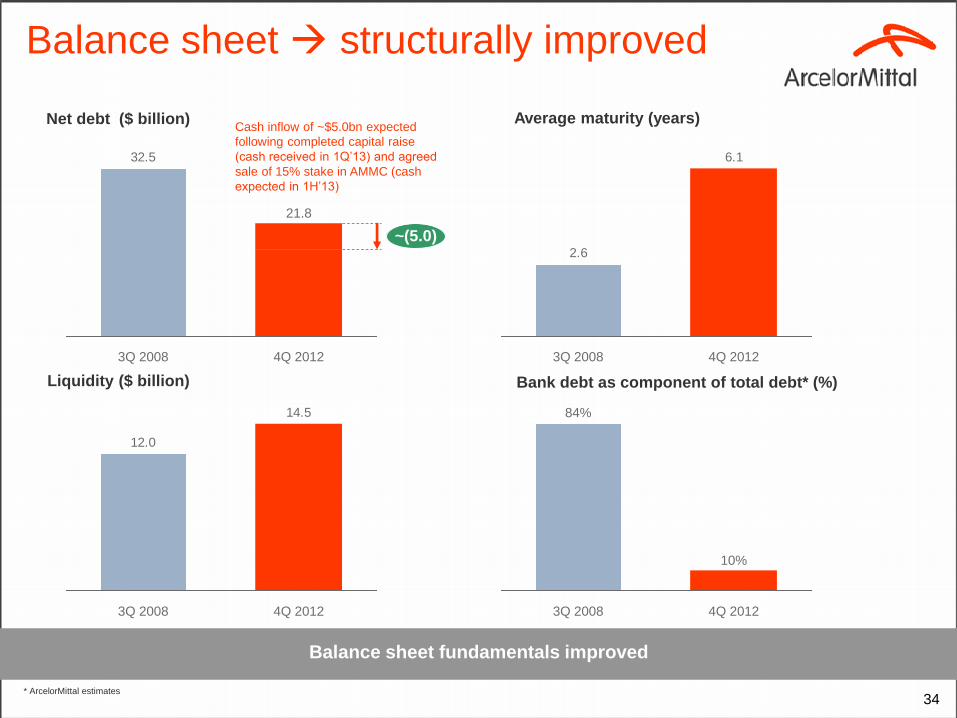
Net debt ($ billion)
Balance sheet fundamentals improved
Average maturity (years)
Liquidity ($ billion) Bank debt as component of total debt* (%)
Balance sheet structurally improved
32.5
21.8
~(5.0)
4Q 2012 3Q 2008
6.1
2.6
4Q 2012 3Q 2008
14.5
12.0
4Q 2012 3Q 2008
* ArcelorMittal estimates
4Q 2012
10%
3Q 2008
84%
Cash inflow of ~$5.0bn expected
following completed capital raise
(cash received in 1Q’13) and agreed
sale of 15% stake in AMMC (cash
expected in 1H’13)
35
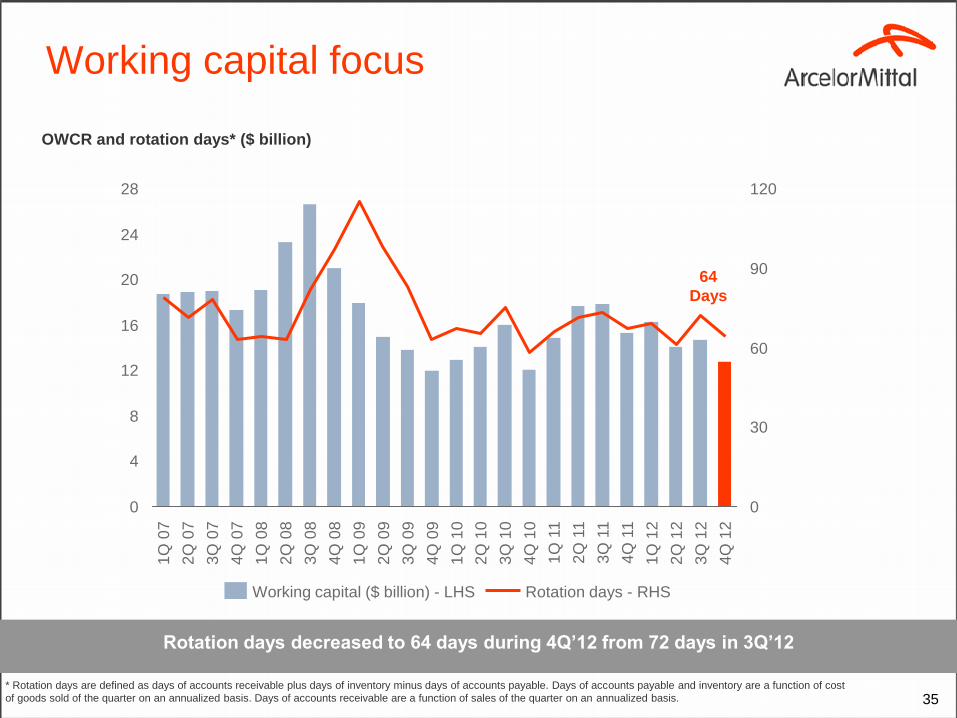
Working capital focus
OWCR and rotation days* ($ billion)
* Rotation days are defined as days of accounts receivable plus days of inventory minus days of accounts payable. Days of accounts payable and inventory are a function of cost
of goods sold of the quarter on an annualized basis. Days of accounts receivable are a function of sales of the quarter on an annualized basis.
Rotation days decreased to 64 days during 4Q’12 from 72 days in 3Q’12
0
4
8
12
16
20
24
28
0
30
60
90
120
3Q
08
2Q
08
1Q
08
4Q
08
2Q
10
4Q
10
1Q
11
3Q
10
1Q
10
4Q
07
4Q
09
2Q
09
3Q
09
1Q
09
3Q
11
2Q
11
2Q
12
3Q
12
1Q
12
4Q
11
4Q
12
3Q
07
2Q
07
1Q
07
Working capital ($ billion) - LHS Rotation days - RHS
64
Days
36
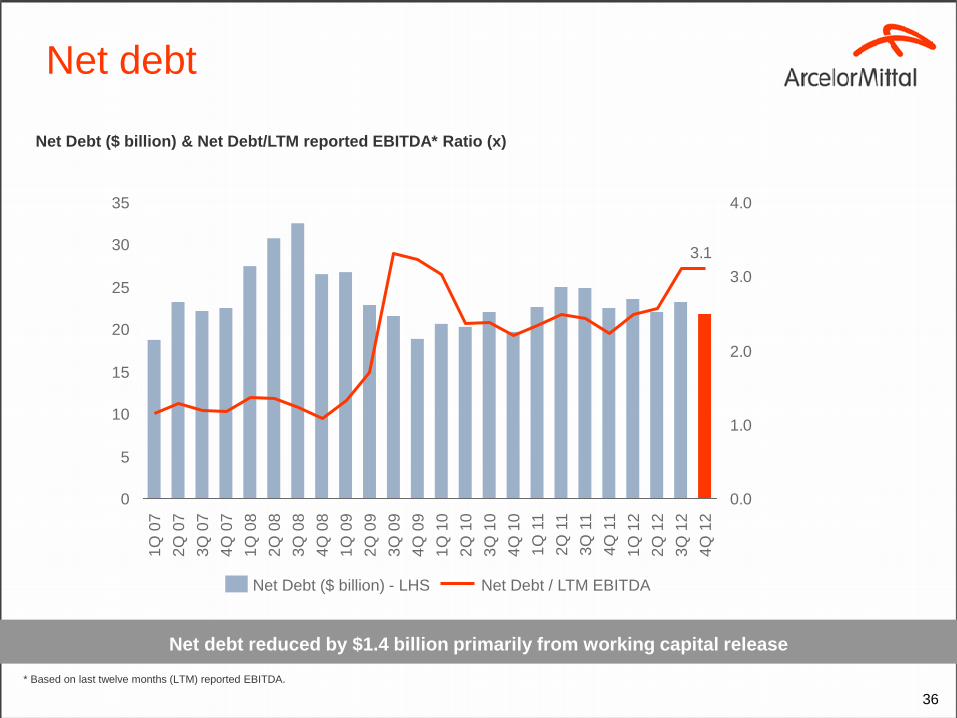
Net debt
Net Debt ($ billion) & Net Debt/LTM reported EBITDA* Ratio (x)
* Based on last twelve months (LTM) reported EBITDA.
Net debt reduced by $1.4 billion primarily from working capital release
3.1
0
5
10
15
20
25
30
35
0.0
1.0
2.0
3.0
4.0
1Q
12
4Q
11
3Q
11
2Q
11
1Q
11
4Q
10
3Q
10
2Q
10
1Q
10
4Q
09
3Q
09
2Q
09
1Q
09
4Q
08
3Q
08
2Q
08
1Q
08
4Q
07
3Q
07
3Q
12
2Q
12
2Q
07
1Q
07
4Q
12
Net Debt ($ billion) - LHS Net Debt / LTM EBITDA
37
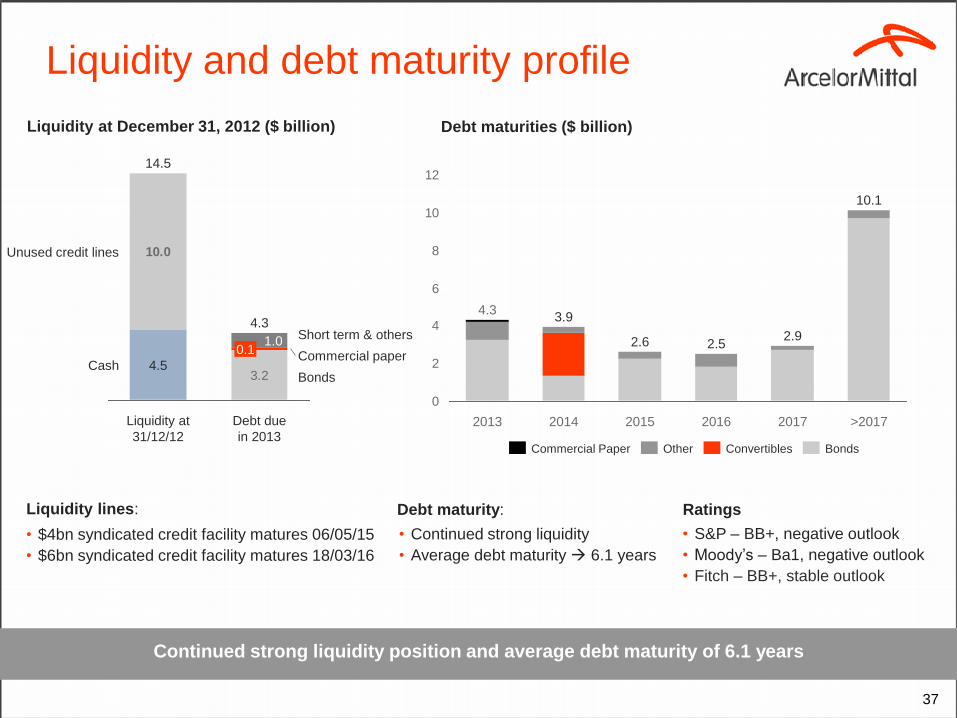
Liquidity and debt maturity profile
Debt maturities ($ billion) Liquidity at December 31, 2012 ($ billion)
Continued strong liquidity position and average debt maturity of 6.1 years
Liquidity lines:
• $4bn syndicated credit facility matures 06/05/15
• $6bn syndicated credit facility matures 18/03/16
• Continued strong liquidity
• Average debt maturity 6.1 years
Debt maturity: Ratings
• S&P – BB+, negative outlook
• Moody’s – Ba1, negative outlook
• Fitch – BB+, stable outlook
0
2
4
6
8
10
12
>2017
10.1
2017
2.9
2016
2.5
2015
2.6
2014
3.9
2013
4.3
Bonds Convertibles Other Commercial Paper
3.2
10.0
Bonds
Commercial paper
Short term & others
Cash
Unused credit lines
Debt due
in 2013
4.3
0.1 1.0
Liquidity at
31/12/12
14.5
4.5
38
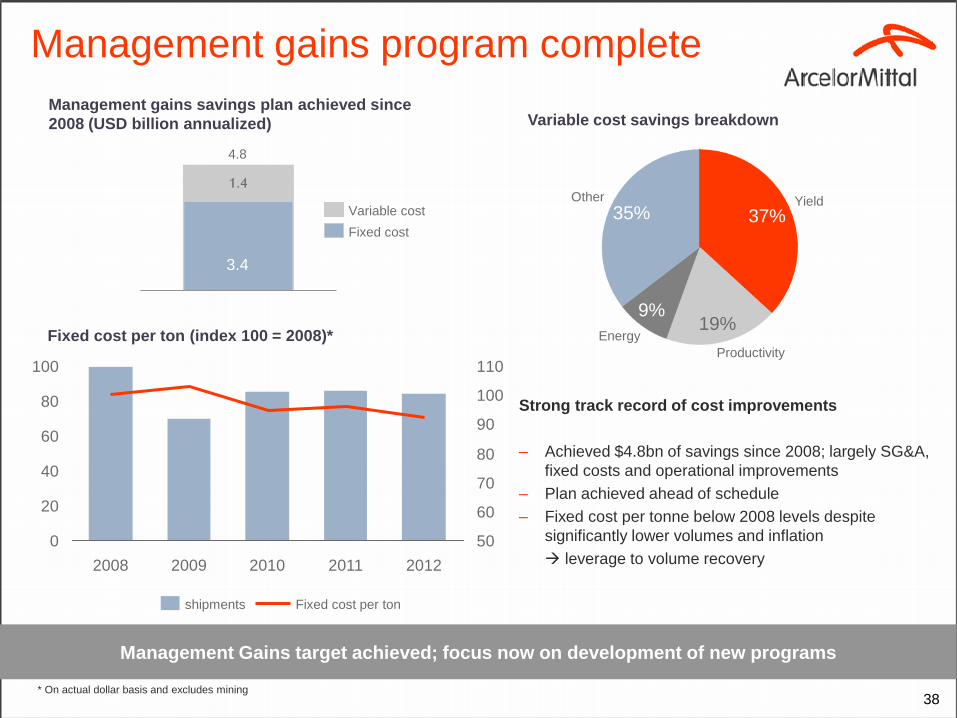
Management gains program complete
Strong track record of cost improvements
– Achieved $4.8bn of savings since 2008; largely SG&A,
fixed costs and operational improvements
– Plan achieved ahead of schedule
– Fixed cost per tonne below 2008 levels despite
significantly lower volumes and inflation
leverage to volume recovery
Management gains savings plan achieved since
2008 (USD billion annualized)
Management Gains target achieved; focus now on development of new programs
4.8
3.4
Fixed cost
Variable cost Other
35%
Energy
9%
Productivity
19%
Yield
37%
Variable cost savings breakdown
Fixed cost per ton (index 100 = 2008)*
0
20
40
60
80
100
50
60
70
80
90
100
110
2012 2011 2010 2009 2008
Fixed cost per ton shipments
* On actual dollar basis and excludes mining
39
Contacts
Daniel Fairclough – Global Head Investor Relations
+44 207 543 1105
Hetal Patel – UK/European Investor Relations
+44 207 543 1128
Valérie Mella – European and Retail Investor Relations
+44 207 543 1156
Maureen Baker – Fixed Income/Debt Investor Relations
+33 1 71 92 10 26
Thomas A McCue – US Investor Relations
+312-899-3927
Lisa Fortuna – US Investor Relations
+312-899-3985


![Quadrilateral Family[1] Rashmi Kathuria](https://static.fdocuments.us/doc/165x107/554cab70b4c905aa608b4606/quadrilateral-family1-rashmi-kathuria.jpg)