Preparing for Global Change in the Petroleum Supply Chain 2006 Presentations/Vance Scott... ·...
74
Houston, Texas June 7, 2006 Preparing for Global Change in the Petroleum Supply Chain Preparing for Global Change in the Preparing for Global Change in the Petroleum Supply Chain Petroleum Supply Chain University of Nevada/COPPEAD Petroleum Executive Logistics Course
Transcript of Preparing for Global Change in the Petroleum Supply Chain 2006 Presentations/Vance Scott... ·...
Houston, Texas
June 7, 2006
Preparing for Global Change in the Petroleum Supply Chain
Preparing for Global Change in the Preparing for Global Change in the Petroleum Supply ChainPetroleum Supply Chain
University of Nevada/COPPEAD Petroleum Executive Logistics Course

A.T. Kearney 82/06.2006/13154 2
AgendaAgenda
About A.T. Kearney
Basics and fundamentals — Petroleum supply chains are complex and global
A look to the future
Keys to value

A.T. Kearney 82/06.2006/13154 3
About A.T. KearneyAbout A.T. Kearney
A.T. Kearney 82/06.2006/13154 4
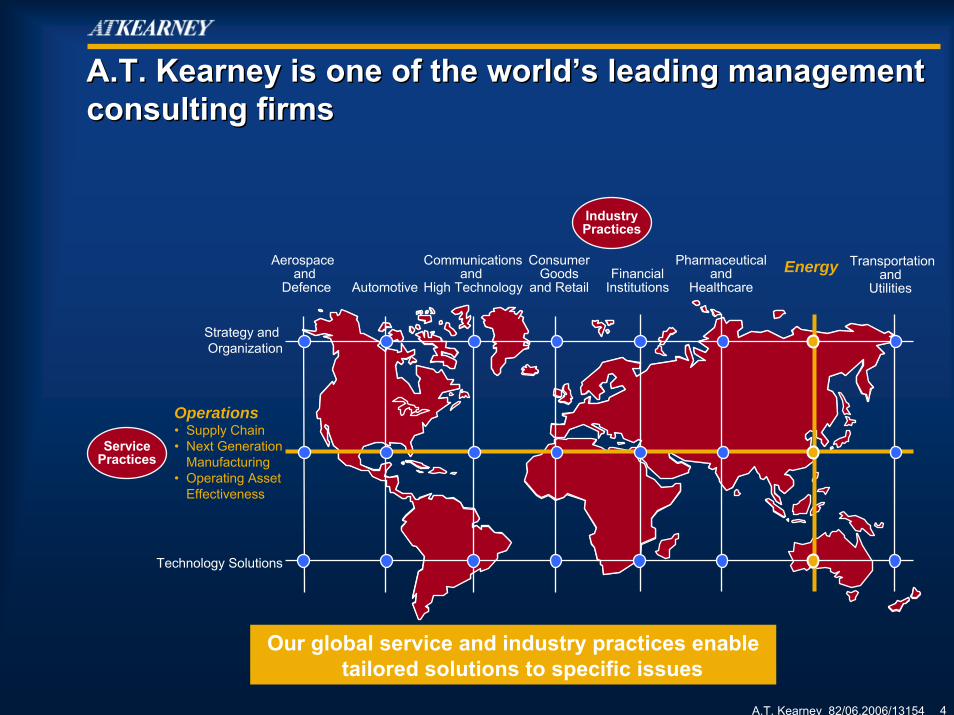
A.T. Kearney is one of the world’s leading management consulting firmsA.T. Kearney is one of the world’s leading management consulting firms
Aerospace and
Defence Automotive
Communicationsand
High TechnologyFinancial
Institutions
Pharmaceuticaland
HealthcareEnergy Transportation
and Utilities
Consumer Goods
and Retail
Operations• Supply Chain• Next Generation
Manufacturing• Operating Asset
Effectiveness
Strategy and Organization
Technology Solutions
ServicePractices
Our global service and industry practices enable tailored solutions to specific issues
IndustryPractices
A.T. Kearney 82/06.2006/13154 5
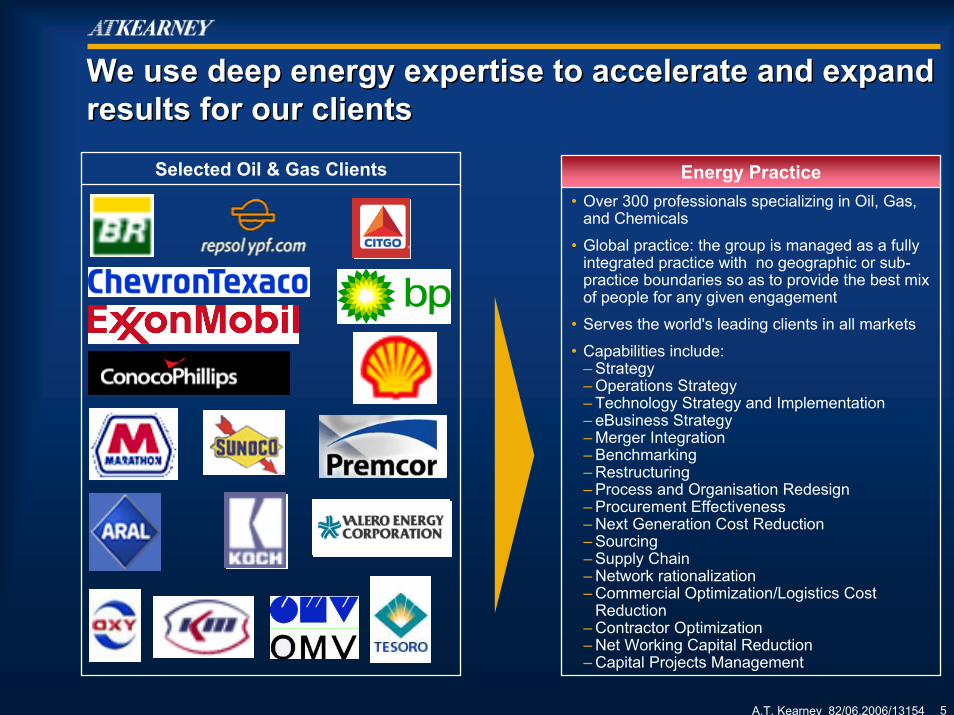
We use deep energy expertise to accelerate and expand results for our clientsWe use deep energy expertise to accelerate and expand results for our clients
Selected Oil & Gas Clients Energy Practice• Over 300 professionals specializing in Oil, Gas,
and Chemicals
• Global practice: the group is managed as a fully integrated practice with no geographic or sub-practice boundaries so as to provide the best mix of people for any given engagement
• Serves the world's leading clients in all markets
• Capabilities include:– Strategy– Operations Strategy– Technology Strategy and Implementation– eBusiness Strategy– Merger Integration– Benchmarking– Restructuring– Process and Organisation Redesign– Procurement Effectiveness– Next Generation Cost Reduction– Sourcing– Supply Chain– Network rationalization– Commercial Optimization/Logistics Cost
Reduction– Contractor Optimization– Net Working Capital Reduction– Capital Projects Management

A.T. Kearney 82/06.2006/13154 6
Basics and fundamentals —Petroleum supply chains are complex and global
Basics and fundamentals —Petroleum supply chains are complex and global
A.T. Kearney 82/06.2006/13154 7
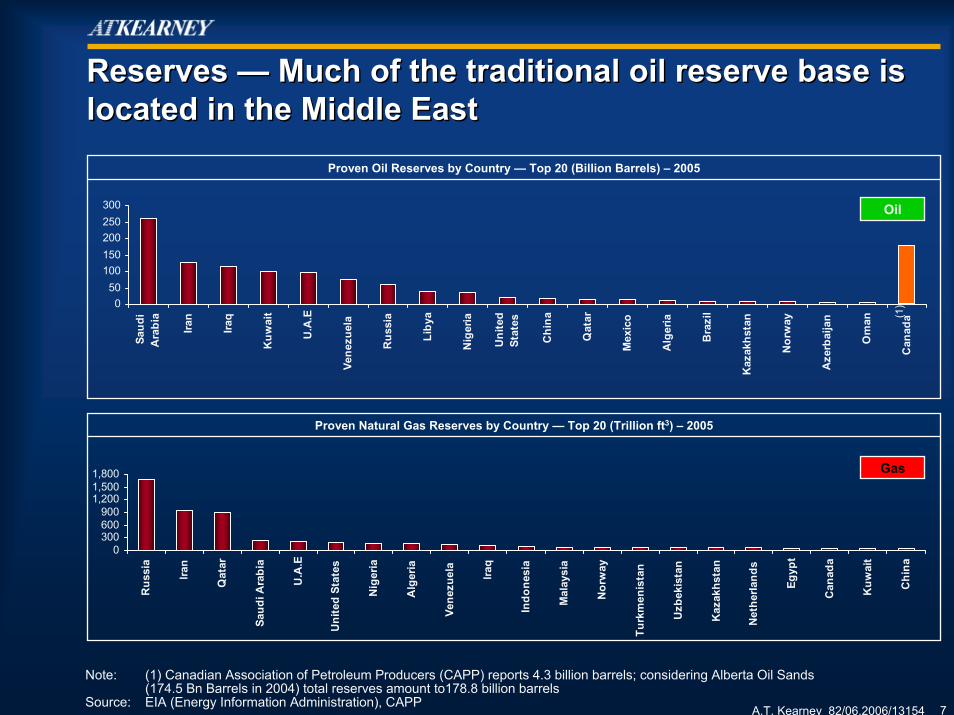
Proven Natural Gas Reserves by Country — Top 20 (Trillion ft3) – 2005
Proven Oil Reserves by Country — Top 20 (Billion Barrels) – 2005
050
100150200250300
Saud
iA
rabi
a
Iran
Iraq
Kuw
ait
U.A
.E
Vene
zuel
a
Rus
sia
Liby
a
Nig
eria
Uni
ted
Stat
es
Chi
na
Qat
ar
Mex
ico
Alg
eria
Bra
zil
Kaz
akhs
tan
Nor
way
Aze
rbai
jan
Om
an
Can
ada
Reserves — Much of the traditional oil reserve base is located in the Middle EastReserves — Much of the traditional oil reserve base is located in the Middle East
0300600900
1,2001,5001,800
Rus
sia
Iran
Qat
ar
Saud
i Ara
bia
U.A
.E
Uni
ted
Stat
es
Nig
eria
Alg
eria
Vene
zuel
a
Iraq
Indo
nesi
a
Mal
aysi
a
Nor
way
Turk
men
ista
n
Uzb
ekis
tan
Kaz
akhs
tan
Net
herla
nds
Egyp
t
Can
ada
Kuw
ait
Chi
na(1
)
Gas
Oil
Note: (1) Canadian Association of Petroleum Producers (CAPP) reports 4.3 billion barrels; considering Alberta Oil Sands(174.5 Bn Barrels in 2004) total reserves amount to178.8 billion barrels
Source: EIA (Energy Information Administration), CAPP

A.T. Kearney 82/06.2006/13154 8
Key Producing RegionsWorld Production
299
245
97
301
128
Asia Pacific
Europe & Eurasia
Americas
Africa
Middle East
US$ 1.07 trillion
Supply — The global crude oil production totals to US$ 1.07 trillionSupply — The global crude oil production totals to US$ 1.07 trillion
Crude Oil Production in 2004(1)
Europe & Eurasia
Oil
SaudiArabia43%
Iran17%
Others11%
Middle EastOthers
4%
Americas
US35%
Mexico18%Venezuela
15%
Canada14%
Brazil7%
Argentina4%
UnitedArabianEmirates
11%
Kuwait10%
Iraq8%
RussianFederation
43%Norway
18%
UnitedKingdom
12%
Others10%
Kazakhstan7%
Note: (1) Based on production volume times regional spot crude oil prices Source: BP Statistical review of world energy 2005

A.T. Kearney 82/06.2006/13154 9
130 129
110
5850 47 45 45 43
35 33 30 28 27 25 23 2218
14 14 12 11 11 10 10 10
Key Producing Countries(1)
(US$ Billion)
Kuw
ait
Vene
zuel
a
Mex
ico
Kaz
akhs
tan
Can
ada
Liby
a
Bra
zil
Alg
eria
Ang
ola
Indi
a
Uni
ted
Kin
gdom
Chi
na
Rus
sian
Fede
ratio
n
Supply — Saudi Arabia, Russian Federation and USA dominate crude oil productionSupply — Saudi Arabia, Russian Federation and USA dominate crude oil production
Regional Crude Oil Production Breakdown
80% of Global Market
50% of Global Market
Saud
iA
rabi
a
Mal
aysi
a
Egyp
t
Arg
entin
a
USA Ira
n
Nor
way
Uni
ted
Ara
bian
Emira
tes
Nig
eria
Om
an
Qat
ar
Indo
nesi
a
Iraq
Note: (1) Covering 90% of Entire Natural Gas Production in 2004Source: BP Statistical review of world energy 2005/A.T. Kearney analysis
Oil
Middle EastAsia PacificAmericasAfricaEurope

A.T. Kearney 82/06.2006/13154 10
Key Consuming RegionsWorld Consumption
445
280
288
6537
Asia Pacific
Europe & Eurasia
Americas
AfricaMiddle East
Demand — The global crude oil consumption totals to US$ 1.11 trillionDemand — The global crude oil consumption totals to US$ 1.11 trillion
Crude Oil Production in 2004(1)
Asia Pacific
Others10%
US$ 1.11 trillion Americas
US70%
Mexico6%
Canada8%
Brazil6%
Europe & Eurasia
Others46%
Germany13%
RussianFederation
13%
France10%
Italy9%
UnitedKingdom
9%
China29%
Japan23%
Other23%
India23%
SouthKorea10%
Indonesia5%
Australia4%
Note: (1) Based on production volume times regional spot crude oil pricesSource: BP Statistical review of world energy 2005/A.T. Kearney analysis
Oil

A.T. Kearney 82/06.2006/13154 11
311
8265
37 36 33 31 29 28 28 28 26 25 22 21 20 18 18 17 14 14 11 11 11 11
Key Producing Countries(1)
(US$ Billion)
Sout
h K
orea
Ger
man
y
Can
ada
Bra
zil
Spai
n
Indi
a
Chi
na
Rus
sian
Fede
ratio
n
Demand — The USA, China, Japan are the three dominant petroleum consumersDemand — The USA, China, Japan are the three dominant petroleum consumers
Regional Crude Oil Production Breakdown
Note: (1) Covering 85% of Entire Oil Production in 2004Source: BP Statistical review of world energy 2005/A.T. Kearney analysis
80% of Global Market
50% of Global Market
Thai
land
Taiw
an
Net
herla
nds
USA Ira
n
Bel
gium
&Lu
xem
bour
g
Aus
tral
ia
Indo
nesi
a
Saud
i Ara
bia
Japa
n
Mex
ico
Fran
ce
Italy
Uni
ted
Kin
gdom
`Oth
er S
. &C
ent.
Am
eric
a
Oth
er A
fric
a
Oth
er M
iddl
eEa
st
Oil
Middle EastAsia PacificAmericasAfricaEurope
A.T. Kearney 82/06.2006/13154 12
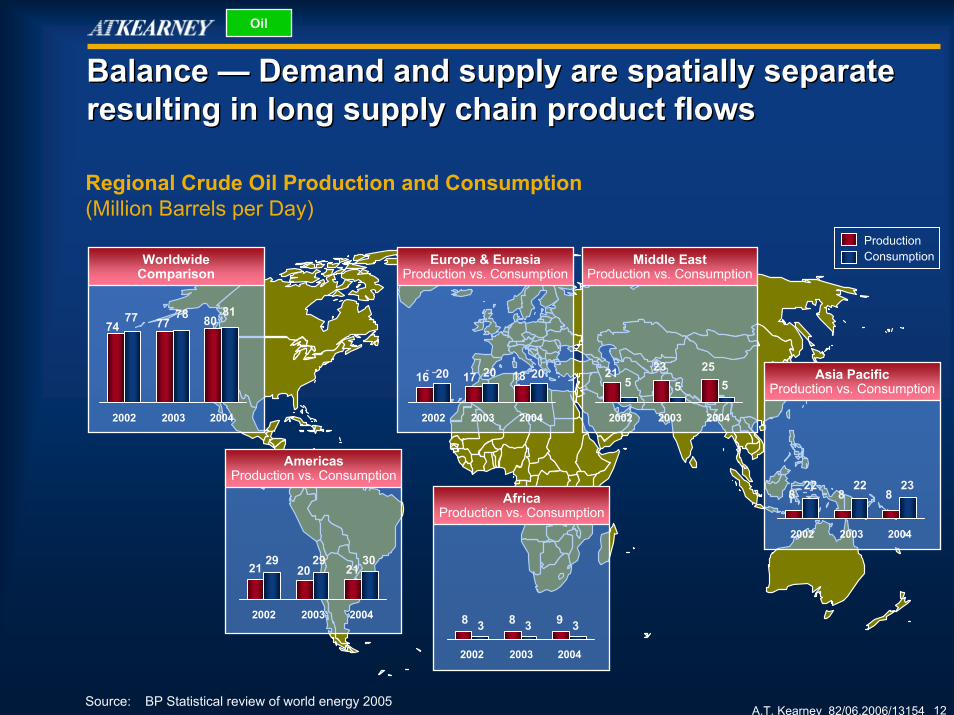
Asia PacificProduction vs. Consumption
Middle EastProduction vs. Consumption
Europe & Eurasia Production vs. Consumption
Balance — Demand and supply are spatially separate resulting in long supply chain product flowsBalance — Demand and supply are spatially separate resulting in long supply chain product flows
2002 2003 2004
Regional Crude Oil Production and Consumption(Million Barrels per Day)
16 20 17 20 18 20
WorldwideComparison
2002 2003 2004
7477 77
78 8081
2002 2003 2004
215
235
255
AmericasProduction vs. Consumption
21 2920
2921
30
AfricaProduction vs. Consumption
8 3
822
2002 2003 2004
822
823
2002 2003 2004
8 3 9 32002 2003 2004
Source: BP Statistical review of world energy 2005
ProductionConsumption
Oil
A.T. Kearney 82/06.2006/13154 13
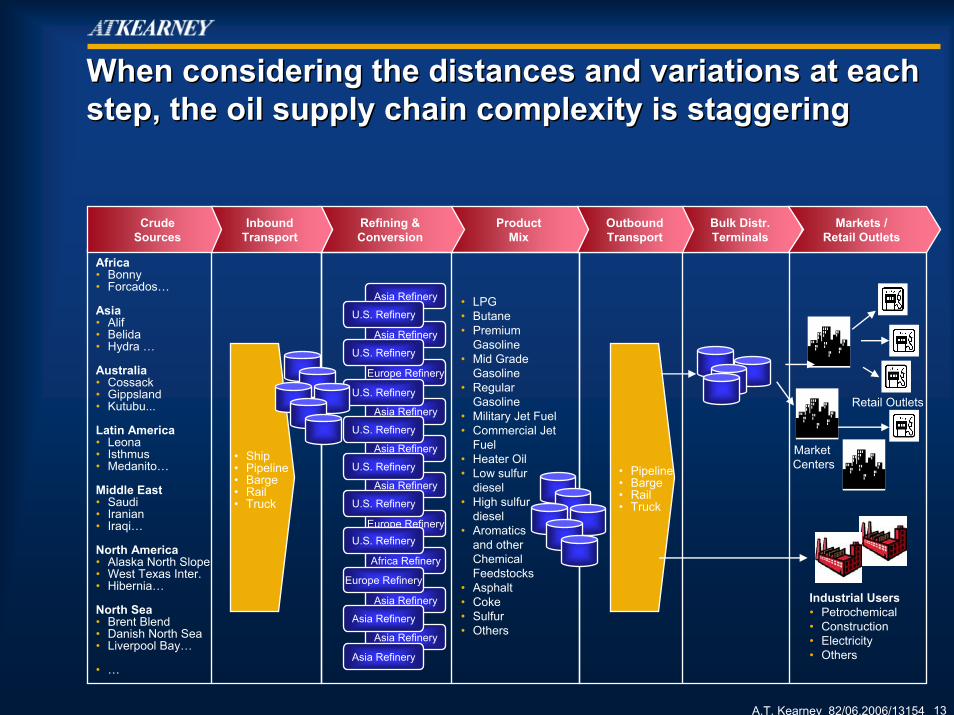
When considering the distances and variations at each step, the oil supply chain complexity is staggeringWhen considering the distances and variations at each step, the oil supply chain complexity is staggering
Africa• Bonny• Forcados…
Asia• Alif• Belida• Hydra …
Australia• Cossack• Gippsland• Kutubu...
Latin America• Leona• Isthmus• Medanito…
Middle East• Saudi• Iranian• Iraqi…
North America• Alaska North Slope• West Texas Inter.• Hibernia…
North Sea• Brent Blend• Danish North Sea• Liverpool Bay…
• …
Refining & Conversion
Product Mix
OutboundTransport
Bulk Distr.Terminals
Markets /Retail Outlets
Crude Sources
InboundTransport
• LPG• Butane• Premium
Gasoline• Mid Grade
Gasoline• Regular
Gasoline• Military Jet Fuel• Commercial Jet
Fuel• Heater Oil• Low sulfur
diesel• High sulfur
diesel• Aromatics
and other Chemical Feedstocks
• Asphalt• Coke• Sulfur• Others
• Ship• Pipeline• Barge• Rail• Truck
• Pipeline• Barge• Rail• Truck
Market Centers
Industrial Users• Petrochemical• Construction• Electricity• Others
Retail Outlets
Asia Refinery
Asia Refinery
Europe Refinery
Asia Refinery
Asia Refinery
Asia Refinery
Europe Refinery
Africa Refinery
Asia Refinery
Asia Refinery
U.S. Refinery
U.S. Refinery
U.S. Refinery
U.S. Refinery
U.S. Refinery
U.S. Refinery
U.S. Refinery
Europe Refinery
Asia Refinery
Asia Refinery

A.T. Kearney 82/06.2006/13154 14
Key Producing RegionsWorld Production
1,052
892
323
279
145
Asia Pacific
Europe & Eurasia
Americas
Africa
Middle East
Supply — The Natural gas production totals to 2.69 trillion cubic metersSupply — The Natural gas production totals to 2.69 trillion cubic meters
Natural Gas Production in 2004
RussianFederation
56%Norway8%
United Kingdom
9%
Uzbekistan5%
Others15% Mexico
4%
Venezuela3%
Canada21%
Others6%
Argentina5%
2.69 Trillion Cubic Meters
Netherlands7%
Indonesia23%
Malaysia17%
China13%
Australia11%
Others27%
India9%
Gas
Source: BP Statistical review of world energy 2005
Europe & Eurasia Americas
Asia Pacific
US61%
A.T. Kearney 82/06.2006/13154 15
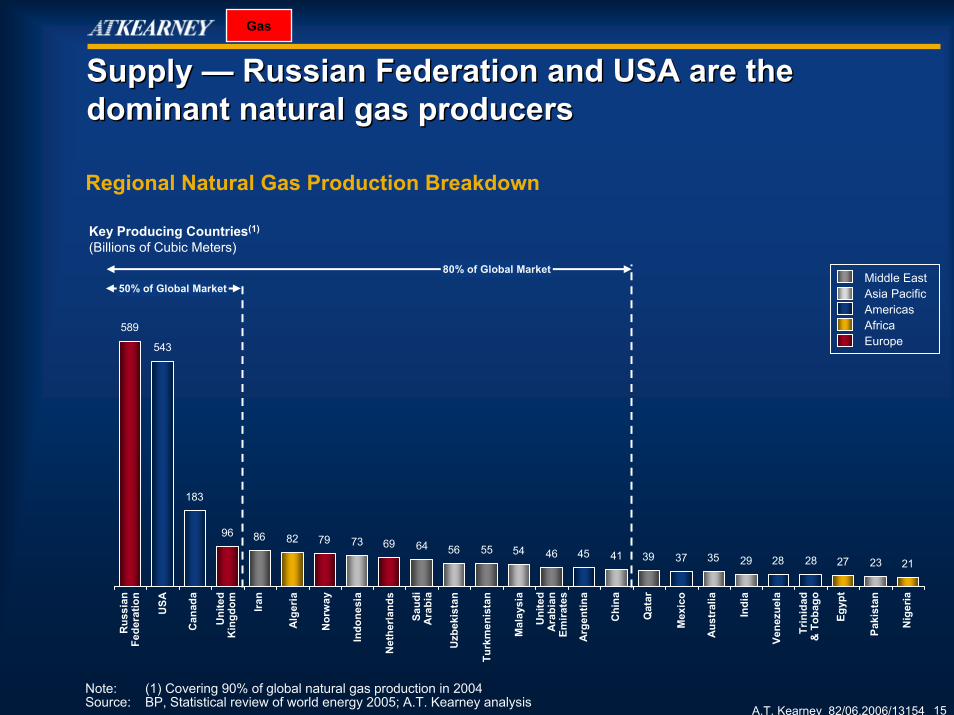
589
543
183
96 86 82 79 73 69 64 56 55 54 46 45 41 39 37 35 29 28 28 27 23 21
Saud
iA
rabi
a
USA
Trin
idad
& T
obag
o
Aus
tral
ia
Nor
way
Net
herla
nds
Iran
Vene
zuel
a
Can
ada
Uni
ted
Kin
gdom
Nig
eria
Uni
ted
Ara
bian
Emira
tes
Turk
men
ista
n
Alg
eria
Indo
nesi
a
Arg
entin
a
Qat
ar
Mal
aysi
a
Paki
stan
Indi
a
Uzb
ekis
tan
Supply — Russian Federation and USA are the dominant natural gas producersSupply — Russian Federation and USA are the dominant natural gas producers
Regional Natural Gas Production Breakdown
80% of Global MarketMiddle EastAsia PacificAmericasAfricaEurope
50% of Global Market
Key Producing Countries(1)
(Billions of Cubic Meters)
Chi
na
Mex
ico
Egyp
t
Rus
sian
Fede
ratio
n
Note: (1) Covering 90% of global natural gas production in 2004Source: BP, Statistical review of world energy 2005; A.T. Kearney analysis
Gas

A.T. Kearney 82/06.2006/13154 16
Key Consuming RegionsWorld Consumption
1,108
902
368
242
69
Asia Pacific
Europe & Eurasia
Americas
AfricaMiddle East
Demand — The global Natural Gas demand totals 2.69 trillion cubic metersDemand — The global Natural Gas demand totals 2.69 trillion cubic meters
Natural Gas Consumption in 2004
Europe & Eurasia
RussianFederation
36%
Germany8%
United Kingdom9%
Others15%
Americas
Ukraine6%
Malaysia9%
India9%
2.69 Trillion Cubic Meters
Source: BP Statistical review of world energy 2005
Italy7%
US72%
Canada10%
Mexico5%
Argentina4%
Venezuela3% Others
4%
Brazil2%
Japan20%
China11%
Indonesia9%
Others27%
Asia Pacific
Gas
A.T. Kearney 82/06.2006/13154 17
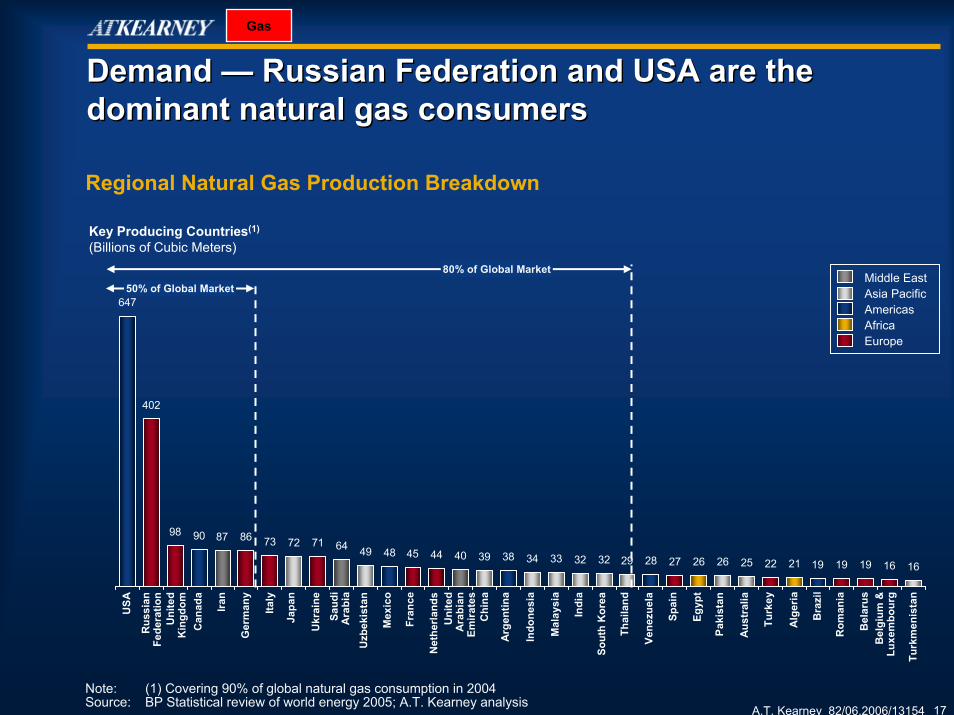
Demand — Russian Federation and USA are the dominant natural gas consumersDemand — Russian Federation and USA are the dominant natural gas consumers
Regional Natural Gas Production Breakdown
Note: (1) Covering 90% of global natural gas consumption in 2004Source: BP Statistical review of world energy 2005; A.T. Kearney analysis
Gas
647
402
98 90 87 86 73 72 71 64 49 48 45 44 40 39 38 34 33 32 32 29 28 27 26 26 25 22 21 19 19 19 16 16
Key Producing Countries(1)
(Billions of Cubic Meters)
Fran
ce
USA
Rom
ania
Turk
ey
Ukr
aine
Mex
ico
Iran
Vene
zuel
a
Can
ada
Uni
ted
Kin
gdom
Turk
men
ista
n
Uni
ted
Ara
bian
Emira
tes
Thai
land
Japa
n
Uzb
ekis
tan
Sout
h K
orea
Indo
nesi
a
Paki
stan
Indi
a
Net
herla
nds
Chi
na
Spai
n
Bel
gium
&Lu
xem
bour
g
Rus
sian
Fede
ratio
n
80% of Global Market
50% of Global Market
Ger
man
y
Italy
Saud
iA
rabi
a
Arg
entin
a
Mal
aysi
a
Egyp
t
Aus
tral
ia
Alg
eria
Bra
zil
Bel
arus
Middle EastAsia PacificAmericasAfricaEurope
A.T. Kearney 82/06.2006/13154 18
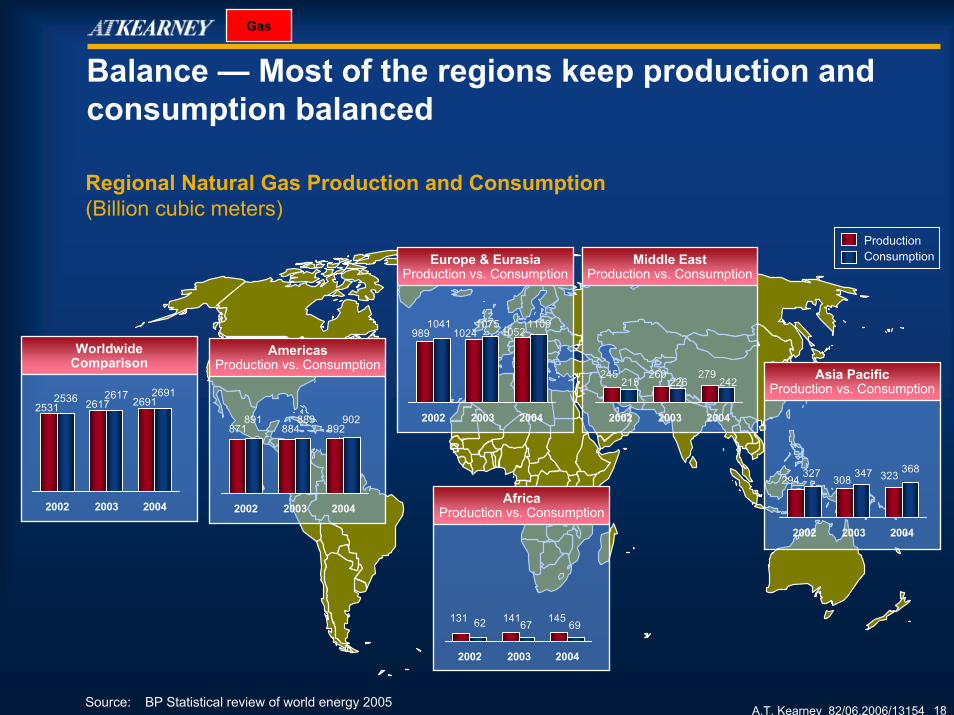
Asia PacificProduction vs. Consumption
Middle EastProduction vs. Consumption
Europe & Eurasia Production vs. Consumption
Balance — Most of the regions keep production and consumption balanced
2002 2003 2004
Regional Natural Gas Production and Consumption(Billion cubic meters)
9891041
10241075
10521109
WorldwideComparison
2002 2003 2004
25312536 2617
2617 26912691
2002 2003 2004
245215
260226
279242
ProductionConsumption
AmericasProduction vs. Consumption
2002 2003 2004
871891
884889
892902
AfricaProduction vs. Consumption
2002 2003 2004
131 62 14167
14569
2002 2003 2004
294 327 308 347 323 368
Source: BP Statistical review of world energy 2005
Gas
A.T. Kearney 82/06.2006/13154 19
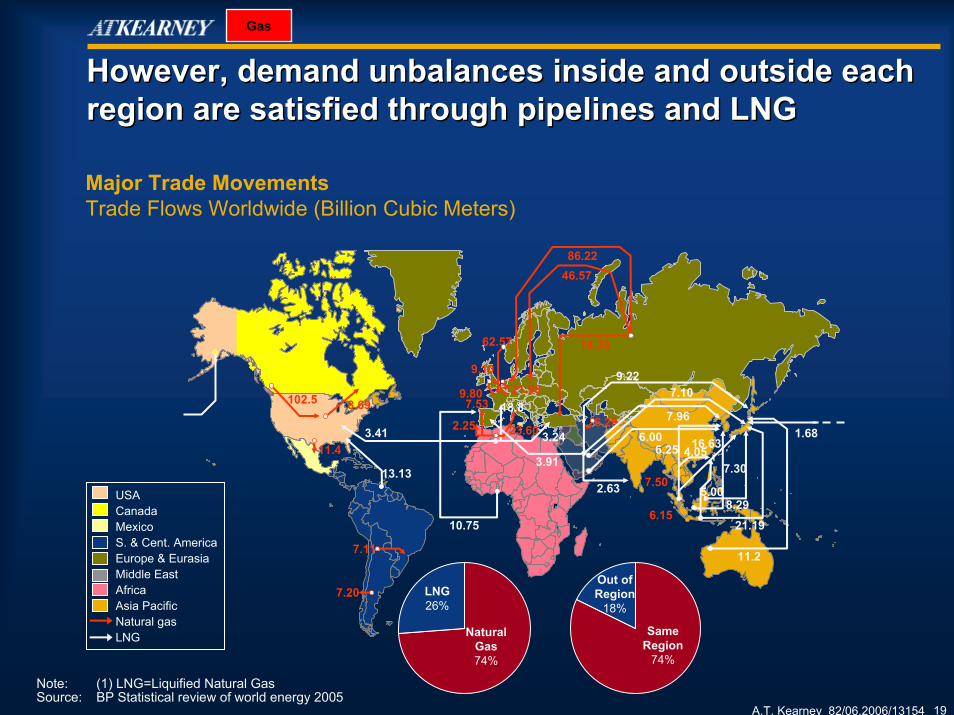
However, demand unbalances inside and outside each region are satisfied through pipelines and LNGHowever, demand unbalances inside and outside each region are satisfied through pipelines and LNG
USACanadaMexicoS. & Cent. AmericaEurope & EurasiaMiddle EastAfricaAsia PacificNatural gasLNG
LNG26%
Natural Gas74%
Out ofRegion
18%
Same Region
74%
Major Trade MovementsTrade Flows Worldwide (Billion Cubic Meters)
11.4
13.13
3.41
10.75
2.25
9.80
62.57
46.5786.22
1.68
7.30
8.296.15
2.63 7.50
102.5 8.69 7.53 18.8
14.35
6.29
3.91
7.96
7.109.22
6.004.05
16.63
5.00
21.19
11.27.11
7.20
9.1021.98
3.2423.606.25
Gas
Note: (1) LNG=Liquified Natural Gas Source: BP Statistical review of world energy 2005

A.T. Kearney 82/06.2006/13154 20
US supply chain infrastructure is one of the most complex systems in the worldUS supply chain infrastructure is one of the most complex systems in the world
US Petroleum Supply Chain Selected Physical Statistics(Latest Available Estimates)
Refining (March 2006) Pipelines (2004) Terminals (2003)
Barge (Excludes Ocean Tankers) Truck (2003) Rail (2003)Liquid carriers 3,614Throughput (kBPD) 4,180
Petroleum Tank Trucks (thousands) 170.4Throughput (kBPD) 600
Number of Tank Cars (thousands) 3,411Throughput (kBPD) 300
Number of Refineries (as of 1/1/05) 152Capacity (kBPD) 17,387Throughput (kBPD) 16,662Utilization (%) 85.7
Crude stocks (mBBL) 342Total stocks (mBBL) 1,691
Total Miles ~190,000• Crude trunk line ~55,000• Crude gathering line ~40,000• Refined Product ~95,000
Throughput (kBPD) 25,000Crude + Product
Number 1,612Total storage capacity (mBBL) 700Typical stocks (mBBL) 237Utilization (%) 34
Source: Energy Information Administration/Association of Oil Pipelines/BP Statistical Review 2003/Opis/Department of Transportation/A.T. Kearney Analysis

A.T. Kearney 82/06.2006/13154 21
Petroleum enters and leaves the US supply chain at many locationsPetroleum enters and leaves the US supply chain at many locations
Source: Energy Information Agency, 2002
US Petroleum Oil Flow — Supply Chain Energy Balance — 2002(Million Barrels per Day)
A.T. Kearney 82/06.2006/13154 22
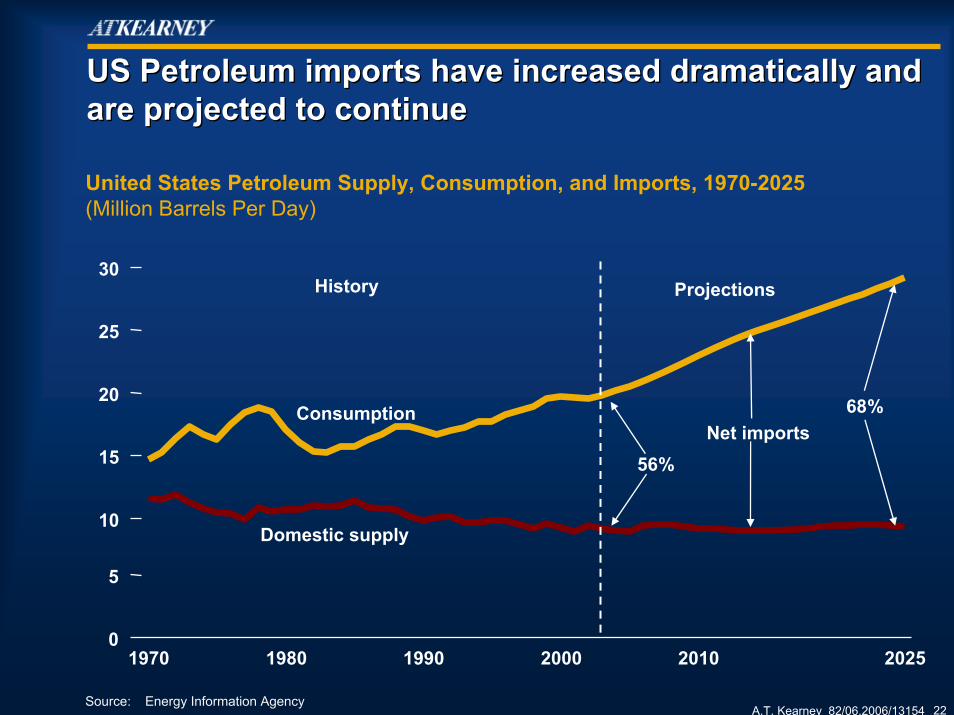
1970 1980 1990 2000 2010 20250
5
10
15
20
25
30
Domestic supply
Consumption
History Projections
Net imports56%
68%
US Petroleum imports have increased dramatically and US Petroleum imports have increased dramatically and are projected to continueare projected to continue
Source: Energy Information Agency
United States Petroleum Supply, Consumption, and Imports, 1970-2025(Million Barrels Per Day)

A.T. Kearney 82/06.2006/13154 23
Key Import Source Countries – 2005Total = 12,353 kBPD
US imports from most nations continues to grow, with major share gains from the Persian Gulf and CanadaUS imports from most nations continues to grow, with major share gains from the Persian Gulf and Canada
Key Import Source Countries – 1983Total = 5,051 kBPD
US Crude Oil Import Sources
Other40%
United Kingdom
7%
Venezuela8%
Canada11%
Mexico16%
Saudi Arabia
7%Columbia
2%Nigeria
6%
Norway1%
Persian Gulf (Rest)
2%
Iraq0%
Source: Energy Information Administration; A.T. Kearney analysis
Iraq4%
Algeria4%
Angola4%
Russia3%
United Kingdom
3%
Persian Gulf (Rest)
2% Other20%
Nigeria9%
Mexico11%
Venezuela
12%
Saudi Arabia
12%
Canada16%
A.T. Kearney 82/06.2006/13154 24
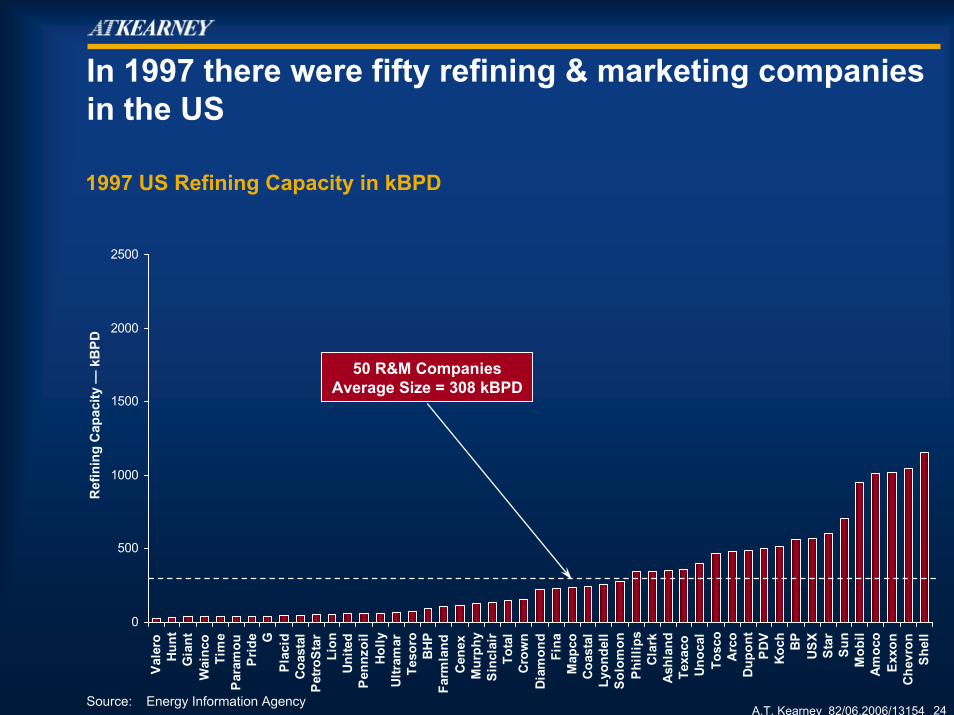
In 1997 there were fifty refining & marketing companies in the US
0
500
1000
1500
2000
2500
Vale
roH
unt
Gia
ntW
ainc
oTi
me
Par
amou
Prid
e GPl
acid
Coa
stal
Pet
roS
tar
Lion
Uni
ted
Pen
nzoi
lHo
llyU
ltram
arTe
soro
BH
PFa
rmla
ndC
enex
Mur
phy
Sinc
lair
Tota
lC
row
nDi
amon
dFi
naM
apco
Coa
stal
Lyon
dell
Solo
mon
Phi
llips
Cla
rkA
shla
ndTe
xaco
Unoc
alTo
sco
Arc
oD
upon
tP
DV
Koch BP
US
XSt
arS
unM
obil
Amoc
oEx
xon
Che
vron
She
ll
50 R&M CompaniesAverage Size = 308 kBPD
Ref
inin
g C
apac
ity —
kBPD
1997 US Refining Capacity in kBPD
Source: Energy Information Agency
A.T. Kearney 82/06.2006/13154 25
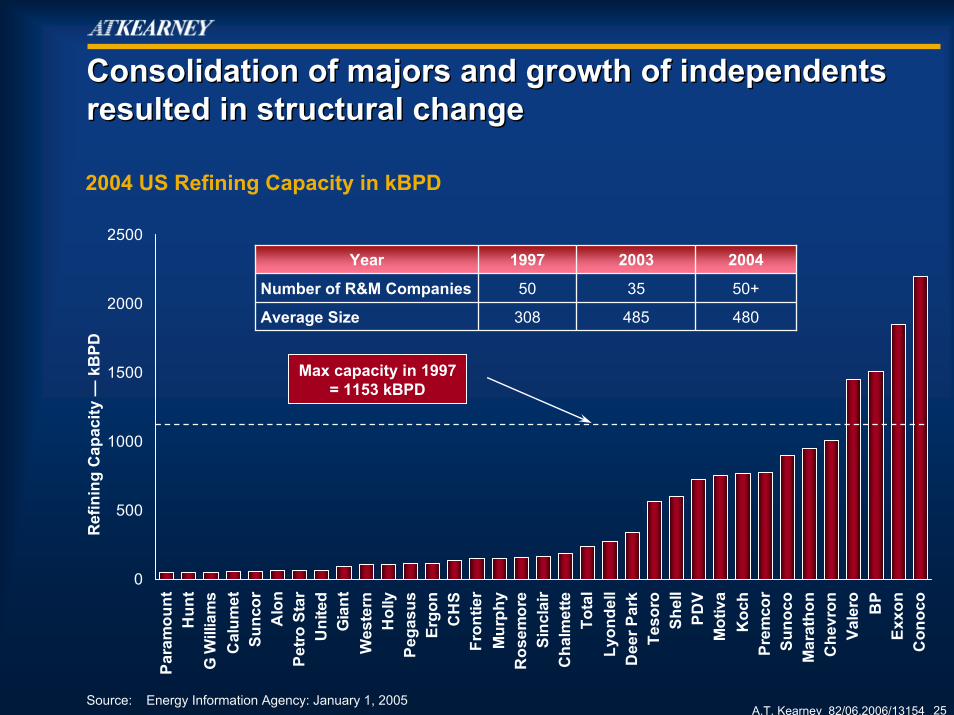
Consolidation of majors and growth of independents resulted in structural changeConsolidation of majors and growth of independents resulted in structural change
0
500
1000
1500
2000
2500
Para
mou
ntH
unt
G W
illia
ms
Cal
umet
Sunc
orA
lon
Petro
Sta
rU
nite
dG
iant
Wes
tern
Hol
lyPe
gasu
sEr
gon
CH
SFr
ontie
rM
urph
yR
osem
ore
Sinc
lair
Cha
lmet
teTo
tal
Lyon
dell
Dee
r Par
kTe
soro
Shel
lPD
VM
otiv
aK
och
Prem
cor
Suno
coM
arat
hon
Che
vron
Vale
ro BP
Exxo
nC
onoc
o
Ref
inin
g C
apac
ity —
kBPD
Year 1997 2003 2004
Number of R&M Companies 50 35 50+
480Average Size 308 485
2004 US Refining Capacity in kBPD
Source: Energy Information Agency: January 1, 2005
Max capacity in 1997= 1153 kBPD
A.T. Kearney 82/06.2006/13154 26
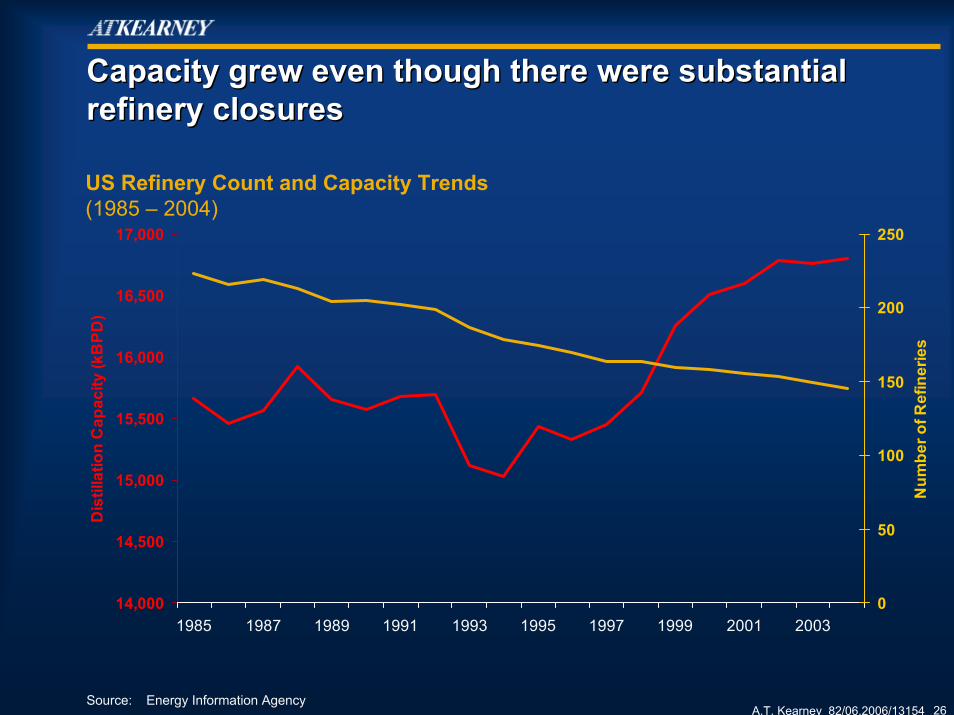
Capacity grew even though there were substantial refinery closuresCapacity grew even though there were substantial refinery closures
14,000
14,500
15,000
15,500
16,000
16,500
17,000
1985 1987 1989 1991 1993 1995 1997 1999 2001 2003
Dis
tilla
tion
Cap
acity
(kB
PD)
0
50
100
150
200
250
Num
ber o
f Ref
iner
ies
US Refinery Count and Capacity Trends(1985 – 2004)
Source: Energy Information Agency
A.T. Kearney 82/06.2006/13154 27
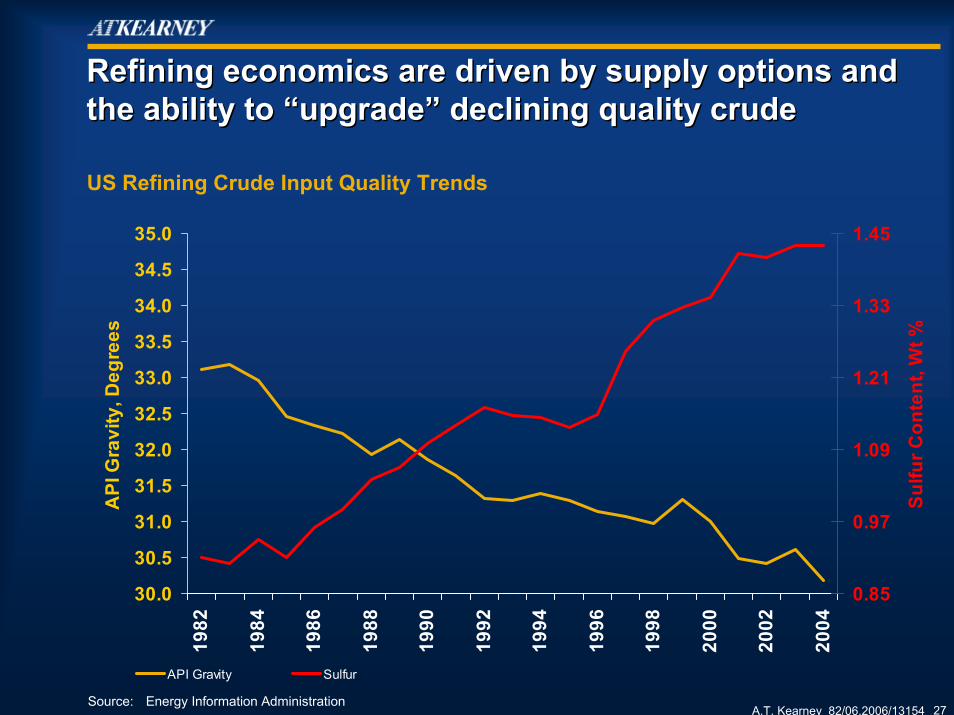
Refining economics are driven by supply options and the ability to “upgrade” declining quality crudeRefining economics are driven by supply options and the ability to “upgrade” declining quality crude
30.0
30.5
31.0
31.5
32.0
32.5
33.0
33.5
34.0
34.5
35.0
1982
1984
1986
1988
1990
1992
1994
1996
1998
2000
2002
2004
API
Gra
vity
, Deg
rees
0.85
0.97
1.09
1.21
1.33
1.45
Sulfu
r Con
tent
, Wt %
API Gravity Sulfur
US Refining Crude Input Quality Trends
Source: Energy Information Administration
A.T. Kearney 82/06.2006/13154 28
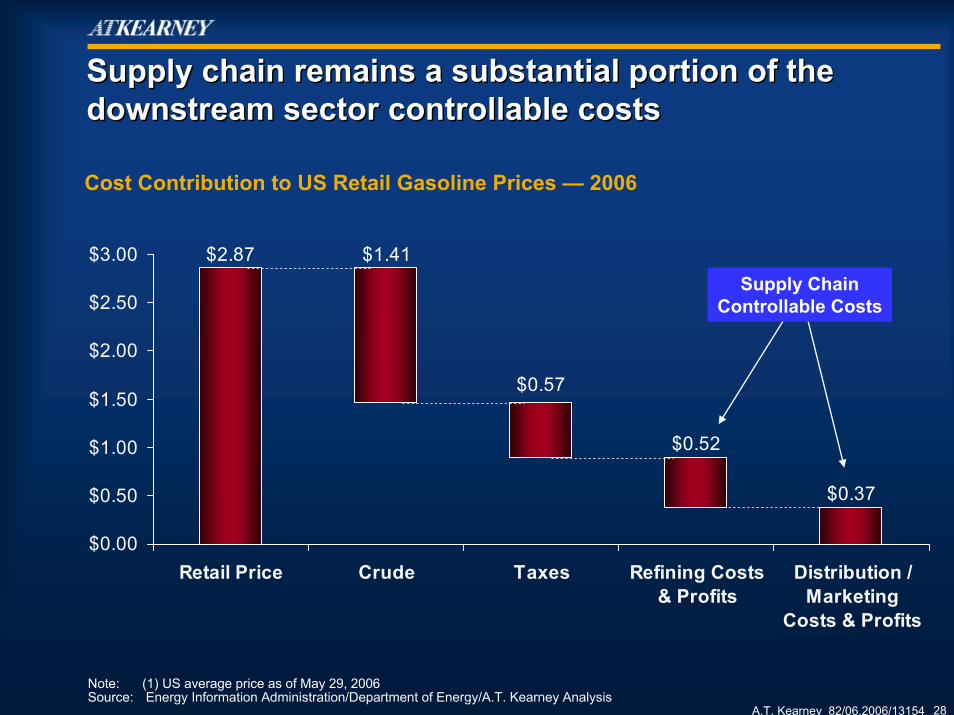
Supply chain remains a substantial portion of the downstream sector controllable costs Supply chain remains a substantial portion of the downstream sector controllable costs
$0.37
$0.52
$2.87 $1.41
$0.57
$0.00
$0.50
$1.00
$1.50
$2.00
$2.50
$3.00
Retail Price Crude Taxes Refining Costs& Profits
Distribution /Marketing
Costs & Profits
Cost Contribution to US Retail Gasoline Prices — 2006
Note: (1) US average price as of May 29, 2006Source: Energy Information Administration/Department of Energy/A.T. Kearney Analysis
Supply ChainControllable Costs

A.T. Kearney 82/06.2006/13154 29
A Look to the FutureA Look to the Future

A.T. Kearney 82/06.2006/13154 30
The Global Business Policy Council provides deep insight into future trendsThe Global Business Policy Council provides deep insight into future trends
The Global Business Policy Council (GBPC) was formed over a decade ago with the objective of providing early warningagainst accelerating shifts in economics, politics, technology, demographics, and culture that are poised to shape and shakethe global business environment
Membership in the GBPC is limited to a select group of corporate leaders (~50) and their companies joined by a small group of world-renowned policy makers, scholars, and other thought leaders and their companies.
Each year, these members have threeopportunities to gather for two-to-three days of intense discussion and reflection on the forces shaping a volatile and continually changing global business environment
The Council produces a series of intellectualcapital products that provide a broad rangeof insights on important global trends
Why is this so important?

A.T. Kearney 82/06.2006/13154 31
72%63% 67%
62%
33%25%
17% 17% 19%
66%
51%43%
38% 35% 35% 32% 28% 27%
Traditional risks are giving way to a number of emerging risks to which companies are exposed Traditional risks are giving way to a number of emerging risks to which companies are exposed
Traditional RisksDecrease of 6 – 24%
Since 2003 Emerging Risks
Increase of 4 – 11% since 2003
Most Critical Risks to Firm Operations (2005)(% of Total Respondents)
Government Regulation /
Legal Decisions
Country Financial
Risk
Currency / Interest
Rate Volatility
Political and Social
Disturban-ces
Disruption of Key
Supplier / Customer /
Partner
Corporate Governance
Issues
IT Disruption
Theft of Intellectual Property
Product Quality / Safety
Problems
Source: A.T. Kearney Global Business Policy Council, 2006.
20052003

A.T. Kearney 82/06.2006/13154 32
Large firms often attribute earnings under-performance to unexpected external events Large firms often attribute earnings under-performance to unexpected external events
43% of Fortune 100 companies blamed unexpected external events for failure to meet earnings expectations
43% Blame External Events
External Events Reported in 2003 Annual Reports of the Fortune 100
Note: (1) Percentages do not add up due to multiple events reported by some companiesSources: A.T. Kearney Global Business Policy Council analysis of companies annual reports
20%
12%
12%
11%
9% Terrorism
Foreign Exchange Crisis
September 11th
War in Iraq
Crisis in Latin America
A.T. Kearney 82/06.2006/13154 33
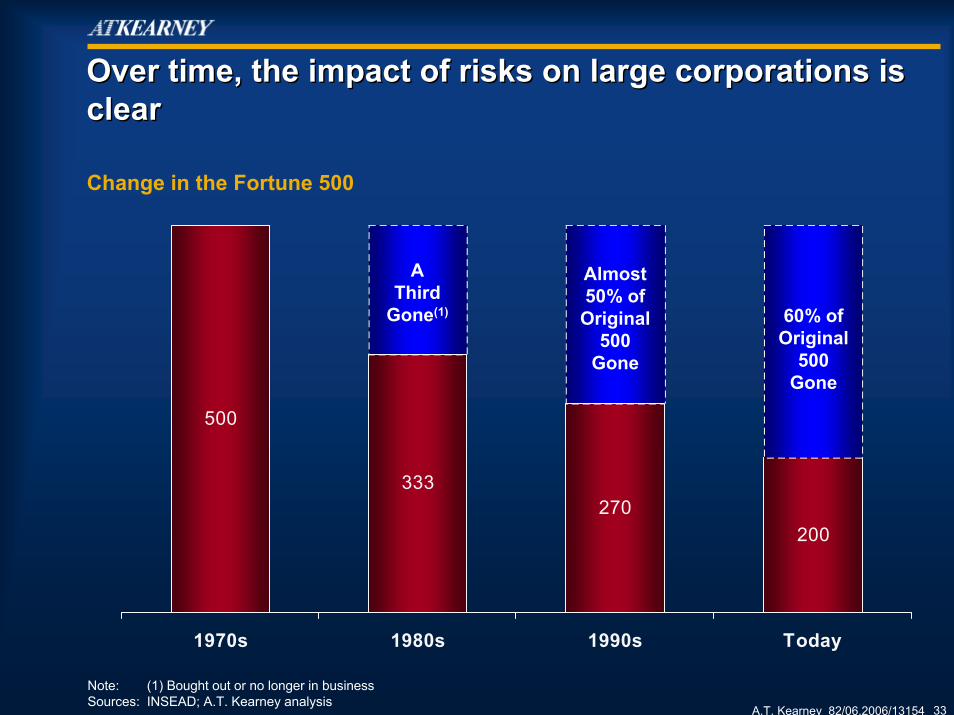
Over time, the impact of risks on large corporations is clearOver time, the impact of risks on large corporations is clear
200270
333
500
Today1990s1980s1970s
Almost 50% of
Original 500
Gone
A Third
Gone(1) 60% of Original
500 Gone
Change in the Fortune 500
Note: (1) Bought out or no longer in businessSources: INSEAD; A.T. Kearney analysis

A.T. Kearney 82/06.2006/13154 34
To better understand risks, A.T. Kearney focuses on the forces reshaping the worldTo better understand risks, A.T. Kearney focuses on the forces reshaping the world

A.T. Kearney 82/06.2006/13154 35
The implications for oil and gas supply chains are immenseThe implications for oil and gas supply chains are immense
• Sourcing• Labor Conditions• Environment• Privacy
• Increasing segmentation
• Shift of location of demand
• Fundamental shift in customer demand and labor supply
• Major growth outside US
• New competitors
• Potential supply disruptions
New ConsumersGlobalization
Natural Resources &Environment
Demographics
Regulation & Activism
Wildcards
Technology & Innovation
• Continuous opportunities/threats from new products, processes, technologies

A.T. Kearney 82/06.2006/13154 36
Developed Nations• Expansion of Older Population• Environmental and Social Responsibility Preferences
Emerging Nations• Access and Economic Development• Technology Growth
20,000
25,000
30,000
35,000
40,000
45,000
50,000
55,000
60,000
1996 1997 1998 1999 2000 2001 2002 2003 2004 2005 2006E 2007E 2008E 2009E 2010E
Economic performance and customer preferences drive global demand for petroleumEconomic performance and customer preferences drive global demand for petroleumIncreased Demand — Worldwide Revival of Economy
Further influenced by political unrest in certain regions (e.g. Middle East)
GDP Top 30 Countries
Demographics
Source: Global Insight, A.T. Kearney analysis

A.T. Kearney 82/06.2006/13154 37
Industries, including petrochemicals, are rebalancing to meet demographic and preference shiftsIndustries, including petrochemicals, are rebalancing to meet demographic and preference shiftsUnprecedented Demand Shifting —Fundamental Relocation of Industries
After China, India is likely to be the next area for major growth
Demographics
Source: Global Insight, A.T. Kearney analysis
China
EU
NAFTA
Exports of Finished Goods
Future Exports of Petrochemicals

A.T. Kearney 82/06.2006/13154 38
By 2020, middle income spending will shift to emerging markets — how will you seize the market opportunity?By 2020, middle income spending will shift to emerging markets — how will you seize the market opportunity?
Source: World Bank, EIU, U.S. Census Bureau, A.T. Kearney analysis
Middle Income Upper MiddleUpper Middle Upper Income Upper Income Scale: 10 million consumersScale: 10 million consumers
Total middle income consumers = 2.3 billion
(31% world population)
Ecuador
New ZealandIndonesia
Taiwan
Canada
Argentina
Chile
Peru
Central America
Ireland
Benelux
Italy
Portugal Austria Switzerland
Turkey
Iran
GreeceNorth Africa
South AfricaAustralia
Philippines
Thailand
Singapore
Hong Kong
South Korea
Columbia Venezuela
U.S. China
Mexico
Brazil
France
Spain
UK
Russia
EasternEurope
Japan
Germany
India
Israel
Iran
TurkeyItaly
Scandinavia
Globalization / New Consumers

A.T. Kearney 82/06.2006/13154 39
Ceyhan
Oil Fields Realistic Projects Postponed Projects2004 finalized Existing Pipelines
New pipelines and terminals are securing supply flexibility and connecting resources with customersNew pipelines and terminals are securing supply flexibility and connecting resources with customers
New Consumers
Oil & Gas Pipeline Projects
Source: DekaBank
China
Russia
Chad
Beijing
DaqingUlan-Ude
Irkutsk
Krasnojarsk
Novo-sibirsk
Tengiz
Baku
NovorossiskSamsun
Ventspils
Nachodka
Kola
Ürünqi
Clair OilOstsee-Pipeline
Chad-Cameroon
Baku-Ceyhan
Caspic Pipeline
Samsun-CeyhanSiberia-Beijing
Sibirien-Japanisches Meer
Sibirien-Nordostchina
Westsibirien-Westchina
Northern Gateway

A.T. Kearney 82/06.2006/13154 40
In the near term, global oil tanker capacity will not be the limiting factor for accessing customersIn the near term, global oil tanker capacity will not be the limiting factor for accessing customers
• Cyclical industry: just emerging from supply constraint situation
• Over 88 mm tons of orders (~11 mbd); 66mm tons (~8.3 mbd), between 2005-2007
• Oil demand is likely to increase 5.4 mbdthrough 2010 in the most aggressive IEA scenario
• Concerns on tanker supply post-2010 remain, given the dramatic oil demand growth in China, the Venezuelan output reduction and long-haul supply increase
But the shift in oil demand balance may cause capacity constraints in the mid- and long-term
0.0
2.0
4.0
6.0
8.0
10.0
2005 – 2007m
bd
Oil Demand Growth Tanker Capacity Growth
Oil Demand vs. Tanker Capacity Growth (2005-2007)
Globalization/New Consumers
Source: Deutsche Bank analyst reports; A.T. Kearney analysis
A.T. Kearney 82/06.2006/13154 41
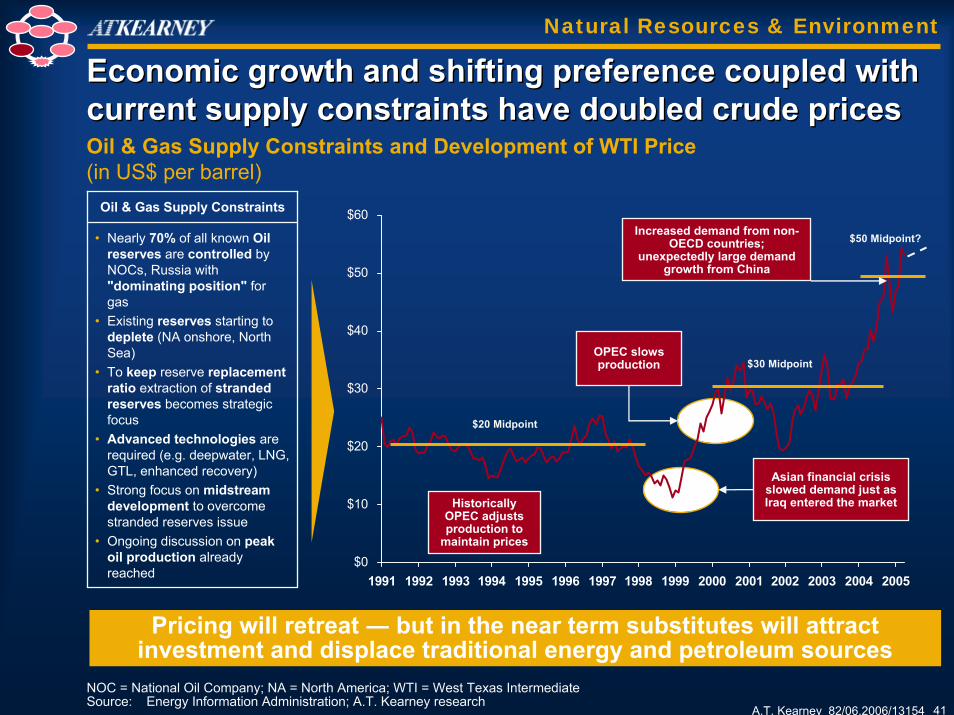
Economic growth and shifting preference coupled with current supply constraints have doubled crude pricesEconomic growth and shifting preference coupled with current supply constraints have doubled crude prices
NOC = National Oil Company; NA = North America; WTI = West Texas IntermediateSource: Energy Information Administration; A.T. Kearney research
$0
$10
$20
$30
$40
$50
$60
1991 1992 1993 1994 1995 1996 1997 1998 1999 2000 2001 2002 2003 2004 2005
$20 Midpoint
$30 Midpoint
$50 Midpoint?
Asian financial crisis slowed demand just as Iraq entered the market
OPEC slows production
Increased demand from non-OECD countries;
unexpectedly large demand growth from China
Historically OPEC adjusts production to
maintain prices
Oil & Gas Supply Constraints
• Nearly 70% of all known Oil reserves are controlled by NOCs, Russia with "dominating position" for gas
• Existing reserves starting to deplete (NA onshore, North Sea)
• To keep reserve replacement ratio extraction of stranded reserves becomes strategic focus
• Advanced technologies are required (e.g. deepwater, LNG, GTL, enhanced recovery)
• Strong focus on midstream development to overcome stranded reserves issue
• Ongoing discussion on peak oil production already reached
Oil & Gas Supply Constraints and Development of WTI Price (in US$ per barrel)
Pricing will retreat ― but in the near term substitutes will attract investment and displace traditional energy and petroleum sources
Natural Resources & Environment
A.T. Kearney 82/06.2006/13154 42
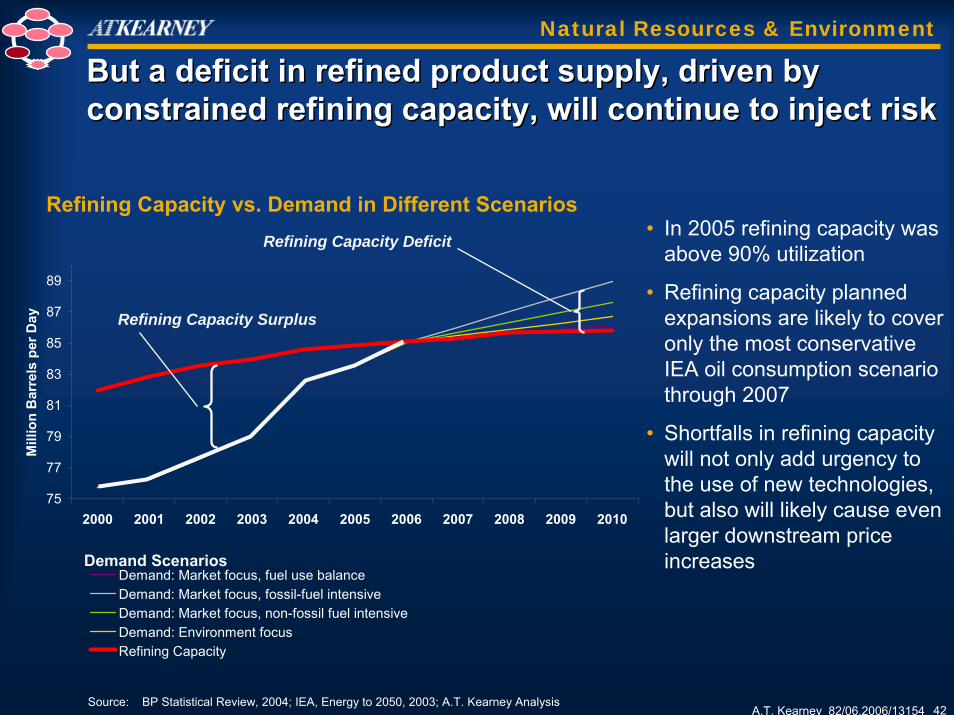
But a deficit in refined product supply, driven by constrained refining capacity, will continue to inject riskBut a deficit in refined product supply, driven by constrained refining capacity, will continue to inject risk
• In 2005 refining capacity was above 90% utilization
• Refining capacity planned expansions are likely to cover only the most conservative IEA oil consumption scenario through 2007
• Shortfalls in refining capacity will not only add urgency to the use of new technologies, but also will likely cause even larger downstream price increases
Refining Capacity vs. Demand in Different Scenarios
Source: BP Statistical Review, 2004; IEA, Energy to 2050, 2003; A.T. Kearney Analysis
75
77
79
81
83
85
87
89
2000 2001 2002 2003 2004 2005 2006 2007 2008 2009 2010
Mill
ion
Bar
rels
per
Day
Demand: Market focus, fuel use balanceDemand: Market focus, fossil-fuel intensiveDemand: Market focus, non-fossil fuel intensiveDemand: Environment focusRefining Capacity
Refining Capacity Surplus
Refining Capacity Deficit
Demand Scenarios
Natural Resources & Environment

A.T. Kearney 82/06.2006/13154 43
145
1563
67
94
206
445
300
North America
Western Europe
Total Atlantic Basin
Indus-trialized
Asia
China Rest of Asia
Total Pacific Basin
Total
Several regions are expected to face potential refined oil supply deficits over the next 5 years …Several regions are expected to face potential refined oil supply deficits over the next 5 years …
• Strong demand growth for middle and light distillates
• Strict fuel norms leading to closure of marginal units
• Few investments in new capacity
Key Drivers • Robust demand growth driven by overall economic growth in the region
• Growth in Chinese consumption driven by transportation and petrochemicals sector
• Closure of uneconomical & marginal units
Atlantic Basin Pacific Basin
Shift in location of demand
Expected Refined Oil Product Deficit Regions in 2010(Figures in mtpa1)
Note: (1) mtpa=Million Metric Tons per annum; 1 mtpa = 0.02 mbdSource: EIA Outlook, Analyst Reports, A.T.Kearney analysis
Natural Resources & Environment

A.T. Kearney 82/06.2006/13154 44
… with projected refined oil product capacities unable to address these deficits… with projected refined oil product capacities unable to address these deficits
Assumptions: Based on historical flows, it is assumed that 75% of Middle East production will be available for Asia Pacific, Eastern Europe, Latin America & Africa; surplus is assumed to serve North America and Europe demand
Source: EIA Outlook; Analyst Reports; A.T.Kearney analysis
33
20
15-94
S. Korea
IndustrializedAsia
MiddleMiddle--easteast
AfricaAfrica
Latin AmericaLatin America
Supply deficit Supply surplusLikely flows based on historical trends
West Europe East Europe
China
Pacific Basin (Unmet Demand)
Atlantic Basin (Unmet Demand)
Expected Demand Supply Scenario – 2010 (Figures in mtpa)
-50
-207-65
-15
Rest of Asia
North America
-67
-62
175
90
Natural Resources & Environment
A.T. Kearney 82/06.2006/13154 45
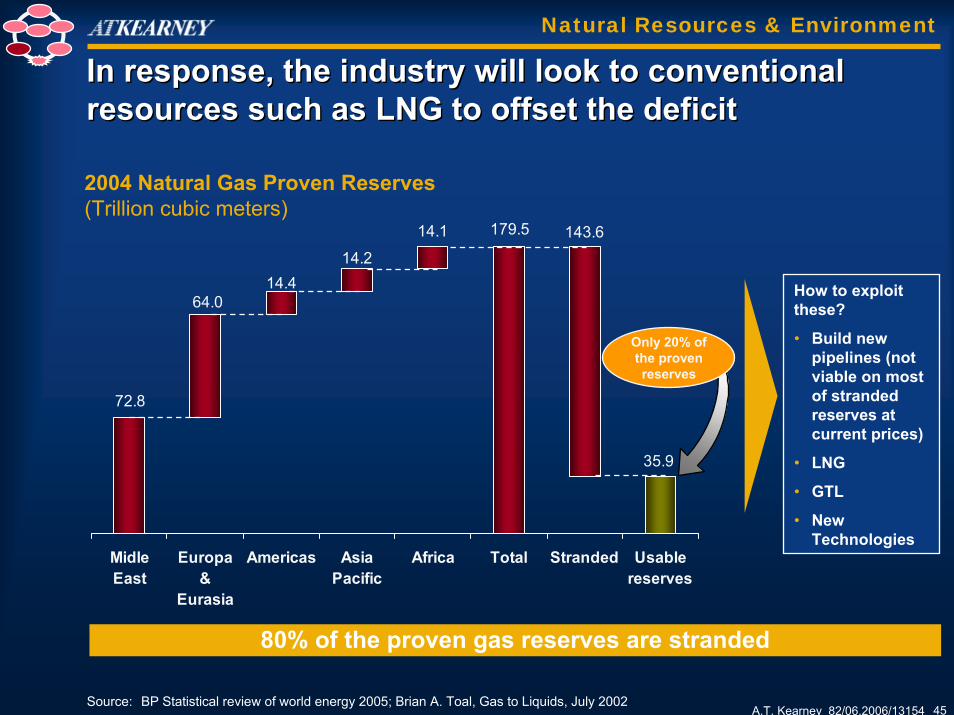
In response, the industry will look to conventional resources such as LNG to offset the deficitIn response, the industry will look to conventional resources such as LNG to offset the deficit
72.8
64.014.4
14.2
14.1 179.5 143.6
35.9
MidleEast
Europa&
Eurasia
Americas AsiaPacific
Africa Total Stranded Usablereserves
Only 20% of the proven reserves
How to exploit these?
• Build new pipelines (not viable on most of stranded reserves at current prices)
• LNG
• GTL
• New Technologies
Natural Resources & Environment
2004 Natural Gas Proven Reserves(Trillion cubic meters)
Source: BP Statistical review of world energy 2005; Brian A. Toal, Gas to Liquids, July 2002
80% of the proven gas reserves are stranded

A.T. Kearney 82/06.2006/13154 46
LNG is playing an increasingly important role in the international gas trade …LNG is playing an increasingly important role in the international gas trade …
Natural gas LNG
11.4
13.13
3.41
10.75
2.25
9.80
62.57
46.5786.22
7.30
8.296.15
2.63 7.50
1.68
102.5 8.69 7.53 18.8
14.35
6.29
3.91
7.96
7.109.22
6.00 4.0
5
16.63
5.00
21.19
11.27.11
7.20
Source: IEA, World Energy Outlook 2004
North America Asia Europe
0
100
200
300
400
500
600
700
800
1985 1990 1995 2002 2010 2020 2030
Natural Gas and LNG Trade Flows Worldwide 2004 (bcm)
LNG Volume & Development (bcm)
Note: bcm = Billion Cubic MetersSource: BP Statistical review 2005
Natural Resources & Environment
9.10
21.98
3.2423.606.25
A.T. Kearney 82/06.2006/13154 47
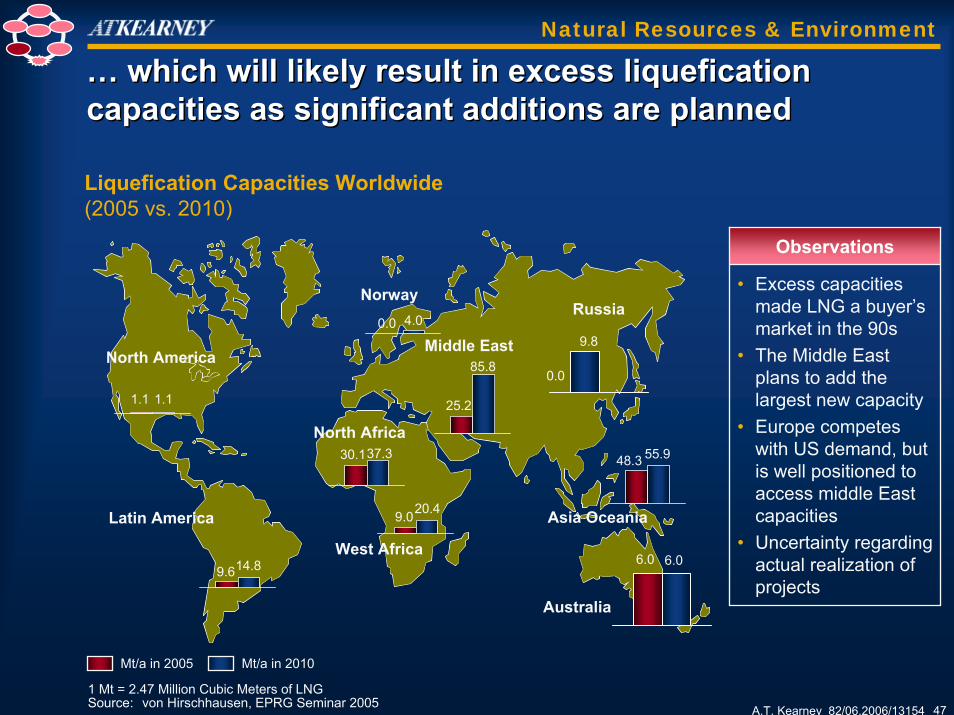
… which will likely result in excess liquefication capacities as significant additions are planned … which will likely result in excess liquefication capacities as significant additions are planned
Middle East
Australia
Asia Oceania
West Africa
Latin America
North America
NorwayRussia
6.0 6.0
0.0 4.0
0.0
9.8
9.020.4
9.614.8
1.1 1.1
48.3 55.9
25.2
85.8
North Africa30.137.3
Mt/a in 2005 Mt/a in 2010
Liquefication Capacities Worldwide (2005 vs. 2010)
Observations
• Excess capacities made LNG a buyer’s market in the 90s
• The Middle East plans to add the largest new capacity
• Europe competes with US demand, but is well positioned to access middle East capacities
• Uncertainty regarding actual realization of projects
1 Mt = 2.47 Million Cubic Meters of LNGSource: von Hirschhausen, EPRG Seminar 2005
Natural Resources & Environment

A.T. Kearney 82/06.2006/13154 48
The key conventional energy resources will face challenges after 2020The key conventional energy resources will face challenges after 2020
Conventional energy resources
Renewable resources
19901990 20002000 20102010 20202020 20302030 20402040
OilOil
Gas
Nuclear powerThe future of the nuclear energy The future of the nuclear energy supply depends on technology and supply depends on technology and regulatory advancesregulatory advances
GTL technologies opening GTL technologies opening opportunity for exploiting stranded opportunity for exploiting stranded gasgas
Resources will focus on limited Resources will focus on limited countries driven by distance from countries driven by distance from the marketthe market
Technology improvements could Technology improvements could retard the oil scarcityretard the oil scarcity
Competition with food and leisure Competition with food and leisure for land usefor land use
Prices will further be reduced, new Prices will further be reduced, new forms of energy storage requiredforms of energy storage required
Gas
Nuclear Power
Coal
Biofuels
Solar, wind & water
Source: A.T. Kearney; Shell Study 2050
Energy Resources Constraints
Technology & Innovation
A.T. Kearney 82/06.2006/13154 49
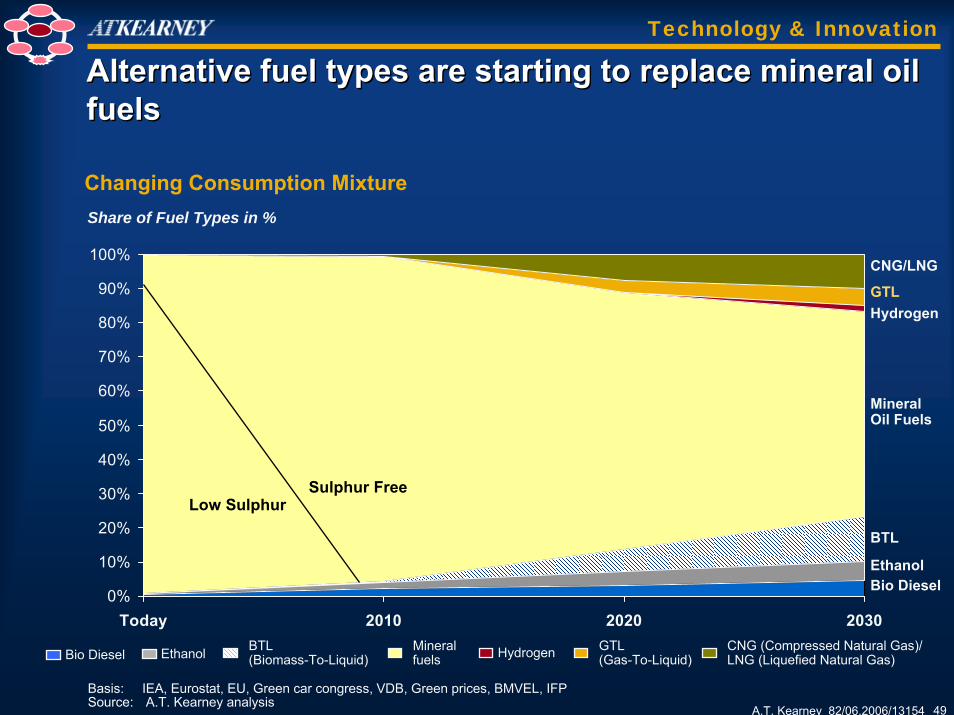
Alternative fuel types are starting to replace mineral oil fuelsAlternative fuel types are starting to replace mineral oil fuels
0%
10%
20%
30%
40%
50%
60%
70%
80%
90%
100%
Today 2010 2020 2030
Bio DieselEthanol
BTL
HydrogenGTL
CNG/LNG
MineralOil Fuels
Share of Fuel Types in %
Sulphur Free
Mineral fuelsEthanol BTL
(Biomass-To-Liquid) Hydrogen GTL (Gas-To-Liquid)
CNG (Compressed Natural Gas)/ LNG (Liquefied Natural Gas)
Low Sulphur
Changing Consumption Mixture
Basis: IEA, Eurostat, EU, Green car congress, VDB, Green prices, BMVEL, IFP Source: A.T. Kearney analysis
Bio Diesel
Technology & Innovation

A.T. Kearney 82/06.2006/13154 50
GTL has only recently become a competitive technologyGTL has only recently become a competitive technology
Technology & Innovation
GTL technology has a cost structure advantage at oil prices exceeding US$20 per bbl
Diesel Production Costs Comparison(US$/BBL)
Exploiting stranded gas reserves requires less capital than other unconventional hydrocarbon
development processes
Unconventional Petroleum Liquids Capital Investment Costs(Us$’000/Bpd)
Shale OilOil Sands
Extra-heavy Oil
Biomass –To-Liquids
Coal-To-LiquidsGas-To-Liquids
Oil Refinery
0 20 40 60 80 100 120 140 160
Notes: (1) International average gas prices, May 2006; US$ 1.00/MMBtu(2) ConocoPhillips estimates(3) Considering an average price of US$50 per bbl
Source: 2006 EIA Energy Outlook and Modeling Conference Handouts; Rentech Co.;A.T. Kearney analysis
RefineryGTL
2414
7
50
10
59
28
Cost Advantage:US$31/Bbl(3)
Equilibrium Price:US$20/Bbl
Feedstock(1)
Capex recovery & taxes(2)
Operating cost(2)

A.T. Kearney 82/06.2006/13154 51
GTL is a promising technology to substitute oil demand from stranded gas reservesGTL is a promising technology to substitute oil demand from stranded gas reserves
Technology & Innovation
Source: ConocoPhililps, 2005; New York Times, 5/2006; A.T. Kearney research
Drivers for Development
• Push to monetize stranded reserves
• Push to utilize wells that are too small for pipelines’ viability at current prices (e.g. Nigeria, Malaysia, South Africa)
• Decreasing cost and improvement of the technology
• Oil price that allows technology to be a viable alternative only since 2000
Investment and Interest Growing
• ExxonMobil, ConocoPhillips, Shell, Chevron, BP investing heavily in GTL technology in Africa, Asia, and Latin America
• US military is testing alternative fuels based on GTL technologies (5/06, New York Times)
• By 2020, GTL plants will produce ~1 mbd GTL products (~70+% from Qatar), and substitute up to 3% of world diesel and naphta markets
However, it is likely that before 2020, the technology will only relieve about 1% of oil demand

A.T. Kearney 82/06.2006/13154 52
Currently, tax breaks are major growth drivers for bio fuels with very few exceptionsCurrently, tax breaks are major growth drivers for bio fuels with very few exceptions
National bio diesel tax breaks compared to mineral diesel 2005 (€ ct/l)
Correlation between bio diesel tax breaks and market share per EU country Conclusions:
Positive correlation exists between bio diesel tax breaks and market share of bio diesel (e.g. Germany, France, Italy and Spain) with only few exceptionsSlovenia, Portugal and Greece with significant bio diesel share despite missing tax breaksCountries like UK and Hungary with relatively low bio diesel share despite significant tax breaks (but: Hungary's entry into EU 2005, UK with tax breaks since 2003)
Tax breaks and share of bio fuel per country (example bio diesel)
1) Quotas for the volume of bio diesel that receives tax breaksSource: A.T. Kearney analysis
0.0%
0.5%
1.0%
1.5%
2.0%
2.5%
3.0%
3.5%
4.0%
0 10 20 30 40 50
GRMAIR, FIN, DEN
B GE, LIT Fr
UK
IT
LAT, POR, SLO
N
A
SW
SP
CZ
H
Share of bio dieselper country2005 (in % of diesel market)
Technology & Innovation

A.T. Kearney 82/06.2006/13154 53
Fuel Cells will create significant opportunities when commercializedFuel Cells will create significant opportunities when commercialized
0
5000
10000
2001 2002 2003 2004 2005 2006 2007 2008 2009 2010 2011 2012 2013 2014 2015
Market Volume(1)
(US$ millions)
Portable
Stationary
MobilePrototype
phase
CommercialPhase
Expected MarketShare in 2015
Mobile
Portable
Stationary
PassengerCars
Other Cars &VehiclesBattery
Replacement
Generators
Commercial/Industrial
Residential30%
10%
2-10%(of new car
registrations)Prototype Phase
PrototypePhase
PrototypePhase
Launch
LaunchCommercial Phase
Launch
Launch
Commercial Phase
Launch
Launch
CommercialPhase
Best Case Scenarios
Fuel Cell Market Scenario 2015
Note: (1) Market covers only Fuel Cells, excl. revenues from new fuels Source: A.T. Kearney analysis
Technology & Innovation

A.T. Kearney 82/06.2006/13154 54
The race for the future energy technologies is still openThe race for the future energy technologies is still open
1800 1850 1900 1950 2000 …
Energy Technology Discontinuities
Wood,Wind,Water,Ani-mals
Steam Engine, Coal
Electric Dynamo,
Coal
Internal Com-
bustionEngine, Oil
Nu-clear
Power 1970–1990
CCGT Gas1) >1990
Solarenergy ?
Bio Fuels?
Fuel Cell hydrogen?
GTL?
New Technologies
Note: (1) Combined cycle gas turbineSource: A.T. Kearney; Shell Study 2050
• Commercial introduction of new primary energy takes ~ 25 years to obtain 1% of global market
• Future energy resources will focus on low emissions but several issues have still to be solved— Improving GTL technology— Nanotechnology:
– Hydrogen/energy storage– Costs– Efficiency
― Solar energy― Bio fuels scale economic
viability― Government efforts and
interests
Technology & Innovation
A.T. Kearney 82/06.2006/13154 55
A deregulatory era may be over — How will you manage governments’ “visible hand”?A deregulatory era may be over — How will you manage governments’ “visible hand”?
Powerful Forces Push New Constraints
Returning trend of nationalization – Venezuela / Bolivia
Mandated environmental compliance• Sulfur emissions• Greenhouse gasses
The growing crisis of corporate credibility
Mingling of science and ethics — including human cloning and ongoing biotechnology developments
63% of US citizens believe corporations are too powerful(1)
Source: (1) The Arlington Institute
Regulation & Activism
A.T. Kearney 82/06.2006/13154 56
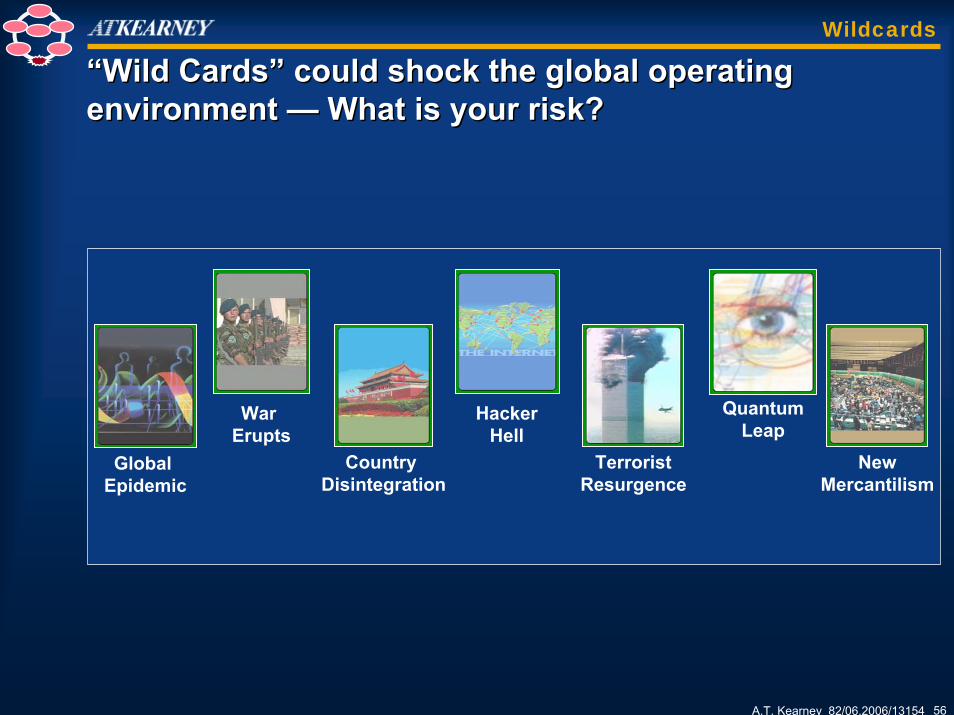
“Wild Cards” could shock the global operating environment — What is your risk?“Wild Cards” could shock the global operating environment — What is your risk?
Country Disintegration
War Erupts
NewMercantilism
TerroristResurgence
HackerHell
Global Epidemic
QuantumLeap
Wildcards

A.T. Kearney 82/06.2006/13154 57
Supply disruptions may occur because of disruption at a transit “chokepoint”…Supply disruptions may occur because of disruption at a transit “chokepoint”…
Supply Chokepoint — Oil & Gas:
Potential Transit Chokepoint Politically Unstable Country With Oil Or Gas Resources
Wildcards

A.T. Kearney 82/06.2006/13154 58
GBPC executives recently reviewed these major forces ― three future scenarios remained but were refinedGBPC executives recently reviewed these major forces ― three future scenarios remained but were refined
New ConsumersGlobalization
Natural Resources &Environment
Demographics
Regulation & Activism
Wildcards
Technology & Innovation
“Circle the Wagons” —suggests the US becomes isolationist
“Patchwork World” — the US remains engaged in world affairs, but with limited friends
“Open Society” —combines multilateral problem solving with global open markets
A.T. Kearney 82/06.2006/13154 59
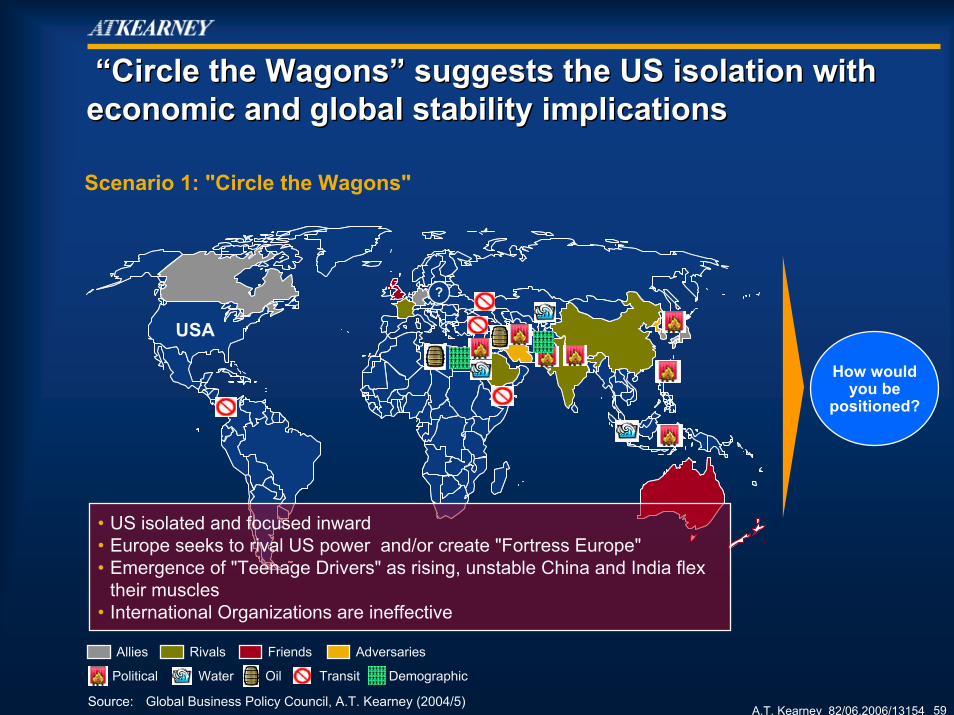
“Circle the Wagons” suggests the US isolation with economic and global stability implications“Circle the Wagons” suggests the US isolation with economic and global stability implications
USA
Allies Rivals Friends Adversaries
Political DemographicWater Oil Transit
• US isolated and focused inward• Europe seeks to rival US power and/or create "Fortress Europe"• Emergence of "Teenage Drivers" as rising, unstable China and India flex
their muscles• International Organizations are ineffective
How wouldyou be
positioned?
Scenario 1: "Circle the Wagons"
Source: Global Business Policy Council, A.T. Kearney (2004/5)
?

A.T. Kearney 82/06.2006/13154 60
"Patchwork World" considers the US to remain engaged in world affairs, but with limited friends"Patchwork World" considers the US to remain engaged in world affairs, but with limited friends
USA
Allies Rivals Friends Adversaries
Political DemographicWater Oil Transit
• Resembles 2004• US engages on issues of national interest• Mixed EU-US relationship with both cooperation and tensions• Most conflicts remain localized• International Organizations remain active but weak
How wouldyou be
positioned?
Scenario 2: "Patchwork World"
Source: Global Business Policy Council, A.T. Kearney (2004/5)
?

A.T. Kearney 82/06.2006/13154 61
"Open Society" combines multilateral problem solving with global open markets"Open Society" combines multilateral problem solving with global open markets
USA
Allies Rivals Friends Adversaries
Political DemographicWater Oil Transit
• Emphasis on multilateral problem solving• Global problems moderated by action• Resumption of robust global growth and stability• Coalitions counter terror and local conflict
How wouldyou be
positioned?
Scenario 3: "Open Society"
Source: Global Business Policy Council, A.T. Kearney (2004/5)
?

A.T. Kearney 82/06.2006/13154 62
Keys to valueKeys to value

A.T. Kearney 82/06.2006/13154 63
History of A.T. Kearney's Assessment of Excellence in Supply Chain
1992 1996
1992 Leadership Practices In
Procurement Study
Participant Profile:• 25 from North
America
1996 Leadership Practices In
Procurement Study
Participant Profile:• 51 from Europe• 26 from North America
Participant Profile:• 86 from Europe• 40 from North America• 26 from Asia and
Emerging markets• 10 from South America
Participant Profile:• 53 from North
America• 45 from Europe• 31 from South
America• 18 from Asia and
Emerging markets
25 Total Participants77 Total Participants 1999
2002
2004
1999 Assessment of Excellence in
Supply Chain
2002 Assessment of Excellence in
Supply Chain
2004 Assessment of Excellence in
Supply Chain
162 Total Participants
147 Total Participants
300+Total Participants
Participant Profile:• 150+ from Europe• 130+ from N. Amer.• 50+ from Asia-Pacific• 30+ from S. Amer.
SupplierRelationshipManagement
Supply Management
Strategy
Organizational Alignment
StrategicSourcing
OperatingProcess Management
Knowledge/InformationManagementPerformance Management
Human Resources Management
A.T. Kearney conducts proprietary research to understand the practices driving value in supply chainA.T. Kearney conducts proprietary research to understand the practices driving value in supply chain

A.T. Kearney 82/06.2006/13154 64
5.3% 5.0%
8.1%
9.8%
3.6%
2.1%2.9%
1.9%
DirectMaterials
IndirectMaterials
CapitalExpenditure
Services
LeadersFollowers
7.1% 7.3%
3.2%
6.4%
4.7%6.1%
2.0% 1.5%
6.0% 5.8%
1999 2000 2001 2002 2003
Leaders
Industries Average (in which Leaders participate)
Source: A.T. Kearney AESC 2004 Survey
These practices are correlated to differentiated business performanceThese practices are correlated to differentiated business performance
Average Annual Savings Over Past Two Years Net Income Margin (1999 – 2003)
A.T. Kearney 82/06.2006/13154 65
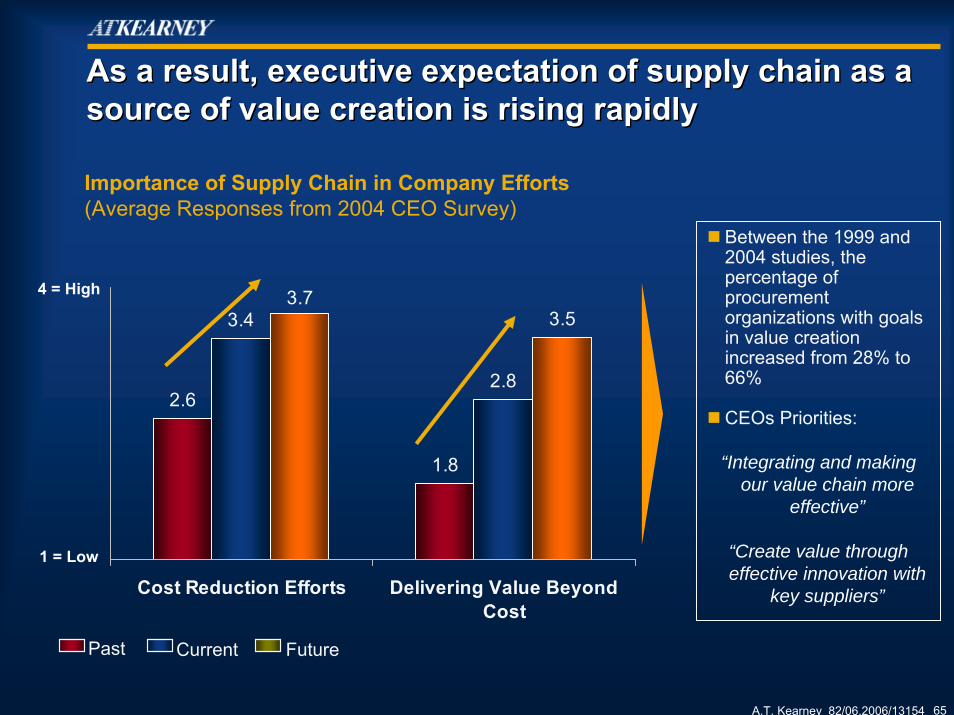
As a result, executive expectation of supply chain as a source of value creation is rising rapidlyAs a result, executive expectation of supply chain as a source of value creation is rising rapidly
1 = Low
4 = High
2.6
1.8
3.4
2.8
3.73.5
Cost Reduction Efforts Delivering Value BeyondCost
Importance of Supply Chain in Company Efforts(Average Responses from 2004 CEO Survey)
Past Current Future
Between the 1999 and 2004 studies, the percentage of procurement organizations with goals in value creation increased from 28% to 66%
CEOs Priorities:
“Integrating and making our value chain more
effective”
“Create value through effective innovation with
key suppliers”

A.T. Kearney 82/06.2006/13154 66
A.T. Kearney has identified four key levers for supply chain value creation A.T. Kearney has identified four key levers for supply chain value creation
Innovation
and Growth
Value C
hain
Optimiza
tion
Advanced
Cost Management
Risk M
anag
emen
t/
Supply Contin
uity
ValueCreation
A.T. Kearney 82/06.2006/13154 67
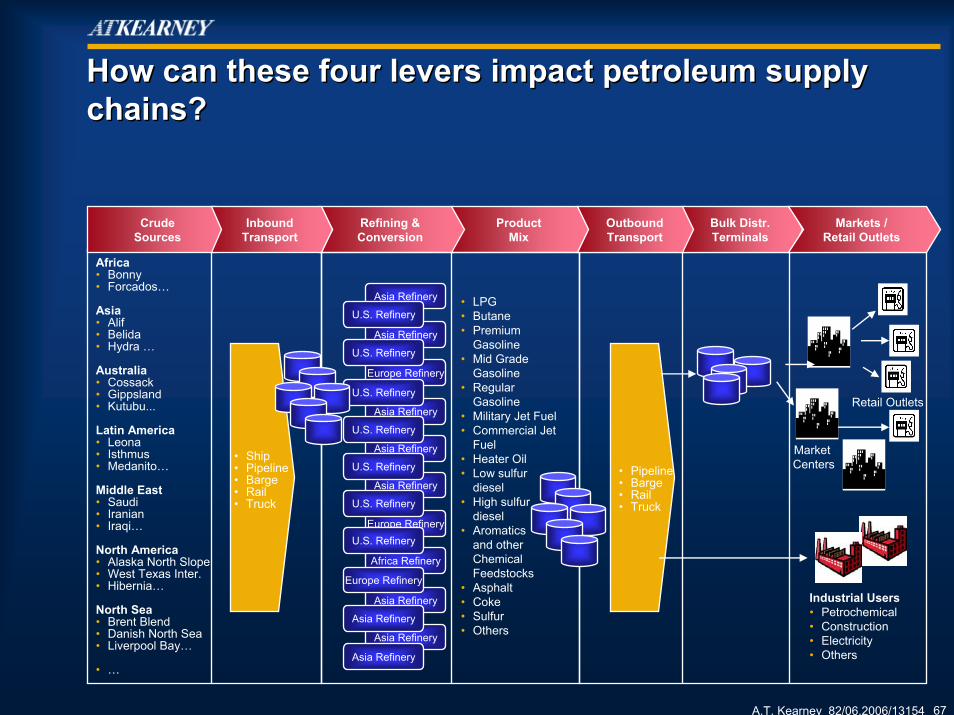
How can these four levers impact petroleum supply chains?How can these four levers impact petroleum supply chains?
Africa• Bonny• Forcados…
Asia• Alif• Belida• Hydra …
Australia• Cossack• Gippsland• Kutubu...
Latin America• Leona• Isthmus• Medanito…
Middle East• Saudi• Iranian• Iraqi…
North America• Alaska North Slope• West Texas Inter.• Hibernia…
North Sea• Brent Blend• Danish North Sea• Liverpool Bay…
• …
Refining & Conversion
Product Mix
OutboundTransport
Bulk Distr.Terminals
Markets /Retail Outlets
Crude Sources
InboundTransport
• LPG• Butane• Premium
Gasoline• Mid Grade
Gasoline• Regular
Gasoline• Military Jet Fuel• Commercial Jet
Fuel• Heater Oil• Low sulfur
diesel• High sulfur
diesel• Aromatics
and other Chemical Feedstocks
• Asphalt• Coke• Sulfur• Others
• Ship• Pipeline• Barge• Rail• Truck
• Pipeline• Barge• Rail• Truck
Market Centers
Industrial Users• Petrochemical• Construction• Electricity• Others
Retail Outlets
Asia Refinery
Asia Refinery
Europe Refinery
Asia Refinery
Asia Refinery
Asia Refinery
Europe Refinery
Africa Refinery
Asia Refinery
Asia Refinery
U.S. Refinery
U.S. Refinery
U.S. Refinery
U.S. Refinery
U.S. Refinery
U.S. Refinery
U.S. Refinery
Europe Refinery
Asia Refinery
Asia Refinery

A.T. Kearney 82/06.2006/13154 68
Risk management and supply continuity is the largest source of value in petroleum supply chainsRisk management and supply continuity is the largest source of value in petroleum supply chains
Refining & Conversion
Product Mix
OutboundTransport
Bulk Distr.Terminals
Markets /Retail Outlets
Crude Sources
InboundTransport
Ensuring adequate supplies of crude
Developing options for feedstock disruption
Contracting to ensure adequate logistics at each stage
Planning for capacity needs at each level
Meeting product mix requirements to prevent lost sales
Building supply chain scenario models based on global forces and potential outcomes to model risk and identify response strategies
…Innovation
and Growth
Value C
hain
Optimiza
tion
Advanced
Cost Management
Risk M
anag
emen
t/
Supply Contin
uity
ValueCreation

A.T. Kearney 82/06.2006/13154 69
Supply chain can help innovation and growthSupply chain can help innovation and growth
Refining & Conversion
Product Mix
OutboundTransport
Bulk Distr.Terminals
Markets /Retail Outlets
Crude Sources
InboundTransport
Exploring new technologies to upgrade crudes
Investing in and evaluating technologies for alternative fuels
Explicit evaluation of forward and backward integration
Partnering with suppliers that can provide innovation in manufacturing, logistics, technology
Identifying new markets and developing creative solutions for access
Creating market segmentation approaches to identify needs and drive growth
…Innovation
and Growth
Value C
hain
Optimiza
tion
Advanced
Cost Management
Risk M
anag
emen
t/
Supply Contin
uity
ValueCreation
A.T. Kearney 82/06.2006/13154 70
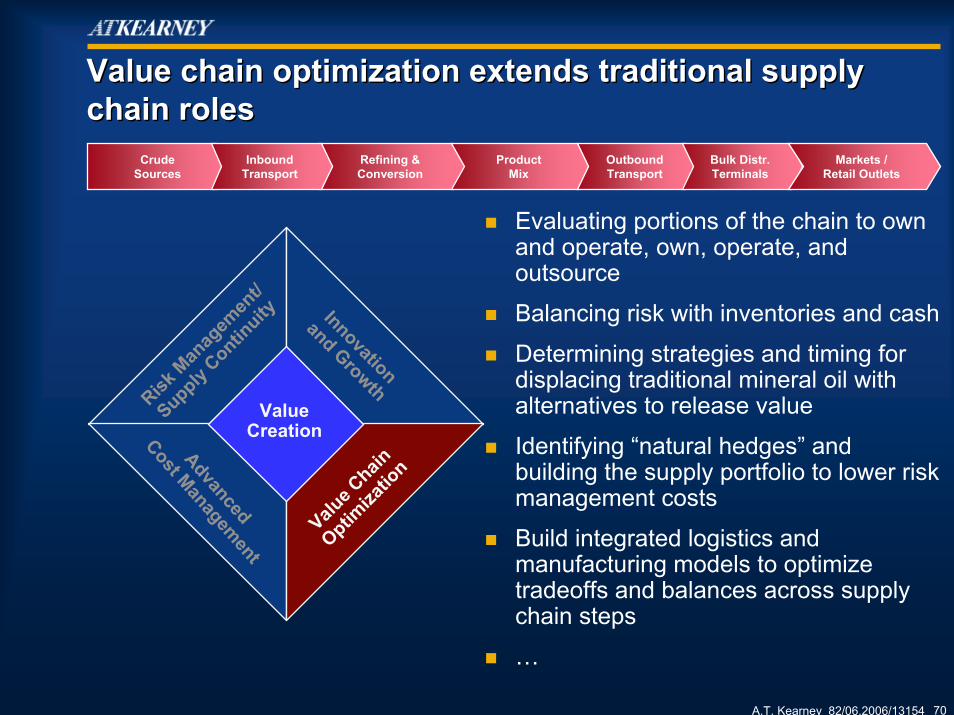
Value chain optimization extends traditional supply chain rolesValue chain optimization extends traditional supply chain roles
Refining & Conversion
Product Mix
OutboundTransport
Bulk Distr.Terminals
Markets /Retail Outlets
Crude Sources
InboundTransport
Evaluating portions of the chain to own and operate, own, operate, and outsource
Balancing risk with inventories and cash
Determining strategies and timing for displacing traditional mineral oil with alternatives to release value
Identifying “natural hedges” and building the supply portfolio to lower risk management costs
Build integrated logistics and manufacturing models to optimize tradeoffs and balances across supply chain steps
…Innovation
and Growth
Value C
hain
Optimiza
tion
Advanced
Cost Management
Risk M
anag
emen
t/
Supply Contin
uity
ValueCreation
A.T. Kearney 82/06.2006/13154 71
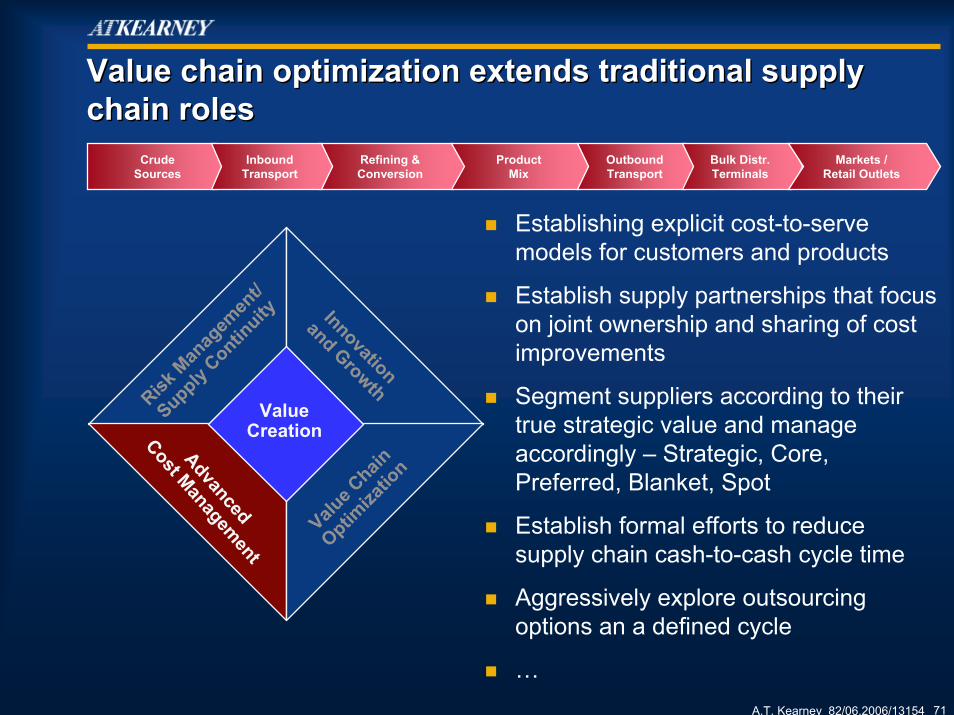
Value chain optimization extends traditional supply chain rolesValue chain optimization extends traditional supply chain roles
Refining & Conversion
Product Mix
OutboundTransport
Bulk Distr.Terminals
Markets /Retail Outlets
Crude Sources
InboundTransport
Establishing explicit cost-to-serve models for customers and products
Establish supply partnerships that focus on joint ownership and sharing of cost improvements
Segment suppliers according to their true strategic value and manage accordingly – Strategic, Core, Preferred, Blanket, Spot
Establish formal efforts to reduce supply chain cash-to-cash cycle time
Aggressively explore outsourcing options an a defined cycle
…
Innovation
and Growth
Value C
hain
Optimiza
tion
Advanced
Cost Management
Risk M
anag
emen
t/
Supply Contin
uity
ValueCreation

A.T. Kearney 82/06.2006/13154 72
In summary…In summary…
A.T. Kearney 82/06.2006/13154 73
Hydrocarbon supply chains must anticipate and adapt to the coming change Hydrocarbon supply chains must anticipate and adapt to the coming change
Over the last 20 years, refiners consolidated inefficient and excess capacity and are beginning to make gains in business returns
These returns can rapidly evaporate if supply chains fail to deliver feedstock, materials, labor and sales product to customers
Enormous amounts of infrastructure and capital are invested in the fixed asset base — particularly in the US
These investments are at risk from changing conditions• Crude quality• Shifting demographic and economic centers — China and India• Potentially disruptive technologies• Increasing “visible hand” of governments
Petroleum supply chains that employ leading practices can anticipate these changes, capture additional value and thrive well into the future

Houston, Texas
June 7, 2006
Preparing for Global Change in the Petroleum Supply Chain
Preparing for Global Change in the Preparing for Global Change in the Petroleum Supply ChainPetroleum Supply Chain
University of Nevada/COPPEAD Petroleum Executive Logistics Course
![GLOBAL SUPPLY CHAIN MANAGEMENT [Author] [Institution] › portfolio › Global Supply Cha… · GLOBAL SUPPLY CHAIN MANAGEMENT [Author] [Institution] GLOBAL SUPPLY CHAIN MANAGEMENT](https://static.fdocuments.us/doc/165x107/5f0434ae7e708231d40cd5e9/global-supply-chain-management-author-institution-a-portfolio-a-global-supply.jpg)