Global petroleum-survey-2013
122
Fraser Institute Global Petroleum Survey 2013 by Alana Wilson, Gerry Angevine, and Miguel Cervantes Survey Director: Kenneth P. Green
-
Upload
boaz-arad -
Category
Economy & Finance
-
view
45 -
download
1
Transcript of Global petroleum-survey-2013

Fraser Institute
GlobalPetroleum Survey2013
by Alana Wilson, Gerry Angevine,and Miguel Cervantes Survey Director: Kenneth P. Green

Ac knowl edge ments
First and fore most, we wish to thank the many man ag ers and senior offi cers of petro leum explo ra tion
com pa nies and asso ci ated firms who sub mit ted sur vey responses, thereby pro vid ing the data for the
anal y ses in this report. In addi tion, we are grate ful to var i ous indus try asso ci a tions and non-profit
think tanks for pro vid ing help ful con tact infor ma tion and gen er ously inform ing their mem bers of
the oppor tu nity to par tic i pate in the sur vey. In par tic u lar we would like to thank Instituto Argentino
del Petroleo y del Gas; the Asociación Española de Compañías de Investigación, Exploración,
Producción de Hidrocarburos y Almacenamiento Subterráneo; the Cen tral Asian Free Mar ket Insti -
tute in Kyrgyzstan; the Eco nomic Pol icy Insti tute-Bishkek Con sen sus also in Kyrgyzstan; the Ini tia -
tive for Pub lic Pol icy Anal y sis in Nige ria; the Nassau Insti tute in the Baha mas; and POPULI in Bolivia
for their assis tance.
Spe cial thanks are due to Ken neth P. Green, the Fra ser Insti tute’s Senior Direc tor, Nat u ral Resource
Stud ies, for his insight ful edit ing of this report; to Kristin McCahon for man ag ing its pub li ca tion; and
to Bill Ray for devel op ing the world and regional maps.
Any errors or omis sions are the sole respon si bil ity of the authors. As they worked inde pend ently,
opin ions expressed by the authors are their own and do not nec es sar ily reflect the opin ions of sup -
port ers, trust ees, or other staff of the Fra ser Insti tute.
Copy right
Copy right© 2013 by the Fra ser Insti tute. All rights reserved. No part of this pub li ca tion may be repro duced in
any man ner what so ever with out writ ten per mis sion except in the case of brief pas sages quoted in crit i cal
arti cles and reviews.
For more infor ma tion on the Fra ser Insti tute and this pub li ca tion, please see the end of this doc u ment.
Date of is sue
Novem ber 2013

Ta ble of con tents
Sur vey in for ma tion. . . . . . . . . . . . . . . . . . . . . . . . . . . . . . . . . 4
Ex ec u tive sum mary. . . . . . . . . . . . . . . . . . . . . . . . . . . . . . . . . 5
Sur vey meth od ol ogy . . . . . . . . . . . . . . . . . . . . . . . . . . . . . . . . 8
Global re sults . . . . . . . . . . . . . . . . . . . . . . . . . . . . . . . . . . . . 15
Re sults by con ti nen tal re gion . . . . . . . . . . . . . . . . . . . . . . . . . . 42
Op tional sur vey ques tions . . . . . . . . . . . . . . . . . . . . . . . . . . . . 73
Ad di tional com ments from the Pe tro leum Sur vey . . . . . . . . . . . . . . . 77
Sin gle-fac tor re sults . . . . . . . . . . . . . . . . . . . . . . . . . . . . . . . . 83
Com pli ments re ceived . . . . . . . . . . . . . . . . . . . . . . . . . . . . . . 103
Ref er ences . . . . . . . . . . . . . . . . . . . . . . . . . . . . . . . . . . . . . 104
Ap pen dix 1: Proved Oil and Nat u ral Gas Re serves . . . . . . . . . . . . . . 105
Ap pen dix 2: Maps 1 through 8 . . . . . . . . . . . . . . . . . . . . . . . . . . 107
About the au thors . . . . . . . . . . . . . . . . . . . . . . . . . . . . . . . . 116
Pub lish ing in for ma tion . . . . . . . . . . . . . . . . . . . . . . . . . . . 117
Sup port ing the Fra ser In sti tute . . . . . . . . . . . . . . . . . . . . . . . 118
Pur pose, fund ing, and in de pend ence . . . . . . . . . . . . . . . . . . . 119
About the Fra ser In sti tute . . . . . . . . . . . . . . . . . . . . . . . . . . 120
Ed i to rial Ad vi sory Board . . . . . . . . . . . . . . . . . . . . . . . . . . . 121

Sur vey in for ma tion
The 2013 Fra ser Insti tute Global Petro leum Sur vey was dis trib uted to man ag ers and exec -
u tives of petro leum explo ra tion and pro duc tion com pa nies around the world and to
firms that pro vide sup port ser vices to such com pa nies.
The anal y ses con tained in this report are based on infor ma tion obtained from 864
respon dents rep re sent ing 762 com pa nies. The explo ra tion and devel op ment bud gets of
these par tic i pat ing com pa nies totaled about $312 bil lion in 2012. That rep re sents more
than 50 per cent of global upstream expen di tures last year, accord ing to infor ma tion
reported in the Inter na tional Energy Agency’s most recent World Energy Out look (Inter -
na tional Energy Agency, 2012).

Ex ec u tive sum mary
This report pres ents the results of the Fra ser Insti tute’s 7th annual sur vey of petro leum indus try
exec u tives and man ag ers regard ing bar ri ers to invest ment in oil and gas explo ra tion and pro duc -
tion facil i ties in var i ous juris dic tions around the globe. The sur vey responses have been tal lied to
rank prov inces, states, other geo graph ical regions (e.g. off shore areas) and coun tries accord ing to
the extent of such bar ri ers. Those bar ri ers, as iden ti fied by the sur vey respon dents, include high tax
rates, costly reg u la tory obli ga tions, uncer tainty over envi ron men tal reg u la tions and the inter pre -
ta tion and admin is tra tion of reg u la tions gov ern ing the “upstream” petro leum indus try, and con -
cerns with regard to polit i cal sta bil ity and secu rity of per son nel and equip ment.
A total of 864 respon dents par tic i pated in the sur vey this year, pro vid ing suf fi cient data to eval u ate
157 juris dic tions. By way of com par i son 147 juris dic tions were eval u ated in the 2012 sur vey, 135 in
2011, and 133 in 2010.
The juris dic tions were assigned scores for each of 16 ques tions per tain ing to fac tors known to
affect invest ment deci sions. The scores are based on the pro por tion of neg a tive responses a juris -
dic tion received on each ques tion. The greater the pro por tion of neg a tive responses for a juris dic -
tion, the greater were its per ceived invest ment bar ri ers and, there fore, the lower its rank ing.
A Pol icy Per cep tion Index (referred to in pre vi ous sur vey years as the All-Inclu sive Com pos ite
Index) derived from the scores on each of the 16 fac tor ques tions cap tures inves tors’ per cep tions
on con di tions affect ing invest ment deci sions and pro vides a com pre hen sive assess ment of each
juris dic tion. The Pol icy Per cep tion Index does not fac tor in a juris dic tion’s known petro leum
reserves. A new sec tion has been added to this year’s report to show how juris dic tions com pare on
their Pol icy Per cep tion Index mea sure in the con text of their proved reserves.
On the Pol icy Per cep tion index, the 10 least attrac tive juris dic tions for invest ment (start ing with
the worst) are Ven e zuela, Ecua dor, Iran, Bolivia, Rus sia—Off shore Arc tic, Uzbekistan, Rus -
sia—East ern Sibe ria, South Sudan, Iraq, and Rus sia—Other (i.e., all of Rus sia except for Off shore
Arc tic, Off shore Sakhalin, and East ern Sibe ria). Each of the juris dic tions in this group except Rus -
sia—Off shore Arc tic and South Sudan were also among the 10 least desir able juris dic tions for
invest ment in oil and gas explo ra tion and devel op ment iden ti fied in the 2012 sur vey.
The juris dic tions with Pol icy Per cep tion Index scores in the first quintile (i.e., less than 20, sug gest -
ing that obsta cles to invest ment are lower than in all other juris dic tions assessed by the sur vey), are
all located in Can ada, the United States, and Europe. Accord ing to this year’s sur vey, the 10 most
attrac tive juris dic tions for invest ment world wide are Oklahoma, Mis sis sippi, Sas katch e wan,
Texas, Arkan sas, Kan sas, Ala bama, North Dakota, Man i toba, and Neth er lands—North Sea. Six of
these juris dic tions were in last year’s top 10 most attrac tive juris dic tions. Sas katch e wan, Arkan sas,
and Ala bama (2 US states that were not ranked in 2012), and Neth er lands—North Sea were not in
Fra ser In sti tute Global Pe tro leum Sur vey, 2013 5www.fraserinstitute.org

last year’s top 10 list. These 4 juris dic tions dis placed Neth er lands, New Mex ico, Den mark, and
West Vir ginia from the list.
As men tioned above, a new sec tion has been added to this year’s report to exam ine how juris dic -
tions com pare on their Pol icy Per cep tion Index mea sure when their proved oil and gas reserves are
con sid ered. Juris dic tions with proved (some times referred to as “proven”) reserves have been split
into three tiers based on their hold ings of the worlds’ proved oil and gas reserves with Tier One
juris dic tions each hold ing at least 1 per cent, Tier Two hold ing between 0.1 and 1 per cent, and Tier
Three hold ing up to 0.1 per cent.
Twenty-seven of the juris dic tions assessed hold at least 1 per cent of the worlds’ proved oil and gas
reserves, rang ing from India’s 13.9 bil lion bar rels of oil equiv a lent (Bboe) to Iran’s 369.6 Bboe.
Together, the juris dic tions in this group of large reserve hold ers (Tier One) account for 92 per cent
of global reserves. Most remark ably, the 9 Tier One juris dic tions that stand out as the least attrac -
tive for invest ment on the basis of their Pol icy Per cep tion Index scores (Ven e zuela, Iran, the four
Rus sian regions, Iraq, Libya, and Kazakhstan) account for more than half of the world’s proved oil
and reserves. The seven large-reserve hold ers that rank high est accord ing to that mea sure are Texas,
Qatar, Alberta, United Arab Emirates, Nor way—North Sea, Aus tra lia—Off shore, and Kuwait.
Forty-one juris dic tions assessed in the sur vey hold at least 0.1 per cent of global reserves, but less
than 1 per cent, rang ing from Chad’s 1.5 Bboe to Oman’s 11.8 Bboe. Of these, Ecua dor, Bolivia,
Uzbekistan, and South Sudan appear to pose the great est bar ri ers to upstream invest ment. The 10
most attrac tive juris dic tions with reserves in this size group (Tier Two) are: Oklahoma, Arkan sas,
North Dakota, Neth er lands—Onshore, Lou i si ana, Wyo ming, United King dom—North Sea;
Nor way, Oman, and Utah.
Of the 70 juris dic tions with very lit tle proved oil and gas reserves, and no more than 0.1 per cent of
the global amount (rang ing from almost neg li gi ble hold ings in the case of Spain—Off shore to
West Vir ginia’s 1.3 Bboe), those deemed the least attrac tive for invest ment on the basis of poor
Pol icy Per cep tion Index scores are: Argen tina—Salta, Kyrgyzstan, the 5 other Argen tine prov inces
included in the sur vey, Soma li land, and Gua te mala. The top per form ers in this group of very small
reserve hold ers (Tier Three) are Mis sis sippi, Sas katch e wan, Kan sas, Ala bama, Man i toba, and the
Neth er lands—North Sea.
Bar ri ers to invest ment have increased in a num ber of juris dic tions over the past year. In par tic u lar,
Pol icy Per cep tion Index scores increased by at least 15 points com pared with the cor re spond ing
2012 scores for New Mex ico, Mich i gan, Col o rado, Cyprus, Hun gary, Guy ana, France, Roma nia,
Cal i for nia, Bul garia, New York, Gua te mala, Que bec, and Kyrgyzstan, indi cat ing that inves tors
per ceive that these juris dic tions have increased invest ment bar ri ers. The dete ri o ra tion in attrac -
tive ness for invest ment was great est in Col o rado, Hun gary, Cyprus, Gua te mala, Cal i for nia, Bul -
garia, and New York.
6 Fra ser In sti tute Global Pe tro leum Sur vey, 2013
www.fraserinstitute.org

This year, 14 juris dic tions improved their rel a tive attrac tive ness for invest ment by at least 10
points on the Pol icy Per cep tion Index mea sure. Of those, Chile, Jor dan, Mali, and Paki stan
improved by at least 20 points and each achieved sig nif i cant gains in the global and regional Index
rank ings. Other juris dic tions that improved sig nif i cantly on that index this year are Namibia, Bah -
rain, Brunei, Thai land, Alba nia, South Africa, New Bruns wick, Ivory Coast, East Timor, and Yemen.
Two optional sur vey ques tions were included in this year’s sur vey. First, par tic i pants were asked
“how would your assess ment of invest ment poten tial change were the United States to imple ment
fed eral con trol over hydrau lic frac tur ing?” In response, slightly more than half of the respon dents
indi cated that they would decrease or mod estly decrease their assess ment as a result, while 27 per -
cent would not change their assess ment.
Sec ond, sur vey par tic i pants were asked “how would your assess ment of the attrac tive ness of West -
ern Can ada and the North west Ter ri to ries for invest ment change if Can ada con tin ues to face a
short fall in oil-trans port capa bil ity to East ern Can ada, export mar kets over seas, and US refin ers?”
The major ity (62%) of respon dents noted that the attrac tive ness would decline while nearly a third
(29%) would not change their assess ment.
Respon dents’ com ments high light rea sons for the invest ment attrac tive ness (or not) of some
juris dic tions. As in pre vi ous sur veys, inves tors indi cate that they con tinue to turn away from juris -
dic tions with oner ous fis cal regimes, polit i cal insta bil ity, and land claim dis putes. Sim i larly, inves -
tors pre fer to avoid juris dic tions with costly, time-con sum ing uncer tain reg u la tions. Other fac tors
being equal, com pet i tive tax and reg u la tory regimes can attract invest ment and thus gen er ate sub -
stan tial eco nomic ben e fits.
Fra ser In sti tute Global Pe tro leum Sur vey, 2013 7www.fraserinstitute.org

Sur vey methodology
Sam ple design
This sur vey is designed to iden tify prov inces, states, off shore regions, other geo graphic areas, and
coun tries with the great est bar ri ers to invest ment in oil and gas explo ra tion and pro duc tion. Juris -
dic tions assessed by inves tors as rel a tively unat trac tive may then be prompted to con sider pol icy
reforms that could improve their rank ings. Pre sum ably, petro leum com pa nies use the infor ma -
tion that is pro vided to cor rob o rate their own assess ments and to iden tify juris dic tions where busi -
ness con di tions and the reg u la tory envi ron ment are most attrac tive for invest ment. The sur vey
results are also a use ful source of infor ma tion for the media, pro vid ing inde pend ent infor ma tion
as to how particular jurisdictions compare.
The sur vey was dis trib uted to man ag ers and exec u tives in the “upstream” petro leum indus try.
This includes explo ra tion for oil and gas reserves, and the pro duc tion of crude oil, bitu men, and
both con ven tional sources of nat u ral gas and non-con ven tional sources such as coalbed meth ane,
and gas embed ded in shale for ma tions. It does not include the refin ing, upgrad ing, or pro cess ing
of crude oil, bitu men, and raw nat u ral gas, or the trans por ta tion and mar ket ing of petro leum
prod ucts.
The names of poten tial respon dents were taken from pub licly avail able mem ber ship lists of trade
asso ci a tions and other sources. In addi tion, some indus try asso ci a tions and non-profit think tanks
(e.g., the Instituto Argentino del Petroleo y del Gas; the Asociación Española de Compañías de
Investigación, Exploración, Producción de Hidrocarburos y Almacenamiento Subterráneo; the
Cen tral Asian Free Mar ket Insti tute in Kyrgyzstan; the Eco nomic Pol icy Insti tute-Bishkek Con -
8 Fra ser In sti tute Global Pe tro leum Sur vey, 2013
www.fraserinstitute.org
Fig ure 1: The position survey respondents hold in their company, 2013
Company Chairman, CEO, President, or Director:
28%
Company Group, Division or Unit Manager: 15%
Company Specialist/ Advisor (e.g. Landman, Geologist, Economist,
Planner, or Lawyer ): 18%
Company Vice President: 11%
Other: 7%
Professional Consultant, Advisor, or Negotiator providing services to
companies in the petroleum industry: 21%

sen sus also in Kyrgyzstan; the Ini tia tive for Pub lic Pol icy Anal y sis in Nige ria; the Nassau Insti tute
in the Baha mas; and POPULI in Bolivia) pro vided con tact infor ma tion.
The sur vey was con ducted from Feb ru ary 20, 2013, until May 6, 2013. A total of 864 responses were
received from indi vid u als work ing with 762 com pa nies. As fig ure 1 illus trates, just over half (55%)
of the respon dents iden ti fied them selves as either a man ager or hold ing a higher-level posi tion.
The explo ra tion and devel op ment bud gets of the com pa nies that were rep re sented totalled about
$312 bil lion in 2012. This accounts for more than 50 per cent of the total of $619 bil lion of global
upstream expen di tures of these kinds that were made last year, accord ing to an esti mate in the
Inter na tional Energy Agency’s most recent World Energy Out look (Inter na tional Energy Agency,
2012). Fig ure 2 shows that 94 per cent of the firms par tic i pat ing in the sur vey are engaged in the
explo ra tion and devel op ment of oil and/or nat u ral gas, 37 per cent are engaged in pro duc tion of oil
and/or nat u ral gas, and 27 per cent pro vide expert advice and/or drill ing ser vices.1
Fig ure 3 shows the prin ci pal focus of the petro leum explo ra tion and devel op ment activ i ties of
com pa nies whose man ag ers or other rep re sen ta tives par tic i pated in the sur vey. The focus of most
of these com pa nies (71 per cent) is on find ing and devel op ing con ven tional oil and gas reserves.
The per cent age of com pa nies focus ing on find ing and devel op ing con ven tional oil and gas reserves
has declined in recent years from 82 per cent in 2011 and 80 per cent in 2012. Uncon ven tional nat u -
ral gas explo ra tion and devel op ment rep re sented 29 per cent of the focus of com pa nies in 2013.
Six teen per cent of the upstream activ ity reported by par tic i pants employed by petro leum firms
involves uncon ven tional oil resources. The major ity of this activ ity (70 per cent) involves the
recov ery of oil from shale for ma tions using hydrau lic fracking, 17 per cent is focused on oil sands
Fra ser In sti tute Global Pe tro leum Sur vey, 2013 9www.fraserinstitute.org
Fig ure 2: Activ i ties per formed by firms of sur vey respon dents, 2013
1 Firms were invited to select all activities performed; therefore, activities reported exceed 100 percent.
Drilling services for petroleum exploration and development companies:
5%
Other: 11%
Provision of expert advice to petroleum exploration
and development companies: 22%Natural gas exploration
and development: 35%
Production of oil and/or natural gas: 37%
Oil exploration and development: 58%

bitu men and 13 per cent on other oil activ i ties such as the explo ra tion or devel op ment of oil from
kerogen found in shale rock.
Thir teen per cent of upstream activ ity of par tic i pants in the sur vey involves uncon ven tional nat u -
ral gas resources. The major ity of this activ ity (70 per cent) involves the recov ery of nat u ral gas
from tight sand and shale for ma tions using hydrau lic fracking. Twenty-two per cent is focused on
coal-bed meth ane. Other uncon ven tional nat u ral gas activ i ties (related to gas hydrates) were
reported by seven per cent of the petro leum firms in the sur vey.
10 Fra ser In sti tute Global Pe tro leum Sur vey, 2013
www.fraserinstitute.org
Fig ure 3: Company focus in petroleum exploration and developmentbusiness, as indicated by respondents
Conventional oil: 48%
Oil from shale formationsrequiring hydraulic fracking:
12%
Oil sands bitumen: 3%
Other oil activities(e.g. exploration and
development of kerogen): 2%
Conventional natural gas:22%
Natural gas from tight sand and shale formations using
hydraulic fracking: 9%
Coal-bed methane: 3%Other natural gas activities
(e.g. in relation to gas hydrates): 1%

Sur vey ques tion naire
The sur vey was designed to cap ture the opin ions of man ag ers and exec u tives regard ing the level of
invest ment bar ri ers in juris dic tions with which their com pa nies are famil iar. Respon dents were
asked to indi cate how each of the 16 fac tors listed below influ ence com pany deci sions to invest in
var i ous jurisdictions.
1. Fis cal terms— include licenses, lease pay ments, roy al ties, other pro duc tion taxes, and gross
rev e nue charges, but not cor po rate and per sonal income taxes, cap i tal gains taxes, or sales
taxes.
2. Tax a tion in gen eral— the tax bur den, includ ing per sonal, cor po rate, pay roll, and cap i tal
taxes, and the com plex ity of tax com pli ance, but exclud ing petro leum explo ra tion and pro -
duc tion licenses and fees, land lease fees, and roy al ties and other charges directly against
petro leum pro duc tion.
3. Envi ron men tal reg u la tions—sta bil ity of reg u la tions, con sis tency, and time li ness of reg u la -
tory pro cess, reg u la tions not based on sci ence, etc.
4. Reg u la tory enforce ment—uncer tainty in the juris dic tions with which you are famil iar
regard ing the admin is tra tion, inter pre ta tion, sta bil ity, or enforce ment of exist ing
reg u la tions.
5. Cost of reg u la tory com pli ance—re: fil ing per mit appli ca tions, par tic i pat ing in hear ings, etc.
6. Pro tected areas—uncer tainty con cern ing what areas can be pro tected as wil der ness or parks,
marine life pre serves, or archae o log i cal sites.
7. Trade bar ri ers—tar iff and non-tar iff bar ri ers to trade and restric tions on profit repa tri a tion,
cur rency restric tions, etc.
8. Labour reg u la tions and employ ment agree ments—impact of labor reg u la tions, employ -
ments agree ments, labor mil i tancy/work dis rup tions, and local hir ing require ments.
9. Qual ity of infra struc ture—includes access to roads, power avail abil ity, etc.
10. Qual ity of geo log i cal data base—includes qual ity, detail, and ease of access to geo log i cal
infor ma tion.
11. Labor avail abil ity and skills—the sup ply and qual ity of labor, and the mobil ity that work ers
have to relo cate.
12. Dis puted land claims—the uncer tainty of unre solved claims made by aboriginals, other
groups, or indi vid u als.
13. Polit i cal sta bil ity.
14. Secu rity—the phys i cal safety of per son nel and assets.
15. Reg u la tory dupli ca tion and incon sis ten cies (includes fed eral/pro vin cial, fed eral/state,
inter-depart men tal over lap, etc.)
16. Legal sys tem—legal pro cesses that are fair, trans par ent, non-cor rupt, effi ciently adminis-
tered, etc.
Fra ser In sti tute Global Pe tro leum Sur vey, 2013 11www.fraserinstitute.org

The 16 fac tors above were unchanged from the 2012 sur vey. How ever two ques tions that had been
included—on socio eco nomic agree ments or com mu nity devel op ment con di tions and on cor rup -
tion of gov ern ment offi cials—were dropped this year in response to com plaints from pre vi ous
years’ respon dents that the sur vey had become oner ously lengthy. Too, those ques tions were seen
to be redun dant, or over lap heavily with other ques tions.
For each of the 16 fac tors, respon dents were asked to select one of the fol low ing five responses that
best described each juris dic tion with which they were famil iar:
1. Encour ages invest ment
2. Is not a deter rent to invest ment
3. Is a mild deter rent to invest ment
4. Is a strong deter rent to invest ment
5. Would not invest due to this cri te rion
The 2013 sur vey included a list of 157 juris dic tions that respon dents could select for eval u a tion,
includ ing all of the Cana dian prov inces and ter ri to ries except Ontario, Prince Edward Island, and
Nunavut; many US oil and gas pro duc ing states (as well as the US Alaska, Pacific, and Gulf Coast
off shore regions); all six Aus tra lian states, the Aus tra lian off shore, and the Timor Gap Joint Petro -
leum Devel op ment Area (JPDA); and coun tries with cur rent or poten tial petro leum pro duc tion
capac ity. Rus sia was split into four cat e go ries: Off shore Arc tic, Off shore Sakhalin, East ern Sibe ria,
and the rest of the coun try. Six prov inces in Argen tina were also included in the sur vey: Chubut,
Mendoza, Neuquen, Salta, Santa Cruz, and Tierra del Fuego. Brazil was again rep re sented by three
sep a rate cat e go ries: onshore con ces sions, off shore con ces sions, and off shore “pre-salt” regions.
Mex ico and Saudi Ara bia, where invest ment in upstream petro leum explo ra tion and devel op ment
is mostly con fined to gov ern ment-owned facil i ties, were again excluded from the list of juris dic -
tions that respon dents could rank.
This year’s sur vey list added five new juris dic tions: Bot swana, French Gui ana, Sey chelles,
Spain—Off shore and Spain—Onshore.
Scor ing the sur vey re sponses
For each juris dic tion, we cal cu lated the per cent age of neg a tive scores for each of the 16 fac tors.2 We
then devel oped an index for each fac tor by assign ing the juris dic tion with the high est per cent age of
neg a tive responses a value of 100, and cor re spond ingly lower val ues to the other juris dic tions
12 Fra ser In sti tute Global Pe tro leum Sur vey, 2013
www.fraserinstitute.org
2 The negative scores were determined by the number of times respondents graded a factor as “a mild
deterrent to investment,” “a strong deterrent to investment,” or indicated that they “would not
invest” in the jurisdiction because of issues related to that factor.

accord ing to their scores. Juris dic tions with the low est index val ues are con sid ered the most attrac -
tive by upstream inves tors and thus rank above juris dic tions with higher val ues as a con se quence
of hav ing greater proportions of negative scores.
In past years, only juris dic tions eval u ated on all 16 fac tors by at least 5 respon dents were included
in the rank ings. This year, we were able to increase this min i mum thresh old to 10 for all juris dic -
tions except Bot swana, Malta, Jor dan, Mali, US Off shore—Pacific, Som a li land, and Kyrgyzstan
for which 5 to 8 responses were received for all 16 pol icy ques tions. This allowed us to rank all of the
157 juris dic tions listed in the ques tion naire. The median num ber of responses to all ques tions
across all juris dic tions was 24.5, which com pares favor ably with 15 in the 2012 sur vey.
In addi tion to rank ings for each of the 16 fac tors, juris dic tions were ranked on the basis of five
com pos ite indi ces, as fol lows.
Policy Perception Index
The Pol icy Per cep tion Index value (referred to in pre vi ous sur veys as the All-Inclu sive Com pos ite
Index) for each juris dic tion is derived from the equally-weighted3 scores achieved on all 16 fac tors.
This index cap tures the per cep tions of man ag ers and exec u tives regard ing the level of invest ment
bar ri ers on a range of fac tors and con di tions affect ing invest ment deci sions as well as cap tur ing a
wide range of energy pol i cies. It is the most com pre hen sive mea sure of the invest ment bar ri ers
within each juris dic tion and most of the dis cus sion that fol lows is based on the juris dic tional
scores and rank ings obtained using it. A large score on this mea sure indi cates that inves tors regard
the juris dic tion in question as relatively unattractive for investment.
Com mer cial Envi ron ment Index
The Com mer cial Envi ron ment Index ranks juris dic tions on five fac tors that affect after-tax cash
flow and the cost of under tak ing petro leum explo ra tion and devel op ment activities:
· fis cal terms
· tax a tion in gen eral
· trade bar ri ers
· qual ity of in fra struc ture
· la bor avail abil ity and skills
For each juris dic tion the scores for this index were cal cu lated by aver ag ing the neg a tive scores for
each of these five fac tors. A high index value indi cates that indus try man ag ers and exec u tives con -
sider that the busi ness con di tions reflected in this mea sure con sti tute sig nif i cant barriers to
investment.
Fra ser In sti tute Global Pe tro leum Sur vey, 2013 13www.fraserinstitute.org
3 The scores for each of the 16 factors are published online to permit interested parties to tailor
weighting and composite indices to suit their needs.

Reg u la tory Cli mate Index
The Reg u la tory Cli mate Index reflects the scores assigned to juris dic tions for the fol low ing six
fac tors:
· the cost of reg u la tory com pli ance
· reg u la tory en force ment
· en vi ron men tal reg u la tions
· la bor reg u la tions and em ploy ment agree ments
· reg u la tory du pli ca tion and in con sis ten cies
· le gal sys tem
A rel a tively high value on the Reg u la tory Cli mate Index indi cates that reg u la tions, require ments,
and agree ments in a juris dic tion con sti tute a sub stan tial bar rier to invest ment, result ing in a rel a -
tively poor ranking.
Geopolitical Risk Index
The Geopolitical Risk Index rep re sents the scores gar nered by juris dic tions for polit i cal sta bil ity
and secu rity. These fac tors are con sid ered to be more dif fi cult to over come than either reg u la tory
or com mer cial bar ri ers because a change in the polit i cal land scape is usu ally required for sig nif i -
cant prog ress to be achieved. A high score on the Geopolitical Risk Index indi cates that invest ment
in that juris dic tion is rel a tively unat trac tive because of polit i cal insta bil ity and/or secu rity issues
that threaten the phys i cal safety of per son nel or present risks to an investor’s facilities.
Best prac tices
The inclu sion of a ques tion in the sur vey on the extent to which explo ra tion and devel op ment
might increase if a full and com plete tran si tion to “best prac tices” (in rela tion to the main driv ers
of invest ment deci sions) were to occur allowed us to mea sure the poten tial impact of the adop tion
of best prac tices on the attrac tive ness for invest ment in each jurisdiction.
14 Fra ser In sti tute Global Pe tro leum Sur vey, 2013
www.fraserinstitute.org

Global results
Policy Perception Index
Table 1 com pares the 2013, 2012, 2011, 2010, and 2009 scores and rank ings on the Pol icy Per cep -
tion Index. The first col umn pres ents the 2013 rank ing, and the sec ond col umn indi cates how the
juris dic tion ranked in the 20124 sur vey, etc. The sec ond set of col umns pres ents the abso lute scores
for each juris dic tion in each of the 5 years, respec tively, based on the per cent age of neg a tive
responses to each of the sur vey ques tions. Those at the top of the list are regarded as hav ing rel a -
tively low invest ment bar ri ers and, there fore, as being more attrac tive for invest ment. Read ers are
reminded again that these rank ings are driven purely by responses to the sur vey ques tions and do
not account for the extent of the juris dic tions’ proved oil and gas reserves, which will be dis cussed
later. Hence it is pos si ble for juris dic tions with rel a tively small or even no reserves to score more
highly on eval u a tions of their busi ness con di tions, reg u la tory regimes, and other fac tors (but
exclud ing the extent of their petro leum resources) than jurisdictions with much larger reserves.
The 10 juris dic tions with the high est per cent age of neg a tive responses, indi cat ing the great est bar -
ri ers to invest ment, are:
1. Rus sia—other
2. Iraq
3. South Sudan
4. Rus sia—East ern Sibe ria
5. Uzbekistan
6. Rus sia—Off shore Arc tic
7. Bolivia
8. Iran
9. Ecua dor
10. Ven e zuela
With the excep tion of South Sudan and Rus sia—Off shore Arc tic, all of these juris dic tions were
also in the 10 least attrac tive juris dic tions for invest ment in the 2012 sur vey. Of the four Rus sian
juris dic tions in the 2013 sur vey, only Rus sia—Off shore Sakhalin is not in the group of 10 least
attrac tive juris dic tions this year, rank ing 140th least attrac tive (of 157). The two juris dic tions dis -
placed from the bot tom 10 in the 2013 sur vey are Libya and Argen tina—Santa Cruz. Libya has
improved its score although its rank ing has dropped from 143 (of 147) in 2012 to 145 (of 157).
Fra ser In sti tute Global Pe tro leum Sur vey, 2013 15www.fraserinstitute.org
4 Note that, for any jurisdiction, comparison of the 2012 and 2013 values for this Index is affected by
the fact that scores on the question regarding socioeconomic agreements/community development
conditions were included were included in the calculation prior to 2013 and scores on the corruption
question were included in the calculation for 2012.

16 Fra ser In sti tute Global Pe tro leum Sur vey, 2013
www.fraserinstitute.org
2013Rank inGroupof 157
2012Rank inGroupof 147
2011Rank inGroupof 135
2010Rank inGroupof 133
2009Rank inGroupof 140
2013Score
2012Score
2011Score
2010Score
2009Score
US—Oklahoma 1 1 4 9 9 9.84 4.71 11.81 13.00 11.30
US—Mis sis sippi 2 2 1 6 5 11.19 6.30 4.89 11.65 9.88
CA—Sas katch e wan 3 13 11 17 38 11.43 14.60 17.48 17.63 25.02
US—Texas 4 3 5 2 8 11.71 8.03 12.17 9.53 10.97
US—Ar kan sas 5 N/A 15 13 1 12.34 N/A 19.16 15.62 6.73
US—Kan sas 6 8 3 19 3 12.64 12.32 11.70 18.80 8.93
US—Al a bama 7 N/A 8 10 2 15.34 N/A 17.00 13.41 8.88
US—North Da kota 8 4 10 24 28 15.92 9.88 17.44 19.65 22.37
CA—Man i toba 9 5 12 8 21 16.87 11.05 17.52 12.48 20.98
Neth er lands—North Sea
10 12 7 26 18 18.66 14.30 15.88 20.26 19.16
Neth er lands 11 6 24 25 25 21.68 11.42 22.11 20.02 21.63
Faroe Is lands 12 18 26 N/A N/A 22.11 19.59 23.33 N/A N/A
Den mark 13 9 17 33 40 22.46 13.09 20.47 23.99 25.53
US—Lou i si ana 14 15 14 15 15 22.57 15.26 18.87 16.62 16.18
US—Wy o ming 15 11 27 4 16 22.63 13.87 23.38 10.25 17.35
United King dom— North Sea
16 22 22 29 39 23.47 21.44 21.77 21.23 25.02
Bot swana*** 17 N/A N/A N/A N/A 23.96 N/A N/A N/A N/A
Qa tar 18 32 33 30 35 24.16 25.42 25.73 21.47 23.90
CA—Al berta 19 21 51 60 92 24.47 21.08 32.73 36.70 47.46
Nor way 20 31 54 51 46 25.18 25.31 33.52 32.69 28.28
US—Montana 21 23 43 35 41 25.89 22.17 29.74 24.26 25.74
US—West Vir ginia 22 10 6 49 58 25.91 13.64 13.35 31.93 32.34
United King dom 23 38 32 32 45 26.40 27.63 25.35 23.55 27.87
CA—New found -land & Lab ra dor
24 47 50 50 82 26.43 33.78 32.34 32.39 40.87
United ArabEmirates
25 42 39 41 47 26.49 30.65 28.59 28.89 28.29
Chile 26 76 20 22 23 26.63 49.51 21.45 19.55 21.46
AU—South Aus tra lia
27 29 21 14 17 26.91 24.83 21.50 15.74 18.73
Nor way—NorthSea
28 19 31 47 37 27.06 19.95 24.89 31.47 24.81
US—Ohio 29 14 2 12 36 27.35 14.97 10.16 13.76 24.06
CA—Nova Sco tia 30 35 34 53 54 27.52 26.17 26.64 33.28 30.37
Oman 31 46 57 44 52 27.84 32.77 34.18 30.03 29.78
US—Utah 32 24 18 7 13 28.09 22.65 21.28 12.04 15.45
AU—North ernTer ri tory
33 44 30 16 32 29.25 32.12 24.87 17.14 23.46
Table 1: Juris dic tional rank ings accord ing to the extent of invest ment bar ri ers (basedon Pol icy Per cep tion Index values)

Fra ser In sti tute Global Pe tro leum Sur vey, 2013 17www.fraserinstitute.org
2013Rank inGroupof 157
2012Rank inGroupof 147
2011Rank inGroupof 135
2010Rank inGroupof 133
2009Rank inGroupof 140
2013Score
2012Score
2011Score
2010Score
2009Score
New Zea land 34 20 16 18 30 29.60 20.59 20.33 18.32 23.19
Ire land 35 17 N/A N/A 27 29.60 18.26 N/A N/A 21.88
US—New Mex ico 36 7 41 54 43 30.36 11.92 28.79 34.27 26.75
Sey chelles 37 N/A N/A N/A N/A 30.98 N/A N/A N/A N/A
Namibia 38 67 49 48 19 31.31 43.72 32.09 31.88 19.80
CA—Yu kon 39 58 N/A 36 105 31.99 38.04 N/A 25.50 54.05
US—Il li nois 40 N/A 13 3 12 32.51 N/A 17.75 9.65 15.26
US Off shore—Gulf of Mex ico
41 26 60 11 14 33.07 22.89 36.38 13.44 15.96
Geor gia 42 49 N/A N/A N/A 33.40 35.04 N/A N/A N/A
Malta*** 43 25 N/A N/A N/A 33.76 22.86 N/A N/A N/A
Bah rain 44 78 38 46 24 34.51 49.71 28.37 30.81 21.62
Jor dan*** 45 99 N/A 75 87 34.60 58.86 N/A 44.40 44.56
Po land 46 41 36 37 93 35.03 29.12 27.24 26.84 47.53
CA—Brit ish Co lum bia
47 39 69 52 71 35.55 27.73 41.44 33.16 37.66
Tur key 48 66 70 84 101 35.63 43.56 41.51 48.15 51.57
AU—West ern Aus tra lia
49 40 37 21 56 35.70 28.78 28.18 19.13 31.25
Brunei 50 85 71 45 55 35.81 52.56 41.51 30.46 31.15
Mo rocco 51 57 61 67 61 36.18 37.72 36.58 40.97 33.49
AU—Tas ma nia 52 51 28 23 44 36.69 35.74 23.66 19.61 27.13
Trin i dad and To bago
53 69 58 59 59 37.45 44.79 34.18 36.54 32.81
Aus tra lia—Off shore
54 33 40 31 N/A 37.65 25.86 28.61 21.93 N/A
Ger many 55 36 35 39 50 38.07 26.27 27.04 27.48 28.90
AU—Vic to ria 56 43 19 20 57 38.74 31.78 21.40 18.96 31.52
Ja pan 57 37 56 69 74 39.05 27.37 33.96 42.06 38.53
US—Penn syl va nia 58 34 65 66 51 39.13 26.04 40.37 40.44 29.56
Thai land 59 84 64 73 64 39.14 51.82 39.90 43.42 35.77
Ku wait 60 64 74 83 77 39.56 42.23 43.76 46.10 39.71
CA—North westTer ri to ries
61 60 103 74 120 40.84 39.62 64.84 44.08 62.84
US—Mich i gan 62 30 29 38 22 41.03 24.87 23.87 27.27 21.00
Uru guay 63 81 52 27 67 41.38 51.31 32.76 21.10 36.26
Spain—Off shore 64 N/A N/A N/A N/A 41.52 N/A N/A N/A N/A
Spain—On shore 65 N/A N/A N/A N/A 41.85 N/A N/A N/A N/A
US—Col o rado 66 16 53 61 81 42.02 16.85 33.47 37.35 40.42
Al ba nia 67 95 73 81 85 43.41 57.19 42.34 45.64 42.90
Ma lay sia 68 83 79 63 75 43.55 51.77 47.47 39.71 39.06
Table 1: Juris dic tional rank ings continued ...

18 Fra ser In sti tute Global Pe tro leum Sur vey, 2013
www.fraserinstitute.org
2013Rank inGroupof 157
2012Rank inGroupof 147
2011Rank inGroupof 135
2010Rank inGroupof 133
2009Rank inGroupof 140
2013Score
2012Score
2011Score
2010Score
2009Score
AU—Queensland 69 50 42 34 49 45.07 35.40 29.12 24.06 28.80
Is rael 70 54 81 N/A N/A 45.33 37.06 48.73 N/A N/A
South Af rica 71 106 85 88 99 45.62 63.75 51.55 49.95 50.36
Phil ip pines 72 91 86 55 90 47.15 55.56 53.31 35.68 45.65
Co lom bia 73 65 48 42 66 47.65 43.36 31.81 29.60 36.16
Ghana 74 80 72 89 73 47.88 51.27 41.89 50.33 37.95
US Off shore—Alaska
75 52 78 57 72 48.11 35.92 47.23 36.20 37.92
Cy prus 76 27 N/A N/A N/A 48.22 24.43 N/A N/A N/A
Mau ri ta nia 77 97 111 N/A N/A 48.55 57.69 70.56 N/A N/A
Tu ni sia 78 56 62 62 20 49.35 37.66 36.93 38.95 20.42
US—Alaska 79 61 83 68 78 49.70 40.16 50.84 41.80 39.75
Hun gary 80 28 9 43 91 49.83 24.79 17.06 29.82 46.62
CA—New Bruns wick
81 102 59 N/A N/A 49.94 62.08 35.80 N/A N/A
Green land 82 59 44 56 83 50.65 38.60 30.08 36.04 41.44
Mali*** 83 128 N/A N/A N/A 50.90 74.23 N/A N/A N/A
AU—New SouthWales
84 63 45 40 62 50.92 41.50 30.14 28.05 33.77
Ivory Coast 85 108 80 99 128 50.99 64.04 47.74 55.79 69.76
Cam er oon 86 82 98 76 108 51.66 51.49 59.82 44.70 55.27
Su ri name 87 N/A 87 70 111 51.94 N/A 54.19 42.26 57.52
Leb a non 88 71 N/A N/A N/A 52.22 45.61 N/A N/A N/A
Tan za nia 89 89 89 82 96 52.32 54.67 54.95 45.66 49.09
Guy ana 90 48 97 N/A 125 52.39 34.12 58.48 N/A 65.99
Mo zam bique 91 90 75 97 80 52.71 55.54 45.22 55.19 40.32
Pa ki stan 92 129 107 105 119 53.26 74.43 67.70 62.17 62.77
Azerbaijan 93 70 104 108 86 53.93 45.58 65.45 64.33 43.91
It aly 94 96 77 78 103 54.17 57.42 46.91 45.01 52.83
Kenya 95 86 N/A N/A N/A 54.56 52.58 N/A N/A N/A
France 96 55 46 58 48 55.26 37.23 30.65 36.43 28.61
Ro ma nia 97 53 63 95 65 55.34 36.57 38.56 53.96 36.09
US—Cal i for nia 98 45 91 87 79 55.70 32.47 55.99 49.35 40.13
Viet nam 99 92 84 64 104 56.13 55.73 51.23 40.29 53.95
US Off shore— Pa cific***
100 N/A 101 103 33 56.20 N/A 63.17 60.66 23.55
China 101 103 90 90 88 57.23 62.53 55.43 51.66 44.86
Ga bon 102 100 99 91 95 57.85 59.15 60.23 52.10 48.74
Ethi o pia 103 72 N/A 119 134 58.74 47.07 N/A 76.15 74.24
Equa to rial Guinea 104 107 121 101 124 58.74 63.85 76.85 59.16 65.15
Table 1: Juris dic tional rank ings continued ...

Fra ser In sti tute Global Pe tro leum Sur vey, 2013 19www.fraserinstitute.org
2013Rank inGroupof 157
2012Rank inGroupof 147
2011Rank inGroupof 135
2010Rank inGroupof 133
2009Rank inGroupof 140
2013Score
2012Score
2011Score
2010Score
2009Score
Brazil—On shorecon ces sion con tracts
105 88 67 * * 59.02 52.72 40.83 * *
Peru 106 94 76 85 102 59.22 57.01 46.37 48.36 51.60
Brazil—Off shorecon ces sion con tracts
107 74 68 * * 59.71 48.08 41.22 * *
An gola 108 118 117 93 112 60.14 69.84 72.70 52.65 58.72
French Gui ana 109 N/A N/A N/A N/A 60.18 N/A N/A N/A N/A
Niger 110 79 N/A 112 142 60.75 50.88 N/A 65.46 99.03
Timor Gap (JPDA) 111 73 47 72 63 61.09 47.34 30.75 42.52 34.82
Mad a gas car 112 105 100 98 N/A 61.14 63.54 62.66 55.54 N/A
East Timor 113 121 112 118 N/A 61.28 71.63 70.68 76.06 N/A
Bul garia 114 62 55 86 84 61.68 40.93 33.94 49.21 41.54
Brazil—Off shorepresalt area profitshar ing con tracts
115 75 66 * * 61.73 48.36 40.79 * *
Greece 116 93 N/A N/A 106 61.99 55.80 N/A N/A 54.26
Egypt 117 104 93 79 69 62.62 62.70 56.47 45.32 37.15
Uganda 118 87 122 94 N/A 64.06 52.66 77.72 53.41 N/A
US—New York 119 68 N/A 102 29 64.20 44.08 N/A 59.34 22.73
Ye men 120 130 120 116 100 64.42 74.50 75.25 69.66 51.46
Re pub lic of theCongo(Brazzaville)
121 113 113 104 116 66.41 67.29 70.71 60.90 61.04
Dem o cratic Re pub lic of theCongo (Kinshasa)
122 120 129 106 130 69.32 71.03 85.14 62.81 70.68
Turkmenistan 123 98 124 128 115 70.23 58.79 80.31 87.41 60.57
In dia 124 124 109 107 107 70.41 72.98 69.56 63.34 54.71
Pa pua New Guinea 125 123 96 110 94 70.62 72.96 57.68 65.11 48.29
Al ge ria 126 125 125 109 118 71.04 73.23 80.93 64.37 61.83
Myanmar 127 115 108 113 133 71.18 68.82 68.42 66.59 73.60
Gua te mala 128 77 N/A N/A 97 73.48 49.57 N/A N/A 49.69
Ar gen tina—Neuquen
129 111 102 * * 73.76 65.49 63.88 * *
Cam bo dia 130 135 110 92 123 73.89 79.97 70.38 52.35 64.08
Ar gen tina—Santa Cruz
131 140 94 * * 74.02 84.00 57.13 * *
In do ne sia 132 127 114 111 114 74.36 74.14 71.57 65.12 59.66
Chad 133 132 115 114 132 74.96 74.92 71.94 66.98 73.46
Table 1: Juris dic tional rank ings continued ...

20 Fra ser In sti tute Global Pe tro leum Sur vey, 2013
www.fraserinstitute.org
2013Rank inGroupof 157
2012Rank inGroupof 147
2011Rank inGroupof 135
2010Rank inGroupof 133
2009Rank inGroupof 140
2013Score
2012Score
2011Score
2010Score
2009Score
Ar gen tina—Chubut
134 112 95 * * 75.62 65.55 57.48 * *
Ni ge ria 135 137 123 126 136 75.75 81.31 79.36 83.38 74.85
Ar gen tina—Mendoza
136 119 88 N/A N/A 75.88 69.99 54.66 N/A N/A
Ar gen tina—Tierra del Fuego
137 122 * * * 76.29 72.58 * * *
Soma li land*** 138 110 N/A N/A N/A 76.56 65.22 N/A N/A N/A
Kazakhstan 139 134 131 124 135 76.73 78.64 89.27 80.45 74.43
Rus sia—Off shoreSakhalin
140 133 * * * 76.75 77.31 * * *
CA—Que bec 141 101 92 77 68 77.11 60.53 56.24 44.89 36.89
Ban gla desh 142 114 118 115 137 78.23 67.75 72.99 68.75 74.99
Syria 143 131 106 96 109 78.53 74.66 67.69 55.17 56.27
Ukraine 144 116 119 130 126 79.27 69.12 74.16 88.73 69.16
Libya 145 143 127 121 113 79.98 85.55 83.69 76.60 58.95
Kyrgyzstan*** 146 109 105 123 117 80.60 64.21 66.34 79.74 61.04
Ar gen tina—Salta 147 126 82 * * 81.08 73.50 49.56 * *
Rus sia—Other 148 138 * * * 81.62 82.33 * * *
Iraq 149 139 128 125 129 82.88 82.60 83.95 81.41 70.09
South Su dan 150 117 ** ** ** 83.80 69.15 ** ** **
Rus sia—East ern Si be ria
151 144 * * * 85.80 85.91 * * *
Uzbekistan 152 141 130 122 110 89.22 84.97 88.37 78.37 56.91
Rus sia—Off shore Arc tic
153 136 * * * 90.74 80.94 * * *
Bolivia 154 147 133 133 143 95.80 100.00 96.18 100.00 100.00
Iran 155 145 132 129 127 97.17 88.44 92.50 87.93 69.29
Ec ua dor 156 142 134 127 140 97.97 85.34 96.27 85.59 87.80
Ven e zuela 157 146 135 132 141 100.00 97.09 100.00 97.18 91.86
Aus tria N/A N/A 23 5 4 N/A N/A 22.06 10.35 9.81
CA—On tario N/A N/A 25 28 60 N/A N/A 22.57 21.22 33.30
Su dan ** ** 116 120 139 ** ** 71.96 76.23 82.64
Rus sia * * 126 131 138 * * 81.24 91.45 78.69
Ar gen tina * * * 117 131 * * * 71.07 71.51
Brazil * * * 80 89 * * * 45.58 45.43
*Bro ken down into re gions.**Su dan be came two coun tries: South Su dan was ranked but not Su dan.*** Re sponses be low the 10 thresh old but higher than 5.
Table 1: Juris dic tional rank ings continued ...

Figure 4: Policy Perception Index
0 20 40 60 80 100
US – AlaskaTunisia
MauritaniaCyprus
US Offshore – AlaskaGhana
ColombiaPhilippines
South AfricaIsrael
AU – QueenslandMalaysiaAlbania
US – ColoradoSpain – OnshoreSpain – Offshore
UruguayUS – Michigan
CA – Northwest TerritoriesKuwait
ThailandUS – Pennsylvania
JapanAU – Victoria
GermanyAustralia – Offshore
Trinidad and TobagoAU – Tasmania
MoroccoBrunei
AU – Western AustraliaTurkey
CA – British ColumbiaPolandJordan
BahrainMalta
GeorgiaUS Offshore – Gulf of Mexico
US – IllinoisCA – Yukon
NamibiaSeychelles
US – New MexicoIreland
New ZealandAU – Northern Territory
US – UtahOman
CA – Nova ScotiaUS – Ohio
Norway – North SeaAU – South Australia
ChileUnited Arab Emirates
CA – Newfoundland & LabradorUnited Kingdom
US – West VirginiaUS – Montana
NorwayCA – Alberta
QatarBotswana
United Kingdom – North SeaUS – WyomingUS – Louisiana
DenmarkFaroe IslandsNetherlands
Netherlands – North SeaCA – Manitoba
US – North DakotaUS – Alabama
US – KansasUS – Arkansas
US – TexasCA – Saskatchewan
US – MississippiUS – Oklahoma
Mild deterrent toinvestment
Strong deterrentto investment
Would not pursueinvestment due tothis factor
0 20 40 60 80 100
VenezuelaEcuador
IranBolivia
Russia – Offshore ArcticUzbekistan
Russia – Eastern SiberiaSouth Sudan
IraqRussia – other
Argentina – SaltaKyrgyzstan
LibyaUkraine
SyriaBangladesh
CA – QuebecRussia – Offshore Sakhalin
KazakhstanSomaliland
Argentina – Tierra del FuegoArgentina – Mendoza
NigeriaArgentina – Chubut
ChadIndonesia
Argentina – Santa CruzCambodia
Argentina – NeuquenGuatemala
MyanmarAlgeria
Papua New GuineaIndia
TurkmenistanDemocratic Republic of the Congo (Kinshasa)
Republic of the Congo (Brazzaville)Yemen
US – New YorkUganda
EgyptGreece
Brazil – Offshore presalt area profit sharing contractsBulgaria
East TimorMadagascar
Timor Gap Joint Petroleum Development Area (JPDA)Niger
French GuianaAngola
Brazil – Offshore concession contractsPeru
Brazil – Onshore concession contractsEquatorial Guinea
EthiopiaGabonChina
US Offshore – PacificVietnam
US – CaliforniaRomania
FranceKenya
ItalyAzerbaijan
PakistanMozambique
GuyanaTanzaniaLebanon
SurinameCameroon
Ivory CoastAU – New South Wales
MaliGreenland
CA – New BrunswickHungary
Mild deterrent toinvestment
Strong deterrentto investment
Would not pursueinvestment due tothis factor

Argen tina—Santa Cruz also improved its score and moved up to the 131st least attrac tive juris dic -
tion (of 157) in 2013 com pared with 140th (of 147) in 2012.
Fig ure 4 pres ents the Pol icy Per cep tion Index rank ings for the 157 juris dic tions ranked this year.
Respon dents ranked the fol low ing 10 juris dic tions as the most attrac tive for invest ment in petro -
leum explo ra tion and devel op ment:
1. Oklahoma
2. Mis sis sippi
3. Sas katch e wan
4. Texas
5. Arkan sas
6. Kan sas
7. Ala bama
8. North Dakota
9. Man i toba
10. Neth er lands—North Sea
Six of these juris dic tions—Oklahoma, Mis sis sippi, Texas, Kan sas, North Dakota, and Man i -
toba—also ranked among the top 10 juris dic tions world wide in 2012. Of those six, all but Man i -
toba were also among the top 10 in 2011 along with Ala bama and the Neth er lands—North Sea.
Ala bama was not ranked in 20125 and the Neth er lands—North Sea dropped to 12th (of 147) in
2012.
Oklahoma and Mis sis sippi rank first and sec ond, respec tively, this year, unchanged from their
2012 stand ings. Sas katch e wan has moved into the top 10 to 3rd (of 157) from 13th (of 147) in 2012.
Texas dropped one spot to 4th from 3rd in 2012 while Arkan sas moved to 5th after fail ing to rank in
2012 due to insuf fi cient data. Kan sas moved up to 6th (of 157) from 8th (of 147) in 2012 while Ala -
bama ranked 7th after fail ing to rank in 2012. North Dakota and Man i toba each dropped four spots
in this year’s sur vey to rank 8th and 9th (of 157) respec tively. Finally the Neth er lands—North Sea
moved up to 10th in 2012 after drop ping out of the top 10 to 12th (of 147) in the 2012 sur vey. Dis -
placed from the top 10 this year were the Neth er lands (to 11th of 157), Den mark (to 13th), and West
Vir ginia (to 22nd). New Mex ico dropped sig nif i cantly in this year’s rank ing, to 36th place (of 157)
from 7th (of 147) in 2012.
Chile, Namibia, Bah rain, Jor dan, Brunei, Thai land, Alba nia, South Africa, New Bruns wick, Mali,
Ivory Coast, and Paki stan, all scored much lower Pol icy Per cep tion Index scores this year (by at
least 11 points) and there fore achieved sig nif i cantly improved rank ings. The improve ments in
scores were most remark able in the case of Jor dan (-24.26), Mali (-23.33), Chile (-22.88), Paki stan
22 Fra ser In sti tute Global Pe tro leum Sur vey, 2013
www.fraserinstitute.org
5 Alabama was not ranked in 2012 due to insufficient data.

(-21.18), South Africa (-18.13), and Brunei (-16.76). Improved scores enabled each of these juris -
dic tions to move up con sid er ably in the rank ings, indi cat ing that sur vey respon dents now regard
them as more favor able for upstream petro leum invest ment than in 2012. For exam ple, Jor dan
now ranks as the 45th (of 157) most attrac tive juris dic tion world wide com pared with 99th place (of
147) in 2012 and Mali is 83rd (of 157) com pared with 128th (of 147) a year ago. The rea sons under -
ly ing these and other sig nif i cant improve ments are exam ined in the regional anal y sis that is pre -
sented later in this report.
Respon dents also awarded higher (i.e., less favor able) over all scores to a num ber of juris dic tions
this year, indi cat ing that bar ri ers to invest ment there appear to have increased since the 2012 sur -
vey was under taken. Dete ri o ra tion (i.e., higher val ues) of 15 points or more in the scores this year
com pared with 2012 occurred in New Mex ico, Mich i gan, Col o rado, Cyprus, Hun gary, Guy ana,
France, Roma nia, Cal i for nia, Bul garia, New York, Gua te mala, Que bec, and Kyrgyzstan. Obsta cles
to invest ment are indi cated to have increased the most in Col o rado (+25.17), Hun gary (+25.04),
Gua te mala (+23.90), Cyprus (+23.79), Cal i for nia (+23.22), Bul garia (+20.75), and New York
(+20.13).
Map 1 (see Appen dix 2) illus trates the rel a tive attrac tive ness of juris dic tions around the globe for
invest ment based on scores from the Pol icy Per cep tion Index. Read ers are reminded again that
these rank ings are driven purely by responses to the sur vey ques tions and do not account for the
extent of the juris dic tions’ proved oil and gas reserves, which will be dis cussed later. The scores,
from 0 to 100, have been divided into five equal ranges (quin tiles). Those in the 0 to 19.99 range
(first quintile) are rated as most attrac tive for invest ment while juris dic tions with scores rang ing
from 80.0 to 100 (fifth quintile) are the least attrac tive.
First quintile
Only the top10 juris dic tions pre vi ously men tioned have scores in the top range (first quintile, light
blue) in 2013. These are:
· Oklahoma
· Mis sis sippi
· Sas katch e wan
· Texas
· Ar kan sas
· Kan sas
· Al a bama
· North Da kota
· Man i toba
· Neth er lands—North Sea
Fra ser In sti tute Global Pe tro leum Sur vey, 2013 23www.fraserinstitute.org

This com pares with 19 juris dic tions with first quintile scores in 2012 and 15 in 2011. All of the
juris dic tions in the first quintile this year also scored in the first quintile in 2012, with the excep tion
of Arkan sas and Ala bama which were not ranked in 2012 due to insuf fi cient data. The Neth er -
lands, Faroe Islands, Den mark, Lou i si ana, Wyo ming, West Vir ginia, Nor way—North Sea, Ohio,
Ire land, and New Mex ico slipped from the first quintile in 2012 to the sec ond quintile in 2013. Col -
o rado, which also scored in the first quintile in 2012, has dropped to the third quintile.
US juris dic tions account for 7 of the 10 juris dic tions with first quintile scores this year. Two juris -
dic tions (Sas katch e wan and Man i toba) are in Can ada. The only other juris dic tion in the top 10
group ing is the Neth er lands.
Second quintile
The 50 juris dic tions with scores from 20 to 39.99 (sec ond quintile) accord ing to the Pol icy Per cep -
tion Index are iden ti fied in dark blue in Map 1. This com pares with 48 sec ond quintile juris dic tions
in 2012. Geo graph i cally, this year this group is con cen trated in North Amer ica (with 10 US and 5
Cana dian juris dic tions), Europe (13 coun tries), and Oceania (New Zea land, Brunei, and 6 Aus tra -
lian juris dic tions). Seven juris dic tions in the sec ond quintile are in the Mid dle East North Africa
region and three are in the rest of Africa. Asia and Latin Amer ica are each rep re sented in the sec ond
quintile by 2 jurisdictions.
All of the juris dic tions with scores in the sec ond quintile are listed below in the order of their rank
(i.e., best to worst score). Due to their improved (lower) scores, the nine juris dic tions marked with
an up arrow (Ú) moved up into the sec ond quintile this year from the third quintile in 2012. Bot -
swana, Sey chelles, and Illi nois were not eval u ated in 2012. Ten juris dic tions fell from the first
quintile in 2012 to the sec ond quintile in 2013 (see pre vi ous sec tion) and the remain ing 28 juris dic -
tions in the sec ond quintile group were also in this group in 2012.
· Neth er lands
· Faroe Is lands
· Den mark
· Lou i si ana
· Wy o ming
· United King dom—North Sea
· Bot swana
· Qa tar
· Al berta
· Nor way
· Montana
· West Vir ginia
· United King dom
· New found land & Lab ra dor
24 Fra ser In sti tute Global Pe tro leum Sur vey, 2013
www.fraserinstitute.org

· United Arab Emirates
· ChileÚ
· South Aus tra lia
· Nor way—North Sea
· Ohio
· Nova Sco tia
· Oman
· Utah
· North ern Ter ri tory
· New Zea land
· Ire land
· New Mex ico
· Sey chelles
· NamibiaÚ
· Yu kon
· Il li nois
· US Off shore—Gulf of Mex ico
· Georgia
· Malta
· Bah rainÚ
· Jor danÚ
· Po land
· Brit ish Co lum bia
· Tur keyÚ
· West ern Aus tra lia
· BruneiÚ
· Mo rocco
· Tas ma nia
· Trin i dad and To bagoÚ
· Aus tra lia—Off shore
· Ger many
· Vic to ria
· Ja pan
· Penn syl va nia
· Thai landÚ
· Ku waitÚ
Fra ser In sti tute Global Pe tro leum Sur vey, 2013 25www.fraserinstitute.org

Third quintile
Inves tors gen er ally per ceive juris dic tions with Pol icy Per cep tion Index scores from 40 to 59.99
(i.e., in the third quintile) as some what less attrac tive than those with scores in the first and sec ond
quin tiles. The 47 juris dic tions that achieved third quintile scores this year, col ored green on Map 1
(up from 40 in 2012) are listed below in order of their rank (best to worst).
One rea son for the increased num ber of juris dic tions fall ing in the third quintile this year is that
four of those listed (Spain—Off shore, Spain—Onshore, Suri name, US Off shore—Pacific) were
not eval u ated in 2012. Of the 43 juris dic tions with scores in the third quintile range this year that
were also eval u ated in 2012, Col o rado dropped into the third quintile this year from a first quintile
per for mance a year ago. Thir teen juris dic tions, marked with a down arrow (Ø) below, dropped
into the third quintile in 2013 from the sec ond quintile in 2012. In addi tion to Col o rado, the dete -
ri o ra tion was par tic u larly severe in Hun gary, Cyprus, and Cal i for nia. The index scores for each of
these four juris dic tions increased (i.e. wors ened) by at least 23 points (see table 1). Seven juris dic -
tions marked with an up arrow (Ú) reg is tered third quintile per for mances this year com pared with
only fourth quintile rat ings in 2012. In the case of Mali, Paki stan, and South Africa, the improve -
ment resulted from reduc tions in their index scores of 18 or more points. The remain ing 22 juris -
dic tions scored in the third quintile both this year and in 2012.
· North west Ter ri to riesØ
· Mich i ganØ
· Uru guay
· Spain—Off shore
· Spain—On shore
· Col o rado
· Al ba nia
· Ma lay sia
· QueenslandØ
· Is raelØ
· South Af ricaÚ
· Phil ip pines
· Co lom bia
· Ghana
· US Off shore—AlaskaØ
· Cy prusØ
· Mau ri ta nia
· Tu ni siaØ
· Alaska
· Hun garyØ
· New Bruns wickÚ
26 Fra ser In sti tute Global Pe tro leum Sur vey, 2013
www.fraserinstitute.org

· Green landØ
· MaliÚ
· New South Wales
· Ivory CoastÚ
· Cam er oon
· Su ri name
· Leb a non
· Tan za nia
· Guy anaØ
· Mo zam bique
· Pa ki stanÚ
· Azerbaijan
· It aly
· Kenya
· FranceØ
· Ro ma niaØ
· Cal i for niaØ
· Viet nam
· US Off shore—Pa cific
· ChinaÚ
· Ga bon
· Ethi o pia
· Equa to rial GuineaÚ
· Brazil—On shore con ces sion con tracts
· Peru
· Brazil—Off shore con ces sion con tracts
Fourth quintile
Juris dic tions with Pol icy Per cep tion Index scores from 60 to 79.99 (i.e., the fourth quintile) all
received rel a tively high per cent ages of neg a tive scores. This indi cates that inves tors regard them as
less attrac tive than juris dic tions with lower scores, i.e., those in the first, sec ond, or third quin tiles.
Thirty-eight juris dic tions have scores in the fourth quintile this year com pared with 35 in 2012.
They are col ored orange on Map 1.
The fourth quintile juris dic tions are listed below in the order or their respec tive ranks. French Gui -
ana was not eval u ated in 2012. The nine juris dic tions that slipped into the fourth quintile this year
from the third quintile last year are flagged with a down arrow (Ø). Of these, the dete ri o ra tion was
espe cially severe in the case of Gua te mala, Bul garia, and New York, whose scores wors ened (i.e.,
Fra ser In sti tute Global Pe tro leum Sur vey, 2013 27www.fraserinstitute.org

increased) by more than 20 points. Argen tina—Santa Cruz, Nige ria, and Libya achieved improved
scores this year—mov ing into the fourth quintile from the fifth.
The 25 juris dic tions in the fourth quintile that are nei ther flagged nor men tioned above were also
in this quintile in 2012.
· An gola
· French Gui ana
· NigerØ
· Timor Gap (JPDA)Ø
· Mad a gas car
· East Timor
· Bul gariaØ
· Brazil—Off shore pre-salt area profit shar ing con tractsØ
· GreeceØ
· Egypt
· UgandaØ
· New YorkØ
· Ye men
· Re pub lic of the Congo (Brazzaville)
· Dem o cratic Re pub lic of the Congo (Kinshasa)
· TurkmenistanØ
· In dia
· Pa pua New Guinea
· Al ge ria
· Myanmar
· Gua te malaØ
· Ar gen tina—Neuquen
· Cam bo dia
· Ar gen tina—Santa Cruz
· In do ne sia
· Chad
· Ar gen tina—Chubut
· Ni ge ria
· Ar gen tina—Mendoza
· Ar gen tina—Tierra del Fuego
· Soma li land
· Kazakhstan
· Rus sia—Off shore Sakhalin
· Que bec
28 Fra ser In sti tute Global Pe tro leum Sur vey, 2013
www.fraserinstitute.org

· Bangladesh
· Syria
· Ukraine
· Libya
Fifth quintile
The fifth quintile (shown on Map 1 in red) is reserved for juris dic tions rated as the least attrac tive
to inves tors. Their scores range from 80 to 100. This year, as in 2012, there are 12 juris dic tions in
this cat e gory, which indi cates their rel a tive unattractiveness for upstream invest ment. In order of
their rank ings, these are:
· Kyrgyzstan
· Ar gen tina—Salta
· Rus sia—Other
· Iraq
· South Su dan
· Rus sia—East ern Si be ria
· Uzbekistan
· Rus sia—Off shore Arc tic
· Bolivia
· Iran
· Ec ua dor
· Ven e zuela
All of these coun tries were in the fifth quintile in 2012 with the excep tion of Kyrgyzstan, Argen -
tina—Salta and South Sudan, which dropped into the fifth quintile this year after achiev ing fourth
quintile scores in 2012. Kyrgyzstan’s change was most sig nif i cant, with its index score ris ing (i.e.,
wors en ing) by 16.4 points. Three (of the four) Rus sian regions are in the fifth quintile again this
year: Rus sia—Other, Rus sia—East ern Sibe ria, and Rus sia—Off shore Arc tic. Three fifth-quintile
scor ers last year (Argen tina—Santa Cruz, Nige ria, and Libya) scored better and moved up to the
some what less unat trac tive fourth quintile this year.
Policy Perception Index rankings segmented accordingto jurisdictions’ proved reserves
Rank ing the attrac tive ness of juris dic tions for invest ment accord ing to their com mer cial envi ron -
ment, reg u la tory cli mate, polit i cal risk, and other fac tors (e.g. secu rity of per son nel and equip -
ment, and qual ity of infra struc ture and data) as we have been doing since the sur vey was ini ti ated
in 2007 has proven use ful. How ever, this approach ignores the fact that deci sions to invest in
petro leum explo ra tion and devel op ment are always con di tioned by the extent of a juris dic tion’s
Fra ser In sti tute Global Pe tro leum Sur vey, 2013 29www.fraserinstitute.org

petro leum resources. While juris dic tions with rel a tively small proved oil and gas reserves (and
gen er ally, rel a tively lit tle petro leum pro duc tion), such as Man i toba and Mis sis sippi, may achieve
high Pol icy Per cep tion Index scores and rank ings, they can not be expected to attract nearly as
much invest ment as juris dic tions with sim i lar attrib utes accord ing to that mea sure, but with much
larger petro leum reserves (e.g. Qatar, Alberta, and the United Arab Emirates). There fore, in this
sec tion, we assess how juris dic tions in each of 3 proved reserves clas si fi ca tions or “tiers,” com pare
on the Pol icy Per cep tion index mea sure. The com bi na tion of a high rank ing on the Pol icy Per cep -
tion Index with exten sive proved oil and gas reserves pro vides a strong indication that a
jurisdiction will have considerable appeal to upstream investors.
Proved (some times referred to as “proven”) reserves are dis cov ered oil or gas resources which, on
the basis of test wells, are believed to be fea si ble for com mer cial iza tion, assum ing cur rent oil and
gas prices and using already avail able trans por ta tion infra struc ture such as pipe lines. By ignor ing
dis cov ered resources not yet proven to con sti tute “reserves,” this approach penal izes juris dic tions
such as Brazil’s off shore pre-salt region whose known but unproven resources are thought to have
enor mous poten tial. It also gives no rec og ni tion to juris dic tions believed to hold sig nif i cant
yet-to-be dis cov ered oil and gas resources such as Alaska—US Off shore, Rus sia—Off shore Arc -
tic, Kenya, and Green land. In spite of these short com ings, we were lim ited to work ing with
proved reserves because data were avail able on this basis for nearly all of the juris dic tions
included in our sur vey.6
The Tier One clas si fi ca tion encom passes 27 juris dic tions which, in each case, hold at least 1 per -
cent (when rounded) of the proved reserves held by 138 of the 157 juris dic tions included in the
sur vey which have proved oil and/or gas reserves.7 The proved reserves held by these juris dic tions
range from 13.9 bil lion bar rels of oil equiv a lent (Bboe) in India to 369.6 Bboe in Iran, and con sti -
tute 92.1 per cent of the proved reserves of the group of 138 juris dic tions.
Table 2 indi cates the Pol icy Per cep tion Index scores and rank ings and proved reserves for each of
the Tier One juris dic tions.
The top seven large reserve hold ers accord ing to the Pol icy Per cep tion Index are Texas, Qatar,
Alberta, United Arab Emirates, Nor way—North Sea, Aus tra lia—Off shore, and Kuwait. Of these,
only Texas ranks in the most favour able first quintile; the 6 oth ers achieved slightly less attrac tive
sec ond quintile scores this year. The six least attrac tive large reserve hold ers are Ven e zuela, Iran,
Rus sia—Off shore Arc tic, Rus sia—East Sibe ria, Iraq, and Rus sia—Other, all with least attrac tive
fifth quintile scores and, as a group, com pris ing almost 46 per cent of total proved reserves. If that
30 Fra ser In sti tute Global Pe tro leum Sur vey, 2013
www.fraserinstitute.org
6 The data sources that we used for proved reserves are provided in Appendix 1.
7 The 19 jurisdictions excluded because they have no proved reserves are: Botswana, Brazil—Offshore
Profit Sharing Contracts, Cambodia, Cyprus, Faroe Islands, French Guiana, Greenland, Guyana,
Kenya, Lebanon, Mali, Malta, New South Wales, Niger, Quebec, Seychelles, Tasmania, East Timor,
and Uruguay.

sub-group were enlarged to encom pass the next 3 least attrac tive juris dic tions accord ing to the
Pol icy Per cep tion Index (i.e., the 3 worst fourth quintile per form ers this year: Libya, Rus sia—Off -
shore Sakhalin, and Kazakhstan) it would rep re sent more than half of the world’s proved oil and
gas reserves.
The 41 Tier Two juris dic tions each have at least 0.1 per cent of the proved reserves of the group of
138 reserve hold ers. The reserves of these juris dic tions range from Chad’s 1.5 Bboe to Oman’s 11.8
Bboe. As a whole, the Tier Two juris dic tions hold 6.8 per cent of total proved reserves.
Fra ser In sti tute Global Pe tro leum Sur vey, 2013 31www.fraserinstitute.org
Ta ble 2: Tier One Com par i sons
Tier One Pol icy Per cep tion In dex score
Proved Re serves (bboe)
1 Texas 11.71 24.529
2 Qa tar 24.16 189.996
3 Al berta 24.47 177.020
4 United Arab Emirates 26.49 138.002
5 Nor way—North Sea 27.06 14.220
6 Aus tra lia—Off shore 37.65 28.029
7 Ku wait 39.56 113.275
8 Ma lay sia 43.55 21.932
9 Azerbaijan 53.93 15.386
10 China 57.23 34.842
11 Brazil—Off shore CC 59.71 16.609
12 An gola 60.14 15.550
13 Egypt 62.62 18.747
14 Turkmenistan 70.23 161.110
15 In dia 70.41 13.890
16 Al ge ria 71.04 41.936
17 In do ne sia 74.36 23.608
18 Ni ge ria 75.75 70.928
19 Kazakhstan 76.73 42.410
20 Rus sia—Off shore Sakhalin 76.75 23.725
21 Libya 79.98 56.967
22 Rus sia—Other 81.62 204.753
23 Iraq 82.88 166.780
24 Rus sia—East Si be ria 85.80 18.789
25 Rus sia—Off shore Arc tic 90.74 135.091
26 Iran 97.17 369.581
27 Ven e zuela 100.00 332.981
32 Fra ser In sti tute Global Pe tro leum Sur vey, 2013
www.fraserinstitute.org
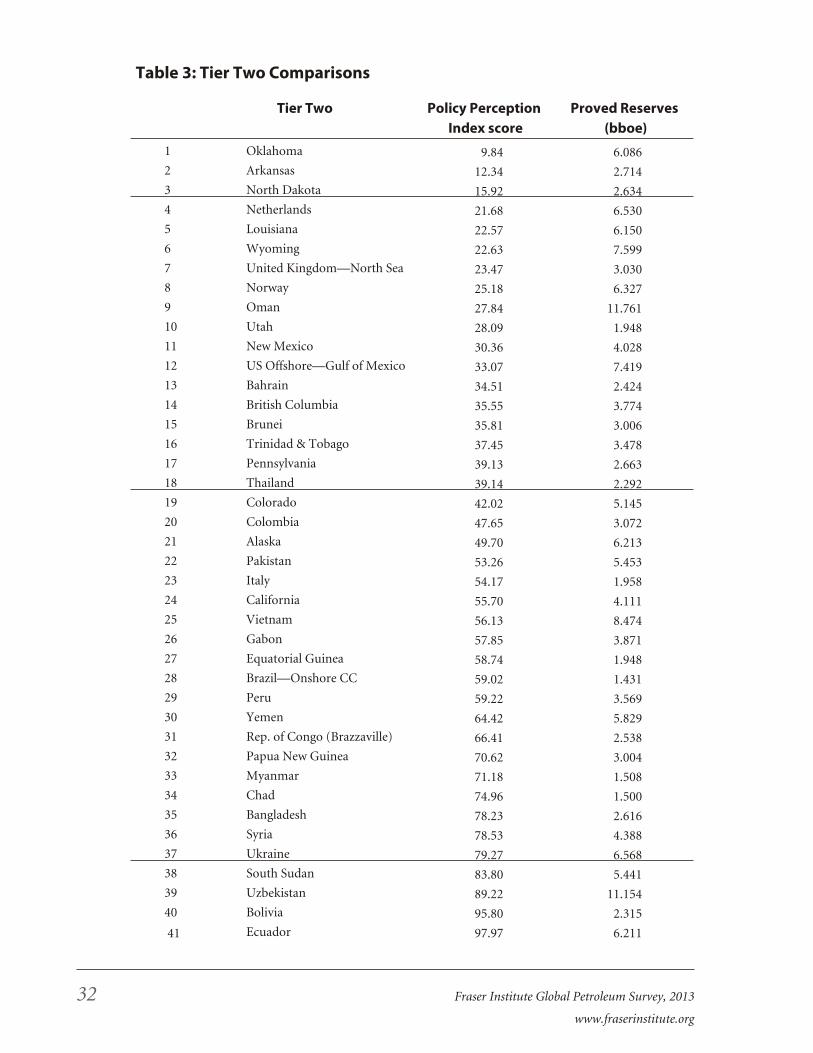
Ta ble 3: Tier Two Com par i sons
Tier Two Pol icy Per cep tion In dex score
Proved Re serves (bboe)
1 Oklahoma 9.84 6.086
2 Ar kan sas 12.34 2.714
3 North Da kota 15.92 2.634
4 Neth er lands 21.68 6.530
5 Lou i si ana 22.57 6.150
6 Wy o ming 22.63 7.599
7 United King dom—North Sea 23.47 3.030
8 Nor way 25.18 6.327
9 Oman 27.84 11.761
10 Utah 28.09 1.948
11 New Mex ico 30.36 4.028
12 US Off shore—Gulf of Mex ico 33.07 7.419
13 Bah rain 34.51 2.424
14 Brit ish Co lum bia 35.55 3.774
15 Brunei 35.81 3.006
16 Trin i dad & To bago 37.45 3.478
17 Penn syl va nia 39.13 2.663
18 Thai land 39.14 2.292
19 Col o rado 42.02 5.145
20 Co lom bia 47.65 3.072
21 Alaska 49.70 6.213
22 Pa ki stan 53.26 5.453
23 It aly 54.17 1.958
24 Cal i for nia 55.70 4.111
25 Viet nam 56.13 8.474
26 Ga bon 57.85 3.871
27 Equa to rial Guinea 58.74 1.948
28 Brazil—On shore CC 59.02 1.431
29 Peru 59.22 3.569
30 Ye men 64.42 5.829
31 Rep. of Congo (Brazzaville) 66.41 2.538
32 Pa pua New Guinea 70.62 3.004
33 Myanmar 71.18 1.508
34 Chad 74.96 1.500
35 Ban gla desh 78.23 2.616
36 Syria 78.53 4.388
37 Ukraine 79.27 6.568
38 South Su dan 83.80 5.441
39 Uzbekistan 89.22 11.154
40 Bolivia 95.80 2.315
41 Ec ua dor 97.97 6.211

Pol icy Per cep tion Index scores and rank ings and proved reserves for each of the Tier Two
proved-reserves-level juris dic tions are indi cated in table 3. The 3 most attrac tive juris dic tions, all
with first quintile scores on the Pol icy Per cep tion Index mea sure, are Oklahoma, Arkan sas, and
North Dakota. These are fol lowed by 7 juris dic tions with low sec ond quintile scores: Neth er lands,
Lou i si ana, Wyo ming,United King dom—North Sea; Nor way, Oman, and Utah. The 3 larg est
reserves hold ers of the ten most attrac tive Tier Two juris dic tions are Oman (11.8 Bboe), Wyo ming
Fra ser In sti tute Global Pe tro leum Sur vey, 2013 33www.fraserinstitute.org
Ta ble 4: Tier Three Com par i sons
Tier Three Pol icy Per cep tion In dex score
Proved Re serves(bboe)
1 Mis sis sippi 11.19 0.473
2 Sas katch e wan 11.43 0.965
3 Kan sas 12.64 1.061
4 Al a bama 15.34 0.567
5 Man i toba 16.87 0.034
6 Neth er lands—North Sea 18.66 1.051
7 Den mark 22.46 1.121
8 Montana 25.89 0.631
9 West Vir ginia 25.91 1.340
10 United King dom 26.40 1.102
11 New found land & Lab ra dor 26.43 0.864
12 Chile 26.63 0.797
13 South Aus tra lia 26.91 0.222
14 Ohio 27.35 0.223
15 Nova Sco tia 27.52 0.032
16 North ern Ter ri tory 29.25 0.070
17 New Zea land 29.60 0.295
18 Ire land 29.60 0.065
19 Namibia 31.31 0.411
20 Yu kon 31.99 0.021
21 Il li nois 32.51 0.082
22 Geor gia 33.40 0.106
23 Jor dan 34.60 0.041
24 Po land 35.03 0.900
25 Tur key 35.63 0.311
26 West ern Aus tra lia 35.70 0.113
27 Mo rocco 36.18 0.011
28 Ger many 38.07 0.687
29 Vic to ria 38.74 0.032
30 Ja pan 39.05 0.182
31 North west Ter ri to ries 40.84 0.129
con tin ued next page ...

34 Fra ser In sti tute Global Pe tro leum Sur vey, 2013
www.fraserinstitute.org
Ta ble 4: Tier Three Com par i sons
Tier Three Pol icy Per cep tion In dex score
Proved Re serves(bboe)
32 Mich i gan 41.03 0.616
33 Spain—Off shore 41.52 0.003
34 Spain—On shore 41.85 0.148
35 Al ba nia 43.41 0.205
36 Queensland 45.07 0.225
37 Is rael 45.33 1.310
38 South Af rica 45.62 0.337
39 Phil ip pines 47.15 0.789
40 Ghana 47.88 0.810
41 US Off shore—Alaska 48.11 0.023
42 Mau ri ta nia 48.55 0.287
43 Tu ni sia 49.35 0.855
44 Hun gary 49.83 0.080
45 New Bruns wick 49.94 0.020
46 Ivory Coast 50.99 0.287
47 Cam er oon 51.66 1.092
48 Su ri name 51.94 0.072
49 Tan za nia 52.32 0.043
50 Mo zam bique 52.71 0.841
51 France 55.26 0.128
52 Ro ma nia 55.34 1.310
53 US Off shore—Pa cific 56.20 0.582
54 Ethi o pia 58.74 0.164
55 Aus tra lia—Timor Gap JPDA 61.09 0.509
56 Mad a gas car 61.14 0.187
57 Bul garia 61.68 0.052
58 Greece 61.99 0.017
59 Uganda 64.06 1.000
60 New York 64.20 0.071
61 Dem o cratic Re pub lic of theCongo (Kinshasa)
69.32 0.245
62 Gua te mala 73.48 0.270
63 Ar gen tina—Neuquen 73.76 1.109
64 Ar gen tina—Santa Cruz 74.02 0.771
65 Ar gen tina—Chubut 75.62 1.318
66 Ar gen tina—Mendoza 75.88 0.375
67 Ar gen tina—Tierra del Fuego 76.29 0.256
68 Soma li land 76.56 0.037
69 Kyrgyzstan 80.60 0.077
70 Ar gen tina—Salta 81.08 0.244

(7.6 Bboe), and Neth er lands (6.5 Bboe). The proved reserves of all 10 of the most attrac tive juris -
dic tions in this group are 54.8 Bboe. This rep re sents just 2.0 per cent of the world’s proved reserves.
The four least attrac tive Tier Two juris dic tions are Ecua dor, Bolivia, Uzbekistan, and South
Sudan, all with fifth quintile Pol icy Per cep tion index scores. The 6 next worst juris dic tions in this
tier, as indi cated by their poor fourth quintile scores, are the Ukraine, Syria, Ban gla desh, Chad,
Myanmar, and Papua New Guinea. Com bined, the 10 least attrac tive Tier Two juris dic tions have
proved reserves of 44.7 Bboe or about 1.7 per cent of the world total.
Pol icy Per cep tion Index scores and rank ings and proved reserves for each of the 70 Tier Three
low-proved-reserves juris dic tions are indi cated in table 4. These juris dic tions each have up to 0.1
per cent of the proved reserves held by the 138 juris dic tions, rang ing from almost neg li gi ble hold -
ings in the case of Spain—Off shore to West Vir ginia’s 1.34 Bboe, and, alto gether, 1.1 per cent of
total proved reserves.
The six most attrac tive of the Tier Three juris dic tions, all with first quintile Pol icy Per cep tion
Index scores, are Mis sis sippi, Sas katch e wan, Kan sas, Ala bama, Man i toba, and the Neth er -
lands—North Sea. They are fol lowed by 12 juris dic tions with low sec ond quintile scores: Den -
mark, Montana, West Vir ginia, United King dom, New found land & Lab ra dor, Chile, South
Aus tra lia, Ohio, Nova Sco tia, Aus tra lian North ern Ter ri tory, New Zea land, and Ire land.
The least attrac tive juris dic tions among this group of low-proved-reserve hold ers are Argen -
tina—Salta and Kyrgyzstan, both with fifth quintile scores, and 7 juris dic tions with the worst (i.e.,
upper half) fourth quintile scores: the 5 other Argen tine prov inces that were included in the sur -
vey, Soma li land, and Gua te mala.
Com mer cial Envi ron ment Index find ings
Fig ure 5 ranks juris dic tions based on the five com mer cial envi ron ment index fac tors: fis cal terms,
tax a tion in gen eral, trade bar ri ers, qual ity of infra struc ture, and labor avail abil ity and skills.
Based solely on the responses to these 5 fac tors, the 10 least attrac tive juris dic tions are Ven e zuela,
Iran, Bolivia, Uzbekistan, Rus sia—Off shore Arc tic, Ecua dor, Rus sia—East ern Sibe ria,
Kazakhstan, Rus sia—other, and Argen tina—Salta.
This year, Rus sia—Off shore Arc tic, Ecua dor, and Kazakhstan dis placed Libya, Uru guay, Cam bo -
dia, and Yemen in this group.8 Although Libya’s score on the com mer cial envi ron ment remained
in the unde sir able fifth quintile, Cam bo dia and Yemen each improved to the fourth quintile range.
Uru guay improved most nota bly, mov ing from the fifth quintile in 2012 to a low (41.3) third
quintile score.
Fra ser In sti tute Global Pe tro leum Sur vey, 2013 35www.fraserinstitute.org
8 Note that, for any jurisdiction, comparison of the 2012 and 2013 values for this Index is affected by
the fact that scores on the corruption question were only included in the calculation for 2012.

Figure 5: Commercial Environment Index
0 20 40 60 80 100
VenezuelaIran
BoliviaUzbekistan
Russia – Offshore ArcticEcuador
Russia – Eastern SiberiaKazakhstan
Russia – otherArgentina – Salta
SyriaIraq
LibyaBangladesh
Russia – Offshore SakhalinArgentina – Tierra del Fuego
KyrgyzstanSouth Sudan
TurkmenistanChad
CambodiaArgentina – Santa Cruz
IndonesiaArgentina – Mendoza
Argentina – ChubutArgentina – Neuquen
MyanmarDemocratic Republic of the Congo (Kinshasa)
UkraineUgandaAlgeriaNigeria
CA – QuebecGuatemala
IndiaChina
Brazil – Offshore presalt area profit sharing contractsSomaliland
Papua New GuineaRepublic of the Congo (Brazzaville)
AngolaYemenGabon
NigerEquatorial Guinea
VietnamBrazil – Offshore concession contractsBrazil – Onshore concession contracts
East TimorTimor Gap (JPDA)
French GuianaUS – New York
AzerbaijanEthiopia
KenyaMadagascar
EgyptMauritania
BulgariaTanzania
MozambiqueGreenland
GuyanaCameroon
GreeceKuwait
RomaniaIvory Coast
SurinameUS Offshore – Pacific
US – AlaskaUS – California
FranceMalaysia
GhanaLebanonGeorgia
Hungary Mild deterrent toinvestment
Strong deterrent toinvestment
Would not pursueinvestment due tothis factor
0 20 40 60 80 100
PakistanCA – New Brunswick
ItalyUS Offshore – Alaska
PeruMali
TunisiaCyprus
BotswanaBrunei
UruguayAlbania
PhilippinesIsrael
AU – New South WalesGermany
SeychellesTrinidad and Tobago
OmanJapan
CA – Northwest TerritoriesThailand
United Arab EmiratesNamibia
South AfricaAU – Queensland
CA – Newfoundland & LabradorTurkey
ColombiaUS – Michigan
BahrainAU – Western Australia
CA – Nova ScotiaJordan
MoroccoAustralia – Offshore
Faroe IslandsPoland
MaltaNorway
US – PennsylvaniaUS – Colorado
AU – TasmaniaAU – Northern Territory
DenmarkUnited Kingdom
CA – YukonNorway – North Sea
IrelandCA – British Columbia
AU – VictoriaQatar
Spain – OnshoreUnited Kingdom – North Sea
ChileUS – Ohio
US Offshore – Gulf of MexicoUS – Illinois
US – MontanaNew Zealand
Spain – OffshoreUS – Utah
NetherlandsUS – West Virginia
AU – South AustraliaUS – North Dakota
US – New MexicoNetherlands – North Sea
US – LouisianaCA – Alberta
US – WyomingCA – ManitobaUS – ArkansasUS – Alabama
US – KansasCA – Saskatchewan
US – TexasUS – MississippiUS – Oklahoma
Mild deterrent toinvestment
Strong deterrent toinvestment
Would not pursueinvestment due to thisfactor

Oklahoma ranks as the most com mer cially attrac tive juris dic tion again this year, fol lowed closely
by Mis sis sippi and Texas. Other juris dic tions in the first quintile accord ing to the Com mer cial
Envi ron ment Index are Sas katch e wan, Kan sas, Ala bama, Arkan sas, Man i toba, Wyo ming, Alberta,
Lou i si ana, Neth er lands—North Sea, New Mex ico, and North Dakota. Cana dian and US juris dic -
tions dom i nate the first quintile with 10 US states and 3 Cana dian prov inces in this quintile and
only the Neth er lands—North Sea from out side of North Amer ica.
Reg u la tory Cli mate Index results
The Reg u la tory Cli mate Index (fig ure 6) ranks juris dic tions accord ing to inves tors’ per cep tions of
the reg u la tory hur dles that are in place, includ ing reg u la tory enforce ment, reg u la tory incon sis -
tency and dupli ca tion, envi ron men tal reg u la tions, labor reg u la tions, fair ness and trans par ency of
the legal sys tem, and the cost of reg u la tory com pli ance. Poor per for mance on reg u la tory issues is a
major rea son why many juris dic tions are regarded as relatively unattractive for investment.
Based on the responses to these fac tors, the 10 least attrac tive juris dic tions on the Reg u la tory Cli -
mate Index are Ven e zuela, Ecua dor, Iran, Rus sia—Off shore Arc tic, Uzbekistan, Bolivia, Rus -
sia—East ern Sibe ria, Que bec, Argen tina—Salta, and Rus sia—Off shore Sakhalin. This group is
sim i lar to that reported in the 2012 sur vey except that Que bec and Argen tina—Salta have replaced
Argen tina—Santa Cruz and Kazakhstan. Both Que bec and Salta dropped from the fourth quintile
in 2012 into the bot tom 10 accord ing to this mea sure in 2013. In addi tion to the 10 worst juris dic -
tions accord ing to the Reg u la tory Cli mate Index, Rus sia—Other, Ukraine, and Argen -
tina—Chubut were also awarded unde sir able fifth quintile rat ings with respect to the reg u la tory
cli mate.
The 10 most attrac tive juris dic tions on the Reg u la tory Cli mate Index this year are Bot swana, Sas -
katch e wan, Oklahoma, Faroe Islands, Arkan sas, North Dakota, Texas, Kan sas, Mis sis sippi, and
Man i toba. The most attrac tive juris dic tions are sim i lar to last year’s with the excep tion of Bot -
swana and Arkan sas—which were not included in the 2012 sur vey—and Faroe Islands which
moved up from the sec ond quintile. All 10 most attrac tive juris dic tions achieved first quintile rat -
ings on the Reg u la tory Cli mate Index. No other juris dic tions have first quintile reg u la tory cli mate
scores. Three juris dic tions that had first quintile rat ings on the Reg u la tory Cli mate Index in
2012—West Vir ginia, Den mark, and Ohio—slipped into the sec ond quintile range in 2013.
Geopolitical Risk Index
The Geopolitical Risk Index focuses on polit i cal risk and on the secu rity of per son nel and phys i cal
assets. As fig ure 7 indi cates, 18 juris dic tions (Libya, Syria, Iraq, Iran, Ven e zuela, South Sudan,
Soma li land, Kyrgyzstan, Yemen, Alge ria, Egypt, Ecua dor, Bolivia, Chad, Paki stan, Papua New
Guinea, Mali, and Nige ria) scored in the fifth quintile this year on this mea sure. This com pares
with only 10 juris dic tions in the fifth quintile in 2012. The rea son for the dif fer ence is that 8 of the
Fra ser In sti tute Global Pe tro leum Sur vey, 2013 37www.fraserinstitute.org

Figure 6: Regulatory Climate Index
0 20 40 60 80 100
US – MichiganAlbania
AU – VictoriaAzerbaijan
JapanCameroon
South AfricaColombia
PhilippinesUS – Alaska
AU – TasmaniaUS Offshore – Gulf of Mexico
Australia – OffshoreGuyana
GhanaTunisia
TanzaniaMauritania
MalaysiaGermany
CyprusPoland
Ivory CoastCA – Northwest Territories
KenyaMali
KuwaitUS – Illinois
JordanThailand
BruneiAU – Western Australia
CA – British ColumbiaUruguay
US – New MexicoIreland
CA – YukonNorway – North Sea
MaltaMorocco
Trinidad and TobagoNew Zealand
US – OhioBahrain
US – UtahTurkey
AU – South AustraliaCA – Alberta
US – West VirginiaUnited Kingdom
US – LouisianaCA – Nova Scotia
AU – Northern TerritoryUnited Kingdom – North Sea
NorwayNamibia
US – WyomingGeorgia
ChileUS – Montana
NetherlandsSeychelles
United Arab EmiratesOman
CA – Newfoundland & LabradorQatar
Netherlands – North SeaDenmark
US – AlabamaCA – Manitoba
US – MississippiUS – KansasUS – Texas
US – North DakotaUS – ArkansasFaroe Islands
US – OklahomaCA – Saskatchewan
Botswana
Mild deterrent toinvestment
Strong deterrent toinvestment
Would not pursueinvestment due to this factor
0 20 40 60 80 100
VenezuelaEcuador
IranRussia – Offshore Arctic
UzbekistanBolivia
Russia – Eastern SiberiaCA – Quebec
Argentina – SaltaRussia – Offshore Sakhalin
Russia – otherUkraine
Argentina – ChubutArgentina – MendozaArgentina – Neuquen
Argentina – Tierra del FuegoKazakhstan
Argentina – Santa CruzIndonesia
IraqNigeria
KyrgyzstanLibya
US – New YorkSouth Sudan
Brazil – Offshore presalt area profit sharing contractsBulgaria
CambodiaIndia
BangladeshAlgeria
Brazil – Offshore concession contractsSomaliland
TurkmenistanUS – California
US Offshore – PacificGuatemala
PeruTimor Gap (JPDA)
SyriaRepublic of the Congo (Brazzaville)
FrancePapua New Guinea
MyanmarGreece
ChadBrazil – Onshore concession contracts
ItalySpain – Offshore
HungaryDemocratic Republic of the Congo (Kinshasa)
French GuianaAngola
EgyptAU – New South Wales
Spain – OnshoreMadagascar
YemenRomaniaVietnam
US Offshore – AlaskaGabon
UgandaEquatorial Guinea
ChinaEthiopia
IsraelAU – Queensland
NigerGreenlandSuriname
US – PennsylvaniaCA – New Brunswick
US – ColoradoPakistanLebanon
East TimorMozambique Mild deterrent to
investment
Strong deterrentto investment
Would not pursueinvestment due tothis factor

Figure 7: Geopolitical Risk Index
0 20 40 60 80 100
LibyaSyriaIraqIran
VenezuelaSouth Sudan
SomalilandKyrgyzstan
YemenAlgeria
EgyptEcuador
BoliviaChad
PakistanPapua New Guinea
MaliNigeria
Democratic Republic of the Congo (Kinshasa)Bangladesh
UkraineUzbekistan
NigerEast Timor
Ivory CoastArgentina – Tierra del Fuego
KenyaRussia – other
TunisiaRepublic of the Congo (Brazzaville)
GuatemalaRussia – Offshore Arctic
Argentina – ChubutRussia – Eastern Siberia
MyanmarArgentina – Santa Cruz
LebanonEquatorial Guinea
Argentina – MendozaArgentina – Salta
MadagascarCambodia
EthiopiaArgentina – Neuquen
IndiaColombia
AngolaUgandaBahrain
IndonesiaTanzania
Russia – Offshore SakhalinAzerbaijan
South AfricaSuriname
GreeceKazakhstanPhilippines
GabonCameroon
GuyanaFrench Guiana
BulgariaCyprus
MozambiqueCA – Quebec
TurkmenistanGhana
MoroccoPeru
ThailandAlbania
CA – New BrunswickRomania
MauritaniaTimor Gap (JPDA)
VietnamTrinidad and Tobago
Mild deterrent toinvestment
Strong deterrent toinvestment
Would not pursueinvestment due to thisfactor
0 20 40 60 80 100
Brazil – Onshore concession contractsIsrael
Brazil – Offshore concession contractsUS Offshore – Pacific
ItalyTurkeyChina
GeorgiaUruguay
FranceUS – California
Brazil – Offshore presalt area profit …MalaysiaHungary
AU – New South WalesUS – MichiganUS – New York
MaltaUS – Illinois
KuwaitUS – Colorado
QatarNamibia
CA – British ColumbiaJordan
Spain – OffshoreUS Offshore – Alaska
OmanGreenlandSeychelles
US – AlaskaIreland
CA – Nova ScotiaAU – Victoria
Spain – OnshoreAU – Queensland
Faroe IslandsUnited Arab Emirates
US Offshore – Gulf of MexicoPoland
BotswanaUS – New Mexico
CA – Newfoundland & LabradorAustralia – Offshore
US – PennsylvaniaDenmarkGermany
CA – Northwest TerritoriesNew Zealand
United Kingdom – North SeaCA – Alberta
JapanBrunei
ChileUS – Utah
US – MontanaUnited Kingdom
CA – YukonUS – Louisiana
AU – South AustraliaNorway – North Sea
CA – ManitobaUS – West Virginia
US – KansasUS – Wyoming
AU – Western AustraliaUS – Arkansas
US – OhioAU – Northern Territory
NorwayNetherlands – North Sea
NetherlandsUS – North Dakota
US – OklahomaUS – Texas
CA – SaskatchewanUS – Alabama
US – MississippiAU – Tasmania
Mild deterrent to investment
Strong deterrent toinvestment
Would not pursueinvestment due to this factor

listed juris dic tions (Iran, Ecua dor, Soma li land, Kyrgyzstan, Alge ria, Egypt, Ecua dor, and Chad)
dropped from fourth quintile scores on the Geopolitical Risk Index in 2012 to fifth quintile scores
this year. This indi cates that upstream inves tors regard them as pos ing greater polit i cal and/or
security risks than a year ago.
A rel a tively high per cent age of the neg a tive responses some juris dic tions received on the polit i cal
sta bil ity and secu rity issue ques tions indi cate that respon dents sim ply “would not pur sue invest -
ment” in those juris dic tions due to this fac tor. Those juris dic tions for which the sur vey responses
used in the eval u a tions con tained the larg est per cent ages of this most neg a tive type of response are
Syria, Iran, Venezuela, and Mali.
Poten tial for improve ment
In this year’s sur vey, respon dents were again asked, “How much do you think oil and gas explo ra -
tion and devel op ment in each of the juris dic tions with which you are famil iar might increase if a
full and com plete tran si tion to ‘Best Prac tices’ in rela tion to the main driv ers of invest ment deci -
sions—such as roy al ties, envi ron men tal reg u la tions, cost of reg u la tory com pli ance, profit repa tri -
a tion, a fair and trans par ent legal sys tem, and secu rity of per son nel and assets—were to occur?”
Respon dents were asked to answer to the ques tion for each juris dic tion with which they are famil -
iar by select ing from one of five pos si ble responses: 1) Not at all; 2) Only slightly; 3) 20 to 50 per -
cent; 4) 50 to 100 percent; and 5) More than 100 percent.
The results (fig ure 8) indi cate that a rel a tively large per cent age (20% or more) of respon dents
believe that explo ra tion and devel op ment could increase by more than 100 per cent in Uzbekistan,
Cam bo dia, Iran, Iraq, Syria, New York, Que bec, and Ven e zuela if best prac tices were adopted.
Com bin ing all the responses that indi cate that best prac tices could increase explo ra tion and devel -
op ment by at least 20 per cent (i.e., the type 3, 4 and 5 responses) shows that sur vey respon dents
believe that activ ity could poten tially be boosted by the great est per cent age in Soma li land, Bolivia,
Rus sia—East ern Sibe ria, Iran, Turkmenistan, Chad, Rus sia—Off shore Sakhalin, Nige ria,
Myanmar, Tan za nia, Argen tina—Salta, Argen tina—Chubut, Uzbekistan, Alge ria, Ban gla desh,
Libya, India, and Iraq. More over, as fig ure 10 indi cates, the adop tion of best prac tices would likely
lead to greater upstream invest ment in many other juris dic tions as well.
40 Fra ser In sti tute Global Pe tro leum Sur vey, 2013
www.fraserinstitute.org

Figure 8: Transition to Best Practices
0% 20% 40% 60% 80% 100%
US Offshore – PacificColombia
US – CaliforniaIvory Coast
JordanAzerbaijan
GhanaGabon
United Arab EmiratesRepublic of the Congo (Brazzaville)
MadagascarRomania
ItalySpain – Onshore
Brazil – Offshore concession contractsKenya
UruguaySpain – Offshore
Brazil – Onshore concession contractsMozambique
AlbaniaCambodiaCameroon
EthiopiaGuatemala
SurinameAngola
US – New YorkPakistan
SyriaDemocratic Republic of the Congo (Kinshasa)
Brazil – Offshore presalt area profit sharing contractsFrench Guiana
ChinaPapua New Guinea
IsraelUkraine
MauritaniaTunisia
VietnamGreece
BulgariaSouth Sudan
KuwaitKazakhstan
Equatorial GuineaYemen
East TimorEgypt
Argentina – MendozaCA – Quebec
EcuadorArgentina – Neuquen
IndonesiaUganda
PeruVenezuela
Russia – otherArgentina – Santa Cruz
Argentina – Tierra del FuegoKyrgyzstan
IraqIndiaLibya
BangladeshAlgeria
UzbekistanArgentina – Salta
Argentina – ChubutTanzania
MyanmarNigeria
Russia – Offshore SakhalinChad
TurkmenistanIran
Russia – Eastern SiberiaBolivia
Somaliland
20 - 50 percent
50 - 100 percent
More than 100 percent
0% 20% 40% 60% 80% 100%
Faroe IslandsNetherlands – North Sea
AU – South AustraliaJapan
NetherlandsCA – Saskatchewan
NorwayCA – Newfoundland & Labrador
US – North DakotaCA – Manitoba
US – West VirginiaUS – Alabama
US – MississippiCA – Yukon
United Kingdom – North SeaCA – British Columbia
United KingdomNew Zealand
Norway – North SeaUS – Texas
CA – AlbertaUS – LouisianaUS – Arkansas
DenmarkUS – Kansas
CA – Nova ScotiaGermany
AU – Western AustraliaAU – Northern Territory
US – MontanaUS – Utah
AU – TasmaniaAU – Victoria
QatarUS – OklahomaUS – Wyoming
US – New MexicoGreenlandUS – Ohio
Australia – OffshoreUS – PennsylvaniaAU – Queensland
NamibiaUS – Alaska
Timor Gap (JPDA)US Offshore – Gulf of Mexico
MaltaBotswana
GuyanaUS – Michigan
US – IllinoisFrancePoland
US – ColoradoTrinidad and TobagoCA – New Brunswick
HungaryBahrain
CA – Northwest TerritoriesIreland
AU – New South WalesOmanBrunei
GeorgiaTurkey
ThailandMali
NigerSeychelles
South AfricaChile
US Offshore – AlaskaMalaysia
CyprusPhilippines
MoroccoRussia – Offshore Arctic
Lebanon
20 - 50 percent
50 - 100 percent
More than 100 percent

Re sults by continental region
North Amer ica
Com pared to other regions of the world, many juris dic tions in Can ada and the United States are
rated as attrac tive for upstream invest ment.
Can ada
Table 5 sum ma rizes this year’s shifts in the rel a tive attrac tive ness of Cana dian juris dic tions com -
pared with 2012. Read ers are reminded that these rank ings are based on the fac tors in the Pol icy
Per cep tion Index only, and do not fac tor a juris dic tion’s proved oil and gas reserves or its petro -
leum resource poten tial. As in 2009, 2010, 2011, and 2012, Man i toba and Sas katch e wan are the top
2 Cana dian juris dic tions, though they have swapped posi tions once again. Sas katch e wan achieved
a slightly lower Pol icy Per cep tion Index score this year and there fore moved higher in the rank ing.
How ever, Man i toba received higher per cent ages of neg a tive scores over all and slipped a bit on the
Policy Perception Index scale.
As fig ure 9 illus trates, Sas katch e wan is again seen as the most attrac tive Cana dian juris dic tion for
upstream petro leum invest ment after hav ing relin quished that posi tion to Man i toba in 2012. At
the other end of the scale, Que bec stands out as the Cana dian juris dic tion pos ing the great est bar ri -
ers to invest ment.
Can ada had 10 juris dic tions in the 2013 sur vey and two, Sas katch e wan (ranked 3rd of 157) and
Man i toba (ranked 9th), achieved com mend able first quintile rank ings. Five prov inces (Alberta,
42 Fra ser In sti tute Global Pe tro leum Sur vey, 2013
www.fraserinstitute.org
Ta ble 5: Rank ings of Ca na dian Ju ris dic tions for 2013 and their Pol icyPer cep tion In dex Scores
Rank in 2013 Ju ris dic tion Score Rank in 2012
1 Sas katch e wan 11.43 2
2 Man i toba 16.87 1
3 Al berta 24.47 3
4 New found land & Lab ra dor 26.43 6
5 Nova Sco tia 27.52 4
6 Yu kon 31.99 7
7 Brit ish Co lum bia 35.55 5
8 North west Ter ri to ries 40.84 8
9 New Bruns wick 49.94 10
10 Que bec 77.11 9

New found land and Lab ra dor, Nova Sco tia, Yukon, and Brit ish Colum bia) are in the sec ond
quintile this year and the North west Ter ri to ries and New Bruns wick fall in the third quintile. Only
Que bec is now in the fourth quintile.
Que bec has fallen from 101st (of 147) in 2012 to 141st (of 157) in 2013 sug gest ing that it is becom ing
less attrac tive for upstream petro leum explo ra tion invest ment. Que bec’s Pol icy Per cep tion Index
score dete ri o rated from 60.5 to 77.1—the worst per for mance of all the Cana dian juris dic -
tions—with invest ment now appar ently being deterred even more than in 2012 due to poorer
results with regard to the cost of reg u la tory com pli ance (38%)9; tax a tion in gen eral (25%); and
uncer tainty con cern ing pro tected areas (23%). Brit ish Colum bia dropped in the Pol icy Per cep tion
Index rank ing from 39th (of 147) in 2012 to 47th (of 157) this year as a con se quence of poorer (i.e.,
higher) scores on the sur vey ques tions per tain ing to uncer tainty con cern ing envi ron men tal reg u -
la tions (19%), polit i cal sta bil ity (12%), and tax a tion in gen eral (11%).
The North west Ter ri to ries slipped mar gin ally from a high sec ond quintile place ment in 2012
(score 39.6) to the third quintile (score 40.8) while also drop ping one spot in the rank ings to 61st
(of 157) in 2013. Man i toba fell four spots in the rank ings from 5th (of 147) in 2012 to 9th (of 157) in
2013.
Fra ser In sti tute Global Pe tro leum Sur vey, 2013 43www.fraserinstitute.org
Fig ure 9: Pol icy Per cep tion Index—Canada
9 The numbers in brackets show the difference between the total percentage of responses which indicate
that a particular factor is a deterrent to investment (i.e., the combined responses of types “3. Is a mild
deterrent to investment,” “4. Is a strong deterrent to investment,” and “5. Would not pursue
exploration investment in this region due to this factor”) from 2012 to 2013.
0 10 20 30 40 50 60 70 80 90 100
Quebec
New Brunswick
Northwest Territories
British Columbia
Yukon
Nova Scotia
Newfoundland & Labrador
Alberta
Manitoba
Saskatchewan Mild deterrent to investment
Strong deterrent to investment
Would not pursue investment due to this factor

Alberta achieved a slightly higher rank ing this year, mov ing from 21st posi tion (of 147) in 2012 to
19th (of 157) in spite of real iz ing a slightly poorer Pol icy Per cep tion Index score. Nova Sco tia also
achieved a higher rank ing, mov ing up five spots to 30th (of 157) in 2013, although it too had a
slightly poorer over all score. The Cana dian juris dic tion that improved the most in the rank ing this
year was New found land and Lab ra dor which is now 24th (of 157) com pared with 47th (of 147) a
year ago as the result of an improved over all scores , most nota bly with regard to the labour reg u la -
tions and employ ment agree ments ques tion (-50%).
New Bruns wick ben e fit ted from hav ing the most improved Pol icy Per cep tion Index score
amongst the Cana dian juris dic tions after drop ping sig nif i cantly in the rank ings in 2012 as a con se -
quence of con sid er able dete ri o ra tion in its over all score. New Bruns wick moved up from the
fourth quintile (score 62.1) in 2012, to the third quintile (score 49.9) in 2013 and improved its
rank ing from 102 (of 147) to 81 (of 157), mainly as the result of improved per for mance on the reg -
u la tory enforce ment (-48%), labour reg u la tions (-39%), and trade bar ri ers fac tors (-30%). How -
ever, in spite of these improve ments, New Bruns wick is next to last in Can ada, after Que bec, in
terms of its attrac tive ness for explo ra tion and devel op ment invest ment. In both cases this is prob a -
bly the result of pol i cies regard ing to the poten tial appli ca tion of hydrau lic fracking to recover nat -
u ral gas from shale for ma tions, and the man ner in which those pol i cies are being admin is tered.
Respon dents’ com ments about var i ous prov inces ranged from com pli men tary to crit i cal. The
com ments in the fol low ing sec tion have been edited for length, gram mar, and spell ing, to retain
con fi den ti al ity, and to clar ify mean ings.
Alberta
“Al berta: Safe and sim ple lan guage and rules. Hope fully no more roy alty re views. Po lit -
i cal un cer tainty in BC is a con cern.”
“Trans par ent and co or di nated reg u la tory pro cess. Rule of law.”
“Clear and pre dict able reg u la tion. Open to new kinds of re sources. Risk-tak ing in ves -
tors. Geo log i cal and tech ni cal know-how. Ac cess to mar kets.”
“Most re cently, some ru ral mu nic i pal i ties in Al berta are re al iz ing a wind fall profit
through an an ti quated Drill and Equip ment Tax which is pro vid ing ex ces sive rev e nues.
This tax is an im ped i ment to drill ing. Fur ther more, it is caus ing an im bal ance in gov -
ern ment rev e nues amongst pro vin cial and mu nic i pal ju ris dic tions.”
Brit ish Co lum bia
“Car bon tax in BC is a huge bur den on natural gas companies.”
“Po lit i cal un cer tainty in BC is a con cern.”
44 Fra ser In sti tute Global Pe tro leum Sur vey, 2013
www.fraserinstitute.org

“Reg u la tory pa per work and tim ing for ap prov als con tin ues to get more com pli cated
and cum ber some in Al berta and BC. This may be a nec es sary bur den given en vi ron -
men tal con cerns/aware ness by the gen eral pub lic.”
Man i toba
“Strong la bor force, and ex cel lent gov ern ment sup port of in dus try. Try ing to be better
than [just] com pet i tive.”
“Gen eral mis trust or over con trol of in dus try and the threat of un fa vor able change.”
New Bruns wick
“Cor rupt gov ern ment of fi cials who are more con cerned with re-elec tion rather than
sup port ing and de vel op ing an in dus try.”
“Min is ter of Nat u ral Re sources does not un der stand the reg u la tions which have been
made and in ter prets them dif fer ently for each com pany.”
Nova Sco tia
“Ad di tional reg u la tion and over sight, lo cal em ploy ment re quire ments on large pro -
jects, mul ti ple lev els of gov ern ment in volve ment.”
Sas katch e wan
“In vest ment fa vour able en vi ron ment. Con sis tent ap pli ca tion of laws and gen eral sup -
port by pro vin cial gov ern ment of oil and gas de vel op ment.”
“Col lab o ra tive ap proach to set ting reg u la tions that in volve en vi ron men tal, in dus try,
and lo cal con cerns.”
“Sta tis ti cal In ven tory Rec on cil i a tion (SIR) is very ef fec tive with land own ers and pro -
cesses to get wells drilled. Reg u la tions have very lit tle time im pair ment on ac tiv i ties.”
Que bec
“Gov ern ment is not sup port ive of in dus try; pub lic against de vel op ment of in dus try;
poor roy alty sys tem; very busi ness un friendly.”
“Ex pro pri a tions and de facto ex pro pri a tions in Que bec with out com pen sa tion are par -
tic u larly dis cour ag ing rel a tive to ex pec ta tions of rule of law.”
“To tal un cer tainty fu eled by in con sis ten cies in mes sages given by the gov ern ment.”
Fra ser In sti tute Global Pe tro leum Sur vey, 2013 45www.fraserinstitute.org

The United States
Twenty-four US juris dic tions were included in the 2013 sur vey list and suf fi cient responses were
received to allow us to rank all of them. Arkan sas, Ala bama, Illi nois, and US Off shore—Pacific
were included this year’s report after being excluded from the report on the results of the 2012 sur -
vey as a con se quence of insuf fi cient responses.
Oklahoma is again the most attrac tive US and global juris dic tion, fol lowed by Mis sis sippi. Five
other US juris dic tions are also in the first quintile and among the top 10 most attrac tive juris dic -
tions: Texas, Arkan sas, Kan sas, Ala bama, and North Dakota this year (fig ure 10). With the excep -
tion of Arkan sas and Ala bama, these juris dic tions were all in the first quintile in 2012 as well.
Ten US juris dic tions are in the sec ond quintile. Lou i si ana, Wyo ming, West Vir ginia, Ohio, and
New Mex ico all dropped to the sec ond quintile this year from the first quintile, join ing Montana,
Utah, Illi nois, US Off shore—Gulf of Mex ico, and Penn syl va nia. New Mex ico’s attrac tive ness for
invest ment appears to have wors ened con sid er ably as its Pol icy Per cep tion Index score increased
from 11.9 in 2012 to 30.4 and its rank ing fell from 7th (of 147) to 36th (of 157) largely as a result of
poorer scores on the ques tions per tain ing to uncer tainty con cern ing pro tected areas (40%), reg u -
la tory enforce ment (32%), and dis puted land claims (21%).
46 Fra ser In sti tute Global Pe tro leum Sur vey, 2013
www.fraserinstitute.org
Fig ure 10: Pol icy Per cep tion Index—United States
0 10 20 30 40 50 60 70 80 90 100
New York
US Offshore – Pacific
California
Alaska
US Offshore – Alaska
Colorado
Michigan
Pennsylvania
US Offshore – Gulf of Mexico
Illinois
New Mexico
Utah
Ohio
West Virginia
Montana
Wyoming
Louisiana
North Dakota
Alabama
Kansas
Arkansas
Texas
Mississippi
Oklahoma
Mild deterrent to investment
Strong deterrent to investment
Would not pursue investment due to this factor

There are six US juris dic tions in the third quintile includ ing Mich i gan, US Off shore—Alaska, and
Cal i for nia, which dropped from the sec ond quintile in 2012 to the third quintile. Mich i gan’s Pol -
icy Per cep tion Index score dete ri o rated from 24.9 in 2012 to 41.0 this year mainly due to the per -
cep tion that the reg u la tory cli mate has wors ened con sid er ably. Cal i for nia also received much
poorer grades from sur vey respon dents this year as indi cated by an increase in its over all score
(from 32.5 to 55.7) largely as the result of dete ri o ra tion in its com mer cial envi ron ment (par tic u -
larly fis cal terms and tax a tion in gen eral). Col o rado dropped into the third quintile (score 42.0)
from the first quintile (score 16.9) in 2012 revers ing 4 years of improved scores on the Pol icy Per -
cep tion Index. Col o rado’s rank plum meted from 16th (of 147) to 66th (of 157), the larg est drop
among the US juris dic tions, largely as a result of increased neg a tive sen ti ment with regard to
uncer tainty con cern ing pro tected areas (40%), reg u la tory dupli ca tion (37%), and dis puted land
claims (35%). Alaska and the US Off shore—Pacific also placed in the third quintile.
New York is the only US juris dic tion with a fourth quintile score (64.2) this year, drop ping from
the third quintile in 2012 (score 44.1). New York ranks 119th (of 157) this year, drop ping from 68th
(of 147) in 2012. The dete ri o ra tion in the state’s attrac tive ness for invest ment is largely the con se -
quence of poorer scores in rela tion to legal sys tem fair ness (38%), tax a tion in gen eral (28%), and
reg u la tory dupli ca tion (26%) ques tions.
Three US juris dic tions (Col o rado, Cal i for nia, and New York) saw their Pol icy Per cep tion Index
scores dete ri o rate (i.e., increase) by more than 20 points this year while six oth ers (New Mex ico,
Mich i gan, West Vir ginia, Gulf of Mex ico, Penn syl va nia, and US Off shore—Alaska) received over -
all grades at least 10 points worse than in 2012. None of the US juris dic tions in this year’s sur vey
ben e fit ted from improved Pol icy Per cep tion Index scores. This sug gests that the US as a whole is
now regarded as some what less attrac tive for upstream petro leum devel op ment than in 2012.
Sur vey par tic i pants’ com ments on a num ber of Amer i can juris dic tions are pre sented below. Com -
ments in have been edited for length, gram mar, and spell ing, to retain con fi den ti al ity, and to clar -
ify mean ings.
Alaska
“Tra di tion of good busi ness pro duc tive model com bined with op ti mal la bor qual ity,
dis tri bu tion, and fis cal pol icy.”
Col o rado
“Oil and gas reg u la tory agency has a ma jor ity of of fi cers non-knowl edge able about the
in dus try and eco nom ics of same.”
“Con stantly chang ing reg u la tory en vi ron ment with a hos tile and anti-de vel op ment
bias. Many lower level gov ern men tal en ti ties feel the need to con trol the in dus try and
pro mul gate their own re dun dant, ill-in formed reg u la tions that in ev i ta bly re sult in great
Fra ser In sti tute Global Pe tro leum Sur vey, 2013 47www.fraserinstitute.org

costs and de lays on the in dus try. “Fractivists” have con vinced many cit ies to ban
fracking or at tempt to reg u late it. State reg u la tory agen cies con tin u ously at tempt to ap -
ply even tighter re stric tions in a con stantly chang ing, al though con sis tently more re -
stric tive, en vi ron ment that cre ates un cer tainty and risk. Even though I live in
Col o rado, the com pany I founded will not do busi ness in this state.”
Lou i si ana
“Leg acy lit i ga tion on-shore Lou i si ana has crip pled the in dus try. The con tin ued de nial
or fail ure to pro cess off-shore per mits has also crip pled the in dus try in this state.”
Mis sis sippi
“Ease of reg u la tion and low costs to op er ate with good lease terms.”
“The State Oil & Gas Board of Mis sis sippi is not hos tile to ex plo ra tion and pro duc tion
ac tiv ity and is proactive in pro mot ing nat u ral re source de vel op ment while also ful fill -
ing its reg u la tory role in pro tect ing the en vi ron ment and con ser va tion of re sources.
This is con sis tent with the stated pub lic pol icy of the state as set out by the leg is la ture.”
New Mex ico
“Com pa nies re fuse to in vest in New Mex ico be cause of un cer tain sta tus of the Lesser
Prai rie Chicken on the en dan gered list.”
New York
“Strong anti-oil ex plo ra tion pol i cies and pro pa ganda.”
“New York sits on top of mas sive re serves that it will not al low the in dus try to de -
velop.”
Penn syl va nia
“State gov ern ment ac tively pro motes the de vel op ment of the re source.”
Texas
“Sta bil ity, in fra struc ture, lim ited tax, fair reg u la tion, knowl edge able reg u la tors, stream -
lined per mit ting pro cess, lim ited fed eral in ter fer ence.”
“Proactive ap proach to oil and gas de vel op ment is en cour aged by lo cal and state au -
thor i ties.”
48 Fra ser In sti tute Global Pe tro leum Sur vey, 2013
www.fraserinstitute.org

“Reg u la tions en cour age ex plo ra tion and pro duc tion. Long his tory of ex plo ra tion and
pro duc tion. Knowl edge able pro fes sion als in Rail road Com mis sion. Rea son able ex pec -
ta tions of land own ers, in clud ing the State of Texas.”
“Easy ac cess, large re source base, abun dant ser vice com pany in fra struc ture, large
amounts of cap i tal.”
US Off shore—Gulf of Mex ico
“Ma ture busi ness en vi ron ment, ef fec tive reg u la tions. How ever, it could im prove the
en vi ron men tal over see ing.”
“Sta ble tax roy alty fis cal re gime. Tough en ing but still trans par ent reg u la tory en vi ron -
ment. No wind fall taxes in high com mod ity price en vi ron ment. Lim ited or no com -
mod ity mar ket ing re stric tions.”
West Vir ginia
“The city of Morgantown, WV, is shut ting down two wells from fur ther de vel op ment.
The two wells were al ready drilled and were await ing hydrofracture.”
Wy o ming
“Ac cess, clar ity of re quire ments—le gal, en vi ron men tal, etc.”
“Tax Roy alty sys tem with out state par tic i pa tion and pro duc tion shar ing el e ments
makes it the most com pel ling for in vest ment.”

Oceania
In the sur vey Oceania is com posed of six teen juris dic tions. These are the six Aus tra lian states, the
North ern Ter ri tory, and the Aus tra lian Off shore (both of which fall under Aus tra lian fed eral juris -
dic tion), the Timor Gap Joint Petro leum Devel op ment Area (JPDA), East Timor, New Zea land,
Brunei, Malay sia, the Phil ip pines, Papua New Guinea, and Indonesia.
As fig ure 11 illus trates, the results for this region fall into three dis tinct cat e go ries again this year.
Last year’s three fourth-quintile coun tries (Indo ne sia, Papua New Guinea, and East Timor) were
joined this year by the Timor Gap (JPDA) which fell into the fourth quintile after rat ing in the third
quintile in 2012. The Timor Gap (JPDA) saw its rank ing fall the most amongst the Oceania juris -
dic tions, drop ping from 73rd (of 147) in 2012 to 111th (of 157) as greater per cent ages of neg a tive
responses sug gest that sur vey respon dents are more con cerned with reg u la tory dupli ca tion and
incon sis ten cies (35%), dis puted land claims (31%), and polit i cal sta bil ity (21%) there than a year
ago. East Timor improved both in terms of its rank and score as most ele ments of its com mer cial
envi ron ment are seen to be more pos i tive than they were.
There are now four third quintile juris dic tions in the Oceania region: New South Wales, Phil ip -
pines, Malay sia, and Queensland. The lat ter dropped into the third quintile range after achiev ing a
sec ond quintile score in 2012.
There are eight juris dic tions in the sec ond quintile this year includ ing the Aus tra lian juris dic tions
of Vic to ria, Aus tra lia—Off shore, West ern Aus tra lia, the North ern Ter ri tory, South Aus tra lia, and
50 Fra ser In sti tute Global Pe tro leum Sur vey, 2013
www.fraserinstitute.org
Figure 11: Policy Perception Index—Oceania
0 10 20 30 40 50 60 70 80 90 100
Indonesia
Papua New Guinea
East Timor
Timor Gap (JPDA)
New South Wales
Philippines
Queensland
Malaysia
Victoria
Australia – Offshore
Tasmania
Brunei
Western Australia
New Zealand
Northern Territory
South Australia
Mild deterrent to investment
Strong deterrent to investment
Would not pursue investment due to this factor

Tas ma nia, as well as New Zea land and Brunei. South Aus tra lia is the most attrac tive juris dic tion in
this region. Last year’s high est ranked juris dic tion in Oceania, New Zea land, saw its Pol icy Per cep -
tion Index score and rank dete ri o rate largely because of increased neg a tive responses for reg u la -
tory dupli ca tion (25%), labour and skills avail abil ity (14%), and the qual ity of infra struc ture
(11%). Aus tra lia—Off shore also dropped in the rank ings this year in part due to a wors en ing reg u -
la tory cli mate. Brunei improved the most amongst the Oceanian juris dic tions, mov ing into the
sec ond quintile from the third, and up in the rank ings from 85th (of 147) in 2012 to 50th (of 157) in
2013 in part due to lower per cent ages of respon dents now being con cerned by the cost of reg u la -
tory com pli ance (-42%), trade bar ri ers (-33%), and dis puted land claims (-27%) issues than
pre vi ously.
Respon dents offered both pos i tive and neg a tive com ments about con di tions in the juris dic tions
that we sur veyed in the Oceania region. The com ments in the fol low ing sec tion have been edited
for length, gram mar, and spell ing, to retain con fi den ti al ity, and to clar ify mean ings.
Aus tra lia in gen eral
“Fa vour able fis cal terms, ex plo ra tion is incentivized, reg u la tions trans par ent. Ease of
ac cess to au thor i ties and tech ni cal data.”
“Aus tra lian la bour costs and union ism are a sig nif i cant de ter rent to work ing here.”
“Pol icy in Aus tra lia is be ing driven by green-based, alarm ist, anti-fos sil fuel groups and
the gov ern ment fed er ally is very scared run ning into a fed eral elec tion. This gen er ates
great un cer tainty for the in dus try, par tic u larly with a weak state gov ern ment in New
South Wales and is go ing to drive ex plo ra tion dol lars out of that state and over seas.
The east ern Aus tra lian econ omy is go ing to be starved of gas and in dus try is go ing to
suf fer for this.”
Aus tra lia—Off shore
“Trans par ent, and un am big u ous laws and pol i cies, avail abil ity of qual i fied per son nel
and ex cel lent geo log i cal da ta base sys tem.”
East Timor
“Gov ern ment in ter fer ence.”
“Fails to hon our the word ing and in ten tion of agree ments.”
“East Timor is in creas ingly seen as fail ing to hon our trea ties and uses me dia to lobby
for its po lit i cal agenda.”
“East Timor—in abil ity to ac cess on shore licen ces.”
Fra ser In sti tute Global Pe tro leum Sur vey, 2013 51www.fraserinstitute.org

In do ne sia
“In do ne sia which has rich nat u ral re sources and it pi o neered pro duc tion shar ing con -
tracts early on and later fol lowed by the rest of the world. Gov ern ment is ac ces si ble for
prob lem res o lu tion.”
“In do ne sia—high fis cal take and dif fi culty of do ing busi ness.”
“In do ne sia: Ab surdly de tailed reg u la tory in ter fer ence and dis trust of in ves tors cou pled
with re gional-based ap prov als from un in formed lo cal power bro kers and cor rupted of -
fi cials.”
“Land ac cess be com ing prob lem atic, lack of clar ity, over lap with other us age.”
Ma lay sia and In do ne sia
“It’s all rel a tive. Ma lay sia has a lot of reg u la tions and con trol of op er a tions by Petronas,
but there is a de gree of cer tainty in out come with the right ap proach, and the op por tu -
nity scope is mixed with dif fer ent lev els of reg u la tion/fis cal terms that try to match with
in ves tor ap pe tite. In do ne sia, on the other hand, seems de ter mined to con tinue with
un cer tain reg u la tions and pol i cies, with na tion al iza tion of re sources as the ul ti mate
goal.”
Ma lay sia
“There is a sin gle na tional reg u la tor.”
“Clear, trans par ent, and ef fi cient le gal and ad min is tra tive pro cess to do busi ness.”
New South Wales
“Er ratic and wildly chang ing reg u la tions gov ern ing coalbed meth ane ex plo ra tion and
de vel op ment in NSW over the last four years.”
“In con sis tency in its reg u la tions. Sev eral com pa nies have stopped op er a tions in the
state, and we are also likely to.”
New Zea land
“New Zea land is a model reg u la tory en vi ron ment. It is pre dict able, the sanc tity of law
and con tracts is par a mount, and le gal in ter pre ta tion gets a day in court.”
“Good terms, open gov ern ment with no state ju ris dic tions over lap ping the na tional re -
gime.”
52 Fra ser In sti tute Global Pe tro leum Sur vey, 2013
www.fraserinstitute.org

“Opaque de ci sion mak ing in New Zea land Pe tro leum & Min er als; na tive ti tle is sues
never com pletely sorted; Re source Man age ment Act re sults in ex traor di narily long
timelines to any de vel op ment.”
“New Zea land is un able to fa cil i tate ef fec tive oil and gas ex plo ra tion ac tiv i ties due to an
in ef fec tive con sent and pub lic com ment pro cess.”
Phil ip pines
“The Phil ip pines is a very en cour ag ing place to in vest in oil and gas. In spite of its be ing
underexplored, there is a ba sis to claim that it has huge de pos its es pe cially in the off -
shore Palawan.”
“Fis cal re gime is very fa vour able while reg u la tory and la bour is sues are also quite
good.”
South Aus tra lia
“Pro-ac tive gov ern ment (and op po si tion), sta ble and at trac tive fis cal re gime, in formed
and pro fes sional reg u la tor, very su pe rior ac cess to es sen tial data.”
“South Aus tra lia is be com ing well-known for rapid ap prov als and cut ting through
green and red tape.”
Vic to ria
“Vic to ria gov ern ment un able to man date, so put a mor a to rium on coal seam gas
(CSG) ex plo ra tion and fracking.”
West ern Aus tra lia
“Na tive ti tle onshore West ern Aus tra lia is in creas ingly pain ful, caught be tween state
and fed eral leg is la tion both prob a bly sub op ti mally con ceived and drafted.”
Fra ser In sti tute Global Pe tro leum Sur vey, 2013 53www.fraserinstitute.org

Europe
Fig ure 12 shows the rank ings for Euro pean juris dic tions based on this year’s Pol icy Per cep tion
Index val ues. We were able to eval u ate 30 juris dic tions in this region com pared with 28 in 2012 as
Spain—Off shore and Spain—Onshore were added to the 2013 survey.
Three Rus sian juris dic tions—Off shore Arc tic, East ern Sibe ria, and Other—are in the fifth quintile
and amongst the 10 least attrac tive global juris dic tions for upstream petro leum explo ra tion
invest ment. They fell in the fifth quintile in 2012 as well.
Four Euro pean juris dic tions are in the fourth quintile this year. Both Bul garia and Greece dropped
from the third quintile in 2012 to the low fourth quintile range. Bul garia’s attrac tive ness has fallen
sig nif i cantly due to a dete ri o rat ing com mer cial envi ron ment—espe cially with regard to the tax a -
tion regime (46%) and fis cal terms (39%) fac tors—as well as increased con cern regard ing polit i cal
sta bil ity (34%). Greece’s attrac tive ness dete ri o rated largely because of increased neg a tive
responses for its com mer cial envi ron ment—espe cially trade bar ri ers (42%) and qual ity of infra -
54 Fra ser In sti tute Global Pe tro leum Sur vey, 2013
www.fraserinstitute.org
Figure 12: Policy Perception Index—Europe
0 10 20 30 40 50 60 70 80 90 100
Russia – Offshore ArcticRussia – Eastern Siberia
Russia – otherUkraine
Russia – Offshore SakhalinGreece
BulgariaRomania
FranceItaly
GreenlandHungary
CyprusAlbania
Spain – OnshoreSpain – Offshore
GermanyTurkeyPoland
MaltaGeorgiaIreland
Norway – North SeaUnited Kingdom
NorwayUnited Kingdom – North Sea
DenmarkFaroe IslandsNetherlands
Netherlands – North Sea
Mild deterrent to investment
Strong deterrent to investment
Would not pursue investment due to this factor

struc ture (30%)—although it also improved nota bly in terms of labour and skill avail abil ity
(-53%). Rus sia—Off shore Sakhalin, and the Ukraine are also in the fourth quintile, as in 2012.
There are nine Euro pean juris dic tions in the third quintile this year, up from five in 2012. The
main rea son for the increase is that five juris dic tions—Roma nia, France, Green land, Hun gary,
and Cyprus—have each been awarded mark edly worse Pol icy Per cep tion Index scores (by more
than 10) indi cat ing dete ri o rat ing attrac tive ness for explo ra tion invest ment which has dropped
these juris dic tions from the sec ond to the third quintile. Both of the Span ish juris dic tions that
were added to the sur vey list this year are also ranked in the third quintile. Italy and Alba nia are
ranked in the third quintile again, although both improved their over all score and rank ing, espe -
cially Alba nia.
This year 14 (of 30) Euro pean juris dic tions rated in the attrac tive first and sec ond quin tiles com -
pared with 18 (of 28) in 2012. Tur key moved up to the sec ond quintile from the third quintile while
Ire land, Den mark, Faroe Islands, Nor way—North Sea, and Neth er lands dropped to the sec ond
quintile from the first. The Neth er lands—North Sea is the only Euro pean juris dic tion in the first
quintile. It is also among the most attrac tive 10 juris dic tions of the 157 that were ranked this year.
Hun gary, Cyprus, and Bul garia all achieved worse scores on the Pol icy Per cep tion Index by at least
20 points indi cat ing that their attrac tive ness for upstream petro leum invest ment has dete ri o rated.
Accord ingly, their Index rank ings dropped sig nif i cantly. Hun gary fell from 28th place (of 147) in
2012 to 80th spot (of 157) largely because of increased con cerns regard ing uncer tainty per tain ing
to envi ron men tal reg u la tions (58%), fis cal terms (39%), and reg u la tory enforce ment (37%).
Cyprus dropped from 27th posi tion (of 147) in 2012 to 76th (of 157) mainly as a result of less
favour able scores on the dis puted land claims (44%), legal sys tem fair ness (43%) and polit i cal sta -
bil ity (31%) ques tions.10 In addi tion, the fol low ing eight juris dic tions saw their scores on the Pol -
icy Per cep tion Index worsen by at least 10 points com pared with 2012: Ukraine, Roma nia, France,
Green land, Ger many, Malta, Ire land, and Neth er lands.
Alba nia and Tur key exhib ited the great est improve ments among the Euro pean juris dic tions this
year. Tur key moved up the rank ings from 66th in 2012 to 48th place largely because of improve -
ments to its reg u la tory cli mate. Alba nia climbed from 95th (of 147) to 67th spot as respon dents
indi cated less con cern with the qual ity of infra struc ture (-47%), labour avail abil ity and skills
(-38%), and polit i cal sta bil ity (-32%).
Com pared with last year, the attrac tive ness of Europe for upstream petro leum invest ment has
dete ri o rated in 2013. This find ing is not sur pris ing given the eco nomic chal lenges cur rently fac ing
the region.
Fra ser In sti tute Global Pe tro leum Sur vey, 2013 55www.fraserinstitute.org
10 The reasons for Bulgaria’s worse performance are explained earlier in this section.

The com ments received for Euro pean juris dic tions range from pos i tive to crit i cal. Some of them
are pro vided below and the com ments have been edited for length, gram mar and spell ing, to retain
con fi den ti al ity, and to clar ify mean ings.
Faroe Islands
“In cred i bly low fis cal take, co op er a tive re gimes.”
France
“The de ci sion of the French gov ern ment to take back all the on shore li censes for un -
con ven tional pe tro leum.”
“Po lit i cal in ter fer ence in the ad min is tra tion of up stream ex plo ra tion and de vel op ment
which has halted all ad min is tra tive and per mit ap prov als for up to three years; cum ber -
some well per mit ting pro cess re quir ing 2+ years to per mit a sim ple ex plo ra tion well (3
months nor mal av er age out side France); in ter fer ence by lo cal and na tional pol i ti cians
in hy dro car bons busi ness, ma nip u la tion of me dia against hy dro car bons in dus try de -
spite job and eco nomic growth re sult ing from it; large scale ig no rance at cen tral gov -
ern ment pol icy level which fil ters down through ad min is tra tion and so ci ety cre at ing
un fa vor able en vi ron ment.”
“‘Green’ so cial ist gov ern ment has put all li cens ing ac tiv ity on hold and banned any
kind of fracking (con ven tional or un con ven tional). New ‘Code Minier’ in prep a ra tion
but no idea what it will con tain.”
Greece
“Lack of big ar eas of un ex plored acre age. Poor hy dro car bon sys tems.”
“Greece has an abun dance of oil and has never had a well drilled on land. Why? Pol i -
tics!”
Hun gary
“The Hun gar ian gov ern ment stopped the for mer ex plo ra tion li cens ing sys tem 2.5 years
ago, but a new sys tem has not been fully de vel oped yet—thus no new blocks avail able
since Oc to ber 2011. En vi ron men tal au thor i ties com pletely for bid work on Natura 2000
ar eas (EUwide net work of na ture pro tec tion ar eas), which is not the case in other EU
coun tries, and not what the Hun gar ian reg u la tions say.”
“The Hun gar ian gov ern ment should look at en ergy—es pe cially up stream—com pa nies
as part ners and not as en e mies who, sup pos edly, gen er ate high prof its and take them
out of the coun try. They should un der stand that up stream is a high risk, high re ward
56 Fra ser In sti tute Global Pe tro leum Sur vey, 2013
www.fraserinstitute.org

busi ness, and the suc cess of these com pa nies is a suc cess to the host coun try as well
through the roy al ties and taxes paid, and keep this in dus try alive in Hun gary.”
Nor way
“Clear, trans par ent, and pre dict able re gime, gen er ous ex plo ra tion cost re cov ery.”11
Nor way North Sea
“Sta ble fis cal re gime, clear leg is la tion on terms and con di tions, strong le gal sys tem.”
“Al though the fis cal take is ex tremely high (close to 80%), they pro vide upfront cash
com pen sa tion for close to 80% of ex plo ra tion ex penses.”
Rus sia—Off shore Sakhalin
“Which ju ris dic tion has the least fa vor able pol i cies: Any where in Rus sia due to the cor -
rup tion and the scale of cap i tal at risk in or der to de velop pro jects there.”
Rus sia—East ern Si be ria
“Rus sian pol icy is not sta ble and the fis cal terms are too harsh for in ves tors.”
Rus sia—Off shore Arc tic
“Ex pen sive de vel op ment, lit tle ju rid i cal se cu rity, state mo nop oly.”
Rus sia—Other
“In the case of Rus sia: hos til ity to the West, IOCs and prac tices verg ing on rack e teer ing
by oligarchs and gov ern ment.”
“Rus sia—con trac tual un cer tainty, lack of sanc tity of con tract. Re source own er ship un -
cer tainty.”
“Good hy dro car bon po ten tial but se ri ous above ground risks, par tic u larly con tract in -
sta bil ity.”
“Reg u la tor un cer tainty, cor rup tion, con cen tra tion in na tional oil com pany hands, un -
will ing ness to re form.”
Fra ser In sti tute Global Pe tro leum Sur vey, 2013 57www.fraserinstitute.org
11 This comment likely applies to Norwegian offshore areas other than the North Sea: the country has
no onshore oil and gas reserves.

Neth er lands
“The Neth er lands reg u la tory frame work is held ran som by en vi ron men tal pres sure
groups.”
Spain
“Award ing an ex plo ra tion per mit in Spain may take more than 5 years. Many na tional,
re gional, and lo cal ad min is tra tions are in volved in the pro cess. En vi ron men tal per mit -
ting reg u la tion for ex plo ra tion and pro duc tion (E&P) is not clear enough.”
Tur key
“Flat roy alty rate of 12.5%, cor po rate tax rate 20% (with write-offs for ex plo ra tion and
pro duc tion ex pen di tures), long ex plo ra tion licence term up to 11 years, no re stric tions
on fracking, Brent-re lated oil prices and Rus sian-re lated do mes tic nat u ral gas prices
(>US$10/Mcf), trans par ent reg u la tions and in de pend ent reg u la tory agency, pro-busi -
ness gov ern ment, avail abil ity of in fra struc ture, ready mar kets for oil and gas (Tur key
im ports 98% of nat u ral gas needs and 92% of oil needs), world class un con ven tional oil
and nat u ral gas op por tu ni ties (tight gas, shale gas, tight oil, shale oil), equip ment avail -
abil ity at very com pet i tive day rates (close to North Amer i can costs).”
“The past de cade of po lit i cal sta bil ity in Tur key, cou pled with some of the best fis cal
terms in the world make it a very at trac tive place to do busi ness.”
Ukraine
“Ukraine Au thor i ties are cor rupt, start ing at the top. Im pos si ble to ‘go it alone’ as a
for eign com pany—es sen tial you have a pow er ful Oli garch to pro vide cover.”
United King dom
“Un cer tain ties in plan ning re gime will neg a tively im pact in vest ment in on shore ac tiv -
ity.12
Lack of cen tral gov ern ment sup port means lo cal de ci sion mak ers will cause de lays
that are un ac cept able to in ves tors.”
“The UK has an ex em plary pol icy cli mate—ra tio nal, well reg u lated, but not
overregulated. Works well for com pa nies as well as the ul ti mate ben e fi cia ries (UK cit i -
zens). The UK fol lows the rule of law and has sta ble le gal foun da tion.”
58 Fra ser In sti tute Global Pe tro leum Sur vey, 2013
www.fraserinstitute.org
12 Because the United Kingdom has no onshore proved oil and gas reserves of any remaining
significance, this comment likely relates to expectations regarding exploration and development of
natural gas believed to be embedded in onshore shale formations, which remain to be proven.

Asia
Fig ure 13 ranks the Asian juris dic tions that were eval u ated this year accord ing to their Pol icy Per -
cep tion Index values.
Japan, again with an attrac tive sec ond quintile rat ing, is still rated by petro leum explor ers and
devel op ers as the most attrac tive juris dic tion for invest ment in Asia, although its attrac tive ness for
invest ment fell in this year’s sur vey as evi denced by a Pol icy Per cep tion Index score near the upper
bounds of the sec ond quintile (39.1) com pared with a score of 27.4 in 2012. The dete ri o ra tion is
due in part to increased neg a tive sen ti ment with regard to tax a tion (37%), fis cal terms (13%), and
reg u la tory enforce ment (11%). Con se quently, Japan dropped from 37th place (of 147) in the over -
all rank ing in 2012 to 57th place (of 157) where it is closely fol lowed by 39th ranked Thai land, which
also has a sec ond quintile score. Uzbekistan and Kyrgyzstan, both with unde sir able fifth quintile
scores, are appar ently the two least attrac tive coun tries in the region.
Once again, most Asian juris dic tions have rel a tively unat trac tive third or fourth quintile rat ings.
How ever, there have been some nota ble changes in the rel a tive attrac tive ness of some of the 14
Asian juris dic tions (the same group of coun tries as in 2012). Kyrgyzstan expe ri enced the most sig -
nif i cant dete ri o ra tion in Pol icy Per cep tion Index scor ing and as a result has dropped from the
fourth quintile in 2012 to the fifth quintile. The change is mostly due to increased con cern over the
coun try’s geopolitical risk. Uzbekistan remains the least attrac tive juris dic tion in the region and
one of the 10 least attrac tive juris dic tions over all.
Turkmenistan joined five other coun tries in the fourth quintile this year, drop ping from a third
quintile score in 2012. The coun try’s poorer over all score largely resulted from increased uneas i -
Fra ser In sti tute Global Pe tro leum Sur vey, 2013 59www.fraserinstitute.org
Figure 13: Policy Perception Index—Asia
0 10 20 30 40 50 60 70 80 90 100
Uzbekistan
Kyrgyzstan
Bangladesh
Kazakhstan
Cambodia
Myanmar
India
Turkmenistan
China
Vietnam
Azerbaijan
Pakistan
Thailand
Japan Mild deterrent to investment
Strong deterrent to investment
Would not pursue investment due to this factor

ness over com mer cial and reg u la tory fac tors, par tic u larly labour and skills avail abil ity (32%),
uncer tainty con cern ing envi ron men tal reg u la tions (23%), and tax a tion (23%). Ban gla desh also
received a poorer rat ing than a year ago while Cam bo dia improved some what in both rank and
score. Both, like Kazakhstan, Myanmar, and India, remained in the fourth quintile this year.
Four Asian juris dic tions have third quintile scores this year: China, Viet nam, Azerbaijan, and
Paki stan. Of these coun tries, Paki stan’s attrac tive ness for upstream petro leum invest ment
improved the most, allow ing it to move into the third quintile from the fourth, and up in the rank -
ings from 129th (of 147) in 2012 to 92nd (of 157). The improve ment is mainly due to less neg a tive
sen ti ment being expressed by sur vey respon dents regard ing the cost of reg u la tory com pli ance
(-36%), fis cal terms (-33%), and infra struc ture (-28%). Thai land also received more favor able
scores over all which allowed the coun try to move into the more attrac tive sec ond quintile from the
third, in part because of less neg a tive sen ti ment over its geo log i cal data base (-31%), uncer tainty
con cern ing dis puted land claims (-25%) and reg u la tory enforce ment (-21%).
Below are some of the com ments received about the petro leum indus try invest ment envi ron ment
in var i ous Asian coun tries. The com ments in the fol low ing sec tion have been edited for length,
gram mar and spell ing, to retain con fi den ti al ity, and to clar ify mean ings.
Cam bo dia
“Keeps add ing on more fis cal de vices even when the cur rent re gime is not vi a ble.”
“The Cam bo dian gov ern ment im posed a Cus tom Ex port duty on crude oil ex ports,
which is tan ta mount to an ad di tional roy alty. When ad vised to re duce the roy alty for
mar ginal field pro duc tion and seek to reap ad di tional prof its taxes cor re spond ingly in
the up side, the gov ern ment for got about the in cen tive that low er ing the roy alty on
mar ginal fields would bring and slapped on an ad di tional profit tax and oil share start -
ing at the first dol lar of profit—ouch! Con se quently, there is no de vel op ment!”
China
“Well es tab lished pe tro leum laws and reg u la tions, trans par ent on tax and tar iffs, po lit i -
cally sta ble, not many com mu nity is sues.”
“China has a less clear le gal re gime gov ern ing oil and gas ex ploi ta tion and less po lit i cal
sta bil ity. There are also re stric tions on busi ness scopes of for eign in vested com pa nies in
China.”
In dia
“Chang ing tax a tion, im ma ture in dus try and reg u la tions. Dif fi culty deal ing with gov -
ern ment de part ments. Bor der is sues with cur rent blocks.”
60 Fra ser In sti tute Global Pe tro leum Sur vey, 2013
www.fraserinstitute.org

“Com plex laws, con flicts be tween cen tral and state gov ern ments and too much out -
dated bu reau cracy.”
Pa ki stan
“Pa ki stan is a rel a tively good coun try with an Eng lish le gal, ac count ing, and ed u ca tion
sys tem, and high prospectivity.”
“Adhocism in pol icy mak ing. Reg u la tors did not keep up with the pace of pol icy mak -
ers in Pa ki stan in 2012.”
“The main is sue with Pa ki stan is the se cu rity and po lit i cal in sta bil ity which has led to
cer tain is sues for mul ti na tional com pa nies op er at ing here for years. We have been
work ing in the re gion since the early 1990s and have seen dif fer ent phases in the po lit i -
cal sce nar ios and, as a re sult, have wit nessed un sta ble im ple men ta tion of the pol i cies.
There has been some change in the last 5 years and dem o cratic cul ture has been im -
proved, and it is ex pected that with this change im prove ment in leg is la tion im ple men -
ta tion will be wit nessed.”
Thai land
“Thai track re cord of not mess ing around.”
“Thai land has a sta ble oil and gas en vi ron ment and fis cal terms are very rea son able.”
“En vi ron men tal Im pact As sess ment (EIA) pro cess sud denly stalled for one year im me -
di ately prior to con ces sion ter mi na tion. A gov ern men tal de part ment that had never
been in volved much in the pro cess pre vi ously sud denly be came very in ter ested. Par tic i -
pant from that de part ment failed to show up re peat edly at meet ings, caus ing the EIA
not to be ap proved in a timely fash ion and re sult ing in loss of con ces sion. Later rem e -
died af ter a law suit was filed with ex ten sion of con ces sion term. Con ces sion was gen er -
ally known to be of value and I was con cerned about of fi cial cor rup tion and in ter est of
3rd par ties in see ing con ces sion go out for re-bid.”
“Rel a tive to other SE Asian coun tries, easy to op er ate.”
Turkmenistan
“Laws are good, one-win dow ap proach.”
Viet nam
“Fa vour able fis cal terms. Gov ern ment oil and gas de part ments are knowl edge able and
en cour age in vest ment. Com pli ance with Pro duc tion Shar ing Con tracts is trans par ent
with min i mal regulatory bur den.”
Fra ser In sti tute Global Pe tro leum Sur vey, 2013 61www.fraserinstitute.org

Africa
This year we regrouped the Afri can juris dic tions into two regions: 1) the Mid dle East and North
Africa (MENA), and 2) the remain der of Africa (Africa). This change was made to be more con sis -
tent with the regional report ing and sta tis tics pro duced by inter na tional orga ni za tions. This exam -
ines the sur vey results with respect to Africa (as rede fined) and the fol low ing sec tion, the MENA
region.
Fig ure 14 shows the rel a tive attrac tive ness of the 24 juris dic tions in Africa. This year, two Afri can
juris dic tions were added to the sur vey list: Bot swana and Sey chelles. Coin ci den tally, Bot swana
(ranked 17th over all) and Sey chelles (37th of 157) are regarded as the most attrac tive juris dic tions
for upstream invest ment in Africa—both with scores in the rel a tively attrac tive sec ond quintile.
Namibia is also in the sec ond quintile hav ing moved up from a 3rd quintile score in 2012 and jump -
ing from 67th place (of 147) to 38th place (of 157) this year, largely as the result of inves tors’ per cep -
tions of reduced geopolitical risk and a stron ger com mer cial envi ron ment.
There are 11 juris dic tions in the third quintile includ ing Mali and South Africa. Both coun tries
received sig nif i cantly improved Pol icy Per cep tion scores and rank ings and moved up from fourth
quintile scores in 2012. Mali improved the most, mov ing from 128th spot (of 147) in 2012 to 83rd
place (of 157) as the result of improved scores on most of the reg u la tory fac tors, espe cially cost of
62 Fra ser In sti tute Global Pe tro leum Sur vey, 2013
www.fraserinstitute.org
Fig ure 14: Policy Perception Index—Africa
0 10 20 30 40 50 60 70 80 90 100
South Sudan
Somaliland
Nigeria
Chad
Democratic Republic of the Congo (Kinshasa)
Republic of the Congo (Brazzaville)
Uganda
Madagascar
Niger
Angola
Equatorial Guinea
Ethiopia
Gabon
Kenya
Mozambique
Tanzania
Cameroon
Ivory Coast
Mali
Ghana
South Africa
Namibia
Seychelles
Botswana Mild deterrent to investment
Strong deterrent to investment
Would not pursue investment dueto this factor

com pli ance (-43%), and on ques tions affect ing the com mer cial envi ron ment, espe cially tax a tion
(-57%), and trade bar ri ers (-43%). South Africa jumped from 106th spot (of 147) to 71st place (of
157) as the result of improved scores on all of the reg u la tory fac tor ques tions and less neg a tive sen -
ti ment with regard to the qual ity of infra struc ture (-38%). The Ivory Coast also achieved an
improved score on the Pol icy Per cep tion Index this year and moved into the third quintile from
the fourth quintile as a result. Ethi o pia’s invest ment attrac tive ness rank ing slipped both amongst
the Afri can juris dic tions and glob ally.
Uganda’s and Niger’s scores dropped from the third quintile range in 2012 into the less attrac tive
fourth quintile this year. The dete ri o ra tion in Uganda’s over all score resulted from increased
negativity expressed over its labour and skills avail abil ity (48%), reg u la tory dupli ca tion (39%),
and secu rity (34%). Secu rity (38%) was also a rea son for Niger’s poorer per for mance along with
legal sys tem issues (40%). Soma li land dropped in the rank ings as its scores on reg u la tory fac tors,
nota bly envi ron men tal reg u la tions (56%) were less robust than in 2012. Nige ria improved its
score enough to allow the coun try to move up from the lower fifth quintile in 2012 to the fourth
quintile. South Sudan, the low est ranked Afri can juris dic tion this year, dropped from 117th spot
(of 147) in 2012 to 150th (of 157) plac ing it amongst the 10 least attrac tive juris dic tions.
Some of the respon dents’ com ments con cern ing var i ous Afri can juris dic tions are pre sented
below. These com ments have been edited for length, gram mar and spell ing, to retain con fi den ti al -
ity, and to clar ify mean ings.
Bot swana
“Clear rules, good geo log i cal data, no cor rup tion, na tive ti tle is sues de fined.”
“Not over reg u lated, fis cally and po lit i cally sta ble, and they re al ize that they need gas
for their econ omy.”
Chad
“High on cor rup tion and an un sta ble po lit i cal and gov er nance sys tem.”
Cam er oon
“Tough pro duc tion shar ing agree ments in an area of mar ginal eco nomic ex plo ra tion
op por tu ni ties.”
Dem o cratic Re pub lic of the Congo (Kinshasa)
“Not sta ble and high op er a tion costs.”
“In sta bil ity com pared to neigh bour An gola.”
Fra ser In sti tute Global Pe tro leum Sur vey, 2013 63www.fraserinstitute.org

Ga bon
“Il le gal take over by gov ern ment of on shore oil field worth 100M$s, hav ing to go to in -
ter na tional courts.”
Kenya
“Kenya is hor ri bly un pre dict able. Suc cess in neigh bour ing coun tries has made them
dis trust ing of in ves tors and they have been too quick to as sume they have the le ver age
to tax op er a tors that have yet to find any re sources. They also over state suc cess sto ries
to back changes in the law. Gov ern ment of fi cials have lit tle in ter est in ef fec tively com -
mu ni cat ing with com pa nies.”
Kenya and Mo zam bique
“They are ea ger to at tract new in ves tors.”
Ni ge ria
“The pol i cies be hind off shore ex plo ra tion, pro duc tion, and de vel op ment lead ing to the
ex e cu tion of Pro duc tion Shar ing Con tracts be tween Ni ge rian Na tional Pe tro leum Cor -
po ra tion (NNPC) and Oil Mul ti na tion als ac cords im mense in cen tives to con duct pe -
tro leum op er a tions in Ni ge ria.”
“Non pas sage of the Pe tro leum In dus try Bill for over 3 years now has been a night mare
as it has brought un cer tainty as to the in dus try in Ni ge ria. On the other hand, the space
opened by the mar ginal field and in dig e nous own er ship pol icy has seen dra matic rise
in lo cal ca pac ity, par tic i pa tion, and com pe tence in the last few years in Ni ge ria.”
“There is a need to curb the in se cu rity sit u a tion re sult ing from the mil i tant un rest.
Gov ern ment needs to take re spon si bil ity in this area. Re duce cor rup tion and have a
good de vel op ment and wel fare plan for the peo ple.”
Niger
“Lack of clear rules.”
“Due to in sta bil ity in the gov ern ment, this coun try has not been able to make head way
in de vel op ing its re sources.”
Sey chelles
“Soft terms as new comer to ex plo ra tion and pro duc tion.”
64 Fra ser In sti tute Global Pe tro leum Sur vey, 2013
www.fraserinstitute.org

South Af rica
“Po ten tial is lim ited but pol i cies are very en cour ag ing and for ward-look ing and le -
gal/po lit i cal sta bil ity is (so far) strong.”
South Su dan
“The re cent war with the north has made the coun try very vol a tile.”
Uganda
“Lack of trans par ency. Red tape and bu reau cracy are rife.”
The Mid dle East and North Africa (MENA)
The 18 Mid dle East and North Afri can coun tries eval u ated in this year’s sur vey are pre sented in fig -
ure 15, ranked accord ing to their rel a tive attrac tive ness for invest ment as mea sured by the Pol icy
Per cep tion Index. Again this year, none of the region’s juris dic tions achieved first quintile Pol icy
Per cep tion Index scores, but seven do have rel a tively attrac tive second quintile scores.
Iran and Iraq are again ranked amongst the 10 least attrac tive juris dic tions in the sur vey and have
over all scores in the least attrac tive fifth quintile. There are five MENA juris dic tions with scores in
the fourth quintile includ ing Libya, which moved up from the fifth quintile in 2012. Four juris dic -
tions have third quintile scores, includ ing Tuni sia which dropped from the sec ond quintile in 2012
in part due to increased con cerns with regard to qual ity of the geo log i cal data base (29%), legal sys -
tem (21%), and secu rity (19%).
Both Jor dan and Bah rain moved into the sec ond quintile from the third quintile this year, as each
achieved sig nif i cantly improved scores on the Pol icy Per cep tion Index and, as a result, moved up
in the global rank ing. Jor dan climbed from 99th place (of 147) to 45th spot (of 157) in the global
rank ing as the result of sig nif i cant improve ments in sur vey respon dents’ per cep tions of the
amount of geopolitical risk, infra struc ture (-52%), and labour reg u la tions and employ ment agree -
ments (-50%). Bah rain moved from 78th place to 44th posi tion because of less neg a tive sen ti ment
with regard to dis puted land claims (-48%), labour and skills avail abil ity (-38%), labour reg u la -
tions and employ ment agree ments (-38%), and other fac tors. Qatar is again the most attrac tive
juris dic tion in the region fol lowed by the United Arab Emirates and Oman. All three moved up in
the global rank ings as the result of improved Pol icy Per cep tion Index scores, indi cat ing that they
have become more attrac tive tar gets for invest ment in upstream petro leum explo ra tion and pro -
duc tion devel op ment.
Fra ser In sti tute Global Pe tro leum Sur vey, 2013 65www.fraserinstitute.org

Respon dents pro vided the fol low ing com ments regard ing con di tions in var i ous coun tries in the
Mid dle East and North Africa and com ments have been edited for length, gram mar and spell ing,
to retain con fi den ti al ity, and to clar ify mean ings.
Al ge ria
“Very pu ni tive fis cal re gime and gen er ally harsh en vi ron ment.”
“Al ge ria has a tre men dous ex plo ra tion po ten tial, but tough con trac tual terms and le -
gal-fis cal changes are mak ing some ex plo ra tion and pro duc tion (E&P) com pa nies pull
out of the coun try.”
Egypt
“De ferred and/or non-pay ment of con trac tor share of oil sales by the Egyp tian Gen eral
Pe tro leum Com pany (EGPC).”
Is rael
“Very anti-busi ness and de vel op ment, very slow bu reau cracy with no fixed timelines,
lack of knowl edge able reg u la tory au thor i ties, ex pe ri enced oil and gas pro fes sion als.”
66 Fra ser In sti tute Global Pe tro leum Sur vey, 2013
www.fraserinstitute.org
Figure 15: Policy Perception Index—Middle East
0 10 20 30 40 50 60 70 80 90 100
Iran
Iraq
Libya
Syria
Algeria
Yemen
Egypt
Lebanon
Tunisia
Mauritania
Israel
Kuwait
Morocco
Jordan
Bahrain
Oman
United Arab Emirates
Qatar Mild deterrent to investment
Strong deterrent to investment
Would not pursue investment due to this factor

Iran
“Not re spond ing to sanc tions enough to help in vest ment. Fails to rec og nize their weak
value prop o si tion.”
Iraq
“Kurdistan in Iraq is most sig nif i cant for ex plo ra tion and pro duc tion busi ness and the
lo cal gov ern ment there claims sov er eignty over nat u ral re sources whereas Iraq fed eral
gov ern ment also claims sov er eignty. Ex plo ra tion and pro duc tion com pa nies would
nat u rally feel help less.”
“Tech ni cal Ser vice Agree ments with poor terms in con sis tent with dif fi cult work en vi -
ron ment.”
Jor dan
“Abil ity to ne go ti ate a stand-alone con ces sion agree ment to gether with all fiscals and
en vi ron ment/le gal frame work etc.”
Libya
“Un der Ex plo ra tion and Pro duc tion Shar ing Agree ment IV terms, full cy cle re turns to
the con trac tor can be as low as 4% for new licence awards in the 2004 to 2008 pe riod.”
“Fis cal terms only work for large com pa nies and dis cov er ies.”
Mo rocco
“Very fa vour able con di tions to in vest ment.”
Oman
“Fis cal and po lit i cal sta bil ity, be nign op er at ing en vi ron ment, ma ture ser vices and la -
bour, ac cess to new op por tu ni ties, ex plo ra tion suc cess rate.”
Tu ni sia
“Tu ni sian Ap proval Pro cess at the mo ment is un cer tain with no time lim its!”
Fra ser In sti tute Global Pe tro leum Sur vey, 2013 67www.fraserinstitute.org

Latin Amer ica and the Carib bean
Fig ure 16 pres ents the Latin Amer i can and Carib bean juris dic tions that were eval u ated this year on
the Pol icy Per cep tion Index. Again this year, Brazil was bro ken out into three dis tinct juris dic tions:
Onshore Con ces sion Con tracts (CCs), Off shore Con ces sion Con tracts, and Off shore Pre-salt
Area Profit Shar ing Con tracts (PSCs). Argen tina was bro ken down into six petro leum-pro duc ing
prov inces: Chubut, Mendoza, Neuquen, Salta, Santa Cruz, and Tierra del Fuego. French Gui ana
was added to this year’s sur vey and Suri name was eval u ated after not being included in the 2012
rank ings, increas ing the num ber of jurisdictions evaluated to 21 from 19.
Again this year, Ven e zuela, Ecua dor, and Bolivia rank as the least attrac tive juris dic tions for invest -
ment in the region although Ven e zuela replaced Bolivia as the low est ranked juris dic tion in the
world. All three coun tries, together with Argen tina—Salta have 5th quintile scores. Argen -
tina—Santa Cruz received a suf fi ciently improved score to move from the 5th quintile to the fourth
quintile. In part this is due to reduc tions in neg a tive sen ti ment related to dis puted land claims
(-37%), uncer tainty con cern ing envi ron men tal reg u la tions (-36%), and pro tected areas (-21%).
Four other Argentinian prov inces—Tierra del Fuego, Mendoza, Chubut, and Neuquen—also
have fourth quintile scores, but in each case their scores dete ri o rated some what this year. The 2013
68 Fra ser In sti tute Global Pe tro leum Sur vey, 2013
www.fraserinstitute.org
Fig ure 16: Policy Perception Index—Latin Amer ica and the Carib bean
0 10 20 30 40 50 60 70 80 90 100
Venezuela
Ecuador
Bolivia
Argentina – Salta
Argentina – Tierra del Fuego
Argentina – Mendoza
Argentina – Chubut
Argentina – Santa Cruz
Argentina – Neuquen
Guatemala
Brazil – Offshore presalt area profit sharing contracts
French Guiana*
Brazil – Offshore concession contracts
Peru
Brazil – Onshore concession contracts
Guyana
Suriname
Colombia
Uruguay
Trinidad and Tobago
Chile Mild deterrent toinvestment
Strong deterrentto investment
Would not pursueinvestment due tothis factor
*French Guiana is in South America but under French jurisdiction.

Pol icy Per cep tion Index scores for Brazil—Off shore Pre-salt Profit Shar ing Con tracts and Gua te -
mala resulted in both juris dic tions’ scores drop ping from the third quintile range to the fourth.
Gua te mala also fell sig nif i cantly in the global rank ings—from 77th place (of 147) in 2012 to 128th
spot (of 157) as fac tors affect ing both the reg u la tory cli mate and com mer cial envi ron ment were
seen to pose greater bar ri ers to invest ment, par tic u larly trade bar ri ers (47%), reg u la tory enforce -
ment (38%), and tax a tion (36%). French Gui ana ranks 109th with a low fourth quintile score.
Seven juris dic tions in Latin Amer ica and the Carib bean achieved third quintile scores this year,
down from nine in 2012. Suri name, not eval u ated in 2012, ranks 87th and has a score in this
quintile. Both Brazil—Onshore Con ces sion Con tracts and Brazil—Off shore Con ces sion Con -
tracts have scores in the third quintile again this year, but in both cases, the scores are less robust
than in 2012. As a con se quence, these juris dic tions’ rank ings are lower than a year ago. Guy ana,
which ranked first in the region in 2012 dropped to the 6th most attrac tive in the region and fell in
the global rank ings from 48th (of 147) to 90th (of 157) in 2013, with an over all score in the third
quintile instead of the sec ond. The coun try’s poorer per for mance is attrib ut able to greater bar ri ers
to invest ment being indi cated for most of the reg u la tory fac tor ques tions as well as for tax a tion
(31%). Uru guay improved its rank ing in the region as well as glob ally as a con se quence of achiev -
ing a much improved third quintile Pol icy Per cep tion Index score. This improve ment was trig -
gered by sur vey responses sig nal ling less negativity on all the com mer cial envi ron ment fac tors with
the excep tion of infra struc ture qual ity.
Trin i dad and Tobago moved up from the third quintile to the more attrac tive sec ond quintile in
2013 and achieved a higher global rank ing as the result of less negativity for all fac tors in its com -
mer cial envi ron ment. Chile reg is tered the most improve ment and is now seen as the most attrac -
tive juris dic tion for upstream petro leum invest ment in Latin Amer ica and the Carib bean Basin.
Chile’s over all score improved from the mid dle of the third quintile to the lower sec ond quintile this
year, improv ing its global rank ing from 76th place (of 147) to 26th place (of 157). This resulted from
improved scores on var i ous reg u la tory cli mate ques tions, espe cially those on the cost of com pli ance
(-63%), reg u la tory dupli ca tion and incon sis ten cies (-37%), and dis puted land claims (-38%).
Respon dents’ com ments on juris dic tions in Latin Amer i can and the Carib bean Basin are pro vided
below. They have been edited for length, gram mar and spell ing, to retain con fi den ti al ity, and to
clar ify meanings.
Ar gen tina in gen eral
“Reg u lated oil and nat u ral gas prices in Ar gen tina have stalled in vest ment.”
“Ar gen tina’s nat u ral gas co mes now to Chile at a price of US$18-19 per mil lion Brit ish
Ther mal Units, and out of that approx. 80% are roy al ties and taxes. That is a hor ror
story and a dem on stra tion of gov ern ment in ter ven tion in busi ness.”
Fra ser In sti tute Global Pe tro leum Sur vey, 2013 69www.fraserinstitute.org

“Ar gen tina—fed eral gov ern ment ex pro pri a tion of shares of Repsol, fed eral gov ern -
ment con trols on price, fed eral gov ern ment con trols on ex port vol umes, pow er ful un -
ions, and fed eral gov ern ment mis aligned with free en ter prise (but aligned with
dis en fran chised poor ma jor ity, de pend ent on sub si dies from un ions and fed eral gov -
ern ment).”
“To tal fail ure to re spect con tracts and vested rights up held by all in stances of fed eral
and pro vin cial gov ern ments.”
Ar gen tina—Neuquen
“Well-de vel oped pol i cies. Po lit i cally less de pend ent on the fed eral gov ern ment.”
Ar gen tina—Santa Cruz and Tierra del Fuego
“Po lit i cal, le gal, and con trac tual un cer tain ties are kill ing the busi ness.”
Bolivia
“Le gal un cer tainty. Pop u list ex pro pri a tions. Land locked. So cial and po lit i cal in sta bil -
ity. Poor train ing.”
“His tory of to tal ex pro pri a tion is worse than any where, and no sign of this chang ing.”
Co lom bia
“Launched an ag gres sive in cen tive pro gram to in vest by stream lin ing the ini tial in vest -
ment pro cesses, spe cif i cally re lated to en vi ron men tal reg u la tions. In Co lom bia, En vi -
ron men tal Im pact As sess ments (EIAs) are ap proved in 6 months com pared to the
av er age two months it takes in Peru.”
“Co lom bia has well-or ga nized bid rounds. Subsurface data pack ages are good and
open. Blocks award ing pro cess is clear and trans par ent. Good con trac tual terms.”
“Ac tively seek ing ex plo ra tion and pro duc tion in vest ment, so ad justed fis cal terms, reg -
u la tory en vi ron ment, and land man age ment to at tract that in vest ment. Very re cently,
within last 1-2 years, en vi ron men tal per mit ting chal lenges, and de te ri o rat ing fis cal and
tax pol i cies have eroded suc cess of the pre vi ous 5-10 years.”
“Co lom bia has the most fa vour able con di tions for pe tro leum in vest ment.”
Ec ua dor
“Gov ern ment al ways changes signed con tracts uni lat er ally.”
70 Fra ser In sti tute Global Pe tro leum Sur vey, 2013
www.fraserinstitute.org

French Gui ana
“A new min is ter with re spon si bil ity for oil and gas in Paris uni lat er ally banned all off -
shore drill ing... For tu nately, she was re placed sev eral days later but the re place ment ap -
pears to re fuse to sign any thing that co mes across the desk re lated to oil and gas.”
Peru
“Peru just in tro duced a man da tory carry of the state com pany through the ex plo ra tion
phase for bid rounds. This at a time many play ers are leav ing the coun try. The bid
round will not go well.”
“Leg is la tion has been sta ble and econ omy grow ing con sis tently for the last 10 years.
En ergy need has been grow ing, with un der ex plored bas ins and rea son able en try
prices.”
“Peru en cour ages oil and gas in vest ment but the po lit i cal in ter ac tion re quires pay offs
and un der the ta ble deal ings.”
Su ri name
“Ex Dutch col ony with ques tion able lead er ship and men tal ity for an oil pro duc ing
area.”
Uru guay
“Uru guay has been an ex am ple of good pol icy cli mate: with out much prospectivity
they man aged to at tract sig nif i cant in vest ment and world class play ers to start ex plor -
ing their deep wa ters, based on at trac tive terms, flex i bil ity, po lit i cal sta bil ity, and le gal
cer tainty.”
Ven e zuela
“Er ratic, chang ing, and in con sis tent le gal, reg u la tory, and fis cal re gimes.
“Pur su ing in ter nal so cial ist pol i cies and hos tile to lib eral cap i tal in vest ment (and profit
pro duc ing eco nomic model) pur sued by in ter na tional com pa nies.”
“In sta bil ity. Re quire ment to part ner with in ef fi cient state oil com pany.”
“Ven e zuela has been a hor ror story dur ing the last 10 years: con tract in sta bil ity, ex pro -
pri a tion with out com pen sa tion, tax mod i fi ca tions, oil price wind fall taxes, la bor re -
stric tions, po lit i cal in ter fer ence in op er a tions, lack of le gal cer tainty, etc.”
Fra ser In sti tute Global Pe tro leum Sur vey, 2013 71www.fraserinstitute.org

“The de scent of PDVSA (Ven e zuela’s na tional oil com pany) from an ex em plary in ter -
na tional na tional oil com pany to its pres ent de graded sta tus, all due to po lit i cal de vel -
op ments, is strik ing.”
“There are com pa nies in Ven e zuela that have not been paid in months, not even in the
na tional cur rency. Contracts are back tracked by ex pect ing for eign ers to in vest their
share, PDVSA’s share too (with out PDVSA go ing into debt) and not have any say in
op er a tions, fi nance, and la bor pol icy. Ex pro pri a tion men aces are con stant and you can
never find the PDVSA per son to talk to for any de ci sion and com plaint.”
72 Fra ser In sti tute Global Pe tro leum Sur vey, 2013
www.fraserinstitute.org

Op tional sur vey ques tions
Op tional Ques tion One
Par tic i pants were asked, “How would your assess ment of invest ment poten tial change were the
United States to imple ment fed eral con trols over hydrau lic frac tur ing?” Their responses fol low
(see fig ure 17). Slightly more than half of respon dents would decrease or mod estly decrease their
assess ment as a result. Twenty-seven per cent of respon dents would not change their assess ment.
How ever, 22 per cent of respon dents indi cated that they would increase or mod estly increase their
assessment.
The results sug gest that most of those who responded to this ques tion by indi cat ing that they
would lower their assess ment prob a bly believe that fed eral con trols would increase the cost of reg -
u la tory com pli ance to such a degree that they would pre fer to focus on invest ment oppor tu ni ties
in the US that don’t involve hydrau lic fracking or to oppor tu ni ties in other coun tries (which could
involve fracking). Why, on the other hand, some respon dents sug gest that they would increase
their assess ment is unclear. This might reflect their belief that fed eral gov ern ment con trols would
reduce reg u la tory uncer tainty in rela tion to fracking.
Fra ser In sti tute Global Pe tro leum Sur vey, 2013 73www.fraserinstitute.org
0% 5% 10% 15% 20% 25% 30% 35%
Increase
Modest increase
No change
Modest decrease
Decrease
9%
13%
27%
20%
31%
Percentage of responses
Figure 17: How would your assessment of investment potential change werethe United States to implement federal controls over hydraulic fracturing?

The com ments below were received regard ing the reg u la tory envi ron ment for hydrau lic frac tur ing
in the United States. Com ments have been edited for length, gram mar and spell ing, to retain con fi -
den ti al ity, and to clar ify mean ings.
“If the US con trols or slows down hy drau lic frac tur ing the in vest ment cli mate in the
US will slow down by at least 60-70 per cent. This will de stroy the US pe tro leum in dus -
try un til a new ad min is tra tion is elected.”
“In dus try does not like un cer tainty and the pro vin cial and fed eral and US state gov ern -
ments have gen er ated tons of stud ies and re views, but have not tack led the is sues prop -
erly. In the US’s case, the pro cess sim ply goes on and on. Not mak ing a de ci sion wipes
out pro jects just as readily as bad gov ern ment pro grams.”
“Sur prised that US fed eral lands were not treated as a sep a rate en tity/ju ris dic tion. This
would re ceive a very low/hos tile rat ing as it is vir tu ally im pos si ble to con duct mean ing -
ful busi ness on fed eral lands.”
“Out side of fed eral lands, the fed eral gov ern ment has no busi ness stick ing its nose into
pri vate en ter prise!”
“Pro jects de ferred are of ten those de stroyed. There is an open door for in ter na tional
trade in liq ue fied nat u ral gas and that door is clos ing. West ern Aus tra lia may have the
mar ket be fore the US can move.”
“En vi ron men tal reg u la tions are one of the big gest im ped i ments to our in dus try. We
have had salt wa ter or “brine” com ing out of our wells for many years. En vi ron men tal -
ists now call this haz ard ous waste. In PA they use this salt brine to get rid of the snow.
Ap par ently it was n’t that much of an is sue. Now en vi ron men tal ists wish to ban fracking.
This pro ce dure has been around since 1954. Why is this now a prob lem? It seems that no
mat ter where we go to drill or de velop oil and gas, the state or fed eral gov ern ments are
stick ing their hands out and want ing money. Gov ern ment in ter fer ence will be the ru in -
ation of our in dus try if they keep ma lign ing and over reg u lat ing our oil and gas.”
“Gov ern ment reg u la tion, whether fed eral, state, county or city, needs to be ap pro pri -
ately bal anced from a com mer cial and en vi ron men tal per spec tive so as to not com -
pletely de rail in vest ment. Al ter na tive sources of en ergy are still a long way from be ing
able to re place fos sil fu els and econ o mies need ad e quate fuel sup plies at af ford able
costs in or der to main tain and grow.”
“The gov ern ment has no au thor ity to out law such drill ing prac tices ex cept, per haps, on
fed eral lands in the US. We think that the fed eral gov ern ment will not take such an
ill-ad vised ac tion on fed eral lands with out be ing able to prove that fracking is caus ing
some measureable dam age. We have now been fracking wells since 1940s and have now
fracked in ex cess of one mil lion wells, in clud ing many on fed eral lands in the Rocky
Moun tain states.”
74 Fra ser In sti tute Global Pe tro leum Sur vey, 2013
www.fraserinstitute.org

Op tional Ques tion Two
Par tic i pants were also asked “How would your assess ment of the attrac tive ness of West ern Can ada
and the North west Ter ri to ries for invest ment change if Can ada con tin ues to face a short fall in
oil-trans port capa bil ity to East ern Can ada, export mar kets over seas, and US refin er ies?” Their
responses fol low (see fig ure 18). The major ity of respon dents (62%) indi cated that the attrac tive -
ness of the region would decline. Twenty-nine per cent of respon dents would not change their
assess ment. Rather unex pect edly, nine per cent of respon dents indi cated that they would assess
West ern Can ada and the North west Ter ri to ries as being more attrac tive for invest ment.13
The fol low ing com ments were received regard ing Can ada’s oil-trans port capa bil ity. Com ments
have been edited for length, gram mar and spell ing, to retain con fi den ti al ity, and to clar ify mean ings.
“Should we be sur prised we don’t have the ap pro pri ate crude oil take-away ca pac ity?
Gov ern ments have been ap prov ing oil sands in vest ment. Where are the equiv a lent
pipes?”
“In Can ada, the oil trans por ta tion chal lenge is the big gest is sue. How ever, it is a
two-part is sue. Part one is just build ing/ex pand ing pipe lines. An equally large (or
maybe larger) is sue is whether these pipe lines should have dilbit (di luted oilsands bi tu -
men) in them or not.”
“Ca na dian en ergy is marginalized now due to is sues of mar ket ing the prod ucts and the
view that North Amer ica is over sup plied with all forms of hy dro car bon ver sus de mand.
In vest ment cli mate will re main chal lenged un til more mar kets can be opened al though
over all con cerns about Chi nese eco nomic growth rates will still pro vide over all throt tle
on in vest ment. Can ada needs to pro ject how its pol i cies and pro ce dures are an ad van -
tage to in vest ment, and are lower risk than some of the pro ce dures in the US—i.e.,
hor i zon tal well com ple tions, and also gas flar ing that is go ing on to a very high ex tent
in the US Bakken oil play.”
“Mid stream con straints (pipe lines) are the sin gle big gest risk to the in dus try to day in
West ern Can ada. It has been the sin gle big gest risk for years and in dus try has com mu -
ni cated these risks for years in an tic i pa tion of the bot tle necks. Un for tu nately gov ern -
ment is late to the game and risks bil lions of dol lars in tax rev e nues and bil lions of
dol lars in in vest ment as those cap i tal dol lars are di verted else where. Hope fully the ur -
gency of the mat ter is el e vated.”
“Need the Key stone pipe line to bring oil from Can ada to the US. It would help with
pric ing im me di ately.”
Fra ser In sti tute Global Pe tro leum Sur vey, 2013 75www.fraserinstitute.org
13 How the outlook for upstream investment in Western Canada and the Northwest Territories could be
seen to improve if Canada continues to face transportation bottlenecks is unclear. The rationale might
be that the situation needs to get even worse in order to trigger governments to adopt measures that
are necessary to expedite investment in required transportation infrastructure.

“Ca na dian fed eral gov ern ment and pro vin cial gov ern ments need to wake up and smell
the flow ers. The world of en ergy is mov ing ahead with out Can ada. If Can ada does n’t
open up its ex port routes to both the west coast (pri mary) and east coast (sec ond ary),
then Can ada is doomed to con tinue sub si diz ing the US prof li gate use of en ergy for ever,
to the loss of Ca na dian cit i zens to day and the gen er a tions to fol low.”
“We should not be ‘held hos tage’ by the funds pro vided by US com pa nies to the ‘Green
Party’ to hin der ad di tional pipe lines to the West Coast. This mar ket to Asia is es sen tial
to our wellbeing. The re cent light oil pro duc tion as a re sult of hor i zon tal drill ing and
fracking in the North Da kota area is REAL and has al ready dis placed our oil ex ports to
the US. It ap pears that we have an oil and gas sur plus and it is cur rently sell ing for a
heavy dis count.”
“Di ver si fy ing our mar kets to ex port both oil and gas should be a na tional pri or ity/vi -
sion. The cur rent lack of al ter na tives cost our coun try mil lions of dol lars a day.”
“Key stone XL has be come a fi asco. The reg u la tory pro cess has been sub verted by pol i tics.”
“The con tin ued de bate over fracking and the Key stone XL pipe line points out a trou -
bling trend in US pol icy: that eco nomic ar gu ments don’t mat ter in the face of strong
po lit i cal con vic tions. I would sug gest that coun tries rang ing from Ven e zuela to Ger -
many are poster chil dren for the fal la cies in her ent in that ap proach.”
76 Fra ser In sti tute Global Pe tro leum Sur vey, 2013
www.fraserinstitute.org
0% 5% 10% 15% 20% 25% 30% 35% 40%
Increase
No change
Modest reduction
Large reduction
Would no longer invest
9%
29%
36%
24%
3%
Figure 18: How would your assessment of the attractiveness of WesternCanada and the Northwest Territories for investment change if Canadacontinues to face a shortfall in oil-transport capability to Eastern Canada,export markets overseas and U.S. refiners?

Ad di tional com ments from the Pe tro leum Sur vey
Com ments have been edited for length, gram mar and spell ing, to retain con fi den ti al ity, and to
clar ify mean ings.
Reg u la tory “hor ror sto ries” …
Can ada
“Car bon tax in BC is a huge bur den on nat u ral gas com pa nies. Car bon tax pay ments in
2012 equalled roy alty pay ments for our com pany.”
“Du pli ca tion and miscommunication be tween the [now for mer] En ergy Re sources
Con ser va tion Board and Al berta En vi ron ment... hor rific!! And that Board’s un re al is tic
ex pec ta tions from small ju nior sec tor par tic i pants.”
USA
“Cor rupt and in tru sive fed eral pol i cies in the US are driv ing cap i tal in vest ments slowly
to Can ada and var i ous over seas ven ues.”
“Mich i gan and New Mex ico: Over zeal ous reg u la tion per son nel with strong-arm tac tics
and threats.”
“The state of North Da kota has all of its oil and gas in for ma tion avail able to the pub lic
at a very nom i nal fee. Un for tu nately, the worst “hor ror” sto ries I have are from fed eral
land man ag ers in North Da kota, whereas state and pri vate lands are truly ac ces si ble.”
“Leg acy law suits in Lou i si ana (un lim ited en vi ron men tal li a bil ity re gard less of time
passed or changes in pro duc ing com pa nies) have driven the op er a tors out of the state
and re duced ac tiv ity by over 25%. See Corbello vs. Iowa Pro duc tion. Shell Oil had to pay
$80 mil lion in dam ages for cleanup on land val ued at $100,000.”
“My hor ror story would be op er at ing in the Gulf of Mex ico, in shal low wa ter, af ter the
Macondo spill in deep wa ter. The reg u la tory au thor ity pan icked and cre ated un en -
force able rules which set the in dus try back two years.”
“The City of Fort Col lins in Col o rado chose to an nex an ex ist ing oil field in the 1990’s.
The city chose how to zone the area and they chose to zone it res i den tial. In the late
1990’s thru July 2010 the city ap proved three sep a rate hous ing sub di vi sions with hous -
ing lots right up to ex ist ing well lo ca tions. Then Fort Col lins City Coun cil de ter mined
that the oil wells were in dus trial op er a tions and ap proved a mor a to rium on drill ing
Fra ser In sti tute Global Pe tro leum Sur vey, 2013 77www.fraserinstitute.org

and a ban on hy drau lic frac tur ing and tried, but failed, to shut down op er a tions in
2012 and 2013.”
“Pre lim i nary con clu sions of the draft US En vi ron men tal Pro tec tion Agency’s re port on
hy drau lic fracking in di cate a po ten tial con nec tion be tween frac tur ing and Pavillion,
Wy o ming, ground wa ter qual ity. How ever, the find ings were not sci en tif i cally ver i fied
by a third party.”
“Shell’s ex pe ri ence in the Chukchi Sea off Alaska, whereby one gov ern ment de part -
ment leases the land and other de part ments pre vent the les see from ex plor ing and de -
vel op ing it.”
Oceania
“New South Wales: con stantly chang ing the pol icy in re la tion to gas ex plo ra tion, which
is driv ing ex plo ra tion away and will starve their econ omy of gas.”
“Fed eral Aus tra lian gov ern ment in mul ti ple back flips in pol i cies, im po si tion of ar bi -
trary bans, or no-go ar eas, in tro duc tion of ad di tional tax and com pli ance bur dens.”
“Many ex am ples in Aus tra lia where a pub lic that is not well ac quainted with the pe tro -
leum in dus try and ad vances in sci ence and en gi neer ing is fre quently swayed by the me -
dia (mainly TV net works) into ex pect ing worst case sce nar ios are wide spread.”
“In do ne sian re stric tions on ex pa tri ate in ves tor work per mits (age, in-coun try years
work ing, etc.). In do ne sian reg u la tory ap proval pro cess, etc.”
“The dis missal of the oil and gas up stream im ple ment ing body in In do ne sia in late
2012. And the in tro duc tion of reg u la tion there which is in con flict with the pro duc tion
shar ing con tracts which com pa nies have with the host coun try.”
“Pro duc tion shar ing con tracts have be come ve hi cles for au di tory abuse and use of
threats of cost re cov ery de nial as weap ons of in flu ence/in ter fer ence, as in In do ne sia.”
“In do ne sia’s use of crim i nal law and anti-brib ery rules to co erce for eign oil com pa nies
into com pli ance with in creased gov ern ment share of rev e nues.”
Eu rope
“We filed ap pli ca tions for two licen ces in Spain in 2003. Af ter eight years there was no
prog ress so we cancelled the ap pli ca tions.”
“France: To carry out a sim ple as sign ment of in ter ests (i.e., farm-out), the pro cess takes
2+ years, a 300-page ap pli ca tion, 7 reg u la tory steps and a min is te rial or der (UK pro cess
takes 7 days). Per mit re newal takes the same time—per mit is re newed only af ter per mit
ex pires; well per mit ting pro cess takes 2+ years, reg u la tory over kill at ev ery step of the
78 Fra ser In sti tute Global Pe tro leum Sur vey, 2013
www.fraserinstitute.org

ex plo ra tion and pro duc tion (E&P) pro cess; hy drau lic fracking was banned with out re -
view of ex pert’s re ports due to elec tion pol i tick ing/grandstanding.”
“Hor ror is the du ra tion of ap proval pro cesses ratifications in Ro ma nia.”
Asia
“China: not dis clos ing all past ex plo ra tion data, pro vided only the good re sults.”
“Kazakhstan’s sud den in crease in the rent tax in 2011.”
Mid dle East North Af rica (MENA)
“Al ge ria: Over bu reau cratic, non-uni fied gov ern ment, cor rup tion, and se cu rity is sues.”
“Iraq and Libya: Very poor terms and lack of se cu rity.”
“Iran: Sanc tions, un fa vour able hy dro car bon law and fis cal terms, opaque busi ness en -
vi ron ment, con tract in sta bil ity, po lit i cal un cer tainty, se cu rity en vi ron ment.”
Af rica
“Ni ge ria: cor rupt and dan ger ous kleptocracy.”
“In re cent times, Su dan, which is now di vided into two coun tries, pre sented a hor ror
spec ta cle to the ex plo ra tion and pro duc tion com pa nies in vested there. Su dan and
South Su dan are yet to re solve all their is sues.”
“Dem o cratic Re pub lic of the Congo (Kinshasa): Le gally un cer tain, un safe, cor rup tion.”
“Uganda: Cor rup tion and high risk.”
“Pa pua New Guinea and Re pub lic of Congo (Brazzaville): Po lit i cal in sta bil ity, per son -
nel safety is sues, un cer tainty of ten ure, sov er eign risk.”
Latin Amer ica and the Ca rib bean
“Ar bi trary changes in ev ery as pect of the in dus try in Ar gen tina: taxes, la bour laws, hy -
dro car bon prices, ex port hur dles, and so on.”
“Ar gen tina: Mod i fi ca tions to con trac tual terms and ar bi trary na tion al iza tions.”
“The en vi ron men tal reg u la tor IBAMA [Bra zil ian In sti tute of En vi ron ment and Nat u ral
Re sources] in Brazil is very slug gish and does not work in a time bound man ner.”
“Bra zil ian ‘fines’ for en vi ron men tal non-com pli ance, where you get a 30% dis count if
you pay within 10 days and agree not to con test or ap peal the ‘fines.’”
Fra ser In sti tute Global Pe tro leum Sur vey, 2013 79www.fraserinstitute.org

“The Bra zil ian lo cal con tent pen alty fine is a hor ror story re gard ing how a reg u la tory
frame work can hin der in vest ment.”
Ex em plary pol i cies…
“Thai land: Roy alty re gimes are simple and pro mote com mon goals.”
“In Nor way we have stan dard ized joint op er at ing agree ments, unitization agree ments,
and to a large ex tent tie-in and pro cess ing agree ments. Saves a lot of time and money.”
“Sas katch e wan’s move to an en vi ron men tal code of prac tice that al lows for fast reg u la -
tory per mit ting and the use of pro fes sion ally qual i fied en vi ron men tal pro fes sion als ver -
sus min is try reg u la tors for reg u la tory ap prov als and mon i tor ing achieves a better re sult
for the en vi ron ment at lower cost, cre ates fast adop tion of best prac tices, and im proves
reg u la tory timelines sig nif i cantly.”
Op por tu ni ties & chal lenges …
“The in dus try needs to work with gov ern ments and en vi ron men tal groups to set out
proactive goals and ob jec tives which can be met col labor atively. The clas sic model of
con flict no lon ger is work ing and it is caus ing lost op por tu ni ties for all.”
“As the in ter na tional oil com pa nies leave the shal low-wa ter re gions and older fields in
West Af rica, West Af ri can gov ern ments need to make the in vest ment cli mate and reg u -
la tions work for smaller- to in ter me di ate-sized oil com pa nies that have the ex per tise
and are the only ones left to in vest in the re gion.”
“We need mod er ate reg u la tory over sight as [with out it] com pa nies will cut cor ners and
the re sult is leaks, fires, poor en vi ron men tal is sues, poor land owner re la tions, ser vice
com pa nies rac ing die sel rigs through com mu ni ties, etc. The in dus try per forms at a high
bar rel a tive to the con cerns so ci ety has, but it only takes a few lousy op er a tors to RUIN
IT FOR THE REST OF US.”
“The in dus try should make an ef fort to stan dard ize en vi ron men tal reg u la tions per tain -
ing to the ex plo ra tion and ex ploi ta tion of shale plays. Draft stan dard shale joint op er at -
ing agree ment (JOA) and set forth pa ram e ters to help au thor i ties in de vel op ing
coun tries to of fer ar eas for un con ven tional re sources.”
“The mis con cep tions and mis in for ma tion dis sem i nated by gov ern ment, self-serv ing
spe cial in ter est groups, and the me dia add to the lack of trust to wards the in dus try in
gen eral and the not-in-my-back yard at ti tude so com mon to day.”
“The in dus try seems to be los ing the pub lic re la tions war. Op po si tion to all forms of
pe tro leum de vel op ment seems to be get ting stron ger. Op po nents do not even have to
80 Fra ser In sti tute Global Pe tro leum Sur vey, 2013
www.fraserinstitute.org

pre tend to have real facts and fig ures. Emo tional ap peals seem to be suf fi cient to ob tain
po lit i cal ends.”
“In vest ment cli mate is not pres ently fa vour able for ju nior ex plo ra tion com pa nies with
lit tle or no pro duc tion. Mis in for ma tion con cern ing un con ven tional re source pro duc -
tion is pro duc ing po lit i cal back lash and un cer tainty in pol i cies.”
“Oil and gas ju ris dic tions need to be com pet i tive to at tract in vest ment dol lars. The in -
dus try has choices. For those ju ris dic tions that fail to rec og nize this—un com pet i tive
ju ris dic tions will con tinue to see in vest ment ero sion. The un in formed pub lic ac tiv ists
who pro test de vel op ment and steer pub lic per cep tion against in dus try through the
mar vels of mod ern tech nol ogy (i.e., the elec tronic so cial me dia con duits), weaken their
lo cal econ omy and be come cat a lysts for cre at ing an im pov er ished fu ture for the worlds
they live in.”
“En vi ron men tal re stric tions have be come a re li gion, and are no lon ger sub ject to logic
and sci ence. They are un pre dict able and dras ti cally re strict po ten tial in vest ment in ex -
plo ra tion and de vel op ment pro jects.”
“The EU pol icy with re gard to the re duc tion of CO2 emis sion is sim ply stu pid, not even
based on math e mat i cal mod els and sim u la tions.”
“There will be great eco nomic pres sure be tween Iraq and Kurdistan to re solve the le gal
ba sis for oil de vel op ments, in clud ing the ti tle to oil, ex port per mits, and rev e nue shar -
ing: but these groups are ca pa ble of con tin u ing (and prob a bly will con tinue) to be have
ir ra tio nally [just] to dis agree.”
“Many bar ri ers to en try with na tion al iza tion and na tional pref er ences in many ju ris dic -
tions out side of North Amer ica and the North Sea (West ern world). See ing in creased
dom i nance of Asian play ers (many gov ern ment-linked) who have com pet i tive ad van -
tages due to dif fer ent mar ket pres sures and avail abil ity of cap i tal.”
Fu ture ex pec ta tions …
“The in vest ment cli mate is go ing to be better and better in the fu ture due to the en ergy
de mand in creas ing from time to time. Coun tries that have been stiff and in flex i ble to
in ves tors will be left be hind and the ben e fits will come to coun tries in the new fron tier
(Myanmar, Mad a gas car, Ban gla desh, East ern Af rica).”
“The oil and gas sec tor is out of fa vour with in ves tors and it is par tic u larly dif fi cult for
smaller do mes tic or in ter na tional com pa nies to raise the nec es sary cap i tal to grow the
busi ness at this time, whether based in Cal gary, Hous ton, or Lon don. Macro is sues
with re spect to in ter na tional GDP growth rates, con strained com mod ity prices, and re -
stric tions on in flows of cap i tal by state owned en ter prises (in the case of Can ada) could
re sult in very tough times for the sec tor over the next 2-3 years. Those with strong cash
Fra ser In sti tute Global Pe tro leum Sur vey, 2013 81www.fraserinstitute.org

flow can avoid debt and eq uity mar kets and pro vide share hold ers with their strong ap -
pe tite for yield. Oth ers will strug gle and ei ther dis ap pear or merge with oth ers be fore
there is a ros ier cap i tal mar kets pic ture.”
“In vest ment in the upstream in dus try would gen er ally con tinue to be af fected by reg u -
la tory and pol icy changes in most ju ris dic tions. I fore see in creased in ter est and in vest -
ment in the de vel op ing world as po lit i cal and eco nomic con di tions in that re gion
con tinue to sta bi lize. The cost of crude oil and pe tro leum prod ucts will re main sta ble
and may dip slightly within the next 3-5 years.”
“The in dus try will still grow in spite of the emer gence of unconventional re sources.
Pre dic tions of the “global en ergy cri sis” did not hap pen and yet we have an abun dance
of resources. Not all of Af rica and South Amer ica have been ex plored. We still have the
Arctic, Iraq, Iran, etc. In dus try is still mak ing dis cov er ies in Gulf of Mexico.”
“Large-vol ume off shore de vel op ments will pros per: UK North Sea, Nor way, Gulf of
Mex ico, off shore Brazil, and off shore West Af rica. Ex ist ing large-vol ume on shore de -
vel op ments will pros per: Saudi Ara bia, Qa tar, UAE, Ku wait, and Rus sia (lat ter to the
ex tent run by Rus sians them selves). The Straits of Hormuz will be come more high risk
as the Ira ni ans be come more frac tious and hos tile (more so if they do in fact be come a
nu clear armed state in 2013 or 2014 or 2015, and be come even more frac tious and hos -
tile and un pre dict able).”
“I think the up stream pe tro leum in dus try will con tinue to flour ish as long as oil prices
don’t con tinue to drop, but the costs will grow as en vi ron men tal pol i cies get stricter
and the ab orig i nal com mu ni ties liv ing in or around the li cense ar eas be come aware of
their ne go ti at ing power and keep in creas ing their de mands to a breaking point.”
82 Fra ser In sti tute Global Pe tro leum Sur vey, 2013
www.fraserinstitute.org

Sin gle-factor results
The rank ings for the spe cific fac tors addressed by the 16 sur vey ques tions pro vide detailed infor -
ma tion about each juris dic tion’s rel a tive attrac tive ness for invest ment (see fig ures 19 through 34).
The results for each fac tor are illus trated by the rank ings, and the com plete data set is avail able for
down loading. The juris dic tions with a rel a tively low pro por tion of neg a tive scores appear near the
top of the rank ings and are gen er ally regarded as more attrac tive for upstream petro leum
invest ment.
The sin gle-fac tor rank ings are self-explan a tory. How ever, we high light some find ings of par tic u lar
inter est below.
Fis cal terms
Accord ing to the sur vey respon dents (fig ure 19), fis cal terms pose the great est obsta cle to invest -
ment in Ven e zuela, Bolivia, Ecua dor, Iran, and Argen tina—Tierra del Fuego, Chubut, Mendoza,
Santa Cruz, and Neuquen. Amongst the Cana dian and US juris dic tions fis cal terms appear to be of
most con cern in Cal i for nia, Que bec, and New York. In each of those three juris dic tions the scores
for this fac tor fall in the unde sir able fourth quintile.
Juris dic tions with the low est per cent ages of neg a tive responses on the fis cal terms ques tion (which
sug gests that this issue is not of great con cern) include Sas katch e wan, North Dakota, South Aus -
tra lia, Oklahoma, Mis sis sippi, and Aus tra lia’s North ern Ter ri tory. Amongst the Afri can juris dic -
tions fis cal terms are of least con cern in Bot swana, fol lowed by Sey chelles and Mali.
Uncer tainty con cern ing envi ron men tal reg u la tions
The 10 juris dic tions that have the worst scores with regard to uncer tainty con cern ing envi ron men -
tal reg u la tions this year are Que bec, Ecua dor, Cal i for nia, France, New York, US—Off shore
Pacific, Spain—Off shore, Brazil—Off shore PSCs, Hun gary, and Brazil—Off shore CC (fig ure 21).
Cal i for nia, France, and Que bec were also in this group last year. Sev eral of these juris dic -
tions—includ ing Que bec, France and sev eral munic i pal i ties and coun ties in New York—have
moratoria on hydraulic fracturing.
Uncer tainty con cern ing envi ron men tal reg u la tions is of least con cern to sur vey respon dents in
Sas katch e wan, Oklahoma, North Dakota, Bot swana, and Mali. They replaced Soma li land, Ethi o -
pia, Bah rain, Cyprus, and Man i toba, which all saw increases in the degree of con cern with regard to
this issue.
Fra ser In sti tute Global Pe tro leum Sur vey, 2013 83www.fraserinstitute.org

Inter pre ta tion and admin is tra tion of reg u la tions
The 10 juris dic tions with the worst scores on the ques tion regard ing inter pre ta tion and con sis -
tency in the admin is tra tion and enforce ment of reg u la tions this year are Ven e zuela, Bolivia, Rus -
sia—East ern Sibe ria, Kyrgyzstan, Argen tina—Salta, Rus sia—Other, Ecua dor, Que bec,
Rus sia—Off shore Arc tic, and Ukraine. Ven e zuela, Bolivia, Argen tina—Salta, and the Rus sian
juris dic tions were also in this group in 2012. Thirty-nine juris dic tions have unflat ter ing fourth and
fifth quintile scores on this question (figure 22).
New Bruns wick, which ranked last (of 147) juris dic tions on this issue in 2012 has
improved—receiv ing a low third quintile score. The most attrac tive juris dic tions in terms of this
issue are Bot swana, Faroe Islands, Sas katch e wan, Oklahoma, Man i toba, Texas, Aus tra lia’s North -
ern Ter ri tory, North Dakota, Arkan sas, and South Aus tra lia.
Cost of reg u la tory com pli ance
Twenty-eight juris dic tions have unflat ter ing fourth and fifth quintile scores on the cost of reg u la -
tory com pli ance fac tor (fig ure 23). Que bec ranks as the worst (of 157) juris dic tions on this issue.
Other juris dic tions in the worst fifth quintile group are Rus sia—Off shore Arc tic, US—Off shore
Alaska, Ven e zuela, Ecua dor, and Iran. Those in the fourth quintile with the high est and worst
scores on this issue (in the upper half of the quintile) are Uzbekistan, Bul garia, Bolivia, Cal i for nia,
US—Off shore Pacific, Greece, Rus sia—Other, and Kazakhstan.
High reg u la tory com pli ance costs often also mean that the time required for pro ject appli ca tions to
be approved is unduly long. As a result, poten tially via ble pro jects are often sub ject to long delays or
not under taken at all. In such cases, the fore gone eco nomic and social ben e fits may be large.
Pro tected areas
Cana dian, US, and Aus tra lian juris dic tions dom i nate (11 of 16) the group with scores in the least
attrac tive fourth and fifth quin tiles on the ques tion per tain ing to uncer tainty regard ing pro tected
areas (see fig ure 24). The scores for New South Wales, Que bec, and New York (although just barely
so) fall within the least attrac tive fifth quintile. Cal i for nia, Ecua dor, US Off shore—Alaska, US Off -
shore—Pacific, Queensland, Col o rado, Gua te mala, Alaska, Greece, Aus tra lia—Off shore, Peru,
Bolivia, and New Mex ico all have slightly better but yet very unat trac tive fourth quintile scores on
this ques tion. By con trast, Mid dle East and North Afri can coun tries com prise seven of the ten
juris dic tions with the least amount of neg a tive sen ti ment indi cated by respon dents with regard to
this fac tor.
84 Fra ser In sti tute Global Pe tro leum Sur vey, 2013
www.fraserinstitute.org

Trade bar ri ers
Iran, three Argen tin ean prov inces (Neuquen, Salta, and Tierra del Fuego), all four Rus sian
regions, along with Ven e zuela and Uzbekistan are the 10 juris dic tions for which trade reg u la tions
and cur rency con trols are indi cated as pos ing the great est bar rier to upstream invest ment. The
poor per for mance of the Argen tine prov inces and Rus sian regions with respect to this fac tor was
also high lighted in the 2012 sur vey. Trade bar ri ers were indi cated to be of no con cern what so ever
in Can ada’s North west Ter ri to ries, Yukon, Ala bama, Arkan sas, South Aus tra lia, Malta, Bot swana,
and Jor dan (see fig ure 25).
Labor availability and skills
The 10 least attrac tive juris dic tions for labor avail abil ity and skills are Repub lic of Congo
(Brazzaville), Kyrgyzstan, Niger, Soma li land, South Sudan, Uganda, Turkmenistan, Dem o cratic
Repub lic of Congo (Kinshasa), Chad, and Ban gla desh (see fig ure 29). The 10 juris dic tions where
labor avail abil ity and skills are of least con cern are Lou i si ana, Oklahoma, Hun gary, Texas, Neth er -
lands—North Sea, Mis sis sippi, Kan sas, Arkan sas, Colorado, and Norway.
Juris dic tions with high unem ploy ment rates per se are not nec es sar ily attrac tive to oil and gas
explor ers and devel op ers; they require skilled work ers and spe cial ists for many posi tions and while
the unem ploy ment rate may be high, there may none the less be a defi ciency in the avail abil ity of
skilled labor. Fur ther more, inter na tional mobil ity of skilled work ers is impor tant to the upstream
oil and gas indus try so it can meet its require ment for skilled work ers with out being con strained by
the size and qual ity of the local work force.
Dis puted land claims
Soma li land has the worst score on the dis puted land claims ques tion this year (fig ure 30). The
other juris dic tions with unat trac tive fifth quintile scores on this fac tor are Can ada’s North west
Ter ri to ries, Ecua dor, Papua New Guinea, and South Sudan. Clearly, the land claims issue con tin -
ues to be of major con cern in the North west Ter ri to ries—with the sec ond worst score. The
Yukon—which was tied with the North west Ter ri to ries for the worst score on this ques tion last
year—has improved to the mid dle of the third quintile.
Brit ish Colum bia’s score on this ques tion fell into the unat trac tive fourth quintile this year join ing
Alaska, West ern Aus tra lia, Vic to ria, New South Wales, Queensland, Peru, Cyprus, Bolivia, East
Timor, Timor Gap (JPDA), and Ban gla desh.
Fra ser In sti tute Global Pe tro leum Sur vey, 2013 85www.fraserinstitute.org

Duplication and inconsistency of regulations
Soma li land, Uzbekistan, Iran, Ven e zuela, and Ukraine all have poor fifth quintile scores this year
on the ques tion per tain ing to reg u la tory dupli ca tion and incon sis tency (fig ure 33). Sev en teen
juris dic tions includ ing Que bec, three Rus sia juris dic tions (Other, East ern Sibe ria, and Off -
shore—Sakhalin), four Argen tine prov inces (Santa Cruz, Tierra del Fuego, Salta, and Chubut), as
well as India, Uganda, Iraq, and Indo ne sia have unde sir able fourth quintile scores.
Juris dic tions with no neg a tive responses on this issue this year are Den mark, Faroe Islands, Geor -
gia, Malta, and Neth er lands. Twenty-nine juris dic tions have first quintile scores on the reg u la tory
dupli ca tion ques tion. Remark ably, 11 of those juris dic tions are in the Cana dian, US, and Aus tra -
lian fed er a tions where one might expect dupli ca tion and incon sis tency between fed eral and
state/pro vin cial laws and reg u la tions to be a sig nif i cant obsta cle to invest ment.
Legal system fairness and transparency
A total of 31 juris dic tions have unat trac tive fifth quintile scores on this issue (see fig ure 34). Sur vey
respon dents indi cated that legal sys tem fair ness is of major con cern in Ukraine, Uzbekistan, Rus sia
(East ern Sibe ria and Off shore Arc tic), Kyrgyzstan, Chad, Niger, Repub lic of Congo (Brazzaville),
Soma li land, and Argen tina—Salta. Other juris dic tions among the group of 31 with most unat trac -
tive fifth quintile scores on the legal sys tem fair ness and trans par ency ques tion are four Argen tine
prov inces (Mendoza, Tierra del Fuego, Neuquen, and Chubut), Ecua dor, South Sudan, Libya,
Rus sia—Other, Ven e zuela, Iraq, Iran, Equatorial Guinea, and Nigeria.
A fair and sta ble legal sys tem is essen tial for the devel op ment of the upstream oil and gas indus try.
Oil and gas explor ers and devel op ers often spend years invest ing in explo ra tion before real iz ing
any return on their invest ment. They need to be cer tain that if they dis cover and develop resources
in accor dance with the exist ing laws and reg u la tions, they will ben e fit more or less as planned, sub -
ject, of course, to market conditions.
86 Fra ser In sti tute Global Pe tro leum Sur vey, 2013
www.fraserinstitute.org

Fig ure 19: Fis cal terms
0% 20% 40% 60% 80% 100%
Ivory CoastBahrain
Papua New GuineaJapanIsrael
TunisiaPeru
KenyaUS Offshore – Gulf of Mexico
US – MichiganCameroonSuriname
QatarCyprus
TanzaniaUS – Utah
US – New MexicoUS – Pennsylvania
OmanLebanon
TurkeyUS – Illinois
DenmarkUnited Kingdom
Norway – North SeaUnited Kingdom – North Sea
PakistanNorway
MadagascarUruguay
CA – Nova ScotiaGhana
CA – Newfoundland & LabradorAU – Queensland
ThailandSpain – Onshore
South AfricaCA – British Columbia
PolandUS – Louisiana
GreenlandUS – OhioColombia
NetherlandsChile
US – West VirginiaMozambique
EthiopiaMorocco
IrelandSpain – Offshore
US – MontanaNetherlands – North Sea
US – AlabamaPhilippinesCA – Yukon
AU – VictoriaCA – Northwest Territories
NamibiaAU – Tasmania
New ZealandAU – Western Australia
MaliSeychelles
US – WyomingCA – Alberta
US – ArkansasFaroe Islands
BotswanaAustralia – Offshore
CA – ManitobaUS – Kansas
US – TexasAU – Northern Territory
US – MississippiUS – Oklahoma
AU – South AustraliaUS – North Dakota
CA – Saskatchewan Mild deterrent toinvestment
Strong deterrent toinvestment
Would not pursueinvestment due tothis factor
0% 20% 40% 60% 80% 100%
VenezuelaBolivia
Argentina – Tierra del FuegoEcuador
IranArgentina – Chubut
Argentina – MendozaArgentina – Santa Cruz
Argentina – NeuquenRussia – Eastern Siberia
LibyaRussia – other
KazakhstanAlgeria
Argentina – SaltaIraq
Russia – Offshore ArcticUS – California
Brazil – Offshore presalt area profit sharing contractsCambodia
SyriaUkraineNigeria
BangladeshCA – Quebec
Russia – Offshore SakhalinIndonesia
KuwaitUS – New York
Brazil – Offshore concession contractsHungary
ChinaChad
South SudanUS Offshore – Pacific
Timor Gap (JPDA)KyrgyzstanUzbekistan
IndiaYemen
US – AlaskaTurkmenistan
Democratic Republic of the Congo (Kinshasa)Bulgaria
US Offshore – AlaskaEquatorial Guinea
MyanmarEgypt
RomaniaFrance
UgandaCA – New Brunswick
GuatemalaAzerbaijan
AU – New South WalesMalaysia
AngolaNiger
SomalilandMauritania
GreeceVietnam
ItalyRepublic of the Congo (Brazzaville)
GeorgiaGabon
US – ColoradoBrunei
GermanyTrinidad and Tobago
GuyanaJordan
United Arab EmiratesFrench Guiana
Brazil – Onshore concession contractsEast Timor
MaltaAlbania
Mild deterrent toinvestment
Strong deterrent toinvestment
Would not pursueinvestment due tothis factor

Fig ure 20: Tax a tion in general
0% 20% 40% 60% 80% 100%
United Arab EmiratesAlbania
Faroe IslandsRepublic of the Congo (Brazzaville)
CA – New BrunswickMalta
GreenlandAU – Queensland
NigerIvory Coast
NetherlandsBahrain
MauritaniaOman
MozambiqueGhanaCyprus
QatarUS Offshore – Alaska
AU – VictoriaAU – Western Australia
Australia – OffshorePeru
US – MichiganAU – Northern Territory
MadagascarUS – Illinois
JordanLebanon
US – AlaskaKenya
AU – New South WalesNetherlands – North Sea
US – ColoradoPhilippines
PakistanThailand
TurkeySpain – Onshore
ColombiaUS – Pennsylvania
East TimorPoland
CA – Nova ScotiaUS – Louisiana
CA – British ColumbiaCA – Newfoundland & Labrador
AU – TasmaniaBotswanaUS – Ohio
IrelandAU – South Australia
South AfricaSpain – Offshore
US Offshore – Gulf of MexicoUruguayNamibiaMorocco
New ZealandUS – Montana
CA – ManitobaUS – New Mexico
CA – AlbertaUS – West Virginia
US – KansasSeychelles
US – ArkansasUS – Utah
MaliUS – Alabama
CA – Northwest TerritoriesChile
CA – YukonUS – MississippiUS – Wyoming
US – North DakotaUS – Oklahoma
US – Texas Mild deterrent toinvestment
Strong deterrent toinvestment
Would not pursueinvestment due tothis factor
0% 20% 40% 60% 80% 100%
VenezuelaUzbekistan
Argentina – Santa CruzBolivia
Argentina – ChubutArgentina – Salta
Argentina – NeuquenEcuador
Argentina – Tierra del FuegoIran
Russia – otherRussia – Eastern Siberia
Russia – Offshore ArcticArgentina – Mendoza
KazakhstanIndonesia
FranceUkraine
CA – QuebecBrazil – Offshore presalt area profit sharing contracts
Russia – Offshore SakhalinTurkmenistan
KyrgyzstanKuwait
Brazil – Offshore concession contractsLibya
HungaryAzerbaijanCambodia
US – New YorkNigeria
ChadUS – California
AlgeriaChina
IraqSyria
JapanFrench Guiana
BangladeshBrazil – Onshore concession contracts
MalaysiaItaly
IndiaSouth Sudan
GuatemalaMyanmarGermany
NorwayDemocratic Republic of the Congo (Kinshasa)
UgandaGreece
Equatorial GuineaBulgaria
TunisiaTimor Gap (JPDA)
GuyanaBrunei
GeorgiaEthiopia
SomalilandAngola
VietnamRomania
SurinameGabonYemen
TanzaniaNorway – North Sea
EgyptUnited Kingdom – North Sea
DenmarkCameroon
United KingdomIsrael
US Offshore – PacificPapua New Guinea
Trinidad and Tobago
Mild deterrent toinvestment
Strong deterrentto investment
Would not pursueinvestment due tothis factor

Fig ure 21: Envi ron men tal reg u la tions
0% 20% 40% 60% 80% 100%
CA – QuebecEcuador
US – CaliforniaFrance
US – New YorkUS Offshore – Pacific
Spain – OffshoreBrazil – Offshore presalt area profit sharing …
HungaryBrazil – Offshore concession contracts
US Offshore – AlaskaGuatemala
AU – New South WalesVenezuela
KyrgyzstanPeru
Spain – OnshoreGermany
US – PennsylvaniaBrazil – Onshore concession contracts
US – AlaskaIsrael
CambodiaAU – QueenslandTimor Gap (JPDA)
IranAU – Tasmania
Russia – Offshore ArcticUzbekistan
ItalyRussia – Eastern Siberia
BoliviaUS – Colorado
US Offshore – Gulf of MexicoCA – New Brunswick
GreenlandSomaliland
AU – VictoriaAustralia – Offshore
JapanBangladesh
NigeriaIndonesia
GreeceColombia
Argentina – MendozaBulgaria
KazakhstanAU – Western Australia
US – MichiganCA – British Columbia
UkraineArgentina – Salta
Russia – Offshore SakhalinIraq
GuyanaTurkmenistan
French GuianaIreland
Russia – otherArgentina – Neuquen
IndiaNorway – North Sea
ChileRomania
KuwaitPapua New Guinea
ChadJordan
New ZealandPoland
US – OhioArgentina – Tierra del Fuego
US – UtahSouth Africa
US – New MexicoArgentina – Santa Cruz
Democratic Republic of the Congo (Kinshasa)Argentina – Chubut
Mild deterrent toinvestment
Strong deterrent toinvestment
Would not pursueinvestment due tothis factor
0% 20% 40% 60% 80% 100%
United Kingdom – North SeaCA – Northwest Territories
US – IllinoisSouth Sudan
GabonLibya
Netherlands – North SeaAU – South Australia
ChinaNetherlands
PakistanUruguay
East TimorSyria
AlbaniaPhilippines
AlgeriaNorway
US – LouisianaMadagascar
Republic of the Congo (Brazzaville)AU – Northern Territory
CyprusMyanmar
United KingdomTrinidad and Tobago
MauritaniaCA – Yukon
MaltaVietnam
NigerUS – West Virginia
CA – AlbertaSuriname
BahrainYemen
EgyptEquatorial Guinea
TunisiaDenmark
AngolaUS – Wyoming
CA – Nova ScotiaMorocco
BruneiUganda
MalaysiaTanzania
MozambiqueUS – Montana
ThailandCA – Manitoba
GhanaTurkey
AzerbaijanEthiopia
Ivory CoastLebanon
United Arab EmiratesQatar
CameroonFaroe Islands
US – AlabamaCA – Newfoundland & Labrador
GeorgiaOman
NamibiaUS – Mississippi
KenyaSeychelles
US – KansasUS – Texas
US – ArkansasMali
BotswanaUS – North Dakota
US – OklahomaCA – Saskatchewan
Mild deterrent toinvestment
Strong deterrent toinvestment
Would not pursueinvestment due to thisfactor

Fig ure 22: Uncer tainty con cern ing the admin is tra tion, inter pre ta tionand enforce ment of reg u la tions
0% 20% 40% 60% 80% 100%
VenezuelaBolivia
Russia – Eastern SiberiaKyrgyzstan
Argentina – SaltaRussia – other
EcuadorCA – Quebec
Russia – Offshore ArcticUkraine
Russia – Offshore SakhalinIranIraq
Argentina – ChubutTurkmenistan
Argentina – Tierra del FuegoArgentina – MendozaArgentina – Neuquen
KazakhstanUzbekistan
Argentina – Santa CruzSouth Sudan
AlgeriaLibya
US – New YorkSyria
IndonesiaFrance
Spain – OffshoreNigeria
CambodiaDemocratic Republic of the Congo (Kinshasa)
Spain – OnshoreBrazil – Offshore presalt area profit sharing contracts
BulgariaBangladesh
IndiaPapua New Guinea
US – CaliforniaTimor Gap (JPDA)
YemenChad
GreeceMalta
MyanmarSomaliland
US Offshore – PacificRepublic of the Congo (Brazzaville)
LebanonItaly
Brazil – Offshore concession contractsEgypt
HungaryMadagascar
VietnamUS – Colorado
GuatemalaAlbania
PakistanAngola
NigerIsraelPeru
UgandaGreenland
French GuianaChina
JordanKuwait
RomaniaEquatorial Guinea
AU – New South WalesUS – Pennsylvania
AzerbaijanCyprus
EthiopiaUS – Michigan
Ghana
Mild deterrent toinvestment
Strong deterrent toinvestment
Would not pursueinvestment due tothis factor
0% 20% 40% 60% 80% 100%
Brazil – Onshore concession contractsMalaysia
PhilippinesAU – Tasmania
CA – New BrunswickUS Offshore – Alaska
US Offshore – Gulf of MexicoEast Timor
JapanMauritania
GabonCameroon
KenyaUS – New Mexico
TunisiaSuriname
AU – QueenslandTanzania
PolandGeorgia
MozambiqueIreland
GermanyBrunei
US – OhioMali
South AfricaUS – Alaska
TurkeyUS – Illinois
BahrainAU – Victoria
Ivory CoastGuyana
ColombiaThailand
US – UtahAustralia – Offshore
US – WyomingUS – Montana
UruguayMorocco
New ZealandUnited Arab Emirates
ChileTrinidad and Tobago
US – LouisianaCA – Nova ScotiaUnited Kingdom
Norway – North SeaUnited Kingdom – North Sea
SeychellesCA – British Columbia
US – West VirginiaQatar
NetherlandsUS – Alabama
DenmarkNamibia
OmanNorway
CA – AlbertaCA – Northwest Territories
CA – YukonUS – Mississippi
AU – Western AustraliaNetherlands – North Sea
US – KansasCA – Newfoundland & Labrador
AU – South AustraliaUS – Arkansas
US – North DakotaAU – Northern Territory
US – TexasCA – Manitoba
US – OklahomaCA – Saskatchewan
Faroe IslandsBotswana
Mild deterrent toinvestment
Strong deterrentto investment
Would not pursueinvestment due tothis factor

Fig ure 23: Cost of reg u la tory com pli ance
0% 20% 40% 60% 80% 100%
CA – QuebecRussia – Offshore Arctic
US Offshore – AlaskaVenezuela
EcuadorIran
UzbekistanBulgaria
BoliviaUS – California
US Offshore – PacificGreece
Russia – otherKazakhstan
US – New YorkGreenland
Russia – Eastern SiberiaRussia – Offshore Sakhalin
UkraineBrazil – Offshore presalt area profit sharing …
GuatemalaBrazil – Onshore concession contracts
IndonesiaBrazil – Offshore concession contracts
PeruArgentina – Chubut
US Offshore – Gulf of MexicoCambodia
Spain – OffshoreArgentina – Santa CruzAU – New South Wales
US – AlaskaCA – New Brunswick
French GuianaArgentina – Neuquen
JapanSpain – Onshore
US – PennsylvaniaFrance
Argentina – MendozaTurkmenistan
LibyaAlgeria
CA – Northwest TerritoriesCA – Yukon
IndiaRepublic of the Congo (Brazzaville)
IraqArgentina – Tierra del Fuego
VietnamUS – Michigan
MyanmarTimor Gap (JPDA)
SyriaArgentina – Salta
US – ColoradoHungary
South SudanNigeria
RomaniaPapua New Guinea
ItalyAU – Queensland
AU – VictoriaGermany
BangladeshUS – Illinois
AngolaEgypt
CA – British ColumbiaAzerbaijanColombia
KyrgyzstanSuriname
Australia – OffshoreSouth Africa
GuyanaAU – Western Australia
Mild deterrent toinvestment
Strong deterrentto investment
Would notpursueinvestment dueto this factor
0% 20% 40% 60% 80% 100%
AU – TasmaniaDemocratic Republic of the Congo (Kinshasa)
EthiopiaIsrael
LebanonUS – New Mexico
MozambiqueMalaysia
New ZealandAU – South Australia
PolandChina
US – UtahEast Timor
BahrainUS – West Virginia
United KingdomSomaliland
CA – AlbertaPakistan
AU – Northern TerritoryCyprus
Norway – North SeaThailand
AlbaniaMauritania
US – LouisianaPhilippinesCameroon
GhanaMadagascar
UgandaUnited Kingdom – North Sea
US – OhioGabon
MaltaChad
Equatorial GuineaMorocco
Trinidad and TobagoYemenKuwait
Ivory CoastTanzania
CA – Newfoundland & LabradorNetherlands
UruguayUS – Wyoming
NamibiaNorwayTunisiaKenya
CA – Nova ScotiaJordanBrunei
US – AlabamaIreland
CA – ManitobaTurkey
GeorgiaNiger
Netherlands – North SeaMali
SeychellesUS – Texas
US – KansasDenmark
US – North DakotaQatar
United Arab EmiratesUS – Montana
CA – SaskatchewanUS – Oklahoma
OmanUS – Mississippi
ChileFaroe Islands
US – ArkansasBotswana
Mild deterrent toinvestment
Strong deterrentto investment
Would not pursueinvestment due tothis factor

Fig ure 24: Uncer tainty regard ing pro tected areas
0% 20% 40% 60% 80% 100%
Argentina – NeuquenPhilippinesKazakhstan
Faroe IslandsIreland
MadagascarGabon
East TimorChile
Argentina – Tierra del FuegoSuriname
Trinidad and TobagoSyria
Papua New GuineaThailand
Russia – otherNigeria
SeychellesSouth Sudan
EgyptTanzania
TurkmenistanMyanmar
PolandPakistan
ChinaDemocratic Republic of the Congo (Kinshasa)
Republic of the Congo (Brazzaville)Iraq
AngolaNorway – North Sea
GuyanaAzerbaijan
LibyaNetherlands – North Sea
US – North DakotaKenya
TunisiaNamibia
CA – Newfoundland & LabradorUS – Texas
MozambiqueUS – OklahomaCA – ManitobaUS – Alabama
DenmarkKyrgyzstan
IsraelUnited Kingdom – North Sea
MalaysiaCA – Saskatchewan
GhanaVietnam
US – ArkansasNiger
CyprusUS – Kansas
US – West VirginiaUS – Mississippi
GeorgiaMali
MauritaniaMorocco
CA – Nova ScotiaBotswana
ChadEthiopia
AlgeriaIvory Coast
BahrainEquatorial Guinea
OmanQatar
JordanBrunei
YemenAlbania
United Arab EmiratesKuwait
Mild deterrent toinvestment
Strong deterrent toinvestment
Would not pursueinvestment due tothis factor
0% 20% 40% 60% 80% 100%
AU – New South WalesCA – Quebec
US – New YorkUS – California
EcuadorUS Offshore – PacificUS Offshore – Alaska
AU – QueenslandUS – Colorado
GuatemalaUS – Alaska
GreeceAustralia – Offshore
PeruBolivia
US – New MexicoUS – Utah
CA – New BrunswickItaly
US – MichiganBrazil – Offshore concession contracts
FranceUS – Pennsylvania
AU – TasmaniaAU – Victoria
Timor Gap (JPDA)Greenland
Brazil – Onshore concession contractsFrench GuianaUS – Wyoming
AU – Western AustraliaColombia
VenezuelaRussia – Eastern Siberia
Argentina – SaltaBrazil – Offshore presalt area profit sharing …
CA – British ColumbiaIran
CA – Northwest TerritoriesAU – South Australia
Argentina – MendozaSpain – Offshore
IndiaUS – Illinois
MaltaSpain – Onshore
US Offshore – Gulf of MexicoBulgaria
CA – YukonNew Zealand
Argentina – Santa CruzRussia – Offshore Arctic
UzbekistanUS – Montana
AU – Northern TerritoryIndonesia
NetherlandsJapan
HungaryCA – Alberta
RomaniaUkraine
Argentina – ChubutUnited Kingdom
UruguayGermany
CameroonUS – Louisiana
Russia – Offshore SakhalinUganda
CambodiaSomaliland
South AfricaTurkey
NorwayBangladesh
LebanonUS – Ohio
Mild deterrent toinvestment
Strong deterrentto investment
Would not pursueinvestment due tothis factor

Fig ure 25: Trade bar ri ers
0% 20% 40% 60% 80% 100%
MoroccoMauritania
GermanyUruguay
JapanGeorgia
TurkeyKyrgyzstan
OmanUS – California
NamibiaColombia
Trinidad and TobagoKuwait
United KingdomBrunei
US – MichiganHungary
MaliSomaliland
GuyanaNorway
PeruUS – Alaska
Timor Gap (JPDA)Norway – North Sea
CA – New BrunswickAU – Tasmania
GreenlandUnited Arab EmiratesCA – British Columbia
AU – New South WalesUS Offshore – Gulf of Mexico
IrelandCA – Nova Scotia
Australia – OffshoreFaroe Islands
United Kingdom – North SeaUS – Illinois
Spain – OffshoreQatar
SeychellesAU – Victoria
US – OhioNetherlands
Netherlands – North SeaUS – Colorado
CA – AlbertaCA – Newfoundland & Labrador
US – PennsylvaniaAU – Queensland
US – UtahChile
US Offshore – AlaskaUS – Kansas
New ZealandSpain – Onshore
US – LouisianaUS – Texas
AU – Northern TerritoryDenmark
US – WyomingCA – Manitoba
US – New MexicoUS – West Virginia
AU – Western AustraliaUS – North Dakota
CA – SaskatchewanUS – OklahomaUS – Mississippi
US – MontanaCA – Northwest Territories
CA – YukonUS – AlabamaUS – Arkansas
AU – South AustraliaMalta
BotswanaJordan
Mild deterrent to investment
Strong deterrent to investment
Would not pursue investment due to this factor
0% 20% 40% 60% 80% 100%
IranRussia – Offshore Arctic
VenezuelaRussia – Eastern Siberia
Argentina – NeuquenArgentina – Salta
Russia – Offshore SakhalinRussia – other
UzbekistanArgentina – Tierra del Fuego
BoliviaArgentina – Mendoza
Argentina – ChubutArgentina – Santa Cruz
EcuadorSyria
ChinaMyanmar
KazakhstanUkraine
LibyaGuatemala
TurkmenistanIndonesia
VietnamIndia
IraqBangladesh
CambodiaEgypt
GabonSouth Sudan
AngolaRepublic of the Congo (Brazzaville)
AlgeriaNigeria
Brazil – Onshore concession contractsChad
Brazil – Offshore presalt area profit sharing …Lebanon
Democratic Republic of the Congo (Kinshasa)Uganda
Brazil – Offshore concession contractsEquatorial Guinea
GreecePakistanMalaysia
Papua New GuineaEast Timor
French GuianaPhilippines
NigerGhanaYemen
US – New YorkCameroon
PolandEthiopia
Ivory CoastSouth Africa
MozambiqueMadagascar
ThailandBahrain
TanzaniaCyprus
RomaniaAzerbaijan
ItalyTunisia
US Offshore – PacificCA – Quebec
IsraelKenya
FranceAlbania
BulgariaSuriname
Mild deterrent toinvestment
Strong deterrent toinvestment
Would not pursueinvestment due tothis factor

Fig ure 26: Labor reg u la tions and employ ment agree ments
0% 20% 40% 60% 80% 100%
CA – British ColumbiaCameroon
US – IllinoisAU – South Australia
SurinameMozambique
OmanMalta
AzerbaijanThailand
GuatemalaPakistan
CA – YukonGermanyLebanon
AU – Northern TerritorySpain – Offshore
Trinidad and TobagoPhilippines
US – PennsylvaniaColombia
US – CaliforniaIreland
CA – Nova ScotiaUS Offshore – Pacific
EthiopiaEast Timor
CyprusPoland
AlbaniaUnited Kingdom – North Sea
NetherlandsTurkey
TanzaniaDenmark
Spain – OnshoreFaroe Islands
GeorgiaUnited Kingdom
KenyaNew Zealand
KyrgyzstanMorocco
US – ColoradoCA – Alberta
United Arab EmiratesKuwait
CA – Newfoundland & LabradorCA – Manitoba
MauritaniaIsrael
Netherlands – North SeaUS – West Virginia
MaliSeychelles
QatarUS – New Mexico
US – OhioNamibia
ChileUS – Utah
US Offshore – Gulf of MexicoUS – North Dakota
US – AlaskaCA – Saskatchewan
US – LouisianaUS – Montana
US – KansasUS – Alabama
BahrainUS – OklahomaUS – Wyoming
US – TexasUS – Mississippi
US – ArkansasUS Offshore – Alaska
BotswanaJordan
Mild deterrent toinvestment
Strong deterrentto investment
Would not pursueinvestment due tothis factor
0% 20% 40% 60% 80% 100%
VenezuelaArgentina – Salta
Argentina – ChubutIran
Argentina – NeuquenArgentina – Tierra del Fuego
BoliviaArgentina – Santa Cruz
Russia – Offshore SakhalinArgentina – Mendoza
Russia – Offshore ArcticEcuador
Timor Gap (JPDA)Uzbekistan
BulgariaNigeria
Australia – OffshoreCA – Quebec
LibyaNorway – North Sea
BangladeshGabon
IraqIndonesia
Brazil – Onshore concession contractsAngola
EgyptFrance
SyriaIndia
Brazil – Offshore presalt area profit sharing …Chad
French GuianaYemen
Papua New GuineaJapan
UgandaAlgeria
Brazil – Offshore concession contractsRomania
KazakhstanHungary
Russia – otherMyanmar
South SudanVietnam
TunisiaAU – Western Australia
BruneiAU – New South Wales
Russia – Eastern SiberiaNorway
US – New YorkItaly
CA – Northwest TerritoriesGreenland
GuyanaUkraine
AU – VictoriaSouth Africa
Republic of the Congo (Brazzaville)UruguayMalaysia
PeruAU – TasmaniaTurkmenistan
ChinaUS – Michigan
GreeceAU – QueenslandEquatorial Guinea
GhanaCambodia
NigerSomalilandIvory Coast
MadagascarCA – New Brunswick
Democratic Republic of the Congo (Kinshasa) Mild deterrent toinvestment
Strong deterrentto investment
Would not pursueinvestment due tothis factor

Fig ure 27: Qual ity of infra struc ture
0% 20% 40% 60% 80% 100%
KyrgyzstanRussia – Offshore ArcticRussia – Eastern Siberia
GreenlandSouth Sudan
SomalilandPapua New Guinea
Democratic Republic of the Congo (Kinshasa)Chad
Russia – otherRussia – Offshore Sakhalin
MyanmarBotswana
UgandaKenya
KazakhstanMadagascar
CambodiaIraq
CA – Northwest TerritoriesUzbekistan
MaliEast Timor
BangladeshBolivia
IranEthiopia
TanzaniaSyria
NigeriaYemen
MozambiqueIndonesia
GuatemalaGabon
US – AlaskaLibyaNiger
MauritaniaTurkmenistan
IndiaVenezuela
VietnamBrazil – Onshore concession contracts
CA – QuebecEcuador
GhanaUS Offshore – Alaska
CameroonPeru
UkraineAngola
Republic of the Congo (Brazzaville)Philippines
Timor Gap (JPDA)Pakistan
CA – Newfoundland & LabradorBrazil – Offshore presalt area profit sharing …
Ivory CoastBulgariaUruguay
Argentina – SaltaCyprus
Equatorial GuineaAlgeria
ColombiaCA – New Brunswick
CA – YukonGreece
French GuianaGuyana
SurinameRomania
EgyptNamibia
AzerbaijanChina
Lebanon Mild deterrent toinvestment
Strong deterrentto investment
Would notpursue investmentdue to this factor
0% 20% 40% 60% 80% 100%
CA – Nova ScotiaSeychelles
Argentina – Tierra del FuegoBrazil – Offshore concession contracts
MoroccoAU – Northern TerritoryArgentina – Santa Cruz
ThailandAU – Western Australia
US – New YorkUS – Montana
PolandAlbania
Argentina – MendozaUS – Pennsylvania
New ZealandIreland
ChileAU – Queensland
TurkeyArgentina – Chubut
South AfricaUS – North Dakota
US Offshore – PacificAU – Tasmania
ItalyOmanIsrael
GeorgiaTunisia
AU – New South WalesAustralia – Offshore
Argentina – NeuquenTrinidad and Tobago
US – ColoradoMalaysia
US – West VirginiaCA – British Columbia
AU – South AustraliaFaroe Islands
HungaryUS – MichiganUS – Wyoming
US – OhioUS Offshore – Gulf of Mexico
US – ArkansasBruneiFrance
US – UtahDenmark
JordanUnited Arab Emirates
US – IllinoisNorway
Spain – OffshoreUnited Kingdom
US – LouisianaUS – New Mexico
GermanyUS – California
AU – VictoriaSpain – Onshore
CA – AlbertaCA – Manitoba
CA – SaskatchewanBahrain
Norway – North SeaQatar
US – KansasUS – Oklahoma
United Kingdom – North SeaUS – Alabama
NetherlandsUS – Mississippi
US – TexasMalta
Netherlands – North SeaJapan
Kuwait Mild deterrent toinvestment
Strong deterrent toinvestment
Would not pursueinvestment due tothis factor

Fig ure 28: Geo log i cal data base
0% 20% 40% 60% 80% 100%
United Arab EmiratesArgentina – Chubut
PhilippinesTrinidad and Tobago
MoroccoBrazil – Offshore concession contractsBrazil – Onshore concession contracts
Brazil – Offshore presalt area profit sharing …Israel
FranceThailand
US – West VirginiaPeru
Argentina – NeuquenUS – Michigan
OmanUS – Pennsylvania
PakistanPoland
BotswanaJordan
ColombiaUS – Ohio
Timor Gap (JPDA)US – Montana
QatarCA – Newfoundland & Labrador
US – AlaskaGermanyHungary
US – IllinoisFaroe Islands
CA – Northwest TerritoriesJapan
AU – QueenslandUS – California
MaltaUS – Colorado
BahrainCA – New Brunswick
IrelandCA – Nova Scotia
US Offshore – PacificKuwait
US – North DakotaUS – New Mexico
GeorgiaUnited Kingdom
US – WyomingUS – Mississippi
US – TexasUS Offshore – Alaska
AU – Northern TerritoryUS – Arkansas
US Offshore – Gulf of MexicoUnited Kingdom – North Sea
CA – YukonAU – South Australia
CA – ManitobaUS – Utah
AU – VictoriaUS – Louisiana
Netherlands – North SeaNetherlandsUS – Kansas
US – AlabamaUS – Oklahoma
AU – New South WalesDenmark
Norway – North SeaNew Zealand
Australia – OffshoreAU – Western Australia
CA – AlbertaNorway
CA – British ColumbiaCA – Saskatchewan
AU – Tasmania
Mild deterrent toinvestment
Strong deterrent toinvestment
Would not pursueinvestment due tothis factor
0% 20% 40% 60% 80% 100%
Russia – Offshore ArcticSouth Sudan
UkraineTurkmenistan
ChadSomalilandUzbekistan
BangladeshCambodiaMyanmar
UgandaRussia – other
SyriaGuyana
IraqKazakhstan
RomaniaBoliviaCyprus
Democratic Republic of the Congo (Kinshasa)Kenya
GuatemalaLibyaIndia
ChinaKyrgyzstan
MadagascarNiger
EcuadorUruguay
IndonesiaFrench Guiana
East TimorRepublic of the Congo (Brazzaville)
Equatorial GuineaTanzania
Russia – Eastern SiberiaIran
MozambiqueVenezuela
VietnamAzerbaijan
NigeriaPapua New Guinea
TurkeyAlgeria
GreenlandEthiopia
GhanaMali
SeychellesGreeceTunisiaYemen
CA – QuebecSouth Africa
BulgariaSuriname
US – New YorkCameroon
AngolaSpain – Onshore
Ivory CoastGabon
MalaysiaMauritania
Argentina – SaltaEgypt
Russia – Offshore SakhalinItaly
Spain – OffshoreArgentina – Mendoza
Argentina – Santa CruzArgentina – Tierra del Fuego
LebanonChile
BruneiAlbania
Namibia
Mild deterrent toinvestment
Strong deterrent toinvestment
Would not pursueinvestment due tothis factor

Fig ure 29: Labor avail abil ity
0% 20% 40% 60% 80% 100%
Republic of the Congo (Brazzaville)Kyrgyzstan
NigerSomaliland
South SudanUganda
TurkmenistanDemocratic Republic of the Congo (Kinshasa)
ChadBangladeshMauritaniaUzbekistan
Papua New GuineaEast TimorSeychelles
GuyanaAngola
IranSyriaIraq
MyanmarBotswana
MaliMozambique
Timor Gap (JPDA)KenyaLibya
Equatorial GuineaGreenlandGuatemalaKazakhstan
MadagascarEcuador
GabonEthiopia
CA – QuebecCameroon
Ivory CoastTanzania
SurinameBoliviaYemen
French GuianaCA – Northwest Territories
AlgeriaNamibiaLebanonUruguay
CA – YukonVenezuelaCambodiaAzerbaijan
Australia – OffshoreGeorgia
BruneiFaroe Islands
IndiaVietnam
GhanaBulgaria
AU – Western AustraliaBrazil – Onshore concession contracts
Argentina – SaltaAU – Tasmania
IndonesiaRussia – Offshore Arctic
ChinaEgypt
NigeriaPakistan
AU – Northern TerritoryUS – North Dakota
AU – QueenslandCA – New Brunswick
PeruTunisia
US – New YorkPhilippines
Mild deterrent toinvestment
Strong deterrentto investment
Would not pursueinvestment due tothis factor
0% 20% 40% 60% 80% 100%
Russia – Offshore SakhalinUS Offshore – Pacific
AU – VictoriaAU – New South Wales
CyprusSouth Africa
OmanAlbania
US – AlaskaRussia – other
Brazil – Offshore concession contractsChile
AU – South AustraliaMaltaIsrael
RomaniaSpain – Onshore
MoroccoArgentina – Mendoza
Spain – OffshoreArgentina – Tierra del Fuego
TurkeyJordan
Brazil – Offshore presalt area profit …US – Montana
UkraineMalaysia
US – MichiganCA – Nova Scotia
New ZealandIreland
ThailandArgentina – Neuquen
CA – Newfoundland & LabradorRussia – Eastern Siberia
CA – British ColumbiaUnited Arab Emirates
US – OhioUS – Pennsylvania
KuwaitArgentina – Chubut
US – UtahTrinidad and Tobago
US – West VirginiaArgentina – Santa Cruz
US Offshore – AlaskaItaly
GreeceCA – Alberta
ColombiaUS – California
BahrainFrance
CA – SaskatchewanQatar
DenmarkUS – WyomingCA – Manitoba
GermanyNorway – North Sea
NetherlandsJapan
United KingdomUS – Alabama
US Offshore – Gulf of MexicoUS – Illinois
US – New MexicoPoland
United Kingdom – North SeaNorway
US – ColoradoUS – Arkansas
US – KansasUS – Mississippi
Netherlands – North SeaUS – Texas
HungaryUS – OklahomaUS – Louisiana
Mild deterrent toinvestment
Strong deterrent toinvestment
Would not pursueinvestment due tothis factor

Fig ure 30: Dis puted land claims
0% 20% 40% 60% 80% 100%
SomalilandCA – Northwest Territories
EcuadorPapua New Guinea
South SudanPeru
CyprusBolivia
East TimorCA – British Columbia
Timor Gap (JPDA)US – AlaskaBangladesh
AU – Western AustraliaEthiopia
AU – VictoriaAU – New South Wales
NigeriaAU – Queensland
KyrgyzstanChad
GuatemalaAU – Northern Territory
IraqColombia
VenezuelaGreece
IndonesiaIran
Argentina – SaltaIndia
Argentina – NeuquenMyanmar
CA – YukonAU – Tasmania
Russia – Eastern SiberiaRussia – Offshore Arctic
UkraineMali
NigerCA – QuebecNew ZealandCA – AlbertaMadagascar
KenyaMozambique
CA – New BrunswickAU – South Australia
RomaniaRussia – Offshore Sakhalin
PhilippinesUzbekistanCambodia
Argentina – MendozaDemocratic Republic of the Congo (Kinshasa)
TurkmenistanArgentina – Chubut
GhanaUS – New YorkRussia – other
Republic of the Congo (Brazzaville)Syria
Argentina – Tierra del FuegoGuyana
LibyaYemenFrance
TanzaniaArgentina – Santa Cruz
Brazil – Onshore concession contractsSouth Africa
JapanFrench Guiana
VietnamGabon
UgandaIsrael
CA – Saskatchewan
Mild deterrent toinvestment
Strong deterrent toinvestment
Would not pursueinvestment due tothis factor
0% 20% 40% 60% 80% 100%
US – ColoradoMorocco
ChileSuriname
CA – ManitobaPakistan
US – West VirginiaBulgaria
GreenlandHungary
EgyptLebanon
MauritaniaUS – New Mexico
CameroonItaly
Trinidad and TobagoIvory Coast
ChinaUS – Montana
Australia – OffshoreKazakhstanAzerbaijan
US Offshore – PacificJordanAngolaAlbaniaAlgeria
US – UtahMalaysia
Equatorial GuineaTunisia
ThailandUruguay
US Offshore – AlaskaNamibia
US – WyomingBruneiMalta
Spain – OnshoreTurkey
BotswanaBrazil – Offshore presalt area profit sharing …
US – PennsylvaniaUS – California
SeychellesBrazil – Offshore concession contracts
KuwaitUS – Louisiana
US – OhioQatar
PolandCA – Nova Scotia
GermanyCA – Newfoundland & Labrador
US Offshore – Gulf of MexicoUnited Arab Emirates
OmanUS – Oklahoma
Faroe IslandsUS – North Dakota
US – TexasNetherlands – North Sea
Spain – OffshoreNetherlands
US – MichiganBahrain
United KingdomUS – Mississippi
IrelandUS – Illinois
DenmarkNorway
Norway – North SeaUS – Kansas
United Kingdom – North SeaUS – AlabamaUS – Arkansas
Georgia Mild deterrent toinvestment
Strong deterrent toinvestment
Would not pursueinvestment due tothis factor

Fig ure 31: Polit i cal sta bil ity
0% 20% 40% 60% 80% 100%
KyrgyzstanVenezuela
LibyaBolivia
SyriaIraqIran
Argentina – SaltaEgypt
YemenArgentina – Tierra del Fuego
EcuadorArgentina – Mendoza
South SudanChad
Argentina – ChubutUkraineAlgeria
Argentina – NeuquenSomaliland
Argentina – Santa CruzBangladesh
Republic of the Congo (Brazzaville)Greece
East TimorNigeria
UzbekistanPakistan
TunisiaDemocratic Republic of the Congo (Kinshasa)
Papua New GuineaKenya
Russia – Offshore ArcticIvory Coast
Russia – Eastern SiberiaMyanmar
Russia – otherMadagascar
MaliEquatorial Guinea
GuatemalaCA – Quebec
LebanonCyprus
NigerIndia
BulgariaCambodia
Timor Gap (JPDA)Albania
French GuianaSuriname
AngolaAzerbaijan
GabonKazakhstan
Russia – Offshore SakhalinFrance
RomaniaGeorgiaEthiopia
IndonesiaUganda
US Offshore – PacificBahrain
ThailandItaly
CameroonGuyana
MaltaSouth Africa
TanzaniaUS – CaliforniaTurkmenistan
CA – New BrunswickPeru
US – MichiganUS – Colorado
Mild deterrent toinvestment
Strong deterrentto investment
Would not pursueinvestment due tothis factor
0% 20% 40% 60% 80% 100%
AU – New South WalesMauritania
US – IllinoisCA – British Columbia
PhilippinesVietnam
GhanaIsrael
UruguayBrazil – Offshore concession contracts
MozambiqueUS – New York
MoroccoTurkey
ColombiaTrinidad and TobagoUS Offshore – Alaska
Brazil – Onshore concession contractsHungary
Brazil – Offshore presalt area profit sharing …Malaysia
KuwaitAU – Victoria
Spain – OffshoreAU – Queensland
Faroe IslandsChina
US – AlaskaGreenland
NamibiaQatar
CA – Nova ScotiaOman
CA – Newfoundland & LabradorSpain – Onshore
SeychellesDenmark
US – PennsylvaniaJordan
US – New MexicoCA – Northwest Territories
US Offshore – Gulf of MexicoAustralia – Offshore
United Arab EmiratesPoland
CA – AlbertaIreland
GermanyUnited Kingdom – North Sea
New ZealandCA – Yukon
AU – South AustraliaUS – Montana
US – UtahCA – ManitobaUS – Louisiana
United KingdomAU – Western Australia
JapanUS – Arkansas
ChileUS – Ohio
US – KansasAU – Northern Territory
US – WyomingUS – West Virginia
Norway – North SeaNetherlands
Netherlands – North SeaBrunei
US – OklahomaNorway
US – North DakotaUS – Texas
CA – SaskatchewanUS – Alabama
US – MississippiAU – Tasmania
Botswana
Mild deterrent to investment
Strong deterrent to investment
Would not pursue investmentdue to this factor

Fig ure 32: Secu rity
0% 20% 40% 60% 80% 100%
MaliSomaliland
South SudanIranIraq
SyriaLibya
PakistanAlgeria
Papua New GuineaNigeriaYemen
VenezuelaNiger
Democratic Republic of the Congo (Kinshasa)EgyptChad
ColombiaEcuador
KyrgyzstanEthiopia
Ivory CoastGuatemala
Russia – otherBolivia
UzbekistanEast Timor
KenyaLebanon
BangladeshCambodia
TunisiaEquatorial Guinea
UgandaRussia – Eastern Siberia
MyanmarRussia – Offshore Arctic
UkraineBahrain
MadagascarRepublic of the Congo (Brazzaville)
AngolaIndia
TanzaniaPhilippines
South AfricaIndonesia
MozambiqueRussia – Offshore Sakhalin
MoroccoAzerbaijan
GhanaArgentina – Tierra del Fuego
Argentina – ChubutCameroon
GuyanaArgentina – Santa Cruz
KazakhstanSuriname
TurkmenistanGabon
PeruArgentina – Mendoza
CA – New BrunswickChina
Argentina – NeuquenTrinidad and Tobago
Brazil – Onshore concession contractsFrench Guiana
ThailandMauritania
VietnamArgentina – Salta
IsraelBrazil – Offshore concession contracts
BulgariaTurkeyCyprus
Mild deterrent toinvestment
Strong deterrentto investment
Would notpursue investmentdue to this factor
0% 20% 40% 60% 80% 100%
CA – QuebecRomania
AlbaniaBotswana
Brazil – Offshore presalt area profit …MalaysiaUruguay
GreeceJordan
HungaryQatar
NamibiaUS Offshore – Pacific
KuwaitItaly
IrelandTimor Gap (JPDA)
OmanBrunei
Spain – OffshoreSeychelles
United Arab EmiratesUS – New York
GreenlandAU – New South Wales
PolandUS – Alaska
JapanChile
GermanyUS Offshore – Alaska
US – CaliforniaNew Zealand
US – IllinoisUS Offshore – Gulf of Mexico
Norway – North SeaSpain – Onshore
US – MichiganUS – West Virginia
FranceCA – Nova Scotia
US – ColoradoUS – Utah
US – WyomingAustralia – Offshore
United Kingdom – North SeaUnited Kingdom
US – New MexicoUS – Montana
NorwayCA – AlbertaUS – Kansas
US – LouisianaUS – North Dakota
CA – British ColumbiaUS – Texas
CA – ManitobaCA – Newfoundland & Labrador
CA – Northwest TerritoriesCA – Saskatchewan
CA – YukonUS – AlabamaUS – Arkansas
US – MississippiUS – Ohio
US – OklahomaUS – Pennsylvania
AU – Northern TerritoryAU – Queensland
AU – South AustraliaAU – Tasmania
AU – VictoriaAU – Western Australia
DenmarkFaroe Islands
GeorgiaMalta
NetherlandsNetherlands – North Sea
Mild deterrent to investment
Strong deterrent to investment
Would not pursue investment due tothis factor

Fig ure 33: Reg u la tory dupli ca tion
0% 20% 40% 60% 80% 100%
SomalilandUzbekistan
IranVenezuela
UkraineRussia – other
Russia – Eastern SiberiaRussia – Offshore Sakhalin
IndiaUganda
IraqIndonesia
LibyaTimor Gap (JPDA)
EcuadorMyanmar
Argentina – Santa CruzArgentina – Tierra del Fuego
NigeriaCA – Quebec
Argentina – SaltaArgentina – Chubut
South SudanBolivia
Russia – Offshore ArcticChad
Argentina – MendozaArgentina – Neuquen
AU – QueenslandMadagascar
Republic of the Congo (Brazzaville)Democratic Republic of the Congo (Kinshasa)
EthiopiaMali
French GuianaSuriname
KazakhstanTanzania
ChinaAlgeriaGabon
MozambiquePeruItaly
BangladeshMauritaniaCambodia
US – CaliforniaYemen
East TimorGuatemala
US – ColoradoAU – Victoria
Spain – OnshoreGhana
CA – Northwest TerritoriesGreece
US – New YorkPapua New Guinea
US – AlaskaEquatorial Guinea
Brazil – Offshore concession contractsSyria
US Offshore – PacificAU – New South Wales
AlbaniaRomania
AngolaCameroon
Ivory CoastEgypt
Brazil – Onshore concession contractsSpain – Offshore
PakistanVietnam
US Offshore – AlaskaBulgaria
Brazil – Offshore presalt area profit sharing …
Mild deterrent toinvestment
Strong deterrentto investment
Would not pursueinvestment due tothis factor
0% 20% 40% 60% 80% 100%
GuyanaKenya
PhilippinesNiger
Australia – OffshoreIsrael
LebanonUS – Pennsylvania
CA – Newfoundland & LabradorUS – Michigan
AU – Western AustraliaKyrgyzstan
BotswanaSouth Africa
ColombiaPoland
US Offshore – Gulf of MexicoCA – Yukon
NamibiaCA – British Columbia
CA – New BrunswickCyprus
HungaryThailand
CA – AlbertaAzerbaijan
CA – Nova ScotiaJordan
US – WyomingNew Zealand
TunisiaBrunei
US – IllinoisMorocco
GreenlandAU – South Australia
MalaysiaUS – New Mexico
UruguayUS – Montana
US – UtahTurkmenistan
FranceUS – Ohio
US – West VirginiaAU – Northern Territory
IrelandKuwait
Trinidad and TobagoGermany
SeychellesBahrain
US – LouisianaTurkey
AU – TasmaniaOman
US – AlabamaUnited Kingdom
US – North DakotaUS – Arkansas
US – TexasCA – Saskatchewan
ChileUS – MississippiCA – Manitoba
United Arab EmiratesJapan
United Kingdom – North SeaUS – Kansas
US – OklahomaQatar
Norway – North SeaNetherlands – North Sea
NorwayDenmark
Faroe IslandsGeorgia
MaltaNetherlands
Mild deterrent toinvestment
Strong deterrent toinvestment
Would not pursueinvestment due tothis factor

Fig ure 34: Legal sys tem pro cesses
0% 20% 40% 60% 80% 100%
UkraineUzbekistan
Russia – Eastern SiberiaRussia – Offshore Arctic
KyrgyzstanChadNiger
Republic of the Congo (Brazzaville)Somaliland
Argentina – SaltaEcuador
South SudanLibya
Russia – otherVenezuela
IraqIran
NigeriaArgentina – Mendoza
Argentina – Tierra del FuegoEquatorial Guinea
TurkmenistanKazakhstan
Argentina – NeuquenBolivia
MyanmarMadagascar
Argentina – ChubutSyria
IndonesiaMali
AlgeriaRussia – Offshore Sakhalin
AngolaPapua New Guinea
EthiopiaArgentina – Santa Cruz
KenyaDemocratic Republic of the Congo (Kinshasa)
CameroonYemen
CambodiaAzerbaijan
BangladeshIndia
EgyptGabon
UgandaMozambique
East TimorLebanonVietnam
TanzaniaSuriname
PhilippinesChina
GuatemalaIvory Coast
PakistanItaly
TunisiaMauritania
PeruAlbania
RomaniaBulgaria
Brazil – Offshore concession contractsBrazil – Onshore concession contracts
ColombiaBrazil – Offshore presalt area profit sharing …
South AfricaThailand
GreeceMalaysia
US Offshore – PacificJordanCyprus
Morocco
Mild deterrent toinvestment
Strong deterrentto investment
Would not pursueinvestment due tothis factor
0% 20% 40% 60% 80% 100%
GhanaIsrael
CA – QuebecPoland
US – New YorkFrench Guiana
BruneiTurkey
NamibiaHungaryBahrain
Trinidad and TobagoUS – California
UruguaySeychelles
GuyanaQatar
KuwaitSpain – Onshore
US – LouisianaTimor Gap (JPDA)
US – IllinoisAU – New South Wales
United Arab EmiratesFrance
Spain – OffshoreCA – New Brunswick
US – ColoradoUS – Michigan
US – New MexicoAU – TasmaniaUS – Alabama
AU – QueenslandUS – Montana
US Offshore – Gulf of MexicoOman
AU – VictoriaGeorgia
US – PennsylvaniaUS – Alaska
US – West VirginiaUS – Wyoming
US – MississippiUnited Kingdom
New ZealandUS – Texas
IrelandJapan
US – ArkansasUS – Oklahoma
US – UtahUS Offshore – Alaska
ChileUS – Ohio
US – KansasGermany
CA – AlbertaCA – British Columbia
Australia – OffshoreCA – Nova Scotia
United Kingdom – North SeaUS – North Dakota
NorwayNorway – North SeaCA – Saskatchewan
CA – ManitobaCA – Newfoundland & Labrador
CA – Northwest TerritoriesCA – Yukon
AU – Northern TerritoryAU – South Australia
AU – Western AustraliaDenmark
Faroe IslandsGreenland
MaltaNetherlands
Netherlands – North SeaBotswana
Mild deterrent to investment
Strong deterrent to investment
Would not pursue investment dueto this factor

Com pli ments re ceived
“Good luck with the sur vey!”
“I hope your sur vey will be used in a way that will help the pri vate com pa nies in Amer -
ica that strug gle ev ery day to stay in busi ness, which iron i cally helps many of the very
peo ple that are at tempt ing to put the oil and gas work ers out of busi ness.....”
“Con grat u la tions! This sur vey is very use ful.”
“The sur vey is com pre hen sive and considers all fac tors in flu enc ing in vest ment cli -
mate.”
Fra ser In sti tute Global Pe tro leum Sur vey, 2013 103www.fraserinstitute.org

Ref er ences
Brit ish Pe tro leum (2012). Sta tis ti cal Re view of World En ergy 2012. Brit ish Pe tro leum (June).
<http://www.bp.com/assets/bp_internet/globalbp/globalbp_uk_english/reports_and_publications/statistical_energy_review_2011/STAGING/local_assets/pdf/statistical_review_of_world_energy_full_report_2012.pdf>, as of No vem ber 7, 2013.
Neth er lands (2013). Nat u ral Re sources and Geo ther mal En ergy in the Neth er lands. 2011 An nual
Re view. <http://www.nlog.nl/resources/Jaarverslag2011/Delfstoffen_2011_UK_final_
NLOG_0.1.pdf>, as of Oc to ber 29, 2013.
Grama, Yulia (2012). The Anal y sis of Rus sian Oil and Gas Re serves. In ter na tional Jour nal of En -
ergy Eco nom ics and Pol icy 2(2): 82-91.
In ter na tional En ergy Agency (2012). World En ergy Out look 2012. No vem ber.
<http://www.worldenergyoutlook.org/publications/weo-2012/#d.en.26099>, as of Oc to -
ber 29, 2013.
US De part ment of En ergy (2013a). In ter na tional En ergy Sta tis tics. Web ta ble. En ergy In for ma -
tion Ad min is tra tion. <http://www.eia.gov/cfapps/ipdbproject/IEDIndex3.cfm?
tid=5&pid=57&aid=6>, as of Oc to ber 29, 2013.
US De part ment of En ergy (2013b). Crude Oil plus Lease Con den sate Re serves. Web ta ble. En ergy
In for ma tion Ad min is tra tion. <http://www.eia.gov/dnav/pet/PET_CRD_CPLC_A_
EPCCOND_R01_MMBBL_A.htm>, as of Oc to ber 29, 2013.
US De part ment of En ergy (2013c). Coun try Brief: Rus sia. En ergy In for ma tion Ad min is tra tion.
<http://www.eia.gov/countries/country-data.cfm?fips=RS>, as of Oc to ber 29, 2013
104 Fra ser In sti tute Global Pe tro leum Sur vey, 2013
www.fraserinstitute.org

Ap pen dix 1: Proved Oil and Nat u ral Gas Re serves
For about 40 coun tries proved reserves data to year-end 2011 for oil and/or nat u ral gas were taken
from Brit ish Petro leum’s Sta tis ti cal Review of World Energy (Brit ish Petro leum, 2012). For the
remain ing coun tries, gen er ally all with smaller reserves, the data were obtained from the US
Depart ment of Energy’s Energy Infor ma tion Admin is tra tion’s online “Sta tis tics” site (US Depart -
ment of Energy, 2013a). Data for reserves of oil (bil lions of bar rels) and gas (tril lions of cubic feet)
were obtained sep a rately. The gas reserves data were then con verted to bil lions of bar rels of oil
equiv a lent and the result ing quan ti ties com bined with the oil reserves data to pro vide esti mates of
each juris dic tion’s total proved reserves of oil and gas in bil lions of bar rels of oil equiv a lent. For
coun tries that were bro ken down into states, prov inces, ter ri to ries, off shore regions, and/or geo -
graph ical regions for the pur pose of the sur vey, the “national” reserves data were allo cated accord -
ing to the best infor ma tion avail able.
For the United States, state and off shore region reserves data as at year-end 2010 were avail able
online (US Depart ment of Energy, 2013b).14 The sep a ra tion of proved reserves between Alaska
and the Alaska—US Off shore regions was guided by infor ma tion pro vided by State of Alaska offi -
cials. Up-to-date proved oil and gas reserves data for Can ada’s prov inces and ter ri to ries were pro -
vided directly to the Fra ser Insti tute by the National Energy Board in response to a spe cial request.
The Board’s esti mates of proved Cana dian oil and gas reserves were used instead of the esti mates
pro vided in the Sta tis ti cal Review of World Energy.
Because the United King dom only pub lishes data for “P2” (proved plus prob a ble) reserves, we
were advised by a UK gov ern ment offi cial to allo cate the esti mates of that coun try’s total proved
(i.e., “P1”) oil and gas reserves as pro vided in the Sta tis ti cal Review of World Energy between the
North Sea and “other” off shore regions (West of Shet land Islands and the Irish Sea) accord ing to
the UK’s P2 reserves data. The UK has no sig nif i cant onshore oil and gas reserves. While there is
sub stan tial dis cus sion and debate regard ing pos si ble pro duc tion of nat u ral gas from onshore (and,
pos si bly, off shore) shale for ma tions, as yet no reserve esti mates are avail able (even on a P2 basis).
The break down of Nor we gian reserves as between Nor way and Nor way—North Sea was based on
an Excel file pro duced by the Nor we gian Petro leum Direc tor ate which shows Nor way’s reserves of
oil and gas in each of the North, Nor we gian, and Barents Seas. (Nor way has no onshore reserves).
For the Neth er lands, the split between onshore and off shore reserves was based on reserves data for
the coun try’s onshore and the con ti nen tal shelf (North Sea) regions con tained in the Nat u ral
Resources and Geo ther mal Energy in the Neth er lands 2011 annual review (Neth er lands, 2012).
Geoscience Aus tra lia kindly pro vided guid ance with respect to the allo ca tion of Aus tra lian
reserves by state, the North ern Ter ri tory, and the Aus tra lia—Off shore region based on data for P2
reserves because, like the UK, Aus tra lia does not pub lish data for P1 reserves. Oil and gas reserves
Fra ser In sti tute Global Pe tro leum Sur vey, 2013 105www.fraserinstitute.org
14 Year-end 2011 oil and gas reserves data by state were not yet available.

esti mates for the Aus tra lia—East Timor JPDA, (also in P2 terms) were gra ciously pro vided by Mr.
G. Bethune, CEO of the Aus tra lian con sult ing firm Energy Quest.
Esti mates of proved reserves of oil and gas as of Decem ber 31, 2011, for the six Argen tine prov inces
included in the sur vey were obtained from an Excel file gen er ated by Argen tina’s Department of
Energy. Because no profit shar ing con tracts are in place as yet with respect to the Bra zil ian off shore,
no oil and gas reserves were allo cated to Brazil—Off shore PSC Con tracts. Brazil’s proved oil and
gas reserves were there fore allo cated between Brazil—Onshore and Brazil—Off shore Con ces sion
Con tracts accord ing to data for year-end 2011 pro vided on the Agencia Nacional do Petroleo’s
(National Petro leum Agency) Gas Nat u ral e Biocombustiveis’ website. For Spain, the allo ca tion of
proved oil and gas reserves as between the onshore and off shore cat e go ries was based on infor ma -
tion kindly pro vided by Mr. Jorge Navarro of Compania Espanola de Petroleos, S.A.U. (CEPSA) in
Spain.
The most chal leng ing allo ca tion task was in the case of the 4 Rus sian regions in the sur vey: East ern
Sibe ria, Sakhalin Island, Off shore Arc tic, and Other. We were unable to find any defin i tive infor -
ma tion on proved oil and gas reserves for these regions in the pub lic domain. In fact, one Rus sian
expert on oil and gas resources informed us that it was unlikely that any insti tu tion in Rus sia could
pro vide us with the infor ma tion we required. How ever, some very use ful infor ma tion, espe cially
with regard to the regional allo ca tion of Rus sian oil resources, is con tained in a 2012 arti cle by
Yulia Grama. The allo ca tions for Rus sia were based on insights pro vided in that paper and in the
US Energy Infor ma tion Admin is tra tion’s most recent coun try brief on Rus sia (Grama, 2012; US
Depart ment of Energy, 2013c).
106 Fra ser In sti tute Global Pe tro leum Sur vey, 2013
www.fraserinstitute.org
Ap pen dix 2: Maps of ju ris dic tions
The fol low ing pages con tain maps 1 through 8 . These maps illus trate the rel a tive attrac tive ness of
juris dic tions around the globe for invest ment based on scores from the All-Inclu sive Com pos ite
Index. The scores, from 0 to 100, have been divided equally into five ranges (quin tiles). Those in
the 0 to 19.9 range (first quintile) are rated as most attrac tive for invest ment while juris dic tions
with scores rang ing from 80.0 to 100 (fifth quintile) are the least attrac tive.
Fra ser In sti tute Global Pe tro leum Sur vey, 2013 107www.fraserinstitute.org

MAP 1: 2013 GLOBAL INVESTMENT CLIMATE for petroleum upstream development
Most attractive 2nd Quintile 3rd Quintile 4th Quintile Least attractive Unmeasured

MAP 2: NORTH AMERICA 2013
Most attractive
2nd Quintile
3rd Quintile
4th Quintile
Least attractive
Unmeasured
ALASKA
BRITISHCOLUMBIA
SASK
ATCHEW
AN
MANITOBA
YUKON
QUEBEC
MONTANANORTHDAKOTA
NEWMEXICO
OHIO
MICHIGANPENNSYLVANIA
W.VIRGINIA
CALIFORNIA
WYOMING
COLORADO KANSAS
OKLAHOMA
TEXAS
MIS
SISI
PPI
NEW YORK
LOUISIANA
NORTHWESTTERRITORIES
ALBERTA
NEWFOUNDLAND& LABRADOR
NOVA SCOTIA
UTAH
NEW BRUNSWICK
ALAB
AMA
ILLINOIS
US OFFSHOREPACIFIC
US OFFSHOREALASKA
US OFFSHOREGULF OF MEXICO
ARKA
NSA
S

MAP 3: OCEANIA 2013
Most attractive
2nd Quintile
3rd Quintile
4th Quintile
Least attractive
Unmeasured
WESTERN AUSTRALIA
NORTHERNTERRITORY
QUEENSLAND
NEW SOUTHWALES
VICTORIA
TASMANIA
SOUTH AUSTRALIA
NEW ZEALAND
PAPUANEW GUINEA
INDONESIA
PHILIPPINES
BRUNEI
MALAYSIA
TIMOR GAP(JPDA)
EAST TIMOR
AUSTRALIA-OFFSHORE

Most attractive 2nd Quintile 3rd Quintile 4th Quintile Least attractive Unmeasured
POLAND
ITALY
HUNGARY
BULGARIA
TURKEY
UKRAINE
ALBANIA
FRANCE
GERMANY
NORWAY
UNITEDKINGDOM
ROMANIA
NETHERLANDS
DENMARK
GREENLAND
RUSSIA*
FAROE ISLANDS
IRELAND
GREECE
*Eastern Siberia and Sakhalin jurisdictions, which belong to the European region, are located on the Asia map (Fig. 15).
MALTA
CYPRUS
GEORGIA
MAP 4: EUROPE 2013
SPAIN
NORWAYNORTH SEA
NETHERLANDSNORTHSEA
UKNORTH SEA
SPAINOFFSHORE
RUSSIAOFFSHOREARCTIC

Most attractive 2nd Quintile 3rd Quintile 4th Quintile Least attractive Unmeasured
CHINA
KAZAKHSTAN
TURKMENISTAN
PAKISTAN
KYRGYZSTAN
BANG
LADESH
MYANMAR
THAILAND
CAMBODIA VIETNAM
AZERBAIJAN
UZBEKISTAN
JAPAN
INDIA
EASTERN SIBERIA(European region)
(European region)
MAP 5: ASIA 2013
RUSSIAOFFSHORESAKHALIN

CAMEROON
DEMOCRATICREPUBLIC OFTHE CONGO(Kinshasa)
EQUATORIALGUINEA
REP
UBL
IC O
F T
HE
CON
GO
(Bra
zzav
ille)
GABON
MAP 6: AFRICA 2013
Most attractive
2nd Quintile
3rd Quintile
4th Quintile
Least attractive
Unmeasured
UGANDA
KENYA
NIGERIAIVORYCOAST
ANGOLA
NAMIBIA
TANZANIA
CHAD
MOZAM
BIQUE
SOUTH AFRICA
GHANA
MADAGASC
AR
SOUTHSUDAN
MALI
ETHIOPIA
SOMALILAND
NIGER
SEYCHELLES
BOTSWANA

IRAN
SYRIA
KUWAIT
YEMEN
OMANUNITED ARAB
EMIRATES
BAHRAINQATAR
ISRAEL
LEBANON
JORDANIRAQ
EGYPTLIBYA
ALGERIA
MOROCCO
TUNISIA
MAURITANIA
Most attractive 2nd Quintile 3rd Quintile 4th Quintile Least attractive Unmeasured
MAP 7: MIDDLE EAST and NORTH AFRICA 2013

MAP 8: LATIN AMERICA & CARIBBEAN BASIN 2013
Most attractive
2nd Quintile
3rd Quintile
4th Quintile
Least attractive
Unmeasured
BRAZILPRESALT
PERU
COLOMBIA
ECUADOR
VENEZUELA
BOLIVIA
CHILE
URUGUAY
TRINIDAD& TOBAGO
GUYANA
ARGENTINAMENDOZA
ARGENTINASANTA CRUZ
ARGENTINACHUBUT
ARGENTINASALTA
ARGENTINANEUQUÉN
BRAZILCONCESSIONCONTRACTS
BRAZIL
ARGENTINATIERRA DEL FUEGO
GUATEMALA
FRENCH GUIANASURINAME

About the authors
Alana Wil son is a Senior Econ o mist with the Fra ser Insti tute’s Cen tre for Nat u ral Resource Stud ies
and coor di na tor of the Sur vey of Min ing Com pa nies and Global Petro leum Sur vey. She has a M.Sc. in
Local Eco nomic Devel op ment from the Lon don School of Eco nom ics & Polit i cal Sci ences, and a
B.Sc. Agroecology (Hon ours) in Food and Resource Eco nom ics from the Uni ver sity of Brit ish
Colum bia. Her research has focused on the domes tic and inter na tional impacts of min ing, nat u ral
resource eco nom ics, and eco nomic devel op ment and she has worked in Can ada and inter na tion -
ally for gov ern ment, international organizations, and industry.
Miguel Angel Cer van tes is a Research Economist with the Fra ser Insti tute. He has an aca demic
back ground in Eco nom ics; he holds Bach e lor’s and Mas ter’s degrees in Eco nom ics from the Uni -
ver sity of Texas at El Paso. He has lec tured at Vanier Col lege, and HEC busi ness school in Mon -
treal. He was the co-ordinator of the 2008/2009, 2009/2010, 2010/2011, and 2011/2012 edi tions of
the Fra ser Insti tute Annual Sur vey of Min ing Com pa nies, and the 2009, 2010, 2011, and 2012 edi -
tions of the Fra ser Insti tute Global Petro leum Sur vey. He was also a co-author of the Eco nomic Free -
dom of the Arab World 2010, 2011, and 2012 Annual Reports.
Gerry Angevine is a Fra ser Insti tute Senior Fel low. From July 2006 to the end of 2012 he was a
Senior Econ o mist with the Insti tute with respon si bil ity for energy pol icy stud ies. He launched the
global Petro leum Sur vey in 2007. Dr. Angevine has been Pres i dent of Angevine Eco nomic Con sult -
ing Ltd., an energy eco nom ics con sult ing firm, since 1999, and was a Man ag ing Con sul tant with
Navigant Con sult ing Ltd. from 2001 to 2004. He was Pres i dent, CEO, and a Direc tor of the Cana -
dian Energy Research Insti tute from 1979 to 1999. Gerry has advised the Alberta Depart ment of
Energy and tes ti fied before the National Energy Board as an expert wit ness. He has also writ ten
anal y ses for the Fra ser Insti tute of Ontario’s 2007 Inte grated Power Sys tem Plan and Alberta elec -
tric trans mis sion pol icy as well as sev eral stud ies address ing aspects of a con ti nen tal energy strat egy
and pol icy changes required to expe dite invest ment in Cana dian crude oil and nat u ral gas trans -
por ta tion infra struc ture. He has A.M. and Ph.D. degrees in Eco nom ics from the Uni ver sity of
Mich i gan, an M.A. Eco nom ics degree from Dalhousie Uni ver sity, and a B.Com. degree from
Mount Allison Uni ver sity.
Ken neth P. Green is Senior Direc tor, Nat u ral Resources at the Fra ser Insti tute. He received his
doc tor ate in Envi ron men tal Sci ence and Engi neer ing from the Uni ver sity of Cal i for nia, Los
Angeles (UCLA), an M.S. in Molec u lar Genet ics from San Diego State Uni ver sity, and a B.S. Biol -
ogy from UCLA. Dr. Green has stud ied pub lic pol icy involv ing risk, reg u la tion, and the envi ron -
ment for more than 16 years at pub lic pol icy research insti tu tions across North Amer ica. He has an
exten sive pub li ca tion list of pol icy stud ies, mag a zine arti cles, opin ion col umns, book and ency clo -
pe dia chap ters, and two sup ple men tary text books on cli mate change and energy pol icy. Ken’s
writ ing has appeared in major news pa pers across the US and Can ada, and he is a reg u lar pres ence
on both Cana dian and Amer i can radio and tele vi sion.
116 Fra ser In sti tute Global Pe tro leum Sur vey, 2013
www.fraserinstitute.org

Pub lish ing in for ma tion
Dis tri bu tion
These pub li ca tions are avail able from <http://www.fraserinstitute.org> in Por ta ble Doc u mentFor mat (PDF) and can be read with Adobe Acro bat® 7 or later, or with Adobe Reader® 7 or later.Adobe Reader® 9, the most recent ver sion, is avail able free of charge from Adobe Sys tems Inc. and
may be down loaded from: <http://get.adobe. com/reader/>. We encour age you to install the mostrecent ver sion.
Or der ing pub li ca tions
For infor ma tion about order ing the Fra ser Insti tute’s printed pub li ca tions, please con tact thepub li ca tions coor di na tor
· e-mail: [email protected]
· tele phone: 604.688.0221 ext. 580 or, toll free, 1.800.665.3558 ext. 580
Me dia
For media inqui ries, please con tact our Com mu ni ca tions Depart ment:
tele phone: 604.714.4582 or e-mail: [email protected]
Copy right
Copy right © 2013 by the Fra ser Insti tute. All rights reserved. No part of this pub li ca tion may berepro duced in any man ner what so ever with out writ ten per mis sion except in the case of brief pas -sages quoted in crit i cal arti cles and reviews.
ISBN
978-0-88975-278-8
Date of is sue
Novem ber 2013
Ed it ing, de sign, and pro duc tion
Kristin McCahon
Cover de sign
Bill Ray
Cover im ages
Camel © KenGriffith, Bigstock; Ara bian oil indus try © Mlenny, iStock
Fra ser In sti tute Global Pe tro leum Sur vey, 2013 117www.fraserinstitute.org

Sup port ing the Fra ser In sti tute
To learn how to sup port the Fra ser Insti tute, please con tact
· De vel op ment De part ment, The Fra ser In sti tute, Fourth Floor, 1770 Burrard Street, Van cou ver, Brit ish Co lum bia, Can ada V6J 3G7
· tele phone, toll-free: 1.800.665.3558 ext. 586
· e-mail: [email protected]
Life time Pa trons
For their long-stand ing and valu able sup port con trib ut ing to the suc cess of the Fra ser Insti tute, the
fol low ing peo ple have been rec og nized and inducted as Life time Patrons of the Fra ser Insti tute.
118 Fra ser In sti tute Global Pe tro leum Sur vey, 2013
www.fraserinstitute.org
Sonja Bata
Charles Barlow
Ev Berg
Art Grunder
Jim Chap lin
Serge Darkazanli
John Dobson
Ray mond Heung
Bill Korol
Bill Mackness
Fred Mannix
Jack Pirie
Con Riley
Catherine Windels

Pur pose, fund ing, and in de pend ence
The Fra ser Insti tute pro vides a use ful pub lic ser vice. We report objec tive infor ma tion about the
eco nomic and social effects of cur rent pub lic pol i cies, and we offer evi dence-based research and
edu ca tion about pol icy options that can improve the qual ity of life.
The Insti tute is a non-profit orga ni za tion. Our activ i ties are funded by char i ta ble dona tions, unre -
stricted grants, ticket sales and spon sor ships from events, the licens ing of prod ucts for pub lic dis -
tri bu tion, and the sale of pub li ca tions.
All research is sub ject to rig or ous review by exter nal experts, and is con ducted and pub lished sep a -
rately from the Insti tute’s Board of Trust ees and its donors.
The opin ions expressed by staff or author(s) are those of the indi vid u als them selves, and should
not be inter preted to reflect those of the Insti tute, its Board of Trust ees, or its donors and
sup port ers.
As a healthy part of pub lic dis cus sion among fel low cit i zens who desire to improve the lives of peo -
ple through better pub lic pol icy, the Insti tute wel comes evi dence-focused scru tiny of the research
we pub lish, includ ing ver i fi ca tion of data sources, rep li ca tion of ana lyt i cal meth ods, and intel li -
gent debate about the prac ti cal effects of pol icy rec om men da tions.
Fra ser In sti tute Global Pe tro leum Sur vey, 2013 119www.fraserinstitute.org

About the Fra ser In sti tute
Our vision is a free and pros per ous world where indi vid u als ben e fit from greater choice, com pet i -
tive mar kets, and per sonal respon si bil ity. Our mis sion is to mea sure, study, and com mu ni cate the
impact of com pet i tive mar kets and gov ern ment inter ven tions on the wel fare of indi vid u als.
Founded in 1974, we are an inde pend ent Cana dian research and edu ca tional orga ni za tion with loca -
tions through out North Amer ica and inter na tional part ners in over 85 coun tries. Our work is
financed by tax-deduct ible con tri bu tions from thou sands of indi vid u als, orga ni za tions, and foun da -
tions. In order to pro tect its inde pend ence, the Insti tute does not accept grants from gov ern ment or
con tracts for research.
Nous envisageons un monde libre et prospère, où chaque personne bénéficie d’un plus grand choix, de
marchés concurrentiels et de responsabilités individuelles. Notre mis sion consiste à mesurer, à étudier et
à communiquer l’effet des marchés concurrentiels et des inter ven tions gouvernementales sur le
bien-être des individus.
Peer re view
Val i dat ing the accu racy of our research
The Fra ser Insti tute main tains a rig or ous peer review pro cess for its research. New research, major
research pro jects, and sub stan tively mod i fied research con ducted by the Fra ser Insti tute are
reviewed by a min i mum of one inter nal expert and two exter nal experts. Review ers are expected to
have a rec og nized exper tise in the topic area being addressed. When ever pos si ble, exter nal review
is a blind pro cess.
Com men tar ies and con fer ence papers are reviewed by inter nal experts. Updates to pre vi ously
reviewed research or new edi tions of pre vi ously reviewed research are not reviewed unless the
update includes sub stan tive or mate rial changes in the meth od ol ogy.
The review pro cess is over seen by the direc tors of the Insti tute’s research depart ments who are
respon si ble for ensur ing all research pub lished by the Insti tute passes through the appro pri ate peer
review. If a dis pute about the rec om men da tions of the review ers should arise dur ing the Insti tute’s
peer review pro cess, the Insti tute has an Edi to rial Advi sory Board, a panel of schol ars from Can -
ada, the United States, and Europe to whom it can turn for help in resolv ing the dis pute.
120 Fra ser In sti tute Global Pe tro leum Sur vey, 2013
www.fraserinstitute.org

Ed i to rial Ad vi sory Board
* Deceased
† Nobel Lau re ate
Fra ser In sti tute Global Pe tro leum Sur vey, 2013 121www.fraserinstitute.org
Pro fes sor Terry L. Ander son
Pro fes sor Rob ert Barro
Pro fes sor Michael Bliss
Pro fes sor Jean-Pierre Centi
Pro fes sor John Chant
Pro fes sor Bev Dahlby
Pro fes sor Erwin Diewert
Pro fes sor Ste phen Easton
Pro fes sor J.C. Her bert Emery
Pro fes sor Jack L. Granatstein
Pro fes sor Her bert G. Grubel
Pro fes sor James Gwartney
Pro fes sor Ron ald W. Jones
Dr. Jerry Jor dan
Pro fes sor Ross McKitrick
Pro fes sor Michael Parkin
Pro fes sor Friedrich Schnei der
Pro fes sor Law rence B. Smith
Dr. Vito Tanzi
Past mem bers
Pro fes sor Armen Alchian
Pro fes sor James M. Buchanan†
Pro fes sor Friedrich A. Hayek*†
Pro fes sor H. G. John son*
Pro fes sor F. G. Pennance*
Pro fes sor George Stigler*†
Pro fes sor Edwin G. West*
Sir Alan Walters*

The Fra ser Insti tute,
Fourth Floor, 1770 Burrard Street
Van cou ver, Brit ish Colum bia
Can ada
V6J 3G7