Ppt 2 d ploting k10998
11
Assignment of Control theory Topic- 2-D ploting SUBMITTED TO:- Mr. Somesh chaturvedi ASSISTANT PROFESSOR EE& ECE DEPARTMENT SUBMITTED BY:- Wasique Ahmad UID k-10998 BRANCH- MECHANICAL
-
Upload
vinit-chauhan -
Category
Technology
-
view
52 -
download
0
Transcript of Ppt 2 d ploting k10998

Assignment of Control theory Topic- 2-D ploting
SUBMITTED TO:- Mr. Somesh chaturvedi ASSISTANT PROFESSOR
EE& ECE DEPARTMENT
SUBMITTED BY:-Wasique Ahmad UID k-10998BRANCH-
MECHANICAL

TABLE OF CONTENTS IntroductionFunction Ueses of 2-D ploting2-D ploting coding outputEffectApplicationConclusions

Introduction MATLAB not only helps us for calculation but
also helps us in data analysis and visualization by plotting graphs and waveforms. It provides us with a ‘big picture’ of our data
Default 2d (‘plot’) and 3d (‘plot3’) plots in Matlab are generally good. The only recommended change is to avoid the legend (‘legend hide’). Replace this with direct annotation.

Function When creating a MATLAB function, the name of the
file should match the name of the first function in the file. Valid function names begin with an alphabetic character, and can contain letters, numbers, or underscores. Functions are also often case sensitive.
Function handlesMATLAB supports elements of lambda
calculus by introducing function handles, or function references, which are implemented either in .m files or anonymous/nested functions

Uses of 2-D ploting Apart from 2-D Plotting and graphics we use followings as
a combination according to our needs Linear Algebra Algebraic Equations Non-linear Functions Statistics Data Analysis Calculus and Differential Equations Numerical Calculations Integration Transforms Curve Fitting

2-D ploting coding Syntax :poly(x1,y1,x2,y2)eg:x=0:10;y=x.^2;z=2:12;t=x.^2;plot(x,y,z,t)
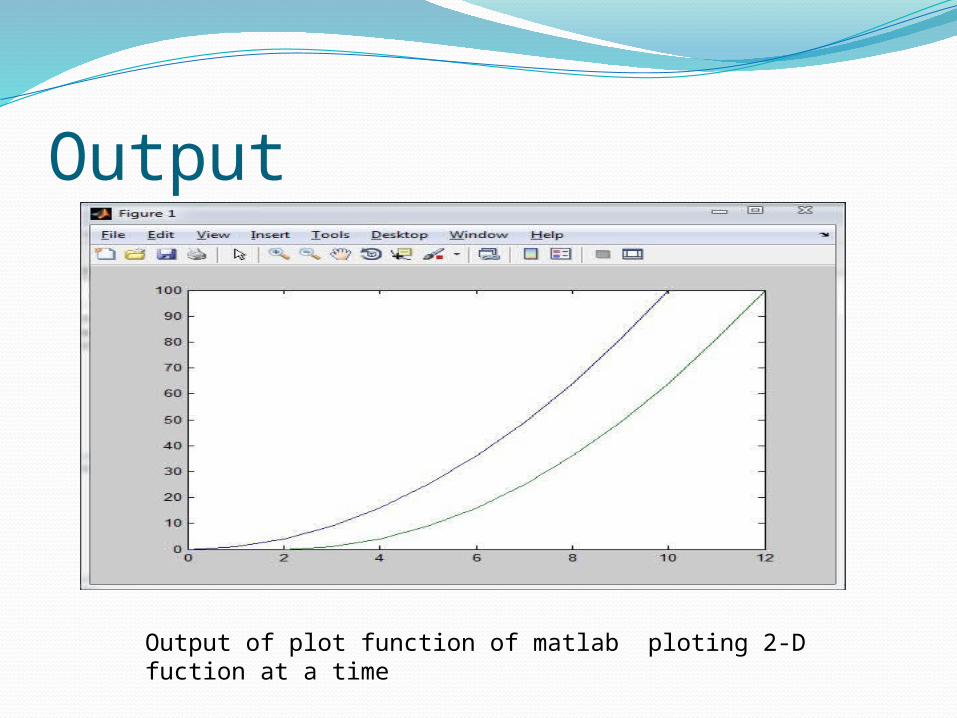
Output
Output of plot function of matlab ploting 2-D fuction at a time

EFFECTThe graph is showing the variation quantity
with respect to timeWhen we see at t=0 ,the quantity increases
linearly and when we set the t=2 then also it follows the same pattern of increment.

Application It provides tools for building applications
with custom graphical interfaces MATLAB's programming interface gives
development tools for improving code quality, maintainability, and maximizing performance
It provides functions for integrating MATLAB based algorithms with external applications and languages such as C, Java, .NET and Microsoft Excel

conclusion To change the characteristics of the plot we
can use plottools function. A box will pop up showing your output, we can change change the characteristics there like color, plot type. We can also more data to the plot.