Post-implementation effects of the Benefit Cap (Wave 2 Survey) · PDF file3...
94
Post-implementation effects of the Benefit Cap (wave 2 survey) December 2014
Transcript of Post-implementation effects of the Benefit Cap (Wave 2 Survey) · PDF file3...

Post-implementation effects of the Benefit Cap (wave 2 survey)December 2014

Research Report No 894
A report of research carried out by Ipsos MORI on behalf of the Department for Work and Pensions.
© Crown copyright 2014.
You may re-use this information (not including logos) free of charge in any format or medium, under the terms of the Open Government Licence. To view this licence, visit http://www.nationalarchives.gov.uk/doc/open-Government-licence/ or write to the Information Policy Team, The National Archives, Kew, London TW9 4DU, or email: [email protected].
This document/publication is also available on our website at: https://www.gov.uk/Government/organisations/department-for-work-pensions/about/research#research-publications
If you would like to know more about DWP research, please email: [email protected]
First published 2014.
ISBN 978 1 910219 67 6
Views expressed in this report are not necessarily those of the Department for Work and Pensions or any other Government Department.

3
Post-implementation effects of the Benefit Cap (wave 2 survey)
SummaryThis report is one of a series of outputs from the evaluation of the Benefit Cap. It highlights the key findings from a longitudinal telephone survey of capped households identified from the October 2013 Single Housing Benefit Extract (SHBE).
The first wave of the survey was carried out with 1,200 claimants in February 2014, and the second in August/September 2014 with 468 of the same claimants. This work examines the behavioural change over time on employment, finances and housing.
4
Post-implementation effects of the Benefit Cap (wave 2 survey)
ContentsAcknowledgements ................................................................................................................. 7
The Authors ............................................................................................................................. 8
Glossary of terms and list of abbreviations.............................................................................. 9
1 Introduction ...................................................................................................................... 10
1.1 Aims of the study ................................................................................................... 10
1.2 Background ............................................................................................................11
1.3 Research methods .................................................................................................11
1.4 Key findings ........................................................................................................... 13
1.4.1 Characteristics of survey respondents .................................................... 13
1.4.2 Responses to the Benefit Cap ................................................................ 13
1.4.3 Employment-related effects of the Benefit Cap ...................................... 14
1.4.4 Housing-related effects of the Benefit Cap ............................................. 14
1.4.5 Financial-related effects of the Benefit Cap ............................................ 14
2 Characteristics of survey respondents ............................................................................ 16
2.1 Respondent status in relation to the Benefit Cap ............................................................................................................ 18
2.2 Reasons why respondents became unaffected by the Benefit Cap ...................... 19
3 Responses to the Benefit Cap ......................................................................................... 21
3.1 Coping behaviours and responses ........................................................................ 21
3.2 Taking actions in response to the Benefit Cap ...................................................... 23
3.3 Discretionary Housing Payment ............................................................................ 23
4 Employment-related effects of the Benefit Cap ............................................................... 28
4.1 Employment-related actions .................................................................................. 28
4.2 Impact of the Benefit Cap on work seeking ........................................................... 30
4.3 Barriers to employment and actions to overcome them ........................................ 32
5
Post-implementation effects of the Benefit Cap (wave 2 survey)
5 Housing-related effects of the Benefit Cap ...................................................................... 36
5.1 Moving home ......................................................................................................... 36
5.2 Barriers to moving home ....................................................................................... 37
6 Financial-related effects of the Benefit Cap ..................................................................... 40
6.1 Arrears and responses .......................................................................................... 40
6.2 Household finances ............................................................................................... 42
7 Conclusion ....................................................................................................................... 45
Appendix A Technical details and statistical reliability ......................................................... 47
Appendix B Policy information ............................................................................................. 52
Appendix C Review and evaluation of the Benefit Cap ....................................................... 54
Appendix D Survey questionnaires ...................................................................................... 55
List of tablesTable 2.1 Selected demographic characteristics of wave 2 cohort groups ...................... 18
Table 3.1 Changes in DHP status for claimants in receipt currently/previously in receipt ........................................................................................................... 26
Table 3.2 Effects and behaviours in relation to DHP status ............................................. 26
Table 4.1 Since we last spoke to you in February 2014, would you say that as a result of being affected by the Benefit Cap, you are doing/did the following things more or less often than before or about the same amount? ... 29
Table 4.2 Those doing ‘the same amount’ of work-related actions and how much of each of these actions they were doing before becoming affected by the Benefit Cap ...................................................................................................... 30
Table 6.1 Change in arrears status between survey waves: Are you currently up to date with the rent you owe or are you in arrears? ................................... 41
Table A.1 Comparison of respondent profiles (cohort group) for waves 1 and 2 (weighting variables) .......................................................................................................... 48
Table A.2 Comparison of responders and non-responders from wave 1 ......................... 49
Table A.3 Approximate sampling tolerances by size of sample ....................................... 50
Table A.4 Approximate sampling tolerances when comparing sub-samples ................... 50

6
Post-implementation effects of the Benefit Cap (wave 2 survey)
List of figuresFigure 2.1 How would you best describe your current work status? ................................. 17
Figure 3.1 Since we last spoke with you in February this year, what, if anything, have/did you/your family do in response to the reduction in your benefits since/whilst being affected by the Benefit Cap? ............................................... 22
Figure 3.2 Which of the following statements best describes your situation in relation to Discretionary Housing Payments, or DHP? .................................... 25
Figure 4.1 Overall, would you say you have been/were more encouraged or less encouraged to find paid work as a result of being affected by the Benefit Cap, or has it made/did it make no difference to you? ......................... 31
Figure 4.2 Differences between key subgroups in response to the question: Overall, would you say you have been/were more encouraged or less encouraged to find paid work as a result of being affected by the Benefit Cap, or has it made/did it make no difference to you? ......................... 32
Figure 4.3 What would you say are the main barriers to you finding work?/Thinking about any actions you have taken since being affected by the Benefit Cap, how much progress, if any, do you feel you have made in overcoming these barriers to finding work? ................................................................................... 33
Figure 4.4 What, if anything, have you done to overcome these barriers to finding work? .................................................................................................... 35
Figure 5.1 What actions, if any, have you taken to move to different accommodation? .... 37
Figure 5.2 What are the main barriers to moving to different accommodation? ................ 38
Figure 5.3 What, if anything, have you done to overcome these barriers to moving? ...... 39
Figure 6.1 What, if anything, have you done to reduce the amount of arrears you currently owe on this accommodation? ..................................................... 42
Figure 6.2 How often, since February this year, have you or your household run out of money before the end of the week or month? Please include any times when you have run out of money and had to use your credit card, an overdraft, or borrow to get by ...................................................................... 43
Figure 6.3 If you ever run out of money at the end of the week or month, how do you cover the shortfall? ....................................................................... 44

7
Post-implementation effects of the Benefit Cap (wave 2 survey)
AcknowledgementsThis research was commissioned by the Department for Work and Pensions. The project managers were Claire Frew, Saima Tarapdar and Rachel Tsang, and input was also received from Toby Nutley, Joy Thompson and Sue Bonner.
The authors would like to thank the Housing Benefit claimants who gave their time to participate in this research.
8
Post-implementation effects of the Benefit Cap (wave 2 survey)
The AuthorsStephen Finlay is Research Director at Ipsos MORI and Head of the Housing, planning and development team. He is Project Director for this element of the Benefit Cap evaluation and has worked in a similar role within a consortium evaluating the Removal of the Spare Room Subsidy.
Lewis Hill is a Senior Research Executive in Ipsos MORI’s Housing, planning and development team. He is Project Manager for the survey research with claimants and has managed a number of projects for the Department for Work and Pensions on welfare reform, covering the evaluation of the Removal of the Spare Room Subsidy and the Benefit Cap.

9
Post-implementation effects of the Benefit Cap (wave 2 survey)
Glossary of terms and list of abbreviationsAffected claimant Housing Benefit claimant affected by the Benefit Cap.
Since Housing Benefit is claimed by a family unit, this is usually the same as households.
The Benefit Cap The Cap, introduced from April 2013, limits the total amount of benefits that most out-of-work working-age households can receive to £500 a week for couples and families, and £350 a week for single people.
Discretionary Housing Payments awarded by local authorities when theyPayments consider that a claimant requires further financial
assistance towards housing costs. The Department for Work and Pensions (DWP) allocates funding for Discretionary Housing Payments (DHP) to local authorities who decide how to allocate it and may also choose to top up the funding from their own resources.
Housing Benefit Financial support paid to tenants (or to landlords on their behalf) for those who are out of work or on low incomes to help pay their rent. It can cover up to the entire value of the rent, depending on the claimant’s circumstances and income.
Single Housing Benefit Extract Housing Benefit and Council Tax Benefit statistics published by DWP are based on the Single Housing
Benefit Extract (SHBE) data source. SHBE is a monthly electronic scan of claimant-level data direct from local authority computer systems. It has been designed to provide sufficient information for all current and future statistical purposes, and is now the single source of Housing Benefit data.
Working Tax Credit A means-tested state benefit paid to those in work with a low income (paid by HM Revenue & Customs). Those who qualify for Working Tax Credit (WTC) (or with someone in their household who does) are not affected by the Benefit Cap.
10
Post-implementation effects of the Benefit Cap (wave 2 survey)
1 IntroductionThe Department for Work and Pensions (DWP) commissioned Ipsos MORI, an independent research organisation, to conduct a longitudinal survey over two waves to look at the effects of the Benefit Cap on a cohort of those identified as affected by the Cap from the October 2013 Single Housing Benefit Extract (SHBE). This included households who would have been capped during the implementation of the policy, which completed in September 2013.
This survey report feeds into a wider evaluation of the Benefit Cap, including: ad-hoc analysis of administrative data; in-depth interviews with claimants affected by the Cap; and interviews with local authorities and stakeholders. All will be published as part of the suite of evaluation publications informing the Benefit Cap Review following the Cap’s first year of operation. Further details can be found in Appendix C of this report.
This report presents findings from the wave 2 research using analysis conducted by Ipsos MORI, covering the following key themes:• the proportion of the cohort who self-identify as being either still affected or no longer
affected by the Benefit Cap since wave 1, and their characteristics in relation to aspects such as age, household composition, Benefit Cap amount, current work status and previous employment history;
• the identification of how, if at all, their responses to the Benefit Cap have changed over time, and whether they have taken some of the actions that they planned to at wave 1;
• the extent and role of Discretionary Housing Payments (DHP) in terms of the numbers who have applied, whether there have been any changes to those receiving DHP, and reasons for no longer receiving DHP. The analysis also considers differences in behaviours and impacts between those still receiving DHP, those that were receiving DHP but are not anymore, and those that have never received DHP;
• the effects of the Benefit Cap on attitudes to employment, in terms of whether the cohort have been more, or less, encouraged to find paid work, the extent of their employment-seeking activities, and the barriers they may face in finding work;
• the effects of the Benefit Cap on attitudes to moving home, identifying the number of respondents in the cohort who have moved in between surveys, as well as identifying those still wanting to move as a result of the Benefit Cap, what actions they have taken, and what barriers they have faced; and
• the financial effects of the Benefit Cap, including looking at the impact on rent arrears and household finances.
1.1 Aims of the studyThe objectives of this element of the evaluation are to:• evaluate the effects of the Benefit Cap on affected claimants’ behaviour, particularly
in relation to employment, housing and household finances, and to understand the characteristics of the cohort of claimants;

11
Post-implementation effects of the Benefit Cap (wave 2 survey)
• look at these changes in behaviour over time and understand what is driving and/or preventing different responses to the Benefit Cap; and
• cover the gaps in knowledge in the current package of evaluation and supplement the official statistics and other outputs being published as part of the suite of evaluation material on the household Benefit Cap.
1.2 BackgroundIn April 2013, the Government introduced a cap on the total amount of benefit that most working-age households (between 16 and the female State Pension age1) can receive so that, broadly, households on out-of-work benefits will no longer receive more in welfare payments than the average weekly wage after tax for working households. The Cap limits the combined sum that a household2 may receive in benefits to £500 a week for families/couples and £350 a week for single people without dependent children. Details of the benefits to which the Cap applies and exemptions can be found in Appendix B.
1.3 Research methodsAt wave 1 Ipsos MORI conducted a telephone survey among a representative sample of claimants known to be affected by the Benefit Cap at the time the SHBE was selected. A total of 1,200 interviews were conducted, of which 1,060 respondents self-identified as currently affected by the Benefit Cap at the time of interview, and 140 respondents said they were no longer affected. Fieldwork was conducted between 7 and 26 February 2014, with wave 1 results published in a Headline Summary Report in April 20143.
A follow-up (wave 2) survey was conducted with wave 1 respondents who agreed to be re-contacted, following several keeping in touch exercises designed to keep respondents engaged with the research and to request any updated personal details (in particular any new contact and/or address details). Of the original group of respondents from wave 1, 940 agreed to be re-contacted for the wave 2 survey4. Fieldwork was conducted between 11 August and 15 September 2014 (though most interviews were completed by the end of August). To provide a consistent view, this original group of self-identified affected claimants was also used to draw the sample for the in-depth interviews with claimants, results of which are published alongside this work (for further information, see Appendix C).
1 This was age 61.5 in April 2013.2 In relation to the application of the Benefit Cap, the term household represents the
basic family unit for the purposes of administering out-of-work benefits, which can be made up of a single adult or a couple, and any dependent children or qualifying young people for whom that adult or couple are responsible. These households are termed benefit units. Any individuals, such as adult children, grandparents, etc. living in the same house, who may claim benefits independently, are not included in the same Benefit Cap calculation.
3 DWP (14 April 2014). ‘Post-implementation effects of the benefit cap: headline findings’, available online at:www.gov.uk/government/publications/benefit-cap-post-implementation-effects-headline-findings, accessed on 4 December 2014.
4 Further information on the profile of wave 1 and wave 2 respondents can be found in Appendix A.

12
Post-implementation effects of the Benefit Cap (wave 2 survey)
A total of 468 telephone interviews were completed at wave 2, of which 333 respondents self-identified that they were still affected by the Benefit Cap and 96 identified that, since wave 1, they were no longer affected. A further 39 respondents self-identified as being both unaffected at wave 1 and at wave 2.
The focus of analysis in this report is on the 429 claimants who were affected by the Benefit Cap at wave 1 and who were either still affected, or who were no longer affected, at wave 2. It is this group of wave 2 respondents, that is those who said they were affected by the Benefit Cap at wave 1, who form the main focus of analysis throughout this report (known as the ‘cohort’ or ‘analysis group’ hereafter).
As the purpose of the wave 2 research is to assess how the original wave 1 cohort has been affected by the Benefit Cap over time, the data for both waves is weighted to be representative of the wave 1 profile in relation to age, gender, number of dependants, size of property (number of bedrooms) and amount by which claimants have been capped. This allows for like for like comparisons of this cohort group while mitigating against the effect of non-response between the two survey waves.
The original wave 1 survey data was weighted to be representative of the affected claimant sample sourced from the October 2013 SHBE. However, it is important to keep in mind that results from wave 2 are based on a specific group of claimants and reflect the characteristics of this group at a specific point in time. They will therefore not necessarily be representative of the entire affected claimant population as reflected by official statistics published on the Benefit Cap.
Use of a longitudinal survey approach provided the opportunity to minimise recall bias for key questions through the inclusion of previous responses recorded at wave 1. As with wave 1, analysis of wave 2 survey results is based on self-reported circumstances and behaviours.
Administrative data was also used in order to analyse results in more detail. Respondents were asked for permission to link their survey responses with relevant administrative data held by DWP, with 90 per cent consenting to having their responses linked with information about their Housing Benefit claim in this way.
The purpose of this data linking exercise was, firstly, to validate survey responses against administrative data as an additional ‘sense-check’ on the robustness of the survey data. Secondly, the data linking exercise allowed for further analysis of results and a greater understanding of the impacts of the Benefit Cap on the cohort of claimants. Where relevant, findings from this exercise are included in the body of the report. Further information about the data linking process can be found in Appendix A.
As a sample survey, that is to say, a subset of the overall population of claimants affected by the Benefit Cap, it is also important to bear in mind that all survey estimates will have associated tolerances. At the 95 per cent confidence interval, a respondent base of 429 gives a sampling tolerance (or predicted range of responses) of no greater than +/-4. Further information on statistical reliability and survey methodology can be found in Appendix A.
13
Post-implementation effects of the Benefit Cap (wave 2 survey)
1.4 Key findings1.4.1 Characteristics of survey respondentsClose to four in five respondents who were affected by the Benefit Cap at wave 1 were still affected at wave 2, with 22 per cent of the cohort of respondents no longer affected.
Half of those no longer affected said this was because they had found work (50 per cent), some of whom said they had not been in regular employment prior to becoming affected by the Benefit Cap (24 per cent of those no longer affected). Around a quarter (26 per cent) said they were no longer affected because they had begun to receive a benefit, such as Disability Living Allowance or Working Tax Credit (WTC)5, which exempts them. Official Statistics show 11 per cent of all no longer affected claimants moved to an exempt benefit (not including WTC). Some respondents no longer affected by the Benefit Cap had moved (13 per cent) in order to become unaffected, most commonly into the social rented sector.
1.4.2 Responses to the Benefit CapWave 1 survey results suggested that many of the cohort had acted in response to being affected by the Benefit Cap, with many planning to take further action in the future. Cutting back (on both essentials and non-essentials6) and looking for work were the most commonly mentioned responses to being affected by the Benefit Cap, a pattern also evident from wave 2 survey results, with a greater proportion of respondents saying they had cut back on non-essentials (30 per cent, up from 24 per cent in wave 1). In contrast, fewer respondents (six per cent compared with 12 per cent in wave 1) said spontaneously that they had applied for a Discretionary Housing Payment (DHP) in order to deal with being affected by the Benefit Cap.
Around one in five respondents at wave 1 said they had not taken any action to deal with the changes at all, with those paying less in rent or whose benefits were capped by a smaller amount more likely not to have done anything in this regard. Of this group, most (63 per cent) said they had taken some form of action by wave 2.
The vast majority of those who had said at wave 1 that they planned to look for work said they had done some work-seeking by wave 2. Around two in five of this group were successful in finding work (and for many this meant becoming unaffected by the Benefit Cap).
Close to three in five (59 per cent) of respondents had applied for DHP by wave 2, up from 43 per cent in wave 1 (with many having applied in the intervening period). There are indications from the data that those in receipt of DHP at the time of interview were less likely than those not in receipt to have felt adverse financial impacts of being affected, and were less likely to feel they had not made any progress overcoming barriers they had identified to finding work.
5 See section 2.2 for further details – this figure includes a proportion of respondents in receipt of Working Tax Credit largely because of the way that respondents’ responses were recorded.
6 These were self-defined by respondents.
14
Post-implementation effects of the Benefit Cap (wave 2 survey)
1.4.3 Employment-related effects of the Benefit CapOne of the primary aims of the Benefit Cap policy is to encourage employment among those who are out of work and in receipt of benefits, and results from the survey suggest that the policy has encouraged some work-seeking activity.
One in five (20 per cent) of the cohort was in work at wave 2, up from nine per cent in wave 1. Most of those who found work were no longer affected by the Benefit Cap as a result. Overall, 44 per cent of respondents said they had felt more encouraged to find paid work as a result of being affected by the Benefit Cap.
Those who said they are less frequently in work (‘sometimes/rarely/never’) are more likely to say they have been more encouraged by the policy to find paid work than those who say they are more frequently in work (‘always/mostly’), at 49 per cent and 37 per cent respectively.
While the majority said that the Cap had made no difference to them at wave 2 in terms of trying to find paid work, using employment services, submitting applications and/or attending job interviews, a significant minority reported that, as a result of the Cap, they were doing an increasing amount of these actions. The proportion who said they were doing more in terms of attending job interviews and/or using employment-related services increased significantly between the two waves of the survey (from 14 per cent and 27 per cent, to 20 per cent and 35 per cent respectively).
However, most respondents perceive there are a number of barriers to finding paid work, with the availability and/or cost of childcare featuring prominently here. Many feel they have not been able to make much progress in overcoming barriers to finding work.
1.4.4 Housing-related effects of the Benefit CapBy the time of the wave 2 survey, around one in ten respondents had moved to alternative accommodation. Half (five per cent of the cohort) moved to social rented accommodation, with two per cent to private rented accommodation and three per cent into temporary accommodation. Most of those who moved said they did so at least in part because of being affected by the Benefit Cap.
Many of those who are still affected at wave 2 continue to consider moving to new accommodation, though the proportion has fallen since wave 1 (down to 36 per cent from 42 per cent). Many have taken action with a view to finding new accommodation, though respondents looking to move were more likely to have done things like searching for properties and seeking advice from the council than registering for a transfer or mutual exchange.
Close to two-thirds of respondents who were looking to move in wave 2 perceive there are barriers to them moving elsewhere, with cost and availability of affordable properties (51 per cent) the most mentioned barrier to moving.
1.4.5 Financial-related effects of the Benefit CapFindings from wave 1 suggested that the Benefit Cap had impacted upon many respondents and resulted in them making a number of changes to the way they managed their household finances. Wave 2 findings suggest that the financial impacts of the Benefit Cap continue to be felt by a significant number of the cohort.

15
Post-implementation effects of the Benefit Cap (wave 2 survey)
The proportion of respondents in rent arrears has changed little since wave 1 (39 per cent compared with 41 per cent), with those no longer affected by the Cap much less likely to be in arrears than those who still are. One-quarter (25 per cent) of the cohort said they are in arrears ‘most/all of the time’, and the majority of those in arrears said the amount they owe has increased since wave 1. Many have, however, negotiated rent repayment plans with their landlords to help repay the amount they owe, while others have cut back on spending or sought advice.
When asked to define their financial resilience in terms of the frequency with which their household runs out of money before the end of the week or month, half (50 per cent) said this happens ‘very often’. The most common way of covering the shortfall is borrowing from friends or family.

16
Post-implementation effects of the Benefit Cap (wave 2 survey)
2 Characteristics of survey respondents
As part of this element of the evaluation, it is important to look at the characteristics of the cohort and understand their profile in relation to key demographic characteristics, as well as their status in relation to the Benefit Cap and the proportions still affected and no longer affected.
More than three-quarters (78 per cent) of wave 2 respondents who self-identified as being affected by the Benefit Cap at wave 1 said they were still affected by the Benefit Cap at wave 2, compared with 22 per cent who said they were no longer affected.
Of this group, and as at wave 1, women make up a significant proportion of the cohort, accounting for four in five respondents (80 per cent). As at wave 1, respondents in the analysis group are also most likely to be living in larger families and be longer-term recipients of Housing Benefit. Four in five respondents have three or more dependent children living in the household and have been in receipt of benefits (of any kind) for three years or longer.
Overall, just under four in ten (37 per cent) are from a black or minority ethnic background while similar proportions are aged 34 or under (43 per cent), or report a long-term illness, health problem or disability in their household (40 per cent) which did not entitle those who are still affected to a disability-related benefit which would exempt them from the Cap. There is a fairly even split between private renters (42 per cent of the cohort) and social renters (48 per cent), with other respondents either in temporary or another form of accommodation.
As shown in Figure 2.1, a majority of those surveyed (69 per cent) report they are currently unemployed7 and a third (34 per cent) are unemployed and seeking work, down from 43 per cent in wave 1. Two in ten in this cohort are, however, in work8 (20 per cent), compared to fewer than one in ten (nine per cent) when surveyed in wave 1. Of those currently in work, half (ten per cent of all respondents) said they are working part-time between 16-29 hours. The mean gross income of the cohort group (including earnings) is £380 a week.
Additionally, nearly a fifth (18 per cent) describe their current work status as ‘long-term sick or disabled’ (ten per cent) or ‘carer’ (eight per cent), proportions that have changed little since wave 1 (nine per cent and six per cent respectively). Note, however, that those in this group who are still affected are not in receipt of a disability-related benefit which would exempt them from the Cap.
7 Working and being entitled to Working Tax Credits (WTCs) will exempt households from being capped.
8 This includes those who said they are working full-time, part-time and those who said they are self-employed.

17
Wave 1 Wave 2
Don’t know/refused
Other
Carer
Full-time education, trainingscheme/apprenticeship
Long-term sick or disabled
Unemployed – not seeking work
Unemployed – seeking work
Self-employed
Working part-time(less than 16 hours a week)
Working part-time(16-29 hours a week)
Working full-time(30 hours a week or more)
Percentages
32
68
31
910
2724
4334
21
34
103
14
**
Base: All respondents in the analysis group (wave 2: 429, wave 1: 1,060).Fieldwork dates 7 – 26 February and 11 August – 15 September 2014.NB: Self-employed broken down in Wave 2 (1% 30 hours or more per week, *% 16-29 hours per week, 1% less than 16 hours per week).
Post-implementation effects of the Benefit Cap (wave 2 survey)
Figure 2.1 How would you best describe your current work status?
There is no difference between one-parent families (22 per cent) and two-parent families (20 per cent) in terms of their likelihood of being in work. However, one-parent families who are working are more likely than two-parent families to be doing so part-time (13 per cent compared to seven per cent). Men are statistically significantly more likely to be working full time than women (14 per cent compared to one per cent), though note that this question relates solely to the named claimant, some of whom may have partners or other family members in their household who are in work and with different working patterns.

18
Post-implementation effects of the Benefit Cap (wave 2 survey)
2.1 Respondent status in relation to the Benefit Cap
As noted above, during the intervening period between wave 1 and wave 2, the proportion of respondents currently affected by the Benefit Cap has fallen. More than three-quarters (78 per cent) of wave 2 respondents who said they were affected by the Benefit Cap at wave 1 said they were currently affected by the Benefit Cap at wave 2, whereas 22 per cent said they were no longer affected. This compares to 88 per cent and 12 per cent respectively at wave 1. This fall is to be expected as the cohort has had longer to take actions in response to being affected by the Benefit Cap.
The extent to which respondents’ benefits are capped among this cohort remains the same as wave 1. Nearly three in ten (28 per cent) are capped by up to £25 a week, while a fifth (21 per cent) are capped by £25 or more but less than £50 a week. Almost a quarter (24 per cent) have had their benefits capped by £100 or more a week.
Table 2.1 shows some key demographic characteristics of the cohort at wave 2, distinguishing between those that said they are currently affected and those that said they are no longer affected.
Table 2.1 Selected demographic characteristics of wave 2 cohort groups (statistically significant differences are denoted with asterisks in the second column)
Still affected (n=333)
No longer affected (n=96)
GenderMale 19% 27%*Female 81% 73%*Age16-34 44% 38%35-44 39% 45%45+ 16% 18%Work StatusWorking (including self-employed) 13% 46%*TenureHousing association 22% 17%Council/local authority 26% 28%Private landlord 42% 43%Limiting health problem/disability in household?Yes 39% 44%Household compositionOne-parent family with two or more children 60% 51%*Two-parent family with two or more children 32% 42%*Other household composition 8% 6%
The table suggests that there are some differences between the two groups in terms of their demographic characteristics (though note many of these differences are not statistically significant).
19
Post-implementation effects of the Benefit Cap (wave 2 survey)
2.2 Reasons why respondents became unaffected by the Benefit Cap
Respondents who said they were no longer affected by the Benefit Cap were asked to indicate why they were no longer affected. Half (50 per cent) of those no longer affected said this is due to them or someone else in the household having found a job. Further analysis of this group indicates that those without a self-reported limiting health problem or disability (62 per cent) and those living in larger families with three or more dependants (56 per cent) are statistically significantly more likely to say they have found work as the reason for no longer being affected.
Nearly half (49 per cent) of those who found work and are no longer affected said they have typically been in work only sometimes, rarely or never before becoming affected by the Benefit Cap. This suggests that nearly a quarter (24 per cent) of all those no longer affected because of finding work had not been in regular employment prior to becoming affected by the Benefit Cap.
A further quarter (26 per cent) of those we surveyed who are no longer affected spontaneously mentioned that they have started to receive other benefits such as Disability Living Allowance (DLA) or Working Tax Credit (WTC), which exempts them from the Cap. Official statistics show 11 per cent of all no longer affected claimants moved to an exempt benefit (not including WTC). The figure of 26 per cent should be treated as indicative only given the smaller base size on which it is based9. This figure rises to 49 per cent among those no longer affected who report that they or someone in their household has a limiting health problem or disability.
Additionally, 13 per cent of those no longer affected said they have moved to another property (of which ten per cent have moved to a property in the social rented sector and four per cent in the private rented sector). Those living in the social rented sector are statistically significantly more likely than those no longer affected overall to have moved to a different property in the social rented sector (18 per cent compared to ten per cent overall).
Smaller proportions of those no longer affected said that a change in their household composition meant they were no longer capped (four per cent), that they had increased their working hours in an existing job (two per cent) or that they had renegotiated a lower rent with their landlord (one per cent). Other individual responses were cited by four per cent of respondents, while one per cent said they were unsure about why they were no longer affected.
Official statistics are published on the Benefit Cap10 covering all households affected since its introduction (as opposed to the cohort of respondents in this report). The official statistics published on 6 November, show that over 50,000 households have been capped, with 47 per cent no longer capped. Of those no longer capped the most common reason is due to a WTC claim, 40 per cent are exempt due to this. Other reasons for off-flow are lower in proportion and include a reduction in benefit income (14 per cent) reduction in Housing Benefit (13 per cent), movement to an exempt benefit (11 per cent) or no longer claiming Housing Benefit (11 per cent).
9 Based on a sample of 96 the tolerance associated with this estimate is ±9 per cent, meaning the true value could lie between 17 per cent and 35 per cent. Please refer to Appendix A for further information about sampling tolerances.
10 Department for Work and Pensions: Benefit cap statistics (www.gov.uk/government/collections/benefit-cap-statistics)
20
Post-implementation effects of the Benefit Cap (wave 2 survey)
The figure of 26 per cent in receipt of an exempt benefit in the survey is higher than current official statistics estimates largely because of the way that respondents’ responses were recorded. Many respondents who said they now have a WTC claim were recorded in the survey as being in receipt of an exempt benefit (whereas official statistics treat receipt of WTC as a movement into work, and receipt of exempting benefits, for example DLA, as a separate category).
Data linking analysis supports this, suggesting that many of those who report being in receipt of an exempt benefit could actually be in receipt of WTC – 21 of the 25 respondents who said they are in receipt of an exempt benefit gave their consent for data linking. Of this group, nine were in receipt of either WTC (or Child Tax Credit, which are flagged together) according to the August 2014 Single Housing Benefit Extract (SHBE). As such, this figure is likely to be an overestimate, though these findings should be treated with caution as they are based on such a small group of respondents.Furthermore, these findings are based on the cohort of respondents first surveyed in February 2014 and subsequently agreeing to be re-contacted, rather than being reflective of the wider caseload of all people affected by the Benefit Cap on which administrative statistics are based11.
11 Further examination of administrative data on capped households including both off-flows over time resulting in potential differences between capped claimants’ changes in circumstances relative to comparator groups has been carried out. This work is published in an ad hoc analytical publication alongside this report (further details presented in Appendix C).
21
Post-implementation effects of the Benefit Cap (wave 2 survey)
3 Responses to the Benefit CapWave 1 survey results indicated that many of the cohort had already taken actions in response to being affected by the Benefit Cap and many planned to take further actions in the future. It also highlighted a significant minority of respondents (17 per cent) who indicated they had not taken any actions in response to being capped. The wave 2 survey provided the opportunity to follow-up with the cohort to identify any longer-term changes in coping behaviours in response to the Benefit Cap. This chapter also considers the role of Discretionary Housing Payments (DHP) and the extent to which it has influenced coping behaviours, responses and impacts of being affected by the Benefit Cap.
3.1 Coping behaviours and responsesSpending less and looking for paid work remain the most common responses to being affected by the Benefit Cap. Respondents were asked on an unprompted basis what, if anything, they had done in response to the reduction in their benefits. In wave 2, as with wave 1, respondents were most likely to have spent less on household essentials (35 per cent), to have spent less on non-essentials (30 per cent) and to have looked for a job (28 per cent)12.
Figure 3.1 shows that since wave 1 there has been a statistically significant increase in the proportion of respondents who said they have spent less on non-essentials (24 per cent in wave 1 compared to 30 per cent in wave 2). There have also been small, but not statistically significant rises in the proportions of those who said they have spent less on household essentials (32 per cent in wave 1 compared to 35 per cent in wave 2) and those who said they have looked for a job (25 per cent in wave 1 compared to 28 per cent in wave 2).
There is some variability in responses to the Benefit Cap across sub-groups in relation to the most commonly stated actions. Larger families (defined here as families with three or more dependents) as well as lone parent households are statistically significantly more likely than the cohort overall to have spent less on both essentials and non-essentials, as too are those who have a self-defined limiting health problem or disability (42 per cent said they have spent less on essentials compared to 35 per cent overall). Note, however, that those in this group who are still affected are not in receipt of a disability-related benefit which would exempt them from the Cap. Those that perceive there are barriers to them finding work were also more likely to say they have spent less on both essential and non-essential items (41 per cent and 34 per cent respectively compared with 35 per cent and 30 per cent overall). The sub-groups most likely to say they have looked for a job included those that are currently working (59 per cent) and those from a black or minority ethnic background (41 per cent).
12 Both ‘household essentials’ and ‘non-essentials’ were not defined by the interviewer but self-defined by the respondent.

22
Post-implementation effects of the Benefit Cap (wave 2 survey)
Percentages
35
4
6
4
5
3
4
8
3
4
1
Base: All respondents in the analysis group (429). Fieldwork dates 11 August –15 September 2014. Responses of 2% or less not shown. This question was asked on an unprompted basis.
30
28
21
Don’t know
None of these
Other
Sought advice or help fromcouncil or HA (landlord)
Sought advice or help fromsomeone else (e.g. a charity)
Looked at moving toanother property in SRS
Applied for/started takinga training course
Not paid rent and goneinto rent arrears
Not paid other household bills andgone into or added to debt
Applied for DHP
Borrowed money from friends/family(which you intend to pay back)
Looked for a job
Spent less on non-essentials
Spent less on household essentials
Figure 3.1 Since we last spoke with you in February this year, what, if anything, have/did you/your family do in response to the reduction in your benefits since/whilst being affected by the Benefit Cap?
Wave 2 results also indicate a statistically significant decrease in the proportion of respondents spontaneously saying that they have applied for DHP. This has fallen from 12 per cent in wave 1 to just six per cent in wave 2. Although further analysis highlights few significant differences among sub-groups, younger respondents (under 35) are least likely to spontaneously mention applying for DHP (three per cent) while those living in larger properties (with four or more bedrooms) are more likely to have said spontaneously that they applied (11 per cent). Further information on the application and receipt of DHP is presented in Section 3.3.
There has been a small, but not significant, increase in the proportion of respondents saying they have taken no action in response to their benefits being capped (17 per cent in wave

23
Post-implementation effects of the Benefit Cap (wave 2 survey)
1 compared to 21 per cent in wave 2). Respondents who said this are more likely to be younger (27 per cent of those aged under 35), pay lower rent (34 per cent of those paying less than £100 a week), and be affected less financially by the Benefit Cap (24 per cent of those capped by less than £25 a week).
3.2 Taking actions in response to the Benefit CapLooking for paid work continues to be a priority for many affected by the Benefit Cap. In wave 1, respondents who were currently affected by the Cap were asked unprompted what, if anything, they were planning to do to deal with being affected. During wave 2 we followed this up by asking whether or not respondents had taken any of the actions they said they had planned to.
Findings from wave 2 show that many respondents said they have taken the actions they planned at wave 1. For instance, almost all of those who said they planned on spending less on essentials and non-essentials at wave 1 (96 per cent and 88 per cent respectively) had done so. Further, approaching half (45 per cent) of those surveyed at wave 1 said they planned on looking for a job, and in wave 2, 85 per cent of this group said they had done so.
Furthermore, two in five (40 per cent) of those who said spontaneously they had looked for a job at wave 1 said they had been successful by wave 2. As might be expected, the proportion saying they had been successful varies markedly between those no longer affected and those still affected (71 per cent and 29 per cent respectively)13.
Additionally, the survey followed up with those who at wave 1 said they did not have any plans to deal with being affected by the Benefit Cap. Of all those who said they planned on doing nothing in wave 1, almost two-thirds (63 per cent) said they had taken some action since wave 1.
Among those still affected at wave 2, while 41 per cent indicated they still have not done anything, nearly a quarter (23 per cent) indicated they have looked for a job, while 15 per cent said they have cut back on household essentials.
Those who said they had still not taken any action since wave 1 were asked an open-ended question about why this was so. While this only represents a small proportion of the cohort, reasons that respondents gave for not taking any action varied, including being affected only by a small amount and therefore not needing to act, not feeling that there was anything that could be done to change the situation, and some who had health problems which made taking any action difficult.
3.3 Discretionary Housing PaymentAnalysis of wave 1 results indicated that those affected may not have seen DHP as a long-term solution and indeed this may have been impacting on some of the stated short-term and longer-term responses among those affected by the Benefit Cap. Wave 2 asked in more detail about DHP to assess the proportion of the cohort that had applied for DHP since being affected as well as identify any changes to the DHP award and reasons for no longer receiving DHP.
13 The majority who say they had been successful but are still affected are predominantly working part-time and potentially below the Working Tax Credit threshold.

24
Post-implementation effects of the Benefit Cap (wave 2 survey)
Wave 2 data shows that the majority (59 per cent) of those surveyed said they have applied for DHP (compared to 43 per cent in wave 1). Note that there was a significant change in the way this question was asked of respondents between waves 1 and 214.
Part of the reason for this increase seems to be that many of those who had not heard of DHP at wave 1 had since applied by wave 2. Two in five (40 per cent) of the cohort had not heard of DHP at wave 1, but one-third (33 per cent) of this group have since applied (13 per cent of respondents overall). Similarly, 35 per cent of those who had heard of DHP at wave 1 but had not applied have since made an application for DHP (five per cent of respondents overall), which helps to account for this increase.
Data from wave 2 shows that more than two in five (42 per cent) of respondents applied for and received DHP, half of whom (22 per cent overall) are no longer receiving them. Those who applied for and got DHP and who are still receiving them are more likely to have a Benefit Cap of at least £100 a week (41 per cent), pay £300 or more in rent a week (29 per cent) or live in a council/local authority property (39 per cent).
Respondents who are no longer receiving DHP are more likely to be from one-parent families with two or more children (68 per cent) or from a black or minority ethnic background (48 per cent).
Almost a third (31 per cent) of respondents said they had not applied for DHP. Those who had not applied are more likely to have had their benefits capped by less than £25 a week and are more likely to be up to date with their rent payments (67 per cent). Very few said they have never heard of DHP, which despite the change in survey question wording, suggests awareness of DHP has risen between survey waves.
Among those who are still receiving DHP, more than half (54 per cent) said there has been no change to their award since we last spoke to them at wave 1. However, those whose award has changed are most likely to say it has decreased. Three in ten (29 per cent) who are still receiving DHP reported a decrease in the amount they receive and one in ten (11 per cent) said that the amount of DHP they receive has increased15.
Among those who are no longer receiving DHP, more than a third of those surveyed said that when the DHP term came to an end they reapplied but did not get it (35 per cent), and a similar proportion said that they did not reapply (37 per cent). A further 16 per cent said they no longer receive DHP as they are no longer affected by the Benefit Cap.
14 In wave 1, respondents were asked initially if they had heard of DHP. Those who had were then asked if they had applied/been successful or not. In wave 2 the question was framed differently to ask all respondents about their situation in relation to DHP in anticipation of the fact that most respondents, having been prompted at wave 1, would be aware of DHP when re-interviewed.
15 These estimates should be treated with the appropriate caution given the base sizes for analysis.

25
Post-implementation effects of the Benefit Cap (wave 2 survey)
Don’t know
Have never heard of DHP
I have not applied for DHP
I have applied for DHP but amstill waiting to hear
I applied for but did not get DHP
I applied for and got DHP, but amno longer receiving them
I applied for and got DHP,and am still receiving them
Percentages
31
5
6
4
Base: All respondents in the analysis group (429). Fieldwork dates 11 August –15 September 2014.
20
22
11
Figure 3.2 Which of the following statements best describes your situation in relation to Discretionary Housing Payments, or DHP?
26
Post-implementation effects of the Benefit Cap (wave 2 survey)
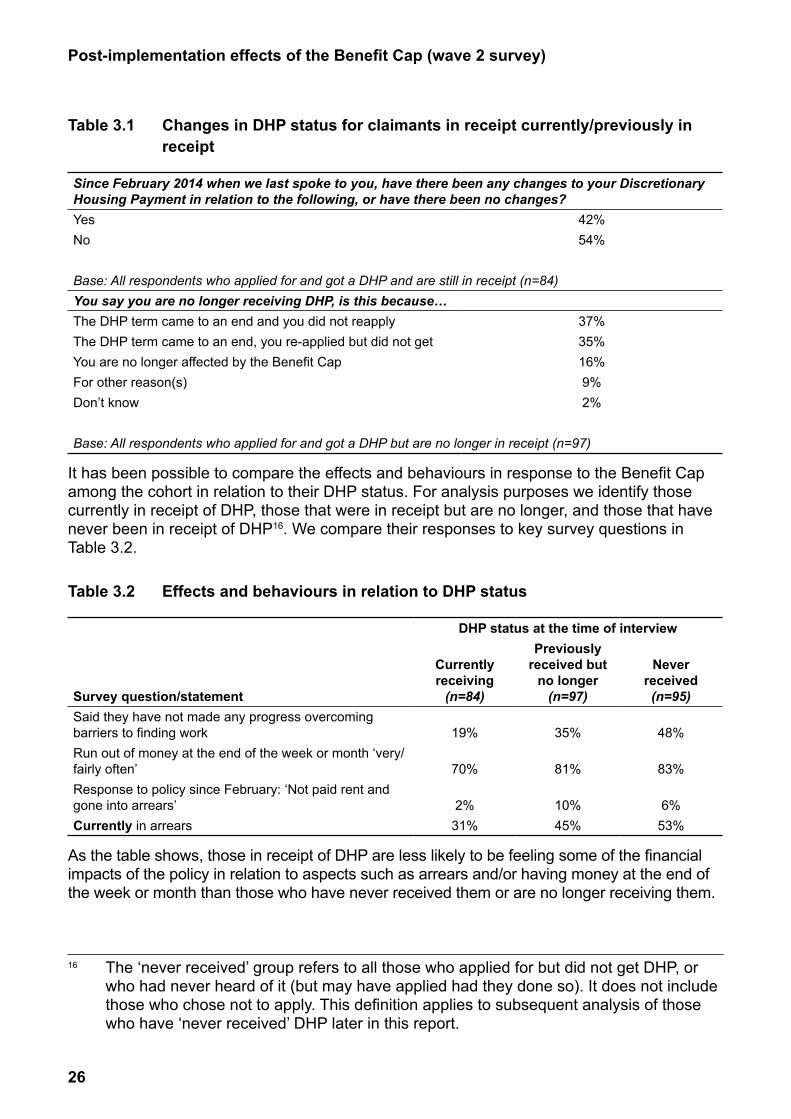
Table 3.1 Changes in DHP status for claimants in receipt currently/previously in receipt
Since February 2014 when we last spoke to you, have there been any changes to your Discretionary Housing Payment in relation to the following, or have there been no changes?Yes 42%No 54%
Base: All respondents who applied for and got a DHP and are still in receipt (n=84)You say you are no longer receiving DHP, is this because…The DHP term came to an end and you did not reapply 37%The DHP term came to an end, you re-applied but did not get 35%You are no longer affected by the Benefit Cap 16%For other reason(s) 9%Don’t know 2%
Base: All respondents who applied for and got a DHP but are no longer in receipt (n=97)
It has been possible to compare the effects and behaviours in response to the Benefit Cap among the cohort in relation to their DHP status. For analysis purposes we identify those currently in receipt of DHP, those that were in receipt but are no longer, and those that have never been in receipt of DHP16. We compare their responses to key survey questions in Table 3.2.
Table 3.2 Effects and behaviours in relation to DHP status
DHP status at the time of interview
Survey question/statement
Currently receiving
(n=84)
Previously received but
no longer (n=97)
Never received (n=95)
Said they have not made any progress overcoming barriers to finding work 19% 35% 48%Run out of money at the end of the week or month ‘very/fairly often’ 70% 81% 83%Response to policy since February: ‘Not paid rent and gone into arrears’ 2% 10% 6%Currently in arrears 31% 45% 53%
As the table shows, those in receipt of DHP are less likely to be feeling some of the financial impacts of the policy in relation to aspects such as arrears and/or having money at the end of the week or month than those who have never received them or are no longer receiving them.
16 The ‘never received’ group refers to all those who applied for but did not get DHP, or who had never heard of it (but may have applied had they done so). It does not include those who chose not to apply. This definition applies to subsequent analysis of those who have ‘never received’ DHP later in this report.

27
Post-implementation effects of the Benefit Cap (wave 2 survey)
It also appears that respondents who said they are currently receiving DHP are also more likely to feel they have made progress in overcoming barriers to finding work. They are also less likely to feel there are barriers to them finding employment (63 per cent compared with 73 per cent of those who have never received DHP, though this is not a statistically significant difference). This may reflect some element of conditionality among those still receiving DHP (having to demonstrate they are looking for work as a condition of receipt of DHP), or equally may reflect a greater sense of progress through additional skills or training but without yet resulting in paid employment.

28
Post-implementation effects of the Benefit Cap (wave 2 survey)
4 Employment-related effects of the Benefit Cap
A key focus of the Benefit Cap policy is to encourage those out of work and on benefits to find employment. The wave 2 survey provided an opportunity to follow up with the cohort to see what, if any, specific employment-related actions have been undertaken in response to the Cap. It also considers further some of the barriers to employment that the cohort has identified.
4.1 Employment-related actionsEarlier analysis in section 2 indicated that one in five (20 per cent) of the cohort said they are currently in work at wave 2, statistically significantly higher than the nine per cent recorded at wave 1.
Wave 2 looked at whether respondents were more, or less, likely to undertake a number of employment seeking activities. The data from this wave indicates that although a majority said they have been doing the same amount of activity as a result of the Cap since we last spoke to them in February 2014 (wave 1), it is encouraging an increasing amount of employment-related activity for a significant minority of the cohort and particularly among key target groups for the policy (including the unemployed who are seeking work)17.
More than a third (35 per cent) are using, or have used, employment services such as Jobcentre Plus more frequently as a result of being affected by the Benefit Cap, a statistically significant increase of eight percentage points from 27 per cent in wave 1. The proportion who said they are using these services more frequently also rises significantly to just over half among those who are unemployed and seeking work (52 per cent) and to 45 per cent among those who are working. However, just over half (53 per cent) of survey respondents are using these services about the same amount as before being affected by the Benefit Cap, and one in ten said they are using them less (11 per cent).
17 Note that findings for this question include all respondents regardless of their current work status.

29
Post-implementation effects of the Benefit Cap (wave 2 survey)
Table 4.1 Since we last spoke to you in February 2014, would you say that as a result of being affected by the Benefit Cap, you are doing/did the following things more or less often than before or about the same amount?
Wave 2 (August/September 2014)Activity Less Same amount MoreTrying/tried to find paid work – whether a new job or extra work 9% 51% 38%Using/used any employment services (like JobCentre Plus, local careers centre or recruitment agency, etc.) 11% 53% 35%Submitting/submitted applications to find paid work 11% 55% 32%Going/went to job interviews 16% 63% 20%
For half of respondents the amount of time they are spending trying to find a new job or extra work (51 per cent) has not changed since wave 1, though many claimants will have been on benefits with work search requirements (such as Jobseeker’s Allowance (JSA)) during this period. However, approaching two in five (38 per cent) said they are now spending more time trying to find a new job or extra work. This rises significantly to almost three in five among those who said they are currently unemployed and seeking work (57 per cent) and to just over half (52 per cent) among those who are currently working. These figures are statistically significantly higher than for respondents overall.
More than half (55 per cent) of respondents have not changed the amount of time they are spending submitting job applications since wave 1. However, a third (32 per cent) are now spending more time on this – a statistically significant four percentage point increase from wave 1. This rises further to nearly half (48 per cent) among those who are currently unemployed and seeking work, and 41 per cent among those who are currently working. One in ten said they are spending less time on this now (11 per cent) rising to one in five (19 per cent) among those who said they ‘hardly ever/never run out of money’.
Three in five of those surveyed said they are spending (or spent) about the same amount of time attending job interviews since wave 1 (63 per cent), and one in six (16 per cent) said they are spending (or spent) less time on this, rising to a quarter (24 per cent) among those who are currently in work. However, one in five are spending more time on this – a statistically significant increase of six percentage points from wave 1 (14 per cent). This also increases significantly among those who said they are unemployed and seeking work and those who said they are currently working (27 per cent and 32 per cent respectively).
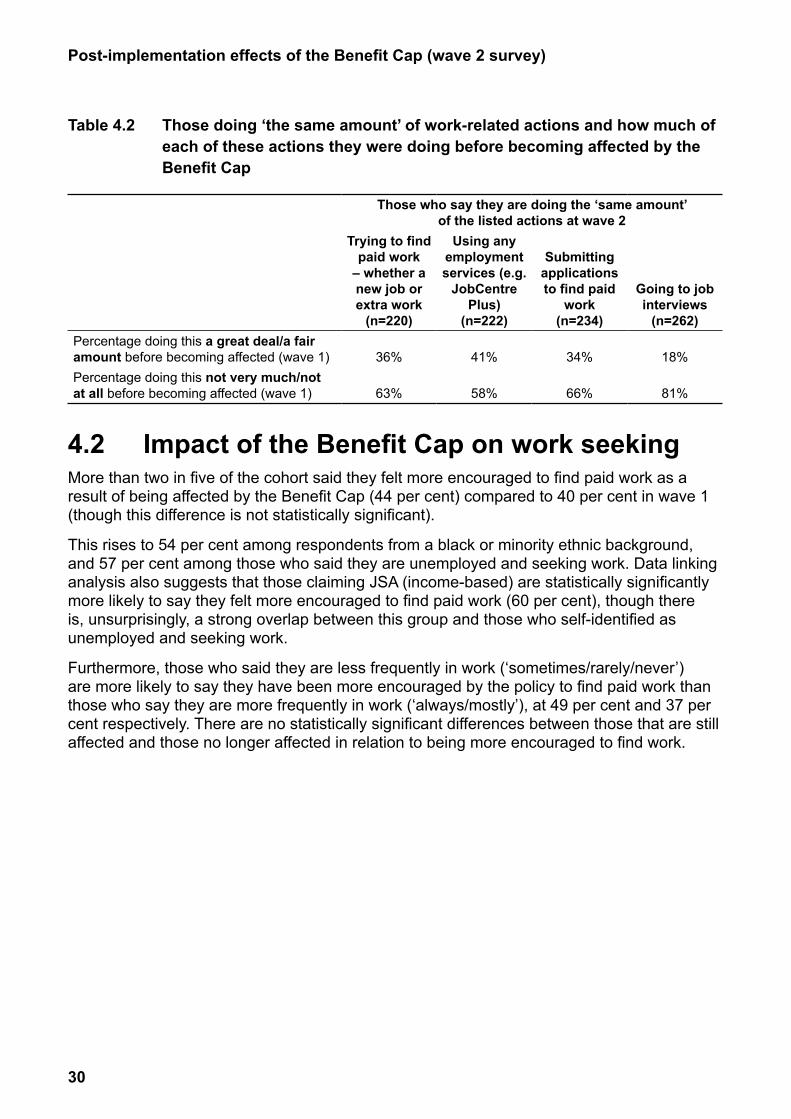
Analysis of those who said they are doing ‘the same amount’ of these work-related actions in wave 2 suggests that, for the majority, this is not because they were already being active in this regard before becoming affected by the Benefit Cap, as shown by Table 4.2.
30
Post-implementation effects of the Benefit Cap (wave 2 survey)
Table 4.2 Those doing ‘the same amount’ of work-related actions and how much of each of these actions they were doing before becoming affected by the Benefit Cap
Those who say they are doing the ‘same amount’ of the listed actions at wave 2
Trying to find paid work
– whether a new job or extra work
(n=220)
Using any employment services (e.g.
JobCentre Plus)
(n=222)
Submitting applications to find paid
work (n=234)
Going to job interviews
(n=262)Percentage doing this a great deal/a fair amount before becoming affected (wave 1) 36% 41% 34% 18%Percentage doing this not very much/not at all before becoming affected (wave 1) 63% 58% 66% 81%
4.2 Impact of the Benefit Cap on work seekingMore than two in five of the cohort said they felt more encouraged to find paid work as a result of being affected by the Benefit Cap (44 per cent) compared to 40 per cent in wave 1 (though this difference is not statistically significant).
This rises to 54 per cent among respondents from a black or minority ethnic background, and 57 per cent among those who said they are unemployed and seeking work. Data linking analysis also suggests that those claiming JSA (income-based) are statistically significantly more likely to say they felt more encouraged to find paid work (60 per cent), though there is, unsurprisingly, a strong overlap between this group and those who self-identified as unemployed and seeking work.
Furthermore, those who said they are less frequently in work (‘sometimes/rarely/never’) are more likely to say they have been more encouraged by the policy to find paid work than those who say they are more frequently in work (‘always/mostly’), at 49 per cent and 37 per cent respectively. There are no statistically significant differences between those that are still affected and those no longer affected in relation to being more encouraged to find work.

31
Post-implementation effects of the Benefit Cap (wave 2 survey)
Figure 4.1 Overall, would you say you have been/were more encouraged or less encouraged to find paid work as a result of being affected by the Benefit Cap, or has it made/did it make no difference to you?
Since wave 1, a lower proportion of the cohort report that being affected by the Benefit Cap has made no difference to them. Overall, two in five respondents (42 per cent) feel that it has made no difference to them in terms of encouraging them to find paid work, compared with 47 per cent in wave 1. This rises to two-thirds (66 per cent) of respondents who self-identified as long-term sick or disabled, more than half (54 per cent) of those who said they ‘hardly ever/never’ run out of money at the end of the week/month and half (51 per cent) of those who said they have been ‘always/mostly’ in work. Those capped by less than £25 a week were also more likely to say the Cap has made no difference in terms of encouraging them to find paid work (51 per cent).
Base: All respondents in the analysis group (wave 2: 429; wave 1: 1,060).Fieldwork dates 7 – 26 February and 11 August – 15 September 2014.
Don’t knowMade no difference
Less encouragedMore encouraged
Percentages
40
9
47
4
44
10
42
4
Wave 2Wave 1

32
Post-implementation effects of the Benefit Cap (wave 2 survey)
Figure 4.2 Differences between key subgroups in response to the question: Overall, would you say you have been/were more encouraged or less encouraged to find paid work as a result of being affected by the Benefit Cap, or has it made/did it make no difference to you?
4.3 Barriers to employment and actions to overcome them
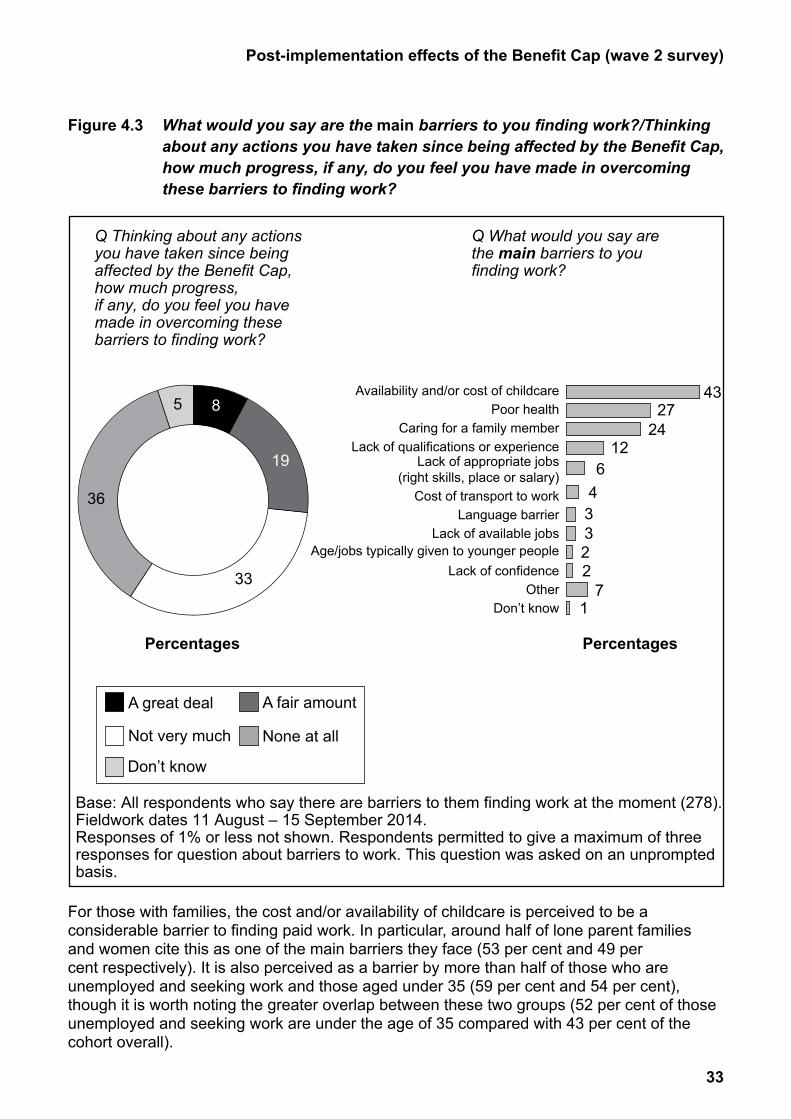
Despite some positive signs that the Benefit Cap is encouraging people to find paid work and increasing the time people spend on activities related to finding work, two-thirds of the cohort at wave 2 (65 per cent) perceive considerable barriers to employment. This rises to 69 per cent of those who are still affected by the Benefit Cap.
When asked on an unprompted basis about barriers to finding work, more than two in five mentioned the availability and/or cost of childcare (43 per cent). The next most commonly mentioned barrier for more than a quarter (27 per cent) is poor health, followed by caring responsibilities (24 per cent).
Base: All respondents in the analysis group (429).Fieldwork dates 11 August – 15 September 2014.
Percentages
44
10
42
457
56
54
49
37
Percentage more encouraged
Don’t knowMade no difference
Less encouragedMore encouraged
Those more frequently in work(always/mostly)
Those less frequently in work(sometimes/rarely/never)
Black or minorityethnic background
Those who looked for work inresponse to changes at W1
Unemployed andseeking work
33
Post-implementation effects of the Benefit Cap (wave 2 survey)
Base: All respondents who say there are barriers to them finding work at the moment (278).Fieldwork dates 11 August – 15 September 2014.Responses of 1% or less not shown. Respondents permitted to give a maximum of three responses for question about barriers to work. This question was asked on an unprompted basis.
Percentages Percentages
19
8
10
36
33
543
126
43322
71
2724
Don’t knowOther
Lack of confidenceAge/jobs typically given to younger people
Lack of available jobsLanguage barrier
Cost of transport to work
Lack of appropriate jobs(right skills, place or salary)
Lack of qualifications or experienceCaring for a family member
Poor healthAvailability and/or cost of childcare
Not very much
A fair amountA great deal
Don’t know
None at all
Q Thinking about any actions you have taken since being affected by the Benefit Cap, how much progress,if any, do you feel you have made in overcoming these barriers to finding work?
Q What would you say arethe main barriers to youfinding work?
Figure 4.3 What would you say are the main barriers to you finding work?/Thinking about any actions you have taken since being affected by the Benefit Cap, how much progress, if any, do you feel you have made in overcoming these barriers to finding work?
For those with families, the cost and/or availability of childcare is perceived to be a considerable barrier to finding paid work. In particular, around half of lone parent families and women cite this as one of the main barriers they face (53 per cent and 49 per cent respectively). It is also perceived as a barrier by more than half of those who are unemployed and seeking work and those aged under 35 (59 per cent and 54 per cent), though it is worth noting the greater overlap between these two groups (52 per cent of those unemployed and seeking work are under the age of 35 compared with 43 per cent of the cohort overall).
34
Post-implementation effects of the Benefit Cap (wave 2 survey)
Two-parent families are more likely to cite poor health than they are to cite childcare as a barrier to finding work (44 per cent compared to 30 per cent). Poor health is considered to be a barrier to finding work for almost all of those surveyed who report their work status as long-term sick or disabled (98 per cent), though those who are affected by the Benefit Cap are not in receipt of an exempting disability-related benefit which would take them outside the scope of the Cap. Furthermore, a third of those who are not working consider poor health to be a barrier (33 per cent). It is also more often cited as a barrier to work by men and respondents aged 45 or over (57 per cent and 55 per cent respectively).
Caring responsibilities (including caring for children) are perceived as a barrier to employment for a quarter of respondents (24 per cent), rising to 27 per cent among women and a third (32 per cent) among those currently living in private rented accommodation.
A lack of experience or qualifications was mentioned as a barrier to finding work by one in eight (12 per cent), rising to more than a quarter (26 per cent) among those who had ‘rarely or never’ been in work since leaving school and 17 per cent of those who said they are unemployed and seeking work.
In terms of making progress to overcome these barriers to employment, more than a quarter (27 per cent) of respondents feel they have made ‘a great deal or fair amount’ of progress since being affected by the Benefit Cap, while a third said they have made ‘not very much’ progress. These results do not differ significantly between barriers identified by respondents, that is to say those who identify certain barriers are no more or less likely to feel that they have made progress in overcoming them than those who identify others.
Respondents who said they have looked for work since being affected by the Benefit Cap as well as those from a black or minority ethnic background are most likely to say that they made ‘a great deal’ of progress in terms of overcoming the barriers to work (16 per cent and 13 per cent respectively). Those who described their current work status as unemployed and seeking work and lone parent families are more likely to say they did not make very much progress in overcoming barriers (42 per cent and 38 per cent respectively).
More than a third (36 per cent) of those who identified barriers to employment said they have made no progress at all in overcoming these barriers. In particular, those aged 45 and above and those with a self-reported limiting long-term health problem or disability are more likely to say they have made no progress at all (51 per cent and 46 per cent respectively). Similarly, almost half (49 per cent) of those whose benefits have been capped at between £50 and £100 a week, and those who have never received DHP (48 per cent), report having made no progress in overcoming barriers to employment.
Those of the cohort identifying barriers to finding work were asked what, if anything, they had done to overcome these barriers. Many (43 per cent) said they have not done anything and this is an especially prevalent response among those aged 45 and above (57 per cent), those with a self-reported limiting health problem or disability18 (53 per cent) and those who have never received DHP (55 per cent).
Sizeable minorities have, however, taken some actions and those actions most commonly mentioned include help with training/qualifications (15 per cent), job searching (13 per cent) and childcare (ten per cent). Those who are currently unemployed and seeking work are more likely than those identifying barriers to employment overall to say they have sought
18 Note, however, that those in this group who are still affected are not in receipt of a disability-related benefit which would exempt them from the Cap.

35
Don’t know
Nothing
Something else
Sought/received financial assistance tohelp with job search activities
Looked to retrain/study for a new qualification
Moved/tried to move to a different area
Sought/received medical treatment to beable to start looking for work
Sought/received general careersadvice and guidance
Applied for jobs more regularly/actively
Sought/received help applying for jobs(CVs, interviews, etc.)
Sought/received help with childcare,cost of childcare
Sought/received help with searching/finding jobs
Sought/received help with training andqualification opportunities
Percentages
15
13
10
9
7
7
4
2
1
1
4
43
4
Base: All respondents who say there are barriers to them finding work at the moment (278). Fieldwork dates 11 August – 15 September 2014. This question was asked on an unprompted basis.
Post-implementation effects of the Benefit Cap (wave 2 survey)
help with training/qualifications (20 per cent, albeit this is not a statistically significant difference). Half of those who said they are unemployed and seeking work are aged 25-34 (compared with 41 per cent overall).
Figure 4.4 What, if anything, have you done to overcome these barriers to finding work?
36
Post-implementation effects of the Benefit Cap (wave 2 survey)
5 Housing-related effects of the Benefit Cap
At wave 1 five per cent of the cohort spontaneously mentioned looking at moving to a property in the social rented sector in response to being capped, while nine per cent indicated they were planning to look to move to a property in the social rented sector within the next year. The wave 2 survey enabled an assessment of how many of the cohort have moved in the intervening period between surveys, their characteristics and some of the barriers commonly identified to moving home.
5.1 Moving homeBy the time of the wave 2 survey around one in ten of those surveyed had moved to another property since wave 1. Half of these (five per cent) have moved in to social accommodation, of which three per cent are now renting from a council/local authority. Additionally, two per cent are renting a property from a private landlord, and three per cent have moved in to temporary accommodation provided by a council.
The proportion who have moved within or into temporary accommodation since wave 1 more than doubled to seven per cent among those whose benefit has been capped by £100 or more a week and those who were but are no longer receiving DHP.
Furthermore, those who have moved within or into social accommodation are more likely to no longer be affected by the Benefit Cap (13 per cent), to have up to two dependent children and pay rent of between £100 – £199 a week.
Of the small number who have moved to another property since wave 1, close to two-thirds (62 per cent) did so at least in part because of being affected by the Benefit Cap, while around two in five (42 per cent) said the Benefit Cap was the only reason why they moved.
A slightly lower proportion of those surveyed said they are looking to move home than in wave 1, However, the vast majority of those who are looking to move have taken some action to help facilitate this move.
Just over a third of respondents said they are looking to move from their current accommodation (35 per cent), down from 42 per cent in wave 1. In part, this reflects that a proportion of those previously looking to move have done so, although excluding those who have moved since the last survey only raises the proportion of the current cohort looking to move to 36 per cent.
The proportion of respondents looking to move rises to more than two in five among those who are unemployed and seeking work (42 per cent) and private renters (44 per cent). Half (50 per cent) of those wishing to move currently pay between £200 – £299 a week on rent, and more than two in five (41 per cent) are in rent arrears. Furthermore, although not a statistically significant difference, the data suggests the greater the Benefit Cap amount, the more likely respondents are to want to move, with those capped by £100 or more a week (41 per cent) more likely than those capped by up to £25 a week (29 per cent) to be looking for new accommodation.

37
Base: All respondents in the analysis group (wave 1: 1,060); all respondents in the analysis group who have not moved since wave 1 (wave 2: 387); all respondents who are currently looking to move from their existing accommodation who have not moved since wave 1 (142). Fieldwork dates 7 – 26 February and 11 August – 15 September 2014. This latter question was asked on an unprompted basis.
Percentages Percentages
40
6
28
1
14
15
3812
Q Are you currently looking to move from this accommodation, or not?
Q What actions, if any, have you taken to move to different accommodation?
Don’t know
No
Yes
2
56
42 36
62
2
Wave 1 Wave 2
Nothing
Other
Sought help to pay off arrears on current property
Visited properties
Sought help from charities/otherorganisations (e.g. CAB, Shelter)
Sought advice from estate/letting agents
Registered for a transfer/mutual exchange
Sought advice from the council
Searched for properties
Post-implementation effects of the Benefit Cap (wave 2 survey)
Figure 5.1 What actions, if any, have you taken to move to different accommodation?
The majority of those wanting to move from their accommodation have taken some action. Respondents are more likely to have taken options such as searching for properties (40 per cent) and seeking advice from the council (38 per cent) than options such as registering for a transfer or mutual exchange (12 per cent) or approaching estate/lettings agents (eight per cent). Around one in seven (15 per cent) said they have done nothing.
5.2 Barriers to moving homeMost of those looking to move from their current accommodation believe there are barriers to doing so, and these centre largely around affordability, as was the case in wave 1.
Almost two-thirds (64 per cent) of those respondents wishing to move believe they face barriers to moving, which represents 22 per cent of the affected cohort overall. For most, these barriers centre on cost, which reflects the nature of the cohort in terms of being more likely to live in London and high cost housing areas, as well as requiring larger accommodation. More than half (51 per cent) cite property prices/a lack of available property that they can afford as a key barrier. As well as affordability, property size and location emerge as significant barriers. More than a quarter (28 per cent) feel there is a lack of suitable size properties and 13 per cent cite a lack of properties available where they want to live.
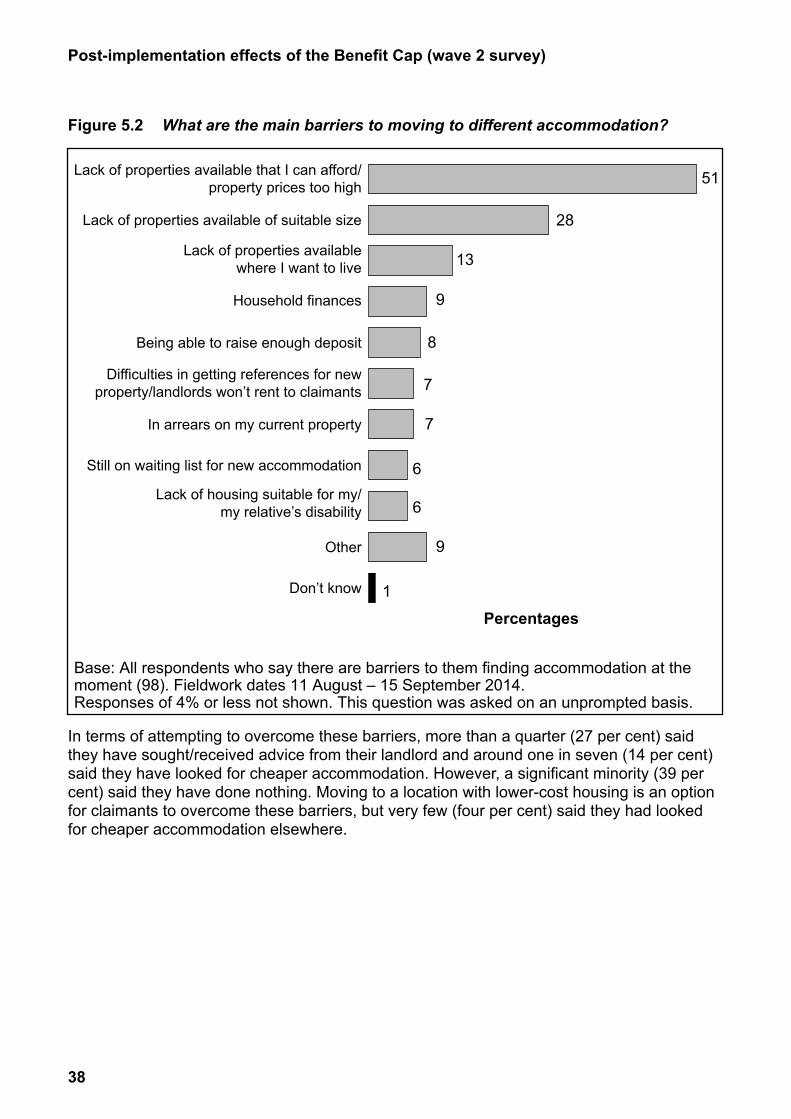
38
Post-implementation effects of the Benefit Cap (wave 2 survey)
Don’t know
Other
Lack of housing suitable for my/my relative’s disability
Still on waiting list for new accommodation
In arrears on my current property
Difficulties in getting references for newproperty/landlords won’t rent to claimants
Being able to raise enough deposit
Household finances
Lack of properties availablewhere I want to live
Lack of properties available of suitable size
Lack of properties available that I can afford/property prices too high
Percentages
28
13
9
8
7
7
6
6
9
51
1
Base: All respondents who say there are barriers to them finding accommodation at the moment (98). Fieldwork dates 11 August – 15 September 2014.Responses of 4% or less not shown. This question was asked on an unprompted basis.
Figure 5.2 What are the main barriers to moving to different accommodation?
In terms of attempting to overcome these barriers, more than a quarter (27 per cent) said they have sought/received advice from their landlord and around one in seven (14 per cent) said they have looked for cheaper accommodation. However, a significant minority (39 per cent) said they have done nothing. Moving to a location with lower-cost housing is an option for claimants to overcome these barriers, but very few (four per cent) said they had looked for cheaper accommodation elsewhere.
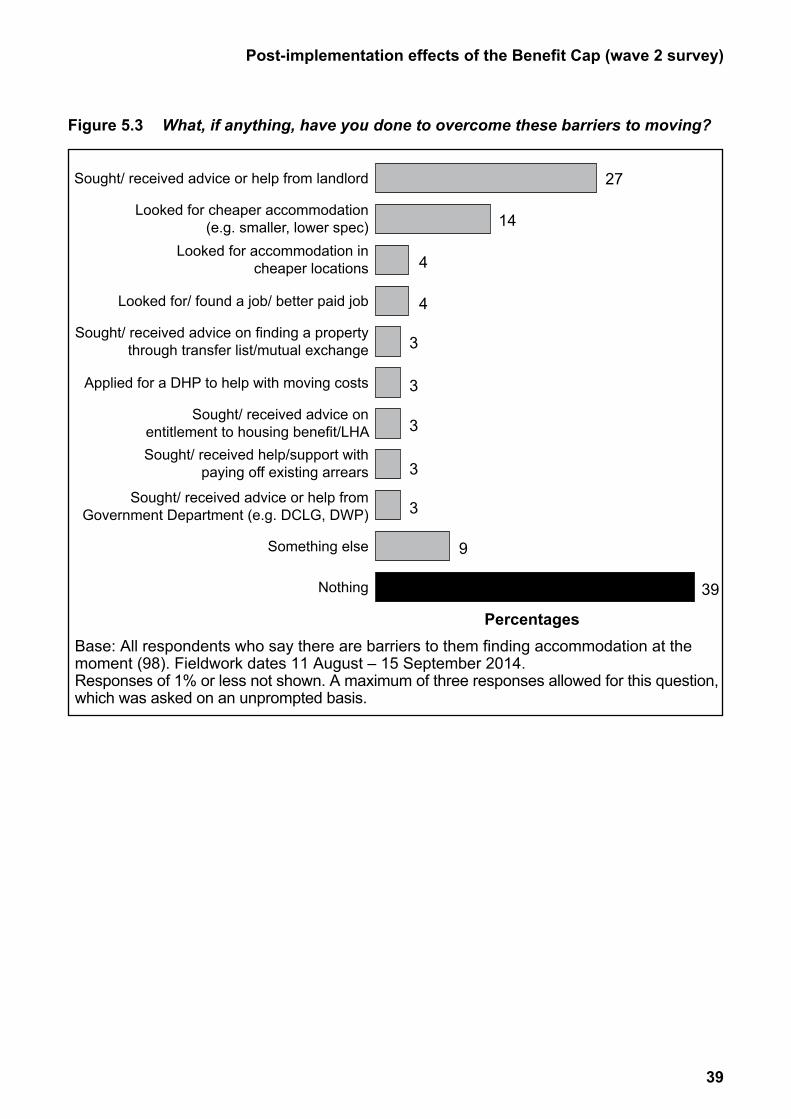
39
Post-implementation effects of the Benefit Cap (wave 2 survey)
Percentages
27
14
4
4
9
3
3
3
3
3
391
Base: All respondents who say there are barriers to them finding accommodation at the moment (98). Fieldwork dates 11 August – 15 September 2014.Responses of 1% or less not shown. A maximum of three responses allowed for this question, which was asked on an unprompted basis.
Nothing
Something else
Sought/ received advice or help fromGovernment Department (e.g. DCLG, DWP)
Sought/ received help/support withpaying off existing arrears
Sought/ received advice onentitlement to housing benefit/LHA
Applied for a DHP to help with moving costs
Sought/ received advice on finding a propertythrough transfer list/mutual exchange
Looked for/ found a job/ better paid job
Looked for accommodation incheaper locations
Looked for cheaper accommodation(e.g. smaller, lower spec)
Sought/ received advice or help from landlord
Figure 5.3 What, if anything, have you done to overcome these barriers to moving?

40
Post-implementation effects of the Benefit Cap (wave 2 survey)
6 Financial-related effects of the Benefit Cap
Wave 1 findings indicated that the Benefit Cap has, for some, resulted in significant reductions in income, with implications for the way they manage their household finances. The wave 2 survey provided an opportunity to follow-up with respondents in the cohort to see what, if any, effects the Benefit Cap has had specifically on rent arrears and household finances.
6.1 Arrears and responsesWave 1 responses showed that among those affected by the Benefit Cap, the frequency of rent arrears had increased since being affected (46 per cent said they were more often in rent arrears since becoming affected). Furthermore, the majority of those who were in arrears at the time (67 per cent) said the amount they owed had increased since being affected by the Cap.
In the intervening period between wave 1 and wave 2, there has been little change in the overall proportion of respondents who stated they were in rent arrears. Around two in five (41 per cent) of the cohort were in arrears in wave 1, and since then there has been a slight decrease to 39 per cent in wave 2. Those still affected by the Benefit Cap were more likely to say they are in arrears than those no longer affected (45 per cent compared to 21 per cent).
Results from wave 1 indicated that those in social rented housing were more likely to be in rent arrears than those in private rented accommodation. This difference is still apparent in wave 2 findings, albeit it is not statistically significant (44 per cent and 34 per cent respectively said they are in rent arrears). Data linking analysis suggests that those in social rented accommodation almost exclusively have their Housing Benefit paid directly to their landlord.
The proportion of respondents saying they are currently in arrears rises to around half among those who have never received a Discretionary Housing Payment (DHP) (53 per cent) and those who pay rent of between £0-£99 a week (50 per cent). However, those capped by £50 or more a week are no more likely than those capped by less than £50 a week to say they are currently in arrears (41 per cent and 38 per cent respectively).
In terms of the amount owed, around one in five survey respondents owe up to £200 (22 per cent), and a similar proportion owe between £200 – £500 (21 per cent). However, almost half (49 per cent) owe more than £500, of which 28 per cent owe more than £1,000.
A quarter (25 per cent) of the cohort at wave 2 said they are in arrears ‘all/most of the time’, which rises to 29 per cent among those who are affected by the Benefit Cap. It rises further to a third among those who no longer receive DHP. Close to four in five respondents (78 per cent) reported that they had ‘never’ been in arrears before becoming affected by the Benefit Cap compared with 34 per cent who said the same in wave 2 (since February 2014). Most (58 per cent) of respondents who are currently in arrears said their rent arrears have increased since wave 1. A quarter (24 per cent) said they have stayed the same, and just 14 per cent said the amount they owe has decreased.
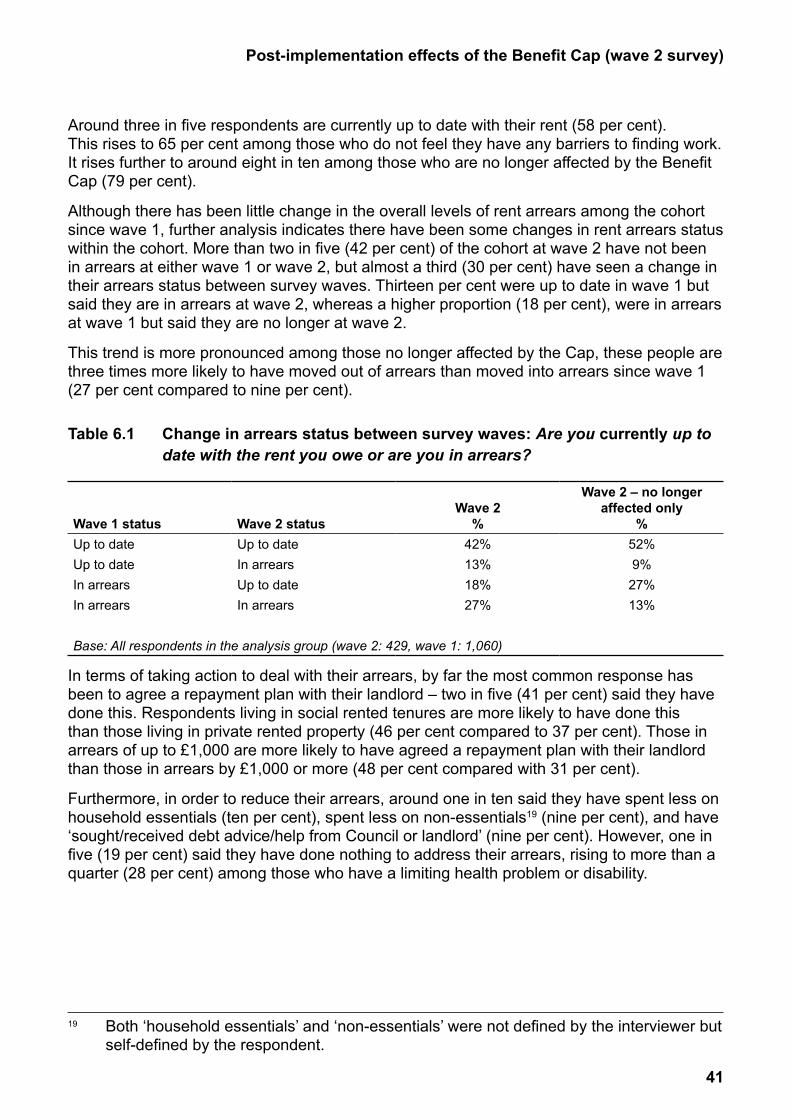
41
Post-implementation effects of the Benefit Cap (wave 2 survey)
Around three in five respondents are currently up to date with their rent (58 per cent). This rises to 65 per cent among those who do not feel they have any barriers to finding work. It rises further to around eight in ten among those who are no longer affected by the Benefit Cap (79 per cent).
Although there has been little change in the overall levels of rent arrears among the cohort since wave 1, further analysis indicates there have been some changes in rent arrears status within the cohort. More than two in five (42 per cent) of the cohort at wave 2 have not been in arrears at either wave 1 or wave 2, but almost a third (30 per cent) have seen a change in their arrears status between survey waves. Thirteen per cent were up to date in wave 1 but said they are in arrears at wave 2, whereas a higher proportion (18 per cent), were in arrears at wave 1 but said they are no longer at wave 2.
This trend is more pronounced among those no longer affected by the Cap, these people are three times more likely to have moved out of arrears than moved into arrears since wave 1 (27 per cent compared to nine per cent).
Table 6.1 Change in arrears status between survey waves: Are you currently up to date with the rent you owe or are you in arrears?
Wave 2 – no longer
Wave 1 status Wave 2 statusWave 2
%affected only
%Up to date Up to date 42% 52%Up to date In arrears 13% 9%In arrears Up to date 18% 27%In arrears In arrears 27% 13%
Base: All respondents in the analysis group (wave 2: 429, wave 1: 1,060)
In terms of taking action to deal with their arrears, by far the most common response has been to agree a repayment plan with their landlord – two in five (41 per cent) said they have done this. Respondents living in social rented tenures are more likely to have done this than those living in private rented property (46 per cent compared to 37 per cent). Those in arrears of up to £1,000 are more likely to have agreed a repayment plan with their landlord than those in arrears by £1,000 or more (48 per cent compared with 31 per cent).
Furthermore, in order to reduce their arrears, around one in ten said they have spent less on household essentials (ten per cent), spent less on non-essentials19 (nine per cent), and have ‘sought/received debt advice/help from Council or landlord’ (nine per cent). However, one in five (19 per cent) said they have done nothing to address their arrears, rising to more than a quarter (28 per cent) among those who have a limiting health problem or disability.
19 Both ‘household essentials’ and ‘non-essentials’ were not defined by the interviewer but self-defined by the respondent.

42
Post-implementation effects of the Benefit Cap (wave 2 survey)
Don’t know
Nothing
Other
Received money from friends/family (not expected to pay back)
Borrowed money from another lender
Sought/received debt advice/help from DWP
Spoke to my landlord about lowering theamount of rent charged
Looked for a job
Applied to the council for a DHP
Borrowed money from friends/family (money intended to pay back)
Sought/received debt advice/help fromcouncil or landlord
Spent less on non-essentials
Spent less on household essentials
Agreed a repayment plan with landlord
Percentages
41
10
9
5
12
3
2
2
2
2
19
*
Base: All respondents who are currently in arrears on their existing accommodation (166). Fieldwork dates 11 August – 15 September 2014. Responses of 1% or less not shown.
9
7
Figure 6.1 What, if anything, have you done to reduce the amount of arrears you currently owe on this accommodation?
6.2 Household financesRespondents were asked to self-assess the financial resilience of their household finances by indicating how often they have run out of money at the end of each week or month since the last survey. This is recognised as a subjective measure of resilience and the term ‘run out of money’ is self-defined. As such the cohort’s responses were also considered alongside other measures such as stated income and rental levels.
Most respondents said they ‘very or fairly often’ run out of money before the end of the week or month, of which half (50 per cent) said they ‘very often’ run out.

43
Post-implementation effects of the Benefit Cap (wave 2 survey)
Base: All respondents in the analysis group (429).Fieldwork dates 11 August – 15 September 2014.
Percentages
50
26
1360
55
37
Percentage very often
Those no longer affected bythe Benefit Cap
Those up to date with their rent
Those not currently in work
Those still affected bythe Benefit Cap
Unemployed and seeking work
NeverHardly ever
Fairly oftenVery often
30
53
* Don’t know
Figure 6.2 How often, since February this year, have you or your household run out of money before the end of the week or month? Please include any times when you have run out of money and had to use your credit card, an overdraft, or borrow to get by
*
11 Those in arrears with their rent 68
More than two-thirds (68 per cent) of respondents who have rent arrears and over half (55 per cent) of those who are still affected by the Benefit Cap said they ‘very often’ run out of money. Similarly, three in five (60 per cent) of those who are unemployed and seeking work said they ‘very often’ run out of money as do 56 per cent of those who perceive barriers to finding work.
Just one in ten (11 per cent) said they ‘never’ run out of money at the end of the week/month. This more than doubles to around one in five (23 per cent) among those who are no longer affected by the Cap and people aged 45 or over (20 per cent). Analysis using information provided as part of the data linking process suggests that those who are paid Housing Benefit directly were no more likely than those whose Housing Benefit is paid directly to their landlord to say they run out of money at the end of the week/month.
Most of those who run out of money said they borrow from friends or family to tide them over. Three in five (59 per cent) said they borrow money from friends or family to cover the shortfall, a finding which is largely consistent across demographic groups.
Although not a statistically significant difference, the data suggests that a higher proportion of those who have never received DHP borrow from friends and family than those who are

44
Post-implementation effects of the Benefit Cap (wave 2 survey)
Percentages
59
4
8
5
6
3
4
9
3
2
2
1
Base: All respondents who have run out of money before the end of the week or month since February this year (376). Fieldwork dates 11 August – 15 September 2014. Responses of 1% or less not shown. This question was asked on an unprompted basis.
10
9
6
5Don’t know
Other
Delay paying the rent
Sell possessions (e.g. car, valuables)
Use a food bank
Gifts of food from family/friends
Reduce heating/energy costs
Delay paying other bills
Receive money from family/friends(not expected to pay back)
Borrow money from a lender
Overdraw from a bank account
Make do/go without
Use a credit card
Go without meals
Borrow money from family or friends
currently receiving DHP (66 per cent compared to 54 per cent). Similarly, data suggests that those whose benefits have been capped at a lower amount may be more likely to borrow from friends and family than those who have been capped at £100 or more per week (66 per cent and 52 per cent respectively, though this difference is not statistically significant).
Furthermore, in order to cover the shortfall, around one in ten (ten per cent) of those who said they run out of money before the end of the week or month said they go without meals, use a credit card (nine per cent) or simply make do/go without (nine per cent).
Figure 6.3 If you ever run out of money at the end of the week or month, how do you cover the shortfall?

45
Post-implementation effects of the Benefit Cap (wave 2 survey)
7 ConclusionThis research has revealed a number of effects of the Benefit Cap on the cohort of respondents who were affected by the policy in February 2014 (wave 1) based on their reported behaviours and situations.
By the time the cohort were re-interviewed in August/September 2014 (wave 2), one in five were no longer affected by the Benefit Cap, of whom half had found work in order to become unaffected and many of whom said they had not been in frequent employment before becoming affected. This leaves four in five who were still affected by the Benefit Cap.
Responses to the policy have varied. Those affected by the Cap were most likely to say they have cut back on spending and looked for work in order to deal with the changes. Almost two-thirds of those who had said at wave 1 they did not plan to do anything to deal with being affected by the policy have since taken some form of action.
While the proportion of respondents applying for Discretionary Housing Payment (DHP) has increased (largely a consequence of returning to the same group of claimants, most of whom were still affected), results suggest that comparatively few (around one in twenty) now regard applying for DHP as a top of mind response to the policy. That said, there is an indication that DHP has helped protect some claimants in the cohort from more acute financial difficulties compared with those who were not successful with their application or had never heard of them.
While more than half said they are doing as much in terms of key employment-related activities as they were before, around a third acknowledge that they have done more since becoming affected by the Benefit Cap. Those who are unemployed and seeking work are among the most responsive to the policy in this respect. Furthermore, more than two in five said they feel more encouraged to find paid work as a result of being affected, although many at the time of interview had not been able to find paid work since wave 1.
However, around two-thirds identify a number of key barriers to finding work, most notably around the availability and/or cost of childcare (reflecting the fact that the vast majority of the cohort have two or more children at home). Many are finding it difficult to overcome these barriers to finding work, though more than a quarter said they feel they have made some progress since being affected by the Benefit Cap.
One in ten respondents moved to alternative accommodation to deal with being affected by the changes, while just over a third said they are looking for somewhere else to live. Again, respondents identified a number of barriers to moving, largely relating to the cost of appropriate alternative accommodation.
The Benefit Cap has had implications for the way that respondents in the cohort manage their finances. Around two in five of the cohort said they were in arrears at wave 2, which is in line with the proportion seen at wave 1. Those who are no longer affected by the Benefit Cap are less likely to be in arrears, although a majority of those who said they are in arrears said the amount they owe has increased.
The majority of respondents reported running out of money by the end of the week or month, and are most likely to be borrowing from friends or family to cover the shortfall.

46
Post-implementation effects of the Benefit Cap (wave 2 survey)
Overall, while a majority of the cohort are still affected by the policy and feeling its effects (most notably around financial management), there are some indications that the policy’s intended aim of encouraging work-seeking is having an effect on a significant minority of respondents, despite perceived challenges, particularly barriers to employment.
47
Post-implementation effects of the Benefit Cap (wave 2 survey)
Appendix A Technical details and statistical reliabilityA.1 Survey detailsAt wave 1 Ipsos MORI interviewed a sample of 1,200 benefit claimants known to be affected by the Benefit Cap identified from the October 2013 Single Housing Benefit Extract (SHBE). Wave 2 interviews took place around seven months later following several keeping in touch exercises.
At wave 2 Ipsos MORI interviewed a sample of 468 benefit claimants who participated at wave 1 and who agreed to be recontacted for wave 2. A total of 940 (78 per cent) wave 1 respondents consented to re-contact following the keeping in touch exercises.
Of the wave 2 sample of 468, 333 were identified to be still affected by the Benefit Cap and 96 had become unaffected since the wave 1 survey (February 2014). A further 39 respondents were identified as being both unaffected at wave 1 and at wave 2, having flowed off the Cap since October. The focus of analysis in this report is on the 429 claimants who were affected by the Benefit Cap at wave 1 and who were either affected or no longer affected at wave 2. Further details of the profile of wave 1 and wave 2 respondents are presented below.
Interviews were carried out using Computer-Assisted Telephone Interviewing (CATI) with interviews lasting an average of 12 minutes. Fieldwork for wave 2 was conducted between 11 August and 15 September 2014.
Results are based on all respondents unless otherwise stated.
Data is weighted to be representative of the wave 1 profile in relation to age, gender, number of dependents, size of property (number of bedrooms) and amount by which claimants have been capped. This allows for like-for-like comparisons of this cohort group over time. Wave 1 data was weighted to be representative of the affected claimant cohort from the October 2013 SHBE.
Where results do not sum to 100, this may be due to multiple responses or rounding.
Where survey results are presented, an asterisk (*) denotes a finding of less than 0.5 per cent, but greater than zero.
A.2 Cohort profileTable A.1 shows the weighted and unweighted profiles for affected respondents to both wave 1 and wave 2 surveys. As the table shows, the profile between waves 1 and 2 is not markedly different.

48
Post-implementation effects of the Benefit Cap (wave 2 survey)
Table A.1 Comparison of respondent profiles (cohort group) for waves 1 and 2 (weighting variables)
Wave 1 Wave 2 +/-
Weighted Unweighted Weighted Unweighted
Unweighted wave 2 vs.
wave 1GenderMale 20% 20% 20% 23% +3Female 80% 80% 80% 77% -3Age30 and under 21% 22% 21% 17% -531-35 29% 29% 29% 27% -236-40 23% 23% 23% 26% +3Over 40 27% 27% 27% 30% +3Number of bedrooms0 to 2 18% 21% 18% 20% -13 53% 51% 53% 53% +24 or more 29% 29% 29% 27% -2Number of dependent children0 to 2 19% 18% 19% 18% 03 or more 81% 82% 81% 82% 0
In total, 39 per cent of the original wave 1 population was interviewed again at wave 2. While it is not possible to be sure about the impact of any bias as a result of this level of non-response, a comparison of the profiles of those who took part and those who did not may give an indication of any possible differences. While the profile of non-respondents is slightly younger and marginally more likely to be in private rented accommodation, the profile otherwise looks broadly the same.
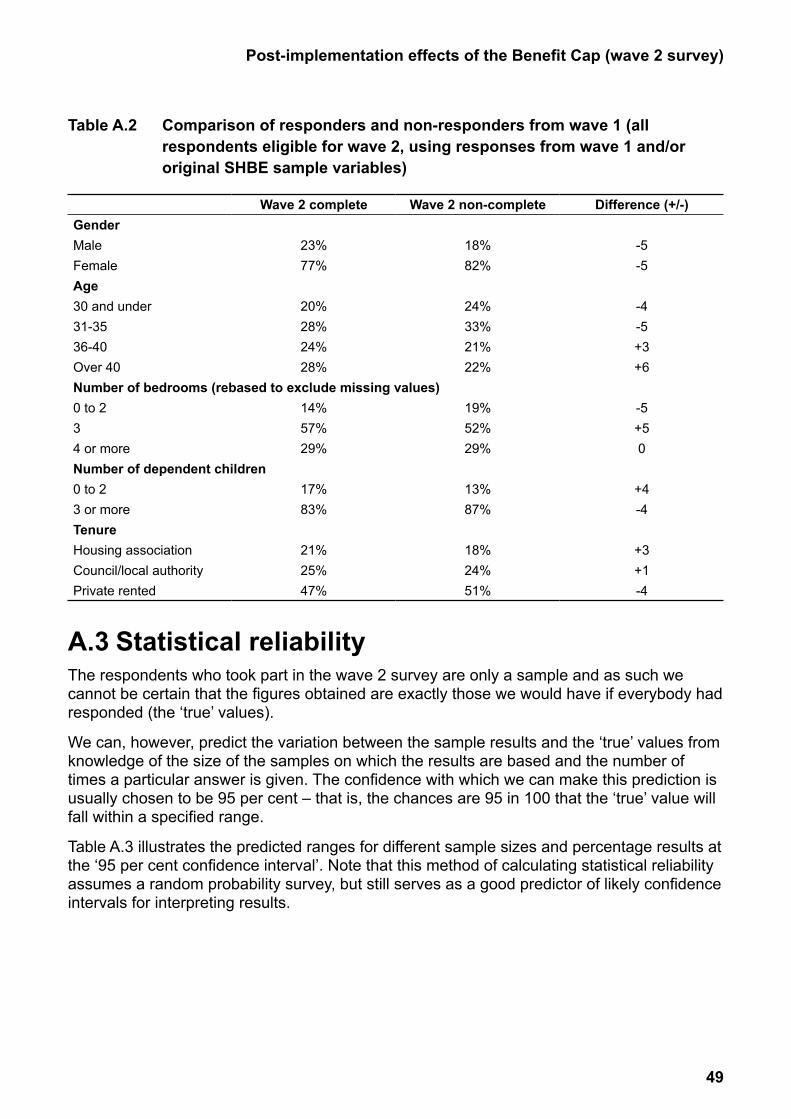
49
Post-implementation effects of the Benefit Cap (wave 2 survey)
Table A.2 Comparison of responders and non-responders from wave 1 (all respondents eligible for wave 2, using responses from wave 1 and/or original SHBE sample variables)
Wave 2 complete Wave 2 non-complete Difference (+/-)GenderMale 23% 18% -5Female 77% 82% -5Age30 and under 20% 24% -431-35 28% 33% -536-40 24% 21% +3Over 40 28% 22% +6Number of bedrooms (rebased to exclude missing values)0 to 2 14% 19% -53 57% 52% +54 or more 29% 29% 0Number of dependent children0 to 2 17% 13% +43 or more 83% 87% -4TenureHousing association 21% 18% +3Council/local authority 25% 24% +1Private rented 47% 51% -4
A.3 Statistical reliabilityThe respondents who took part in the wave 2 survey are only a sample and as such we cannot be certain that the figures obtained are exactly those we would have if everybody had responded (the ‘true’ values).
We can, however, predict the variation between the sample results and the ‘true’ values from knowledge of the size of the samples on which the results are based and the number of times a particular answer is given. The confidence with which we can make this prediction is usually chosen to be 95 per cent – that is, the chances are 95 in 100 that the ‘true’ value will fall within a specified range.
Table A.3 illustrates the predicted ranges for different sample sizes and percentage results at the ‘95 per cent confidence interval’. Note that this method of calculating statistical reliability assumes a random probability survey, but still serves as a good predictor of likely confidence intervals for interpreting results.
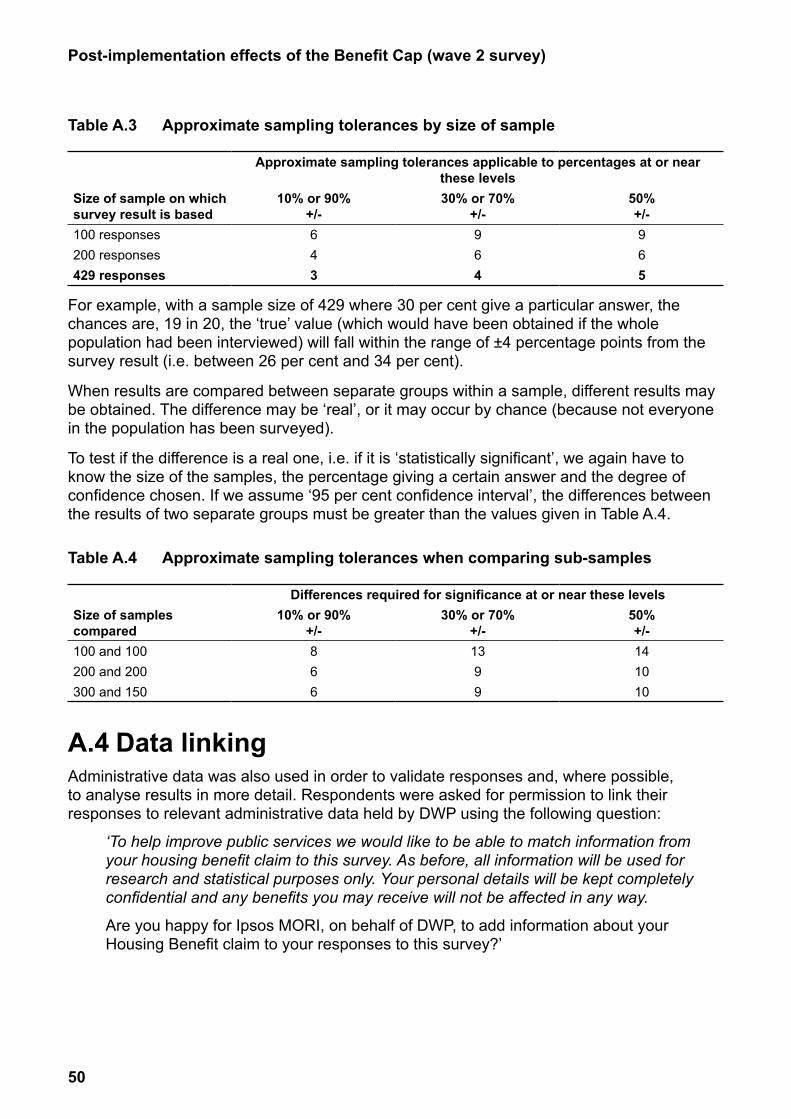
50
Post-implementation effects of the Benefit Cap (wave 2 survey)
Table A.3 Approximate sampling tolerances by size of sample
Approximate sampling tolerances applicable to percentagthese levels
es at or near
Size of sample on which survey result is based
10% or 90% +/-
30% or 70% +/-
50% +/-
100 responses 6 9 9200 responses 4 6 6429 responses 3 4 5
For example, with a sample size of 429 where 30 per cent give a particular answer, the chances are, 19 in 20, the ‘true’ value (which would have been obtained if the whole population had been interviewed) will fall within the range of ±4 percentage points from the survey result (i.e. between 26 per cent and 34 per cent).
When results are compared between separate groups within a sample, different results may be obtained. The difference may be ‘real’, or it may occur by chance (because not everyone in the population has been surveyed).
To test if the difference is a real one, i.e. if it is ‘statistically significant’, we again have to know the size of the samples, the percentage giving a certain answer and the degree of confidence chosen. If we assume ‘95 per cent confidence interval’, the differences between the results of two separate groups must be greater than the values given in Table A.4.
Table A.4 Approximate sampling tolerances when comparing sub-samples
Differences required for significance at or near these levelsSize of samples compared
10% or 90% +/-
30% or 70% +/-
50% +/-
100 and 100 8 13 14200 and 200 6 9 10300 and 150 6 9 10
A.4 Data linkingAdministrative data was also used in order to validate responses and, where possible, to analyse results in more detail. Respondents were asked for permission to link their responses to relevant administrative data held by DWP using the following question:
‘To help improve public services we would like to be able to match information from your housing benefit claim to this survey. As before, all information will be used for research and statistical purposes only. Your personal details will be kept completely confidential and any benefits you may receive will not be affected in any way.
Are you happy for Ipsos MORI, on behalf of DWP, to add information about your Housing Benefit claim to your responses to this survey?’
51
Post-implementation effects of the Benefit Cap (wave 2 survey)
422 of the 468 respondents gave permission for their responses to be linked to details about their Housing Benefit claim. Ipsos MORI sent a list of ID numbers for these respondents to DWP, who returned a file via PGP encryption including the relevant administrative data.
There were some limitations to the type of information that could be included in the data, but those variables which were included covered the following themes:• administrative information such as Cap amount;
• details about respondents’ Housing Benefit claim;
• rent status, amount and how this is paid;
• employment and hours worked;
• details of any benefits which would exempt claimants from being affected by the Benefit Cap.
52
Post-implementation effects of the Benefit Cap (wave 2 survey)
Appendix B Policy informationThe Benefit Cap limits the total amount of benefit that may be received by people in a single household from the following benefits:• Bereavement Allowance
• Carer’s Allowance
• Child Benefit
• Child Tax Credit
• Employment and Support Allowance (not including the support component)
• Guardian’s Allowance
• Housing Benefit
• Incapacity Benefit
• Income Support
• Jobseeker’s Allowance
• Maternity Allowance
• Severe Disablement Allowance
• Widowed Parent’s Allowance (or Widowed Mother’s Allowance or Widows Pension if received before 9 April 2001)
The amount of benefits a household can receive is restricted to £500 a week for couples (with or without children living with them), £500 for single parents whose children live at home, and £350 a week for single adults with no children or whose children live away from home.
Households are exempt from the Benefit Cap if anyone in the household receives Working Tax Credits or receives any of the following benefits:• Disability Living Allowance
• Personal Independence Payment
• Attendance Allowance
• Industrial Injuries Benefits (and equivalent payments as part of a war disablement pension
53
Post-implementation effects of the Benefit Cap (wave 2 survey)
or the Armed Forces Compensation Scheme)
• Employment and Support Allowance (the support component)
• War Widow’s or War Widower’s Pension
• War pensions
• Armed Forces Compensation Scheme
• Armed Forces Independence Payment
The Benefit Cap applied from 15 April 2013 in Bromley, Croydon, Enfield and Haringey local authorities. Remaining local authorities applied the Cap between 15 July 2013 and the end of September 2013. As such all households identified as being appropriate to be capped were capped by the end of September 2013. The Benefit Cap is currently administered through Housing Benefit, and as such a household which is not in receipt of Housing Benefit will not currently be in scope for the Cap.
Further information and official statistics for the Benefit Cap can be found at www.gov.uk/government/collections/benefit-cap-statistics
54
Post-implementation effects of the Benefit Cap (wave 2 survey)
Appendix C Review and evaluation of the Benefit CapThis document is published as part of the suite of evaluation material on the household Benefit Cap. It should be read in conjunction with the other reports. These are:1 The Benefit Cap Review. The review is published in line with the statement by the
Minister for Employment 1 February 2012. This document draws on the suite of evaluation material published alongside it. It also makes reference to the official statistics www.gov.uk/government/collections/benefit-cap-statistics and evidence previously published by the department www.gov.uk/government/publications/benefit-cap-public-attitudes-before-and-after-its-introduction
2 Benefit Cap: Analysis of outcomes for capped claimants. Analysis of administrative data carried out by departmental analysts and peer reviewed by the Institute for Fiscal Studies. This document examines the historical estimates of those in scope for the Cap and effects of the Benefit Cap by comparison of outcomes of capped claimants and comparable groups. Evidence is presented on movement into work (proxied by Working Tax Credit exemption), moving house and movement out of scope for the Cap.
3 In-depth interviews with people affected by the Benefit Cap. A Cambridge Centre for Housing and Planning Research (CCHPR) report based on interviews with 50 households affected by the Benefit Cap. These households were identified from the same source as the Ipsos MORI surveyed claimants. This work explores coping strategies of households and changes in behaviour around work and wellbeing, mobility and household structure, income and wellbeing, and beliefs and expectations. It provides contextual information around themes explored in the survey.
4 Supporting households affected by the Benefit Cap: Impact on Local Authorities, local services and social landlords. This report by CCHPR draws on work in ten case study local authorities (LAs); a survey of social landlords; and consultation with major lenders to the housing association sector. A variety of LA staff were interviewed in May/August 2013 and again in September 2014 in case study areas; 26 landlords were interviewed in 2013 and again after one year in these areas alongside 47 local agencies (including CAB and voluntary organisations); and variety of lenders were interviewed and provided written responses to the consultation in October 2013 and 2014. It provides information on how local services have been affected and how they are working with capped claimants.

55
Post-implementation effects of the Benefit Cap (wave 2 survey)
Appendix D Survey questionnairesWave one questionnaire
Survey introduction and opt-outGood morning/afternoon/evening.
My name is ……………… and I am calling you from Ipsos MORI, the research organisation, on behalf of the Department for Work and Pensions.
Can I please speak to [insert name of resident from sample].
INTERVIEWER: If transferred to another person, repeat ‘My name is from Ipsos MORI...the Department for Work and Pensions’. If sample is flagged with ‘Appointee’ then it is permissible to conduct the interview with a nominated appointee.
We are contacting you about some research on benefit changes that have been introduced by the government. You may or may not be affected by these changes currently, but your opinion is important to us and we want to know what you think. We are contacting you for research purposes only, and any views you give will be treated completely confidentially.
INTERVIEWER: If respondent says they are no longer affected by the benefit changes: ‘We are also interested in speaking with those who were previously affected by the changes but are no longer affected’.
This research will help the government understand how these changes are affecting people’s actions and attitudes and results will be published later this year. The research consists of confidential telephone interviews with people affected by the changes across Great Britain now and a follow-up interview in Summer 2014.
READ REASSURANCE ON CONFIDENTIALITY
I would like to assure you that any information you provide will be held in the strictest of confidence and will be handled securely throughout the study. The research findings will not identify you and no personal information will be shared with any third parties. Further, your answers will not affect your benefit entitlements or future dealings with the Department in any way.
Before we begin, I’d also like to inform you that Ipsos MORI is a member of the Market Research Society.
ASK QA1 – QA3 ONLY IF RESPONDENT ASKS FOR FURTHER INFORMATION OR REQUIRES FURTHER REASSURANCE
QA1
Would you like to receive further information about the survey from DWP or not?

56
Post-implementation effects of the Benefit Cap (wave 2 survey)
ASK ALL//SC1. Yes GO TO QA2
2. No GO TO QA4
QA2
How, if at all, would you like to receive further information about the survey?
ASK ALL//SC1. By email GO TO QA3
2. By post GO TO QA3
QA3
In which case can I take contact details for you?
ASK IF CODE 1 OR 2 AT QA2
Email address GO TO QA4
(IF CODE 1 AT QA2)
Name
Address
Postcode GO TO QA4
(IF CODE 2 AT QA2)
QA4
Are you available to discuss this briefly now? (Arrange a call back if necessary – the interview takes around 10 minutes)
INTERVIEWER: Check with the caller they are the named person or an appointee (only if the sample has an appointee flag). If it is not [NAME/APPOINTEE] code as 4 ‘No, not named person…’
ASK ALL//SC1. Yes, [NAME/APPOINTEE], appropriate time CONTINUE TO SURVEY
2. Yes, [NAME/APPOINTEE], but need to call back MAKE APPOINTMENT
3. Yes, [NAME/APPOINTEE], but refused THANK & CLOSE
4. No, not named person [NAME/APPOINTEE] THANK & CLOSE
The government has recently introduced a new limit on the total amount of benefit working age claimants can be entitled to. This means that households on out of work benefits will no longer receive more than £500 a week if they are a couple with or without children, or a single parent, or £350 a week if they are a single adult. Its official name is the Benefit Cap.
S1 Before starting to complete this survey how much, if anything, did you know about the Benefit Cap?

57
Post-implementation effects of the Benefit Cap (wave 2 survey)
ASK ALL//SC//READ OUT 1. A great deal
2. A fair amount
3. Just a little
4. Heard of, know nothing about
5. Never heard of
6. Don’t know (DO NOT READ OUT)
S2 To the best of your knowledge, are you and your family currently affected by the Benefit Cap or not, by which I mean your benefits have been reduced so they do not exceed £500 a week or £350 a week if you are a single person household?
ASK ALL//SC//READ OUT 1. Yes, currently affected CONTINUE TO SURVEY
2. No, not currently affected but have been CONTINUE TO SURVEY
3. No, not currently affected and never have been THANK & CLOSE
4. Don’t know (DO NOT PROMPT) THANK & CLOSE
AwarenessA1 Do you remember receiving written notification or not informing you that you/your family would be affected by the Benefit Cap?
ASK ALL//SC 1. Yes
2. No
3. Don’t know
A2a In what month of last year did the amount of benefit you received first start to be affected by the Benefit Cap?
ASK ALL//RECORD MONTH//SOFT CHECK IF BEFORE JUNE 20131. Don’t know
2. Refused
A2b And when did you cease to be affected by the Benefit Cap?
ASK IF CODE 2 AT S2//RECORD MONTH AND YEAR//SOFT CHECK IF BEFORE JUNE 2013//INTERVIEWER CODE MONTH AND YEAR
1. Don’t know
2. Refused
A2c And why are you no longer affected by the Benefit Cap?

58
Post-implementation effects of the Benefit Cap (wave 2 survey)
ASK IF CODE 2 AT S2//MC//DO NOT READ OUT PROBE FULLY1. I/someone in the family found a job
2. Increased working hours
3. Renegotiated a lower rent with landlord
4. Moved to another property in the social rented sector
5. Moved to another property in the private sector
6. Started to receive other benefits that meant the Cap doesn’t apply (e.g. Disability Living Allowance, Personal Independence Payment, etc.)
7. Other (please specify)
8. Don’t know
A3 Now for a question about the ‘grace period’, whereby the Benefit Cap is not applied for 39 weeks if you or your partner have been in employment for 50 out of the previous 52 weeks before claiming benefit.
Which of the following statements best describes your situation in relation to the ‘grace period’?
ASK ALL//SC//READ OUT1. I’ve not heard of the grace period
2. I’ve heard of this, applied and was eligible for a grace period
3. I’ve heard of this, applied and was not eligible for a grace period
4. I’ve heard of this, applied but am still waiting to hear
5. I’ve heard of this, but have not applied for a grace period
6. Don’t know (DO NOT PROMPT)
A4 Now for a question about Discretionary Housing Payments, or DHPs, which are top-up payments from local councils to help some Housing Benefit claimants afford their housing costs. Before this interview, had you heard of them or not?
ASK ALL//SC 1. Heard of them GO TO A5
2. Not heard of them GO TO B1
3. Don’t know GO TO B1
A5 And which of the following statements best describes your situation in relation to Discretionary Housing Payments, or DHPs?
ASK IF CODE 1 AT A4//SC//READ OUT1. I applied for and got DHPs, and am still receiving them
2. I applied for and got DHPs, but am no longer receiving them
3. I applied for but did not get DHPs
59
Post-implementation effects of the Benefit Cap (wave 2 survey)
4. I have applied for DHPs but am still waiting to hear
5. I have not applied for DHPs
6. Don’t know (DO NOT PROMPT)
I’d now like to ask you some questions about how you are dealing with the reduction in your benefits since being affected by the Benefit Cap. As with the rest of the questionnaire, I would like to assure you that your answers are completely confidential, and will not affect your benefits entitlement in any way.
READ OUT IF CODE 1 AT S2
I’d now like to ask you some questions about how you dealt with the reduction in your benefits when you were affected by the Benefit Cap. As with the rest of the questionnaire, I would like to assure you that your answers are completely confidential, and will not affect your benefits entitlement in any way.
READ OUT IF CODE 2 AT S2
Coping behavioursB1 What, if anything, have you/your family done in response to the reduction in your benefits since being affected by the Benefit Cap? INTERVIEWER PROMPT: Anything else? ASK IF CODE 1 AT S2//MC//DO NOT READ OUT PROBE FULLY
B1 What, if anything, did you/your family do in response to the reduction in your benefits when you became affected by the Benefit Cap? INTERVIEWER PROMPT: Anything else? ASK IF CODE 2 AT S2//MC//DO NOT READ OUT PROBE FULLY
Employment related1. Looked for a job
2. Looked for a better paid job
3. Looked for an additional (i.e. second or third) job
4. Increased the number of hours worked at current job
Housing related5. Looked to renegotiate a lower rent with landlord
6. Moved to another property in the social rented sector
7. Moved to another property in the private sector
8. Looked at moving to another property in the social rented sector
9. Looked at moving to another property in the private sector
Benefit related10. Applied for DHP – Discretionary Housing Payments
11. Started to receive other benefits that mean the Cap won’t apply (eg Disability Living Allowance, Personal Independence Payment, etc.)

60
Post-implementation effects of the Benefit Cap (wave 2 survey)
Money related12. Used savings
13. Borrowed money from friends/family (money which you intend to pay back)
14. Received money from friends/family (money which you are not expected to pay back)
15. Borrowed money through a pay day loan
16. Borrowed money from another lender
17. Borrowed money via a credit card
Other18. Not paid rent and gone into rent arrears
19. Not paid other household bills and gone into or added to debt
20. Spent less on household essentials (e.g. food, heating)
21. Spent less on non-essentials (e.g. going out, holidays)
22. Taken in a lodger
Advice related23. Sought advice or help from Department for Work and Pensions
24. Sought advice or help from Job Centre Plus employment services
25. Sought advice or help from council or housing association (landlord)
26. Sought advice or help from someone else such as a local charity, church or group
27. Other (SPECIFY)
28. None of these (SINGLE CODE)
29. Don’t know (SINGLE CODE)
B2 And thinking about the next 12 months, what, if anything, are you/your family planning to do to deal with being affected by the Benefit Cap? Please say if you are not planning to do anything. INTERVIEWER PROMPT: Anything else?
ASK IF CODE 1 AT S2//MC//DO NOT READ OUT PROBE FULLY
Employment related1. Look for a job
2. Look for a better paid job
3. Look for an additional (i.e. second or third) job
4. Increase the number of hours worked at current job
Housing related5. Look to renegotiate a lower rent with landlord

61
Post-implementation effects of the Benefit Cap (wave 2 survey)
6. Look at moving to another property in the social rented sector
7. Look at moving to another property in the private sector
Benefit related8. Apply for a DHP – Discretionary Housing Payment
9. Re-apply for a DHP – Discretionary Housing Payment
10. Start to receive other benefits that mean the Cap won’t apply (eg Disability Living Allowance, Personal Independence Payment, etc.)
Money related11. Use savings
12. Borrow money from friends/family (money which you intend to pay back)
13. Receive money from friends/family (money which you are not expected to pay back)
14. Borrow money through a pay day loan
15. Borrow money from another lender
16. Borrow money via a credit card
Other17. Not pay rent and go into rent arrears
18. Not pay other household bills and go into or add to debt
19. Spend less on household essentials (e.g. food, heating)
20. Spend less on non-essentials (e.g. going out, holidays)
21. Take in a lodger
Advice related22. Seek advice or help from Department for Work and Pensions
23. Seek advice or help from Job Centre Plus employment services
24. Seek advice or help from council or housing association (landlord)
25. Seek advice or help from someone else such as a local charity, church or group
26. Other (SPECIFY)
27. None of these (SINGLE CODE)
28. Don’t know (SINGLE CODE)
Coping behaviours (employment related)C1 Of the following, how much, if anything, were you doing in the 12 months BEFORE being affected by the Benefit Cap?
62
Post-implementation effects of the Benefit Cap (wave 2 survey)
ASK ALL//SC FOR EACH//READ OUT//ROTATE STATEMENTS B TO Da) Trying to find paid work – whether a new job or extra work
b) Using any employment services (like JobCentre Plus, local careers centre or recruitment agency, etc.)
c) Submitting applications to find paid work
d) Going to job interviews
1. A great deal
2. A fair amount
3. Not very much
4. Not at all
5. Don’t know
C2 And SINCE being affected by the Benefit Cap have you done more, or less or the same amount of the following?
ASK IF CODE 1 AT S2//SC FOR EACH//READ OUT//ROTATE STATEMENTS B TO D
C2 And after you became affected by the Benefit Cap, did you do more, or less or the same amount of the following?
ASK IF CODE 2 AT S2//SC FOR EACH//READ OUT//ROTATE STATEMENTS B TO Da) Tried to find paid work – whether a new job or extra work
b) Used any employment services (like JobCentre Plus, local careers centre or recruitment agency, etc.)
c) Submitted applications to find paid work
d) Went to job interviews
1. More
2. Less
3. The same amount
4. Don’t know
C3 Overall, would you say you have been more encouraged or less encouraged to find paid work as a result of being affected by the Benefit Cap, or has it made no difference to you?
ASK IF CODE 1 AT S2//SC
C3 Overall, would you say you were more encouraged or less encouraged to find paid work as a result of being affected by the Benefit Cap, or did it make no difference to you?
ASK IF CODE 2 AT S2//SC1. More encouraged
2. Less encouraged
3. Made no difference
4. Don’t know

63
Post-implementation effects of the Benefit Cap (wave 2 survey)
C4 Regardless of whether or not you are in work at the moment, what, if anything, would you say are the main barriers to you finding work? INTERVIEWER PROMPT: Anything else?
ASK ALL//MC MAXIMUM OF 3//DO NOT READ OUT1. Lack of available jobs
2. Lack of appropriate jobs (right skills, place or salary)
3. Cost of transport to work
4. availability and/or Cost of childcare
5. Lack of qualifications or experience
6. Lack of confidence
7. Poor health
8. Caring for a family member
9. Another reason (specify)
10. Nothing (SINGLE CODE)
11. Don’t know (SINGLE CODE)
12. Refused
C5 How would you best describe your current work status?
ASK ALL//SC//DO NOT READ OUT PROBE WHERE NECESSARY1. Working full-time (30 hours a week or more)
2. Working part-time (16-29 hours a week)
3. Working part-time (Less than 16 hours a week)
4. Self-employed
5. Unemployed – seeking work
6. Unemployed – not seeking work
7. Fully retired
8. Long term sick or disabled
9. Full-time education, training scheme/apprenticeship
10. Carer
11. Other
12. Don’t know/refused (DO NOT READ OUT)
C6 Which of the following best describes your employment history since leaving school/further education?
64
Post-implementation effects of the Benefit Cap (wave 2 survey)
ASK ALL//SC//READ OUT//REVERSE SCALE FOR HALF OF RESPONDENTS1. I have always been in paid employment
2. I have mostly been in paid employment
3. I have sometimes been in paid employment
4. I have rarely been in paid employment
5. I have never been in paid employment
6. Refused
Coping behaviours (housing related)
I’d now like to ask some questions about your accommodation.
D1 Which one of these applies to you…?
ASK ALL//SC//READ OUT 1. I am renting from a housing association
2. I am renting from a council or local authority
3. I am renting from a private landlord
4. I am living in temporary accommodation provided by a council having been accepted as homeless
5. Other (Specify)
6. Don’t know (DO NOT PROMPT)
D2 How long have you lived here in this accommodation?
ASK ALL//SC//DO NOT READ OUT 1. Less than six months
2. Longer than six months but less than 12 months
3. 12 months or longer but less than 2 years
4. 2 years or longer but less than 5 years
5. 5 years or longer but less than 10 years
6. 10 years or longer
7. Other (DO NOT PROMPT)
8. Don’t know (DO NOT PROMPT)
D3 Are you currently looking to move from this accommodation, or not?
ASK ALL//SC1. Yes
2. No
3. Don’t know

65
Post-implementation effects of the Benefit Cap (wave 2 survey)
D4 Can I just check, is your reason for wanting to move from here mainly because of the changes to benefits resulting from the Benefit Cap or is it for some other reason(s)?
ASK IF D3 =1//SC 1. Mainly because of the changes to benefits
2. For some other reason(s)
3. Don’t know
D5 What is that reason(s)?
ASK IF D4 =2//MC MAXIMUM OF 3//DO NOT READ OUT
INTERVIEWER NOTE: IF CODE 1 OR 5 PROBE TO DISTINGUISH BETWEEN THE TWO OR IF BOTH ARE APPLICABLE
Property reasons 1. Want a larger house or flat
2. Want a smaller house or flat
3. Want self-contained accommodation (i.e. not sharing)
4. Want shared accommodation
5. Need an extra room for a (non-resident) son/daughter to stay overnight
6. Need an extra room for a carer to stay overnight
7. Want a different type of accommodation (e.g. change from flat to house or top floor to ground floor)
8. Sold my previous home
9. Property in poor condition (including being demolished)
Financial reasons10. Want to pay lower rent
11. Because Housing Benefit payment (£) was reduced because of the Removal of Spare Room Subsidy (‘Bedroom Tax’)
12. Because Housing Benefit payment (£) was reduced because of changes to Local Housing Allowance
13. Because Benefit payment (£) was reduced because of the Benefit Cap
14. Positive change to claimant’s financial situation – could afford a more expensive property
15. Negative change to claimant’s financial situation – lower income (excl. reduction in Housing Benefit)
Tenancy related reasons16. Asked to leave/evicted – landlord selling the property/needed property for own use
17. Asked to leave/evicted – landlord no longer letting to Benefit claimants

66
Post-implementation effects of the Benefit Cap (wave 2 survey)
18. Asked to leave/evicted – rent arrears
19. Asked to leave/evicted – following complaint about condition/state of repair
20. Asked to leave/evicted– landlord gave no reason
21. Didn’t get on with the landlord
22. End of tenancy agreement
Other reasons 23. To move to a specific area/neighbourhood/town/city
24. To move to a better area/neighbourhood/town/city
25. To move to more settled accommodation (ie from temporary accommodation)
26. For personal or family reasons (e.g. closer to a particular school or friends, to move in with someone/got married, birth of a child, divorce/separation)
27. For job related reasons (e.g. new job)
28. Other (Specify)
29. Don’t know (SINGLE CODE)
D6 What, if anything, are the main barriers to moving to different accommodation?
ASK IF D3 =1//MC MAXIMUM OF 3//DO NOT READ OUT 1. Property prices too high
2. A lack of properties available that I can afford
3. A lack of properties available where I want to live
4. A lack of properties available that are the size I want to live in
5. The fees and costs associated with moving (eg fees/transport)
6. Being able to raise enough deposit
7. Job security
8. Household finances
9. Lack of sufficient information
10. Proximity to family/friends
11. Proximity to job
12. Proximity to schools and local services
13. Other (Specify)
14. Nothing (SINGLE CODE)
15. Don’t know (SINGLE CODE)
Coping behaviours (financial and other)E1 Thinking back to BEFORE you started to be affected by the Benefit Cap, how often

67
Post-implementation effects of the Benefit Cap (wave 2 survey)
did you/your family get into arrears on your property, that is owing money to your landlord because you’ve not been able to pay the rent in full?
ASK ALL//SC FOR EACH//READ OUT1. Never
2. Occasionally
3. Sometimes
4. Most of the time
5. All of the time
6. Don’t know (DO NOT PROMPT)
7. Refused (DO NOT PROMPT)
E2 And since being affected by the Benefit Cap, how often do you/your family get into arrears on your property, that is owing money to your landlord because you’ve not been able to pay the rent in full?
ASK IF CODE 1 AT S2//SC FOR EACH//READ OUT
E2 And after you became affected by the Benefit Cap, how often did you/your family get into arrears on your property, that is owing money to your landlord because you’ve not been able to pay the rent in full?
ASK IF CODE 2 AT S2//SC FOR EACH//READ OUT1. Never
2. Occasionally
3. Sometimes
4. Most of the time
5. All of the time
6. Don’t know (DO NOT PROMPT)
7. Refused (DO NOT PROMPT)
E3 Since being affected by the Benefit Cap, if you ever run out of money at the end of the week or month, how do you cover the shortfall?
ASK IF CODE 1 AT S2//MC//DO NOT READ OUT
E3 Thinking back to when you were affected by the Benefit Cap, if you ever ran out of money at the end of the week or month, how did you cover the shortfall?
ASK IF CODE 2 AT S2//MC//DO NOT READ OUT1. Borrow money from family or friends
2. Gifts of food from family or friends
3. Use a food bank
4. Go without meals

68
Post-implementation effects of the Benefit Cap (wave 2 survey)
5. Reduce heating/energy costs
6. Borrow from a money lender
7. Overdraw from a bank account
8. Use a credit card
9. Use the Housing Benefit money
10. Delay paying the rent
11. Delay paying other bills
12. Other ways (Specify)
13. Don’t know (SINGLE CODE)
14. HAVE NEVER run out of money (SINGLE CODE)
E4 Have you/your family undertaken any of the following in response to the reduction in your benefits since being affected by the Benefit Cap?
ASK IF CODE 1 AT S2//MC//READ OUT
E4 Did you/your family undertake any of the following BECAUSE of the reduction in your benefits when you became affected by the Benefit Cap?
ASK IF CODE 2 AT S2//MC//READ OUT1. Applied for DHP – Discretionary Housing Payments
2. Applied for child maintenance or an increase in child maintenance
3. Applied to adopt, or have adopted a disabled child
4. Living with previously separated family members
5. Taken a lodger
6. Taken receipt of a benefit that exempts you from the Benefit Cap (like Disability Living Allowance or Working Tax Credit)
7. None of these (DO NOT PROMPT)
8. Don’t know (DO NOT PROMPT)
E5 And can I check has your Housing Benefit also been reduced or not because of…..
ASK ALL//SC FOR EACH STATEMENT//READ OUT IN FULL (INCLUDING TEXT IN BRACKETS)
a) The Removal of Spare Room Subsidy (also known as the ‘Bedroom Tax’)?
b) Changes to Local Housing Allowance – that is Housing Benefit paid to people who rent privately?
1. Yes
2. No
3. Don’t know
69
Post-implementation effects of the Benefit Cap (wave 2 survey)
E6 For which of these periods are you charged rent at this accommodation?
ASK ALL//SC//READ OUT1. Weekly
2. 4 weekly
3. Monthly
4. Other (SPECIFY)
5. Don’t know
E7 How much in total does your landlord currently charge your household in rent? That is, the total amount of rent INCLUDING any that is paid by Housing Benefit?
ASK ALL//RECORD EXACT AMOUNT £
IF RESPONDENT DOES NOT KNOW THE EXACT AMOUNT, RECORD THEIR ESTIMATED AMOUNT £
£
1. Don’t know
2. Refused
E8 And are you currently up to date with the rent you owe or are you in arrears?
ASK ALL//SC//READ OUT 1. Up to date
2. In arrears
3. Don’t know
4. Refused
E9 By how much are you currently in arrears on this accommodation?
ASK IF E8=2//RECORD EXACT AMOUNT £//LOGIC TEST FOR ANY AMOUNT ABOVE £1,000
IF RESPONDENT DOES NOT KNOW THE EXACT AMOUNT, RECORD THEIR ESTIMATED AMOUNT £
£1. Don’t know
2. Refused
E10 Have your rent arrears increased, decreased or remained the same since you started to be affected by the Benefit Cap?
ASK IF CODE 1 AT S2 AND E8 = 2//SC
E10 Did your rent arrears increase, decrease or remain the same in the period when you were affected by the Benefit Cap?

70
Post-implementation effects of the Benefit Cap (wave 2 survey)
ASK IF CODE 2 AT S2 AND E8 = 2//SC1. Increased
2. Decreased
3. Remained the same
4. Can’t remember
5. Don’t know
About youAnd lastly I’d like to ask some general questions about you. As with the rest of the questionnaire, I would like to assure you that your answers are completely confidential.
F1 What was your age last birthday?
ASK ALL//SC//DO NOT READ OUT, CODE AS APPROPRIATE1. 16-24
2. 25-34
3. 35-44
4. 45-54
5. 55-59
6. 60-64
7. 65+
8. Don’t know
9. Refused
F2 How many people usually live in your property in total?
ASK ALL
INTERVIEWER TYPE IN NUMBER98. Don’t know
99. Refused
F3 How many dependent children are there living with you? That is those under the age of 16 or those aged 16-18 unmarried and in full-time education.
ASK ALL
INTERVIEWER TYPE IN NUMBER98. Don’t know
99. Refused
F4 And how many couples are there living in your property? IF NECESSARY One couple is two people in a relationship and living together.
71
Post-implementation effects of the Benefit Cap (wave 2 survey)
ASK ALL
INTERVIEWER TYPE IN NUMBER98. Don’t know
99. Refused
F5 What is your ethnic group?
ASK ALL//SC//DO NOT READ OUT PROBE WHERE NECESSARY1. White – English, Welsh, Scottish, Northern Irish, British
2. White – Irish
3. White – Gypsy or Irish Traveller
4. Any other White background (specify)
5. Mixed – White and Black Caribbean
6. Mixed – White and Black African
7. Mixed – White and Asian
8. Any other mixed background (specify)
9. Asian or Asian British – Indian
10. Asian or Asian British – Pakistani
11. Asian or Asian British – Bangladeshi
12. Asian or Asian British – Chinese
13. Any other Asian background (specify)
14. Black or Black British Caribbean
15. Black or Black British African
16. Any other Black background (specify)
17. Arab
18. Other (Specify)
19. Prefer not to answer
F6 Do you or does anyone in your family have any long-term illness, health problems or disability which limits your/their daily activities or the work you/they can do, including any problems which are due to old age?
ASK ALL//SC 1. Yes
2. No
3. Don’t know
F7 How long have you/your family been receiving any type of benefits?
72
Post-implementation effects of the Benefit Cap (wave 2 survey)
ASK ALL//SC//DO NOT READ OUT 1. Less than 6 months
2. 6 months or more but less than 12 months
3. 1 year or more but less than 2 years
4. 2 years or more but less than 3 years
5. 3 years or more but less than 5 years
6. 5 years or more but less than 10 years
7. 10 years or more
8. Don’t know
F8 What is your (you and your partner’s) total weekly or monthly income before any deductions for income tax, national insurance and so on? Please include income from all sources such as earnings from employment, benefits, grants, maintenance from an ex-partner, interest on savings, and so on. Please say if this is monthly or weekly.
ASK ALL//IF RESPONDENT DOES NOT KNOW THE EXACT AMOUNT, RECORD THEIR ESTIMATED AMOUNT £
£
1. Weekly
2. Monthly
3. Don’t know
4. Refused
F9 Since becoming affected by the Benefit Cap, how much, if at all, has your total weekly or monthly income been reduced by? Please say if this is monthly or weekly.
ASK IF CODE 1 AT S2//IF RESPONDENT DOES NOT KNOW THE EXACT AMOUNT, RECORD THEIR ESTIMATED AMOUNT £
F9 When you became affected by the Benefit Cap, how much, if at all, was your total weekly or monthly income reduced by? Please say if this is monthly or weekly.
ASK IF CODE 2 AT S2//IF RESPONDENT DOES NOT KNOW THE EXACT AMOUNT, RECORD THEIR ESTIMATED AMOUNT £
£
1. Weekly
2. Monthly
3. Not been reduced
4. Don’t know
5. Refused
73
Post-implementation effects of the Benefit Cap (wave 2 survey)
Re-contact questionsTo help improve public services we would like to be able to match information from your housing benefit claim to this survey. As before, all information will be used for research and statistical purposes only. Your personal details will be kept completely confidential and any benefits you may receive will not be affected in any way.
G1 Are you happy for Ipsos MORI, on behalf of DWP, to add information about your Housing Benefit claim to your responses to this survey?
1. Yes
2. No
G2 We are keen to contact participants in this first survey again about the Benefit Cap. Can we take your details to contact you again about this study in the future?
1. Yes IF YES – contact details to be recorded: name, address, telephone number, mobile number; and email address (to be entered twice to validate)
2. No
G3 And would you be happy for Ipsos MORI to pass your name and contact details to the Cambridge Centre for Housing and Planning Research (CCHPR) at Cambridge University for them to conduct further research about this study within the next year?
IF YES AT G2, DO NOT RECORD ADDRESS DETAILS AGAIN (DP: FEED THROUGH ADDRESS DETAILS FROM G2).
1. Yes IF YES – contact details to be recorded: name, address, telephone number, mobile number; and email address (to be entered twice to validate)
2. No
G4 Are there any comments you would like to make about the topics we have discussed during this interview?
WRITE IN
None
THANK AND CLOSE

74
Post-implementation effects of the Benefit Cap (wave 2 survey)
Wave two questionnaire
Survey introductionGood morning/afternoon/evening.
My name is ……………… and I am calling you from Ipsos MORI, the research organisation, on behalf of the Department for Work and Pensions.
Can I please speak to [insert name of resident from sample].
INTERVIEWER: If transferred to another person, repeat ‘My name is from Ipsos MORI...the Department for Work and Pensions’. If sample is flagged with ‘Appointee’ then it is permissible to conduct the interview with a nominated appointee.
You may remember that you kindly took part in a research project about changes to housing benefit (specifically the Benefit Cap) in February of this year, which for some, may also have involved a more in-depth interview with our partners at Cambridge University.
We are now conducting a follow-up survey about the Housing Benefit system and specifically the Benefit Cap as part of this research project for Government and are contacting you as you agreed to be contacted again in relation to this research project.
INTERVIEWER: If respondent says they are no longer affected by the benefit changes: ‘We are also interested in speaking with those who were previously affected by the changes but are no longer affected’.
This research will help the government understand how these changes are affecting people’s actions and attitudes and results will be published later this year.
READ REASSURANCE ON CONFIDENTIALITY
I would like to assure you that any information you provide will be held in the strictest of confidence and will be handled securely throughout the study. The research findings will not identify you and no personal information will be shared with any third parties. Further, your answers will not affect your benefit entitlements or future dealings with the Department in any way.
Before we begin, I’d also like to inform you that Ipsos MORI is a member of the Market Research Society.
QA1 Are you available to discuss this briefly now? (Arrange a call back if necessary – the interview takes around 10 minutes)
INTERVIEWER: Check with the caller they are the named person. If it is not [NAME] code as 4 ‘No, not named person…’
ASK ALL//SC2. Yes, [NAME], appropriate time CONTINUE TO SURVEY
3. Yes, [NAME], but need to call back MAKE APPOINTMENT
4. Yes, [NAME], but refused THANK & CLOSE
5. No, not named person [NAME] THANK & CLOSE

75
Post-implementation effects of the Benefit Cap (wave 2 survey)
As you may know the government has introduced a limit on the total amount of benefit working age claimants can be entitled to. This means that households on out of work benefits no longer receive more than £500 a week if they are a couple with or without children, or a single parent, or £350 a week if they are a single adult. Its official name is the Benefit Cap.
If you are affected by the Benefit Cap, your Housing Benefit will go down so that the total amount of benefit received isn’t more than the cap level. This is different from other recent benefit changes like the capping of Local Housing Allowance room rates if you rent your accommodation from a private landlord.
When we last spoke to you in February 2014, at the time you said [you/your family were currently affected/you/your family were not currently affected, but had been] by the Benefit Cap. TEXT SUBSTITUTE FROM SAMPLE
S1 To the best of your knowledge, are you and your family currently affected by the Benefit Cap or not?
ASK ALL//SC//READ OUT 7. Yes, currently affected CONTINUE TO SURVEY
8. No, not currently affected but have been CONTINUE TO SURVEY
9. Don’t know (DO NOT PROMPT) THANK & CLOSE
S2 When did you cease to be affected by the Benefit Cap?
ASK IF CODE 2 AT S1//RECORD MONTH AND YEAR//SOFT CHECK IF BEFORE JUNE 2013//INTERVIEWER CODE MONTH AND YEAR
3. Don’t know/can’t remember
4. Refused
S3 From what you know or understand, why are you no longer affected by the Benefit Cap?
ASK IF CODE 2 AT S1//MC//DO NOT READ OUT PROBE FULLY9. I/someone in the family found a job
10. Increased working hours
11. Renegotiated a lower rent with landlord
12. Moved to another property in the social rented sector
13. Moved to another property in the private sector
14. Started to receive other benefits that meant the Cap doesn’t apply (e.g. Disability Living Allowance, Personal Independence Payment, etc.)
15. Other (please specify)
16. Don’t know
76
Post-implementation effects of the Benefit Cap (wave 2 survey)
Discretionary Housing Payment (DHP)A1 Now for a question about Discretionary Housing Payments, or DHPs, which are top-up payments from local councils to help some Housing Benefit claimants afford their housing costs. Which of the following statements best describes your situation in relation to Discretionary Housing Payments, or DHPs?
ASK ALL//SC//READ OUT7. I applied for and got DHPs, and am still receiving them
8. I applied for and got DHPs, but am no longer receiving them
9. I applied for but did not get DHPs
10. I have applied for DHPs but am still waiting to hear
11. I have not applied for DHPs
12. Don’t know (DO NOT PROMPT)
13. Have never heard of them (DO NOT PROMPT)
A1b You said you applied for but did not get DHPs. Do you know why you did not get DHPs?
ASK IF CODE 3 AT A1
[ENTER RESPONSE]
A2 Since February 2014 when we last spoke to you, have there been any changes to your Discretionary Housing Payment in relation to the following, or have there been no changes?
ASK IF CODE 1 AT A1//MC 1-3//READ OUT4. Yes – an increase in the amount of DHP received
5. Yes – a decrease in the amount of DHP received
6. Yes – a change to the terms or conditions attached to the DHP (SPECIFY)
7. No – no changes to my DHP
8. Don’t know (DO NOT PROMPT)
A3 You say you are no longer receiving DHPs, is this because…
ASK IF CODE 2 AT A1//SC//READ OUT1. You are no longer affected by the Benefit Cap
2. The DHP term came to an end and you did not re-apply
3. The DHP term came to an end, you re-applied but did not get
4. For some other reason(s) (SPECIFY)
5. Don’t know (DO NOT PROMPT)
Coping behavioursI’d now like to ask you some questions about how you are dealing with the reduction in your benefits since being affected by the Benefit Cap. As with the rest of the questionnaire,
77
Post-implementation effects of the Benefit Cap (wave 2 survey)
I would like to assure you that your answers are completely confidential, and will not affect your benefits entitlement in any way.
READ OUT IF CODE 1 AT S1
I’d now like to ask you some questions about how you dealt with the reduction in your benefits when you were affected by the Benefit Cap. As with the rest of the questionnaire, I would like to assure you that your answers are completely confidential, and will not affect your benefits entitlement in any way.
READ OUT IF CODE 2 AT S1
B1 Since we last spoke with you in February this year, what, if anything, have you/your family done in response to the reduction in your benefits since being affected by the Benefit Cap? INTERVIEWER PROMPT: Anything else?
ASK IF CODE 1 AT S1//MC//DO NOT READ OUT PROBE FULLY
B1 Since we last spoke with you in February this year, what, if anything did you/your family do in response to the reduction in your benefits whilst being affected by the Benefit Cap? INTERVIEWER PROMPT: Anything else?
ASK IF CODE 2 AT S1//MC//DO NOT READ OUT PROBE FULLY
Employment related30. Looked for a job
31. Looked for a better paid job
32. Looked for an additional (i.e. second or third) job
33. Looked to become self-employed
34. Increased the number of hours worked at current job
Housing related35. Looked to renegotiate a lower rent with landlord
36. Moved to another property in the social rented sector
37. Moved to another property in the private sector
38. Looked at moving to another property in the social rented sector
39. Looked at moving to another property in the private sector
Benefit related40. Applied for DHP – Discretionary Housing Payments
41. Started to receive other benefits that mean the Cap won’t apply (eg Disability Living Allowance, Personal Independence Payment, etc.)
Money related42. Used savings
43. Borrowed money from friends/family (money which you intend to pay back)

78
Post-implementation effects of the Benefit Cap (wave 2 survey)
44. Received money from friends/family (money which you are not expected to pay back)
45. Borrowed money through a pay day loan
46. Borrowed money from another lender
47. Borrowed money via a credit card
Other48. Not paid rent and gone into rent arrears
49. Not paid other household bills and gone into or added to debt
50. Spent less on household essentials
51. Spent less on non-essentials
52. Take in a lodger
Advice related53. Sought advice or help from Department for Work and Pensions
54. Sought advice or help from Job Centre Plus employment services
55. Sought advice or help from council or housing association (landlord)
56. Sought advice or help from someone else such as a local charity, church or group
57. Other (SPECIFY)
58. None of these (SINGLE CODE)
59. Don’t know (SINGLE CODE)
B2 And since we last spoke to you, have you been able to…?
ASK RELEVANT STATEMENT IF CODES 1-4, OR 6 AT B1//SC//READ OUTe) Find a job
f) Find a better paid job
g) Find an additional job
h) Become self-employed
i) Increase the number of hours worked in your current job
j) Renegotiate a lower rent with landlord
1. Yes
2. No
3. Don’t know
B3 When we last spoke to you, we asked you what you were planning to do in the next 12 months to deal with being affected by the Benefit Cap. I am now going to read out a list of the things you said you had planned to do.

79
Post-implementation effects of the Benefit Cap (wave 2 survey)
Since February 2014, have you/your family DONE any of the following in response to the reduction in your benefits when you were affected by the Benefit Cap?
ASK RELEVANT STATEMENT IF CODE 1-26 AT B2 OF WAVE 1 SURVEY//SC EACH//READ OUT
INTERVIEWER NOTE: IF RESPONDENT SAYS THEY DON’T REMEMBER/DO NOT THINK THEY SAID THEY PLANNED TO TAKE A PARTICULAR ACTION IN PREVIOUS INTERVIEW, ACCEPT AND MOVE ONTO NEXT STATEMENT.
e) Text substitute statement from B2 of Baseline Survey (FROM SAMPLE)
f) Text substitute statement from B2 of Baseline Survey (FROM SAMPLE)
g) Text substitute statement from B2 of Baseline Survey (FROM SAMPLE)
h) Text substitute statement from B2 of Baseline Survey (FROM SAMPLE)
i) etc
1. Yes
2. No
3. Don’t know
B4 You mention you have not been able to do some of the things you had planned to. Why is that?
ASK IF CODE 2 FOR ANY STATEMENT AT B3
WRITE IN1. No reason
2. Don’t know
B5 When we last spoke to you, we asked you what you were planning to do in the next 12 months to deal with being affected by the Benefit Cap. At the time you said you did not have any plans.
Since February 2014, have you/your family done anything in response to the reduction in your benefits when you were affected by the Benefit Cap? INTERVIEWER PROMPT: Anything else?
ASK IF CODE 28 AT B2 OF WAVE 1 SURVEY//MC//DO NOT READ OUT//PROBE FULLY
Employment related1. Looked for a job
2. Looked for a better paid job
3. Looked for an additional (i.e. second or third) job
4. Looked to become self-employed
5. Increased the number of hours worked at current job
80
Post-implementation effects of the Benefit Cap (wave 2 survey)
Housing related6. Looked to renegotiate a lower rent with landlord
7. Moved to another property in the social rented sector
8. Moved to another property in the private sector
9. Looked at moving to another property in the social rented sector
10. Looked at moving to another property in the private sector
Benefit related11. Applied for DHP – Discretionary Housing Payments
12. Started to receive other benefits that mean the Cap won’t apply (e.g. Disability Living Allowance, Personal Independence Payment, etc.)
Money related13. Used savings
14. Borrowed money from friends/family (money which you intend to pay back)
15. Received money from friends/family (money which you are not expected to pay back)
16. Borrowed money through a pay day loan
17. Borrowed money from another lender
18. Borrowed money via a credit card
Other19. Not paid rent and gone into rent arrears
20. Not paid other household bills and gone into or added to debt
21. Spent less on household essentials
22. Spent less on non-essentials
23. Taken in a lodger
Advice related24. Sought advice or help from Department for Work and Pensions
25. Sought advice or help from Job Centre Plus employment services
26. Sought advice or help from council or housing association (landlord)
27. Sought advice or help from someone else such as a local charity, church or group
28. Other (SPECIFY)
29. None of these (SINGLE CODE)
30. Don’t know (SINGLE CODE)
81
Post-implementation effects of the Benefit Cap (wave 2 survey)
B6 You say you have not taken any actions in response to being affected by the Benefit Cap since we last spoke to you. Why is that?
ASK IF CODE 29 AT B5
WRITE IN1. No reason
2. Don’t know
Coping behaviours (employment related)C1 Since we last spoke to you in February 2014, would you say that as a result of being affected by the Benefit Cap, you are doing the following things more or less often than before or about the same amount?
ASK IF CODE 1 AT S1//SC FOR EACH//READ OUT//ROTATE STATEMENTS B TO D
C1 Since we last spoke to you in February 2014, would you say that as a result of being affected by the Benefit Cap, you did the following things more or less often than before or about the same amount?
ASK IF CODE 2 AT S1//SC FOR EACH//READ OUT//ROTATE STATEMENTS B TO D
PLEASE NOTE VARIABLE TEXT FOR CODE 1 AND CODE 2 AT S1 RESPECTIVELY.a) Trying/Tried to find paid work – whether a new job or extra work
b) Using/Used any employment services (like JobCentre Plus, local careers centre or recruitment agency, etc.)
c) Submitting/Submitted applications to find paid work
d) Going/Went to job interviews
1. More
2. Less
3. The same amount
4. Don’t know
C2 Overall, would you say you have been more encouraged or less encouraged to find paid work as a result of being affected by the Benefit Cap, or has it made no difference to you?
ASK IF CODE 1 AT S1//SC
C2 Overall, would you say you were more encouraged or less encouraged to find paid work as a result of being affected by the Benefit Cap, or did it make no difference to you?
ASK IF CODE 2 AT S1//SC1. More encouraged
2. Less encouraged
3. Made no difference
4. Don’t know

82
Post-implementation effects of the Benefit Cap (wave 2 survey)
C3 How would you best describe your current work status?
ASK ALL//SC//DO NOT READ OUT PROBE WHERE NECESSARY1. Working full-time (30 hours a week or more)
2. Working part-time (16-29 hours a week)
3. Working part-time (Less than 16 hours a week)
4. Self-employed (30 hours a week or more)
5. Self-employed (16-29 hours a week)
6. Self-employed (Less than 16 hours a week)
7. Unemployed – seeking work
8. Unemployed – not seeking work
9. Fully retired
10. Long term sick or disabled
11. Full-time education, training scheme/apprenticeship
12. Carer
13. Other
14. Don’t know/refused (SINGLE CODE)
C4 You say you are a carer, can I check which of the following descriptions best applies?
ASK IF CODE 12 AT C3//SC//READ OUT1. You care for someone in a professional capacity (such as working in a care home)
2. You care for someone in an unpaid capacity with or without allowances who currently lives with you
3. You care for someone in an unpaid capacity with or without allowances who does not currently live with you
4. You are a parent caring for a dependent child/children within your household
5. You care for someone in another capacity (SPECIFY)
C5 Regardless of whether or not you are in a job, are there any barriers to you finding work or not at the moment?
ASK ALL//SC1. Yes
2. No
3. Don’t know
C6 What would you say are the main barriers to you finding work? INTERVIEWER PROMPT: Anything else?
ASK IF CODE 1 AT C5//MC MAXIMUM OF 3//DO NOT READ OUT

83
Post-implementation effects of the Benefit Cap (wave 2 survey)
1. Lack of available jobs
2. Lack of appropriate jobs (right skills, place or salary)
3. Cost of transport to work
4. Availability and/or Cost of childcare
5. Lack of qualifications or experience
6. Lack of confidence
7. Poor health
8. Caring for a family member
9. Another reason (specify)
10. Don’t know (SINGLE CODE)
11. Refused
C7 Thinking about any actions you have taken since being affected by the Benefit Cap, how much progress, if any, do you feel you have made in overcoming these barriers to finding work?
ASK IF CODE 1 AT C5//SC//READ OUT
A great deal
A fair amount
Not very much
None at all
Don’t know
C8 What, if anything, have you done to overcome these barriers to finding work? INTERVIEWER PROMPT: Anything else?
ASK IF CODE 1 AT C5//SC//DO NOT READ OUT1. Sought/received help with childcare, cost of childcare
2. Moved to a different area
3. Sought/received help with searching/finding jobs
4. Sought/received help applying for jobs (CVs, interviews, etc.)
5. Sought/received help with training and qualification opportunities
6. Sought/received general careers advice and guidance
7. Sought/received financial assistance to help with job search activities
8. Something else (SPECIFY)
9. Nothing (SINGLE CODE)
10. Don’t know (SINGLE CODE)
11. Refused
84
Post-implementation effects of the Benefit Cap (wave 2 survey)
Coping behaviours (housing related)I’d now like to ask some questions about your accommodation.
D1 Since we last spoke in February 2014, have you moved to another property? If yes, which one of these applies?
ASK ALL//SC//READ OUT 1. Yes – renting from a housing association
2. Yes – renting from a council or local authority
3. Yes – renting from a private landlord
4. Yes – moved into temporary accommodation provided by a council having been accepted as homeless
5. Yes – Other (SPECIFY)
6. No
7. Don’t know (DO NOT PROMPT)
D1b And since February this year, have you at any point lived in temporary accommodation provided by a council having been accepted as homeless?
ASK IF CODES 1-5 AT D1//SC//DO NOT READ OUT1. Yes
2. No
3. Don’t know (DO NOT PROMPT)
D2 How long have you lived here in this accommodation?
ASK IF CODES 1-5 AT D1//SC//DO NOT READ OUT1. Less than a month
2. A month or longer but less than 2 months
3. 2 months or longer but less than 3 months
4. 3 months or longer but less than 4 months
5. 4 months or longer but less than 5 months
6. 5 months or longer
7. Other
8. Don’t know
D3 Can I just check, which of these was your reason(s) for moving to new accommodation?
ASK IF CODES 1-5 AT D1//SC//READ OUT4. Because of the changes to Housing Benefit and nothing else
5. Because of the changes to Housing Benefit and other reason(s)
6. For some other reason(s)
85
Post-implementation effects of the Benefit Cap (wave 2 survey)
7. Don’t know
D4 What is that reason(s)?
ASK IF CODES 2-3 AT D3//MC MAXIMUM OF 3//DO NOT READ OUT
INTERVIEWER NOTE: IF CODE 1 OR 5 PROBE TO DISTINGUISH BETWEEN THE TWO OR IF BOTH ARE APPLICABLE
Property reasons30. Wanted a larger house or flat
31. Wanted a smaller house or flat
32. Wanted self-contained accommodation (i.e. not sharing)
33. Wanted shared accommodation
34. Needed an extra room for a (non-resident) son/daughter to stay overnight
35. Needed an extra room for a carer to stay overnight
36. Wanted a different type of accommodation (e.g. change from flat to house or top floor to ground floor)
37. Sold my previous home
38. Previous property in poor condition (including being demolished)
Financial reasons39. Wanted to pay lower rent
40. Because Housing Benefit payment (£) was reduced because of the Removal of Spare Room Subsidy (‘Bedroom Tax’)
41. Because Housing Benefit payment (£) was reduced because of changes to Local Housing Allowance
42. Because Benefit payment (£) was reduced because of the Benefit Cap
43. Positive change to claimant’s financial situation – could afford a more expensive property
44. Negative change to claimant’s financial situation – lower income (NOT including reduction in Housing Benefit)
Tenancy related reasons45. Asked to leave/evicted – landlord selling the property/needed property for own use
46. Asked to leave/evicted – landlord no longer letting to Benefit claimants
47. Asked to leave/evicted – rent arrears
48. Asked to leave/evicted – following complaint about condition/state of repair
49. Asked to leave/evicted– landlord gave no reason
50. Didn’t get on with the landlord
51. End of tenancy agreement

86
Post-implementation effects of the Benefit Cap (wave 2 survey)
Other reasons 52. To move to a specific area/neighbourhood/town/city
53. To move to a better area/neighbourhood/town/city
54. To move to more settled accommodation (ie from temporary accommodation)
55. For personal or family reasons (e.g. closer to a particular school or friends, to move in with someone/got married, birth of a child, divorce/separation)
56. For job related reasons (e.g. new job)
57. Other (Specify)
58. Don’t know (SINGLE CODE)
D5 Are you CURRENTLY looking to move from this accommodation, or not?
ASK ALL//SC1. Yes
2. No
3. Don’t know
D6 What actions, if any, have you taken to move to different accommodation? INTERVIEWER PROMPT: Anything else?
ASK IF CODE 1 AT D5//MC MAXIMUM OF 3//DO NOT READ OUT 1. Registered for a transfer/mutual exchange
2. Searched for properties
3. Sought advice from council
4. Sought advice from estate/letting agents
5. Sought financial advice
6. Sought help to pay off arrears on current property
7. Visited properties
8. Paid a deposit
9. Sought help from charities/other organisations (e.g. CAB, Shelter)
10. Other (SPECIFY)
11. Nothing (SINGLE CODE)
12. Don’t know (SINGLE CODE)
D7 Are there any barriers to you moving to different accommodation or not at the moment?
ASK IF CODE 1 AT D5//SC1. Yes
2. No
3. Don’t know
87
Post-implementation effects of the Benefit Cap (wave 2 survey)
D8 What are the main barriers to moving to different accommodation?
ASK IF CODE 1 AT D7//MC MAXIMUM OF 3//DO NOT READ OUT 16. Property prices too high
17. A lack of properties available that I can afford
18. A lack of properties available where I want to live
19. A lack of properties available that are the size I want to live in
20. The fees and costs associated with moving (eg fees/transport)
21. Being able to raise enough deposit
22. Job security
23. Household finances
24. In arrears on my current property
25. Difficulties in getting references for new property
26. Lack of sufficient information
27. Proximity to family/friends
28. Proximity to job
29. Proximity to schools and local services
30. Other (SPECIFY)
31. Don’t know (SINGLE CODE)
D9 What, if anything, have you done to overcome these barriers to moving? INTERVIEWER PROMPT: Anything else?
ASK IF CODE 1 AT D7//MC MAXIMUM OF 3//DO NOT READ OUT 1. Looked for cheaper accommodation (e.g. smaller, lower specification)
2. Looked for accommodation in cheaper locations
3. Sought/received advice on finding a property through transfer list/mutual exchange
4. Sought/received advice or help from council or housing association (landlord)
5. Applied for a DHP to help with moving costs
6. Sought/received advice on entitlement to housing benefit/Local Housing Allowance
7. Sought/received advice on entitlement to other benefits
8. Sought/received advice or help from Government Department (eg DCLG, DWP)
9. Sought/received advice or help from a financial advisor
10. Sought/received help/support with housing costs
11. Sought/received help/support with paying off existing arrears
12. Looked for/found a job/better paid job
88
Post-implementation effects of the Benefit Cap (wave 2 survey)
13. Increased income in other ways
14. Borrowed money from friends/family
15. Borrowed money from another lender
16. Something else (SPECIFY)
17. Nothing (SINGLE CODE)
18. Don’t know (SINGLE CODE)
19. Refused
Coping behaviours (financial and other)E1 Since February this year, how often, if at all, have you/your family got into arrears on your property, that is owing money to your landlord because you’ve not been able to pay the rent in full?
ASK ALL//SC//READ OUT1. Never
2. Occasionally
3. Sometimes
4. Most of the time
5. All of the time
6. Don’t know (DO NOT PROMPT)
7. Refused (DO NOT PROMPT)
E2 And are you CURRENTLY up to date with the rent you owe or are you in arrears?
ASK ALL//SC//READ OUT 1. Up to date
2. In arrears
3. Don’t know (DO NOT PROMPT)
4. Refused (DO NOT PROMPT)
E3 By how much are you currently in arrears on this accommodation?
ASK IF CODE 2 AT E2//RECORD EXACT AMOUNT £//LOGIC TEST FOR ANY AMOUNT ABOVE £1,000
IF RESPONDENT DOES NOT KNOW THE EXACT AMOUNT, RECORD THEIR ESTIMATED AMOUNT £
£
3. Don’t know
4. Refused
E4 Since we last spoke with you in February, have your rent arrears increased, decreased or
89
Post-implementation effects of the Benefit Cap (wave 2 survey)
remained the same?
ASK IF CODE 2 AT E2//SC 1. Increased
2. Decreased
3. Remained the same
4. Can’t remember (DO NOT PROMPT)
5. Don’t know (DO NOT PROMPT)
E5 What, if anything, have you done to reduce the amount of arrears you currently owe on this accommodation? INTERVIEWER PROMPT: Anything else?
ASK IF CODE 2 AT E2//MC//DO NOT READ OUT1. Sought/received debt advice/help from Council or landlord
2. Sought/received debt advice/help from Department for Work and Pensions
3. Sought/received debt advice/help from someone else such as a local charity, church or group
4. Agreed a repayment plan with landlord
5. Looked at lower rent properties in the private market
6. Registered with a Council or Housing Association waiting/transfer list
7. Registered for a mutual exchange
8. Spoke to my landlord about lowering the amount of rent charged
9. Applied to the Council for a Discretionary Housing Payment
10. Borrowed money from friends/family (money which you intend to pay back)
11. Received money from friends/family (money which you are not expected to pay back)
12. Borrowed money through a pay day loan
13. Borrowed money from another lender
14. Borrowed money via a credit card
15. Spent less on household essentials
16. Spent less on non-essentials
17. Looked for a job
18. Looked for a better paid job
19. Looked for an additional (i.e. second or third) job
20. Increased the number of hours worked at current job
21. Other (SPECIFY)
22. Nothing (SINGLE CODE)

90
Post-implementation effects of the Benefit Cap (wave 2 survey)
23. Don’t know (SINGLE CODE)
24. Refused (SINGLE CODE)
E6 How often, since February this year, have you or your household run out of money before the end of the week or month? Please include any times when you have run out of money and had to use your credit card, an overdraft, or borrow to get by.
ASK ALL//SC//READ OUT1. Very often
2. Fairly often
3. Hardly ever
4. Never
5. Don’t know (DO NOT PROMPT)
6. Refused (DO NOT PROMPT)
E7 If you ever run out of money at the end of the week or month, how do you cover the shortfall?
ASK IF CODES 1-3 AT E6//MC//DO NOT READ OUT9. Borrowed money from friends/family (money which you intend to pay back)
10. Received money from friends/family (money which you are not expected to pay back)
11. Gifts of food from family or friends
12. Use a food bank
13. Go without meals
14. Reduce heating/energy costs
15. Borrow from a money lender
16. Overdraw from a bank account
17. Use a credit card
18. Use the Housing Benefit money
19. Delay paying the rent
20. Delay paying other bills
21. Other ways (Specify)
22. Don’t know (SINGLE CODE)
E8 Since we last spoke with you in February this year, have you/your family undertaken any of the following in response to the reduction in your benefits while being affected by the Benefit Cap?
91
Post-implementation effects of the Benefit Cap (wave 2 survey)
ASK IF CODE 1 AT S1//MC//READ OUT
E8 Since we last spoke with you in February this year, did you/your family undertake any of the following because of the reduction in your benefits whilst being affected by the Benefit Cap?
ASK IF CODE 2 AT S1//MC//READ OUT 1. Applied for DHP – Discretionary Housing Payments
2. Applied for child maintenance or an increase in child maintenance
3. Applied to adopt, or have adopted a disabled child
4. Living with previously separated family members
5. Taken a lodger
6. Taken receipt of a benefit that exempts you from the Benefit Cap (like Disability Living Allowance or Working Tax Credit)
7. None of these (DO NOT PROMPT)
8. Don’t know (DO NOT PROMPT)
E9 For which of these periods are you charged rent at this accommodation?
ASK ALL//SC//READ OUT1. Weekly
2. Fortnightly
3. 4 weekly
4. Monthly
5. Other (SPECIFY)
6. Don’t know
E10 How much in total does your landlord currently charge your household in rent? That is, the total amount of rent INCLUDING any that is paid by Housing Benefit?
ASK ALL//RECORD EXACT AMOUNT £
IF RESPONDENT DOES NOT KNOW THE EXACT AMOUNT, RECORD THEIR ESTIMATED AMOUNT £
£
3. Don’t know
4. Refused

92
Post-implementation effects of the Benefit Cap (wave 2 survey)
About youAnd lastly I’d like to ask some general questions about you. As with the rest of the questionnaire, I would like to assure you that your answers are completely confidential.
F1 What was your age last birthday?
ASK ALL//SC//DO NOT READ OUT, CODE AS APPROPRIATE10. 16-24
11. 25-34
12. 35-44
13. 45-54
14. 55-59
15. 60-64
16. 65+
17. Don’t know
18. Refused
F2 Thinking back to when we last spoke to you in February this year, have there been any changes in your personal or household circumstances, for example additions or losses to your household or you/someone in your family experiencing poor health?
ASK ALL//SC//READ OUT1. Yes
2. No
3. Don’t know (READ OUT)
F3 How many people usually live in your property in total?
ASK IF CODE 1 AT F2
INTERVIEWER TYPE IN NUMBER100. Don’t know
101. Refused
F4 How many dependent children are there living with you? That is those under the age of 16 or those aged 16-18 unmarried and in full-time education.
ASK IF CODE 1 AT F2
INTERVIEWER TYPE IN NUMBER100. Don’t know
101. Refused
F5 And how many couples are there living in your property? IF NECESSARY One couple is two people in a relationship and living together.
93
Post-implementation effects of the Benefit Cap (wave 2 survey)
ASK IF CODE 1 AT F2
INTERVIEWER TYPE IN NUMBER100. Don’t know
101. Refused
F6 Do you or does anyone in your family have any long-term illness, health problems or disability which limits your/their daily activities or the work you/they can do, including any problems which are due to old age?
ASK IF CODE 1 AT F2//SC 4. Yes
5. No
6. Don’t know
F7 How long have you/your family been receiving any type of benefits?
ASK IF CODE 1 AT F2//SC//DO NOT READ OUT 9. Less than 6 months
10. 6 months or more but less than 12 months
11. 1 year or more but less than 2 years
12. 2 years or more but less than 3 years
13. 3 years or more but less than 5 years
14. 5 years or more but less than 10 years
15. 10 years or more
16. Don’t know
F8 What is your (you and your partner’s) total weekly or monthly income before any deductions for income tax, national insurance and so on? Please include income from all sources such as earnings from employment, benefits, grants, maintenance from an ex-partner, interest on savings, and so on. Please say if this is monthly or weekly.
ASK ALL//IF RESPONDENT DOES NOT KNOW THE EXACT AMOUNT, RECORD THEIR ESTIMATED AMOUNT £
£5. Weekly
6. Monthly
7. Don’t know
8. Refused

94
Post-implementation effects of the Benefit Cap (wave 2 survey)
Data matching and final commentsG1 To help improve public services we would like to be able to match information from your housing benefit claim to this survey. As before, all information will be used for research and statistical purposes only. Your personal details will be kept completely confidential and any benefits you may receive will not be affected in any way.
Are you happy for Ipsos MORI, on behalf of DWP, to add information about your Housing Benefit claim to your responses to this survey?
ASK ALL//SC1. Yes
2. No
G2 Finally, are there any comments you would like to make about the topics we have discussed during this interview?
ASK ALL
WRITE IN
None
THANK AND CLOSE