Washington, DC Smart Roof Cost-Benefit Report - cap...
48
1 Washington, DC Smart Roof Cost-Benefit Report Authors: Greg Kats and Keith Glassbrook, Capital E Partners:
Transcript of Washington, DC Smart Roof Cost-Benefit Report - cap...
1
Washington, DC Smart Roof Cost-Benefit Report
Authors:
Greg Kats and Keith Glassbrook, Capital E
Partners:
2
Acknowledgements Thanks to our Partners:
Department of General Services
National Housing Trust
Global Cool Cities Alliance
Enterprise Community Partners
American Institute of Architects
U.S. Green Building Council Thanks to the Smart Roof Steering Committee:
Sean Cahill – VP of Development, Property Group Partners; President, DC Building Industry Association
Greg Kats – President, Capital E
Brendan Shane – Chief, Office of Policy & Sustainability, District Department of the Environment (now Regional Director for North America, C40 Cities)
Thanks to our Advisors:
David Bowers – VP & Market Leader, Mid-Atlantic, Enterprise Community Partners; Ordained Minister
John Davies-Cole – State Epidemiologist, Center for Policy, Planning & Evaluation, DC Department of Health
Lynn Goldman – Dean, Milken Institute School of Public Health (GWU); Epidemiologist; former EPA Assistant Administrator
Chris Pyke – VP Research, U.S. Green Building Council (now Chief Operating Officer at GRESB)
Thanks for support, insights, and perspectives from:
LaVerne Jones, Gerald Lucas, Rolando Medina, and Rowena Samala – DC Department of Health
Keith Anderson, Evan Branosky, Emily Rice, Jeff Seltzer, Young Tsuei, Bill Updike, Brian Van Wye, and Jay Wilson – District Department of the Environment
Mark Chambers – Department of General Services
Bob Hoehn and Dave Nowak – U.S. Forest Service
David Sailor – Portland State University
Sam Brooks – ClearRock
Ronnen Levinson and Art Rosenfeld – Heat Island Group, Lawrence Berkeley National Laboratory
Hashem Akbari – Concordia University
Richard Rast – Bluefin LLC Special thanks for extensive input from:
Neal Fann – U.S. Environmental Protection Agency
Paul Lanning – Bluefin LLC
Kurt Shickman – Global Cool Cities Alliance
3
Author Bios Greg Kats is President of Capital E, which invests in and advises fast growth clean energy and green building firms, works with large institutions on scaling greening, and partners with national organizations to research and document the cost-effectiveness of green policy and technology. He serves on the DC Mayor’s Green ribbon Task Force. Greg led the development of IPMVP—the global energy and water efficiency design, measurement, and verification standard that has served as the design basis for $50 billion in energy efficiency financing. He helped found LEED, the international green building standard, and was the first recipient of the USGBC Lifetime Achievement Award. Greg served as the Director of Financing for Energy Efficiency and Renewable Energy at the US Department of Energy. Greg also served as Managing Director for the multi-billion dollar global clean energy VC/PE firm Good Energies, where he led investments in energy efficiency, smart grid, and green building technologies. He regularly testifies before and advises governmental entities, including recently the US Congress, the World Bank, the Israeli Knesset, and the National Academy of Sciences. He is a founder of the country’s first green bank and a founder of the American Council on Renewable Energy (ACORE), and he Chairs the Congressionally established advisory board guiding the greening of 430,000 federal buildings. Greg earned an MBA from Stanford University and, concurrently, an MPA from Princeton University, and a BA from UNC-CH as a Morehead Scholar. Greg’s prior work on cost benefit analysis includes:
Greening Our Built World: Costs, Benefits, and Strategies (Island Press, 2010). Includes widely cited cost-benefit analysis and findings. Extensively excerpted by National Academy of Sciences in its 2011 publication “Achieving High-Performance Federal Facilities”
Principal Author, Green Office Buildings: A Practical Guide to Development (Urban Land Institute, 2005)
“The Costs and Financial Benefits of Green Buildings.” 2003. Written for 20 California state agencies. Report findings cited as rationale for 2004 California Executive order requiring all future state public construction and retrofits to be green, for New York City legislation requiring all future public construction to be green, and for Boston legislation requiring all private and public construction to be LEED certifiable.
Co-author, “International Greenhouse Gas Trading Programs: Measurement and Accounting” (Energy Policy, 2003)
Keith Glassbrook is Senior Analyst at Capital E. He has extensive experience in environmental analysis and life cycle assessment. Recently, his life cycle assessment and feasibility study of small wind power in Thailand was published in the journal Energy for Sustainable Development. He supported EPA’s biogenic CO2 emissions ruling and analyzed the environmental impacts of biofuels while at RTI International. His background is rounded out with experience supporting solar renewable energy credit documentation at a VC funded solar firm in Washington, DC and securing funding and supporting the launch of a campus-wide bikeshare program at UNC-Chapel Hill. Keith holds a BS in Environmental Science from UNC-CH, where he graduated Phi Beta Kappa with highest distinction.
4
Executive Summary This report, funded by the District of Columbia Department of General Services (DGS), addresses a large opportunity for Washington, DC to achieve its aspirations to become the greenest, healthiest, most equitable city in the US: how it uses the roofs of city owned buildings. The last decade has seen the emergence of a range of rooftop technologies that provide important health, energy, water, and environmental benefits. These technologies include: cool roofs; green roofs; and rooftop solar photovoltaics (PV). Impacts from the deployment of these technologies on District owned buildings, regions of a city, or city-wide could be transformative for quality of life, sharply cut energy bills, improve the quality of local waterbodies, and help slow climate change cost-effectively.
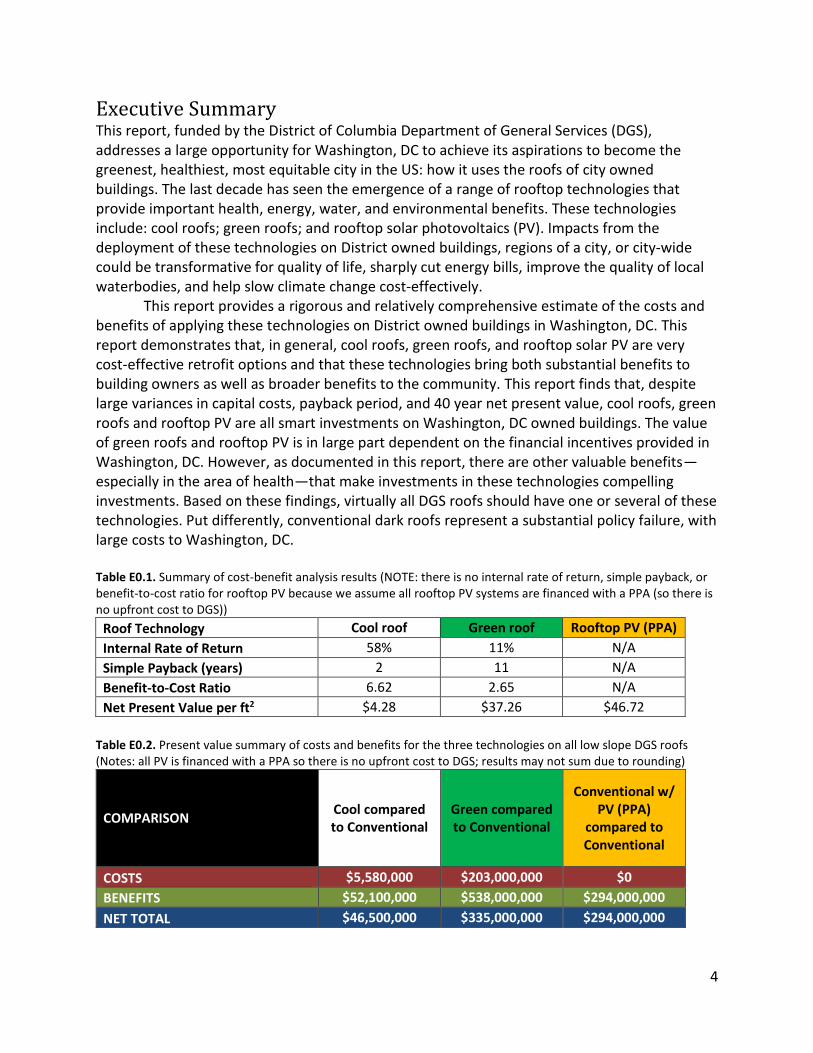
This report provides a rigorous and relatively comprehensive estimate of the costs and benefits of applying these technologies on District owned buildings in Washington, DC. This report demonstrates that, in general, cool roofs, green roofs, and rooftop solar PV are very cost-effective retrofit options and that these technologies bring both substantial benefits to building owners as well as broader benefits to the community. This report finds that, despite large variances in capital costs, payback period, and 40 year net present value, cool roofs, green roofs and rooftop PV are all smart investments on Washington, DC owned buildings. The value of green roofs and rooftop PV is in large part dependent on the financial incentives provided in Washington, DC. However, as documented in this report, there are other valuable benefits—especially in the area of health—that make investments in these technologies compelling investments. Based on these findings, virtually all DGS roofs should have one or several of these technologies. Put differently, conventional dark roofs represent a substantial policy failure, with large costs to Washington, DC. Table E0.1. Summary of cost-benefit analysis results (NOTE: there is no internal rate of return, simple payback, or benefit-to-cost ratio for rooftop PV because we assume all rooftop PV systems are financed with a PPA (so there is no upfront cost to DGS))
Roof Technology Cool roof Green roof Rooftop PV (PPA)
Internal Rate of Return 58% 11% N/A
Simple Payback (years) 2 11 N/A
Benefit-to-Cost Ratio 6.62 2.65 N/A
Net Present Value per ft2 $4.28 $37.26 $46.72
Table E0.2. Present value summary of costs and benefits for the three technologies on all low slope DGS roofs (Notes: all PV is financed with a PPA so there is no upfront cost to DGS; results may not sum due to rounding)
COMPARISON Cool compared to Conventional
Green compared to Conventional
Conventional w/ PV (PPA)
compared to Conventional
COSTS $5,580,000 $203,000,000 $0
BENEFITS $52,100,000 $538,000,000 $294,000,000
NET TOTAL $46,500,000 $335,000,000 $294,000,000
5
This report provides the first rigorous and comprehensive methodology to estimate the costs and benefits of cool roofs, green roofs, and rooftop PV. It has involved a range of leading health and policy advisors and the development of a multi-level health and benefits valuation model to quantify the full set of costs and benefits of these technologies. The establishment of this model provides a powerful new platform to address and understand larger city design opportunities. This reports findings strongly indicate that a city-wide strategy of adoption of these technologies would have private and public benefits on the order of billions of dollars, including providing energy savings for building owners, reducing city peak summer temperatures, improving livability, and providing a large public health benefit.
By providing a rigorous and comprehensive analysis this report is intended to enable Washington, DC to make more informed design and retrofit choices to enhance health, comfort, and affordability and to achieve substantial environmental benefits. In addition, we provide a detailed set of methods and assumptions in the Appendix to help other cities perform similar analyses. We hope for others to build on and improve our methodology and assumptions. Our intent is to make an analysis of this type significantly easier and less time-consuming to apply in cities anywhere and to help drive cost effective improvements in city livability.
6
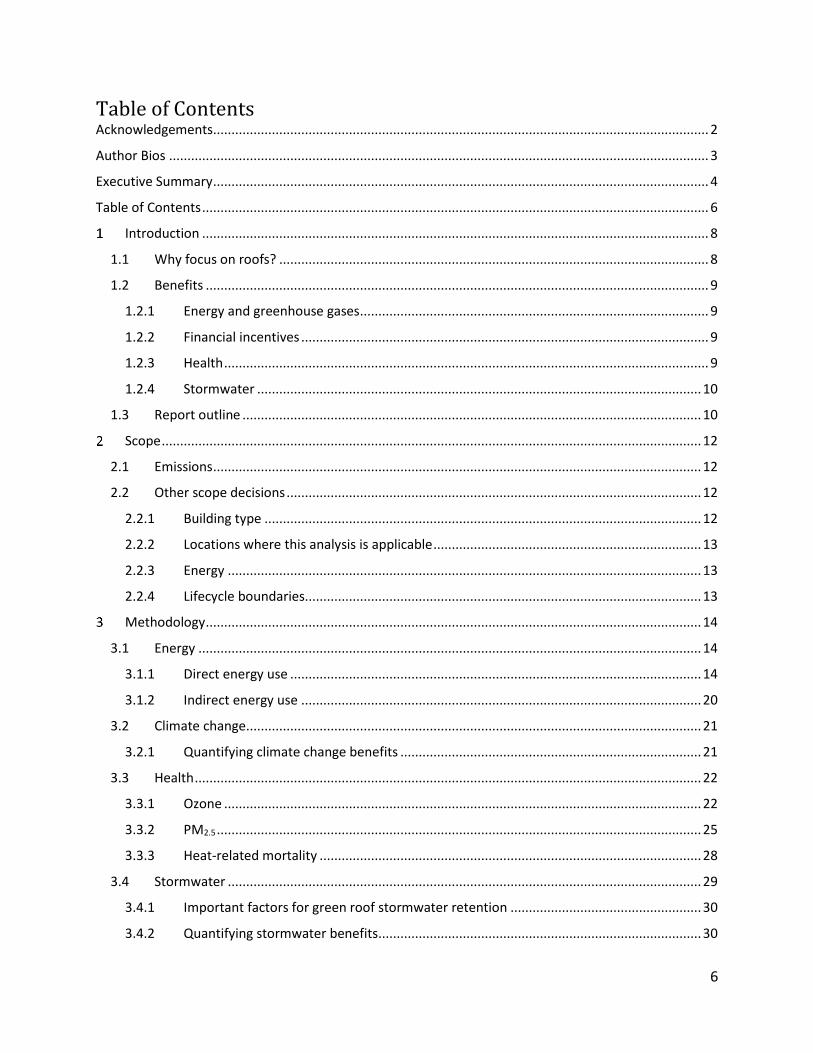
Table of Contents Acknowledgements ....................................................................................................................................... 2
Author Bios ................................................................................................................................................... 3
Executive Summary ....................................................................................................................................... 4
Table of Contents .......................................................................................................................................... 6
Introduction .......................................................................................................................................... 8
1.1 Why focus on roofs? ..................................................................................................................... 8
1.2 Benefits ......................................................................................................................................... 9
1.2.1 Energy and greenhouse gases ............................................................................................... 9
1.2.2 Financial incentives ............................................................................................................... 9
1.2.3 Health .................................................................................................................................... 9
1.2.4 Stormwater ......................................................................................................................... 10
1.3 Report outline ............................................................................................................................. 10
Scope ................................................................................................................................................... 12
2.1 Emissions ..................................................................................................................................... 12
2.2 Other scope decisions ................................................................................................................. 12
2.2.1 Building type ....................................................................................................................... 12
2.2.2 Locations where this analysis is applicable ......................................................................... 13
2.2.3 Energy ................................................................................................................................. 13
2.2.4 Lifecycle boundaries............................................................................................................ 13
Methodology ....................................................................................................................................... 14
3.1 Energy ......................................................................................................................................... 14
3.1.1 Direct energy use ................................................................................................................ 14
3.1.2 Indirect energy use ............................................................................................................. 20
3.2 Climate change ............................................................................................................................ 21
3.2.1 Quantifying climate change benefits .................................................................................. 21
3.3 Health .......................................................................................................................................... 22
3.3.1 Ozone .................................................................................................................................. 22
3.3.2 PM2.5 .................................................................................................................................... 25
3.3.3 Heat-related mortality ........................................................................................................ 28
3.4 Stormwater ................................................................................................................................. 29
3.4.1 Important factors for green roof stormwater retention .................................................... 30
3.4.2 Quantifying stormwater benefits ........................................................................................ 30
7
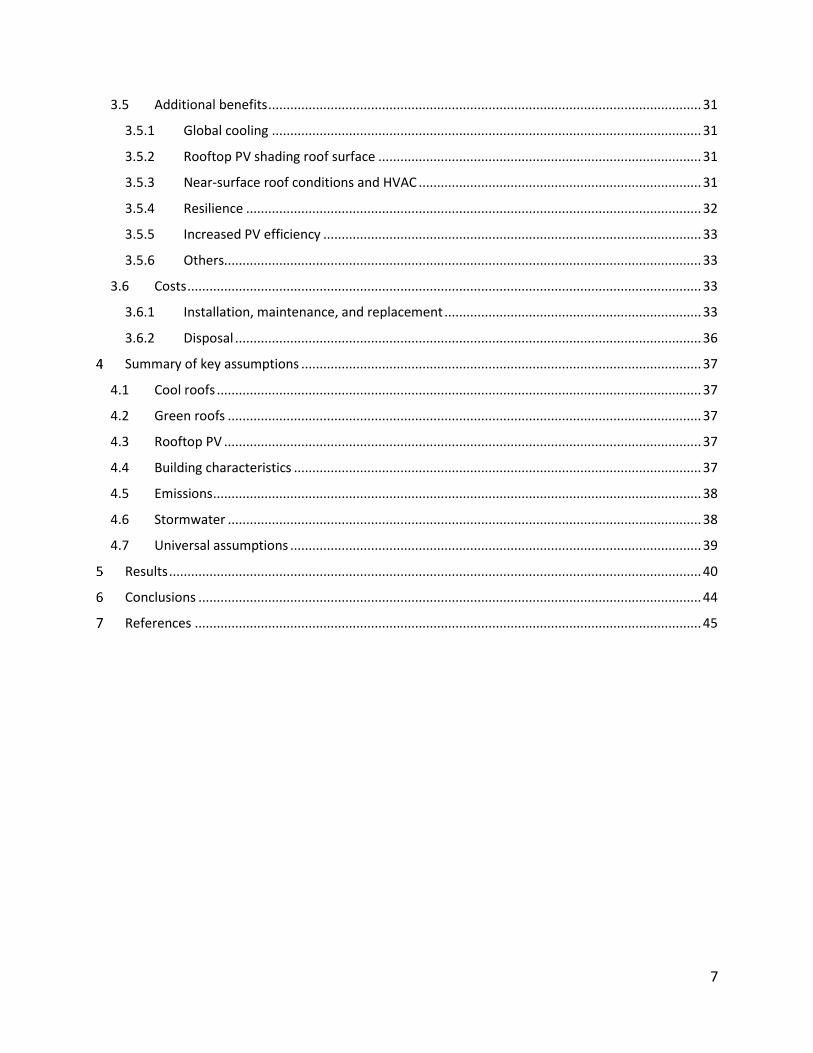
3.5 Additional benefits ...................................................................................................................... 31
3.5.1 Global cooling ..................................................................................................................... 31
3.5.2 Rooftop PV shading roof surface ........................................................................................ 31
3.5.3 Near-surface roof conditions and HVAC ............................................................................. 31
3.5.4 Resilience ............................................................................................................................ 32
3.5.5 Increased PV efficiency ....................................................................................................... 33
3.5.6 Others.................................................................................................................................. 33
3.6 Costs ............................................................................................................................................ 33
3.6.1 Installation, maintenance, and replacement ...................................................................... 33
3.6.2 Disposal ............................................................................................................................... 36
Summary of key assumptions ............................................................................................................. 37
4.1 Cool roofs .................................................................................................................................... 37
4.2 Green roofs ................................................................................................................................. 37
4.3 Rooftop PV .................................................................................................................................. 37
4.4 Building characteristics ............................................................................................................... 37
4.5 Emissions ..................................................................................................................................... 38
4.6 Stormwater ................................................................................................................................. 38
4.7 Universal assumptions ................................................................................................................ 39
Results ................................................................................................................................................. 40
Conclusions ......................................................................................................................................... 44
References .......................................................................................................................................... 45
8
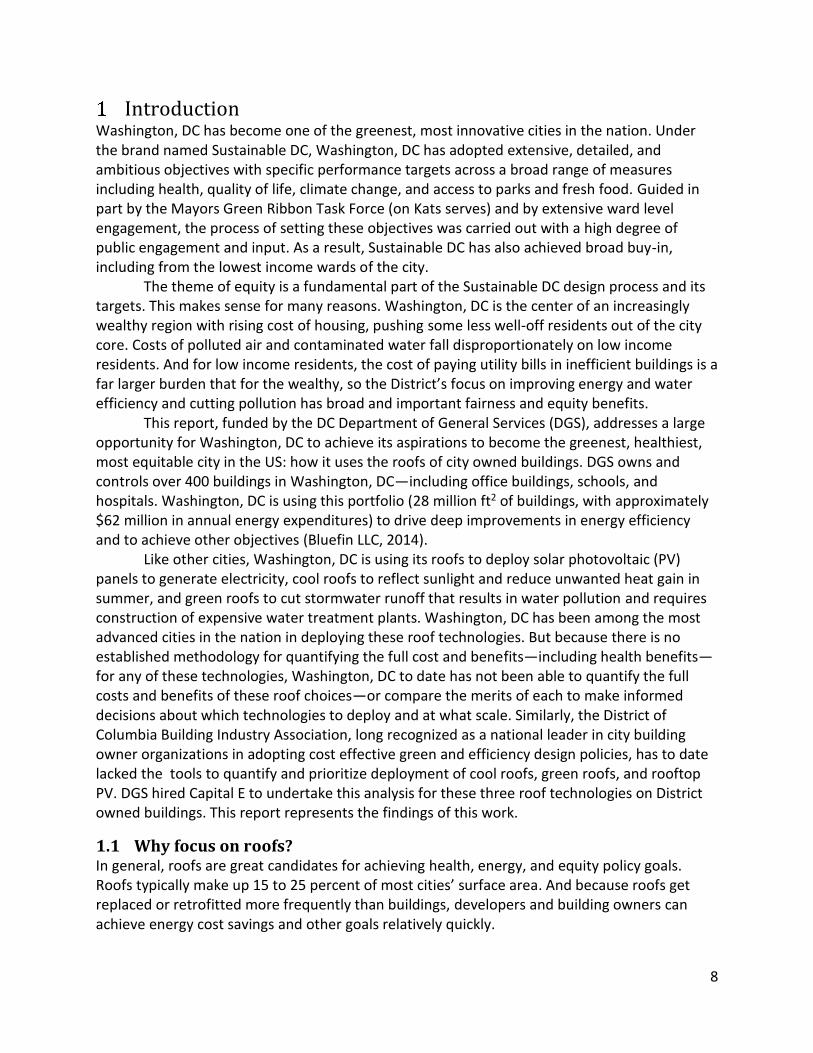
Introduction Washington, DC has become one of the greenest, most innovative cities in the nation. Under the brand named Sustainable DC, Washington, DC has adopted extensive, detailed, and ambitious objectives with specific performance targets across a broad range of measures including health, quality of life, climate change, and access to parks and fresh food. Guided in part by the Mayors Green Ribbon Task Force (on Kats serves) and by extensive ward level engagement, the process of setting these objectives was carried out with a high degree of public engagement and input. As a result, Sustainable DC has also achieved broad buy-in, including from the lowest income wards of the city.
The theme of equity is a fundamental part of the Sustainable DC design process and its targets. This makes sense for many reasons. Washington, DC is the center of an increasingly wealthy region with rising cost of housing, pushing some less well-off residents out of the city core. Costs of polluted air and contaminated water fall disproportionately on low income residents. And for low income residents, the cost of paying utility bills in inefficient buildings is a far larger burden that for the wealthy, so the District’s focus on improving energy and water efficiency and cutting pollution has broad and important fairness and equity benefits.
This report, funded by the DC Department of General Services (DGS), addresses a large opportunity for Washington, DC to achieve its aspirations to become the greenest, healthiest, most equitable city in the US: how it uses the roofs of city owned buildings. DGS owns and controls over 400 buildings in Washington, DC—including office buildings, schools, and hospitals. Washington, DC is using this portfolio (28 million ft2 of buildings, with approximately $62 million in annual energy expenditures) to drive deep improvements in energy efficiency and to achieve other objectives (Bluefin LLC, 2014).
Like other cities, Washington, DC is using its roofs to deploy solar photovoltaic (PV) panels to generate electricity, cool roofs to reflect sunlight and reduce unwanted heat gain in summer, and green roofs to cut stormwater runoff that results in water pollution and requires construction of expensive water treatment plants. Washington, DC has been among the most advanced cities in the nation in deploying these roof technologies. But because there is no established methodology for quantifying the full cost and benefits—including health benefits—for any of these technologies, Washington, DC to date has not been able to quantify the full costs and benefits of these roof choices—or compare the merits of each to make informed decisions about which technologies to deploy and at what scale. Similarly, the District of Columbia Building Industry Association, long recognized as a national leader in city building owner organizations in adopting cost effective green and efficiency design policies, has to date lacked the tools to quantify and prioritize deployment of cool roofs, green roofs, and rooftop PV. DGS hired Capital E to undertake this analysis for these three roof technologies on District owned buildings. This report represents the findings of this work.
1.1 Why focus on roofs? In general, roofs are great candidates for achieving health, energy, and equity policy goals. Roofs typically make up 15 to 25 percent of most cities’ surface area. And because roofs get replaced or retrofitted more frequently than buildings, developers and building owners can achieve energy cost savings and other goals relatively quickly.
9
1.2 Benefits Each of the three roof technologies—cool roofs, green roofs, rooftop PV—is well established. Each technology has different costs and benefits, and each has their advocates. But, like cities and other organizations, governmental organizations do not have a way to evaluate the cost effectiveness of any of these solutions completely, either as a standalone investment, a combined investment, or in comparison with each other. The single largest gap in understanding and quantifying the benefits of these approaches—especially cool roofs and green roofs—is the health-related benefits. Health impact pathways are complicated. We have been fortunate to be able to work with leading public health experts and institutions in developing our analysis.
1.2.1 Energy and greenhouse gases Installation of cool roofs, green roofs, and/or rooftop PV has wide-ranging benefits. Cool roofs and green roofs reduce the energy required for space conditioning, making the government building stock more efficient and lowering energy bills. In Washington, DC, grid electricity sources are relatively dirty, so greenhouse gas (GHG) emission reduction benefits from cutting electricity use by expanding cool and green roof area, and generating power from solar PV can be significant (EPA, 2014a). For cool roofs and green roofs, a large portion of cooling energy reductions occurs during periods of peak energy demand and can reduce the use of the costliest, least efficient, and often dirtiest generation (EPA, 2008a). Rooftop PV also generally offsets grid electricity use during peak demand periods (afternoons) thereby reducing utility need to deploy often dirty, inefficient peaking power plants. Large scale deployment of cool roofs and green roofs can reduce the urban heat island effect. Lower ambient air temperatures not only mean lower cooling energy consumption but also reduced peak electricity demand, which tends to be provided by inefficient, polluting power plants. Buildings that require less energy and/or produce their own energy are less dependent on the grid and more resilient as well.
1.2.2 Financial incentives In many cities and states there are incentives for installing these roof technologies. Washington, DC, along with 29 states, has a renewable portfolio standard that requires a specific percentage of its energy generation come from renewable sources—Washington, DC, also has a specific solar target (DSIRE, 2014). In Washington, DC PV system owners and lessees are eligible to generate renewable energy credits that can be sold to generate income. In addition to renewable energy credit income, there are other types of financial incentives for solar systems at the federal, state, and local levels. There are cool roof and green roof financial incentives as well, most of which are at the local level. Washington, DC offers financial incentives for green roof installation, including subsidies (through the RiverSmart Roof program), discounts on stormwater fees (through the RiverSmart Rewards program), and the ability to generate and sell Stormwater Retention Credits (SRCs) (DDOE, 2014).
1.2.3 Health Lower ambient air temperatures due to cool and green roof installation have public health benefits. Ground-level ozone formation generally increases with higher air temperature so lower summer air temperatures mean lower levels of ground-level ozone and decreased
10
incidence of ozone-related health consequences (e.g., worsened asthma, heart disease, and premature death) (ALA, 2014a). Heat stress is associated with many negative health outcomes, including premature death and is expected to become more common as the planet continues to warm (CDC, 2011). Urban heat island (UHI) mitigation through cool and green roof installation can help ameliorate the effects of heat stress. Reductions in fossil fuel energy use from using any of the three technologies also contributes to reductions in fine particle pollution and reductions in health issues (e.g., heart disease, asthma, and death) (ALA, 2014a).
1.2.4 Stormwater Many cities, including Washington, DC, have stormwater management requirements and incentives to reduce stormwater runoff, especially peak runoff that can result in localized flooding, sewage system overflows, and local water body damage and contamination. Green roofs stand out as effective managers of stormwater. Peak runoff rate reduction, delayed time of peak runoff, and decreased total runoff from green roofs all relieve pressure on aging stormwater infrastructure and reduce water pollution. Stormwater management will become even more important as average annual precipitation and the incidence of extreme rainfall events are expected to increase in many regions, including in Washington, DC, due to climate change.
1.3 Report outline In this report, we first present the results of our cost-benefit analysis. Next, we describe each of the three roof technologies, focusing on characteristics that affect the costs and benefits of each technology. Then we describe how we quantify the costs and benefits of the technologies—including a description of how and why we arrived at each method. Our intent is to provide to users documentation that helps them to use data from their building(s) and city conditions to understand, evaluate, and quantify the full costs and benefits of these technologies.
All costs and benefits are quantified on a present value, dollars per square foot basis, with explicit assumptions on term and discount rate. This approach results in a common, net present value per square foot ($NPV/ft2) estimates that enable all costs and benefits to be compared to each other and/or aggregated into a single common estimate for combined technologies. This allows for more informed policy and design choices. In this analysis we include three cost-benefit estimates. The lower bound estimate assumes the lowest estimated benefits and the highest estimated costs, and the upper bound estimate assumes the highest estimated benefits and the lowest estimated costs. The middle estimate serves as the main cost-benefit estimate of our analysis and assumes the midpoint or average benefit and cost estimates. In this work we have quantified a set of costs and benefits that is broader than other work to date.
Health impacts are substantial but complex, and have generally not been quantified or valued for these three technologies. This report describes the different health impact pathways and methodologies used to calculate these costs and benefits. Because this kind of analysis has not been done before, in building the cost-benefit analysis methodology we had to draw on multiple methods, studies, and models to develop new approaches for quantifying the health impacts. We have quantified some costs and benefits in ways that have not been done before.

11
We have sought to make these assumptions explicit throughout the text. And, in all cases, we provide references and, where available, links.
There are a set of additional benefits and impacts that may be significant but that we have not been able to quantify due to insufficient data. Because most of these impacts are benefits and are excluded from our cost-benefit calculations, our estimates tend to underestimate the value of cool roofs, green roofs, or rooftop PV. In this sense, the report findings are conservative, that is, they tend to underestimate the net benefits of the three technologies.
12
Scope
2.1 Emissions In any analysis of this type a basic decision relates to scope. For example, a private developer that builds and then sells its properties may care little about long-term operational costs. An owner-occupier will care more about operational costs and comfort but may be indifferent to impact on neighbors. Washington, DC has made the decision to be concerned about global climate change and has set policy commitments to achieve greenhouse gas (GHG) emission reductions. Washington, DC clearly views climate change impacts as within its scope of responsibility and policy obligations, and places substantial importance on climate change mitigation and adaptation even though improvements within the city’s borders and the resultant CO2 emission reductions are too small to materially affect global climate change impacts on the city.
The mayor of Washington, DC has signed the U.S. Conference of Mayors Climate Protection Agreement, which among other commitments, commits participating cities to “Strive to meet or beat the Kyoto Protocol targets in their own communities” (U.S. Conference of Mayors, 2014). Most other major U.S. cities (over 1,000) have done so and have made the decision to be expansive about the scope of climate and health costs and benefits relevant to their policy obligations. Most U.S. cities now view their global climate change and other environmental impacts as their own responsibility—for example, as a cost to be included in design decisions—and value the benefits of other forms of pollution reduction even when these reductions occur outside the city (e.g., power plants that provide electricity to Washington, DC are outside the District’s borders). This report, therefore, quantifies and includes all the pollution reduction benefits that result from both local and non-local pollution reduction (e.g., from District Government buildings). This report includes local and non-local emissions impacts for GHG and particulate matter and local temperature impacts on ground-level ozone pollution, but does not include the impacts of temperature reductions on non-local ozone pollution or the impact of local and non-local emissions reductions on ground-level ozone pollution.1
2.2 Other scope decisions Other scope decisions in this report include:
2.2.1 Building type This report estimates the costs and benefits of applying these roof options to the
portfolio of government buildings in Washington, DC. The cost-benefit results cannot be assumed to apply to other building types. Residential buildings, for example, have different occupancy patterns than government buildings, and tend to have different insulation levels and HVAC efficiencies. Therefore, the results of an analysis performed of residential buildings will likely be different than those of this study. For this analysis, we model government buildings as commercial buildings, so results of this analysis will be generally applicable to other commercial buildings. Even within the broad class of commercial buildings, building characteristics (e.g., roof insulation levels, HVAC
1 See the Appendix for the rationale as to why we do not include the effect of temperature on non-local ozone concentrations and the effect of emissions reductions on local and non-local ozone concentrations.
13
efficiencies) can vary greatly. To the extent that building characteristics differ from those in this analysis, results of this report will not apply. Nevertheless, the general findings are broadly indicative of the value of cool roofs, green roofs, and rooftop PV, and the methods explained in this report can be applied to other building portfolios.
2.2.2 Locations where this analysis is applicable Building portfolio location is an important factor to consider because results are highly
location dependent. This report estimates the costs and benefits of cool roofs, green roofs, and rooftop PV in Washington, DC; results in another city may be quite different. For example, solar radiation, which is an important factor in benefit outcomes like rooftop PV output and direct and indirect energy impacts for cool and green roofs, varies widely. In Los Angeles solar radiation is about 24 percent higher than in Washington, DC, so the energy-related benefits of a similar PV analysis performed in Los Angeles will likely be greater than those in this analysis (NREL, 2014). Other factors that can vary by location include but are not limited to: electricity fuel mix and emissions (impacts climate change and PM2.5 benefits), population demographics (impacts health benefits), and portfolio building thermal properties (impacts direct and indirect energy benefits). The methods used in this report, however, can be used to estimate the costs and benefits of other properties in other cities around the world if relevant data is available.2
2.2.3 Energy This report estimates annual energy consumption benefits (direct and indirect) that
result from installing a cool roof or green roof on a building.3 In addition, this report estimates energy cost savings due to installing rooftop PV. However, this report does not address the issue of peak electricity demand impacts in part because of limitations in the energy benefit tools available and because Pepco—the largest electricity provider in the District—does not mandate time of use pricing.
2.2.4 Lifecycle boundaries This report estimates the costs and benefits of the three roof technologies over a 40
year period. This report does not include any costs and benefits that results from raw material extraction or manufacturing of cool roofs, green roofs, or rooftop PV. In addition, GHG and health-related costs and benefits from installation, maintenance, and disposal are not included.
2 As an example, the Green Roof Energy Calculator (GREC), which is used to calculated direct energy benefits, is only available for 95 U.S. cities and 5 Canadian cities, so a user outside these cities would need to determine an alternate method to calculate direct energy benefits for a low slope roof. 3 Direct energy impacts are the energy impacts achieved by reducing heat gain through the roof due to changes in roof technology (i.e., conventional to cool, conventional to green, while indirect energy impacts are the energy impacts achieved by reducing ambient air temperatures.
14
Methodology
3.1 Energy In this section we describe how cool roofs, green roofs, and rooftop PV directly and indirectly impact building energy consumption. First, we summarize how cool roofs, green roofs, and rooftop PV directly impact building energy use and costs. Second, we review how these technologies impact the urban heat island (UHI) effect and indirect energy benefits.
3.1.1 Direct energy use
3.1.1.1 Cool roofs and green roofs
3.1.1.1.1 Cool roofs Cool roofs have a high solar reflectance compared to conventional, dark roofs. Roofs with high solar reflectance reflect more solar radiation (ultraviolet, visible, and/or infrared) than conventional roofs and therefore stay significantly cooler.4 Because the surface temperature of a cool roof is lower than that of a conventional roof, less heat is transferred to the building below and to the surrounding areas. A building with a cool roof requires less energy for cooling in the summer but can require more energy for heating in the winter.5 Factors that minimize this heating penalty include less intense solar radiation during the winter due to lower sun position, shorter days, and increased cloudiness, the potential for winter snow coverage, and the fact that peak demand for heating occurs after the sun goes down, which is when conventional and cool roofs return to roughly the same temperature.6
The amount of direct energy savings/penalty depends on a number of factors. Direct energy savings/penalties depend on the thermal properties of the roof assembly, the operating schedule of a building, and HVAC equipment efficiencies.7 Heat flux through the roof is diminished as the R-value of roof insulation increases (e.g., there is more or better insulation), so buildings with well insulated roofs will experience lower heat transfer-related energy savings (or penalties) than buildings with less well insulated roofs. Savings/penalties will be different in residential and commercial properties because of differences in occupancy and HVAC schedules. The ratio of cooling savings to heating penalty per square foot of roof area for commercial buildings will be higher than that for residential buildings because commercial buildings are typically occupied and conditioned when cooling demand is at its peak and
4 For example, EPA notes a cool roof with high solar reflectance and thermal emittance typically reaches 110 to 115°F in the summer sun, while a conventional roof with low solar reflectance and high thermal emittance typically reaches 165 to 185°F. (EPA, 2008a) 5 This phenomenon can be mitigated by incorporating increased insulation in the roof structure. 6 We do not directly model factors that impact the winter heating penalty. These factors are implicitly addressed in the calculators we use to estimate direct energy benefits so we cannot address them individually. 7 We address the impacts of these factors on direct energy savings/penalties through the selection of building age and type (commercial or residential) in the direct energy savings calculators. See Section 3.1.1.1.4 and the Appendix for more details.

15
heating demand is at its minimum (i.e., during the day), while residential buildings are primarily occupied and conditioned while cooling demand is at its minimum and heating demand is at its peak (i.e., during the evening, night, and morning).
The direct energy savings depend heavily on climate as well.8 For example, in a broad modeling study, Levinson and Akbari (2010) found that cooling energy savings generally increased as building location moved southward, while heating penalties generally increased northward. Levinson and Akbari (2010) determined the load change ratio—increase in annual heating load divided by decrease in annual cooling load—for commercial buildings around the country.9 The load change ratio for office buildings in Washington, DC area ranged from 0.18 to 0.34. The load change ratio would be higher for residential properties for reasons discussed in the previous paragraph.
Heat transfer between floors in a building is minimal, so only the top floor of a building will experience material direct energy savings/penalties from reduced roof heat transfer (Levinson and Akbari, 2010). Therefore, the more floors a building has, the smaller the percentage impact of a cool roof on total building energy consumption.
Another consequence of lower surface temperatures on cool roofs is lower near-roof surface air temperatures. If HVAC components are located on the roof, lower near-roof surface air temperatures result in increased air conditioner efficiency and decreased energy use. The direct energy impact of lowering rooftop air temperatures is discussed with other additional benefits in Section 3.5.3.10
8 We account for the impact of climate on direct energy savings/penalties when we select the location (Washington, DC) of the building portfolio in the direct energy calculators. 9 A load change ratio less than 1 means that the cooling lead decreased more than the heating load increased, resulting in a net energy savings. See Section 3.1.1.1.4 and the Appendix for more details. 10 We do not include the direct energy impact of air conditioning efficiency increases from low near-roof surface temperatures in our direct energy savings/penalties impact.
16
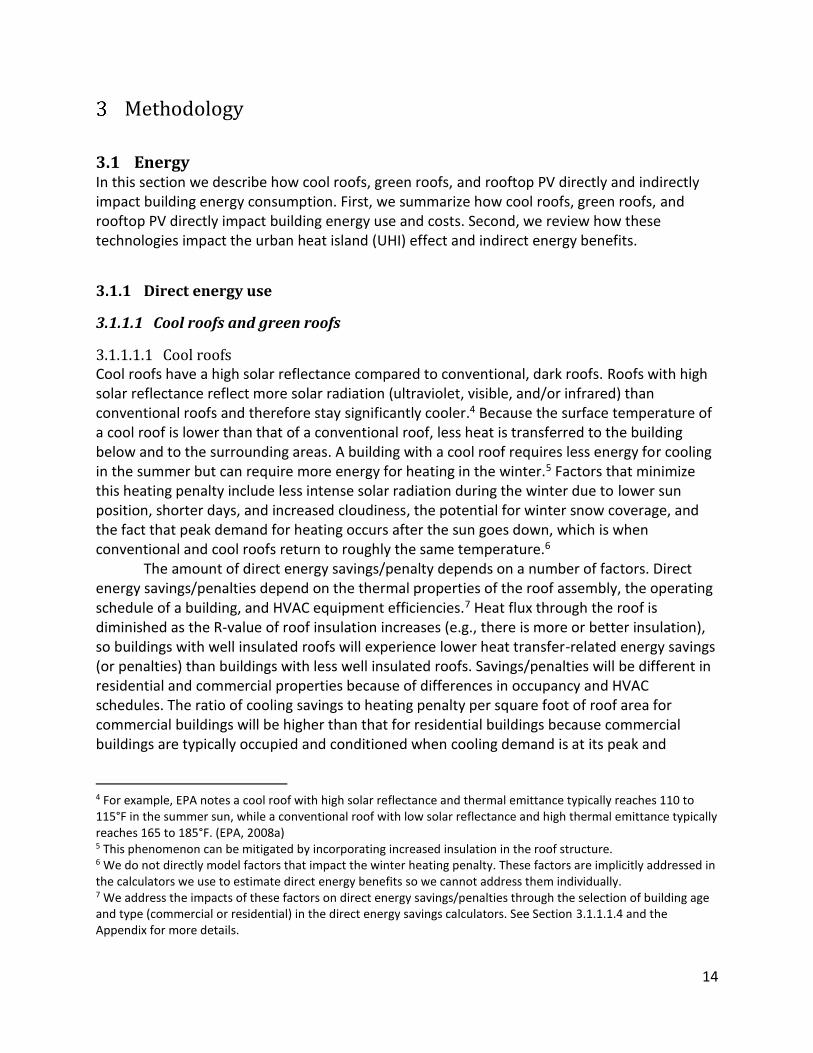
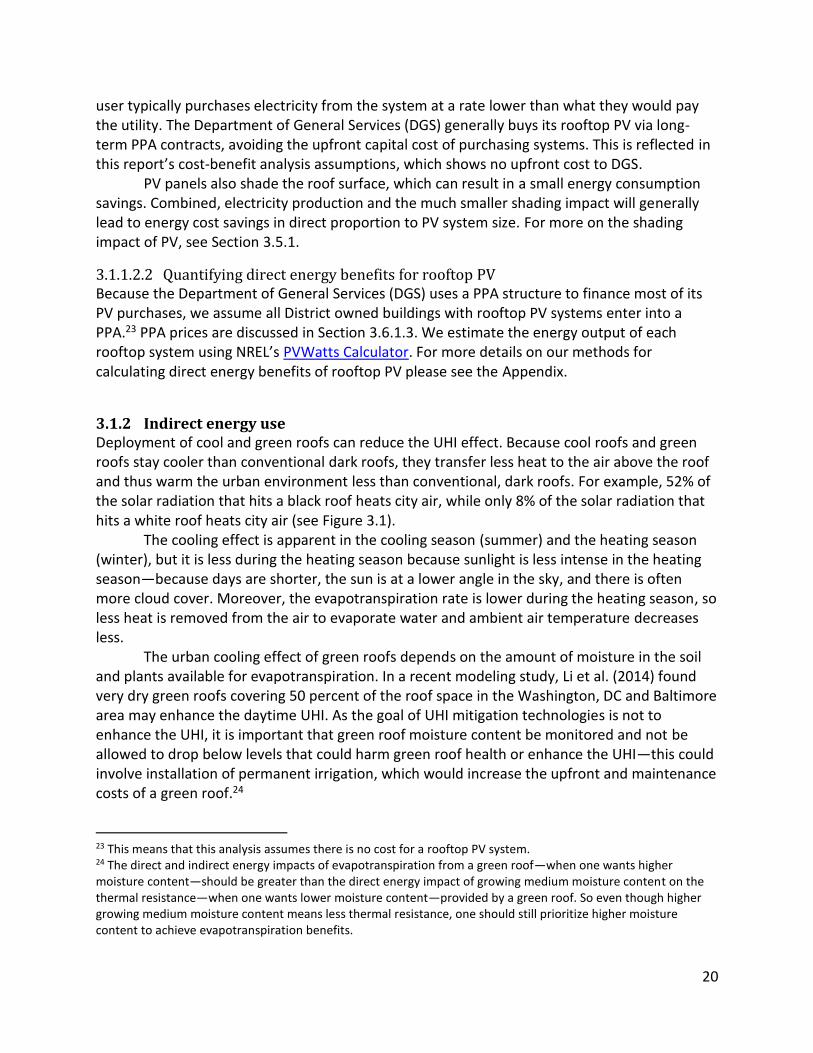
Figure 3.1. Cool roofs reflect the majority of solar radiation that reaches their surface--some of which is reflected back into space—and remain cooler throughout the day. In contrast, dark roofs absorb the large majority of solar radiation that reaches their surface and become hotter as a result. Compared to a cool roof, the higher temperatures on a dark roof results in greater city and atmospheric warming and greater warming of the building below. (Source: Adapted from LBNL Heat Island Group, numbers do not sum due to rounding)
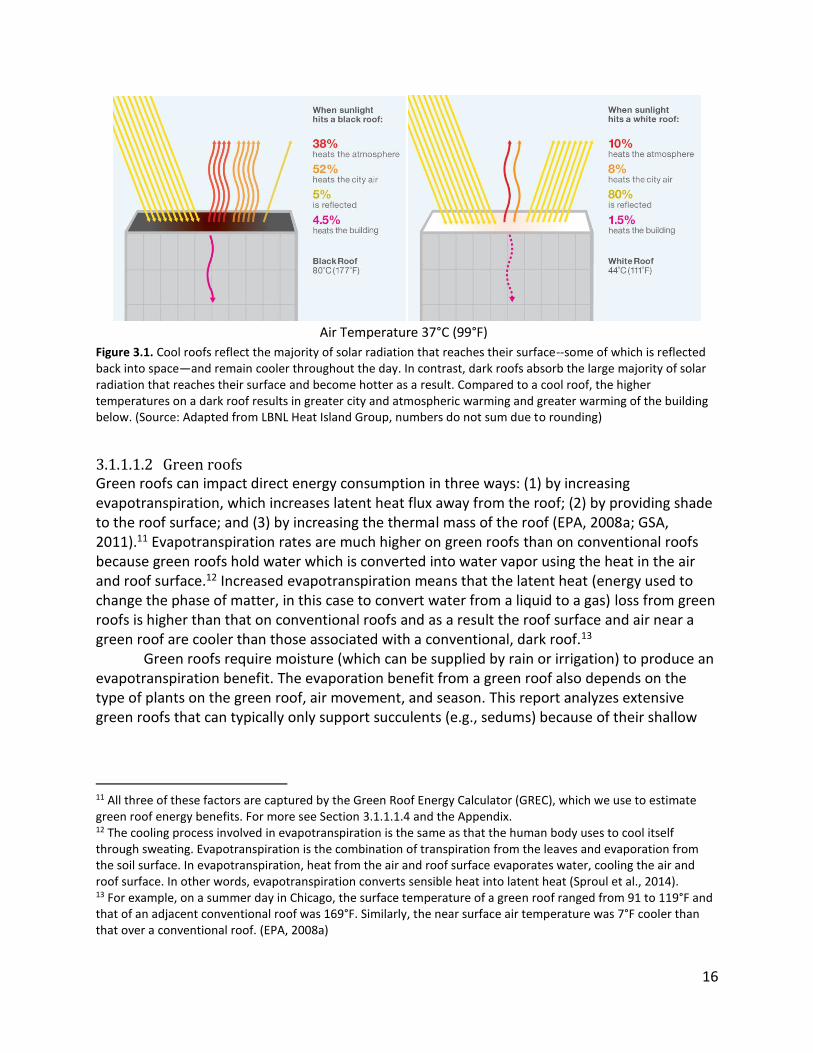
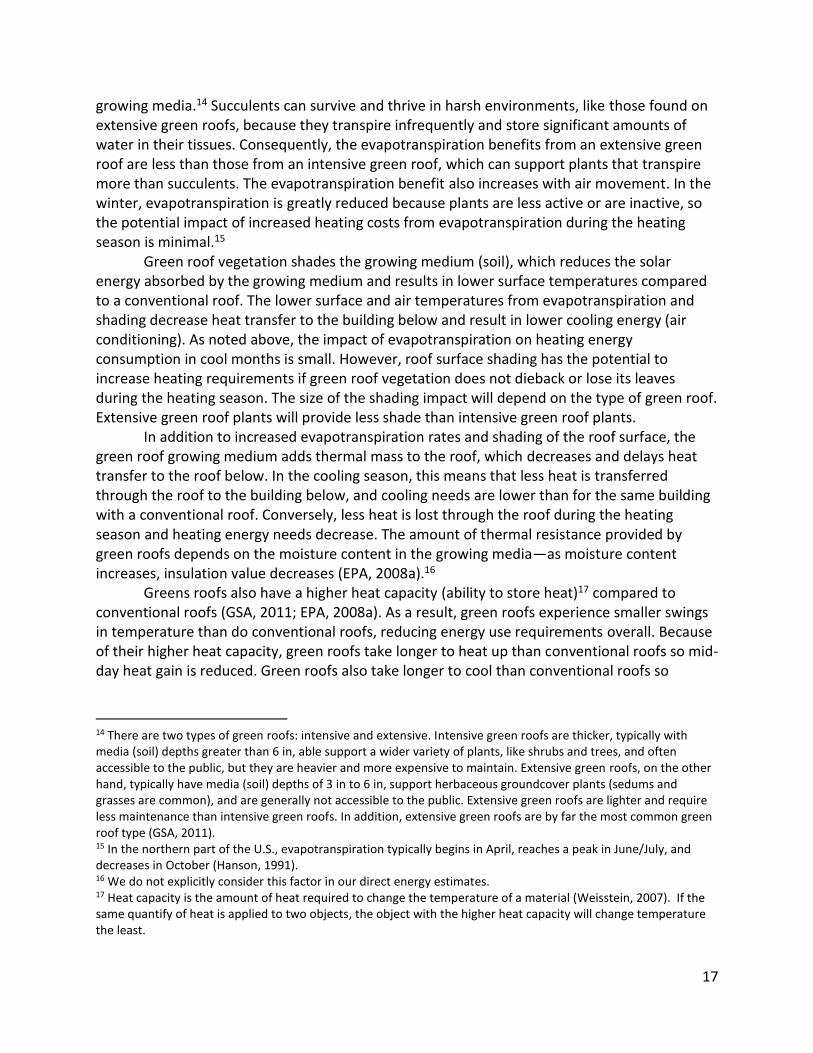
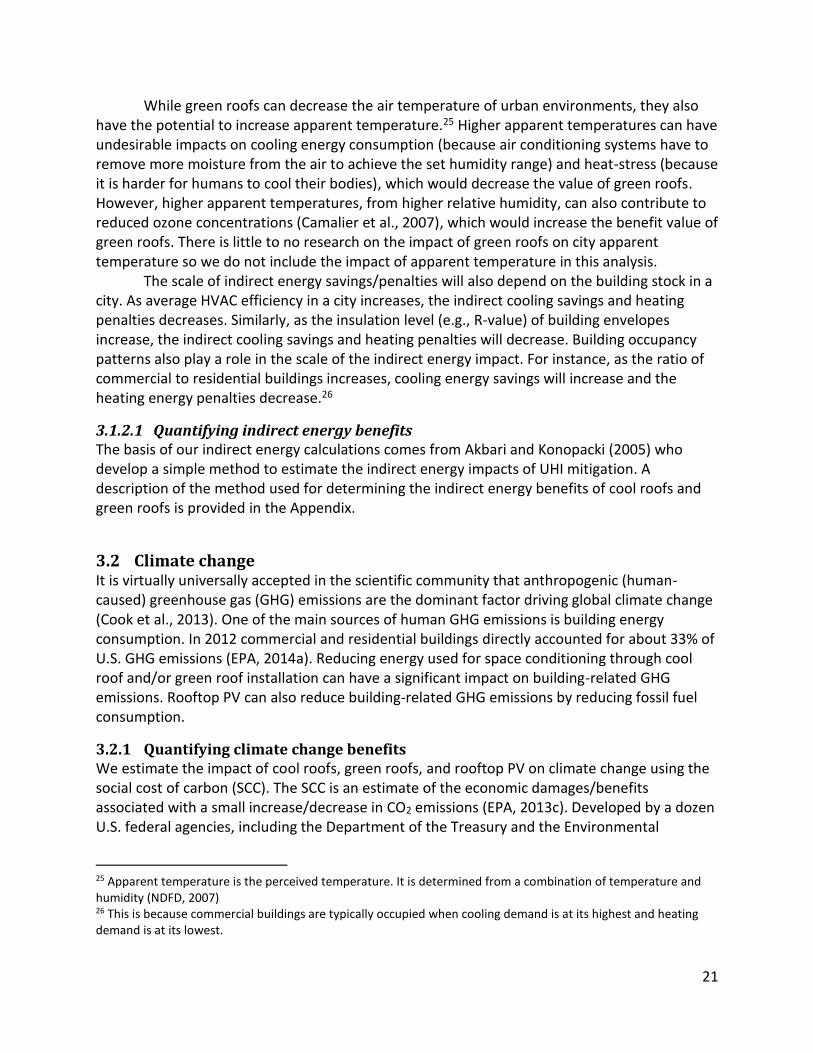
3.1.1.1.2 Green roofs Green roofs can impact direct energy consumption in three ways: (1) by increasing evapotranspiration, which increases latent heat flux away from the roof; (2) by providing shade to the roof surface; and (3) by increasing the thermal mass of the roof (EPA, 2008a; GSA, 2011).11 Evapotranspiration rates are much higher on green roofs than on conventional roofs because green roofs hold water which is converted into water vapor using the heat in the air and roof surface.12 Increased evapotranspiration means that the latent heat (energy used to change the phase of matter, in this case to convert water from a liquid to a gas) loss from green roofs is higher than that on conventional roofs and as a result the roof surface and air near a green roof are cooler than those associated with a conventional, dark roof.13
Green roofs require moisture (which can be supplied by rain or irrigation) to produce an evapotranspiration benefit. The evaporation benefit from a green roof also depends on the type of plants on the green roof, air movement, and season. This report analyzes extensive green roofs that can typically only support succulents (e.g., sedums) because of their shallow
11 All three of these factors are captured by the Green Roof Energy Calculator (GREC), which we use to estimate green roof energy benefits. For more see Section 3.1.1.1.4 and the Appendix. 12 The cooling process involved in evapotranspiration is the same as that the human body uses to cool itself through sweating. Evapotranspiration is the combination of transpiration from the leaves and evaporation from the soil surface. In evapotranspiration, heat from the air and roof surface evaporates water, cooling the air and roof surface. In other words, evapotranspiration converts sensible heat into latent heat (Sproul et al., 2014). 13 For example, on a summer day in Chicago, the surface temperature of a green roof ranged from 91 to 119°F and that of an adjacent conventional roof was 169°F. Similarly, the near surface air temperature was 7°F cooler than that over a conventional roof. (EPA, 2008a)
Air Temperature 37°C (99°F)
17
growing media.14 Succulents can survive and thrive in harsh environments, like those found on extensive green roofs, because they transpire infrequently and store significant amounts of water in their tissues. Consequently, the evapotranspiration benefits from an extensive green roof are less than those from an intensive green roof, which can support plants that transpire more than succulents. The evapotranspiration benefit also increases with air movement. In the winter, evapotranspiration is greatly reduced because plants are less active or are inactive, so the potential impact of increased heating costs from evapotranspiration during the heating season is minimal.15
Green roof vegetation shades the growing medium (soil), which reduces the solar energy absorbed by the growing medium and results in lower surface temperatures compared to a conventional roof. The lower surface and air temperatures from evapotranspiration and shading decrease heat transfer to the building below and result in lower cooling energy (air conditioning). As noted above, the impact of evapotranspiration on heating energy consumption in cool months is small. However, roof surface shading has the potential to increase heating requirements if green roof vegetation does not dieback or lose its leaves during the heating season. The size of the shading impact will depend on the type of green roof. Extensive green roof plants will provide less shade than intensive green roof plants. In addition to increased evapotranspiration rates and shading of the roof surface, the green roof growing medium adds thermal mass to the roof, which decreases and delays heat transfer to the roof below. In the cooling season, this means that less heat is transferred through the roof to the building below, and cooling needs are lower than for the same building with a conventional roof. Conversely, less heat is lost through the roof during the heating season and heating energy needs decrease. The amount of thermal resistance provided by green roofs depends on the moisture content in the growing media—as moisture content increases, insulation value decreases (EPA, 2008a).16
Greens roofs also have a higher heat capacity (ability to store heat)17 compared to conventional roofs (GSA, 2011; EPA, 2008a). As a result, green roofs experience smaller swings in temperature than do conventional roofs, reducing energy use requirements overall. Because of their higher heat capacity, green roofs take longer to heat up than conventional roofs so mid-day heat gain is reduced. Green roofs also take longer to cool than conventional roofs so
14 There are two types of green roofs: intensive and extensive. Intensive green roofs are thicker, typically with media (soil) depths greater than 6 in, able support a wider variety of plants, like shrubs and trees, and often accessible to the public, but they are heavier and more expensive to maintain. Extensive green roofs, on the other hand, typically have media (soil) depths of 3 in to 6 in, support herbaceous groundcover plants (sedums and grasses are common), and are generally not accessible to the public. Extensive green roofs are lighter and require less maintenance than intensive green roofs. In addition, extensive green roofs are by far the most common green roof type (GSA, 2011). 15 In the northern part of the U.S., evapotranspiration typically begins in April, reaches a peak in June/July, and decreases in October (Hanson, 1991). 16 We do not explicitly consider this factor in our direct energy estimates. 17 Heat capacity is the amount of heat required to change the temperature of a material (Weisstein, 2007). If the same quantify of heat is applied to two objects, the object with the higher heat capacity will change temperature the least.
18
morning heating energy requirements may be reduced, but this also means evening cooling requirements may be increased. The direct energy consumption impacts of green roofs depend on many of the same factors as those of cool roofs, namely the thermal properties of the roof assembly, the operating schedule of a building, HVAC equipment efficiencies, and climate. Only the top floor of a building will experience direct energy consumption impacts.18
Figure 3.2. Green roof direct energy benefit features (Source: EPA, 2008a)
3.1.1.1.3 Peak electricity demand Peak roof surface temperatures generally coincide with peak electricity demand—generally on weekday afternoons during the cooling season (summer) (EPA, 2008a). Because cool roofs and green roofs have lower peak roof surface temperatures, buildings with cool roofs or green roofs will experience reduced peak electricity demand.19 Peak electricity demand reduction not only reduces electricity use but it can also reduce consumption during periods with higher electricity rates and reduce capacity charges (e.g., for large commercial and industrial buildings), so
18 Similar to on a cool roof, the near-roof surface temperature on a green roof will be lower than that on a conventional roof during the summer. If HVAC components are located on the roof, lower near-roof surface air temperatures result in increased air conditioner efficiency and decreased energy use. We do not include the direct energy impact of air conditioning efficiency increases from low near-roof surface temperatures in our direct energy savings/penalties impact. 19 Based on a sample of nine cool roof studies, EPA (2008a) found that peak demand for cooling energy was reduced by 14 to 38 percent after cool roof installation. It is important to note, however, that most of these buildings were one story and/or single family residences, so the peak demand savings would likely be smaller for multi-unit affordable housing properties.
19
reduced peak demand can save consumers on their electricity bills. Because of limitations in the Green Roof Energy Calculator (GREC)20 and because Pepco does not currently mandate time of use pricing,21 we do not quantify the benefits of peak electricity demand and consumption reductions. This is an area that merits further research.
3.1.1.1.4 Quantifying direct energy benefits for cool and green roofs We use the Green Roof Energy Calculator (GREC) v2.0 to estimate direct energy savings/penalties from the installation of cool and green roofs on low-slope (including flat) roofs. To estimate the direct energy savings/penalties from the installation of cool roofs on steep-slope roofs (we assume green roofs are not installed on steep-slope roofs) we use GAF’s Cool Roof Energy Savings Tool (CREST), which generates energy savings estimates using Oak Ridge National Laboratory cool roof calculators. Results generated only using CREST for both low slope and steep slope cool roof energy savings estimates can be found in the Appendix. We do not quantify the peak energy demand and consumption reduction benefits of installing cool roofs or green roofs due to limitations in the GREC and because time of use pricing is not mandatory in the District.22 We describe our methods in the Appendix.
3.1.1.2 Rooftop PV
3.1.1.2.1 Rooftop PV Rooftop PV can save on energy costs in two ways: electricity generation and roof surface shading (a comparatively small impact). Almost the entire energy benefit rooftop PV provides is through onsite electricity generation, which reduces electricity bills. Washington, DC has a net metering laws allowing PV owners/lessees to have the value of electricity generation to be recognized at the same price as electricity purchased from the utility, so if any of the electricity produced by the PV system is unused by the building, it is sent to the grid and credited to the next electricity bill at the same price consumers pay for grid supplied electricity. PV owners can also take advantage of the large incentives offered to PV owners including production based incentives (e.g., solar renewable energy credits and feed-in tariffs) and tax credits.
Third-party financing is a popular option for building owners interested in rooftop PV who view the up-front cost of rooftop PV as too high, lack capital to fund a solar investment, and/or who cannot take advantage of certain solar incentives (e.g., tax credits). Third-party solar financing involves solar installers or developers providing solar electricity to a customer without requiring that the customer own a solar electric system. The two most popular forms of third-party ownership are leasing and power purchase agreements (PPA) (DOE, 2014). Under a solar lease, the electricity user pays a monthly fee for the solar system and gets to use all the electricity the system produces without additional charges. Similarly, in a PPA, the electricity
20 We do not include peak demand savings in our direct energy savings estimates for cool roofs or green roofs due to limitations in the Green Roof Energy Calculator (GREC). For more on GREC see Section 3.1.1.1.4 and the Appendix. 21 Time of use pricing for electricity is becoming more widely adopted. It is expected in Washington, DC in the next five years. 22 GREC only provides annual energy savings/penalties estimates so its outputs are not resolved enough to estimate peak demand benefits.
20
user typically purchases electricity from the system at a rate lower than what they would pay the utility. The Department of General Services (DGS) generally buys its rooftop PV via long-term PPA contracts, avoiding the upfront capital cost of purchasing systems. This is reflected in this report’s cost-benefit analysis assumptions, which shows no upfront cost to DGS.
PV panels also shade the roof surface, which can result in a small energy consumption savings. Combined, electricity production and the much smaller shading impact will generally lead to energy cost savings in direct proportion to PV system size. For more on the shading impact of PV, see Section 3.5.1.
3.1.1.2.2 Quantifying direct energy benefits for rooftop PV Because the Department of General Services (DGS) uses a PPA structure to finance most of its PV purchases, we assume all District owned buildings with rooftop PV systems enter into a PPA.23 PPA prices are discussed in Section 3.6.1.3. We estimate the energy output of each rooftop system using NREL’s PVWatts Calculator. For more details on our methods for calculating direct energy benefits of rooftop PV please see the Appendix.
3.1.2 Indirect energy use Deployment of cool and green roofs can reduce the UHI effect. Because cool roofs and green roofs stay cooler than conventional dark roofs, they transfer less heat to the air above the roof and thus warm the urban environment less than conventional, dark roofs. For example, 52% of the solar radiation that hits a black roof heats city air, while only 8% of the solar radiation that hits a white roof heats city air (see Figure 3.1).
The cooling effect is apparent in the cooling season (summer) and the heating season (winter), but it is less during the heating season because sunlight is less intense in the heating season—because days are shorter, the sun is at a lower angle in the sky, and there is often more cloud cover. Moreover, the evapotranspiration rate is lower during the heating season, so less heat is removed from the air to evaporate water and ambient air temperature decreases less.
The urban cooling effect of green roofs depends on the amount of moisture in the soil and plants available for evapotranspiration. In a recent modeling study, Li et al. (2014) found very dry green roofs covering 50 percent of the roof space in the Washington, DC and Baltimore area may enhance the daytime UHI. As the goal of UHI mitigation technologies is not to enhance the UHI, it is important that green roof moisture content be monitored and not be allowed to drop below levels that could harm green roof health or enhance the UHI—this could involve installation of permanent irrigation, which would increase the upfront and maintenance costs of a green roof.24
23 This means that this analysis assumes there is no cost for a rooftop PV system. 24 The direct and indirect energy impacts of evapotranspiration from a green roof—when one wants higher moisture content—should be greater than the direct energy impact of growing medium moisture content on the thermal resistance—when one wants lower moisture content—provided by a green roof. So even though higher growing medium moisture content means less thermal resistance, one should still prioritize higher moisture content to achieve evapotranspiration benefits.
21
While green roofs can decrease the air temperature of urban environments, they also have the potential to increase apparent temperature.25 Higher apparent temperatures can have undesirable impacts on cooling energy consumption (because air conditioning systems have to remove more moisture from the air to achieve the set humidity range) and heat-stress (because it is harder for humans to cool their bodies), which would decrease the value of green roofs. However, higher apparent temperatures, from higher relative humidity, can also contribute to reduced ozone concentrations (Camalier et al., 2007), which would increase the benefit value of green roofs. There is little to no research on the impact of green roofs on city apparent temperature so we do not include the impact of apparent temperature in this analysis. The scale of indirect energy savings/penalties will also depend on the building stock in a city. As average HVAC efficiency in a city increases, the indirect cooling savings and heating penalties decreases. Similarly, as the insulation level (e.g., R-value) of building envelopes increase, the indirect cooling savings and heating penalties will decrease. Building occupancy patterns also play a role in the scale of the indirect energy impact. For instance, as the ratio of commercial to residential buildings increases, cooling energy savings will increase and the heating energy penalties decrease.26
3.1.2.1 Quantifying indirect energy benefits The basis of our indirect energy calculations comes from Akbari and Konopacki (2005) who develop a simple method to estimate the indirect energy impacts of UHI mitigation. A description of the method used for determining the indirect energy benefits of cool roofs and green roofs is provided in the Appendix.
3.2 Climate change It is virtually universally accepted in the scientific community that anthropogenic (human-caused) greenhouse gas (GHG) emissions are the dominant factor driving global climate change (Cook et al., 2013). One of the main sources of human GHG emissions is building energy consumption. In 2012 commercial and residential buildings directly accounted for about 33% of U.S. GHG emissions (EPA, 2014a). Reducing energy used for space conditioning through cool roof and/or green roof installation can have a significant impact on building-related GHG emissions. Rooftop PV can also reduce building-related GHG emissions by reducing fossil fuel consumption.
3.2.1 Quantifying climate change benefits We estimate the impact of cool roofs, green roofs, and rooftop PV on climate change using the social cost of carbon (SCC). The SCC is an estimate of the economic damages/benefits associated with a small increase/decrease in CO2 emissions (EPA, 2013c). Developed by a dozen U.S. federal agencies, including the Department of the Treasury and the Environmental
25 Apparent temperature is the perceived temperature. It is determined from a combination of temperature and humidity (NDFD, 2007) 26 This is because commercial buildings are typically occupied when cooling demand is at its highest and heating demand is at its lowest.
22
Protection Agency, the SCC reflects the best current science and economic understanding of the impact of climate change.27,28 See the Appendix for more details on the methods used to estimate the climate change impact of the three roof technologies.
3.3 Health Cool roof, green roof, and rooftop PV installations reduce air pollution thereby improving public health. We examine two major urban pollutants: ground-level (tropospheric) ozone (subsequently referred to as “ozone”) and fine particles (particles less than or equal to 2.5 micrometers in size and subsequently referred to as “PM2.5”). The pollution reduction pathways are different for the three roof technologies. We describe the similarities and differences for the three roof technologies below.
3.3.1 Ozone
3.3.1.1 Ozone background Ozone is a secondary pollutant formed when its two primary precursors, volatile organic compounds (VOCs) and nitrogen oxides (NOx), combine in the presence of sunlight. Ambient ozone concentration depends on a number of factors, including but not limited to temperature, relative humidity, solar radiation, and wind speed (EPA, 2008b; Camalier et al., 2007). As temperature increases, the rates of chemical reactions that form ozone increase, thereby increasing ozone formation, and thus ozone levels tend to be highest during the afternoon and during the warm season. The ozone season is defined as May through September (EPA, 2008b; Bell et al., 2007 and references therein; EPA, 2012a). Climate change is expected to result in increased ozone pollution and negative human health effects. For example, Bell et al. (2007) analyzed the effects of climate change on ozone concentrations in 50 U.S. cities and found that climate change can be expected to increase ambient ozone concentrations—daily 8 hour max ozone increased on average by 4.4 parts per billion (ppb), or 7.2%—and thus harm human health. Perera and Sanford (2011) analyzed the ozone-related health costs of climate change in 40 U.S. states and found that in the year 2020 alone a 1 parts per billion (ppb) and 2 ppb increase in ozone concentration would increase health costs by $2.7 billion and $5.4 billion, respectively.29 As noted above, UHIs result in higher ambient ozone concentrations and related human health problems; however, we have found no studies that quantify elevated ozone levels caused by UHIs and/or ozone-related health impacts of UHIs (EPA, 2008a).30 In this
27 The SCC was recently reviewed by the U.S. Government Accountability Office (GAO). A report of GAO’s finding, published in July, 2014, reaffirmed all SCC methodologies and findings (GAO, 2014). 28 The SCC estimates are built on three widely used climate impact models and each are modelled with discount rates of 2.5%, 3%, and 5%. First issued in 2010, the SCC was recently revised in 2013. The 2013 update estimated a higher cost value associated with CO2 than the earlier analysis, reflecting the trend of attributing greater impact and cost to climate change. The average SCC in 2014 using the 5%, 3%, and 2.5% discount rates is $11, $36, and $56 per metric ton of CO2 emitted, respectively. 29 These cost increases are in 2008$. 30 Rasmussen et al. (2013) summarizes the current work on the ozone-temperature relationship well. They note that Holloway et al. (2008) and Lam et al. (2011) examined the relationship between ozone and climate change, while Bell et al. (2007), Chang et al. (2010), Post et al. (2012), Ebi and McGregor (2008), and Tagaris et al. (2009)
23
analysis, we quantify the impact that cool roofs and green roofs have on ambient ozone concentrations and ozone-related human health effects.
Ozone concentration is also dependent on the level of VOCs and NOx in the atmosphere because the rate of ozone production can be limited by either VOCs or by NOx.31 Ozone precursors are emitted directly into the atmosphere by biogenic (natural) and anthropogenic (human) sources. In urban areas, the largest sources of anthropogenic VOCs are solvent use and motor vehicle use (EPA, 2008a). At the regional and global scales, VOC emissions from vegetation are significantly larger than VOC emissions from anthropogenic sources. Combustion processes are the largest source of anthropogenic NOx emissions—electric power generation and motor vehicles are the two largest sources. Biogenic sources of NOx are typically much less significant than anthropogenic sources. The major natural sources of NOx in the US include lightning, fertilizer, and wildfires.
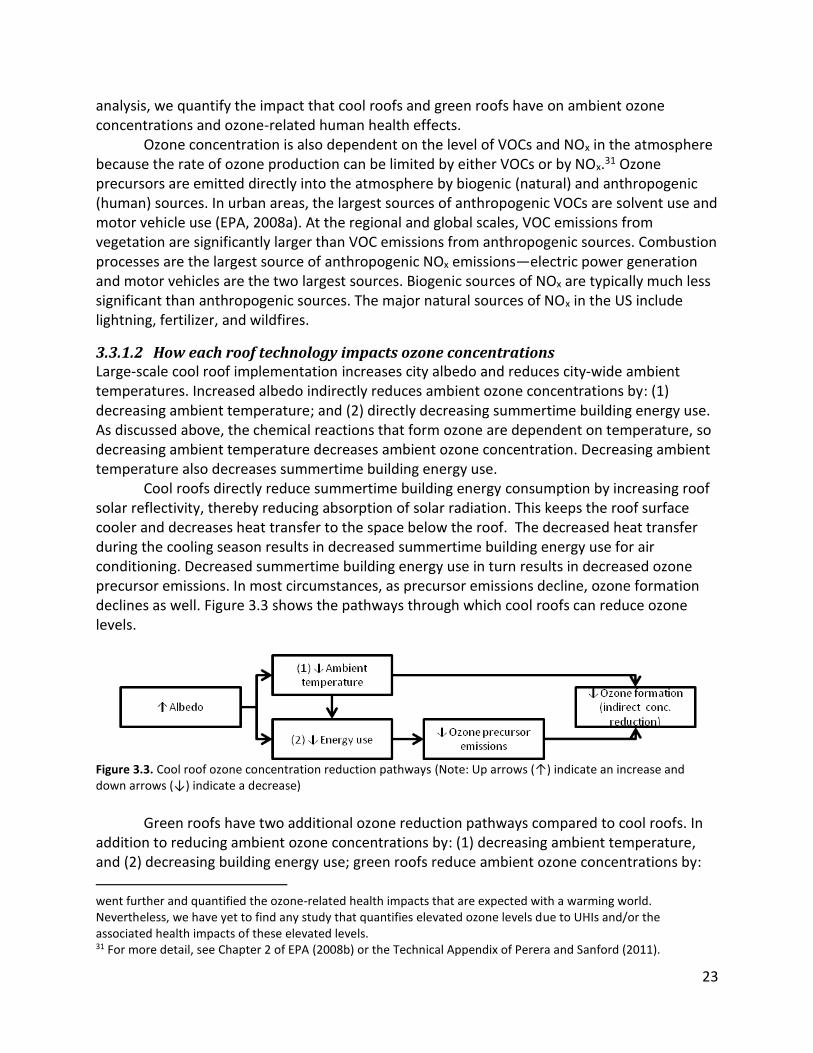
3.3.1.2 How each roof technology impacts ozone concentrations Large-scale cool roof implementation increases city albedo and reduces city-wide ambient temperatures. Increased albedo indirectly reduces ambient ozone concentrations by: (1) decreasing ambient temperature; and (2) directly decreasing summertime building energy use. As discussed above, the chemical reactions that form ozone are dependent on temperature, so decreasing ambient temperature decreases ambient ozone concentration. Decreasing ambient temperature also decreases summertime building energy use.
Cool roofs directly reduce summertime building energy consumption by increasing roof solar reflectivity, thereby reducing absorption of solar radiation. This keeps the roof surface cooler and decreases heat transfer to the space below the roof. The decreased heat transfer during the cooling season results in decreased summertime building energy use for air conditioning. Decreased summertime building energy use in turn results in decreased ozone precursor emissions. In most circumstances, as precursor emissions decline, ozone formation declines as well. Figure 3.3 shows the pathways through which cool roofs can reduce ozone levels.
Figure 3.3. Cool roof ozone concentration reduction pathways (Note: Up arrows (↑) indicate an increase and down arrows (↓) indicate a decrease)
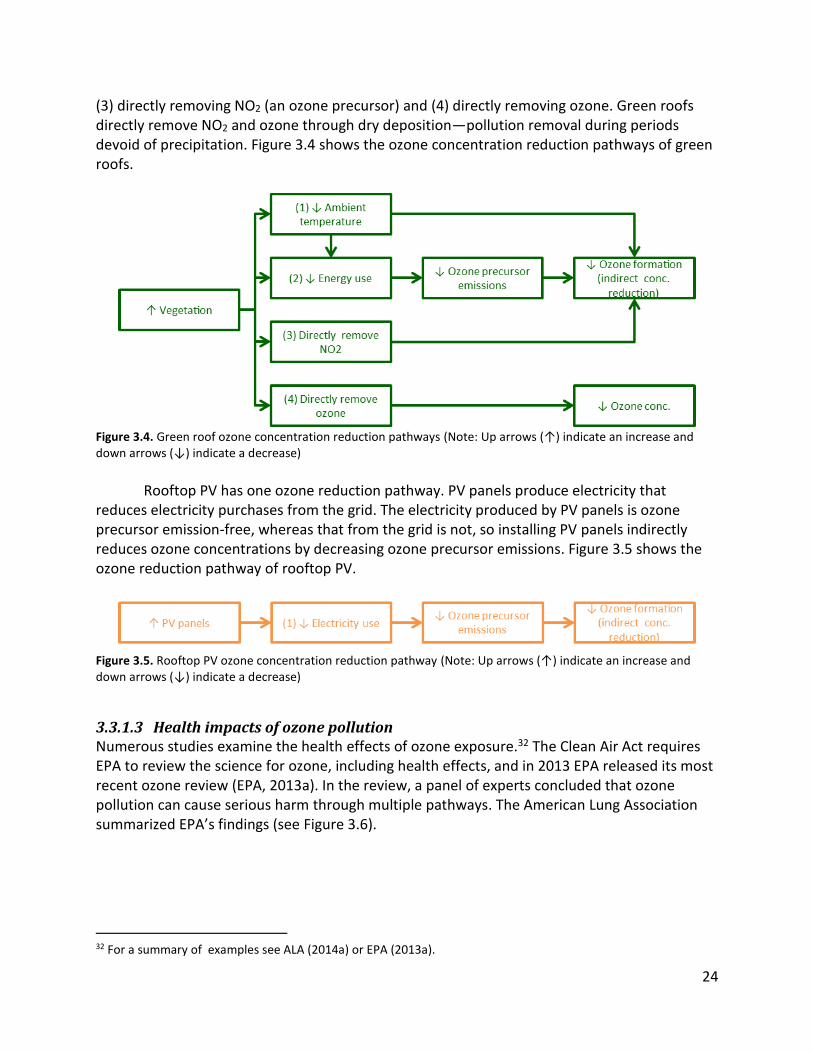
Green roofs have two additional ozone reduction pathways compared to cool roofs. In
addition to reducing ambient ozone concentrations by: (1) decreasing ambient temperature, and (2) decreasing building energy use; green roofs reduce ambient ozone concentrations by:
went further and quantified the ozone-related health impacts that are expected with a warming world. Nevertheless, we have yet to find any study that quantifies elevated ozone levels due to UHIs and/or the associated health impacts of these elevated levels. 31 For more detail, see Chapter 2 of EPA (2008b) or the Technical Appendix of Perera and Sanford (2011).
24
(3) directly removing NO2 (an ozone precursor) and (4) directly removing ozone. Green roofs directly remove NO2 and ozone through dry deposition—pollution removal during periods devoid of precipitation. Figure 3.4 shows the ozone concentration reduction pathways of green roofs.
Figure 3.4. Green roof ozone concentration reduction pathways (Note: Up arrows (↑) indicate an increase and down arrows (↓) indicate a decrease)
Rooftop PV has one ozone reduction pathway. PV panels produce electricity that reduces electricity purchases from the grid. The electricity produced by PV panels is ozone precursor emission-free, whereas that from the grid is not, so installing PV panels indirectly reduces ozone concentrations by decreasing ozone precursor emissions. Figure 3.5 shows the ozone reduction pathway of rooftop PV.
Figure 3.5. Rooftop PV ozone concentration reduction pathway (Note: Up arrows (↑) indicate an increase and down arrows (↓) indicate a decrease)
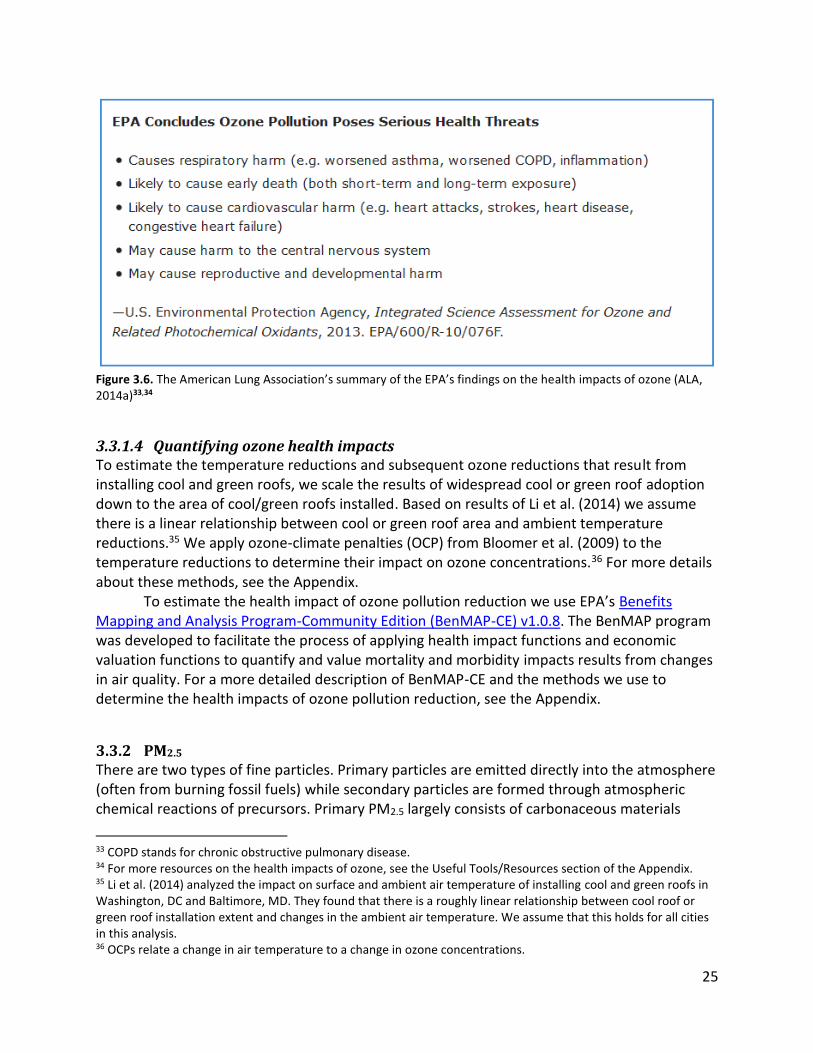
3.3.1.3 Health impacts of ozone pollution Numerous studies examine the health effects of ozone exposure.32 The Clean Air Act requires EPA to review the science for ozone, including health effects, and in 2013 EPA released its most recent ozone review (EPA, 2013a). In the review, a panel of experts concluded that ozone pollution can cause serious harm through multiple pathways. The American Lung Association summarized EPA’s findings (see Figure 3.6).
32 For a summary of examples see ALA (2014a) or EPA (2013a).
25
Figure 3.6. The American Lung Association’s summary of the EPA’s findings on the health impacts of ozone (ALA, 2014a)33,34
3.3.1.4 Quantifying ozone health impacts To estimate the temperature reductions and subsequent ozone reductions that result from installing cool and green roofs, we scale the results of widespread cool or green roof adoption down to the area of cool/green roofs installed. Based on results of Li et al. (2014) we assume there is a linear relationship between cool or green roof area and ambient temperature reductions.35 We apply ozone-climate penalties (OCP) from Bloomer et al. (2009) to the temperature reductions to determine their impact on ozone concentrations.36 For more details about these methods, see the Appendix.
To estimate the health impact of ozone pollution reduction we use EPA’s Benefits Mapping and Analysis Program-Community Edition (BenMAP-CE) v1.0.8. The BenMAP program was developed to facilitate the process of applying health impact functions and economic valuation functions to quantify and value mortality and morbidity impacts results from changes in air quality. For a more detailed description of BenMAP-CE and the methods we use to determine the health impacts of ozone pollution reduction, see the Appendix.
3.3.2 PM2.5 There are two types of fine particles. Primary particles are emitted directly into the atmosphere (often from burning fossil fuels) while secondary particles are formed through atmospheric chemical reactions of precursors. Primary PM2.5 largely consists of carbonaceous materials
33 COPD stands for chronic obstructive pulmonary disease. 34 For more resources on the health impacts of ozone, see the Useful Tools/Resources section of the Appendix. 35 Li et al. (2014) analyzed the impact on surface and ambient air temperature of installing cool and green roofs in Washington, DC and Baltimore, MD. They found that there is a roughly linear relationship between cool roof or green roof installation extent and changes in the ambient air temperature. We assume that this holds for all cities in this analysis. 36 OCPs relate a change in air temperature to a change in ozone concentrations.
26
(elemental carbon, organic carbon, and crustal materials). Major sources of primary particles include fires, dust, agricultural processes, stationary fuel combustion (e.g., electric utilities), motor vehicles, and industrial processes (e.g., metal smelters) (EPA, 2014c). Secondary particles make up most of the PM2.5 pollution in the U.S. (EPA, 2013b). Secondary PM2.5 is mainly made up of sulfates (formed from sulfur dioxide emissions), nitrates (formed from NOx emissions), ammonium (formed from ammonia emissions), and organic carbon (formed from VOCs). The vast majority of sulfur dioxide emissions are from stationary fuel combustion (e.g., power plants). The dominant source of ammonia emissions is agricultural processes (e.g., animal feed operations) (EPA, 2014c; EPA, 2012c). In the EPA region that includes Washington, DC, the main components of fine particle pollution are organic carbon and sulfates (EPA, 2008c).
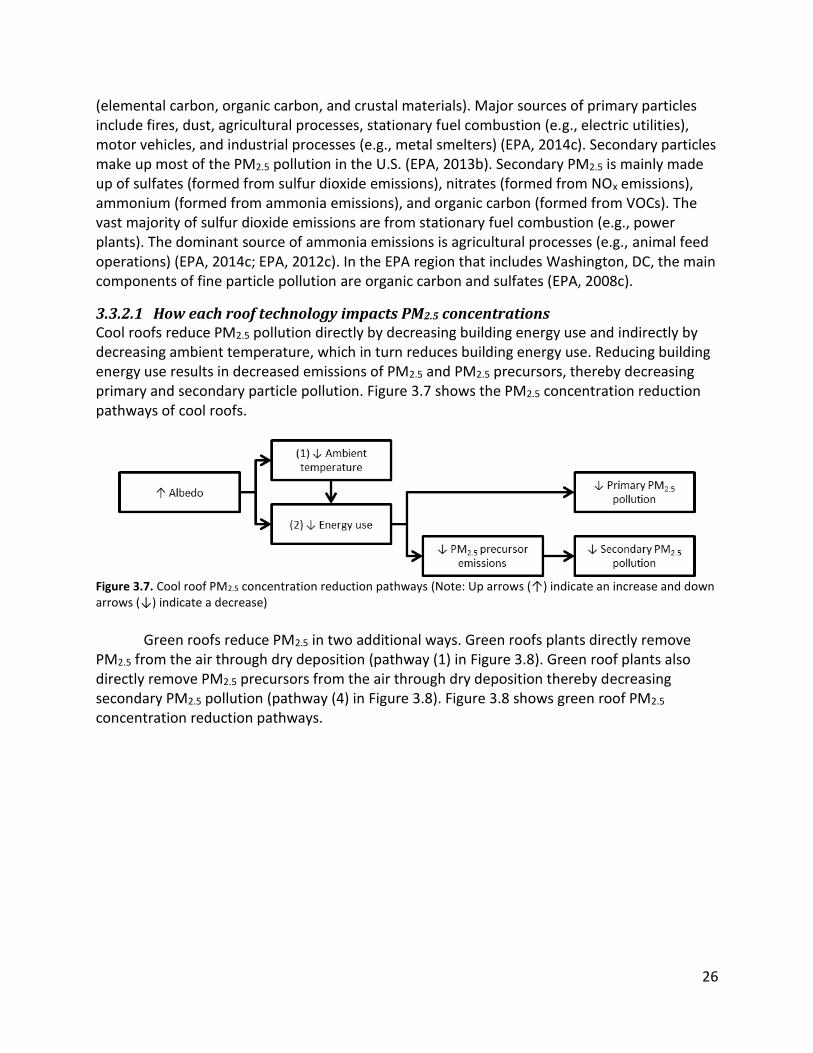
3.3.2.1 How each roof technology impacts PM2.5 concentrations Cool roofs reduce PM2.5 pollution directly by decreasing building energy use and indirectly by decreasing ambient temperature, which in turn reduces building energy use. Reducing building energy use results in decreased emissions of PM2.5 and PM2.5 precursors, thereby decreasing primary and secondary particle pollution. Figure 3.7 shows the PM2.5 concentration reduction pathways of cool roofs.
Figure 3.7. Cool roof PM2.5 concentration reduction pathways (Note: Up arrows (↑) indicate an increase and down arrows (↓) indicate a decrease)
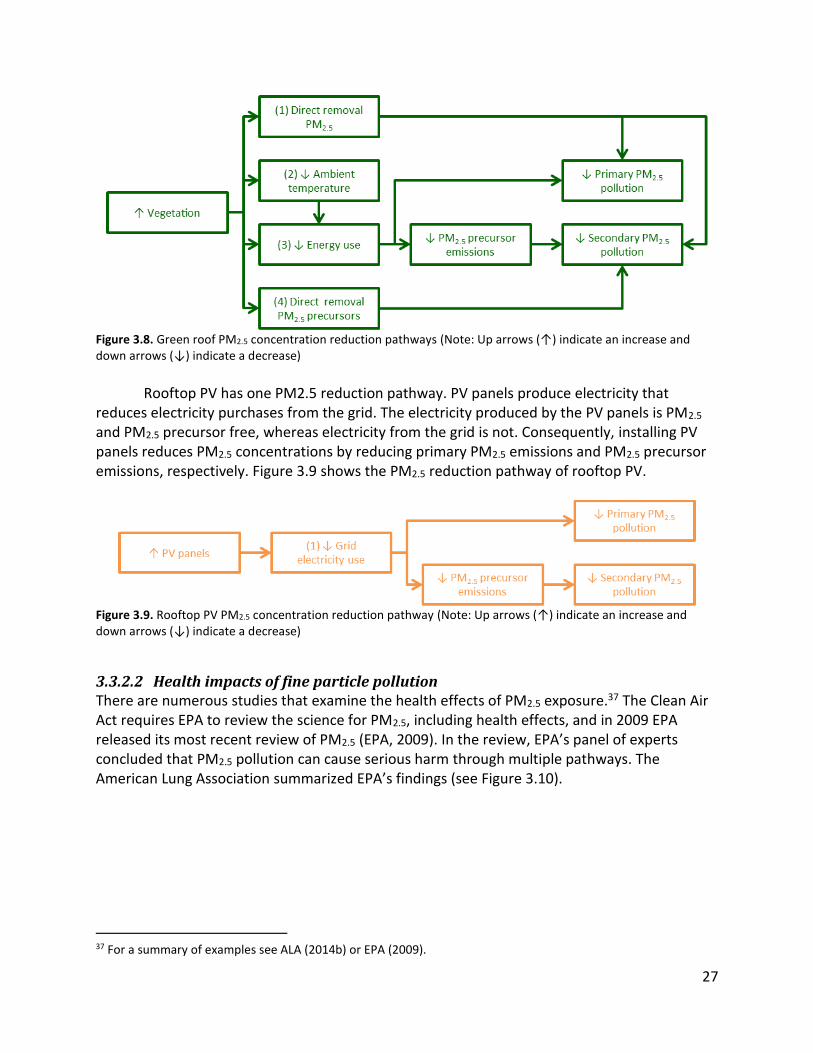
Green roofs reduce PM2.5 in two additional ways. Green roofs plants directly remove
PM2.5 from the air through dry deposition (pathway (1) in Figure 3.8). Green roof plants also directly remove PM2.5 precursors from the air through dry deposition thereby decreasing secondary PM2.5 pollution (pathway (4) in Figure 3.8). Figure 3.8 shows green roof PM2.5 concentration reduction pathways.
27
Figure 3.8. Green roof PM2.5 concentration reduction pathways (Note: Up arrows (↑) indicate an increase and down arrows (↓) indicate a decrease)
Rooftop PV has one PM2.5 reduction pathway. PV panels produce electricity that
reduces electricity purchases from the grid. The electricity produced by the PV panels is PM2.5 and PM2.5 precursor free, whereas electricity from the grid is not. Consequently, installing PV panels reduces PM2.5 concentrations by reducing primary PM2.5 emissions and PM2.5 precursor emissions, respectively. Figure 3.9 shows the PM2.5 reduction pathway of rooftop PV.
Figure 3.9. Rooftop PV PM2.5 concentration reduction pathway (Note: Up arrows (↑) indicate an increase and down arrows (↓) indicate a decrease)
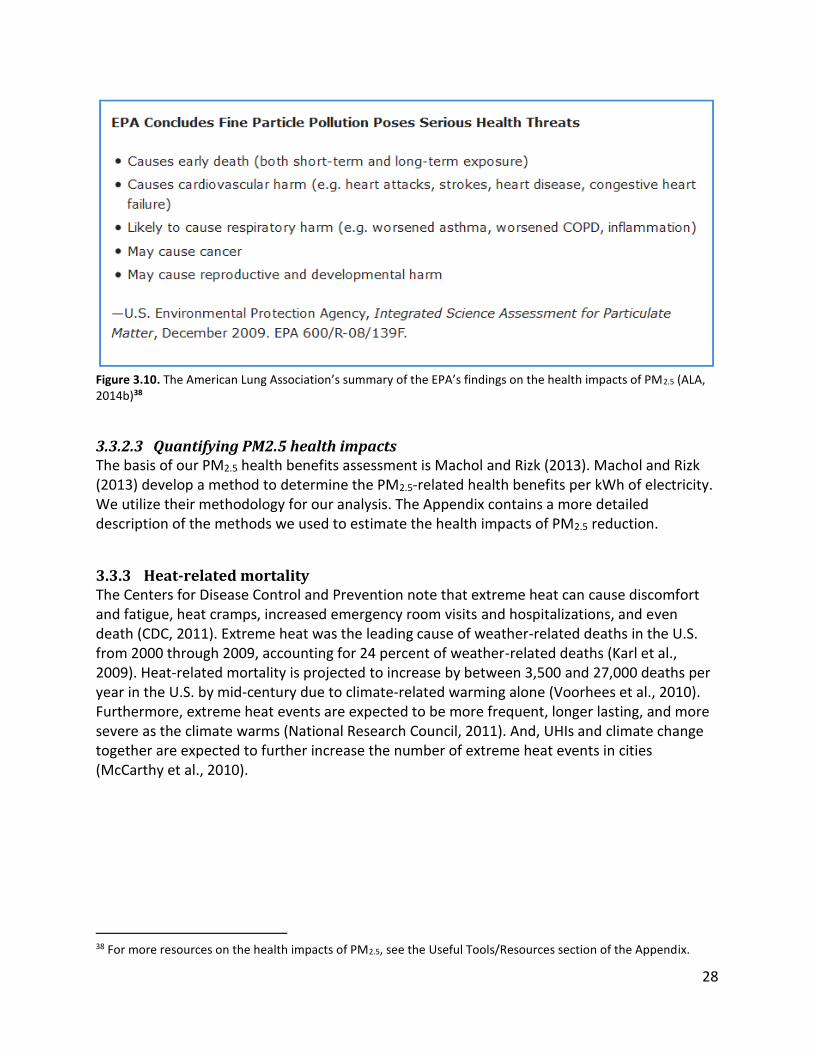
3.3.2.2 Health impacts of fine particle pollution There are numerous studies that examine the health effects of PM2.5 exposure.37 The Clean Air Act requires EPA to review the science for PM2.5, including health effects, and in 2009 EPA released its most recent review of PM2.5 (EPA, 2009). In the review, EPA’s panel of experts concluded that PM2.5 pollution can cause serious harm through multiple pathways. The American Lung Association summarized EPA’s findings (see Figure 3.10).
37 For a summary of examples see ALA (2014b) or EPA (2009).
28
Figure 3.10. The American Lung Association’s summary of the EPA’s findings on the health impacts of PM2.5 (ALA, 2014b)38
3.3.2.3 Quantifying PM2.5 health impacts The basis of our PM2.5 health benefits assessment is Machol and Rizk (2013). Machol and Rizk (2013) develop a method to determine the PM2.5-related health benefits per kWh of electricity. We utilize their methodology for our analysis. The Appendix contains a more detailed description of the methods we used to estimate the health impacts of PM2.5 reduction.
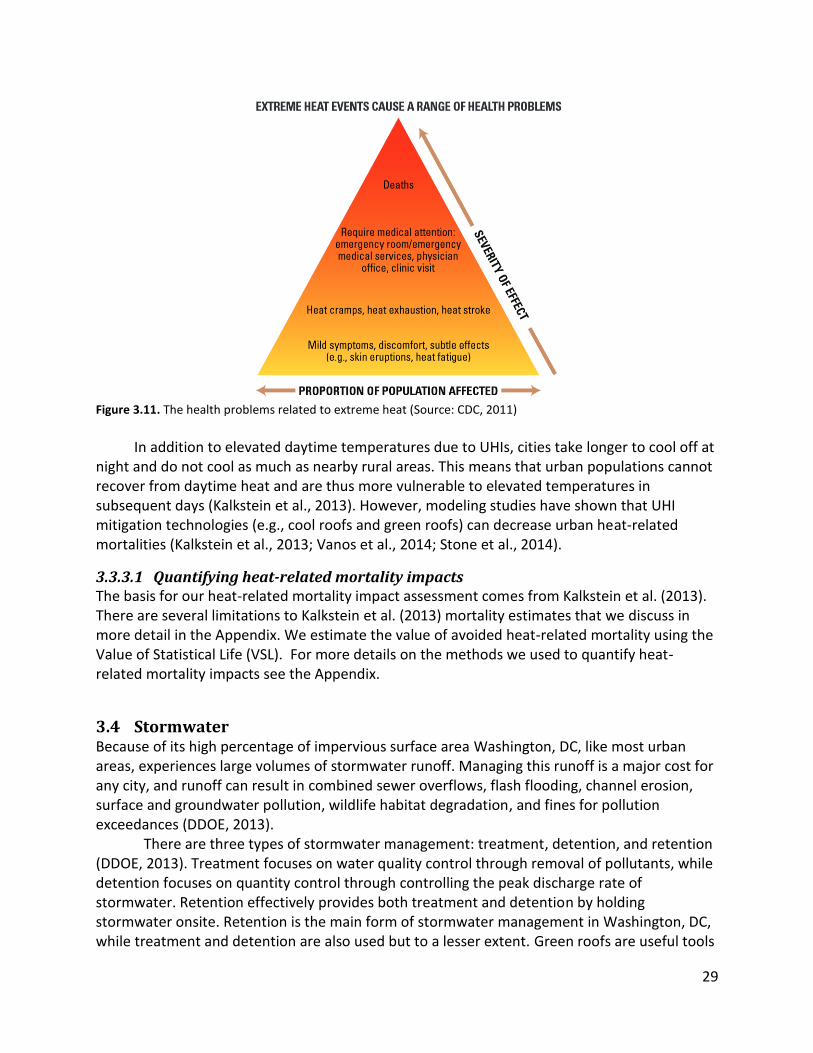
3.3.3 Heat-related mortality The Centers for Disease Control and Prevention note that extreme heat can cause discomfort and fatigue, heat cramps, increased emergency room visits and hospitalizations, and even death (CDC, 2011). Extreme heat was the leading cause of weather-related deaths in the U.S. from 2000 through 2009, accounting for 24 percent of weather-related deaths (Karl et al., 2009). Heat-related mortality is projected to increase by between 3,500 and 27,000 deaths per year in the U.S. by mid-century due to climate-related warming alone (Voorhees et al., 2010). Furthermore, extreme heat events are expected to be more frequent, longer lasting, and more severe as the climate warms (National Research Council, 2011). And, UHIs and climate change together are expected to further increase the number of extreme heat events in cities (McCarthy et al., 2010).
38 For more resources on the health impacts of PM2.5, see the Useful Tools/Resources section of the Appendix.
29
Figure 3.11. The health problems related to extreme heat (Source: CDC, 2011)
In addition to elevated daytime temperatures due to UHIs, cities take longer to cool off at
night and do not cool as much as nearby rural areas. This means that urban populations cannot recover from daytime heat and are thus more vulnerable to elevated temperatures in subsequent days (Kalkstein et al., 2013). However, modeling studies have shown that UHI mitigation technologies (e.g., cool roofs and green roofs) can decrease urban heat-related mortalities (Kalkstein et al., 2013; Vanos et al., 2014; Stone et al., 2014).
3.3.3.1 Quantifying heat-related mortality impacts The basis for our heat-related mortality impact assessment comes from Kalkstein et al. (2013). There are several limitations to Kalkstein et al. (2013) mortality estimates that we discuss in more detail in the Appendix. We estimate the value of avoided heat-related mortality using the Value of Statistical Life (VSL). For more details on the methods we used to quantify heat-related mortality impacts see the Appendix.
3.4 Stormwater Because of its high percentage of impervious surface area Washington, DC, like most urban areas, experiences large volumes of stormwater runoff. Managing this runoff is a major cost for any city, and runoff can result in combined sewer overflows, flash flooding, channel erosion, surface and groundwater pollution, wildlife habitat degradation, and fines for pollution exceedances (DDOE, 2013).
There are three types of stormwater management: treatment, detention, and retention (DDOE, 2013). Treatment focuses on water quality control through removal of pollutants, while detention focuses on quantity control through controlling the peak discharge rate of stormwater. Retention effectively provides both treatment and detention by holding stormwater onsite. Retention is the main form of stormwater management in Washington, DC, while treatment and detention are also used but to a lesser extent. Green roofs are useful tools
30
for stormwater management because they provide stormwater retention and meet water quality treatment and detention requirements. The green roof growing medium captures and stores rainfall.39 Evapotranspiration and water storage in green roofs plants also contribute to the retention capacity of green roofs. Any water that is not captured or evaporated from the roof either runs off the roof surface or infiltrates the green roof, where it can be collected or gradually discharged.
3.4.1 Important factors for green roof stormwater retention Green roof stormwater retention depends on a number of factors. The plants, growing medium, drainage layer, and roof slope all affect green roof stormwater retention. Green roofs will retain the most stormwater during the summer because this is when plants are active and evapotranspiration (which generally increases as temperature increases) is at its peak (GSA, 2011). The amount of water a green roof retains depends on the amount of rain that falls, how fast rain falls, and the length of time since the previous storm (GSA, 2011; Berndtsson, 2010). As a roof becomes more saturated, its ability to absorb rainfall decreases. Therefore, a green roof will retain less rainfall and reduce peak runoff rates to a lesser extent as (1) the amount of rainfall in a storm increases, (2) the rate of rainfall increases, and (3) the length of time between storms decreases. Larger green roofs generally reduce peak runoff rates and the time of peak runoff better per unit area than smaller green roofs (GSA, 2011).
3.4.2 Quantifying stormwater benefits Washington, DC requires property owners to pay stormwater fees. The income from stormwater fees is used to finance stormwater management in the city. Stormwater fees are calculated based on the total area of impervious surface on a property. Under 2013 legislation , if a property installs stormwater management practices (such as a green roofs), then it is eligible to receive discounts on its stormwater fee through the RiverSmart Rewards program. The discounts reflect the decreased stormwater burden on a city’s stormwater system from a property that installs stormwater management practices. We quantify stormwater benefits using the Washington, DC stormwater fee discounts.
In 2013, Washington, DC introduced stormwater regulations40 that require many new and redeveloped properties to meet stormwater retention requirements. As part of these regulations, Washington, DC has developed an approach to incentivize stormwater management based on a stormwater retention credit (SRC) trading program. The SRC trading program provides a large financial incentive for green roof installation in Washington, DC. More information on stormwater regulations, the SRC program, and how we use it to quantify stormwater benefits can be found in the Appendix.
39 German green roof guidelines suggest the growing medium generally retains 30 percent to 60 percent of rainfall when fully saturated (GSA, 2011). 40 2013 Rule on Stormwater Management and Soil Erosion and Sediment Control (http://ddoe.dc.gov/swregs)
31
3.5 Additional benefits (NOTE: These additional benefits are not quantified in this analysis, and are presented in no particular order)
3.5.1 Global cooling An additional impact of a cool roof is that it reflects more sunlight back into space compared to a conventional roof, thereby causing a negative radiative forcing on the earth and countering global warming. Studies have found that increasing the albedo of about 1,000 square feet of roof by 0.25 can offset the emissions of 0.5 tons of CO2-e per year over the typical 20 year life of a cool roof (Akbari et al., 2009; Menon et al., 2010). This benefit is material41 and should be included subsequent analyses.
3.5.2 Rooftop PV shading roof surface When PV panels are installed on a conventional, cool, or green roof, they shade the roof surface and reduce the roof surface temperature, providing modest energy savings. As discussed earlier, lower roof surface temperatures result in decreased cooling energy use during the cooling season and slightly increased heating energy use during the heating season. The magnitude of the cooling energy or heating energy impact depends on many factors, including climate and characteristics of the roof below the panels (e.g., level of insulation), but the cooling benefit generally outweighs the potential heating penalty. For example, simulations by Dominguez et al. (2011) found that PV on commercial low slope roof in San Diego, CA decrease annual cooling load on the top floor of a building by 38% and have no impact on annual heating load. On a green roof PV shading can have the added benefit of enhancing vegetation health and allowing for greater vegetation diversity (Sailor, 2010).
3.5.3 Near-surface roof conditions and HVAC On a typical day during the cooling season, near-surface roof temperatures (i.e., the temperature close to the roof surface) on a cool or green roof are lower than those on a conventional roof (EPA, 2008a). If HVAC equipment is located on a cool or green roof, this can result in cooling energy savings because lower near-surface air temperatures mean the air conditioning system has to remove less heat from the incoming air, reducing electricity consumption. However, on green roofs (and not cool roofs) this reduction may be partially offset by increased humidity near the green roof’s surface. Heating energy savings from changes in near-surface air temperature are not expected for either cool or green roofs when compared to conventional roofs because conventional roofs tend to be warmer than cool or green roofs during the heating season.
Wray and Akbari (2008) estimate that the impact of decreased air intake temperatures from installing a cool roof to be a 0.3-0.6% decrease in energy consumption of rooftop cooling units. Moseley et al. (2013) compared a green roof to a white roof on Walmart store in Chicago. They found that when only heat flux energy savings were considered on a single-story Walmart store in Chicago, a green roof resulted in approximately 1.6% energy savings compared to the
41 Sproul et al. (2014) calculate that over 50 years this benefit is $2.8 per m2 ($0.26 per ft2) for a white roof (with respect to a black roof) and $1.6 per m2 ($0.15 per ft2) for green roof (with respect to a black roof).
32
white roof. However, when air tempering (i.e., effect of air intake temperature changes) was included in energy savings calculations, the green roof saved roughly 5.3% in whole building energy use (15% cooling reduction and 11% heating reduction) compared to the white roof.42
Lower intake air temperature during the cooling season could have a significant impact on the cooling energy savings from cool or green roofs on multistory buildings. The impact of heat gain or loss through the roof is only evident on the top floor of a building. The relative impacts of air intake temperature and HVAC unit temperature on energy consumption are independent of floor number and could have a significant impact on an entire buildings’ energy consumption and, if possible, should be included in estimating the energy consumption impact of cool or green roofs (this generally has not been done in studies to date). However, given limited findings on the impact that near-surface roof temperature reductions have on HVAC use, we do not include this factor in our cost-benefit calculations. This topic deserves further research.
3.5.4 Resilience The accelerating reality of climate change has prompted federal agencies including the US military, as well as state agencies, corporations, and insurance firms to become increasingly concerned about resilience and to make resilience an objective in city and construction planning. Buildings that have cool or green roofs and that include on site solar generation are more resilient than buildings that do not. Green roofs and cool roofs make buildings more energy efficient. As the country’s largest energy consumer, the United States Department of Defense recognizes the value of energy efficiency, officially codifying it as “a force multiplier” in the 2010 Quadrennial Defense Review (DoD, 2010). Stated succinctly by Admiral Mike Mullen, Chairman of the Joint Chiefs of Staff, “Saving energy saves lives” (Mullen, 2010).
Climate change has been widely recognized as a security issue by the US military. As recognized by Former Secretary of Defense Leon Panetta, “climate change has a dramatic impact on national security” (Panetta, 2012). Expanded use of green roofs, cool roofs, and rooftop PV all contribute to slowing climate change.
When power goes out in the summer, buildings with cool roofs and green roofs gain heat slower and remain cooler and more comfortable, able to operate longer and pose less of health risk to occupants. Buildings with rooftop PV and onsite energy storage can be set up to generate their own power even when the grid is down, maintaining crucial functions such as telecommunications, cell phone recharging, lighting, security features, and refrigeration. Because the fragility of the “grid leaves DoD vulnerable to service disruptions and places continuity of critical missions at serious and growing risk,” the U.S. military has set ambitious targets to reduce energy use and deploy renewable energy sources (Robyn, 2012; DoD, 2011).
42 Note that the results of Moseley et al. (2013) are based on the analysis of a single story building with an approximately 1-to-1 floor area to roof area ratio so it is difficult to draw general conclusions for all buildings sizes. Thought experiment: HVAC equipment draws in large volumes of air. Walmart HVAC system and HVAC system of 5 story building with same floor area as Walmart store will draw in approximately same amount of outside air to maintain comfortable building environment. The Walmart HVAC system will draw in more air that has been tempered by roof than the HVAC system of the five story building with same floor because the roof of the 5 story building is 5 times smaller than the Walmart roof. As a result, air temp on cool/green roof will have less impact on cooling/heating consumption of 5 story building.
33
Buildings with cool roofs or green roofs and rooftop PV with storage combine these attributes and provide a very substantial improvement in resilience compared with conventional buildings. We are not able to quantify the value of resilience but it appears to be significant, perhaps on the order of several dollars per ft2. We hope to quantify this benefit in subsequent analyses.
3.5.5 Increased PV efficiency Cool roofs and green roofs may also enhance PV performance. PV efficiency degrades slightly with higher panel temperature, so lower near-roof air temperatures on cool and green roofs can measurably increase PV efficiency.43 For example, a recent study from Carnegie Mellon University found that when temperatures were approximately at or above 77 °F to PV panel efficiency for panels over green roofs increased slightly (0.8-1.5%) compared to PV panels over black roofs (Nagengast, 2013). Overall, Nagengast (2013) concluded that the potential economic benefit of the temperature and power output interaction is minor. There is currently not convincing data on the impact of cool roofs on PV power output. We do not include this benefit in our analysis because we do not analyze rooftop PV on cool or green roofs in this analysis. We hope to include combination technologies in future analyses.
3.5.6 Others Other benefits that we have not included in this analysis include:
Employment
Rooftop agriculture
Amenity value
Aesthetic benefit
Reduced landfill usage by extending roof life
The Baltimore effect (downwind UHI impact) We recommend these benefits be quantified.
3.6 Costs
3.6.1 Installation, maintenance, and replacement
3.6.1.1 Conventional and cool roofs We assume that cool roofs have the same lifetime as conventional roofs (20 years). This assumption is consistent with assumed values in the literature (Sproul et al. 2014). However, it is reasonable to assume that cool roofs could last longer than conventional roofs before they need to be replaced (Gaffin et al., 2012; Sproul et al., 2014). Roof membrane life is limited by three natural forces: thawing/freezing, UV radiation, and daily thermal expansion/contraction. A cool roof will experience less thermal expansion/contraction and can reflect more UV
43 All else equal, higher PV efficiency means greater electricity generation.
34
radiation than a conventional roof, indicating that cool roofs have the potential to last longer than conventional roofs (Gaffin et al., 2012; Sproul et al., 2014). Cool roof installation and maintenance costs are based on current literature and on guidance from roofing professionals (Bluefin LLC, 2014; Sproul et al., 2014; DOE, 2012). Roof replacement, rather than restoration, is the norm when roof repairs are necessary (e.g., when there is a leak) (Bluefin LLC, 2014). There may not be a difference between the replacement cost of a conventional, low-slope roof and that of a cool, low-slope roof (Bluefin LLC, 2014; Sproul et al., 2014). However, because we assume the new low slope cool roofs installed have an above average albedo, we assume there will be a price premium compared to conventional roofs. For the lower bound, we assume the cool roof cost premium is $0.50 per square foot. We assume the low slope cool roof cost premium for the middle and upper bound estimates are $0.25 and $0.00 per square foot, respectively.44 There is typically a cost premium for steep slope cool roofs compared to conventional roofs. We assume the steep slope cool roof cost premium for the lower bound, middle, and upper bound estimates are $1.00, $0.75, and $0.50 per square foot respectively.
At the end of a conventional or cool roof’s life, the roof can be replaced or restored (e.g., patched, repaired). The choice between replacement and restoration depends on a number of factors including the condition of the insulation and the condition of the existing roof.45 Unfortunately, there is no good rule of thumb to decide whether a roof should be replaced or restored. A common practice is to replace a roof at the end of its life, so we assume that after 20 years each cool roof is replaced with a new cool roof. For all cost-benefit estimates, we assume the same cool roof cost premiums as stressed above.
The maintenance requirements of cool roofs are similar to those of conventional roofs with one exception. Conventional roofs do not need to be washed to maintain albedo but cool roofs should occasionally be washed to maintain albedo. There are currently two cleaning options for cool roofs: power washing and mop cleaning (or equivalent). We do not include power washing in our analysis because it has been shown to not be cost-effective relative to leaving the roof in less reflective condition, or compared to other cleaning methods (Sproul et al. 2014; Bluefin LLC, 2014).46 Instead we assume mop cleaning or equivalent every two years at $0.02 per square foot per wash (Bluefin LLC, 2014). For simplicity, we assume the cost of washing is amortized annually so that the maintenance premium of a cool roof over a conventional roof is $0.01 per square foot per year. Summaries of the maintenance and replacement premiums are summarized in Table 3.1 and Table 3.2.
44 As a reminder, the lower bound estimates assume the highest costs and the lowest benefits, while the upper bound estimates assume the lowest costs and the highest benefits. 45 For example, the manufacturer or installer of a new roof may not grant a warranty to the new roof if the existing roof is not in good enough shape. 46 In a 2014 cost-benefit analysis of cool, green, and black roofs, Sproul et al. (2014) determine that power washing is not cost-effective compared to leaving cool roofs in a less reflective state. The roofing firm Bluefin LLC, notes that power washing is expensive and can damage the roof membrane, which can increase other maintenance costs or decrease membrane life. As an alternative, Bluefin LLC recommends mop cleaning with a mild, environmentally-friendly cleaning product.
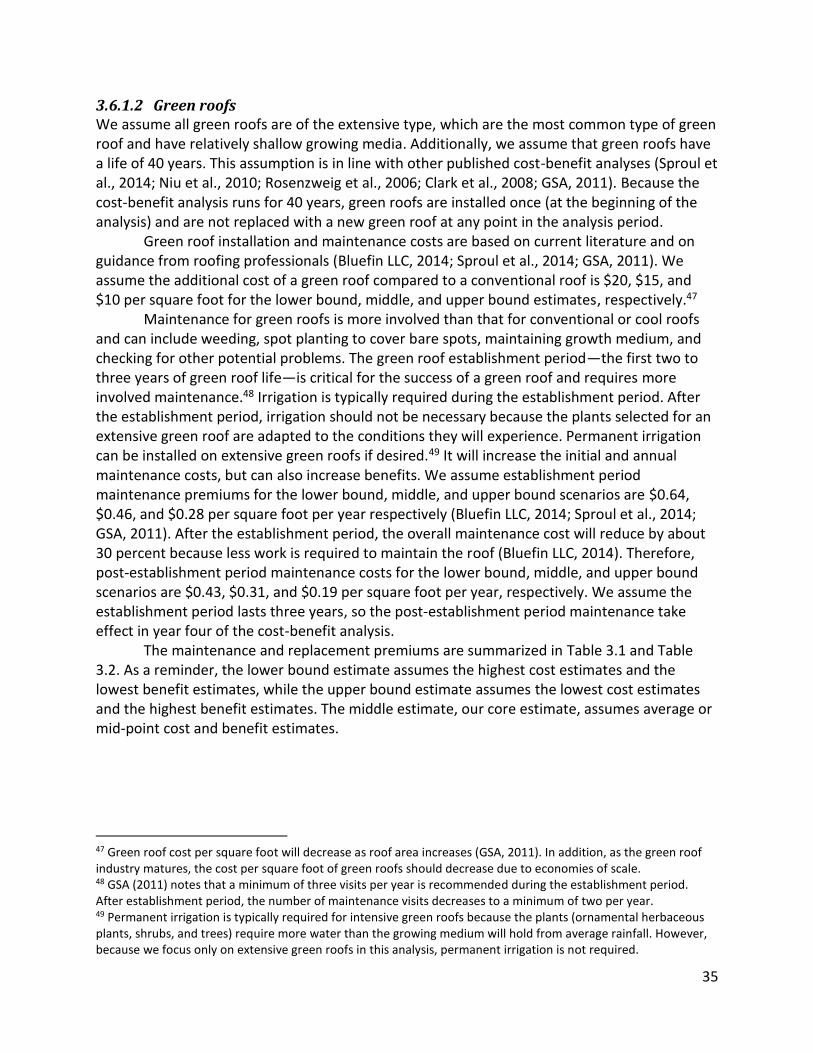
35
3.6.1.2 Green roofs We assume all green roofs are of the extensive type, which are the most common type of green roof and have relatively shallow growing media. Additionally, we assume that green roofs have a life of 40 years. This assumption is in line with other published cost-benefit analyses (Sproul et al., 2014; Niu et al., 2010; Rosenzweig et al., 2006; Clark et al., 2008; GSA, 2011). Because the cost-benefit analysis runs for 40 years, green roofs are installed once (at the beginning of the analysis) and are not replaced with a new green roof at any point in the analysis period. Green roof installation and maintenance costs are based on current literature and on guidance from roofing professionals (Bluefin LLC, 2014; Sproul et al., 2014; GSA, 2011). We assume the additional cost of a green roof compared to a conventional roof is $20, $15, and $10 per square foot for the lower bound, middle, and upper bound estimates, respectively.47
Maintenance for green roofs is more involved than that for conventional or cool roofs and can include weeding, spot planting to cover bare spots, maintaining growth medium, and checking for other potential problems. The green roof establishment period—the first two to three years of green roof life—is critical for the success of a green roof and requires more involved maintenance.48 Irrigation is typically required during the establishment period. After the establishment period, irrigation should not be necessary because the plants selected for an extensive green roof are adapted to the conditions they will experience. Permanent irrigation can be installed on extensive green roofs if desired.49 It will increase the initial and annual maintenance costs, but can also increase benefits. We assume establishment period maintenance premiums for the lower bound, middle, and upper bound scenarios are $0.64, $0.46, and $0.28 per square foot per year respectively (Bluefin LLC, 2014; Sproul et al., 2014; GSA, 2011). After the establishment period, the overall maintenance cost will reduce by about 30 percent because less work is required to maintain the roof (Bluefin LLC, 2014). Therefore, post-establishment period maintenance costs for the lower bound, middle, and upper bound scenarios are $0.43, $0.31, and $0.19 per square foot per year, respectively. We assume the establishment period lasts three years, so the post-establishment period maintenance take effect in year four of the cost-benefit analysis.
The maintenance and replacement premiums are summarized in Table 3.1 and Table 3.2. As a reminder, the lower bound estimate assumes the highest cost estimates and the lowest benefit estimates, while the upper bound estimate assumes the lowest cost estimates and the highest benefit estimates. The middle estimate, our core estimate, assumes average or mid-point cost and benefit estimates.
47 Green roof cost per square foot will decrease as roof area increases (GSA, 2011). In addition, as the green roof industry matures, the cost per square foot of green roofs should decrease due to economies of scale. 48 GSA (2011) notes that a minimum of three visits per year is recommended during the establishment period. After establishment period, the number of maintenance visits decreases to a minimum of two per year. 49 Permanent irrigation is typically required for intensive green roofs because the plants (ornamental herbaceous plants, shrubs, and trees) require more water than the growing medium will hold from average rainfall. However, because we focus only on extensive green roofs in this analysis, permanent irrigation is not required.
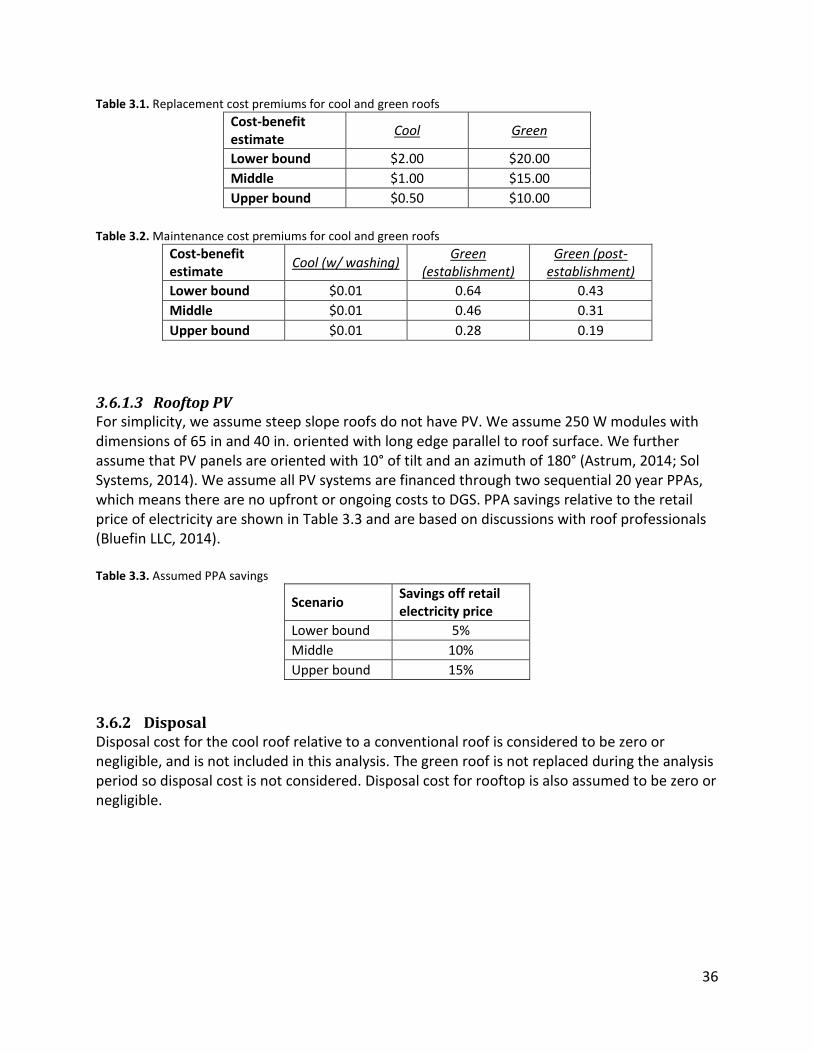
36
Table 3.1. Replacement cost premiums for cool and green roofs
Cost-benefit estimate
Cool Green
Lower bound $2.00 $20.00
Middle $1.00 $15.00
Upper bound $0.50 $10.00
Table 3.2. Maintenance cost premiums for cool and green roofs
Cost-benefit estimate
Cool (w/ washing) Green
(establishment) Green (post-
establishment)
Lower bound $0.01 0.64 0.43
Middle $0.01 0.46 0.31
Upper bound $0.01 0.28 0.19
3.6.1.3 Rooftop PV For simplicity, we assume steep slope roofs do not have PV. We assume 250 W modules with dimensions of 65 in and 40 in. oriented with long edge parallel to roof surface. We further assume that PV panels are oriented with 10° of tilt and an azimuth of 180° (Astrum, 2014; Sol Systems, 2014). We assume all PV systems are financed through two sequential 20 year PPAs, which means there are no upfront or ongoing costs to DGS. PPA savings relative to the retail price of electricity are shown in Table 3.3 and are based on discussions with roof professionals (Bluefin LLC, 2014). Table 3.3. Assumed PPA savings
Scenario Savings off retail electricity price
Lower bound 5%
Middle 10%
Upper bound 15%
3.6.2 Disposal Disposal cost for the cool roof relative to a conventional roof is considered to be zero or negligible, and is not included in this analysis. The green roof is not replaced during the analysis period so disposal cost is not considered. Disposal cost for rooftop is also assumed to be zero or negligible.
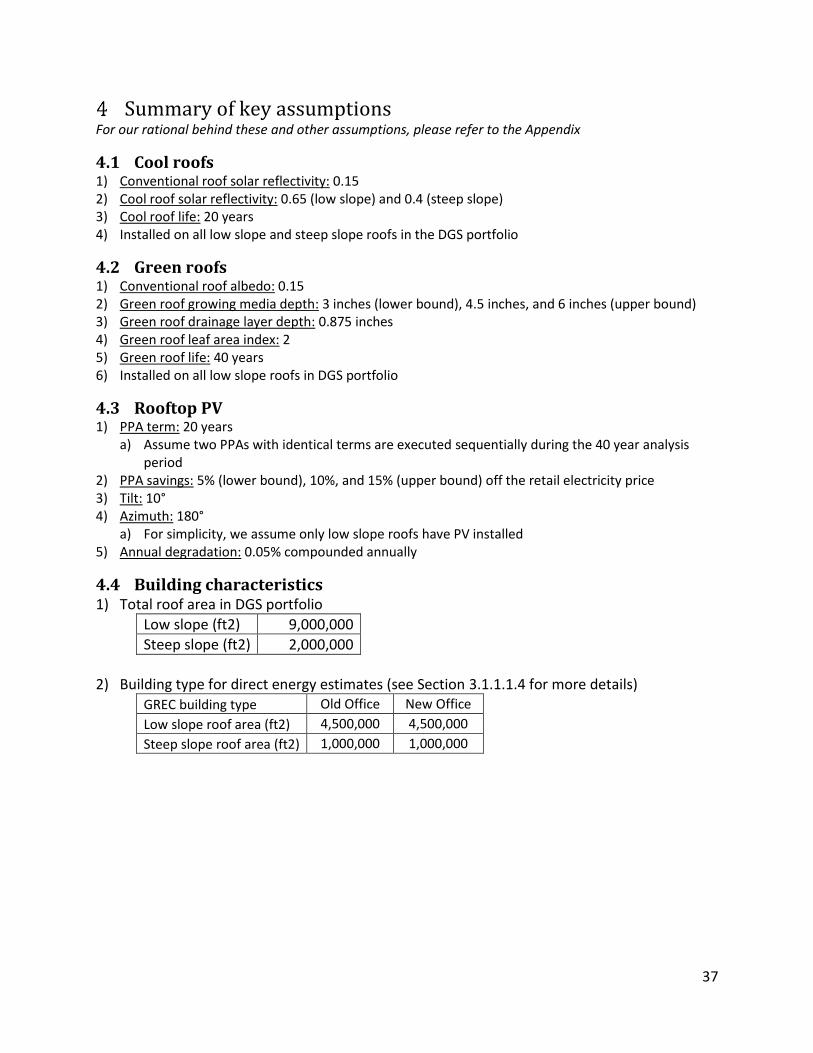
37
Summary of key assumptions For our rational behind these and other assumptions, please refer to the Appendix
4.1 Cool roofs 1) Conventional roof solar reflectivity: 0.15 2) Cool roof solar reflectivity: 0.65 (low slope) and 0.4 (steep slope) 3) Cool roof life: 20 years 4) Installed on all low slope and steep slope roofs in the DGS portfolio
4.2 Green roofs 1) Conventional roof albedo: 0.15 2) Green roof growing media depth: 3 inches (lower bound), 4.5 inches, and 6 inches (upper bound) 3) Green roof drainage layer depth: 0.875 inches 4) Green roof leaf area index: 2 5) Green roof life: 40 years 6) Installed on all low slope roofs in DGS portfolio
4.3 Rooftop PV 1) PPA term: 20 years
a) Assume two PPAs with identical terms are executed sequentially during the 40 year analysis period
2) PPA savings: 5% (lower bound), 10%, and 15% (upper bound) off the retail electricity price 3) Tilt: 10° 4) Azimuth: 180°
a) For simplicity, we assume only low slope roofs have PV installed 5) Annual degradation: 0.05% compounded annually
4.4 Building characteristics 1) Total roof area in DGS portfolio
Low slope (ft2) 9,000,000
Steep slope (ft2) 2,000,000
2) Building type for direct energy estimates (see Section 3.1.1.1.4 for more details)
GREC building type Old Office New Office
Low slope roof area (ft2) 4,500,000 4,500,000
Steep slope roof area (ft2) 1,000,000 1,000,000
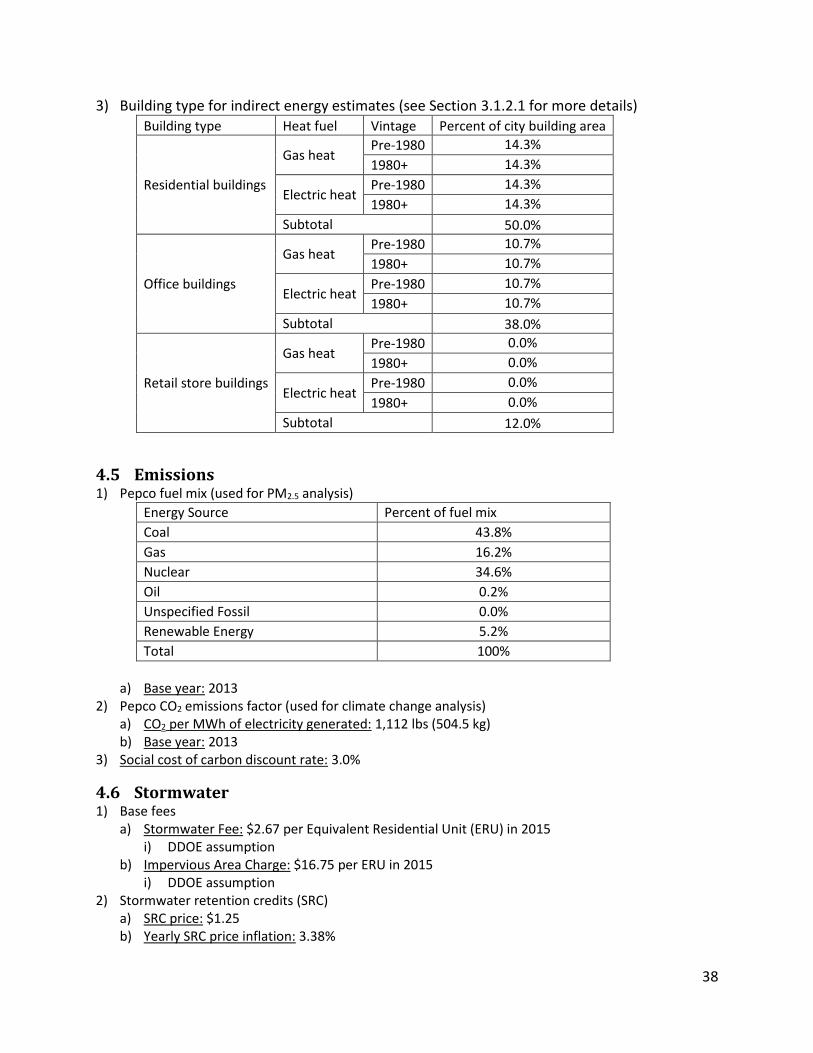
38
3) Building type for indirect energy estimates (see Section 3.1.2.1 for more details)
Building type Heat fuel Vintage Percent of city building area
Residential buildings
Gas heat Pre-1980 14.3%
1980+ 14.3%
Electric heat Pre-1980 14.3%
1980+ 14.3%
Subtotal 50.0%
Office buildings
Gas heat Pre-1980 10.7%
1980+ 10.7%
Electric heat Pre-1980 10.7%
1980+ 10.7%
Subtotal 38.0%
Retail store buildings
Gas heat Pre-1980 0.0%
1980+ 0.0%
Electric heat Pre-1980 0.0%
1980+ 0.0%
Subtotal 12.0%
4.5 Emissions 1) Pepco fuel mix (used for PM2.5 analysis)
Energy Source Percent of fuel mix
Coal 43.8%
Gas 16.2%
Nuclear 34.6%
Oil 0.2%
Unspecified Fossil 0.0%
Renewable Energy 5.2%
Total 100%
a) Base year: 2013
2) Pepco CO2 emissions factor (used for climate change analysis) a) CO2 per MWh of electricity generated: 1,112 lbs (504.5 kg) b) Base year: 2013
3) Social cost of carbon discount rate: 3.0%
4.6 Stormwater 1) Base fees
a) Stormwater Fee: $2.67 per Equivalent Residential Unit (ERU) in 2015 i) DDOE assumption
b) Impervious Area Charge: $16.75 per ERU in 2015 i) DDOE assumption
2) Stormwater retention credits (SRC) a) SRC price: $1.25 b) Yearly SRC price inflation: 3.38%
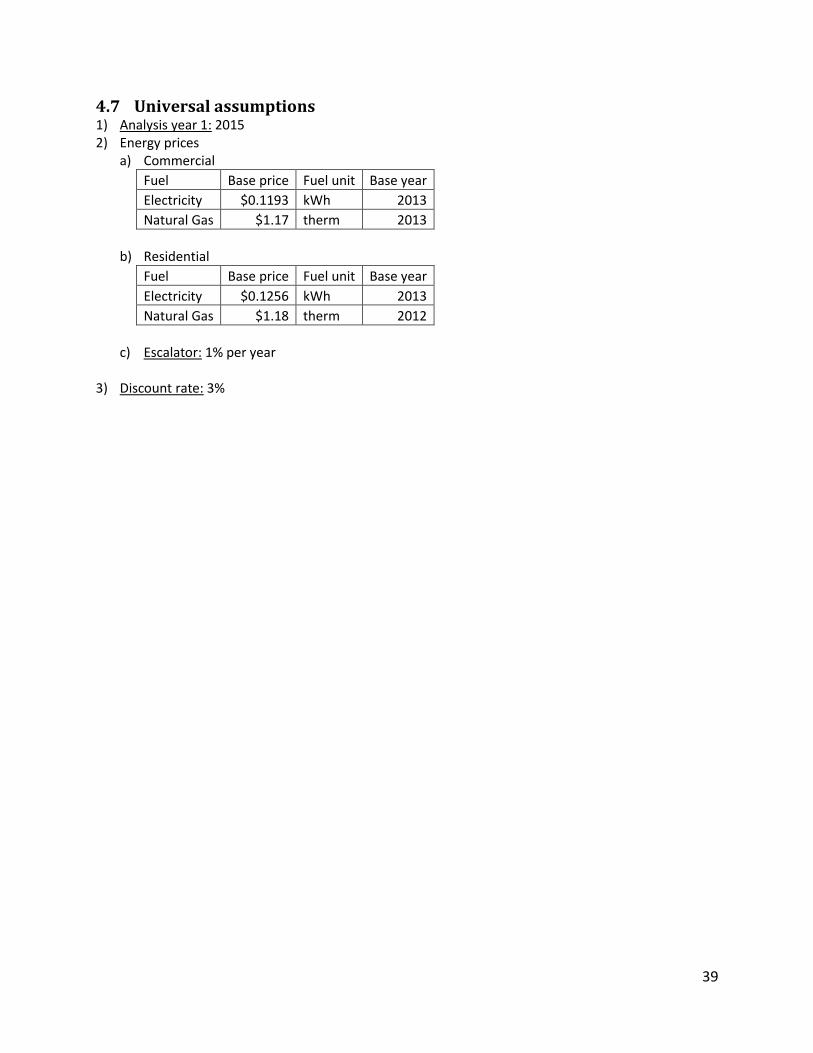
39
4.7 Universal assumptions 1) Analysis year 1: 2015 2) Energy prices
a) Commercial
Fuel Base price Fuel unit Base year
Electricity $0.1193 kWh 2013
Natural Gas $1.17 therm 2013
b) Residential
Fuel Base price Fuel unit Base year
Electricity $0.1256 kWh 2013
Natural Gas $1.18 therm 2012
c) Escalator: 1% per year
3) Discount rate: 3%
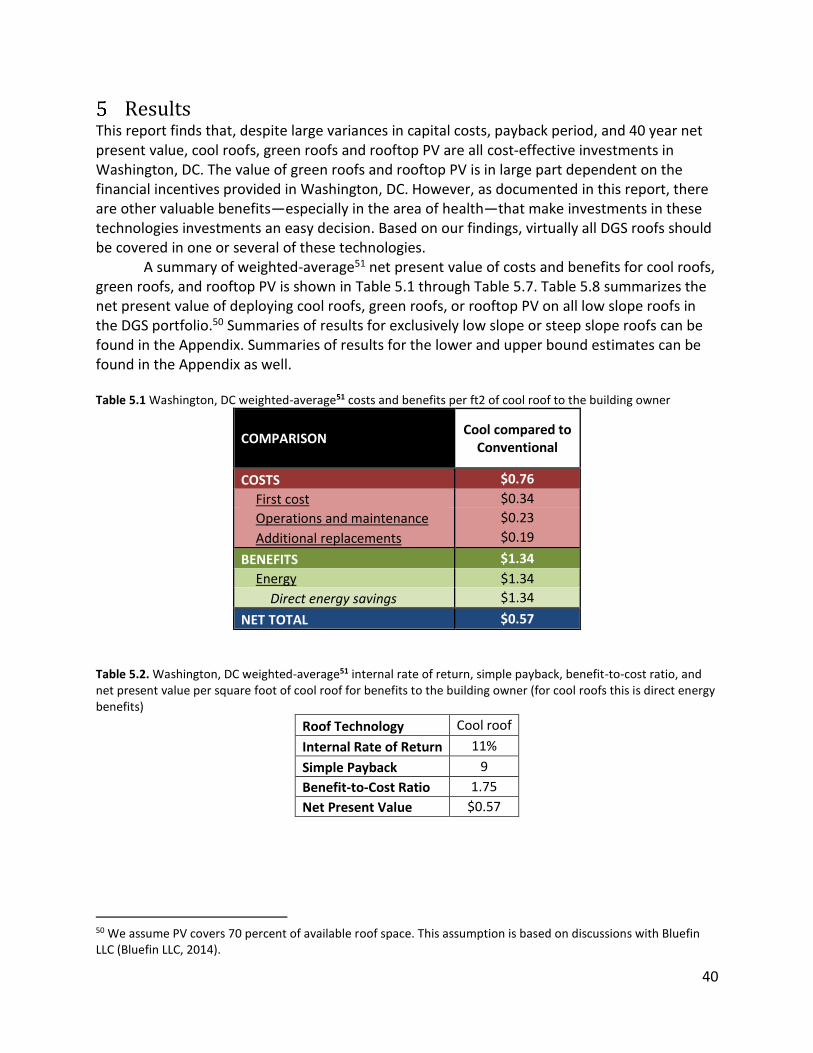
40
Results This report finds that, despite large variances in capital costs, payback period, and 40 year net present value, cool roofs, green roofs and rooftop PV are all cost-effective investments in Washington, DC. The value of green roofs and rooftop PV is in large part dependent on the financial incentives provided in Washington, DC. However, as documented in this report, there are other valuable benefits—especially in the area of health—that make investments in these technologies investments an easy decision. Based on our findings, virtually all DGS roofs should be covered in one or several of these technologies.
A summary of weighted-average51 net present value of costs and benefits for cool roofs, green roofs, and rooftop PV is shown in Table 5.1 through Table 5.7. Table 5.8 summarizes the net present value of deploying cool roofs, green roofs, or rooftop PV on all low slope roofs in the DGS portfolio.50 Summaries of results for exclusively low slope or steep slope roofs can be found in the Appendix. Summaries of results for the lower and upper bound estimates can be found in the Appendix as well. Table 5.1 Washington, DC weighted-average51 costs and benefits per ft2 of cool roof to the building owner
COMPARISON Cool compared to
Conventional
COSTS $0.76
First cost $0.34
Operations and maintenance $0.23
Additional replacements $0.19
BENEFITS $1.34
Energy $1.34
Direct energy savings $1.34
NET TOTAL $0.57
Table 5.2. Washington, DC weighted-average51 internal rate of return, simple payback, benefit-to-cost ratio, and net present value per square foot of cool roof for benefits to the building owner (for cool roofs this is direct energy benefits)
Roof Technology Cool roof
Internal Rate of Return 11%
Simple Payback 9
Benefit-to-Cost Ratio 1.75
Net Present Value $0.57
50 We assume PV covers 70 percent of available roof space. This assumption is based on discussions with Bluefin LLC (Bluefin LLC, 2014).
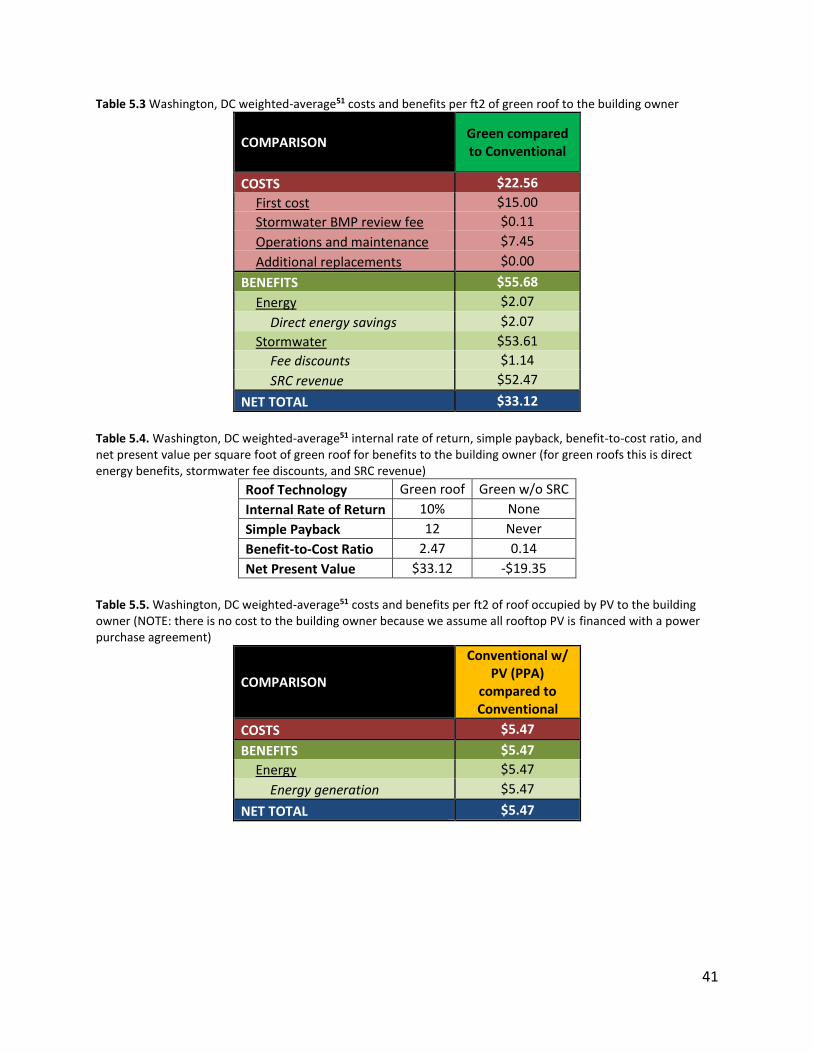
41
Table 5.3 Washington, DC weighted-average51 costs and benefits per ft2 of green roof to the building owner
COMPARISON Green compared to Conventional
COSTS $22.56
First cost $15.00
Stormwater BMP review fee $0.11
Operations and maintenance $7.45
Additional replacements $0.00
BENEFITS $55.68
Energy $2.07
Direct energy savings $2.07
Stormwater $53.61
Fee discounts $1.14
SRC revenue $52.47
NET TOTAL $33.12
Table 5.4. Washington, DC weighted-average51 internal rate of return, simple payback, benefit-to-cost ratio, and net present value per square foot of green roof for benefits to the building owner (for green roofs this is direct energy benefits, stormwater fee discounts, and SRC revenue)
Roof Technology Green roof Green w/o SRC
Internal Rate of Return 10% None
Simple Payback 12 Never
Benefit-to-Cost Ratio 2.47 0.14
Net Present Value $33.12 -$19.35
Table 5.5. Washington, DC weighted-average51 costs and benefits per ft2 of roof occupied by PV to the building owner (NOTE: there is no cost to the building owner because we assume all rooftop PV is financed with a power purchase agreement)
COMPARISON
Conventional w/ PV (PPA)
compared to Conventional
COSTS $5.47
BENEFITS $5.47
Energy $5.47
Energy generation $5.47
NET TOTAL $5.47
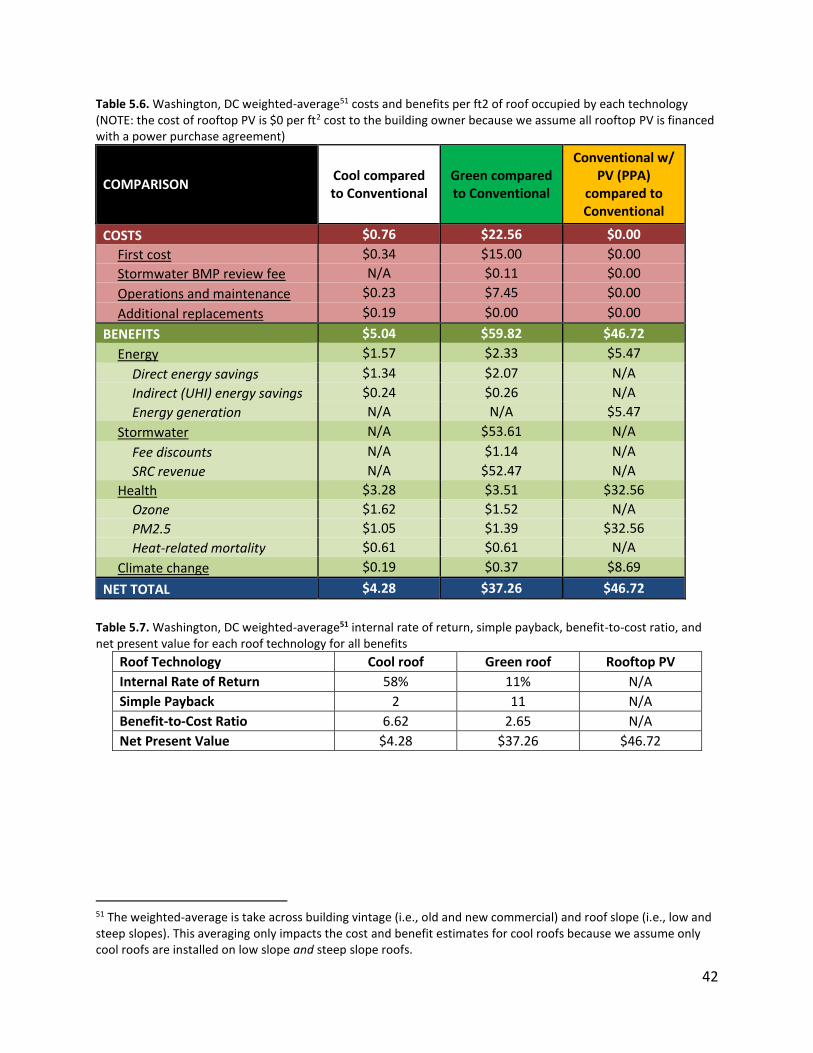
42
Table 5.6. Washington, DC weighted-average51 costs and benefits per ft2 of roof occupied by each technology (NOTE: the cost of rooftop PV is $0 per ft2 cost to the building owner because we assume all rooftop PV is financed with a power purchase agreement)
COMPARISON Cool compared to Conventional
Green compared to Conventional
Conventional w/ PV (PPA)
compared to Conventional
COSTS $0.76 $22.56 $0.00
First cost $0.34 $15.00 $0.00
Stormwater BMP review fee N/A $0.11 $0.00
Operations and maintenance $0.23 $7.45 $0.00
Additional replacements $0.19 $0.00 $0.00
BENEFITS $5.04 $59.82 $46.72
Energy $1.57 $2.33 $5.47
Direct energy savings $1.34 $2.07 N/A
Indirect (UHI) energy savings $0.24 $0.26 N/A
Energy generation N/A N/A $5.47
Stormwater N/A $53.61 N/A
Fee discounts N/A $1.14 N/A
SRC revenue N/A $52.47 N/A
Health $3.28 $3.51 $32.56
Ozone $1.62 $1.52 N/A
PM2.5 $1.05 $1.39 $32.56
Heat-related mortality $0.61 $0.61 N/A
Climate change $0.19 $0.37 $8.69
NET TOTAL $4.28 $37.26 $46.72
Table 5.7. Washington, DC weighted-average51 internal rate of return, simple payback, benefit-to-cost ratio, and net present value for each roof technology for all benefits
Roof Technology Cool roof Green roof Rooftop PV
Internal Rate of Return 58% 11% N/A
Simple Payback 2 11 N/A
Benefit-to-Cost Ratio 6.62 2.65 N/A
Net Present Value $4.28 $37.26 $46.72
51 The weighted-average is take across building vintage (i.e., old and new commercial) and roof slope (i.e., low and steep slopes). This averaging only impacts the cost and benefit estimates for cool roofs because we assume only cool roofs are installed on low slope and steep slope roofs.

43
Table 5.8. Present value summary of costs and benefits for the three technologies on all low slope DGS roofs (Notes: all PV is financed with a PPA so there are no upfront or ongoing costs to DGS; results may not sum due to rounding)
COMPARISON Cool compared to
Conventional Green compared to
Conventional
Conventional w/ PV (PPA) compared to
Conventional
COSTS $5,580,000 $203,000,000 $0
BENEFITS $52,100,000 $538,000,000 $294,000,000
Energy $17,100,000 $21,100,000 $34,500,000
Stormwater N/A $482,000,000 N/A
Health $32,900,000 $31,600,000 $205,000,000
Climate change $2,110,000 $3,310,000 $54,700,000
NET TOTAL $46,500,000 $335,000,000 $294,000,000
44
Conclusions This report provides the first rigorous and (relatively) comprehensive model to estimate the full costs and benefits of cool roofs, green roofs, and rooftop PV. It has involved a range of leading health and policy advisors and the development of a multi-level health and benefits valuation model to quantify the full set of costs and benefits of these technologies. The establishment of this model provides a new powerful platform to address and understand larger city design opportunities. This reports findings strongly indicate that a city-wide strategy of adoption of these technologies would have private and public benefits (potentially on the order of billions of dollars), including providing energy savings for building owners, reducing city peak summer temperatures, improving livability, and providing a large public health benefit.
An expanded analysis is recommended to extend from District owned buildings to all public and private buildings in Washington, DC and incorporate residential as well as commercial buildings. An expanded study could address additional benefits including quantifying benefits of resilience and increased employment. As temperature extremes continue to rise, Washington, DC will be faced with increasingly severe heat and weather events and increased pressure to make building and systems resilient. The value of resilience from deployment of these three technologies can and should be quantified. Similarly, installing these technologies is labor intensive and can provide substantial employment for Washington, DC residents, especially if coupled with training. The financial benefits of increased employment should be quantified. (Other areas of analysis and model refinement are identified in the report as recommended areas of additional work.)
The potential for reductions in peak temperature and ozone and other health related costs indicates that a city-wide policy of extending cooling strategies (e.g., cool pavements, street trees) to other built areas, including roads, pavement and sidewalks, could yield large financial and health benefits at relatively low cost. Building on this analysis of District owned buildings to provide a city-wide analysis with a broader scope as discussed above would likely demonstrate large, low net cost opportunities to deliver large improvements in city public health, livability, and environmental footprint while cutting energy costs.
45
References Akbari, H., Konopacki, S., 2005. Calculating energy-saving potentials of heat-island reduction
strategies. Energy Policy 33, 721–756. doi:10.1016/j.enpol.2003.10.001 Akbari, H., Menon, S., Rosenfeld, A., 2009. Global cooling: increasing world-wide urban albedos
to offset CO2. Climatic Change 94, 275–286. doi:10.1007/s10584-008-9515-9 American Lung Association (ALA), 2014a. Ozone Pollution. State of the Air 2014. URL
http://www.stateoftheair.org/2014/health-risks/health-risks-ozone.html (accessed 10.8.14).
American Lung Association (ALA), 2014b. Particle Pollution. State of the Air 2014. URL http://www.stateoftheair.org/2014/health-risks/health-risks-particle.html (accessed 10.8.14).
Astrum Solar, 2014. Personal communication. Bell, M.L., Goldberg, R., Hogrefe, C., Kinney, P.L., Knowlton, K., Lynn, B., Rosenthal, J.,
Rosenzweig, C., Patz, J.A., 2007. Climate change, ambient ozone, and health in 50 US cities. Climatic Change 82, 61–76. doi:10.1007/s10584-006-9166-7
Bloomer, B.J., Stehr, J.W., Piety, C.A., Salawitch, R.J., Dickerson, R.R., 2009. Observed relationships of ozone air pollution with temperature and emissions. Geophysical Research Letters 36. doi:10.1029/2009GL037308
Bluefin LLC, 2014. Personal communication. Camalier, L., Cox, W., Dolwick, P., 2007. The effects of meteorology on ozone in urban areas and
their use in assessing ozone trends. Atmospheric Environment 41, 7127–7137. doi:10.1016/j.atmosenv.2007.04.061
Centers for Disease Control, 2011. Climate Change and Extreme Heat Events. Chang, H.H., Zhou, J., Fuentes, M., 2010. Impact of Climate Change on Ambient Ozone Level and
Mortality in Southeastern United States. International Journal of Environmental Research and Public Health 7, 2866–2880. doi:10.3390/ijerph7072866
Clark, C., Adriaens, P., Talbot, F.B., 2008. Green Roof Valuation: A Probabilistic Economic Analysis of Environmental Benefits. Environmental Science & Technology 42, 2155–2161. doi:10.1021/es0706652
Cook, J., Nuccitelli, D., Green, S.A., Richardson, M., Winkler, B., Painting, R., Way, R., Jacobs, P., Skuce, A., 2013. Quantifying the consensus on anthropogenic global warming in the scientific literature. Environmental Research Letters 8, 024024. doi:10.1088/1748-9326/8/2/024024
Database of State Incentives for Renewables & Efficiency (DSIRE), 2014. Renewable Portfolio Standard Policies.
District Department of the Environment (DDOE), 2013. Stormwater Retention Credit Trading and In-Lieu Fee Analyses.
District Department of the Environment (DDOE), 2014. Green Roofs in the District of Columbia. District Department of the Environment. URL http://green.dc.gov/greenroofs (accessed 12.4.14).
Dominguez, A., Kleissl, J., Luvall, J.C., 2011. Effects of solar photovoltaic panels on roof heat transfer. Solar Energy 85, 2244–2255. doi:10.1016/j.solener.2011.06.010
46
Ebi, K.L., McGregor, G., 2008. Climate Change, Tropospheric Ozone and Particulate Matter, and Health Impacts. Environmental Health Perspectives 116, 1449–1455. doi:10.1289/ehp.11463
Gaffin, S.R., Imhoff, M., Rosenzweig, C., Khanbilvardi, R., Pasqualini, A., Kong, A.Y.Y., Grillo, D., Freed, A., Hillel, D., Hartung, E., 2012. Bright is the new black—multi-year performance of high-albedo roofs in an urban climate. Environmental Research Letters 7, 014029. doi:10.1088/1748-9326/7/1/014029
Hanson, R.L., 1991. Evapotranspiration and Droughts, in: National Water Summary 1988-89--Hydrologic Events and Floods and Droughts, U.S. Geological Survey Water-Supply Paper 2375. U.S. Government Printing Office, Washington, D.C, pp. 99–104.
Holloway, T., Spak, S.N., Barker, D., Bretl, M., Moberg, C., Hayhoe, K., Van Dorn, J., Wuebbles, D., 2008. Change in ozone air pollution over Chicago associated with global climate change. Journal of Geophysical Research 113. doi:10.1029/2007JD009775
Kalkstein, L.S., Sailor, D., Shickman, K., Sheridan, S., Vanos, J., 2013. Assessing the Health Impacts of Urban Heat Island Reduction Strategies in the District of Columbia.
Karl, T.R., Melillo, J.M., Peterson, T.C. (Eds.), 2009. Global Climate Change Impacts in the United States. Cambridge University Press, New York.
Lam, Y.F., Fu, J.S., Wu, S., Mickley, L.J., 2011. Impacts of future climate change and effects of biogenic emissions on surface ozone and particulate matter concentrations in the United States. Atmospheric Chemistry and Physics 11, 4789–4806. doi:10.5194/acp-11-4789-2011
Levinson, R., Akbari, H., 2010. Potential benefits of cool roofs on commercial buildings: conserving energy, saving money, and reducing emission of greenhouse gases and air pollutants. Energy Efficiency 3, 53–109. doi:10.1007/s12053-008-9038-2
Li, D., Bou-Zeid, E., Oppenheimer, M., 2014. The effectiveness of cool and green roofs as urban heat island mitigation strategies. Environmental Research Letters 9, 055002. doi:10.1088/1748-9326/9/5/055002
Machol, B., Rizk, S., 2013. Economic value of U.S. fossil fuel electricity health impacts. Environment International 52, 75–80. doi:10.1016/j.envint.2012.03.003
McCarthy, M.P., Best, M.J., Betts, R.A., 2010. Climate change in cities due to global warming and urban effects. Geophysical Research Letters 37, n/a–n/a. doi:10.1029/2010GL042845
Menon, S., Akbari, H., Mahanama, S., Sednev, I., Levinson, R., 2010. Radiative forcing and temperature response to changes in urban albedos and associated CO2 offsets. Environmental Research Letters 5, 014005. doi:10.1088/1748-9326/5/1/014005
Moseley, D., Miller, C., Bell, C., Weeks, K., Bass, B., Berghage, R., 2013. Green Roof Performance: A cost-benefit analysis based on Walmart’s Chicago store.
Mullen, M., 2010. Speech at the DoD Energy Security Forum by Chairman of The Joint Chiefs of Staff.
Nagengast, A.L., 2013. Energy Performance Impacts from Competing Low-slope Roofing Choices and Photovoltaic Technologies. Carnegie Mellon University.
National Digital Forecast Database, 2007. Element Definitions. National Weather Service National Digital Forecast Database. URL http://www.nws.noaa.gov/ndfd/definitions.htm (accessed 10.8.14).
National Renewable Energy Laboratory, 2014. PVWatts Calculator. NREL. URL http://pvwatts.nrel.gov/ (accessed 12.4.14).
47
National Research Council, 2011. Climate Stabilization Targets: Emissions, Concentrations, and Impacts over Decades to Millennia. National Academies Press, Washington, D.C.
Niu, H., Clark, C., Zhou, J., Adriaens, P., 2010. Scaling of Economic Benefits from Green Roof Implementation in Washington, DC. Environmental Science & Technology 44, 4302–4308. doi:10.1021/es902456x
Panetta, L., 2012. Speech at the Environmental Defense Fund Reception (Energy, Security, and the Environment) by Secretary of Defense.
Pepco, 2014. Rate Schedules. Pepco. URL http://www.pepco.com/my-business/choices-and-rates/district-of-columbia/rate-schedules/ (accessed 10.8.14).
Perera, E.M., Sanford, T., 2011. Climate Change and Your Health: Rising Temperature, Worsening Ozone Pollution.
Post, E.S., Grambsch, A., Weaver, C., Morefield, P., Huang, J., Leung, L.-Y., Nolte, C.G., Adams, P., Liang, X.-Z., Zhu, J.-H., Mahoney, H., 2012. Variation in Estimated Ozone-Related Health Impacts of Climate Change due to Modeling Choices and Assumptions. Environmental Health Perspectives 120, 1559–1564. doi:10.1289/ehp.1104271
Rasmussen, D.J., Hu, J., Mahmud, A., Kleeman, M.J., 2013. The Ozone–Climate Penalty: Past, Present, and Future. Environmental Science & Technology 47, 14258–14266. doi:10.1021/es403446m
Robyn, D., 2012. Speach at IFC International Office by Deputy Under Secretary of Defense for Installations and Environment.
Rosenzweig, C., Solecki, W.D., Slosberg, R.B., 2006. Mitigating New York City’s Heat Island with Urban Forestry, Living Roofs, and Light Surfaces.
Sailor, D.J., 2010. Energy Performance of Green Roofs. Sol Systems LLC, 2014. Personal communication. Sproul, J., Wan, M.P., Mandel, B.H., Rosenfeld, A.H., 2014. Economic comparison of white,
green, and black flat roofs in the United States. Energy and Buildings 71, 20–27. doi:10.1016/j.enbuild.2013.11.058
Stone, B., Vargo, J., Liu, P., Habeeb, D., DeLucia, A., Trail, M., Hu, Y., Russell, A., 2014. Avoided Heat-Related Mortality through Climate Adaptation Strategies in Three US Cities. PLoS ONE 9, e100852. doi:10.1371/journal.pone.0100852
Tagaris, E., Liao, K.-J., DeLucia, A.J., Deck, L., Amar, P., Russell, A.G., 2009. Potential Impact of Climate Change on Air Pollution-Related Human Health Effects. Environmental Science & Technology 43, 4979–4988. doi:10.1021/es803650w
U.S. Conference of Mayors, 2014. U.S. Conference of Mayors Climate Protection Agreement. Mayors Climate Protection Center. URL http://www.usmayors.org/climateprotection/agreement.htm (accessed 9.23.14).
U.S. Department of Defense, 2010. Quadrennial Defense Review Report. U.S. Department of Defense, 2011. Department of Defense Annual Energy Management Report
Fiscal Year 2010. U.S. Department of Energy (DOE), 2010. Guidelines for Selecting Cool Roofs. U.S. Department of Energy (DOE), 2014. Third-Party Solar Financing. DOE. URL
http://apps3.eere.energy.gov/greenpower/onsite/solar_financing.shtml (accessed 10.9.14).
48
U.S. Environmental Protection Agency (EPA), 2008a. Reducing Urban Heat Islands: Compendium of Strategies.
U.S. Environmental Protection Agency (EPA), 2008b. Final Ozone NAAQS Regulatory Impact Analysis (No. EPA-452/R-08-003).
U.S. Environmental Protection Agency (EPA), 2008c. National Air Quality: Status and Trends Through 2007 (No. EPA-454/R-08-006).
U.S. Environmental Protection Agency (EPA), 2009. Integrated Science Assessment for Particulate Matter (No. EPA/600/R-08/139F).
U.S. Environmental Protection Agency (EPA), 2012a. BenMAP User’s Manual. U.S. Environmental Protection Agency (EPA), 2012b. Regultory Impact Analysis for the Final
Revisions to the National Ambient Air Quality Standards for Particulate Matter (No. EPA-452/R-12-005).
U.S. Environmental Protection Agency (EPA), 2013a. Integrated Science Assessment for Ozone and Related Photochemical Oxidants (No. EPA 600/R-10/076F).
U.S. Environmental Protection Agency (EPA), 2013b. Basic Information. EPA. URL http://www.epa.gov/airquality/particlepollution/designations/basicinfo.htm (accessed 10.8.14).
U.S. Environmental Protection Agency (EPA), 2013c. Fact Sheet: Social Cost of Carbon. U.S. Environmental Protection Agency (EPA), 2014a. Emission Factors for Greenhouse Gas
Inventories. U.S. Environmental Protection Agency (EPA), 2014b. Inventory of U.S. Greenhouse Gas
Emissions and Sinks: 1990-2012 (No. EPA 430-R-14-003). U.S. Environmental Protection Agency (EPA), 2014c. The 2011 National Emissions Inventory.
EPA. URL http://www.epa.gov/ttnchie1/net/2011inventory.html (accessed 10.8.14). U.S. General Services Administration (GSA), 2011. The Benefits and Challenges of Green Roofs
on Public and Commercial Buildings. U.S. Government Accountability Office, 2014. Regulatory Impact Analysis: Development of
Social Cost of Carbon Estimates. Vanos, J., Kalkstein, L.S., Sailor, D., Shickman, K., Sheridan, S., 2014. Assessing the Health
Impacts of Urban Heat Island Reduction Strategies in Baltimore, Los Angeles, and New York.
Voorhees, A.S., Fann, N., Fulcher, C., Dolwick, P., Hubbell, B., Bierwagen, B., Morefield, P., 2011. Climate Change-Related Temperature Impacts on Warm Season Heat Mortality: A Proof-of-Concept Methodology Using BenMAP. Environmental Science & Technology 45, 1450–1457. doi:10.1021/es102820y
Weisstein, E.W., 2007. Heat Capacity. Wolfram Research. URL http://scienceworld.wolfram.com/physics/HeatCapacity.html (accessed 12.5.14).
Wray, C., Akbari, H., 2008. The effects of roof reflectance on air temperatures surrounding a rooftop condensing unit. Energy and Buildings 40, 11–28. doi:10.1016/j.enbuild.2007.01.005