CAP 1062 Future Airspace Strategy (FAS): UK Continuous ... 1062 FAS UK CCO CBA.pdf · CAP 1062...
100
Future Airspace Strategy (FAS): UK Continuous Climb Operations (CCOs) Cost Benefit Analysis (CBA) CAP 1062
Transcript of CAP 1062 Future Airspace Strategy (FAS): UK Continuous ... 1062 FAS UK CCO CBA.pdf · CAP 1062...

Future Airspace Strategy (FAS): UK Continuous Climb Operations (CCOs) Cost Benefit Analysis (CBA)CAP 1062


CAP 1062
Future Airspace Strategy (FAS): UK Continuous Climb Operations (CCOs) Cost Benefit Analysis (CBA)
www.caa.co.uk
July 2013

© Civil Aviation Authority 2013
All rights reserved. Copies of this publication may be reproduced for personal use, or for use within a company or organisation, but may not otherwise be reproduced for publication.
To use or reference CAA publications for any other purpose, for example within training material for students, please contact the CAA at the address below for formal agreement.
Enquiries regarding the content of this publication should be addressed to:Regulatory Policy Group, Civil Aviation Authority, CAA House, 45 - 49 Kingsway, London, WC2B 6TE
The latest version of this document is available in electronic format at www.caa.co.uk/publications

CAP 1062 Contents
July 2013 Page 5
Contents
Foreword 9
Executive Summary 11
Background 11
Benefit to Cost Ratio (BCR) 11
Benefits 12
Costs 13
Section 1 14
Future Airspace Strategy (FAS) 14
Section 2 15
CCO study scope and limitations 15
Section 3 17
CBA Design and Methodology 17
Section 4 18
Continuous Climb Operations (CCOs) 18
Section 5 20
CCO Assumptions 20
Performance Based Navigation (PBN) capability 20
Scenarios 22
Major airspace redesign programmes 23
Coverage of costs and benefits 24
Transition Altitude (TA) 27
LAMP 28
NTCA 28

CAP 1062 Contents
July 2013 Page 6
Other airspace redesign costs 28
Aircraft categories 29
Calculating flight efficiency and CO2 savings 30
Air Traffic Demand 32
Airport Capacity 33
Fuel prices 34
Passenger time 34
Delay cost savings 34
Carbon prices 35
Price levels 35
Discount rate 36
Section 6 37
CCO Benefits 37
Quantified fuel efficiency, CO2 and time savings 37
Noise Benefits 39
Safety 41
Access to controlled airspace 42
ATC workload / sector capacity increase 43
Benefits at airports not included in this study 43
Section 7 45
Direct CCO Costs (operations at airports included in this study) 45
Attributing costs 45
Aircraft equipage – Performance Based Navigation (PBN) 46
Airspace Modernisation 51
Major Airspace Modernisation Programmes (TA, LAMP, NTCA) 51
Airport level airspace redesign costs 53
NPV of Total Costs 53
Section 8 55
Indirect costs (operations at impacted airports outside of this study) 55
Military costs 55

CAP 1062 Contents
July 2013 Page 7
Cost to operators at airports outside the study 56
Section 9 58
Summary of NPV of Costs and Benefits 58
Section 10 59
Benefit to Cost Ratio (BCR) 59
Section 11 62
Distributional Analysis 62
Annex A
Assessing the Overall Benefits of FAS Deployment 64
Annex B
Developing a Cost Benefit Analysis (CBA) framework for the FAS 66
Annex C
Total Aircraft Movements 2011 68
Annex D
CCO baseline performance at Heathrow, Gatwick, Stansted, Manchester and Birmingham 70
Annex E
Carbon prices 73
Annex F
Example of derivation of baseline 2011 expected benefits by aircraft type at Heathrow 75

CAP 1062
July 2013 Page 8
Annex G
Baseline year (2011) benefits by airport 78
Annex H
Sensitivity Analysis 81
CCO Scenario – 80 per cent and 60 per cent continuous climbs achieved 81
Discount Rate – UK recommended rate of 3.5 per cent 85
Exchange Rate – 2012 average Euro exchange rate 86
Annex I
CAA PBN Capability Study results 89
Annex J
Summary of Assumptions and Uncertainties 90
Annex K
York Aviation Independent Validation Commentary 96
Contents

CAP 1062 Foreword
July 2013 Page 9
Foreword
Aviation relies on the scarce resource that is airspace to ensure that consumers, businesses, the military and leisure flyers enjoy the many benefits aviation brings.
The basic structure of the UK’s airspace was developed over forty years ago. Since then there have been huge changes in the pressures on airspace, including a hundred fold increase in demand for aviation coupled with intense pressure to mitigate the environmental impacts of aviation From the airline perspective, fuel accounts for their largest cost and, as a consequence, any operational profile that reduces fuel burn has both an environmental and an economic benefit.
Throughout Europe there is ambition to simplify and harmonise the way airspace and air traffic control is used through the Single European Sky project. In the UK and Ireland we’re meeting those and other issues through the Future Airspace Strategy (FAS) which sets out a plan to modernise airspace by 2020.
To help quantify the benefits that FAS can deliver, and the costs of implementing these changes, we have undertaken a detailed study on one of the main benefits that we anticipate – Continuous Climb Operations (CCO), where an aircraft is able to climb to its optimal cruising height without having to stop at various levels in-between, which is currently the case in many tactical situations.
We wanted to scope the benefits to consumers and wider society from this FAS deliverable and also provide findings from a wider consumer and societal perspective, rather than the commercially focused assessments industry stakeholders will produce as part of their own investment strategies to realise the benefits of FAS.
While the study examines only one of the operational improvements that FAS could bring, it also aims to set a framework for future FAS analysis that would build a comprehensive picture of the full benefits and costs associated with this important project.
We encourage you to review this document and use it and its findings where appropriate in your organisation. We are keen to hear any feedback that you have on this type of work and the benefits you consider it brings to the industry. If you have any comments on it or would like to discuss this work in more detail please email Amanda Downing ([email protected])
Mark SwanDirector of Airspace Policy

18th April 2013
Continuous Climb Operations (CCOs) Cost Benefit Analysis: Validation & Assurance
We have now had the opportunity to review the revised draft of Continuous Climb Operations
(CCOs) Cost Benefit Analysis. We note that this version has addressed the great majority of our
comments from the previous draft.
We have revised our note (see Annex K) to delete points which have been fully resolved. The
comments that remain have generally been addressed in the revised draft, but they relate to issues
and uncertainties that are not practically solvable and which we believe need to be recorded as
such. Where this is the case, we recognise that appropriate wording has been added to the Report
to clarify the position in relation to these issues and note their existence and their potential impact
on the analysis. They do, however, of course, remain weaknesses and hence they remain in our
accompanying note.
We have also reiterated some previous comments that agreed with the approach taken in relation
to potentially particularly important assumptions.
Overall, we are happy to verify that we believe the Continuous Climb Operations (CCOs) Cost
Benefit Analysis to:
be methodologically appropriate to undertaking a high level analysis of an operation outcome in this context and that it includes all relevant aspects;
have taken a sensible approach to the limitations and biases of the sources of data;
have been conducted in line with best practice.
Best regards
Louise Congdon
Managing Partner
York Aviation
York Aviation LLP
Primary House
Spring Gardens
Macclesfield
Cheshire SK10 2DX
Tel: 01625 614051
Fax: 01625 426159
E-mail: [email protected]
www.yorkaviation.co.uk

CAP 1062 Executive Summary
July 2013 Page 11
Executive Summary
Background
1. The approach of this study was to provide a high level assessment of the benefits and costs of continuous climb implementation across the UK.
2. It forms only one part of the overall evaluation of FAS benefits. It captures the impact of implementing fully systemised continuous climb operations only and therefore does not capture all the benefits expected from full FAS deployment.
3. The costs and benefits are highly dependent on the deployment plan timescale and therefore represent an illustration of what benefits and costs could be expected under such timescales and will change depending on the final timescale agreed for FAS deployments affecting continuous climb operations.
4. At this stage, not all the costs and benefits are known but quantification of the benefits and costs has been done to the maximum possible extent and remain estimates in approximate terms. Qualitative benefits and costs have also been identified and described where possible.
Benefit to Cost Ratio (BCR)
5. The BCR was positive for central scenarios assuming fully systemised CCOs for the airports included in this study. This indicates a net benefit to the UK from supporting the implementation of fully systemised CCOs.
6. The BCRs ranges from 2.1 (benefits 110 per cent greater than costs) to 4.1 (benefits 310 per cent greater than costs) depending on how quickly fully systemised CCOs could be implemented and the extent of the costs faced.
7. If fully systemised CCOs were not able to be achieved, the BCRs decrease significantly. 80 per cent CCO achievement generates a BCR range of 1.3 to 2.6 and a 60 per cent CCO achievement generates a BCR range of 0.6 to 1.3. These situations include scenarios where the net benefits are not greater than the net costs.

CAP 1062 Executive Summary
July 2013 Page 12
8. Military costs have not been factored into this analysis. However, as long as military costs directly attributable to fully systemised CCOs are less than approximately £70 million a net benefit to the UK from fully systemised CCOs should remain.
9. Passengers and commercial aircraft operators at the airports included in the study would be clear winners of fully systemised CCOs with benefits significantly greater than the costs.
10. The position of airports, ANSPs and aircraft operators outside the airports in this study is less clear as many of the benefits to these stakeholders have not been able to be fully quantified, e.g. safety benefits, pilot and controller workload and potential airspace capacity release. However, this is only one operational improvement and it is widely expected that these stakeholders will receive significant benefits in other areas.
11. The military position is less favourable, with costs incurred but the benefit limited to the ability to continue to operate as they do currently.
Benefits
12. Quantified benefits include fuel savings, passenger time savings, operator time savings and CO2 emission savings. Other possible qualitative benefits include safety, air traffic controller workload, and the release of controlled airspace.
13. The expected benefits from fully systemised continuous climb operations (CCOs) across the UK could be up to £16 million per year. Of this 26 per cent is expected to accrue to aircraft operators through reduced fuel costs, a further 30 per cent to aircraft operators through time and maintenance savings, 43 per cent to passengers through time savings and 2 per cent to reduced carbon emissions.
14. Over the timeframe of the FAS (up to 2030) expected benefits from fully systemised CCOs could range from £142 million to £208 million depending on the implementation timescales of the different airports.
15. Expected benefits from CCOs depend on the implementation timeframe for the airports with the greatest possible benefits to be achieved. Expected benefits are highest when fully systemised CCOs at Heathrow and London City airports are implemented at the beginning rather than the end of the deployment phase. A late implementation of

CAP 1062 Executive Summary
July 2013 Page 13
Heathrow and London City airports results in approximately 30 per cent loss of total expected benefits.
16. Expected benefits from CCOs are also highly dependent on the extent to which full systemisation of CCOs can be achieved. Fully systemised CCOs generated 60 per cent greater benefits compared to 80 per cent CCO achievement, and fully systemised CCOs generated 230 per cent greater benefits compared to a 60% CCO achievement level.
Costs
17. Quantified direct costs include aircraft retrofit, airport airspace redesign, and major airspace redesign and potential indirect costs to other operators. These costs have been assumed to include the necessary training, consultation, certification and publication of procedure costs.
18. It is not currently possible to quantify any costs to the UK military related to aircraft retrofit.
19. Over the timeframe of the FAS (up to 2030) estimated direct costs attributable to fully systemised CCOs could range from £41.7 million under a low cost scenario to £65.3 million under a high cost scenario depending on the implementation timescales of the different airports.
20. If indirect costs are included the estimated costs attributable to fully systemised climbs would increase to £42.1 million under a low cost scenario to £70.7 million under a high cost scenario.

CAP 1062 Section 1: Future Airspace Strategy (FAS)
July 2013 Page 14
1SECTION 1
Future Airspace Strategy (FAS)
1.1 The UK’s FAS was developed by the CAA, with contributions from the Department for Transport (DfT), Ministry of Defence (MoD) and NATS (the UK’s main Air Navigation Service Provider), and considers the development of the UK’s airspace system from 2011 to 2030. The Strategy sets the direction for how planning, management and regulation of UK airspace should develop to maintain and improve the UK’s high levels of safety while addressing the many different requirements on the airspace system, and delivering balanced or ‘optimal’ outcomes, taking into account all those involved in, or affected by, the use of airspace.1
1.2 The FAS itself did not provide a detailed roadmap or plan for the implementation of changes to the UK’s airspace system. Similarly, it did not provide a blueprint, or future design for the UK’s airspace structure, but it did set the direction for future detailed pieces of work to be progressed in these areas. A FAS industry implementation group (FASIIG) was set up in 2011 in order to drive forward the development of a network-wide FAS deployment plan by end of 2012. The deployment plan includes detailed actions required across the industry as well as a network-wide assessment of the benefits and costs associated with FAS deployment.
1 CAA (2011) Future Airspace Strategy for the United Kingdom 2011 to 2030; http://www.caa.co.uk/default.aspx?catid=64&pageid=12068

CAP 1062 Section 2: CCO study scope and limitations
July 2013 Page 15
2SECTION 2
CCO study scope and limitations
2.1 The CAA is particularly interested in the benefits to consumers and wider society from the FAS and is therefore leading this work to assess the costs and benefits from a wider consumer and societal perspective separately from the commercially focused assessments industry stakeholders will produce as part of their own investment strategies.
2.2 This study examines only one of the operational improvements, CCOs, expected as part of FAS deployment and does not capture all the benefits expected from full FAS deployment. It also aims to set a framework for future strategic FAS deployment analysis working towards a more comprehensive picture of the full benefits and costs associated with FAS deployment.
2.3 This work is purposely structured from a strategic network-wide level and does not attempt to capture the level of detail that one would expect to see from industry stakeholders regarding their own individual business cases for FAS deployment. It is intended to provide the industry, and the CAA, with an assessment of the strategic benefits available to consumers and society from the FAS and leaves industry stakeholders to develop a commercially viable deployment plan to realise these benefits. It is recognised that the realisation of CCO benefits in this study is dependent on this commercially viable deployment plan, which may be more difficult for some stakeholders. However, the CAA hope that the results of this study and evidence of wider network benefits could be used by stakeholders in the development of their individual commercial investment plans.
2.4 It is not expected that the figures in this report will align exactly to other cost benefit studies in the industry2. The scope and focus of this study is likely to be different as this report solely captures CCO benefits and other reports are likely to cover other operational changes or different
2 Other cost benefits studies in the industry include SESAR Macroeconomic CBA (http://www.sesarju.eu/news-press/documents/assessing-macroeconomic-impact-sesar-874), and other potential organisation specific business cases, e.g. future LAMP, TA, or NTCA business cases produced by NATS, airport business cases for airspace changes, or aircraft operator business cases for aircraft retrofit.

CAP 1062 Section 2: CCO study scope and limitations
July 2013 Page 16
timescales; however, this reports uses transparent industry and UK recommended standard assumptions where possible.
2.5 Sections 4 and 5 describe continuous climb operations (CCOs) and the assumptions used in the study to assess the benefits and costs of CCOs. Sections 6 and 7, respectively, set out how the estimated benefits and costs of implementing full continuous climb operations have been calculated. Section 8 describes the impact at airports and to airspace users not included in this study and finally section 9 illustrates the impact across different groups of users in the UK.

CAP 1062 Section 3: CBA Design and Methodology
July 2013 Page 17
3SECTION 3
CBA Design and Methodology
3.1 Quantification of the benefits and costs has been done to the extent required to provide a robust strategic assessment of the costs and benefits. Qualitative benefits and costs have also been identified and described where possible.
3.2 As an initial step towards developing a methodology to be applied rigorously in the future, this study covers the costs and benefits for continuous climb operations only, which is only one of many operational improvement areas in the FAS. Annex A in this report covers the wider context of the overall assessment of the benefits of the FAS and Annex B describes the development of a cost benefit analysis framework for operational improvements in the FAS that was used in order to conduct this study.

CAP 1062 Section 4: Continuous Climb Operations (CCOs)
July 2013 Page 18
4SECTION 4
Continuous Climb Operations (CCOs)
4.1 One of the characteristics of the UK’s future airspace system as described in the FAS document is routeing based on ‘user preferred trajectories’. User preferred trajectories include a 2D element to allow users’ preferences to fly as direct a route as possible across the ground (horizontal performance); a 3D element to allow users’ preference to fly an optimal vertical profile that minimises fuel burn (vertical performance); and a 4D element that introduces the dimension of time, allowing users to combine horizontal and vertical performance while ensuring synchronisation of flight profiles to minimise, and where possible, remove delays and optimise the overall flow of air traffic.
4.2 In June 2012 a voluntary industry Departures Code of Practice was published by Sustainable Aviation compiled by a group representing aerospace manufacturers, airlines, airports, air traffic control, and the CAA’s Environmental Research and Consultancy Department (ERCD).3 It gives advice on operational techniques, including CCOs, aimed at improving the environmental impacts of aircraft operations. The Sustainable Aviation work has been used in this study to define the concept of a CCO, but not in the actual calculation of expected benefits.
4.3 In this study, CCOs refer to the removal of the airspace constraints that result in a stepped climb to cruise, thereby providing an optimised continuous climb, dependent on the aircraft’s own configuration and performance capability, which varies across the fleet of aircraft operating in UK airspace. Figure 1 below illustrates the components of a perfect flight based on vertical performance, which includes a continuous climb component. A continuous climb from departure to cruising altitude significantly increases the fuel efficiency of the aircraft delivering fuel savings to aircraft operators as well as delivering emission savings.
4.4 As highlighted in the Departures Code, the principle of a CCO is to provide a continuous climb from lift-off to optimum cruise level. However, fuel savings can also be realised by minimising the duration of level flight and/or increasing the altitude at which any necessary
3 Sustainable Aviation (June 2012) Reducing the Environmental Impacts of Ground Operations and Departing Aircraft. http://www.sustainableaviation.co.uk/wp-content/uploads/DCOPractice2012approvedhi-res.pdf (last accessed 17/8/2012)

CAP 1062 Section 4: Continuous Climb Operations (CCOs)
July 2013 Page 19
level offs are given. Fuel penalties increase with the number of level off segments incurred by the aircraft. The Departures Code illustrates that the fuel penalty for an aircraft with one level off segment at 6,000ft at ten nautical miles is between three and seven per cent, which is lower than the fuel penalty of between five and eight per cent for two level offs with one at 6,000ft for ten nautical miles and a second at flight level 195 for five nautical miles. As mentioned in 4.2 this data has not been used in the actual calculation of expected benefits in this study, but does support that fuel savings can be expected from removing level off segments.
4.5 Currently within the UK, aircraft can be offered a continuous climb if it is cleared to do so by an air traffic controller (ATC) on a tactical basis and the airspace design permits it to occur; however these procedures are not included in the standard instrument departures (SIDs) and cannot be offered on a routine basis. This is due to the complexity of the current airspace design from a number of factors, such as the close proximity of other airports, the need to level off aircraft to de-conflict with another aircraft trajectory and the use of, and need to avoid, airborne holding stacks. Full user preferred trajectories would not be possible in densely trafficked terminal manouvering areas (TMAs), due to the complexity cause by a wide range of different arrival and departure routes. Consequently the optimum design within a TMA is likely to be a highly systemised structure of 2 and 3-D routes that incorporate continuous climb and continuous descent operations.
Figure 1 - NATS depiction of the perfect flight based on vertical performance

CAP 1062 Section 5: CCO Assumptions
July 2013 Page 20
5SECTION 5
CCO Assumptions
5.1 This section describes the assumptions that have been used in this study.
Performance Based Navigation (PBN) capability
5.2 PBN sets the level of accuracy, integrity and continuity that an aircraft’s navigation systems will have to meet as well as the required functionality. PBN will allow the implementation of airspace structures that take advantage of aircraft able to fly more flexible, accurate, repeatable and therefore deterministic three dimensional flight paths using onboard equipment capabilities. It has been described as reengineering the way we fly.
5.3 PBN requirements are expressed in navigation specifications in terms of accuracy, integrity, continuity and functionality required for the operation on a particular route or procedure. PBN is described through RNAV and RNP Applications with respective RNAV and RNP Operations.
5.4 RNAV (RNAV1 , RNAV 5 etc.)– navigation specification based on area navigation that does not include the requirement for on-board performance monitoring and alerting
5.5 RNP (RNP 4 etc.) – navigation specification based on area navigation that includes the requirement for on-board performance monitoring and alerting.
5.6 In October 2011, the CAA and IAA jointly published the Policy for the Application of Performance-based Navigation in UK/Ireland Airspace4. It set out the framework around which PBN can be applied as well as providing the regulatory mechanism for the scale of change that will have to be undertaken by the respective Air Navigation Service Providers (ANSPs) in order to realise the projected benefits. The PBN policy stated that RNAV1 capable aircraft should operate on strategic ATS routes, all new terminal airspace procedures shall be designed using PBN terminal airspace procedure criteria and that all new terminal airspace designs should facilitate the use of CCO and CDOs. A “soft
4 CAA (October 2011) Policy for the Application of Performance-based Navigation in UK/Ireland Airspace; http://www.caa.co.uk/default.aspx?catid=7&pagetype=90&pageid=13334

CAP 1062 Section 5: CCO Assumptions
July 2013 Page 21
mandate” for PBN in terminal airspace is also provided, which could mean that the CAA would provide a mandate for a specific route or volume of airspace only rather than a requirement for all UK aircraft operators. This study has assumed PBN capability for only aircraft operating at the airports included in this study in line with the “soft mandate” approach.
5.7 PBN will lead to flight efficiency improvement and allow optimisation of the airspace. Without the constraints of navigating via fixed, ground-based aids, it provides the airspace designer with a powerful tool in terms of positioning routes and instrument flight procedures in relation to areas of congestion or population density. PBN can offer predictable and repeatable path trajectories moving to a systemised environment with designed interactions, and closer spaced routes, amongst other benefits.
5.8 From an airspace and airports perspective the envisaged benefits of PBN include an increase in capacity in existing controlled airspace, greater access to airports (especially for general aviation (GA) aircraft which have traditionally been limited due to their basic equipment), improvements in safety, and a reduction in the effects that flights have on the environment from more efficient routes and more accurate path keeping for noise abatement.
5.9 From an ANSP perspective the envisaged benefits of PBN include reduced service cost through reduced navigational infrastructure, increased systemisation and increased controller productivity; improvement in safety and improvement in the quality of the service to meet new airspace user requirements. The navigation infrastructure is a key element of PBN and is linked to a move towards a space-based navigation environment. This in turn will allow rationalisation of ground infrastructure (e.g. VOR) leading to savings from capital investment, maintenance and spectrum utilisation.
5.10 Given the strong regulatory policy direction this study assumes that all future SID and airspace redesigns included in an airspace change proposal under CAP725 will be based on PBN procedures and therefore require PBN compliance from aircraft operating in that area. Specifically, this study has assumed that airspace changes to implement fully systemised CCOs will require a RNAV1 level of PBN capability.

CAP 1062 Section 5: CCO Assumptions
July 2013 Page 22
Scenarios
5.11 The benefits and costs in this study have been assessed against a baseline, or “do nothing”, scenario. The baseline scenario is based on the actual radar data and current CCO performance up to at least 18,000ft and assumes a continuation of this level of CCO performance in the future. It is recognised that this does not take into account departures where a level off was first incurred at/or above 18,000ft; however, the vast majority of level off segments will occur below 18,000ft and therefore this is deemed to be a satisfactory approximation for baseline performance.
5.12 Currently CCOs in the UK are generally offered on a tactical basis by air traffic controllers based on available capacity. In the baseline scenario, if increased traffic levels were to decrease the frequency at which tactical CCOs could be offered the baseline CCO performance level would decrease. If this were the case benefits would be expected to be higher than those included in this study as there would be a greater potential benefit from fully systemised CCOs.
5.13 The three CCO scenarios, or “do something” scenarios, in this study assume a full continuous climb (based on aircraft performance) from departure to cruise level and attempt to reflect the difference in expected benefits related to the timing and coordination of implementation:
�� CCO Scenario 1 – early full implementation
�� All airports implement CCOs by 2016
�� CCO Scenario 2 – staged implementation leading with Heathrow
�� LTMA5 – Heathrow / London city from 2016; Gatwick from 2018; Stansted/Luton from 2020
�� NTCA6 – all from 2016
�� Elsewhere7 from 2016
�� CCO Scenario 3 – staged implementation finishing with Heathrow
�� LTMA – Stansted/Luton from 2016; Gatwick from 2018; Heathrow / London city from 2020
5 Includes Heathrow, Gatwick, Stansted, Luton and London City airports6 Includes Manchester, Liverpool John Lennon, and Newcastle airports7 Includes Birmingham, Edinburgh and Glasgow, Bristol

CAP 1062 Section 5: CCO Assumptions
July 2013 Page 23
�� NTCA – all from 2016
�� Elsewhere from 2016
5.14 These scenarios are affected by three key factors. Firstly, benefits and costs are highly dependent on implementation timescales that are currently being determined and agreed as part of FAS Deployment. Actual implementation timescales will likely change from those assumed in this study, but the scenarios still give an indication of how the net benefits would change with different implementation timescales.
5.15 Secondly, although the vision in the FAS is to enable fully systemised CCOs, in reality the complexity of UK airspace, particularly in the London Terminal Manoeuvring Area (LTMA), may mean this is not feasible for all SIDs or for all times in the day. Therefore, it is acknowledged that the figures in the CCO scenarios represent maximum benefits which could be achieved. Sensitivity analysis has been conducted on the CCO scenarios assumption of full continuous climbs, with analysis of the benefits realised with an 80 per cent and 60 per cent achievement of fully systemised CCOs where current performance levels are below those levels. The results of this sensitivity analysis can be found in Annex H.
5.16 Finally, the CCO scenarios do not cover any changes to the length or horizontal profiles of the SIDs which is very important to bear in mind. It is envisaged that PBN capabilities will enable changes to SIDs other than just vertical performance and therefore these scenarios are on the conservative side from airspace redesigns with departure profile changes. It is not possible to currently quantify potential benefits of horizontal changes to departure profiles.
5.17 Costs in the study have been assumed to arise from the baseline year in 2011 for both aircraft equipage and airspace redesigns and are assumed to be evenly spread across during the implementation phases. It is recognised that this may overestimate the net present value of the costs through lower discounting of costs if in practice costs are not incurred until a later date.
Major airspace redesign programmes
5.18 Major airspace redesign programmes are a cornerstone of the FAS deployment and form one of NATS’ main contribution to the FAS. The current airspace design does not effectively separate arrival and

CAP 1062 Section 5: CCO Assumptions
July 2013 Page 24
departure flows to individual airports onto dedicated routes. Interactions between traffic flows create the need for tactical interventions that interrupt CCOs as well as interrupting CDOs, increasing controller and pilot workload and reducing airspace capacity.
5.19 Currently many departures, mainly in the London terminal environment, level off at between four and seven thousand feet in order avoid incoming traffic not allowing for fully systemised CCOs. The London Airspace Management Programme (LAMP) and the Northern Terminal Control Area (NTCA) airspace redesigns, in conjunction with a change to the Transition Altitude (TA) across the UK to 18,000 ft, aim to maximise the achievement of CCOs.
5.20 This study assumes that the TA, LAMP and NTCA major airspace redesigns are implemented as required for each of the benefit scenarios, and that other airspace redesigns are undertaken where necessary to facilitate fully systemised CCOs at the airports included in this study. The full costs of all initiatives included in this section have been included.
Coverage of costs and benefits
5.21 The starting point for identifying airports to include in the study was UK airports with annual commercial movements around or above 40,000 air traffic movements (ATM) per year in order to capture the airports that could be expected to derive the greatest benefits from CCOs.
5.22 Airports from this group were then chosen based on the information that was available to the CAA in order to appropriately compare baseline and future scenarios and estimate the benefits from the change in operation. Radar data was available for several airports and other airports were judged to have relatively similar mixes of traffic and/or movements. Table 1 lists the UK airports that have been included in this report to generate the expected benefits.

CAP 1062 Section 5: CCO Assumptions
July 2013 Page 25
Table 1 – Airports used in the study to calculate expected benefits and source of data
Radar data Estimated from radar data at proxy airport
Heathrow
Gatwick
Stansted Luton
Manchester
London City
Birmingham Edinburgh
Glasgow
Liverpool
Newcastle
Bristol
5.23 Stansted was chosen as a proxy for Luton airport as it was the most similar London airport8. Birmingham airport was chosen as the proxy airport for Edinburgh, Glasgow, Liverpool, Newcastle and Bristol airports due to the relatively similar expected baseline CCO performance of the airports9.
5.24 Five airports were omitted from the study as they were deemed to have traffic mixes that were unique and therefore did not fit close enough with the radar data that was available10.
5.25 Radar data covering a 92 day period over the summer 2011 was used to estimate baseline data for Heathrow, Gatwick, Stansted and Manchester airports. Data for London City airport was from the same
8 It is acknowledged that Luton airport has a slightly different mix of commercial and business traffic; however it was deemed to be an appropriate approximation at the aggregate level of this study. Additionally Luton has lower movements per year and therefore the benefits have been adjusted to the proportionate level (67 per cent) of traffic compared to Stansted.
9 It is recognised that Liverpool, Newcastle and Bristol airports annual ATM movements are almost half those at Birmingham and therefore overestimate the benefits at these airports. Therefore benefits figures at these airports have been computed at 50 per cent of Birmingham figures for 2011.
10 These airports included Aberdeen, East Midlands International, Belfast International, Belfast City and Southampton.

CAP 1062 Section 5: CCO Assumptions
July 2013 Page 26
92 day summer period, but from 2006 rather than 2011 due to data accessibility. Birmingham airport radar data covered the full year in 2011.
5.26 It was not deemed necessary to include all regional airports in the study due to relatively high levels of current CCO performance at many of these airports and therefore low expected benefits. The airports included in this study represent 56 per cent of all UK aircraft movements and 66 per cent of all UK commercial aircraft movement for 2011. Annex C includes information on 2011 aircraft movements for the airports included in this study.
5.27 The data in this study is based on a baseline CCO performance level at each of the airports, ranging from a high of 90 per cent at Birmingham and Manchester airports to a low of 4 per cent at London City. This means that whilst 90 per cent of flights in the sample period received a CCO up to at least 18,000ft out of Birmingham and Manchester, only 4 per cent of flights out of London City received a CCO up to at least 18,000ft11. Annex D provides the full distributions of baseline CCO performance across the sample periods at Heathrow, Gatwick, Stansted, Manchester and Birmingham in 2011.
5.28 In the development of the methodology and scope for this study the issue of what baseline should be used for measuring current CCO performance was questioned and particularly the use of baseline data from 2011 where traffic levels were not as high as those seen previously in UK airspace. The level of expected benefits is directly correlated with and highly sensitive to baseline CCO performance levels; higher air traffic levels could be associated with a lower base CCO performance level and therefore the expected benefits from moving to fully systemised CCOs could be greater than those estimated here. A fully systemised CCO environment designed to cope with traffic growth should remove or minimise the risk of not achieving the 100 per cent achievement levels included in this report.
5.29 Distributions of CCO performance over the same period in 2008, 2009, 2010 and 2011 at London Heathrow were examined and showed that baseline CCO performance was indeed lower in 2008 at 33 per cent (compared to 40 per cent in 2009, 2010, and 2011) with the higher
11 Baseline performance data is based on 2011 data except for London City airport which is based on a sample from 2006. It is possible that part of the low performance for London City airport is due to the fact that the sample was taken from a year with higher traffic levels; however London City SIDs are constrained by arrivals into and out of London Heathrow and therefore it is not unreasonable to assume that this level of performance is a regular occurrence.

CAP 1062 Section 5: CCO Assumptions
July 2013 Page 27
traffic levels. However, CCO performance has been stable over the last three years and UK traffic levels are predicted to recover slowly from the recent economic downturn, therefore 2011 has been deemed an appropriate year for baseline CCO performance in this study.
5.30 It should be noted that there was no objection to the use of 2011 for baseline CCO performance in the interim report; however it is still recognised that if CCO baseline performance levels were to decrease from the 2011 levels the benefits of implementing CCOs in the UK would be greater than those included in this report.
5.31 Major airspace change programmes, such as LAMP or NTCA, will cover multiple airports including those within and outside of this study. Therefore the costs of the major airspace change programmes are spread across a wider set of stakeholders than those generating the expected benefits included in this report. The full cost of these programmes has been included as it is not possible to ascertain the specific cost of these programmes to each of the airport locations included in this study.
5.32 Additionally, stakeholders transiting through a designated PBN airspace volume may also require PBN capability. This extends the number of airspace users required to equip with the necessary PBN capability in order to achieve the expected benefits at the airports included in this study. The costs in this study attempt capture these users as best as possible based on current information in section 8.
5.33 Therefore the coverage of benefits and costs across stakeholders is not perfectly aligned with the expected benefits capturing a smaller subset of stakeholders compared to the expected costs. However, it was deemed more important to capture the costs imposed on other airspace users even if the benefits they would achieve were too small or not able to be measured in a comparable way to the airports included in this study.
Transition Altitude (TA)5.34 In order to achieve the aims of both the LAMP and NTCA programmes
a change to the TA level across the UK is needed. TA is the altitude at or below which the vertical position of an aircraft is normally controlled by reference to altitude. The TA at most major airports in the UK is 6,000 ft and in the Manchester Terminal Manoeuvring Area (TMA) area it is 5,000ft. At most minor aerodromes and for most uncontrolled airspace the TA is 3,000 ft. In Ireland the TA for major airports is 5,000 ft. The

CAP 1062 Section 5: CCO Assumptions
July 2013 Page 28
current situation is therefore confusing and has the potential to result in altimeter setting errors. For those aircraft that climb quickly the problem is exacerbated by creating a high workload for a relatively low TA and has the potential for continuing safety implications if not resolved.
5.35 The CAA published a consultation document in January 2012 related to the policy to raise and harmonise the TA both inside and outside controlled airspace (CAS) in the London and Scottish Flight Information Regions (FIRs) at 18,000 ft. With due regard to feedback from the first consultation and further discussions and work on the issues around the TA, a second CAA consultation will likely be conducted in Spring 2014 at the earliest.
LAMP 5.36 The LAMP programme considers a fundamental redesign of the
terminal airspace at a network level, above circa 4,000 ft and will improve the route network and remove stack holding in normal operations freeing up valuable airspace capacity. More precise, systemised, departure and arrival procedures will be implemented to capitalise on the available airspace thereby enabling the systemised CCOs required to realise the expected benefits in this study.
5.37 The LAMP programme includes Heathrow, Gatwick, Stansted, Luton, London City and Birmingham airports.
NTCA 5.38 In the NTCA environment traffic levels are lower and there is more
spare capacity, which enables a higher tactical CCO performance level currently. Nevertheless the redesign of NTCA route network presents similar opportunities to systemise CCOs and achieve the expected benefits estimated as part of this study. A NTCA redesign would include Manchester and Liverpool airports.
Other airspace redesign costs5.39 Airspace redesigns at Edinburgh, Glasgow, Bristol and Newcastle
airports would not be included in the LAMP or NTCA redesign programmes, and therefore this study assumes that the necessary airspace changes would be implemented at these airports to facilitate fully systemised CCOs.
CAP 1062 Section 5: CCO Assumptions
July 2013 Page 29
Aircraft categories
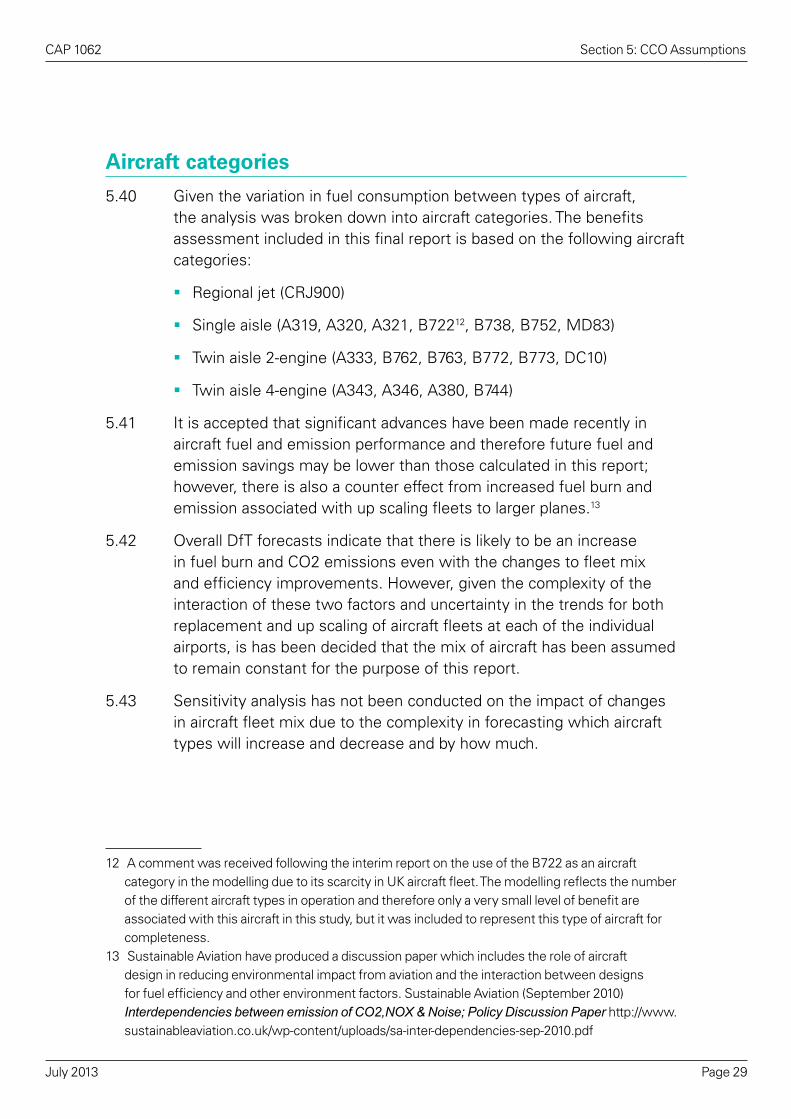
5.40 Given the variation in fuel consumption between types of aircraft, the analysis was broken down into aircraft categories. The benefits assessment included in this final report is based on the following aircraft categories:
�� Regional jet (CRJ900)
�� Single aisle (A319, A320, A321, B72212, B738, B752, MD83)
�� Twin aisle 2-engine (A333, B762, B763, B772, B773, DC10)
�� Twin aisle 4-engine (A343, A346, A380, B744)
5.41 It is accepted that significant advances have been made recently in aircraft fuel and emission performance and therefore future fuel and emission savings may be lower than those calculated in this report; however, there is also a counter effect from increased fuel burn and emission associated with up scaling fleets to larger planes.13
5.42 Overall DfT forecasts indicate that there is likely to be an increase in fuel burn and CO2 emissions even with the changes to fleet mix and efficiency improvements. However, given the complexity of the interaction of these two factors and uncertainty in the trends for both replacement and up scaling of aircraft fleets at each of the individual airports, is has been decided that the mix of aircraft has been assumed to remain constant for the purpose of this report.
5.43 Sensitivity analysis has not been conducted on the impact of changes in aircraft fleet mix due to the complexity in forecasting which aircraft types will increase and decrease and by how much.
12 A comment was received following the interim report on the use of the B722 as an aircraft category in the modelling due to its scarcity in UK aircraft fleet. The modelling reflects the number of the different aircraft types in operation and therefore only a very small level of benefit are associated with this aircraft in this study, but it was included to represent this type of aircraft for completeness.
13 Sustainable Aviation have produced a discussion paper which includes the role of aircraft design in reducing environmental impact from aviation and the interaction between designs for fuel efficiency and other environment factors. Sustainable Aviation (September 2010) Interdependencies between emission of CO2,NOX & Noise; Policy Discussion Paper http://www.sustainableaviation.co.uk/wp-content/uploads/sa-inter-dependencies-sep-2010.pdf

CAP 1062 Section 5: CCO Assumptions
July 2013 Page 30
Calculating flight efficiency and CO2 savings
5.44 The primary quantifiable benefits from CCOs have been identified as flight efficiency benefits (fuel and time savings) and the associated environmental benefits from more efficient flight plans (CO2and noise).
5.45 The calculation of the difference in fuel burn was evaluated based on ICAO guidance on ensuring a common measurement point14. Fuel burn comparisons can only be evaluated once the aircraft on a stepped climb and the aircraft on a continuous climb have reached a common point, and beyond that everything else is the same. After departure the first common point (in terms of speed, height and distance) is an adjusted top of climb, which ICAO refer to as ‘Point X’ and is depicted in figure 2 below.
Figure 2 – ICAO recommended adjusted top of climb (Point X) comparison measurement15
14 ICAO (2008) ICAO Circular 317: Effects of PAN-OPS Noise Abatement Departure Procedures on Nose and Gaseous Emissions.
15 ICAO (2008) ICAO Circular 317: Effects of PAN-OPS Noise Abatement Departure Procedures on Nose and Gaseous Emissions; Figure 4.1.

CAP 1062 Section 5: CCO Assumptions
July 2013 Page 31
5.46 The fuel, CO2 and time savings benefits were then calculated by the CAA’s ERCD from baseline radar data using the BADA 3.9 model16. BADA 3.9 is a theoretical model to estimate fuel burn and therefore may not be as accurate as the manufacturers’ models, but it was chosen for this study as the most consistent method for estimating the benefits across the many different types of aircraft operating at UK airports.
5.47 The benefits from CCOs have been calculated for each aircraft type by taking the difference in flight efficiency between the baseline performance level and that which has been estimated using the BADA 3.9 model under a fully systemised CCO for each aircraft type. This saving has then been extrapolated across the increase in the number of CCOs that would be expected again for each aircraft type based on the existing aircraft fleet mix. The fuel, time and CO2 savings for each aircraft type have then been aggregated according to the total number of departures to generate a 2011 baseline saving. This saving is the extrapolated into future years using the assumptions detailed in the rest of this section. Annex F includes a breakdown of these calculations for Heathrow to illustrate how the expected benefits have been derived.
5.48 It is important to note that the fuel savings calculations do not include additional fuel efficiency savings that aircraft operators would make from uploading less fuel than they would have previously. Aircraft operators are required to carry fuel to cover the entire flight plan, plus contingency, and if they are able to plan for systemised CCOs they may be able to lower the amount of fuel they uplift to the aircraft. This reduces the weight of the aircraft, which in turn reduces fuel burn.
5.49 Data from industry workshops held in May 2012 was used to compare industry estimates to the modelling used in this study. Any differences were generally found to be down to differences in the approach taken to calculate the benefit or due to data being estimated directly from the manufacturer’s modelling rather than the theoretical model used in this report. It was found that the manufacturer’s models tended to produce higher expected benefits than those estimated using the BADA 3.9 model in this study and therefore this study potentially reflects a more conservative picture of potential fuel burn and time savings.
16 http://www.eurocontrol.int/eec/public/standard_page/proj_BADA_documents_39.html (last accessed 29 August 2012)
CAP 1062 Section 5: CCO Assumptions
July 2013 Page 32
Air Traffic Demand
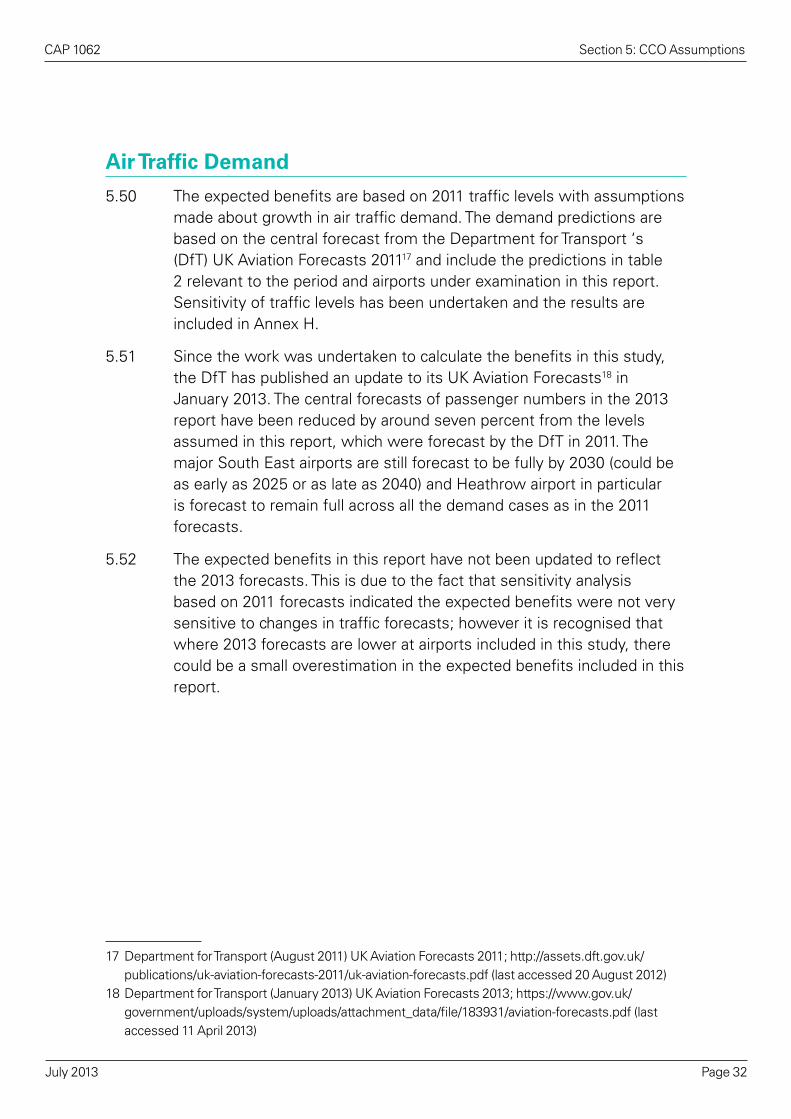
5.50 The expected benefits are based on 2011 traffic levels with assumptions made about growth in air traffic demand. The demand predictions are based on the central forecast from the Department for Transport ‘s (DfT) UK Aviation Forecasts 201117 and include the predictions in table 2 relevant to the period and airports under examination in this report. Sensitivity of traffic levels has been undertaken and the results are included in Annex H.
5.51 Since the work was undertaken to calculate the benefits in this study, the DfT has published an update to its UK Aviation Forecasts18 in January 2013. The central forecasts of passenger numbers in the 2013 report have been reduced by around seven percent from the levels assumed in this report, which were forecast by the DfT in 2011. The major South East airports are still forecast to be fully by 2030 (could be as early as 2025 or as late as 2040) and Heathrow airport in particular is forecast to remain full across all the demand cases as in the 2011 forecasts.
5.52 The expected benefits in this report have not been updated to reflect the 2013 forecasts. This is due to the fact that sensitivity analysis based on 2011 forecasts indicated the expected benefits were not very sensitive to changes in traffic forecasts; however it is recognised that where 2013 forecasts are lower at airports included in this study, there could be a small overestimation in the expected benefits included in this report.
17 Department for Transport (August 2011) UK Aviation Forecasts 2011; http://assets.dft.gov.uk/publications/uk-aviation-forecasts-2011/uk-aviation-forecasts.pdf (last accessed 20 August 2012)
18 Department for Transport (January 2013) UK Aviation Forecasts 2013; https://www.gov.uk/government/uploads/system/uploads/attachment_data/file/183931/aviation-forecasts.pdf (last accessed 11 April 2013)

CAP 1062 Section 5: CCO Assumptions
July 2013 Page 33
Table 2 –DfT ATM Forecasts (000s) at UK airports (central forecast) 19
Airport 2010 2030 Average annual growth 2011-2020
Heathrow 450 480 0.3%
Gatwick 230 260 0.7%
Manchester 150 280 4.3%
Stansted 140 260 4.3%
Birmingham 85 210 7.4%
Glasgow 70 75 0.4%
Luton 75 130 3.7%
Edinburgh 100 190 4.5%
Newcastle 50 55 0.5%
Liverpool John Lennon
45 55 1.1%
London City 65 120 4.2%
Bristol 55 85 2.7%
Airport Capacity
5.53 This study assumes that no new runway capacity is available in the UK in the period covered to 2030, but that airports continue to develop to maximum use of their current potential runway capacities. This is consistent with the modelling assumptions used by the DfT in developing their UK Aviation Forecasts described above.
5.54 The complexity of UK airspace, particularly in the South East of England, means that changes to airport capacity or throughput may have an impact on the ability to offer CCOs in some parts of the airspace. Therefore, if there were to be significant change in airport capacity in the South East of England, the benefits included in this report may need to be reassessed.
19 Department for Transport (August 2011) UK Aviation Forecasts 2011; table H.3, page 160, central forecast.

CAP 1062 Section 5: CCO Assumptions
July 2013 Page 34
Fuel prices
5.55 Fuel prices have been based on the 2011 average jet fuel prices handled by IATA €710 per tonne or £618 per tonne as recommended by Eurocontrol20. Fuel price inflation is covered in section 5.13.
Passenger time
5.56 As described by Eurocontrol the passenger value of time is an opportunity cost, which corresponds to the monetary value associated with a traveller (passenger) during a journey. It is essentially, how much a traveller would be willing to pay in order to save time during a journey (e.g. by travelling on a quicker service or a faster mode), or how much ‘compensation’ they would accept, directly or indirectly, for ‘lost time’.
5.57 The value of passenger time savings from fully systemised CCOs has been estimated using the Eurocontrol recommended value for passenger opportunity cost of €43.8 per minute or £38.01 per minute21.
5.58 It is recognised that there has been significant discussion about the use of passenger time savings for small increments of time, and whether or not they should be valued at lower rates than larger increments. It is argued that there is greater difficulty in making effective use of smaller increments of time savings, particularly when unanticipated. However, as supported by the FAA the theoretical and empirical knowledge does not appear to support valuing small increments of time less than larger ones. Therefore, even though the average times savings per flight from fully systemised CCOs are smaller increments it is felt to be appropriate to capture this value to passengers.
Delay cost savings
5.59 The value of time to aircraft operators resulting from fully systemised CCOs has been estimated based on the Eurocontrol recommended value for delay costs22. The savings has been approximated based on
20 EUROCONTROL (Feb 2012) Standard Inputs for EUROCONTROL Cost Benefit Analyses.21 EUROCONTROL (Feb 2012) Standard Inputs for EUROCONTROL Cost Benefit Analyses. http://
www.eurocontrol.int/documents/standard-inputs-eurocontrol-cost-benefit-analyses Based on base scenario value for passenger opportunity cost of €43.8 per minute and converted to £ based on EUROCONTROL exchange rate conversion for 2011 of £1.152475.
22 EUROCONTROL (Feb 2012) Standard Inputs for EUROCONTROL Cost Benefit Analyses. http://www.eurocontrol.int/documents/standard-inputs-eurocontrol-cost-benefit-analyses

CAP 1062 Section 5: CCO Assumptions
July 2013 Page 35
the strategic delay figure for the airborne stage of flight figure minus the fuel costs estimate savings as this has been calculated separately. Although the airborne delay cost is technically considered to exclude the climb phase the values have been considered as an appropriate proxy for the savings.
5.60 The figure used for 2011 was €31.1 per minute or £26.99 per minute23.
Carbon prices
5.61 Carbon prices has been estimated based on the Department for Environment and Climate Change (DECC)’s central carbon value for the traded sector24.
5.62 DECC has updated the carbon prices for traded sectors following the modelling undertaken to calculate the estimated benefits included in this report, which has reduced the value of the short term traded carbon prices most significantly in the early years of this study with the values in the later years returning to the level of the estimates included in this study.
5.63 It is acknowledged that this results in an overestimation of the benefits from carbon savings in this study; however as carbon savings make up approximately two per cent of the total estimated benefits it was not deemed necessary to update the figures included in this report at this time.
Price levels
5.64 The figures in the final report are based on constant 2011 prices, and therefore no assumptions have been made about general price increases in the future.
5.65 However, fuel prices have been relatively volatile in recent years and jet fuel prices are forecast to increase on average by a real 2.4 per cent per year from 2010 to 2035 according to the Annual Energy Outlook
23 Based on the EUROCONTROL recommend value for delay costs for the Base Scenario for a Strategic Airborne delay, minus the fuel costs, of €31.1 per minute and converted to £ based on EUROCONTROL exchange rate conversion for 2011 of £1.152475 (£26.99).
24 Based on £13 for central carbon value for traded sector for 2011 in 2011 prices. DECC (October 2011) A brief guide to the carbon valuation methodology for UK policy appraisal. http://www.decc.gov.uk/en/content/cms/emissions/valuation/valuation.aspx#
CAP 1062 Section 5: CCO Assumptions
July 2013 Page 36
2012 published by the U.S Energy Information Administration25. Real fuel prices increases of 2.4 per cent per year have been included in this study.
5.66 Sensitivity analysis for real fuel price inflation has been undertaken in Annex H.
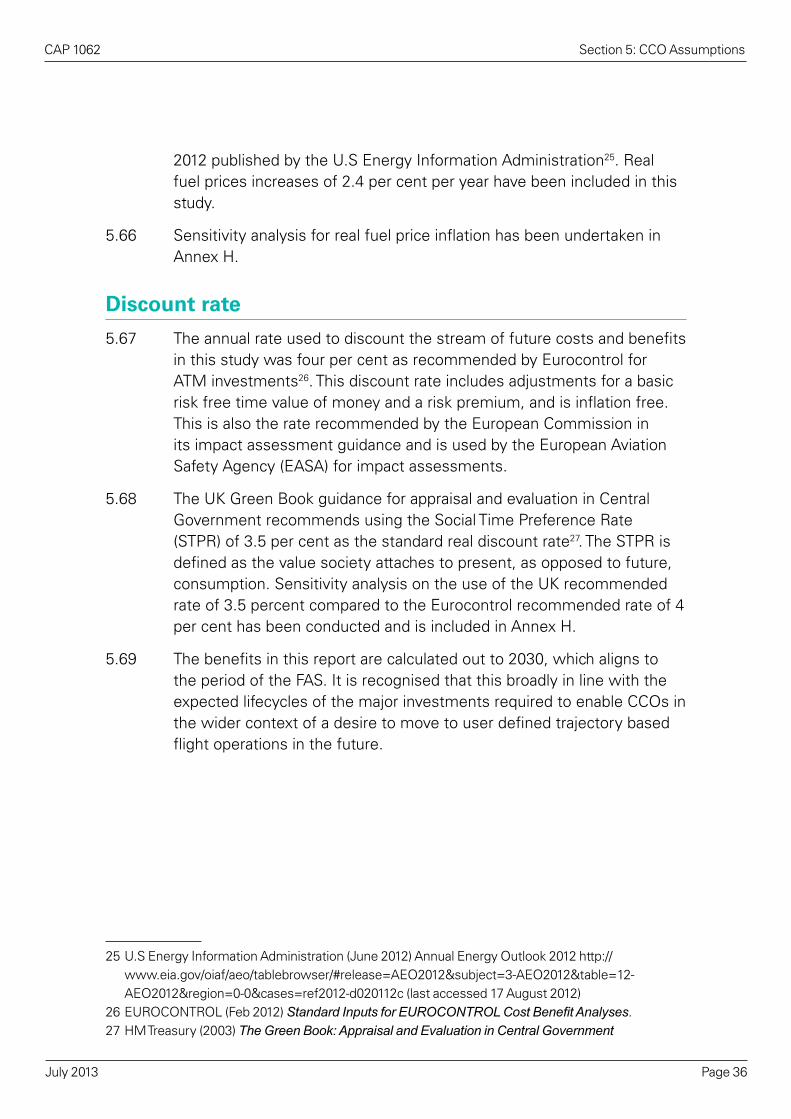
Discount rate
5.67 The annual rate used to discount the stream of future costs and benefits in this study was four per cent as recommended by Eurocontrol for ATM investments26. This discount rate includes adjustments for a basic risk free time value of money and a risk premium, and is inflation free. This is also the rate recommended by the European Commission in its impact assessment guidance and is used by the European Aviation Safety Agency (EASA) for impact assessments.
5.68 The UK Green Book guidance for appraisal and evaluation in Central Government recommends using the Social Time Preference Rate (STPR) of 3.5 per cent as the standard real discount rate27. The STPR is defined as the value society attaches to present, as opposed to future, consumption. Sensitivity analysis on the use of the UK recommended rate of 3.5 percent compared to the Eurocontrol recommended rate of 4 per cent has been conducted and is included in Annex H.
5.69 The benefits in this report are calculated out to 2030, which aligns to the period of the FAS. It is recognised that this broadly in line with the expected lifecycles of the major investments required to enable CCOs in the wider context of a desire to move to user defined trajectory based flight operations in the future.
25 U.S Energy Information Administration (June 2012) Annual Energy Outlook 2012 http://www.eia.gov/oiaf/aeo/tablebrowser/#release=AEO2012&subject=3-AEO2012&table=12-AEO2012®ion=0-0&cases=ref2012-d020112c (last accessed 17 August 2012)
26 EUROCONTROL (Feb 2012) Standard Inputs for EUROCONTROL Cost Benefit Analyses.27 HM Treasury (2003) The Green Book: Appraisal and Evaluation in Central Government

CAP 1062 Section 6: CCO Benefits
July 2013 Page 37
6SECTION 6
CCO Benefits
6.1 This section describes the quantitative and qualitative expected benefits from fully systemised CCOs at the airports included in this study.
Quantified fuel efficiency, CO2 and time savings
Table 3 - Traffic, fuel burn and time savings; all airports (out to 2030)
Airport 2011 departures
2011 CCO %
2011 savings
CCO Scenario
1 (2016-2030)
CCO Scenario 2 (2016-
2030)
CCO Scenario 3 (2016-
2030)
Heathrow 233,172 39.6% £8.73m £96.6m £96.6m £67.6m
Gatwick 125,517 59.8% £1.77m £19.5m £16.5m £16.5m
Stansted 73,468 46.6% £1.51m £19.3m £14.2m £19.3m
Luton (73,468) (46.6%) £1.0m £12.5m £9.2m £12.5m
Manchester 79,131 89.8% £0.34m £4.3m £4.3m £4.3m
London City 66,129 4.3% £1.68m £19.9m £19.9m £14.4m
Birmingham 45,102 90.2% £0.13m £1.8m £1.8m £1.8m
Glasgow (45,102) (90.2%) £0.13m £1.4m £1.4m £1.4m
Edinburgh (45,102) (90.2%) £0.13m £1.7m £1.7m £1.7m
Liverpool John Lennon
(45,102) (90.2%) £0.07m £0.7m £0.7m £0.7m
Newcastle (45,102) (90.2%) £0.07m £0.7m £0.7m £0.7m
Bristol (45,102) (90.2%) £0.07m £0.8m £0.8m £0.8m
TOTAL (£) £15.64m £179.2m £167.8m £141.8m
6.2 The benefits listed in table 3 above represent the maximum possible benefits with fully systemised CCOs in the theoretical baseline year of 2011 and for the three main scenarios out to 2030. Annex F includes a more detailed breakdown of the expected benefits that could have been achieved in 2011 with full CCO implementation.

CAP 1062 Section 6: CCO Benefits
July 2013 Page 38
6.3 For the average individual flight out of Heathrow, for example, the benefit equates to a saving of 37 kg of fuel (0.04 metric tonnes) and 38 seconds. Whilst these figures are small for each individual flight, the benefits accumulate quickly as benefits are gained for every flight departing from UK airports, of which there were over 2 million in the UK in 201128.
6.4 Logically, total benefits are highest for CCO scenario 1 where all airports implement full CCOs by 2016, and decrease in CCO scenarios 2 and 3 where implementation is staged with high benefit airports, such as Heathrow and London City, implemented respectively at the beginning or the end of period. The delay of high benefit airports from the beginning of implementation, scenario 2, to the end of implementation, scenario 3, results in a loss of over £25 million over the period to 2030 or almost 20 per cent.
6.5 Potential benefits for London airports represent approximately 94 per cent of total UK expected benefits, with Heathrow alone comprising around 56 per cent of total UK benefits. Therefore the timing for the implementation of CCOs at London airports and at Heathrow in particular has a significant impact on the level of expected benefits across the UK as a whole.
6.6 Sensitivity analysis was carried out on the CCO performance level achieved, traffic growth forecasts and the discount rate, and the details can be found in Annex H. Expected benefits were most sensitive to the CCO performance level achieved with 100 per cent systemised CCO performance level generating expected benefits 60 or 230 per cent greater than expected benefits generated at 80 per cent and 60 per cent systemised CCO performance levels respectively. Conversely, a 20 per cent decrease in systemised CCO performance (100% to 80%) resulted in a 40 per cent decrease in expected benefits, and a 40 per cent decrease in systemised performance (100% to 60% CCO achievement) resulted in a 70 per cent decrease in expected benefits.
6.7 The use of a lower discount rate resulted in a minor increase in expected benefits. Expected benefits figures are up to 6.5 per cent higher using the lower 3.5 per cent discount rate as recommended for UK appraisals and evaluations compared to the Eurocontrol recommended figure of 4.0 per cent.
28 NATS UK flights, total movements 2011/12; http://www.nats.co.uk/about-us/operational-performance/

CAP 1062 Section 6: CCO Benefits
July 2013 Page 39
6.8 A change in traffic growth figures from central to low forecasts has an even lesser impact, with less than one per cent decrease in the expected benefit estimate from using the low traffic growth forecast compared to the central growth forecast.
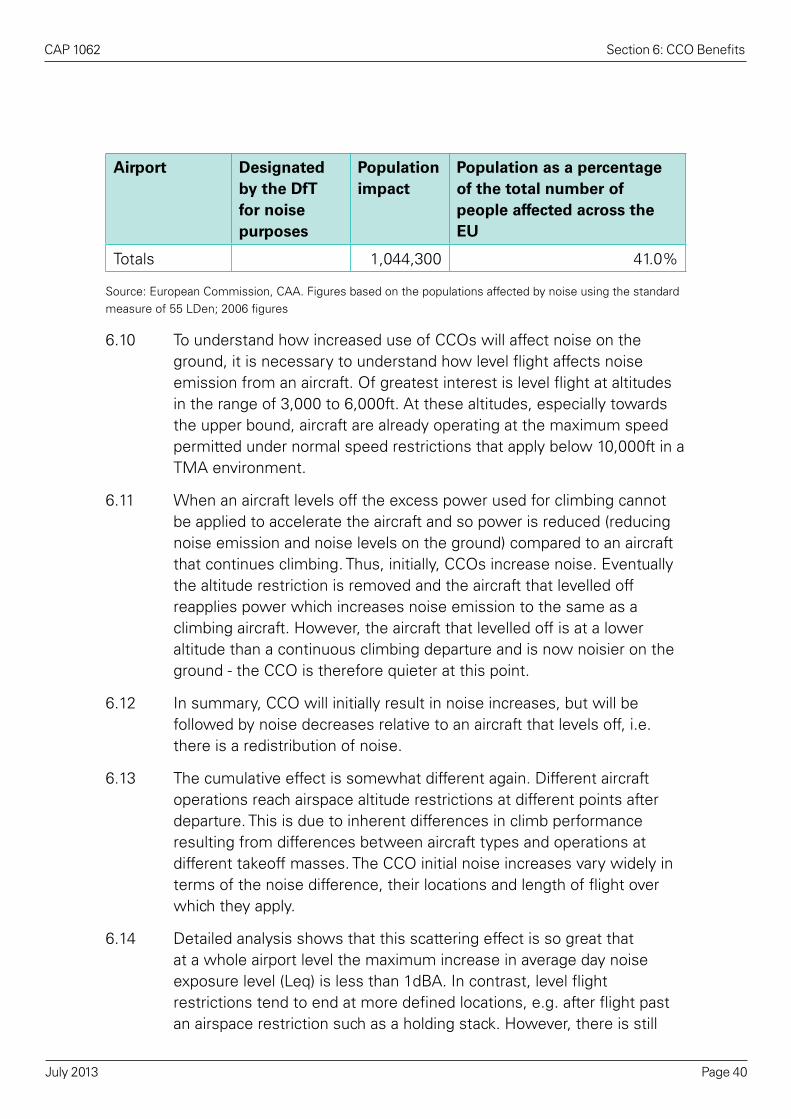
Noise Benefits
6.9 Heathrow airport generates the vast majority of the noise impact across the UK, and a significant proportion of the noise impact in the EU. Table 4 shows the noise impact distribution for UK airports.
Table 4 – Noise impact distribution for top fifteen UK airports by population affected by noise at the European level29
Airport Designated by the DfT for noise purposes
Population impact
Population as a percentage of the total number of people affected across the EU
Heathrow * 725,500 28.5%
Manchester 94,000 3.7%
Glasgow 63,600 2.5%
Birmingham 47,900 1.9%
Aberdeen 16,300 0.6%
Edinburgh 15,000 0.5%
London City 12,200 0.5%
Southampton 12,100 0.5%
Gatwick * 11,900 0.5%
East Midlands 10,500 0.4%
Stansted * 9,400 0.4%
Luton 8,600 0.3%
Leeds Bradford 8,400 0.3%
Newcastle 5,900 0.2%
Liverpool John Lennon
5,700 0.2%
29 CAA (2011) Aviation Policy for the Environment Insight Note (p.22); http://www.caa.co.uk/docs/589/CAA_InsightNote2_Aviation_Policy_For_The_Environment.pdf
CAP 1062 Section 6: CCO Benefits
July 2013 Page 40
Airport Designated by the DfT for noise purposes
Population impact
Population as a percentage of the total number of people affected across the EU
Totals 1,044,300 41.0%
Source: European Commission, CAA. Figures based on the populations affected by noise using the standard measure of 55 LDen; 2006 figures
6.10 To understand how increased use of CCOs will affect noise on the ground, it is necessary to understand how level flight affects noise emission from an aircraft. Of greatest interest is level flight at altitudes in the range of 3,000 to 6,000ft. At these altitudes, especially towards the upper bound, aircraft are already operating at the maximum speed permitted under normal speed restrictions that apply below 10,000ft in a TMA environment.
6.11 When an aircraft levels off the excess power used for climbing cannot be applied to accelerate the aircraft and so power is reduced (reducing noise emission and noise levels on the ground) compared to an aircraft that continues climbing. Thus, initially, CCOs increase noise. Eventually the altitude restriction is removed and the aircraft that levelled off reapplies power which increases noise emission to the same as a climbing aircraft. However, the aircraft that levelled off is at a lower altitude than a continuous climbing departure and is now noisier on the ground - the CCO is therefore quieter at this point.
6.12 In summary, CCO will initially result in noise increases, but will be followed by noise decreases relative to an aircraft that levels off, i.e. there is a redistribution of noise.
6.13 The cumulative effect is somewhat different again. Different aircraft operations reach airspace altitude restrictions at different points after departure. This is due to inherent differences in climb performance resulting from differences between aircraft types and operations at different takeoff masses. The CCO initial noise increases vary widely in terms of the noise difference, their locations and length of flight over which they apply.
6.14 Detailed analysis shows that this scattering effect is so great that at a whole airport level the maximum increase in average day noise exposure level (Leq) is less than 1dBA. In contrast, level flight restrictions tend to end at more defined locations, e.g. after flight past an airspace restriction such as a holding stack. However, there is still

CAP 1062 Section 6: CCO Benefits
July 2013 Page 41
sufficient scattering due to restrictions being removed at different points, that the cumulative Leq noise decreases, likewise do not exceed 1dBA.
6.15 In terms of placing a value on these changes, the Department for Transport’s Transport Appraisal Guidance, webTAG, provides a methodology for monetising the annoyance associated with a level of noise exposure. Applied to Heathrow, with a case of 100 percent fully systemised CCO compared with current use, the increases and decreases described above were found to result in a small net saving in the monetary value of noise annoyance.
6.16 We caution, however, that this was driven by the webTAG methodology placing values on noise decreases at very low exposure levels, which are subject to a very high level of uncertainty. A more robust conclusion is that the overall effect is neutral.
Safety
6.17 Safety benefits have been described associated with the reduction in the number of instructions that would need to be passed from air traffic controller to pilot with systemised CCOs, which could lead to a reduction in the number of level busts that occur each year. The benefits from this could be estimated from taking the number of level busts in 2011 and then applying a proportionate reduction in the probability of that occurrence based on the reduction in the number of instructions passed from controller and pilot.
6.18 However, the safety benefit from a potential reduction in level busts30 and the reduction of interactions between the controller and pilot cannot be taken in isolation from the overall safety impact on the air traffic environment as a whole network. The implications of systemised CCO operations on the safety levels of the entire network would require a full concept of operations to be known and simulated, which is not currently available. Quantifying such a safety benefit in monetary terms is difficult but work could be done to explore measuring it in terms of loss of life or hull loss calculations in the future.
30 A level bust is defined as any unauthorised vertical deviation of more than 300 feet from an ATC flight clearance. A level bust occurs when an aircraft fails to fly at the level to which it has been cleared, regardless of whether actual loss of separation from other aircraft or the ground results.

CAP 1062 Section 6: CCO Benefits
July 2013 Page 42
Access to controlled airspace
6.19 The objective of airspace redesigns to move to more efficient departures and arrivals, which includes the introduction of systemised CCOs as well as continuous descent operations (CDOs), has a genuine potential to release volumes of controlled airspace at lower levels because aircraft climb quicker on departure and fly at higher levels for longer on arrival. The release of controlled airspace particularly at lower levels around airports is a significant benefit to the general aviation community31.
6.20 Placing a value on a volume of airspace is complex as it is highly dependent on several factors particular to a volume of airspace including, but not limited to, the location, class of airspace created or released, impact of the surrounding airspace on its use, potential users and traffic including whether the freed airspace volume is likely to enable new activity or redistributes activity from other areas.
6.21 A release, or creation, of controlled airspace could either fundamentally change operations in the area, such as enabling new activity where it was previously not feasible, or it could increase the efficiency of the use of that airspace by alleviating previous choke points. In the case where a release of controlled airspace created new general aviation activity in an area, a value for that airspace volume could be inferred by estimating the level of general aviation activity that could now be carried out and the value it would have to the users; perhaps related to reduced travel costs for a user if they are able to operate closer to home or an inherent value from operating in a different type of environment. However, the implications of that new activity would also have to be factored in such as any changes in noise or emission levels or any distributional impacts if that activity was previously carried out elsewhere. It is worth noting that it is very difficult to measure the noise of general aviation aircraft in transit at low levels and there are not accepted metrics to capture this impact.
6.22 In the case where a release of controlled airspace enables a more efficient use of uncontrolled airspace, the value of that released airspace volume could be inferred by estimating the fuel, emission or time savings from the more efficient operations; however, it is possible
31 The CAA released a policy statement on the Release of Controlled and Segregated Airspace in 2010 and invited National Air Traffic Management Advisory Committee (NATMAC) members to propose areas for the return of controlled airspace to class G; however to date the CAA have not been approached with any proposals.

CAP 1062 Section 6: CCO Benefits
July 2013 Page 43
that the change could also create new choke points or inefficiencies and if this were to occur the consequences of these would have to be factored in as well. This is further complicated by the lack of reliable and accurate data on usage levels of particular portions of uncontrolled airspace.
6.23 For the purpose of this exercise, it is not possible to determine the volumes of controlled airspace that could be released and the general aviation communities that would benefit from CCOs as the details of major airspace redesigns are not currently known. However, there is recent evidence of controlled airspace being released where it was been determined that it was not vital to operational air traffic control efficiency in 2011. NATS and the British Gliding Association identified a 1000ft vertical segment of the southern LTMA Class A controlled airspace that was no longer required to support London Gatwick Airport operations. Following a successful airspace change proposal it has been estimated that approximately 15 cubic nautical miles had been released back to Class G airspace, where there is considerable demand from both the powered and particularly un-powered aviation community.
ATC workload / sector capacity increase
6.24 It has also been suggested that the expansion of systemised CCOs could reduce the workload of air traffic controllers thereby increasing the capacity in the sector; however, as mentioned in the safety section above, there are potentially offsetting factors for ATC workload which have yet to be fully identified and simulated. Therefore at this stage it is not possible to provide a definitive assessment of the impact on ATC sector capacity.
6.25 Systemised airspace design would ensure that climb profiles are as close to optimal as possible and are not dependent on available ATC capacity to re-clear aircraft to higher levels. As a consequence aircraft spend a lower portion of time in stepped-climbs at sub-optimal levels.
Benefits at airports not included in this study
6.26 Aberdeen, East Midlands International, Belfast International, Belfast City and Southampton airports were not able to be included in the study due to lack of comparable information to generate expected benefits. Based on the results generated for the airports included in this study a very broad approximation of the expected benefits at these excluded airports for the CCO baseline year and the CCO scenarios is included in

CAP 1062 Section 6: CCO Benefits
July 2013 Page 44
table 5. It should be noted that this approximation is based only on the results at airports included in this study with a similar level of ATMs. It does not reflect the fleet mix at these airports or the likely current CCO performance level.
Table 5 – Broad approximation of expected benefits at airports not able to be included in study due to lack of comparable information
Airport Based on 2011 savings
CCO Scenario
1 (2016-2030)
CCO Scenario 2 (2016-
2030)
CCO Scenario 3
(2016-2030)
Aberdeen Edinburgh £0.13m £1.7m £1.7m £1.7m
East Midlands International
Birmingham £0.13m £1.8m £1.8m £1.8m
Belfast International
Newcastle £0.07m £0.7m £0.7m £0.7m
Belfast City Newcastle £0.07m £0.7m £0.7m £0.7m
Southampton Bristol £0.07m £0.8m £0.8m £0.8m
TOTAL (£) £0.47m £5.7m £5.7m £5.7m
6.27 Other airports not included in the study will be impacted by the changes at the major commercial UK airports. Airports with lower levels of commercial air transport activity may not receive the same direct benefits from fully systemised CCOs as they will already generally have a better climb performance level.
6.28 However, other airports and aircraft operators may realise a different set of benefits. For example, there are potential safety and operational benefits associated with a greater availability of PBN capabilities and a raised and harmonised TA that are not related directly to CCOs, such as a reduction in controlled flight into terrain (CFIT) incidents, resilience to weather conditions and cost savings from not having to replace expensive ground based navigational infrastructure.

CAP 1062 Section 7: Direct CCO Costs (operations at airports included in this study)
July 2013 Page 45
7SECTION 7
Direct CCO Costs (operations at airports included in this study)
Attributing costs
7.1 The main costs identified for systemised CCOs have been aircraft equipage and certification associated with Performance Based Navigation (PBN) capabilities and airspace redesign and consultation costs to incorporate CCOs into air traffic procedures and SIDs.
7.2 In the case of aircraft equipage and certification costs, it is important to recognise that there are varying degrees to which operators will face costs in this area depending on their existing fleet capability level. For example, some aircraft may require both equipment upgrade and necessary certification, some aircraft may already be equipped but will face certification costs, and some aircraft may already carry the equipment and be certified to operate that equipment.
7.3 Whilst PBN capability and airspace redesign may be required to move to a systemised CCO air traffic environment, both facilitate other improvements such as enabling better arrivals or more free-routeing of aircraft. Therefore, it is neither appropriate to include the full costs associated with them as enabling CCOs is not the sole or primary object of the investment; nor is it appropriate to exclude any associated costs as they form a substantial objective in their own right to be considered an incidental or “free” benefit of other improvements.
7.4 A partial attribution is most appropriate and could be done in two ways. Firstly, the costs could be attributed on a percentage basis. This is probably the best treatment for attributing the costs of aircraft equipage and certification, where CCOs is generally one of three improvement categories enabled through PBN capability (continuous descent operations (CDOs) and enabling more accurate routeing of aircraft being the other two) and could be said to require one third of the equipage investments.
7.5 Secondly, costs could be attributed on a unit or component basis, where individual components to a project could be separately identified and applied to a different improvement. Airspace redesign costs could fit

CAP 1062 Section 7: Direct CCO Costs (operations at airports included in this study)
July 2013 Page 46
best with this process if SID redesign and consultation costs could be separated from other improvements included in the airspace redesign, which is most likely the case for lower level airspace redesigns undertaken by individual airports. However, given the complexity of airspace redesign costs for large airspace modernisation programmes, such as LAMP or NTCA, a component based approach may not be most appropriate.
7.6 In this study, a percentage based approach has been used to assign the costs of aircraft equipage and the costs of major airspace redesign programmes, and a component based approach for lower level airspace redesigns by individual airports. PBN capability equipage costs directly attributable to fully systemised CCOs has been assumed to represent one third of total estimated PBN equipage costs. Lower level airport airspace redesign costs for airports have been estimated to include only SID redesign and associated local consultation costs. Airspace redesign costs directly attributable to CCOs for the major airspace redesign programmes by NATS, LAMP and NTCA, have been assumed to form approximately one third of the total modernisation programme costs. This is based on the assumption that these programmes generally attempt to enable systemised CCOs, systemised CDOs and reduced stack holding (where applicable), and more efficient lateral routings. Transition Altitude (TA) airspace redesign costs directly attributable to fully systemised CCOs have been assumed to form approximately one half of the total TA programme costs.
7.7 It is recognised that these assumptions have been made on a simplistic basis and may not reflect the true cost of enabling fully systemised climbs; however, it was necessary to make some apportionment of the costs and this was felt to be the best approach.
Aircraft equipage – Performance Based Navigation (PBN)
7.8 As mentioned in section 5.1, although a continuous climb can be facilitated without specific PBN capability, this study has assumed that airspace changes to implement fully systemised CCOs will require a RNAV1 level of PBN capability. In order to understand the operator fleet capability in the UK and to identify operator upgrade plans, the CAA conducted a PBN capability survey in 2010, which included an assessment of current fleet RNAV1 capability32.
32 The results of the CAA PBN capability study have not been formally published but are available on request

CAP 1062 Section 7: Direct CCO Costs (operations at airports included in this study)
July 2013 Page 47
7.9 The survey looked at capability by airports and Airport Groups derived from aircraft capability data and flight plan traffic for a sample taken in UK airspace during summer 2010 (1 June 2010 to 30 September 2010). The data available to the CAA was the flight plan data collected by NATS from the summer of 2010, assessed against the fleet survey that was produced by the CAA and NATS from material available from IATA and Eurocontrol. This included a number of assumptions as to capability of aircraft types based on the date of manufacture and the know production configuration.
7.10 The numbers for RNAV1 capability are based on numbers of movement by a given aircraft capability operating into or out of an airport. This does not necessarily imply that a given operator has an operational approval. In the absence of aircraft fleet data assumptions were made based on the age of the aircraft and the manufacturer’s specifications. Business jets are more bespoke and therefore no assumptions were made about these aircraft types. Military aircraft were not included in the study as the Ministry of Defence is conducting its own assessment of PBN capability and is covered below; although we are aware that types such as the Boeing C-17 Globemaster and Airbus Voyager (A330) and future Airbus A400M will be capable to a degree.
7.11 Annex I includes the estimated baseline RNAV1 capability level by airport group across the UK. The survey highlighted that there is generally a high level of RNAV1 capability, with capability levels highest in the airport groups with the larger commercial aviation airports. Most applicable to this study, the London, Manchester and Scottish airport groups have the highest capability levels of 93, 90 and 90 per cent capable respectively.
7.12 Table 6 shows, shows estimated capability levels in more detail at the individual airports in the London and Northern Terminal Areas, which have been assumed to require RNAV1 capability in order to achieve systemised CCOs.

CAP 1062 Section 7: Direct CCO Costs (operations at airports included in this study)
July 2013 Page 48
Table 6 – PBN Capability by airports included in this study
Airport RNAV1 capable %
London Terminal Area Heathrow 96%
Gatwick 96%
Stansted 93%
Luton 85%
London City 72%
Northern Terminal Area
Manchester 93%
Liverpool John Lennon
82%
Other
Birmingham 86%
Edinburgh 93%
Glasgow 89%
Newcastle 66%
Bristol 69%
7.13 It is important to note that these figures are based on data from 2010 and the CAA expect the numbers to increase since that point due to wider EU and global PBN developments or aircraft upgrade programmes.
7.14 PBN required routes and procedures are in place in other airspace areas around the world and ICAO is driving international implementation of PBN through ICAO Assembly Resolution A37-11. In support of the direction set by ICAO, the European Commission is developing a European wide PBN Implementing Rule (IR) which is projected to take effect in terminal airspace from 2020.
7.15 Most recently, in Europe as of 15 November 2012 Schiphol airport in Amsterdam mandated all aircraft to hold RNAV1. The requirement had previously been in place for some years during the night hours, but was extended to 24 hours as part of their national PBN implementation. This means that any aircraft that operate to Schiphol airport, will now be RNAV1 capable and this will also have driven up the estimated RNAV1 capability levels for aircraft operating in the UK.
CAP 1062 Section 7: Direct CCO Costs (operations at airports included in this study)
July 2013 Page 49
7.16 Within the UK, the CAA is aware that many of the major aircraft operators are already fully RNAV1 capable or undergoing fleet upgrade programmes, which will ensure that they are fully RNAV1 capable in the near future. Some of the larger business jet operators also operate aircraft with high technical capabilities and will already be RNAV1 capable, if not operationally approved yet. There are other aircraft operators that are not currently RNAV1 capable fleet and would face some aircraft retrofit costs.
7.17 Using the baseline position from the CAA PBN capability survey, the aircraft type and airline operator of movements identified as not being RNAV1 capable were identified at the twelve airports included in this study33. Operators that had ceased operations, since 2010, or merged with other operators were removed, as were operators where it was known to be highly likely that those aircraft would become RNAV1 compliant through existing fleet upgrade or replacement programmes by 2016. Business aviation operators flying into the airports included in this study were included in PBN capability study.
7.18 From the remaining operators that are believed to be non-RNAV1 capable, the number of aircraft in their total fleet was identified in order to estimate a retrofit cost for that operator. It is recognised that this approach is likely to overestimate the upgrade cost as not all operators will operate all aircraft of one type into UK airports; however, in general this approach is only able to roughly approximate costs and therefore it was felt to be suitable approximation given the information available.
7.19 The vast majority of aircraft identified as likely to remain RNAV1 noncompliant by 2016 were regional, business or turboprop categories. Eurocontrol has estimated aircraft retrofit costs as part of its preliminary economic impact assessment for a PBN implementing rule (IR), included in table 7 below34. Eurocontrol’s retrofit cost estimates are based on aircraft type, assumed FMS functionality and aircraft age.
33 Where the number of movements was greater than fifty across the period of the study; which is roughly equivalent to less than 3 movements per week.
34 Seamless Asian Skies: Initial Economic Analysis of Benefits report estimates similar figures for aircraft retrofit costs. FMS retrofit costs estimated at $100,000 or $300,000 for mainline aircraft and lower costs for GPS or MMR retrofit costs $58,000 and $30,000 or $40,000 respectively.

CAP 1062 Section 7: Direct CCO Costs (operations at airports included in this study)
July 2013 Page 50
Table 7 – Eurocontrol PBN retrofit cost estimates
Cost Category
Aircraft category Retrofit Requirement Estimated Cost (€)
Mainline aircraft (Airbus, Boeing, McDonnel Douglas)
A Fully equipped No retrofit required €0
B Mainline aircraft with RF T1 FRT software upgrade €40,000
C Typical mainline aircraft 2 new FMCT2s + 2 new MCDUT3s
€400,000
D Specific older aircraft types Extensive retrofit €950,000
Regional / business / turboprop
E Aircraft with RF FRTT4 software upgrade €20,000
F Aircraft with capable MCDUs and displays
2 FMCs €100,000
G Aircraft with capable displays
2 FMCs + 2 MCDUs €150,000
H Older aircraft (> 15 years) 2 new FMCs + 2 new MCDUs + new EFIST5
€500,000
General aviation
I All general aviation General aviation retrofit €50,000
T1 Radius to fix (RF)
T2 Flight management computer (FMC)
T3 Multifunction control and display unit (MCDU)
T4 Fixed radius transition (FRT)
T5 Electronic flight instrument system(EFIS)
7.20 The estimated retrofit costs for non-RNAV1 capable aircraft operating into the airports included in this study directly attributable to CCOs ranged from a low cost scenario of £1.4 million (€20,000 cost each) to a medium cost scenario of £6.8 million (€100,000 cost each) to the high cost scenario of £10.1 million (€150,000 each).
7.21 This is a broad approximation for the costs. It may overestimate the costs if the retrofit costs are less than currently estimated or if the PBN capability study underestimated RNAV1 capability levels and retrofit for these aircraft are no longer necessary. However, it may also underestimate costs if the CAA PBN capability study overestimated RNAV1 capability levels or if retrofit costs turn out to be greater than currently estimated. Currently it is difficult to identify the probability

CAP 1062 Section 7: Direct CCO Costs (operations at airports included in this study)
July 2013 Page 51
of either of these possibilities and therefore this estimate should be treated with a certain level of caution.
7.22 The costs estimated in this section do not include military aircraft equipage costs, as military operations at these are airports are low and therefore the military will be unlikely to incur significant direct costs at these airports. However, it is important to note that this does not mean that there would be no cost implications to the military. The major airspace modernisation programmes are likely to require aircraft transiting the area to be RNAV1 capable and therefore the military may incur indirect costs. These indirect costs have been described in section 8.
7.23 Costs to business aviation operators have been included in the aircraft equipage costs above where the aircraft made more than an average of two flights per week into the airports included in this study in the period covered by the CAA’s PBN capability survey. Similar to the situation described for the military, operators required to transit RNAV1 airspace could also face aircraft retrofit costs. This impact is also described in section 8.
7.24 At this time it is not expected that a significant proportion, if any, of general aviation operators will operate in the environment covered by a PBN mandate, therefore this study has not included cost to general aviation operators other than business jet operators.
Airspace Modernisation
Major Airspace Modernisation Programmes (TA, LAMP, NTCA)7.25 As described in Section 5, the implementation of fully systemised
CCOs requires a programme of major network airspace modernisation changes in order to develop airspace structures that are based on PBN procedures and incorporate fully systemised CCOs.
7.26 In the UK, currently the three major airspace redesign programmes in development to enable fully systemised CCOs at the airports included in this study are TA, LAMP and NTCA.
7.27 These three major modernisation programmes are currently in development and therefore it is difficult to assign a true cost of the programmes; however, the following cost ranges have been assumed as approximations and are based around certain implementation and consultation timescales as well as project scope. As the programmes

CAP 1062 Section 7: Direct CCO Costs (operations at airports included in this study)
July 2013 Page 52
develop the costs in this study can be updated to get a more accurate picture, if necessary. It is also important to note that expenditure on these major airspace redesign programmes is subject to the outcome of NATS En Route Ltd’s (NERL’s) regulatory settlement for Reference Period 2 (RP2) which includes consultation with NERL’s customers.
7.28 The total cost for a change in TA to 18,000ft for this study currently approximated in this study is between £35 and £45 million. TA is an enabler for fully systemised CDOs as well as CCOs and therefore only one half of the total programmes costs have been assumed to be attributable to enabling fully systemised CCOs. The costs used in this study directly attributable to fully systemised CCOs are a low cost scenario of £17.5 million, a medium cost scenario of £20 million and a high cost scenario of £22.5 million. It should be noted that the plans for a change in TA to 18,000ft have not been finalised and therefore the costs included at this point are subject to change.
7.29 The LAMP programme covers Heathrow, Gatwick, Stansted, Luton, London City and parts of Birmingham airport. The total LAMP programme cost currently approximated in this study is between £70 million and £90 million; however LAMP enables other operational outcomes such as fully systemised CDOs with reduced reliance on stackholding and changes to route lengths and therefore have been assumed as approximately one third of the total programme costs can be attributable to fully systemised CCOs. The costs used in this study for the LAMP programme directly attributable to fully systemised CCOs are a low cost scenario of £23.3 million, a medium cost scenario of £26.7 million and a high cost scenario of £30.0 million. It should be noted that the plans for LAMP have not been finalised and therefore the costs included at this point are subject to change.
7.30 The NTCA programme covers Manchester, Liverpool, Newcastle, and parts of Birmingham airport. The total NTCA programme cost currently approximated in this study is between £10 million and £15 million; however as like LAMP, NTCA enables other operational outcomes and therefore only one third of the total programme cost has been assumed to be attributable to fully systemised CCOs. The costs used in this study for the NTCA programme directly attributable to fully systemised CCOs are a low cost scenario of £3.3 million, a medium cost scenario of £4.2 million and a high cost scenario of £5.0 million. It should be noted that the plans for NTCA have not been finalised and therefore the costs included at this point are subject to change.

CAP 1062 Section 7: Direct CCO Costs (operations at airports included in this study)
July 2013 Page 53
7.31 Edinburgh, Glasgow and Bristol airports are not covered by these major airspace redesign programmes, but it is assumed that airspace changes for these airports (that are costs in the following section) will allow for the implementation of fully systemised CCOs.
Airport level airspace redesign costs7.32 The cost of the airspace change process for SID redesign for an
airport to enable fully systemised CCOs using PBN procedures has been estimated to be in the range of £100,000 to £250,000. This cost depends on the number of SIDs to be redesigned by the airport, the complexity of the SID redesigns and the extent of local consultation required as part of the airspace change process.
7.33 The estimated airport level airspace redesign costs for the airports included in this study directly attributable to CCOs ranged from a low cost scenario of £1.2 million (£100,000 cost each) to a medium cost scenario of £2.1 million (£175,000 cost each) to the high cost scenario of £3.0 million (£250,000 each).
7.34 It should be noted that these costs reflect only an estimate of the cost to the airport for the SID redesign and consultation and do not include any additional environmental compensation costs that could be incurred by airports. This study has assumed only vertical changes to SID and not any horizontal changes to routes that that would result in a different distribution of impact, therefore under this context it is assumed these costs would not be incurred.
NPV of Total Costs
7.35 It has been assumed that all airspace modernisation costs will be incurred in line with the three scenarios presented in section 5.2 and cover airspace requirements over the entire period of the FAS out to 2030. The NPV of the airspace modernisation costs directly attributable to fully systemised CCOs are estimated as follows in table 8:

CAP 1062 Section 7: Direct CCO Costs (operations at airports included in this study)
July 2013 Page 54
Table 8 – Net present value (NPV) of total direct costs
NPV Costs CCO Scenario 1 (2016-2030)
CCO Scenario 2 (2016-2030)
CCO Scenario 3 (2016-2030)
Commercial aircraft equipage
Low £1.3m £1.3m £1.3m
Medium £6.3m £6.3m £6.3m
High £9.4m £9.4m £9.4m
Airport airspace redesign
Low £1.1m £1.1m £1.1m
Medium £1.9m £1.9m £1.9m
High £2.7m £2.7m £2.7m
Major airspace redesign
Low £40.9m £39.3m £39.3m
Medium £47.1m £45.3m £45.3m
High £53.2m £51.2m £51.2m
Total Direct Costs
Low £43.3m £41.7m £41.7m
Medium £55.3m £53.6m £53.6m
High £65.3m £63.5m £63.5m

CAP 1062 Section 8: Indirect costs (operations at impacted airports outside of this study)
July 2013 Page 55
8SECTION 8
Indirect costs (operations at impacted airports outside of this study)
8.1 Section 7 includes the direct costs to airports, ANSPs and aircraft operators of implementing fully systemised CCOs at the airports included in this study; however there may be other indirect costs to aircraft operators and the military resulting from a RNAV1 mandates, particularly in the London TMA area as part of the LAMP programme.
8.2 This section describes the potential additional indirect costs to the military, general aviation and other aircraft operators.
Military costs
8.3 Military traffic is categorised as flying general air traffic (GAT) or operational air traffic (OAT). GAT encompasses all flights conducted in accordance with the rules and procedures of the International Civil Aviation Organisation (ICAO); these may include military flights for which ICAO rules satisfy their operational requirements35. OAT refers to all flights which do not comply with the provision for GAT, the majority of which is operated by military agencies. Military GAT traffic is the traffic most likely to be impacted by a RNAV1 mandate at the civil airports included in this study.
8.4 During 2012, there were 53,488 OAT military flights handled by the military Area Control Centres at Prestwick and Swanwick. Eurocontrol reported that there were 6,930 UK military GAT flights. OAT comprises 88 per cent of total military flights36; therefore the vast majority of military operations in the UK would not be affected by RNAV1 requirements at the civil airports included in this study. The State aircraft most likely to be affected by a RNAV1 mandate would be transport-type aircraft, which are more likely to fly GAT. In 2012, the UK military was reported to have 10337 of these types of aircraft.
35 Eurocontrol EATM Glossary of Terms36 Statistics provided by FMARS SO2 plans through DAATM 28 Mar 1337 Eurocontrol Edition 2012; 29 October 2012) Directorate Single Sky; Civil-Military ATM Co-ordination
Division (DSS/CM); Military Statistics

CAP 1062 Section 8: Indirect costs (operations at impacted airports outside of this study)
July 2013 Page 56
8.5 The issue of PBN capability to the UK military is principally to enable the military to gain access to civil airspace. The Ministry of Defence (MOD) is investigating the RNAV situation for State aircraft and is looking towards implementing a RNAV1 capability upon some of its transport-type airframes. There is no plan to implement RNAV at military aerodromes.
8.6 There is currently no detailed cost analysis for the UK MOD; however, it is already apparent that some aircraft, by virtue of their equipment fit, will be RNAV 1 compliant; others may demonstrate an equivalent form of compliance and some may not be compliant during their remaining service life. This may prove challenging and therefore alternative means of handling non-RNAV1 compliant State aircraft will have to be part of the solution and resulting airspace management arrangements.
8.7 It should also be noted that due to the significant presence of US military aircraft based and operating in the UK there could also be a potential impact on the US military as well as the UK military.
8.8 It has not been possible to determine or approximate the costs to the military to demonstrate RNAV1 capability through retrofit or the demonstration of equivalence, and therefore this study does not include the direct costs of RNAV1 retrofit to the UK military. However, as long as military costs directly attributable to fully systemised CCOs are less than approximately £70 million a net benefit to the UK from fully systemised CCOs should remain.
Cost to operators at airports outside the study
8.9 Potential aircraft retrofit costs were identified to aircraft operators at airports outside this study but likely to be affected by RNAV1 mandates in the LAMP major airspace modernisation programme. Information from the CAA’s PBN capability survey at 19 further airports was considered38.
8.10 There were few operators into these airports operating over 50 flights per aircraft type in the four month period covered by the CAA’s PBN capability survey period. Therefore, the threshold at these airports for inclusion was lowered to approximately one flight per week, or greater than 16 movements per aircraft type over the whole survey period.
38 These airports include: Chichester/Goodwood, Lashenden/Headcorn, Redhill, Denham, Panshanger, White Waltham, Lydd, Manston, Cambridge, Stapleford, Duxford, Wycombe Air Park/Booker, Oxford/Kidlington, Elstree, Farnborough, Blackbushe, Fairoaks, Southend and Biggin Hill.

CAP 1062 Section 8: Indirect costs (operations at impacted airports outside of this study)
July 2013 Page 57
8.11 Some of the costs had already been accounted for in the direct costs section where the aircraft operator operates the same type of aircraft into both airports included and outside of the study. These costs remain in the direct costs section and have not been double counted. The costs in the section were estimated using the same process as that for the direct costs described in section 7.2.
8.12 Indirect aircraft retrofit costs were approximated to be between £0.4 million for the low cost scenario to £2.0 million for the medium cost scenario to £3.0 million for the high cost scenario under the wider CCO1 scenario timing.
8.13 Less is known of the capability levels of business jet aircraft and therefore this may overestimate the indirect costs if the current RNAV1 capability level is higher than that assumed, or if all of the aircraft in the operators fleet do not fly into those airports.
Table 9 – Net present value (NPV) of indirect costs and total costs including indirect costs
NPV Costs CCO Scenario 1 (2016-2030)
CCO Scenario 2 (2016-2030)
CCO Scenario 3 (2016-2030)
Other aircraft operator retrofit
Low £0.4m £0.4m £0.4m
Medium £1.9m £1.9m £1.9m
High £2.8m £2.8m £2.8m
Total Costs (incl indirect costs)
Low £45.3m £42.1m £42.1m
Medium £59.3m £55.4m £55.4m
High £70.7m £66.3m £66.3m
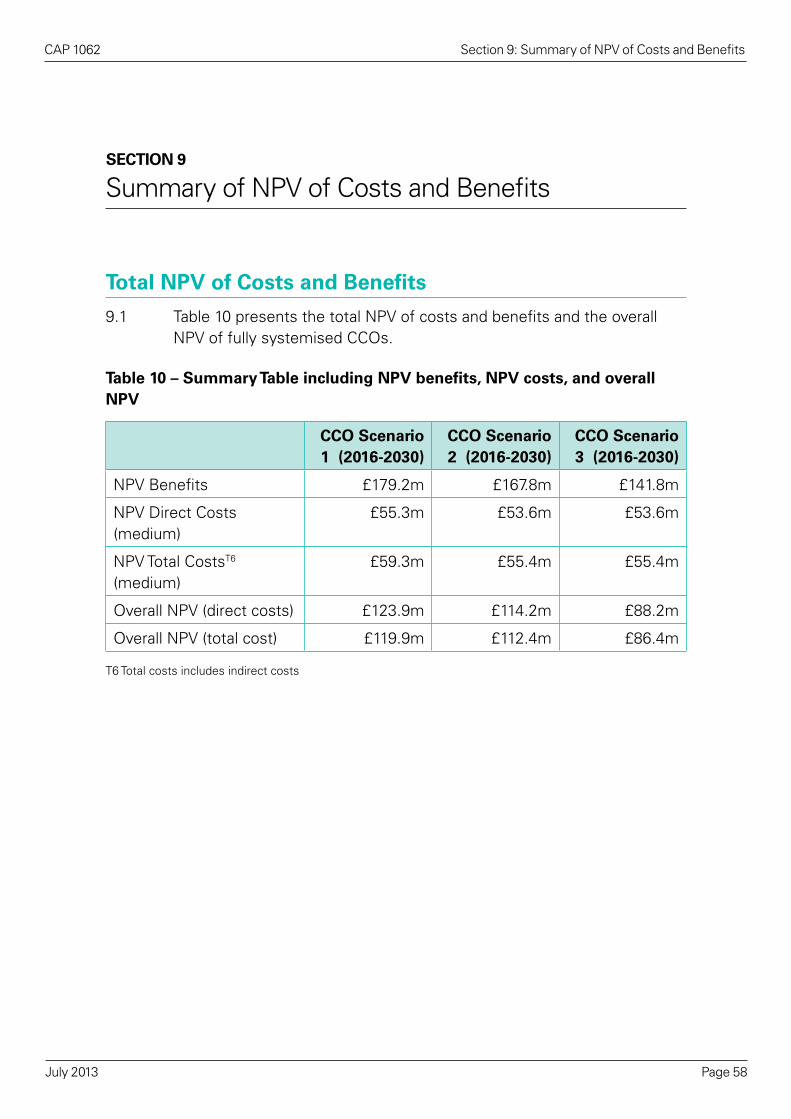
CAP 1062 Section 9: Summary of NPV of Costs and Benefits
July 2013 Page 58
9SECTION 9
Summary of NPV of Costs and Benefits
Total NPV of Costs and Benefits
9.1 Table 10 presents the total NPV of costs and benefits and the overall NPV of fully systemised CCOs.
Table 10 – Summary Table including NPV benefits, NPV costs, and overall NPV
CCO Scenario 1 (2016-2030)
CCO Scenario 2 (2016-2030)
CCO Scenario 3 (2016-2030)
NPV Benefits £179.2m £167.8m £141.8m
NPV Direct Costs (medium)
£55.3m £53.6m £53.6m
NPV Total CostsT6 (medium)
£59.3m £55.4m £55.4m
Overall NPV (direct costs) £123.9m £114.2m £88.2m
Overall NPV (total cost) £119.9m £112.4m £86.4m
T6 Total costs includes indirect costs

CAP 1062 Section 10: Benefit to Cost Ratio (BCR)
July 2013 Page 59
10SECTION 10
Benefit to Cost Ratio (BCR)
10.1 The BCR is the ratio of the net present value of total benefits to the net present value of total costs. A BCR greater than one indicates a net benefit and a BCR less than one indicates a net loss.
10.2 The BCRs for the various timescale scenarios and cost ranges for fully systemised CCOs are included in table 11. The BCRs indicate a net benefit to the airports included in this study from implementing fully systemised CCOs. Logically, benefit is greatest for scenario where the benefits are implemented earliest and the cost estimate is the low scenario.
10.3 The full LAMP and NTCA designs have not been finalised and it is not known to what extent it will be possible to design fully systemised CCOs across the UK; however, it is unlikely that all SID interactions will be eliminated due to geographical limitations and the complexity of the terminal airspace interactions. In addition, the current implementation plans indicate that changes to Heathrow SIDs will come towards the back end of the LAMP implementation. Therefore it is not unreasonable to believe that the most realistic deployment scenario will reflect the scenario 3 implementation timescale, a medium cost scenario including indirect costs and only an 80 per cent CCO performance. If this were the case it could be expected that the expected benefits would be approximately 60 per cent greater than the costs.
10.4 Tables 12 and 13 show the BCRs for the various timescale scenarios and cost ranges for situations of only 80 per cent and 60 per cent CCO achievement respectively. The BCRs decrease significantly in situations where fully systemised CCOs are not achieved and in some cases the result changes to a situation where the net costs are greater than net benefits. In the bleakest situation, under 60 per cent CCO achievement only a few of the scenarios would generate a net benefit to the UK if indirect costs were included.
10.5 Although it has not been possible to quantify UK military costs, it is possible to determine what level of military costs (or any other additional costs) would eliminate the overall benefits from fully systemised CCOs. As long as total military, or other, costs are less than

CAP 1062 Section 10: Benefit to Cost Ratio (BCR)
July 2013 Page 60
approximately £70 million, the scenarios included in this report for fully systemised CCOs should generate benefits greater than costs.
10.6 If it were only possible to achieve 80 per cent CCO performance, then military (or other) costs would need to be less than approximately £20 million for the scenarios included in this report to generate benefits greater than costs. As demonstrated in table 13, benefits are only greater than costs in two of the scenarios included in this report for 60 per cent CCO achievement before factoring in any military or other costs.
Table 11 – BCR direct costs only and including indirect costs – 100% CCOs
CCO Scenario 1 (2016-2030)
CCO Scenario 2 (2016-2030)
CCO Scenario 3 (2016-2030)
Direct costs only
Low cost 4.1 4.0 3.4
Medium cost 3.2 3.1 2.7
High Cost 2.7 2.6 2.2
Indirect costs included
Low cost 4.1 4.0 3.4
Medium cost 3.1 3.0 2.6
High Cost 2.6 2.5 2.1
Table 12 – BCR direct costs only and including indirect costs – 80% CCOs
CCO Scenario 1 (2016-2030)
CCO Scenario 2 (2016-2030)
CCO Scenario 3 (2016-2030)
Direct costs only
Low cost 2.6 2.5 2.1
Medium cost 2.0 2.0 1.6
High Cost 1.7 1.6 1.4
Indirect costs included
Low cost 2.6 2.5 2.0
Medium cost 2.0 1.9 1.6
High Cost 1.6 1.6 1.3

CAP 1062 Section 10: Benefit to Cost Ratio (BCR)
July 2013 Page 61
Table 13 – BCR direct costs only and including indirect costs – 60% CCOs
CCO Scenario 1 (2016-2030)
CCO Scenario 2 (2016-2030)
CCO Scenario 3 (2016-2030)
Direct costs only
Low cost 1.3 1.3 1.0
Medium cost 1.0 1.0 0.8
High Cost 0.8 0.8 0.7
Indirect costs included
Low cost 1.3 1.3 1.0
Medium cost 1.0 1.0 0.7
High Cost 0.8 0.8 0.6

CAP 1062 Section 11: Distributional Analysis
July 2013 Page 62
11SECTION 11
Distributional Analysis
11.1 The distribution of the costs and benefits across the different types of aviation stakeholders is not equal with some stakeholder expected to realised benefits greater than their costs and other stakeholders potentially incurring greater costs than benefits. This analysis must be considered in the context of the wider FAS deployment. This analysis for fully systemised CCOs covers only one of the many operational improvements planned as part of FAS deployment. Stakeholders that incur a net cost from fully systemised CCOs may receive a net benefit from other operational improvements.
11.2 Table 14 shows the estimated distribution of costs and benefits across different stakeholder groups involved in fully systemised CCOs (CCO scenario 3; medium cost). It is clear that there are different impacts on different stakeholders groups; however, overall this study estimates that there is an overall net benefit across all UK stakeholders from the implementation of fully systemised CCOs.

CAP 1062 Section 11: Distributional Analysis
July 2013 Page 63
Table 14 – Distribution of benefits and costs across different stakeholder groups – 100% CCO achievement
Benefits Costs Likely impact
Aircraft operator (in study)
Fuel, CO2, Delay - £87.9m
More efficient fuel planning
Equipage - £6.3m +
Aircraft operator (airports outside study)
Pilot workload
Safety
More efficient fuel planning
Equipage - £1.9m ±
Airport Potential terminal airspace capacity release
Neutral noise impact
Airspace change - £1.9m
±
ANSP Controller workload
Safety
More efficient use of airspace
Major airspace change - £56.6m
±
Military Able to continue current operations
Equipage −
Passenger Time - £53.8m +
OVERALL +

CAP 1062 Annex A: Assessing the Overall Benefits of FAS Deployment
July 2013 Page 64
AANNEX A
Assessing the Overall Benefits of FAS Deployment
A1 The FAS Deployment Plan provides estimates of the benefits of operational improvements at an aggregate level. This ‘top-down’ approach aims to capture the net positive outcomes expected in areas of the network that can be assessed relatively independently.
A2 For example, the benefits associated with greater continuous climb operations in the London terminal environment can be assessed independently from enabling more direct routing in the en-route phase of flight.
A3 The high levels of interdependency that exist across the ATM capabilities that enable operational improvements make it difficult to estimate the benefits of one particular capability in isolation. For example, procedure re-design and navigational capabilities are both integral to enabling better climb performance, but the direct benefits attributable to each capability are difficult to isolate and apportion.
A4 Taking this into account, the cost benefit analysis for FAS Deployment aims to provide a clear line of sight between the benefits of operational improvements and the costs of ATM capabilities that enable them, guiding industry decision-making around which capabilities to invest in, where and in what sequence.
A5 The FAS cost benefit analysis will aim to quantify and then monetise the improvements in each area by building three ‘cases’:
�� The En-route case
�� The Terminal case
�� The Runway Optimisation case
A6 The En-route case for FAS deployment concentrates on the flight efficiency and delay benefits associated with aircraft flying more efficient and flexible profiles during the en-route phase of flight. The En-route case is founded on:
�� Fuel and emissions savings from the implementation of more direct routes in the upper airspace and other volumes of airspace.
�� Fuel, emissions and delay savings from enabling more effective use of danger areas.

CAP 1062 Annex A: Assessing the Overall Benefits of FAS Deployment
July 2013 Page 65
�� Fuel, emissions, noise, delay and safety savings realised in the terminal environment from sequencing arrivals during the en-route phase of flight to present traffic to the terminal, at an accurate time of arrival, in an optimal order and reduce the need for airborne holding.
A7 The Terminal case for FAS Deployment concentrates on flight efficiency, delay and safety benefits associated with aircraft flying more efficient and predictable profiles to descend into and climb out of the terminal environment. The terminal case is founded on:
�� Fuel and emissions savings from aircraft flying more sections of their climbs continuously.
�� Fuel, emissions and noise savings from aircraft flying more sections of their descents continuously.
�� Safety increases from aircraft flying more predictable, repeatable (systemised) arrival and departure routes with less tactical changes and level-offs.
�� Noise savings from aircraft flying more precise flight paths at low levels.
�� Delay savings generated by increases in ATM capacity from aircraft flying more closely spaced routes.
A8 The Runway Optimisation case for FAS deployment concentrates on flight efficiency, delay and safety benefits associated with a steady stream of aircraft landing at the time predicted and managing their turnaround processes effectively to hit a target start time for departure. The runway optimisation case is founded on:
�� Fuel and emissions savings from less time spent taxiing and queuing on the airfield.
�� Delay savings from greater slot adherence at capacity constrained airports and increased utilisation of wasted slots.
�� Safety increases from greater situational awareness and control of aircraft during ground movements.
A9 Benefits estimates will be generated by establishing typical baselines of performance built from historic data and comparing them against scenarios, case studies and the insights of operational experts to model the impact of the proposed changes.
CAP 1062 Annex B: Developing a Cost Benefit Analysis (CBA) framework for the FAS
July 2013 Page 66
BANNEX B
Developing a Cost Benefit Analysis (CBA) framework for the FAS
B1 An initial mapping exercise of the components of FAS, and the relationships between the multiple capabilities and technologies necessary to achieve the operational improvements envisioned, was undertaken to develop the most appropriate approach for a CBA. The mapping exercise highlighted a high proportion of enabling technologies and capabilities adding to the complexity of analysing the FAS.
B2 It was decided that the most appropriate level of analysis for a cost benefit study was to analyse the FAS at the operational improvement level, which is at a high enough level to capture the enabling technologies and capabilities and deliver benefits, but at a low enough level to enable a realistic evaluation of the costs and benefits.
B3 Continuous climbs operations (CCOs) were identified as being the best starting point for FAS deployment evaluation given the relatively discrete nature of the improvement and the amount of information already known about the actions and costs associated with its implementation. It was also expected to be an area where significant benefits could be realised within the UK.
B4 RPG is leading on the CBA project with significant involvement from the FASIIG programme management office (PMO) consultant on the identification of network benefits and the alignment of the CBA to the FAS deployment plan. The CAA’s Environment Research and Consultancy Department (ERCD) supported the initial benefits assessment and have undertaken work on the noise implications from CCOs. NATS’ Operational Analysis (OA) unit supported the development of the scope for the project as well as the development of the baseline data collection as well as wider NATS involvement on cost identification.
B5 The direction and scope of the work has been endorsed by the FAS Programme Board as well as by the FASIIG at the FASIIG 4 meeting on the 9 March 2012. Initial data on potential benefits from CCOs was presented to the FASIIG 5 meeting on the 18 April 2012 where industry representatives agreed with the approach for the analysis, but felt that the potential benefits could be greater. In response to this, industry workshops were arranged with stakeholders to test the assumptions

CAP 1062 Annex B: Developing a Cost Benefit Analysis (CBA) framework for the FAS
July 2013 Page 67
used in the modelling and gather benefits data directly from airline operators.
B6 The industry workshops were held on 9 May and 11 May 2012 and included representatives from the following industry stakeholders:
�� NATS
�� EasyJet
�� Virgin Atlantic
�� Emirates
�� Flybe
�� British Airways
�� Jet2
�� IAA
�� Bar-UK
B7 The information gathered from the airlines at the workshops was used to test against the information included in the modelling approach in this report.
B8 An interim report was produced in July 2012 and circulated to the industry through FASIIG members for comments on 30 July 2012. Two comments have been received so far related to how the work would be extended to other airports across the UK and the fleet mix used for fuel saving and CO2modelling purposes.

CAP 1062 Annex C: Total Aircraft Movements 2011
July 2013 Page 68
CANNEX C
Total Aircraft Movements 201139
Table 15 – Total Aircraft Movements 2011 for airports included in this study
Commercial Movements
Total Air Transport
of which, Air Taxi
Positioning Flights
Local Movements
HEATHROW 480,906 476,917 622 1,407 0
GATWICK 251,067 244,776 205 4,089 0
MANCHESTER 167,469 158,262 237 4,046 27
STANSTED 148,317 138,792 1,893 4,210 0
EDINBURGH 113,357 108,708 3,590 2,020 0
LUTON 97,574 76,222 4,084 4,984 3
BIRMINGHAM 93,145 84,742 916 3,024 2,826
GLASGOW 78,111 72,377 2,445 2,016 6
LIVERPOOL (JOHN LENNON)
69,055 46,192 558 385 4
LONDON CITY 68,792 67,366 6,302 1,036 0
NEWCASTLE 64,521 45,121 475 1,375 809
BRISTOL 66,179 72,780 110 723 0
39 CAA (2012) UK Airports Annual Statement of Movements, Passengers and Cargo 2011; table 3.1.

CAP 1062 Annex C: Total Aircraft Movements 2011
July 2013 Page 69
Non-Commercial Movements
Test & Training
Other flights
Aero Club
Private flights
Official Military Business Aviation
HEATHROW 24 158 0 67 557 36 1,740
GATWICK 168 253 11 57 8 14 1,691
MANCHESTER 0 346 0 731 0 77 3,980
STANSTED 138 115 0 1,225 485 94 3,258
EDINBURGH 39 90 504 420 13 260 1,303
LUTON 263 595 0 384 138 6 14,979
BIRMINGHAM 42 68 0 361 0 289 1,793
GLASGOW 94 77 2,004 283 2 60 1,192
LIVERPOOL (JOHN LENNON)
43 17 19,188 1,824 7 336 1,059
LONDON CITY 147 5 0 0 0 6 232
NEWCASTLE 569 25 0 13,134 3,145 261 82
BRISTOL 0 15 6,469 5,907 0 281 4

CAP 1062 Annex D: CCO baseline performance at Heathrow, Gatwick, Stansted, Manchester and Birmingham
July 2013 Page 70
DANNEX D
CCO baseline performance at Heathrow, Gatwick, Stansted, Manchester and Birmingham
Figure 3 – Distribution of CCO performance over 3 month summer period in 2011 (Heathrow)

CAP 1062 Annex D: CCO baseline performance at Heathrow, Gatwick, Stansted, Manchester and Birmingham
July 2013 Page 71
Figure 4 - Distribution of CCO performance over 3 month summer period in 2011 (Gatwick)
Figure 5 - Distribution of CCO performance over 3 month summer period in 2011 (Stansted)
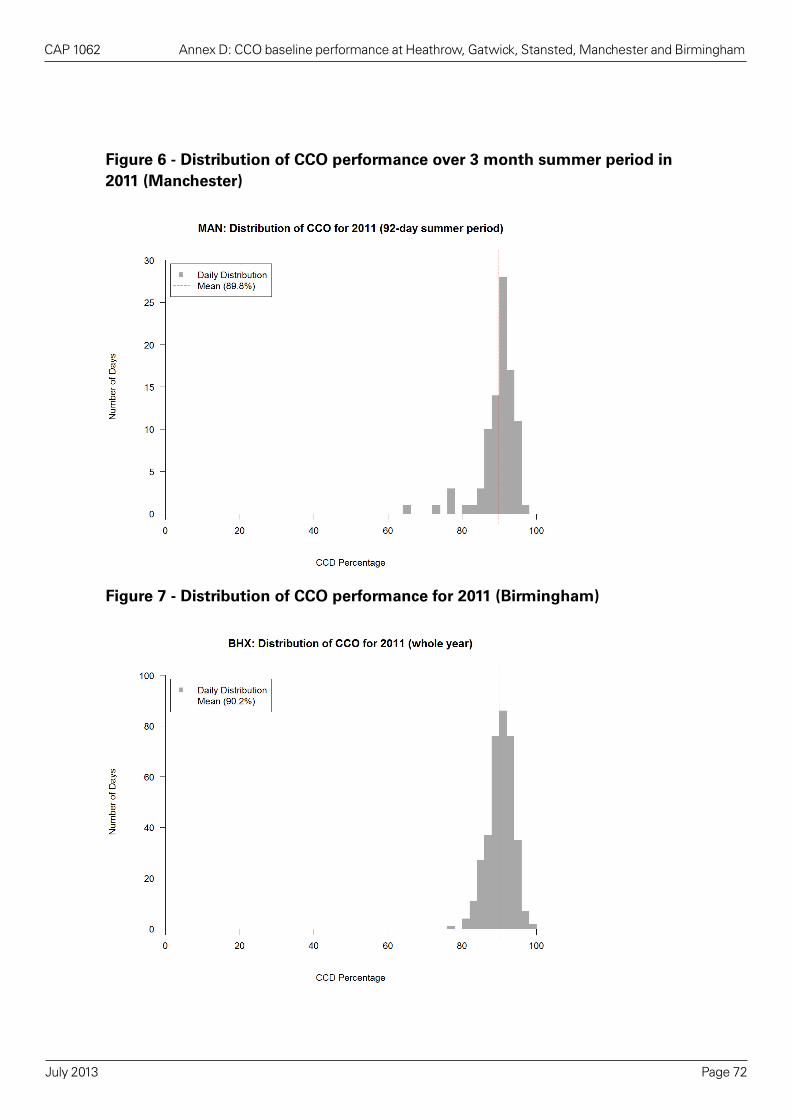
CAP 1062 Annex D: CCO baseline performance at Heathrow, Gatwick, Stansted, Manchester and Birmingham
July 2013 Page 72
Figure 6 - Distribution of CCO performance over 3 month summer period in 2011 (Manchester)
Figure 7 - Distribution of CCO performance for 2011 (Birmingham)

CAP 1062 Annex E: Carbon prices
July 2013 Page 73
EANNEX E
Carbon prices
E1 This study has used carbon price figures in the table below from the Department for Energy and Climate Change’s (DECC) A brief guide to the carbon valuation methodology for UK policy appraisal; October 2011, but it is worth noting that Point Carbon suggest that the future growth in carbon prices may not be as high40.
Table 16 – Summary of all carbon values and sensitivities over 2011-2030 period; the central traded value highlighted in green was used in this report
Traded Non-traded
Low Central High Low Central High
2011 6 13 17 28 56 83
2012 7 14 18 28 56 85
2013 9 16 20 29 57 86
2014 10 17 21 29 58 87
2015 12 19 24 30 59 89
2016 14 21 27 30 60 90
2017 15 22 28 30 61 91
2018 16 24 31 31 62 93
2019 17 26 33 31 63 94
2020 19 29 35 32 64 95
2021 21 33 43 32 65 97
2022 23 38 51 33 66 99
2023 25 42 58 33 67 100
2024 26 47 66 34 68 102
2025 28 51 73 34 69 103
2026 30 56 81 35 70 105
2027 32 61 89 36 71 107
40 http://www.businessgreen.com/bg/news/2129829/carbon-issues-gloomy-forecast-eu-carbon-prices

CAP 1062 Annex E: Carbon prices
July 2013 Page 74
Traded Non-traded
Low Central High Low Central High
2028 34 65 96 36 72 108
2029 35 70 104 37 73 110
2030 37 74 111 37 74 111
E2 As highlighted in section 5.12, DECC has published updated traded sector carbon prices following the benefit modelling undertaken in this report. The updated traded sector carbon figures are provided in table 17 below for information.
Table 17 – DECC’s updated traded sector carbon values for policy appraisals (2012)
£/tCO2e real 2012
Updated Low Updated Central Updated High
2012 0.00 5.76 11.98
2013 0.00 5.98 12.42
2014 0.00 6.24 12.88
2015 0.00 6.45 13.36
2016 0.00 6.67 13.85
2017 0.00 7.10 14.37
2018 0.00 7.55 15.29
2019 0.00 8.03 16.28
2020 0.00 8.55 17.33
2021 3.78 15.26 26.94
2022 7.57 21.97 36.56
2023 11.35 28.68 46.17
2024 15.13 35.39 55.79
2025 18.92 42.10 65.40
2026 22.70 48.81 75.02
2027 26.48 55.52 84.63
2028 30.26 62.23 94.25
2029 34.05 68.94 103.86
2030 37.83 75.65 113.48
CAP 1062 Annex F: Example of derivation of baseline 2011 expected benefits by aircraft type at Heathrow
July 2013 Page 75
FANNEX F
Example of derivation of baseline 2011 expected benefits by aircraft type at Heathrow

CAP 1062 Annex F: Example of derivation of baseline 2011 expected benefits by aircraft type at Heathrow
July 2013 Page 76
Table 18 - Traffi
c mix, fu
el bu
rn savin
gs, tim
e saving
s; Lon
do
n H
eathrow
(2011)
Fligh
t – Level S
egm
ent
Fligh
t – C
ruise
Altitu
de
Aircraft
mix
ProxyFuel kg/hr
Fuel kg/km
Fuel kg/hr
Fuel kg/km
Deps
/ dayIncrease in C
CO
deps/day
Time
saving (sec / flight)
Time
saving (m
in / day)
Fuel savings (kg / flight)
Fuel (kg/yr)
Reg
ion
al jet
CR
J 900
1,3623
1,5912.0
2920
6823
17123,791
Sin
gle-
aisleA
3192,102
42,192
2.6120
8037
4919
537,441
A320
2,4275
2,6063.1
15594
3352
18619,540
A321
2,7795
3,0323.6
6941
3625
23349,174
B722
3,3607
4,7635.7
00
680
17201
B738
2,3875
2,6693.2
3125
4318
22198,294
B752
3,6507
4,0654.9
116
232
1837,974
MD
832,800
53,189
3.94
338
220
25,166
Twin
-aisle,
2-eng
ine
A333
4,92210
5,7396.6
1710
387
37137,968
B762
4,6019
5,0275.9
32
612
6349,812
B763
4,97510
5,2516.2
3420
289
34243,207
B764
5,38510
6,0767.1
95
383
5184,909
B772
6,96014
8,2399.2
5631
4724
54599,213
B773
6,96014
8,7819.7
2317
3811
37227,610
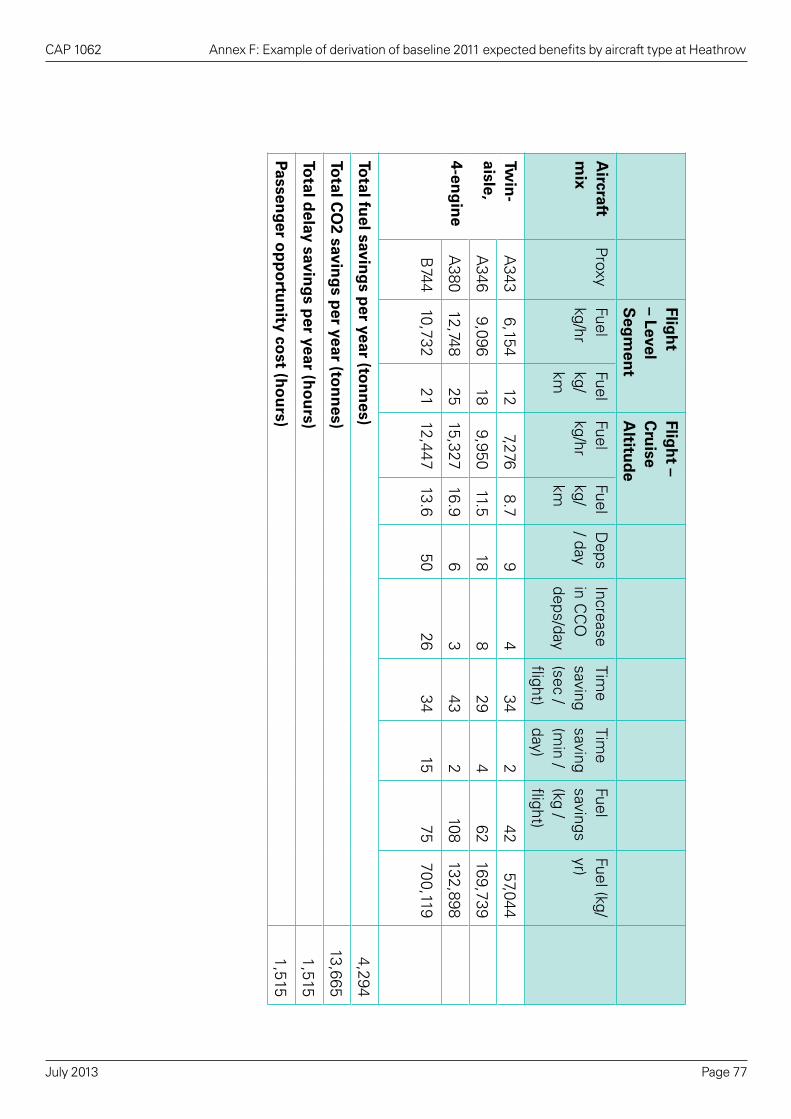
CAP 1062 Annex F: Example of derivation of baseline 2011 expected benefits by aircraft type at Heathrow
July 2013 Page 77
Fligh
t – Level S
egm
ent
Fligh
t – C
ruise
Altitu
de
Aircraft
mix
ProxyFuel kg/hr
Fuel kg/km
Fuel kg/hr
Fuel kg/km
Deps
/ dayIncrease in C
CO
deps/day
Time
saving (sec / flight)
Time
saving (m
in / day)
Fuel savings (kg / flight)
Fuel (kg/yr)
Twin
-aisle,
4-eng
ine
A343
6,15412
7,2768.7
94
342
4257,044
A346
9,09618
9,95011.5
188
294
62169,739
A380
12,74825
15,32716.9
63
432
108132,898
B744
10,73221
12,44713.6
5026
3415
75700,119
Total fu
el saving
s per year (to
nn
es)4,294
Total C
O2 savin
gs p
er year (ton
nes)
13,665
Total d
elay saving
s per year (h
ou
rs)1,515
Passenger o
pp
ortu
nity co
st (ho
urs)
1,515
CAP 1062 Annex G: Baseline year (2011) benefits by airport
July 2013 Page 78
GANNEX G
Baseline year (2011) benefits by airport
G1 Table 19 includes the annual expected benefits for 2011 by airport, compared to the baseline CCO scenario, which measures benefits against current CCO performance levels (not against zero CCO performance). Figure 8 shows the breakdown by type of expected benefit.

CAP 1062 Annex G: Baseline year (2011) benefits by airport
July 2013 Page 79
Table 19 - Traffic mix, fuel burn savings, time savings; all airports (2011)
Airport 2011 departures
2011 CCO %
Fuel savings (Tonnes)
CO2 savings (Tonnes CO2e)
Time saving (hours)
Passenger time saving (hours)
Total airport savings 2011 (£)
Heathrow 233,172 39.6% 4,294 13,665 1,515 1,515 £8.73m
Gatwick 125,517 58.1% 700 2,228 335 335 £1.77m
Stansted 73,468 46.6% 581 1,847 289 289 £1.51m
Luton (46.6%) 383 1,219 190 190 £1.0m
Manchester 79,131 89.8% 110 351 68 68 £0.34m
London City 66,129 4.3% 179 569 401 401 £1.68m
Birmingham 45,102 90.2% 36 115 28 28 £0.13m
Glasgow (90.2%) 36 115 28 28 £0.13m
Edinburgh (90.2%) 36 115 28 28 £0.13m
Liverpool (90.2%) 18 57 14 14 £0.07m
Newcastle (90.2%) 18 57 14 14 £0.07m
Bristol (90.2%) 18 57 14 14 £0.07m
TOTAL 6,410 20,397 2,916 2,916
TOTAL (£) £4.01mT6 £0.27mT7 £4.72mT8 £6.65mT9 £15.64m
T6 Based on 2011 average jet fuel prices handled by IATA €710/tonne or £618/tonne as recommended by Eurocontrol ; EUROCONTROL (Feb 2012) Standard Inputs for EUROCONTROL Cost Benefit Analyses.
T7 DECC (October 2011) A brief guide to the carbon valuation methodology for UK policy appraisal. http://www.decc.gov.uk/en/content/cms/emissions/valuation/valuation.aspx# Based on £13 for central carbon value for traded sector for 2011 in 2011 prices.
T8 EUROCONTROL (Feb 2012) Standard Inputs for EUROCONTROL Cost Benefit Analyses. http://www.eurocontrol.int/documents/standard-inputs-eurocontrol-cost-benefit-analyses Based on the EUROCONTROL recommend value for delay costs for the Base Scenario for a Strategic Airborne delay, minus the fuel costs, of €31.1 per minute and converted to £ based on EUROCONTROL exchange rate conversion for 2011 of £1.152475 (£26.99). Although the airborne delay cost is considered to exclude the climb phase the values have been considered an appropriate proxy for the saving.
T9 EUROCONTROL (Feb 2012) Standard Inputs for EUROCONTROL Cost Benefit Analyses. http://www.eurocontrol.int/documents/standard-inputs-eurocontrol-cost-benefit-analyses Based on base scenario value for passenger opportunity cost of €43.8 per minute and converted to £ based on EUROCONTROL exchange rate conversion for 2011 of £1.152475 (£38.01)
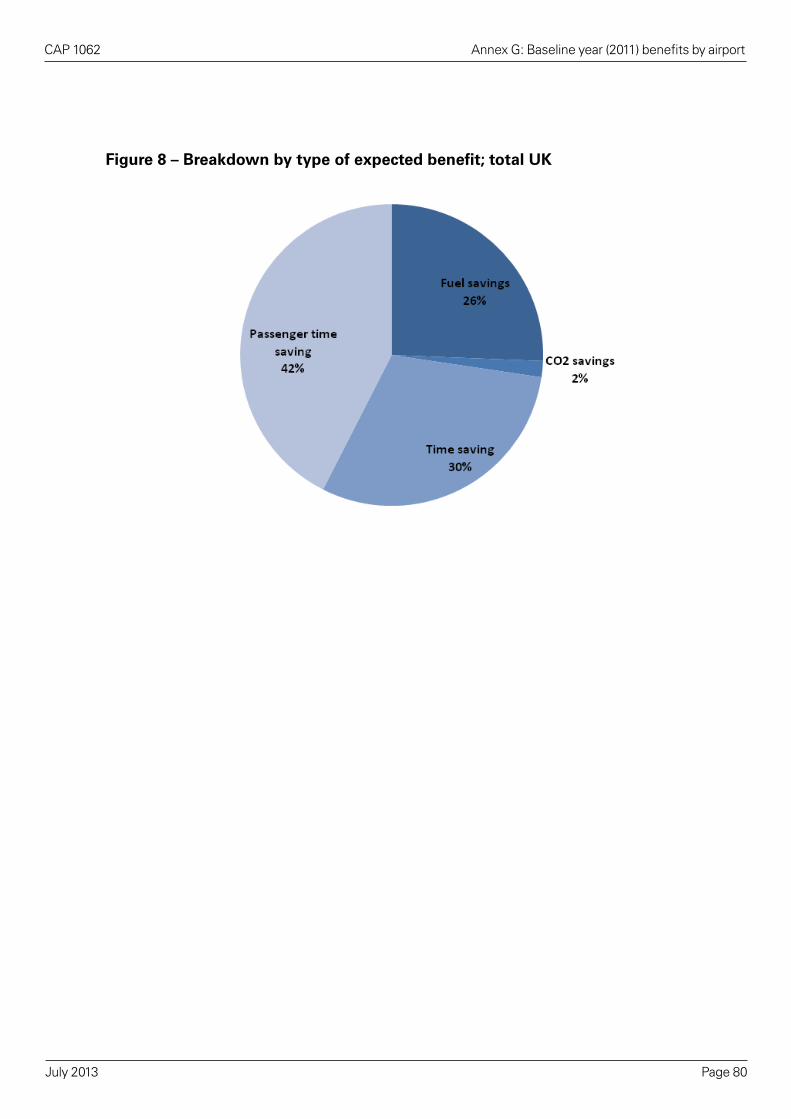
CAP 1062 Annex G: Baseline year (2011) benefits by airport
July 2013 Page 80
Figure 8 – Breakdown by type of expected benefit; total UK
CAP 1062 Annex H: Sensitivity Analysis
July 2013 Page 81
HANNEX H
Sensitivity Analysis
CCO Scenario – 80 per cent and 60 per cent continuous climbs achieved
H1 As expected, the potential benefit figures decrease with a decrease in the CCO performance level achieved. Figures 9 to 12 show the difference in expected benefits for a one year 2011 scenario and for the three future implementation scenarios included in this report. Expected benefits are approximately 60 per cent greater with 100% CCO performance compared to 80% CCO performance. Conversely, a 20 per cent loss in systemised CCO performance from 100% to 80% CCO achievement results in a 40 per cent decrease in expected benefits. Expected benefits are approximately 230 per cent greater with 100% CCO performance compared to 60% CCO performance; or conversely, a 40 per cent loss in systemised CCO performance from 100% to 60% CCO achievement results in a 70 per cent decrease in expected benefits.

CAP 1062 Annex H: Sensitivity Analysis
July 2013 Page 82
Figure 9 – 2011 savings; 100% CCO vs. 80% CCO vs. 60% CCO41
Figure 10 – CCO scenario 1; 100% CCO vs. 80% CCO vs. 60% CCO
41 Manchester, Birmingham, Glasgow, Edinburgh, Liverpool John Lennon, Newcastle and Bristol airport figures do not change with a change in CCO achievement level as their current CCO performance is better than the 80 per cent scenario.

CAP 1062 Annex H: Sensitivity Analysis
July 2013 Page 83
Figure 11 – CCO scenario 2; 100% CCO vs. 80% CCO vs. 60% CCO
Figure 12 - CCO Scenario 3; 100% CCO vs. 80% CCO vs. 60% CCO

CAP 1062 Annex H: Sensitivity Analysis
July 2013 Page 84
Traffic levels – low forecast
H2 Central traffic forecasts were used in the study; however, given the continuing economic situation in the UK and Europe sensitivity analysis has been conducted using the DfT’s low traffic forecast compared to central forecasts in table 20.
Table 20 –DfT ATM Forecasts (000s) at UK airports low and central forecasts 42
Airport 2010 2030 (Low)
Annual growth (Low)
2030
(Central)
Annual growth (Central)
Heathrow 450 480 0.3% 480 0.3%
Gatwick 230 260 0.6% 260 0.6%
Manchester 150 240 2.4% 280 3.2%
Stansted 140 250 2.9% 260 3.1%
Birmingham 85 180 3.8% 210 4.6%
Glasgow 70 60 -0.8% 75 0.3%
Luton 75 120 2.4% 130 2.8%
Edinburgh 100 190 3.3% 190 3.3%
Newcastle 50 50 0.0% 55 0.5%
Liverpool John Lennon
45 50 0.5% 55 1.0%
London City 65 120 3.1% 120 3.1%
Bristol 55 65 0.8% 85 2.2%
H3 Table 21 shows sensitivity analysis for the low traffic forecast compared to the central traffic forecast for CCO scenario 1, with less than one per cent difference in the expected benefit estimates. Traffic forecasts have a minor impact on the expected benefits figures because the airports with the largest expected benefits are also the airports with the lowest expected traffic growth.
42 Department for Transport (August 2011) UK Aviation Forecasts 2011

CAP 1062 Annex H: Sensitivity Analysis
July 2013 Page 85
Table 21 – CCO scenario savings; low vs. central traffic forecasts
Airport CCO Scenario 1 Central (2016-2030)
CCO Scenario 1 Low (2016-2030)
Heathrow £96.6m £96.6m
Gatwick £19.5m £19.5m
Stansted £19.3m £19.1m
Luton £12.5m £12.2m
Manchester £4.3m £4.1m
London City £19.9m £19.9m
Birmingham £1.8m £1.7m
Glasgow £1.4m £1.3m
Edinburgh £1.7m £1.7m
Liverpool John Lennon £0.7m £0.7m
Newcastle £0.7m £0.7m
Bristol £0.8m £0.7m
TOTAL £179.2m £178.3m
Discount Rate – UK recommended rate of 3.5 per cent
H4 Sensitivity analysis was conducted on the use of a different discount rate for CCO scenario 1. The rate used in the central assumptions for this study was the 4.0 per cent rate as recommended by Eurocontrol and in this section has been compared to the use of the 3.5 per cent discount rate as recommended by the UK Green Book for Appraisal and Evaluation in Central Government.
H5 Figure 13 shows that the expected benefits figures are up to 6.5 per cent higher using the lower 3.5 per cent discount rate as recommended for UK appraisals and evaluations compared to the Eurocontrol recommended figure.

CAP 1062 Annex H: Sensitivity Analysis
July 2013 Page 86
Figure 13 - CCO scenario savings; 3.5 per cent vs. 4.0 per cent discount rate
Exchange Rate – 2012 average Euro exchange rate H6 Sensitivity analysis was conducted on the use of a different exchange
rate for CCO scenario 1. The rate used in the central assumptions for this study was the 2011 average exchange rate of £1.152475 as recommended by Eurocontrol and in this section has been compared to the use of a higher 2012 average exchange rate of £1.230981, calculated as an average of HMRC’s monthly Euro conversion rates for 201243.
H7 Figure 14 shows that the expected benefits figures decrease by approximately 8 per cent using a higher £1.230981 exchange rate, indicating that the benefits figures included in this report are fairly sensitive to the Euro exchange rate.
43 http://customs.hmrc.gov.uk/channelsPortalWebApp/channelsPortalWebApp.portal?_nfpb=true&_pageLabel=pageImport_ShowContent&id=HMCE_PROD_009585&propertyType=document

CAP 1062 Annex H: Sensitivity Analysis
July 2013 Page 87
Figure 14 – CCO scenario 1 savings; higher exchange rate
Fuel price – Forecast fuel price inflation
H8 Sensitivity analysis was conducted on the forecast for real fuel price increases. The base scenario used in this report was the average real annual 2.4 per cent increase forecast in the Annual Energy Outlook 2012 published by the U.S Energy Information Administration. Additional forecasts of 2.9 per cent and 3.4 per cent
H9 Figure 15 shows that the expected benefits increase by approximately two per cent and four per cent for higher real fuel price inflation levels of 2.9 per cent and 3.4 per cent respectively. This indicates that expected benefits figures are sensitive to fuel price changes.

CAP 1062 Annex H: Sensitivity Analysis
July 2013 Page 88
Figure 15 – CCO scenario 1 savings; higher real fuel price inflation

CAP 1062 Annex I: CAA PBN Capability Study results
July 2013 Page 89
IANNEX I
CAA PBN Capability Study results
I1 The survey highlighted that there is generally a high level of RNAV1 capability, with capability levels highest in the airport groups with the larger commercial aviation airports.
Table 22 – PBN Capability by Airport Group across UK
Airport Group RNAV1 capable
Belfast Group 90%
East Anglia Group 50%
Farnborough Group 22%
Jersey Group 57%
London Group 93%
Manchester Group 90%
Midlands Group 82%
Other 58%
Other London area airfields 17%
PC South Group – ex Manchester & Midlands 66%
Scottish Group 90%
Severn Group 68%
Solent Group 74%

CAP 1062 Annex J: Summary of Assumptions and Uncertainties
July 2013 Page 90
JANNEX J
Summary of Assumptions and Uncertainties
Table 23 – Summary of main assumptions
Central Assumption Sensitivity Analysis
Aircraft fleet mix Constant over study period None
Air traffic capacity DfT UK Aviation Forecasts 2011 – central assumption
DfT UK Aviation Forecasts 2011 – low assumption
Airport capacity No new runway capacity across UK
None
CCO “do nothing” baseline coverage
None
CCO “do something” coverage
100% - all UK airports The greater of 80% or current baseline
The greater of 60% or current baseline
Carbon price DECC central carbon value for traded section in 2011 prices – e.g. £13 for 2011
None
Delay costs Eurocontrol recommended value for base scenario for strategic delay (minus fuel costs) of €31.1/min or £26.99/min
None
Discount rate 3.5 per cent (Eurocontrol recommendation)
4.0 per cent (UK Green Book recommendation)
Exchange rate Eurocontrol exchange rate conversion for 2011 of £1.152475
£1.25 exchange rate – delay £24.88, fuel £568/tonne (£0.45/litre), pax £35.04
Fuel prices 2011 average jet fuel prices handled by IATA €710/tonne or £618/tonne (£0.5/litre)
None

CAP 1062 Annex J: Summary of Assumptions and Uncertainties
July 2013 Page 91
Central Assumption Sensitivity Analysis
Fuel price inflation Annual real increases of 2.4% None
Passenger time costs
Eurocontrol passenger time saving for 2011 of €43.8/min or £38.01/min
None
Price levels Constant 2011 prices
Table 24 – Summary of key uncertainties
Uncertainty Description Impact
Baseline CCO level Assumes constant baseline CCO level; however traffic growth increases may decrease the current CCO performance level, thereby increasing the potential benefits from fully systemised CCO.
Baseline CCO coverage had to be approximated at many of the airports included in this study, and therefore the actual CCO performance level may be higher or lower than that estimated in this study.
Underestimation of benefits
Underestimation of benefits with lower current CCO performance
Overestimation of benefits with higher current CCO performance
Choice of proxy airports for radar data
Where airport specific radar data was not readily available for airports included in the study an estimate of the baseline CCO performance level has been estimated from a proxy airports. It is possible that this proxy airport may have a higher or lower baseline than the airport itself which could mean an overestimation or underestimation of benefits at airports where proxies have been used.
Underestimation of benefits where proxy airport has higher baseline CCO performance
Overestimation of benefits where proxy airport has lower baseline CCO performance

CAP 1062 Annex J: Summary of Assumptions and Uncertainties
July 2013 Page 92
Uncertainty Description Impact
Horizontal flight track length
Study assumes no changes to horizontal flight length; however major airspace redesigns to facilitate fully systemised CCO will require changes to horizontal flight tracks.
Underestimation of benefits
Aircraft fleet mix Study assumes no change in fleet mix; however future aircraft fleet will become more fuel efficient but may also upsize to accommodate a greater number of passengers per aircraft.
Overestimation of benefits if there is an increase in fuel efficient aircraft
Underestimation of benefits if increase if average aircraft size increases
Fuel efficiency It has not been possible to systematically calculate the possible fuel efficiency savings from reduced fuel uplift from aircraft operators. Reduced fuel uplift leads to a lower aircraft weight which in turn creates its own fuel efficiency savings.
Underestimation of fuel efficiency and CO2 savings
Future fuel prices Real fuel prices have been assumed to rise by an average of 2.4 per cent per year; however it is recognised that recent fuel price volatility adds a some uncertainty to this assumption.
Underestimation of benefits if real fuel prices increase by more than 2.4 per cent per year
Overestimation of benefits if real fuel prices increase by less than 2.4 per cent per year

CAP 1062 Annex J: Summary of Assumptions and Uncertainties
July 2013 Page 93
Uncertainty Description Impact
Allocation of costs across years prior to implementation
The study assumes costs are incurred evenly across the years from 2011 until the year prior to implementation (2016 in most cases, other than later years in the delayed implementation scenarios). In practice costs it could be possible for these costs to be incurred at later dates, which has an impact on the NPV of total costs.
Overestimation of costs
Attributing costs to CCOs
Whilst PBN capability and airspace redesigns may be required to move to a systemised CCO air traffic environment, both facilitate other improvements such as enabling better arrivals or more free-routeing of aircraft. Therefore it has been necessary to make some apportionment of the cost that would be directly attributable to the systemisation of CCO, which introduces a level of uncertainty into the costs included in the study.
It is not possible to predict whether the apportionment of costs assumed in this study is an over or underestimation of costs or the extent of which is may over or underestimate the costs.
Over or underestimation of costs
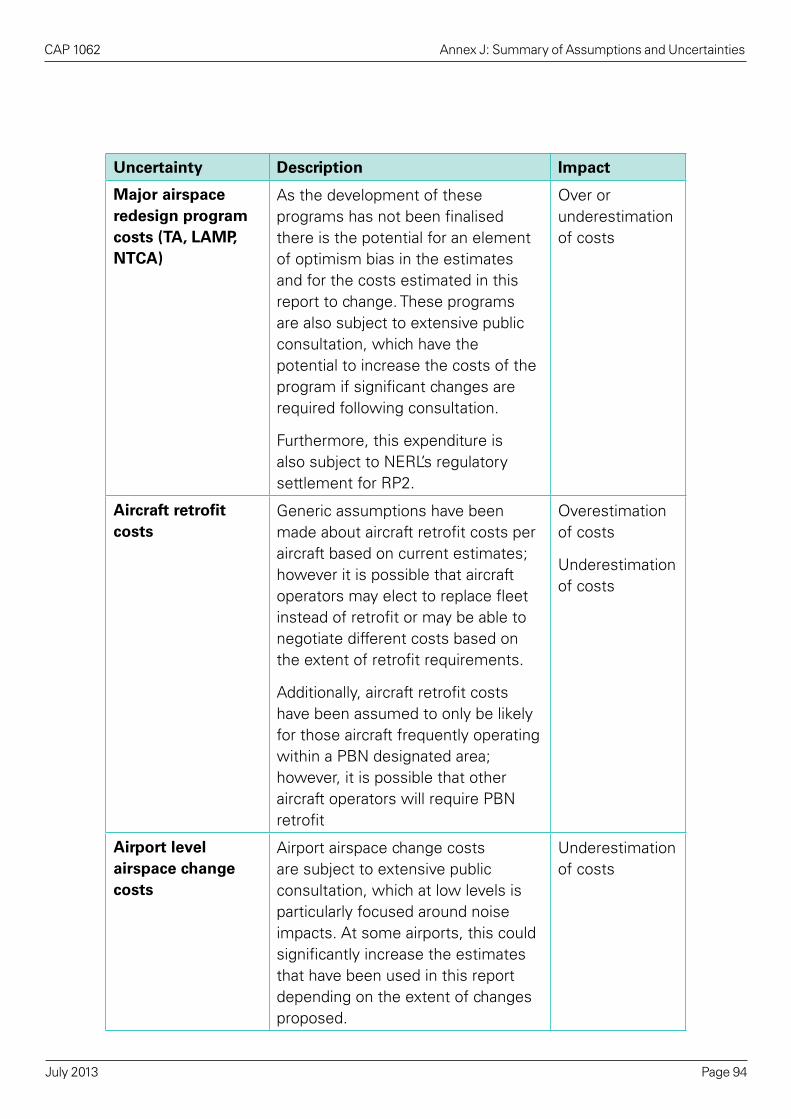
CAP 1062 Annex J: Summary of Assumptions and Uncertainties
July 2013 Page 94
Uncertainty Description Impact
Major airspace redesign program costs (TA, LAMP, NTCA)
As the development of these programs has not been finalised there is the potential for an element of optimism bias in the estimates and for the costs estimated in this report to change. These programs are also subject to extensive public consultation, which have the potential to increase the costs of the program if significant changes are required following consultation.
Furthermore, this expenditure is also subject to NERL’s regulatory settlement for RP2.
Over or underestimation of costs
Aircraft retrofit costs
Generic assumptions have been made about aircraft retrofit costs per aircraft based on current estimates; however it is possible that aircraft operators may elect to replace fleet instead of retrofit or may be able to negotiate different costs based on the extent of retrofit requirements.
Additionally, aircraft retrofit costs have been assumed to only be likely for those aircraft frequently operating within a PBN designated area; however, it is possible that other aircraft operators will require PBN retrofit
Overestimation of costs
Underestimation of costs
Airport level airspace change costs
Airport airspace change costs are subject to extensive public consultation, which at low levels is particularly focused around noise impacts. At some airports, this could significantly increase the estimates that have been used in this report depending on the extent of changes proposed.
Underestimation of costs

CAP 1062 Annex J: Summary of Assumptions and Uncertainties
July 2013 Page 95
Uncertainty Description Impact
Future “do something” scenario timescales
The scenarios included in this study were developed to show hypothetical implementation timescales and therefore may not fully align with actual implementation timescales.
Underestimation of benefits if implemented early
Overestimation of benefits if not fully implemented by 2020
Military costs The Military is legally exempt from any civil airspace requirement; however it is possible that a fully efficient airspace design would not be possible without ensuring Military PBN capability. The UK Military have been estimated based on the current position as what level might be necessary in order for the Military to retain the same access to airspace whist allowing the full efficiency benefits to be achieved from the airspace redesign. If it were possible to design an efficient airspace design without requiring Military PBN capability the Military retrofit costs included in this report might not be necessary.
The costs included in this study reflect only costs to the UK Military. It is possible that there could also be retrofit or certification costs to the American Military for aircraft based in the UK
Overestimate Military costs
Underestimate costs

CAP 1062 Annex K: York Aviation Independent Validation Commentary
July 2013 Page 96
KANNEX K
York Aviation Independent Validation Commentary
York Aviation
Future Airspace Strategy
Continuous Climb Operations (CCOs) Cost Benefit Analysis
Commentary
York Aviation was appointed on 27th March to validate and provide assurance on the methodology and approach adopted by the Civil Aviation Authority (CAA) in undertaking this Cost Benefit Analysis (CBA). We were asked to review the FAS CCO CBA report to consider if:
a. The methodological approach to undertaking a high level analysis of an operation outcome is appropriate in this context and includes all relevant aspects;
b. Adequate allowances have been made for the limitations and biases of the sources of data;
c. It was conducted in line with best practice.
We have expressly not reviewed the financial model nor the individual calculations. Nor have we sought to verify the external data sources themselves.
In this note, we set out our comments on the CBA Report.
General
At the outset, we note that the report is clearly written for an audience familiar with the CCO concept and for those which have been party to consultation discussions regarding the project. As such, it is less easy to follow for readers who have not been party to ongoing discussions on the project. Dependent on the audience for the CBA, the report would benefit from fuller explanation of the
CAP 1062 Annex K: York Aviation Independent Validation Commentary
July 2013 Page 97
background and some of the terms contained within it. This has been addressed to a reasonable extent since the initial draft we reviewed but remains an issue.
There is a general issue which arises throughout the entire analysis, which is the indivisibility of many of the costs and benefits and the extent to which fairly broad brush assumptions have had to be made regarding the attribution to CCOs as part of a wider suite of operational improvements which could arise from the introduction of Performance Based Navigation (PBN). Whilst this is a potential weakness, which could be particularly material under scenarios where the introduction of CCOs is only marginally beneficial on the basis of the analysis undertaken, it is difficult to identify an alternative approach for appraising the costs and benefits of a single specific operational improvement as distinct from measuring the benefits from the introduction of PBN in its entirety. Overall, we accept that the approach taken is reasonable and sensible.
2. Scope and Limitations
We note that the CAA’s aim in this analysis is to identify the strategic benefits to consumers and wider society from the implementation of the Future Airspace Strategy (FAS) or specific components therein. We appreciate that this does not purport to provide the business case for investment by any particular stakeholder. However, we can see a potential weakness in this approach if stakeholder objectives are not aligned as such a strategic approach, in essence, assumes that societal benefits will be capable of being captured through the charging structures (air fares, ATM charges etc) so as to provide funding for the investment. This may not necessarily be so in all cases. This has been acknowledged by the CAA and additional wording has been added to explain the point since the initial draft we reviewed.
3. Design and Methodology
We note that the CBA has quantified costs and benefits to the extent necessary but also described qualitative benefits. We concur that this is consistent with best practice, as set out in the Treasury Green Book, which recognises that in appraising projects not all costs and benefits lend themselves to robust quantification.
5. CCO Assumptions
5.1 Performance Based Navigation
Whilst appreciating that this is largely a context setting section, this is a section which might warrant greater clarity for the more general reader. The CAA has improved the wording in this section in relation to the particular example raised in our initial comments. However, there remain some issues around clarity.

CAP 1062 Annex K: York Aviation Independent Validation Commentary
July 2013 Page 98
5.2 Scenarios
The approach to setting the baseline and scenarios appears reasonable. The limitations of setting the baseline at 2011 and the risk that baseline CCOs could be higher or lower dependent on underlying traffic levels are appropriately acknowledged. Furthermore, sensitivity tests have been carried out to reflect less than 100% implementation of CCOs even in the ‘do something’ scenarios. The scenarios have been set to consider the implications of varying implementation timescales at different airports, albeit all permutations have not been individually modelled. This is reasonable in a high level CBA exercise which is aimed at defining the overall envelope of benefits rather than the specific benefits at the individual stakeholder level.
5.4 Coverage of Costs and Benefits
We note that a sample of airports was selected based, in part, on availability of radar data, albeit with some differences in years. We note that some airports for which data was available have been used as proxies for others in terms of the proportion of CCO operations in the baseline, e.g. Birmingham for Edinburgh, Glasgow etc. Whilst recognising the constraints of available data and the proportionality of considering issues at regional airports where the level of CCO performance is already high, it would be worth noting the potential limitations of this approach in terms of the impact of local circumstances. For example, Birmingham lies in a very complex piece of airspace and as such might be expected to have a lower proportion of CCOs than at least some of the other regional airports grouped with it which operate in less complex airspace. CAA has recognised that this is an area of uncertainty and this has now been included as an uncertainty in Table 24. As this is not a problem that can be solved, this is a sensible approach.
We note that the full costs of the airspace redesign programmes has been included in each case (paragraph 5.3.7), even though this will cover airports not specifically included within the CBA. We agree that this is the prudent approach, along with estimating costs for users transiting the airspace, as set out in paragraph 5.3.9.
5.6 Aircraft Categories
It would seem reasonable to include some form of sensitivity test for changes to the technologies of aircraft, i.e. for lower fuel burn, to show how sensitive the results are to the assumption of no effective change to 2011 fleets.

CAP 1062 Annex K: York Aviation Independent Validation Commentary
July 2013 Page 99
5.8 Airport Capacity
Given the ongoing work of the Airports Commission, it is reasonable for the CBA to have been undertaken on the assumption of no additional airport capacity in the South East of England.
5.9 Price Levels
The fuel price assumptions adopted for the CBA appear reasonable. The Annual Energy Outlook 2012 published by the U.S Energy Information Administration is a commonly used source for this information and should provide an independent view. Equally, we note the comments regarding the volatility of fuel prices in recent years and concur with this view. Given this volatility it may be helpful to consider some sensitivity tests around the influence of fuel prices. The CAA concur that sensitivity testing in this area would be helpful but given timescales and uncertainty around volatility, this has not been addressed at this time. Some additional wording has been included since the additional draft to recognise the issue as an uncertainty.
5.14 Discount Rate
Given that the audience for this CBA is presumably UK based, it might have been preferable to present the Treasury Discount Rate of 3.5% as the prime case.
6. CCO Benefits
6.2 Noise Benefits
We would concur with the authors with regards to the WebTAG methodology in relation to noise benefits. We would also be concerned that the WebTAG methodology does not specifically relate to air transport noise. As stated, a neutral assumption seems more robust.
Other Unquantified Benefits
We note the descriptions of other non-quantifiable benefits and agree with this treatment. Generally, these would be expected to have some positive benefits, reinforcing the conservatism in much of the approach.
7. Direct CCO Costs
7.1 Attributing Costs
It is in this area that the indivisibility of costs gives some potential weakness in the approach. Although uncertainty about the quantum of costs is cited in Table 26, there should also mention about the uncertainty in making the apportionment of costs on a somewhat arbitrary basis. That said, the basis upon which the cost apportionment has been made seems reasonable in the circumstances – the

CAP 1062 Annex K: York Aviation Independent Validation Commentary
July 2013 Page 100
desire to isolate the costs and benefits of CCOs from other potential performance improvements – and in line with normal practice in such circumstances. It is, however, a potentially significant area of uncertainty which needs to be highlighted in presenting the results. The position around this issue has been clarified since the initial draft we reviewed but ultimately it remains a weakness, albeit that we accept that the CAA’s approach is sensible and reasonable.
7.2 Aircraft Equipage
This appears to be another area where the approach is conservative, by taking the number of RNAV1 capable aircraft based on 2010 data as the basis for estimating the costs.
7.3 Airspace Modernisation
We have commented above on the potential weakness in the simple apportionment of the costs of the major airspace redesign programmes. We note that a range has been applied to total costs but not to apportionment. Again, the CAA has added wording to ensure clarity around the issues of apportionment of costs and the consequent uncertainties arising but this remains a weakness.
11. Distributional Analysis
Broadly, this analysis seems reasonable but the benefits to airports would probably warrant some discussion in Section 5. As a general point, the document refers to “benefits to airports” when presenting the results. More accurately, this is benefits realised at airports as the airport operator will not necessarily be a direct beneficiary. This may reflect in part the lack of involvement by airports to date (Appendix B) in developing the CBA approach.
Conclusions
Overall, whilst we have noted some areas of weakness above, these are largely areas of unavoidable uncertainty in the inputs rather than in the implementation of the CBA approach.
The greatest area of weakness remains the difficulty of accurately apportioning costs to the implementation of one procedural change out of a suite of changes permitted by PBN and major air space re-design. That said, the approach adopted by the CAA seems the most reasonable which could have been chosen given the desire to assess individual operational improvements separately.
Generally, the data sources appear to be the most appropriate ones and in the main explanation of how these sources have been used is clear.
lc/jb/18.4.13