Polarization and Policy: The Politics of Public Sector ... · Terry M. Moe . William Bennett Munro...
42
Polarization and Policy: The Politics of Public Sector Pensions (forthcoming 2016, Legislative Studies Quarterly) Sarah F. Anzia Michelle J. Schwartz Assistant Professor of Public Policy Goldman School of Public Policy University of California, Berkeley 2607 Hearst Avenue Berkeley, CA 94720 (510) 642-5431 (phone) (510) 643-9657 (fax) [email protected] Terry M. Moe William Bennett Munro Professor of Political Science Department of Political Science Stanford University Encina Hall West, Suite 100 Stanford, CA 94305 (650) 725-8212 (phone) (650) 723-1808 (fax) [email protected] Abstract: For decades, America’s state and local governments have promised their workers increasingly generous pensions but failed to fully fund them, producing a fiscal problem of staggering proportions. In this paper, we examine the politics of public pensions. While mainstream theoretical ideas in the American politics literature would suggest the pension issue should be polarized, with Democrats pushing for generous pensions over Republican resistance, we develop an argument—rooted in more traditional theoretical work by Schattschneider, Lowi, Wilson, and others—implying that both parties should be expected to support generous pensions during normal times, and that only after the onset of the Great Recession, which expanded the scope of conflict, should the parties begin to diverge. Using a new dataset of state legislators’ votes on hundreds of pension bills passed between 1999 and 2011, we carry out an empirical analysis that supports these expectations.
Transcript of Polarization and Policy: The Politics of Public Sector ... · Terry M. Moe . William Bennett Munro...

Polarization and Policy: The Politics of Public Sector Pensions
(forthcoming 2016, Legislative Studies Quarterly)
Sarah F. Anzia Michelle J. Schwartz Assistant Professor of Public Policy
Goldman School of Public Policy University of California, Berkeley
2607 Hearst Avenue Berkeley, CA 94720
(510) 642-5431 (phone) (510) 643-9657 (fax) [email protected]
Terry M. Moe
William Bennett Munro Professor of Political Science Department of Political Science
Stanford University Encina Hall West, Suite 100
Stanford, CA 94305 (650) 725-8212 (phone)
(650) 723-1808 (fax) [email protected]
Abstract: For decades, America’s state and local governments have promised their workers increasingly generous pensions but failed to fully fund them, producing a fiscal problem of staggering proportions. In this paper, we examine the politics of public pensions. While mainstream theoretical ideas in the American politics literature would suggest the pension issue should be polarized, with Democrats pushing for generous pensions over Republican resistance, we develop an argument—rooted in more traditional theoretical work by Schattschneider, Lowi, Wilson, and others—implying that both parties should be expected to support generous pensions during normal times, and that only after the onset of the Great Recession, which expanded the scope of conflict, should the parties begin to diverge. Using a new dataset of state legislators’ votes on hundreds of pension bills passed between 1999 and 2011, we carry out an empirical analysis that supports these expectations.

1
The economic downturn of 2008 plunged America’s state and local governments into
financial trouble, leading to widespread layoffs of public workers and cutbacks in public
services. Since then the economy has slowly improved, yet most of these governments face a
challenging future—due to an unresolved policy problem that threatens their financial well-
being, and with it their capacity to provide a full range of public services to their citizens. The
problem is the unfunded cost of public sector pensions.
Before the Great Recession, this problem attracted little public attention. But with the
steep drop in the stock market, the assets of state and local pension funds plummeted and left
many seriously underfunded—and very much in the public spotlight. As financial economists
and credit-rating organizations weighed in, moreover, analysis revealed that the underfunding
problem was far more severe than the governments’ own data suggested—between $1.1 trillion
and $3.8 trillion, depending on the underlying assumptions (Munnell, Aubry, and Cafarelli,
2014)—and that it was not simply due to the recession-caused decline in asset value. The
problem was chronic and many years in the making, rooted in widespread departures from sound
accounting practices, with governments offering their workers increasingly valuable pensions but
failing to make the up-front payments necessary to fund them (e.g., Novy-Marx and Rauh, 2009;
Kiewiet and McCubbins, 2014).
Detroit has gone bankrupt, as have Stockton, San Bernardino, Vallejo, and Central Falls,
with pensions playing a key role. More cities are likely to follow. Others are devoting much
larger shares of their budgets to pension costs, crowding out other services. Under current law,
states cannot go bankrupt. But ballooning pension costs are staking ever-larger claims to their
revenues, squeezing services, and imposing austerity. Going forward, rising pension costs will
likely continue to be one of the major challenges confronting state government.

2
This paper explores the politics of public sector pensions. One of our aims is to shed new
light on the political sources of the nation’s pension problem: a problem of profound
consequence that is well worth studying as a significant realm of American government and
politics (Thom, 2013; Kiewiet, 2010).1 Our second aim is an analytical one. The pension issue,
as we will show, offers an instructive case for analysis—for it reveals a pattern of politics
strikingly inconsistent with mainstream theoretical ideas that, for well over a decade, have
structured the way political scientists tend to think about the politics of public policy.2
A mainstream approach to studying pensions would start with the polarization that has
gripped the nation in recent decades and the literature that, in documenting its growth with great
sophistication, has profoundly shaped scholarly thinking. Scholars widely agree, for example,
that the congressional parties have grown distant from one another ideologically along the left-
right continuum; that these same partisan divisions are present among America’s political elites
and activists; and that over the years a broad range of policy dimensions—civil rights, abortion,
and religion, for example—have been absorbed into this same ideological continuum, reinforcing
party conflict (Poole and Rosenthal, 2007; Barber and McCarty, 2013; Layman, Carsey, and
Horowitz, 2006). Recent work has shown, as well, that polarization at the state level is
comparable to what is observed at the national level (Shor and McCarty, 2011).
The pension issue would appear to be a set-up for polarized conflict between the parties.
It is clearly a labor issue, and labor issues have been a defining component of the left-right
continuum; indeed, as Jochim and Jones (2012) have shown in an analysis of congressional
voting on 18 policy dimensions, labor issues stand out as among the most polarized. The pension
issue is also a fiscal issue of spending and taxing, which, again, is a classic source of party
conflict. There is good reason, then, for expecting Democrats and Republicans to be squared off

3
against one another in polarized conflict—with Democrats, as the allies of unions and proponents
of a more active government, strongly favoring more generous pensions, and Republicans, as
union adversaries and proponents of a less active government, opposing them. This polarized
dynamic, in turn, points to a simple bottom line in explaining why the nation is faced with such a
serious pension problem: the Democrats did it—and they did it over Republican opposition.
But is there validity to this story? Our argument here is that, however prevalent
polarization may seem throughout American politics, and however plausible such a theoretical
account may seem for pensions (or any policy issue), there is no substitute for paying closer
attention to the policy itself. As Schattschneider (1935) argued some 80 years ago, policies make
their own politics—and there is a political science literature, much of it developed prior to the
polarization era, that attempts to understand the nature of that connection by training attention on
the policies themselves and linking their specifics to the fundamentals of politics. This more
traditional approach—which, for convenience, we call the Schattschneider approach—leads to a
different set of predictions about the politics of public sector pensions, and suggests a different
take on who is responsible for the nation’s pension problem.
In our empirical study, we put these theoretical ideas to the test by carrying out an
analysis of more than 300 pension bills considered by state legislatures from 1999 through 2011.
The findings show that the pension issue is not polarized—far from it—and that its distinctive
political dynamics are precisely what the Schattschneider approach leads us to expect. The result
is a better understanding of the pension issue itself—and a basis for arguing that, while
polarization is surely pervasive and rightly at the core of scholarly thinking, an approach that
pays closer attention to the policies themselves has much to contribute in explaining legislative
behavior and the politics of public policy.

4
A Schattschneider Approach to Pensions
The overarching theme that policies make their own politics is familiar to all political
scientists, as are the classic contributions that buttress it. Scholars such as Schattschneider (1935,
1960), Lowi (1964), Olson (1965), and Wilson (1980) put the focus on each policy’s connection
to certain fundamentals—having to do, for example, with interest groups and the logic of
collective action, the distribution of costs and benefits across constituencies, political salience,
and the scope of conflict—that structure the dynamics of politics, and may vary from issue to
issue and over time. These contributions have long been put to coherent, productive use in
various subfields of the discipline, including American political development, public policy, and
comparative politics (see, e.g., Baumgartner and Jones, 2010; Hacker, 2002; Patashnik, 2008).
Even so, in the theory and research that have most animated the field of American politics in
recent years, captured scholarly attention, and defined what many see as its cutting-edge
contributions, this Schattschneider tradition of theoretical thinking has fallen into disuse.
Precisely because this is so, new work is beginning to emerge that calls for bringing it back to
center stage in order to gain a deeper, more variegated perspective on the politics of public
policy (Hacker and Pierson, 2014; Bawn et al., 2012).
What does this approach imply for the politics of pensions? We can begin by noting that,
until the Great Recession, pensions were not in the headlines,3 opinion polls ignored the topic,4
and there is no evidence that average voters cared about the issue. This was a classic case of an
inattentive public (e.g., Schattschneider, 1960; Arnold, 1990). One group of voters, however,
stood out as an exception: public sector workers—who had incentives to care about the issue,
and to reward supportive politicians. Democratic politicians clearly had reason to be responsive
to these voters in expanding pensions. But so did Republicans—for they were under no voter

5
pressure to be opposed, and there was potential gain from supporting voters who were paying
attention.
The interest group system was similarly unbalanced. Public employees in many places
were represented by public sector unions, which had strong incentives to use their influence in
elections and lobbying to promote favorable action on pensions.5 Yet there were no interest
groups on the other side: a standard outcome, as Olson (1965) and Wilson (1980) argue, of
policies with concentrated benefits and distributed costs. As union allies, Democrats had
incentives to take the lead in pushing for generous pensions. But Republicans had reason to go
along, as there were no interest groups to reward them for being opposed.6
The incentives for bipartisanship were reinforced, moreover, by the myopic political
calculations that pensions induce—another example, as this approach emphasizes, of how the
specifics of an issue determine its politics. Public pensions are financed by employer and
employee contributions to pension funds, where the money is invested to yield assets sufficient
(supposedly) to pay retirees a specified annuity for the rest of their lives. For employees, there is
little risk, as accrued pension benefits are typically protected by state law, and indeed, sometimes
by provisions written into state constitutions.7 The risk is borne by governments, and thus
taxpayers, and it is up to governments to ensure that contributions are sufficient to fund the
payouts retirees have been promised.
Yet politicians don’t have incentives to do that. They are in the position of being able to
promise public workers and their unions much-valued benefits without having to pay the true
costs—for if they fail to make the necessary contributions, the bills won’t come due for many
years, when other politicians and generations of taxpayers will be responsible for paying them.
Thus, current politicians have incentives to behave myopically: by increasing benefits, keeping

6
contributions lower than they should be—and relying on others, in the future, to pay the full
costs (Kiewiet, 2010; more generally, see Nordhaus, 1975).
This is an alluring calculus that knows no party lines. A skeptic might argue that, because
Democrats and unions want these promises to be kept, they would insist on the more costly
contribution levels necessary for full funding. But we question that. With state-controlled
pensions, accrued pension benefits are fortified by strong legal protections in almost all states
(Munnell and Quinby, 2012; Monahan, 2010).8 It will just be someone else’s problem, in the
future, to pay them. In the meantime, Democrats and union leaders have incentives to lock in
high benefit levels, satisfy current constituents, keep contributions low, and free up resources for
spending on other programs. Republicans have incentives to do the same, especially if it frees up
money for the policies they prefer, such as cutting taxes.9
Until the Great Recession, then, with the voter and interest group systems so one-sided,
and with pensions inducing myopic calculations attractive to both parties, the incentives were
nicely aligned in favor of bipartisanship—not polarization. But as Schattschneider (1960)
famously argued, the normal politics of any policy issue can change dramatically with an
expansion in the scope of conflict—and that is precisely what happened with onset of the Great
Recession. Public sector pensions were suddenly so critically underfunded that they required
huge, immediate contributions and threatened to wreak financial havoc on many governments.
Pensions became a salient, much-publicized issue, and as a result, their political environment
radically changed. Voters were presented with far more information on the topic, portraying
public sector pensions as costly to taxpayers and a threat to government. Conservative interest
groups—including the newly formed Tea Party—leaped into action on the pension issue (see,

7
e.g., Sirota, 2013; Reich, 2011; Drum, 2010). The voter and interest group systems were no
longer one-sided.
With such a dramatic expansion in the scope of conflict, this approach argues, comes a
change in policymakers’ incentives (Baumgartner and Jones, 2010). For Republican politicians,
the post-recession environment yielded a newly emergent constituency opposed to “excessive”
public sector pensions and supportive of retrenchments—giving them incentives to “act like
Republicans” by cutting back on government and opposing labor. Democrats still had
constituency-based incentives to be pro-pension. But that would now mean defending past gains
and keeping retrenchment from going too far. The Schattschneider approach thus points to a
more conflictual brand of politics after the recession—and a sharp break from the bipartisan past.
Yet even for the new era, the logic here points to a politics that is not fully polarized. One
reason is that Republicans continued to have public sector workers in their districts, and this
alone gave them reason to moderate their approach to retrenchment. But perhaps the more
profound force for moderation was that the myopic logic of pensions remained just as relevant as
ever, and for politicians of both parties. Yes, the fiscal crisis demanded huge new pension
contributions and basic reforms, but resolving the long-term problem via full funding would be
phenomenally costly and threatening to their popularity. Their incentives, regardless of party,
were to get beyond the crisis with as little political pain as possible, and that meant continuing to
push costs into the future.10
In sum, then, a Schattschneider approach argues that policies shape their own politics,
and it points to fundamentals that, when connected to a given policy, tell us what to expect. In
the case of pensions, this logic implies that prior to the recession, voters were unconcerned and
uninformed about public pensions, and the interest group pressures were one-sided. Democrats

8
and Republicans therefore had incentives to behave in a cooperative, bipartisan fashion—and not
to be polarized. This approach also implies that the Great Recession—which left many public
pensions severely underfunded—triggered an expansion in the scope of conflict: voters were no
longer unconcerned and uninformed, and the interest group system was no longer one-sided. As
a result, policymakers’ incentives changed to promote higher levels of partisanship—levels that
represented a clear break from the past, but still fell far short of polarization.
Data on Public Pension Legislation
Because the vast majority of public employees are members of pension systems
controlled by state governments, our analysis focuses on state legislatures, which are the key
decision makers on public pension policies. In studying their decisions, we take advantage of a
database compiled by the National Conference of State Legislatures (NCSL).11 For each year
starting in 1999, the NCSL tracked and summarized pension bills enacted by each of the 50 state
governments (excluding minor bills deemed of little interest), yielding a rich source of
information on pension decisions.
For the years 1999-2011, we coded each bill according to whether it expanded or reduced
pension benefits. The most basic expansions involved changes in the benefit formulas, but
benefits were expanded by other means as well—e.g., by shortening the vesting period, allowing
spouses to collect benefits, or allowing employees to purchase service credit for years they did
not work.12 We coded as a reduction any bill that decreased benefits, restricted benefit options
(such as the purchase of service credit), or increased payroll contributions.13
We should emphasize that our coding captures the changes in state pension policies, as
well as the direction of those changes. As a practical matter, it does not attempt to measure the
financial magnitudes or expected impacts associated with each legislative decision—figures that

9
are unavailable in the NCSL data (or any data set), and about which, even on high-profile bills,
experts can wildly disagree. From a reading of the bills, however, it is clear that some—for
example, those applying only to elected officials or judges—are exceedingly limited in scope,
and we have eliminated them from the data set.
Trends in Public Pension Legislation, 1999-2011
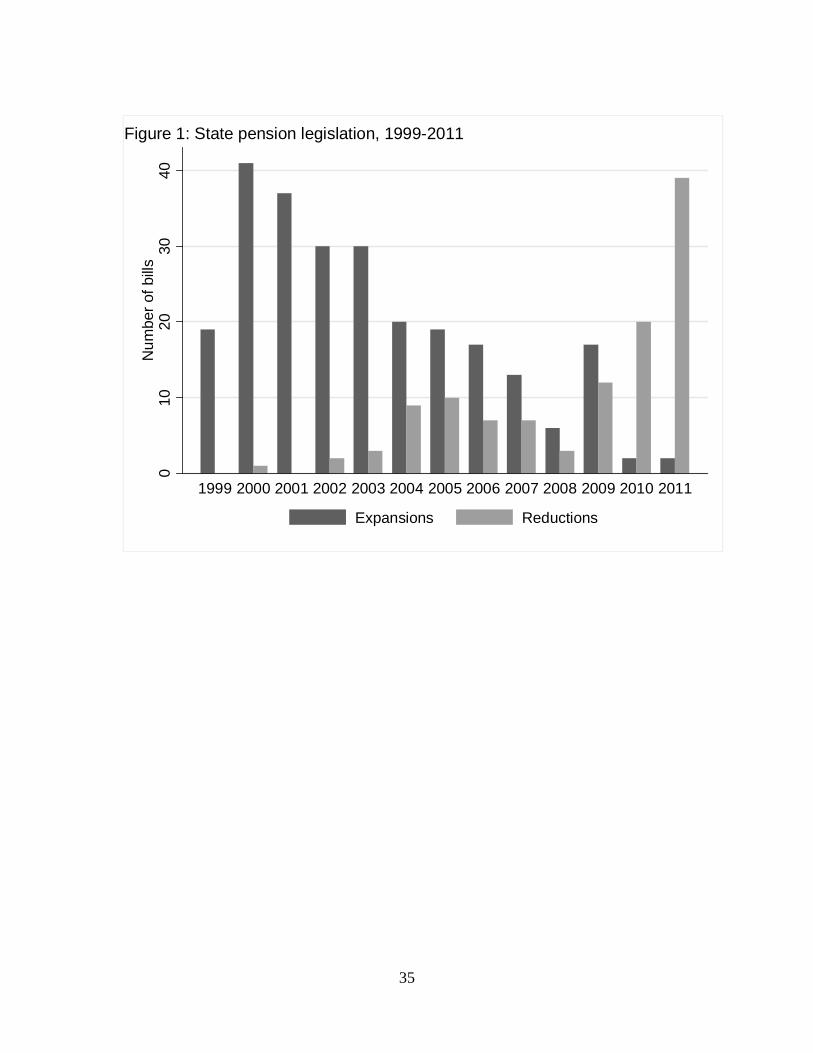
Our coding produced a dataset of 366 pension bills adopted by state legislatures between
1999 and 2011.14 In Figure 1, we plot the number of expansion and reduction bills for each year,
and the pattern is striking. It is immediately apparent that this thirteen-year period can be roughly
divided into two phases: an expansionary phase that lasted until the onset of the Great Recession,
and a retrenchment phase that took hold thereafter.
[Figure 1 here]
The first three years covered by our data were truly remarkable: states across the country
enacted 97 new laws that expanded pensions for public employees. And those expansionary bills
were not limited to just a few states: 34 states made their pension systems more generous during
this time. Even more striking is that only a single state reduced pensions (South Dakota). This
was an active expansionary period for public pensions, and governments from California to
Wyoming were taking part.
The economy temporarily turned sour in 2001, and the period from 2002 to 2008 saw the
passage of some bills that reduced pensions. But as the figure shows, benefit increases remained
the norm. State governments passed a total of 135 pension increases during these years, and less
than a third as many decreases. Even in 2009, after the housing bubble had burst and the Great
Recession had taken hold, some state legislatures were still passing bills that increased benefits.

10
But then the pendulum swung abruptly in the other direction. Of the 63 pension bills in 2010 and
2011, 59 were retrenchments.
Even these numbers, which document a consistent march toward pension expansion from
1999 to 2008, understate the seriousness of the problem state governments were creating for
themselves. For the most part, the benefit increases applied to all employees, and sometimes
retroactively to those already retired; and these increases were typically permanent and could not
be reduced for those workers actually receiving them, due to the legal protections built into state
law and court decisions (Munell and Quinby, 2012; Monahan, 2010). Because of those legal
protections, most of the subsequent pension decreases could only apply to new employees—and
could not, without large increases in contributions, actually make up for the underfunding
problem the earlier promises had helped to create.
The sheer numbers, then, cannot reveal everything that was going on during this period.
Even so, Figure 1 is a vivid display of key developments. During the early and mid-2000s, state
legislatures were actively engaged in passing bills that made pensions more generous—but all
that changed with the Great Recession, as state governments rushed to retrench.
Inside the Legislature: Pensions and Partisanship
Having established what pension changes the states enacted and when, we now turn to an
investigation of how those changes were made: who supported them, who opposed them, and
how partisan the pension issue was throughout this time period. Were the Democrats (and their
union supporters) responsible for the generosity of states’ pension benefits? Did the Republicans
go along? Did the politics of pension benefits undergo a dramatic change with the Great
Recession and the expansion in the scope of conflict that it generated?
11
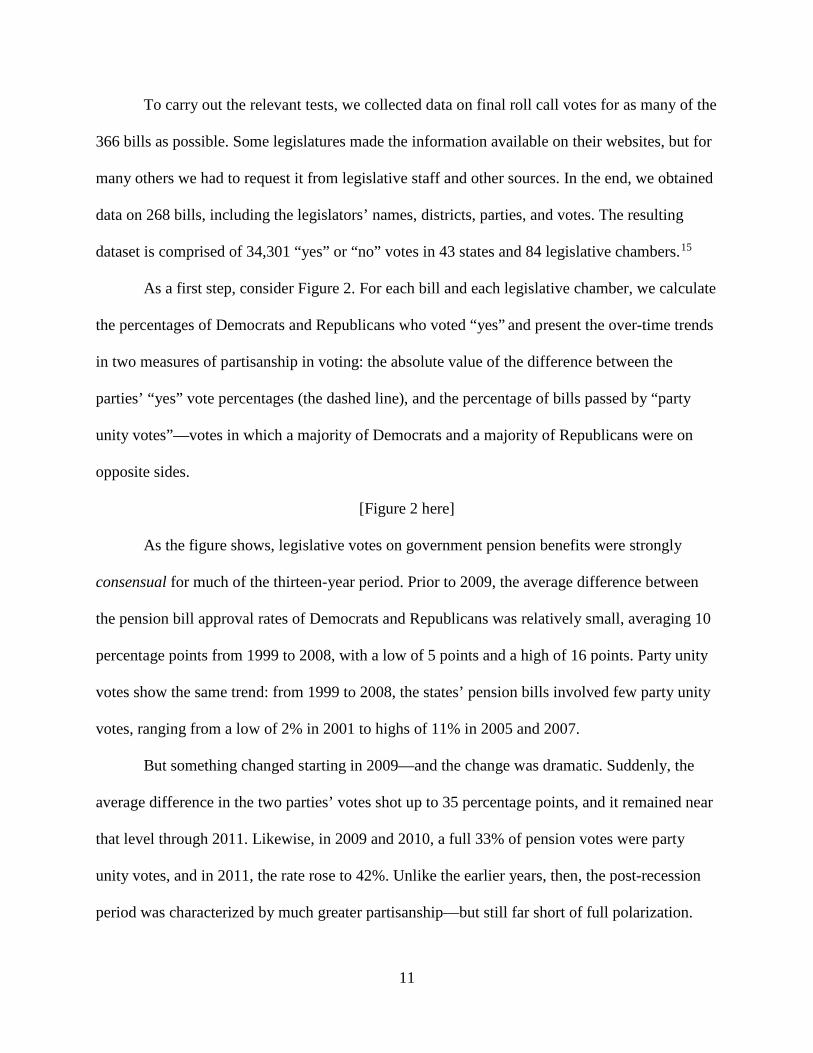
To carry out the relevant tests, we collected data on final roll call votes for as many of the
366 bills as possible. Some legislatures made the information available on their websites, but for
many others we had to request it from legislative staff and other sources. In the end, we obtained
data on 268 bills, including the legislators’ names, districts, parties, and votes. The resulting
dataset is comprised of 34,301 “yes” or “no” votes in 43 states and 84 legislative chambers.15
As a first step, consider Figure 2. For each bill and each legislative chamber, we calculate
the percentages of Democrats and Republicans who voted “yes” and present the over-time trends
in two measures of partisanship in voting: the absolute value of the difference between the
parties’ “yes” vote percentages (the dashed line), and the percentage of bills passed by “party
unity votes”—votes in which a majority of Democrats and a majority of Republicans were on
opposite sides.
[Figure 2 here]
As the figure shows, legislative votes on government pension benefits were strongly
consensual for much of the thirteen-year period. Prior to 2009, the average difference between
the pension bill approval rates of Democrats and Republicans was relatively small, averaging 10
percentage points from 1999 to 2008, with a low of 5 points and a high of 16 points. Party unity
votes show the same trend: from 1999 to 2008, the states’ pension bills involved few party unity
votes, ranging from a low of 2% in 2001 to highs of 11% in 2005 and 2007.
But something changed starting in 2009—and the change was dramatic. Suddenly, the
average difference in the two parties’ votes shot up to 35 percentage points, and it remained near
that level through 2011. Likewise, in 2009 and 2010, a full 33% of pension votes were party
unity votes, and in 2011, the rate rose to 42%. Unlike the earlier years, then, the post-recession
period was characterized by much greater partisanship—but still far short of full polarization.

12
To test whether the year-to-year differences in partisanship are statistically significant,
we regress the party difference measure on binary indicators for each year (taking 1999 as the
base), clustering standard errors by state. See model 1 of Table 1. The findings show that party
differences were consistently small prior to 2009, and that none were statistically significant. In
2009, 2010, and 2011, however, these differences grew larger and statistically significant—
confirming that it was only with the onset of the Great Recession that pensions became a more
partisan issue.
[Table 1 here]
The recession was a watershed event, because it quickly led to a dramatic free-fall in the
assets of state and local pension funds—making the underfunding problem a matter of great
governmental and expert concern, and, for the first time in modern history, moving pension
policy out of the political shadows, into the wide-open, more democratically volatile realm of
intense public scrutiny. The recession expanded the scope of conflict—and the behavior of
legislators changed along with it, as we should expect.
As a way of investigating whether this shift in public salience did indeed occur, we
counted the number of stories about U.S. state and local public pensions published each year by
the two largest national newspapers—the New York Times and the Wall Street Journal—as well
as three midsize newspapers with a more regional focus: the Denver Post, the St. Petersburg
Times, and the Orange County Register. The solid line in Figure 3 plots the number of New York
Times stories, the long-dashed line shows the number of Wall Street Journal stories, and the
short-dashed line is the sum of the number of stories published by the three midsize
newspapers.16 Clearly, there was little coverage of state and local pension issues in the early
years of our analysis. From 1999 to 2007, the New York Times published an average of only 9

13
stories per year, and the Wall Street Journal published an average of 8. In those same years, the
three midsize newspapers published fewer than 15 stories per year, on average. But then
suddenly, starting in 2008 and 2009, the number of news stories in the two national papers
increased dramatically. In 2008, the New York Times published 40 stories on pensions, and by
2009, the number increased to 68. In 2010 and 2011, it published 75 and 94 stories, respectively.
The pattern for the Wall Street Journal is similar: the number of stories on pensions jumped in
2008 and steadily increased over the next three years: 63 in 2009, 71 in 2010, and 90 in 2011.
The spike in the midsize papers’ coverage came slightly later but was just as pronounced:
together, they published 54 articles in 2010 and 86 in 2011. The timing of this spike in coverage,
moreover, aligns closely with the rise in partisanship on pension issues, as shown by the dotted
line in Figure 3 (which is reproduced from Figure 2). While this evidence is by no means
dispositive, it is at least suggestive that voters likely became much more aware of pension
problems with the sharp increase in information, contributing to the sudden increase in
partisanship.
[Figure 3 here]
As a check, it is reasonable to wonder whether the sharp uptick in partisan voting is
actually due to the changing content of the bills, as the latter period is heavily freighted with
retrenchment bills. To test for this, in model 2 of Table 1, we add an indicator for whether the
bill was a pension reduction. The findings are the same: pension votes were mostly bipartisan
from 1999 to 2008 but became dramatically more partisan in 2009. In addition, we consider
whether the pre-recession bipartisanship persists when we limit the analysis to bills that solely
affected public school teachers—a group that has long divided the parties on many other policy
issues. Tellingly, we find that even in these cases, the pre-recession party difference in voting

14
was a mere 10.9%, which is statistically indistinguishable from the 9.6% rate for bills affecting
other types of employees (p=0.65).
Another potential concern is that the spike in partisanship in 2009 might not be specific
to public pensions—that instead, state legislative partisanship might have suddenly increased on
many issues, perhaps in response to the election of President Barack Obama. To investigate this,
we use Shor and McCarty’s (2011, 2013) estimates of state legislator ideology, which are based
on state legislators’ roll call votes, to plot the distance between the median legislators of each
party in each state legislative chamber and year. (See the online appendix.) We find no evidence
that polarization suddenly spiked in state legislatures in 2009: Some states show a gradual
increase in polarization over time, some show a slight decrease, while other chambers show little
change. But no chamber has a trend similar to the one shown in Figure 2. This suggests that the
pattern we have found is specific to pensions and not part of a general trend in state legislatures.
Consistent with our argument, then, the evidence suggests that the normal politics of
public pension benefits is bipartisan. Only when the Great Recession triggered an expansion in
the scope of conflict—increasing voter awareness and activating anti-pension groups—did the
parties in state legislatures begin to diverge.
Explaining the Increase in Partisanship: Empirical Design
We next move to the individual level and explore the voting behavior of legislators. We
analyze expansion and reduction bills separately, using logistic regression to model our
dependent variable, the individual legislator’s vote (“yes”=1, “no”=0). As predictors we include
the legislator’s party (Republican=1, Democrat=0), an indicator for expanded scope of conflict
(1 for 2009 and after, 0 otherwise), and the interaction between the two. Because many
individuals voted on multiple bills, we cluster the standard errors by legislator.

15
In addition to these basic factors of relevance to the theory, we include other state-level
variables that also may explain legislators’ votes on pensions. First, we control for total state
debt per capita, because legislators’ votes might depend on the fiscal condition of their states
(see, e.g., Thom, 2013). In our expansion model, we also include an indicator of whether the
state government expanded pensions in the previous year, since legislators may be less willing to
support expansions if they did so recently. Likewise, in the model of retrenchment bills, we
include an indicator of whether the state reduced pensions in the prior year.
The theoretical expectations for both expansion and reduction bills are straightforward.
But carrying out the tests for reduction bills runs into an interesting data problem that calls for an
adjustment. Most post-recession bills involve reductions, because the states were under intense
pressure to address the underfunding problem; and we expect Republicans to favor deeper
retrenchments than Democrats, who should try to keep retrenchments to a minimum. Yet what
would this look like in terms of the parties’ voting behavior? Consider the case of California.
In 2012, Democratic Governor Jerry Brown and the Democratic legislature passed a
pension reform bill which capped benefits and raised the retirement age for new hires, and in a
few other ways made modest changes to reduce the state’s pension burden. In the final Assembly
vote, most Democrats voted for the bill, and most Republicans voted against it. Why? Because
this was a Democratic bill forwarded by a Democratic government, and most Republicans
thought the retrenchment didn’t go far enough. As Republican Senator Mark Wyland said, “Each
of us know in our hearts that this is a small, small, small step” (Harmon, 2012).
Our data, of course, cannot capture whether a bill’s reductions “go far enough.” As a
result, if we simply carry out an analysis of legislative voting, Democrats will come across in
these situations as much more favorable to pension reductions than Republicans are—when, in

16
fact, the opposite is true. And California is just an illustration. The same sort of reverse voting
has occurred in many other states, and for the same reason. Our challenge is to get around this
data problem in such a way that we can capture what the votes of legislators really mean, and in
so doing ensure that our statistical analysis provides appropriate tests.
A reasonable solution is to break the reduction bills into two groups, depending on party
control of government. In states where Democrats control the legislature and the governorship,
they are in a position to enact the modest pension reductions they favor—and that Republicans
are likely to oppose for not going far enough. In our voting data, this is what partisan pension
politics should look like in governments controlled by Democrats.
In governments with non-Democratic governments—where Republicans have unified
control (which is often the case) or at least have a veto (because they control one chamber and/or
the governorship)—partisan pension politics should look different. Successful retrenchment bills
must meet Republican approval at some point along the way, and the reductions are likely to
satisfy them and get their votes. In these states, it is the Republicans who are likely to vote “yes”
and the Democrats who are likely to vote “no”—because they think the bills go too far.
With this adjustment in how we approach and analyze the data on retrenchment bills, we
have a simple set of expectations that can readily be tested.
Empirical Results
Our findings are set out in Table 2. In the first column we focus on pension expansion
bills, explaining each legislator’s vote with reference to party affiliation, the scope of conflict
variable, and the interaction of the two (as well as the control variables). The direction and
significance of the estimated coefficients—including combinations of coefficients (see the
bottom of the table)—provide tests of the theoretical expectations, but the findings are easier to

17
interpret if we convert the estimates into predicted probabilities, which we do in Table 3 (using
Clarify 2.0—see Tomz, Wittenberg, and King, 2003).17
[Table 2 here]
The predicted probabilities in Table 3 show that, on bills that expand pensions, the voting
patterns look exactly as we would expect. Prior to 2009, Democrats voted almost universally in
support of benefit increases—but so did Republicans. Specifically, Democrats supported benefit
increases at a rate of 98%, and Republicans went along, supporting increases at a rate of 93%.
After the scope of conflict expanded, Democratic support remained about the same (98.5%)—but
Republican “yes” votes plummeted to 69%. The politics of pension benefit increases had clearly
become more partisan. But it was still not polarized.
What of pension reductions? In the column 2 of Table 2, we include the same variables,
except that we allow the main coefficients to vary depending on whether the bills were enacted
by Democratic unified governments or not. The coefficients are set out in Table 2, but again it is
helpful to turn to the predicted probabilities in Table 3. There, we find that the differences
between the parties were small prior to 2009 on reductions—and they were small regardless of
who controlled state government. During normal times, Republicans and Democrats tended to
vote together on reductions and at levels of support exceeding 90%. Harmony came to an end,
however, when the scope of conflict expanded. Voting became more partisan.
[Table 3 here]
As expected, partisan conflict took different forms depending on who controlled the
government. In governments without unified Democratic control, Republicans continued to
support reduction bills at a high rate of 92% (compared to 93% before the recession), but
Democratic support fell to 71% (compared to 96% before). In governments controlled by

18
Democrats, voting was just as partisan but the roles were reversed: the Democrats continued to
support pension reductions at a high rate of 92%, and Republican support dropped sharply to
50% (as compared to 94% before).18
Turning back to Table 2, we also find that most of our control variables operate in the
expected direction. Support for expansions (reductions) was lower in states that had expanded (or
reduced) pensions the year before. In column 2, we also find that legislators are more likely to
vote “yes” on reductions when state debt is high. However, on pension expansions, we estimate
an insignificant coefficient on state debt. Unlike pension reductions, then, state debt does not
appear to be associated with legislators’ willingness to vote “yes” on increasing pensions.
Given that 2010 saw the election of many new Republican legislators, it is reasonable to
wonder whether the sudden divergence in Democratic and Republican votes on pensions was
caused by changes in the composition of the legislatures—with new, more conservative
Republicans getting elected to office—or by changes in the votes of legislators who were already
in office before the recession, and changed their behavior after 2008. We want to emphasize that
both of these sources of partisan conflict are consistent with our theoretical perspective. It could
be that increased voter awareness and the activation of anti-pension groups led to the election of
more anti-pension Republicans. But the same changes in voter awareness and group activity
could also have caused sitting Republican legislators—mindful of their coming reelection bids—
to become more anti-pension. It is likely that both effects were at work.
However, it might be especially instructive to take a closer look at the legislators who
stayed in office the entire time, because if these legislators actually changed their positions, that
would be a clear indication that new constituency pressures were at work. To find out, we first
limit our models in Table 2 to the legislators who were in office both before and after the
19
recession and voted on pension expansions (or reductions) in both time periods. The results
(presented in the online appendix) show that these Republicans were 14 percentage points less
likely to vote “yes” on pension expansions after 2008. For reductions in non-Democratic unified
governments, Republican support did not change, but Democrats became less likely to vote
“yes” after the recession (by about 10 percentage points). In Democratic unified governments,
the pattern is reversed: Democratic voting on reductions did not change after 2008, but
Republican voting did—by 40 percentage points.
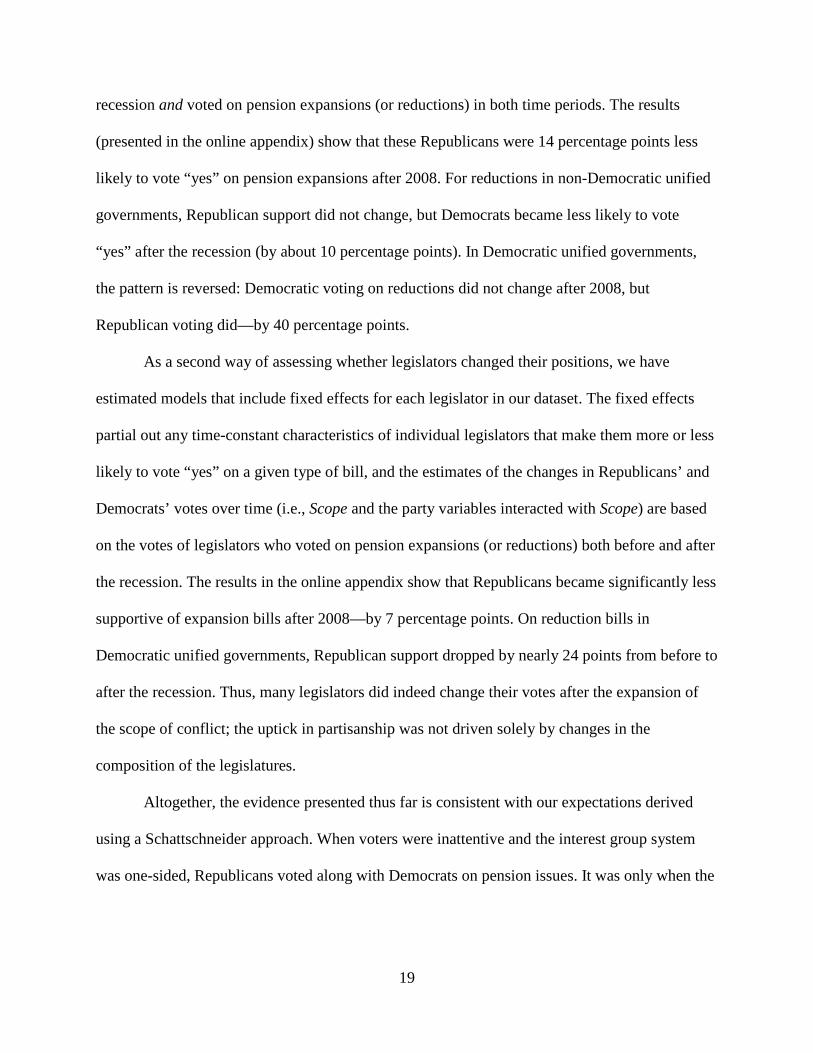
As a second way of assessing whether legislators changed their positions, we have
estimated models that include fixed effects for each legislator in our dataset. The fixed effects
partial out any time-constant characteristics of individual legislators that make them more or less
likely to vote “yes” on a given type of bill, and the estimates of the changes in Republicans’ and
Democrats’ votes over time (i.e., Scope and the party variables interacted with Scope) are based
on the votes of legislators who voted on pension expansions (or reductions) both before and after
the recession. The results in the online appendix show that Republicans became significantly less
supportive of expansion bills after 2008—by 7 percentage points. On reduction bills in
Democratic unified governments, Republican support dropped by nearly 24 points from before to
after the recession. Thus, many legislators did indeed change their votes after the expansion of
the scope of conflict; the uptick in partisanship was not driven solely by changes in the
composition of the legislatures.
Altogether, the evidence presented thus far is consistent with our expectations derived
using a Schattschneider approach. When voters were inattentive and the interest group system
was one-sided, Republicans voted along with Democrats on pension issues. It was only when the

20
recession laid bare the states’ severe pension problems, made the issue politically salient, and
increased voter and group awareness, that the parties’ positions began to diverge.
The Effect of Constituency Pressure
In a final set of tests, we investigate whether the shift from bipartisanship to increased
partisanship was propelled by an increase in competitive pressure from voters and interest
groups, as our theory suggests. To do this, we would ideally want a measure of the relative
strength of pro- and anti-pension interest groups in each state legislative district and year in our
dataset, as well as a district-year-level measure of voters’ attentiveness to and sentiment about
public pensions. Unfortunately, detailed information of that kind is not available. We do,
however, have three proxies for these constituency pressures in each state legislative district,
which we use to carry out preliminary tests of our proposed mechanism.
The first measure comes from Bonica (2014), who uses correspondence analysis of
millions of campaign finance records to create a measure of state legislator ideology. Bonica’s
scores are particularly useful to us because they are constructed from data on campaign
contributions; they therefore reflect the liberalism or conservativism of each legislator’s donor
base.19 We recognize, however, that several of the donors whose contributions are included in
those scores may not have been active on the public pension issue, even after 2008. We therefore
employ two other measures of district-level constituency pressure on state legislators, both of
which capture the strength of voters and groups that were focused on pensions. The first is an
indicator of whether the legislator received campaign donations from public sector unions in her
most recent election,20 and the second is the percentage of the district’s population employed by
government.21 While none of these measures is perfect,22 each captures some aspect of pro- and
anti-pension constituency pressure at the level of the state legislative district.

21
In our discussion to follow, we focus on Republican votes—in particular, Republican
votes on pension expansions and pension reductions in Democratic unified governments. (We
present the full results in the online appendix.) Unlike Democrats, who had incentives to be
responsive to government workers and public sector unions before and after 2008, Republicans
(we argue) experienced a dramatic shift in their constituencies’ attentiveness to the pension issue
with the onset of the Great Recession. The evidence we presented in Tables 2 and 3 is consistent
with that: most Republicans voted with the Democrats prior to the recession, but many of them
(on pension expansions and reductions in Democratic governments) reversed course in 2009. If a
change in constituency pressure is part of the explanation for that, we should also find that
certain Republicans were more likely to reverse course: those with conservative donor bases,
those who did not receive financial backing from public sector unions, and those in districts with
low levels of government employment. Our expectation, then, is that the three district
constituency variables will have little effect on Republican votes prior to the recession but a
significantly bigger effect after the recession.
[Table 4 here]
The relevant tests are carried out in Table 4, but again, the findings are easier to interpret
as predicted probabilities. We start by using the estimates from columns 1 and 2 of Table 4 to
calculate the predicted probability of a “yes” vote for two types of Republicans: those with
conservative donor bases—meaning those with scores at the 90th percentile for their party—and
those with moderate donor bases—those with scores at the 10th percentile. Those probabilities
are shown in panel 1 of Table 5. Next, we replace the donor conservatism measure with the
indicator for public sector union contributions: the coefficient estimates are in columns 3 and 4
of Table 4, and the predicted probabilities are in panel 2 of Table 5. Finally, in columns 5 and 6

22
of Table 4, we measure pressure from voters and interest groups using government employment,
and we calculate probabilities for Republicans with low (10%) and high (23%) levels of
government employment in their districts. Those probabilities are presented in Table 5, panel 3.
[Table 5 here]
Based on the top two rows of each panel in Table 5 (those labeled “Before”), none of the
constituency measures had a sizeable impact on Republican votes before the recession, in line
with our expectations. After the recession, however, we see a different pattern. In panel 1, we
find that Republicans with conservative donors supported pension increases at a lower rate
(65%) than Republicans with moderate donors (74%). They also voted for Democratic pension
reduction bills at lower rates (24%, compared to 59%). This pattern is consistent with our
argument that a rise in constituency opposition contributed to the increase in partisanship:
Republicans more dependent on conservative donors were more likely to deviate from the pre-
recession norm of bipartisanship than Republicans with more moderate donors.
When we use the two pension-specific measures of constituency pressure, we also find
support for our argument. In panel 2 of Table 5, we find that after the recession, Republicans
who received campaign funding from public sector unions were more likely to support pension
increases (76%) than Republicans who did not receive support from unions (61%). Likewise, in
panel 3, we find that 83% of Republicans with high government employment in their districts
voted “yes” on pension increases, compared to only 60% of Republicans with low government
employment. Our findings on pension reductions are more mixed, but generally still supportive.
On the one hand, Republicans from districts with high and low levels of government
employment did not differ significantly in their treatment of Democratic retrenchment bills.
However, union financial support did make a difference, as we show in panel 2: Republicans

23
with union backing were significantly more likely to vote for Democratic pension reduction bills
(47%) than Republicans without union backing (32%).
These results are preliminary, but the general direction is clear: after the recession,
certain Republicans were more likely than others to defect from the pre-recession norm of
bipartisanship.23 We propose that these differences among Republicans arose because they were
responding to newly-attentive opposition constituencies—and the strength of those
constituencies, as well as the strength of government employees and their unions, varied across
the districts they represented. As we’ve said, more detailed measures are simply unavailable for
the pension-specific preferences and attentiveness of voters and interest groups in each of the
thousands of state legislative districts and years in our dataset. But our empirical tests, using
three reasonable proxies for constituency pressures, conform to our expectations. All in all, our
findings suggest that the rise of anti-pension competitive pressures did affect the votes of
Republicans—and helped to promote a new and more contentious politics of public pension
benefits.
Discussion
For many American state and local governments, the fiscal burden of underfunded
pensions is staggering. Even as reforms proceed, and in part because of them, the ongoing costs
of operating public pension funds will be much greater than in the past, consume larger
proportions of tax revenue, and crowd out funding for many public services of great value to
citizens—education, police and fire protection, public parks, and more (Kiewiet and McCubbins,
2014).
This paper is an effort to shed new light on the politics of pensions, and thus to better
understand a policy issue of profound importance for American government. As we study the

24
partisan politics of the pension issue, moreover, our second aim is to show that it can serve as an
instructive case that speaks to the ways that political scientists think about and study the politics
of public policy.
For well over a decade, mainstream thinking on the politics of public policy has been
heavily shaped by the technically sophisticated, highly developed literature on polarization,
which has been right at the center of the American politics field. We argue that there is much to
be gained by looking outside the mainstream. Specifically, we take advantage of a more
traditional political science literature that—in part because of polarization’s analytic
prominence—has largely been pushed to the periphery, but continues to hold great value.
The polarization literature implies that the pension issue—because it is a labor issue, as
well as an issue of taxing and spending—lies squarely on the traditional left-right dimension of
partisan conflict, and thus should tend to be polarized: with Democrats pushing for increasingly
generous pension benefits, and Republicans opposing them. The more traditional approach—
arising from the work of Schattschneider, Olson, Lowi, and Wilson, among others—begins with
the notion that policies make their own politics; and it proceeds by linking the specifics of
policies to the fundamentals of politics, leading to very different and more nuanced predictions.
In particular, it leads us to recognize that, during the normal times that prevailed for
many years, the pension issue was characterized by distinctive political conditions—lack of
salience, uninterested and uninformed voters, a one-sided interest group system, and politicians
motivated to offer valuable pension benefits without paying the full cost—that were a setup for
bipartisanship and cooperation, not polarization. It also leads us to expect that, as these
conditions came to an end with the Great Recession—which brought pensions into the public
spotlight, expanded the scope of conflict, and (partially) changed the incentives of politicians—

25
the result would be higher levels of partisan conflict, and thus a change in pension politics. But
still no polarization.
These expectations are borne out in our data on pension legislation. We find that, during
the normal times that prevailed pre-recession, state legislatures tended to increase the generosity
of public pensions, and voting patterns were heavily bipartisan. Democrats and Republicans were
essentially on the same team. After the expansion in the scope of conflict, their voting patterns
underwent a dramatic shift—with Republicans pushing for pension cutbacks and Democrats
trying to moderate the retrenchments. Politics became more partisan, but not polarized.
As the pension case well shows, the basic features of any given policy can have important
consequences for politics. And had we not looked for these features in the case of pensions—and
known, via theory, what to look for in connecting them to politics—we would have had little
basis for understanding why politicians dealt with the generosity of pension benefits as they
actually did. While more research is surely needed to explore the full range of policies in ways
this more traditional approach would suggest, pensions are not alone in departing from the
polarization that characterizes many issues in American politics: distributive policies (such as
transportation) clearly do not fit the mold, and Jochim and Jones (2012) have found that other
realms of policy, such as agriculture, trade, and science, appear not to be polarized either.
As scholars think about the politics of public policy, then, we agree with Hacker and
Pierson (2014) that there is good reason for “bringing policy back in.” The result over the long
term would be a richer, more fully developed theory that sheds a brighter light on the behavior of
parties and politicians (Bawn et al., 2012), is better capable of spelling out the political
conditions under which public policies do and do not get polarized—and, through a productive
linkage with other literatures, stands to promote progress in the larger discipline.

26
As befits an argument for bringing policy back in, we want to conclude by returning to
the policy itself. This paper’s analysis of the pension issue has focused on the benefits side of the
equation and on key theoretical points that stand to be of broad relevance to the field—but a
comprehensive account of the politics of pensions clearly calls for more research. The small
existing literature on the topic, mentioned earlier, is a useful start. Studies of legislative voting,
such as the one presented here, are indispensable if the basics of pension politics are to be
understood. But research must ultimately connect these policy decisions to their financial
consequences for pension systems, governments, and citizens. Some bills are much more
consequential than others, and these magnitudes must somehow be measured and taken into
account if we are to link politics more directly to the underfunding problem (and others, like the
crowding out of government services).
Future research should also target state pension funds and their governing boards—which
are political creations of state legislatures, are delegated authority to make (some) pension
decisions, often have their decisions overridden by legislatures, and commonly incorporate
representatives of public sector unions. The political dynamics linking them to legislatures—and
underfunding—have never been systematically explored, and they need to be.
As we look ahead, then, we hope that the pressing relevance of public sector pensions—
one of the great challenges facing American governments—will soon be matched by a growing
research literature on their politics. For now, this analysis makes it clear that the polarization that
characterizes so much of American politics, and that might seem to provide an obvious
explanation for the modern pension problem—that the Democrats created it, over the resistance
of Republicans—does not in fact explain it. The underfunding problem plaguing the nation today
was brought about by both political parties, acting together and in harmony.

27
References
Arnold, R. Douglas. 1990. The Logic of Congressional Action. New Haven, CT: Yale University
Press.
Barber, Michael, and Nolan McCarty. 2013. “Causes and Consequences of Polarization.” in Jane
Mansbridge and Cathie Jo Martin, eds., Negotiating Agreement in Politics. Washington,
D.C.: American Political Science Association: 19-53.
Bawn, Kathleen, et al. 2012. “A Theory of Political Parties: Groups, Policy Demands, and
Nominations in American Politics.” Perspectives on Politics 10 (3): 571-97.
Baumgartner, Frank R., and Bryan D. Jones. 2010. Agendas and Instability in American Politics,
2nd ed. Chicago: University of Chicago Press.
Bonica, Adam. 2014. “Mapping the Ideological Marketplace.” American Journal of Political
Science 58: 367-86.
Campbell, Andrea Louise. 2003. How Policies Make Citizens: Senior Political Activism and the
American Welfare State. Princeton: Princeton University Press.
Derthick, Martha. 1979. Policymaking for Social Security. Washington, D.C.: Brookings.
DiSalvo, Daniel. 2015. Government Against Itself: Public Union Power and Its Consequences.
New York: Oxford University Press.
Drum, Kevin. 2010. “The War on Pensions.” Mother Jones (December 22).
Hacker, Jacob S. 2002. The Divided Welfare State: The Battle over Public and Private Social
Benefits in the United States. Cambridge University Press.
Hacker, Jacob S., and Paul Pierson. 2014. “After the Master Theory: Downs, Schattschneider,
and the Rebirth of Policy-Focused Analysis.” Perspectives on Politics 12.
Harmon, Steven. 2012. “California Legislature Sends ‘Sweeping’ Pension Reform to Governor.”
San Jose Mercury News (August 31).

28
Jacobs, Alan M. 2011. Governing for the Long Term: Democracy and the Politics of Investment.
New York: Cambridge University Press.
Jochim, Ashley E., and Bryan D. Jones. 2012. “Issue Politics in a Polarized Congress.” Political
Research Quarterly 20: 1-18.
Kiewiet, D. Roderick. 2010. “The Day after Tomorrow: The Politics of Public Employee
Retirement Benefits.” The California Journal of Public Policy 2 (3), article 3.
..............., and Mathew D. McCubbins. 2014. “State and Local Government Finance: The New
Fiscal Ice Age.” Annual Review of Political Science 17: 105-122.
Layman, Geoffrey C., Thomas M. Carsey, and Juliana Menasce Horowitz. 2006. “Party
Polarization in American Politics: Characteristics, Causes, and Consequences.” Annual
Review of Political Science 9: 83-110.
Lowi, Theodore. 1964. “American Business, Public Policy, Case Studies, and Political Theory.”
World Politics 16: 677-715.
Moe, Terry M. 2011. Special Interest: Teachers Unions and America’s Public Schools.
Washington, D.C.: Brookings Institution Press.
Monahan, Amy. B. 2010. “Public Pension Plan Reform: The Legal Framework.” Education
Finance and Policy 5 (4): 617-46.
Munnell, Alicia H., and Laura Quinby. 2012. Legal Constraints on Changes in State and Local
Pensions. Center for Retirement Research.
Munnell, Alicia H., Jean-Pierre Aubry, and Mark Cafarelli. 2014. The Funding of State and
Local Pensions: 2013-2017. Center for Retirement Research.
Nordhaus, William D. 1975. “The Political Business Cycle.” The Review of Economic Studies 42
(2): 169-90.
29
Novy-Marx, Robert, and Joshua Rauh. 2009. “The Liabilities and Risks of State-Sponsored
Pension Plans.” Journal of Economic Perspectives 23 (4): 191-210.
Olson, Mancur. 1965. The Logic of Collective Action. Cambridge, MA: Harvard University
Press.
Patashnik, Eric. 2008. Reforms at Risk: What Happens After Major Policy Changes Are Enacted.
Princeton, NJ: Princeton University Press.
Poole, Keith T., and Howard Rosenthal. 2007. Ideology and Congress. New Brunswick, N.J.:
Transaction Publishers.
Reich, Robert. 2011. “Republican Class Warfare.” Christian Science Monitor (January 6).
Schattschneider, E.E 1935. Politics, Pressure, and the Tariff. New York: Prentice-Hall.
...............1960. The Semi-Sovereign People: A Realist’s View of Democracy in America. New
York: Holt, Reinhart, Winston.
Shor, Boris, and Nolan McCarty. 2011. “The Ideological Mapping of American Legislatures.”
American Political Science Review 105 (3): 530–51.
Shor, Boris, and Nolan McCarty. 2013. "May 2013 Updated Aggregate Data for Ideological
Mapping of American Legislatures", http://hdl.handle.net/1902.1/21404
UNF:5:Gxvn/P6NkDXQyga+3BnG+A== V1.
Sirota, David. 2013. The Plot against Pensions. Institute for America’s Future.
Thom, Michael. 2013. “All of the Above: How Fiscal, Political, and Workforce Traits Affect
Pension Funding.” State and Local Government Review 45 (3): 163-171.
Tomz, Michael, Jason Wittenberg, and Gary King. 2003. “Clarify: Software for Interpreting and
Presenting Statistical Results. Journal of Statistical Software 8 (1).
Wilson, James Q. 1980. The Politics of Regulation. New York: Basic Books.

30
Table 1. Party difference in voting on public pension bills Model 1 Model 2 2000 0.023 (0.030) 0.023 (0.031) 2001 -0.012 (0.022) -0.012 (0.022) 2002 0.051 (0.059) 0.05 (0.060) 2003 0.033 (0.055) 0.032 (0.057) 2004 0.028 (0.042) 0.026 (0.047) 2005 0.065 (0.056) 0.064 (0.062) 2006 0.021 (0.035) 0.019 (0.037) 2007 0.083 (0.065) 0.082 (0.065) 2008 0.097 (0.108) 0.097 (0.109) 2009 0.289*** (0.081) 0.288*** (0.087) 2010 0.246*** (0.077) 0.242*** (0.087) 2011 0.342*** (0.085) 0.338*** (0.093) Reduction 0.004 (0.038) Constant 0.065*** (0.021) 0.065*** (0.021) R-squared 0.18 0.18 Observations 508 508 Notes: Standard errors clustered by state in parentheses. Dependent variable is the absolute value of the difference between the percentage of Democrats voting “yes” and the percentage of Republicans voting “yes.” The omitted year variable is 1999. * p<0.1; ** p<0.05; *** p<0.01

31
Table 2: Public pensions, political parties, and the scope of conflict Expansions Reductions (1) (2) Scope 0.432** -2.286*** (0.210) (0.145) Republican -1.205*** -0.565*** (0.080) (0.170) Scope*Republican -2.178*** 2.099*** (0.222) (0.188) Democratic Unified -0.232 (0.213) Republican*Democratic Unified 0.375 (0.314) Scope*Democratic Unified 1.775*** (0.260) Scope*Republican*Democratic Unified -4.383*** (0.363) Debt per capita -0.002 0.14*** (0.022) (0.021) Previous Expansion -0.344*** (0.065) Previous Reduction -0.765*** (0.076) Constant 3.758*** 2.804*** (0.083) (0.143) Observations 21,245 10,688 Pseudo R-squared 0.11 0.14 Additional hypothesis tests Scope + Scope*Rep. -1.746*** -0.188 (0.077) (0.120) Scope + Scope*Rep. + Scope*Dem. Unif. -2.795*** + Scope*Rep.*Dem. Unif. (0.232) Scope + Scope*Dem. Unif. -0.511** (0.223)
Notes: Standard errors clustered by legislator in parentheses. In column 1, Scope + Scope*Rep. tests whether Republicans’ rates of voting “yes” were the same before and after the recession. In column 2, Scope + Scope*Rep. tests whether Republicans’ votes were the same before and after the recession in non-Democratic unified governments, and Scope + Scope*Rep. + Scope*Dem. Unif. + Scope*Rep.*Dem. Unif. is the corresponding test for Democratic unified governments. Scope + Scope*Dem. Unified tests whether Democratic voting was the same before and after the recession in Democratic unified governments. All hypothesis tests are two-tailed. * p<0.1; ** p<0.05; *** p<0.01

32
Table 3: Predicted probabilities of voting "yes" on pension bills
Expansions
Democrats before 0.977 Republicans before 0.927
Democrats after 0.985 Republicans after 0.689
Reductions, Non-Democratic Unified Governments
Democrats before 0.961 Republicans before 0.933
Democrats after 0.714 Republicans after 0.920
Reductions, Democratic Unified Governments
Democrats before 0.951 Republicans before 0.941
Democrats after 0.920 Republicans after 0.497

33
Table 4: The change in constituency pressure Expansions Reductions Expansions Reductions Expansions Reductions (1) (2) (3) (4) (5) (6) Scope 0.249 -2.821*** 0.399 -0.913 0.71 -0.496 (0.306) (0.398) (0.542) (0.676) (0.823) (0.807) Republican -1.14*** -2.038*** -1.33*** -0.827* -1.603*** -0.562 (0.144) (0.434) (0.205) (0.471) (0.363) (0.983) Scope*Republican -1.7*** 1.575*** -2.328*** -1.912*** -2.46*** -1.137 (0.353) (0.518) (0.553) (0.720) (0.880) (1.088) Conservative donors -0.07 3.066*** (0.141) (0.410) Scope*Conservative donors -0.236 -4.583*** (0.353) (0.495) Republican*Conservative 0.023 -1.408** (0.186) (0.679) Scope*Rep.*Conservative -0.186 1.333* (0.419) (0.794) Previous expansion -0.407*** -0.362*** -0.305*** (0.069) (0.075) (0.078) Debt per capita -0.016 0.332*** -0.023 0.176** -0.012 0.166** (0.025) (0.068) (0.024) (0.069) (0.028) (0.069) Previous reduction -0.689* 0.319 0.43 (0.377) (0.281) (0.264) Union -0.009 -1.136*** (0.210) (0.433) Scope*Union 0.09 1.082 (0.594) (0.703) Republican*Union 0.198 0.711 (0.231) (0.595) Scope*Rep.*Union 0.422 -0.105 (0.615) (0.839) Government employment 2.663 -0.716 (1.954) (3.931) Scope*Government 1.195 2.827 (5.351) (4.392) Republican*Government 4.593** 2.167 (2.289) (5.535) Scope*Rep.*Government 0.528 -6.858 (5.747) (6.110) Constant 3.766*** 2.963*** 3.772*** 2.836*** 2.913*** 2.081*** (0.107) (0.327) (0.193) (0.430) (0.346) (0.722) Observations 19,474 2,363 15,852 2,270 12,034 2,356 Pseudo R-squared 0.12 0.28 0.13 0.21 0.13 0.20 Constituency pressure effect -0.045 6.582*** 0.189* -0.425 -0.958*** -0.192 for Republicans, before (0.125) (0.900) (0.097) (0.402) (0.160) (0.502) Constituency pressure effect -0.446** -1.510*** 0.701*** 0.552*** -1.185*** 0.341 for Republicans, after (0.191) (0.300) (0.133) (0.199) (0.231) (0.269) Notes: Standard errors clustered by legislator in parentheses. The hypothesis tests at the bottom of the table show the effect of conservative donors in columns 1-2, the effect of public sector union contributions in 3-4, and the effect of high government employment in 5-6. Hypothesis tests are two-tailed. * p<0.1; ** p<0.05; *** p<0.01

34
Table 5: Predicted probabilities of voting "yes" on pension bills
Expansions
Reductions, Democratic Unified
Governments
1.
Before, Moderate Donors 0.929 0.896 Before, Conservative Donors 0.926 0.973 After, Moderate Donors 0.739 0.586 After, Conservative Donors 0.646 0.240
2.
Before, With Union Support 0.928 0.831 Before, Without Union Support 0.915 0.894 After, With Union Support 0.759 0.469 After, Without Union Support 0.610 0.324
3.
Before, High Government Employment 0.949 0.906 Before, Low Government Employment 0.878 0.889 After, High Government Employment 0.828 0.441 After, Low Government Employment 0.597 0.525
35
010
2030
40N
umbe
r of b
ills
1999 2000 2001 2002 2003 2004 2005 2006 2007 2008 2009 2010 2011
Figure 1: State pension legislation, 1999-2011
Expansions Reductions

36
0%
5%
10%
15%
20%
25%
30%
35%
40%
45%
1999 2000 2001 2002 2003 2004 2005 2006 2007 2008 2009 2010 2011
Figure 2: Partisanship on public pension votes
Average Party Difference % Party Unity Votes

37
0%
5%
10%
15%
20%
25%
30%
35%
40%
45%
0
10
20
30
40
50
60
70
80
90
100
1999 2000 2001 2002 2003 2004 2005 2006 2007 2008 2009 2010 2011
Ave
rage
par
ty d
iffer
ence
Num
ber o
f sto
ries
Figure 3: Number of news articles about state and local public pensions
New York Times articles
Wall Street Journal articles
Orange County Register, Denver Post, & St. Petersburg Times articles
Average Party Difference
38
1 Political scientists have done very little empirical research on the politics of public sector
pensions, and the small literature that does exist—mostly a recent development, and very much a
step in the right direction—has so far produced mixed findings. For example, it is not clear
whether party control of state government has an effect on the funding status of public pensions.
2 We are talking about pension systems for public employees. Pension systems for all citizens,
such as Social Security, have been better studied. See Jacobs (2011), Campbell (2003), and
Derthick (1979). For political research on the American social welfare system more generally,
see Hacker (2002).
3 We provide data on news coverage of public pensions below.
4 A search of the Roper Center iPOLL database between 1999 and 2008 reveals only a single
public opinion poll question related to public employees’ pensions—one from 2001 asking
whether teachers’ pension benefits should be made transferable between school districts in order
to alleviate a teacher shortage. Questions about public employees’ pensions were more common
after the recession; for example, there were 7 questions in 2011 and 35 in 2015.
5 On public sector unions and their politics, see DiSalvo (2015) and Moe (2011).
6 With voters so uninformed and apathetic, both parties had incentives to craft pension policies
falling within what Bawn et al. (2012) call the “electoral blind spot” of voters—policies that
please interest groups, but that many voters might oppose if well informed. The twist in the
pension case is that the two parties, rather than crafting different policies to cater to distinctive
groups, had incentives to embrace the same “blind spot” policy to please (or avoid offending) the
same interest group.
7 For details on variations in state law, see Munnell and Quinby (2012) and Monohan (2010).

39
8 This logic for state-controlled pension funds may not apply with equal force for local pension
funds, because local governments can declare bankruptcy and put pensions at risk. That is what
happened in Detroit, for example, where a federal bankruptcy judge approved a (small) scale-
back in benefits. Yet local bankruptcies are so rare and so recent that it is questionable whether
politicians and unions have worried much about these risks over past decades.
9 The bipartisan behavior expected here does not mean that no Republicans would ever oppose
pension increases. Republicans tend to have more conservative constituencies and to be less
amenable to spending and taxing than Democrats, and some opposition would seem likely. The
point is simply that during normal times the triggers of Republican opposition were not
operating.
10 Note that the post-recession salience of pensions may well fade in future years as states adopt
partial reforms and the sense of crisis recedes—suggesting that, long term, the current structure
of partisan conflict may not represent a stable equilibrium (see, more generally, Baumgartner and
Jones, 2010).
11 See the NCSL, “Past Years’ Annual Enacted Legislation Summaries,” available at
http://www.ncsl.org/issues-research/labor/pension-and-retirement-legislative-summaries-and-
r.aspx.
12 In principle, bills that decreased employees’ contributions should also be considered
expansions, but the NCSL database includes few such bills (only eleven)—perhaps because
decisions to decrease employee contributions are often made locally through collective
bargaining, not by state legislatures. This is the one area of pension politics where our focus on
legislation probably misses most relevant decisions. For this reason, we exclude the eleven bills
that decreased employee contributions from our analysis.

40
13 For a detailed description of the content of these bills, see the online appendix. The NCSL
database also includes information on decisions to increase or decrease the contributions of
employers (governments). However, these bills are often ambiguous in meaning. When the
legislature “lowers” government pension contributions, it is allowing governments to contribute
less than they otherwise would under the previous formula—but the new dollar amounts may
actually be greater than the original amounts. It is a matter of interpretation whether the
legislature is lowering contributions or increasing them. Adding to the ambiguity, the new
contribution levels may apply just for certain years and then automatically adjust to another
higher or lower level. For these reasons, we focus our analysis on legislative decisions about
benefits—which can be coded without ambiguity, and about which we have clear theoretical
expectations.
14 We eliminate 17 bills that included both expansions and reductions. We also drop bills that did
not enact the types of changes we described above. In addition, we exclude Nebraska because it
has a nonpartisan legislature.
15 We exclude legislators who were absent, excused, who abstained, or who voted “present.” We
also drop independents. We classify members of the Green, Progressive, and Working Families
parties as Democrats.
16 The numbers for each of the midsize newspapers are shown in the online appendix.
17 For all predicted probabilities, state debt per capita is set at its mean, and the indicators for
prior-year expansions and retrenchments are set at zero.
18 In the online appendix, we carry out the same analysis using ordinary least squares rather than
logistic regression, and we also run models that include state fixed effects. For both, our
estimated marginal effects are nearly identical.

41
19 The measure we use in this analysis is constant for individual legislators over time; in our
dataset, the scores range from -3.5 (most liberal) to 3.8 (most conservative). We are missing
scores for most legislators who came into office via elections prior to 2000.
20 These data come from the National Institute on Money in State Politics (NIMSP), as compiled
by Bonica (2014). The NIMSP data begin in 2000, so we are missing campaign finance records
for some votes in our dataset.
21 The data, from the U.S. Census, are only available according to boundaries drawn during the
2000 redistricting.
22 For example, it is possible that union contributions are endogenous if they are influenced by
legislators’ votes on pensions. Also, as we discussed, we would like to have separate district-by-
year measures of voter attentiveness and interest group activity rather than measures that capture
both factors, but such measures are not available. That said, the measures we use here are
reasonable, we think, because the change in constituency pressure from voters and interest
groups likely moved in the same direction.
23 In the online appendix, we limit the expansion models to legislators who were in office and
voted on pension expansions both before and after the recession, and our findings are
substantively the same. While we would like to do the same analysis for pension reductions in
Democratic unified governments, there are only 93 legislators in two states who voted on
pension reductions in Democratic unified governments both before and after the recession.