
Pitching Staff Management: A New Way of Thinking
40
PITCHI G Staff Management: A New Way of Thinking
-
Upload
nelson-gord -
Category
Sports
-
view
871 -
download
2
Transcript of Pitching Staff Management: A New Way of Thinking

PITCHI GStaff Management: A New Way of Thinking
“The definition of insanity is repeating the same behaviors and expecting a different
outcome.”
Albert Einstein
“If everyone was not already doing it this way, is this the way that you would start?”
Peter Caliendo
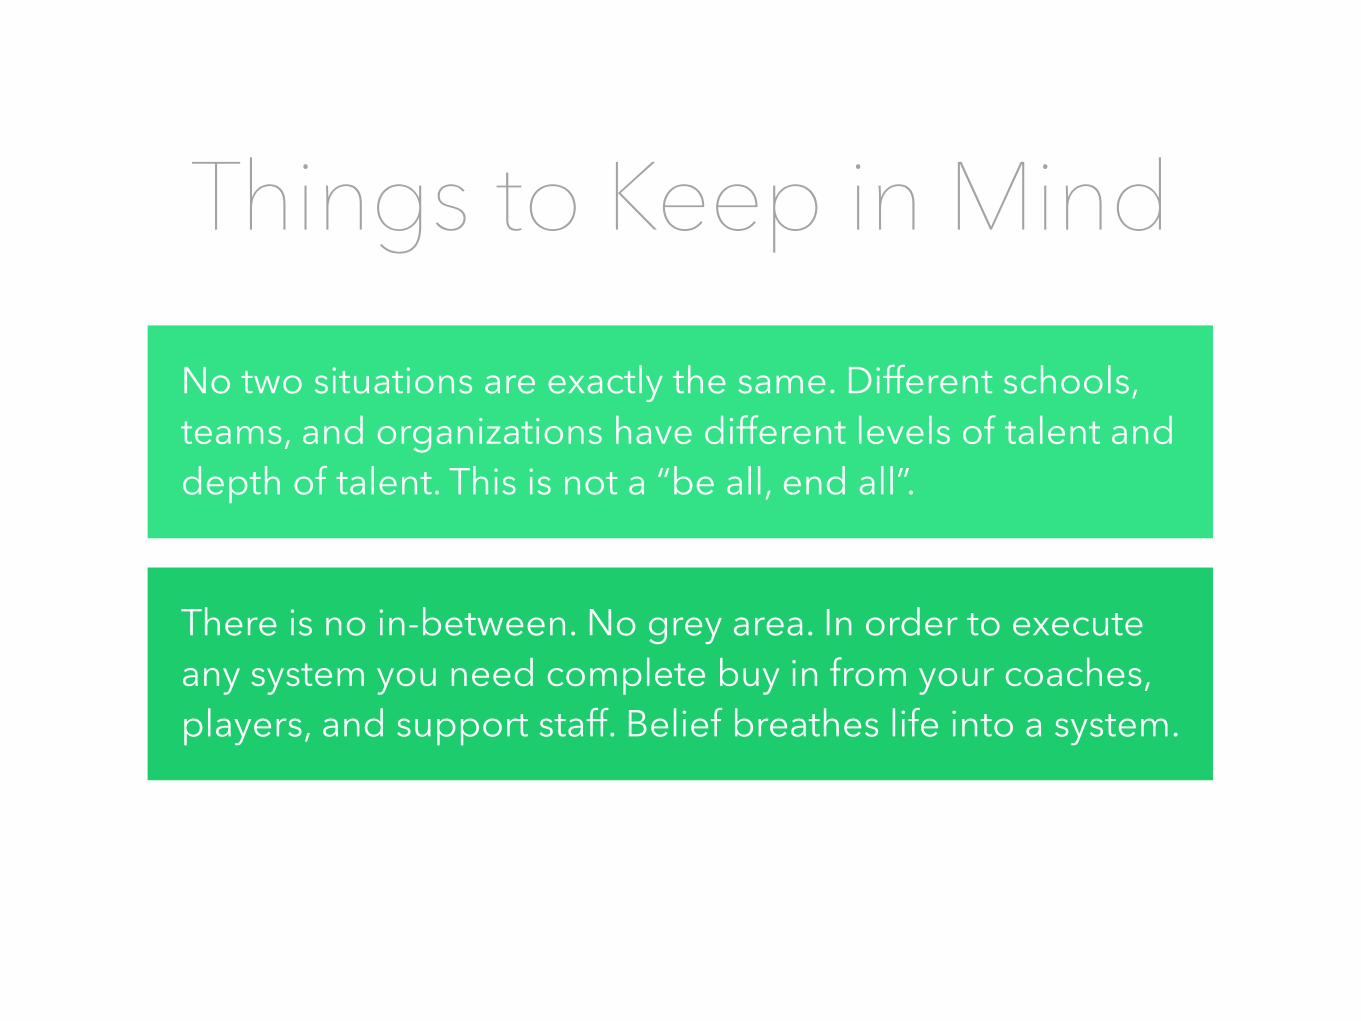
There is no in-between. No grey area. In order to execute any system you need complete buy in from your coaches, players, and support staff. Belief breathes life into a system.
No two situations are exactly the same. Different schools, teams, and organizations have different levels of talent and depth of talent. This is not a “be all, end all”.
Things to Keep in Mind
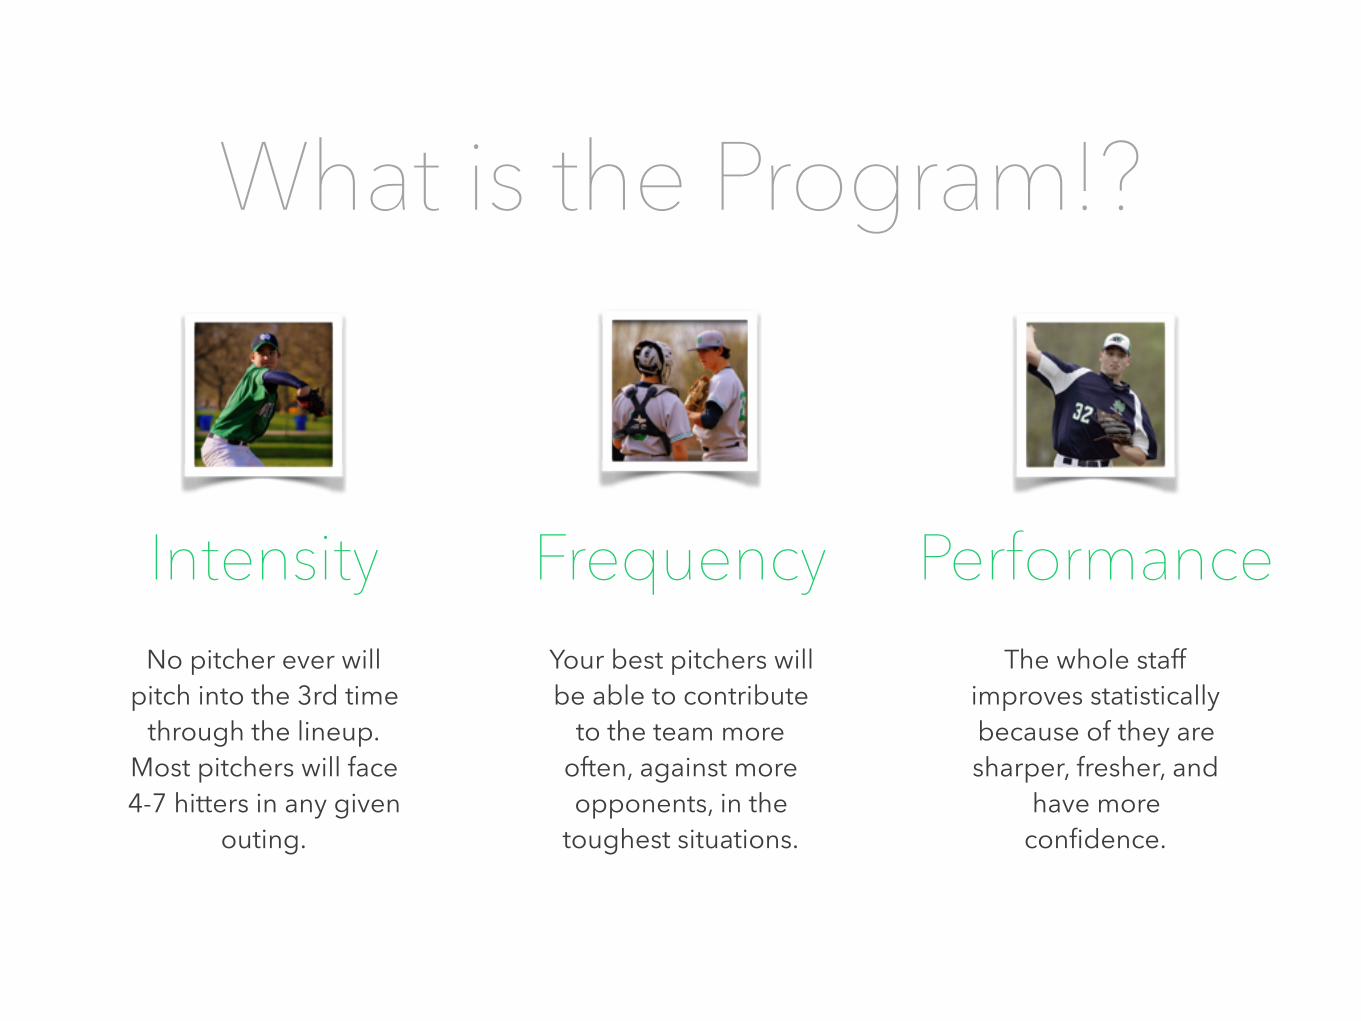
The whole staff improves statistically because of they are sharper, fresher, and
have more confidence.
PerformanceYour best pitchers will be able to contribute
to the team more often, against more opponents, in the
toughest situations.
FrequencyNo pitcher ever will
pitch into the 3rd time through the lineup.
Most pitchers will face 4-7 hitters in any given
outing.
Intensity
What is the Program!?
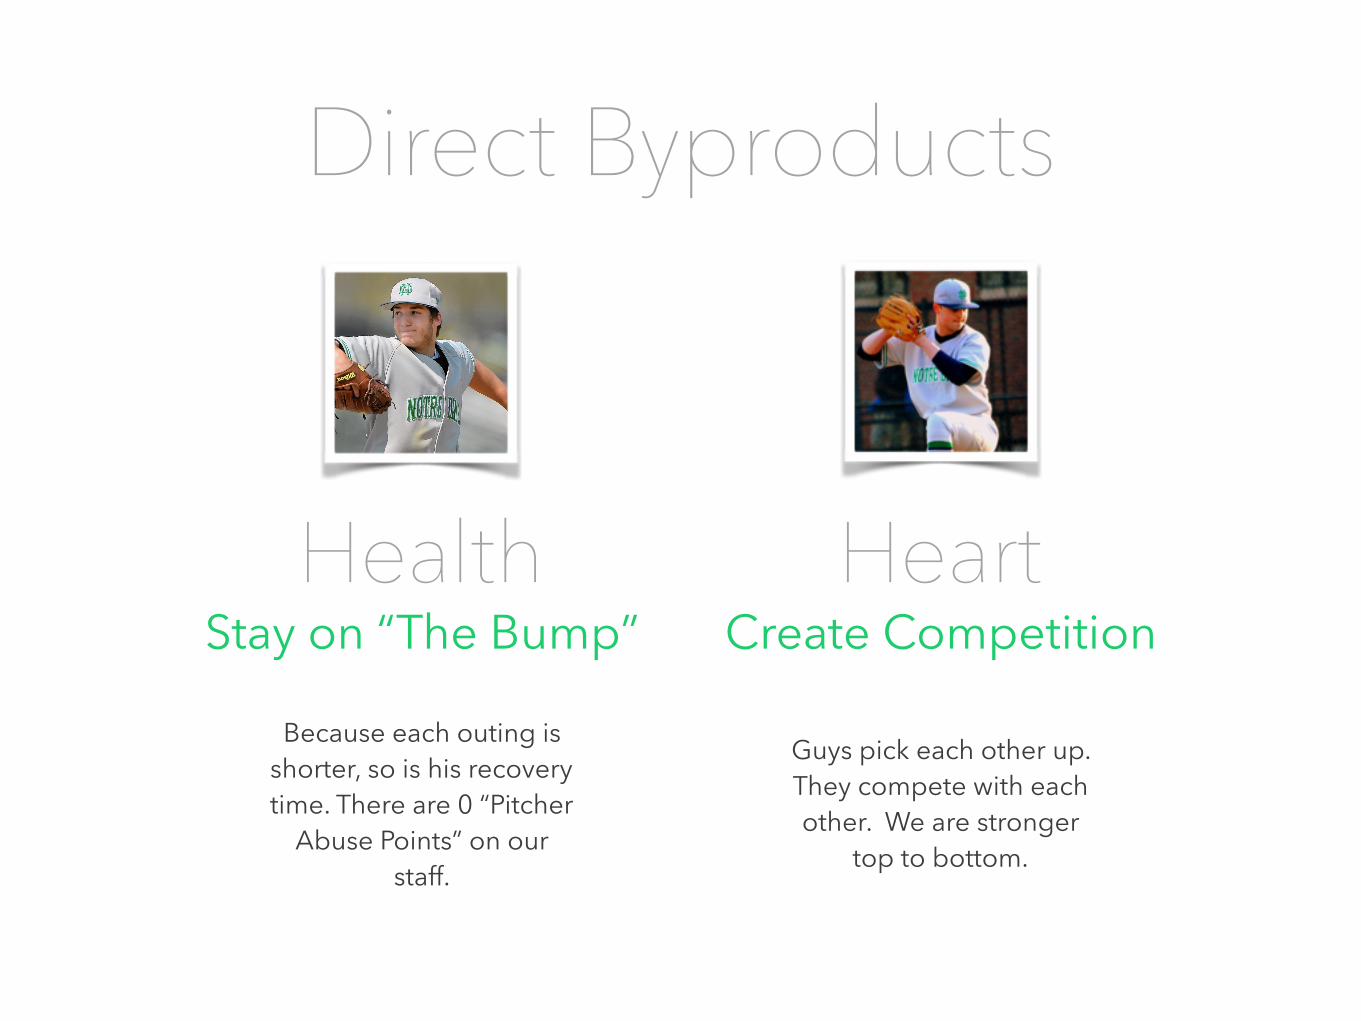
Guys pick each other up. They compete with each other. We are stronger
top to bottom.
Create CompetitionHeart
Because each outing is shorter, so is his recovery time. There are 0 “Pitcher
Abuse Points” on our staff.
Health
Direct Byproducts
Stay on “The Bump”

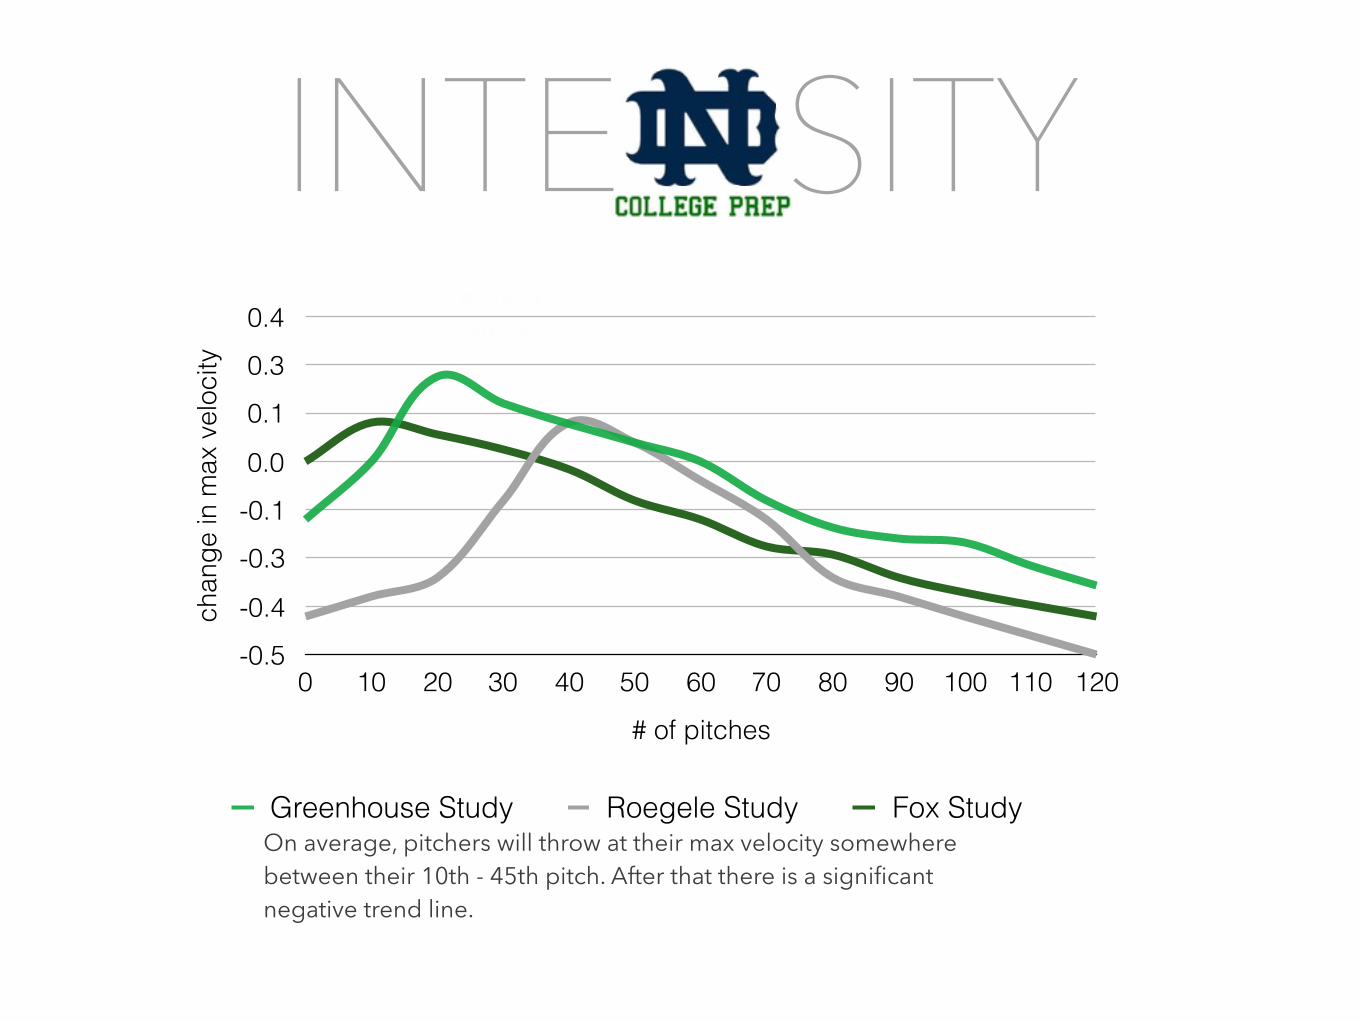
INTE SITYFocused Energy Leads to Better Results
chan
ge in
max
vel
ocity
-0.5
-0.4
-0.3
-0.1
0.0
0.1
0.3
0.4
# of pitches
0 10 20 30 40 50 60 70 80 90 100 110 120
Greenhouse Study Roegele Study Fox StudyOn average, pitchers will throw at their max velocity somewhere between their 10th - 45th pitch. After that there is a significant negative trend line.
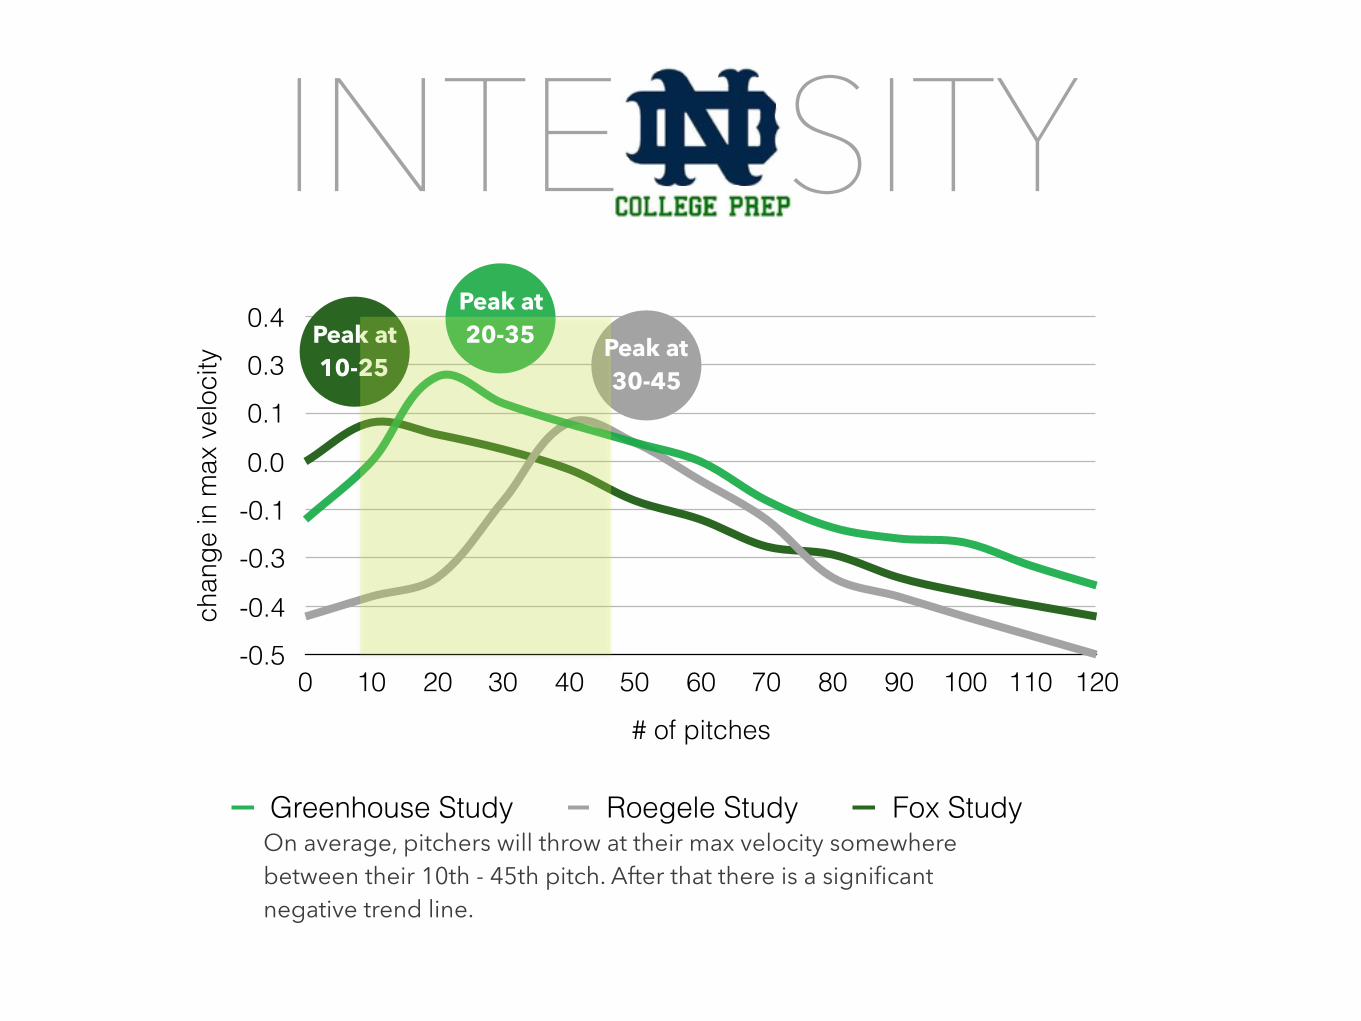
Peak at 20-35
INTE SITY

chan
ge in
max
vel
ocity
-0.5
-0.4
-0.3
-0.1
0.0
0.1
0.3
0.4
# of pitches
0 10 20 30 40 50 60 70 80 90 100 110 120
Greenhouse Study Roegele Study Fox Study
Peak at 10-25
On average, pitchers will throw at their max velocity somewhere between their 10th - 45th pitch. After that there is a significant negative trend line.
Peak at 20-35 Peak at
30-45
INTE SITY

FREQUE CYYour Best Gets to Face their Best, More Often

FREQUE CY
55%
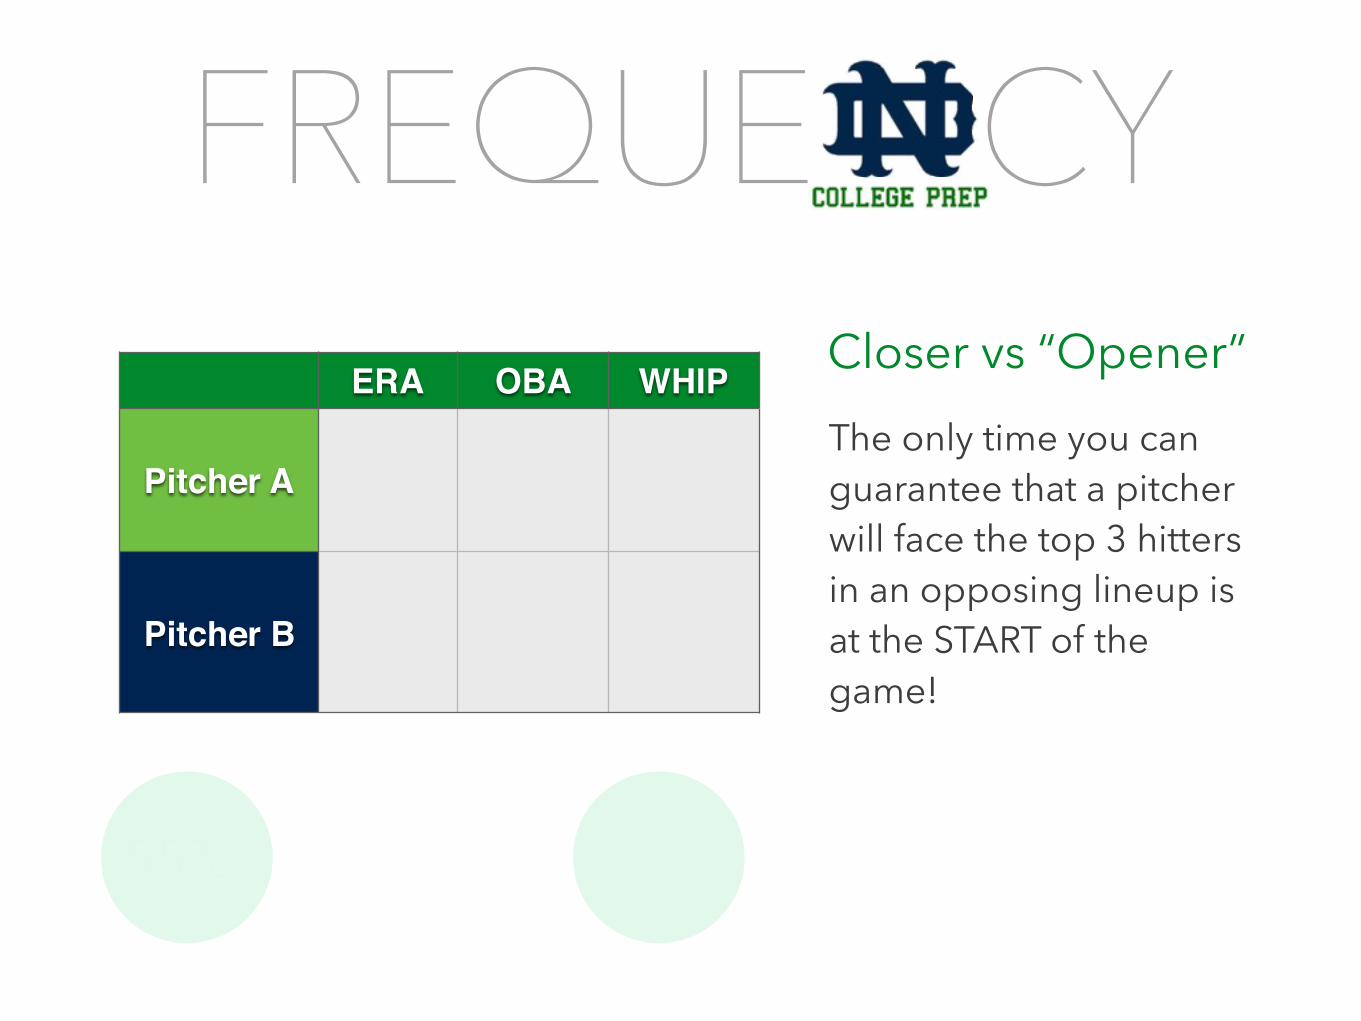
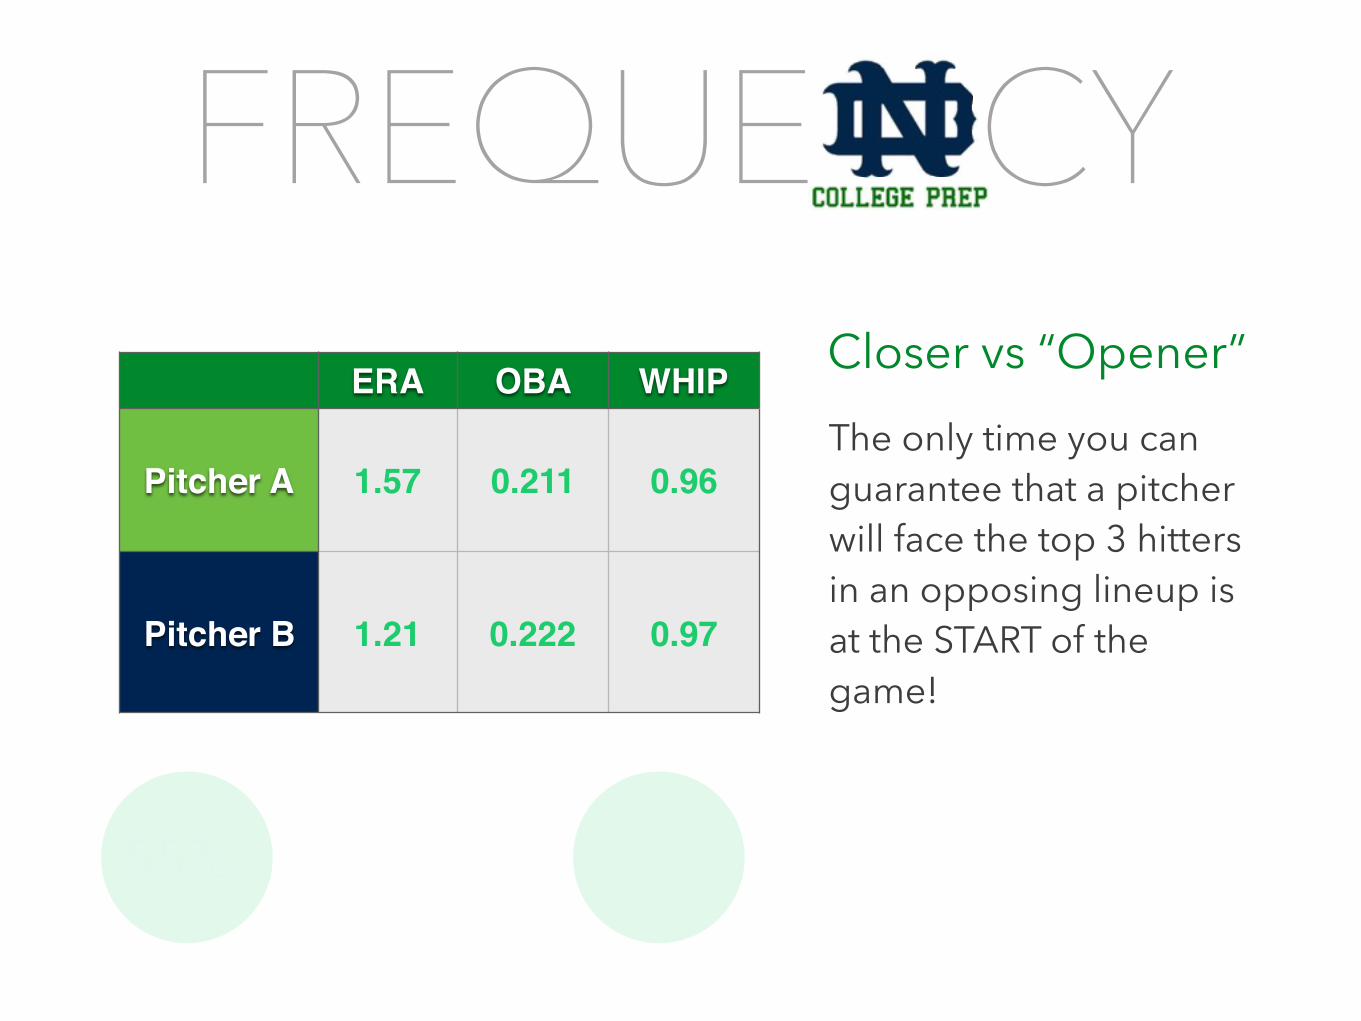
The only time you can guarantee that a pitcher will face the top 3 hitters in an opposing lineup is at the START of the game!
Closer vs “Opener”
FREQUE CY
55%
The only time you can guarantee that a pitcher will face the top 3 hitters in an opposing lineup is at the START of the game!
Closer vs “Opener”ERA OBA WHIP
Pitcher A
Pitcher B

FREQUE CY
55%
The only time you can guarantee that a pitcher will face the top 3 hitters in an opposing lineup is at the START of the game!
Closer vs “Opener”ERA OBA WHIP
Pitcher A 1.57 0.211 0.96
Pitcher B

FREQUE CY
55%
The only time you can guarantee that a pitcher will face the top 3 hitters in an opposing lineup is at the START of the game!
Closer vs “Opener”ERA OBA WHIP
Pitcher A
Pitcher B 1.21 0.222 0.97
FREQUE CY
55%
The only time you can guarantee that a pitcher will face the top 3 hitters in an opposing lineup is at the START of the game!
Closer vs “Opener”ERA OBA WHIP
Pitcher A 1.57 0.211 0.96
Pitcher B 1.21 0.222 0.97

FREQUE CY
55%
The only time you can guarantee that a pitcher will face the top 3 hitters in an opposing lineup is at the START of the game!
Closer vs “Opener”ERA OBA WHIP
#1 1.57 0.211 0.96
#8 1.21 0.222 0.97
FREQUE CY
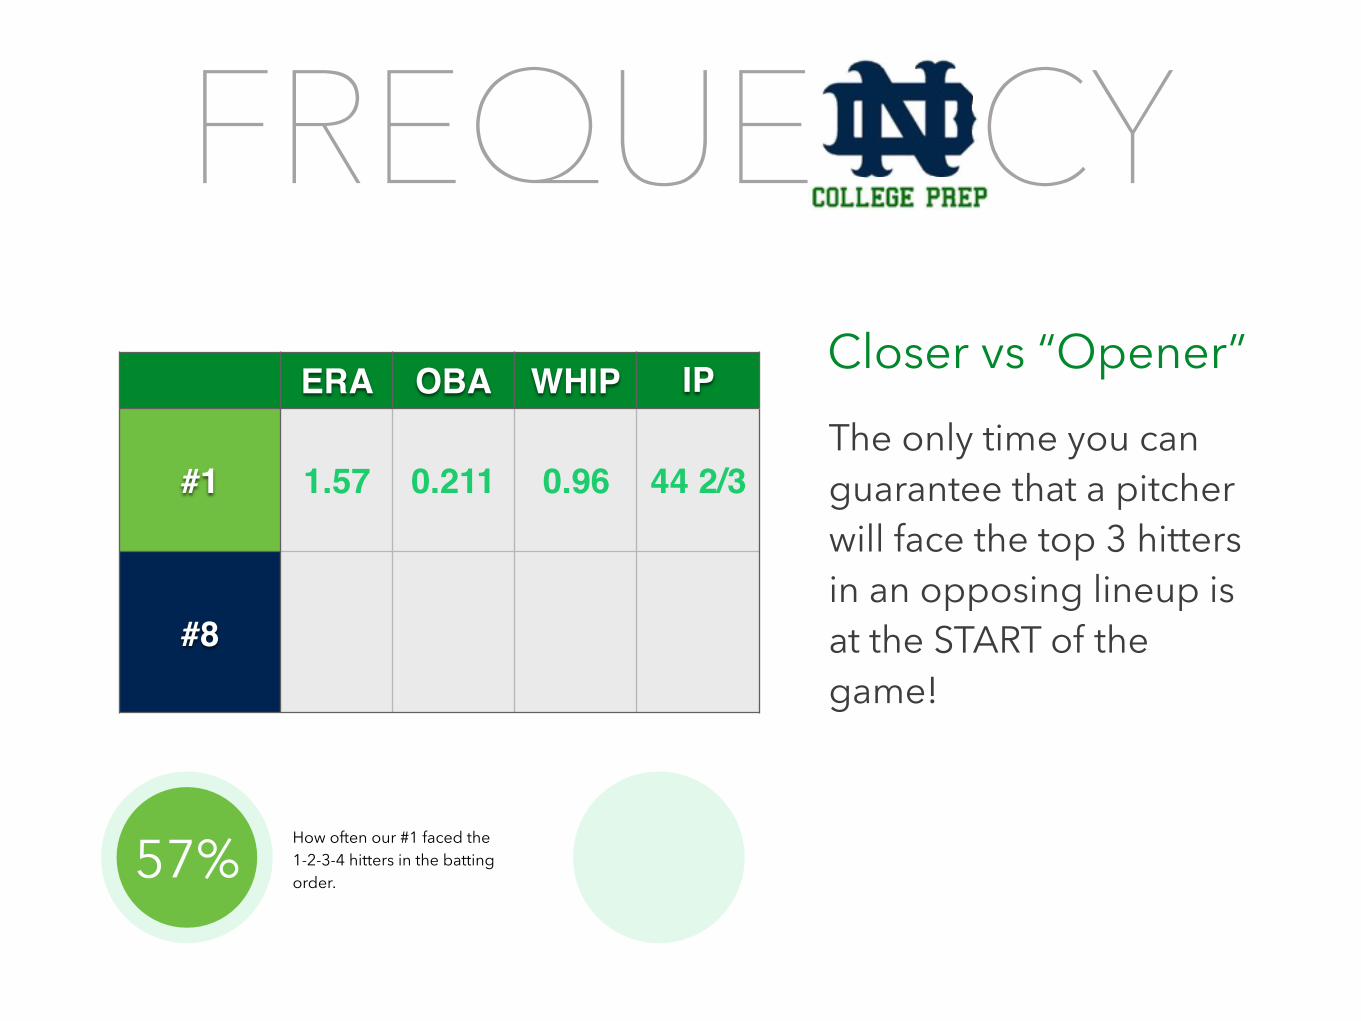
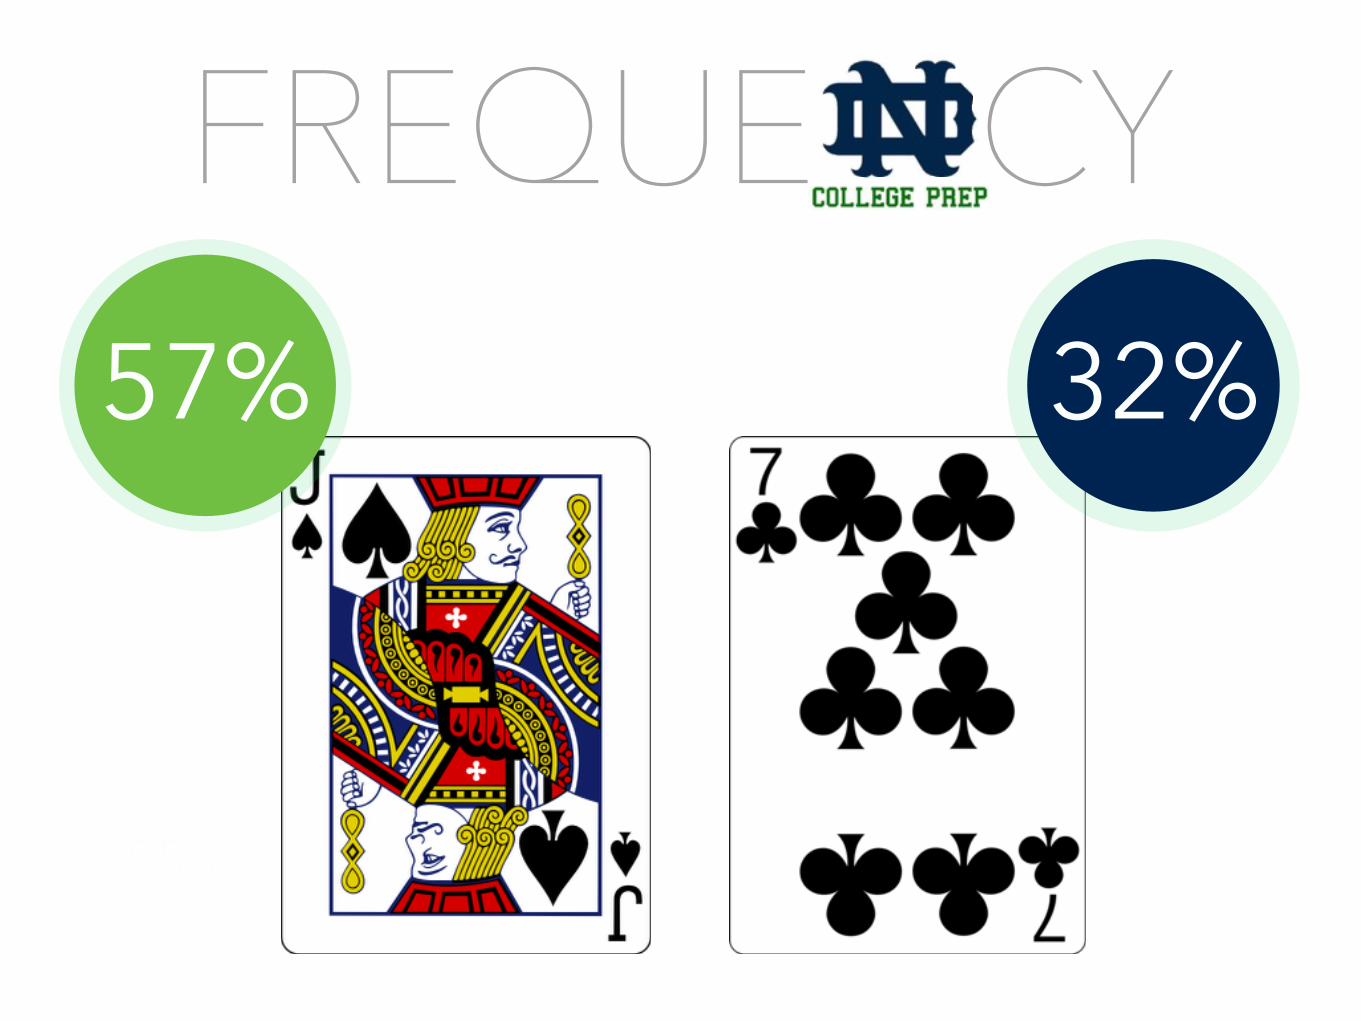
55% How often our #1 faced the 1-2-3-4 hitters in the batting order.
The only time you can guarantee that a pitcher will face the top 3 hitters in an opposing lineup is at the START of the game!
Closer vs “Opener”
57%
ERA OBA WHIP IP
#1 1.57 0.211 0.96 44 2/3
#8
FREQUE CY
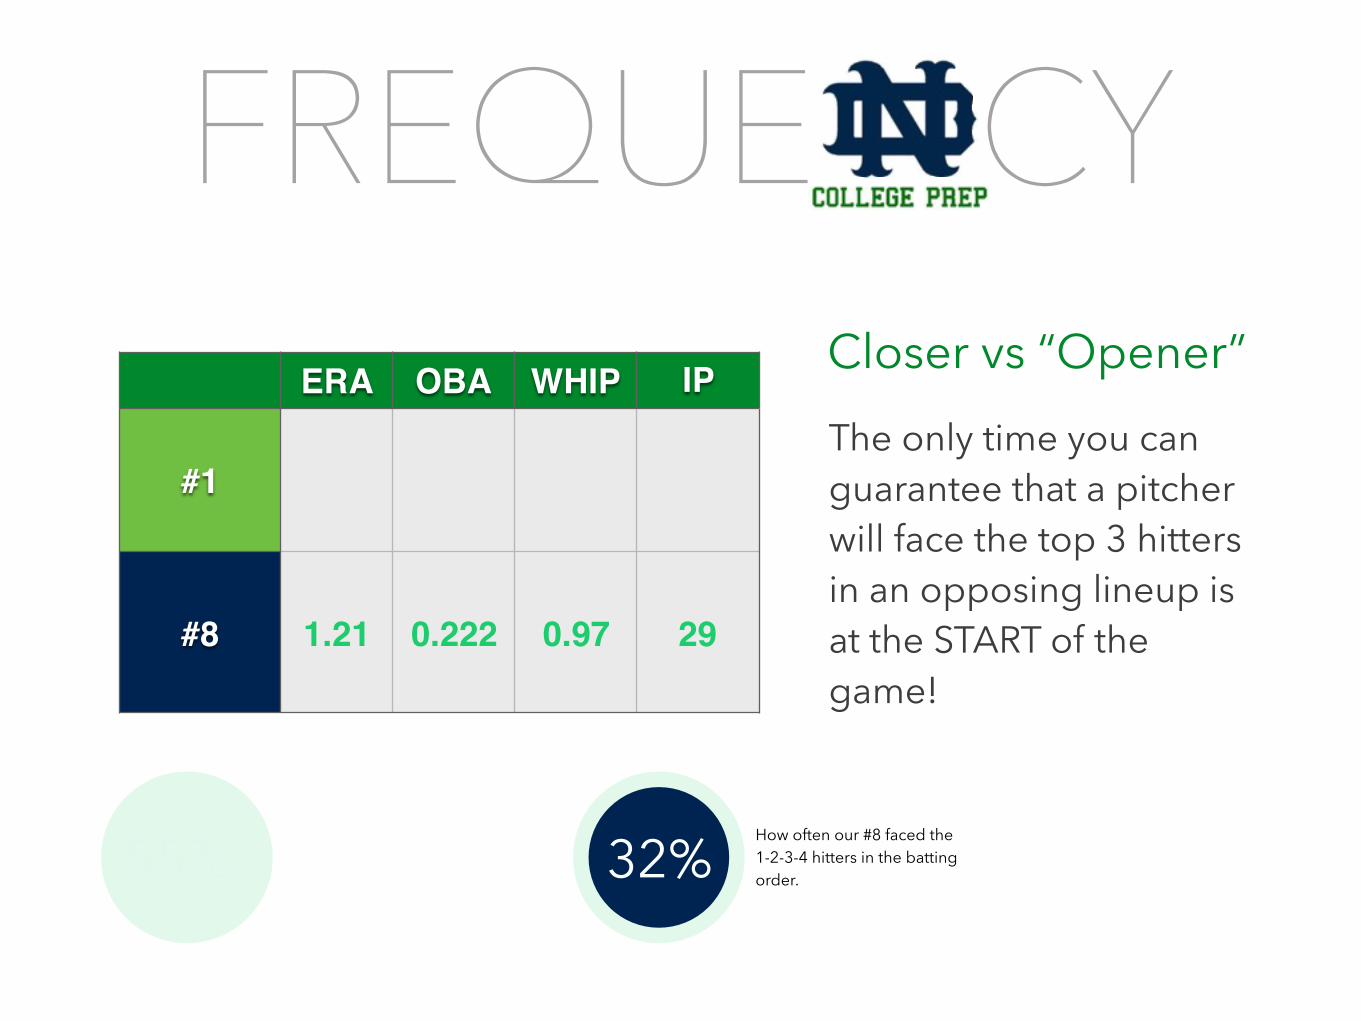
55% How often our #8 faced the 1-2-3-4 hitters in the batting order.
The only time you can guarantee that a pitcher will face the top 3 hitters in an opposing lineup is at the START of the game!
Closer vs “Opener”
32%
ERA OBA WHIP IP
#1
#8 1.21 0.222 0.97 29
FREQUE CY
55% How often our #8 faced the 1-2-3 hitters in the batting order.
How often our #1 faced the 1-2-3-4 hitters in the batting order.
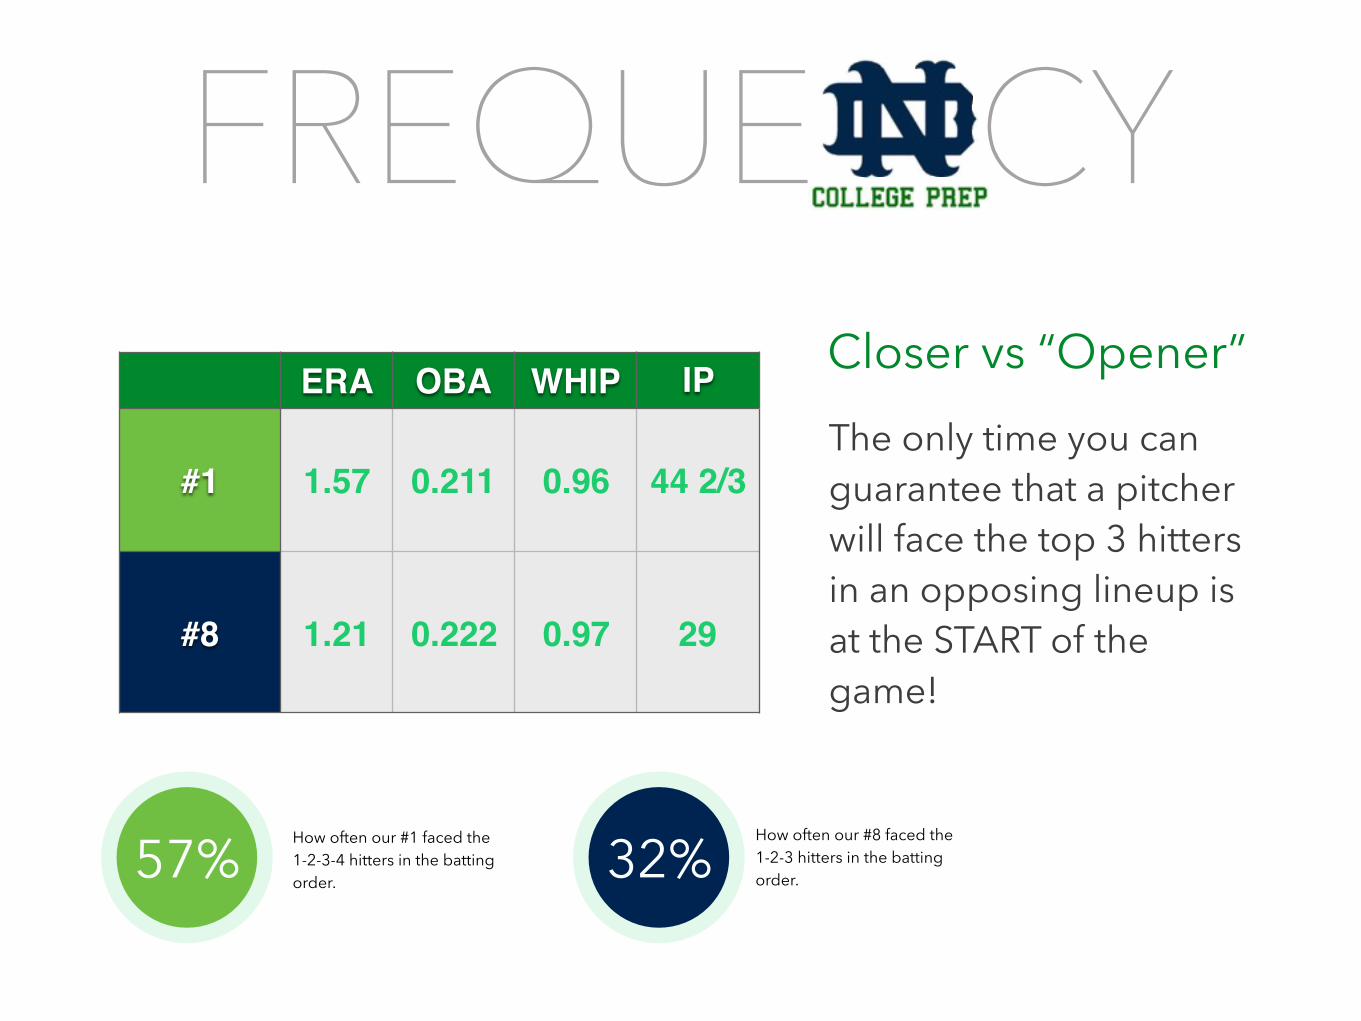
The only time you can guarantee that a pitcher will face the top 3 hitters in an opposing lineup is at the START of the game!
Closer vs “Opener”
57% 32%
ERA OBA WHIP IP
#1 1.57 0.211 0.96 44 2/3
#8 1.21 0.222 0.97 29
FREQUE CY
55%
57% 32%
FREQUE CY
55%
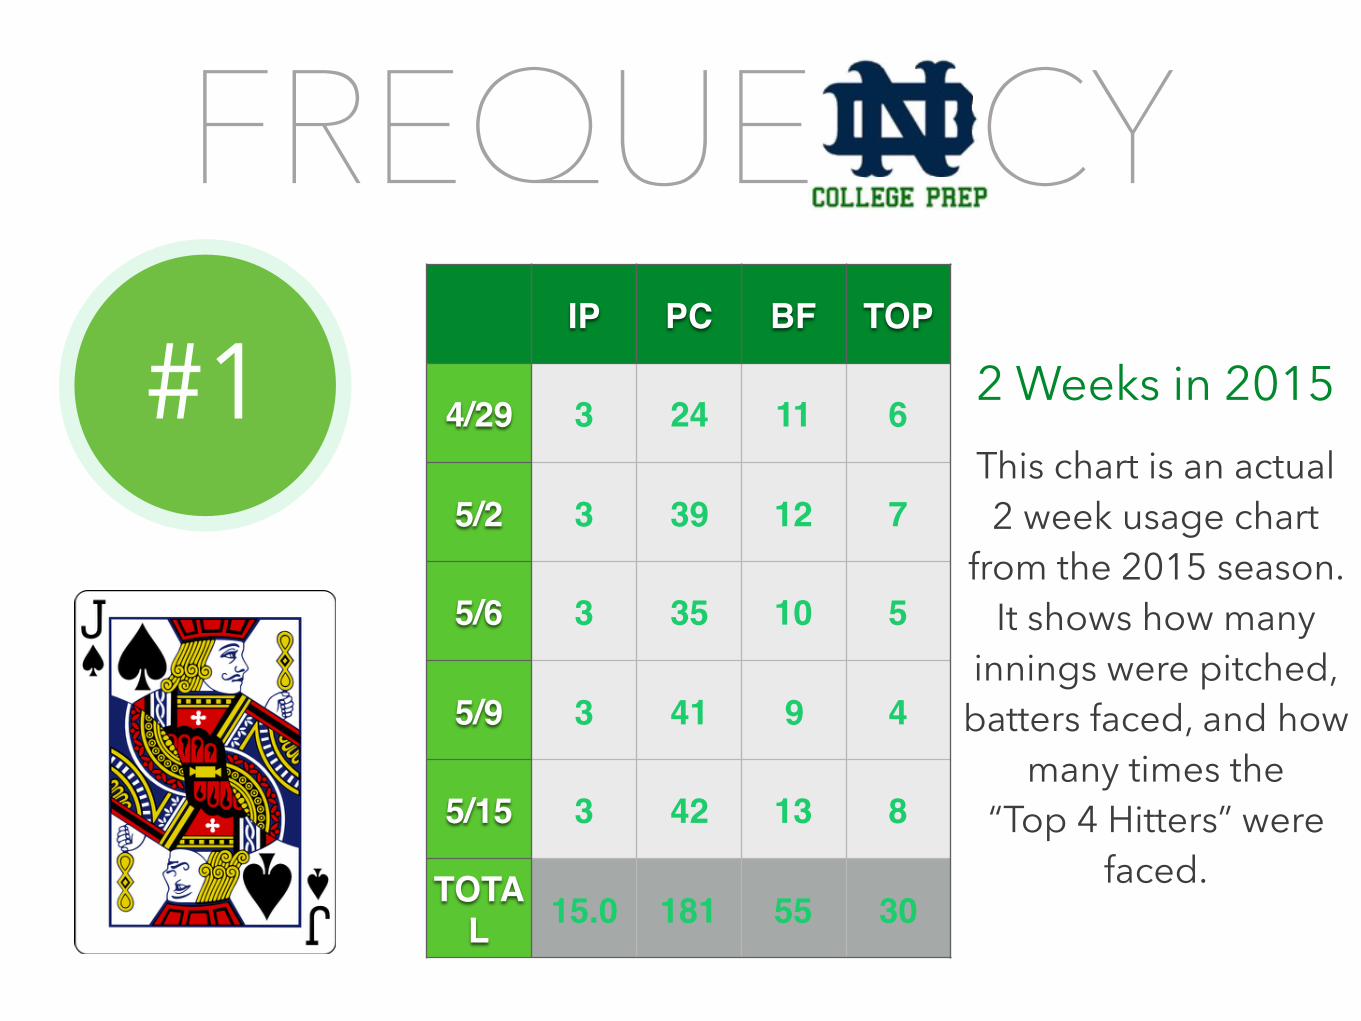
#1IP PC BF TOP
4/29 3 24 11 6
5/2 3 39 12 7
5/6 3 35 10 5
5/9 3 41 9 4
5/15 3 42 13 8
TOTAL 15.0 181 55 30
This chart is an actual 2 week usage chart
from the 2015 season. It shows how many
innings were pitched, batters faced, and how
many times the “Top 4 Hitters” were
faced.
2 Weeks in 2015
FREQUE CY
55%
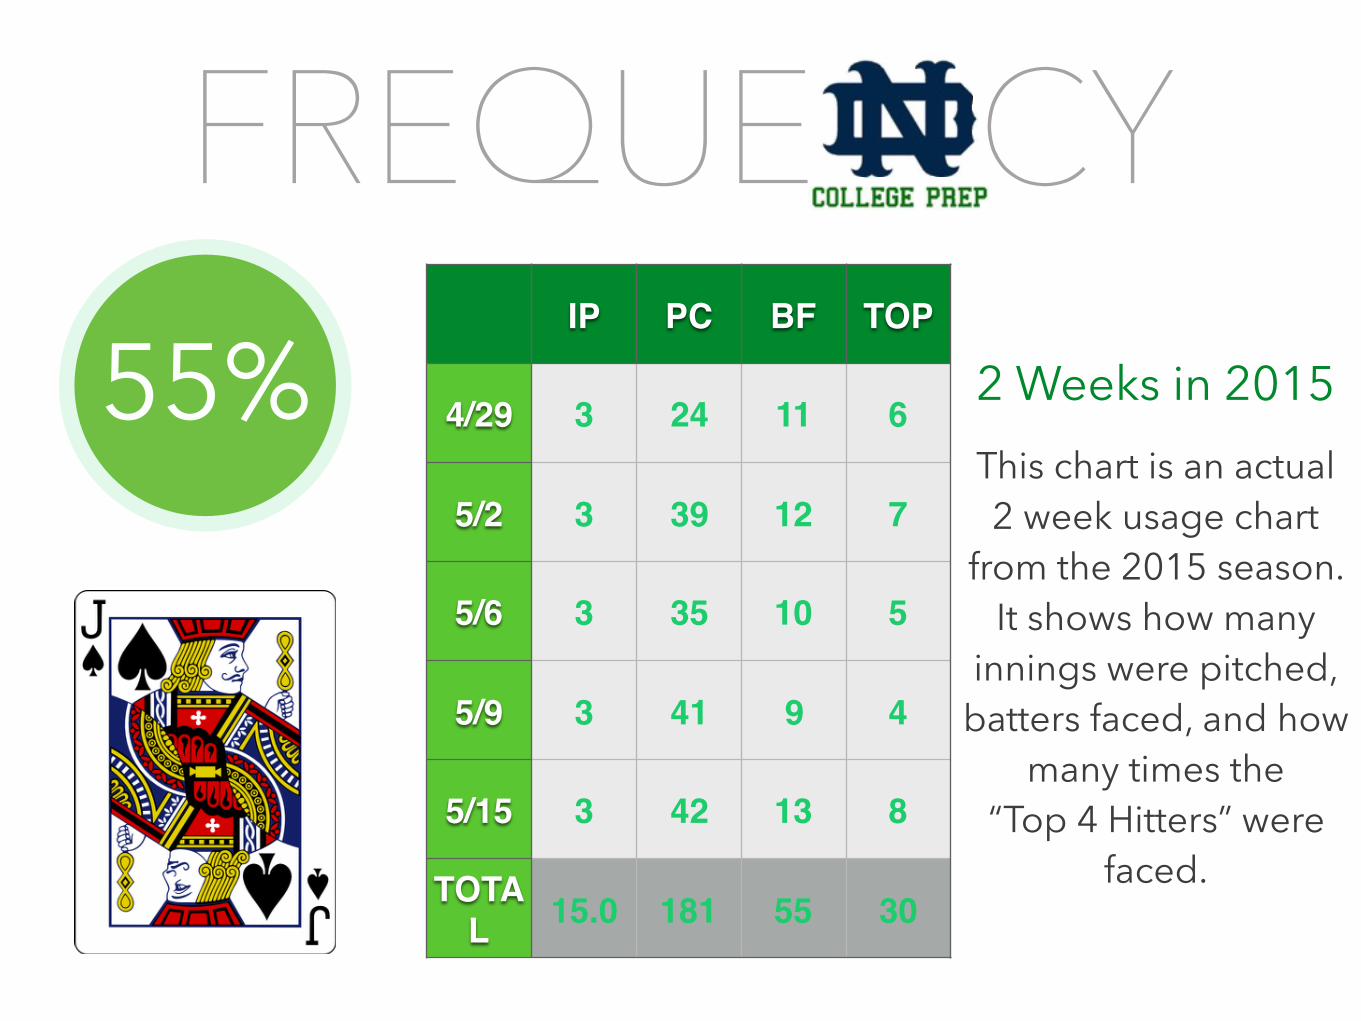
55%This chart is an actual 2 week usage chart
from the 2015 season. It shows how many
innings were pitched, batters faced, and how
many times the “Top 4 Hitters” were
faced.
2 Weeks in 2015IP PC BF TOP
4/29 3 24 11 6
5/2 3 39 12 7
5/6 3 35 10 5
5/9 3 41 9 4
5/15 3 42 13 8
TOTAL 15.0 181 55 30
FREQUE CY
55%
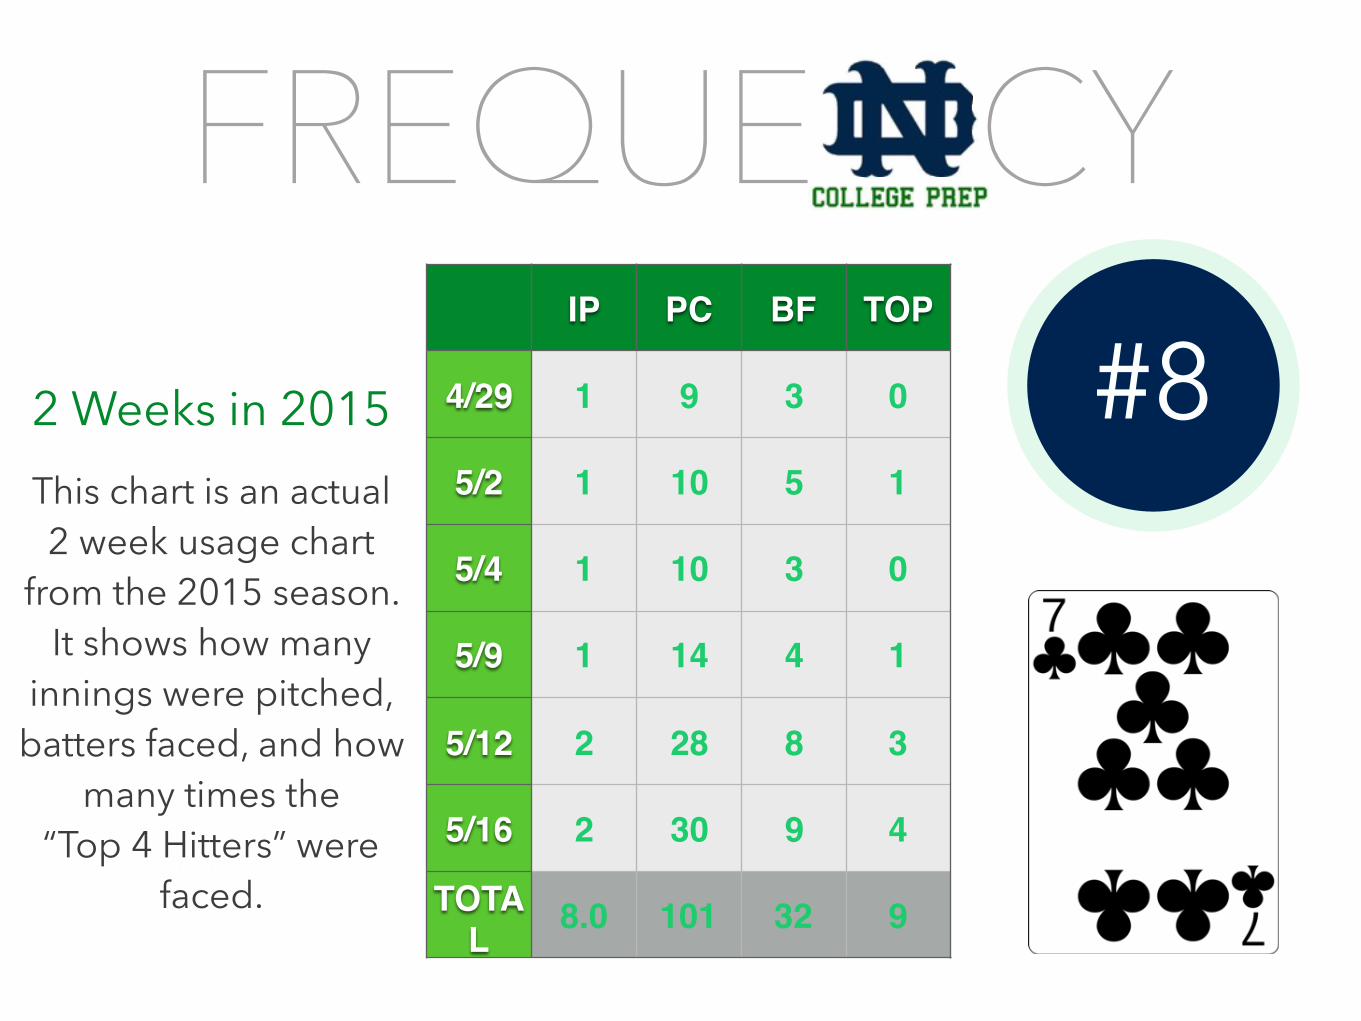
#8IP PC BF TOP
4/29 1 9 3 0
5/2 1 10 5 1
5/4 1 10 3 0
5/9 1 14 4 1
5/12 2 28 8 3
5/16 2 30 9 4
TOTAL 8.0 101 32 9
This chart is an actual 2 week usage chart
from the 2015 season. It shows how many
innings were pitched, batters faced, and how
many times the “Top 4 Hitters” were
faced.
2 Weeks in 2015

FREQUE CY
55%
28%This chart is an actual 2 week usage chart
from the 2015 season. It shows how many
innings were pitched, batters faced, and how
many times the “Top 4 Hitters” were
faced.
2 Weeks in 2015
IP PC BF TOP
4/29 1 9 3 0
5/2 1 10 5 1
5/4 1 10 3 0
5/9 1 14 4 1
5/12 2 28 8 3
5/16 2 30 9 4
TOTAL 8.0 101 32 9
FREQUE CY
55%
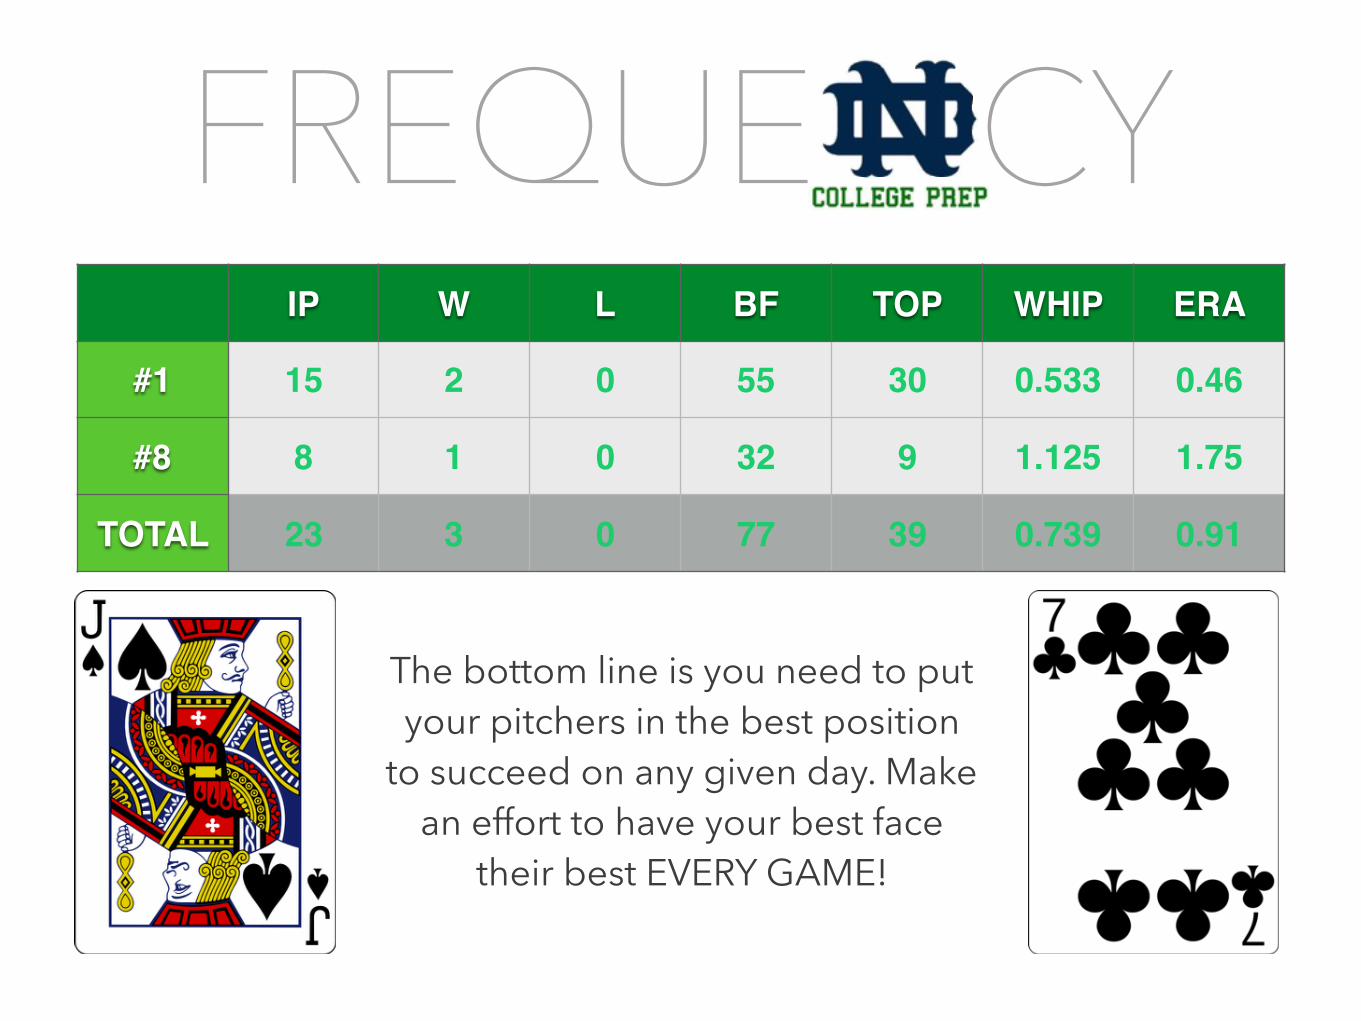
IP W L BF TOP WHIP ERA
#1 15 2 0 55 30 0.533 0.46
#8 8 1 0 32 9 1.125 1.75
TOTAL 23 3 0 77 39 0.739 0.91
The bottom line is you need to put your pitchers in the best position
to succeed on any given day. Make an effort to have your best face
their best EVERY GAME!
PERFORMA CEThe Proof is in the Numbers, They Never Lie
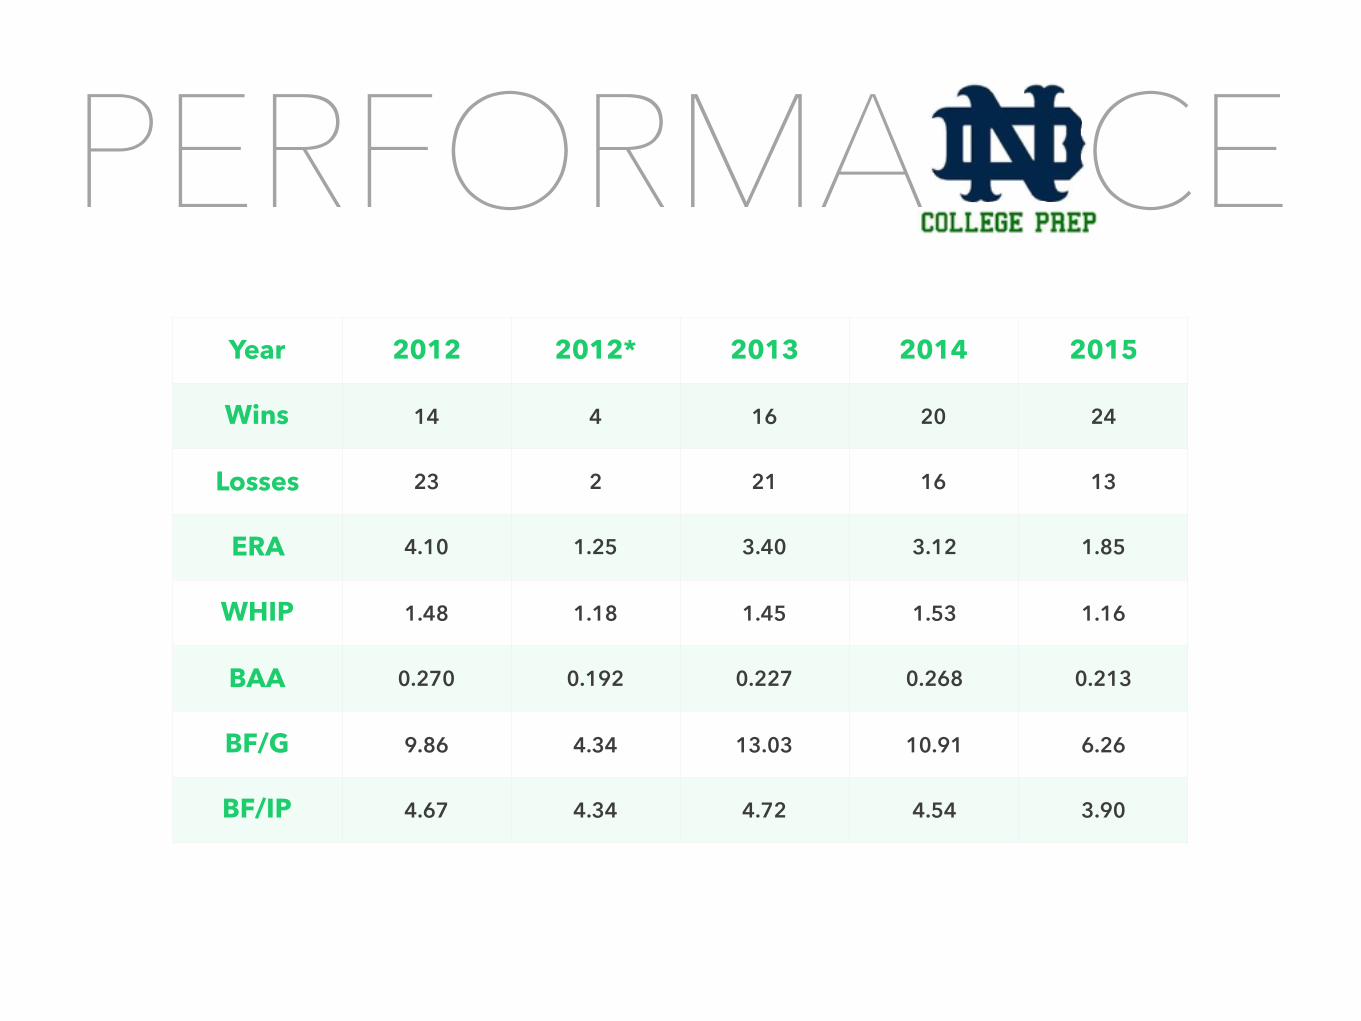
PERFORMA CEYear 2012 2012* 2013 2014 2015
Wins 14 4 16 20 24
Losses 23 2 21 16 13
ERA 4.10 1.25 3.40 3.12 1.85
WHIP 1.48 1.18 1.45 1.53 1.16
BAA 0.270 0.192 0.227 0.268 0.213
BF/G 9.86 4.34 13.03 10.91 6.26
BF/IP 4.67 4.34 4.72 4.54 3.90
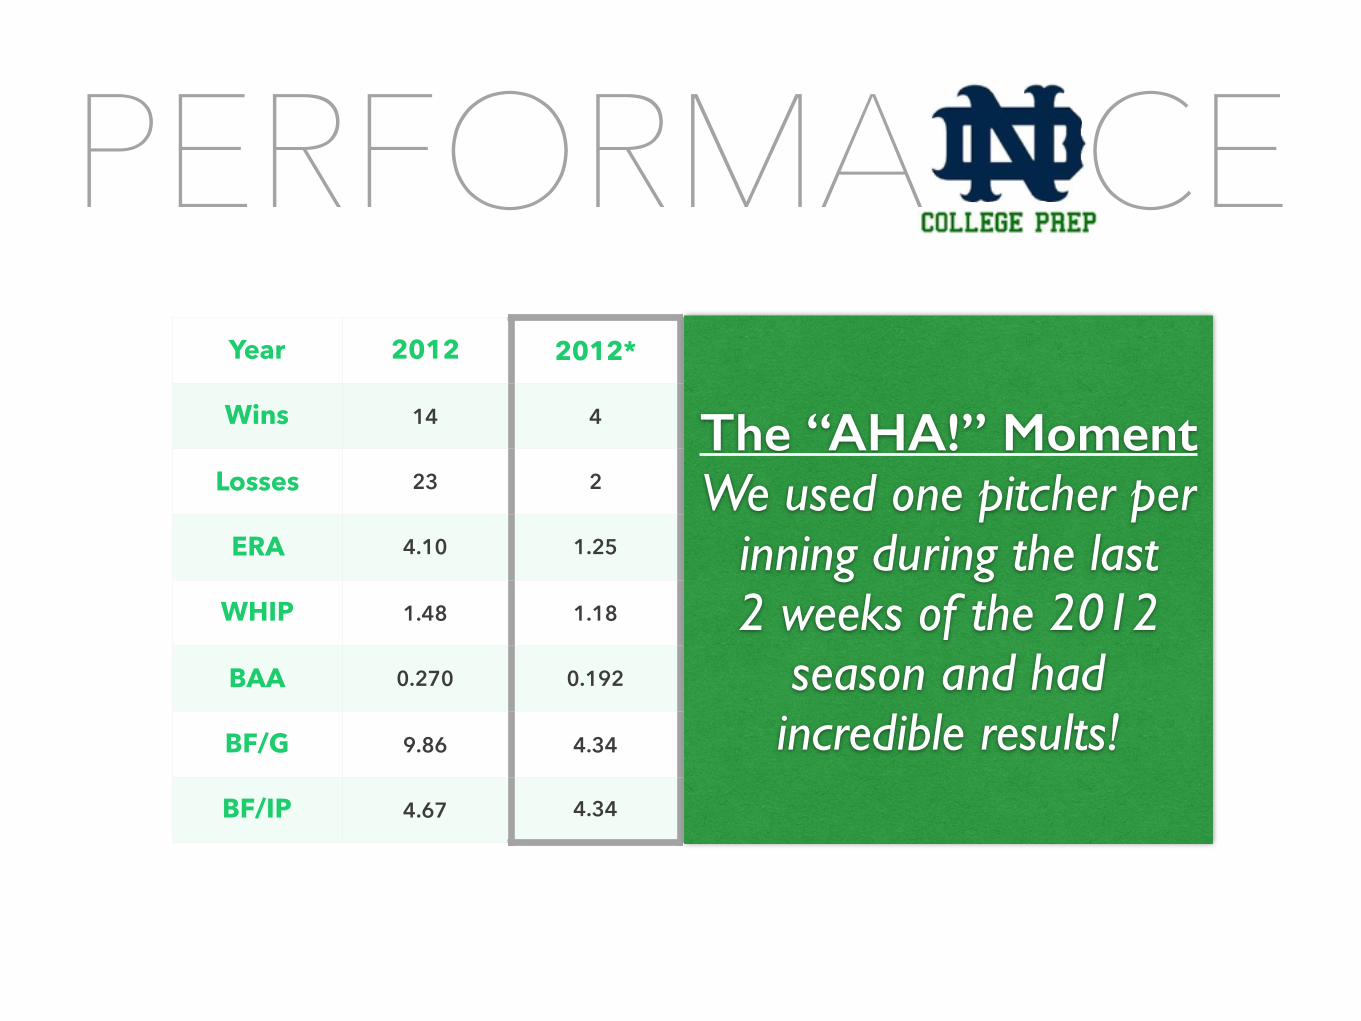
PERFORMA CEYear 2012 2012* 2013 2014 2015
Wins 14 4 16 20 24
Losses 23 2 21 16 13
ERA 4.10 1.25 3.40 3.12 1.85
WHIP 1.48 1.18 1.45 1.53 1.16
BAA 0.270 0.192 0.227 0.268 0.213
BF/G 9.86 4.34 13.03 10.91 6.26
BF/IP 4.67 4.34 4.72 4.54 3.90
The “AHA!” Moment We used one pitcher per
inning during the last 2 weeks of the 2012
season and had incredible results!

PERFORMA CEYear 2013 2014 2015
Wins 16 20 24
Losses 21 16 13
ERA 3.40 3.12 1.85
WHIP 1.45 1.53 1.16
BAA 0.227 0.268 0.213
BF/G 13.03 10.91 6.26
BF/IP 4.72 4.54 3.90
Experimental Mode Tried different
combinations of theories. Piggy-back starters, back-
end first, etc. Trying to find “balance” instead of
“buy-in”!
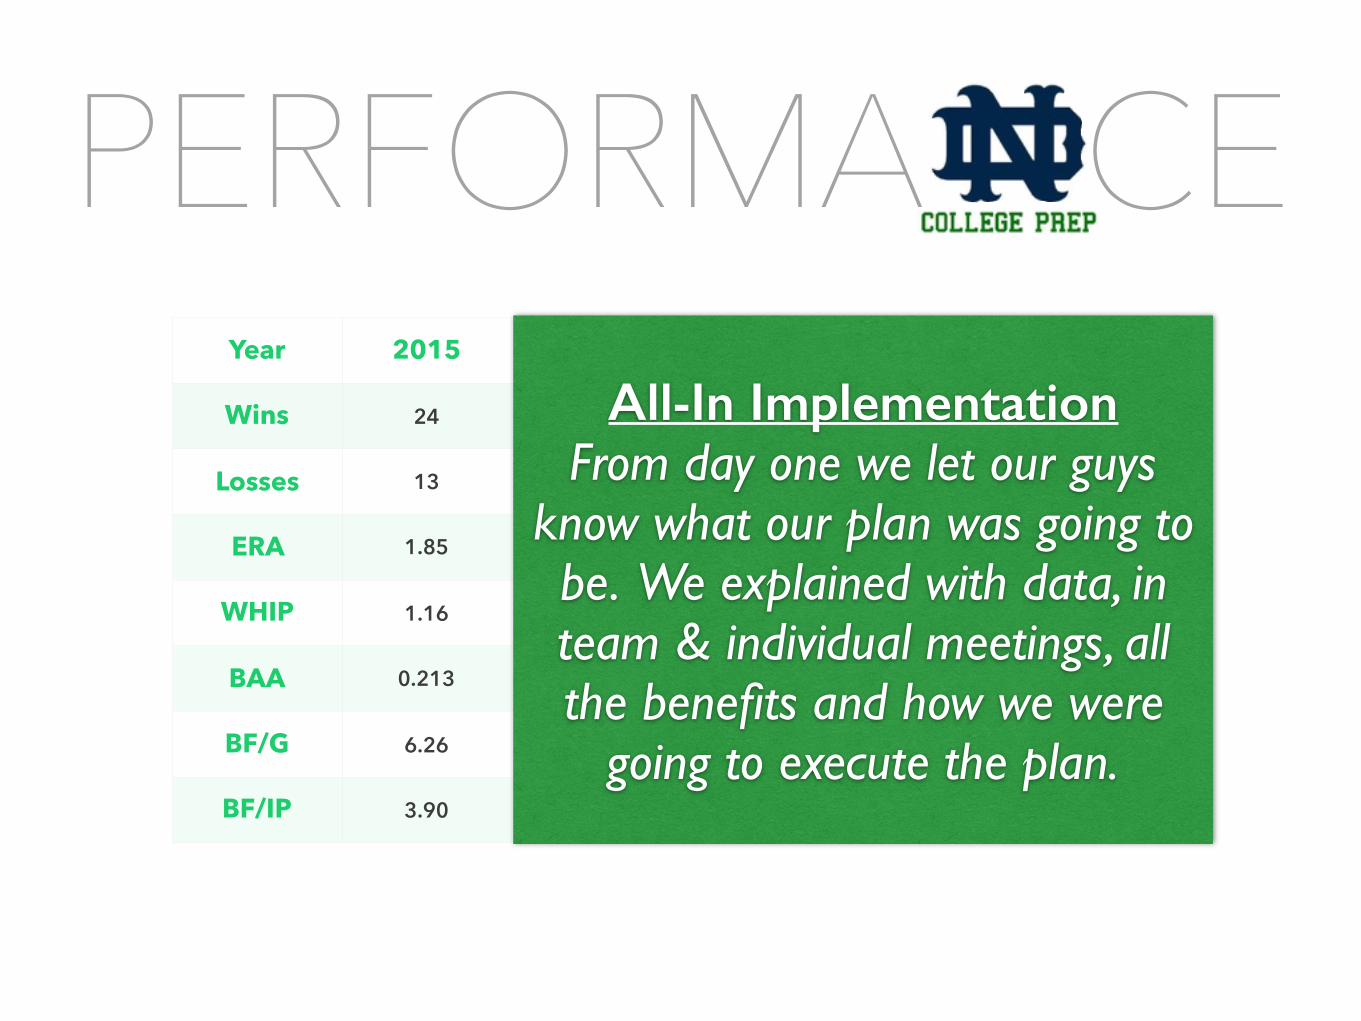
PERFORMA CEYear 2015
Wins 24
Losses 13
ERA 1.85
WHIP 1.16
BAA 0.213
BF/G 6.26
BF/IP 3.90
All-In Implementation From day one we let our guys
know what our plan was going to be. We explained with data, in team & individual meetings, all the benefits and how we were
going to execute the plan.
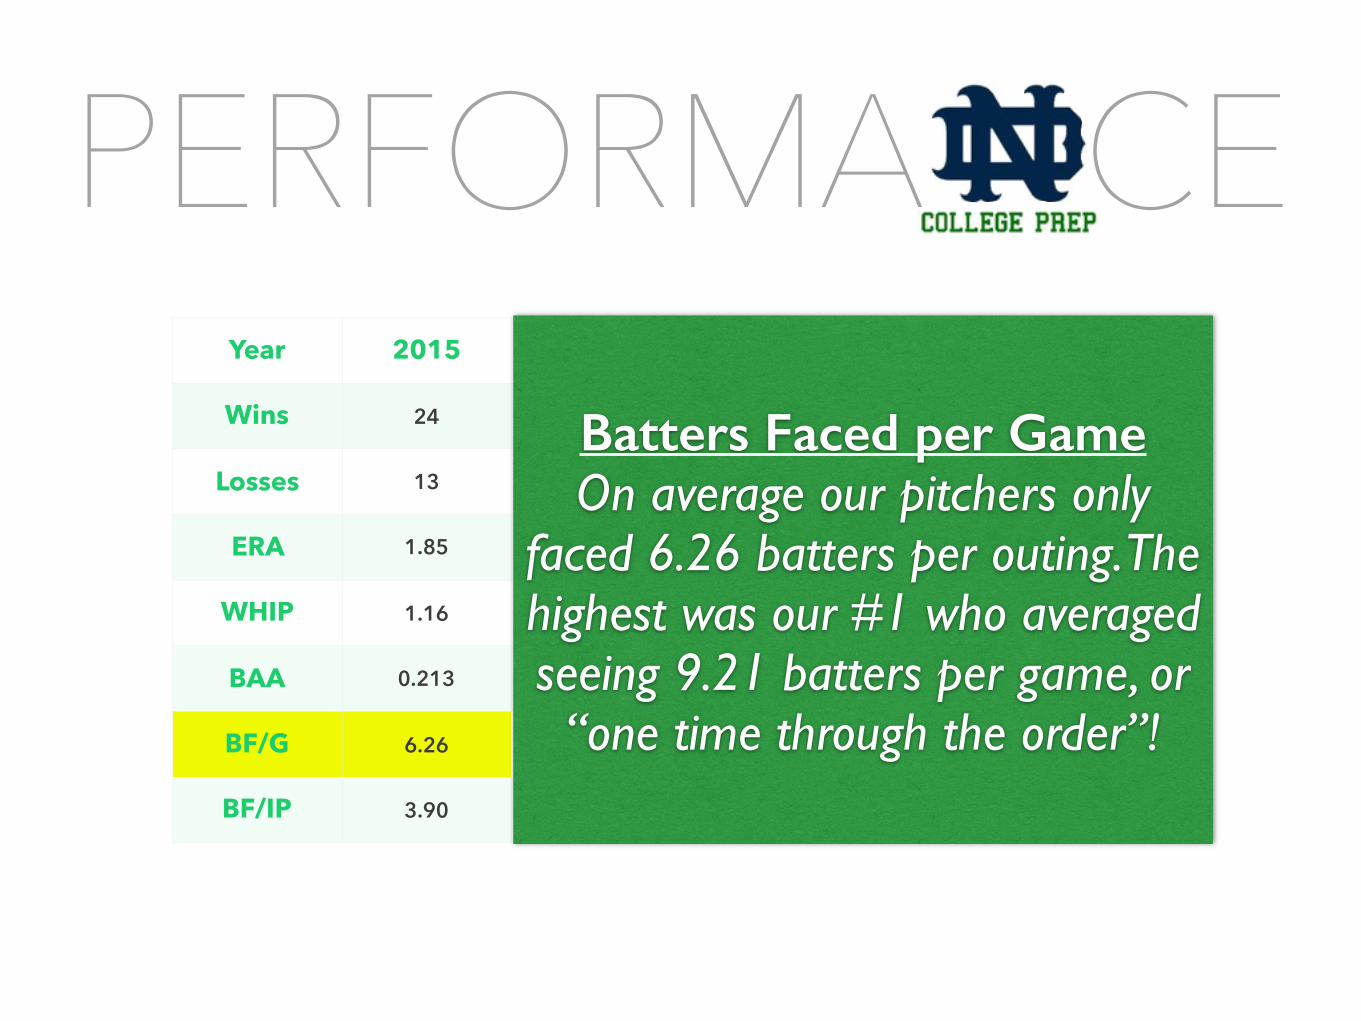
PERFORMA CEYear 2015
Wins 24
Losses 13
ERA 1.85
WHIP 1.16
BAA 0.213
BF/G 6.26
BF/IP 3.90
Batters Faced per Game On average our pitchers only
faced 6.26 batters per outing. The highest was our #1 who averaged seeing 9.21 batters per game, or “one time through the order”!
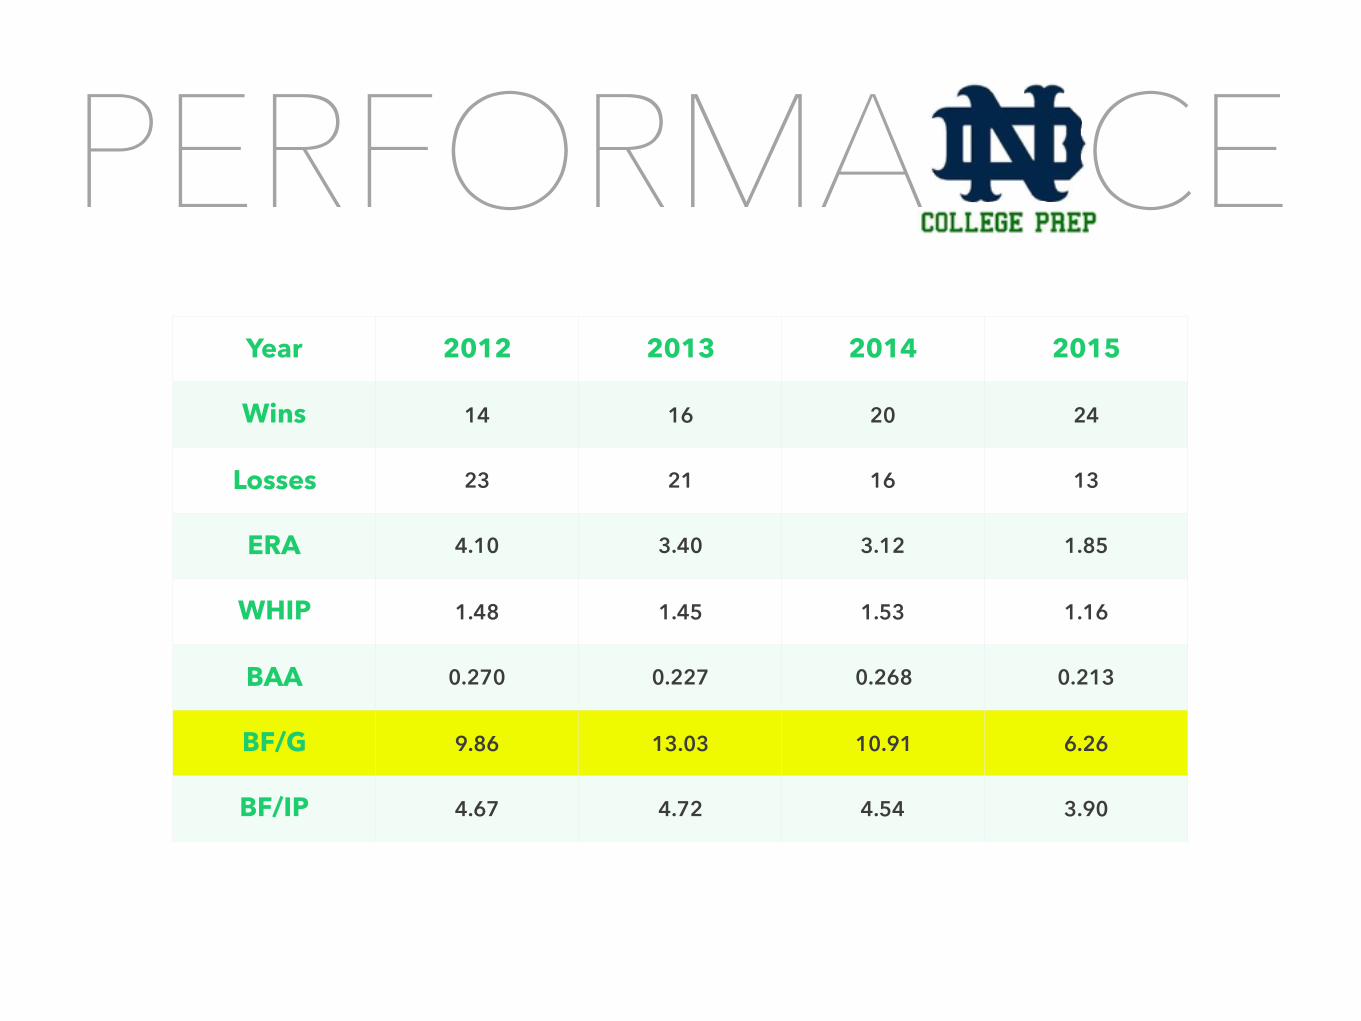
PERFORMA CEYear 2012 2013 2014 2015
Wins 14 16 20 24
Losses 23 21 16 13
ERA 4.10 3.40 3.12 1.85
WHIP 1.48 1.45 1.53 1.16
BAA 0.270 0.227 0.268 0.213
BF/G 9.86 13.03 10.91 6.26
BF/IP 4.67 4.72 4.54 3.90
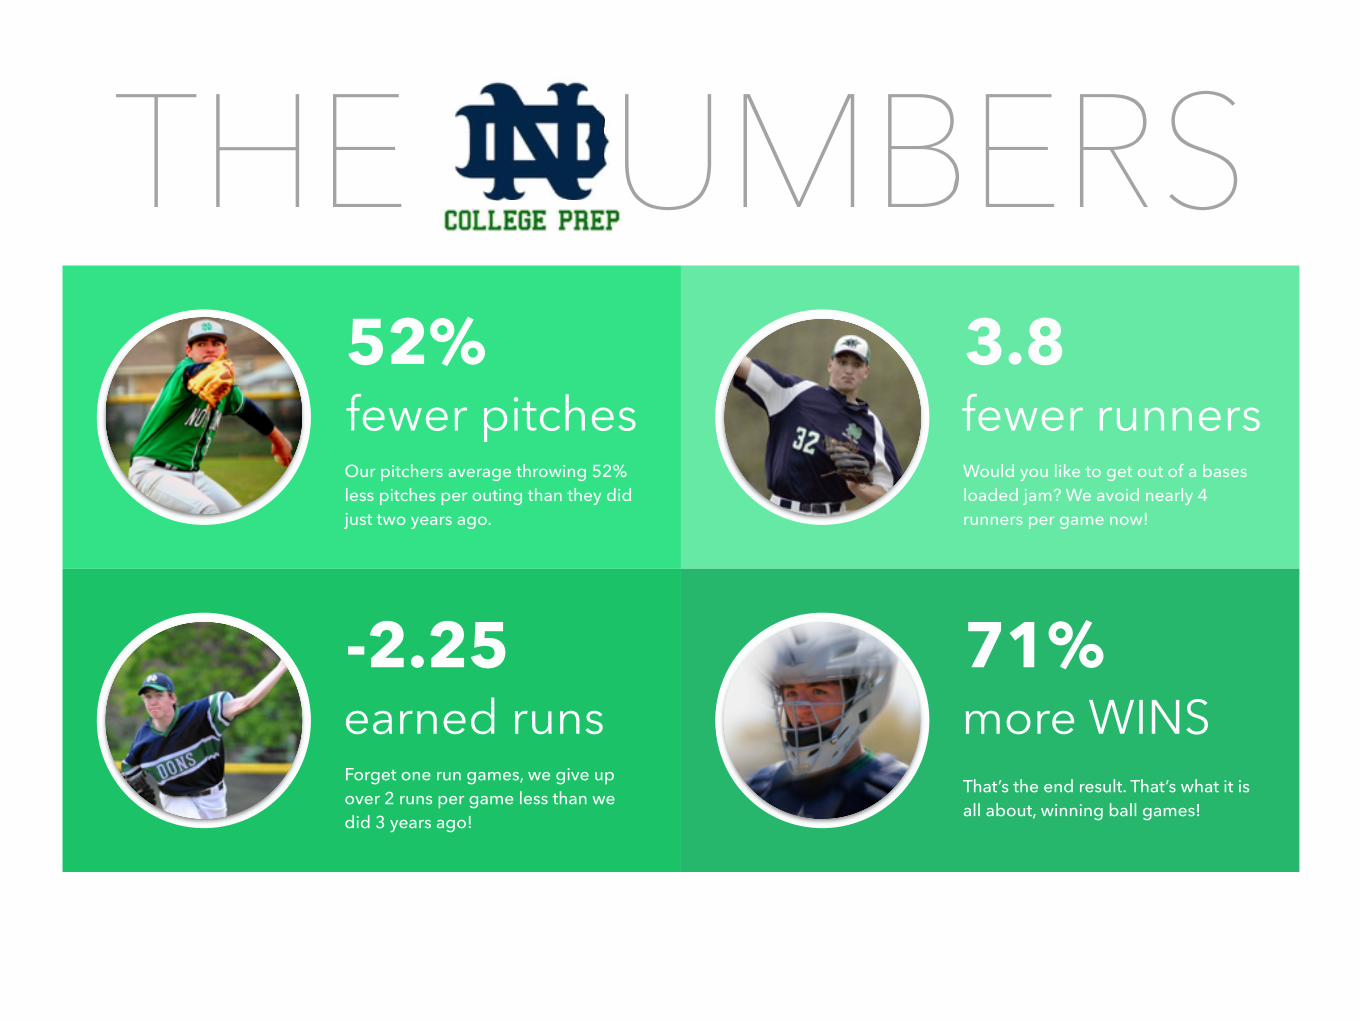
That’s the end result. That’s what it is all about, winning ball games!
71%
Would you like to get out of a bases loaded jam? We avoid nearly 4 runners per game now!
3.8
Forget one run games, we give up over 2 runs per game less than we did 3 years ago!
-2.25
Our pitchers average throwing 52% less pitches per outing than they did just two years ago.
52%fewer pitches fewer runners
earned runs more WINS
THE UMBERS
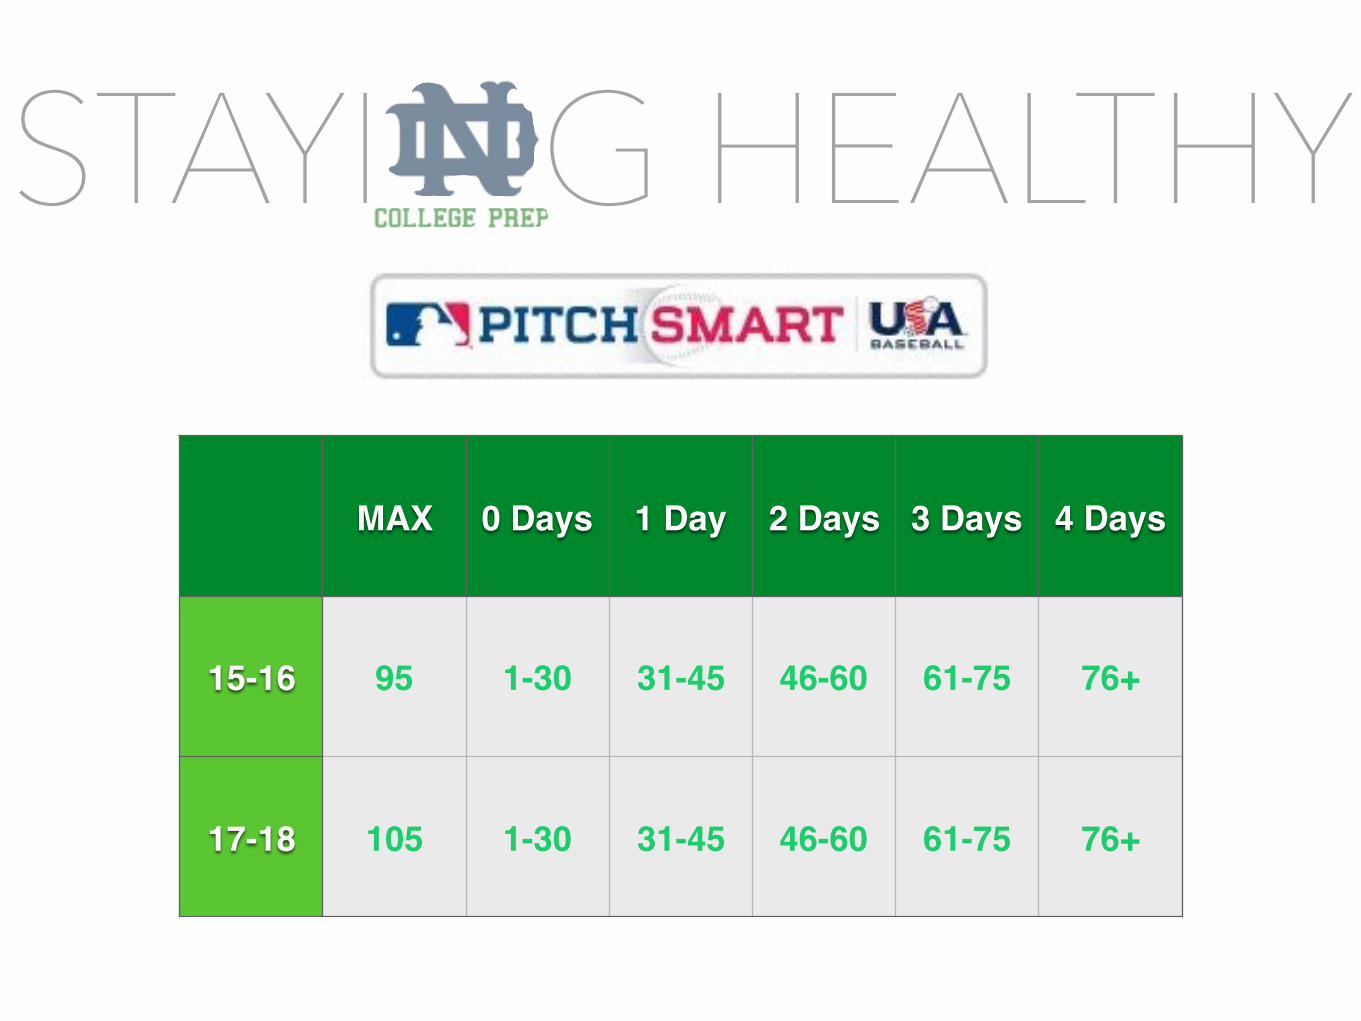
STAYI G HEALTHY
MAX 0 Days 1 Day 2 Days 3 Days 4 Days
15-16 95 1-30 31-45 46-60 61-75 76+
17-18 105 1-30 31-45 46-60 61-75 76+
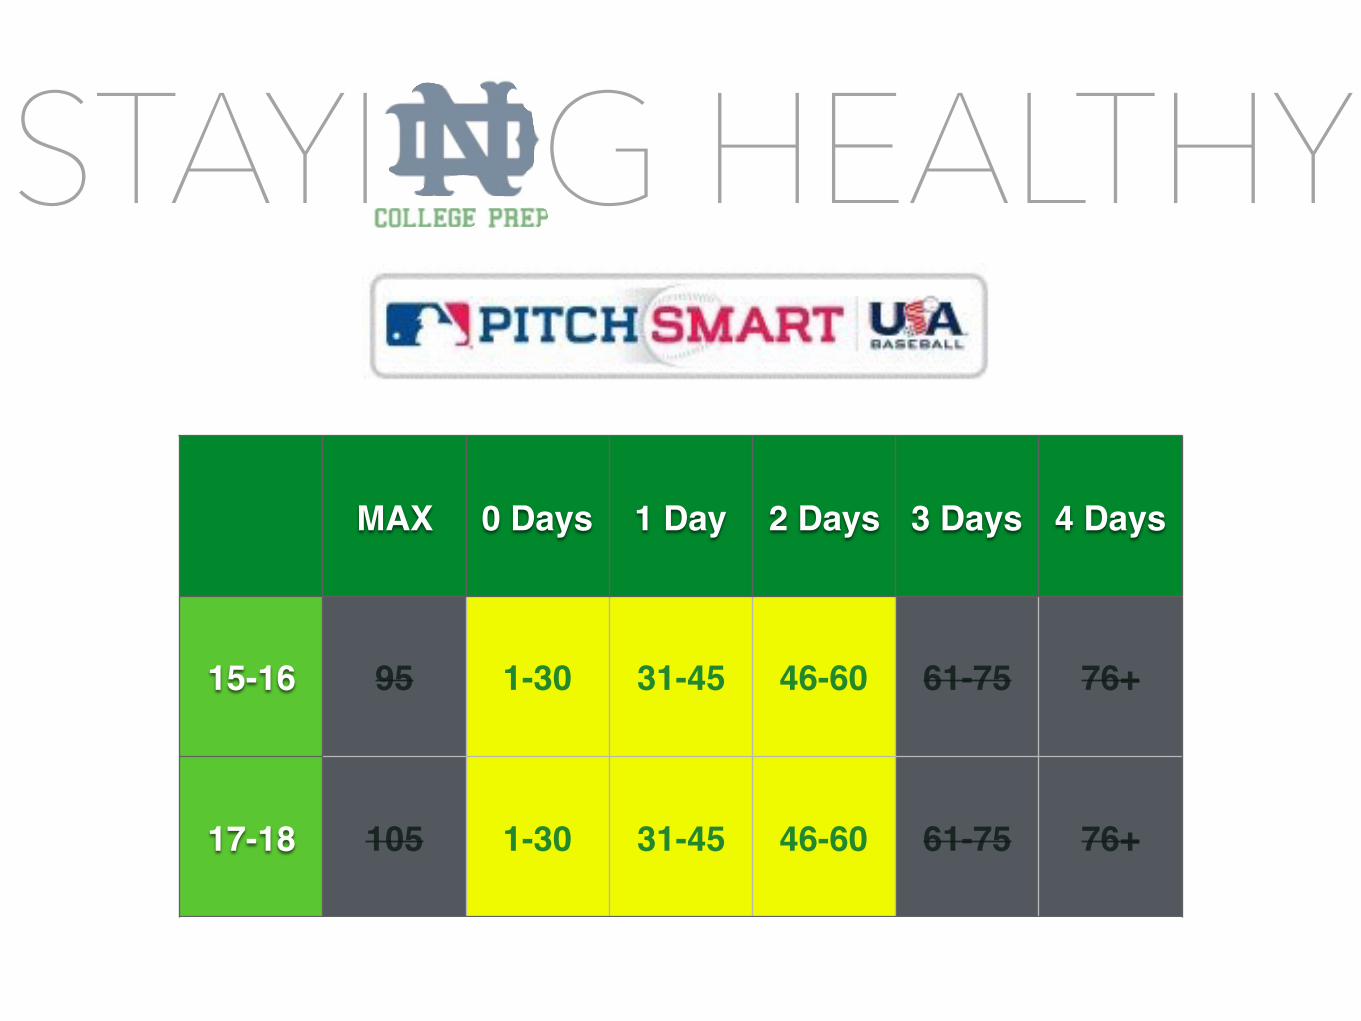
STAYI G HEALTHY
MAX 0 Days 1 Day 2 Days 3 Days 4 Days
15-16 95 1-30 31-45 46-60 61-75 76+
17-18 105 1-30 31-45 46-60 61-75 76+

100%80%
Players will stay healthier and be better prepared by getting on the game mound.
The problem with many bullpen sessions is that they are not done at game speed. Imagine driving down a hill with your foot on the breaks.
Avoid Bullpens
Bullpen Game
STAYI G HEALTHY
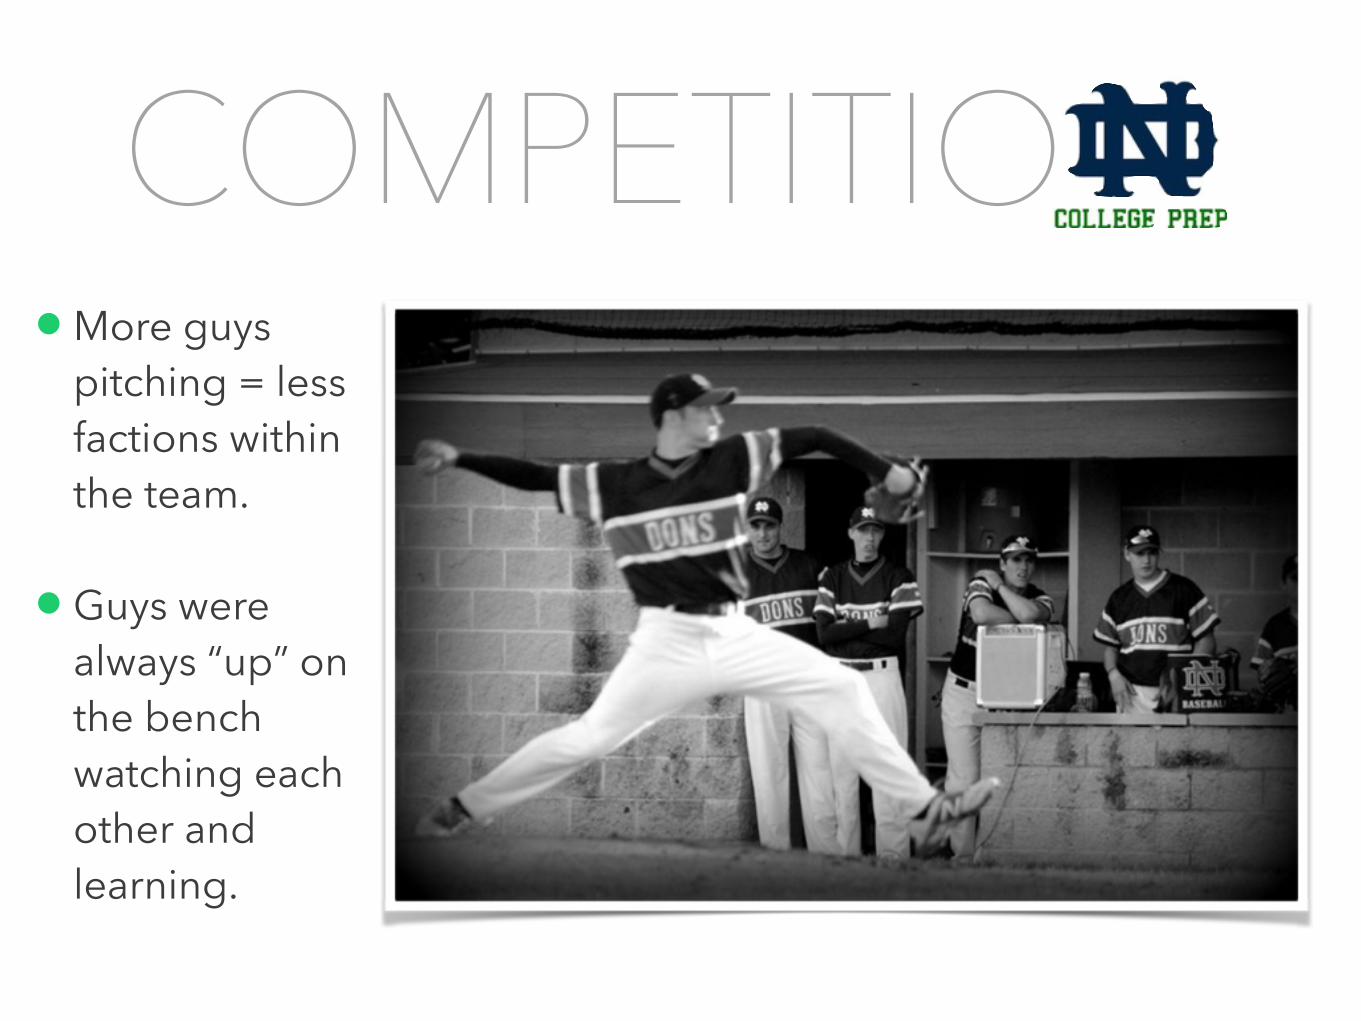
• More guys pitching = less factions within the team.
• Guys were always “up” on the bench watching each other and learning.
COMPETITIO
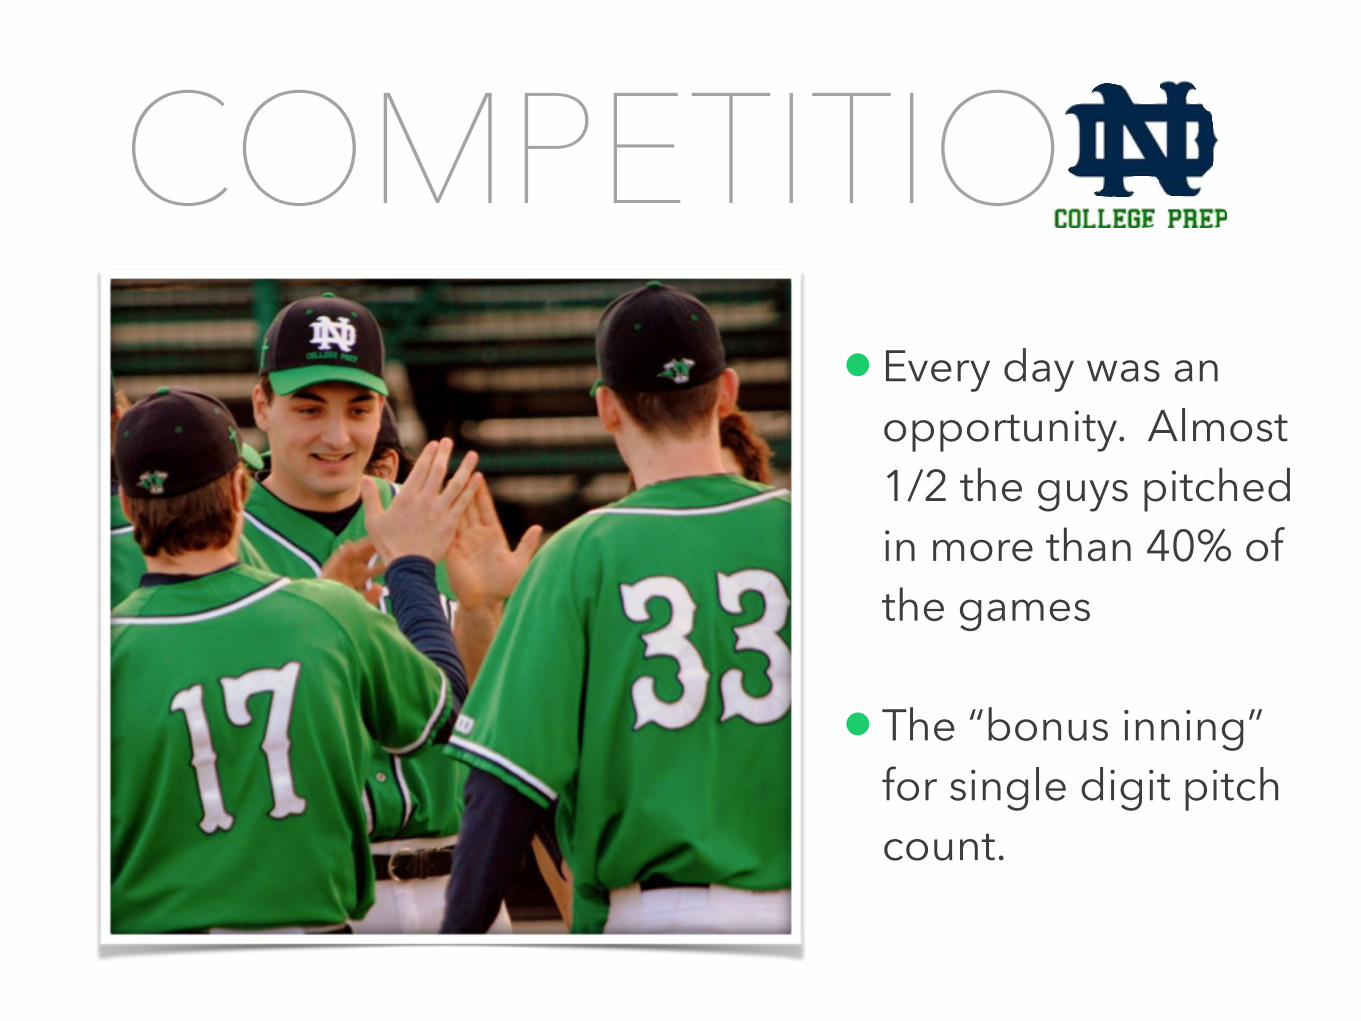
• Every day was an opportunity. Almost 1/2 the guys pitched in more than 40% of the games
• The “bonus inning” for single digit pitch count.
COMPETITIO