PHYSICAL IMPACTS OF CLIMATE CHANGE
8
1 PHYSICAL IMPACTS OF CLIMATE CHANGE For institutional/advisor use only The risk and opportunities of climate change Part 1 of 5 Climate change is here Climate change is causing a wide range of physical impacts with serious implications for investors and businesses. While weather variability and extremes have always existed, satellite and other observations show that temperatures are increasing which is causing some extreme weather events to become more frequent and intense. (Intergovernmental Panel on Climate Change, 2018). These effects have ranged from declines in sea ice, coral bleaching events, links to more intense storms, rising sea levels, heatwaves, droughts and water scarcity. In 2018, which is expected to be the 4th hottest year on record, records were broken all around the world. During the Northern hemisphere summer, an Algerian city experienced the hottest temperature ever reliably recorded (51.3°C), a never-before-seen subtropical storm developed off the coast of Chile, severe storms experienced by Somalia, France, Germany and the Nordics, and flash flooding occurred in Japan, South Korea, Vietnam, Bangladesh and India. The 2018 Californian wildfires are the most destructive on record with over 7,500 fires burning and 1.7 million acres destroyed. While scientists are careful about attributing specific events to climate change, these events are nonetheless consistent with expectations of a warming planet. More clearly linked to climate change than individual events is that according to NASA 17 of the 18 warmest years on record have occurred since 2001 , with the other year being 1998. 2017 was the hottest year on record. These changes are also accelerating, with the period since the 1950s being described as the Great Acceleration by earth system scientists. Charts 1 and 2 show this acceleration through the changes in average global temperature anomalies for the oceans and the land. Chart 3 shows the corresponding rise in greenhouse gas (GHG). Chart 1 & 2: Global ocean and land temperature anomalies 1880-2017 Source: National Oceanic and Atmospheric Administration (NOAA) 2018. Source: NOAA 2018. Chart 3: Concentration of CO2 in the atmosphere – parts per million Source: NASA 2018.
Transcript of PHYSICAL IMPACTS OF CLIMATE CHANGE

1
PHYSICAL IMPACTS OF CLIMATE CHANGE
For institutional/advisor use only
The risk and opportunities of climate change Part 1 of 5
Climate change is hereClimate change is causing a wide range of physical impacts with serious implications for investors and businesses. While weather variability and extremes have always existed, satellite and other observations show that temperatures are increasing which is causing some extreme weather events to become more frequent and intense. (Intergovernmental Panel on Climate Change, 2018).
These effects have ranged from declines in sea ice, coral bleaching events, links to more intense storms, rising sea levels, heatwaves, droughts and water scarcity.
In 2018, which is expected to be the 4th hottest year on record, records were broken all around the world. During the Northern hemisphere summer, an Algerian city experienced the hottest temperature ever reliably recorded (51.3°C), a never-before-seen subtropical storm developed off the coast of Chile, severe storms experienced by Somalia, France, Germany and the Nordics, and flash flooding occurred in Japan,
South Korea, Vietnam, Bangladesh and India. The 2018 Californian wildfires are the most destructive on record with over 7,500 fires burning and 1.7 million acres destroyed.
While scientists are careful about attributing specific events to climate change, these events are nonetheless consistent with expectations of a warming planet. More clearly linked to climate change than individual events is that according to NASA 17 of the 18 warmest years on record have occurred since 2001, with the other year being 1998. 2017 was the hottest year on record.
These changes are also accelerating, with the period since the 1950s being described as the Great Acceleration by earth system scientists.
Charts 1 and 2 show this acceleration through the changes in average global temperature anomalies for the oceans and the land. Chart 3 shows the corresponding rise in greenhouse gas (GHG).
Chart 1 & 2: Global ocean and land temperature anomalies 1880-2017
Source: National Oceanic and Atmospheric Administration (NOAA) 2018. Source: NOAA 2018.
Chart 3: Concentration of CO2 in the atmosphere – parts per million
Source: NASA 2018.

2
The Risks and Opportunities of Climate Change Part 1: Physical Impacts of Climate Change
Climate change’s hidden sting Two things are often underappreciated in relation to these changes. Firstly, small changes in average temperature can have significant impacts because the rising average temperatures also shift the distribution of the extremes. This change in distribution is important because shifting the curve results in rare extremes becoming more frequent while new, never before seen extremes begin to occur.
Chart 4 represents the shift in the probability distribution for average and extreme temperatures as a result of global warming. Chart 5 shows the actual shift in distribution in decades since 1981. The frequency of extreme high temperatures increases non-linearly, while extreme lows show a more muted response.
Chart 4: Increase in mean temperature and variance
Source: Adapted from IPCC (2001) http://www.c2es.org/publications/extreme-weather-and-climate-change.
Chart 5: Shifting distribution of summer temperatures
Source: Hansen, NASA 2012.
Secondly, while we generally associate climate change with steady, albeit accelerating increases in average temperatures within a relatively stable system, various tipping points and feedback loops risk shifting the climate rapidly and irreversibly into a new and very different state. A recent paper published by the Proceedings of the National Academy of Sciences of the United States of America (PNAS) identified various tipping points, which if breached, could send the earth’s climate into a “hothouse” state even if human emissions of greenhouse gases were reduced.
Examples of tipping points and feedback loops identified by NASA include:
– changes in ocean circulation and the Gulf Stream due to Arctic and Greenland sea ice melt;
– ice loss causing more of the sun’s energy to be absorbed rather reflected back into space;
– and rapid releases of methane and CO2 caused by melting of permafrost in the Arctic tundra.
Chart 6: Tipping points towards a hothouse earth
Source: Trajectories of the Earth System in the Anthropocene, PNAS 2018.

3
The Risks and Opportunities of Climate Change Part 1: Physical Impacts of Climate Change
Scenarios for future climate changeThe range of impacts of climate change will vary significantly depending on whether humanity is able to reduce greenhouse gases quickly enough to avoid the most catastrophic temperature increases. The IPCC special report, Global Warming of 1.5°C, considers, among other things, the likely differences between 1.5°C and 2°C of warming. Due to the reasons explained previously along with the sensitivity of different biological systems to changing temperatures, the difference in impacts is significant. For example it is the difference between losing 70% of coral reefs like the Great Barrier Reef or all of them. The economic impacts of such changes are almost incalculable.
Chart 7 illustrates at a global level the change in risk across a number of dimensions as temperatures increase. Risks increase more rapidly for some areas than others. At 4°C the risks of catastrophic impacts are high across all areas. It also shows the current temperature change (about 1°C above pre-industrial levels) has already increased risks which, as demonstrated above, are having significant impacts. The current cumulative effect of national commitments made through the Paris Agreement would only contain likely warming to somewhere between 2.5°C and 3°C but may result in higher temperatures.
Chart 7: Climate scenario impacts on risk
Source: Intergovernmental Panel on Climate Change 2014.
This is because the expected amount of warming for a given concentration of GHG emissions is not fixed. The probability of a given temperature increase is represented in Chart 8. The often discussed 450 scenario (as used in International Energy Agency analysis) only provides a 50% probability of staying under 2°C of warming, while the current concentration of 405ppm provides a 66-90% chance of avoiding 2°C. Current levels are also reasonably likely to exceed the 1.5°C increase targeted by the Paris Climate Agreement.
Chart 8: Probability of temperature increases at various levels of GHG concentration
Source: Climate Change Authority 2014.
This means that while assumptions can be made on the implications of various climate outcomes in economic and environmental analysis under different emissions scenarios there are material risks of much worse outcomes, which this analysis often masks. It also does not properly deal with the breaching of tipping points or discontinuous change, all of which underlies the urgency of reducing emissions.
Current impacts of climate change are becoming increasingly costlyThe past is no longer a good guide to the future for assessing company/asset vulnerability to extremes. Chart 9 from NOAA shows the number of billion dollar disaster events in the US since 1980 (adjusted for inflation). There is a clear increase in severe storm damage, more regular wildfires and drought events.
Chart 9: Billion-dollar disaster event (CPI adjusted)
Source NOAA: http://www.ncdc.noaa.gov/billions/time-series, 2018.
These events are occurring around the world, but with important regional differences.

4
The Risks and Opportunities of Climate Change Part 1: Physical Impacts of Climate Change
As a result of these changes and slow action to reduce emissions, the World Economic Forums’ Global Risk Report has become increasingly dominated by environmental and social issues stemming from climate change. In 2018, four of the five risks of highest concern for the next decade (in terms of impact) were directly related to climate change with the fifth being weapons of mass destruction.
Chart 10: World Economic Forum Top 5 global risks
Source: WEF 2018 http://reports.weforum.org/global-risks-2018/files/2018/01/II.-Risks-evolution-table-mid.png
This is impacting companies in different waysThese risks are highly variable and can impact different companies and locations in a number of ways*. For example:
– PG&E shares fell more than 40% when its electricity infrastructure was found to have caused at least 12 wildfires across 6 counties of California in 2017 which the CEO attributed to climate change.
– Nufarm reduced its FY18 earnings forecast by roughly 87.5%, due to the impacts of the Australian drought. Growers have struggled producing healthy crops in such dry conditions which has reduced demand for crop protection.
– Severe floods in Kerala India during August 2018 are estimated to have caused US$2.7bn in damages, with 324 deaths and over 700,000 people displaced. The floods saw rubber plantations impacted and local tyre companies experiencing disruptions from the floods including accessibility for employees. The Economic Times of India reported that shares in Apollo Tyres and MRF lost 12% and 7% respectively in the weeks following the events.
– In 2015, Hurricane Harvey devastated Houston with at least 88 deaths. The storm was the second costliest with US$125bn in damages. The petrochemical and refining industries were hard hit shutting down much of the industry and causing knock on effect through increases in petrol prices. AEP Texas and Energy Texas reported storm cost estimates topping a combined US$500 million, with AEP Texas’s estimate ranging from approximately US$250 million to US$300 million.
Any of these events may have occurred anyway and the attribution of particular extreme weather events to climate change is difficult. However over the last decade scientists have been increasingly able to show the likelihood that an event would have occurred without the influence of climate change or how much worse it was as a result. This analysis is often referred to as showing the ‘fingerprints of climate change’ on a given event.
It is sufficient to say that while companies have always incurred costs due to extreme weather events, the likelihood and impact of these has increased to such an extent that they could shift valuations for some assets/companies and that this influence is likely to grow. This is particularly the case for companies that are highly exposed and aren’t appropriately managing the risks. This results in both risks and opportunities for investors, including the opportunity to engage with companies to ensure they are building climate resilience into their businesses.
* Reference to the names of each company mentioned in this communication is for illustrative purposes only, and should not be construed as investment advice or investment recommendation of those companies. Companies mentioned herein may or may not form part of the holdings of CFSGAM.
5
The Risks and Opportunities of Climate Change Part 1: Physical Impacts of Climate Change
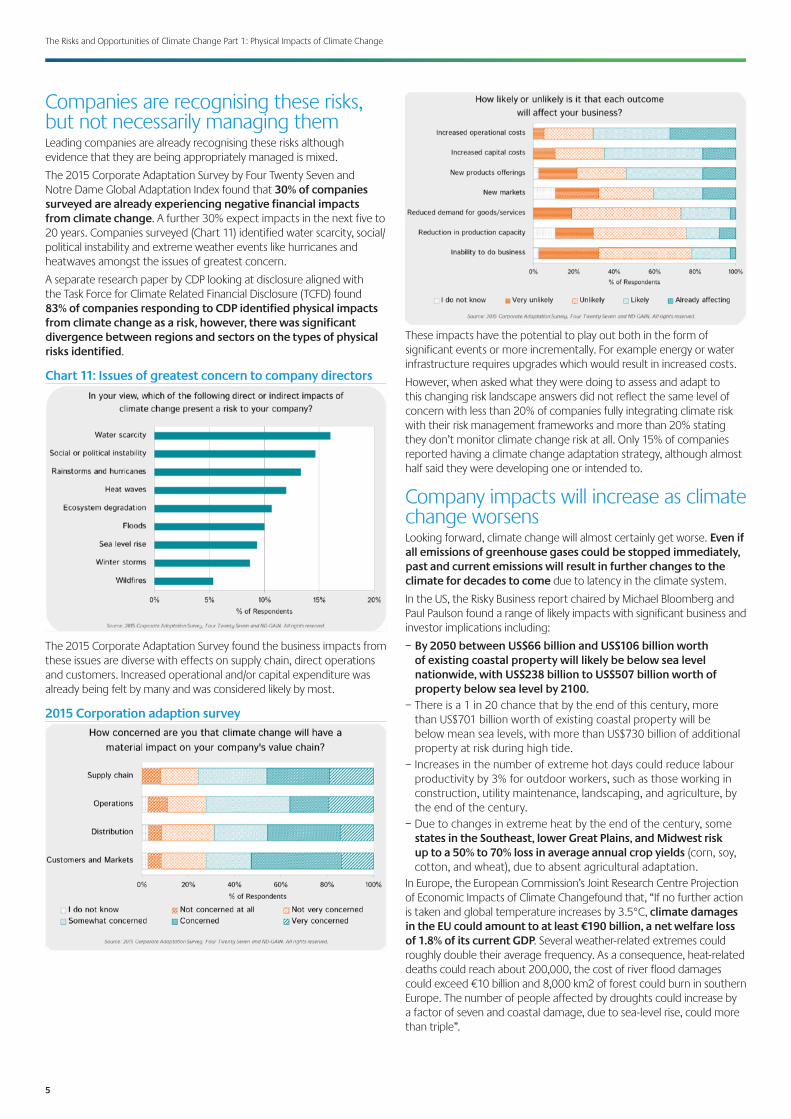
Companies are recognising these risks, but not necessarily managing themLeading companies are already recognising these risks although evidence that they are being appropriately managed is mixed.
The 2015 Corporate Adaptation Survey by Four Twenty Seven and Notre Dame Global Adaptation Index found that 30% of companies surveyed are already experiencing negative financial impacts from climate change. A further 30% expect impacts in the next five to 20 years. Companies surveyed (Chart 11) identified water scarcity, social/political instability and extreme weather events like hurricanes and heatwaves amongst the issues of greatest concern.
A separate research paper by CDP looking at disclosure aligned with the Task Force for Climate Related Financial Disclosure (TCFD) found 83% of companies responding to CDP identified physical impacts from climate change as a risk, however, there was significant divergence between regions and sectors on the types of physical risks identified.
Chart 11: Issues of greatest concern to company directors
The 2015 Corporate Adaptation Survey found the business impacts from these issues are diverse with effects on supply chain, direct operations and customers. Increased operational and/or capital expenditure was already being felt by many and was considered likely by most.
2015 Corporation adaption survey
These impacts have the potential to play out both in the form of significant events or more incrementally. For example energy or water infrastructure requires upgrades which would result in increased costs.
However, when asked what they were doing to assess and adapt to this changing risk landscape answers did not reflect the same level of concern with less than 20% of companies fully integrating climate risk with their risk management frameworks and more than 20% stating they don’t monitor climate change risk at all. Only 15% of companies reported having a climate change adaptation strategy, although almost half said they were developing one or intended to.
Company impacts will increase as climate change worsens Looking forward, climate change will almost certainly get worse. Even if all emissions of greenhouse gases could be stopped immediately, past and current emissions will result in further changes to the climate for decades to come due to latency in the climate system.
In the US, the Risky Business report chaired by Michael Bloomberg and Paul Paulson found a range of likely impacts with significant business and investor implications including:
– By 2050 between US$66 billion and US$106 billion worth of existing coastal property will likely be below sea level nationwide, with US$238 billion to US$507 billion worth of property below sea level by 2100.
– There is a 1 in 20 chance that by the end of this century, more than US$701 billion worth of existing coastal property will be below mean sea levels, with more than US$730 billion of additional property at risk during high tide.
– Increases in the number of extreme hot days could reduce labour productivity by 3% for outdoor workers, such as those working in construction, utility maintenance, landscaping, and agriculture, by the end of the century.
– Due to changes in extreme heat by the end of the century, some states in the Southeast, lower Great Plains, and Midwest risk up to a 50% to 70% loss in average annual crop yields (corn, soy, cotton, and wheat), due to absent agricultural adaptation.
In Europe, the European Commission’s Joint Research Centre Projection of Economic Impacts of Climate Changefound that, “If no further action is taken and global temperature increases by 3.5°C, climate damages in the EU could amount to at least €190 billion, a net welfare loss of 1.8% of its current GDP. Several weather-related extremes could roughly double their average frequency. As a consequence, heat-related deaths could reach about 200,000, the cost of river flood damages could exceed €10 billion and 8,000 km2 of forest could burn in southern Europe. The number of people affected by droughts could increase by a factor of seven and coastal damage, due to sea-level rise, could more than triple”.
6
The Risks and Opportunities of Climate Change Part 1: Physical Impacts of Climate Change
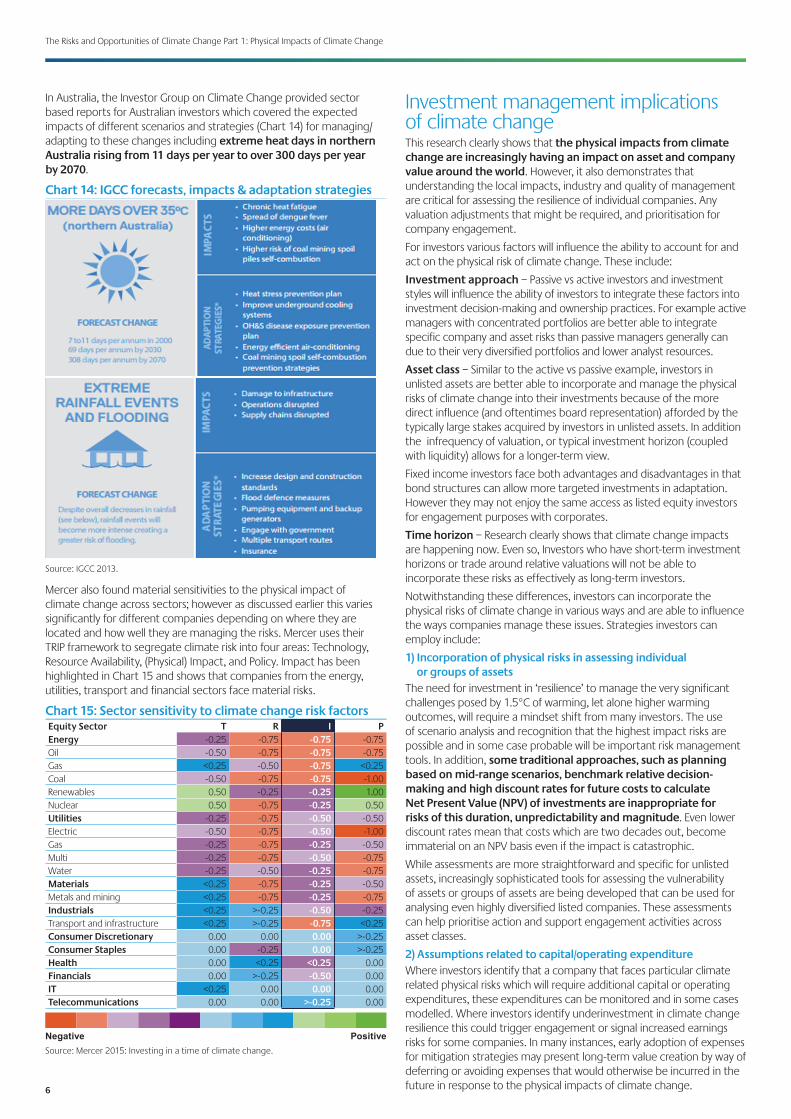
In Australia, the Investor Group on Climate Change provided sector based reports for Australian investors which covered the expected impacts of different scenarios and strategies (Chart 14) for managing/adapting to these changes including extreme heat days in northern Australia rising from 11 days per year to over 300 days per year by 2070.
Chart 14: IGCC forecasts, impacts & adaptation strategies
Source: IGCC 2013.
Mercer also found material sensitivities to the physical impact of climate change across sectors; however as discussed earlier this varies significantly for different companies depending on where they are located and how well they are managing the risks. Mercer uses their TRIP framework to segregate climate risk into four areas: Technology, Resource Availability, (Physical) Impact, and Policy. Impact has been highlighted in Chart 15 and shows that companies from the energy, utilities, transport and financial sectors face material risks.
Chart 15: Sector sensitivity to climate change risk factorsEquity Sector T R I PEnergy -0.25 -0.75 -0.75 -0.75Oil -0.50 -0.75 -0.75 -0.75Gas <0.25 -0.50 -0.75 <0.25Coal -0.50 -0.75 -0.75 -1.00Renewables 0.50 -0.25 -0.25 1.00Nuclear 0.50 -0.75 -0.25 0.50Utilities -0.25 -0.75 -0.50 -0.50Electric -0.50 -0.75 -0.50 -1.00Gas -0.25 -0.75 -0.25 -0.50Multi -0.25 -0.75 -0.50 -0.75Water -0.25 -0.50 -0.25 -0.75Materials <0.25 -0.75 -0.25 -0.50Metals and mining <0.25 -0.75 -0.25 -0.75Industrials <0.25 >-0.25 -0.50 -0.25Transport and infrastructure <0.25 >-0.25 -0.75 <0.25Consumer Discretionary 0.00 0.00 0.00 >-0.25Consumer Staples 0.00 -0.25 0.00 >-0.25Health 0.00 <0.25 <0.25 0.00Financials 0.00 >-0.25 -0.50 0.00IT <0.25 0.00 0.00 0.00Telecommunications 0.00 0.00 >-0.25 0.00
Negative PositiveSource: Mercer 2015: Investing in a time of climate change.
Investment management implications of climate change This research clearly shows that the physical impacts from climate change are increasingly having an impact on asset and company value around the world. However, it also demonstrates that understanding the local impacts, industry and quality of management are critical for assessing the resilience of individual companies. Any valuation adjustments that might be required, and prioritisation for company engagement.
For investors various factors will influence the ability to account for and act on the physical risk of climate change. These include:
Investment approach – Passive vs active investors and investment styles will influence the ability of investors to integrate these factors into investment decision-making and ownership practices. For example active managers with concentrated portfolios are better able to integrate specific company and asset risks than passive managers generally can due to their very diversified portfolios and lower analyst resources.
Asset class – Similar to the active vs passive example, investors in unlisted assets are better able to incorporate and manage the physical risks of climate change into their investments because of the more direct influence (and oftentimes board representation) afforded by the typically large stakes acquired by investors in unlisted assets. In addition the infrequency of valuation, or typical investment horizon (coupled with liquidity) allows for a longer-term view.
Fixed income investors face both advantages and disadvantages in that bond structures can allow more targeted investments in adaptation. However they may not enjoy the same access as listed equity investors for engagement purposes with corporates.
Time horizon – Research clearly shows that climate change impacts are happening now. Even so, Investors who have short-term investment horizons or trade around relative valuations will not be able to incorporate these risks as effectively as long-term investors.
Notwithstanding these differences, investors can incorporate the physical risks of climate change in various ways and are able to influence the ways companies manage these issues. Strategies investors can employ include:
1) Incorporation of physical risks in assessing individual or groups of assets
The need for investment in ‘resilience’ to manage the very significant challenges posed by 1.5°C of warming, let alone higher warming outcomes, will require a mindset shift from many investors. The use of scenario analysis and recognition that the highest impact risks are possible and in some case probable will be important risk management tools. In addition, some traditional approaches, such as planning based on mid-range scenarios, benchmark relative decision-making and high discount rates for future costs to calculate Net Present Value (NPV) of investments are inappropriate for risks of this duration, unpredictability and magnitude. Even lower discount rates mean that costs which are two decades out, become immaterial on an NPV basis even if the impact is catastrophic.
While assessments are more straightforward and specific for unlisted assets, increasingly sophisticated tools for assessing the vulnerability of assets or groups of assets are being developed that can be used for analysing even highly diversified listed companies. These assessments can help prioritise action and support engagement activities across asset classes.
2) Assumptions related to capital/operating expenditureWhere investors identify that a company that faces particular climate related physical risks which will require additional capital or operating expenditures, these expenditures can be monitored and in some cases modelled. Where investors identify underinvestment in climate change resilience this could trigger engagement or signal increased earnings risks for some companies. In many instances, early adoption of expenses for mitigation strategies may present long-term value creation by way of deferring or avoiding expenses that would otherwise be incurred in the future in response to the physical impacts of climate change.

7
The Risks and Opportunities of Climate Change Part 1: Physical Impacts of Climate Change
3) Assumptions related to demand for goods and servicesFor some companies including retailers, demands for goods and services may shift as a result of a changing climate. This may particularly impact specialist providers and require changes to inventory management practices. For example, there have already been cases where warmer winters have affected sales of winter clothing and heating appliances. The converse is also true for air conditioners or insulation. In some cases assumptions around sales growth can be adjusted in response.
4) Engagement with company management
The results of climate change assessments can be incorporated into engagement plans with companies to gain confidence in management’s approach to climate risk. As with other ESG issues this can be seen as a proxy for management quality generally and provide competitive advantage to more resilient businesses. Encouraging companies to have good governance and risk management approaches and to play a constructive role in reducing emissions to mitigate climate change can help encourage positive change for individual companies and across markets.
Proxy voting is a powerful extension of engagement for listed equities. Shareholder resolutions requesting improved disclosure are opportunities for investors to reinforce the importance of the issue. Investors will face increasing scrutiny of their proxy voting decisions in this regard.
Investors in unlisted assets should also expect increased scrutiny of their engagement with the management teams of individual assets given their often direct oversight through board representation.
Fixed Income investors can encourage positive action and improved management of climate change risks through active engagement at investor meetings and supporting sustainable bonds that are targeted to improve climate change resilience. Fixed Income investors can also demand a risk premium to invest in corporate bonds of companies that are weak in managing these risks.
5) Advocacy and engagement with regulators and other stakeholders
Two aspects are particularly relevant for investor advocacy. The risks associated with climate change are so great that avoiding the worst impacts is the best way to avoid future losses, in that regard advocating for effective climate mitigation policies like carbon pricing remains important.
Secondly, standards around buildings, infrastructure and community resilience need to be made climate change ready. It is important that investors advocate for high standards in these areas as the interconnectedness of the risks makes it difficult to manage at the asset level alone.
6) Climate change governance and risk disclosure
In order to shift the conversation around climate risk and play a constructive role in mitigating the worst impacts of climate change, investors need to be clear in their own disclosure on these issues. This includes descriptions of how climate change risks are integrated into investment decision-making and engagement, quantitative and qualitative risk analysis, case studies and proxy voting.
7) Adaptation planning
For unlisted assets, formal adaptation planning will become increasingly important to ensure the risks of climate change are being adequately understood and managed. For listed assets, engagement with companies on the importance of adaptation planning and transparent disclosure is also important.
9) Assessing supply chain risks
Some companies will face larger risks in their supply chains than in their direct operations. Beyond traditional supply chain analysis, understanding the resilience of critical infrastructure and communities will provide a more comprehensive understanding of the risks and opportunities. Understanding supply chain risks related to climate change should be seen as part of existing assessments of supply chain resilience already performed by many investors for both listed and unlisted assets. While transparency around suppliers will often be more limited for investors in listed assets, a focus on material suppliers and climate impacts at a country level can be used to provide early insights ahead of company engagement.
10) Adaptation finance
The opportunity to invest directly in adaptation and resilience is becoming possible through bond and other financing structures. Similarly, understanding which companies (e.g. engineering services or water services) are likely to offer investors exposure to growth areas while also offering diversification and other benefits.
The table below outlines these different approaches for managing the physical risks across asset classes with further description provided.
Asset Class
Inco
rpor
atio
n of
phy
sical
ris
ks in
ass
essin
g in
divi
dual
or
gro
ups
of a
sset
s
Ass
umpt
ions
rela
ted
to c
apita
l/ope
ratin
g
expe
nditu
re
Ass
umpt
ions
rela
ted
to
dem
and
for g
oods
and
se
rvic
es
Enga
gem
ent w
ith c
ompa
ny
man
agem
ent
Advo
cacy
and
eng
agem
ent
with
regu
lato
rs a
nd o
ther
st
akeh
olde
rs
Clim
ate
chan
ge
gove
rnan
ce a
nd ri
sk
disc
losu
re (i
nc v
otin
g)
Adap
tatio
n pl
anni
ng
Ass
essin
g su
pply
cha
in ri
sks
Adap
tatio
n fin
ance
Active Domestic Listed Equites X X X X X X X
Active Global Equities X X X X X X X
Passive Domestic Listed Equities X X X X
Passive International equities X X X X
Corporate debt X X X X X X X X
Corporate debt financials X X X X X
Sov/semi/supra Debt X X X X X X X
Private equity X X X X X X X X X
Unlisted property X X X X X X X X X
Unlisted Infrastructure X X X X X X X X X
High Level – external tools and forecastsMedium Level – external tools and forecasts, proprietary models/frameworksDeep level – external tools and forecasts, proprietary models/frameworks, specialist reports and advice
8
The Risks and Opportunities of Climate Change Part 1: Physical Impacts of Climate Change
ConclusionClimate change is real, it is here and it will change the very planetary processes which have underpinned human prosperity since the start of the Holocene. The issue demands an urgent response from across society including the investment community.
Climate change is affecting countries, companies, assets and communities in a variety of ways and these impacts are likely to get worse. The difference in catastrophic risks between 1.5°C and 2°C of warming demonstrates that significant effort must go into reducing emissions and advocating for policy to support significant emission reductions.
Good stewardship of client assets requires investors to consider these issues with a range of strategies that are relevant for different assets classes. Given the complexity and wide-reaching nature of the issues posed by climate-breakdown, organisations require an integrated approach which cuts across the business and investment activities.
Coming next, part 2New legislation and policy is being introduced around the world to curb emissions. It reflects the efforts of policy makers to limit the physical impacts of climate change; society’s concerns about the changing climate as well as a fiduciary duty to current and future generations.
Part 2 in our 5 part Climate Change Series discusses recent changes in regulation at a global, national, state, local and sectoral level. Importantly, it also addresses the growth and trends in policy responses by countries and how this impacts companies.
This document is directed at persons of a professional, sophisticated or wholesale nature and not the retail market.This document has been prepared for general information purposes only and is intended to provide a summary of the subject matter covered. It does not purport to be comprehensive or to give advice. The views expressed are the views of the writer at the time of issue and may change over time. This is not an offer document, and does not constitute an offer, invitation, investment recommendation or inducement to distribute or purchase securities, shares, units or other interests or to enter into an investment agreement. No person should rely on the content and/or act on the basis of any matter contained in this document.This document is confidential and must not be copied, reproduced, circulated or transmitted, in whole or in part, and in any form or by any means without our prior written consent. The information contained within this document has been obtained from sources that we believe to be reliable and accurate at the time of issue but no representation or warranty, express or implied, is made as to the fairness, accuracy or completeness of the information. We do not accept any liability for any loss arising whether directly or indirectly from any use of this document.References to “we” or “us” are references to Colonial First State Global Asset Management (CFSGAM) which is the consolidated asset management division of the Commonwealth Bank of Australia ABN 48 123 123 124. CFSGAM includes a number of entities in different jurisdictions, operating in Australia as CFSGAM and as First State Investments (FSI) elsewhere. Past performance is not a reliable indicator of future performance.Reference to specific securities (if any) is included for the purpose of illustration only and should not be construed as a recommendation to buy or sell. Reference to the names of any company is merely to explain the investment strategy and should not be construed as investment advice or a recommendation to invest in any of those companies.Hong Kong and SingaporeIn Hong Kong, this document is issued by First State Investments (Hong Kong) Limited and has not been reviewed by the Securities & Futures Commission in Hong Kong. In Singapore, this document is issued by First State Investments (Singapore) whose company registration number is 196900420D and has not been reviewed by the Monetary Authority of Singapore. First State Investments and First State Stewart Asia are business names of First State Investments (Hong Kong) Limited. First State Investments (registration number 53236800B) and First State Stewart Asia (registration number 53314080C) are business divisions of First State Investments (Singapore).AustraliaIn Australia, this document is issued by Colonial First State Asset Management (Australia) Limited AFSL 289017 ABN 89 114 194311.United Kingdom and European Economic Area (“EEA”)In the United Kingdom, this document is issued by First State Investments (UK) Limited which is authorised and regulated in the UK by the Financial Conduct Authority (registration number 143359). Registered office: Finsbury Circus House, 15 Finsbury Circus, London, EC2M 7EB, number 2294743.Outside the UK within the EEA, this document is issued by First State Investments International Limited which is authorised and regulated in the UK by the Financial Conduct Authority (registration number 122512). Registered office 23 St. Andrew Square, Edinburgh, Midlothian EH2 1BB number SC079063.Middle EastIn certain jurisdictions the distribution of this material may be restricted. The recipient is required to inform themselves about any such restrictions and observe them. By having requested this document and by not deleting this email and attachment, you warrant and represent that you qualify under any applicable financial promotion rules that may be applicable to you to receive and consider this document, failing which you should return and delete this e-mail and all attachments pertaining thereto.KuwaitIf in doubt, you are recommended to consult a party licensed by the Capital Markets Authority (“CMA”) pursuant to Law No. 7/2010 and the Executive Regulations to give you the appropriate advice. Neither this document nor any of the information contained herein is intended to and shall not lead to the conclusion of any contract whatsoever within Kuwait.UAE - Dubai International Financial Centre (DIFC)Within the DIFC this material is directed solely at Professional Clients as defined by the DFSA’s COB Rulebook. UAE (ex-DIFC)By having requested this document and / or by not deleting this email and attachment, you warrant and represent that you qualify under the exemptions contained in Article 2 of the Emirates Securities and Commodities Authority Board Resolution No 37 of 2012, as amended by decision No 13 of 2012 (the “Mutual Fund Regulations”). By receiving this material you acknowledge and confirm that you fall within one or more of the exemptions contained in Article 2 of the Mutual Fund Regulations.USAIn the US, this document is issued by First State Investments (US) LLC. This material is solely for the attention of institutional, professional, qualified or sophisticated investors and distributors who qualify as qualified purchasers under the Investment Company Act of 1940 and as accredited investors under Rule 501 of SEC Regulation D under the US Securities Act of 1933. It is not to be distributed to the general public, private customers or retail investors in any jurisdiction whatsoever.Copyright © Colonial First State Group Limited 2018All rights reserved.