LP 4 Impacts of Climate Change on Physical Systems
42
LP 4 # of Days 2 Prior Knowledge Depending on students' backgrounds they may or may not be able to identify dependent and independent variables. If students struggle with reading easy graphs, they may need more scaffolding prior to the Stations activity. California English- Language Arts Content Standards Reading 2.5 Writing 2.3.b, c Listening and Speaking 1.1, 2.0.b, c Lesson Objective Students will analyze the sources for climate data and will analyze this data to identify the impact of climate change on physical systems. Language Goals/Demands Students will be able to describe the impacts of climate change on the physical system and justify claims with evidence. Lesson Assessment Quiz over using data to make conclusions & mitigation strategies California State Science Standard Earth Science 1.c, 4.a, 4.b, 4.c, 6.a, 6.c, 6.d, 8.b; Investigation 1.a, 1.d, 1.m Materials Needed Graphs and Questions for each station; Graphs for Causes; Powerpoint slides for Ice Core Explanations, Mitigation Powerpoint What Worked Well Time Learning Task or Activity Day 1 3 min BW: Some scientists collect data from tens of thousands of years ago. How do you think scientists can know what happened so far in the past? Discuss your ideas with a partner 20 min Data Collection Instrumentation - Show students slide #2 pointing out that the data goes back 100,000 years. - Ask for student input about how data is collected especially from periods long ago. (Talk about thermometers, satellites, etc. and introduce ice cores if students don't suggest this) - Pass out Student Guide for use during this segment Method & Notes Changes for Next Time Impacts of Climate Change on Physical Systems Pair Work WHOLE CLASS DISCUSSION/ANALYSIS See Slides 4.1.1 for Ice Core Slides See 4.1.1 for Ice Core Slides and Notes See 4.1.2 for Ice Core Guiding Questions If you have access to streaming video, you may replace the slide show and data analysis with the KQED video (20 minutes) on ice cores found at: http://www.kqed.org/quest/television/web-extra-at-the-core-of-climate- change
Transcript of LP 4 Impacts of Climate Change on Physical Systems

LP 4# of Days 2
Prior Knowledge
Depending on students' backgrounds they may or may not be able to identify dependent and independent variables. If students struggle with reading easy graphs, they may need more scaffolding prior to the Stations activity.
California English-Language Arts
Content Standards
Reading 2.5Writing 2.3.b, cListening and Speaking 1.1, 2.0.b, c
Lesson Objective
Students will analyze the sources for climate data and will analyze this data to identify the impact of climate change on physical systems.
Language Goals/Demands
Students will be able to describe the impacts of climate change on the physical system and justify claims with evidence.
Lesson Assessment
Quiz over using data to make conclusions & mitigation strategies
California State Science
StandardEarth Science 1.c, 4.a, 4.b, 4.c, 6.a, 6.c, 6.d, 8.b; Investigation 1.a, 1.d, 1.m
Materials Needed
Graphs and Questions for each station; Graphs for Causes; Powerpoint slides for Ice Core Explanations, Mitigation Powerpoint What Worked Well
Time Learning Task or ActivityDay 1
3 min
BW: Some scientists collect data from tens of thousands of years ago. How do you think scientists can know what happened so far in the past? Discuss your ideas with a partner
20 min
Data Collection Instrumentation- Show students slide #2 pointing out that the data goes back 100,000 years. - Ask for student input about how data is collected especially from periods long ago. (Talk about thermometers, satellites, etc. and introduce ice cores if students don't suggest this)- Pass out Student Guide for use during this segment
Method & Notes
Changes for Next Time
Impacts of Climate Change on Physical Systems
Pair Work
WHOLE CLASS DISCUSSION/ANALYSISSee Slides 4.1.1 for Ice Core SlidesSee 4.1.1 for Ice Core Slides and NotesSee 4.1.2 for Ice Core Guiding Questions
If you have access to streaming video, you may replace the slide show and data analysis with the KQED video (20 minutes) on ice cores found at:http://www.kqed.org/quest/television/web-extra-at-the-core-of-climate-change

7 min
Mitigation Introduction- We have talked about the presence of GHG's and how we detect them, how do you think we can limit them? We will be talking about this at different points over the next few lessons.- Have the chalkboard divided into four parts. Assign student pairs to one sector and have them discuss for four or five minutes how we might be able to decrease or "mitigate" GHG emission in these sectors. Have students write ideas on the board under the proper heading
Possible Sectors: Transportation, Heating & Cooling Buildings, Industry emissions, Electricity Use
12 min
Mitigation Presentation- Present slides on four or five of the wedge strategies that students will use for the summative assessment
HW
Concept Maps - Add the following terms and relationships to your Concept Map:Sea Level Rise, Glacial Cover, Ice Cores
Day 2
3 minBW: What parts of Earth's systems do you think are changing due to increased greenhouse gases? Try and think of two or three possibilities.
5 min
Introduction to Stations- Humans are responsible for significant increased carbon emissions that have an impact on physical and biological systems. Today we are going to look at evidence to make claims about the impact of increased emissions on the physical world. You will be divided into groups and rotate through four stations. Each station has the instructions and task cards. You will record your answers on the student handout.- Divide up students into four groups
INDIVIDUAL SEAT WORK
TEACHER-LED INSTRUCTIONSSee 4.2.1 for Station Resource CardsSee 4.2.2 for Station Task CardsSee 4.2.3 for Student Prompts for the Station Activity
PAIR WORKSee Slides 4.1.3, # 1-3 to introduce the activity
LECTURE/SLIDESSee Slides 4.1.3 for Mitigation StrategiesSee Teacher Guide 4.1.3 for copies of mitigation strategies and notes
HOMEWORK SLIDESee 4.1.3 #8 for homework slide

8 min
Station 1: Long-term Temperature GraphsStation 2: Long-term Sea Level Rise GraphsStation 3: Long-term Snow Cover GraphsStation 4: Severe Weather Frequency Graphs
8 min Station 2:
8 min Station 3:
8 min Station 4:
10 min
Group Processing/Station Debrief- What claims can be made about climate change? - What is the evidence that climate is changing? What is the impact on physical systems?(Remind students to support their statements with data from the previous day's stations).- Is this evidence convincing?
HWWrite a paragraph summarizing the impact of climate change on the physical system. You should mention how confident you feel in the data that supports these claims.
TEACHER-LED DISCUSSIONSee 4.2.4 for Discussion Slides
GROUP WORK
GROUP WORK
GROUP WORK
GROUP WORK

4.0:LessonPlan4:TheImpactofClimateChangeonEarth’sPhysicalSystemTeacherGuides:4.1.1–IceCoreSlides4.1.2–IceCoreGuidingQuestionsHandout4.1.3–MitigationSlides4.2.1–StationResourceCards4.2.2–StationTaskCards4.2.3–StudentPromptsforStationsActivity4.2.4–SlidesforStationDiscussionLessonPlan4QuizOptionalVideoLinkhttp://www.kqed.org/quest/television/web‐extra‐at‐the‐core‐of‐climate‐change

!"#$%&"#'()*+"*#$,-#./""0$,)'"#.%'"'#%1"2(#($"#("34"/%()/"#,5#($"#"%/($#%0*#-"#
60,-#%#7,(#%8,)(#($"#27+3%("#5/,3#($,)'%0*'#,5#9"%/'#%.,:##;+.$(#0,-#-"#%/"#.,+0.#(,#
(%76#%8,)(#$,-#-"#60,-#%8,)(#27+3%("#+0#($"#*+'(%0(#4%'(#',#($%(#-"#2%0#2,34%/"#+(#
(,#,)/#2)//"0(#27+3%(":#
<#
=$+'#./%4$#'$,-#2%/8,0#*+,>+*"#%0*#("34"/%()/"#,&"/#($"#7%'(#?@ABAAA#9"%/':##C(#+'0D(#
+34,/(%0(#($%(#9,)#)0*"/'(%0*#($"#./%4$'#',#3)2$#%'#($%(#'2+"0E'('#%/"#3"%')/+0.#
27+3%("#,&"/#%#&"/9#7,0.#4"/+,*#,5#E3":#F'#-"#$%&"#'""0#+0#4/"&+,)'#4/"'"0(%E,0'B#
($"#%3,)0(#,5#2%/8,0#*+,>+*"#($%(#+'#+0#($"#%(3,'4$"/"#+'#3)2$#3,/"#0,-#($%0#+(#$%'#
"&"/#8""0#+0#($"#4%'(#?@ABAAA#9"%/'#%7($,).$#7"&"7'#-"/"#$+.$"/#3+77+,0'#,5#9"%/'#%.,:##
!$9#*,#9,)#($+06#+(#*,"'0D(#7,,6#7+6"#($"#("34"/%()/"#$%'#.,0"#($%(#3)2$#$+.$"/G##
HF0'-"/I#="34"/%()/"#2$%0."#7%.'#8"$+0*#($"#JKL#+02/"%'"#2%)'"*#89#$)3%0#
%2E&+E"'B#',#($"#27+3%("#+'#'E77#/"'4,0*+0.#(,#($"#8+.#+02/"%'"#+0#JKL:M#
#N,-#*,#9,)#($+06#($"9#3"%')/"*#($"#("34"/%()/"G#
L#

F(#($+'#4,+0(B#+5#9,)#$%&"#%22"''#(,#'(/"%3+0.#&+*",B#9,)#2%0#/"47%2"#($"#'7+*"'#-+($#
($"#OPQR#&+*",#HLA#3+0)("'M#,0#+2"#2,/"'#5,)0*#%(I#
$S4ITT---:6U"*:,/.TU)"'(T("7"&+'+,0T-"8V">(/%V%(V($"V2,/"V,5V27+3%("V2$%0."#
=$"/3,3"("/'#%/"#,079#%#2,)47"#,5#$)0*/"*#9"%/'#,7*B#8)(#-"#$%&"#*%(%#5,/#$)0*/"*'#
,5#($,)'%0*'#,5#9"%/':##!$%(#*,#9,)#($+06#($"9#)'"G##
W# ?#

@#
=$"#')33"/#8%0*'#%44"%/#-$+("#8"2%)'"#($"#'0,-#">4"/+"02"'#L?#$,)/'#,5#')07+.$(#
+0#($"#4,7%/#/".+,0':##=$+'#2$%0."'#($"#(">()/"#2,34%/"*#(,#($"#A#$,)/'#,5#')07+.$(#
($%(#+(#/"2"+&"'#+0#($"#-+0("/:#
X#

Y#
C0#($"#+2"B#($"#-%("/#3,7"2)7"'#HNLKM#$%&"#,>9."0#%(,3'#,5#*+1"/"0(#+',(,4"':##=$"#
/%E,#,5#($"#%3,)0(#,5#,0"#,>9."0#+',(,4"#(,#%0,($"/#,>9."0#+',(,4"#+'#)'"*#%'#%#
4/,>9#5,/#("34"/%()/":##Z2+"0E'('#2%0#3"%')/"#($"#+',(,4"#/%E,#,5#($"#+2"#(,#
*"("/3+0"#($"#4%'(#("34"/%()/":###
[,77"0#%0*#*)'(#4%/E27"'#%/"#)'"*#(,#+05"/#3,/"#%8,)(#($"#2,0*+E,0'#%(#($%(#E3":#
=$"/"#%/"#.%'#8)887"'#(/%44"*#+0#($"#+2"#%7',:##=$+'#.%'#2%0#8"#%0%79\"*#(,#*"("/3+0"#
($"#%3,)0(#,5#./""0$,)'"#.%'"'#($%(#-"/"#+0#($"#%(3,'4$"/"#7,0.#%.,:##=$+'#+'#$,-#
'2+"0E'('#2%0#3"%')/"#($"#%3,)0(#,5#2%/8,0#*+,>+*"#+0#($"#%(3,'4$"/":###
]#

=$"#+2"#2,/"'#2%0#8"#(%6"0#5/,3#($,)'%0*'#,5#5""(#*""4B#8)(#($"#7"0.($#,5#($"#2,/"#
*"4"0*'#,0#($"#7"0.($#,5#($"#*/+77#8+(:##^,'(#*/+77#8+('#%/"#?VX#3"("/'#7,0.#',#'2+"0E'('#
."(#">(/"3"79#7,0.#+2"#2,/"'#H,&"/#LAAA#3"("/'M#5/,3#+02/"3"0('#,5#?VX#3"("/':#
_#
Z""#Z()*"0(#N%0*,)(#5,/#C2"#J,/"#R%(%#
<A#

=$"'"#("34"/%()/"'#-"/"#2,77"2("*#&+%#%0#,>9."0#+',(,4"#4/,>9:##=$"#%3,)0(#,5#
,>9."0#+',(,4"#<]#2%0#8"#3"%')/"*#%0*#+'#'(/,0.79#2,//"7%("*#-+($#("34"/%()/":#
C0#-$%(#9"%/#*,#($"#/"%*+0.'#8".+0G#
<<# <L#

JKL#2,02"0(/%E,0#+'#3"%')/"*#89#2%/"5)7#">(/%2E,0#,5#($"#.%'#8)887"':#
<W# <?#

=$"'"#./%4$'#'$,-#($"#/"2"0(#2%/8,0#*+,>+*"#7"&"7:##[/"&+,)'#$+.$'#$%&"#8""0#
')/4%''"*#89#%#./"%(#*"%7:##
=$"/"#+'#0%()/%7#&%/+%E,0B#8)(#-"#$%&"#*+'()/8"*#($"#'9'("3#(,#2%)'"#)00%()/%7#
&%/+%E,0:#
`+&"0#($%(#("34"/%()/"#7%.'#%#8+(#8"$+0*#2%/8,0#*+,>+*"#"3+''+,0'B#-"#2%0#">4"2(#(,#
'""#("34"/%()/"#+02/"%'"'#+0#($"#5)()/":#
<@# <X#

Name________________________________________________________StudentHandout4.1.2:VostokIceCoreDataGuidingQuestion:Aren’tcyclesofwarmingandcoolingnaturalforEarth’sclimate?TemperatureGraphs
1. Lookingatthedatatable,inwhatyeardoesthetemperaturedatastartandstop?
2. Lookingatthetemperaturegraph,howmanycyclesofwarmingandcoolinghastheEarthhadinthepast420,000years?
3. HastheEartheverbeenthishotinthepast420,000years?Temperature&CarbonDioxideGraphs
4. Lookatthetemperatureandcarbondioxidegraphs.Whencarbondioxideishighest,whatisthetemperatureatthesametime?
5. Lookatthedatatableforcarbondioxide.Whatisthemostrecentdateshown?Whatisthecarbondioxidelevelforthatdate?
6. Whatisthecurrentlevelofcarbondioxide?
7. Basedonyouranswersforquestions4‐6,whatdoyouthinkwillhappentotemperaturesinthenearfuture?
8. Doyouthinkthisispartofanaturalcycle?Whyorwhynot?

1
Climate Change mitigation: actions we can take to reduce the emissions of greenhouse gases. For this lesson we will be learning
about 4 mitigation strategies. These strategies will help mitigate or reduce the amount of carbon dioxide that is released into the
atmosphere.
2
This should be a review of earlier lesson
We know this from different sources like the ice cores that we just
discussed.
If we want to avoid changing the earth even more, we need to cut down
or mitigate the amount of carbon that we use.
At this point have students work in pairs or small groups for 5-7 minutes
to come up with ways in which they could reduce carbon emissions in the sectors shown on the next slide.

Some official definitions of mitigation: To moderate in force or intensity, to alleviate. To lessen in force or intensity. Elimination or reduction in
frequency, magnitude or severity of exposure. To minimize risk.
An informal definition that could be used to discuss the idea: Basically to make something that could be very bad less bad.
Ask for examples of things people do to “mitigate” for the following environmental effects:
Earthquake – build houses to building codes, try to get people to have emergency kits, meeting points.
Floods – build houses on stilts, make walls so the water can’t get in. Create dams.
Climate Change – mostly involve decreasing the amount of greenhouse gases of all kinds in the atmosphere. For the most part, mitigation cannot reverse warming that has already occurred, it can
only slow or stop what would come without any changes.
!" 4

5
Quick formative assessment: make sure students remember what efficiency means
6

7 8

9
ImpactsofClimateChangeonPhysicalSystems
PPT4.2.4

Graph1:TemperatureGlobalOceanandAtmosphere
PPT4.2.4 hBp://data.giss.nasa.gov/gistemp/graphs/Year
Tempe
ratureDifferen
ceFromNormal(°C)
5-year Running Average Annual Average

Graph2:Temperature
PPT4.2.4 J.Hansenetal.,PNAS103:14288‐293(2006)
2001-2005 Mean Surface Temperature Difference from the Temperatures Recorded from 1951-1980 (in °C)
Global Mean = .53
North America
South America
Africa
Asia
Australia
Europe
Gray indicates no data.
0°
30° S
60° S
30° N
60° N
0° 90° W 90° E
Antarctica

Graph3:SeaLevel
PPT4.2.4
Observed changes in (a) global average surface temperature, (b) global average sea level from tide gauge (blue) and satellite (red) data. All changes are relative to corresponding averages for the period 1961–1990. Smoothed curves represent decadal average values while circles show yearly values. The shaded areas are the uncertainty intervals estimated from a comprehensive analysis of known uncertainties.

Graph4:SeaLevel
PPT4.2.4
hBp://www.globalwarmingart.com/images/2/2c/Global_Sea_Level_Rise_Risks.png Rahmstorfetal.,2007;Science
Projected global sea level change. The colored lines represent different models, based on global observations.
1 m = 100 cm = 1000 mm This map is designed to emphasize regions of the Eastern United States and Caribbean that are near sea level.

Graph5:GlacierThinning
PPT4.2.4
The map shows the average annual rate of thinning since 1970 for the 173 glaciers that have been measured at least 5 times between 1970 and 2004 (Dyurgerov and Meier 2005). Larger changes are plotted as larger circles and towards the back.
Thinning Thickening
hBp://www.globalwarmingart.com/wiki/File:Glacier_Mass_Balance_Map_png

Graph6:Snow&GlacierCoverPortageGlacier,Alaska PasterzeGlacier,Austria
PPT4.2.4

Graph7:SevereWeather
PPT4.2.4
Very Heavy Precipitation is defined as the heaviest 1%
of all events.

Graph8:SevereWeather
PPT4.2.4
Even
tsperYear
hBp://maps.grida.no/go/graphic/trends‐in‐natural‐disasters

Station1TaskCard–Temperature
EvidencefortheImpactofClimateChangeonthePhysicalSystem
MaterialsTaskCard,Graph1,Graph2,StudentHandout,p.1Instructions
1. Asagroup,lookatgraphs1&2.Talkaboutwhatyouthinktheyrepresentpriortolookingatthequestionsforthisstation.
2. Feelfreetoaskeachotherquestionsaboutpartsofthegraphthatyoudon’tunderstandorpointoutpartsofthegraphthatyouthinkareimportant.Itishelpfultostartbyidentifyingwhateachaxisrepresents.
3. Afterlookingatthegraphs,readthequestionsforthisstationthatappearbelow.Discusseachquestionasagroup.
4. Afteryouarefinisheddiscussingthequestions,individuallyanswerthetwoquestionsforeachstationonthestudenthandout.
Station1GroupQuestionsGraph11.Whatisthedifferencebetweentheblackdotsandtheredline?2.Howmuchhastemperature,indegreesCelsius,changedsince1880?3.Whatdoesitmeanthatthisgraphshows“globaloceanandatmospheretemperatures”?Graph24.Namethreeplacesthatwerecolderthannormalduring2001‐2005.5.Namethreeplacesthatwerewarmerthannormal.6.WhatisthesignificanceofaGlobalMean=.53?Nowmakeanevidencesupportedclaimonyourstudenthandout.

Station2TaskCard–SeaLevelRise
EvidencefortheImpactofClimateChangeonthePhysicalSystem
MaterialsTaskCard,Graph3,Graph4,StudentHandoutp.1Instructions
1. Asagroup,lookatgraphs3&4.Talkaboutwhatyouthinktheyrepresentpriortolookingatthequestionsforthisstation.
2. Feelfreetoaskeachotherquestionsaboutpartsofthegraphthatyoudon’tunderstandorpointoutpartsofthegraphthatyouthinkareimportant.Itishelpfultostartbyidentifyingwhateachaxisrepresents.
3. Afterlookingatthegraphs,readthequestionsforthisstationthatappearbelow.Discusseachquestionasagroup.
4. Afteryouarefinisheddiscussingthequestions,individuallyanswerthetwoquestionsforeachstationonthestudenthandout.
HelpfulDefinitions:TideGauge–Adeviceformeasuringsealevel.SatelliteAltimetry–Asatelliteimageusedtojudgetheelevationabovesealevel.Station2GroupQuestionsGraph31.Whatisthepurposeofthisgraph?2.Whatrelationshipdoesthegraphshow?Graph43.Howcanyouknowhowhighaplaceisabovesealevel?4.Whichplaceshavethelowestheightabovesealevel?5.Themapontherightshowsdifferentpossibleprojectionsofsealevelriseoverthenext90years.Eachlinerepresentsadifferentprediction.Ifthebluelinepredictionoccurs,willanyregionsbeaffectedby2100?Ifso,whichones?Nowmakeanevidencesupportedclaimonyourstudenthandout.

Station3TaskCard–SnowandGlacierCover
EvidencefortheImpactofClimateChangeonthePhysicalSystem
MaterialsTaskCard,Graph5,Graph6,StudentHandoutp.2Instructions
1. Asagroup,lookatgraphs5&6.Talkaboutwhatyouthinktheyrepresentpriortolookingatthequestionsforthisstation.
2. Feelfreetoaskeachotherquestionsaboutpartsofthegraphthatyoudon’tunderstandorpointoutpartsofthegraphthatyouthinkareimportant.Itishelpfultostartbyidentifyingwhateachaxisrepresents.
3. Afterlookingatthegraphs,readthequestionsforthisstationthatappearbelow.Discusseachquestionasagroup.
4. Afteryouarefinisheddiscussingthequestions,individuallyanswerthetwoquestionsforeachstationonthestudenthandout.
HelpfulDefinitions:Glacier–Ahugemassoficethatslowlymovesoveralandmass.Station3GroupQuestionsGraph51.Lookatthescaleatthebottomofthefigure.Whatdothesecolorsmean?2.Whatplaceshavethemostglacierthinning?3.Whatisthetrend?Areglaciersincreasingordecreasingglobally?Graph/Picture64.Whyaretheretwopicturesineachcolumn?5.Whatdothegroupsofpicturesshow?Nowmakeanevidencesupportedclaimonyourstudenthandout.
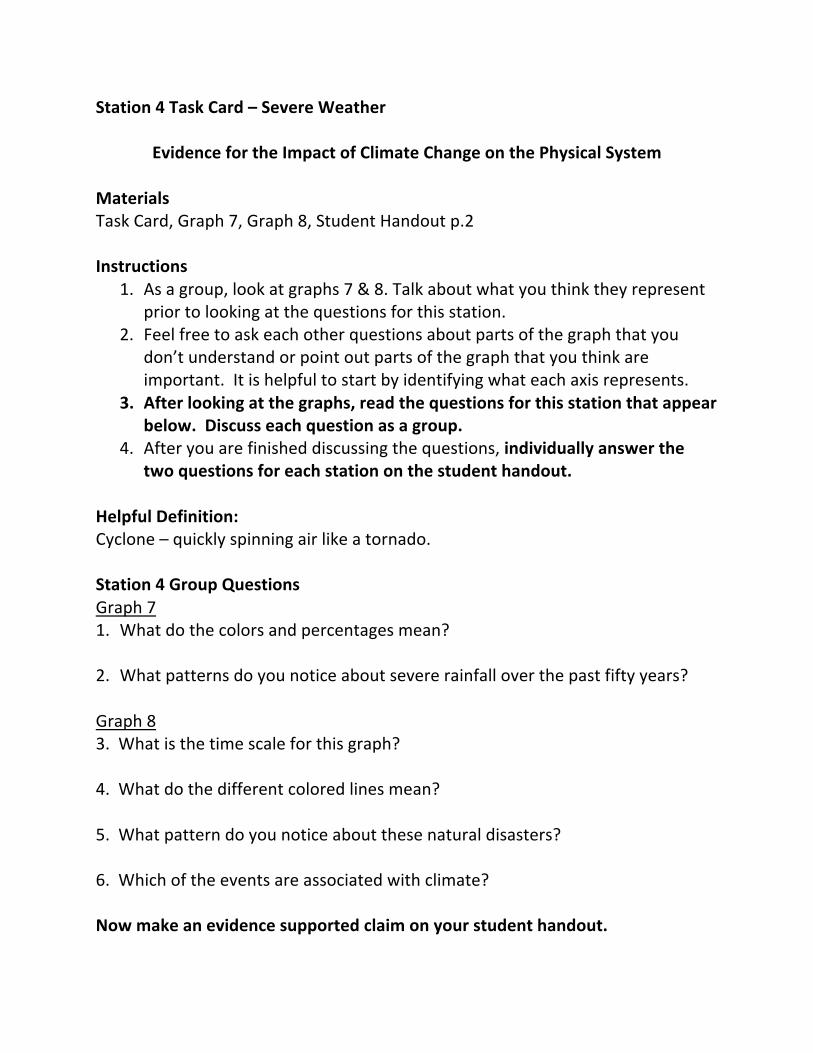
Station4TaskCard–SevereWeather
EvidencefortheImpactofClimateChangeonthePhysicalSystem
MaterialsTaskCard,Graph7,Graph8,StudentHandoutp.2Instructions
1. Asagroup,lookatgraphs7&8.Talkaboutwhatyouthinktheyrepresentpriortolookingatthequestionsforthisstation.
2. Feelfreetoaskeachotherquestionsaboutpartsofthegraphthatyoudon’tunderstandorpointoutpartsofthegraphthatyouthinkareimportant.Itishelpfultostartbyidentifyingwhateachaxisrepresents.
3. Afterlookingatthegraphs,readthequestionsforthisstationthatappearbelow.Discusseachquestionasagroup.
4. Afteryouarefinisheddiscussingthequestions,individuallyanswerthetwoquestionsforeachstationonthestudenthandout.
HelpfulDefinition:Cyclone–quicklyspinningairlikeatornado.Station4GroupQuestionsGraph71. Whatdothecolorsandpercentagesmean?
2. Whatpatternsdoyounoticeaboutsevererainfalloverthepastfiftyyears?Graph83.Whatisthetimescaleforthisgraph?4.Whatdothedifferentcoloredlinesmean?5.Whatpatterndoyounoticeaboutthesenaturaldisasters?6.Whichoftheeventsareassociatedwithclimate?Nowmakeanevidencesupportedclaimonyourstudenthandout.

1
Name____________________________________________________________StudentHandout4.2.3EvidencefortheImpactofClimateChangeonEarth’sPhysicalSystemsStation1Conclusions:Temperature1.Basedongraphs1&2,whatclaim(conclusion)orclaimscanyoumakeaboutglobaltemperatures?2.Whatisyourevidenceforthisclaim?Station2Conclusions:SeaLevelRise1.Basedongraph3&4,whatclaim(conclusion)orclaimscanyoumakeabouttheimpactofclimatechangeonsealevelrise?2.Whatisyourevidenceforthisclaim?

2
Station3Conclusions:SnowandGlacierCover1.Basedongraph5&6,whatclaim(conclusion)orclaimscanyoumakeabouttheimpactofclimatechangeonsnowandglaciercover?2.Whatisyourevidenceforthisclaim?Station4Conclusions:SevereWeather1.Basedongraph7&8,whatclaim(conclusion)orclaimscanyoumakeabouttheimpactofclimatechangeonsevereweathersystems?2.Whatisyourevidenceforthisclaim?

!"#$%$&%'()$%&*+$&,#$&%,*-./&+$%.0+1$&1*+)%2&&"#$3&4*3&5$&#$'670'&,.&6+.8$1,&)0+(/9&
3.0+&)$5+($7&.7&,#$&%,*-./&*1-:(,3&%.&,#*,&%,0)$/,%&1*/&+$7$+&,.&%6$1(;1&6.(/,%&.7&
$:()$/1$2<&
=&
>!?#*,&(%&,#$&)(@$+$/1$&5$,A$$/&,#$&5'0$&).,%&*/)&,#$&+$)&'(/$B&
>!>&C.A&401#&#*%&,$46$+*,0+$&1#*/9$)&%(/1$&=DDEB&
>!>&).&3.0&,#(/F&,#(%&(%&$/.09#&,.&*@$1,&*/3,#(/9B&
G&

"#(%&6(1,0+$&%#.A%&*&4*6&.7&,#$&A.+')&*/)&A#$,#$+&,#$&,$46$+*,0+$%&A$+$&)(@$+$/,&
,#*/&/.+4*'&.:$+&*&H&3$*+&6$+(.)2&
>!>&?#(1#&*+$*%&A$+$&1.')$+&,#*/&/.+4*'B&
>!>&?#(1#&*+$*%&A$+$&#.I$+&,#*/&/.+4*'B&
>!&?#*,&(%&,#$&%(9/(;1*/1$&.7&*&J'.5*'&K$*/&L&2HM&
M&
&NOPPQ&GEERS&T044*+3&7.+&O.'(134*F$+%2&N/S&!"#$%&'(!)%*+'(,--./(0)'(1)23#4%"(54#'*4'(
6%3#37(!8*&9#:;<8*(8=(>89?#*+(@98;A(B(&8(&)'(C8;9&)(D33'33$'*&(E'A89&(8=(&)'(
B*&'9+8F'9*$'*&%"(1%*'"(8*(!"#$%&'(!)%*+'(G58"8$8*H(57H(I7(J#*H(K7(K%**#*+H(L7(
!)'*H(K7(K%9M;#3H(N767(DF'92&H(K70#+*89(%*O(P7Q7(K#""'9(R'O37ST7(!%$:9#O+'(U*#F'93#&2(
19'33H(!%$:9#O+'H(U*#&'O(N#*+O8$(%*O(V'W(X89?H(VXH(U5D7(
!"#$%&'()*+,+'!"#$%&$'()*+,-$#(.,(/+0(-12"+1(+&$%+-$(#3%4+)$(5$67$%+53%$8(/"0(
-12"+1(+&$%+-$(#$+(1$&$1(4%26(9'$(-+3-$(/"13$0(+,'(#+5$11.5$(/%$'0('+5+:((;11()*+,-$#(
+%$(%$1+9&$(52()2%%$#72,'.,-(+&$%+-$#(42%(5*$(7$%.2'(<=><?<==@:(A6225*$'()3%&$#(
%$7%$#$,5('$)+'+1(+&$%+-$(&+13$#(B*.1$().%)1$#(#*2B(C$+%1C(&+13$#:(D*$(#*+'$'(
+%$+#(+%$(5*$(3,)$%5+.,5C(.,5$%&+1#($#96+5$'(4%26(+()267%$*$,#.&$(+,+1C#.#(24(
E,2B,(3,)$%5+.,9$#(/+(+,'("0(FG;H(I:<8(G.-3%$(<8(G.-3%$(J:K8(G.-3%$(L:<IM(
=2! ?#*,&(%&,#$&60+6.%$&.7&,#$%$&9+*6#%B&
G2! ?#*,&+$'*-./%#(6%&).&,#$&9+*6#%&%#.AB&
M2! C.A&(%&,#(%&+$'*,$)&,.&1'(4*,$&1#*/9$B&&N7&A$&#*)&,.&4*F$&*&1./1$6,&4*6&+$'*-/9&
,#$&;/)(/9%&(/&,#$%$&9+*6#&,.&1'(4*,$&1#*/9$Q&A#*,&A.0')&(,&'..F&'(F$B&
>&U+.4&MEEE&3$*+%&*9.&,.&,#$&%,*+,&.7&,#$&=DEEV%Q&%$*&'$:$'&A*%&*'4.%,&1./%,*/,Q&+(%(/9&
*,&2=&,.&2G&44W3$*+2&&X3.0&4*3&A*/,&,.&%,.6&*/)&*%F&%,0)$/,%&#.A&5(9&*&4(''(4$,$+&(%Y2&&
T(/1$&=ZEEQ&,#$&'$:$'&#*%&+(%$/&*,&=>G&44W3$*+[&"#*,&(%&,$/&-4$%&*%&401#&*%&5$7.+$2&
T(/1$&=ZZGQ&%*,$''(,$&4$*%0+$4$/,%&(/)(1*,$&*&+*,$&.7&*5.0,&M&44W3+2&
\&

"#$&4*6&./&,#$&+(9#,&%#.A%&,#$&$*%,$+/&]/(,$)&T,*,$%&*/)&(,%&#$(9#,&*5.:$&%$*&'$:$'2&
>!C.A&).&3.0&F/.A&#.A&#(9#&*&6'*1$&(%&*5.:$&%$*&'$:$'B&
>!&?#(1#&6'*1$%&#*:$&,#$&'.A$%,&#$(9#,&*5.:$&%$*&'$:$'B&
"#$&9+*6#&./&,#$&+(9#,&%#.A%&)(@$+$/,&6.%%(5'$&6+.8$1-./%&.7&%$*&'$:$'&+(%$&.:$+&,#$&
/$^,&ZE&3$*+%2&&_*1#&'(/$&+$6+$%$/,%&*&)(@$+$/,&6+$)(1-./2&&N7&,#$&5'0$&'(/$&6+$)(1-./&
.110+%Q&A(''&*/3&+$9(./%&5$&*@$1,$)&53&G=EEB&
H&
=2! ?#*,&).$%&,#$&%1*'$&4$*/&*,&,#$&5.I.4&.7&,#$&;90+$B&
G2! ?#*,&(%&,#(%&9+*6#&,+3(/9&,.&%#.AB&
M2! ?#*,&1./1'0%(./%&1*/&3.0&)+*A&*5.0,&1'(4*,$&1#*/9$B&&?#*,&(%&3.0+&$:()$/1$B&
"#(%&%*46'$&.7&4.0/,*(/&9'*1($+%&$^1'0)$%&,#$&6+(4*+3&(1$&%#$$,%&.7&J+$$/'*/)&*/)&`/,*+1-1*2&
N,&%#.0')&5$&*1F/.A'$)9$)&,#*,&9'*1($+&%*46'(/9&(%&#$*:('3&5(*%$)&,.A*+)%&a.+,#&`4$+(1*&*/)&_0+.6$2&T05%,*/-*'&0/%*46'$)&4.0/,*(/&9'*1($+%&$^(%,&(/&
T.0,#&`4$+(1*Q&`%(*&*/)&,#$&4*+9(/%&.7&`/,*+1-1*2&C.A$:$+Q&,#$&9'*1($+&)(%,+(0-./&(%&
*'%.&/.,&0/(7.+42&`7+(1*&#*%&./'3&*&#*/)70'&.7&9'*1($+%&*/)&1./-/$/,*'&`0%,+*'(*&#*%&
/./$2&b$%6(,$&,#$(+&+$'*-:$&(46.+,*/1$Q&/./$&.7&,#$&4*+9(/*'&`/,*+1-1&9'*1($+%&#*:$&
#*)&,#$(+&4*%%&5*'*/1$&%*46'$)&*,&'$*%,&H&-4$%&%(/1$&=ZRE2&
"#$%$&$%-4*,$%&.7&(1$&%#$$,&,#(//(/9&).&/.,&(/1'0)$&9'*1($+&4*%%&'.%,&)0$&,.&(1$5$+9&
1*':(/92&T01#&1*':(/9&(%&/.,&%(9/(;1*/,&7.+&4.%,&4.0/,*(/&9'*1($+%&%(/1$&./'3&*&%4*''&
6+.6.+-./&.7&,#$%$&9'*1($+%&,$+4(/*,$&(/&'*+9$&5.)($%&.7&A*,$+2&
"#$&-4$&%1*'$&7.+&,#(%&9'*1(*'&,#(//(/9&(%&0/*:*('*5'$2&&
c&

=2! ?#*,&).&,#$&6(1,0+$%&%#.AB&&?$+$&,#$3&,*F$/&*,&,#$&%*4$&'.1*-./B&
G2! N%&,#$+$&*&+$'*-./%#(6&,.&1'(4*,$&1#*/9$B&&?#*,&(%&3.0+&$:()$/1$B&&?#*,&$:()$/1$&
A.0')&3.0&/$$)&,.&4*F$&3.0+&1'*(4&%,+./9$+B&
>! T(/1$&=ZDEQ&9'*1($+&+$,+$*,&#*%&,#+$*,$/$)&,#$&$^(%,$/1$&.7&4*/3&.7&,#$&5(99$%,&
9'*1($+%&(/&,#$&A.+')2&&"#(%&6+.1$%%&#*%&(/1+$*%$)&*&9+$*,&)$*'&%(/1$&=ZZH2&
>! dd`%F&%,0)$/,%S&&?#*,&$@$1,&1.0')&,#(%&1'*(4&*5.0,&%/.A&*/)&9'*1($+&1.:$+&#*:$&
./&3.0B&&_:$/&(7&(,&(%&#*66$/(/9&7*+&*A*32&
R&
=2! ?#*,&(%&,#$&-4$&%1*'$B&&&
G2! ?#*,&).&,#$&)(@$+$/,&1.'.+%&4$*/B&
M2! ?#*,&1./1'0%(./%&1*/&3.0&)+*A&*5.0,&,#$&+$'*-./%#(6&5$,A$$/&1'(4*,$&1#*/9$&
*/)&%$:$+$&A$*,#$+&$:$/,%B&
\2! C.A&1./:(/1(/9&(%&,#(%&+$'*-./%#(6B&
-.&'/%&0$&123'4/'564%75'84196'#4'$:;'<$6'6.&'"16&15"63'8"=='#4'$:+'
D&

=2! ?#*,&(%&,#$&-4$&%1*'$B&&&
G2! ?#*,&).&,#$&)(@$+$/,&1.'.+$)&'(/$%&4$*/B&
M2! ?#*,&1./1'0%(./%&1*/&3.0&)+*A&*5.0,&,#$&+$'*-./%#(6&5$,A$$/&1'(4*,$&1#*/9$&
*/)&,#$&7+$e0$/13&.7&%$:$+$&A$*,#$+&$:$/,%B&
\2! C.A&1./:(/1(/9&(%&,#(%&+$'*-./%#(6B&b.$%&,#(%&%,+$/9,#$/&.+&A$*F$/&3.0+&
1./1'0%(./%&7+.4&,#$&6+$:(.0%&%'()$B&
>&"#$&/045$+&.7&%$:$+$&A$*,#$+&)(%*%,$+%&)0$&,.&1'(4*,$&X'(F$&f..)%&*/)&131'./$%Y&*+$&
(/1+$*%(/9&(/&1.46*+(%./&,.&/*,0+*'&)(%*%,$+%&X'(F$&$*+,#e0*F$%Y2&
Z&

StudentName_______________________________________________LessonPlan4QuizUsethegraphbelowtoanswerquestions1‐3.
1. Lookingatthediagram,circlethetrendformajorfloodsperdecadeinAmerica.A. MajorFloodsIncreaseB. MajorFloodsDecreaseC. MajorFloodsStaytheSame
2. Whatistheglobaltrendofmajorfloodssince1950?
3. Providetwopiecesofevidencethatsupportthisclaim.
4. Howdoscientistsdetermineclimateconditionsfrom100,000yearsago?
A. ThermometerReadingsB. SatelliteImagesC. TreeRingsD. IceCores

4.Abouthowmanyyearsdoesthisicecoresamplerepresent?
A. 1‐2yearsB. 4‐5yearsC. 15‐16yearsD. 25‐26years
5.Providetwoexamplesforhowpeoplecanmitigateclimatechangethroughtransportconservation.
1.
2.6.Whydoesinsulatingbuildingshelpmitigateclimatechange?

StudentName____Key___________________________________________LessonPlan4QuizUsethegraphbelowtoanswerquestions1‐3.
1. Lookingatthediagram,circlethetrendformajorfloodsperdecadeinAmerica.A. MajorFloodsIncreaseB. MajorFloodsDecreaseC. MajorFloodsStaytheSame
2. Whatistheglobaltrendofmajorfloodssince1950?Majorfloodinghasincreasedoneverycontinentsince1950.
3. Providetwopiecesofevidencethatsupportthisclaim?
FloodinginAmericahasincreasedsteadilyfromabout10floodsin1950toover200floodsin2000.FloodinginAfricahasincreasedsteadilyfromabouttenfloodsin1950toabout100floodsin2000.
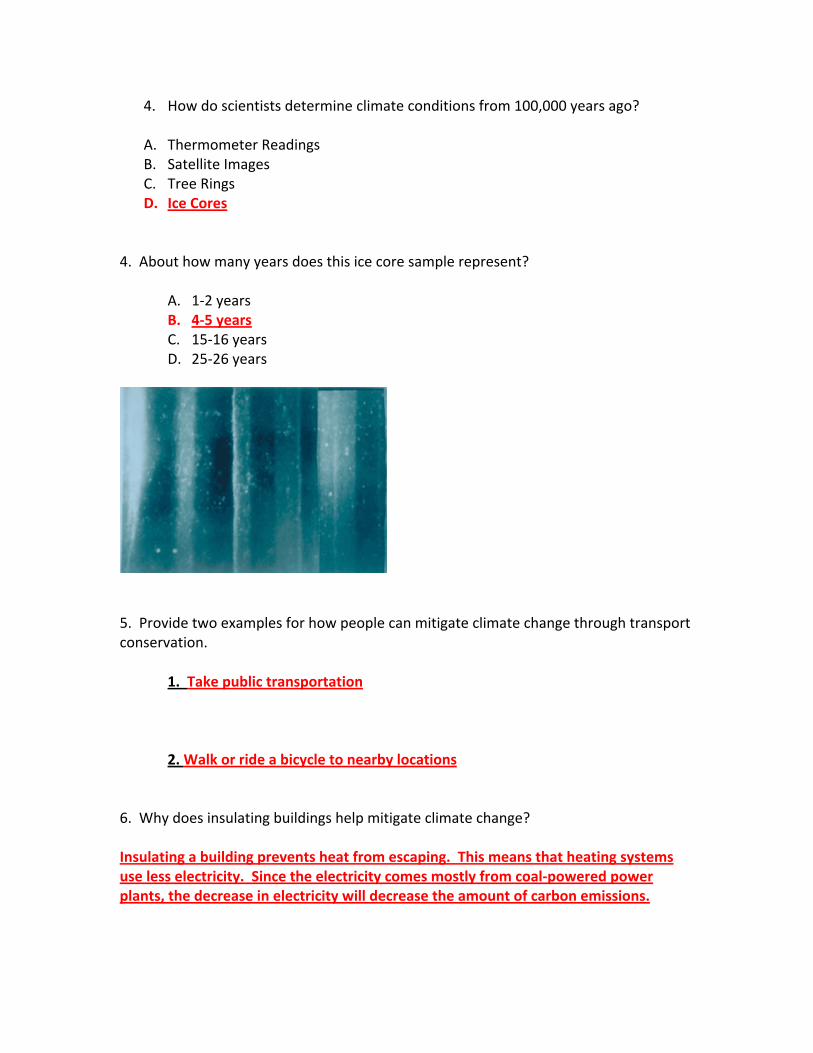
4. Howdoscientistsdetermineclimateconditionsfrom100,000yearsago?
A. ThermometerReadingsB. SatelliteImagesC. TreeRingsD. IceCores
4.Abouthowmanyyearsdoesthisicecoresamplerepresent?
A. 1‐2yearsB. 4‐5yearsC. 15‐16yearsD. 25‐26years
5.Providetwoexamplesforhowpeoplecanmitigateclimatechangethroughtransportconservation.
1.Takepublictransportation
2.Walkorrideabicycletonearbylocations6.Whydoesinsulatingbuildingshelpmitigateclimatechange?Insulatingabuildingpreventsheatfromescaping.Thismeansthatheatingsystemsuselesselectricity.Sincetheelectricitycomesmostlyfromcoal‐poweredpowerplants,thedecreaseinelectricitywilldecreasetheamountofcarbonemissions.