PHASE AND MICROSTRUCTURAL CHARACTERIZATION OF KAOLIN CLAYS...
14
J Pak Mater Soc 2009 3 (2) Anwarul Haq, Yaseen Iqbal, Muhammad Riaz Khan: Phase and microstructural characterization …. 77 PHASE AND MICROSTRUCTURAL CHARACTERIZATION OF KAOLIN CLAYS FROM NORTH WESTERN PAKISTAN Anwarul Haq 1 , Yaseen Iqbal 1* , Muhammad Riaz Khan 2 1 Materials Research Laboratory, Institute of Physics & Electronics, University of Peshawar (Pakistan) Phone No. 00 92 915704615 Fax No. 00 92 91 9216473, Email: [email protected], E-mail: [email protected] 2 Centralized Resource Laboratory, University of Peshawar, Pakistan, E-mail: [email protected] Abstract Berbuff, Nargus and Durr clay samples, commonly known as various grades of Swat china clay, were characterized and compared with imported English china clay. Dehydration of these clays occurred at ~90 to 150ºC, followed by dehydroxylation at ~500 to 530ºC. The formation of γ-Al 2 O 3 -type spinel phase or primary mullite began at ~990 to 1000ºC. The major crystalline phases present in Durr and imported English china clay were kaolinite and illite. Additionally, trace amounts of quartz and muscovite were also identified in Durr clay. Berbuff and Nargus clay samples comprised kaolinite along with paragonite, clinochlore, montmorillonite, quartz and albite. Unlike Nargus, halloysite was also identified in Berbuff. Durr, Berbuff and Nargus contained ~28, ~27 and ~23 mass% kaolin respectively. The microstructure of English china clay comprised typical book- and flake- like kaolinite agglomerates and particles. Durr clay comprised mealy and hexagonal- shaped kaolinite grains. Clinochlore and/or halloysite of tubular morphology were observed in the microstructure of Berbuff and Nargus. The chemistry, phase constitution and thermal behavior of these local clays were found close to those of high quality English china clay. Keywords: Swat china clay; Phase; Microstructure; Kaolinite; Characterization INTRODUCTION Clays are widely used in vitreous ceramic and construction industries [1-3] and are generally mixed and blended to give standard compositions and optimum properties for various applications [4] . The microstructure and properties of clays depend on the characteristics of the parent clay and the processing conditions [5] . Various types of clays comprise different clay minerals of the ninety-three planar/non-planar hydrous phyllosilicates [6-7] which are either 1:1 or 2:1 layer type phyllosilicates with/without interlayer water [8] . Particle size, shape, surface chemistry, area and charge affect the relevant properties like shear viscosity and absorption of a particular clay [2, 9] . Kaolinite, Si 2 Al 2 O 5 (OH) 4 , is a dioctahedral clay mineral of 1:1 layered structure with poly-types namely kaolinite, dickite and nacrite [10] , and the polymorph halloysite [11] . A single layer of kaolinite comprises planes of O 6 , Si 4 , O 4 , (OH) 2 , Al 4 and (OH) 6 stacked one over the other [12] . A detailed account of the internal structure can be found elsewhere [13-17] . Typically, the microstructure of kaolinite consists of pseudo-hexagonal plates, clusters of plates, thin platy or stacked aggregates of compact and clay-like masses [18] and halloysite,
Transcript of PHASE AND MICROSTRUCTURAL CHARACTERIZATION OF KAOLIN CLAYS...
J Pak Mater Soc 2009 3 (2)
Anwarul Haq, Yaseen Iqbal, Muhammad Riaz Khan: Phase and microstructural characterization ….
77
PHASE AND MICROSTRUCTURAL CHARACTERIZATION OF KAOLIN CLAYS FROM NORTH WESTERN PAKISTAN
Anwarul Haq1, Yaseen Iqbal1*, Muhammad Riaz Khan2 1Materials Research Laboratory, Institute of Physics & Electronics, University of Peshawar (Pakistan) Phone No. 00 92 915704615 Fax No. 00 92 91 9216473, Email: [email protected], E-mail: [email protected] 2Centralized Resource Laboratory, University of Peshawar, Pakistan, E-mail: [email protected]
Abstract Berbuff, Nargus and Durr clay samples, commonly known as various grades of Swat china clay, were characterized and compared with imported English china clay. Dehydration of these clays occurred at ~90 to 150ºC, followed by dehydroxylation at ~500 to 530ºC. The formation of γ-Al2O3-type spinel phase or primary mullite began at ~990 to 1000ºC. The major crystalline phases present in Durr and imported English china clay were kaolinite and illite. Additionally, trace amounts of quartz and muscovite were also identified in Durr clay. Berbuff and Nargus clay samples comprised kaolinite along with paragonite, clinochlore, montmorillonite, quartz and albite. Unlike Nargus, halloysite was also identified in Berbuff. Durr, Berbuff and Nargus contained ~28, ~27 and ~23 mass% kaolin respectively. The microstructure of English china clay comprised typical book- and flake-like kaolinite agglomerates and particles. Durr clay comprised mealy and hexagonal-shaped kaolinite grains. Clinochlore and/or halloysite of tubular morphology were observed in the microstructure of Berbuff and Nargus. The chemistry, phase constitution and thermal behavior of these local clays were found close to those of high quality English china clay. Keywords: Swat china clay; Phase; Microstructure; Kaolinite; Characterization
INTRODUCTION Clays are widely used in vitreous ceramic and construction industries [1-3] and are generally mixed and blended to give standard compositions and optimum properties for various applications [4]. The microstructure and properties of clays depend on the characteristics of the parent clay and the processing conditions [5]. Various types of clays comprise different clay minerals of the ninety-three planar/non-planar hydrous phyllosilicates [6-7] which are either 1:1 or 2:1 layer type phyllosilicates with/without interlayer water [8]. Particle size, shape, surface chemistry, area and charge affect the relevant
properties like shear viscosity and absorption of a particular clay [2, 9]. Kaolinite, Si2Al2O5(OH)4, is a dioctahedral clay mineral of 1:1 layered structure with poly-types namely kaolinite, dickite and nacrite [10], and the polymorph halloysite [11]. A single layer of kaolinite comprises planes of O6, Si4, O4, (OH)2, Al4 and (OH)6 stacked one over the other [12]. A detailed account of the internal structure can be found elsewhere [13-17]. Typically, the microstructure of kaolinite consists of pseudo-hexagonal plates, clusters of plates, thin platy or stacked aggregates of compact and clay-like masses [18] and halloysite,
J Pak Mater Soc 2009 3 (2)
Anwarul Haq, Yaseen Iqbal, Muhammad Riaz Khan: Phase and microstructural characterization ….
78
Al2Si2O5(OH)4.2H2O, comprises single or massive aggregates of tubular morphology up to 15 m in length [11, 19]. The degree of perfection in translational periodicity is a measure of the level of crystallinity in a material and is determined by different indices like Hinkley index (HI), Stoch index (IK) and the Aparici-Galan-Ferrel index (AGFI) in clays [20-24]. The transformation of clays from one phase to another or from one type of clay to another type is a function of temperature, pressure, time, contact with microbes and chemicals, the type and quantity of impurities, and exposure to radiations [25]. Clays may be thermally transformed into other phases when subjected to heating. This process is accompanied by weight loss and sometimes conservation of the residual structurally bound water into the next phase [26]. The dehydration of kaolinite (99% pure English china clay) completes by ~150oC, followed by dehydoxylation at ~500-600oC and its structural breakdown occurs in the temperature range ~800-900oC, depending upon the particle size and amount and type of the impurities present [27-29]. Kaolinite from Guandong (China) containing 7.9% quartz and 2-3% illite dehydroxylates to metakaolinite at ~420-660°C depending on the type and amount of impurities present [30] via Si2Al2O5(OH)4
~420-660°C Al2O3.2SiO2 + 2H2O (1) which involves the combination of two OH groups to form H2O and oxygen which remains incorporated in metakolin. At about 900°C, metakaolinite decomposes to amorphous SiO2 and γ-Al2O3–type spinel via Al2O3.2SiO2
~900°C γ -Al2O3 + 2SiO2 (2) γ-Al2O3–type spinel and SiO2 re-crystallize into mullite at temperatures above 1100°C via
3.γ-Al2O3 + 2SiO2 >1100°C 3Al2O3.2SiO2 (3)
Sonuparlak et al.[31] reported the observation of a γ-Al2O3–type spinel phase along with some residual amorphous SiO2 while Srikrishna et al.[32] supported the formation of a single phase (with composition close to mullite) and excess SiO2 at 900°C. Thus the formation of mullite begins at temperatures >900°C and the process continues till 1000°C. At 1000°C, small crystals (5-10 nm in size) of spinel-type phase have been identified by electron diffraction along with 10-30 nm primary mullite crystals in an amorphous SiO2 matrix. At 1100 to 1200°C, the spinel type phase is lost and mullite begins to grow to ~0.5µm in size. At ~1300°C, cristobalite begins to form from amorphous SiO2 discarded as a result of mullite formation and metakaolin grains lose their face-on pseudohexgonal habit leaving only mullite and cristobalite in a glassy matrix. Above 1600°C, the clay body melts completely [27, 29]. Mullite has an orthorhombic crystal structure with composition ranging from 3Al2O3:2SiO2 to 2Al2O3:1SiO2, usually denoted by 3:2 and 2:1 mullite respectively. The size, shape and composition of mullite depend on the composition and viscosity of the matrix. Mullite forming in vitreous ceramics can be distinguished by their shape, size (aspect ratio) and chemical composition as primary mullite M(I), granular secondary mullite M(II) and needle-shaped secondary mullite (MIII) [32-34]. The chemistry, phase transformation behavior and hence the application potential of clays depend upon the origin and immediate environment of a clay deposit [35] and therefore, each clay deposit requires systematic characterization.
J Pak Mater Soc 2009 3 (2)
Anwarul Haq, Yaseen Iqbal, Muhammad Riaz Khan: Phase and microstructural characterization ….
79
The aim of the present study was to characterize the locally available kaolin clays. Findings regarding the chemical, phase and microstructural analyses of the collected samples from various sources of the KPK province of Pakistan are presented and compared with the imported English China clay for possible industrial applications. Experimental methods and results Local kaolin clay samples were collected from local industry and imported kaolin samples were supplied by Akbari Traders chemical dealers, Lahore, Pakistan (Table 1). Samples in the form of powders were dried at 110°C for 2 hours, ground in Mortar and Pestle system and sieved through a ≤53µm (270 US) mesh. The percent mass (%mass) loss upon heating and phase transformation temperatures were determined using a Perkin Elmer Diamond, TG/DTA instrument (Centralized
Resource Laboratory, University of Peshawar, Pakistan) from 40 to 1300°C at 10°C/min in nitrogen atmosphere. The phase analysis of powder samples was carried out using a Philips X-ray diffractometer (Department of Engineering Materials, University of Sheffield, UK) with Ni filtered Cukα radiations (λ=1.54Å) operating at 40 kV and 30 mA with a step size of 0.02º from 5 to 60º at 1º/min. Secondary electron scanning electron microscope images (SEI) were recorded using a JEOL 5910 scanning electron microscope (SEM) operating at 20 kV, equipped with energy dispersive X-ray electron spectroscopy (EDS) system (INCA 200). Powdered samples were mounted onto stubs with double-sided adhesive tape before carbon-coating. Conducting paths were provided with silver paint to avoid charging in the SEM.
Table 1. Various kaolin clay samples investigated in the present study.
S. No
Name Collection Location Symbol
1 Kaolin (Nargus) Swat China Clay Pvt. Ltd., Swat (NWFP) N 2 Kaolin (Berbuff) Swat China Clay Pvt. Ltd. Swat (NWFP) B 3 English China
clay Akbari Traders chemical dealers, Lahore, Punjab
E
4 China Clay Durr Industries Hayatabad, Peshawar (NWFP)
D
As shown in Fig. 1a, a continuous downwards slope was observed for all the investigated samples on the differential thermal analysis (DTA) curves at temperatures ranging from room temperature until the appearance of endotherms due to de-hydroxylation; however, no systematic endothermic dip indicative of dehydration, was observed at ~150oC as reported for pure kaolinite [28]. The dip on the DTA curve (Fig. 1a) at
~534°C for sample E, ~514°C for sample D, ~509°C for sample B and ~498°C for sample N indicated the de-hydroxylation of the examined clay samples at the given temperatures. The exotherms corresponding to the crystallization of γ-Al2O3-type spinel or primary mullite were observed at ~991oC for samples E and N, 992°C for sample D and 981oC for sample B (Table 2).

J Pak Mater Soc 2009 3 (2)
Anwarul Haq, Yaseen Iqbal, Muhammad Riaz Khan: Phase and microstructural characterization ….
80
Table 2. Phase transformation temperatures for the examined clay samples.
Sample Endo. Temp. (oC) Exo. Temp. (oC) E 533.76 990.72 D 513.82 992.37 B 508.70 981.05 N 498.54 991.28
The mass% loss observed at temperatures ranging from ~400 to 500oC was ~4 in samples B and N, and ~3 in samples D and E. At 500-600oC, the mass% loss remained unchanged in sample B whereas in sample E it increased to ~7. The downwards slope on the thermo-gravimetric plots was more pronounced for samples B and N in comparison to samples E and D (Fig. 1b). With further increase in temperature i.e. from 600 to 1200oC, the mass% loss was nearly the same for all the investigated clay samples (Table 3). The percentage of kaolin present in a sample can be estimated from the comparison of the observed mass% loss in a sample under-examination and the mass% loss of pure kaolinite upon dehydroxylation at 500-600oC-the
dehydroxylation range of pure kaolinite. The total water-content in pure kaolinite determined from its chemical formula is ~13.96 mass% [19]. Thus based on the mass% losses observed for various samples sieved through a size <53µm mesh in the present study and English china clay were calculated to be ~52 in sample E, ~28 in sample D, ~27 in sample B and ~23 in sample N (Table 4). X-ray diffraction (XRD) revealed the presence of kaolinite and illite in sample E, kaolinite, muscovite, quartz and illite in sample D, paragonite, kaolinite, albite, clinochlore, and halloysite in sample B, and paragonite, kaolinite, albite, clinochlore and quartz in sample N (Figure 2).
Table 3. Percentage weight loss of locally collected clays at various temperatures
Sample
Mass% Loss 50-160oC
Mass% Loss 160-500oC
Mass% Loss 400-500oC
Mass% Loss 500-600oC
Mass% Loss 600-1200oC
Mass% Loss 50-1200oC
E 0.42 3.16 2.67 7.26 1.51 11.92
D 0.52 3.63 2.97 3.96 1.16 9.00
B 3.12 5.59 4.07 3.79 1.09 12.97
N 2.77 5.02 3.79 3.21 1.02 11.52
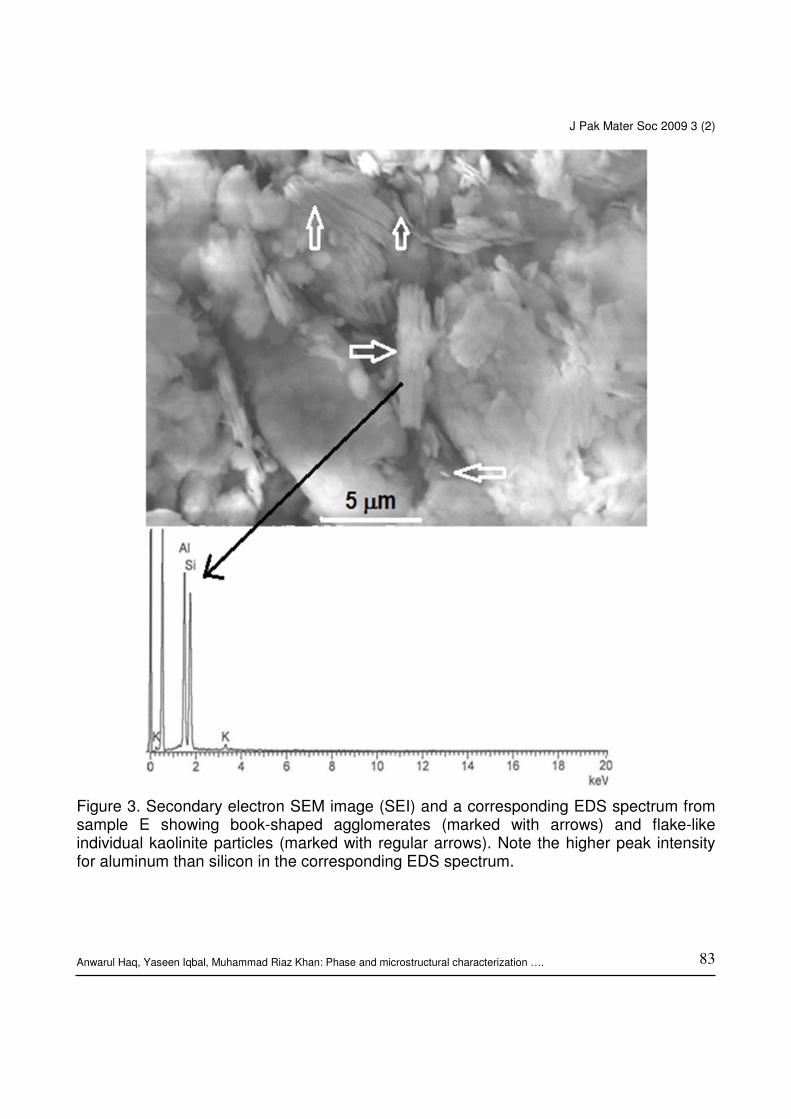
SEM images and the corresponding EDS spectra (Figure 3) revealed that the microstructure of sample E comprised clay agglomerates with typical book-like morphology and flakes of fine clay particles. The higher EDS peak intensities
for aluminum than silicon indicated that the spectra were collected from the clay particles [34]. It was noticeable that the spectra collected from feldspar particles or other non-kaolinite mineral phase(s) also contained peaks due to aluminum but of

J Pak Mater Soc 2009 3 (2)
Anwarul Haq, Yaseen Iqbal, Muhammad Riaz Khan: Phase and microstructural characterization ….
81
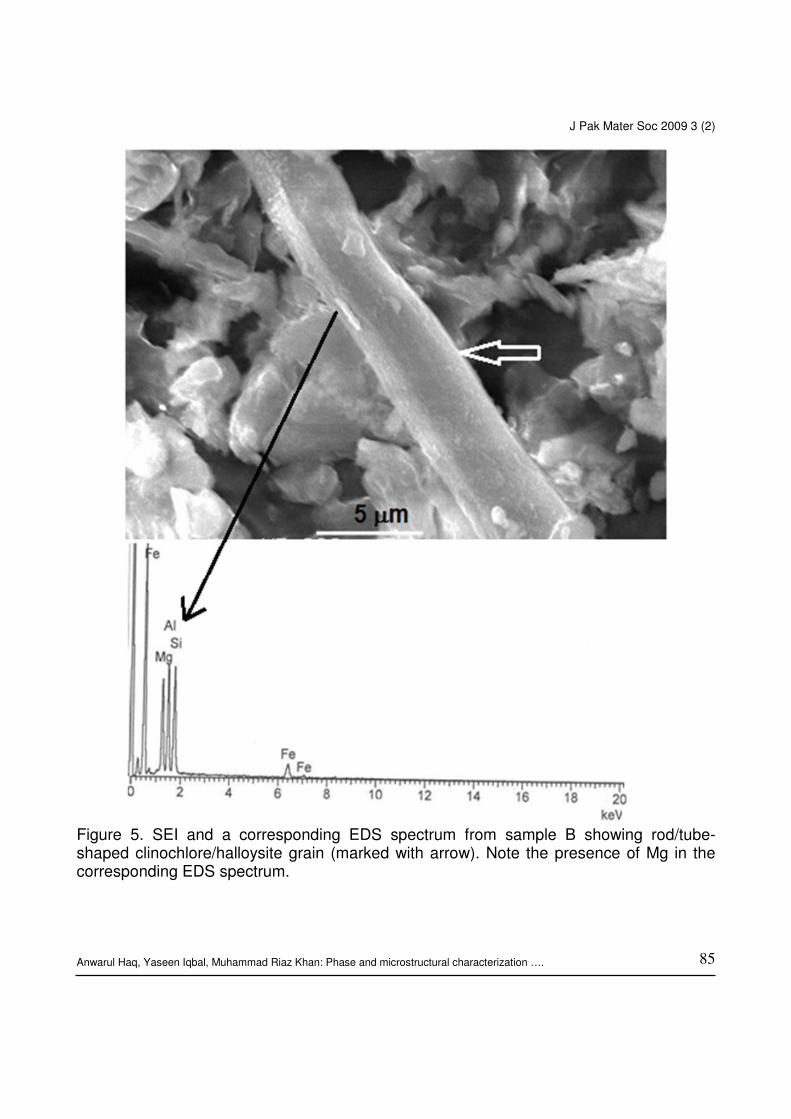
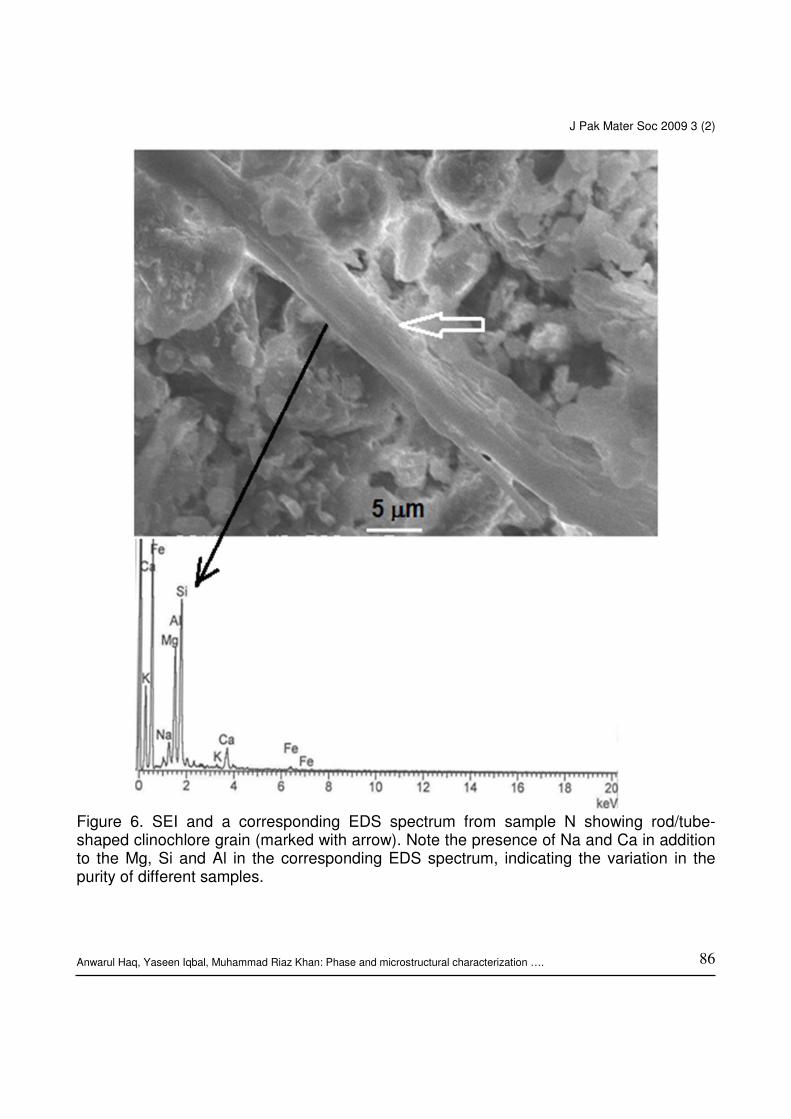
much lower intensities than the silicon in comparison to those collected from kaolinite particles or agglomerates. Sample D comprised soft, mealy and hexagonal-shaped kaolinite grains (Figure 4). The grains observed in samples B and N resembled elongated rods/tubes
(Figures 5-6) of clinochlore or halloysite [37,
39-41]. In addition to kaolinite particles and agglomerates, SEM and EDS revealed the presence of feldspathic and other clay minerals of different grain/particle morphology.
Table 4. Dehydroxylation and Kaolin mineral content present in various samples.
Sample % ∆M (Dehydroxylation) Kaolin (Mass%) E 7.26 51.89 D 3.96 28.30 B 3.79 27.08 N 3.21 22.91
Figure 1(a). Thermo-gravimetric plots and (b) DTA plots from samples E, D, B and N.

J Pak Mater Soc 2009 3 (2)
Anwarul Haq, Yaseen Iqbal, Muhammad Riaz Khan: Phase and microstructural characterization ….
82
Figure 2. XRD patterns from samples E, D, B and N, showing the presence of kaolinite (K) and illite (I) in sample E, kaolinite, illite, muscovite (m) and quartz (Q) in sample D, kaolinite, halloysite (H), paragonite (P), clinochlore (C), albite (A), montmorillonite (M) and quartz in sample B, and kaolinite, paragonite, clinochlore, albite, montmorillonite and quartz in sample N.
J Pak Mater Soc 2009 3 (2)
Anwarul Haq, Yaseen Iqbal, Muhammad Riaz Khan: Phase and microstructural characterization ….
83
Figure 3. Secondary electron SEM image (SEI) and a corresponding EDS spectrum from sample E showing book-shaped agglomerates (marked with arrows) and flake-like individual kaolinite particles (marked with regular arrows). Note the higher peak intensity for aluminum than silicon in the corresponding EDS spectrum.

J Pak Mater Soc 2009 3 (2)
Anwarul Haq, Yaseen Iqbal, Muhammad Riaz Khan: Phase and microstructural characterization ….
84
Figure 4. SEI and a corresponding EDS spectrum from sample D, showing a hexagonal-shaped kaolinite particle (marked with arrow). Note the higher EDS Al-peak intensity than Si.
J Pak Mater Soc 2009 3 (2)
Anwarul Haq, Yaseen Iqbal, Muhammad Riaz Khan: Phase and microstructural characterization ….
85
Figure 5. SEI and a corresponding EDS spectrum from sample B showing rod/tube-shaped clinochlore/halloysite grain (marked with arrow). Note the presence of Mg in the corresponding EDS spectrum.
J Pak Mater Soc 2009 3 (2)
Anwarul Haq, Yaseen Iqbal, Muhammad Riaz Khan: Phase and microstructural characterization ….
86
Figure 6. SEI and a corresponding EDS spectrum from sample N showing rod/tube-shaped clinochlore grain (marked with arrow). Note the presence of Na and Ca in addition to the Mg, Si and Al in the corresponding EDS spectrum, indicating the variation in the purity of different samples.

J Pak Mater Soc 2009 3 (2)
Anwarul Haq, Yaseen Iqbal, Muhammad Riaz Khan: Phase and microstructural characterization ….
87
Discussion A systematic endothermic dip at ~150oC on the DTA curves from pure kaolinite indicative of dehydration has been reported previously [28]; however, in the present study, only a continuous downwards slope was observed. The probable reasons for not observing the dehydration dip may be the clays had already dehydrated during preheating at 110oC for 2h in the present study. In comparison to the previous studies, the clay samples used in the present study were not pure and contained clay minerals other than kaolinite. The endotherms at temperatures ranging from ~498 to 533oC revealed the breakdown of hydroxyl ions from kaolinite which transformed the Al-environment from octahedral coordination in kaolinite to tetrahedral coordination in metakaolin which then, crystallized either directly to mullite or first to Al-Si-type spinel and then nano-size mullite (3Al2O3.2SiO2)
[35]. The observation of exotherms corresponding to the crystallization of γ-Al2O3-type spinel or primary mullite at temperatures ranging from ~981oC to 992°C, were almost consistent with the previous studies [26, 29,
36] and the small variation in the
crystallization temperature may be due to the presence of other clay minerals. These exothermic peaks corresponded to the heat evolved due to crystallization of γ-Al2O3-type spinel or primary mullite. The higher mass% loss (7) observed for the sample E at 500-600oC and constancy or relatively less change in the mass% loss for the other samples, indicated that sample E contained more kaolinite content than the others. The more pronounced downwards slope on the thermo-gravimetric plots for samples B and N in
comparison to samples E and D, indicated the presence of more moisture in the former samples than the latter (Fig. 1b). The observed presence of more kaolin in sample E is obvious as it was commercial and more pure than the others investigated samples. Siddiqui and Ahmad [37] reported the presence of 43.85 to 65.21 mass% kaolin in Swat china clay samples with particle size <63µm but collected from carefully selected kaolin lenses from the same location. Another study [38] reported 17 to 26.8 mass% kaolin in raw kaolinite samples and 51.57 to 59.67 mass% kaolin in washed kaolinite samples from the same region. A comparison of the present observations with the previous studies indicated the variation in kaolin content in samples collected from the same deposit but different lenses or as-mined and washed samples [37-38]. Thus, Swat china clay, if mined carefully and washed, can be used in triaxial porcelain or other vitreous ceramics industry and has the same application potential as any other high quality china clay. Paragonite, kaolinite, albite, clinochlore, and halloysite phases were identified in sample B, and paragonite, kaolinite, albite, clinochlore and quartz in sample N (Figure 2). In addition to the above, Siddiqui and Ahmad [37] reported the presence of calcite and some localized epidote and clinozoisite in samples B and N whereas Muhammad et al. [39] reported the presence of plagioclase, mica and Mg-silicates but in the samples collected directly from the mines. The observed differences in the constituent phases may be due to slight variations in the location of samples. Also, samples N and B investigated in the present study were supplied by Swat China Clay Ltd.,
J Pak Mater Soc 2009 3 (2)
Anwarul Haq, Yaseen Iqbal, Muhammad Riaz Khan: Phase and microstructural characterization ….
88
processed using the cyclone process, which may have affected their phase constitution. The microstructural analysis carried out in the present study was consistent with previous studies [36, 38-40]. Conclusions The phase transformation temperatures determined for local kaolin clays were found consistent with previous studies; however, no systematic endothermic dips were observed at ~150°C, probably due to the use of almost dehydrated samples or the presence of other minerals in the examined samples. In agreement with some previous studies, the kaolin content in Durr, Berbuff and Nargus was lower than that of a) English china clay in the present study, b) samples collected from carefully selected lenses of the same mine or c) washed samples from the same mine. Kaolinite and illite were the major phases present in the imported English china clay and Durr clay samples. Nargus clay comprised kaolinite, paragonite, clinochlore and albite along with trace amounts of montmorillonite and quartz. The phase constitution of Berbuff was similar to Nargus except for halloysite which was present in Berbuff but not in Nargus. The microstructure of English china clay comprised typical book-shaped/flak-like kaolinite agglomerates/particles. Soft, mealy and hexagonal-shaped kaolinite grains were observed in Durr clay and elongated rods of clinochlore or halloysite in Nargus and Berbuff. References 1. Grim RE. Objectives of the first
conference on clays and clay technology and definitions of terms
used in the industry. Clays Clay Miner. 1952; 1: 13-15.
2. Murray HH. Traditional and new applications for Kaolinite, Smectite, and palygorskite: a general overview, Appl. Clay Sci. 2000; 17: 207-221.
3. Temimi M, Amor KB, Camps JP. Making building products by extrusion and cement stabilization: limits of the process with montmorillonite clays. Appl. Clay Sci. 1998; 13: 245-253.
4. Bailey RT. The changing pattern of raw material supplies. J. Brit. Ceram. Soc. LXXIII 1974; 283-286.
5. Dananaj I, Frankovska J, Janotka I. The influence of smectite content on microstructure and geochemical properties of calcium and sodium bentonites. Appl. Clay Sci. 2005; 28: 223-232.
6. Bergaya F, Theng BKG, Lagaly G. Development in Clay Science, 1 Handbook of Clay Science, Elsevier Ltd. (2006).
7. Guggenheim S, Adams JM, Bain DC, Bargaya F, Brigatti MF, Drits VA, Formoso MLL, Galan E, Kogure T, Stanjek H. Summary of the recommendations of nomenclature committees relevant to clay mineralogy: report of the Association International pour l’Etude Argiles (AIPEA) Nomenclature Committee for 2006, Clay Minerals 2006; 41: 863-877.
8. Bailey SW. Summary of recommendation of AIPEA nomenclature committee on clay minerals. Am. Mineral. 1980; 65: 1-7.
9. Murray HH, Kogel JE. Engineered clay products for the paper industry. Appl. Clay Sci. 2005; 29: 199-206.
J Pak Mater Soc 2009 3 (2)
Anwarul Haq, Yaseen Iqbal, Muhammad Riaz Khan: Phase and microstructural characterization ….
89
10. Guggenheim S, Alietti A, Drits VA, Formoso MLL, Galan E, Koster HM, Paquet H, Watanabe T, Bain DC, Hudnall WH. Report of the Association International Pour L’Etude Des Argiles (AIPEA) nomenclature committee for 1996, Clays Clay Miner. 1997; 45: 298-300.
11. Grim RE. Applied Clay Mineralogy. McGraw-Hill book Company, Inc. (1962).
12. Stubna I, Varga G, Trník A. Investigation of Kaolinite dehydroxylations is still interesting. Epitoanyag 2006; 58: 6-9.
13. Balan E, Saitta AM, Mauri F, Calas G. First-principles modeling of the infrared spectrum of Kaolinite. Am. Mineral. 2001; 86: 1321-1330.
14. Akbia E, Hayakawa H, Hayashi S, Miyawaki R, Tomura S, Shibaski Y, Izumi F, Asano H, Kamiyama T. Structure refinement of synthetic deuterated kaolinite by rietveld analysis using time of flight neutron powder diffraction data. Clays Clay miner. 1997; 45: 781-788.
15. Zheng H, Bailey SW. Refinement of the nacrite structure. Clays Clay Miner. 1994; 42: 46-52.
16. Bish DL, Johnston CT. Rietveld refinement and Fourier-transform infrared spectroscopic study of the dickite structure at low temperature. Clays Clay Miner. 1993; 41: 297-304.
17. Bish DL. Rietveld refinement of the kaolinite structure at 1.5K. Clays Clay Miner. 1993; 41: 738-744.
18. Taggart Jr. MS, Milligan WO, Studer HP. Electron micrographic studies of clays, Clays Clay Miner. 1954; 3: 31-95.
19. Giese Jr, RF. Kaolin minerals: Structures and stabilities. In S.W. Bailey (Ed.). Hydrous phyllosilicates (exclusive of mica), Reviews in mineralogy, Miner. Soc. Am. 1988; 19: 29-62.
20. Aparicio P, Perez-Bernal JL, Galan E, Bello MA. Kaolin fractal dimension; Comparison with other properties. Appl. Clay Sci. 2004; 39: 75-84.
21. Aparicio P, Galan E. Mineralogical interference on kaolinite crystallinity index measurements. Clays Clay Miner. 1999; 47: 12-27.
22. Guggenheim S, Bain DC, Bergaya F, Brigatti MF, Drits VA, Eberl DD, Formoso MLL, Galán E, Merriman RJ, Peacor DR, Stanjek A, Watanabe T. Report of the Association Internationale Pour l’Etude des Argiles (AIPEA) nomenclature committee for 2001: order, disorder and crystallinity in phyllosilicates and the use of the "crystallinity index. Clays Clay Miner. 2002; 50: 406-409.
23. Chmielova M, Weiss Z. Determination of structural disorder degree using an XRD profile fitting procedure. Application to Czech kaolins. Appl. Clay Sci. 2002; 22: 65-74.
24. He H, Yuan P, Guo J, Zhu J, Hu C. The influence of random defect density on the thermal stability of kaolinite. J. Am. Ceram. Soc. 2005; 88: 1017-1019.
25. Kim J, Dong H, Seabaugh J, Newell SW, Elbert DD. Role of Microbes in the smectite-to-Illite reaction. Science 2004; 303: 830-832.
26. Lee S, King KJ, Lee HL, Moon HS. Electron-Beam-Induced phase transformations from Metakaolinite to Mullite Investigated by EF-TEM and

J Pak Mater Soc 2009 3 (2)
Anwarul Haq, Yaseen Iqbal, Muhammad Riaz Khan: Phase and microstructural characterization ….
90
HRTEM. J. Am. Ceram. Soc. 2001; 84: 2096-2099.
27. McConville CJ, Lee WE. Microstructural development on firing illite and smectite compared with that in kaolinite. J. Am. Ceram. Soc. 2005; 88: 2267-2277.
28. McConville CJ. Related microstructural development on firing keolinite, illite and smectite clays. PhD thesis. University of Sheffield (UK) (1999).
29. McConville CJ, Lee WE, Sharp JH. Comparison of Microstructural evolution in kaolinite powders and dense clay bodies. Brit. Ceram. Trans. 1998; 58: 75-92.
30. Qiu G, Jiang T, Li G, Fan X, Huang Z. Activation and removal of silicon in kaolinite by thermochemical process. Scan. J. Metallurgy 2004; 33: 121-128.
31. Sonuparlak B, Sarikaya M, Aksay IA. Spinel phase formation during the 980°C exothermic reaction in the kaolinite-to-mullite reaction series. J. Am. Ceram. Soc. 1987; 70: 837-842.
32. Srikrishna K, Thomas G, Martinez R, Corral MP, Aza SD, Moya JS. Kaolinite–mullite reaction series: A TEM study. J. Mater. Sci. 1990; 25: 607-612.
33. Iqbal Y, Lee WE. Fired porcelain microstructures revisited. J. Am. Ceram. Soc. 1999; 82: 3384-3399.
34. Iqbal Y, Lee WE. Microstructural evolution in triaxial porcelain. J. Am. Ceram. Soc. 2000; 83: 3121-3127.
35. Lee WE, Sousa GP, McConville CJ, Tarvornpanich T, Iqbal Y. Mullite formation in clays and clay-derived vitreous ceramics. J. Euro. Ceram. Soc. 2008; 28: 465-471.
36. Carty WM, Senapati U. Porcelain-raw materials, processing, phase evolution, and mechanical Behavior. J. Am. Ceram. Soc. 1998; 81: 3-20.
37. Siddiqui MA, Ahmad Z. Mineralogy of the Swat kaolin deposits, Pakistan. Arab J. Sci. Eng. 2005; 30: 2095-2018.
38. Muhammad S, Kakakhel MAG, Nawaz M. Swat China Clay. M.Sc. Thesis. University of Peshawar (1980).
39. Keller WD. Scan electron micrographs of kaolins collected from diverse environments of origin-IV. Georgia kaolin and kaolinizing source rocks. Clays Clay Miner. 1977; 25: 311-345.
40. Keller WD. Classification of kaolins exemplified by their textures in scan electron micrographs. Clays Clay Miner. 1978; 26: 1-20.